Synthesis of New Cadmium(II) Antipyretic Drug. - Research ...
Upload
independentCategory
view
1download
0
PAPER www.rsc.org/jaas | Journal of Analytical Atomic Spectrometry
High-precision cadmium stable isotope measurements by double spike thermalionisation mass spectrometry
Anne-D�esir�ee Schmitt,†* Stephen J. G. Galer and Wafa Abouchami
Received 5th December 2008, Accepted 28th April 2009
First published as an Advance Article on the web 26th May 2009
DOI: 10.1039/b821576f
Natural mass-dependent fractionation (MDF) of cadmium isotopes is a promising new tool for
investigating Cd pathways and cycling in geological and biological materials. One interesting new
application is as chemical tracer of deep water circulation and nutrient distribution in the oceans. But
since natural isotope fractionation of Cd appears to be extremely limited and Cd abundances low,
excellent external precision and sensitivity are needed to make full use of its potential. Here, we
describe a newly-developed double spike (DS) method for determining the MDF of Cd isotopes. For
inorganic matrices, samples are spiked with a mixed 106Cd-108Cd tracer prior to high-purity anion
exchange-based separation of Cd. Isotope measurements are performed by TIMS using a silica gel
activator. Overall, the DS-TIMS technique offers benefits in terms of superior precision and
sensitivity compared to MC-ICPMS methods currently in use. External precisions on 100-ng-sized Cd
standard loads, double spiked as unknowns, are �14 ppm on the 112Cd/110Cd ratio (2SD), while
ionization efficiencies (ions per atom loaded) are�0.3%. Using this technique, we calibrated the relative
difference in MDF between several Cd standard materials used in various laboratories as ‘‘zero
reference standards’’. We also show that the 112Cd/110Cd ratio can be fractionated by as much as
�0.2% by ion-exchange elution, which is potentially problematic for Cd isotope studies not using
a double spike.
Introduction
Over the past decade there has been increasing interest in
investigating natural mass-dependent stable isotope fraction-
ation (MDF) of transition metals, such as Cu, Zn, Fe, Cr, Mo
and Tl.1 This interest has been spawned, in part, by the advent of
MC-ICPMS technology which allows simple ionization of most
elements, including many of those virtually impossible to ionize
beforehand by TIMS due to refractory chemistry and/or high
first-ionization potential.
In the case of the transition metal Cd, however, the first studies
of MDF were made by TIMS as far back as 1975.2 In a long
series of papers by Rosman, de Laeter and co-workers it has been
shown that large MDF effects can be found in meteorites3–5 and
in lunar samples.6,7 The magnitude of these effects in some
ordinary chondrites is up to �0.5%/Da (i.e. half-percent per
dalton), and so pronounced that it dominates over instrumental
mass bias. The large MDF in extraterrestrial samples has been
verified in more recent MC-ICPMS work, and is thought to be
related to evaporation-condensation or thermal metamorphism
on the meteorite parent bodies.8,9
MC-ICPMS has proven to be the popular method of choice
for Cd isotopes in recent times, instigated by the work of
Wombacher et al.8 In this and subsequent studies, some other
Max-Planck-Institut f€ur Chemie, Postfach 3060, D-55020 Mainz,Germany
† Present address: Universit�e de Franche-Comt�e-CNRS/UMR 6249Chrono-environnement, 16, Route de Gray, F-25030 Besancon Cedex,France. E-mail: [email protected]; Fax: +33 (0)3 81 66 65 58;Tel: +33 (0)3 81 66 65 61.
This journal is ª The Royal Society of Chemistry 2009
useful applications of Cd isotopes have been identified in addi-
tion to those pertaining to extraterrestrial materials. For
example, it has been found that industrially-processed cadmium
is highly isotopically fractionated compared to ‘‘natural’’
terrestrial cadmium. Under such circumstances, the MDF of Cd
is an interesting new tracer for anthropogenic cadmium, and as
such can be used to monitor heavy metal pollution and cycling of
Cd in the environment.10 The isotopic fractionation presumably
occurs during smelting of Cd from Zn ores and/or its purification
by electrodeposition.
Lastly, Cd abundance is a well-known chemical oceanographic
tracer of deep water circulation and a proxy for nutrient distri-
bution.11 For example, the temporal distribution of Cd/Ca ratios
in foraminifera shells has been used to reconstruct past biological
productivity in the oceans. An obvious extension of these ideas is
to search for corresponding Cd isotope effects, and the first
studies have appeared examining MDF of Cd isotopes in
seawater12,13 and ocean Fe–Mn deposits.14
By far the largest Cd isotope variations found thus far are in
extraterrestrial samples and in industrially-processed cadmium
(i.e. man-made). By contrast, two recent, comprehensive surveys
have shown that cadmium MDF in ‘‘natural’’ terrestrial samples
is quite limited, and only of the order of 0.01%/Da.8,14 For this
reason, it is absolutely paramount to acquire Cd isotope data
with the utmost in analytical precision if cadmium MDF is to be
of much practical use. An additional complication is the
extremely low abundance of cadmium in most common mate-
rials, which calls for an analytical method of high sensitivity. The
aim of the present contribution is to address both the issues
of measurement precision and sensitivity. We present a new
J. Anal. At. Spectrom., 2009, 24, 1079–1088 | 1079
double-spike method for Cd stable isotope of cadmium, in which
isotope measurements are performed by TIMS; chemical
protocols for the pre-separation of sample Cd are also described
in detail.
Experimental
Chemical separation protocol for natural samples
The column chemistry separation procedure for Cd was modified
from that discussed for Pb by Lugmair and Galer.15 Cadmium
was eluted using 0.25 N HNO3, once matrix elements and Pb had
been selectively removed using two different dilute hydrobromic-
nitric acid mixtures by anion exchange (column: 100 mL of AG1-
X8 resin, 100–200 mesh). First, the sample is loaded and virtually
all the matrix eluted using 0.2 M HBr–0.5 M HNO3 (Soln. A);
then Pb is selectively eluted using 0.03 M HBr–0.5 M HNO3
(Soln. B). The subsequent dilute HNO3 elution effectively strips
the column of most retained elements, including Cd.16 Partition
coefficients for Cd are �9100 in Soln. A and �33 in Soln. B.17 A
more selective Cd elution can be obtained using a 0.03 M HBr–
2.0 M HNO3 mixture based upon the partitioning data of Stre-
low.18 However, this eluent was found to exhibit too much peak
tailing of Cd to yield a useful elution; by contrast, elution of Cd
with 0.25 N HNO3 does not tail appreciably. Other relevant
partition coefficients can be found elsewhere.17–19
The ‘‘pure’’ Cd fraction was dried down and passed a second time
through exactly the same chemical protocol to ensure complete
purification. Prior to the first anion exchange separation, iron was
removed from the sample by solvent extraction into MIBK (methyl
isobutyl ketone, a.k.a. 4-methylpentan-2-one) from 6 N HCl, which
is essentially quantitative under these conditions.20 This step was
found to be necessary, since traces of iron fully inhibit the thermal
ionization of cadmium. The Cd chemistry blank ranged between 54
and 160 pg over the course of this study, and was negligible
compared to the amount of Cd processed.
Analysis of cadmium isotopes by TIMS
The isotopic composition of cadmium was determined by
thermal ionization mass spectrometry using a Triton instrument
(ThermoFisher) operating in static multicollection mode. This
instrument is fitted with nine Faraday collectors. However, the
collectors cannot be positioned to allow all eight isotopes of Cd
to be measured simultaneously.
Rhenium single filaments (thickness 0.04 mm, width 0.7 mm)
of 99.99% purity were used, that were outgassed in vacuo prior to
use. Samples of cadmium were loaded onto the filaments in dilute
HNO3 followed by 1 mL silica gel activator added in a step-wise
fashion on top. The silica gel activator was prepared from
commercial colloidal silicic acid and orthophosphoric acid.21 For
runs of our Cd isotope standard, 100 ng of cadmium was nor-
mally loaded.
Isotopes of Sn, Pd and In are potentially important isobaric
interferences on Cd, but none were observed for standard or
sample runs. There are several reasons for this. First, Sn, Pd and
In should be quantitatively separated from Cd by our chemical
separation protocol, while second, Sn does not ionize at all by
TIMS under Cd running conditions. Although we did not notice
any isobaric interference from indium, this would only affect
1080 | J. Anal. At. Spectrom., 2009, 24, 1079–1088
113Cd which is problematic during TIMS analysis in any case (see
below). We tested doping Cd standards with palladium, from
which we observed that the Pd emission occurred at far lower
temperatures than those optimal for Cd, consistent with the
findings of others.2,6 Here, even large amounts of doped Pd (e.g.
Pd/Cd¼ 1) were gone before peak Cd emission. However, we did
find that undegassed Re filaments did emit Pd beams significant
enough to warrant isobaric correction on the low Cd masses.
Such interferences are presumably coming from Pd present in the
Re filament, and were absent in filaments degassed normally
before use.
In the mass spectrometer, peak emission of Cd ions occurs at
�1150 �C, about 50 �C lower than that for Pb ions with this acti-
vator. These conditions are similar to those previously noted by
other workers.5,22 Sample sizes of �100 ng yielded slowly decaying
ion beams, averaging �30 pA 112Cd over a half-hour analysis.
Though not run to exhaustion, such ion beams correspond to
ionization efficiencies (i.e. ions registered per atom loaded) of
�0.3% overall. We also observed that the thermal ionization of Cd
is seriously hindered by trace amounts of iron. Quantitative elimi-
nation of residual iron from the sample is thus imperative, and was
achieved here by solvent extraction as noted above.
Odd-even isotope effects. During analysis of cadmium isotopes
by TIMS using a silica gel activator, fractionation of isotope
ratios involving just even-mass isotopes of cadmium appears to
obey a simple mass dependence within the limits of precision. By
contrast, ratios with odd-mass isotopes 111Cd and 113Cd do not
fractionate in a mass-dependent way with respect to even-mass-
only isotope ratios (Fig. 1). This mass-independent fractionation
of odd isotopes of Cd – which is not subtle – has been observed
previously,14,23 and appears to be exhibited by odd-mass isotopes
of Pb and Zn as well, when measured by TIMS using a silica gel
activator.23,24
The origin of the anomalous behaviour of odd isotopes of
cadmium will be discussed in detail elsewhere, but appears to be
due to the magnetic isotope effect25 rather than the nuclear
volume, a.k.a. nuclear field shift of Bigeleisen.26 Since the
isotopes 111Cd and 113Cd do not follow a normal mass-dependent
law during instrumental fractionation by TIMS, they cannot be
used in the determination of the natural fractionation of sample
cadmium.
Choice of TIMS versus MC-ICPMS
The use of TIMS in cadmium isotope studies has had a long
history starting with the initial work by Rosman and de Laeter.2
However, since almost all recent studies have used MC-ICPMS
technology,8–10,12,13,27 it seems pertinent to address the question of
why we decided to pursue TIMS methodology in this work.
First, it should be made clear that our intention was to develop
specifically a double spike (DS) method (cf. Dodson28) for
cadmium isotopes. The most important role the instrument must
play in double spike work is to generate accurate isotope ratio
data with a high degree of long-term stability. While it is possible
in normal isotope ratio work to compensate for shorter-term
variation by normalization to standard runs, drift and inaccur-
acies are anathema to the double spike method. This is so, since
the aim is to try to reconstruct the mixing line once formed by the
This journal is ª The Royal Society of Chemistry 2009
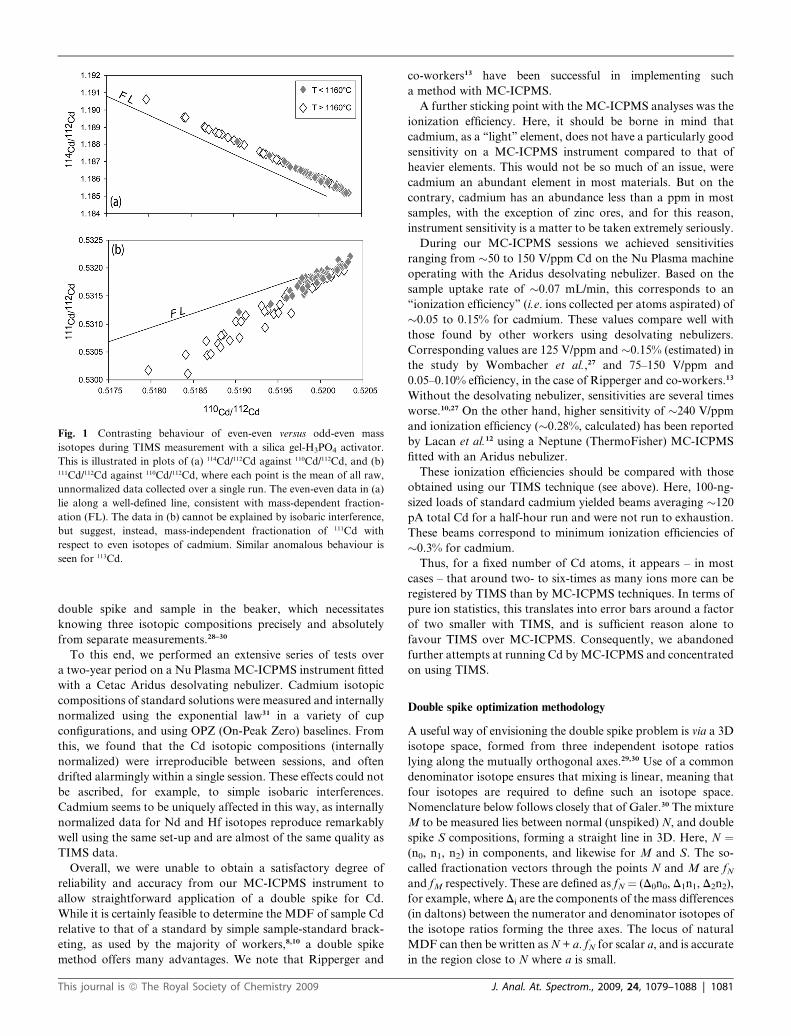
Fig. 1 Contrasting behaviour of even-even versus odd-even mass
isotopes during TIMS measurement with a silica gel-H3PO4 activator.
This is illustrated in plots of (a) 114Cd/112Cd against 110Cd/112Cd, and (b)111Cd/112Cd against 110Cd/112Cd, where each point is the mean of all raw,
unnormalized data collected over a single run. The even-even data in (a)
lie along a well-defined line, consistent with mass-dependent fraction-
ation (FL). The data in (b) cannot be explained by isobaric interference,
but suggest, instead, mass-independent fractionation of 111Cd with
respect to even isotopes of cadmium. Similar anomalous behaviour is
seen for 113Cd.
double spike and sample in the beaker, which necessitates
knowing three isotopic compositions precisely and absolutely
from separate measurements.28–30
To this end, we performed an extensive series of tests over
a two-year period on a Nu Plasma MC-ICPMS instrument fitted
with a Cetac Aridus desolvating nebulizer. Cadmium isotopic
compositions of standard solutions were measured and internally
normalized using the exponential law31 in a variety of cup
configurations, and using OPZ (On-Peak Zero) baselines. From
this, we found that the Cd isotopic compositions (internally
normalized) were irreproducible between sessions, and often
drifted alarmingly within a single session. These effects could not
be ascribed, for example, to simple isobaric interferences.
Cadmium seems to be uniquely affected in this way, as internally
normalized data for Nd and Hf isotopes reproduce remarkably
well using the same set-up and are almost of the same quality as
TIMS data.
Overall, we were unable to obtain a satisfactory degree of
reliability and accuracy from our MC-ICPMS instrument to
allow straightforward application of a double spike for Cd.
While it is certainly feasible to determine the MDF of sample Cd
relative to that of a standard by simple sample-standard brack-
eting, as used by the majority of workers,8,10 a double spike
method offers many advantages. We note that Ripperger and
This journal is ª The Royal Society of Chemistry 2009
co-workers13 have been successful in implementing such
a method with MC-ICPMS.
A further sticking point with the MC-ICPMS analyses was the
ionization efficiency. Here, it should be borne in mind that
cadmium, as a ‘‘light’’ element, does not have a particularly good
sensitivity on a MC-ICPMS instrument compared to that of
heavier elements. This would not be so much of an issue, were
cadmium an abundant element in most materials. But on the
contrary, cadmium has an abundance less than a ppm in most
samples, with the exception of zinc ores, and for this reason,
instrument sensitivity is a matter to be taken extremely seriously.
During our MC-ICPMS sessions we achieved sensitivities
ranging from �50 to 150 V/ppm Cd on the Nu Plasma machine
operating with the Aridus desolvating nebulizer. Based on the
sample uptake rate of �0.07 mL/min, this corresponds to an
‘‘ionization efficiency’’ (i.e. ions collected per atoms aspirated) of
�0.05 to 0.15% for cadmium. These values compare well with
those found by other workers using desolvating nebulizers.
Corresponding values are 125 V/ppm and �0.15% (estimated) in
the study by Wombacher et al.,27 and 75–150 V/ppm and
0.05–0.10% efficiency, in the case of Ripperger and co-workers.13
Without the desolvating nebulizer, sensitivities are several times
worse.10,27 On the other hand, higher sensitivity of �240 V/ppm
and ionization efficiency (�0.28%, calculated) has been reported
by Lacan et al.12 using a Neptune (ThermoFisher) MC-ICPMS
fitted with an Aridus nebulizer.
These ionization efficiencies should be compared with those
obtained using our TIMS technique (see above). Here, 100-ng-
sized loads of standard cadmium yielded beams averaging �120
pA total Cd for a half-hour run and were not run to exhaustion.
These beams correspond to minimum ionization efficiencies of
�0.3% for cadmium.
Thus, for a fixed number of Cd atoms, it appears – in most
cases – that around two- to six-times as many ions more can be
registered by TIMS than by MC-ICPMS techniques. In terms of
pure ion statistics, this translates into error bars around a factor
of two smaller with TIMS, and is sufficient reason alone to
favour TIMS over MC-ICPMS. Consequently, we abandoned
further attempts at running Cd by MC-ICPMS and concentrated
on using TIMS.
Double spike optimization methodology
A useful way of envisioning the double spike problem is via a 3D
isotope space, formed from three independent isotope ratios
lying along the mutually orthogonal axes.29,30 Use of a common
denominator isotope ensures that mixing is linear, meaning that
four isotopes are required to define such an isotope space.
Nomenclature below follows closely that of Galer.30 The mixture
M to be measured lies between normal (unspiked) N, and double
spike S compositions, forming a straight line in 3D. Here, N ¼(n0, n1, n2) in components, and likewise for M and S. The so-
called fractionation vectors through the points N and M are fN
and fM respectively. These are defined as fN ¼ (D0n0, D1n1, D2n2),
for example, where Di are the components of the mass differences
(in daltons) between the numerator and denominator isotopes of
the isotope ratios forming the three axes. The locus of natural
MDF can then be written as N + a. fN for scalar a, and is accurate
in the region close to N where a is small.
J. Anal. At. Spectrom., 2009, 24, 1079–1088 | 1081
The optimization of the double spike composition, and
mixture, was done numerically with a penalty function approach.
This yields (1) an estimate of the ‘‘best’’ mixture (M) to use within
a given 3D isotope space (and its corresponding spike, S), along
with (2) a ‘‘figure of merit’’ w (the penalty function) enabling
comparison between different isotope spaces of each element.
The methodology contrasts with that of previous studies in two
ways: first, the ‘‘optimal’’ mixture is explicitly solved for rather
than the spike composition, and second, more rigorous criteria
are used.
Four parameters are built into the penalty function w, each of
which reflect a desirable property of the spiked mixture. These
parameters take on a value of 1 in the ideal or ‘‘perfect’’ case and
are larger otherwise. First, the ‘‘lever’’ parameter g
g ¼ si � ni
si �mi
(1)
stipulates that M should lie far from S and close to N. Second,
q is the angle between the fractionation vector through N and the
mixing line, and is derived via the dot-product
cosq ¼ m$f N (2)
where m ¼ S � N is the mixing vector and ‘‘hats’’ signify unit
vectors. Angle q should be large, and ideally close to 90�. Third,
the so-called ‘‘intersection angle’’ f plays a key and intuitive role
in deciding the worthiness of a double spike composition, as
discussed elsewhere.30 Angle f is the angle between the normal
and fractionation vectors (fN and fM) as viewed along the
direction of the mixing line. One simple way (but not the only
one) of obtaining angle f is via
cosf ¼ (m � f N)$(m � f M) (3)
and its magnitude should be large, while 90� would be perfect.
Lastly, the ‘‘magnitude’’ parameter r expresses the desire that the
sizes of the 3 isotope ratios of M lie close to unity; this is
expressed in terms of the penalty
r ¼ 1
6
Xi
�mi þ
1
mi
�(4)
which takes a minimum value of 1 for M ¼ (1.0, 1.0, 1.0) and is
larger otherwise.
All four parameters are incorporated into the single ‘‘figure of
merit’’ function w given by
w ¼ rg��sinq , sinf�� (5)
Clearly, another functional form for w could also have been
chosen, leading to different ‘‘weightings’’ of the four factors.
However, for the time being, Eqn. (5) is sufficient for our
purposes.
The ‘‘optimization’’ of the double spike was performed by
solving for M in a given defined isotope space and N that
resulted in a minimum value of w. Normal compositions (N)
were taken from IUPAC.32 The multi-dimensional minimization
of the objective function w was done numerically using
the slow-but-sure Nelder-Mead simplex method. Once prom-
ising compositions M and S have been identified, the
1082 | J. Anal. At. Spectrom., 2009, 24, 1079–1088
overall performance is examined as a function of spike-to-
sample ratio.
Cd isotope notation
We decided to express our isotopic results in terms of the relative
deviation of the sample 112Cd/110Cd ratio from that of the stan-
dard:
3112=110Cd ¼ �
112Cd=110Cd�
spl�112Cd=110Cd
�std
� 1
!� 104 (6)
using the notation outlined by Wombacher and Rehk€amper.33
The most important consideration in this choice is that there is
a two-dalton offset between numerator and denominator for the
reference 112Cd/110Cd ratio. This offset is consistent with the
notation for nearly all stable isotope systems of other elements
(where possible), thus facilitating easy comparison.
We chose not to use 114Cd/110Cd as the reference ratio, as
advocated by Wombacher and Rehk€amper33 and others, since
this involves a four-dalton offset. Further, there is no ultimate
improvement in the relative error in using this ratio. This is so,
since while the natural variation in 114Cd/110Cd is, of course,
double that of the 112Cd/110Cd ratio, the measurement error is
also double.
More specifically, we chose first to avoid odd-mass isotopes of
cadmium because of the problems they pose during TIMS
analyses. Second, isotopes 106Cd and 108Cd are of low natural
abundance and are therefore unsuitable in the reference ratio. Of
the remaining possibilities, it is clear that 116Cd should be avoided
due to a large potential isobaric interference from Sn, which can
be problematic.8 Similarly, a good reason not to use 114Cd is that
it might be affected by thermal neutron capture, according to113Cd (n, g) 114Cd, which is worthy of study itself as a measure of
neutron fluence.3 This leaves the only reasonable two-dalton
reference ratio as 112Cd/110Cd, which we have used here and
elsewhere.14 A further advantage is that the 110Cd/112Cd ratio of
the sample is determined directly during double spike data
reduction (see below).
Results and discussion
Cadmium double spike
The double-spike method was first formulated by Dodson,28 and
can be applied to determine the naturally-occurring MDF of the
thirty-one elements having four or more stable isotopes. Four
isotopes are needed in order to form three independent isotope
ratios.29,30 Three simultaneous equations arise from isotope mass
balance in the mixture of the three isotope ratios, which then can
be used to solve for three unknowns: (1) the mass dependent
fractionation of the sample at the time of adding the double
spike, (2) the instrumental mass bias during measurement, and
(3) the spike-to-sample proportions in the mixture.
Choice and optimization. There is far more to arriving at
a suitable ‘‘double spike’’ than simply picking a tracer compo-
sition, and a considerable amount of optimization is involved.30
First, there is the choice of the three equation set to use, con-
sisting of a trio of independent isotope ratios sharing a common
This journal is ª The Royal Society of Chemistry 2009
denominator isotope. Second, the double spike tracer composi-
tion must be picked within this isotope space; third, once the
tracer composition is finalized, the best proportions of spike to
sample in the mixture need to be determined. For this work, we
attempted to optimize the propagated error on the MDF of the
sample using methodology described in the Experimental
section. This envisions the minimization of a penalty function, w;
as a rule of thumb, a value of w < 2 would qualify as a ‘‘good’’
double spike to use, while spike-sample mixtures can be varied
until w is up to 5 and still provide useful results.
Cadmium consists of eight isotopes – two odd and six even –
which implies that there are 280 possible combinations of 3D
isotope spaces to consider. If we exclude the two odd-mass
isotopes 111Cd and 113Cd from consideration, for reasons of the
mass-independent fractionation effects discussed earlier, we are
left with the six even isotopes and sixty potential isotope spaces
to evaluate.
Potential spike compositions were examined in all sixty 3D
isotope spaces in which the six even isotopes – 106Cd, 108Cd, 110Cd,112Cd, 114Cd, 116Cd – in turn act as the common denominator on
the isotope ratios on the axes. From this analysis, we decided to
use a mixed 106Cd-108Cd double spike, working in the isotope
space {106Cd/112Cd, 108Cd/112Cd, 110Cd/112Cd}. This combination
appears to provide a low value of w at the optimal mixture, and
a broad ‘‘valley’’ of low w-values as the spike-to-sample ratio is
varied from the optimal one. The respective isotopic composi-
tions of our Cd standard and the double spike are summarized in
Table 1.
The 106Cd-108Cd double spike was prepared in 2005 from
commercial, single spikes of 106Cd (oxide, 96.47% nominal
purity) and 108Cd (metal, 90.70%), mixed such that the106Cd/108Cd ratio is �1.2, as implied by our optimization. The
exact compositions are reported in Table 1 while the optimal
mixture composition is given in Table 2. The concentration of the
double spike was set at �340 ppb total Cd, which was chosen so
that �200 mL of DS would yield a near-optimal mixture when
added to �100 ng normal or sample Cd. Such a concentration
yields acceptable weighing errors on the isotope dilution
measurements whilst minimizing DS usage overall. As can be
seen from Fig. 2, this DS has a relatively wide window for
spiking – roughly a factor of 5 either way – without imparing its
performance.
Comparison with other double spikes. Since we are not the first
to use a double spike in the isotope analysis of cadmium, we
compared the efficacy of our 106Cd-108Cd double spike, as mixed
up, with those previously proposed, and used, by two other
Table 1 Cd isotopic composition of spikes and laboratory standard measur
Material 106Cd/112Cd
106Cd spike 363.9108Cd spike 246.4106Cd-108Cd double spikea 360.246 � 2JMC Cd standardb 0.052463 � 8
a Calibrated composition. b Mean and 2SD of 63 runs of our in-house JMC sfrom Rosman et al.5
This journal is ª The Royal Society of Chemistry 2009
groups. Rosman et al.5 made use of a 106Cd-111Cd double spike in
this and other publications, while Ripperger and co-workers13
advocated a 110Cd-111Cd double spike. First, we used the DS
compositions reported by these authors to find the optimal
mixture of DS and normal Cd in the isotope space used (i.e. w is
minimized along the mixing line); second, we plotted the value of
w as a function of the spike-to-sample ratio. The comparison is
shown in Fig. 2, where we include a plot of the all-important
‘‘intersection angle’’ f as well, which is basically the angle
between the normal and fractionation vectors as viewed along
the mixing line (see Experimental section). The minimum values
of w are �33.6 (Ripperger and co-workers13), �7.83 (Rosman
et al.5) and�1.33 for our own DS. As illustrated in Fig. 2, the DS
previously used do not fare particularly well, at least based upon
the optimization criteria outlined in the Experimental section.
The performance characteristics and best mixtures of all three
DS are summarized in Table 2.
Double spike calibration. In order to make use of the double
spike, its isotopic composition must be calibrated against a Cd
standard of known isotopic composition. The calibrated double
spike can then be used, in the reverse sense, to determine the
unknown isotopic composition of Cd in a sample. Here it is
assumed that differences in isotopic composition between cali-
brating standard (known) and sample (unknown) are solely
related to mass-dependent fractionation of the isotopes.
In practise, two problems arise immediately. First, despite
some attempts and much discussion,33 there still does not exist
a suitable isotope reference material for cadmium. Second, none
of the Cd shelf standards used in various laboratories have been
calibrated ‘‘absolutely’’ to high precision. The recent isotopic
calibration by Pritzkow et al.34 is a step in the right direction, but
is problematic in detail. For example, these authors inexplicably
did not use their gravimetrically calibrated mixed spikes as
‘‘double spikes’’ in the sense of Dodson28 and as applied in this
study. More serious, though, is that they combined datasets from
MC-ICPMS and TIMS instruments, the latter of which, as
mentioned earlier, has a serious bias of odd- versus even-mass
isotopes.
For purposes of the double spike calibration, we were forced
to make two assumptions. First, we assumed that ‘‘normal’’
cadmium has a 110Cd/112Cd ratio equal to 0.520089, which is the
mean composition measured by Rosman et al.5 for six runs of
a single reagent. Note that this value differs slightly from that of
the quoted IUPAC composition.32 Second, we assumed that our
own laboratory shelf standard has the same 110Cd/112Cd ratio as
determined by Rosman et al.5 Neither of these assumptions can
ed by TIMS
108Cd/112Cd 110Cd/112Cd
7.731 0.56423607.6 123.8295.704 � 2 10.3864 � 10.037219 � 7 0.520089c
tandard (Lot #15922032). c Value used for internal normalization, taken
J. Anal. At. Spectrom., 2009, 24, 1079–1088 | 1083
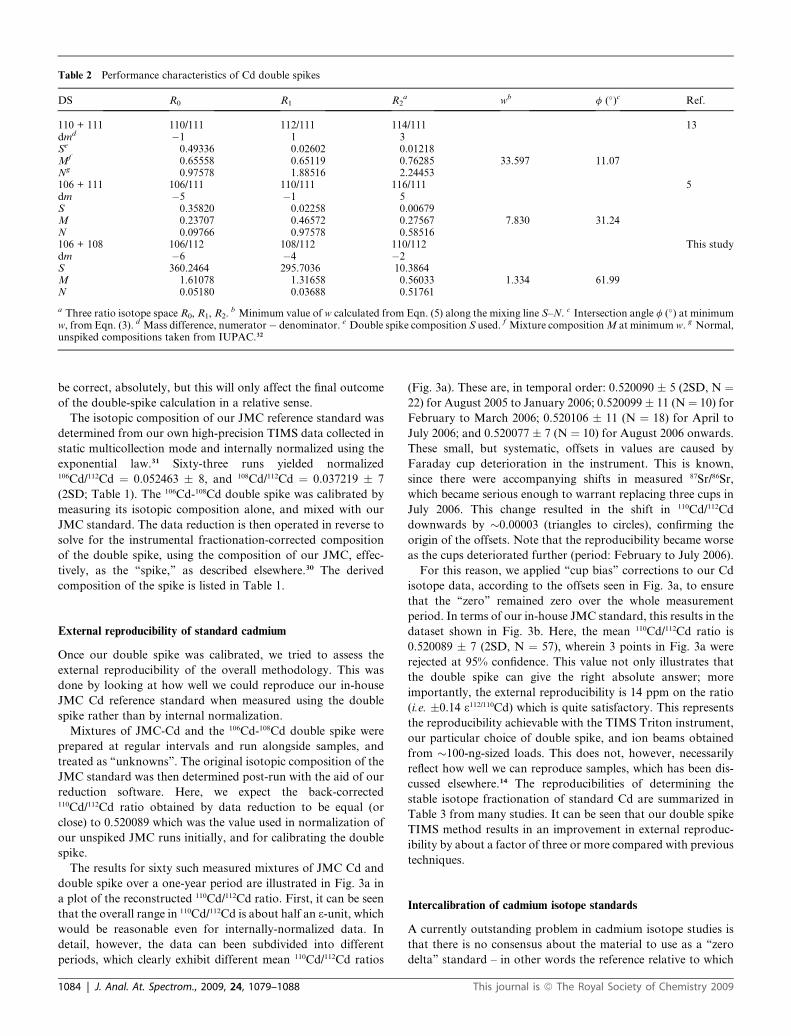
Table 2 Performance characteristics of Cd double spikes
DS R0 R1 R2a wb f (�)c Ref.
110 + 111 110/111 112/111 114/111 13dmd �1 1 3Se 0.49336 0.02602 0.01218Mf 0.65558 0.65119 0.76285 33.597 11.07Ng 0.97578 1.88516 2.24453106 + 111 106/111 110/111 116/111 5dm �5 �1 5S 0.35820 0.02258 0.00679M 0.23707 0.46572 0.27567 7.830 31.24N 0.09766 0.97578 0.58516106 + 108 106/112 108/112 110/112 This studydm �6 �4 �2S 360.2464 295.7036 10.3864M 1.61078 1.31658 0.56033 1.334 61.99N 0.05180 0.03688 0.51761
a Three ratio isotope space R0, R1, R2. b Minimum value of w calculated from Eqn. (5) along the mixing line S–N. c Intersection angle f (�) at minimumw, from Eqn. (3). d Mass difference, numerator� denominator. e Double spike composition S used. f Mixture composition M at minimum w. g Normal,unspiked compositions taken from IUPAC.32
be correct, absolutely, but this will only affect the final outcome
of the double-spike calculation in a relative sense.
The isotopic composition of our JMC reference standard was
determined from our own high-precision TIMS data collected in
static multicollection mode and internally normalized using the
exponential law.31 Sixty-three runs yielded normalized106Cd/112Cd ¼ 0.052463 � 8, and 108Cd/112Cd ¼ 0.037219 � 7
(2SD; Table 1). The 106Cd-108Cd double spike was calibrated by
measuring its isotopic composition alone, and mixed with our
JMC standard. The data reduction is then operated in reverse to
solve for the instrumental fractionation-corrected composition
of the double spike, using the composition of our JMC, effec-
tively, as the ‘‘spike,’’ as described elsewhere.30 The derived
composition of the spike is listed in Table 1.
External reproducibility of standard cadmium
Once our double spike was calibrated, we tried to assess the
external reproducibility of the overall methodology. This was
done by looking at how well we could reproduce our in-house
JMC Cd reference standard when measured using the double
spike rather than by internal normalization.
Mixtures of JMC-Cd and the 106Cd-108Cd double spike were
prepared at regular intervals and run alongside samples, and
treated as ‘‘unknowns’’. The original isotopic composition of the
JMC standard was then determined post-run with the aid of our
reduction software. Here, we expect the back-corrected110Cd/112Cd ratio obtained by data reduction to be equal (or
close) to 0.520089 which was the value used in normalization of
our unspiked JMC runs initially, and for calibrating the double
spike.
The results for sixty such measured mixtures of JMC Cd and
double spike over a one-year period are illustrated in Fig. 3a in
a plot of the reconstructed 110Cd/112Cd ratio. First, it can be seen
that the overall range in 110Cd/112Cd is about half an 3-unit, which
would be reasonable even for internally-normalized data. In
detail, however, the data can been subdivided into different
periods, which clearly exhibit different mean 110Cd/112Cd ratios
1084 | J. Anal. At. Spectrom., 2009, 24, 1079–1088
(Fig. 3a). These are, in temporal order: 0.520090 � 5 (2SD, N ¼22) for August 2005 to January 2006; 0.520099 � 11 (N¼ 10) for
February to March 2006; 0.520106 � 11 (N ¼ 18) for April to
July 2006; and 0.520077 � 7 (N ¼ 10) for August 2006 onwards.
These small, but systematic, offsets in values are caused by
Faraday cup deterioration in the instrument. This is known,
since there were accompanying shifts in measured 87Sr/86Sr,
which became serious enough to warrant replacing three cups in
July 2006. This change resulted in the shift in 110Cd/112Cd
downwards by �0.00003 (triangles to circles), confirming the
origin of the offsets. Note that the reproducibility became worse
as the cups deteriorated further (period: February to July 2006).
For this reason, we applied ‘‘cup bias’’ corrections to our Cd
isotope data, according to the offsets seen in Fig. 3a, to ensure
that the ‘‘zero’’ remained zero over the whole measurement
period. In terms of our in-house JMC standard, this results in the
dataset shown in Fig. 3b. Here, the mean 110Cd/112Cd ratio is
0.520089 � 7 (2SD, N ¼ 57), wherein 3 points in Fig. 3a were
rejected at 95% confidence. This value not only illustrates that
the double spike can give the right absolute answer; more
importantly, the external reproducibility is 14 ppm on the ratio
(i.e. �0.14 3112/110Cd) which is quite satisfactory. This represents
the reproducibility achievable with the TIMS Triton instrument,
our particular choice of double spike, and ion beams obtained
from �100-ng-sized loads. This does not, however, necessarily
reflect how well we can reproduce samples, which has been dis-
cussed elsewhere.14 The reproducibilities of determining the
stable isotope fractionation of standard Cd are summarized in
Table 3 from many studies. It can be seen that our double spike
TIMS method results in an improvement in external reproduc-
ibility by about a factor of three or more compared with previous
techniques.
Intercalibration of cadmium isotope standards
A currently outstanding problem in cadmium isotope studies is
that there is no consensus about the material to use as a ‘‘zero
delta’’ standard – in other words the reference relative to which
This journal is ª The Royal Society of Chemistry 2009
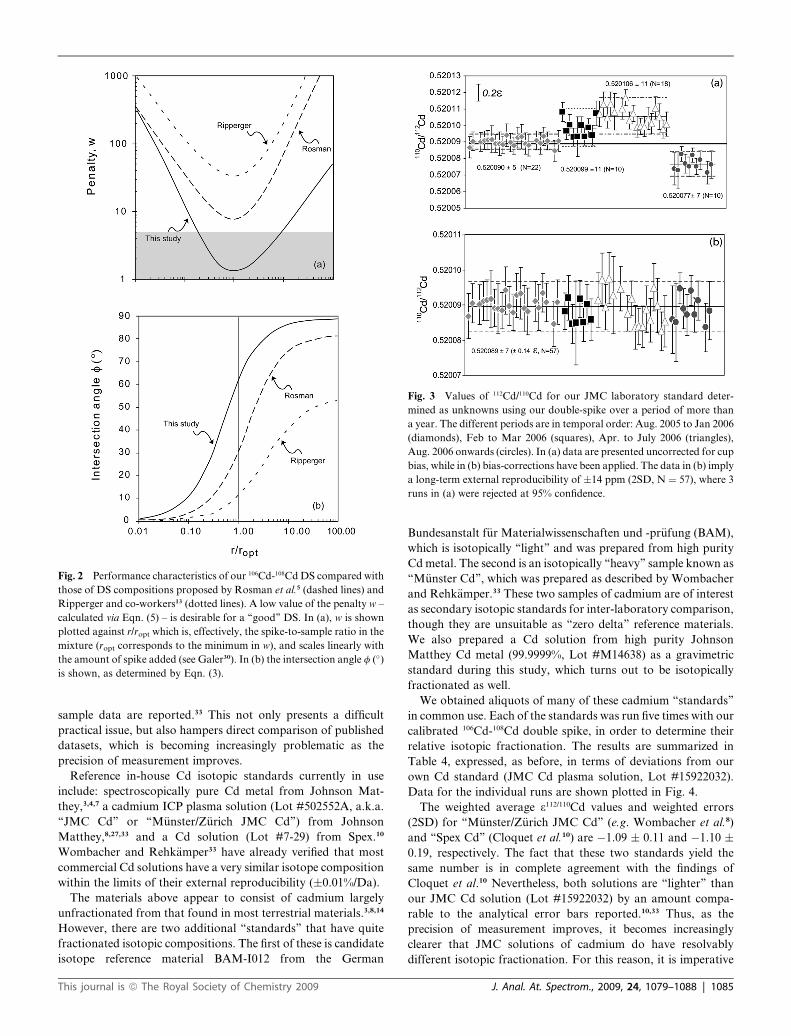
Fig. 3 Values of 112Cd/110Cd for our JMC laboratory standard deter-
mined as unknowns using our double-spike over a period of more than
a year. The different periods are in temporal order: Aug. 2005 to Jan 2006
(diamonds), Feb to Mar 2006 (squares), Apr. to July 2006 (triangles),
Aug. 2006 onwards (circles). In (a) data are presented uncorrected for cup
bias, while in (b) bias-corrections have been applied. The data in (b) imply
a long-term external reproducibility of �14 ppm (2SD, N ¼ 57), where 3
runs in (a) were rejected at 95% confidence.
Fig. 2 Performance characteristics of our 106Cd-108Cd DS compared with
those of DS compositions proposed by Rosman et al.5 (dashed lines) and
Ripperger and co-workers13 (dotted lines). A low value of the penalty w –
calculated via Eqn. (5) – is desirable for a ‘‘good’’ DS. In (a), w is shown
plotted against r/ropt which is, effectively, the spike-to-sample ratio in the
mixture (ropt corresponds to the minimum in w), and scales linearly with
the amount of spike added (see Galer30). In (b) the intersection angle f (�)
is shown, as determined by Eqn. (3).
sample data are reported.33 This not only presents a difficult
practical issue, but also hampers direct comparison of published
datasets, which is becoming increasingly problematic as the
precision of measurement improves.
Reference in-house Cd isotopic standards currently in use
include: spectroscopically pure Cd metal from Johnson Mat-
they,3,4,7 a cadmium ICP plasma solution (Lot #502552A, a.k.a.
‘‘JMC Cd’’ or ‘‘M€unster/Z€urich JMC Cd’’) from Johnson
Matthey,8,27,33 and a Cd solution (Lot #7-29) from Spex.10
Wombacher and Rehk€amper33 have already verified that most
commercial Cd solutions have a very similar isotope composition
within the limits of their external reproducibility (�0.01%/Da).
The materials above appear to consist of cadmium largely
unfractionated from that found in most terrestrial materials.3,8,14
However, there are two additional ‘‘standards’’ that have quite
fractionated isotopic compositions. The first of these is candidate
isotope reference material BAM-I012 from the German
This journal is ª The Royal Society of Chemistry 2009
Bundesanstalt f€ur Materialwissenschaften und -pr€ufung (BAM),
which is isotopically ‘‘light’’ and was prepared from high purity
Cd metal. The second is an isotopically ‘‘heavy’’ sample known as
‘‘M€unster Cd’’, which was prepared as described by Wombacher
and Rehk€amper.33 These two samples of cadmium are of interest
as secondary isotopic standards for inter-laboratory comparison,
though they are unsuitable as ‘‘zero delta’’ reference materials.
We also prepared a Cd solution from high purity Johnson
Matthey Cd metal (99.9999%, Lot #M14638) as a gravimetric
standard during this study, which turns out to be isotopically
fractionated as well.
We obtained aliquots of many of these cadmium ‘‘standards’’
in common use. Each of the standards was run five times with our
calibrated 106Cd-108Cd double spike, in order to determine their
relative isotopic fractionation. The results are summarized in
Table 4, expressed, as before, in terms of deviations from our
own Cd standard (JMC Cd plasma solution, Lot #15922032).
Data for the individual runs are shown plotted in Fig. 4.
The weighted average 3112/110Cd values and weighted errors
(2SD) for ‘‘M€unster/Z€urich JMC Cd’’ (e.g. Wombacher et al.8)
and ‘‘Spex Cd’’ (Cloquet et al.10) are �1.09 � 0.11 and �1.10 �0.19, respectively. The fact that these two standards yield the
same number is in complete agreement with the findings of
Cloquet et al.10 Nevertheless, both solutions are ‘‘lighter’’ than
our JMC Cd solution (Lot #15922032) by an amount compa-
rable to the analytical error bars reported.10,33 Thus, as the
precision of measurement improves, it becomes increasingly
clearer that JMC solutions of cadmium do have resolvably
different isotopic fractionation. For this reason, it is imperative
J. Anal. At. Spectrom., 2009, 24, 1079–1088 | 1085
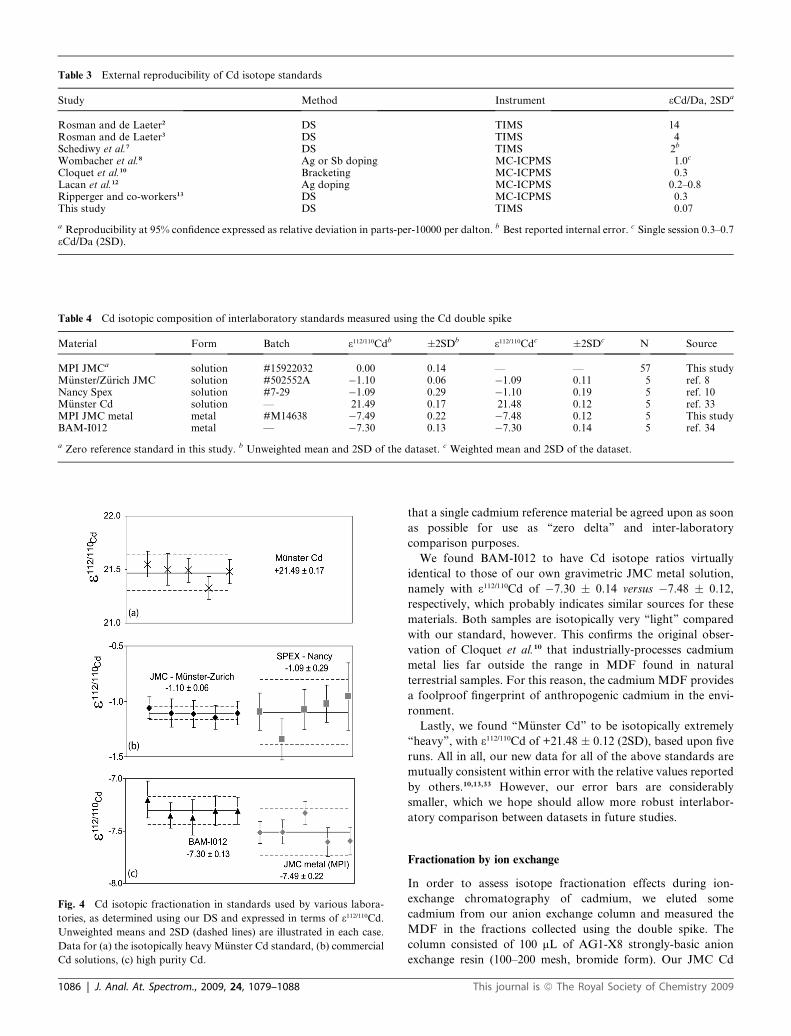
Table 3 External reproducibility of Cd isotope standards
Study Method Instrument 3Cd/Da, 2SDa
Rosman and de Laeter2 DS TIMS 14Rosman and de Laeter3 DS TIMS 4Schediwy et al.7 DS TIMS 2b
Wombacher et al.8 Ag or Sb doping MC-ICPMS 1.0c
Cloquet et al.10 Bracketing MC-ICPMS 0.3Lacan et al.12 Ag doping MC-ICPMS 0.2–0.8Ripperger and co-workers13 DS MC-ICPMS 0.3This study DS TIMS 0.07
a Reproducibility at 95% confidence expressed as relative deviation in parts-per-10000 per dalton. b Best reported internal error. c Single session 0.3–0.73Cd/Da (2SD).
Table 4 Cd isotopic composition of interlaboratory standards measured using the Cd double spike
Material Form Batch 3112/110Cdb �2SDb 3112/110Cdc �2SDc N Source
MPI JMCa solution #15922032 0.00 0.14 — — 57 This studyM€unster/Z€urich JMC solution #502552A �1.10 0.06 �1.09 0.11 5 ref. 8Nancy Spex solution #7-29 �1.09 0.29 �1.10 0.19 5 ref. 10M€unster Cd solution — 21.49 0.17 21.48 0.12 5 ref. 33MPI JMC metal metal #M14638 �7.49 0.22 �7.48 0.12 5 This studyBAM-I012 metal — �7.30 0.13 �7.30 0.14 5 ref. 34
a Zero reference standard in this study. b Unweighted mean and 2SD of the dataset. c Weighted mean and 2SD of the dataset.
Fig. 4 Cd isotopic fractionation in standards used by various labora-
tories, as determined using our DS and expressed in terms of 3112/110Cd.
Unweighted means and 2SD (dashed lines) are illustrated in each case.
Data for (a) the isotopically heavy M€unster Cd standard, (b) commercial
Cd solutions, (c) high purity Cd.
1086 | J. Anal. At. Spectrom., 2009, 24, 1079–1088
that a single cadmium reference material be agreed upon as soon
as possible for use as ‘‘zero delta’’ and inter-laboratory
comparison purposes.
We found BAM-I012 to have Cd isotope ratios virtually
identical to those of our own gravimetric JMC metal solution,
namely with 3112/110Cd of �7.30 � 0.14 versus �7.48 � 0.12,
respectively, which probably indicates similar sources for these
materials. Both samples are isotopically very ‘‘light’’ compared
with our standard, however. This confirms the original obser-
vation of Cloquet et al.10 that industrially-processes cadmium
metal lies far outside the range in MDF found in natural
terrestrial samples. For this reason, the cadmium MDF provides
a foolproof fingerprint of anthropogenic cadmium in the envi-
ronment.
Lastly, we found ‘‘M€unster Cd’’ to be isotopically extremely
‘‘heavy’’, with 3112/110Cd of +21.48 � 0.12 (2SD), based upon five
runs. All in all, our new data for all of the above standards are
mutually consistent within error with the relative values reported
by others.10,13,33 However, our error bars are considerably
smaller, which we hope should allow more robust interlabor-
atory comparison between datasets in future studies.
Fractionation by ion exchange
In order to assess isotope fractionation effects during ion-
exchange chromatography of cadmium, we eluted some
cadmium from our anion exchange column and measured the
MDF in the fractions collected using the double spike. The
column consisted of 100 mL of AG1-X8 strongly-basic anion
exchange resin (100–200 mesh, bromide form). Our JMC Cd
This journal is ª The Royal Society of Chemistry 2009
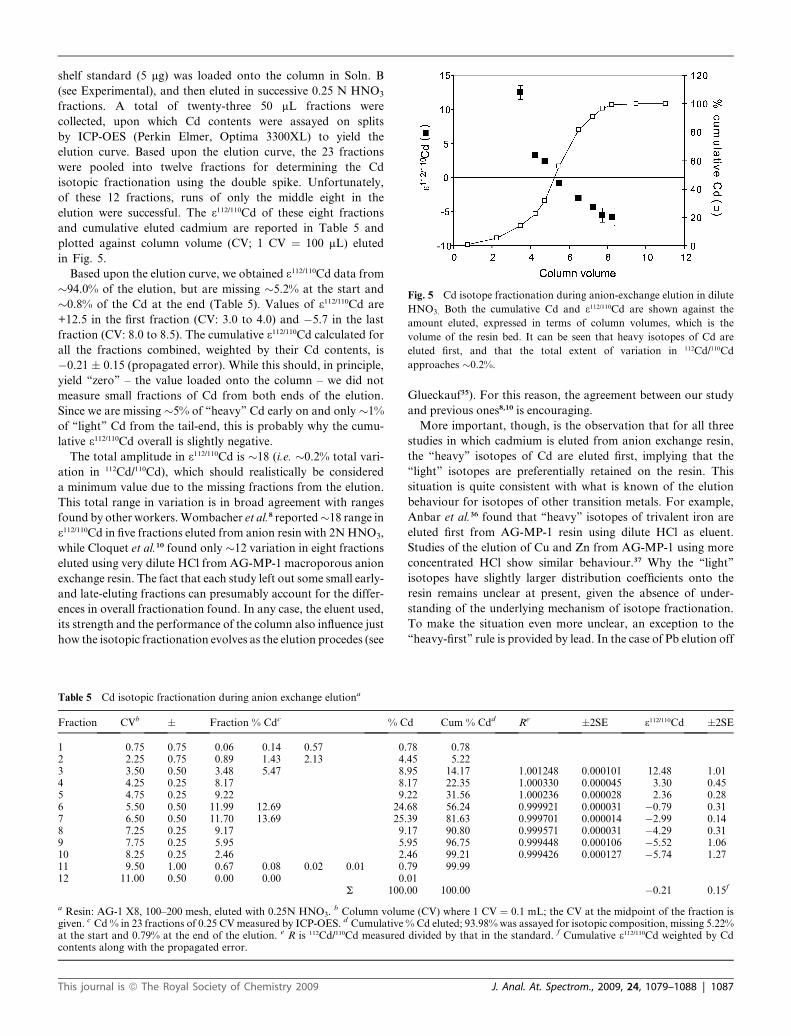
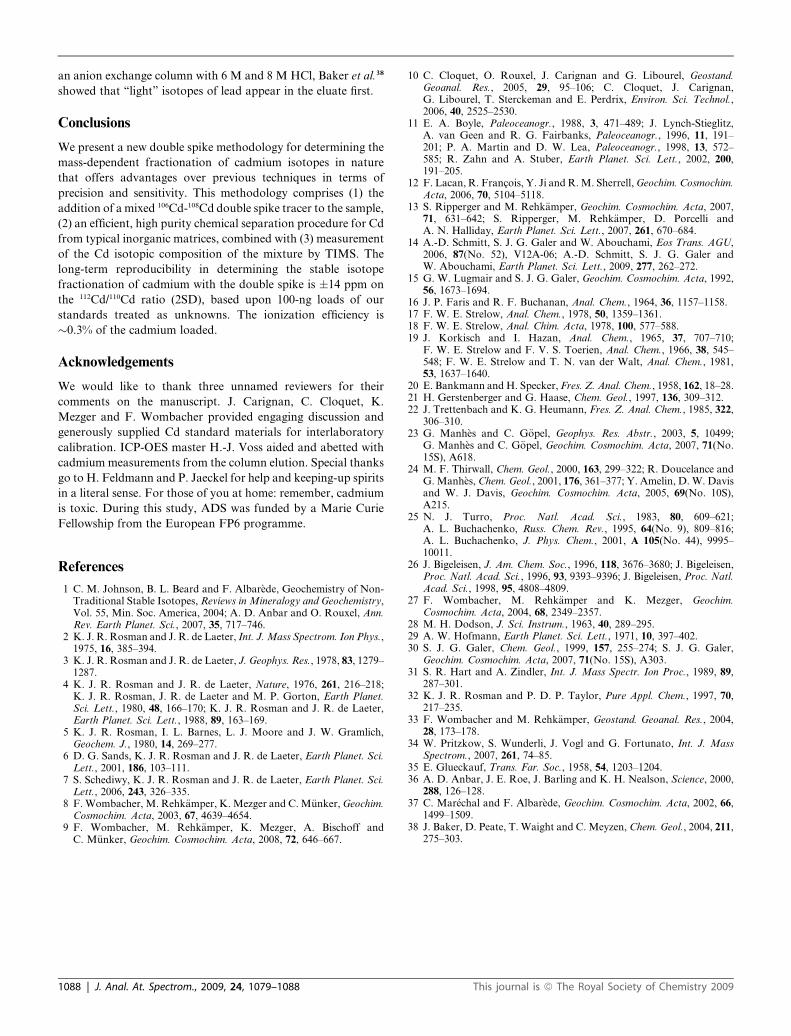
Fig. 5 Cd isotope fractionation during anion-exchange elution in dilute
HNO3. Both the cumulative Cd and 3112/110Cd are shown against the
amount eluted, expressed in terms of column volumes, which is the
volume of the resin bed. It can be seen that heavy isotopes of Cd are
eluted first, and that the total extent of variation in 112Cd/110Cd
approaches �0.2%.
shelf standard (5 mg) was loaded onto the column in Soln. B
(see Experimental), and then eluted in successive 0.25 N HNO3
fractions. A total of twenty-three 50 mL fractions were
collected, upon which Cd contents were assayed on splits
by ICP-OES (Perkin Elmer, Optima 3300XL) to yield the
elution curve. Based upon the elution curve, the 23 fractions
were pooled into twelve fractions for determining the Cd
isotopic fractionation using the double spike. Unfortunately,
of these 12 fractions, runs of only the middle eight in the
elution were successful. The 3112/110Cd of these eight fractions
and cumulative eluted cadmium are reported in Table 5 and
plotted against column volume (CV; 1 CV ¼ 100 mL) eluted
in Fig. 5.
Based upon the elution curve, we obtained 3112/110Cd data from
�94.0% of the elution, but are missing �5.2% at the start and
�0.8% of the Cd at the end (Table 5). Values of 3112/110Cd are
+12.5 in the first fraction (CV: 3.0 to 4.0) and �5.7 in the last
fraction (CV: 8.0 to 8.5). The cumulative 3112/110Cd calculated for
all the fractions combined, weighted by their Cd contents, is
�0.21 � 0.15 (propagated error). While this should, in principle,
yield ‘‘zero’’ – the value loaded onto the column – we did not
measure small fractions of Cd from both ends of the elution.
Since we are missing �5% of ‘‘heavy’’ Cd early on and only �1%
of ‘‘light’’ Cd from the tail-end, this is probably why the cumu-
lative 3112/110Cd overall is slightly negative.
The total amplitude in 3112/110Cd is �18 (i.e. �0.2% total vari-
ation in 112Cd/110Cd), which should realistically be considered
a minimum value due to the missing fractions from the elution.
This total range in variation is in broad agreement with ranges
found by other workers. Wombacher et al.8 reported�18 range in
3112/110Cd in five fractions eluted from anion resin with 2N HNO3,
while Cloquet et al.10 found only �12 variation in eight fractions
eluted using very dilute HCl from AG-MP-1 macroporous anion
exchange resin. The fact that each study left out some small early-
and late-eluting fractions can presumably account for the differ-
ences in overall fractionation found. In any case, the eluent used,
its strength and the performance of the column also influence just
how the isotopic fractionation evolves as the elution procedes (see
Table 5 Cd isotopic fractionation during anion exchange elutiona
Fraction CVb � Fraction % Cdc % C
1 0.75 0.75 0.06 0.14 0.57 0.2 2.25 0.75 0.89 1.43 2.13 4.3 3.50 0.50 3.48 5.47 8.4 4.25 0.25 8.17 8.5 4.75 0.25 9.22 9.6 5.50 0.50 11.99 12.69 24.7 6.50 0.50 11.70 13.69 25.8 7.25 0.25 9.17 9.9 7.75 0.25 5.95 5.10 8.25 0.25 2.46 2.11 9.50 1.00 0.67 0.08 0.02 0.01 0.12 11.00 0.50 0.00 0.00 0.
S 100.
a Resin: AG-1 X8, 100–200 mesh, eluted with 0.25N HNO3. b Column volumgiven. c Cd % in 23 fractions of 0.25 CV measured by ICP-OES. d Cumulativeat the start and 0.79% at the end of the elution. e R is 112Cd/110Cd measuredcontents along with the propagated error.
This journal is ª The Royal Society of Chemistry 2009
Glueckauf35). For this reason, the agreement between our study
and previous ones8,10 is encouraging.
More important, though, is the observation that for all three
studies in which cadmium is eluted from anion exchange resin,
the ‘‘heavy’’ isotopes of Cd are eluted first, implying that the
‘‘light’’ isotopes are preferentially retained on the resin. This
situation is quite consistent with what is known of the elution
behaviour for isotopes of other transition metals. For example,
Anbar et al.36 found that ‘‘heavy’’ isotopes of trivalent iron are
eluted first from AG-MP-1 resin using dilute HCl as eluent.
Studies of the elution of Cu and Zn from AG-MP-1 using more
concentrated HCl show similar behaviour.37 Why the ‘‘light’’
isotopes have slightly larger distribution coefficients onto the
resin remains unclear at present, given the absence of under-
standing of the underlying mechanism of isotope fractionation.
To make the situation even more unclear, an exception to the
‘‘heavy-first’’ rule is provided by lead. In the case of Pb elution off
d Cum % Cdd Re �2SE 3112/110Cd �2SE
78 0.7845 5.2295 14.17 1.001248 0.000101 12.48 1.0117 22.35 1.000330 0.000045 3.30 0.4522 31.56 1.000236 0.000028 2.36 0.2868 56.24 0.999921 0.000031 �0.79 0.3139 81.63 0.999701 0.000014 �2.99 0.1417 90.80 0.999571 0.000031 �4.29 0.3195 96.75 0.999448 0.000106 �5.52 1.0646 99.21 0.999426 0.000127 �5.74 1.2779 99.990100 100.00 �0.21 0.15f
e (CV) where 1 CV ¼ 0.1 mL; the CV at the midpoint of the fraction is% Cd eluted; 93.98% was assayed for isotopic composition, missing 5.22%divided by that in the standard. f Cumulative 3112/110Cd weighted by Cd
J. Anal. At. Spectrom., 2009, 24, 1079–1088 | 1087
an anion exchange column with 6 M and 8 M HCl, Baker et al.38
showed that ‘‘light’’ isotopes of lead appear in the eluate first.
Conclusions
We present a new double spike methodology for determining the
mass-dependent fractionation of cadmium isotopes in nature
that offers advantages over previous techniques in terms of
precision and sensitivity. This methodology comprises (1) the
addition of a mixed 106Cd-108Cd double spike tracer to the sample,
(2) an efficient, high purity chemical separation procedure for Cd
from typical inorganic matrices, combined with (3) measurement
of the Cd isotopic composition of the mixture by TIMS. The
long-term reproducibility in determining the stable isotope
fractionation of cadmium with the double spike is �14 ppm on
the 112Cd/110Cd ratio (2SD), based upon 100-ng loads of our
standards treated as unknowns. The ionization efficiency is
�0.3% of the cadmium loaded.
Acknowledgements
We would like to thank three unnamed reviewers for their
comments on the manuscript. J. Carignan, C. Cloquet, K.
Mezger and F. Wombacher provided engaging discussion and
generously supplied Cd standard materials for interlaboratory
calibration. ICP-OES master H.-J. Voss aided and abetted with
cadmium measurements from the column elution. Special thanks
go to H. Feldmann and P. Jaeckel for help and keeping-up spirits
in a literal sense. For those of you at home: remember, cadmium
is toxic. During this study, ADS was funded by a Marie Curie
Fellowship from the European FP6 programme.
References
1 C. M. Johnson, B. L. Beard and F. Albar�ede, Geochemistry of Non-Traditional Stable Isotopes, Reviews in Mineralogy and Geochemistry,Vol. 55, Min. Soc. America, 2004; A. D. Anbar and O. Rouxel, Ann.Rev. Earth Planet. Sci., 2007, 35, 717–746.
2 K. J. R. Rosman and J. R. de Laeter, Int. J. Mass Spectrom. Ion Phys.,1975, 16, 385–394.
3 K. J. R. Rosman and J. R. de Laeter, J. Geophys. Res., 1978, 83, 1279–1287.
4 K. J. R. Rosman and J. R. de Laeter, Nature, 1976, 261, 216–218;K. J. R. Rosman, J. R. de Laeter and M. P. Gorton, Earth Planet.Sci. Lett., 1980, 48, 166–170; K. J. R. Rosman and J. R. de Laeter,Earth Planet. Sci. Lett., 1988, 89, 163–169.
5 K. J. R. Rosman, I. L. Barnes, L. J. Moore and J. W. Gramlich,Geochem. J., 1980, 14, 269–277.
6 D. G. Sands, K. J. R. Rosman and J. R. de Laeter, Earth Planet. Sci.Lett., 2001, 186, 103–111.
7 S. Schediwy, K. J. R. Rosman and J. R. de Laeter, Earth Planet. Sci.Lett., 2006, 243, 326–335.
8 F. Wombacher, M. Rehk€amper, K. Mezger and C. M€unker, Geochim.Cosmochim. Acta, 2003, 67, 4639–4654.
9 F. Wombacher, M. Rehk€amper, K. Mezger, A. Bischoff andC. M€unker, Geochim. Cosmochim. Acta, 2008, 72, 646–667.
1088 | J. Anal. At. Spectrom., 2009, 24, 1079–1088
10 C. Cloquet, O. Rouxel, J. Carignan and G. Libourel, Geostand.Geoanal. Res., 2005, 29, 95–106; C. Cloquet, J. Carignan,G. Libourel, T. Sterckeman and E. Perdrix, Environ. Sci. Technol.,2006, 40, 2525–2530.
11 E. A. Boyle, Paleoceanogr., 1988, 3, 471–489; J. Lynch-Stieglitz,A. van Geen and R. G. Fairbanks, Paleoceanogr., 1996, 11, 191–201; P. A. Martin and D. W. Lea, Paleoceanogr., 1998, 13, 572–585; R. Zahn and A. Stuber, Earth Planet. Sci. Lett., 2002, 200,191–205.
12 F. Lacan, R. Francois, Y. Ji and R. M. Sherrell, Geochim. Cosmochim.Acta, 2006, 70, 5104–5118.
13 S. Ripperger and M. Rehk€amper, Geochim. Cosmochim. Acta, 2007,71, 631–642; S. Ripperger, M. Rehk€amper, D. Porcelli andA. N. Halliday, Earth Planet. Sci. Lett., 2007, 261, 670–684.
14 A.-D. Schmitt, S. J. G. Galer and W. Abouchami, Eos Trans. AGU,2006, 87(No. 52), V12A-06; A.-D. Schmitt, S. J. G. Galer andW. Abouchami, Earth Planet. Sci. Lett., 2009, 277, 262–272.
15 G. W. Lugmair and S. J. G. Galer, Geochim. Cosmochim. Acta, 1992,56, 1673–1694.
16 J. P. Faris and R. F. Buchanan, Anal. Chem., 1964, 36, 1157–1158.17 F. W. E. Strelow, Anal. Chem., 1978, 50, 1359–1361.18 F. W. E. Strelow, Anal. Chim. Acta, 1978, 100, 577–588.19 J. Korkisch and I. Hazan, Anal. Chem., 1965, 37, 707–710;
F. W. E. Strelow and F. V. S. Toerien, Anal. Chem., 1966, 38, 545–548; F. W. E. Strelow and T. N. van der Walt, Anal. Chem., 1981,53, 1637–1640.
20 E. Bankmann and H. Specker, Fres. Z. Anal. Chem., 1958, 162, 18–28.21 H. Gerstenberger and G. Haase, Chem. Geol., 1997, 136, 309–312.22 J. Trettenbach and K. G. Heumann, Fres. Z. Anal. Chem., 1985, 322,
306–310.23 G. Manh�es and C. G€opel, Geophys. Res. Abstr., 2003, 5, 10499;
G. Manh�es and C. G€opel, Geochim. Cosmochim. Acta, 2007, 71(No.15S), A618.
24 M. F. Thirwall, Chem. Geol., 2000, 163, 299–322; R. Doucelance andG. Manh�es, Chem. Geol., 2001, 176, 361–377; Y. Amelin, D. W. Davisand W. J. Davis, Geochim. Cosmochim. Acta, 2005, 69(No. 10S),A215.
25 N. J. Turro, Proc. Natl. Acad. Sci., 1983, 80, 609–621;A. L. Buchachenko, Russ. Chem. Rev., 1995, 64(No. 9), 809–816;A. L. Buchachenko, J. Phys. Chem., 2001, A 105(No. 44), 9995–10011.
26 J. Bigeleisen, J. Am. Chem. Soc., 1996, 118, 3676–3680; J. Bigeleisen,Proc. Natl. Acad. Sci., 1996, 93, 9393–9396; J. Bigeleisen, Proc. Natl.Acad. Sci., 1998, 95, 4808–4809.
27 F. Wombacher, M. Rehk€amper and K. Mezger, Geochim.Cosmochim. Acta, 2004, 68, 2349–2357.
28 M. H. Dodson, J. Sci. Instrum., 1963, 40, 289–295.29 A. W. Hofmann, Earth Planet. Sci. Lett., 1971, 10, 397–402.30 S. J. G. Galer, Chem. Geol., 1999, 157, 255–274; S. J. G. Galer,
Geochim. Cosmochim. Acta, 2007, 71(No. 15S), A303.31 S. R. Hart and A. Zindler, Int. J. Mass Spectr. Ion Proc., 1989, 89,
287–301.32 K. J. R. Rosman and P. D. P. Taylor, Pure Appl. Chem., 1997, 70,
217–235.33 F. Wombacher and M. Rehk€amper, Geostand. Geoanal. Res., 2004,
28, 173–178.34 W. Pritzkow, S. Wunderli, J. Vogl and G. Fortunato, Int. J. Mass
Spectrom., 2007, 261, 74–85.35 E. Glueckauf, Trans. Far. Soc., 1958, 54, 1203–1204.36 A. D. Anbar, J. E. Roe, J. Barling and K. H. Nealson, Science, 2000,
288, 126–128.37 C. Mar�echal and F. Albar�ede, Geochim. Cosmochim. Acta, 2002, 66,
1499–1509.38 J. Baker, D. Peate, T. Waight and C. Meyzen, Chem. Geol., 2004, 211,
275–303.
This journal is ª The Royal Society of Chemistry 2009
Copyright © 2022 FDOKUMEN