An investigation of cadmium and sulfur reactions in ...
69
Portland State University Portland State University PDXScholar PDXScholar Dissertations and Theses Dissertations and Theses 1982 An investigation of cadmium and sulfur reactions in An investigation of cadmium and sulfur reactions in dimethylsulfoxide dimethylsulfoxide Howard W. Hogle Portland State University Follow this and additional works at: https://pdxscholar.library.pdx.edu/open_access_etds Part of the Inorganic Chemistry Commons Let us know how access to this document benefits you. Recommended Citation Recommended Citation Hogle, Howard W., "An investigation of cadmium and sulfur reactions in dimethylsulfoxide" (1982). Dissertations and Theses. Paper 3213. https://doi.org/10.15760/etd.3204 This Thesis is brought to you for free and open access. It has been accepted for inclusion in Dissertations and Theses by an authorized administrator of PDXScholar. Please contact us if we can make this document more accessible: [email protected].
-
Upload
khangminh22 -
Category
Documents
-
view
4 -
download
0
Transcript of An investigation of cadmium and sulfur reactions in ...
Portland State University Portland State University
PDXScholar PDXScholar
Dissertations and Theses Dissertations and Theses
1982
An investigation of cadmium and sulfur reactions in An investigation of cadmium and sulfur reactions in
dimethylsulfoxide dimethylsulfoxide
Howard W. Hogle Portland State University
Follow this and additional works at: https://pdxscholar.library.pdx.edu/open_access_etds
Part of the Inorganic Chemistry Commons
Let us know how access to this document benefits you.
Recommended Citation Recommended Citation Hogle, Howard W., "An investigation of cadmium and sulfur reactions in dimethylsulfoxide" (1982). Dissertations and Theses. Paper 3213. https://doi.org/10.15760/etd.3204
This Thesis is brought to you for free and open access. It has been accepted for inclusion in Dissertations and Theses by an authorized administrator of PDXScholar. Please contact us if we can make this document more accessible: [email protected].

AN ABSTRACT OF THE THESIS OF Howard W. Hogle for the Master of
Science in Chemistry presented July 23, 1982.
Title: An Investigation of Cadmium and Sulfur Reactions in
Dimethylsulfoxide.
APPROVED BY MEMBERS OF THE THESIS COMMITTEE:
David K. Roe, Chairman
Dennis W. Barnum
The study of the reaction of cadmium and sulfur in dimethyl-
sulfoxide (DMSO) is presented. Specifically, the reaction of
dissolved molecular sulfur in DMSO at temperatures greater than 90°C
with freshly precipitated metallic cadmium is followed by UV-visible
spectrometry, atomic absorption spectrometry, and Raman spectrometry.
Evidence for the formation of a new cadmium-sulfur species and S3- is
discussed. In a second reaction, an equilibrium sodium polysulfide
solution in DMSO is titrated with a solution of cadmium ion at room
temperature and the reaction progress is followed by means of UV
visible spectrometry. A calculation of the average number of poly
sulfide charges reacting with each cadmium ion, nQ, was made using
literature values of the molar absorptivities of the ions 83-, Sa- 2 ,
and 8 6 -2 and Beer's law. Likewise, the average number of sulfur
atoms, nM, reacting with each cadmium ion was determined. A value
of 4.8 polysulfide charges per cadmium ion was determined for nQ and
a value of 18 sulfur atoms per cadmium ion was determined for nM.
The significance of the possible formation of cadmium polysulfide
complexes is discussed briefly in conjunction with the reaction
mechanisms involved in the electrodeposition of CdS from a DMSO
solution of CdCl2 and S8 •
2

AN INVESTIGATION OF CADMIL~f AND SULFUR REACTIONS
IN DIMETHYLSULFOXIDE
by
H0\.,1ARD W. HOGLE
A thesis submitted in partial fulfillment of the requirements for the degree of
MASTER OF SCIENCE in
CHEMISTRY
Portland State University
1982
TO THE OFFICE OF GRADUATE STUDIES AND RESEARCH:
The members of the Committee approve the thesis of Howard W.
Hogle presented July 23, 1982.
David K. Roe, Chairman
Dennis W. Barnum
H¢race F. White
APPROVED:
David W. McClure, Chairman, Department of Chemistry
Studies and Research

ACKNOWLEDGEMENTS
The author at this time thanks David K. Roe for his interest
in the work undertaken, for his encouragement when results were slow
to come, and for his patience throughout this project.
A special thank you is given to Dennis W. Barnum and Horace
F. White for their careful reading of the manuscript and their many
suggestions.
The author expresses his gratitude to Thomas M. Loehr and
Scott S. Sibbett for the time and effort involved in recording the
needed Raman spectra.
The author is also grateful to Nancy Christie for typing the
manuscript.
A special thank you is given to my wife, Linda R. Forbes,
for her many sacrifices during this endeavor.
This work is dedicated to my parents, Harold W. Hogle and
Sophia M. Hogle.

TABLE OF CONTENTS
ACIGmWLEDGEMENT S
LIST OF TABLES
LIST OF FIGURES . .
CHAPTER
I INTRODUCTION
II MATERIALS
III APPARATUS
IV PROCEDURE AND RESULTS
Stability of molecular sulfur in dimethylsulf oxide . . . .
Reaction of metallic cadmium with Sa dissolved in dimethylsulfoxide
Reaction of cadmium ion with polysulfides in dimethylsulf oxide
V DISCUSSION
REFERENCES
APPENDIX A: FORMATION OF POLYSULFIDE SOLUTIONS .
APPENDIX B: DERIVATION OF EQUILIBRIUM EQUATION USING SAWYER'S CONSTANTS ..... .
PAGE
iii
v
vi
1
9
12
14
14
17
25
30
54
57
59

LIST OF TABLES
TABLE
I Summary of Molar Absorptivities for Polysulfides .
II Summary of Equilibrium Constants, Ka and K2 ....
III Summary of Experimental Results from Reaction of
PAGE
6
7
Dissolved Sulfur with Metallic Cadmium . . . . . . . 20
IV Solubility of CdS in DMSO 25
V Molar Absorptivities of S3 - at Various Wavelengths . . . 36
VI Molar Absorptivities of S8 -2 at Various Wavelengths . . 37
VII Summary of Molar Absorptivities for S3-, S8 -2
, and
Hypothetical Cadmium Polysulf ide Complex
VIII Relative Deviation of Experimental Polysulfide
Concentrations from Theoretical Polysulf ide
Concentrations
IX Values of K2 Calculated for DMSO Solutions of Na2Se
38
46
49

LIST OF FIGURES
FIGURE PAGE
1. VV-visible spectra of varying concentrations of
sulfur in DMSO 15
2. Absorbance versus sulfur concentration where sulfur
concentration is expressed as rnmoles of S/liter . . 16
3. UV-visible spectra of a 0.075 ~1 Se solution as a
function of temperature
4. (a) Raman spectrum of 2.13 mM Se solution which was
reacted with cadmium metal. (b) Raman spectrum
of initial 2.13 mM Se solution
5. (a) Raman spectrum of neat DMSO. (b) Raman spectrum
18
21
of DMSO saturated with Se (3.23 mM Se) . . . . . . 22
6. UV-visible spectra of 0.110 mM Se solution aliquots
7.
8.
9.
which were passed over cadmium metal
Elongated quartz cuvette . .
Reaction of cadmium ion with polysulfides followed
by UV-visible spectrometry
Spectrophotometric curves recorded by
Cauquis (21) .•........ . . . . . . . .
23
27
29
35
vii
FIGURE PAGE
10. The experimental values of [S 3-], [S 6 -2], and [Se- 2
)
remaining after each addition of cadmium ion were
determined from UV-visible spectra and Sawyer's
constants . . .
11. Ratio of reacted polysulfide charge to cadmium ion,
nQ, versus -log[Qr], where [Qr] is the total
charge concentration of the remaining unreacted
polysulf ide
12. Ratio of total reacted sulfur atoms to cadmium ion,
nM, versus -log[MT], where [MT] is the total
sulfur concentration of the remaining unreacted
polysulf ide . .
13. Theoretical values for polysulfide concentrations
calculated with Sawyer's equilibrium equations
where sulfur atom to charge ratio equals 4.78 .
14. Expansion of Figure 13 with experimental values of
[S3-], [5 6 -2], and [Sa- 2
] after each addition
compared to the theoretical curves derived from
Sawyer's equilibria equations
15. (a) Sawyer's original plot (24). (b) An additional
data point taken from Sawyer's data for an overall
[Na2S6] of 20 x 10- 3 M. (c) Modified plot
16. Possible ligand combinations involving only S3 - and
Sa- 2 . . . . . . . . . . . . . . . . . . . . . . .
39
41
42
44
45
48
51
CHAPTER I
INTRODUCTION
Recently, research on the deposition of CdS as a photoactive
semiconductor film upon conducting substrates has increased because of
its applications for converting solar energy to electrical energy (1-
4). In the general case of cadmium chalcogenides, the majority of
the films have been formed by vapor deposition techniques (5,6). CdSe
films have been formed by the direct reaction of cadmium metal with a
selenium-saturated, 5 M KOH aqueous solution (7). A variety of elec
trochemical methods has been described; these include anodization of
cadmium metal in a solution of sulfide ion to form an insoluble CdS
film (8-11). Other chalcogenides, CdSe (12) .and CdTe (13), have been
deposited cathodically from acidified solutions containing CdSO~ and
either Se02 or Te02.
More recent work completed by two different groups has
described the cathodic electrodeposition of sulfides and selenides
from a non-aqueous solution of metallic salts and elemental sulfur
or selenium (14-17). A non-aqueous solvent, such as dimethyl
sulfoxide (DMSO), provides a medium in which both non-polar elemen
tal sulfur or selenium and metallic salts can be dissolved. Both
groups have reported that the deposits produced photopotentials in
basic aqueous sulfur-sulfide solutions, and that doping agents could
he incorporated in the films during the electrochemical process.

Baranski and Fawcett have successfully electrodeposited thin
films of CdS and CdSe, as well as other metallic chalcogenides on
substrates of Pt, Au, stainless steel, Ni, Zn, and glass covered
with a conducting film of Sn0 2 • The non-aqueous solvents used were
DMSO, dimethylformamide (DMF), and ethylene glycol. Noting that the
overall reaction in the case of CdS is
• 2 (1) Cd + S + 2e- ~ CdS
2
they have proposed a mechanism in which a freshly electrodeposited
metal monolayer reacts with the dissolved sulfur (14,15). The mech
anism is complicated by the fact that elemental sulfur in solution
exists as the polyatomic molecule S8 • X-ray diffractometer patterns
revealed the material deposited had an interplanar distance of 3.34 A
which compares favorably with the value of 3.36 A for a-eds.
A Rutherford spectrum for ~ particles back-scattered from the
CdS deposit gave two peaks--one for Cd and one for S. The film com
position was estimated from these peaks to be uniform as a function
of depth and in a sulfur/cadmium ratio of 0.9 ± 0.1 to one. An 81%
coulombic efficiency, however, was observed. The remaining consump
tion of charge was attributed to secondary reactions involving oxygen
and/or water, or to the reduction of sulfur contained in sulfur-oxygen
species.
Roe, Li, and Gerischer have also reported the cathodic deposi
tion of metal sulfides and selenides (17). The proposed reaction
sequences were viewed to be either of the following pathways:

3
+n - M (2a) M + ne -+ (surf ace)
(2b) X + qM -+ M X + X m (surface) q p(surface) (m - p)
(3a) X + 2e- -+ X - 2
m m
+n X + X ( 3 b) X m -2
+ qM -+ M q p (surface) ( m - P)
where X represents a sulfur or selenium molecule of unspecified m
molecularity, and M the metal of interest. They have reported elec-
trodepositions of CdS, CdSe, and Bi 2 Se3 on gold, graphite, titanium,
and cadmium-plated copper substrates.
The electrodeposition process was studied by means of voltam-
metry. Specifically for CdS, current was measured as a function of
potential at either a stationary gold electrode, or at a rotating
gold ring-disc electrode. From linear potential scans and potential
pulse measurements, they deduced that underpotential deposits of
cadmium reacted with Se in solution or adsorbed on the electrode sur-
face at 25°C. At 95°C the reactions became more complicated; and
at voltages greater than the underpotential of -0.4 V versus SCE,
direct reduction of Se to polysulfide competed with the electro-
deposition of CdS.
The intent of our present research is to investigate the pos-
sible f orrns and combinations of sulfur and cadmium atoms which may
come to exist in the electrolyte during the electrodeposition
described by these two groups. The investigation has been limited
to non-f aradaic reactions of cadmium and sulfur species occurring in

4
the aprotic solvent DMSO in order to separate these reactions from
their electrochemical precursors. The Cd/sulfur/DMSO system was
chosen because of its previous extensive study (16,17).
The identification of reduced sulfur species, or polysulfides,
has a long history and the subject is still being examined. The
first recorded observations of polysulfides were made by Geitner in
1864 (18). When sulfur was heated to 180°C in a sealed tube with
water and traces of a base, a deep blue coloration developed and sub-
sequently disappeared with a lowering of the temperature. In 1966
Lux and Giggenbach showed that the blue and red color carriers in
polysulfide solutions migrated from cathode to anode, indicative of
negatively charged particles, and not of a neutral sulfur molecular
fragment (19,20).
Electrochemical methods have been used in conjunction with UV-
visible spectroscopy to study polysulfides (21-28). The reduction of
Se by electrolysis in dimethylsulf oxide has been studied by two groups
(21-25). Cauquis et al. studied the reduction of Se at a platinum
electrode in DMSO with 0.1 M Et4NCl04 as an electrolyte (21,22).
Reaction progress was followed by UV-visible spectrometry. Reduction
occurred at two different potentials, and it was proposed that the
'products participated in subsequent reactions as shown below:
First Reduction
Se + 2e- -+ Se- 2
4Sa- 2 :¢ 456- 2 + Se
s6- 2 :¢ 2s3-
Second Reduction l
s6-2 + 2e--+ 253- 2
2s3- 2 + s6- 2 -+ 3s4- 2

5
Sawyer et al. approached the study of polysulfides differently
(23-25). Sodium polysulfides were prepared by allowing stoichio-
metric amounts of elemental sulfur and sodium metal to react in
liquid ammonia under a dry nitrogen atmosphere; the polysulfide was
isolated by evaporation of the ammonia. The UV-visible spectra
of the polysulfides S4- 2, s6- 2
, and Sa- 2 in DMSO were compared with
the products of the two step electrochemical reduction of sulfur.
The two step reduction process was concluded to be:
Se + 2e- -+ Sa- 2 , Sa- 2 + 2e--+ Sa- 4
First J4s -2,.,, 48 -2 + S Reduction 8 6 8
Secon~ \ Sa-4-+ 2s 4-2
Reduction
s6- 2 ¢ 2s3- I s .. - 2 + s.- 2 ""2s.-'
s6- 2 ¢ 2s3-
In 1977, F. Seel et al. reviewed the literature of polysulfides
in aprotic solvents and conducted additional experiments (26). They
studied UV-visible spectra obtained during the addition of Sa solu-
tions of Na 2 S6 and Na 2 S8 as a function of temperature. Their conclu-
tions included:
1. The first reduction step of Sa is primarily due to the
formation of 5 8 -2
•
2. The absorption band at 618 nm is due to the radical ion
s3- ·
3. No ESR evidence of a S4- radical was found.
4. No UV-visible evidence of sulfur fragments S2, S3, or S4
was found.

6
A summary of the assigned absorbance maxima for the polysulf ides
and the calculated molar absorptivities appears in Table I.
TABLE I
SUMMARY OF MOLAR ABSORPTIVITIES FOR POLYSULFIDES
--Se- 2 S3- 56- 2 S.c.- 2
Ref. Solvent E :\ E :\ E :\ E :\
24 DMSO 4000 492 4450 618 3800 475 900 420
22 DMSO 4000<Ee 490 nc 618 nc na 2000 430 <6000
26 DMF nc 465<A e 4850 617 nc 460 nc na <487
27 Aceto- 4400 480 3900 613 3100 450 nc 330 nitrile 10000 350 11000 340
28 DMA 900 618 3800 618 nc 450de nc na 4100 518 400 518 460 7800 365
nc = not calculated. na = not assigned.
Two equilibrium constants are frequently calculated for the dissocia-
tion of s6- 2 and for the global transformation of se- 2 to 56- 2 as
described below:
( 4) 56- 2 ¢ 2s3- Kd = [56~" 2 ]
[S3-) 2
!.-,;
(5) 4Se- 2 :¢ 45 6- 2 + Se K _ [Se] 4 [S6- 2
]
2 - [5e-2]
These values are summarized in Table II.

7
TABLE II
SUMMARY OF EQUILIBRIUM CONSTA~TS, Kd AND K2
= ($3-1 2 k
Reference Kd K _ [S6][Sa] 4
s6= 2 - [Sa] Solvent
24,25 9 x lo- 3 2 x lo- 2 DMSO
22 nc . 03 < K2 < .1 DMSO
26 7. 9 x lo- 2 nc DMF
27 i. 2 x lo- 3 1. 6 x 10- 2 Acetonitrile
28 7 x io- 2 9 x lo- 4 DMA
nc = not calculated.
Only Sawyer et al. have attempted to calculate equilibrium constants
for other possible equilbria, namely,
(6) 2s6-2 ¢ Sa-2 + $4-2 - [se- 2
] [s4- 2)
Ks - [ s6 - 2] 2
(7) 254- 2 ¢253 - + s 2 -2 K _ [S3-) 2 [s 2 -
2] 3 - [$4-2)2
which are calculated to be 4 x 10- 2 and 4 x 10- 7 moles/liter
respectively.
Extensive Raman studies have been done on alkali metal poly-
sulfides in which Raman peaks between 400 and 500 cm- 1 have been
attributed to the S-S stretching modes of S6 and of the polysulf ides
s 2 -2
, S3 -2
, S4 -2
, s,- 2 and S6 -2 (29-37). Raman peaks at 400, 535,
and 600 cm- 1 have been attributed to the ions 5 8 -n (37), 53
- (26,34-
36) and s2 - (26), respectively.

8
Finally, the electrodeposition of CdS requires that the closed
ring structure of Se be opened during the reaction process. Either
the Se molecule is directly reduced at the electrode to 58 -2
, or
freshly deposited cadmium acts as a nucleophilic agent attacking the
Se ring. Several researchers have studied the nucleophilic attack
of the Se ring. Giggenbach used s- 2 as a nucleophilic reagent to
form polysulfides in DMF (20). Chivers and Drummond determined that
the reducing agent in hexamethylphosphoramide (HMPA) solutions of Se
was the solvent impurity dimethylamine (34). Bartlett et al. studied
the reaction of S8 with alkali cyanides and triarylphosphines (38,39).
Seel et al. showed that the polysulfide $4- 2 may also attack the Se
ring (26).
During the present investigation, it became apparent that cad
mium metal reacts spontaneously with dissolved molecular Se to form
cadmium polysulfide complexes. The free radical 5 3 - was observed by
means of Raman spectrometry to form during such reactions. Subse
quent experiments were performed in which polysulfide solutions were
titrated with a solution of Cd• 2• From the visible spectra of the
titrated solutions, calculations were made to determine the ratio of
polysulfide charge per cadmium ion and the ratio of the total sulfur
per cadmium ion in the complexes as functions of the free polysulfide
charge and the free total sulfur concentrations, respectively.

CHAPTER II
MATERIALS
DMSO
Analytical reagent grade dimethylsulfoxide was obtained from J.
T. Baker Chemical Company and from the Crown Zellerbach Company. UV
visible spectra were obtained for both sources and were found to be
optically pure from 750 to 260 nm. Water content in the DMSO was
determined by Karl Fischer titration and found to be 0.50 and 0.45%
by weight, respectively (40).
Cadmium chloride
Reagent grade cadmium chloride (CdC1 2 •2~H 2 0) was obtained from
J. T. Baker Chemical Company. The salt was ground to a fine powder
with mortar and pestle to promote swift salvation in DMSO. Cadmium
concentrations of DMSO titrants were determined by atomic absorption
spectrometry.
Cadmium sulfate
Reagent grade cadmium sulfate was obtained from Allied Chemical
Company and was used without further purification.

10
Sodium sulfide
Analytical reagent grade sodium sulfide (Na2S•9H20) was obtained
from the Mallinckrodt Chemical Works and was used without further
purification.
Cadmium nitrate
Analytical grade cadmium nitrate was obtained from the Mallinck
rodt Chemical Works and was used without further purification.
Sodium borohydride
Reagent grade sodium borohydride was obtained from the Eastman
Kodak Company and was used without further purification.
Sulfur
99.999% pure sulfur was obtained from the Alfa Division of
Ventron, Inc., and was used without further purification.
Cadmium AAS standard
A cadmium atomic absorption spectrometry standard was obtained
from Anderson Laboratories, Inc. The standard contained 1000 ppm Cd
in dilute HCl and was used to verify cadmium standards prepared from
the solid salt CdCl2•2~H20.
Sodium AAS standard
A sodium atomic absorption spectrometry standard was obtained
from Harleco, Inc. The standard contained 1000 ppm Na in dilute HCl.

11
Nitric acid
Reagent grade nitric acid was obtained from Mallinckrodt Chemi
cal Works and was used without further purification.
Hydrochloric acid
Reagent grade hydrochloric acid was obtained from the J. T.
Baker Chemical Co. and was used without further purification.
Potassium chloride
Reagent grade potassium chloride was obtained from the J. T.
Baker Chemical Co. and was used without further purification.
Sodium chloride
Reagent grade sodium chloride was obtained from Mattheson,
Curtis, and Bell and was used without further purification.
Nitrogen
Nitrogen gas was obtained from Airco, Inc., and was used without
further purification.

CHAPTER III
APPARATUS
UV and visible spectrometry
Ultraviolet and visible spectra were recorded on a Cary 14
spectrophotometer with 1 cm fused quartz cuvettes. A scan rate of
1.0 nm/sec was used for spectra recorded between 750 and 260 nm.
Quick and careful transfer of the filtrate in experiments where a
simple vacuum filtration was employed, was the only precaution taken
to prevent oxygen from reacting with the products. To record spectra
at elevated temperatures, the cuvette holders were fitted with water
jackets through which a heated water-ethylene glycol solution was
pumped with a Nescol Instruments, Inc., Exacal 110 temperature control
unit. The temperature within the cuvette was monitored with a mercury
thermometer.
To record spectra in experiments in which an initial polysulfide
solution was employed, the sample cell was fitted with rubber septums
sealed with a thin layer of vacuum grease to prevent oxygen from con
taminating and reacting with the polysulfide solution. The loading
of polysulfide solution was performed in a glove bag.
Atomic absorption spectrophotometry (AAS)
Cadmium and sodium concentrations of DMSO solutions were meas
ured in aqueous dilutions of the original solutions using a 551

Instrumental Laboratories AA-AE spectrophotometer. Absorbances and
concentrations of cadmium solutions were measured at 228.8 nm with
13
the use of a D2 background correction source. Absorbances and concen
trations of sodium solutions were measured at 578.0 nm.
Raman spectroscopy
Raman spectra were recorded in a 90° geometry with a Jarrell
Ash 25-300 spectrometer equipped with an ITT FW 130 (S-20) photo
multiplier and photon-counting electronics. A Coherent Radiation MG
Ar-Kr ion laser was used for sample illumination. The exciting wave
length was 488.0 nm, the scan speec was 1.0 cm- 1 /sec, and the resolu
tion was 3 cm- 1•

CHAPTER IV
PROCEDURE ~1) RESULTS
Two approaches were used to gain information about the products
formed by cadmium and sulfur species in DMSO. In the first, freshly
prepared cadmium metal was reacted with sulfur dissolved in DNSO.
The resulting DMSO solution was examined by atomic abosrption, UV
visible, and Raman spectrometry. In the second approach, sodium
polysulfide solutions were prepared by the reduction of Se with s- 2
ion in DMSO. Microliter additions of Cd~ 2 dissolved in DMSO were
made to the polysulfide solution. After each addition, the UV
visible spectrum of the solution was scanned; and from the resulting
absorption bands the changes in concentrations of the polysulfides
S3-, s6-2
, and Se- 2 were determined.
Stability of molecular sulfur in dimethylsulfoxide
Solutions of varying concentrations of Se in DMSO were prepared
and their UV-visible spectra were recorded (Figure 1). The concentra
tion of Se is plotted against absorbance at three different wave
lengths in Figure 2. If the Se ring fragmented in DMSO at tempera
tures of 90-100°C, or if an impurity in the solvent promoted the
formation of polysulfides as in the case of HMPA (34), the UV-visible
spectrum of the solution would be markedly altered. Spectra were

1.0 mM 1.5 mM [Se]/mM
- 1. 2
I a. Blank DMSO
b. i. 25 x io- 3 ~ 1.1
c. 1. 25 x io- 2
d. 6.25 x 10- 2
..f 1. 0 e. 1. 25 x io- 1
f. 1. 88 x io- 1
I 0.9
0.8
0.5 mM \ \ (7 0.6
0.5
0.4
0.3
0.2
0.1 m..~
0.1
0.01 mM
a -t~ 1 0 ::;: , ~o ~- 280 300 320 340 360
Wavelength/nm
Figure 1. UV-visible spectra of varying concentrations of sulfur in DMSO.
15
CJ u c::: C'O ~ i.. 0 Ul ~
<

2.0
1. 8
1. 6
1. 4
~ 1. 2
u c: C'O
..c ,.,,, 0 er:. 1. 0 ..c <
0.8
0.6
0.4
0.2
0
wavelength/nm
a. 275
b. 285
c. 305
.25 .50 .75 1.00 1. 25 1. 50 1. 75 rnrnoles/li ter
Figure 2. Absorbance versus sulfur concentration where sulfur concentration is expressed as mrnoles of S/liter.
16

recorded for a 0.075 mM Se solution at 24, 42, 66-7, and 90-5°C. No
new absorption bands appeared between 750 to 370 nm. The spectra
between 380 and 260 nm are shown in Figure 3.
Reaction of metallic cadmium with Se dissolved in dimethylsulfoxide
17
To simulate a reaction process in which hot Se/DMSO solution
comes in contact with freshly deposited cadmium metal, a simple
vacuum filtration experiment was employed. DMSO solutions containing
Se in concentrations of 0.110, 0.323, 2.13, and 3.23 mM were prepared.
The glass-fritted funnel was fitted to a filter flask with rubber
adapter which in turn was connected to an aspirator. One gram cad
mium samples were prepared by the reduction of aqueous cadmium ion
in 10 ml of 1 M Cd(N03) 2 with three times the stoichiometric amount
of crystalline sodium borohydride:
(8) Cd+ 2 + 2BH4- ~ Cd 0 + H2 + B2H6
(9) B2H6 + 3H20 ~ H3B03 + 3H2
The cadmium samples were collected in a glass-fritted funnel, washed
with distilled water, and finally washed with three 10 ml aliquots of
DMSO. The last aliquot of DMSO was set aside as a control for the
measurement of residual Cd(N03) 2. Its cadmium concentration was
determined by AAS. This process was repeated with another cadmium
sample, but the final 10 ml aliquot of DMSO was raised to a tempera
ture of 100°C before its contact with the cadmium metal.

280
c b d e
300 320
e d c b a
a.
b.
c.
d.
e.
340
Wavelength/nm
T /°C
Blank at 24°C
24°C
42°C
66-7°C
90-5°C
360 380
Figure 3. UV-visible spectra of a 0.075 mM Se solution as a function of temperature.
18
..Io. 9
-to. 8
-I 0. 7
.J 0. 6
Q)
u i:: r;:
0.5 -e 0 CfJ
..c <
0.4
0.3
0.2
0.1
400

19
A 10 ml aliquot of 0.110 mM S8 solution at 90-100°C was passed
through the funnel, collected, and stored for later measurement of
its Se concentration by UV-visible spectroscopy. Since no precautions
were taken to prevent 0 2 from reacting with S8 , this measurement
served as a control to determine the extent of S8 loss due to reaction
with 02.
Four separate experiments were performed in which a short con
tact time between cadmium metal and sulfur solution was provided by
the use of the vacuum filtration method. The initial sulfur concen
trations were increased for Experiments 2 and 3 with the intent to
maximize any new sulfur species which formed. In turn, each of three
sulfur solutions was heated as noted in Table III, and reacted with
an individual cadmium sample by pipetting sequential 10 ml aliquots
of hot solution over the metal. Each aliquot was collected and
stored in a separate clean glass vial.
Intermediate products, such as sulfur fragments, were then
sought by examining the reacted aliquot as quickly as possibly by
Raman spectroscopy. Raman spectra for an initial 2.13 mM Se sulfur
solution and its reacted filtrate appear in Figure 4. Raman spectra
of neat DMSO and of an S8 -saturated solution of DMSO appear in
Figure 5.
A fourth experiment involved the reaction of a 0.110 mM S8
solution with cadmium as described before. The experiment was per
formed at room temperature. No Raman spectra were obtained for any
of these filtrates.

20
TABLE III
SUMMARY OF EXPERIMENTAL RESULTS FROM REACTION OF
DISSOLVED SULFUR WITH METALLIC CADMIUM*
Experiment 1 Experiment 2 Experiment 3 Experiment 4
90-100°Ct 90-100°Ct 110-120°c t 25°Ct --
[Cd] [Se] [Cd] [Se] [Cd] [Se] [Cd] [Se]
Initial [Se] 0 llO 0 2130 0 3230 0 llO
Without Cd at 100°C 0 90
DMSO blank 25°C 2 0 7 0 2 0 2 0
DMSO blank 100°C 4 0
Aliquot 1 15 50 17 700 43 750 10 30
Aliquot 2 28 50 55 710 --- 12 48
Aliquot 3 26 54 80 760 --- 12 50
Aliquot 4 28 54 ll2 760 --- 14 50 --* Cadmium and sulfur concentrations are expressed in ~M units and were measured at 25°C by AA and UV-visible spectrometry, respectively.
···Temperature of initial solution.

a.
SS'3.E!0
b.
1289.ee
332
387
381
450.~ 3Se.9B ~-· 159.90
478
952
'-·· -·· .... 488.88
Figure 4. (a) Raman spectrum of 2.13 mM Se solution which was reacted with cadmium metal. (b) Raman spectrum of initial 2.13 mM Se solution.
21
se.oo
290.80

a.
b.
386
€00.00 500.00 ~.ea ~.00 200.00 100.'3~
600.00 see.~ 480.00 380.ee 200.00 100.~
Figure 5. (a) Raman spectrum of neat DMSO. (b) Raman spectrum of DMSO saturated with Se (3.23 mM Se).
22

Cadmium and sulfur concentrations of all reacted aliquots were
determined within 24 hours after reaction by AA and UV-visible spec
trometry respectively. The concentration data are summarized in
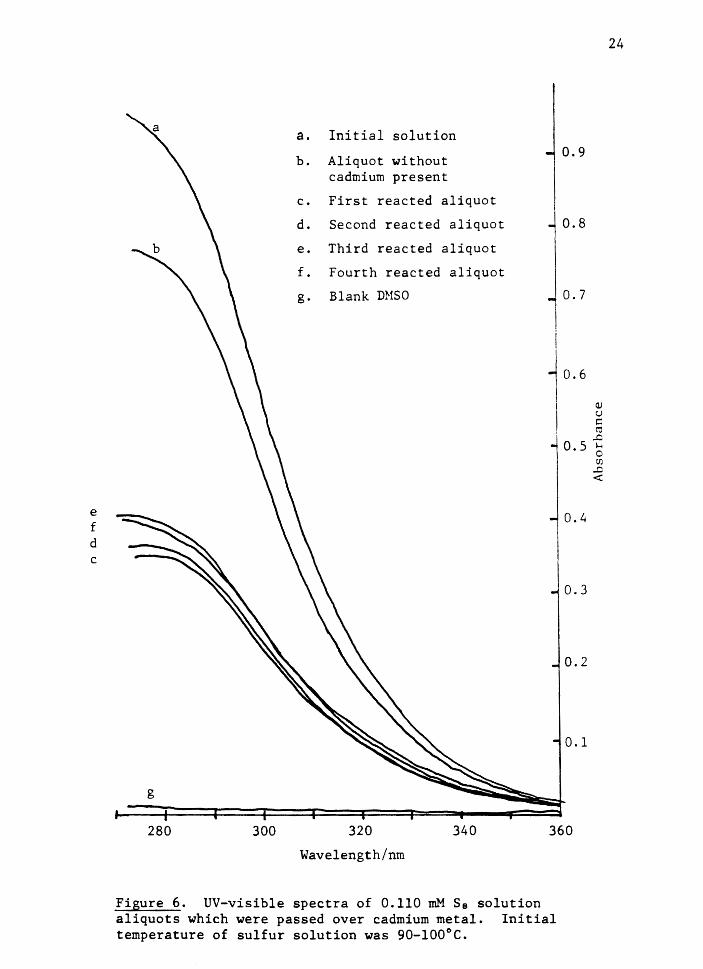
Table III. In Figure 6, the UV-visible spectra of the initial
0.110 mM S8 solution and of the collected filtrates are shown for
Experiment 1.
23
Each subsequent aliquot in a given experiment with the same cad
mium sample was more intensely colored than its predecessor. Extrac
tion of this yellow-brown component with nonpolar solvents, such as
carbon disulfide, toluene, and cyclohexane, was unsuccessful. Addi
tions of methanol or acetone, however, resulted in dilution without
precipitation.
In a test for the presence of sulfide or polysulfide, a few
drops of dilute hydrochloric acid were placed on the reacted metal.
The distinctive odor of hydrogen sulfide was inunediately evident.
Many possible cadmium polysulfides of the general formula CdSp
may form when dissolved molecular sulfur comes in contact with
cadmium metal. To determine if the soluble product of these experi
ments was the simple CdS compound, the solubility of CdS in DMSO was
determined at 25 and 110°C. CdS was prepared by the reaction of
CdS04 and excess Na2S•9H 2 0 in aqueous solution. The yellow precipi
tate was collected, thoroughly washed with distilled water, and
dried at 110°C for 24 hours. Approximately 1 g of the resulting
orange solid was placed in a flask with 25 ml of DMSO. The DMSO was
heated to 110°C and held at this temperature for 30 minutes. A
portion of the hot solution was filtered quickly through a glass
fritted funnel into a heated flask. A 1.00 ml aliquot was quickly
a. Initial solution
b. Aliquot without -l 0.9
cadmium present
c. First reacted aliquot
d. Second reacted aliquot j 0.8
e. Third reacted aliquot
f. Fourth reacted aliquot
g. Blank DMSO Jo. 7
10.6 I Q)
I u t: co
..0 0.5 ~
0 r.J';
..0 <
e f ~ \\ J o . .\ d c
~'\. \\ I 0.3
0.2
0.1
g
280 300 320
Wavelength/nm
340 360
Figure 6. UV-visible spectra of 0.110 mM Se solution aliquots which were passed over cadmium metal. Initial temperature of sulfur solution was 90-100°C.
24

25
diluted to 10.00 ml in a volumetric flask. The cadmium concentration
was determined by AAS. Solubility at 25°C was determined by allowing
the remaining 110°C DMSO to cool to 25°C. Solid CdS was again fil
tered from the solution, and the cadmium concentration of the solution
determined by AAS (Table IV).
TABLE IV
SOLUBILITY OF CdS IN DMSO
Temperature [Cd]/iiM
25°C
100°C
32
124
Reaction of cadmium ion with polysulfides in dimethylsulfoxide
Initially, a polysulfide solution with an approximate molar
ratio of two sodium ions for every eight sulfur atoms was prepared
by the reaction of Na 2 S•9H 2 0 with S8 in DMSO. The various methods
reported in the literature used to produce polysulfide solutions are
discussed in Appendix A. The polysulfide solution was then titrated
with dissolved cadmium chloride in DMSO, and the reaction of cadmium
ion with polysulfides was followed by means of UV-visible spectro
metry.
Great care in the preparation of the polysulfide solution was
necessary to prevent the very swift reaction of oxygen with the newly
f ormed polysulfides. Not only atmospheric oxygen, but also dissolved
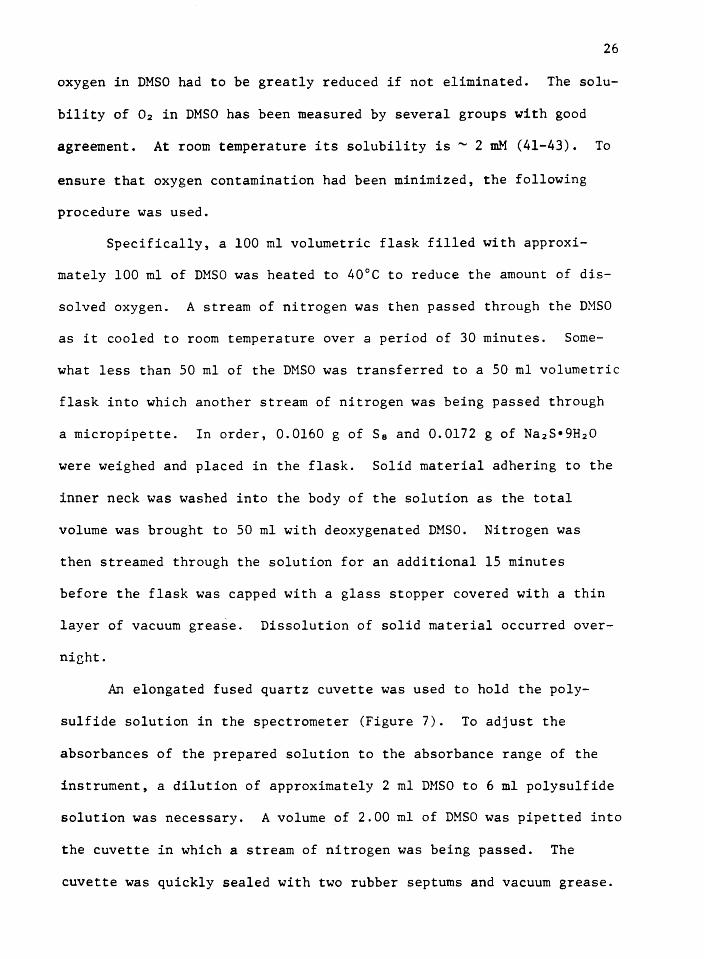
26
oxygen in DMSO had to be greatly reduced if not eliminated. The solu
bility of 02 in DMSO has been measured by several groups with good
agreement. At room temperature its solubility is - 2 mM (41-43). To
ensure that oxygen contamination had been minimized, the following
procedure was used.
Specifically, a 100 ml volumetric flask filled with approxi
mately 100 ml of DMSO was heated to 40°C to reduce the amount of dis
solved oxygen. A stream of nitrogen was then passed through the DMSO
as it cooled to room temperature over a period of 30 minutes. Some
what less than 50 ml of the DMSO was transferred to a 50 ml volumetric
flask into which another stream of nitrogen was being passed through
a micropipette. In order, 0.0160 g of S8 and 0.0172 g of Na2S•9H20
were weighed and placed in the flask. Solid material adhering to the
inner neck was washed into the body of the solution as the total
volume was brought to 50 ml with deoxygenated DMSO. Nitrogen was
then streamed through the solution for an additional 15 minutes
before the flask was capped with a glass stopper covered with a thin
layer of vacuum grease. Dissolution of solid material occurred over
night.
An elongated fused quartz cuvette was used to hold the poly
sulfide solution in the spectrometer (Figure 7). To adjust the
absorbances of the prepared solution to the absorbance range of the
instrument, a dilution of approximately 2 ml DMSO to 6 ml polysulfide
solution was necessary. A volume of 2.00 ml of DMSO was pipetted into
the cuvette in which a stream of nitrogen was being passed. The
cuvette was quickly sealed with two rubber septums and vacuum grease.

r ~
...... ---..... I
' . T
Figure 7. Elongated quartz cuvette.
The introduction of polysulf ide solution to the cuvette was
performed in a glove bag. To minimize the oxygen concentration within
the bag, the air was evacuated and replaced with nitrogen three times.
The polysulf ide solution was then poured directly into the cuvette to
a total predetermined value of 8.13 ml. The solution and gas in
the cuvette were purged for an additional five minutes within the
bag with a stream of nitrogen before being capped.
27

28
The solution was agitated by hand for 90 seconds before being
placed in the spectrometer. Four consecutive scans from 720 to 390 nm
revealed no significant changes with time in the absorbance pattern.
Between each scan the cuvette had been agitated for 90 seconds. Since
no apparent change had occurred, it was viewed that oxygen had been
effectively eliminated from the cuvette.
A -40 mN CdCl2•2~H20 solution was prepared with deoxygenated
DMSO and purged with nitrogen for 20 minutes. To the polysulfide solu
tion in the cuvette, five or ten microliter additions of cadmium solu
tion were made with a five microliter syringe. After each addition,
the cuvette was agitated for 90 seconds, before the resulting solution
was scanned from 720 to 390 nm. For three scans, a five microliter
addition of blank deoxygenated DMSO served as a check for the presence
of oxygen. The complete set of scans appears in Figure 8. With an
identical polysulfide solution and similar method, five microliter
additions of blank DMSO were compared to five microliter additions of
20 mM NaCl/DMSO. No significant change in absorbance occurred with
the addition of chloride ion.
The concentrations of cadmium in the titrant and of sodium in
the polysulfide solution were measured by AAS. The cadmium concentra
tion was found to be 41.2 mM and the sodium concentration of the
original polysulfide solution was found to be 1.77 mM.

Cur
ve
Vol
ume
of
Cd4
2
Ad
dit
ion
/µ1
a In
itia
l sc
ans
b s
c 1
0
d s
e S
bla
nk
f s
g h i j k
s s s S b
lan
k
s 1
s m
S
n s
o S
bla
nk
p 1
0
q 1
0
r 1
0
t 1
0
nee
>
>
>
<
i
< l
\ >
I
< C:
12
.0
40
0
40
0
60
0
700
Wav
elen
gth/
nm
1.5
GI
u ~
qJ
1.0
~
o.s
0 fl)
.0
<
Fig
ure
8
. R
eact
ion
o
f ca
dmiu
m
ion
wit
h p
oly
sulf
ides
foll
ow
ed
by
UV
-vis
ible
sp
ectr
om
etr
y.
[cd•
2J
of
the
titr
an
t w
as
measu
red
by
AA
S to
b
e
41
.2
mM
. S
can
s w
ere
m
ade
afte
r
each
ad
dit
ion
o
f so
luti
on
. N
'0

CHAPTER V
DISCtJSSION
To shed light on the nature of the reactions involved in the
electrodeposition of CdS, two methods were used in the present work.
The first involved an examination of an S8 /DMSO solution as a function
of temperature by UV-visible spectroscopy. The sulfur solution was
then reacted with cadmium metal to simulate the deposition mechanism
step
S + Cd ~ CdS + S m (surface) p(surface) (m-p)'
proposed by both Baranski and Roe (16,17). The reaction products
were analyzed by Raman, AA, and tJV-visible spectroscopy.
The second method involved the direct reaction of polysulfides
with Cd+ 2 in DMSO to simulate the deposition mechanism step
s - 2 + ca· 2 ~ CdS '+ S, m p(surface) ~m-p)'
proposed by Roe (17). The progress of the reaction was followed by
UV-visible spectroscopy.
For the deposition of CdS on metal substrates, DMSO solutions
of Se are typically elevated to temperatures greater than 90°C. Below
this temperature nonstoichiometric deposits were reported (16). The
reactive sulfur species at T > 90°C may not be Se but sulfur fragments
such as S2, S3, or S4, which may form because of higher temperatures

31
and solvent interaction. The spectrum of Se saturated vapor
recorded below 250°C by Bass consists of unresolved maxima at 210,
265, and 285 run (44). This compares very well with the absorption
spectrum of Se in nonpolar solvents at 25°C as well as in DMSO at
25°C. At 500-650°C and 1-10 torr, the spectrum of Se vapor contains
bands at 400 nm and at 520 nm which were attributed to S3 and S4
respectively (45). Since such high temperatures are required for
the fragmentation of Se, formation of such fragments in DMSO solution
at -100°c is doubtful.
Polysulfides may form and become reactive species in DMSO solu
tion at 100°C; for example, in HHPA solutions of Se, a solvent impur
ity reduced Se to polysulfides (34). Polysulfides have absorbance
maxima at wavelengths greater than 400 nm in aprotic solvents.
The absence of sulfur fragments such as S3 and S4, and poly
sulfides in DMSO at T ~ 100°C is supported by the UV-visible spectrum
of an Se/DMSO solution recorded at various temperatures (Figure 3).
The solution remained optically clear from 750 to 390 nm as the tem
perature was increased from 25°C to 90-95°C. The absorption edge did
shift to a slightly longer wavelength with a corresponding decrease in
maximum absorbance which is expected with an increase in temperature.
The absence of absorbances attributed to polysulfides indicates the
lack of an impurity which would act as a reducing agent. The only
sulfur species in solution, therefore, appears to be Se.
When a solution of Se in DMSO at T ~ 90°C was reacted with
freshly prepared cadmium metal, a simple test for the formation of
polysulfides or s- 2 was performed. With the addition of a few drops

32
of dilute HCl to the reacted metal, the odor of H2S was easily
detected which indicates that cadmium does indeed react with dis
solved Se to form CdSp, where p ~ 1. Since all polysulfides decom
pose in acid solutions to reform s- 2 and Se, the value of p remains
unknown. The loss of Se in each reacted aliquot was confirmed by
the measurement of the absorbance due to Se (Figure 6 and Table III).
The concentration of Cd in each reacted aliquot was determined
by AAS (Table III). In the cases of aliquots with [Se]~ 2.13 mM
before reaction, each succeeding aliquot of Se solution reacted with
the same cadmium sample contained a higher concentration of cadmium.
Since the cadmium concentration in these aliquots exceeded the cad
mium concentration of a CdS-saturated DMSO solution, a cadmium
containing species other than CdS was concluded to be present. An
increase in cadmium concentration corresponded to the increasing
intensity of the reacted aliquot's yellow-brown color. Attempts to
extract the yellow-brown component with nonpolar solvents, such as
CS2 and toluene, were unsuccessful. From these observations, it was
concluded that the yellow-brown component is due to a CdSP species
of ionic character. The possibility of the formation of S6 , which
is also yellow-brown, or other neutral sulfur species as reaction
products was eliminated, because of their high degree of solubility
in CS2.
Raman spectral evidence of reaction products containing sulfur
was disappointing. For initial 0.323 mM Se aliquots, only solvent
peaks were observed in the reacted solution indicating that a large
percentage of the sulfur had reacted and remained with the cadmium.

For initial 2.13 m}i Se aliquots, peaks at only 535 cm- 1 were observed
for the first three aliquots, but for the fourth reacted aliquot,
the original S8 peaks appeared with no peak at 535 cm- 1 (Figures 4
and 5). For initial 3.23 mM Se aliquots, only the original Se peaks
were observed for the reacted solution. The peak at 535 cm- 1 has
been assigned to the radical ion S3 - (26,31,34). The formation of
this ion is therefore a possibility during the reaction of cadmium
with Se.
In the second approach, cadmium chloride dissolved in DMSO was
reacted directly with a solution of polysulfide. The method used to
prepare the polysulf ide solution was similar to that of Giggenbach
(20). An overall solution stoichiometry of two atoms of sodium per
-9.6 atoms of sulfur was determined by the measurement of the solu
tion's [Na·] by AAS. When the ratio S:Na exceeds 4, previous
researchers have shown that 5 3 - ~ Se- 2 > S6 -2
, when total negative
polysulfide charge~ 5 mM (24-28). In the solution formed, there
are theoretically major concentrations of S8 -2 and 5 3 -, and a minor
concentration of S6 -2
•
33
With each measured addition of cadmium ion a decrease in the
polysulfide concentration was noted (Figure 8). During the course of
the additions, the color of the solution changed from greenish blue
to yellowish brown. The solution remained transparent with no trace
of precipitate. Since a saturated solution of CdS in DMSO was
observed to be colorless, the yellow-brown component is not the simple
sulfide.

34
Additions of deoxygenated DMSO did not alter the spectrum of
the solution; thus, the techniques employed to reduce oxygen content
were successful, and the possible reaction of oxygen with polysulfide
was eliminated. Additions of 10 ~l of 20 m.~ sodium chloride in DMSO
were made to a polysulfide solution, and the resulting spectra were
compared to those recorded after additions of 10 ~l of blank D~1SO.
There was no effect upon the spectra due to the presence of chloride
ion. The sole reason for decreases in absorbance was the addition of
cd• 2 ion. The yellow-brown component at the end of the experiment
was found to be insoluble in CS2 and toluene, which indicated that
the species present may be ionic in character.
Quantitative analysis of the spectra of Figure 8 was performed
with the constants calculated by Sawyer and Doub since their molar
absorptivities compared favorably with those of other researchers
(Table II). First a working set of molar absorptivities at three
wavelengths was calculated using their data as well as the spectra of
Cauquis (Figure 9). These molar absorptivities were then applied to
Figure 8 to calculate [S3-] and [S 8~ 2 ] for each spectrum. Secondly,
a distribution of the various polysulfides was calculated for a wide
range of dilutions of a Na2S 9 • 6 stoichiometry with Sawyer's equilib
rium equations. The experimental values were compared to the values
predicted by Sawyer's equations. Finally some discrepancies among
Sawyer's data and calculated constants were noted. Modification of
the treatment of the data yielded new equilibrium constants and molar
absorptivities, but their application to the present experimental
work did not significantly alter the conclusions.

35
r Sa-
0·'-l -1
Sa- 2 (J)
e
0 5
0 !.
,00 soc fOO A mi•
Figure 9. Spectrophotometric curves recorded by Cauquis (21). The spectra were recorded during the electrolysis of a 1.2 mM S8 solution in DMSO with a 0.1 M electrolyte of Et~NC104 • Optical pathway: 1 mm. z = no. of electrons consumed per sulfur molecule.
(I) (1) z = 2; (2) z = 2.2; (3) z = 2.4; (4) z = 2.6; (5) z = 2.7. (II) (6) z = 2.9; (7) z = 3.3; (8) z = 3.5; (9) z = 3.8.
To use Sawyer's molar absorptivities to calculate the concentra-
tions of various polysulfides observed in the spectra of Figure 8,
molar absorptivities of S3 - and 5 8 -2 were calculated at wavelengths
other than those given by Sawyer. Cauquis presented a set of spectra
in which the absorbances due to Ss- were well defined and isolated

36
from those of other polysulfides. Using curves 6, 7, 8, 9 in Figure
9, the molar absorptivity of 4450 liter cm- 1 mole- 1 at 618 nm as
calculated by Sawyer, and Beer's law, the molar absorptivities for
S3- at 690 and 700 nm were calculated and are given in Table V.
The absorbance curves for s3- were assumed to be symmetrical about the
line drawn through the maximum at 618; therefore, the E;oo ~ £;36•
TABLE V
MOLAR ABSORPTIVITIES OF 5 3 - AT VARIOUS WAVELENGTHS
Curve A61e [ S 3 - ] /M A69o d9o A7oo(.536) 3 E700(.536)
6 .661 1. 49xlO- 3 . 202 1360 .145 970
7 .502 l.13xl0- 3 .154 1360 .111 980
8 .389 8. 7 4xlO- 4 .ll8 1350 .084 960
9 .282 6.34xl0- 4 .085 1340 .061 960
Ave --- --- --- 1350 --- 970
The concentration of S6- 2 in solutions of the stoichiometry of
two sodium atoms per eight sulfur atoms is small. For example, in a
solution containing 2.4 x 10- 3 moles of charge per liter, only 3.4%
of the charge is due to 56- 2• According to Sawyer, the absorbance
maximum for s6- 2 is at 475 nm with a molar absorptivity of 3.8 x 10³
liter mole- 1 cm- 1• At wavelengths greater than 492 nm the molar absorp-
tivity is less than 3.8 x 10 3 liter mole 1 cm 1 The absorbance con-
tribution due to S6- 2 at wavelengths greater than 492 nm for such
small concentrations is very small when compared to those of S8 - 2 or

37
S3-. For these reasons, the contribution of S6 -2 to the absorbance
at 492 nm and 536 nm was considered to be zero and the absorbance at
these wavelengths was taken to be the composite absorbance of Se- 2,
S3-, and the concentration of any cadmium-polysulfide complex present.
The value of 4000 liter cm- 1 mole- 1 attributed to E~92 by
Sawyer was checked against a Cauquis spectrum (Curve 1 of Figure 9)
of a solution with an overall Na25 8 stoichiometry. The concentration
of 53- was calculated from the absorbance at 690 nm using the average
E: 9o of 1350 liter cm- 1 mole- 1• The concentration of 56- 2 was calcu-
lated with the use of 9.0 x 10³ moles/liter as Kd for the reaction
56- 2 ¢ 2S3-, and the concentration of 5 8 -
2 was taken as the remaining
charge of the solution divided by two. The molar absorptivity of s 0 -2
at 536 nm was calculated with the use of this same spectrum and con-
centrations of S8 -2
, 5 6 -2
, and S3-, and again assuming that the
absorbance at 536 was due to only S3- 2 and 53-. These calculations
are sunnnarized in Table VI.
TABLE VI
MOLAR ABSORPTIVITIES OF S8 -2 AT VARIOUS WAVELENGTHS
Cale. Sawyer Curve A69o S3 - s6- 2 sa- 2 A1.o 92 £~92 £~92 As36 d36
1 .069 5.1 2.9 9.16 .369 4000 4000 .281 2520 xio- "- x10- 5 x10- "-
The residual absorbance at the end of the thirteenth cadmium
addition in Figure 8 was attributed to the absorbance of a cadmium poly-
sulfide complex. An estimate of the molar absorptivities of the complex

38
at 492, 536, and 690 nm was made by the use of Beer's law and the
assumption that the cadmium concentration at the end of the thir-
teenth addition was equal to the concentration of the complex.
In Table VII the molar absorptivities used in the determination
of the concentrations of polysulf ides for the spectra in Figure 8 are
summarized. The calculated concentrations [S 3-], [S 6 -2], and [S 8 -
2]
were plotted as a function of the cadmium ion concentration of the
solution in the cuvette in Figure 10. The total concentration of
polysulfide charge in the initial diluted solution was calculated to
be 1.76 x 10- 3 M from the absorbances in Figure 8. Significantly,
the total charge concentration in the initial solution was determined
by the measurement of sodium by AAS to be 1.77 x 10- 3 M.
TABLE VII
SUMMARY OF MOLAR ABSORPTIVITIES FOR S3-, S8 -2
, AND
HYPOTHETICAL CADMIUM POLYSULFIDE COMPLEX
Species /../nm E/ £ cm- 1 mole- 1
--s.3 - 492 0
536 970
690 1350
Se- 2 492 4000
536 2520
690 0
Cd-polysulf ide 492 1370 complex
536 1060
690 180

( cd·
2 J
xl0
5
45
JS
25
15 5 0
(s6
-2J 10
20
30
40
50
f s.,-
21
f10
70
[S -y
] x
!05
p
fj_g
_~~e
lQ
. T
he
ex
peri
men
tal
valu
es
of
[SJ-
],
[S6
-2],
and
[S
8-
2]
rem
ain
ing
aft
er
each
ad
dit
ion
o
f ca
dmiu
m
ion
wer
e d
eter
min
ed
from
l'
V-v
isih
le sp
ectr
a
and
S
aw
yer'
s co
nst
an
ts.
w
\0
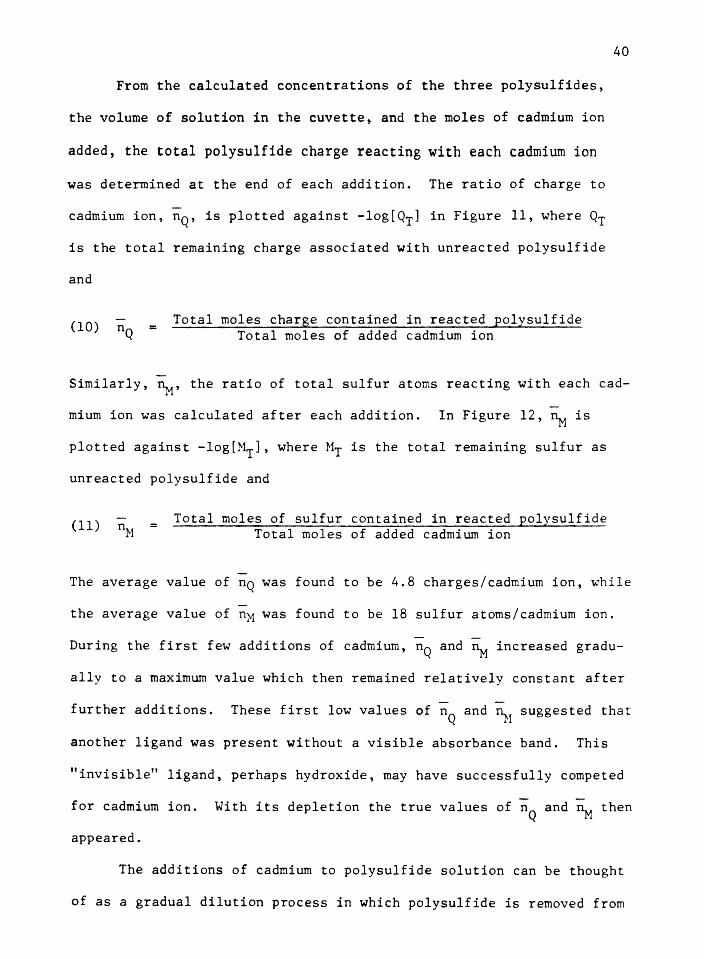
From the calculated concentrations of the three polysulfides,
the volume of solution in the cuvette, and the moles of cadmium ion
added, the total polysulfide charge reacting with each cadmium ion
was determined at the end of each addition. The ratio of charge to
cadmium ion, nq, is plotted against -log[QT] in Figure 11, where QT
is the total remaining charge associated with unreacted polysulf ide
and
(10) nQ = Total moles charge contained in reacted polysulfide
Total moles of added cadmium ion
40
Similarly, 111' the ratio of total sulfur atoms reacting with each cad
mium ion was calculated after each addition. In Figure 12, ~ is
plotted against -log[MT], where MT is the total remaining sulfur as
unreacted polysulf ide and
(11) nM Total moles of sulfur contained in reacted polysulf ide
Total moles of added cadmium ion
The average value of nq was found to be 4.8 charges/cadmium ion, while
the average value of nx was found to be 18 sulfur atoms/cadmium ion.
During the first few additions of cadmium, nQ and 111 increased gradu
ally to a maximum value which then remained relatively constant after
further additions. These first low values of nQ and ~1 suggested that
another ligand was present without a visible absorbance band. This
"invisible" ligand, perhaps hydroxide, may have successfully competed
for cadmium ion. With its depletion the true values of nQ and ~ then
appeared.
The additions of cadmium to polysulfide solution can be thought
of as a gradual dilution process in which polysulf ide is removed from

5 4
"Q
3 2
h 5
/~
3
-lo
g
f Q1
J
Fig
ure
1
1.
Rati
o o
f re
acte
d p
oly
sulf
ide
char
ge
to
cadm
ium
io
n,
nq,
vers
us
-lo
gfQ
T],
w
her
e [Q
T]
is
the
tota
l ch
arg
e co
ncen
trati
on
o
f th
e
rem
ain
ing
u
nre
acte
d p
oly
sulf
ide.
~
I-A

20
"M
15
. .
. .. '\
10
5
5 4
3 2
-ln
p,
(M1
)
fig
ure
1
2.
Rati
o
of
tota
l re
acte
d su
lfu
r at
om
s to
ca
dmiu
m
ion
, nM
, v
ers
us
-lo
g[M
T],
w
her
e [M
r]
is
the
tota
l su
lfu
r co
ncen
trati
on
o
f th
e
rem
ain
ing
u
nre
acte
d
po
lysu
lfid
e.
.i:-
N
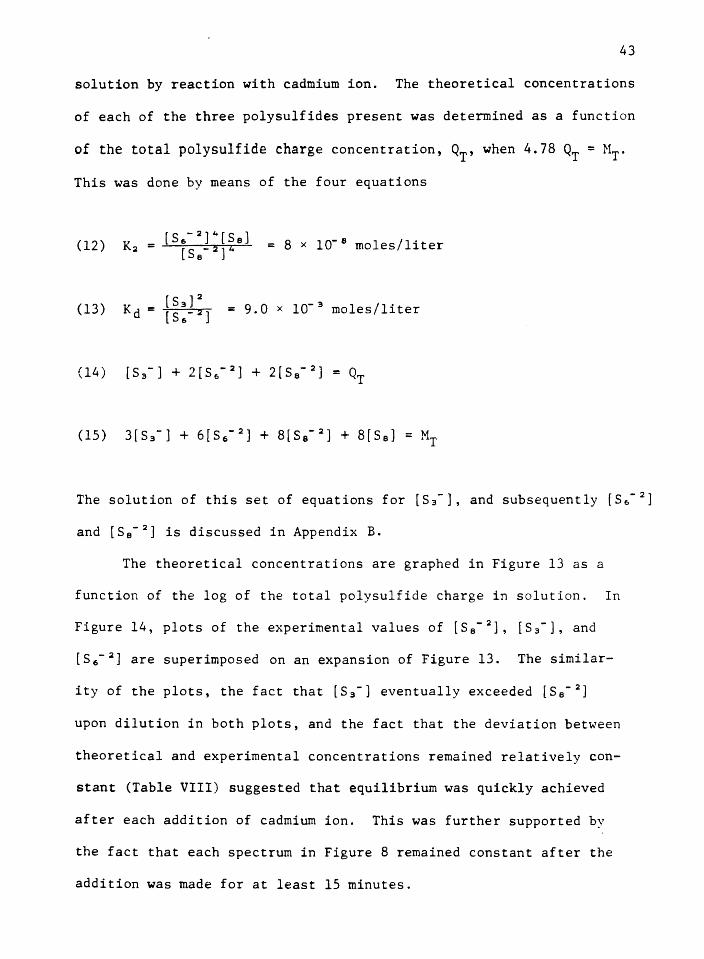
43
solution by reaction with cadmium ion. The theoretical concentrations
of each of the three polysulfides present was determined as a function
of the total polysulfide charge concentration, QT, when 4.78 QT= MT.
This was done by means of the four equations
(12) _ [s6- 2 ] 4 [Ss)
K2 - [Ss-2Jz = 8 x 10- 8 moles/liter
(13) _ [S3] 2
Kd - [S6-!2] = 9.0 x 10- 3 moles/liter
(14) [S3-] + 2(56- 2] + 2[Ss- 2
] =QT
(15) 3(53-) + 6(56- 2] + 8[Se- 2
] + 8[Se] =MT
The solution of this set of equations for [$3-), and subsequently [56- 2 ]
and [S 8 -2
] is discussed in Appendix B.
The theoretical concentrations are graphed in Figure 13 as a
function of the log of the total polysulfide charge in solution. In
Figure 14, plots of the experimental values of [5 8 -2), [5 3 -], and
[5 6 -2
) are superimposed on an expansion of Figure 13. The similar-
ity of the plots, the fact that [S 3 -] eventually exceeded [S 8 -2
]
upon dilution in both plots, and the fact that the deviation between
theoretical and experimental concentrations remained relatively con-
stant (Table VIII) suggested that equilibrium was quickly achieved
after each addition of cadmium ion. This was further supported by
the fact that each spectrum in Figure 8 remained constant after the
addition was made for at least 15 minutes.

6 5 4 -y
-l
og
[S
p ]
J 2
0
/
/ /
./
' 1s
.-2J/
i
I
/ /
rs .. -
21 /
/
/ /
/ /
/
/ /
/
/
/ /
/~
/ 1s
,-1
/ /
I I
I /
. /
/ /
/ /
/ /
/ ./
~
/
/ /
. /
./
/ I.
/,.,,
,
~,I"
/
/ .,,
,,, ....
...-,,,.
_,.,..
,
., ~
/
/ /
/ /
,-/
, ....
:/
/ /.
~
2 J
4 5
-lo
g
{QT]
/
/ 6 7
Fig
ure
13
. ---
Th
co
rcti
c;i
l v
;ilu
cs
for
po
lysu
lfid
e
co
ncen
trati
on
s
cn
lcu
latc
d
wit
h
Saw
ver'
s c'q
uil
ih
ri1
1m
cc
p1
.1ti
on
s w
hC'r
P
s11l
fu
r ;:1
tom
to
cli
arg
P
rati
o
cq
u;d
s Ii
. 7
8.
.i:-
.i:--

5
-log[Sp-Y]
4
3
2 3 4 -log[QT]
Figure 14. Expansion of Figure 13 with experimental values of [S 3-], [5 6 -
2), and [S 8 -
2] after each addition compared to the
theoretical curves derived from Sawyer's equilibria equations. 4.78 Qr= MT. Curves a, band care the expanded theoretical values from Figure 13.
45

46
TABLE VIII
RELATIVE DEVIATION OF EXPERIMENTAL POLYSULFIDE CONCENTRATIONS
FROM THEORETICAL POLYSULFIDE CONCENTRATIONS
For Spectra After [ s 3-] [s6- 2J [Se- 2 ] Cadmitll!l Addition % Deviation % Deviation % Deviation
0 -37 -59 +20
1 -36 -61 +27
2 -38 -63 +26
3 -39 -60 +27
4 -40 -67 +27
5 -41 -66 +30
6 -41 -67 +26
7 -42 -69 +36
ts -JY -66 +37
9 -42 -70 +40
10 -40 -69 +47
The examination of Sawyer's treatment of the experimental data
revealed the possibility of an alternative treatment of his data in
which different values of E!1 8 , Kd, E~1s, and K2 would result. Sawyer
had calculated £!1e and Ka', where Kd' is the apparent dissociation

47
constant for the reaction s6- 2 :¢ 253-, from absorbances of polysulfide
solutions having the overall stoichiometry of Na2S 6 , or one sodium
ion per three sulfur atoms. Specifically,
(17) K ' d = (A6ie/d1e)
2
= C 2 A61 B 6- ~
£ 6 l B
where e:~1e is the molar absorptivity of S3- at 618 nm, C6 is the over-
all concentration of Na2S 6 , and [S 6 -2]A is the apparent concentration
of s6- 2. Rearrangement of equation 17 yielded
(18) A~1e = c6
'r 3 ,2 [K '( s )] A61e Kd ,£61eJ - d £61e zc6
In Figure 13, an additional point from Sawyer's data was added to the
plot. At higher polysulfide concentrations the linear relationship
failed to hold, and therefore, a better estimate of e:~ 1 e and Ka' was
obtained for overall [Na 2 S6 ] ~ 2 x 10- 3 M by using only the lower con-
centration data. A new slope and intercept were calculated for the
lower concentrations using a least squares method. The corrected
plot is graphed with Sawyer's original plot in Figure 15. Since
[s6- 2]A > [s6- 2] because of disproportionation of s6- 2, Ka> Kd'.
Therefore, in this new interpretation of the data Ka> 1.05 x 10- 2
moles/liter and e:~ 18 = 4220 £ cm- 1 mole- 1 •
Spectral evidence in DMF and acetonitrile by Seel et al. (26)
and Fujinaga et al. (27) respectively, suggest that £~1 3 is 60-80%
of Sawyer's value of 3800 £ cm- 1 mole- 1• Since the absorbance attrib-
uted to s6- 2 is already very small in Figure 7, such a change in E~1s

(A61e) 2
c6
,.;,10- 3
200
180
160
140
120
100
80
60
40
20
0 1 ") ,;_
A61e 2C6
48
3 4 5
x}Q- 3
Figure 15. a) Sawyer's original plot (24). b) An additional datum point taken from Sawyer's data for an overall [Na2S 6 ] of 20 x 10- 3 M. c) Modified plot.

is of little significance. An examination of Sawyer's data and cal
culation of K2, however, revealed that his calculated value of
8 x io-s moles/liter is applicable to a 10 x io- 3 M Na 2 Se solution
alone. Values of K2 calculated by Sawyer's method from these
sources of experimental data are listed in Table IX.
TABLE IX
VALUES OF K2 CALCULATED FOR DMSO SOLUTIONS OF Na2Se
49
[Na2Se]/M K2 /moles/liter Source of data
lxlQ- 2 8. 7 3xlQ- B 24
lxlO- 3 8. 49x10- 1 2 24
lxlQ- 4 1. 4xlQ- 14 24
1. 2xlO- 3 7. lx10- 11 21
8. BxlO- 4 5. 3x10- 1 0 Present Work
These discrepancies in the values of £:1e, E!15, Kd, and K2 suggest
further work is needed to fully understand solutions of polysulf ides
in aprotic solvents. However, even when the new estimates of Kd,
£!1e, and £! 75 were used to calculate nQ and 111 for the present experi
mental data, their evaluation was again 4.8 and 18 respectively.
The r.onclusions drawn from the present work are the following:
No evidence was found for fragmentation of Se or for the forma
tion of polysulfide in DMSO solutions at elevated temperatures. The
predominant sulfur species at the beginning of electrodepositions
described by Roe and Baranski appears to be S8 •

50
The reaction of metallic cadmium and Se yields a CdS~ product •
in which p ~ l; that is, the formation of both CdS and sulfides of
higher sulfur content may occur simultaneously. The formation of 53-
during the reaction of the metal and Se is supported by Raman
evidence, but such formation must be listed with some doubt because
of the inconsistency of the spectra of similar reaction products.
Cadmium ions react with polysulfides. Each cadmium ion has the
capacity to react with an average of 4.8 units of polysulfide charge.
Cadmium usually has a coordination number of four. The experimental
value of 4.8 negative charges per cadmium ion suggests the existence
of a mixed ligand complex. Nine different combinations of the pre-
dominant ligands could be considered and are listed in Figure 16.
If each ligand combination is considered to be equally probable,
the average polysulfide charge contribution would be 5.4 and the
average number of sulfur atoms per complex would be 20.3. However,
since (S3-) and [Se- 2] are about equal throughout the process of ca• 2
additions as measured from Figure 8, combinations containing both
5 8 -2 and 53- are more likely. If the improbable combinations a, e,
and k are eliminated from consideration, and all other combinations
are considered equally probable, the average charge ratio is 4.8, and
the average S:Cd ratio is 19.2. These are very close to the experi-
mental values.
Another possible pathway for the reaction of Cd+ 2 and SP-y is
one in which cadmium plays the role of a catalytic center in which
polysulfides come together and react with each other as well as with
cadmium forming a complex CdSp and Se.

a. Ss
Cd / ' S3
~ 53
d.
f.
h.
Ss
S3
Cd
/ Se
~ Sa
53
Cd
~/ ~ s6_ s
Ss I
Cd
/
. ~s6 ~ "-s
'se
' 53
' Se
b.
Ss
Ss
Cd /
~ S3
' Se
c.
e. Se
I Cd
/ ' Se ~
Sa
Sa
s g. /1
s6
I/ s
k.
/ Se
Cd
' ~ / s...- 56
Se
I Cd
' b SJ s/6
Ss
I Cd
/ ' Ss h Sa
Sa
Figure 16. Possible ligand combinations involving only 5 3 - and Se- 2
• Charges are omitted for clarity.
51

52
Finally, the significance of the results of the present work
upon the two possible mechanisms (page 3) for the electrodeposition
process are as follows: For the second mechanism to succeed, the
most likely reduction product of 5 8 , Se- 2, must react with Cd+ 2 to
form CdS. The present experimental results suggest that the reaction
of Cd+ 2 and Se- 2 yields a product having a higher ratio of sulfur
to cadmium. Cd+ 2 has been shown to have the capacity to react with
four or more polysulfide charges. The formation of CdS by such a
reaction is unlikely. Possible precipitation of CdSP on the elec
trode surface, where p ~ 1, is not supported by Baranski's analysis
of the actual electrodeposit where Cd:S is approximately one to one.
Furthermore, CdSP complexes have a greater solubility than CdS in
DMSO, and would tend to stay in solution.
Cadmium metal, on the other hand, has been shown to react with
Se to form a CdSp species. The first mechanism, in which cadmium is
first electrodeposited and then reacts with Se in solution to form
CdS, is a similar reaction. However, a sulfur fragment is also
formed. This fragment at the surface of the electrode may react
again with additional freshly deposited cadmium to form additional
CdS. A similar mechanism was proposed by Bartlett (39) in the
nucleophilic attack of Se by CN- to form SCN-. Once the ring is
opened, the remaining chain was proposed to be further attacked by
C~ until the chain is completely consumed. A similar process may
occur with an opened sulfur chain against the electrode surface of
freshly deposited cadmium.

The increasing intensity of yellow-brown color of the electro
lyte during electrolytic deposition may indicate the formation of
cadmium polysulfide complexes which can form by either the reduction
of Se to Se- 2 and its subsequent reaction with cd• 2, or by the dis
solution of CdS which would further react with Se to form soluble
53
complexes. In either case complex formation may occur. The utili
zation of such complexes in the electrodeposition process is possible
and an area which could be studied in the future to gain further
insight into the mechanism and formation of CdS films.

REFERENCES
1. H. Gerischer, J. Electroanal. Chern. Interfacial Electrochern., 58,
263 (1975).
2. A. B. Ellis, S. W. Kaiser, and M. S. Wrighton, J. Arn. Chem. Soc.,
~' 2839 (1977).
3. K. Rajeswar, P. Singh, and J. DuBow, Electrochirn. Acta, ~' 1117
(1978).
4. T. S. Jayadeviah, Appl. Phys. Lett. 25, 399 (1974).
5. A. T. Fahrenbruch, J. Cryst. Growth, 39, 73 (1977).
6. L. M. Fraas and Y. Ma, J. Cryst. Growth, 39, 92 (1977).
7. W. A. Gerrard and J. R. Owen, Mater. Res. Bull., _!l, 677 (1977).
8. B. Miller and A. Heller, Nature, 262, 680 (1976).
9. L. M. Peter, Electrochirn. Acta,~' 165 (1978).
10. B. Miller, A. Heller, M. Robbins, S. Menezes, K. C. Chang, and
J. Thomson, Jr., J. Electrochem. Soc., 124, 1019 (1977).
11. B. Miller, S. Menezes, and A. Heller, J. Electroanal. Chern.,~'
85 (1978).
12. G. Hodes, J. Manassen, and D. Cahan, Nature, 261, 403 (1976).
13. M. P. R. Panicher, M. Knaster, and F. A. Kroger, J. Electrochem.
Soc., 125, 566 (1978).
14. A. S. Baranski and W.R. Fawcett, J. Electrochem. Soc., 127,
766 (1980).
15. W. R. Fawcett and A. S. Baranski, U.S. Pat. 4,192,721 (1980).

55
16. A. S. Baranski, W. R. Fawcett, A. McDonald, and R. M. deNobriga,
Electrochern. Soc., 128, 963 (1981).
17. D. K. Roe, L. Wenzhao, and H. Gerischer, J. Electroanal. Chern.,
136, 323 (1982).
18. C. F. Geitner, Pharrn. Annls. 129, 350 (1864).
19. H. Lux, S. Benninger, and E. Bohrn, Chern. Ber., 101, 2485 (1968).
20. W. Giggenbach, J. Inorg. Nucl. Chern. 30, 3189 (1968).
21. R. Bonnaterre and G. Cauquis, Chern. Commun., 293 (1972).
22. J. Badoz-Larnbling, R. Bonnaterre, G. Cauquis, M. Delamar, and
G. Demange, Electrochirn. Acta,~' 119 (1976).
23. M. Merritt and D. Sawyer, Inorg. Chern.,~' 211 (1970).
24. R. Martin, W. Doub, J. Roberts, and D. Sawyer, Inorg. Chern., 11_,
1921 (1973).
25. W. H. Doub, Ph.D. Dissertation, Univ. of California, Riverside,
Xerox Univ. Microfilms, Ann Arbor, Mich., Order No. 76-12,650.
26. F. Seel, H. J. Guttler, G. Simon, and A. Wieckowski, Pure Appl.
Chern., 49, 45 (1977).
27. T. Fujinaga, T. Kuwarnota, S. Okazaki, and M. Hojo, Bull. Chern.
Soc. Jpn. 53, 285 (1980).
28. J. Paris and V. Plichon, Electrochirn. Acta±.§_, 1823 (1981).
29. H.J. Bernstein and J. Fowling, J. Chern. Phys., 18, 1018 (1951).
30. D. W. Scott, J.P. McCullough, and F. H. Kruse, J. Mol. Spectrosc.,
13, 313 (1964).
31. G. Janz, E. Roduner, J. Coutts, and J. Douney, Inorg. Chern. 15,
1751 (1976).
32. V. Ziemann and W. Bues, Z. Anorg. Allg. Chem., 455, 69 (1979).

56
33. D. S. Oei, Inorg. Chem., 12, 435 (1973).
34. T. Chivers and I. Drummond, Inorg. Chern., 11, 2525 (1972).
35. T. Chivers and I. Drummond, J. Chem. Soc.(D), 631 (1974).
36. W. Holzer, W. Murphy, and H. Bernstein, J. Mol. Spectrosc.,
32, 13 (1969).
37. F. Daly and C. Brown, J. Phys. Chem., ]J_, 350 (1979).
38. P. Bartlett and G. Meguerian, J. Am. Chem. Soc.,~' 3710 (1956).
39. P. Bartlett and R. Davis, J. Am. Chem. Soc., 80, 2513 (1958).
40. M. Aparicio-Rezo, personal communication.
41. D. T. Sawyer and J. L. Roberts, J. Electroanal. Chem., 11_, 90
(1966).
42. E. L. Johnson, K. H. Pool, and R. E. Hamm, Anal. Chem.,~'
183 (1966).
43. E. L. Johnson, K. H. Pool, and R. E. Hamm, Anal. Chem., 12_,
888 (1967).
44. A. M. Bass, J. Chem. Phys., 19, 1291 (1953).
45. B. Neyer, M. Gouterman, D. Jensen, T. Oommen, K. Spitzer, and
T. Stroy~r-Hansen, "Sulfur Research Trends," R. F. Gould, ed.,
(1972)' p. 53.

APPENDIX A
FORMATION OF POLYSULFIDE SOLUTIONS
There have been three methods described to produce polysulf ide
solutions in aprotic solvents. Giggenbach added Se to a Na2S•9H20
solution of DMF (20). Seel added Se to a solution of Na2S4 in DMF or
HMPA (26). Sawyer formed stoichiometric solids Na2S4, Na2S6, Na2Se
by the reaction of metallic sodium and Se in ammonia. The solids were
then dissolved in DMSO and DMF (24). (Raman spectral studies of
sodium polysulfides, of the general stoichiometry Na2Sx where x > 4,
which have been formed in this manner, have suggested the solid formed
consisted of Na2S4, Se, and perhaps some Na 2S5 (33).) Both Sawyer and
Cauquis formed polysulfide solutions by electrolysis at a controlled
potential in DMSO with a supporting electrolyte (21,24). Fujinaga
et al. (27) and Paris & Plichon (28) also used this method, but the
electrolysis was performed in acetonitrile and DMA respectively.
There is very good agreement between spectra of a specific over
all stoichiometry, Na 2Sx, prepared by two different methods. For
example, spectra of Giggenbach in DMF coincide with those prepared by
Seel in DMF. Likewise, Sawyer found that the measured electrolytic
reduction of elemental sulfur in DMSO yielded spectra similar to those
prepared by solution of the corresponding solid Na 2Sx. For DMSO,
this point is further confirmed by a comparison of Cauquis' spectra

58
obtained by electrolysis and Sawyer's spectra obtained by dissolu
tion. Stoichiometrically equivalent solutions of Na2S6 or Na 2S8
prepared by two different methods have UV-visible maxima at identical
wavelengths (21,24).
For the present work, a solution with S8 -2 as its major poly
sulfide was prepared, for our interest lay in the reduced form of
S8 , S8 -2 , its competition with the reduction of Cd• 2 at the elec
trode surface, and its reactivity with cd• 2. This was done by
preparing a solution having the overall stoichiometry of Na2Se by
the addition of appropriate amounts of Na 2S•9H20 and S8 to deoxygen
ated DMSO. The UV-visible spectra of these solutions are very similar
to the spectra of Na 2S8 /DMSO solutions prepared by Cauquis and Sawyer.
A measurement of the sodium concentration by AAS was used to estimate
the actual ratio of sulfur atoms to charge. This was found to be
4.78; therefore, the actual stoichiometry of experimental polysulfide
was then Na2S9.6•

APPENDIX B
DERIVATION OF EQUILIBRIUM EQUATION USING
SAWYER'S CONSTANTS
Beginning with a set of four equations containing four unknown
concentrations, a polynomial containing only one unknown was formed
through a series of algebraic operations. The four original equations
are
(1)
(2) [S -2]"[S o] 6 e _ K
[se-2]" - 2
(3) 8[S 8 °] + 8[5e- 2] + 6[S6- 2
] + 3(53-) ~
(4) 2([5e- 2] + [56- 2
]) + [53-) =QT
where QT is the total charge concentration and ~ is the total concen
tration of sulfur atoms.
(5)
(6)
Then
[se- 2] = 2[53-]
2_ [53-]
Q - Kd T ~2~----
[Seo] K2Kcl _ 2[S3-] 2
4 t } 4 = 16(53-) 8 QT - [S 3 ] - Kd