Delivery of cloned offspring: experience in Zebu cattle ( Bos indicus
Upload
independentCategory
view
2download
0
1
High fat and/or high salt intake during pregnancy alters maternal meta-inflammation 1
and offspring growth and metabolic profiles 2
3
Clare M Reynolds, Mark H Vickers, Claudia J Harrison, Stephanie A Segovia and Clint Gray 4
Liggins Institute and Gravida: National Centre for Growth and Development, University of 5
Auckland, New Zealand. 6
Correspondence: Dr Clint Gray, 7
Liggins Institute, 8
University of Auckland, 9
Auckland, 10
New Zealand. 11
Phone +64 9 9236687 12
Fax +64 9 3737497 13
Email: [email protected] 14
Running title: Impact of salt/fat on maternal and offspring metabolism 15
Author contributions: C.G. and M.H.V. designed research; C.M.R., C.J.H., C.G. & S.A.S. 16
conducted the research; C.M.R., C.G. & C.J.H. wrote manuscript and M.H.V. critically 17
evaluated the paper. 18
Keywords: Inflammation, maternal metabolism, high salt, high fat, developmental 19
programming 20
21
2
Abstract: 22
A high intake of fat or salt during pregnancy has perturbs placental function, alters fetal 23
development and predisposes offspring to metabolic disease in adult-life. Despite its 24
relevance to modern dietary habits, the developmental programming effects of excessive 25
maternal fat and salt, fed in combination, have not been examined. We investigated the 26
effects of moderately high maternal fat and/or salt intake on maternal meta-inflammation and 27
its consequences on fetal and weanling growth and metabolic profile. Female Sprague-28
Dawley rats were fed a standard control diet (CD), 4% salt diet (SD), 45% fat diet (HF) or 29
4% salt/45% fat combined diet (HFSD) three weeks prior to and throughout pregnancy and 30
lactation. Plasma and tissue samples were collected at day 18 of pregnancy from mother and 31
fetus, and at postnatal day 24 in weanlings. Markers of adipose tissue inflammation, 32
macrophage infiltration, lipogenesis, nutrient transport and storage were altered in pregnant 33
dams receiving high-fat and/or salt diets. This was accompanied by increased fat mass in 34
high-fat groups and differential hepatic lipid and glucose homeostasis. Offspring of high fat-35
fed mothers had reduced fetal weight, displayed catch-up growth, increased fat mass and 36
altered metabolic profiles at weaning. Maternal diets high in fat and/or salt effect maternal 37
metabolic parameters, fetal growth and development, metabolic status and adipoinsular axis 38
in the weanling. Results presented here highlight the importance of diet in expectant mothers 39
or women considering pregnancy. Furthermore, potential for maternal nutritional intervention 40
strategies may be employed to modify metabolic disease risk in adult offspring during later-41
life. 42
43
44
45
3
Introduction: 46
The links between obesity, insulin resistance and immune function have provided the basis 47
for the emerging field of immuno-metabolism which implicates immune cell infiltration and 48
increased expression of inflammatory mediators such as TNFα and IL-1β in the 49
pathophysiology of metabolic disease (1). The low-grade inflammatory phenotype observed 50
in obesity and associated comorbidities may be crucial for understanding the increased 51
incidence in pregnancy related disorders such as gestational diabetes and pre-eclampsia (6, 52
10) in overweight/obese women of childbearing age (9, 18, 27). This study investigates the 53
contribution of maternal high fat and/or salt diet on the maternal meta-inflammatory 54
phenotype both systemically and locally within the adipose tissue. 55
There has been an exponential increase in overweight/obesity rates worldwide, with as many 56
as one in three adults now displaying overweight or obese phenotypes (5). Although 57
increased rates of obesity and related metabolic disorders have largely been attributed to 58
lifestyle factors such as Western-style diets and sedentary activity, there is also increasing 59
evidence that an altered early life environment is a major risk factor for the development of 60
obesity and metabolic dysfunction in later life. The Western diet is moderately high in both 61
saturated fat and salt, with a high fat intake usually paralleled by a high salt intake (12, 28). 62
Studies have examined the effects of developmental programming in both high maternal salt 63
and of fat independently, associating excessive salt and fat with metabolic disorders, 64
hypertension and increased risk of cardiovascular events in adult offspring (8, 16, 20). For the 65
first time, the present study investigates the maternal and developmental programming effects 66
of maternal dietary salt and fat intake in combination. The aim of the present study was to 67
characterize the effect of moderate dietary salt and fat combined on maternal growth and 68
metabolism, fetal and weanling metabolic status and early life growth trajectory in male and 69
female offspring at weaning. 70
4
Methods: 71
Animal Experiments: All procedures described were approved by the Animal Ethics 72
Committee at the University of Auckland (Approval R1069). 80 Female Sprague Dawley rats 73
were fed ad-libitum from weaning until day 90 and maintained at 25°C and a 12h light: 12h 74
dark cycle. Female rats were then randomly assigned to four dietary groups and fed ad-75
libitum for 21 days prior to pregnancy. Following the pre-pregnancy habituation period, the 76
experimental groups were fed either (1) Control (CD, n=20) purified standard chow diet (1% 77
NaCl, 10% kcal from fat); (2) 4% Salt diet (SD; 4% NaCl, 10% kcal from fat, n=20); (3) 78
High-fat diet (HF; 1% NaCl, 45% kcal from fat, n=20) or (4) High-fat 4% Salt (HFSD; 4% 79
NaCl, 45% kcal from fat) ad-libitum throughout pregnancy and lactation. Female rats (115 80
days of age ± 2, (n=80)) were time-mated using an oestrous cycle monitor (Fine Science 81
Tools, USA). Day 1 of pregnancy was determined by the presence of spermatozoa after a 82
vaginal lavage and females individually housed thereafter. Food and water intake and body 83
weight of dams were recorded every two days. Dams were culled at day 18 of gestation (E18) 84
(n=6/group). Remaining dams were allowed to give birth. All pups were weighed and 85
measured lengthwise, then litter size randomly adjusted to 8 pups (4 male, 4 female) to 86
ensure standardized nutrition until weaning. Pups not allocated to litters were killed by 87
decapitation. All pups were weighed every second day until weaning. Plasma samples were 88
collected and analysed for insulin, leptin, glucose and other selected metabolites at all time-89
points. Offspring tissues were collected and weighed at postnatal day 24 (P24, 3 days post 90
weaning). 91
Maternal and offspring tissue collection: Blood glucose and ketone levels were obtained 92
from a tail bleed using FreeStyle Optium Blood Glucose and β-Ketone Test Strips (Abbot 93
Diabetes Care Ltd., OYL, UK). Trunk blood was collected in lithium heparin 10ml 94
vacutainers (Becton Dickinson) and stored on ice. All blood samples were centrifuged at 95
5
2500rpm at 4°C for 15 minutes and supernatant stored at -20°C until later analysis. Maternal 96
and offspring tissues were excised, weighed, and stored for later analysis as detailed below. 97
Materials: Rat-specific insulin and leptin ELISAs were sourced from (Crystal Chem Inc, IL, 98
USA;Catalog #90060 and 90040 respectively). Primers, probes and TaqMan Universal 99
Mastermix were purchased from Applied Biosystems (ABI, CA, USA). All other reagents 100
were purchased from Sigma Aldrich unless otherwise stated. 101
Plasma analysis: Plasma insulin (Crystal Chem Inc, IL, USA), Leptin (Crystal Chem Inc. IL, 102
USA;) IL-1β, IL-6 and TNFα concentrations (Quantikine kits; R&D Systems Europe, 103
Abingdon, UK) were measured enzymatically. HOMA-IR was calculated as [fasting glucose 104
� fasting insulin / 22.5]. Maternal E18 and weanling P24 plasma samples were thawed and 105
analysed for concentrations of free fatty acids (FFA), triglycerides (TAG), triglycerides , low 106
density lipoprotein cholesterol (LDL), total cholesterol , high density lipoprotein low serum-3 107
cholesterol (HDLC3), lactate dehydrogenase, lipoprotein lipase, bilirubin, creatinine, uric 108
acid, alkaline phosphatase (ALP), alanine aminotransferase (ALT), aspartate transaminase 109
(AST), total protein, albumin and creatine kinase (CK). This analysis was performed using a 110
Hitachi 902 autoanalyser (Hitachi High Technologies Corporation, Tokyo, Japan). 111
Ex vivo adipose tissue culture: Freshly isolated gonadal adipose tissue (AT) was isolated 112
from CD, SD, HF and HFSD dams at E18. Adipose explants were placed in 24-well plates 113
(100mg tissue/well) with 1ml of complete media (Dulbecco’s modified media (DMEM), 10% 114
fetal bovine serum (FBS) and 1% penicillin/streptomycin) for 24h. Media was harvested and 115
cytokine secretion (TNFα, IL-6 and IL-1β) analysed by ELISA (Quantikine kits; R&D 116
Systems Europe, Abingdon, United Kingdom). 117
Gene Expression Analysis: RNA was extracted from white AT and liver, using TRI-Reagent 118
(100mg tissue/ml) and stored at -80°C. Single-stranded cDNA was prepared using High-119
6
Capacity cDNA Archive Kit (Applied Biosystems;Warrington, UK). mRNA expression was 120
quantified by real-time PCR (RT-PCR) on an ABI 7700 Sequence Detection System (Perkin-121
Elmer Applied Biosystems). To control for between-sample variability, mRNA levels were 122
normalized to the geometric mean of cyclophilinA and hypoxanthine 123
phosphoribosyltransferase (HPRT) for each sample by subtracting the Ct of controls from the 124
Ct for the gene of interest producing a ΔCt value. The ΔCt for each treatment sample was 125
compared to the mean ΔCt for control samples using the relative quantification 2-(ΔΔCt) 126
method to determine fold-change (23). 127
Statistics: Statistical analysis was performed using SigmaPlot for Windows version 12.0 128
(Systat Software Inc., San Jose, CA, USA). All data were analysed by two-way factorial 129
ANOVA, with maternal high fat and maternal high salt intake as factors. Holm-Sidak post-130
hoc tests were performed where indicated to detect further differences between groups. 131
Where data failed normality testing, it was log transformed. Differences between groups were 132
considered significant at p<0.05. All data are presented as means ± SEM unless otherwise 133
stated. 134
Results: 135
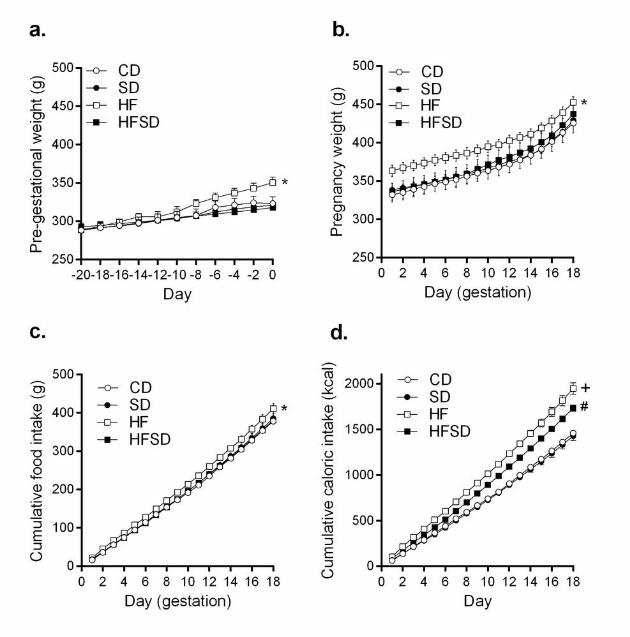
Maternal weights and intakes: There was a significant increase in pre-pregnancy body weight 136
in the HF compared to CD, SD and HFSD females (Figure 1a). The HF group remained 137
significantly heavier than CD and SD until the end of pregnancy. There was a significant 138
difference between HF and HFSD from day 1 to day 12 of pregnancy (Figure 1b). No 139
significant difference was observed between HFSD, CD and SD groups throughout 140
pregnancy (Figure 1b). HF dams had significantly increased food and kcal consumption 141
throughout pregnancy (Figure 1c&d). While there was no significant difference in absolute 142
food intake between CD, SD and HFSD groups, when adjusted for caloric content the HFSD 143
7
group had significantly increased kcal consumption compared to CD and SD groups (Figure 144
1d). 145
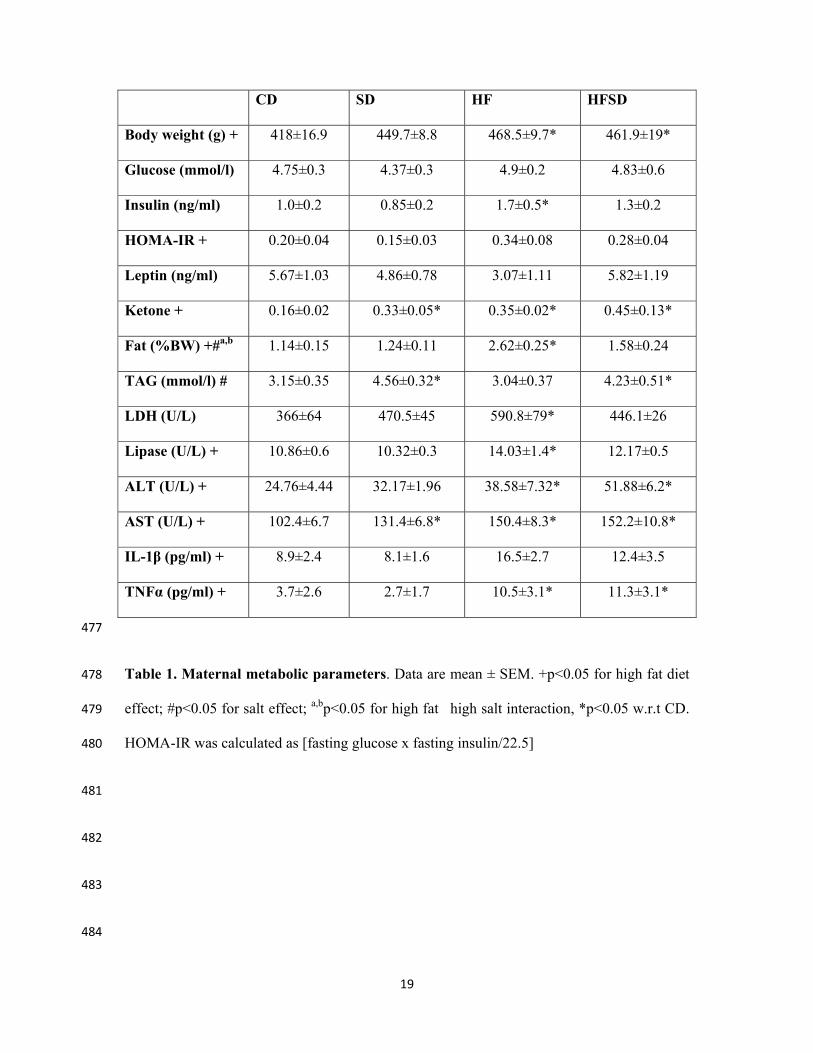
Maternal adipose deposition and metabolic profile: There was a significant effect of fat on 146
maternal body weight at E18 with significantly increased body weight in HF and HFSD 147
groups compared to CD and SD at the end of pregnancy. While there was no effect of 148
maternal diet on glucose concentration, insulin was significantly increased in the HF group 149
compared to CD and SD. There was no significant difference between HF and HFSD groups. 150
This manifested as an effect of high fat on HOMA-IR ratios. Ketone concentrations were 151
significantly increased in SD, HF and HFSD groups compared to CD. As expected, 152
retroperitoneal fat was significantly increased by maternal fat intake, and a significant effect 153
of salt was observed. A significant interaction reflecting reduced retroperitoneal fat in HFSD 154
dams was demonstrated. An effect of fat was observed via significantly increased LDH, 155
Lipase, ALT and AST concentrations. There was a salt effect on fasting plasma triglycerides 156
concentrations. In addition to altered metabolic parameters, maternal fat consumption led to 157
increased circulating concentrations of pro-inflammatory cytokines IL-1β and TNFα (Table 158
1). 159
Maternal adipose tissue inflammation: Given increased fat deposition, triglycerides and 160
circulating cytokine concentrations in our treatment groups, we examined adipose tissue 161
inflammation and function. Adipose explants were cultured for 24h and cytokine 162
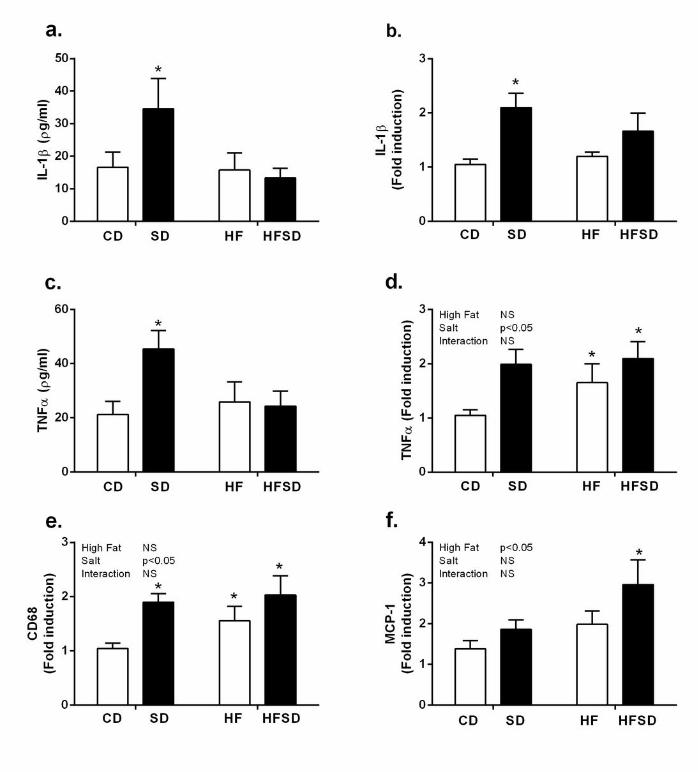
concentrations were assessed. There was significantly increased secretion and expression of 163
IL-1β in the SD compared to CD, HF and HFSD groups (Figure 2a&b). While TNFα gene 164
expression was significantly elevated in SD, HF and HFSD compared to CD, increased 165
explant TNFα secretion was only observed in the SD group (Figure 2c&d). Interestingly this 166
increase in pro-inflammatory cytokines was associated with enhanced expression of CD68, a 167
marker of macrophage infiltration, in SD, HF and HFSD groups with a significant effect of 168
8
salt (Figure 2e). MCP-1 expression was increased in HFSD but not CD, SD or HF groups 169
(Figure 2f). 170
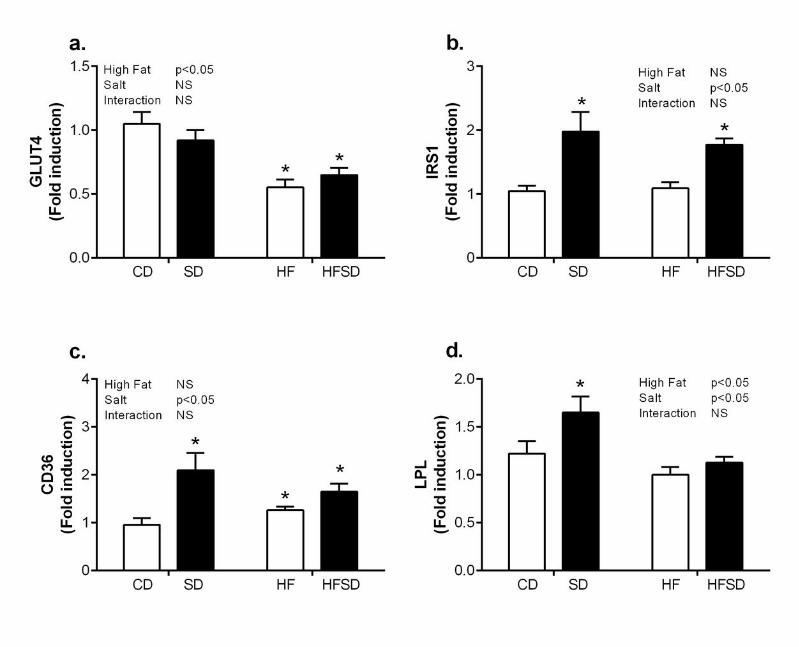
Maternal adipose tissue nutrient transport: To determine if adipose tissue inflammation had 171
an effect on nutrient transport mediators integral to adipose tissue function we examined 172
expression of glucose and fatty acid transport. GLUT4, the main insulin facilitated glucose 173
transporter in adipose tissue, had a significant fat effect with decreased expression in HF and 174
HFSD groups compared to CD and SD (Figure 3a). However, this did not translate into a 175
reduction in IRS-1, a major component of the insulin signalling pathway (Figure 3b). 176
Interestingly there was a significant salt effect on CD36 with significantly increased 177
expression in SD, HF and HFSD groups compared to CD (Figure 3c). This was accompanied 178
by significantly increased LPL expression in SD compared to CD, HF and HFSD groups. 179
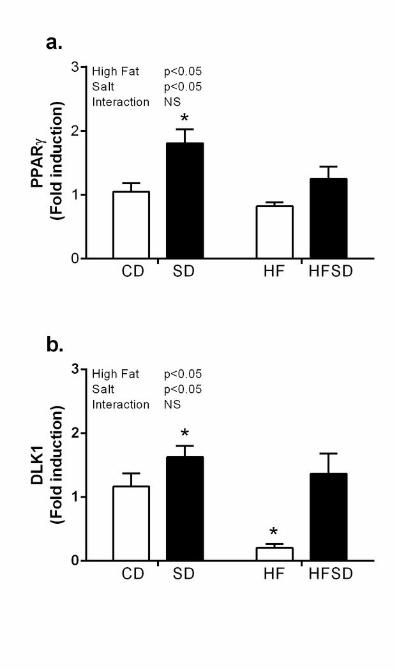
Effect of maternal diet on adipogenic gene expression: Given changes in weight gain, adipose 180
tissue inflammation and nutrient transport, we examined markers relevant to adipogenic 181
pathways. PPARγ, a major regulator of adipogenesis, was significantly increased in the SD 182
groups compared to CD, HF and HFSD (Figure 4a). Furthermore, expression of Dlk-1, a pre-183
adipocyte specific marker, was significantly down-regulated in HF compared to CD, SD and 184
HFSD groups (Figure 4b). 185
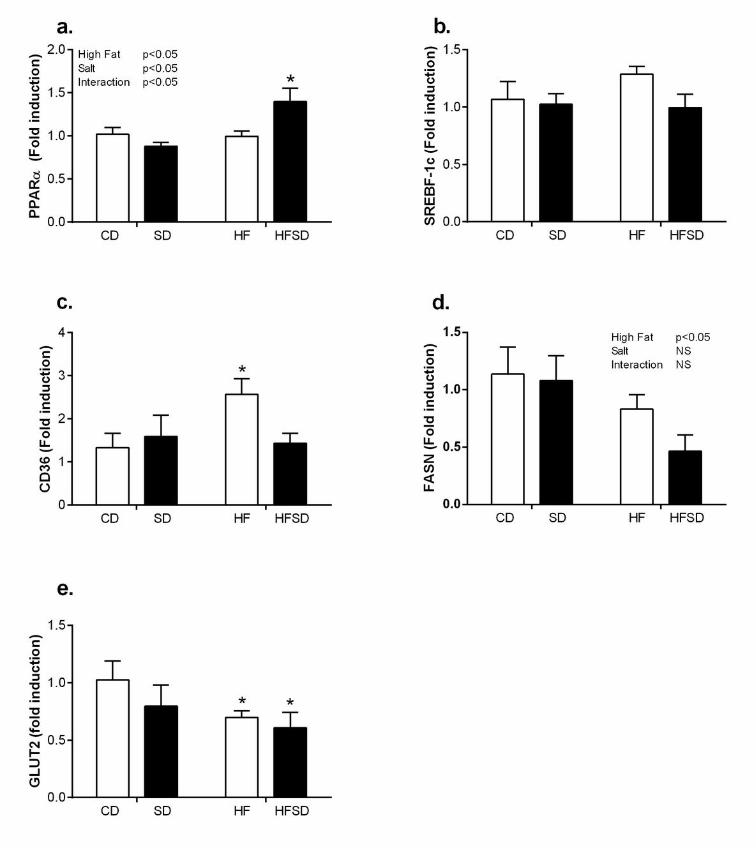
Effect of maternal diet on hepatic gene expression: Despite significant increases in plasma 186
AST and ALT, there was no significant change in hepatic IL-1β or TNFα between dietary 187
groups (data not shown). PPARα, a major regulator of hepatic fatty acid β-oxidation, 188
displayed an effect of fat and salt with significantly increased expression in the SD, HF and 189
HFSD compared to CD groups (Figure 5a). There was no significant difference in Srebp-1c 190
expression between groups (Figure 5b). There was a significant increase in CD36 in the HF 191
group compared to CD, SD and HFSD (Figure 5c). This was accompanied by a fat mediated 192
9
decrease in FASN (Figure 5d). In addition, there was a significant reduction in GLUT2 193
expression in the HF and HFSD groups compared to CD (Figure 5e). 194
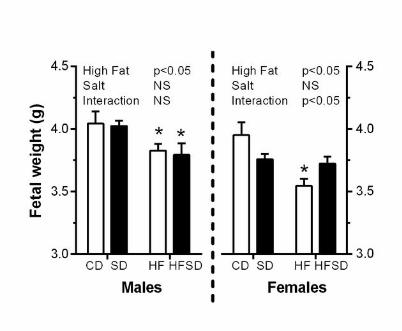
Effects of maternal diet on fetal physiology: Maternal high fat diet significantly decreased 195
body weight in both male and female fetuses. In females, a significant interaction was also 196
observed between salt and fat on fetal weight (Figure 6). 197
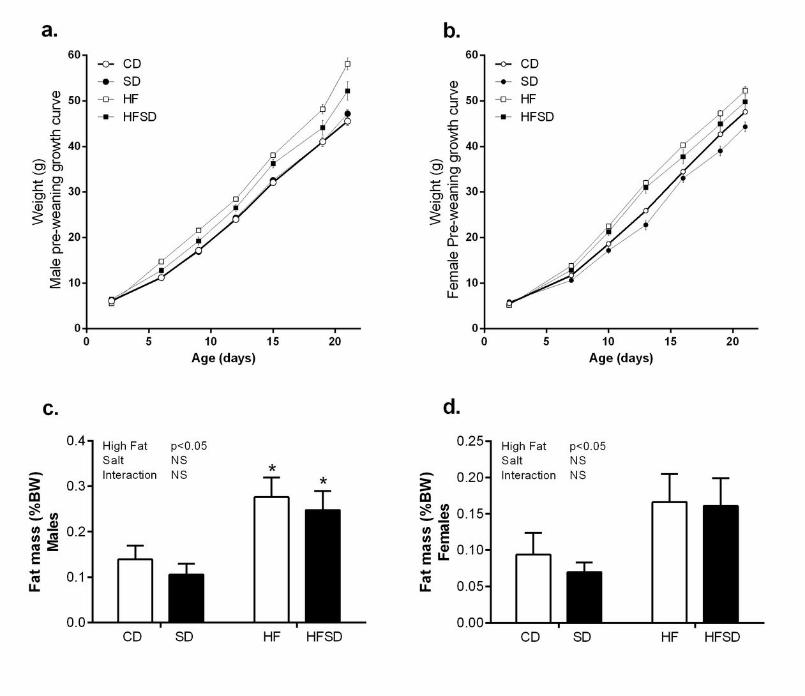
Effect of maternal diet on weanling growth, physiology and plasma metabolic profile: 198
Offspring weight was monitored from day 2-21. Both male and female offspring from the HF 199
and HFSD groups displayed significant catch-up growth and were significantly heavier at the 200
time of weaning compared to CD and SD groups (Figure 7a&b). This was accompanied by 201
significantly increased fat mass (Figure 7c&d). 202
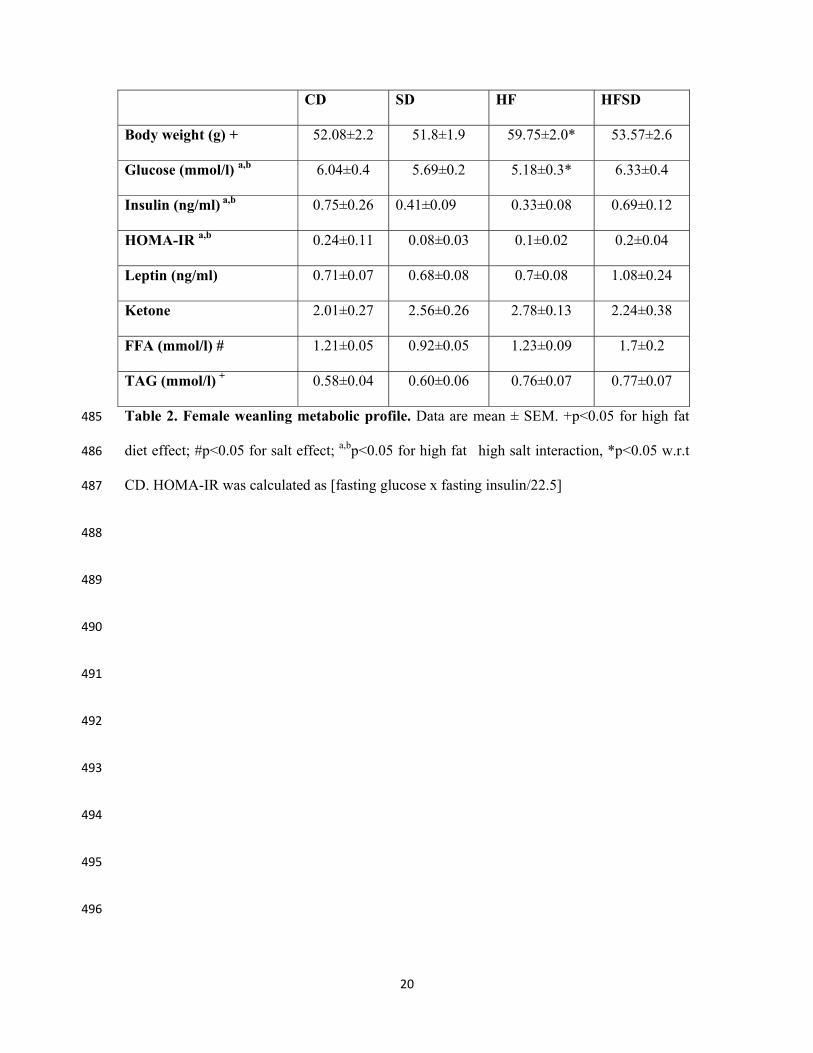
In female offspring, an interaction between salt and fat was observed in blood glucose, 203
plasma insulin, and HOMA-IR (Table 2). There was a high-fat induced increase in 204
triglyceride concentrations. SD decreased FFA concentrations. Plasma leptin and ketone 205
concentrations were not different between groups (Table 2). 206
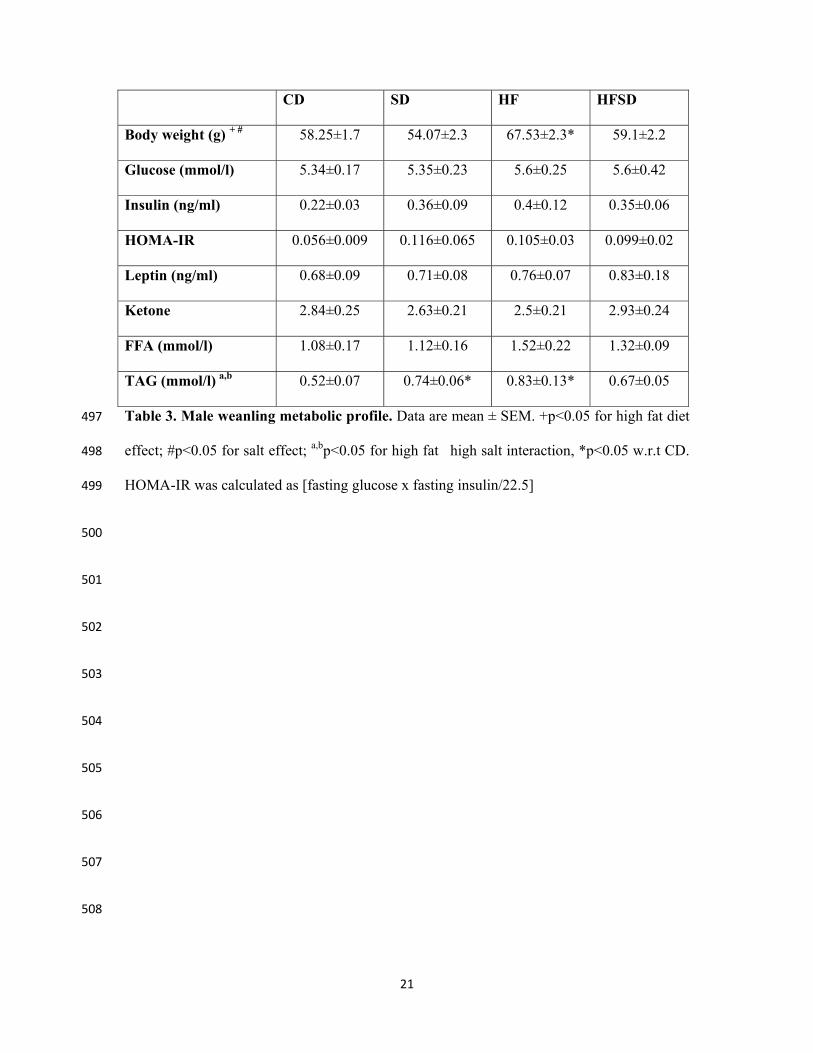
In males, there was no significant difference in glucose, insulin, HOMA-IR, leptin, ketone or 207
FFA concentrations between maternal dietary groups. An interaction between maternal high-208
fat and high-salt diets was observed in triglyceride concentration as a result of significantly 209
increased concentrations in SD and HF compared to CD groups (Table 3). 210
Discussion: 211
The link between maternal nutrition and risk of adult onset non-communicable disease is now 212
widely accepted. Western diets are usually highly processed, high in calories, salt and 213
saturated fats and are strongly associated with increased incidence of obesity, type 2 diabetes 214
and cardiovascular disorders (3, 12). There has been a marked increase in the rates of obesity 215
10
in women of child-bearing age which represents a major issue for both maternal and neonatal 216
health (10). Increased body mass index before and/or during pregnancy is strongly associated 217
with a number of direct maternal complications including gestational diabetes, preeclampsia, 218
low-birth weight, macrosomia and preterm birth. Moreover, it is now increasingly clear that 219
maternal obesity leads to adverse outcomes in offspring (2, 20, 35). In the present study we 220
investigated the role of moderately high maternal dietary salt and/or fat on maternal 221
metabolic profiles and subsequent consequences for fetal and offspring metabolic 222
homeostasis. We also aimed to determine whether the combination of fat and salt may 223
exacerbate the independent effects of salt and fat. It is clear that developmental programming 224
in offspring is influenced strongly by the timing of maternal nutritional insult (21). We 225
therefore incorporated an in utero time-point, while the developing fetus is directly exposed 226
to an altered maternal nutritional mileau, and a subsequent early postnatal time point to 227
investigate the occurrence of catch-up growth and initial metabolic dysfunction which may 228
persist throughout life. This study provides evidence that maternal fat and/or salt 229
consumption induces sex-specific alterations in metabolic parameters synonymous with the 230
development of metabolic disease which may influence the development of adult onset type-231
2-diabetes and obesity in later life. 232
Throughout pregnancy, increases in hormones such as placental lactogen and growth 233
hormone, prolactin, cortisol and progesterone inhibit the action of insulin creating a state of 234
insulin resistance, allowing for increased glucose availability for fetal growth. As obesity is 235
also associated with a state of insulin resistance, the maternal diabetogenic environment is 236
enhanced, thereby effecting the growth and development of the fetus. In line with increased 237
body weight, HF dams had increased insulin and HOMA-IR indices, while the effects were 238
less potent with the HFSD, an intermediate effect was observed with HOMA-IR. 239
Interestingly there was a significant salt effect on plasma triglycerides, this was accompanied 240
11
by increased ketone concentrations across all treatment groups, which indicates a potential 241
shift towards β-oxidation of fatty acids in these dams. This may suggest dysfunctional lipid 242
homeostasis, known to be associated with increased oxidative stress, which may have both 243
direct and indirect effects on fetal growth and placental function. 244
There is significant evidence that pregnancy is accompanied by a redistribution of adipose 245
tissue, with preferential distribution within visceral depots during normal pregnancy (31). 246
Interestingly, evidence suggests that obese women gain weight at a slower rate than lean 247
counterparts, indeed this trend was observed in HF dams during this study. Concurrent with 248
several human studies we also observed that HF dams have decreased leptin concentrations 249
during pregnancy despite increased fat mass (25). As leptin is a major regulator of placental 250
nutrient transport, decreased concentrations with obesity may induce detrimental effects on 251
fetal growth (33). Given the evidence of metabolic dysregulation and hyperlipidaemia at a 252
systemic level, we examined the effects of maternal fat and/or salt diets on adipose tissue 253
inflammation and lipid regulation. 254
Evidence from non-pregnant animal and human studies has linked the progression of adipose 255
tissue dysfunction and insulin resistance to a low-grade pro-inflammatory phenotype. 256
Disproportionate lipid accretion from excess caloric intake promotes infiltration of innate 257
immune cells followed by increased secretion of cytokines such as IL-1β and TNFα which 258
instigate a chronic inflammatory response resulting in insulin resistance. To date, research on 259
HF-induced adipose tissue dysfunction centres around non-pregnant individuals. Indeed 260
while there is a wealth of knowledge in terms of western diets, specifically high fat and high 261
sugar, there is little known in regards to the role of salt and the combination of salt and fat on 262
adipose tissue inflammation and dysfunction. However, there is evidence that inflammatory 263
processes, both local (adipose, placenta) and systemic (circulating cytokines) may be heavily 264
involved in adverse pregnancy outcomes (14). Given the pivotal role of IL-1β and TNFα in 265
12
non-pregnancy related obesity (19, 24, 30) we examined secretion and gene expression in 266
gonadal fat depots. As per the current literature, there was a significant elevation in HF-267
induced TNFα expression, a cytokine known to be increased in response to obesity and 268
indeed during pregnancy complications (13). Interestingly, while IL-1β was not changed in 269
HF dams, there was a significant increase in the SD group. Due to its potency, IL-1β is a 270
tightly regulated protein and requires a two-step activation process. It is initially produced as 271
a pro-protein whose activation is instigated following cleavage of the pro-peptide by an 272
inflammasome complex. In general, the NLRP3 inflammasome is associated with metabolic 273
inflammation. This inflammasome complex is activated by a series of danger associated 274
molecular patterns (DAMPs) which include metabolic stressors such as uric acid, ATP, 275
glucose and changes in cellular structure such as cell swelling and lysosomal damage (26). 276
There is evidence that high sodium intake upsets intracellular K+ balance thus activating the 277
NLRP3 inflammasome (11). While this has not been demonstrated in adipose tissue, we 278
speculate that this may represent a potential mechanism for increased IL-1β in the adipose 279
tissue of SD dams. 280
Given the extensive remodelling of adipose tissue during pregnancy, it is not surprising that 281
there is a progressive infiltration of macrophages during late pregnancy (36). Furthermore the 282
pro-inflammatory changes observed in our treatment groups, we examined whether there was 283
evidence of increased macrophage infiltration into adipose tissue. Indeed, there was a 284
significant increase in CD68 expression, a marker of macrophage activation, in the adipose 285
tissue of each of our treatment groups compared to controls. There was also increased MCP-286
1, a macrophage chemoattractant, in the adipose tissue of HFSD dams. While there is 287
evidence of macrophage crown-like structures in obese pregnant women (14) and 288
macrophage infiltration of adipose tissue following HF in non-human primates (15), to our 289
13
knowledge this is the first study to link excess salt consumption to adipose tissue 290
inflammation during pregnancy. 291
In addition to pro-inflammatory adipose tissue profiles, there were also significant alterations 292
in glucose and lipid homeostasis in fat and/or salt fed dams. Despite increased inflammation 293
in the SD animals, there was no evidence of altered GLUT4 expression in adipose tissue. 294
However, in line with increased HOMA-IR indices, there was a significant reduction of 295
GLUT4 in both HF and HFSD dams. IRS-1, an important regulator of insulin signalling in 296
adipose tissue, was also examined. Interestingly, despite reduced insulin sensitivity, there was 297
a significant increase in expression in salt-fed groups. While phosphorylation of IRS-1 on 298
tyrosine residues is essential for insulin stimulated responses, IRS-1 phosphorylation on 299
serine residues has the potential to inhibit insulin stimulation (17). Ogihara et al. (29) 300
demonstrated that in non-pregnant animals fed a high-salt diet, hepatic insulin signalling via 301
IRS-1 phosphorylation was enhanced despite systemic insulin resistance. However in the 302
absence of protein data it is difficult to fully appreciate the physiological impact of salt-303
induced increases in IRS-1 and it is likely that any potential mechanisms pertaining to insulin 304
resistance reside downstream of IRS-1 signalling. 305
In the current study, alterations in lipid metabolism and adipogenesis were also observed in 306
SD, HF and HFSD dams compared to controls. Exposure to salt and/or fat diet during 307
pregnancy increased adipose tissue expression of the fatty acid transporter protein CD36; this 308
appeared to be more potent in the high salt dams which also displayed increased lipoprotein 309
lipase expression. Given the propensity of lipid moieties to stimulated toll-like-receptors 310
which act as master regulators of innate immune function, increased availability of free fatty 311
acids in the SD and HFSD dams may in part explain enhanced adipose tissue inflammation. 312
Furthermore, PPARγ, which represents an important regulatory factor in adipose tissue lipid 313
14
storage and indeed adipogenesis, is augmented in the SD dams. This is accompanied by 314
amplified DLK-1 expression and represents increased pre-adipocyte numbers with the 315
adipose tissue of SD dams. Together these data suggest that SD dams have an increased pre-316
adipocyte pool with the potential for adipocyte differentiation and therefore enhanced 317
lipogenic capability in these animals. Interestingly the converse is observed in HF dams, 318
reduced DLK-1 and PPARγ expression indicates a reduced potential for adipose expansion 319
which may ultimately result in a hypertrophic, insulin resistant phenotype. 320
To further classify the metabolic state of high fat and/or salt fed dams we examined hepatic 321
gene expression. Unsurprisingly, HF increases CD36 and decreases GLUT2 expression in 322
line with non-pregnant obese phenotypes (4, 22). PPARα is a transcription factor which 323
influences hepatic β-oxidation of fatty acids and subsequent ketogenesis (7). While there is 324
no difference in CD, SD and HF PPARα expression, a significant interaction between salt 325
and fat accompanied with a decrease in GLUT2 expression indicates a potential shift towards 326
hepatic β-oxidation of fatty acids in HFSD dams. Interestingly, we observe elevated plasma 327
ketone concentrations in SD and HF dams with a significant fat/salt interaction in HFSD 328
dams. Ketones cross the placenta and have detrimental effects on fetal growth and neonatal 329
brain structure (32), therefore HFSD diets may represent a link between dietary exposure to 330
salt and/or fat and adverse fetal outcomes. 331
There is significant evidence to support maternal obesity and HF-induced developmental 332
programming of offspring metabolic dysfunction. Interestingly, the impact of high salt diets 333
are not as well established and the combination of maternal salt and fat intake has yet to be 334
investigated in the context of developmental programming, despite their respective 335
prevalence in Western-style diets. Given the greatly increased inflammatory and metabolic 336
disturbances, observed both locally (adipose and liver) and systemically, our aim was to 337
15
ascertain whether this resulted in altered fetal and neonatal growth and basic metabolic 338
profiles. Indeed, male and female fetuses from HF and HFSD had significantly retarded 339
growth at day 18 of gestation. Salt diets alone had only a minor effect on male fetal growth 340
but induced significant growth restriction in female fetuses. Offspring were monitored until 341
the end of weaning and HF and HFSD male and female offspring exhibited catch-up growth 342
associated with significantly enhanced fat mass which is commonly linked to maternal HF-343
induced programming (34). 344
The mechanisms involved in the progression of developmental programming leading to adult 345
metabolic disease remain poorly understood. The current study provides further evidence that 346
increased maternal consumption of fat and salt independently and, for the first time, in 347
combination, negatively impact the developing offspring growth trajectory and potentiate risk 348
factors for metabolic disorders during later-life. The data also emphasizes the importance of a 349
nutritionally-balanced diet when pregnant with significant detrimental effects on 350
inflammation and metabolism in adipose tissue and liver and indeed systemically, which may 351
persist post-pregnancy thus predisposing mothers to future metabolic complications. The 352
ability of maternal metabolic factors such as inflammatory cytokines and ketone bodies to 353
cross the placenta can have serious consequences on fetal and neonatal growth and 354
development. This model offers a robust nutritional paradigm in which mechanistic aspects 355
of maternal metabolism and developmental programming may be usefully and carefully 356
explored. Based upon the data presented we would echo the recent commentaries and 357
initiatives to reduce both the quantity of salt and fat currently in a typical ‘Western diet’. 358
359
360
Acknowledgements and author contributions 361
16
The authors wish to express their gratitude for the help and support provided by the VJU, 362
Rachna Patel, Angelica Bernal and Minglan Li. All work in this manuscript was performed at 363
the Liggins Institute, Grafton Campus, University of Auckland. C.G., C.M.R. and M.H.V. 364
designed research; C.G., C.J.H., C.M.R. & S.A.S. conducted the research; C.M.R., C.G. & 365
C.J.H. wrote manuscript and M.H.V. critically evaluated the paper. C.G. has primary 366
responsibility for its final content. 367
Funding Sources: 368
This work was funded by Gravida, National Centre for Growth and Development; MP16 Rat 369
Programme Part 1. C.G. is funded by a Lotteries Health Fund Research Fellowship. C.M.R. is 370
funded by Auckland Medical Research Foundation, David and Cassie Anderson Research 371
Fellowship. The authors also gratefully acknowledge funding support from the Faculty 372
Development Research Fund (FDRF), Gravida and the Nutricia Research Foundation. 373
374
375
376
377
378
379
380
381
382
17
REFERENCES 383
1. Ahima RS. Digging deeper into obesity. J Clin Invest 121: 2076-2079, 2011. 384 2. Alfaradhi MZ, and Ozanne SE. Developmental programming in response to maternal 385 overnutrition. Front Genet 2: 27, 2011. 386 3. Armitage JA, Poston L, and Taylor PD. Developmental origins of obesity and the metabolic 387 syndrome: the role of maternal obesity. Front Horm Res 36: 73-84, 2008. 388 4. Bae JS, Kim TH, Kim MY, Park JM, and Ahn YH. Transcriptional regulation of glucose 389 sensors in pancreatic beta-cells and liver: an update. Sensors (Basel) 10: 5031-5053, 2010. 390 5. Berghofer A, Pischon T, Reinhold T, Apovian CM, Sharma AM, and Willich SN. Obesity 391 prevalence from a European perspective: a systematic review. BMC public health 8: 200, 2008. 392 6. Bodnar LM, Ness RB, Markovic N, and Roberts JM. The risk of preeclampsia rises with 393 increasing prepregnancy body mass index. Annals of epidemiology 15: 475-482, 2005. 394 7. Burri L, Thoresen GH, and Berge RK. The Role of PPARalpha Activation in Liver and Muscle. 395 PPAR research 2010: 2010. 396 8. Calder PC, Kremmyda LS, Vlachava M, Noakes PS, and Miles EA. Is there a role for fatty 397 acids in early life programming of the immune system? Proc Nutr Soc 69: 373-380, 2010. 398 9. Challis JR, Lockwood CJ, Myatt L, Norman JE, Strauss JF, 3rd, and Petraglia F. Inflammation 399 and pregnancy. Reprod Sci 16: 206-215, 2009. 400 10. Chu SY, Callaghan WM, Kim SY, Schmid CH, Lau J, England LJ, and Dietz PM. Maternal 401 obesity and risk of gestational diabetes mellitus. Diabetes care 30: 2070-2076, 2007. 402 11. Compan V, Baroja-Mazo A, Lopez-Castejon G, Gomez AI, Martinez CM, Angosto D, 403 Montero MT, Herranz AS, Bazan E, Reimers D, Mulero V, and Pelegrin P. Cell volume regulation 404 modulates NLRP3 inflammasome activation. Immunity 37: 487-500, 2012. 405 12. Cordain L, Eaton SB, Sebastian A, Mann N, Lindeberg S, Watkins BA, O'Keefe JH, and 406 Brand-Miller J. Origins and evolution of the Western diet: health implications for the 21st century. 407 Am J Clin Nutr 81: 341-354, 2005. 408 13. Cotechini T, Komisarenko M, Sperou A, Macdonald-Goodfellow S, Adams MA, and Graham 409 CH. Inflammation in rat pregnancy inhibits spiral artery remodeling leading to fetal growth 410 restriction and features of preeclampsia. J Exp Med 211: 165-179, 2014. 411 14. Denison FC, Roberts KA, Barr SM, and Norman JE. Obesity, pregnancy, inflammation, and 412 vascular function. Reproduction 140: 373-385, 2010. 413 15. Farley D, Tejero ME, Comuzzie AG, Higgins PB, Cox L, Werner SL, Jenkins SL, Li C, Choi J, 414 Dick EJ, Jr., Hubbard GB, Frost P, Dudley DJ, Ballesteros B, Wu G, Nathanielsz PW, and Schlabritz-415 Loutsevitch NE. Feto-placental adaptations to maternal obesity in the baboon. Placenta 30: 752-416 760, 2009. 417 16. Gray C, Al-Dujaili EA, Sparrow AJ, Gardiner SM, Craigon J, Welham SJ, and Gardner DS. 418 Excess maternal salt intake produces sex-specific hypertension in offspring: putative roles for 419 kidney and gastrointestinal sodium handling. PLoS One 8: e72682, 2013. 420 17. Gual P, Le Marchand-Brustel Y, and Tanti JF. Positive and negative regulation of insulin 421 signaling through IRS-1 phosphorylation. Biochimie 87: 99-109, 2005. 422 18. Hillemeier MM, Weisman CS, Chuang C, Downs DS, McCall-Hosenfeld J, and Camacho F. 423 Transition to overweight or obesity among women of reproductive age. J Womens Health 424 (Larchmt) 20: 703-710, 2011. 425 19. Hotamisligil GS, and Spiegelman BM. Tumor necrosis factor alpha: a key component of the 426 obesity-diabetes link. Diabetes 43: 1271-1278, 1994. 427 20. Howie GJ, Sloboda DM, Kamal T, and Vickers MH. Maternal nutritional history predicts 428 obesity in adult offspring independent of postnatal diet. J Physiol 587: 905-915, 2009. 429 21. Howie GJ, Sloboda DM, Reynolds CM, and Vickers MH. Timing of maternal exposure to a 430 high fat diet and development of obesity and hyperinsulinemia in male rat offspring: same 431 metabolic phenotype, different developmental pathways? J Nutr Metab 2013: 517384, 2013. 432
18
22. Koonen DP, Jacobs RL, Febbraio M, Young ME, Soltys CL, Ong H, Vance DE, and Dyck JR. 433 Increased hepatic CD36 expression contributes to dyslipidemia associated with diet-induced 434 obesity. Diabetes 56: 2863-2871, 2007. 435 23. Livak KJ, and Schmittgen TD. Analysis of relative gene expression data using real-time 436 quantitative PCR and the 2(-Delta Delta C(T)) Method. Methods 25: 402-408, 2001. 437 24. McGillicuddy FC, Harford KA, Reynolds CM, Oliver E, Claessens M, Mills KH, and Roche HM. 438 Lack of interleukin-1 receptor I (IL-1RI) protects mice from high-fat diet-induced adipose tissue 439 inflammation coincident with improved glucose homeostasis. Diabetes 60: 1688-1698, 2011. 440 25. Misra VK, and Trudeau S. The influence of overweight and obesity on longitudinal trends 441 in maternal serum leptin levels during pregnancy. Obesity (Silver Spring) 19: 416-421, 2011. 442 26. Munoz-Planillo R, Kuffa P, Martinez-Colon G, Smith BL, Rajendiran TM, and Nunez G. K(+) 443 efflux is the common trigger of NLRP3 inflammasome activation by bacterial toxins and particulate 444 matter. Immunity 38: 1142-1153, 2013. 445 27. Nodine PM, and Hastings-Tolsma M. Maternal obesity: improving pregnancy outcomes. 446 MCN The American journal of maternal child nursing 37: 110-115, 2012. 447 28. O'Keefe JH, Jr., and Cordain L. Cardiovascular disease resulting from a diet and lifestyle at 448 odds with our Paleolithic genome: how to become a 21st-century hunter-gatherer. Mayo Clin Proc 449 79: 101-108, 2004. 450 29. Ogihara T, Asano T, Ando K, Chiba Y, Sekine N, Sakoda H, Anai M, Onishi Y, Fujishiro M, 451 Ono H, Shojima N, Inukai K, Fukushima Y, Kikuchi M, and Fujita T. Insulin resistance with enhanced 452 insulin signaling in high-salt diet-fed rats. Diabetes 50: 573-583, 2001. 453 30. Reynolds CM, McGillicuddy FC, Harford KA, Finucane OM, Mills KH, and Roche HM. Dietary 454 saturated fatty acids prime the NLRP3 inflammasome via TLR4 in dendritic cells-implications for 455 diet-induced insulin resistance. Mol Nutr Food Res 56: 1212-1222, 2012. 456 31. Straughen JK, Trudeau S, and Misra VK. Changes in adipose tissue distribution during 457 pregnancy in overweight and obese compared with normal weight women. Nutrition & diabetes 3: 458 e84, 2013. 459 32. Sussman D, Ellegood J, and Henkelman M. A gestational ketogenic diet alters maternal 460 metabolic status as well as offspring physiological growth and brain structure in the neonatal 461 mouse. BMC pregnancy and childbirth 13: 198, 2013. 462 33. Tessier DR, Ferraro ZM, and Gruslin A. Role of leptin in pregnancy: consequences of 463 maternal obesity. Placenta 34: 205-211, 2013. 464 34. Vickers MH. Developmental programming of the metabolic syndrome - critical windows 465 for intervention. World journal of diabetes 2: 137-148, 2011. 466 35. Vickers MH, Breier BH, Cutfield WS, Hofman PL, and Gluckman PD. Fetal origins of 467 hyperphagia, obesity, and hypertension and postnatal amplification by hypercaloric nutrition. Am 468 J Physiol Endocrinol Metab 279: E83-87, 2000. 469 36. Zhang L, Sugiyama T, Murabayashi N, Umekawa T, Ma N, Kamimoto Y, Ogawa Y, and 470 Sagawa N. The inflammatory changes of adipose tissue in late pregnant mice. J Mol Endocrinol 47: 471 157-165, 2011. 472
473
474
475
476
19
CD SD HF HFSD
Body weight (g) + 418±16.9 449.7±8.8 468.5±9.7* 461.9±19*
Glucose (mmol/l) 4.75±0.3 4.37±0.3 4.9±0.2 4.83±0.6
Insulin (ng/ml) 1.0±0.2 0.85±0.2 1.7±0.5* 1.3±0.2
HOMA-IR + 0.20±0.04 0.15±0.03 0.34±0.08 0.28±0.04
Leptin (ng/ml) 5.67±1.03 4.86±0.78 3.07±1.11 5.82±1.19
Ketone + 0.16±0.02 0.33±0.05* 0.35±0.02* 0.45±0.13*
Fat (%BW) +#a,b 1.14±0.15 1.24±0.11 2.62±0.25* 1.58±0.24
TAG (mmol/l) # 3.15±0.35 4.56±0.32* 3.04±0.37 4.23±0.51*
LDH (U/L) 366±64 470.5±45 590.8±79* 446.1±26
Lipase (U/L) + 10.86±0.6 10.32±0.3 14.03±1.4* 12.17±0.5
ALT (U/L) + 24.76±4.44 32.17±1.96 38.58±7.32* 51.88±6.2*
AST (U/L) + 102.4±6.7 131.4±6.8* 150.4±8.3* 152.2±10.8*
IL-1β (pg/ml) + 8.9±2.4 8.1±1.6 16.5±2.7 12.4±3.5
TNFα (pg/ml) + 3.7±2.6 2.7±1.7 10.5±3.1* 11.3±3.1*
477
Table 1. Maternal metabolic parameters. Data are mean ± SEM. +p<0.05 for high fat diet 478
effect; #p<0.05 for salt effect; a,bp<0.05 for high fat�high salt interaction, *p<0.05 w.r.t CD. 479
HOMA-IR was calculated as [fasting glucose x fasting insulin/22.5] 480
481
482
483
484
20
CD SD HF HFSD
Body weight (g) + 52.08±2.2 51.8±1.9 59.75±2.0* 53.57±2.6
Glucose (mmol/l) a,b 6.04±0.4 5.69±0.2 5.18±0.3* 6.33±0.4
Insulin (ng/ml) a,b 0.75±0.26 0.41±0.09 0.33±0.08 0.69±0.12
HOMA-IR a,b 0.24±0.11 0.08±0.03 0.1±0.02 0.2±0.04
Leptin (ng/ml) 0.71±0.07 0.68±0.08 0.7±0.08 1.08±0.24
Ketone 2.01±0.27 2.56±0.26 2.78±0.13 2.24±0.38
FFA (mmol/l) # 1.21±0.05 0.92±0.05 1.23±0.09 1.7±0.2
TAG (mmol/l) + 0.58±0.04 0.60±0.06 0.76±0.07 0.77±0.07
Table 2. Female weanling metabolic profile. Data are mean ± SEM. +p<0.05 for high fat 485
diet effect; #p<0.05 for salt effect; a,bp<0.05 for high fat�high salt interaction, *p<0.05 w.r.t 486
CD. HOMA-IR was calculated as [fasting glucose x fasting insulin/22.5] 487
488
489
490
491
492
493
494
495
496
21
CD SD HF HFSD
Body weight (g) + # 58.25±1.7 54.07±2.3 67.53±2.3* 59.1±2.2
Glucose (mmol/l) 5.34±0.17 5.35±0.23 5.6±0.25 5.6±0.42
Insulin (ng/ml) 0.22±0.03 0.36±0.09 0.4±0.12 0.35±0.06
HOMA-IR 0.056±0.009 0.116±0.065 0.105±0.03 0.099±0.02
Leptin (ng/ml) 0.68±0.09 0.71±0.08 0.76±0.07 0.83±0.18
Ketone 2.84±0.25 2.63±0.21 2.5±0.21 2.93±0.24
FFA (mmol/l) 1.08±0.17 1.12±0.16 1.52±0.22 1.32±0.09
TAG (mmol/l) a,b 0.52±0.07 0.74±0.06* 0.83±0.13* 0.67±0.05
Table 3. Male weanling metabolic profile. Data are mean ± SEM. +p<0.05 for high fat diet 497
effect; #p<0.05 for salt effect; a,bp<0.05 for high fat�high salt interaction, *p<0.05 w.r.t CD. 498
HOMA-IR was calculated as [fasting glucose x fasting insulin/22.5] 499
500
501
502
503
504
505
506
507
508
22
FIGURE LEGENDS: 509
Figure 1. Maternal pre-gestational and gestational growth curves and food intakes. 510
Female Sprague Dawley rats were fed either CD (1% NaCl, 10% kcal from fat), SD (4% 511
NaCl, 10% kcal from fat), HF (1% NaCl, 45% kcal from fat), HFSD (4% Salt, 45% kcal from 512
fat) for 3 weeks prior to pregnancy (a) and during pregnancy (b). Body weight was monitored 513
every second day. Cumulative food intakes (c) and total caloric intakes (d) were calculated. 514
Data are presented as means ± SEM. *p<0.05 for HF versus all other groups; + p<0.05 for 515
HF versus CD and SD; # p<0.05 for HFSD versus CD and SD. 516
Figure 2. Maternal adipose tissue inflammatory profile. Adipose tissue explants (100mg/ml) 517
were cultured for 24h and supernatant was analysed for (a) IL-1β and (c) TNFα using Quantikine 518
ELISA (*p<0.05, w.r.t CD n=6-7). Adipose tissue mRNA expression of (b) IL-1β, (d) TNFα, (e) 519
CD68 and (f) MCP-1 was analysed by RT-PCR (*p<0.05 w.r.t CD; n=8). Values were expressed as 520
mean ± SEM. 521
Figure 3. Adipose tissue glucose and lipid homeostasis. Adipose tissue mRNA expression of 522
(a) GLUT4, (b) IRS1, (c) CD36 and (d) LPL was analysed by RT-PCR (*p<0.05 w.r.t CD; n=6-7 523
litters). Values were expressed as mean ± SEM. 524
Figure 4. Expression of adipogenic markers. Adipose tissue mRNA expression of (a) PPARγ 525
and (b) DLK1. (*p<0.05 w.r.t CD; n=6-7 litters ). Values were expressed as mean ± SEM. 526
Figure 5. Hepatic metabolic gene expression. Liver mRNA expression of (a) PPARα, (b) 527
SREBP-1c, (c) FASN, (d) CD36 and (e) GLUT2. (*p<0.05 w.r.t CD; n=6-7 litters). Values were 528
expressed as mean ± SEM. 529
Figure 6. Effects of maternal diet on fetal weight at embryonic day 18. Dams were culled 530
at embryonic day 18. Fetuses were excised and weighed following sex determination. Male 531
and female fetal weights are expressed as mean ± SEM. *p<0.05 w.r.t CD; n=6-7 litters). 532
23
Figure 7. Effect of maternal diet on male and female offspring growth curves and fat 533
deposition. Male growth curves (day 2-21) (a); female growth curves (2-21) (b), male fat 534
deposition expressed as % body weight (c), female fat deposition expressed as % body 535
weight (d). *p<0.05 w.r.t CD; n=6-7 litters). Data are presented as means ± SEM. 536
537
538
539
Copyright © 2022 FDOKUMEN