
Integración a la Cultura Académica (ICA) Licenciatura en ...
HUMAN NEUROSCIENCEORIGINAL RESEARCH ARTICLE
published: 03 February 2015doi: 10.3389/fnhum.2015.00043
High-dimensional ICA analysis detects within-networkfunctional connectivity damage of default-mode andsensory-motor networks in Alzheimer’s diseaseOttavia Dipasquale1,2*, Ludovica Griffanti 1,2,3, Mario Clerici 1,4, Raffaello Nemni 1,4, Giuseppe Baselli 2 andFrancesca Baglio1
1 IRCCS, Don Gnocchi Foundation, Milan, Italy2 Department of Electronics, Information and Bioengineering, Politecnico di Milano, Milan, Italy3 FMRIB (Oxford University Centre for Functional MRI of the Brain), Oxford, UK4 Università degli Studi di Milano, Milan, Italy
Edited by:Jean-Claude Baron, University ofCambridge, UK
Reviewed by:Serge A. R. Rombouts, LeidenUniversity Medical Center,NetherlandsMario Quarantelli, National ResearchCouncil, Italy
*Correspondence:Ottavia Dipasquale,Neurorehabilitation Unit, MagneticResonance Laboratory, FondazioneDon Carlo Gnocchi ONLUS, IRCCS S.Maria Nascente, Via Capecelatro 66,Milan 20148, Italye-mail: [email protected]
High-dimensional independent component analysis (ICA), compared to low-dimensionalICA, allows to conduct a detailed parcellation of the resting-state networks. The purposeof this study was to give further insight into functional connectivity (FC) in Alzheimer’sdisease (AD) using high-dimensional ICA. For this reason, we performed both low- andhigh-dimensional ICA analyses of resting-state fMRI data of 20 healthy controls and 21patients with AD, focusing on the primarily altered default-mode network (DMN) and explor-ing the sensory-motor network. As expected, results obtained at low dimensionality werein line with previous literature. Moreover, high-dimensional results allowed us to observeeither the presence of within-network disconnections and FC damage confined to someof the resting-state subnetworks. Due to the higher sensitivity of the high-dimensional ICAanalysis, our results suggest that high-dimensional decomposition in subnetworks is verypromising to better localize FC alterations in AD and that FC damage is not confined tothe DMN.
Keywords: group independent component analysis, functional connectivity, resting-state fMRI,Alzheimer’s disease,default-mode network, sensory-motor network
INTRODUCTIONIndependent component analysis (ICA) is a powerful data-drivenmethod used for functional connectivity (FC) analysis of theresting-state fMRI (rfMRI) data. It decomposes rfMRI data intodistinct networks, the resting-state networks (RSNs), correlated intheir spontaneous fluctuations but also maximally independent inthe spatial domain (Beckmann et al., 2005).
Current research in rfMRI is increasingly adopting group-levelhigh-dimensional ICA to obtain more detailed and informa-tive network analyses with respect to the more common low-dimensional approach (Kiviniemi et al., 2009; Abou-Elseoud et al.,2010; Abou Elseoud et al., 2011; Smith et al., 2011, 2013; Tianet al., 2013). In fact, the splitting of the RSNs, obtained from thehigh-dimensional ICA analysis, could be due to a differential func-tionality of subnetworks forming the larger ones obtained with thelow-dimensional analysis (Smith et al., 2009; Abou-Elseoud et al.,2010). In applications to pathological conditions, this differen-tial functionality of subnetworks could be related to the specificset of subjects (Abou-Elseoud et al., 2010; Damoiseaux et al.,2012) and driven by the pathology itself, allowing a more disease-specific FC analysis. Abou-Elseoud et al. (2010) showed that ICAanalysis results are affected by model order selection and demon-strated by patients with seasonal affective disorder (Abou Elseoudet al., 2011) that the between-group differences measured withICA increase with model order (reaching a maximum of around70 components on data acquired with a standard EPI sequence),
thus suggesting multi-level ICA exploration of RSNs FC to opti-mize sensitivity to brain disorders. Furthermore, the analysis ofthe temporal information obtained from rfMRI data (i.e., fromthe analysis of the time series associated with each component)with low- and high-dimensional ICA allows the study of brainfunction from a complementary perspective to the informationprovided by the spatial map analysis. This was also confirmed byTian et al. (2013) in a recent study conducted on healthy subjectsinvestigating the spatial and temporal features of rfMRI relatedto behavior, wherein they highlighted the benefit of the temporalanalysis of the RSNs.
In this work, we applied these innovative rfMRI analyses toAlzheimer’s disease (AD), the most common cause of demen-tia in the elderly (Berr et al., 2005). In fact, the decreased FC ofthe default-mode network (DMN), quantified on rfMRI data, isbecoming a possible new biomarker for this pathology (Greiciuset al., 2004; Gili et al., 2011; Li and Wahlund, 2011). Therefore,early detection and a detailed characterization of this alterationare crucial. Moreover, recent rfMRI studies also investigated theeffects of AD in other RSNs (Brier et al., 2012; Li et al., 2012; Heet al., 2013) in order to investigate possible additional FC changesbeyond the DMN and memory function, but the impact of thepathology on these networks is still unclear.
This study was led by the hypothesis that, in the first stages ofAD, functional alterations arise as within-network FC loss, and, asthe severity of illness increases, these alterations involve the whole
Frontiers in Human Neuroscience www.frontiersin.org February 2015 | Volume 9 | Article 43 | 1
Dipasquale et al. High-dimensional ICA in Alzheimer’s disease
brain. We used high-dimensional ICA to decompose the RSNs insubnetworks and to explore the within-network disruption mech-anisms that affect the mild and moderate stages of AD. We alsocompared the results of this approach with the more traditionallow-dimensional ICA one.
We first used an objective and automatic algorithm to asso-ciate the resting-state subnetworks obtained by means of thehigh-dimensional ICA (i.e., 70 components) to the major RSNsdescribed in literature and obtained with the low-dimensionalICA (i.e., 25 components). We explored the FC in patients withAD and healthy controls (HC) within two RSNs, the DMN andthe sensory-motor network (SMN). The first network, which com-prises the medial prefrontal cortex (mPFC), the posterior cingulatecortex (PCC), the inferior parietal lobes, and the hippocampus, isthe primarily altered RSN in AD, while the SMN is still poorlyexplored in AD studies. The low-dimensional spatial map analysiswas used to verify that the results of our study were in line withprevious literature (Greicius et al., 2004; Zhang et al., 2009; Bin-newijzend et al., 2012; Hafkemeijer et al., 2012); then, by means ofthe temporal (amplitude and network) analysis at low dimension-ality, and the spatial and temporal analyses at high dimensionality,we investigated the FC of the selected RSNs and their subnetworksin more detail.
MATERIAL AND METHODSSUBJECTSForty-one subjects (21 AD and 20 HC) participated in the study.Patients with AD [mean age 73.62± 5.22; 8 males] were recruitedfrom the Memory Clinic of I.R.C.C.S. Don Gnocchi Foundation,with a diagnosis of probable AD dementia, according to the revisedNINCDS-ADRDA criteria (McKhann et al., 2011), in a mild tomoderate stage [Clinical Dementia Rating Scale (CDR)≤ 2]. Toincrease the diagnostic accuracy, analyses of hippocampal vol-umes were also included in the study as an index of downstreamneural injury according to the guidelines for Alzheimer’s demen-tia (McKhann et al., 2011). Twenty age-matched HC (mean age71.05± 3.66; 7 males, MMSE≥ 28) had no history of neurological,cardiovascular, or metabolic disorders and voluntarily participatedin the study. According to the recommendations of the declarationof Helsinki for investigations on human subjects, both local ethicscommittee approval of the Don Gnocchi Foundation and writteninformed consent from all subjects or their caregivers to participatein the study were obtained before study initiation.
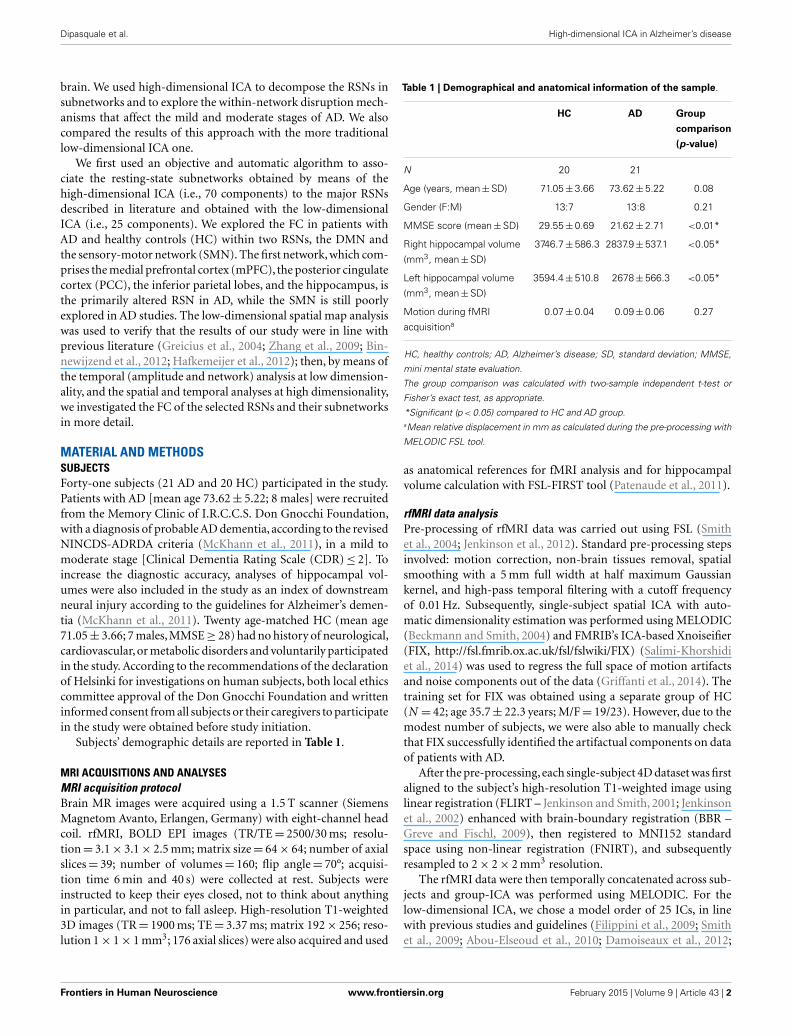
Subjects’ demographic details are reported in Table 1.
MRI ACQUISITIONS AND ANALYSESMRI acquisition protocolBrain MR images were acquired using a 1.5 T scanner (SiemensMagnetom Avanto, Erlangen, Germany) with eight-channel headcoil. rfMRI, BOLD EPI images (TR/TE= 2500/30 ms; resolu-tion= 3.1× 3.1× 2.5 mm; matrix size= 64× 64; number of axialslices= 39; number of volumes= 160; flip angle= 70°; acquisi-tion time 6 min and 40 s) were collected at rest. Subjects wereinstructed to keep their eyes closed, not to think about anythingin particular, and not to fall asleep. High-resolution T1-weighted3D images (TR= 1900 ms; TE= 3.37 ms; matrix 192× 256; reso-lution 1× 1× 1 mm3; 176 axial slices) were also acquired and used
Table 1 | Demographical and anatomical information of the sample.
HC AD Group
comparison
(p-value)
N 20 21
Age (years, mean±SD) 71.05±3.66 73.62±5.22 0.08
Gender (F:M) 13:7 13:8 0.21
MMSE score (mean±SD) 29.55±0.69 21.62±2.71 <0.01*
Right hippocampal volume
(mm3, mean±SD)
3746.7±586.3 2837.9±537.1 <0.05*
Left hippocampal volume
(mm3, mean±SD)
3594.4±510.8 2678±566.3 <0.05*
Motion during fMRI
acquisitiona
0.07±0.04 0.09±0.06 0.27
HC, healthy controls; AD, Alzheimer’s disease; SD, standard deviation; MMSE,
mini mental state evaluation.
The group comparison was calculated with two-sample independent t-test or
Fisher’s exact test, as appropriate.
*Significant (p < 0.05) compared to HC and AD group.aMean relative displacement in mm as calculated during the pre-processing with
MELODIC FSL tool.
as anatomical references for fMRI analysis and for hippocampalvolume calculation with FSL-FIRST tool (Patenaude et al., 2011).
rfMRI data analysisPre-processing of rfMRI data was carried out using FSL (Smithet al., 2004; Jenkinson et al., 2012). Standard pre-processing stepsinvolved: motion correction, non-brain tissues removal, spatialsmoothing with a 5 mm full width at half maximum Gaussiankernel, and high-pass temporal filtering with a cutoff frequencyof 0.01 Hz. Subsequently, single-subject spatial ICA with auto-matic dimensionality estimation was performed using MELODIC(Beckmann and Smith, 2004) and FMRIB’s ICA-based Xnoiseifier(FIX, http://fsl.fmrib.ox.ac.uk/fsl/fslwiki/FIX) (Salimi-Khorshidiet al., 2014) was used to regress the full space of motion artifactsand noise components out of the data (Griffanti et al., 2014). Thetraining set for FIX was obtained using a separate group of HC(N = 42; age 35.7± 22.3 years; M/F= 19/23). However, due to themodest number of subjects, we were also able to manually checkthat FIX successfully identified the artifactual components on dataof patients with AD.
After the pre-processing,each single-subject 4D dataset was firstaligned to the subject’s high-resolution T1-weighted image usinglinear registration (FLIRT – Jenkinson and Smith, 2001; Jenkinsonet al., 2002) enhanced with brain-boundary registration (BBR –Greve and Fischl, 2009), then registered to MNI152 standardspace using non-linear registration (FNIRT), and subsequentlyresampled to 2× 2× 2 mm3 resolution.
The rfMRI data were then temporally concatenated across sub-jects and group-ICA was performed using MELODIC. For thelow-dimensional ICA, we chose a model order of 25 ICs, in linewith previous studies and guidelines (Filippini et al., 2009; Smithet al., 2009; Abou-Elseoud et al., 2010; Damoiseaux et al., 2012;
Frontiers in Human Neuroscience www.frontiersin.org February 2015 | Volume 9 | Article 43 | 2
Dipasquale et al. High-dimensional ICA in Alzheimer’s disease
Zamboni et al., 2013). For the high-dimensional ICA, we chosea dimensionality of 70 ICs, as suggested in Abou-Elseoud et al.(2010) and Abou Elseoud et al. (2011) and judged to be compat-ible with the temporal degrees of freedom of the data (after thecleaning procedure). Subject-specific time series and spatial mapsfrom the low-dimensional and high-dimensional group ICs wereobtained with the dual-regression approach (Filippini et al., 2009).
The low-dimensional group ICs were manually classified asRSNs or artifacts based on previous knowledge of the RSN pat-terns described in literature (Beckmann et al., 2005; De Lucaet al., 2006; Rytty et al., 2013). The high-dimensional compo-nents were then classified taking the low-dimensional RSNs asreference templates, and using a spatio-temporal labeling crite-rion: the high-dimensional component i was labeled as part ofthe low-dimensional component j with which it had the high-est spatial overlap (calculated with Dice coefficient, DCij) andthe highest temporal correlation (TCij, calculated with Pearson’scorrelation among single-subject time series and averaged acrosssubjects). A component was classified as residual noise if all DCij
or TCij were below a threshold empirically determined duringthe algorithm development by evaluating different values againstmanual classification (namely 0.1 for DCij and 0.4 for TCij) onthree different datasets, included the one used in this study, orclassified as unknown if the spatial and temporal matching resultsdisagreed. Both the residual noise and the unknown componentswere ignored in subsequent analyses.
Subsequent analyses were focused on the two RSNs of interest:the DMN and the SMN. We performed spatial maps and temporal(amplitude and network) analyses on these ICs of interest, both atlow and high dimensionality. Regarding the time series analysis athigh dimensionality, we will use the terms “within-network” and“between-network,” respectively, referring to comparisons madebetween subareas belonging to the same RSN or different RSNs.
The spatial maps derived for each subject from the second stageof dual regression were compared between the two groups throughvoxel-wise statistics using a non-parametric permutation test. Acluster-based thresholding was used, corrected for multiple com-parisons by using the null distribution of the max cluster size(Hayasaka and Nichols, 2003).
From the subject-specific time series, obtained as output of thefirst stage of dual regression, we calculated the amplitude of theselected RSNs as the standard deviation of the time series. Networkanalysis was also performed by estimating full correlation values(then converted into z-values) between all pairs of time series ofthe selected components. Significant differences in amplitude andcorrelations between HC and patients with AD were then assessedwith two-sample t -test and corrected for multiple comparisonsusing FSLNets (http://fsl.fmrib.ox.ac.uk/fsl/fslwiki/FSLNets).
RESULTSDEMOGRAPHICAL AND ANATOMICAL CHARACTERISTICS OF THEPARTICIPANTSHC subjects and patients with AD were comparable for age andgender; a significant difference was found for MMSE score, accord-ingly with the adopted inclusion criteria (Table 1). The significantdifference in hippocampal volumes confirmed the gray mattervolume alteration typical of AD.
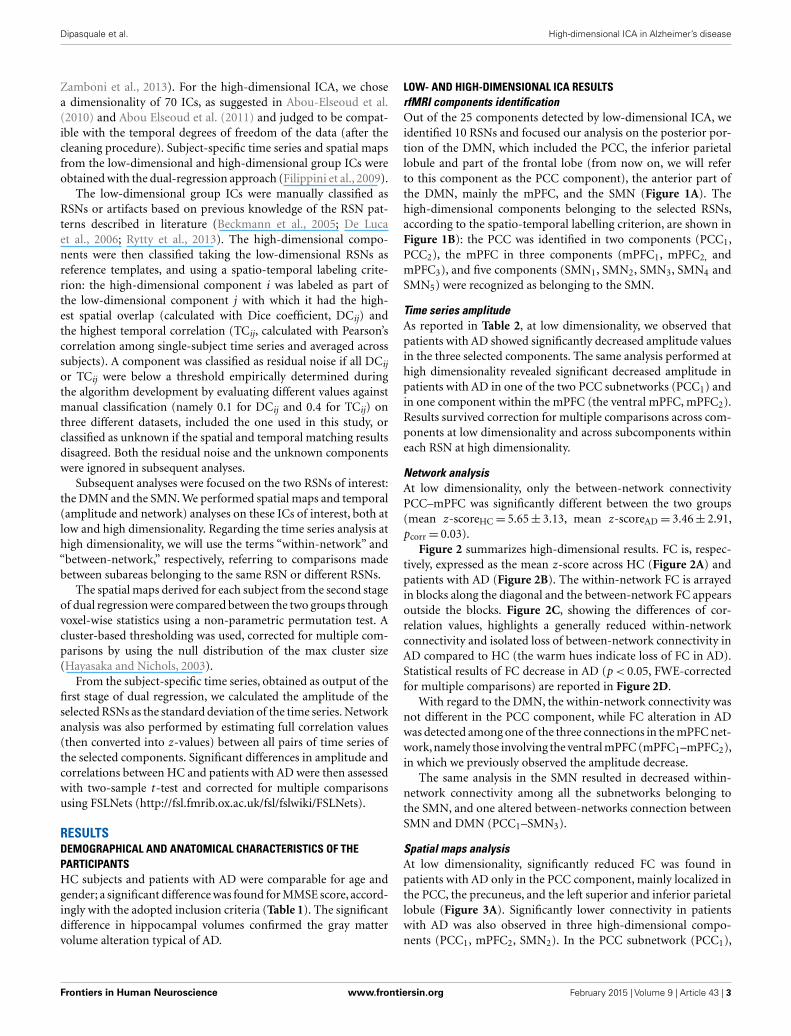
LOW- AND HIGH-DIMENSIONAL ICA RESULTSrfMRI components identificationOut of the 25 components detected by low-dimensional ICA, weidentified 10 RSNs and focused our analysis on the posterior por-tion of the DMN, which included the PCC, the inferior parietallobule and part of the frontal lobe (from now on, we will referto this component as the PCC component), the anterior part ofthe DMN, mainly the mPFC, and the SMN (Figure 1A). Thehigh-dimensional components belonging to the selected RSNs,according to the spatio-temporal labelling criterion, are shown inFigure 1B): the PCC was identified in two components (PCC1,PCC2), the mPFC in three components (mPFC1, mPFC2, andmPFC3), and five components (SMN1, SMN2, SMN3, SMN4 andSMN5) were recognized as belonging to the SMN.
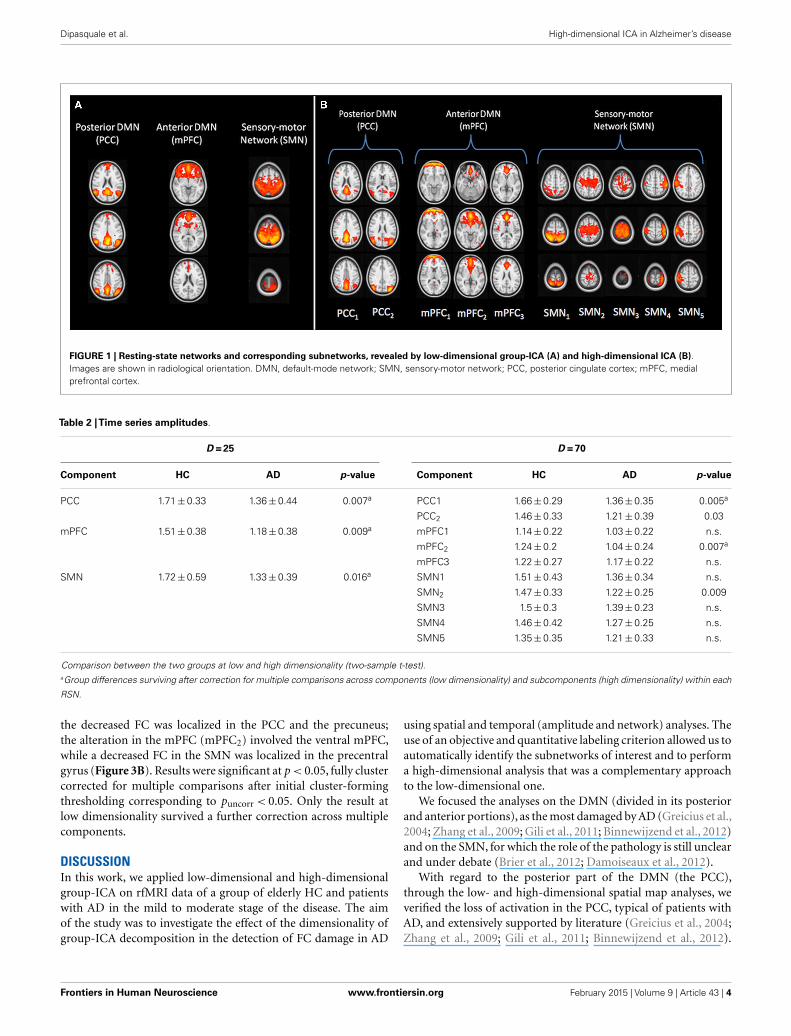
Time series amplitudeAs reported in Table 2, at low dimensionality, we observed thatpatients with AD showed significantly decreased amplitude valuesin the three selected components. The same analysis performed athigh dimensionality revealed significant decreased amplitude inpatients with AD in one of the two PCC subnetworks (PCC1) andin one component within the mPFC (the ventral mPFC, mPFC2).Results survived correction for multiple comparisons across com-ponents at low dimensionality and across subcomponents withineach RSN at high dimensionality.
Network analysisAt low dimensionality, only the between-network connectivityPCC–mPFC was significantly different between the two groups(mean z-scoreHC= 5.65± 3.13, mean z-scoreAD= 3.46± 2.91,pcorr= 0.03).
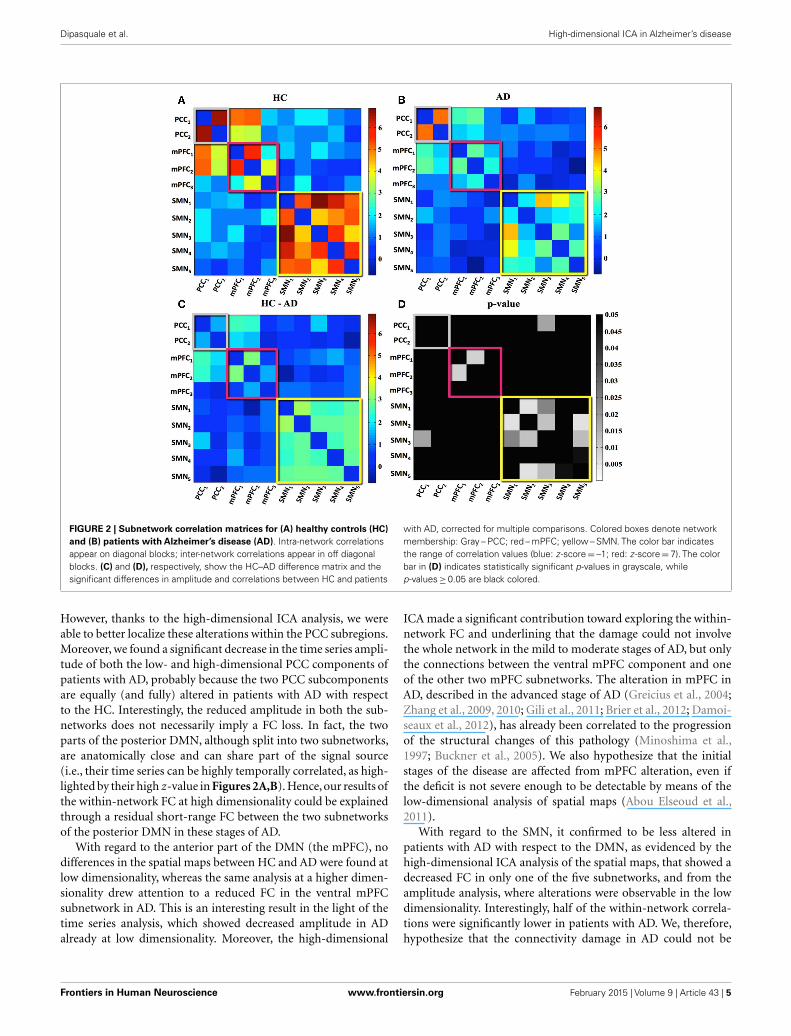
Figure 2 summarizes high-dimensional results. FC is, respec-tively, expressed as the mean z-score across HC (Figure 2A) andpatients with AD (Figure 2B). The within-network FC is arrayedin blocks along the diagonal and the between-network FC appearsoutside the blocks. Figure 2C, showing the differences of cor-relation values, highlights a generally reduced within-networkconnectivity and isolated loss of between-network connectivity inAD compared to HC (the warm hues indicate loss of FC in AD).Statistical results of FC decrease in AD (p < 0.05, FWE-correctedfor multiple comparisons) are reported in Figure 2D.
With regard to the DMN, the within-network connectivity wasnot different in the PCC component, while FC alteration in ADwas detected among one of the three connections in the mPFC net-work,namely those involving the ventral mPFC (mPFC1–mPFC2),in which we previously observed the amplitude decrease.
The same analysis in the SMN resulted in decreased within-network connectivity among all the subnetworks belonging tothe SMN, and one altered between-networks connection betweenSMN and DMN (PCC1–SMN3).
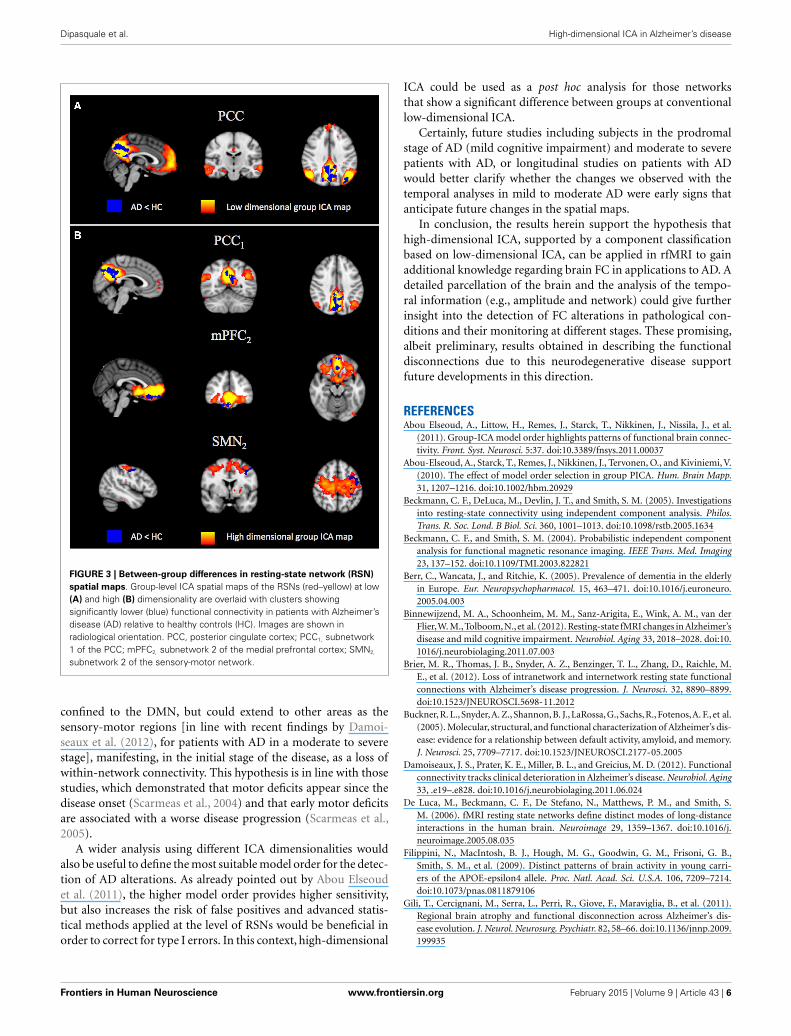
Spatial maps analysisAt low dimensionality, significantly reduced FC was found inpatients with AD only in the PCC component, mainly localized inthe PCC, the precuneus, and the left superior and inferior parietallobule (Figure 3A). Significantly lower connectivity in patientswith AD was also observed in three high-dimensional compo-nents (PCC1, mPFC2, SMN2). In the PCC subnetwork (PCC1),
Frontiers in Human Neuroscience www.frontiersin.org February 2015 | Volume 9 | Article 43 | 3
Dipasquale et al. High-dimensional ICA in Alzheimer’s disease
FIGURE 1 | Resting-state networks and corresponding subnetworks, revealed by low-dimensional group-ICA (A) and high-dimensional ICA (B).Images are shown in radiological orientation. DMN, default-mode network; SMN, sensory-motor network; PCC, posterior cingulate cortex; mPFC, medialprefrontal cortex.
Table 2 |Time series amplitudes.
D = 25 D = 70
Component HC AD p-value Component HC AD p-value
PCC 1.71±0.33 1.36±0.44 0.007a PCC1 1.66±0.29 1.36±0.35 0.005a
PCC2 1.46±0.33 1.21±0.39 0.03
mPFC 1.51±0.38 1.18±0.38 0.009a mPFC1 1.14±0.22 1.03±0.22 n.s.
mPFC2 1.24±0.2 1.04±0.24 0.007a
mPFC3 1.22±0.27 1.17±0.22 n.s.
SMN 1.72±0.59 1.33±0.39 0.016a SMN1 1.51±0.43 1.36±0.34 n.s.
SMN2 1.47±0.33 1.22±0.25 0.009
SMN3 1.5±0.3 1.39±0.23 n.s.
SMN4 1.46±0.42 1.27±0.25 n.s.
SMN5 1.35±0.35 1.21±0.33 n.s.
Comparison between the two groups at low and high dimensionality (two-sample t-test).aGroup differences surviving after correction for multiple comparisons across components (low dimensionality) and subcomponents (high dimensionality) within each
RSN.
the decreased FC was localized in the PCC and the precuneus;the alteration in the mPFC (mPFC2) involved the ventral mPFC,while a decreased FC in the SMN was localized in the precentralgyrus (Figure 3B). Results were significant at p < 0.05, fully clustercorrected for multiple comparisons after initial cluster-formingthresholding corresponding to puncorr < 0.05. Only the result atlow dimensionality survived a further correction across multiplecomponents.
DISCUSSIONIn this work, we applied low-dimensional and high-dimensionalgroup-ICA on rfMRI data of a group of elderly HC and patientswith AD in the mild to moderate stage of the disease. The aimof the study was to investigate the effect of the dimensionality ofgroup-ICA decomposition in the detection of FC damage in AD
using spatial and temporal (amplitude and network) analyses. Theuse of an objective and quantitative labeling criterion allowed us toautomatically identify the subnetworks of interest and to performa high-dimensional analysis that was a complementary approachto the low-dimensional one.
We focused the analyses on the DMN (divided in its posteriorand anterior portions), as the most damaged by AD (Greicius et al.,2004; Zhang et al., 2009; Gili et al., 2011; Binnewijzend et al., 2012)and on the SMN, for which the role of the pathology is still unclearand under debate (Brier et al., 2012; Damoiseaux et al., 2012).
With regard to the posterior part of the DMN (the PCC),through the low- and high-dimensional spatial map analyses, weverified the loss of activation in the PCC, typical of patients withAD, and extensively supported by literature (Greicius et al., 2004;Zhang et al., 2009; Gili et al., 2011; Binnewijzend et al., 2012).
Frontiers in Human Neuroscience www.frontiersin.org February 2015 | Volume 9 | Article 43 | 4
Dipasquale et al. High-dimensional ICA in Alzheimer’s disease
FIGURE 2 | Subnetwork correlation matrices for (A) healthy controls (HC)and (B) patients with Alzheimer’s disease (AD). Intra-network correlationsappear on diagonal blocks; inter-network correlations appear in off diagonalblocks. (C) and (D), respectively, show the HC–AD difference matrix and thesignificant differences in amplitude and correlations between HC and patients
with AD, corrected for multiple comparisons. Colored boxes denote networkmembership: Gray – PCC; red – mPFC; yellow – SMN. The color bar indicatesthe range of correlation values (blue: z -score= –1; red: z -score=7). The colorbar in (D) indicates statistically significant p-values in grayscale, whilep-values≥0.05 are black colored.
However, thanks to the high-dimensional ICA analysis, we wereable to better localize these alterations within the PCC subregions.Moreover, we found a significant decrease in the time series ampli-tude of both the low- and high-dimensional PCC components ofpatients with AD, probably because the two PCC subcomponentsare equally (and fully) altered in patients with AD with respectto the HC. Interestingly, the reduced amplitude in both the sub-networks does not necessarily imply a FC loss. In fact, the twoparts of the posterior DMN, although split into two subnetworks,are anatomically close and can share part of the signal source(i.e., their time series can be highly temporally correlated, as high-lighted by their high z-value in Figures 2A,B). Hence,our results ofthe within-network FC at high dimensionality could be explainedthrough a residual short-range FC between the two subnetworksof the posterior DMN in these stages of AD.
With regard to the anterior part of the DMN (the mPFC), nodifferences in the spatial maps between HC and AD were found atlow dimensionality, whereas the same analysis at a higher dimen-sionality drew attention to a reduced FC in the ventral mPFCsubnetwork in AD. This is an interesting result in the light of thetime series analysis, which showed decreased amplitude in ADalready at low dimensionality. Moreover, the high-dimensional
ICA made a significant contribution toward exploring the within-network FC and underlining that the damage could not involvethe whole network in the mild to moderate stages of AD, but onlythe connections between the ventral mPFC component and oneof the other two mPFC subnetworks. The alteration in mPFC inAD, described in the advanced stage of AD (Greicius et al., 2004;Zhang et al., 2009, 2010; Gili et al., 2011; Brier et al., 2012; Damoi-seaux et al., 2012), has already been correlated to the progressionof the structural changes of this pathology (Minoshima et al.,1997; Buckner et al., 2005). We also hypothesize that the initialstages of the disease are affected from mPFC alteration, even ifthe deficit is not severe enough to be detectable by means of thelow-dimensional analysis of spatial maps (Abou Elseoud et al.,2011).
With regard to the SMN, it confirmed to be less altered inpatients with AD with respect to the DMN, as evidenced by thehigh-dimensional ICA analysis of the spatial maps, that showed adecreased FC in only one of the five subnetworks, and from theamplitude analysis, where alterations were observable in the lowdimensionality. Interestingly, half of the within-network correla-tions were significantly lower in patients with AD. We, therefore,hypothesize that the connectivity damage in AD could not be
Frontiers in Human Neuroscience www.frontiersin.org February 2015 | Volume 9 | Article 43 | 5
Dipasquale et al. High-dimensional ICA in Alzheimer’s disease
FIGURE 3 | Between-group differences in resting-state network (RSN)spatial maps. Group-level ICA spatial maps of the RSNs (red–yellow) at low(A) and high (B) dimensionality are overlaid with clusters showingsignificantly lower (blue) functional connectivity in patients with Alzheimer’sdisease (AD) relative to healthy controls (HC). Images are shown inradiological orientation. PCC, posterior cingulate cortex; PCC1, subnetwork1 of the PCC; mPFC2, subnetwork 2 of the medial prefrontal cortex; SMN2,
subnetwork 2 of the sensory-motor network.
confined to the DMN, but could extend to other areas as thesensory-motor regions [in line with recent findings by Damoi-seaux et al. (2012), for patients with AD in a moderate to severestage], manifesting, in the initial stage of the disease, as a loss ofwithin-network connectivity. This hypothesis is in line with thosestudies, which demonstrated that motor deficits appear since thedisease onset (Scarmeas et al., 2004) and that early motor deficitsare associated with a worse disease progression (Scarmeas et al.,2005).
A wider analysis using different ICA dimensionalities wouldalso be useful to define the most suitable model order for the detec-tion of AD alterations. As already pointed out by Abou Elseoudet al. (2011), the higher model order provides higher sensitivity,but also increases the risk of false positives and advanced statis-tical methods applied at the level of RSNs would be beneficial inorder to correct for type I errors. In this context, high-dimensional
ICA could be used as a post hoc analysis for those networksthat show a significant difference between groups at conventionallow-dimensional ICA.
Certainly, future studies including subjects in the prodromalstage of AD (mild cognitive impairment) and moderate to severepatients with AD, or longitudinal studies on patients with ADwould better clarify whether the changes we observed with thetemporal analyses in mild to moderate AD were early signs thatanticipate future changes in the spatial maps.
In conclusion, the results herein support the hypothesis thathigh-dimensional ICA, supported by a component classificationbased on low-dimensional ICA, can be applied in rfMRI to gainadditional knowledge regarding brain FC in applications to AD. Adetailed parcellation of the brain and the analysis of the tempo-ral information (e.g., amplitude and network) could give furtherinsight into the detection of FC alterations in pathological con-ditions and their monitoring at different stages. These promising,albeit preliminary, results obtained in describing the functionaldisconnections due to this neurodegenerative disease supportfuture developments in this direction.
REFERENCESAbou Elseoud, A., Littow, H., Remes, J., Starck, T., Nikkinen, J., Nissila, J., et al.
(2011). Group-ICA model order highlights patterns of functional brain connec-tivity. Front. Syst. Neurosci. 5:37. doi:10.3389/fnsys.2011.00037
Abou-Elseoud, A., Starck, T., Remes, J., Nikkinen, J., Tervonen, O., and Kiviniemi, V.(2010). The effect of model order selection in group PICA. Hum. Brain Mapp.31, 1207–1216. doi:10.1002/hbm.20929
Beckmann, C. F., DeLuca, M., Devlin, J. T., and Smith, S. M. (2005). Investigationsinto resting-state connectivity using independent component analysis. Philos.Trans. R. Soc. Lond. B Biol. Sci. 360, 1001–1013. doi:10.1098/rstb.2005.1634
Beckmann, C. F., and Smith, S. M. (2004). Probabilistic independent componentanalysis for functional magnetic resonance imaging. IEEE Trans. Med. Imaging23, 137–152. doi:10.1109/TMI.2003.822821
Berr, C., Wancata, J., and Ritchie, K. (2005). Prevalence of dementia in the elderlyin Europe. Eur. Neuropsychopharmacol. 15, 463–471. doi:10.1016/j.euroneuro.2005.04.003
Binnewijzend, M. A., Schoonheim, M. M., Sanz-Arigita, E., Wink, A. M., van derFlier,W. M.,Tolboom,N.,et al. (2012). Resting-state fMRI changes in Alzheimer’sdisease and mild cognitive impairment. Neurobiol. Aging 33, 2018–2028. doi:10.1016/j.neurobiolaging.2011.07.003
Brier, M. R., Thomas, J. B., Snyder, A. Z., Benzinger, T. L., Zhang, D., Raichle, M.E., et al. (2012). Loss of intranetwork and internetwork resting state functionalconnections with Alzheimer’s disease progression. J. Neurosci. 32, 8890–8899.doi:10.1523/JNEUROSCI.5698-11.2012
Buckner, R. L., Snyder,A. Z., Shannon, B. J., LaRossa, G., Sachs, R., Fotenos,A. F., et al.(2005). Molecular, structural, and functional characterization of Alzheimer’s dis-ease: evidence for a relationship between default activity, amyloid, and memory.J. Neurosci. 25, 7709–7717. doi:10.1523/JNEUROSCI.2177-05.2005
Damoiseaux, J. S., Prater, K. E., Miller, B. L., and Greicius, M. D. (2012). Functionalconnectivity tracks clinical deterioration in Alzheimer’s disease. Neurobiol. Aging33, .e19–.e828. doi:10.1016/j.neurobiolaging.2011.06.024
De Luca, M., Beckmann, C. F., De Stefano, N., Matthews, P. M., and Smith, S.M. (2006). fMRI resting state networks define distinct modes of long-distanceinteractions in the human brain. Neuroimage 29, 1359–1367. doi:10.1016/j.neuroimage.2005.08.035
Filippini, N., MacIntosh, B. J., Hough, M. G., Goodwin, G. M., Frisoni, G. B.,Smith, S. M., et al. (2009). Distinct patterns of brain activity in young carri-ers of the APOE-epsilon4 allele. Proc. Natl. Acad. Sci. U.S.A. 106, 7209–7214.doi:10.1073/pnas.0811879106
Gili, T., Cercignani, M., Serra, L., Perri, R., Giove, F., Maraviglia, B., et al. (2011).Regional brain atrophy and functional disconnection across Alzheimer’s dis-ease evolution. J. Neurol. Neurosurg. Psychiatr. 82, 58–66. doi:10.1136/jnnp.2009.199935
Frontiers in Human Neuroscience www.frontiersin.org February 2015 | Volume 9 | Article 43 | 6
Dipasquale et al. High-dimensional ICA in Alzheimer’s disease
Greicius, M. D., Srivastava, G., Reiss, A. L., and Menon, V. (2004). Default-mode network activity distinguishes Alzheimer’s disease from healthy aging:evidence from functional MRI. Proc. Natl. Acad. Sci. U.S.A. 101, 4637–4642.doi:10.1073/pnas.0308627101
Greve, D. N., and Fischl, B. (2009). Accurate and robust brain image alignment usingboundary-based registration. Neuroimage 48, 63–72. doi:10.1016/j.neuroimage.2009.06.060
Griffanti, L., Salimi-Khorshidi, G., Beckmann, C. F., Auerbach, E. J., Douaud, G.,Sexton, C. E., et al. (2014). ICA-based artefact removal and accelerated fMRIacquisition for improved resting state network imaging. Neuroimage 95,232–247.doi:10.1016/j.neuroimage.2014.03.034
Hafkemeijer, A., van der Grond, J., and Rombouts, S. A. (2012). Imaging the defaultmode network in aging and dementia. Biochim. Biophys. Acta 1822, 431–441.doi:10.1016/j.bbadis.2011.07.008
Hayasaka, S., and Nichols, T. E. (2003). Validating cluster size inference: ran-dom field and permutation methods. Neuroimage 20, 2343–2356. doi:10.1016/j.neuroimage.2003.08.003
He, X., Qin, W., Liu, Y., Zhang, X., Duan, Y., Song, J., et al. (2013). Abnormalsalience network in normal aging and in amnestic mild cognitive impairmentand Alzheimer’s disease. Hum. Brain Mapp. 35, 3446–3464. doi:10.1002/hbm.22414
Jenkinson, M., Bannister, P., Brady, M., and Smith, S. (2002). Improved optimizationfor the robust and accurate linear registration and motion correction of brainimages. Neuroimage 17, 825–841. doi:10.1006/nimg.2002.1132
Jenkinson, M., Beckmann, C. F., Behrens, T. E., Woolrich, M. W., and Smith,S. M. (2012). Fsl. Neuroimage 62, 782–790. doi:10.1016/j.neuroimage.2011.09.015
Jenkinson, M., and Smith, S. (2001). A global optimization method for robust affineregistration of brain images. [Electronic version]. Med. Image Anal. 5, 143–156.doi:10.1016/S1361-8415(01)00036-6
Kiviniemi, V., Starck, T., Remes, J., Long, X., Nikkinen, J., Haapea, M., et al. (2009).Functional segmentation of the brain cortex using high model order group PICA.Hum. Brain Mapp. 30, 3865–3886. doi:10.1002/hbm.20813
Li, R., Wu, X., Fleisher, A. S., Reiman, E. M., Chen, K., and Yao, L. (2012). Attention-related networks in Alzheimer’s disease: a resting functional MRI study. Hum.Brain Mapp. 33, 1076–1088. doi:10.1002/hbm.21269
Li, T. Q., and Wahlund, L. O. (2011). The search for neuroimaging biomarkers ofAlzheimer’s disease with advanced MRI techniques. Acta Radiol. 52, 211–222.doi:10.1258/ar.2010.100053
McKhann, G. M., Knopman, D. S., Chertkow, H., Hyman, B. T., Jack, C. R. Jr.,Kawas, C. H., et al. (2011). The diagnosis of dementia due to Alzheimer’s disease:recommendations from the national institute on aging-Alzheimer’s associationworkgroups on diagnostic guidelines for Alzheimer’s disease. Alzheimer Dement.7, 263–269. doi:10.1016/j.jalz.2011.03.005
Minoshima, S., Giordani, B., Berent, S., Frey, K. A., Foster, N. L., and Kuhl, D.E. (1997). Metabolic reduction in the posterior cingulate cortex in very earlyAlzheimer’s disease. Ann. Neurol. 42, 85–94. doi:10.1002/ana.410420114
Patenaude, B., Smith, S. M., Kennedy, D. N., and Jenkinson, M. (2011). A bayesianmodel of shape and appearance for subcortical brain segmentation. Neuroimage56, 907–922. doi:10.1016/j.neuroimage.2011.02.046
Rytty, R., Nikkinen, J., Paavola, L., Abou Elseoud, A., Moilanen, V., Visuri, A.,et al. (2013). GroupICA dual regression analysis of resting state networks ina behavioral variant of frontotemporal dementia. Front. Hum. Neurosci. 7:461.doi:10.3389/fnhum.2013.00461
Salimi-Khorshidi, G., Douaud, G., Beckmann, C. F., Glasser, M. F., Griffanti, L., andSmith, S. M. (2014). Automatic denoising of functional MRI data: combining
independent component analysis and hierarchical fusion of classifiers. Neuroim-age 90, 449–468. doi:10.1016/j.neuroimage.2013.11.046
Scarmeas, N., Albert, M., Brandt, J., Blacker, D., Hadjigeorgiou, G., Papadimitriou,A., et al. (2005). Motor signs predict poor outcomes in Alzheimer disease. Neu-rology 64, 1696–1703. doi:10.1212/01.WNL.0000162054.15428.E9
Scarmeas, N., Hadjigeorgiou, G. M., Papadimitriou, A., Dubois, B., Sarazin, M.,Brandt, J., et al. (2004). Motor signs during the course of Alzheimer disease.[Electronic version]. Neurology 63, 975–982. doi:10.1212/01.WNL.0000138440.39918.0C
Smith, S. M., Beckmann, C. F.,Andersson, J.,Auerbach, E. J., Bijsterbosch, J., Douaud,G., et al. (2013). Resting-state fMRI in the human connectome project. Neuroim-age 80, 144–168. doi:10.1016/j.neuroimage.2013.05.039
Smith, S. M., Fox, P. T., Miller, K. L., Glahn, D. C., Fox, P. M., Mackay, C. E., et al.(2009). Correspondence of the brain’s functional architecture during activa-tion and rest. Proc. Natl. Acad. Sci. U.S.A. 106, 13040–13045. doi:10.1073/pnas.0905267106
Smith, S. M., Jenkinson, M., Woolrich, M. W., Beckmann, C. F., Behrens, T. E.,Johansen-Berg, H., et al. (2004). Advances in functional and structural MRimage analysis and implementation as FSL. Neuroimage 23(Suppl. 1), S208–S219.doi:10.1016/j.neuroimage.2004.07.051
Smith, S. M., Miller, K. L., Salimi-Khorshidi, G., Webster, M., Beckmann, C. F.,Nichols, T. E., et al. (2011). Network modelling methods for FMRI. Neuroimage54, 875–891. doi:10.1016/j.neuroimage.2010.08.063
Tian, L., Kong, Y., Ren, J., Varoquaux, G., Zang, Y., and Smith, S. M. (2013). Spatialvs. temporal features in ICA of resting-state fMRI - a quantitative and quali-tative investigation in the context of response inhibition. PLoS One 8:e66572.doi:10.1371/journal.pone.0066572
Zamboni, G., Wilcock, G. K., Douaud, G., Drazich, E., McCulloch, E., Filippini, N.,et al. (2013). Resting functional connectivity reveals residual functional activityin Alzheimer’s disease. Biol Psychiatry 74, 375–383. doi:10.1016/j.biopsych.2013.04.015
Zhang, H. Y., Wang, S. J., Liu, B., Ma, Z. L., Yang, M., Zhang, Z. J., et al. (2010).Resting brain connectivity: changes during the progress of Alzheimer disease.Radiology 256, 598–606. doi:10.1148/radiol.10091701
Zhang, H. Y., Wang, S. J., Xing, J., Liu, B., Ma, Z. L., Yang, M., et al. (2009). Detec-tion of PCC functional connectivity characteristics in resting-state fMRI inmild Alzheimer’s disease. Behav. Brain Res. 197, 103–108. doi:10.1016/j.bbr.2008.08.012
Conflict of Interest Statement: The authors declare that the research was conductedin the absence of any commercial or financial relationships that could be construedas a potential conflict of interest.
Received: 17 October 2014; accepted: 16 January 2015; published online: 03 February2015.Citation: Dipasquale O, Griffanti L, Clerici M, Nemni R, Baselli G and Baglio F(2015) High-dimensional ICA analysis detects within-network functional connectivitydamage of default-mode and sensory-motor networks in Alzheimer’s disease. Front.Hum. Neurosci. 9:43. doi: 10.3389/fnhum.2015.00043This article was submitted to the journal Frontiers in Human Neuroscience.Copyright © 2015 Dipasquale, Griffanti, Clerici, Nemni, Baselli and Baglio. This is anopen-access article distributed under the terms of the Creative Commons AttributionLicense (CC BY). The use, distribution or reproduction in other forums is permitted,provided the original author(s) or licensor are credited and that the original publica-tion in this journal is cited, in accordance with accepted academic practice. No use,distribution or reproduction is permitted which does not comply with these terms.
Frontiers in Human Neuroscience www.frontiersin.org February 2015 | Volume 9 | Article 43 | 7
Copyright © 2022 FDOKUMEN