HES1, a target of Notch signaling, is elevated in canine osteosarcoma, but reduced in the most...
14
RESEARCH ARTICLE Open Access HES1, a target of Notch signaling, is elevated in canine osteosarcoma, but reduced in the most aggressive tumors Deanna D Dailey 1,2 , Kristin P Anfinsen 3 , Liza E Pfaff 1,2 , EJ Ehrhart 1,2,4 , J Brad Charles 1,4 , Tina B Bønsdorff 3 , Douglas H Thamm 1,2,5 , Barbara E Powers 4 , Thora J Jonasdottir 3 and Dawn L Duval 1,2,5,6* Abstract Background: Hairy and enhancer of split 1 (HES1), a basic helix-loop-helix transcriptional repressor, is a downstream target of Notch signaling. Notch signaling and HES1 expression have been linked to growth and survival in a variety of human cancer types and have been associated with increased metastasis and invasiveness in human osteosarcoma cell lines. Osteosarcoma (OSA) is an aggressive cancer demonstrating both high metastatic rate and chemotherapeutic resistance. The current study examined expression of Notch signaling mediators in primary canine OSA tumors and canine and human osteosarcoma cell lines to assess their role in OSA development and progression. Results: Reverse transcriptase - quantitative PCR (RT-qPCR) was utilized to quantify HES1, HEY1, NOTCH1 and NOTCH2 gene expression in matched tumor and normal metaphyseal bone samples taken from dogs treated for appendicular OSA at the Colorado State University Veterinary Teaching Hospital. Gene expression was also assessed in tumors from dogs with a disease free interval (DFI) of <100 days compared to those with a DFI > 300 days following treatment with surgical amputation followed by standard chemotherapy. Immunohistochemistry was performed to confirm expression of HES1. Data from RT-qPCR and immunohistochemical (IHC) experiments were analyzed using REST2009 software and survival analysis based on IHC expression employed the Kaplan-Meier method and log rank analysis. Unbiased clustered images were generated from gene array analysis data for Notch/ HES1 associated genes. Gene array analysis of Notch/HES1 associated genes suggested alterations in the Notch signaling pathway may contribute to the development of canine OSA. HES1 mRNA expression was elevated in tumor samples relative to normal bone, but decreased in tumor samples from dogs with a DFI < 100 days relative to those with a DFI > 300 days. NOTCH2 and HEY1 mRNA expression was also elevated in tumors relative to normal bone, but was not differentially expressed between the DFI tumor groups. Survival analysis confirmed an association between decreased HES1 immunosignal and shorter DFI. Conclusions: Our findings suggest that activation of Notch signaling occurs and may contribute to the development of canine OSA. However, association of low HES1 expression and shorter DFI suggests that mechanisms that do not alter HES1 expression may drive the most aggressive tumors. Keywords: Hes-1, HES1, Notch, Osteosarcoma, RT-PCR, RT-qPCR, Immunohistochemistry, Canine, Microarray * Correspondence: [email protected] 1 The Flint Animal Cancer Center, College of Veterinary Medicine and Biomedical Sciences, Colorado State University, Fort Collins, CO, USA 2 Cell and Molecular Biology Graduate Program, Colorado State University, Fort Collins, CO, USA Full list of author information is available at the end of the article © 2013 Dailey et al.; licensee BioMed Central Ltd. This is an Open Access article distributed under the terms of the Creative Commons Attribution License (http://creativecommons.org/licenses/by/2.0), which permits unrestricted use, distribution, and reproduction in any medium, provided the original work is properly cited. Dailey et al. BMC Veterinary Research 2013, 9:130 http://www.biomedcentral.com/1746-6148/9/130
Transcript of HES1, a target of Notch signaling, is elevated in canine osteosarcoma, but reduced in the most...
Dailey et al. BMC Veterinary Research 2013, 9:130http://www.biomedcentral.com/1746-6148/9/130
RESEARCH ARTICLE Open Access
HES1, a target of Notch signaling, is elevated incanine osteosarcoma, but reduced in the mostaggressive tumorsDeanna D Dailey1,2, Kristin P Anfinsen3, Liza E Pfaff1,2, EJ Ehrhart1,2,4, J Brad Charles1,4, Tina B Bønsdorff3,Douglas H Thamm1,2,5, Barbara E Powers4, Thora J Jonasdottir3 and Dawn L Duval1,2,5,6*
Abstract
Background: Hairy and enhancer of split 1 (HES1), a basic helix-loop-helix transcriptional repressor, is a downstreamtarget of Notch signaling. Notch signaling and HES1 expression have been linked to growth and survival in avariety of human cancer types and have been associated with increased metastasis and invasiveness in humanosteosarcoma cell lines. Osteosarcoma (OSA) is an aggressive cancer demonstrating both high metastatic rate andchemotherapeutic resistance. The current study examined expression of Notch signaling mediators in primarycanine OSA tumors and canine and human osteosarcoma cell lines to assess their role in OSA development andprogression.
Results: Reverse transcriptase - quantitative PCR (RT-qPCR) was utilized to quantify HES1, HEY1, NOTCH1 andNOTCH2 gene expression in matched tumor and normal metaphyseal bone samples taken from dogs treated forappendicular OSA at the Colorado State University Veterinary Teaching Hospital. Gene expression was also assessedin tumors from dogs with a disease free interval (DFI) of <100 days compared to those with a DFI > 300 daysfollowing treatment with surgical amputation followed by standard chemotherapy. Immunohistochemistry wasperformed to confirm expression of HES1. Data from RT-qPCR and immunohistochemical (IHC) experiments wereanalyzed using REST2009 software and survival analysis based on IHC expression employed the Kaplan-Meiermethod and log rank analysis. Unbiased clustered images were generated from gene array analysis data for Notch/HES1 associated genes.Gene array analysis of Notch/HES1 associated genes suggested alterations in the Notch signaling pathway maycontribute to the development of canine OSA. HES1 mRNA expression was elevated in tumor samples relative tonormal bone, but decreased in tumor samples from dogs with a DFI < 100 days relative to those with a DFI >300 days. NOTCH2 and HEY1 mRNA expression was also elevated in tumors relative to normal bone, but was notdifferentially expressed between the DFI tumor groups. Survival analysis confirmed an association betweendecreased HES1 immunosignal and shorter DFI.
Conclusions: Our findings suggest that activation of Notch signaling occurs and may contribute to thedevelopment of canine OSA. However, association of low HES1 expression and shorter DFI suggests thatmechanisms that do not alter HES1 expression may drive the most aggressive tumors.
Keywords: Hes-1, HES1, Notch, Osteosarcoma, RT-PCR, RT-qPCR, Immunohistochemistry, Canine, Microarray
* Correspondence: [email protected] Flint Animal Cancer Center, College of Veterinary Medicine andBiomedical Sciences, Colorado State University, Fort Collins, CO, USA2Cell and Molecular Biology Graduate Program, Colorado State University,Fort Collins, CO, USAFull list of author information is available at the end of the article
© 2013 Dailey et al.; licensee BioMed Central Ltd. This is an Open Access article distributed under the terms of the CreativeCommons Attribution License (http://creativecommons.org/licenses/by/2.0), which permits unrestricted use, distribution, andreproduction in any medium, provided the original work is properly cited.
Dailey et al. BMC Veterinary Research 2013, 9:130 Page 2 of 14http://www.biomedcentral.com/1746-6148/9/130
BackgroundOsteosarcoma (OSA) is the most common malignantbone tumor among children and adolescents with an in-cidence of 4.4 cases per million per year in the UnitedStates [1]. OSA is also the most common spontaneousprimary bone tumor of dogs, estimated to affect greaterthan 8,000 dogs annually in the United States [2].Tumor morphology, biological behavior, progression ofdisease and molecular characteristics are very similar indogs and humans [2-7]. Consequently, dogs provide avaluable comparative model of human OSA. Standardof care therapy for both human and canine OSA pa-tients remains a combination of surgery and chemother-apy, with five-year survival rates reported in humans ashigh as 70% [1,8] and median survival in canine patientsaround 200 days [2]. Unfortunately, in both human andcanine patients approximately 80% are estimated tohave micrometastases at presentation, some of whosetumors are also refractory to chemotherapy [2,8]. Thesepatients continue to have a poor prognosis. Histologicclassification alone has not proven clinically relevant fordetermination of tumors likely to metastasize or exhibitresistance to chemotherapy protocols. The focus of re-cent research, therefore, has turned toward molecularcharacterization of primary tumors, especially aberrantgene and/or protein expression that might correlatewith prognosis or chemotherapy sensitivity.Hairy and enhancer of split 1 (HES1), a basic helix-loop-
helix (bHLH) transcriptional repressor, is a downstreamtarget of the Notch signaling pathway. The intracellulardomain of activated Notch receptors (NICD) translocatesto the nucleus, forms a transcriptional activating complexwith recombination signal binding protein for immuno-globulin kappa J region (RPBJκ) and activates expressionof target genes including HES1 [9,10]. The HES1 proteincontains both DNA-binding and protein-protein inter-action domains important for its function as a transcrip-tional regulator (including negative regulation of its owntranscription) [9,11,12]. Notch-independent HES1 expres-sion can also result from Hedgehog and c-Jun N-terminalkinase (JNK) signaling as well as from RAS/MAPK signal-ing [10,13-15]. Regulation of HES1 expression and activityis dependent on the tissue, spatial and temporal factors,and the proteins with which it interacts [9,10].Overexpression of Notch and/or HES1 is associated
with a variety of human cancers including T-cell acutelymphoblastic leukemia (ALL), and ovarian, breast, cer-vical, prostate, colon and non-small cell lung cancers[16-19]. Notch/HES1 has also been shown to have tumorsuppressor activity in some cancers including hepatocellu-lar carcinoma, B-cell ALL, myeloid leukemia and neuro-blastoma [20-23]. In human OSA, Notch is implicated inOSA cell proliferation, invasion and metastasis [24,25]. In-creased HES1 mRNA expression was shown in some
human OSA cells and OSA tumor samples compared toosteoblasts or normal bone and an association betweenhigh HES1 expression and decreased survival of OSApatients has been suggested [24-27]. Reduced invasive-ness in response to suppression of Notch signaling andHES1 activity implicates Notch/HES1 signaling in me-tastasis [28]. Another study suggests both up-regulationof Notch and increased expression of HES1 in one OSAcell line occurs in response to activation of the Wnt/β-catenin pathway [29].During bone development there is significant cross
talk between the Wnt/β-catenin, hedgehog, and Notchpathways affecting osteoblast differentiation and mat-uration and influencing HES1 expression [10,29-31].Like Notch and Wnt/β-catenin, aberrant hedgehog sig-naling is also associated with development of humancancers [31]. Previous studies in our lab identifieddecreased expression of three hedgehog pathway asso-ciated genes in OSA tumors from dogs with a diseasefree interval (DFI) < 100 days (poor-responders) com-pared with tumors from dogs with a DFI > 300 (good-responders) [32].In order to explore the hypothesis that Notch signaling
would be altered in canine OSA compared to normalbone samples, the current study examines the expressionof NOTCH1 and 2 receptors and signaling targets,HES1 and HEY1, in canine OSA samples from patientswith known outcome and normal bone tissues. Immuno-histochemical analysis of HES1 protein was assessed inKaplan-Meyer survival analysis to confirm the associ-ation of decreased HES1 expression with a shorter DFI.
MethodsTumor donorsChemotherapy-naïve primary tumor samples were se-lected from the Colorado State University (CSU) FlintAnimal Cancer Center’s tissue archive. Samples are ar-chived with owner consent and approval by the CSUInstitutional Animal Care and Use Committee. Twentytumors from good- and poor-responders (n = 10 eachgroup) were selected following the protocol previouslypublished [32]. Briefly, chemotherapy-naïve primary OSAsamples were from dogs treated with surgical amputationfollowed by chemotherapy with doxorubicin and/or a plat-inum based drug (distribution of choice of drug was notsignificantly different between groups). All twenty dogswere free of thoracic metastases by radiographic analysisat diagnosis and follow up consisted of evaluation by clin-ical examinations including thoracic radiographs every 2–3 months after initial treatment. Disease free interval(DFI) was calculated from surgery until development ofmetastatic disease and samples were identified for cohortsof good responders (DFI > 300 days) and poor responders(DFI < 100 days) in order to flank the median DFI

Dailey et al. BMC Veterinary Research 2013, 9:130 Page 3 of 14http://www.biomedcentral.com/1746-6148/9/130
(200 days). Nine additional appendicular OSA tumorsamples were collected from which matched normalmetaphyseal bone was harvested from the same limb (atleast one joint space away from the tumor) following am-putation. These nine matched samples were collected atamputation as cases came in (convenience sample) andabsence/presence of metastasis, post-operative treatment,and patient follow-up were less consistent in this popula-tion. Tumor and normal bone fragments collected atamputation were flash-frozen in liquid nitrogen and storedat -80°C. Tumor fragments were also fixed in 10% neutralbuffered formalin for 24 hours with subsequent routineprocessing and paraffin embedding.Immunohistochemical HES1 expression was also assessed
in a subset of canine appendicular OSA patients froma previously reported multi-institutional randomized pro-spective clinical trial [33]. The study was approved bythe Institutional Animal Care and Use Committees ofthe participating institutions. All dogs underwent am-putation followed by 5 cycles of adjuvant doxorubicin,with or without an investigational matrix metallopro-tease inhibitor. Inclusion/exclusion criteria, staging, andfollow-up procedures were standardized and tumortissues were processed as previously reported [33]. Histo-logic grading (from 1 to 3) was performed by one author(BEP) utilizing a schema incorporating amount of matrix,percent necrosis, nuclear pleomorphism, nucleolar size/number and mitosis score [33]. Mitotic index was calcu-lated by counting the number of mitotic figures per 10random 400× fields.
Cell cultureCanine cell lines used in this study were provided by Dr.Douglas Thamm; all cell lines were validated for speciesand genetic identity using short-tandem-repeat (STR) pro-filing as previously described [34]. Human OSA cell lineswere obtained from Dr. Douglas Thamm (MG63, SAOS-2,SJSA-1), Dr. Hue Luu (MG63.2), or purchased from ATCC(U2OS). The MG63.2 cell line is a metastatic sub-line ofthe MG63 line, obtained via serial passage of rare lung me-tastases from MG63 [35]. All non-purchased cell lines werevalidated prior to use using STR profiling by the Universityof Colorado DNA Sequencing Shared Resource. Cells werecultured in C10 media (DMEM high glucose with 4 mML-glutamine (Hyclone Laboratories, Inc.), 1 mM of sodiumpyruvate, 2× MEM vitamins, 1× MEM non-essential aminoacids, 1× antibiotic-antimycotic (100×: 10,000 IU/ml peni-cillin, 10,000 ug/ul streptomycin and 25ug/ml) (all additivesfrom Mediatech, Inc.), and 10% fetal bovine serum (FBS)(Atlas Biologicals, Fort Collins, CO).
RNA extractionTotal RNA was extracted from tumors and RT-qPCRwas conducted as described previously [32]. Briefly,
samples were freeze-fractured, homogenized, extractedwith Trizol reagent (Invitrogen, Carlsbad, CA) and puri-fied with RNeasy clean up (Quiagen, Valencia, CA) fol-lowing manufacturer’s protocols. RNA was extractedfrom normal bone using the same protocol with an add-itional spin of 800× g at 4°C for 5 minutes followinghomogenization. The supernatant was carried forwardthrough the Trizol protocol. Total RNA was extractedfrom human and canine OSA cells using the RNeasy Kit(Qiagen) per the manufacturer’s protocol. RNA wasquantified via spectrophotometry and bioanalyzed for in-tegrity as described in O’Donaghue et al. [32] with sam-ples used having a RNA integrity number of at least 8.Human adult osteoblast total RNA was purchased fromCELL Applications, Inc.
Reverse transcriptase PCR and quantitative real time PCRcDNA synthesis was completed using the QuantiTect Re-verse Transcription Kit (Qiagen) with 1 or 3 μg input RNA.RT-qPCR of cDNA was run using iQ SYBR GreenSupermix (Bio-Rad) and 25 ng equivalent RNA input in25 μL reactions on a Stratagene Mx3000P instrument.Expression in canine cells and tissues was normalized tohypoxanthine phosphoribosyltransferase 1 (HPRT1) expres-sion. HPRT1 was selected based on its consistent moderateexpression in our sample sets in prior microarray and RT-qPCR analysis (see Additional file 1 and reference [32]) andits previous use as a canine reference gene [36]. Consistentwith current recommendations for the selection of refer-ence genes and because no single reference gene exhibitedunchanged expression between samples, expression in hu-man OSA cells was normalized to the geometric mean offour reference genes; ribosomal protein S15 (RBS15),glyceraldehyde-3-dehydrogenase (GAPDH), 18S ribosomalRNA (18SrRNA) and HPRT1 [37]. Primer sequences andefficiencies for all genes and the full sequence of the canineHES1 amplicon are listed in Additional file 2. Primers weredesigned using Primer-Blast based upon NCBI RefSeqmRNA sequences when available. Primers were designed tobe intron spanning when possible and cross-checked forspecificity via UCSC in silico PCR. Primers were furthervalidated with standard curves to calculate efficiency, anddissociation curves as previously described [34]. RT-qPCRproducts were validated for size by agarose gel electrophor-esis and sequenced to confirm identity. The 161 bp canineHES1 amplicon revealed 98% homology to the humanhomolog of HES1. Human HES1 primers used were thesame as those used by Zhang et al. [24]. The identity of the200 bp amplicon was verified as human HES1 by dideoxysequencing (CSU DNA sequencing Core).
Western blotWestern blot analysis was performed on canine and hu-man OSA cells using whole cell lysates or cytoplasmic
Dailey et al. BMC Veterinary Research 2013, 9:130 Page 4 of 14http://www.biomedcentral.com/1746-6148/9/130
and nuclear fractions. Whole cell lysates were preparedin triethanolamine (TEA) lysis buffer (55 mM TEA,pH 7.5, 111 mM NaCl, and 2.2 mM EDTA, 0.44% SDS)with 1× Complete Protease Inhibitor Cocktail (RocheDiagnostics). Protein concentrations were determinedusing the bicinchoninic acid (BCA) protein assay(Thermo Scientific). Nuclear extracts were preparedusing a hypotonic 0.5% or 0.25% IgePal (NP-40) buffer(10 mM Hepes, 1.5 mM MgCl, and 10 mM KCl). Briefly,harvested cell pellets were re-suspended in IgePal bufferwith protease inhibitor while vortexing, incubated onice for 0–5 minutes, and centrifuged for 5 minutes at500× g. The supernatant (cytoplasmic fraction) wascollected and the pellet (nuclear fraction) was re-suspended in TEA lysis buffer with protease inhibitors.Samples were separated using SDS-PAGE and trans-ferred to a polyvinylidine fluoride membrane. Themembrane was blocked with 5% non-fat dry milk(NFDM) for one hour at room temperature and incu-bated with rabbit monoclonal anti-HES1 antibody(RabMAb EPR4226, 1:500; Epitomics) in 5% bovineserum albumin (BSA) at 4°C overnight. After washing in0.1% Tween 20-Tris-buffered saline (TBST) the mem-brane was incubated with secondary horseradish per-oxidase conjugated goat anti-rabbit antibody (1:5000;Bio-Rad) in 5% NFDM for one hour at room tem-perature. SuperSignal West Dura Extended DurationSubstrate (Pierce Biotechnology) was used to detectchemiluminescent signals. Band intensity from four ex-periments using whole cell lysates from MG63 andMG63.2 cell lines were analyzed using ImageJ software.The intensity of the HES1 band was normalized to thecorresponding α-tubulin loading control.
Immunohistochemistry (IHC)IHC to detect HES1 expression was performed on 4 μmsections from formalin-fixed paraffin embedded (FFPE)tumor tissues using standard immunoperoxidase tech-niques on charged slides with hematoxylin counter stain.Slides with sections were heated at 60°C for 30 minutes,allowed to cool, and deparaffinized with xylene or a citrusbased clearing solution (Thermo-Fisher Scientific), andrehydrated with descending ethanol concentrations in de-ionized water (100%, 95%, 75% and 50%). Heat inducedepitope retrieval was done with 10 mM sodium citratebuffer (pH 6.0) heated in a pressure cooker for 1 minuteat 125°C. Endogenous peroxidase activity was blockedwith 3% hydrogen peroxide at room temperature for 5 mi-nutes with 3 washes in TBST both before and after. Slideswere incubated with a non-serum protein block (Back-ground Sniper, Biocare Medical) at room temperature for15 minutes followed by incubation with primary antibodyovernight at 4°C overnight. The primary antibody (anti-HES1 RabMAb, Epitomics) was used at a dilution of 1:750
(diluted in Antibody Diluent, Dako). Sections were then in-cubated with a prediluted secondary antibody conjugatedto horseradish peroxidase (Envision and Dual Link SystemHRP, Dako) for 30 minutes at room temperature with 3TBST washes both before and after. Diaminobenzidine(DAB, Ventana Medical Systems) was used as a chromogenfor immunoreactive complex detection and slides werecounterstained with hematoxylin.Sixty-one additional FFPE tumor samples were ana-
lyzed for HES1 immunohistochemical expression utiliz-ing a protocol similar to that described above with thefollowing exceptions: primary antibody was diluted in2.5% normal goat serum in TBST (1:750 or 1:375, higherantibody concentration was used in subsequent batchesto increase immunoreactivity signal), and detection wasperformed using biotinylated anti-rabbit IgG antibody ina Vectastain ABC Kit (Vector Laboratories). The IHCwas performed in five batches of 8 to 18 slides each withthe same antibody dilution used for an entire batch. Var-iations in antibody dilutions were controlled for by in-clusion of a positive control tumor slide with a totalimmunoreactivity score of 4 (percent cells staining scoreof 2 and intensity score of 2; Table 1). All samples withineach batch were scored in reference to the control.Negative controls lacking primary antibody were in-cluded in each batch.HES1 antibody validation was done using human pla-
centa and canine lung and pancreas as positive controltissues. Specificity of the primary antibody was verifiedusing a HES1 blocking peptide (Epitomics). Briefly,primary antibody was incubated with 25× (by mass)blocking peptide in antibody diluents (at both 1:375 and1:750) for one hour at room temperature before applica-tion to canine control and sample tumor slides. Positiveand negative controls with sections from the same tis-sues were incubated in parallel.Immunohistochemical scoring of all slides was per-
formed independently by two authors blinded to case in-formation. A positive cell was any neoplastic cell withdistinct brown staining in the nucleus (stromal cells andendothelial cells were not counted). The percentage ofpositive cells in each sample was estimated based on anaverage of two or more high powered fields and scoredas follows, 1: < 50% cells stain positive, 2: 50-75% cellsstain positive, 3: > 75% cells stain positive. Average stainintensity ranged from 1 to 3 (lowest to highest intensity).Field location and number were selected randomly atthe discretion of the individual scorer. The product of thepercentage and intensity scores made up the overall im-munoreactivity score (ranging from 1 to 9). Both scorerssimultaneously reviewed slides with conflicting scores(scores deviating by more than 1 in either category) (n = 5)and consensus was reached. After review, total scores wereaveraged for statistical analyses.

Table 1 Summary of data for dogs with DFI > 300 and DFI < 100 days, including HES1 immunohistochemistry score
Breed Age at Dx (yrs) Sex Tumor Loc DFI (days) Avg% stain Avg stain intensity Total score
Greyhound 4.4 MC PH 40 1 1 1
Rottweiler 5 MC DF 69 3 3 9
Greyhound 7 MC DF 77 2 1 2
Mix 9 FS T 90 2 1 2
Greyhound 8 FS PT 94 1 2 2
Labrador 10.2 FS DH 95 3 3 9
Mix 8.8 MC DF 97 2 1 2
Golden 10.8 MC PH 97 2 1 2
Mix 7.6 FS DR 307 2 2 4
Greyhound 7.1 MC PH 467 1 1 1
Mix 12.4 MC DR 694 3 3 9
Malamute 10.1 FS DR 734 3 2 6
Labrador 8.7 MC T 787 3 3 9
Golden 8 FS DR 885 3 2 6
DFI disease free interval, Dx diagnosis, MC male castrated, FS female spayed, P proximal, D distal, H humerus, R radius, T tibia, Total Score is product of scores for% cells staining and staining intensity.
Dailey et al. BMC Veterinary Research 2013, 9:130 Page 5 of 14http://www.biomedcentral.com/1746-6148/9/130
Immunocytochemistry (ICC)Immunocytochemistry was performed utilizing the samereagents and a similar protocol to that used for IHC.Slides were prepared via cytospin and dried overnight.Prior to the blocking step cells were fixed with 100%methanol at room temperature for 15 minutes, allowedto dry, washed in TTBS and incubated in 0.1% TritonX-100 in TBS for 7–12 minutes. The remainder of the pro-cedure was identical to that used for IHC, but a higherconcentration of primary antibody (1:250) was used.Photomicrographs (IHC and ICC) were taken using
the Olympus BX51 Research System Microscope with anOlympus dp70 Digital Camera System. Minimal add-itional editing was done in Microsoft ® PowerPoint ® forMac 2011.
Gene expression microarray analysisTotal RNA from primary OSA tumor samples from dogswith DFI < 100 (n = 8) and DFI > 300 (n = 7) was analyzedon GeneChip Canine 2.0 Genome Arrays (Affymetrix,Santa Clara, CA) at CSU’s Rocky Mountain RegionalCenter for Excellence (RMRCE) Genomics Core perAffymetrix protocols as described [35]. Normal bone sam-ples (n = 8) were analyzed using an identical protocol.Samples used for microarray analysis were a subset ofthose used for RT-qPCR (microarray samples were limiteddue to array costs). Microarray pre-processing combiningthe osteosarcoma samples with the normal bone sampleswas conducted using Probe Logarithmic Intensity Error(PLIER) estimation algorithms with log2 transformations.Probesets including Notch receptor ligands, effectors, ortargets of either the canonical Notch pathway or HES1were selected based on literature review, Ingenuity®
Systems Pathway analysis, and/or inclusion in The HumanNotch Signaling Pathway RT2 Profiler™ PCR Array(SAbiosciences) (Additional file 1). CIMminer was used togenerate clustered images of the data from the 75 selectedprobesets with unsupervised clustering on both axes andthe following parameters: average linkage, Euclidean dis-tance, and quantile binning with median centering of thedata. Full microarray data for the DFI groups is availablethrough NCBI’s Gene Expression Omnibus (GEO) via ac-cession number GSE24251.
StatisticsStatistical analysis of RT-qPCR and immunohistochemis-try data (not including survival data) was performedusing Prism software (GraphPad Software, La Jolla, CA).For RT-qPCR data standard curves, dissociation curvesand amplification data was collected on a StratageneMx3000P instrument and analyzed using the Rest2009software [38]. HES1 RT-qPCR data was also analyzedusing the 2(−ΔΔCt) method [39] with similar results. IHCscores for the DFI > 300 and DFI < 100 tumors were ana-lyzed with a 2-tailed Fischer’s exact test after separatingscores into low expression (total score less than 4) andhigh expression (total score greater than or equal to 4)categories. The cut off was based on results of receiver-operating characteristic (ROC) analysis of immunohisto-chemical scores for the DFI > 300 and DFI < 100 groups.Welch t-test in ArrayTrack 3.5.0 with false discoveryrate correction for multiple comparisons (FDR; based onall array probesets) was used to compare microarraygene expression data. Significance was defined as p < 0.05(Welch t-test) or q < 0.05 (FDR).

Dailey et al. BMC Veterinary Research 2013, 9:130 Page 6 of 14http://www.biomedcentral.com/1746-6148/9/130
Statistical analysis of survival data was performedusing a combination of Prism and SPSS software version20 for Macintosh (IBM, Armonk, NY). Correlations be-tween HES1 expression levels and other markers on acontinuous scale were evaluated using linear regressionanalysis. A 2-tailed, unpaired t-test was used to evaluatethe association between HES1 expression levels and cat-egorical markers. The median DFI was estimated usingthe Kaplan-Meier method, and comparisons betweengroups made using log rank analysis for categorical vari-ables. For continuous variables, markers were catego-rized into a low and high group using the median valueas the break point. Multivariable Cox regression analysiswas then performed, utilizing both forward and back-ward stepwise models. Variables identified with a univar-iate p-value of <0.1 were included in the multivariateanalysis. For all other tests, p-values of <0.05 were con-sidered significant.
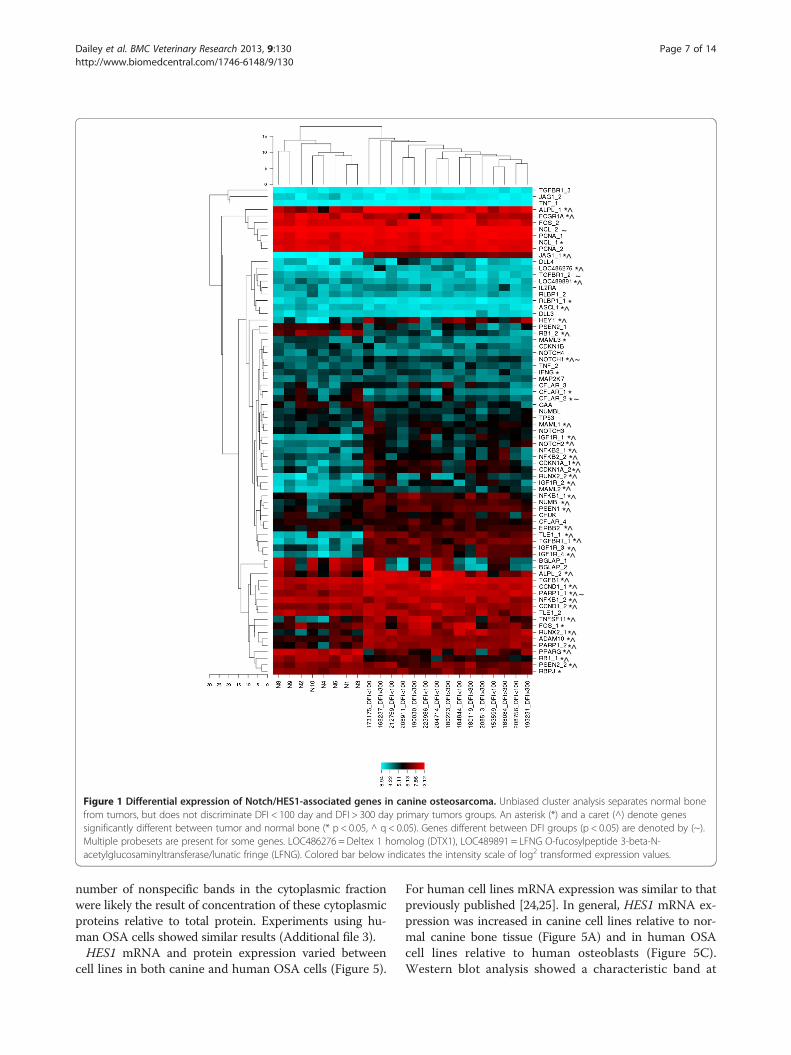
ResultsGene expression analysis of Notch/HES1-associated genesgroups normal and OSA bone samples, but does notdistinguish DFI groupsTo assess the biological relevance of Notch/HES1 signal-ing in canine osteosarcoma, probesets including Notchreceptor ligands, effectors, or targets of either the ca-nonical Notch pathway or HES1 were selected from Ca-nine 2.0 gene array data and analyzed for differentialgene expression as described in materials and methods.Unbiased cluster analysis of data for the 51 Notch/HES1-associated genes separated normal bone from tu-mors, but did not discriminate between the DFI groups(Figure 1). In total, 30 of 51 (58.8%) Notch/HES1 path-way associated genes examined were significantly differ-ent between tumor and normal bone (p < 0.05, q < 0.05);23/30 (76.7%) had increased expression in tumors. Spe-cifically, mRNA expression of NOTCH1 and NOTCH2was elevated in tumor samples compared to normalbone (p < 0.05, q < 0.05). None of the genes evaluatedhad significantly different expression between DFIgroups when corrected for multiple comparisons. HES1was not included on the Canine 2.0 chip, but HEY1, an-other Notch target, was also elevated in tumors com-pared to normal bone (p < 0.05, q < 0.05).RT-qPCR analysis for NOTCH1, NOTCH2, HEY1 and
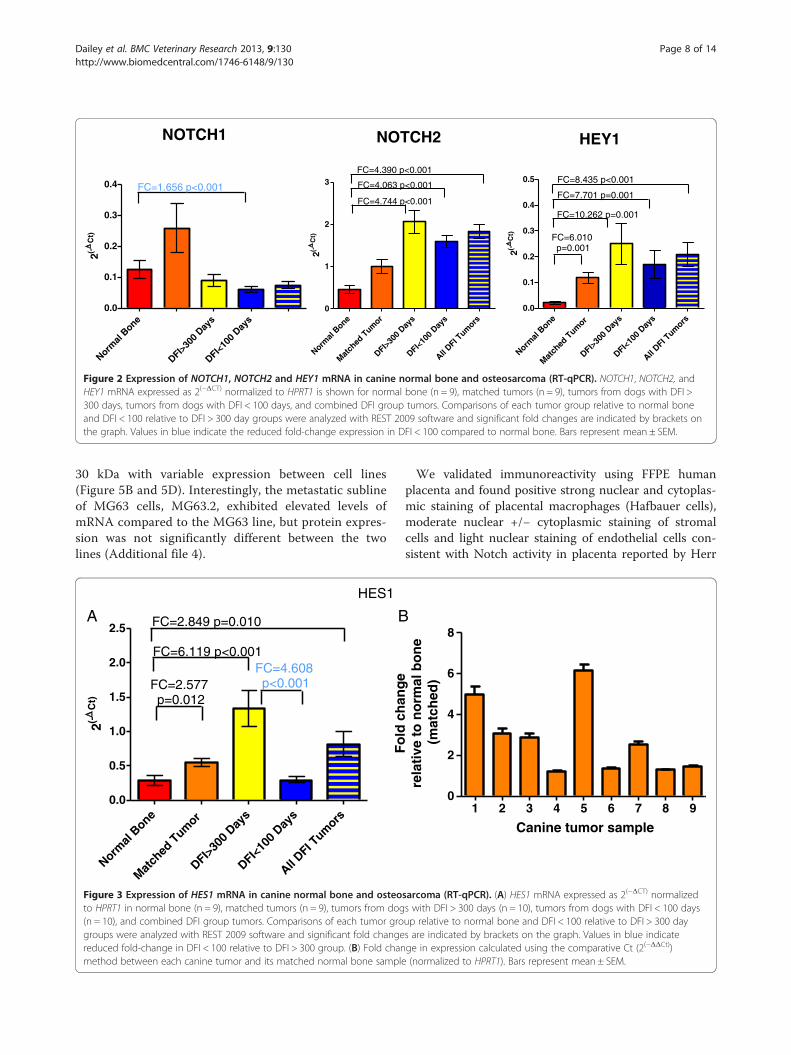
HES1 was conducted on the normal bone/matched OSAand DFI tumor sample sets (Figures 2 and 3). NOTCH1exhibited decreased expression in the DFI < 100 daygroup relative to normal bone (FC down – 1.656,p < 0.001), with no other significant changes measured.This result differed from the 1.27 fold upregulation ofNOTCH1 identified in the gene array analysis, however pre-vious studies have shown that fold-change differences <1.5are frequently unreliable [40]. Consistent with the array
data, NOTCH2 exhibited an approximate 4-fold elevationin expression in both sets of DFI tumors, separately and incombination, relative to normal bone (p < 0.001). Similarly,HEY1 expression was elevated in each tumor group by afold-change ranging from 6 to 10.2 (p ≤ 0.001). RT-qPCRanalysis of these Notch signaling pathway elements con-firmed our finding that Notch signaling is elevated in tu-mors relative to normal bone, but not between tumors inthe two DFI groups.
HES1 mRNA expression in tumors and its prognosticsignificanceRT-qPCR was also used to assess HES1 mRNA levels inOSA tumor and matched normal bone samples. AverageHES1 mRNA expression was elevated 2.57-fold in canineOSA tumors compared to the matched normal bone(Figure 3A; p = 0.012); however, this fold change washighly variable when each OSA tumor was comparedto its matched normal bone sample, with 5 tumorsexhibiting elevated expression compared to normal boneand 4 tumors having virtually unchanged expression(Figure 3B, range 1.19-6.17-fold).We also assessed mRNA levels for HES1 in tumors
taken from dogs with a DFI <100 days or DFI >300 daysfollowing treatment by amputation and chemotherapy.We found that HES1 expression was elevated 4.608-foldin the DFI > 300 tumors compared to the DFI < 100group (Figure 3A; p < 0.001). HES1 expression in theDFI < 100 group was not different from the normal bonesamples.Messenger RNA levels of HES1 were measured in ca-
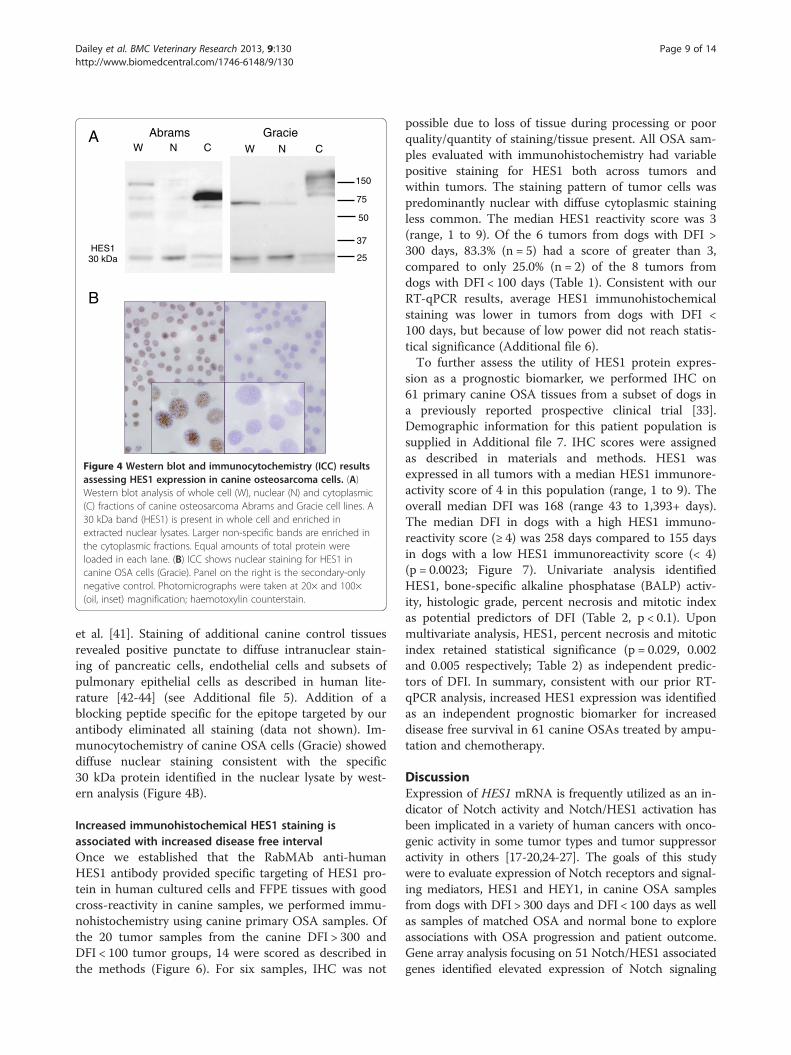
nine and human osteosarcoma cell lines and confirmedusing Western blot analysis using a rabbit monoclonalanti-human HES1 antibody as described to determine ifHES1 mRNA levels correlated to protein expression,(Figures 4 and 5, Additional file 3). Comparison of ca-nine and human amino acid sequence of the HES1 geneidentified 86% homology in the epitope targeted by thisantibody. This was based on the predicted amino acidsequence of NCBI reference sequence XM_548669.1,which has been removed as a result of standard genomeannotation processing. No additional canine HES1 rec-ord is currently available. Western blot analysis of wholecell OSA cell lysates revealed a 30 kD protein (HES1) aswell as larger non-specific bands (Figure 4A, W). Giventhe role of HES1 as a transcriptional regulator, we hy-pothesized that active HES1 protein would reside in thenucleus. Western blot analysis of isolated nuclear andcytoplasmic fractions from both canine and human OSAcell lines confirmed enrichment of the 30 kD HES-1protein in the nuclear fraction (Figure 4A, N) while thenon-specific bands were enriched in the cytoplasm frac-tion (Figure 4A, C). Since equal amounts of total proteinwere loaded in each lane, the increased intensity and/or
*^
*^
*^
*^
*^ *^
*^
*^
*^
*^
*^
*^
*^
*^
*^
*^
*^
*^
*^
*^
*^ *^
*^
*^
*^
*^
*^
*^
*^
*^
*^
*^
*^
*^
*^
*^
*^
*^
*^
*^
*
*
*
*
*
*
*
*
~
~
~
~
~
Figure 1 Differential expression of Notch/HES1-associated genes in canine osteosarcoma. Unbiased cluster analysis separates normal bonefrom tumors, but does not discriminate DFI < 100 day and DFI > 300 day primary tumors groups. An asterisk (*) and a caret (^) denote genessignificantly different between tumor and normal bone (* p < 0.05, ^ q < 0.05). Genes different between DFI groups (p < 0.05) are denoted by (~).Multiple probesets are present for some genes. LOC486276 = Deltex 1 homolog (DTX1), LOC489891 = LFNG O-fucosylpeptide 3-beta-N-acetylglucosaminyltransferase/lunatic fringe (LFNG). Colored bar below indicates the intensity scale of log2 transformed expression values.
Dailey et al. BMC Veterinary Research 2013, 9:130 Page 7 of 14http://www.biomedcentral.com/1746-6148/9/130
number of nonspecific bands in the cytoplasmic fractionwere likely the result of concentration of these cytoplasmicproteins relative to total protein. Experiments using hu-man OSA cells showed similar results (Additional file 3).HES1 mRNA and protein expression varied between
cell lines in both canine and human OSA cells (Figure 5).
For human cell lines mRNA expression was similar to thatpreviously published [24,25]. In general, HES1 mRNA ex-pression was increased in canine cell lines relative to nor-mal canine bone tissue (Figure 5A) and in human OSAcell lines relative to human osteoblasts (Figure 5C).Western blot analysis showed a characteristic band at
NOTCH1 NOTCH2 HEY1
Normal
Bone
DFI>30
0 Day
s
DFI<10
0 Day
s0.0
0.1
0.2
0.3
0.4 FC=1.656 p<0.001
2(-C
t)
Normal
Bone
Match
ed T
umor
DFI>30
0 Day
s
DFI<10
0 Day
s
All DFI T
umors
0.0
0.1
0.2
0.3
0.4
0.5
FC=6.010 p=0.001
FC=8.435 p<0.001
FC=7.701 p=0.001
FC=10.262 p=0.001
2(-C
t)
Normal
Bone
Match
ed T
umor
DFI>30
0 Day
s
DFI<10
0 Day
s
All DFI T
umors
0
1
2
3FC=4.390 p<0.001
FC=4.063 p<0.001
FC=4.744 p<0.001
2(-C
t)
Figure 2 Expression of NOTCH1, NOTCH2 and HEY1 mRNA in canine normal bone and osteosarcoma (RT-qPCR). NOTCH1, NOTCH2, andHEY1 mRNA expressed as 2(−ΔCT) normalized to HPRT1 is shown for normal bone (n = 9), matched tumors (n = 9), tumors from dogs with DFI >300 days, tumors from dogs with DFI < 100 days, and combined DFI group tumors. Comparisons of each tumor group relative to normal boneand DFI < 100 relative to DFI > 300 day groups were analyzed with REST 2009 software and significant fold changes are indicated by brackets onthe graph. Values in blue indicate the reduced fold-change expression in DFI < 100 compared to normal bone. Bars represent mean ± SEM.
Dailey et al. BMC Veterinary Research 2013, 9:130 Page 8 of 14http://www.biomedcentral.com/1746-6148/9/130
30 kDa with variable expression between cell lines(Figure 5B and 5D). Interestingly, the metastatic sublineof MG63 cells, MG63.2, exhibited elevated levels ofmRNA compared to the MG63 line, but protein expres-sion was not significantly different between the twolines (Additional file 4).
A B
Normal
Bone
Match
ed T
umor
DFI>30
0 Day
s
DFI<10
0 Day
s
All DFI T
umors
0.0
0.5
1.0
1.5
2.0
2.5 FC=2.849 p=0.010
FC=2.577 p=0.012
FC=4.608 p<0.001
FC=6.119 p<0.001
2(-C
t)
HES1
Figure 3 Expression of HES1 mRNA in canine normal bone and osteoto HPRT1 in normal bone (n = 9), matched tumors (n = 9), tumors from dog(n = 10), and combined DFI group tumors. Comparisons of each tumor grogroups were analyzed with REST 2009 software and significant fold changereduced fold-change in DFI < 100 relative to DFI > 300 group. (B) Fold chanmethod between each canine tumor and its matched normal bone sample
We validated immunoreactivity using FFPE humanplacenta and found positive strong nuclear and cytoplas-mic staining of placental macrophages (Hafbauer cells),moderate nuclear +/− cytoplasmic staining of stromalcells and light nuclear staining of endothelial cells con-sistent with Notch activity in placenta reported by Herr
1 2 3 4 5 6 7 8 90
2
4
6
8
Canine tumor sample
Fo
ld c
han
ge
rela
tive
to
no
rmal
bo
ne
(m
atch
ed)
sarcoma (RT-qPCR). (A) HES1 mRNA expressed as 2(−ΔCT) normalizeds with DFI > 300 days (n = 10), tumors from dogs with DFI < 100 daysup relative to normal bone and DFI < 100 relative to DFI > 300 days are indicated by brackets on the graph. Values in blue indicatege in expression calculated using the comparative Ct (2(−ΔΔCt))(normalized to HPRT1). Bars represent mean ± SEM.
Abrams Gracie W N C W N C
HES1 30 kDa
150
75
50
37
25
A
B
Figure 4 Western blot and immunocytochemistry (ICC) resultsassessing HES1 expression in canine osteosarcoma cells. (A)Western blot analysis of whole cell (W), nuclear (N) and cytoplasmic(C) fractions of canine osteosarcoma Abrams and Gracie cell lines. A30 kDa band (HES1) is present in whole cell and enriched inextracted nuclear lysates. Larger non-specific bands are enriched inthe cytoplasmic fractions. Equal amounts of total protein wereloaded in each lane. (B) ICC shows nuclear staining for HES1 incanine OSA cells (Gracie). Panel on the right is the secondary-onlynegative control. Photomicrographs were taken at 20× and 100×(oil, inset) magnification; haemotoxylin counterstain.
Dailey et al. BMC Veterinary Research 2013, 9:130 Page 9 of 14http://www.biomedcentral.com/1746-6148/9/130
et al. [41]. Staining of additional canine control tissuesrevealed positive punctate to diffuse intranuclear stain-ing of pancreatic cells, endothelial cells and subsets ofpulmonary epithelial cells as described in human lite-rature [42-44] (see Additional file 5). Addition of ablocking peptide specific for the epitope targeted by ourantibody eliminated all staining (data not shown). Im-munocytochemistry of canine OSA cells (Gracie) showeddiffuse nuclear staining consistent with the specific30 kDa protein identified in the nuclear lysate by west-ern analysis (Figure 4B).
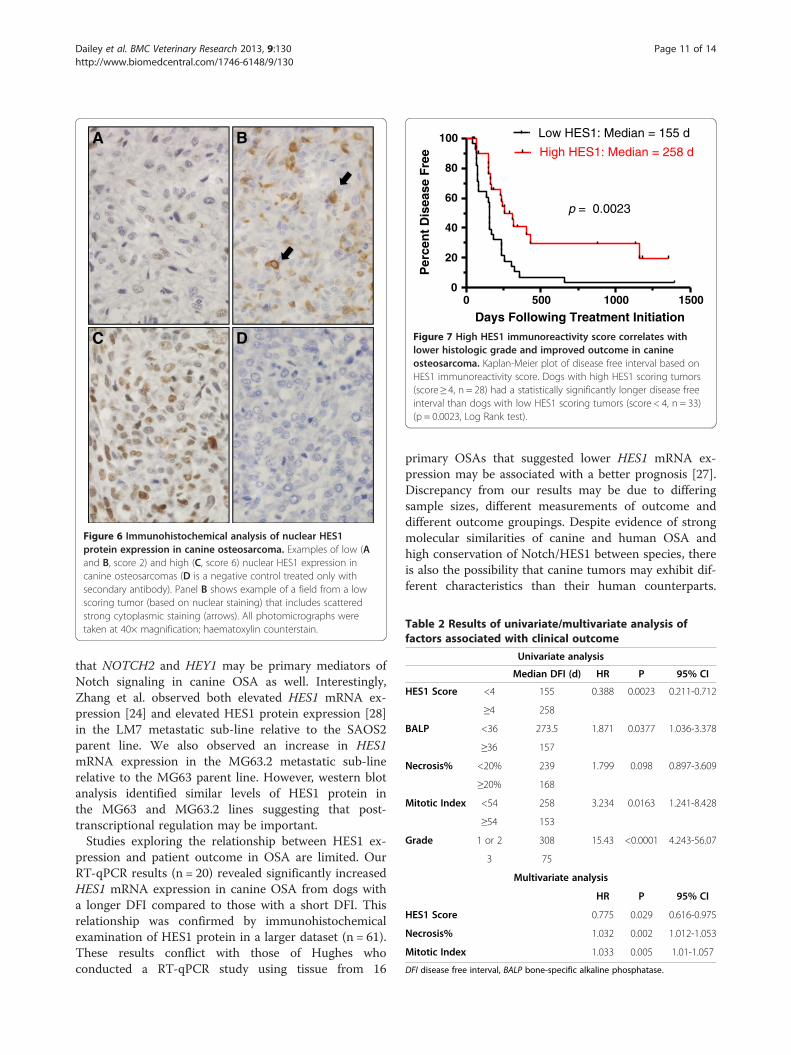
Increased immunohistochemical HES1 staining isassociated with increased disease free intervalOnce we established that the RabMAb anti-humanHES1 antibody provided specific targeting of HES1 pro-tein in human cultured cells and FFPE tissues with goodcross-reactivity in canine samples, we performed immu-nohistochemistry using canine primary OSA samples. Ofthe 20 tumor samples from the canine DFI > 300 andDFI < 100 tumor groups, 14 were scored as described inthe methods (Figure 6). For six samples, IHC was not
possible due to loss of tissue during processing or poorquality/quantity of staining/tissue present. All OSA sam-ples evaluated with immunohistochemistry had variablepositive staining for HES1 both across tumors andwithin tumors. The staining pattern of tumor cells waspredominantly nuclear with diffuse cytoplasmic stainingless common. The median HES1 reactivity score was 3(range, 1 to 9). Of the 6 tumors from dogs with DFI >300 days, 83.3% (n = 5) had a score of greater than 3,compared to only 25.0% (n = 2) of the 8 tumors fromdogs with DFI < 100 days (Table 1). Consistent with ourRT-qPCR results, average HES1 immunohistochemicalstaining was lower in tumors from dogs with DFI <100 days, but because of low power did not reach statis-tical significance (Additional file 6).To further assess the utility of HES1 protein expres-
sion as a prognostic biomarker, we performed IHC on61 primary canine OSA tissues from a subset of dogs ina previously reported prospective clinical trial [33].Demographic information for this patient population issupplied in Additional file 7. IHC scores were assignedas described in materials and methods. HES1 wasexpressed in all tumors with a median HES1 immunore-activity score of 4 in this population (range, 1 to 9). Theoverall median DFI was 168 (range 43 to 1,393+ days).The median DFI in dogs with a high HES1 immuno-reactivity score (≥ 4) was 258 days compared to 155 daysin dogs with a low HES1 immunoreactivity score (< 4)(p = 0.0023; Figure 7). Univariate analysis identifiedHES1, bone-specific alkaline phosphatase (BALP) activ-ity, histologic grade, percent necrosis and mitotic indexas potential predictors of DFI (Table 2, p < 0.1). Uponmultivariate analysis, HES1, percent necrosis and mitoticindex retained statistical significance (p = 0.029, 0.002and 0.005 respectively; Table 2) as independent predic-tors of DFI. In summary, consistent with our prior RT-qPCR analysis, increased HES1 expression was identifiedas an independent prognostic biomarker for increaseddisease free survival in 61 canine OSAs treated by ampu-tation and chemotherapy.
DiscussionExpression of HES1 mRNA is frequently utilized as an in-dicator of Notch activity and Notch/HES1 activation hasbeen implicated in a variety of human cancers with onco-genic activity in some tumor types and tumor suppressoractivity in others [17-20,24-27]. The goals of this studywere to evaluate expression of Notch receptors and signal-ing mediators, HES1 and HEY1, in canine OSA samplesfrom dogs with DFI > 300 days and DFI < 100 days as wellas samples of matched OSA and normal bone to exploreassociations with OSA progression and patient outcome.Gene array analysis focusing on 51 Notch/HES1 associatedgenes identified elevated expression of Notch signaling

NB
Abram
s D17
Gracie
Mckin
ley
Moresc
o
Vogel
Yaman
e0.0
0.2
0.4
0.6
0.8
1.0
***
***
******2(-
Ct)
hOb
MG63
MG63.2
Saos2
SJSA-1
U2OS
0.000
0.002
0.004
0.006
0.008
0.010
***
*** ***
***
2(-C
t)
HES1A B
C D
Figure 5 Expression of HES1 mRNA and protein in human osteosarcoma cell lines. HES1 mRNA in canine OSA cell lines and normal caninebone tissue (NB) expressed as 2(−ΔCT) normalized to HPRT1 (A). HES1 mRNA in human OSA cell lines and normal human osteoblasts expressed as2(−ΔCT) normalized to the geometric mean of RBS15, GAPDH, 18SrRNA, and HPRT1 (C). Data are graphed as mean ± SEM, *** P < 0.001, ** P < 0.01,Two-way ANOVA with Dunnett’s Multiple Comparison Test. (B and D) Western blot shows characteristic distinct HES1 band at 30 kDa. Blot wasstripped and re-probed with an antibody against α-tubulin to serve as a protein loading control.
Dailey et al. BMC Veterinary Research 2013, 9:130 Page 10 of 14http://www.biomedcentral.com/1746-6148/9/130
mediators in tumors relative to normal bone. We con-firmed a statistically significant elevation of NOTCH2,HEY1, and HES1 mRNA expression in OSA when com-pared with normal bone. Interestingly, we did not find ele-vated HES1 expression in the most aggressive OSA whencomparing good and poor responders, but instead identi-fied a statistically significant association between highHES1 mRNA and protein expression and longer DFI fol-lowing standard treatment. Further, the gene array analysisof Notch/HES1 associated genes and RT-qPCR analysis ofNOTCH1, NOTCH2 and HEY1 showed no significant dif-ferences in expression between the DFI groups. Overall,our findings indicate that alterations in Notch signalingoccur during the development of canine OSA, but mecha-nisms that do not alter HES1 expression may drive themost aggressive tumors.The oncogenic role of Notch signaling in OSA in
humans is supported by previous studies [24-26]; how-ever, the specific role of HES1 is less clear. A commonfinding regarding HES1 expression between these previ-ous studies and ours is the variability of expressionwithin human and canine OSA cells and tumors (pleasenote for references 24 and 28, that data from experi-ments done using the OS187 or COL cell lines shouldbe viewed with caution due to a recent disclosure thatthese cells are not OSA cells) [24-26,28]. For example,
HES1 mRNA expression in tumors relative to normalbone was elevated in 5 of 9 canine tumors relative tomatched normal bone samples in our study (Figure 3B)and 6 of 10 human tumors in the Tanaka study [25].There is also disagreement among studies as to whichNotch receptors and target genes are functionally signifi-cant in OSA. Zhang et al. provided evidence that in-creased Notch1 activity and Notch1-induced expressionof HES1 specifically are associated with invasion andmetastasis in two OSA cell lines, the low HES1 express-ing SAOS2 parental line and the metastatic, high HES1expressing LM7 sub-line [24]. Inhibition of Notch sig-naling by a gamma-secretase inhibitor suppressed LM7OSA cell invasion, but had no effect on proliferation ortumorigenesis; whereas induced expression of intracellu-lar cleaved Notch1 (ICN1) or HES1 in the SAOS2 lineincreased invasiveness. Tanaka et al. identified elevationsof NOTCH2 and HEY1 mRNA in human OSA biopsyspecimens relative to normal bone, but NOTCH1 andHES1 mRNA expression was not consistently elevated.In the same study, treatment of OSA cells and tumorsgrown in nude mice with a gamma-secretase inhibitorreduced proliferation through a G1 block [25]. Differingresults in these two studies may be due to different sam-ples studied (tumor vs. cells) and/or the use of differentgamma-secretase inhibitors. Our RT-qPCR data suggests
A B
C D
Figure 6 Immunohistochemical analysis of nuclear HES1protein expression in canine osteosarcoma. Examples of low (Aand B, score 2) and high (C, score 6) nuclear HES1 expression incanine osteosarcomas (D is a negative control treated only withsecondary antibody). Panel B shows example of a field from a lowscoring tumor (based on nuclear staining) that includes scatteredstrong cytoplasmic staining (arrows). All photomicrographs weretaken at 40× magnification; haematoxylin counterstain.
0 500 1000 15000
20
40
60
80
100 Low HES1: Median = 155 d
High HES1: Median = 258 d
p = 0.0023
Days Following Treatment Initiation
Per
cen
t D
isea
se F
ree
Figure 7 High HES1 immunoreactivity score correlates withlower histologic grade and improved outcome in canineosteosarcoma. Kaplan-Meier plot of disease free interval based onHES1 immunoreactivity score. Dogs with high HES1 scoring tumors(score ≥ 4, n = 28) had a statistically significantly longer disease freeinterval than dogs with low HES1 scoring tumors (score < 4, n = 33)(p = 0.0023, Log Rank test).
Table 2 Results of univariate/multivariate analysis offactors associated with clinical outcome
Univariate analysis
Median DFI (d) HR P 95% CI
HES1 Score <4 155 0.388 0.0023 0.211-0.712
≥4 258
BALP <36 273.5 1.871 0.0377 1.036-3.378
≥36 157
Necrosis% <20% 239 1.799 0.098 0.897-3.609
≥20% 168
Mitotic Index <54 258 3.234 0.0163 1.241-8.428
≥54 153
Grade 1 or 2 308 15.43 <0.0001 4.243-56.07
3 75
Multivariate analysis
HR P 95% CI
HES1 Score 0.775 0.029 0.616-0.975
Necrosis% 1.032 0.002 1.012-1.053
Mitotic Index 1.033 0.005 1.01-1.057
DFI disease free interval, BALP bone-specific alkaline phosphatase.
Dailey et al. BMC Veterinary Research 2013, 9:130 Page 11 of 14http://www.biomedcentral.com/1746-6148/9/130
that NOTCH2 and HEY1 may be primary mediators ofNotch signaling in canine OSA as well. Interestingly,Zhang et al. observed both elevated HES1 mRNA ex-pression [24] and elevated HES1 protein expression [28]in the LM7 metastatic sub-line relative to the SAOS2parent line. We also observed an increase in HES1mRNA expression in the MG63.2 metastatic sub-linerelative to the MG63 parent line. However, western blotanalysis identified similar levels of HES1 protein inthe MG63 and MG63.2 lines suggesting that post-transcriptional regulation may be important.Studies exploring the relationship between HES1 ex-
pression and patient outcome in OSA are limited. OurRT-qPCR results (n = 20) revealed significantly increasedHES1 mRNA expression in canine OSA from dogs witha longer DFI compared to those with a short DFI. Thisrelationship was confirmed by immunohistochemicalexamination of HES1 protein in a larger dataset (n = 61).These results conflict with those of Hughes whoconducted a RT-qPCR study using tissue from 16
primary OSAs that suggested lower HES1 mRNA ex-pression may be associated with a better prognosis [27].Discrepancy from our results may be due to differingsample sizes, different measurements of outcome anddifferent outcome groupings. Despite evidence of strongmolecular similarities of canine and human OSA andhigh conservation of Notch/HES1 between species, thereis also the possibility that canine tumors may exhibit dif-ferent characteristics than their human counterparts.
Dailey et al. BMC Veterinary Research 2013, 9:130 Page 12 of 14http://www.biomedcentral.com/1746-6148/9/130
Until similar studies to evaluate nuclear immunoreactiv-ity as a measure of protein expression are carried out inhuman tumors, no firm conclusions regarding possibledifferences in canine and human OSA with respect toHES1 expression can be made.Previous studies examining HES1 expression in other
cancers or during development provide candidate mech-anisms for reduced HES1 expression in the presence ofelevated Notch signaling: uncoupling of HES1 fromNotch signaling, cell cycle regulation of HES1 expres-sion, and post-transcriptional regulation. HES1 expres-sion has been reported to be uncoupled from Notchsignaling in Ewing’s sarcoma [15] and stimulation ofHES1 transcription by sonic hedgehog (Shh) pathwayoccurs in mesodermal and neural stem cells [6 – 8].Using RT-qPCR analysis, we identified significantly de-creased SMO mRNA expression (p < 0.05) in the DFI <100 tumors compared to the DFI > 300 tumors [32]suggesting that reduced HES1 expression in aggressivecanine OSA might reflect a loss of Shh signaling. HES1expression oscillations are both observed and necessaryfor cell cycle progression during neuronal development[45]; aggressive OSA tumor cells may utilize HES1 oscil-latory patterns to manipulate the cell cycle and optimizetheir ability to metastasize and/or resist chemotherapy.Finally, several miRNAs have been shown to regulateHES1 (miR-124 and miR-23b) [46,47] and may contrib-ute to altered HES1 expression in OSA cells and tumors.In addition, HES1 protein may exhibit specific func-
tions depending on its phosphorylation status and bind-ing partners. Kannan et. al. found that interactions withHES1 stimulates PARP1 activation and cleavage, ultim-ately resulting in apoptosis in B-ALL (overall a tumorsuppressor role for HES1) [20]. Further, in neuronal de-velopment, Ju et al. showed that HES1 interactions withphosphorylated PARP1 released HES1 from the HES1/groucho/TLE repressor complex and, upon HES1 phos-phorylation, led to association with a co-activator com-plex, changing the role of HES1 from a transcriptionalrepressor to a transcriptional activator [48]. In bone de-velopment, via inhibition of RUNX2, Notch activitymaintains a population of committed osteoblast precur-sors [49,50]. Interestingly, several studies also show thatHES1 binding stabilizes and activates RUNX2 protein;thus, HES1 has been shown to both inhibit and enhancethe activity of RUNX2 [49,51]. Additional studies explor-ing the phosphorylation status and binding partners ofHES1 may provide a better understanding of these inter-actions in OSA.
ConclusionsThe results of the current study support the associationof Notch pathway activation with the proliferative re-sponse of OSA. However, reduced HES1 expression in
the most aggressive tumors despite the elevated expres-sion of other Notch signaling effectors and targets indi-cates that HES1 is not an ideal sole surrogate marker ofNotch signaling. Further, these findings suggest that add-itional mechanisms beyond Notch signaling may con-tribute to the aggressive phenotype of these tumors.Studies to define the role of Notch signaling in OSAs iswarranted as inhibitors for this and other developmentalpathways that impinge on HES1 are currently in clinicaltrials for the treatment of a variety of human cancers(summarized in Sang et al.) [52]. Research in this areamay reveal important regulatory mechanisms contribut-ing to metastasis and therapeutic resistance in bothcanine and human OSA. While we found that HES1 ex-pression was not consistently linked to Notch signalingin canine OSA, our study has determined that reducedHES1 expression serves as an independent prognosticbiomarker.
Additional files
Additional file 1: Affymetrix Canine 2.0 microarray data processedwith PLIER algorithm. Selected Notch signaling pathway genes fromAffymetrix Canine 2.0 microarray data including both previouslypublished [35] and unpublished data (normal bone).
Additional file 2: Sequences, amplicon sizes, and efficiencies ofprimer pairs used in RT-qPCR experiments.
Additional file 3: Western blot of MG63.2 and U20S whole cell,nuclear and cytosolic fractions for HES1. A distinct band at 30 kDa ispresent in both MG63.2 and U2OS human OSA whole cell (W) and isenriched in nuclear extract (N) lysates. Larger non-specific bandspredominate in the cytoplasmic fraction (C). Equal amounts of totalprotein were loaded in each lane.
Additional file 4: HES1 protein expression is not significantlydifferent between MG63 and MG63.2 cell lines. HES1 band intensitynormalized to α-tubulin loading control. Bars represent mean +/−standard deviation from four independent experiments. Standardunpaired 2-tailed t-test was used to compare mean HES1 band intensityratios for MG63 and MG63.2 Western blot.
Additional file 5: HES1 immunohistochemistry of control caninetissues. Variably intense nuclear staining is present in bronchiolarepithelial cells (A) and in both exocrine and endocrine (islets cells, bluecircle) pancreatic cells (C). B and D are the negative controls. Allphotomicrographs were taken at 40× magnification; haematoxylincounterstain.
Additional file 6: HES1 immunoreactivity in canine osteosarcomasfrom DFI < 100 and >300 groups. Immunoreactivity scores of nuclearHES1 protein expression in tumor sections from DFI < 100 day (filledcircles, n = 8) and DFI > 300 day (filled squares, n = 6) groups. Horizontalline and error bars are mean ± SEM (p = 0.1026).
Additional file 7: Summary demographic data for 61 caninepatients from a previously reported clinical trial [33].
Competing interestsThe authors declare that they have no competing interests.
Authors’ contributionsDDD carried out all mRNA and protein expression experiments (unlessotherwise noted), scored IHC samples, analyzed data, performed statisticalanalyses (except for survival and regression analyses) and drafted themanuscript. KPA contributed to study design and carried out HES1 RT-qPCRfor the DFI group tumors. LEP carried out sample preparation (RNA
Dailey et al. BMC Veterinary Research 2013, 9:130 Page 13 of 14http://www.biomedcentral.com/1746-6148/9/130
extraction from canine tissues and sectioning of FFPE canine tissues for IHC)and taught DDD and KPA RT-qPCR methodology including analysis of data.EJE provided guidance to DDD and JBC for IHC/ICC optimization andscoring. JBC assisted DDD with IHC and ICC optimization and scored IHCsamples. TBB designed canine HES1 primers. DHT performed survival andregression statistical analyses. BEP graded histologic samples from the largerpatient population. TJJ contributed to study design and provided canineHES1 primers. DLD conceived of the study design with TJJ, providedguidance and coordination for all experiments, and helped to draft themanuscript. All authors read and approved the final manuscript.
AcknowledgementsWe acknowledge Brian Kalet for extraction of RNA and protein lysates fromhuman OSA cells as well as assistance troubleshooting various labtechniques and Todd Bass for technical advice/assistance for obtainingunstained tissue sections for IHC. This work was supported by grants to DLDfrom the Morris Animal Foundation (MAF D08CA-053). DDD was supportedby NIH 9T32OD010437-11. KPA was supported by the Committee ofResearch and Ethics at the Norwegian School of Veterinary Science.
Author details1The Flint Animal Cancer Center, College of Veterinary Medicine andBiomedical Sciences, Colorado State University, Fort Collins, CO, USA. 2Celland Molecular Biology Graduate Program, Colorado State University, FortCollins, CO, USA. 3Department of Companion Animal Clinical Sciences,Norwegian School of Veterinary Science, P.O. Box 8416 Dep., NO-0033, Oslo,Norway. 4Department of Microbiology, Immunology and Pathology, Collegeof Veterinary Medicine and Biomedical Sciences, Colorado State University,Fort Collins, CO, USA. 5University of Colorado Comprehensive Cancer Center,Aurora, CO, USA. 6Department of Clinical Sciences, Animal Cancer Center,Colorado State University, 300 West Drake Road, Fort Collins, CO80523-1620, USA.
Received: 23 August 2012 Accepted: 24 June 2013Published: 1 July 2013
References1. Mirabello L, Troisi RJ, Savage SA: Osteosarcoma incidence and survival
rates from 1973 to 2004: data from the Surveillance, Epidemiology, andEnd Results Program. Cancer 2009, 115(7):1531–1543.
2. Dernell WS, Ehrhart NP, Straw RC, Vail DM: Tumors of the Skeletal System.In Withrow & MacEwen's Small Animal Clinical Oncology. 4th edition. St.Louis, Mo: Saunders Elsevier; 2007:540–567.
3. Mueller F, Fuchs B, Kaser-Hotz B: Comparative biology of human andcanine osteosarcoma. Anticancer Res 2007, 27(1A):155–164.
4. Paoloni M, Davis S, Lana S, Withrow S, Sangiorgi L, Picci P, Hewitt S, TricheT, Meltzer P, Khanna C: Canine tumor cross-species genomics uncoverstargets linked to osteosarcoma progression. BMC Genomics 2009, 10:625.
5. De Maria R, Miretti S, Iussich S, Olivero M, Morello E, Bertotti A, ChristensenJG, Biolatti B, Levine RA, Buracco P, et al: Met oncogene activation qualifiesspontaneous canine osteosarcoma as a suitable pre-clinical model ofhuman osteosarcoma. J Pathol 2009, 218(3):399–408.
6. Morello E, Martano M, Buracco P: Biology, diagnosis and treatment ofcanine appendicular osteosarcoma: similarities and differences withhuman osteosarcoma. Vet J 2011, 189(3):268–277.
7. Maniscalco L, Iussich S, Morello E, Martano M, Biolatti B, Riondato F, DellaSalda L, Romanucci M, Malatesta D, Bongiovanni L, et al: PDGFs andPDGFRs in canine osteosarcoma: new targets for innovative therapeuticstrategies in comparative oncology. Vet J 2013, 195(1):41–47.
8. Jaffe N: Osteosarcoma: review of the past, impact on the future. TheAmerican experience. Cancer Treat Res 2009, 152:239–262.
9. Iso T, Kedes L, Hamamori Y: HES and HERP families: multiple effectors ofthe Notch signaling pathway. J Cell Physiol 2003, 194(3):237–255.
10. Fischer A, Gessler M: Delta-Notch–and then? Protein interactions andproposed modes of repression by Hes and Hey bHLH factors.Nucleic Acids Res 2007, 35(14):4583–4596.
11. Coglievina M, Guarnaccia C, Pintar A, Pongor S: Different degrees ofstructural order in distinct regions of the transcriptional repressor HES-1.Biochim Biophys Acta 2010, 1804(12):2153–2161.
12. Takebayashi K, Sasai Y, Sakai Y, Watanabe T, Nakanishi S, Kageyama R:Structure, chromosomal locus, and promoter analysis of the gene
encoding the mouse helix-loop-helix factor HES-1. Negativeautoregulation through the multiple N box elements. J Biol Chem 1994,269(7):5150–5156.
13. Ingram WJ, McCue KI, Tran TH, Hallahan AR, Wainwright BJ: SonicHedgehog regulates Hes1 through a novel mechanism that isindependent of canonical Notch pathway signalling. Oncogene 2008,27(10):1489–1500.
14. Wall DS, Wallace VA: Hedgehog to Hes1: the heist of a Notch target.Cell Cycle 2009, 8(9):1301–1302.
15. Bennani-Baiti IM, Aryee DN, Ban J, Machado I, Kauer M, Muhlbacher K, AmannG, Llombart-Bosch A, Kovar H: Notch signalling is off and is uncoupled fromHES1 expression in Ewing's sarcoma. J Pathol 2011, 225(3):353–363.
16. Shih Ie M, Wang TL: Notch signaling, gamma-secretase inhibitors, andcancer therapy. Cancer Res 2007, 67(5):1879–1882.
17. Weng AP, Aster JC: Multiple niches for Notch in cancer: context iseverything. Curr Opin Genet Dev 2004, 14(1):48–54.
18. Liu J, Ye F, Chen H, Lu W, Zhou C, Xie X: Expression of differentiationassociated protein Hes1 and Hes5 in cervical squamous carcinoma andits precursors. Int J Gynecol Canc 2007, 17(6):1293–1299.
19. Wang X, Fu Y, Chen X, Ye J, Lu B, Ye F, Lu W, Xie X: The expressions ofbHLH gene HES1 and HES5 in advanced ovarian serousadenocarcinomas and their prognostic significance: a retrospectiveclinical study. J Cancer Res Clin Oncol 2010, 136(7):989–996.
20. Kannan S, Fang W, Song G, Mullighan CG, Hammitt R, McMurray J, Zweidler-McKay PA: Notch/HES1-mediated PARP1 activation: a cell type-specificmechanism for tumor suppression. Blood 2011, 117(10):2891–2900.
21. Viatour P, Ehmer U, Saddic LA, Dorrell C, Andersen JB, Lin C, Zmoos AF,Mazur PK, Schaffer BE, Ostermeier A, et al: Notch signaling inhibitshepatocellular carcinoma following inactivation of the RB pathway.J Exp Med 2011, 208(10):1963–1976.
22. Zage PE, Nolo R, Fang W, Stewart J, Garcia-Manero G, Zweidler-McKay PA:Notch pathway activation induces neuroblastoma tumor cell growtharrest. Pediatr Blood Cancer 2012, 58(5):682–689.
23. Klinakis A, Lobry C, Abdel-Wahab O, Oh P, Haeno H, Buonamici S, van DeWalle I, Cathelin S, Trimarchi T, Araldi E, et al: A novel tumour-suppressorfunction for the Notch pathway in myeloid leukaemia. Nature 2011,473(7346):230–233.
24. Zhang P, Yang Y, Zweidler-McKay PA, Hughes DP: Critical role of notchsignaling in osteosarcoma invasion and metastasis. Clin Cancer Res 2008,14(10):2962–2969.
25. Tanaka M, Setoguchi T, Hirotsu M, Gao H, Sasaki H, Matsunoshita Y, KomiyaS: Inhibition of Notch pathway prevents osteosarcoma growth by cellcycle regulation. Br J Cancer 2009, 100(12):1957–1965.
26. Engin F, Bertin T, Ma O, Jiang MM, Wang L, Sutton RE, Donehower LA,Lee B: Notch signaling contributes to the pathogenesis of humanosteosarcomas. Hum Mol Genet 2009, 18(8):1464–1470.
27. Hughes DP: How the NOTCH pathway contributes to the ability ofosteosarcoma cells to metastasize. Cancer Treat Res 2009, 152:479–496.
28. Zhang P, Yang Y, Nolo R, Zweidler-McKay PA, Hughes DP: Regulation ofNOTCH signaling by reciprocal inhibition of HES1 and Deltex 1 and itsrole in osteosarcoma invasiveness. Oncogene 2010, 29(20):2916–2926.
29. Modder UI, Oursler MJ, Khosla S, Monroe DG: Wnt10b activates the Wnt,notch, and NFkappaB pathways in U2OS osteosarcoma cells.J Cell Biochem 2011, 112(5):1392–1402.
30. Lin GL, Hankenson KD: Integration of BMP, Wnt, and notch signaling pathwaysin osteoblast differentiation. J Cell Biochem 2011, 112(12):3491–3501.
31. Day TF, Yang Y: Wnt and hedgehog signaling pathways in bonedevelopment. J Bone Joint Surg Am 2008, 90(Suppl 1):19–24.
32. O'Donoghue LE, Ptitsyn AA, Kamstock DA, Siebert J, Thomas RS, Duval DL:Expression profiling in canine osteosarcoma: identification of biomarkersand pathways associated with outcome. BMC Cancer 2010, 10:506.
33. Moore AS, Dernell WS, Ogilvie GK, Kristal O, Elmslie R, Kitchell B, Susaneck S,Rosenthal R, Klein MK, Obradovich J, et al: Doxorubicin and BAY 12–9566for the treatment of osteosarcoma in dogs: a randomized, double-blind,placebo-controlled study. J Vet Intern Med 2007, 21:783–790.
34. O'Donoghue LE, Rivest JP, Duval DL: Polymerase chain reaction-basedspecies verification and microsatellite analysis for canine cell linevalidation. J Vet Diagn Invest 2011, 23(4):780–785.
35. Su Y, Luo X, He BC, Wang Y, Chen L, Zuo GW, Liu B, Bi Y, Huang J, Zhu GH,et al: Establishment and characterization of a new highly metastatichuman osteosarcoma cell line. Clin Exp Metastasis 2009, 26(7):599–610.
Dailey et al. BMC Veterinary Research 2013, 9:130 Page 14 of 14http://www.biomedcentral.com/1746-6148/9/130
36. Thomson SA, Kennerly E, Olby N, Mickelson JR, Hoffmann DE, Dickinson PJ,Gibson G, Breen M: Microarray analysis of differentially expressed genesof primary tumors in the canine central nervous system. Vet Pathol 2005,42(5):550–558.
37. de Jonge HJ, Fehrmann RS, de Bont ES, Hofstra RM, Gerbens F, Kamps WA,de Vries EG, van der Zee AG, te Meerman GJ, ter Elst A: Evidence basedselection of housekeeping genes. PLoS One 2007, 2(9):e898.
38. Pfaffl MW, Horgan GW, Dempfle L: Relative expression software tool(REST) for group-wise comparison and statistical analysis of relativeexpression results in real-time PCR. Nucleic Acids Res 2002, 30(9):e36.
39. Livak KJ, Schmittgen TD: Analysis of relative gene expression data usingreal-time quantitative PCR and the 2(−Delta Delta C(T)) Method. Methods2001, 25(4):402–408.
40. Dallas PB, Gottardo NG, Firth MJ, Beesley AH, Hoffmann K, Terry PA, FreitasJR, Boag JM, Cummings AJ, Kees UR: Gene expression levels assessed byoligonucleotide microarray analysis and quantitative real-time RT-PCR –how well do they correlate? BMC Genomics 2005, 6:59.
41. Herr F, Schreiner I, Baal N, Pfarrer C, Zygmunt M: Expression patterns ofNotch receptors and their ligands Jagged and Delta in human placenta.Placenta 2011, 32(8):554–563.
42. Katoh M, Katoh M: Integrative genomic analyses on HES/HEY family:Notch-independent HES1, HES3 transcription in undifferentiated ES cells,and Notch-dependent HES1, HES5, HEY1, HEY2, HEYL transcription infetal tissues, adult tissues, or cancer. Int J Oncol 2007, 31(2):461–466.
43. Johansson T, Lejonklou MH, Ekeblad S, Stalberg P, Skogseid B: Lack ofnuclear expression of hairy and enhancer of split-1 (HES1) in pancreaticendocrine tumors. Horm Metab Res 2008, 40(5):354–359.
44. Morimoto M, Liu Z, Cheng HT, Winters N, Bader D, Kopan R: CanonicalNotch signaling in the developing lung is required for determination ofarterial smooth muscle cells and selection of Clara versus ciliated cellfate. J Cell Sci 2010, 123(Pt 2):213–224.
45. Shimojo H, Ohtsuka T, Kageyama R: Oscillations in notch signalingregulate maintenance of neural progenitors. Neuron 2008, 58(1):52–64.
46. Wang C, Yao N, Lu CL, Li D, Ma X: Mouse microRNA-124 regulates theexpression of Hes1 in P19 cells. Front Biosci (Elite Ed) 2010, 2:127–132.
47. Kimura H, Kawasaki H, Taira K: Mouse microRNA-23b regulates expressionof Hes1 gene in P19 cells. Nucleic Acids Symp Ser (Oxf ) 2004(48):213–214.
48. Ju BG, Solum D, Song EJ, Lee KJ, Rose DW, Glass CK, Rosenfeld MG:Activating the PARP-1 sensor component of the groucho/TLE1corepressor complex mediates a CaMKinase IIdelta-dependentneurogenic gene activation pathway. Cell 2004, 119(6):815–829.
49. Hilton MJ, Tu X, Wu X, Bai S, Zhao H, Kobayashi T, Kronenberg HM,Teitelbaum SL, Ross FP, Kopan R, et al: Notch signaling maintains bonemarrow mesenchymal progenitors by suppressing osteoblastdifferentiation. Nat Med 2008, 14(3):306–314.
50. Engin F, Yao Z, Yang T, Zhou G, Bertin T, Jiang MM, Chen Y, Wang L, ZhengH, Sutton RE, et al: Dimorphic effects of Notch signaling in bonehomeostasis. Nat Med 2008, 14(3):299–305.
51. Lee JS, Thomas DM, Gutierrez G, Carty SA, Yanagawa S, Hinds PW: HES1cooperates with pRb to activate RUNX2-dependent transcription.J Bone Min Res 2006, 21(6):921–933.
52. Sang L, Roberts JM, Coller HA: Hijacking HES1: how tumors co-opt theanti-differentiation strategies of quiescent cells. Trends Mol Med 2010,16(1):17–26.
doi:10.1186/1746-6148-9-130Cite this article as: Dailey et al.: HES1, a target of Notch signaling, iselevated in canine osteosarcoma, but reduced in the most aggressivetumors. BMC Veterinary Research 2013 9:130.
Submit your next manuscript to BioMed Centraland take full advantage of:
• Convenient online submission
• Thorough peer review
• No space constraints or color figure charges
• Immediate publication on acceptance
• Inclusion in PubMed, CAS, Scopus and Google Scholar
• Research which is freely available for redistribution
Submit your manuscript at www.biomedcentral.com/submit