Fatigue Behaviour of Aluminium Members with Different Notch ...
22
Citation: Buljan, N.; Skeji´ c, D.; Krolo, P.; Luki´ c, M. Fatigue Behaviour of Aluminium Members with Different Notch Root Shapes. Buildings 2022, 12, 681. https://doi.org/10.3390/ buildings12050681 Academic Editor: Rita Bento Received: 12 April 2022 Accepted: 13 May 2022 Published: 19 May 2022 Publisher’s Note: MDPI stays neutral with regard to jurisdictional claims in published maps and institutional affil- iations. Copyright: © 2022 by the authors. Licensee MDPI, Basel, Switzerland. This article is an open access article distributed under the terms and conditions of the Creative Commons Attribution (CC BY) license (https:// creativecommons.org/licenses/by/ 4.0/). buildings Article Fatigue Behaviour of Aluminium Members with Different Notch Root Shapes Nebojša Buljan 1, * , Davor Skeji´ c 2 , Paulina Krolo 3 and Mladen Luki´ c 4 1 RI ISA d.o.o., Kapitanovo 25, 51000 Rijeka, Croatia 2 Department for Structures, Faculty of Civil Engineering, University of Zagreb, Fra Andrije Kaˇ ci´ ca-Mioši´ ca 26, 10000 Zagreb, Croatia; [email protected] 3 Department of Structural Engineering and Technical Mechanics, Faculty of Civil Engineering, University of Rijeka, Radmile Matejˇ ci´ c 3, 51000 Rijeka, Croatia; [email protected] 4 Centre Technique Industriel de la Construction Métallique (CTICM), Espace Technologique, Route de l’Orme des Merisiers, 91193 Saint-Aubin, France; [email protected] * Correspondence: [email protected] Abstract: In unitised curtain walls, the transfer of horizontal loads, mainly wind loads, from the upper into the lower unit is achieved through the head/notch interlocking connection. Optimisation of the machining process would require a sharp root of the notch, causing an increase in the stress concentration. In order to predict fatigue resistance during design life, the influence of the radius at the root of the notch has been tested in both static and cyclic regimes. The cyclic regime is based on the load history equivalent of 50 years of wind exposure. Numerical simulations on the test assembly have been conducted in order to verify their adequacy for future research on similar issues. The experimental results demonstrated that, for the given specimen shape and alloy, a sharp notch would not lead to premature failure, and such a detail is safe from the purview of damage-tolerant design. Keywords: notch; aluminium profile; fatigue; wind action; stress concentration; unitised curtain wall 1. Introduction Aluminium structural alloys are applied in a wide field within the construction in- dustry [1]. One of their major applications in buildings is related to façades constructed as unitised curtain walls, which substitute for traditional external walls. A curtain wall con- sists of prefabricated units, typically one floor high, composed of loadbearing aluminium frames and infill, and completed with an external and internal finish (Figure 1). Units are interlocked horizontally with male/female mullion halves. The deadload of each unit is supported by brackets fixed to the main structural frame of the building at the floor level: one row of brackets per one row of units. In order to avoid the transfer of vertical loads from the main structure into the curtain wall, each horizontal row of units is connected to other rows by stack joints, allowing vertical movements independently of other rows by using available movement gaps between rows. The transfer of horizontal loads, mainly caused by wind pressure and suction, from the upper row to the lower row relies on interlocking between units at stack joints, thus creating a Gerber beam over the height of the building. One of the common interlocking principles is the engagement of a “chicken head” feature in the transom of the lower unit into the notch in the mullion of the upper unit. The notch is exposed to the horizontal load at its tip, where the load (Figure 2) is transferred through the contact point from the vertical mullion of the upper unit to the chicken head of the lower unit. The notch is a stress riser, and the highest stress concentration occurs at the root of the notch. Buildings 2022, 12, 681. https://doi.org/10.3390/buildings12050681 https://www.mdpi.com/journal/buildings
-
Upload
khangminh22 -
Category
Documents
-
view
0 -
download
0
Transcript of Fatigue Behaviour of Aluminium Members with Different Notch ...

Citation: Buljan, N.; Skejic, D.; Krolo,
P.; Lukic, M. Fatigue Behaviour of
Aluminium Members with Different
Notch Root Shapes. Buildings 2022,
12, 681. https://doi.org/10.3390/
buildings12050681
Academic Editor: Rita Bento
Received: 12 April 2022
Accepted: 13 May 2022
Published: 19 May 2022
Publisher’s Note: MDPI stays neutral
with regard to jurisdictional claims in
published maps and institutional affil-
iations.
Copyright: © 2022 by the authors.
Licensee MDPI, Basel, Switzerland.
This article is an open access article
distributed under the terms and
conditions of the Creative Commons
Attribution (CC BY) license (https://
creativecommons.org/licenses/by/
4.0/).
buildings
Article
Fatigue Behaviour of Aluminium Members with DifferentNotch Root ShapesNebojša Buljan 1,* , Davor Skejic 2 , Paulina Krolo 3 and Mladen Lukic 4
1 RI ISA d.o.o., Kapitanovo 25, 51000 Rijeka, Croatia2 Department for Structures, Faculty of Civil Engineering, University of Zagreb, Fra Andrije Kacica-Miošica 26,
10000 Zagreb, Croatia; [email protected] Department of Structural Engineering and Technical Mechanics, Faculty of Civil Engineering,
University of Rijeka, Radmile Matejcic 3, 51000 Rijeka, Croatia; [email protected] Centre Technique Industriel de la Construction Métallique (CTICM), Espace Technologique,
Route de l’Orme des Merisiers, 91193 Saint-Aubin, France; [email protected]* Correspondence: [email protected]
Abstract: In unitised curtain walls, the transfer of horizontal loads, mainly wind loads, from theupper into the lower unit is achieved through the head/notch interlocking connection. Optimisationof the machining process would require a sharp root of the notch, causing an increase in the stressconcentration. In order to predict fatigue resistance during design life, the influence of the radius atthe root of the notch has been tested in both static and cyclic regimes. The cyclic regime is based onthe load history equivalent of 50 years of wind exposure. Numerical simulations on the test assemblyhave been conducted in order to verify their adequacy for future research on similar issues. Theexperimental results demonstrated that, for the given specimen shape and alloy, a sharp notch wouldnot lead to premature failure, and such a detail is safe from the purview of damage-tolerant design.
Keywords: notch; aluminium profile; fatigue; wind action; stress concentration; unitised curtain wall
1. Introduction
Aluminium structural alloys are applied in a wide field within the construction in-dustry [1]. One of their major applications in buildings is related to façades constructed asunitised curtain walls, which substitute for traditional external walls. A curtain wall con-sists of prefabricated units, typically one floor high, composed of loadbearing aluminiumframes and infill, and completed with an external and internal finish (Figure 1). Units areinterlocked horizontally with male/female mullion halves.
The deadload of each unit is supported by brackets fixed to the main structuralframe of the building at the floor level: one row of brackets per one row of units. Inorder to avoid the transfer of vertical loads from the main structure into the curtain wall,each horizontal row of units is connected to other rows by stack joints, allowing verticalmovements independently of other rows by using available movement gaps between rows.The transfer of horizontal loads, mainly caused by wind pressure and suction, from theupper row to the lower row relies on interlocking between units at stack joints, thus creatinga Gerber beam over the height of the building.
One of the common interlocking principles is the engagement of a “chicken head”feature in the transom of the lower unit into the notch in the mullion of the upper unit. Thenotch is exposed to the horizontal load at its tip, where the load (Figure 2) is transferredthrough the contact point from the vertical mullion of the upper unit to the chicken head ofthe lower unit. The notch is a stress riser, and the highest stress concentration occurs at theroot of the notch.
Buildings 2022, 12, 681. https://doi.org/10.3390/buildings12050681 https://www.mdpi.com/journal/buildings
Buildings 2022, 12, 681 2 of 22
Figure 1. Typical curtain wall unit.
Figure 2. Stack joint between vertical units of a curtain wall.
The production of curtain walls is an industrial process which is constantly beingoptimised. A possible optimisation investigated here is an alternative machining of thenotch in the aluminium profile by sawing in lieu of the traditionally used milling machin-ing process. Sawing may result in a reduction in the machining time, resulting in moreeconomical production, in particular, for large projects where tens of thousands of profilesare machined. However, the problem is that sawing results in sharp corners at the notch,which are exposed to repeated wind loads throughout the design life.
The notch with sharp corners is generally known to be susceptible to fatigue fail-ure when exposed to the cycling load. This detail is strongly advised against in theliterature [2–4] due to the high stress concentration, which is supposed to be mitigated byrounding the sharp corner.
The phenomenon of fatigue in aluminium structures is not widely researched. More-over, aluminium structures susceptible to fatigue exhibit some particularities when com-

Buildings 2022, 12, 681 3 of 22
pared to steel structures [5]. The scope of this research is to investigate the fatigue behaviourof a sharp notch as obtained by sawing into an aluminium structural element in the façadeof the building exposed to wind action during its 50-year design life.
A crack may nucleate from a sharp notch rather quickly due to elevated stress at thenotch root. Since the deformation at the notch root is plastic, the crack initiates underconditions of local plasticity. For cracks growing into the plastic stress–strain field ofa notch, the rate of the crack growth is initially high, but decreases as the crack growsfurther away from the notch root. As the crack exceeds 10–20% of the notch radius, thenotch geometry has little influence on the stress–strain field of the advancing crack andcan stop growing once it has grown out of the notch-influenced region [6]. If the crackkeeps growing, it may grow into the elastic zone (Figure 3). Crack growth through a notchstress–strain field may represent a major or minor portion of the total fatigue life [7]. Afterthe crack grows out of the plastic zone, it may grow to become significantly long.
Figure 3. Phenomenology of crack growth through a notch stress–strain field.
The aim of this research is to investigate whether a sharp root notch is nevertheless atechnically viable design for the entire design life of a façade, within given geometry andfor known load history. The load history chosen for this research, representing a 50-yearwind exposure, was described by N.J. Cook [8] (Appendix K, Table 1).
For comparison, three different characteristic geometries for the notch were obtainedthrough different machining techniques, and these were both tested and numericallysimulated. The notch dimensions remained constant, but the shape of the root of the notchvaried: sharp corners, rounded corners, and the full semi-circular root.
2. Experimental Study2.1. General
An experimental programme was conducted at the structures laboratory of the Facultyof Civil Engineering, University of Rijeka [9]. Specimens were tested using the horizontallypositioned servo-hydraulic actuator Zwick/Roell with a capacity of 250 kN. A total of12 tests on mullion samples were performed, of which 5 specimens were tested undermonotonic loading and 7 specimens under cyclic loading.
It was known that the most structurally resilient root shape in this case would be asemi-circle with a diameter equal to the width of the notch (Figure 4c). Due to a requirementto minimise the cross-section of the frame, the semi-circular root was not practical, as itwould reduce the available vertical gap for the movement, as discussed later. Hence, rootcorners were rounded with a radius equal to the radius of the milling bit, typically close tothe thickness of the aluminium wall (Figure 4b), which corresponds to the diameter of the

Buildings 2022, 12, 681 4 of 22
smallest bit typically used for the milling of aluminium. Machining by sawing results insharp corners on the notch (Figure 4a), which is known to be the worst condition for stressconcentration. All three geometries of the notch (Figure 4) were tested, and the results werecompared to numerical models. It is important to note that the width of the notches wasconstant, but the shape of the root of the notches was variable: sharp corners, roundedcorners, and the full semi-circular root.
Figure 4. Shape of root notch: (a) sharp, N1, (b) rounded, N2, (c) semi-circular, N3.
2.2. Material and Specimen Geometry
The material used was the aluminium alloy EN AW 6063 T6 (extrusion) [10]. Producercertificates confirmed the chemical composition to be compliant with requirements forthe alloy. The surface finish of specimens was natural anodised. Despite the fact thatstatistical data for mechanical properties of the used alloy can be found in the most recentliterature [11], tension tests on used profiles were carried out for verification purposes. Inorder to validate the mechanical properties of the material, 3 dog-bone coupons were testedin accordance with the provisions of EN ISO 6892-1 [12]. Dog-bone coupons Al1 throughAl3 were obtained by cutting out of the wall of the single profile. The measured mechanicalproperties were compared to values from EN 755-2 [10] as well as values provided by thematerials supplier (Table 1).
Table 1. Comparison of mechanical properties.
Coupon/SourceRp0,2 Rm A
[MPa] [MPa] [%]
Coupon Al1 207.7 229.8 10.1
Coupon Al2 211.0 233.7 8.0
Coupon Al3 222.1 241.9 9.7
EN 755-2 [6] 170.0 215.0 8.0
Supplier’s certificate 216.6 235.7 11.8
The profile used was the male half of the split mullion (Figure 5a), an aluminiumextrusion with an asymmetric cross-section. The inner wall of the section parallel to thenotched wall was continuously cut for the entire length of the specimen, as shown inFigure 5b, so that the inner wall did not contribute to the loadbearing capacity of the notch.
The geometry of the notches is shown in Figure 6. The width of the notch was 25 mm,which enabled a close fit of the chicken head. The depth of the notch was 55 mm. Thisenabled ±20 mm of vertical movement in the stack joint.

Buildings 2022, 12, 681 5 of 22
Figure 5. (a) Cross-section of the profile, (b) semi-circular notch in the profile, (c) view of the profile.
Figure 6. Geometry of the (a) sharp notch, N1, (b) rounded notch, N2, and (c) semi-circularnotch (mm).
It should be noted that the total depth of the semi-circular notch was 67.5 mm, whichallowed for a straight length of 55 mm plus a radius of 12.5 mm for the semi-circle. Inpractice, the semi-circular notch was not used due to geometric constraints. The verticalsection through the stack joint between two façade units is shown in Figure 7a. The enlargeddetail in Figure 7b shows the vertical movement capacity of the stack joint when the gapbetween two units closes. The grey chicken head shows the nominal position as-designed.The blue chicken head shows the closed position if the rounded notch was used. Thered chicken head shows the closed position if the semi-circular notch was used. It can beobserved that the movement capacity of the semi-circular notch (sc) was smaller than thatof the rounded notch (rnd), as the movement of the chicken head was limited by the contact

Buildings 2022, 12, 681 6 of 22
with the semi-circular notch (red contour in Figure 7). The position of the semi-circularnotch would need to be higher to enable the same movement capacity as the roundednotch, but this is not possible, as, in that case, the semi-circular part of the notch wouldprotrude over the horizontal transom and enter the area visible to the user (green holein Figure 7), leaving it open for the passage of air and water into the building. However,the semi-circular notch was investigated as well for comparison. For test, specimens witha semi-circular notch at a total depth of 67.5 mm were used. Numerical modelling wasperformed for both semi-circular geometries, at 55 mm and 67.5 mm of the notch depth.
Figure 7. (a) Stack joint; (b) enlarged detail showing the vertical movement capacity.
2.3. Monotonic Testing
Prior to the cyclic tests, profile specimens were tested by applying a monotonicallyincreasing point load until failure. Tests were carried out under displacement control. Thescope of the monotonic testing was to assess the ultimate load to be used as the basis forthe load history in cyclic testing. Specimen profiles were 730 mm long with a notch at oneend. In total, five specimens were tested (see Table 2).
Table 2. Description of test specimens.
Specimen Shape of NotchN
Width ofNotch (mm)
Depth ofNotch (mm)
Radius at the Rootof Notch (mm)Monotonic Test Cyclic Test
M_N1_1 C_N1_1Sharp (N1)
25
55 0M_N1_2 C_N1_2- C_N1_3
M_N2_1 C_N2_1 Rounded (N2) 55 3.5M_N2_2 C_N2_2M_N3 C_N3_1 Semi-circular
(N3) 67.5 12.5- C_N3_2
The specimen was held in the steel frame (Figure 8b) at two points 355 mm apart, andthe horizontal load F was applied at the top end of the profile (Figure 8a).
The point of application for load F was 15 mm below the top end of the profile, forminga 360 mm structural cantilever. The tests were conducted by gradually increasing theapplied load under displacement control of the actuator at a constant speed of 0.025 mm/suntil the specimen fractured.
The deformation of the specimen was measured in 6 positions. The measurement datawas collected using a datalogging device that recorded all measurements at 0.01 s intervals.Displacements were measured using Linear Variable Displacement Transducers (LVDT)with an accuracy of 0.2%, as shown in Figure 9.

Buildings 2022, 12, 681 7 of 22
Figure 8. (a) Test setup; (b) test frame and the structural system (mm).
Figure 9. Positions of LVDTs.
The scope of LVDTs:
• LVDT-1,2,3,4 were located at the level of the application of the load.• LVDT-1—absolute displacement at the back of the profile behind the notch in the
direction of the load.• LVDT-2—absolute displacement at the tip of the specimen in the direction of the load• The differential of LVDT-1 − LVDT-2 measures the opening of the notch under the load.• LVDT-3—absolute displacement at the back of the profile behind the notch perpendic-
ular to the direction of the load.

Buildings 2022, 12, 681 8 of 22
• LVDT-4—absolute displacement at the top end of the specimen perpendicular to thedirection of the load.
• The differential of LVDT-3 − LVDT-4 measures the rotation of the tip of the specimenunder load.
• LVDT-5—absolute displacement of the upper support of the specimen in the directionof the load (upper angle in the steel frame).
• LVDT-6—absolute displacement of the lower support of the specimen in the directionof the load (lower angle in the steel frame).
• The displacements of LVDT-5 and LVDT-6 are used to confirm the sufficient stiffnessof the supporting steel frame.
• The differential of LVDT-5 − LVDT-6 determines the rotation of the supporting steelframe in order to distinguish between movement at the tip of the specimen due to therotation of the support and movement due to the bending of the specimen.
The main results of the testing are tabulated in Table 3.
Table 3. Results of the monotonic testing.
Specimen Ultimate Load Opening of the NotchLVDT-1 − LVDT-2, Figure 8.
(kN) (mm)
M_N1_1 6.78 6.18M_N1_2 6.99 3.78M_N2_1 8.08 9.49M_N2_2 8.61 9.45
M_N3 8.45 20.20
It should be noted that specimens with the sharp notch (Figure 10a), as expected, hadlower breaking forces (6.78 kN and 6.99 kN), which was, on average, 82% of the breakingforce for specimens with rounded or semi-circular notches (8.08 kN, 8.61 kN, and 8.45 kN).Since the opening of the notch was measured at the time of the fracture, there was a notabledifference for various specimens. This value depended on the mode of the breakage andcomprised localized plastic effects; for M_N3, this value was highest as the wall buckled,which can be seen in Figure 10b.
Figure 10. Fracture in monotonic tests: (a) Sharp notch specimen M_N1_1; (b) Semi-circular specimen M_N3.
Specimens with the sharp notch failed through the crack at the root of the notch due tothe concentration of tensile stress (Figure 10a). Specimens with the rounded or semi-circularnotch experienced local buckling of the aluminium wall at the load application point priorto the fracture, so the material at the root of the notch was exposed to the combined stressdue to the rotation of the aluminium wall (Figure 10b). The rotation of the aluminium wallwas a secondary effect caused by the buckling of the wall, which shifted the applicationpoint of the load out of the plane of the wall.

Buildings 2022, 12, 681 9 of 22
The lower maximal measured force for the specimen with the sharp notch was takenas the basis for the load history of subsequent cyclic testing.
2.4. Cyclic Testing2.4.1. Load History
The dominant action on the curtain wall is wind action. During the design life of abuilding (usually 50 years), the notch is exposed to cycles of the horizontal load causedby wind action on the curtain wall. Although the tested specimens were taken from a realproject, the scope of the test was not to verify the adequacy of the aluminium structuralelement for the design load for that specific project, but rather, to assess the comparativeresistance of different notch detail machining for a 50-year exposure to wind of an intensitythat would cause the load in the detail to become close to its loadbearing capacity.
Monotonic testing was used to assess the breaking load of the element, and then thisload was used as a basis for constructing a time history representative of 50-year windexposure with the equivalent effect on the structural integrity of the element as on thebreaking load. The chosen load history used in testing was based on the proposal byBRE in 1984, as described by N.J. Cook [8] (Appendix K, Table 1). This load history wasappropriate for a 50-year design life in the UK. An alternative load history by Gerhardand Kramer [13], used by UEAtc and ETAG documents, was also considered. Both loadhistories are similar [14], Cook’s load history was chosen as being representative sincespecimen profiles are used in the UK market.
It should be noted that, due to the mass of a curtain wall and to the stiffness of theframe, the dynamic excitement of wind gusts is irrelevant and may be neglected [15] (6.2.f);therefore, the load history was adequately expressed as a series of monotonic loads. Thesequence of steps 1–6 was repeated five times, followed by step 7 (100% of the designload F) (Table 3). A total of 6401 (1280 × 5 + 1) cycles were performed. To represent windgust, the duration of one cycle was chosen to be 3 s.
Design load F was determined based on the minimal failure load Fmax of sharp notchedspecimens from monotonic testing (Table 2). The maximal force for specimen M_N1_1 wasequal to 6.78 kN.
The hypothesis was that the aluminium profile would not fail due to fatigue, so afailure load for the profile, Fmax, corrected for the appropriate partial factor, was cho-sen for design load F for the load history. According to Eurocode 0 [16], the value ofthe partial factor for wind action, γf, is 1.5. The design force for cyclic testing is thenF = Fmax/γf = 6.78/1.5 = 4.50 kN. The load history for the cyclic testing is provided inTable 4.
Table 4. Load history for cyclic testing.
Loading Step Number of Cycles Percentage of theDesign Load F
Nominal Load Fi forStep i [kN]
1 1 90% 4.052 960 40% 1.803 60 60% 2.704 240 50% 2.255 5 80% 3.606 14 70% 3.157 1 100% 4.50
2.4.2. Cyclic Test Specimens
Profile specimens were tested [17] using the same apparatus as for monotonic testing,by applying a cycling horizontal point load acting at 15 mm from the top end of the profile.The load history in Table 3 was programmed as a series of sinusoidal load pulses. Theseries of steps 1–6 was repeated five times, and at the end, step 7 was applied. In total,7 specimens were tested (see Table 1).

Buildings 2022, 12, 681 10 of 22
The measured data was collected using a datalogging device that recorded all mea-surements at 0.01 s intervals. The duration of the cyclic testing for one specimen wasapproximately 9 h.
Figure 11 shows the diagram of the maximal opening of the notch, expressed as thedifference between deflections δ1 and δ2 (readings of LVDT_1 and LVDT_2, respectively) foreach set of cycles (single Fi) in each series for the specimen with the sharp notch (C_N1_1).It can be noted that there was a slight increase in the opening of the notch (δ1-δ2) after thefirst series for Fi = 90% F and Fi = 40% F load cycles. This could be caused by the onset ofthe crack in the root of the notch, but this pattern was not observed on other specimens andthere is no definite proof of that hypothesis. For subsequent series of cycle steps, it can beobserved that a stable value of measured deflections and slight fluctuations were attributedto the tolerance of the applied force due to the precision limits of the hydraulic press.
Figure 11. Opening of the notch, sharp notch specimen C_N1_1.
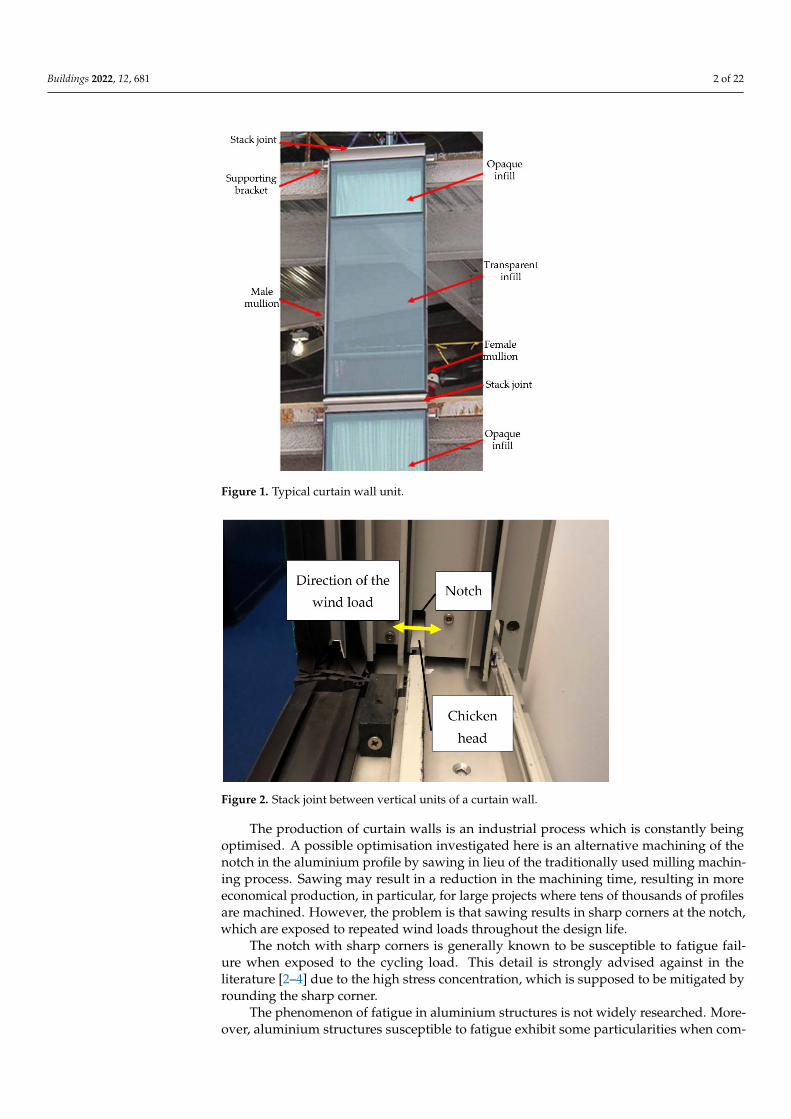
In all 3 specimens with the sharp root notch (C_N1_1, C_N1_2 and C_N1_3), a crackdeveloped at the root of the notch (Figure 12). The stress concentration during the cyclicloading caused the crack propagating 1–2 mm in the direction bisecting the internal cornerof the notch, which was in the range of 35◦ to 55◦. The length of the fracture was measuredusing a microscope Elcometer 900 graduated ×50. It was not possible to identify the cycleat which the crack appeared nor its propagation rate. The apparent slight differences inthe colour of surfaces in Figure 12, enlarged details, are due to the light conditions and toresidues from the red liquid penetrant used to emphasise surface irregularities; in fact, allsamples had the same surface finish.
Cracking of the specimens with the rounded (Figure 13a) and semi-circular roots(Figure 13b), did not occur. In the zone approximately 20 mm around the crack, a net ofmicrocracks radiating from the internal corner of the notch was visible. It is important tonote that all specimen surfaces were anodized with aluminium trioxide, which has a highermodulus of elasticity and higher hardness than the parent material below. For high strains,the anodized surface will crack before the alloy material below. It is not uncommon foranodized surfaces with a thickness of around 30 µm or more to experience microcrackingcaused by the temperature expansion of the parent material. Such a surface becomes“crazed” with crisscrossing lines. This also happened in this test, but due to the highstrain. Microcracks are present only in the surface finish (anodization), while the materialbelow was not cracked, apart from a main crack that grew through the full thickness of thealuminium wall and was observable from both sides of the aluminium wall.

Buildings 2022, 12, 681 11 of 22
Figure 12. Cracks in specimens with the sharp root: (a) C_N1_1, (b) C_N1_2, (c) C_N1_3.
This microcracking of the surface finish was also visible on specimens with roundedroots and with semi-circular roots. However, on these specimens, no cracks in the alu-minium alloy wall occurred. The aluminium material around the root of the notch didunder-go a yield, observable from the residual deformation, which is approximately 1 mmat the opening of the notch, but without initiating cracks (Figure 13a,b).
Buildings 2022, 12, 681 12 of 22
Figure 13. Microcracking of the surface of specimens with the rounded and semi-circular root:(a) C_N2_1; (b) C_N3_1.
3. Numerical Analysis
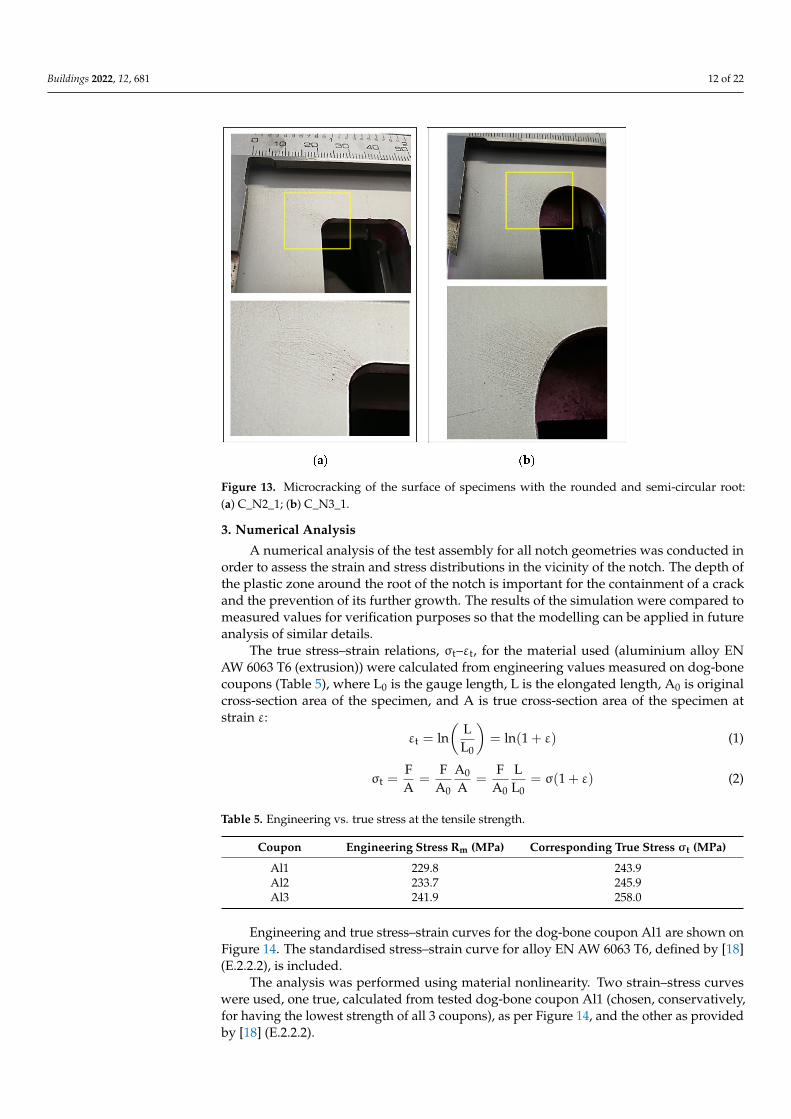
A numerical analysis of the test assembly for all notch geometries was conducted inorder to assess the strain and stress distributions in the vicinity of the notch. The depth ofthe plastic zone around the root of the notch is important for the containment of a crackand the prevention of its further growth. The results of the simulation were compared tomeasured values for verification purposes so that the modelling can be applied in futureanalysis of similar details.
The true stress–strain relations, σt–εt, for the material used (aluminium alloy ENAW 6063 T6 (extrusion)) were calculated from engineering values measured on dog-bonecoupons (Table 5), where L0 is the gauge length, L is the elongated length, A0 is originalcross-section area of the specimen, and A is true cross-section area of the specimen atstrain ε:
εt = ln(
LL0
)= ln(1 + ε) (1)
σt =FA
=F
A0
A0
A=
FA0
LL0
= σ(1 + ε) (2)
Table 5. Engineering vs. true stress at the tensile strength.
Coupon Engineering Stress Rm (MPa) Corresponding True Stress σt (MPa)
Al1 229.8 243.9Al2 233.7 245.9Al3 241.9 258.0
Engineering and true stress–strain curves for the dog-bone coupon Al1 are shown onFigure 14. The standardised stress–strain curve for alloy EN AW 6063 T6, defined by [18](E.2.2.2), is included.
The analysis was performed using material nonlinearity. Two strain–stress curveswere used, one true, calculated from tested dog-bone coupon Al1 (chosen, conservatively,for having the lowest strength of all 3 coupons), as per Figure 14, and the other as providedby [18] (E.2.2.2).

Buildings 2022, 12, 681 13 of 22
Figure 14. Engineering, true and standardised stress–strain curves for Al1.
Models were loaded by a concentrated horizontal force at the contact point of theactuator. The load was increased in steps of 0.5 kN until the nonconvergence of the solutionwas reached.
Specimens with all 3 notch geometries were numerically modelled by FEM softwareStraus7 R2.4.6–Strand7 [19] using solid, 8-node brick elements. The size of elementswas 2.5–5 mm, with one element through the thickness of the profile wall (Figure 15a),maintaining the aspect ratio of elements in the zone around the root of the notch higherthan 0.4 [20]. In the zone around the notch, the density of the mesh was increased to2 elements in the thickness of the aluminium wall and the size of the elements was reducedto 0.5–2.5 mm (Figure 15b).
Figure 15. Element mesh: (a) entire model, (b) upper part, and (c) mesh around the root of the notch.

Buildings 2022, 12, 681 14 of 22
The deformed shape obtained by numerical simulation is shown on Figure 16a, andthe deformation of the profile obtained by testing is shown in Figure 16b.
Figure 16. Deformed shape of the specimen N1: (a) numerically and (b) experimentally obtained.
The highest achieved force for models using the true stress–strain curve was 5.5 kN,and the highest achieved force for models using the standardised stress–strain curve (alloyEN AW 6063 T6) was 5.0 kN. Models of the semi-circular notch at 67.5 mm achieved 0.5 kNless force: 5.0 kN and 4.5 kN. The distribution of the strain for all models is shown inFigures 17–20. The wide area of the yielding can be seen (magenta) around the root ofthe notch.
Figure 17. Strain in the model of the sharp notch: (a) True stress–strain curve (coupon Al1), load5.5 kN; (b) standardised stress–strain curve (alloy EN AW 6063 T6), load 5.0 kN.
For the semi-circular notch, two different geometries were modelled, Figures 19 and 20.The difference between them was the total depth of the notch. Tested specimens had aninitial depth of 55 mm, to which a semi-circular machining with a radius of 12.5 mm wasperformed, resulting in a total depth of 67.5 mm. In order to match the total depth of theother two geometries, an additional model with a semi-circular root was created, which hada total depth of 55 mm, including the semi-circular part, equal to the sharp and roundednotches. Hence, a 67.5 mm notch was representative of tested specimens, whereas a 55 mmnotch had the same notch depth as other tested geometries.

Buildings 2022, 12, 681 15 of 22
Figure 18. Strain in the model of the rounded notch: (a) True stress–strain curve (coupon Al1), load5.5 kN; (b) nominal stress–strain curve (alloy EN AW 6063 T6), load 5.0 kN.
Figure 19. Strain in the model of the semi-circular notch 55 mm: (a) True stress–strain curve (couponAl1), load 5.5 kN; (b) nominal stress–strain curve (alloy EN AW 6063 T6), load 5.0 kN.
In general, nonconvergence of numerical models occurred significantly below themeasured breaking load, approximately at 80% for the model with the sharp notch, 70%for the rounded notch, and 50% for the semi-circular notch. This can be attributed tothe numerical instability at high strain rates. It can be observed that the zone of highstrain increased with an increase in the radius at the notch root, which also increased thenumerical instability.
Numerical models with the same notch geometry, but with different stress–straincurves, show a similar deflection at the low strain and a small difference at the high strain(Figures 21–23):
• Higher stress for the Al1 true curve, which had higher stress in the plastic zone.• Higher strains for the standardised curve, which had lower proof stress, thus yield-
ing earlier.
Figure 21 shows that, when a standardised stress–strain curve was used, the highestmaximal strains occurred at the sharp notch and the lowest maximal strains occurred at thesemi-circular notch.

Buildings 2022, 12, 681 16 of 22
Figure 20. Strain in the model of the semi-circular notch 67.5 mm: (a) True stress–strain curve (couponAl1), load 5.0 kN; (b) nominal stress–strain curve (alloy EN AW 6063 T6), load 4.5 kN.
The advantage of a rounded corner on the notch can be seen from the tabulated strainat 5.0 kN load (Table 6). The greater the radius, the less the strain and, as a result, the moreresistant the detail.
Figure 21. Strain-force curves for the (a) nominal and (b) true stress–strain curve.
Figure 22. Deflection-force curves for the (a) nominal and (b) true stress–strain curves.

Buildings 2022, 12, 681 17 of 22
Figure 23. Von Mises stress–strain curves for the (a) nominal and (b) true stress–strain curves.
Table 6. Numerical modelling—strain at 5.0 kN.
Notch ShapeStrain [%]
Nominal Stress–StrainCurve
True Stress–Strain Curve(Al1)
Sharp 16.17 11.88Rounded 7.10 5.64
Semi-circular (depth 55 mm) 2.88 2.42Semi-circular (depth 67.5 mm) 5.69 * 5.62
(*) at 4.5 kN (no convergence for 5.0 kN).
4. Fatigue Resistance According to Eurocode 9
The fatigue resistance of the element was assessed according to EN 1999-1-3 [21]. Thescope of this assessment was only to compare different notch geometries using cumulativelinear damage model. According to Annex J [21], the selected detail category is 1.6 with thefollowing parameters (Table 7):
∆σ = 100 MPa—nominal stress range
m1 = 7—inverse slope constant of log∆σ-logN fatigue strength curve for
N ≤ 5 × 10⁶ cycles
Table 7. Detail type 1.6, as per EN 1999-1-3, Table J.1.
DetailType
DetailCategory
∆σ-m1
Product FormsConstructional Detail
Initiation SiteStress
Orientation Stress Analysis Execution Requirements
1.6 100-7
Notches, holes
Surface irregularity
Parallel ornormal to rolling
or extrusiondirection.
Account forstress
concentration.
Surface free ofsharp corners
unless parallel tostress direction;
edges free ofstress raisers
No score markstransverse to
stressorientation
visualinspection
In tested specimens, the high stress range was applied less than 105 times, so the en-durance, Ni, could calculated as per [21], according to Annex F for low cycle fatigue range:
Ni =
(∆σC
∆σi
1γFfγMf
)m0
·20m0m1 ·105 (3)

Buildings 2022, 12, 681 18 of 22
∆σc = 100 MPa—reference value of fatigue strength at 2 × 10⁶ cyclesR = 0—stress ratio for the cycle range between σmin = 0 and σmax > 0For the stress ratio R < +0.5, the enhanced reference fatigue strength ∆σc(R) is used:
∆σc(R) = f(R) ∆σc (4)
For R = 0 and for initiation sites away from connections, the enhancement factor f(R) is:
f(R = 0) = 1.2 − 0.4 R = 1.2 (5)
∆σc(R) = 120 MPa (6)
∆σi—stress range for the principal stresses at the detail, max hotspot stress range at theroot of the notch in numerical models, [21]γFf = 1.0—partial factor for fatigue loads, [21]γMf = 1.0—partial factor for materials, [21]m0 = m1 = 7—inverse slope of log∆σ-logN curve at 103 ≤ N ≤ 105 cycles
Formula (3) becomes
Ni =
(120∆σi
)7·2 × 106 (7)
Since the stress history had cycles of various amplitude, the Palmgren–Miner rule wasapplied in order to assess the total damage DL:
DL = ∑ni
Ni(8)
where:
ni—number of cycles of stress range ∆σiNi—endurance under stress range ∆σi
Number of cycles is defined in Table 4, and the total number of cycles, after thesequence was repeated 5 times, as defined in Table 3, is shown below in Table 8.
Table 8. Total number of cycles.
Cycles Total of Cycles ni Force (kN)
1 5 4.05960 4800 1.8060 300 2.70
240 1200 2.255 25 3.6014 70 3.151 1 4.50
6401
Numerical simulations were performed for the load in steps of 0.5 kN, which did notnecessarily match the values of the load used for the cyclic testing (Table 3). In order toassess the hotspot stress range (∆σi) for each cycle, the resulting von Mises stresses fromthe numerical model were used to generate stress–strain curves through the polynomialregression of each notch type. Figure 24 shows the regression curve for the sharp notch.Hotspot stress ranges (∆σi) for each cycle were assessed from the obtained curves. Modelswith the true stress–strain curve for dog-bone coupon Al1 were used.

Buildings 2022, 12, 681 19 of 22
Figure 24. Von Mises stress–strain regression curves for ∆σi.
For each geometry of the notch, the hotspot stress (∆σi) for each cycle was assessedfrom the respective regression curve. The endurance (Ni) for each cycle was calculatedusing Formula (7), and the total damage for each cycle was calculated using Formula (8).The results of this procedure for the sharp notch are shown in Table 9.
Table 9. Total damage for the sharp notch.
Cycles Force Stress Endurance Damageni [kN] [MPa] Ni D
5 4.05 285.1 4679 0.001074800 1.80 221.5 27,410 0.17512300 2.70 238.6 16,292 0.01841
1200 2.25 228.6 21,947 0.0546825 3.60 267.9 7235 0.0034670 3.15 252.1 11,083 0.006321 4.50 304.1 2981 0.00034
6401 0.25939
The total damage, DL, was 0.259, which is lower than 1.0; therefore, the safe life designwas achieved, and it can be assumed that the element was not likely to fail due to fatigueduring its design life (TL) of 50 years. The expected safe life (TS) is:
TS = TL/DL = 193 years (9)
By applying Formulas (7) and (8), the total damage was assessed for each notch type.The results of the analyses for all notch types are shown in Table 10.

Buildings 2022, 12, 681 20 of 22
Table 10. Total damage and expected safe life.
Notch Type Total Damage DL Expected Safe Life Ts [Years]
Sharp 0.259 193Rounded 0.192 260
Semi-circular 55 mm 0.076 660Semi-circular 67.5 mm 0.144 348
For each calculated geometry of the notch, the number of cycles was too low to causefatigue failure, even though the stress concentration in the hotspot was higher than the yieldlimit (0.2% proof strength) for most of the loads. It is expected that the eventual failure willbe caused by material failure at the root of the notch, as described by fracture mechanics.
5. Discussion
It was observed that specimens with a rounded or semi-circular notch did not exhibitcracking, although the material at the notch underwent plastic deformation. Specimenswith the sharp notch developed a crack early in the cyclic testing, but the crack did notgrow further, and the specimen remained stable to the end of the test.
The cause of the cracking was stress concentration. The notch is a geometric stressraiser that causes a localised increase of the stress. Many factors influence the stressconcentration, among which, the most important are: geometry of the member, notchradius, basic material characteristics, material homogeneity on the microscopic scale, localplastic deformation, residual stress, and the load type (monotonic, cyclic, impact) [22]. Inthis paper, only the influence of the notch radius is considered.
It is known that notch sensitivity is small for smaller elements and small radii of thenotch, so extremely high theoretical concentration factors for very sharp notches were notactually realised [6]. Furthermore, ductile materials have a low notch sensitivity index dueto the local plastic deformation at the notch root. The theoretical peak stress is lowered byplastic action, which redistributes the stress and decreases the effective stress concentrationfactor [7].
In tested specimens with a sharp notch, this behaviour was observed. The nucleationof the crack happened early during the test, but throughout the entire cycling, it remainedstable. It is assumed that the crack remained within the plastic zone (Figure 3), and didnot grow out of it. This was confirmed by numerical modelling, which showed that theplastic zone was much deeper (20–40 mm) than the length of the cracks, which wereexperimentally determined in the range of 1–2 mm; see Figure 12.
6. Conclusions
Three configurations of a detail of an extruded aluminium alloy EN AW 6063 T6profile were tested to verify the 50-year design service life of a building [23] using a sharp,rounded, and semi-circular notch:
• Specimens were first tested in the monotonic regime until failure in order to assess theirmaximal load capacity. As expected, specimens with a sharp root had a substantiallylower failure load, roughly 20% lower than that of the other specimens.
• Specimens were then tested in the cyclic regime in order to assess their fatigue resis-tance. The applied variable load history is typical for a 50-year exposure to wind inthe UK, which was the actual in-use condition of the original profiles. The selectedmagnitude of the load history was derived from the lowest monotonic failure load ofthe specimen with the sharp root, reduced by the partial factor for the wind load.
It was observed that all specimens exhibited microcracks in the surface finish. Thishas no structural implications and is not deemed to be a failure, but rather, an acceptableworking condition. Such microcracks cannot cause the onset of corrosion due to the healingproperties of the aluminium and due to its favourable exposure being internal to theair barrier. Specimens with the rounded and semi-circular notches did not exhibit any

Buildings 2022, 12, 681 21 of 22
cracks throughout the test, so they fulfilled requirements for a safe life according to [21]throughout their design life.
All specimens with the sharp root notch exhibited full-penetration cracks propagatingat 45◦ for a length of 1–2 mm. The crack geometry was consistent in shape for all 3specimens. It should be noted that the propagation of cracks was very limited to thevicinity of the sharp internal corner and the length of cracks was lower than the thicknessof the aluminium wall (2.5 mm). This indicates that such a situation should remain stablefor the duration of the building’s design service life and that repeated loading would notresult in progressive collapse of such a detail. Thus, specimens with a sharp notch fulfilthe requirements for the damage-tolerant design according to [21]. Buildings with sucha notch design can be deemed safe for use. This reasoning does not take into accountother non-structural performance requirements, such as possible breach of the air barrier,possible water penetration, or aesthetical issues related to such a crack.
This conclusion cannot be extended to other designs, since they may differ in choiceof alloy, cross-sectional geometry of the profile, notch geometry and its position withinthe profile, or load history, and, hence, exhibit different behaviour during their design life.For other designs, it is recommended not to use sharp notch geometry without conductinglaboratory testing of the notch’s sensitivity to fatigue. Sharp internal corners of notchesshould be avoided in general. However, the gain in the machining costs may justify theeffort of testing and the subsequent use of sharp rooted notches in practice.
Author Contributions: Conceptualization, N.B. and D.S.; methodology, N.B. and D.S.; software, N.B.;validation, D.S. and P.K.; formal analysis, N.B.; investigation, N.B.; resources, N.B.; data curation, N.B.and P.K.; writing—original draft preparation, N.B.; writing—review and editing, D.S., P.K. and M.L.;visualization, N.B. and P.K.; supervision, D.S. and M.L.; project administration, N.B. All authors haveread and agreed to the published version of the manuscript.
Funding: This research received no external funding.
Institutional Review Board Statement: Not applicable.
Informed Consent Statement: Not applicable.
Data Availability Statement: The data presented in this study are available on request from thecorresponding author.
Acknowledgments: To the Permasteelisa Group for donating test specimens. Laboratory tests werecarried out on equipment that was purchased under the project Research Infrastructure for Campus-based Laboratories at the University of Rijeka, number RC.2.2.06-0001. This project was co-funded bythe European Fund for Regional Development (ERDF).
Conflicts of Interest: The authors declare no conflict of interest.
References1. Georgantzia, E.; Gkantou, M.; Kamaris, G.S. Aluminium alloys as structural material: A review of research. Eng. Struct. 2021,
227, 111372. [CrossRef]2. Lotsberg, I. Fatigue Design of Marine Structures; Cambridge University Press: New York, NY, USA, 2016.3. Gurney, T.R. Fatigue of Welded Structures, 2nd ed.; Cambridge University Press: Cambridge, UK, 1979.4. Forrest, P.G. Fatigue of Metals; Pergamon Press: Oxford, UK, 1962.5. Maljaars, J.; Lukic, M.; Soetens, F. Comparison between the Eurocode for Fatigue of Steel Structures, EN 1993-1-9, and the
Eurocode for Fatigue of Aluminium Structures, EN 1999-1-3. Procedia Eng. 2013, 66, 34–48. [CrossRef]6. Pilkey, W.D. Formulas for Stress, Strain, and Structural Matrices, 2nd ed.; Wiley & Sons, Inc.: Hoboken, NJ, USA, 2005.7. Fatemi, A. Notches and Their Effect; University of Toledo: Toledo, OH, USA, 2011.8. Cook, J.N. The Designer’s Guide to Wind Loading Structures; Part 2: Static Structures; BRE: London, UK, 1990.9. Krolo, P. Test Report 004/2020: Aluminium Extruded Profiles-Static Test; Faculty of Civil Engineering University of Rijeka: Rijeka,
Croatia, 2020.10. EN 755-2:2016 Aluminium and Aluminium Alloys-Extruded Rod/Bar, Tube, and Profiles—Part 2: Mechanical Properties; European
Committee for Standardization: Brussels, Belgium, 2016.11. Skejic, D.; Dokšanovic, T.; Cudina, I.; Mazzolani, F.M. The Basis for Reliability-Based Mechanical Properties of Structural
Aluminium Alloys. Appl. Sci. 2021, 11, 4485. [CrossRef]

Buildings 2022, 12, 681 22 of 22
12. EN ISO 6892-1:2016: Metallic Materials–Tensile Testing—Part 1: Method of Test at Room Temperature; European Committee forStandardization: Brussels, Belgium, 2016.
13. Gerhardt, H.J.; Kramer, C. Wind induced loading cycle and fatigue testing of light-weight roofing fixation. J. Wind. Eng. Ind.Aerodyn. 1986, 23, 237–247. [CrossRef]
14. Xu, Y.L. Wind-induced fatigue loading on roof cladding of low-rise buildings. In Cyclone Structural Testing Station: Technical ReportNo 41; James Cook University of North Queensland: Townsville, Australia, 1993.
15. EN 1991:2005 Eurocode 1: Actions on Structures—Part 1–4: General Actions—Wind Actions; European Committee for Standardization:Brussels, Belgium, 2005.
16. EN 1990:2002+A1:2005+A1:2005/AC:2010 Eurocode 0: Basis of Structural Design; European Committee for Standardization: Brussels,Belgium, 2002.
17. Krolo, P. Test Report 005/2020: Aluminium Extruded Profiles-Fatigue Test; Faculty of Civil Engineering University of Rijeka: Rijeka,Croatia, 2020.
18. EN 1999-1-1:2007+A1:2009+A2:2013 Eurocode 9: Design of Aluminium Structures—Part 1-1: General Structural Rules; EuropeanCommittee for Standardization: Brussels, Belgium, 2007.
19. Strand7. Available online: https://www.strand7.com/html/docu_usingstrand7.htm (accessed on 20 November 2021).20. Joshi, A. Stress Concentration Factor Converts into Stress Intensity Factor using ANSYS. IJSER 2006, 7, 1662–1667.21. EN 1999-1-3:2007+A1:2011 Eurocode 9: Design of Aluminium Structures-Part 1–3: Structures Susceptible to Fatigue; European
Committee for Standardization: Brussels, Belgium, 2007.22. Yen, C.S.; Dolan, T.J. A Critical Review of The Criteria for Notch Sensitivity in Fatigue of Metals; Bulletin Series No 398; University of
Illinois Engineering Experiment Station: Urbana, IL, USA, 1952.23. Buljan, N. Fatigue Testing of the Notch in the Aluminium Profile; Faculty of Civil Engineering University of Rijeka: Rijeka, Croatia;
Faculty of Civil Engineering University of Zagreb: Zagreb, Croatia, 2020.