HERALD (health economics using routine anonymised linked data
12
RESEARCH ARTICLE Open Access HERALD (Health Economics using Routine Anonymised Linked Data) Muhammad J Husain 1* , Sinead Brophy 2 , Steven Macey 2 , Leila M Pinder 2 , Mark D Atkinson 2 , Roxanne Cooksey 2 , Ceri J Phillips 3 and Stefan Siebert 2 Abstract Background: Health economic analysis traditionally relies on patient derived questionnaire data, routine datasets, and outcomes data from experimental randomised control trials and other clinical studies, which are generally used as stand-alone datasets. Herein, we outline the potential implications of linking these datasets to give one single joined up data-resource for health economic analysis. Method: The linkage of individual level data from questionnaires with routinely-captured health care data allows the entire patient journey to be mapped both retrospectively and prospectively. We illustrate this with examples from an Ankylosing Spondylitis (AS) cohort by linking patient reported study dataset with the routinely collected general practitioner (GP) data, inpatient (IP) and outpatient (OP) datasets, and Accident and Emergency department data in Wales. The linked data system allows: (1) retrospective and prospective tracking of patient pathways through multiple healthcare facilities; (2) validation and clarification of patient-reported recall data, complementing the questionnaire/routine data information; (3) obtaining objective measure of the costs of chronic conditions for a longer time horizon, and during the pre-diagnosis period; (4) assessment of health service usage, referral histories, prescribed drugs and co-morbidities; and (5) profiling and stratification of patients relating to disease manifestation, lifestyles, co-morbidities, and associated costs. Results: Using the GP data system we tracked about 183 AS patients retrospectively and prospectively from the date of questionnaire completion to gather the following information: (a) number of GP events; (b) presence of a GP ‘drug’ read codes; and (c) the presence of a GP ‘diagnostic’ read codes. We tracked 236 and 296 AS patients through the OP and IP data systems respectively to count the number of OP visits; and IP admissions and duration. The results are presented under several patient stratification schemes based on disease severity, functions, age, sex, and the onset of disease symptoms. Conclusion: The linked data system offers unique opportunities for enhanced longitudinal health economic analysis not possible through the use of traditional isolated datasets. Additionally, this data linkage provides important information to improve diagnostic and referral pathways, and thus helps maximise clinical efficiency and efficiency in the use of resources. Background Health service research have tended to rely on data gen- erated from randomised controlled trials (RCT), obser- vational studies based on patient derived questionnaire data, and routinely assembled data abstracted from the primary and secondary care patient record - popularly known as routine data [1]. Data generated from these three routes are predominantly used as stand-alone datasets, and alongside non-health data such as demo- graphic and geographical data [1,2]. The health sector analyses are enriched when the patient-level data gener- ated from these different sources are linked. Many countries worldwide already routinely capture health care data that can be used for such purposes. For exam- ple, the Scottish Morbidity Linked Dataset which encompasses Scottish Health Survey records, linked to NHS acute and psychiatric hospital records, cancer, and death registrations provides powerful research database * Correspondence: [email protected] 1 Keele Management School, Keele University, Staffordshire, ST5 5BG, UK Full list of author information is available at the end of the article Husain et al. BMC Medical Informatics and Decision Making 2012, 12:24 http://www.biomedcentral.com/1472-6947/12/24 © 2012 Husain et al; licensee BioMed Central Ltd. This is an Open Access article distributed under the terms of the Creative Commons Attribution License (http://creativecommons.org/licenses/by/2.0), which permits unrestricted use, distribution, and reproduction in any medium, provided the original work is properly cited.
Transcript of HERALD (health economics using routine anonymised linked data

RESEARCH ARTICLE Open Access
HERALD (Health Economics using RoutineAnonymised Linked Data)Muhammad J Husain1*, Sinead Brophy2, Steven Macey2, Leila M Pinder2, Mark D Atkinson2, Roxanne Cooksey2,Ceri J Phillips3 and Stefan Siebert2
Abstract
Background: Health economic analysis traditionally relies on patient derived questionnaire data, routine datasets,and outcomes data from experimental randomised control trials and other clinical studies, which are generallyused as stand-alone datasets. Herein, we outline the potential implications of linking these datasets to give onesingle joined up data-resource for health economic analysis.
Method: The linkage of individual level data from questionnaires with routinely-captured health care data allowsthe entire patient journey to be mapped both retrospectively and prospectively. We illustrate this with examplesfrom an Ankylosing Spondylitis (AS) cohort by linking patient reported study dataset with the routinely collectedgeneral practitioner (GP) data, inpatient (IP) and outpatient (OP) datasets, and Accident and Emergency departmentdata in Wales. The linked data system allows: (1) retrospective and prospective tracking of patient pathwaysthrough multiple healthcare facilities; (2) validation and clarification of patient-reported recall data, complementingthe questionnaire/routine data information; (3) obtaining objective measure of the costs of chronic conditions for alonger time horizon, and during the pre-diagnosis period; (4) assessment of health service usage, referral histories,prescribed drugs and co-morbidities; and (5) profiling and stratification of patients relating to disease manifestation,lifestyles, co-morbidities, and associated costs.
Results: Using the GP data system we tracked about 183 AS patients retrospectively and prospectively from thedate of questionnaire completion to gather the following information: (a) number of GP events; (b) presence of aGP ‘drug’ read codes; and (c) the presence of a GP ‘diagnostic’ read codes. We tracked 236 and 296 AS patientsthrough the OP and IP data systems respectively to count the number of OP visits; and IP admissions and duration.The results are presented under several patient stratification schemes based on disease severity, functions, age, sex,and the onset of disease symptoms.
Conclusion: The linked data system offers unique opportunities for enhanced longitudinal health economicanalysis not possible through the use of traditional isolated datasets. Additionally, this data linkage providesimportant information to improve diagnostic and referral pathways, and thus helps maximise clinical efficiency andefficiency in the use of resources.
BackgroundHealth service research have tended to rely on data gen-erated from randomised controlled trials (RCT), obser-vational studies based on patient derived questionnairedata, and routinely assembled data abstracted from theprimary and secondary care patient record - popularlyknown as routine data [1]. Data generated from these
three routes are predominantly used as stand-alonedatasets, and alongside non-health data such as demo-graphic and geographical data [1,2]. The health sectoranalyses are enriched when the patient-level data gener-ated from these different sources are linked. Manycountries worldwide already routinely capture healthcare data that can be used for such purposes. For exam-ple, the Scottish Morbidity Linked Dataset whichencompasses Scottish Health Survey records, linked toNHS acute and psychiatric hospital records, cancer, anddeath registrations provides powerful research database
* Correspondence: [email protected] Management School, Keele University, Staffordshire, ST5 5BG, UKFull list of author information is available at the end of the article
Husain et al. BMC Medical Informatics and Decision Making 2012, 12:24http://www.biomedcentral.com/1472-6947/12/24
© 2012 Husain et al; licensee BioMed Central Ltd. This is an Open Access article distributed under the terms of the Creative CommonsAttribution License (http://creativecommons.org/licenses/by/2.0), which permits unrestricted use, distribution, and reproduction inany medium, provided the original work is properly cited.

http://www.esds.ac.uk/government/shes/; in France,record linkage between a hospital database and theFrench national mortality database offers new prospectsfor large prognostic studies based on hospital data [3];and in Norway, the Medical Birth Registry of Norway isroutinely linked with the Central Population Register,and can be linked with the other central health registers.This paper discusses the potential methodologicaladvantages in the conduct of health economics analysesusing patient-derived questionnaire data linked withroutinely collected information and secondary care clini-cal datasets available in Wales, United Kingdom, withexamples from a research cohort.
MethodsSAIL databankIn order to realise the potential of electronically-heldroutinely collected information to conduct and supporthealth-related research, the Health Information ResearchUnit (HIRU) at the College of Medicine at Swansea Uni-versity, as part of the Welsh Assembly Government’scommitment to the UK Clinical Research Collaboration(UKCRC), has set up the Secure Anonymised Informa-tion Linkage (SAIL) databank [4,5]. The SAIL databankbrings together and links a wide range of person-baseddata. SAIL utilises a split-file approach to anonymisationto overcome issues of confidentiality and disclosure inhealth-related data warehousing by creating personal-level unique and encrypted identifiers for merging infor-mation from various sources [4,5]. The range of comple-mentary sets of data includes clinical data fromrheumatologists, existing routinely collected datasetssuch as the General Practice (GP) records, outpatient(OP) clinical data, inpatient (IP) episodes, accident andemergency (A&E) department, pathology data, NHSadministrative register, breast and cervical cancerscreening data, all Wales injury surveillance system, allWales perinatal survey, congenital anomaly register andinformation service, birth and death data from theOffice for National Statistics, and social servicesdatabases.
Data linkageHIRU uses the MACRAL (Matching Algorithm for Con-sistent Results in Anonymised Linkage) algorithm tocreate encrypted Anonymised Linking Field (ALF) foreach individual [4]. The ALFs are mainly created basedon the patient’s NHS number; and if the NHS numberis absent in a dataset, a mixture of other identifyingvariables like forename, surname, gender, postcode ofresidence, and date of birth are used for probabilisticmatching, while maintaining complete anonymity forthe end users [4]. This linkage allows us to follow thepatient pathway through the NHS system both
retrospectively and prospectively from a reference date(e.g. questionnaire completion date). This system alsoallows linkage of data collected through patient ques-tionnaires with other routinely collected datasets in theSAIL system.
Data linkage with PAS cohortAs part of the Medical Research Council (MRC) PatientResearch Cohort Initiative, a cohort of people withankylosing spondylitis (AS), i.e. the Welsh population-based ankylosing spondylitis (PAS) cohort, has beendeveloped using data collected from patient completedquestionnaires linked with routine data [6]. The studyaims to recruit 1000 AS patients living in Wales andcurrently about 500+ AS patients are participating. Thisstudy has ethical approval from the London Multi-cen-tre Research Ethics committee and the written consentof participants was obtained according to the Declara-tion of Helsinki. For the PAS cohort, the data collectedfrom patients with a diagnosis of AS can be linked toother routinely collected datasets using the SAIL system.To highlight the potential benefits of using the linkedroutine data, this paper uses information on healthcarevisits as reported by the AS patients through question-naires and explores patient pathways in terms of actualevents obtained from the linked GP, OP, IP, and A&Edatasets in the SAIL databank.
Potential benefits of using linked dataThe paper attempts to demonstrate the strength of datalinkage in extracting complementary information fromroutine sources that are beyond the scope and time hor-izon of the study data, and does not intend to testhypotheses with regards to the data quality pertaining tothe specific variable of interest or the individual datasets.The potential benefits of using linked data are discussedbelow.
1. Retrospective and prospective tracking of patientpathwaysWith data spanning multiple years and the ability to linkrecords across several datasets, it is possible using SAILto track the healthcare utilisation history of patients inreceipt of some form of intervention for a given condi-tion across multiple healthcare sectors both before andafter their index/reference healthcare event. Therefore,the SAIL data linkage system allows tracking of thepatient pathways, both retrospectively and prospectively.Linkage with GP data system provides informationabout patients’ primary care events going back manyyears including; previous diagnoses, referrals, presentingsymptoms, investigation results and previous medica-tions. This dataset can also be used to follow the patientat every visit to the GP and therefore record the
Husain et al. BMC Medical Informatics and Decision Making 2012, 12:24http://www.biomedcentral.com/1472-6947/12/24
Page 2 of 12

development of associated conditions and use of co-medications. Linkage with IP data will record all hospitalvisits, surgery and hospital treatment. Linkage with themortality datasets will ensure the dataset remains rele-vant and can examine survival of included patients.Linkage with A&E datasets will give information onemergency visits.
2. Validation of patient-reported recall dataThe use of linked routine data allows cross-checking ofpatient-reported recall data with actual health careevents at the personal level. The inherent limitations (orstrengths) of the data quality pertaining to the surveyquestionnaires under the recall method can be flagged;and an assessment of the generalisability of the patient-reported data can be made. On the other hand, dataobtained from routinely collected data systems oftenrequire careful interpretation with respect to their qual-ity, validity, timelines, bias, confounding and statisticalstability [1]. With the triangulation of datasets in theSAIL system, the validity and reliability of single datasetscan be assessed [6]. The triangulation process will atleast flag the discrepancies, and we can then have anidea about any quality issue pertaining to both the rou-tine and questionnaire data. However, this paper doesnot intend to make assertions with regards to the dataquality of individual datasets, and views the linking ofdatasets primarily as a source of extracting complemen-tary information which are beyond the scope and timehorizon of traditional study data.
3. Objective measure of the cost of illnessCost of illness studies are typically subject to a degree ofscrutiny with regards to the sources and methods ofestimating the quantities and prices, the specification ofstudy perspective, and the identification of the time-frame to which the costs apply [7-9]. The use of linkeddata enhances the precision of the healthcare use infor-mation and the timelines within which the costsincurred; and therefore will help provide an objectiveestimate of the cost and burden of diseases to the fun-ders, health service (NHS in the United Kingdom),society and the individual at each stage of disease over aprolonged period of time.In many conditions there is a delay between the onset
of symptoms and establishing a diagnosis, during whichperiod the patients still utilise healthcare resources. Thelinked routine data can provide information about thepatients’ visits to health care facilities during this symp-tomatic pre-diagnosis period, when the requirement fordiagnostic investigations is often greatest. For example,within the SAIL data system, using the encrypted ALF,we can identify patients from a cohort of any particulardisease who were diagnosed during a reference time (as
indicated by first appearance of a specific diagnosticread code); and link those with various datasets (e.g. GPdata, IP hospital admissions, OP, A&E data etc.) to tracktheir pre-diagnosis visits to healthcare facilities since thedate the symptom onset (as reported by the patients orestablished from the GP or A&E records). This allowsone to compare the extent of health service utilisation,and therefore related costs, before and after the symp-toms developed. In addition, one can also calculate thecosts as a result of delayed diagnosis.The linked healthcare analysis within SAIL need not
be confined to deducing the extent of health service uti-lisation during the pre- and post-diagnosis illness peri-ods but can additionally be performed to ascertain thesize of the direct medical costs associated with the indexillness that are incurred across different healthcare sec-tors. This is possible, for example, with the combineduse of the cost figures included in the Trust FinancialReturn 2 (TFR2) accounts [10] that incorporate expendi-tures relating specifically to A&E attendances, IP admis-sions and OP contacts; and the cross-sector (i.e. primarycare, secondary care, IP, OP, A&E etc.) health servicesutilisation at the individual level obtained from thelinked data system. A system such as the SAIL systemtherefore not only allows the index event for a givencondition to be identified but additionally introduces alongitudinal, temporal, dimension to the analysis as eachof the healthcare sectors captured within SAIL can besearched for multiple years pre- and post-index health-care event to determine the extent of health service uti-lisation and direct medical costs, made possible by theinclusion of an ALF within all of the SAIL datasets. Thisprovides a more objective estimate of the actual costs ofchronic conditions and any interventions.
4. Healthcare pathways and referral historyA retrospective analysis of the patient’s healthcare his-tory can identify the types of referrals to healthcare ser-vices made at different points in time, thus, giving anassessment of health service usage and recommenda-tions for improving patient care pathways. In particular,the linked GP data would provide important informa-tion to improve diagnostic and referral pathways, andthus maximise clinical efficiency and efficiency in theuse of resources. The temporal aspects of the linkeddata sets also help conducting event history analysis,survival analysis and other relevant statistical and econo-metric models.
5. Profiling of patientsThe linked SAIL data includes diverse sets of informa-tion, which enables profiling and stratification ofpatients relating to disease manifestations and severity,lifestyle, co-morbidities, and associated costs.
Husain et al. BMC Medical Informatics and Decision Making 2012, 12:24http://www.biomedcentral.com/1472-6947/12/24
Page 3 of 12

Additionally, given that many chronic conditions haveheterogeneous manifestations with a variable course andunpredictable episodes of exacerbation, the analysis canbe carried out under several person stratificationschemes based on severity of disease, various demo-graphic attributes, and socio-economic conditions. Thisstratification will facilitate early targeting of interven-tions to patients at highest risk, thereby improving thecost-effectiveness ratio of these interventions.
ResultsAn example using a patient with ankylosing spondylitisHere we present an example of one AS patient’s healthservice usage history by tracking the healthcare eventsthrough the linked datasets and comparing this withself-reported data. To preserve complete anonymity, theactual dates are modified by replacing with fictitiousdates. As part of the PAS cohort study, the patient com-pleted a questionnaire during the first week of Novem-ber 2009, in which s/he was asked to recall the numberof visits to the GP, OP, IP, A&E, and to various healthprofessionals during the three months before the ques-tionnaire completion date. The patient reported 4 GPvisits, 1 OP visit, 1 IP visit, no A&E visit, and visited arheumatologist, a radiologist, and a chiropractor onceeach. Distances to the healthcare facilities were 1 mile,3.5 miles, and 3 miles for GP, OP, and IP, respectively.In each case the patient used their own car; and wasaccompanied by someone during the GP and IP visits.The patient also reported having taken pain reducingmedicines (paracetamol, ibuprofen, and naproxen); hav-ing undergone an MRI scan and had blood and urinetests during the 3 months recall period.Using the unique ALF, we tracked the patient’s health-
care pathways through the routine data in SAIL system.Figure 1 plots the patient’s healthcare events from theOP, GP, and A&E datasets for a 2 year period (i.e.August 2008 to August 2010), which represents thetimeline approximately one year before and one yearafter the completion date of the questionnaire by thepatient.The linked routine data show 10 GP events, 2 OP vis-
its and 1 A&E visit during the 3 month recall period.There is no IP visit recorded during this period. There-fore, the self-reported IP visit in the questionnaire mayactually be an A&E visit, which would correlate with theroutine data. Out of those 10 GP events, not all of themare physical visits by the patients, but may include anyevent (e.g. letter encounter, prescription collection, tele-phone conversation etc.). Further exploration of the GPread codes and descriptions for these 10 GP eventsyields information about medication, tests, and other GPrelated encounters, as shown in Table 1. Retrospectiveand prospective tracking of events reveals that there are
51 such GP events during the 2 year period (Figure 1).There are no OP, IP, or A&E visits before or after therecall period, indicating the danger of extrapolatingpatient reported 3 month recall data in the question-naire over a longer period (e.g. one year). However,going further back through the linked data system interms of the timeline (not shown in the figure), it wasfound that the patient made 4 OP visits during August,October, and November of 2005; and 1 IP visit on thefirst week of June 1999.
Examples using the PAS cohort linked to GP data systemUsing the GP data we tracked about 183 AS patientsfrom the PAS cohort retrospectively and prospectivelyfrom the date of questionnaire completion to gather thefollowing information: (a) number of GP events; (b) pre-sence of a GP parent family ‘drugs’ read codes; and (c)the presence of a GP parent family ‘diagnostic’ readcodes.GP events and visits from the linked routine andquestionnaire dataTable 2 presents the average number of GP events forthe AS patients grouped under several stratificationschemes based on baseline disease severity score (lowand high BASDAI); disease function score (low and highBASFI); age, sex, and the age of the onset of first symp-toms. Results are presented for the retrospective 3months recall period, 1 year period, and 5 years period -the questionnaire completion dates being the referencedate for each patient. In the last column of Table 2, wepresent the self-reported number of GP visits during the3 month period from the questionnaires. As mentionedearlier the GP ‘event’ and ‘visits’ are to be construed dif-ferently. The GP event is defined as the unique dates foreach patient where we can find GP read codes indicat-ing administrative actions, referrals, visits, telephoneconversation, prescription collection, symptoms, diagno-sis, prescription drugs etc., pertaining to the particularpatient. The GP visits refer to the physical visits to theGP by the patient. In the questionnaire the patientswere asked about the visits to the GP. In the presenceof numerous read codes, it is beyond the scope thispaper to identify ‘visits’ from within the ‘events’. Never-theless, the number of actual visits obtained from thequestionnaire can be used as complementary informa-tion as to what proportion of the GP events were GPvisits.Table 2 shows that the patients with low disease
severity have less GP visits and events than the patientswith high disease severity. The patients with low diseaseseverity, had 2.81, 12.92, and 61.92 events recorded inthe GP system during the 3 months, 1 year, and 5 yearretrospective period as opposed to 4.25, 17.79, and 80.28events for the high disease severity groups. These ratios
Husain et al. BMC Medical Informatics and Decision Making 2012, 12:24http://www.biomedcentral.com/1472-6947/12/24
Page 4 of 12

Figure 1 Healthcare Pathway of an AS Patient. Each shape indicates a separate event (date) captured in the relevant datasets. The X-axiscaptures events for a period of two years (i.e. 730 days). Therefore, the GP event markers appear almost overlapped when events occurred intwo consecutive dates (e.g. 31st August and 1st September). The questionnaire completion date is 05 November, 2009. The three month patientrecall period is captured by the two vertical dashed lines, indicating the dates 07 August and 05 November. There are 10 GP events during thistime interval, including the overlapped ones.
Table 1 Patient’s GP Read codes during the 3 month recall period
GP EventDate
(sl) GP Read Codes: Descriptions Comment
10 August (i) fh1k: PREMIQUE 0.625 mg/5 mg tablets; (ii)b211: BEMDROFLUAZIDE 2.5 mg tablets; (iii) b211: BENDROFLUMETHIAZIDE 2.5 mgtablets; (iv) bxd2: SIMVASTATIN 20 mg tablets; (v) Bd35: ATENONOL 50 mg tablets
GP visit/Prescription collection
31 August 1969: Abdominal pain System reporting of A&E admission on 30August
01September
Discharge Summary System reporting of A&E discharge summary(ref: 30 August A&E admission)
17September
(i) fh1k: PREMIQUE 0.625 mg/5 mg tablets; (ii)b211: BEMDROFLUAZIDE 2.5 mg tablets; (iii) b211: BENDROFLUMETHIAZIDE 2.5 mgtablets; (iv) bxd2: SIMVASTATIN 20 mg tablets; (v) Bd35: ATENONOL 50 mg tablets; (vi)j2ck: NAPROXEN 250 mg e/c tablets; (vii) 246..: O/E blood pressure; (viii) di21:PARACETAMOL 500 mg; (ix) 8B4: Repeat Prescription.
GP Visit
23September
(i) 52...: Plain Radiography; (ii) 52....:Plain X-Ray GP visit
07October
(i) bd35: ATENONOL 50 mg tablets; (ii)b211: BEMDROFLUAZIDE 2.5 mg tablets; (iii) bxd2: SIMVASTATIN 20 mg tablets; (iv) 8CB..:Had a chinwag with patient; (v) 8CB..: Had a discussion with patient.
GP visit
11October
9 N4..: Failed encounter No visit
28October
(i) b211: BEMDROFLUAZIDE 2.5 mg tablets; (ii) b211: BENDROFLUMETHIAZIDE 2.5 mgtablets; (iii) bxd2: SIMVASTATIN 20 mg tablets; (iv) Bd35: ATENONOL 50 mg tablets (v)j2ck: NAPROXEN 250 mg e/c tablets
GP visit/prescription collection
30October
(i) j2ck: NAPROXEN 25 mg e/c tablets Prescription collection
04November
(i) 9 N36: Letter from specialist; (ii) Letter from consultant No visit
Husain et al. BMC Medical Informatics and Decision Making 2012, 12:24http://www.biomedcentral.com/1472-6947/12/24
Page 5 of 12
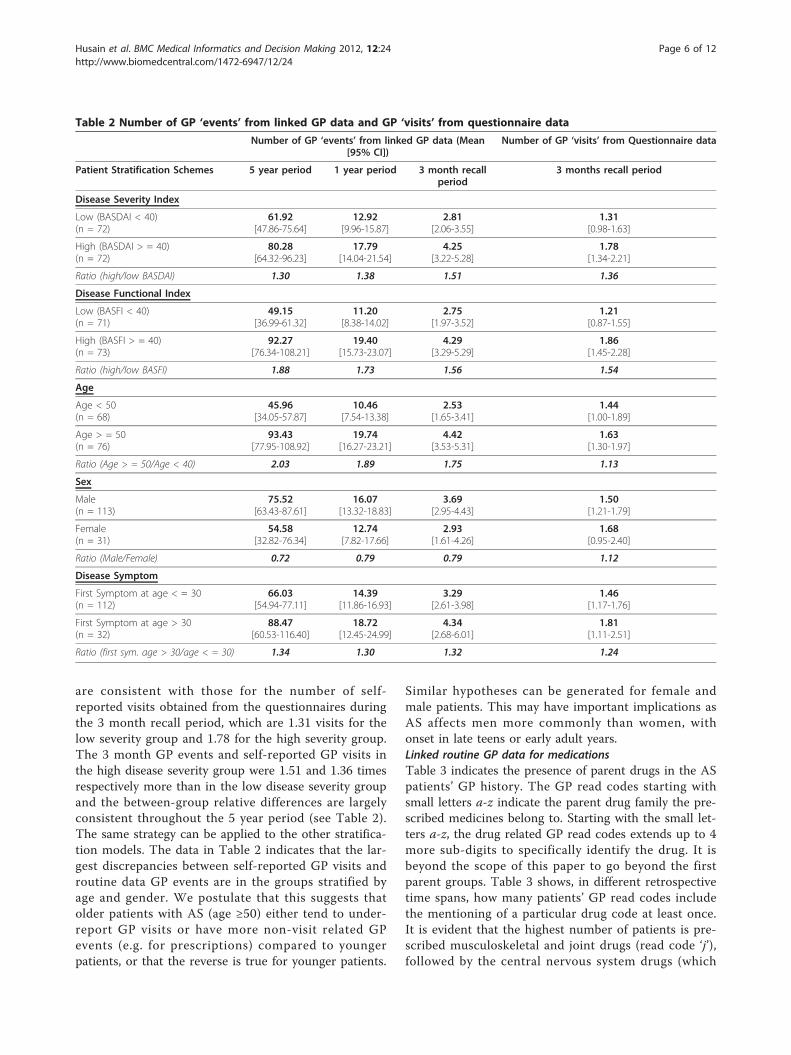
are consistent with those for the number of self-reported visits obtained from the questionnaires duringthe 3 month recall period, which are 1.31 visits for thelow severity group and 1.78 for the high severity group.The 3 month GP events and self-reported GP visits inthe high disease severity group were 1.51 and 1.36 timesrespectively more than in the low disease severity groupand the between-group relative differences are largelyconsistent throughout the 5 year period (see Table 2).The same strategy can be applied to the other stratifica-tion models. The data in Table 2 indicates that the lar-gest discrepancies between self-reported GP visits androutine data GP events are in the groups stratified byage and gender. We postulate that this suggests thatolder patients with AS (age ≥50) either tend to under-report GP visits or have more non-visit related GPevents (e.g. for prescriptions) compared to youngerpatients, or that the reverse is true for younger patients.
Similar hypotheses can be generated for female andmale patients. This may have important implications asAS affects men more commonly than women, withonset in late teens or early adult years.Linked routine GP data for medicationsTable 3 indicates the presence of parent drugs in the ASpatients’ GP history. The GP read codes starting withsmall letters a-z indicate the parent drug family the pre-scribed medicines belong to. Starting with the small let-ters a-z, the drug related GP read codes extends up to 4more sub-digits to specifically identify the drug. It isbeyond the scope of this paper to go beyond the firstparent groups. Table 3 shows, in different retrospectivetime spans, how many patients’ GP read codes includethe mentioning of a particular drug code at least once.It is evident that the highest number of patients is pre-scribed musculoskeletal and joint drugs (read code ‘j’),followed by the central nervous system drugs (which
Table 2 Number of GP ‘events’ from linked GP data and GP ‘visits’ from questionnaire data
Number of GP ‘events’ from linked GP data (Mean[95% CI])
Number of GP ‘visits’ from Questionnaire data
Patient Stratification Schemes 5 year period 1 year period 3 month recallperiod
3 months recall period
Disease Severity Index
Low (BASDAI < 40)(n = 72)
61.92[47.86-75.64]
12.92[9.96-15.87]
2.81[2.06-3.55]
1.31[0.98-1.63]
High (BASDAI > = 40)(n = 72)
80.28[64.32-96.23]
17.79[14.04-21.54]
4.25[3.22-5.28]
1.78[1.34-2.21]
Ratio (high/low BASDAI) 1.30 1.38 1.51 1.36
Disease Functional Index
Low (BASFI < 40)(n = 71)
49.15[36.99-61.32]
11.20[8.38-14.02]
2.75[1.97-3.52]
1.21[0.87-1.55]
High (BASFI > = 40)(n = 73)
92.27[76.34-108.21]
19.40[15.73-23.07]
4.29[3.29-5.29]
1.86[1.45-2.28]
Ratio (high/low BASFI) 1.88 1.73 1.56 1.54
Age
Age < 50(n = 68)
45.96[34.05-57.87]
10.46[7.54-13.38]
2.53[1.65-3.41]
1.44[1.00-1.89]
Age > = 50(n = 76)
93.43[77.95-108.92]
19.74[16.27-23.21]
4.42[3.53-5.31]
1.63[1.30-1.97]
Ratio (Age > = 50/Age < 40) 2.03 1.89 1.75 1.13
Sex
Male(n = 113)
75.52[63.43-87.61]
16.07[13.32-18.83]
3.69[2.95-4.43]
1.50[1.21-1.79]
Female(n = 31)
54.58[32.82-76.34]
12.74[7.82-17.66]
2.93[1.61-4.26]
1.68[0.95-2.40]
Ratio (Male/Female) 0.72 0.79 0.79 1.12
Disease Symptom
First Symptom at age < = 30(n = 112)
66.03[54.94-77.11]
14.39[11.86-16.93]
3.29[2.61-3.98]
1.46[1.17-1.76]
First Symptom at age > 30(n = 32)
88.47[60.53-116.40]
18.72[12.45-24.99]
4.34[2.68-6.01]
1.81[1.11-2.51]
Ratio (first sym. age > 30/age < = 30) 1.34 1.30 1.32 1.24
Husain et al. BMC Medical Informatics and Decision Making 2012, 12:24http://www.biomedcentral.com/1472-6947/12/24
Page 6 of 12

include analgesics) (d). Other drug classes frequentlyrecorded in the AS patients include gastro-intestinal sys-tem drugs (a), cardiovascular system drugs (b), and theskin drugs (m), which is consistent with the associationof these diseases with AS. One could go beyond the par-ent read codes and specifically identify exactly whichdrug was prescribed at which date. The drug codes forthe 3 months after (prospective) the dates of baselinequestionnaire completion for 103 AS patients are shownin the last column of Table 3.Routine GP data for associated diagnosisTable 4 similarly shows the presence of parent diseasediagnostic read codes (start with capital letters A-Z) inthe GP data system for the AS patients at 10 years, 5years, 1 year and 3 months retrospective, and 3 monthsprospective time span, relative to the date of question-naire completion. The most frequent disease group asindicated by the read codes fall under the musculoskele-tal/connective tissue (N), skin/subcutaneous tissue dis-ease (M), nervous system/sense organ diseases (F),respiratory system disorders (H), digestive system disor-ders (J), symptoms, signs, ill-defined conditions (R), andinfectious/parasitic diseases (A). These are consistentwith the conditions that are associated with AS (e.g. psor-iasis, uveitis, colitis) or complicate the treatment (e.g.respiratory infections in patients on immunosuppressive
therapy). Again, further exploration of the parent readcodes by going beyond the first digit would reveal thespecific disease diagnosis.
Examples using the PAS cohort linked to OP and IP datasystemsWe tracked 236 and 296 AS patients retrospectivelythrough the OP and IP data systems respectively toderive the average number of OP visits and IP admis-sions made by the patients grouped under different stra-tification schemes. The results are presented in Table 5.The table has two panels - columns 1-4 relate to OPvisits, and columns 5-8 relate to the IP admissions.OP visitsThe estimates in columns 3 and 4 of Table 5 report theaverage number of visits for the 3 months recall periodobtained from the routine data system and the question-naires respectively. In principle, the numbers in thesetwo columns should match as they relate to OP visitsonly. It is observed that patients in all groups tend tooverestimate the number of OP visits in the question-naire. The over-reporting of OP visits is most marked inthose with high disease activity (BASDAI) and func-tional impairment (BASFI). We postulate that one rea-son for this may be as a result of these patients findingit more difficult to physically attend OP clinics due to
Table 3 Presence of Parent Drug & Appliances Read Codes for the AS Patients
ParentRead Code
Disease Group Retrospective Prospective
10 year(n = 183)
5 year(n = 164)
1 year(n = 147)
3 months(n = 120)
3 months(n = 103)
a Gastro-intestinal system drugs 123 103 75 47 42
b Cardiovascular system drugs 69 65 50 39 36
c Respiratory system drugs 74 56 30 18 20
d Central nervous system drugs 147 125 83 52 40
e Drugs for infectious diseases 139 114 59 20 18
f Endocrine drugs 63 56 29 19 13
g Obs/gynae/urinary drugs 42 33 22 8 6
h Malignant & immunosuppr. drug 19 13 9 8 8
i Haematology/dietetic drugs 54 44 29 18 17
j Musculoskeletal & joint drugs 157 134 89 59 52
k Eye drugs 61 48 26 11 9
l Ear, nose & oropharynx drugs 61 48 16 7 6
m Skin drugs 105 90 46 23 17
n Immunology drugs & vaccines 48 38 15 3 0
o Anaesthetics 10 7 1 0 0
p Appliances & reagents etc. 41 37 14 8 8
q Incontinence Appliances 2 2 2 1 1
s Contrast media 8 8 5 3 2
Note: Baseline questionnaire completion is the reference date. The last column applies to the patients whose data in the GP system exist at least 3 months postquestionnaire completion date
Husain et al. BMC Medical Informatics and Decision Making 2012, 12:24http://www.biomedcentral.com/1472-6947/12/24
Page 7 of 12

their greater disease activity and disability. Again, thismay have important implications when using patient-reported data to estimate utilisation of healthcareresources. Figure 2 shows the number of self-reportedand recorded OP visits by the AS patients. The x-axisshows the number of visits during the 3 months recallperiod self-reported in the questionnaire and the y-axisshows the corresponding number of visits obtained fromthe records of OP data. The numbers in the bracket isthe number of patients. For instance, out of 79 patientswho reported in the questionnaire to have visited onceto the OP during the 3 months recall period, we found29 patients with zero visit, 34 patients with 1 visit, 9patients with 2 visits, and 7 patients more than 2 visits.It can be seen that in general, the patients overestimatedthe number of OP visits when completing the question-naires. 29 patients reported an OP visit that was notrecorded during the 3 month recall period, highlightingissues with using recall data.IP visitsIn the second panel of Table 5 (i.e. columns 5-8), wetracked 296 AS patients through the IP data system toobtain the number of IP admissions. Again, in princi-ple, columns 7 and 8 should match, and indeed these
results for IP admissions are more similar than thecorresponding data for OP visits (columns 3 and 4).The results in columns 7 and 8 suggest that, in con-trast to OP visits, patients tend to underestimate thenumber of IP visits. Younger patients and those withless severe disease severity (BASDAI) and functionalimpairment (BASFI) were most likely to underesti-mate IP admissions. We postulate that this is becausethe admission in these patients was more likely to befor a reason unrelated to their AS, and therefore over-looked and not reported in a questionnaire for an ASstudy.Tracking through the retrospective data of those who
had at least one IP admission, Table 6 indicates addi-tional complementary information on the number ofdays spent in hospital. This information was not cap-tured in the questionnaire data. These data indicate thatolder patients, those with longer disease duration, higherdisease activity and functional impairment spent signifi-cantly more days in hospital than their relevant compar-ison groups. This may also have been a contributoryfactor to the relative under-reporting of IP admissionsin patients with lower disease severity or functionalimpairment.
Table 4 Presence of Parent Diagnosis Read Codes for the AS Patients
ParentRead Code
Disease Group Retrospective Prospective
10 year(n = 183)
5 year(n = 164)
1 year(n = 147)
3 months(n = 120)
3 months(n = 103)
A Infectious/parasitic diseases 49 35 15 5 1
B Neoplasms 26 16 1 0 0
C Endocr/nutr/metabolic/immun. 42 26 7 0 0
D Blood/blood forming organs 14 9 2 1 1
E Mental disorders 35 26 10 4 0
F Nervous system/sense organ 92 78 25 13 3
G Circulatory system diseases 67 44 6 3 4
H Respiratory system disorders 88 72 25 4 5
J Digestive system disorders 81 47 14 6 7
K Genitourinary system diseases 47 36 8 1 0
L Pregnancy/childbirth/puerperium 1 0 0 0 0
M Skin/subcutaneous tissue diseases 94 77 27 3 6
N Musculoskeletal/connective tissue 149 110 36 9 11
P Congenital anomalies 0 0 0 0 0
Q Perinatal conditions 0 0 0 0 0
R Symptoms, signs, ill-defined conditions 60 48 14 4 4
S Injury and self poisoning 56 31 9 1 2
T Causes of injury/poisoning 21 12 3 0 0
U External causes morbdty/mortlty 2 1 0 0 0
Z Unspecified conditions 29 22 5 3 1
Note: Baseline questionnaire completion is the reference date. The last column applies to the patients whose data in the GP system exist at least 3 months postquestionnaire completion date
Husain et al. BMC Medical Informatics and Decision Making 2012, 12:24http://www.biomedcentral.com/1472-6947/12/24
Page 8 of 12

DiscussionThe above examples demonstrate that linked routinedata enables validation and clarification of patientreported data; the retrospective and prospective trackingof the patient healthcare utilization and pathways; andthe referral history in a cohort of patients with AS. Suchanalysis makes it possible to deduce whether the anon-ymised individuals in question were suffering any com-mon co-morbidities, in receipt of healthcare treatmentprior to the occurrence of the reference event, whilst italso allows any frequent complications requiring medicalattention in the days, months, years following the event
(which could be an intervention or questionnaire) to beidentified. From the methodological perspective, anylinkage system would add new dimensions and perspec-tive to traditional health related research (e.g. comple-ment and enhance the results of RCTs), as a resourcefor clinical audits, and in a variety of health impactassessment exercises. For example, the longitudinal rou-tine data would allow an assessment of the impact ofspecific healthcare interventions on subsequent health-care utilisation (e.g. A&E visits or hospital admission).Important limitations of solely relying on questionnairedata include reliance on accurate patient recall and that
Table 5 Number of outpatient (OP) visits and inpatient (IP) admissions from linked and questionnaire data
Number of OP Visits fromlinked data
(Mean [95% CI])
# of self-reported OP visitsfrom Questionnaire
Average Number of IPadmissions from linked
data(Mean [95% CI])
# of self-reported IPadmissions fromQuestionnaire
1 2 3 4 5 6 7 8
PatientStratificationSchemes
5 year 1year
3 monthrecall period
3 months recall period 5year
1year
3 monthrecall period
3 months recall period
Disease Severity Index
Low (BASDAI <40)(n = 119 & 133)
16.78[13.50-20.06]
3.84[2.96-4.72]
0.87[0.64-1.09]
1.06[0.76-1.36]
2.43[1.38-3.48]
0.59[0.26-0.91]
0.11[0.05-0.17]
0.08[0.03-0.13]
High (BASDAI > =40)(n = 117 & 163)
21.89[16.87-26.91]
6.12[4.29-7.95]
1.51[1.06-1.97]
2.55[1.54-3.55]
3.01[2.27-3.76]
0.74[0.51-0.97]
0.17[0.10-0.23]
0.14[0.07-0.21]
Disease Functional Index
Low (BASFI < 40)(n = 110 & 117)
14.17[11.23-17.12]
3.05[2.28-3.81]
0.73[0.53-0.93]
0.90[0.62-1.18]
2.31[1.06-3.55]
0.46[0.12-0.80]
0.11[0.05-0.17]
0.05[0.01-0.09]
High (BASFI > =40)(n = 126 & 179)
23.80[18.93-28.67]
6.65[4.92-8.39]
1.59[1.16-2.02]
2.58[1.64-3.52]
3.04[2.40-3.69]
0.81[0.58-1.04]
0.16[0.10-0.22]
0.16[0.09-0.23]
Age
Age < 50(n = 90 & 164)
18.29[14.64-21.94]
5.07[3.10-7.03]
1.30[0.81-1.79]
1.72[0.80-2.65]
1.91[1.29-2.54]
0.49[0.24-0.74]
0.16[0.08-0.25]
0.05[0.01-0.09]
Age > = 50(n = 146 & 192)
19.95[15.65-24.24]
4.91[3.79-6.03]
1.12[0.84-1.39]
1.84[1.20-2.48]
3.21[2.31-4.11]
0.77[0.51-1.04]
0.13[0.08-0.18]
0.15[0.08-0.22]
Sex
Male(n = 183 & 218)
18.20[14.85-21.55]
4.35[3.48-5.22]
1.02[0.79-1.25]
1.60[1.08-2.12]
2.47[1.96-2.97]
0.55[0.40-0.69]
0.13[0.08-0.18]
0.10[0.05-0.15]
Female(n = 53 & 76)
23.15[16.50-29.80]
7.11[3.71-10.52]
1.77[0.98-2.57]
2.47[0.95-4.00]
3.59[1.62-5.57]
1.03[0.40-1.66]
0.16[0.06-0.26]
0.14[0.05-0.24]
Disease Symptom
First Symptom atage < = 30(n = 182 & 226)
19.04[15.51-22.57]
4.81[3.59-6.04]
1.23[0.92-1.54]
1.85[1.20-2.51]
2.38[1.95-2.81]
0.58[0.42-0.73]
0.14[0.09-0.19]
0.10[0.05-0.15]
First Symptom atage > 30(n = 54 & 70)
20.22[14.69-25.75]
5.50[3.86-7.14]
1.04[0.68-1.40]
1.61[0.95-2.27]
3.97[1.71-6.23]
0.99[0.33-1.65]
0.16[0.05-0.26]
0.17[0.06-0.28]
Husain et al. BMC Medical Informatics and Decision Making 2012, 12:24http://www.biomedcentral.com/1472-6947/12/24
Page 9 of 12

the healthcare events of interest may not occur withinthe limited recall period (e.g. 3 months), but just beforethe recall period or after the completion date of thequestionnaire. This makes extrapolation of the question-naire data for an extended period of time unreliable.The longitudinal linked routine data comes into aid inthis respect.The linkage of the questionnaire data from the PAS
patients with the GP data as shown above enhances andhelps make sense of the rich information obtained fromthe GP Read codes. This constitutes a rich health historyfor these AS patients, for whom we can carry out patientpathway analysis from various clinical and economicaspects. In particular, in keeping with other AS cohorts,these patients had an average lag of about 8 years fromsymptom onset to AS diagnosis, on which we can conductpre- and post-diagnosis analyses of health care utilisation.Again, a matrix of traits based on the PAS question-
naire information linked with the SAIL data system willhelp profiling of AS patients for health and other relatedinterventions. Table 7 summarises the types of informa-tion gathered through the PAS questionnaires, whichcould all be linked with the routine data sources as well
as various demographic, socio-economic, and environ-mental attributes of the patients.The use of HERALD methodology can stratify groups of
patients to identify the early characteristics of patientswho subsequently develop severe disease, thus, enablingthese patients to be targeted with early aggressive therapyin order to prevent severe damage and need for surgery.This profiling can be used to estimate the potentialresource savings of focusing treatment on those patientswith patterns of disease suggestive of the development of asevere outcome. All these will directly affect patient carefor AS in terms of informing NHS service provision andNICE guidelines for the use of expensive biological thera-pies, and informing the process of assessment of cost-effectiveness. In principle, the methods developed for thePAS cohort and described here can be extrapolated to beused in other chronic disease conditions [6]; thus improv-ing patient care for all those conditions. Linked routinedata provides many opportunities for enhanced healthcareresearch and allows evaluation of impacts beyond the lim-ited primary outcomes of interventional studies. As anexample, the expanding SAIL databank in Wales alreadyholds over a billion anonymised records from various
Figure 2 Outpatient (OP) visits from routine data and self-reported patient recall. Brackets indicate numbers of patients.
Husain et al. BMC Medical Informatics and Decision Making 2012, 12:24http://www.biomedcentral.com/1472-6947/12/24
Page 10 of 12

databases, which can be anonymously linked at the indivi-dual record level. The combination of routine data withinformation from patients and RCTs allows the validationof real-life data and its application for clinical research.These linkable databases provide factual and continuousinformation with rich clinical and non-clinical details,
which offers wide ranging opportunities in the realm ofconducting evaluative research, clinical epidemiology, trialrecruitment, genetic research, basic research of biologicalmarkers, stratified medicine, post-trial surveillance, riskassessment, service delivery evaluation, resource use, deci-sion analysis, identification of early disease predictors, and
Table 6 Inpatient (IP) Spells: Average Number of days as IP from Linked IP data
Patient Stratification Schemes Average Number of days as IP from Linked IP data(Mean [# attended][95% CI])
5 years 1 year 3 months recall period
Disease Severity Index
Low (BASDAI < 40) 10.82[n = 100] [7.48-14.16]
5.06[n = 36] [3.04-7.07]
1.43[n = 14] [0.94-1.92]
High (BASDAI > = 40) 12.97[118] [9.16-16.79]
5.62[58] [3.87-7.37]
2.33[24] [1.02-3.64]
Disease Functional Index
Low (BASFI < 40) 9.31[81] [6.03-12.59]
4.04[25] [1.51-6.57]
1.25[12] [0.96-1.54]
High (BASFI > = 40) 13.57[137] [9.99-17.15]
5.90[69] [4.36-7.44]
2.35[26] [1.13-3.56]
Age
Age < 50 7.11[75] [4.74-9.48]
3.37[30] [1.75-4.98]
1.4[15] [0.94-1.86]
Age > = 50 14.55[143] [10.90-18.19]
6.36[64] [4.63-8.09]
2.39[23] [1.03-3.75]
Sex
Male 12.13[158] [9.22-15.04]
4.93[69] [3.47-6.38]
2.00[27] [0.90-3.10]
Female 11.72[58] [6.14-17.31]
6.83[24] [3.79-9.87]
2.00[10] [0.57-3.43]
Disease Symptom
First Symptom at age < = 30 10.96[170] [8.14-13.77]
4.65[75] [3.31-6.00]
1.38[29] [1.12-1.64]
First Symptom at age > 30 15.63[48] [9.59-21.66]
8.37[19] [4.76-11.98]
4.00[9] [0.37-7.63]
Table 7 PAS Questionnaire Contents
Questionnaire(Time Interval)
Summary of Information
Baseline(0)
Co-morbidities, family history, age of diagnosis and first symptoms, disease activity [11], function [12], Quality of life (EQ-5D) [13],and visits to health professionals
Not at work(3 Months)
Previous occupation, activity impairment questionnaire
At work(3 months)
Work questionnaire, including information about current and previous occupation, activity impairment and work limitationsquestionnaire (WLQ) [14], work productivity and activity impairment questionnaire (WPAI-SHP) [15,16]
AS costs(9 months)
AS Cost questionnaire including detailed patient-level information about visits to health care facilities, professionals, AS relatedpathology and other tests, other conditions, medications, costs of various aspects of treatment and disability
Exercise andFatigue(15 months)
International Physical Activity Questionnaire (IPAQ) [17], disease activity, function, Behavioural Regulation in ExerciseQuestionnaire (BREQ-2) [18], Pittsburgh Sleep Quality Index [19], and the Hospital Anxiety and Depression Scale [20,21])
Medication(0,3,6,9,12,15Months)
Medication
Legend: AS patients in the PAS cohort were asked to consent to completing questionnaires either online if they have internet access, or by post. A website hasbeen developed to give access to the questionnaires http://www.ashealth.co.uk/
Husain et al. BMC Medical Informatics and Decision Making 2012, 12:24http://www.biomedcentral.com/1472-6947/12/24
Page 11 of 12

the identification of subjects for prospective studies[6,22,23]. This data system also offers the opportunity forpost-marketing surveillance and pharmacovigilance of newexpensive, and often potentially dangerous, healthcareinterventions in real-life settings. Complementing thisresource with targeted health economic analysis, as pro-posed in the HERALD methodology, offers a uniqueopportunity to deliver the level of health economic datarequired to evaluate and drive forward cost-effective mod-ern healthcare services.
ConclusionThe linkage of routine data, patient completed question-naires and trial data offers unique opportunities forenhanced health economic analysis, including assess-ment of the validity, reliability and generalisability ofhealth economic data not possible through the use oftraditional isolated datasets. The information obtainedfrom the linked data system would help improvingpatient pathways, and thus maximise clinical efficiencyand efficiency in the use of resources.
AcknowledgementsFunding for the PAS cohort was provided by a Medical Research Council(MRC) and National Institute for Social Care and Health Research (NISCHR)grant (G080058). This study makes use of anonymised data held in theSecure Anonymised Information Linkage (SAIL) system, which is part of thenational e-health records research infrastructure for Wales. We would like toacknowledge all the data providers who make anonymised data available forresearch.
Author details1Keele Management School, Keele University, Staffordshire, ST5 5BG, UK.2College of Medicine, Swansea University, Wales, SA2 8PP, UK. 3College ofHuman and Health Sciences, Swansea University, Wales SA2 8PP, UK.
Authors’ contributionsAll authors were involved in the design of the HERALD protocol. The firstdraft of the paper was written by MJH, SB, and SS. Subsequent drafts wereamended and finally approved by all the authors.
Authors’ informationMJH is a Lecturer in Economics at Keele Management School, KeeleUniversity; and also worked as a health economist at the College ofMedicine, Swansea University during 2010/11. SB is a Reader inEpidemiology and has worked for 15 years in the field ofspondyloarthropathy. SS is a Clinical Senior Lecturer and HonoraryConsultant Rheumatologist (MBBCh, MRCP, PhD) whose specialist clinicaland research interest is Spondyloarthritis.
Competing interestsThe authors declare that they have no competing interests.
Received: 21 April 2011 Accepted: 29 March 2012Published: 29 March 2012
References1. McLean G: A review of the use of routine data on CHD in general
practice research in Scotland. Scott Med J 2005, 50(3):109-113.2. Hansell A, Aylin P: Routine data and health impact assessment - a review
of epidemiological studies of socio-economic influence on health andevaluation of outcome indicators derived from routine health data forhealth impact assessment. Report to the Department of Health The Small
Area Health Statistics Unit, Dept of Epidemiology and Public Health,Imperial College School of Medicine at St Mary’s; 2000.
3. Fournel I, Schwarzinger M, Binquet C, Benzenine E, Hill C, Quantin C:Contribution of record linkage to vital status determination in cancerpatients. Stud Health Technol Inform 2009, 150:91-95.
4. Lyons RA, Jones KH, John G, Brooks CJ, Verplancke JP, Ford DV, Brown G,Leake K: The SAIL databank: linking multiple health and social caredatasets. BMC Med Inform Decis Mak 2009, 9:3.
5. Ford DV, Jones KH, Verplancke JP, Lyons RA, John G, Brooks CJ,Thompson S, Bodger O, Couch T, Leake K: The SAIL databank: building anational architecture for e-health research and evaluation. BMC Heal ServRes 2009, 9:157.
6. Atkinson MD, Brophy S, Siebert S, Gravenor MB, Phillips C, Ford DV,Jones KH, Lyons RA: Protocol for a population-based AnkylosingSpondylitis (PAS) cohort in Wales. BMC Musculoskelet Disord 2010, 11:197.
7. Graves N, Walker D, Raine R, Hutchings A, Roberts JA: Cost data forindividual patients included in clinical studies: no amount of statisticalanalysis can compensate for inadequate costing methods. In HealthEconomics. Volume 11. John Wiley & Sons, Ltd; 2002:(8):735-739.
8. Halliday RG, Darba J: Cost data assessment in multinational economicevaluations: some theory and review of published studies. Appl HealthEcon Health Policy 2003, 2(3):149-55.
9. Drummond MF, Sculpher MJ, Torrance GW, O’Brien BJ, Stoddart GL:Methods for the Economic Evaluation of Health Care Programmes. OUPOxford;, 3 2005.
10. Department of Health: NHS Trust financial returns form 2 (TFR2)specialty-specific costs per in patient day for hospital inpatient care andday case car. London: HMSO; 2000.
11. Garrett S, Jenkinson T, Kennedy LG, Whitelock H, Gaisford P, Calin A: A newapproach to defining disease status in ankylosing spondylitis: the BathAnkylosing Spondylitis Disease Activity Index. J Rheumatol 1994,21:2286-2291.
12. Calin A, Jones SD, Garrett SL, Kennedy LG: Bath ankylosing-spondylitisfunctional index. British J Rheumatol 1995, 34:793-794.
13. Cheung K, Oemar M, Oppe M, Rabin R: EQ-5D user guide. Basic informationon how to use EQ-5D Rotterdam EuroQol Group; 2009.
14. Lerner D, Amick BC III: Rogers WH, Malspeis S, Bungay K, Cynn D: TheWork Limitations Questionnaire: a self-administered instrument forassessing on-the-job work disability. Med Care 2001, 39:72-85.
15. WPAI general information, Reilly Associates. [http://www.reillyassociates.net/].
16. Reilly MC, Gooch KL, Wong RL, Kupper H, van der Heijde D: Validity,reliability and responsiveness of the work productivity and activityimpairment questionnaire in ankylosing spondylitis. Rheumatology 2010,49:812-819.
17. The International Physical Activity Questionnaire. [http://www.ipaq.ki.se/ipaq.htm].
18. Markland T, Tobin V: A modification to the behavioural regulation inexercise questionnaire to include an assessment of amotivation. J SportExercise Psychol 2004, 26:191-196.
19. Buysse DJ, Reynolds CF III, Monk TH, Berman SR, Kupfer DJ: The Pittsburghsleep quality index: a new instrument for psychiatric practice andresearch. Psychiatry Research 1989, 28:193-213.
20. Zigmond AS, Snaith RP: The hospital anxiety and depression scale. ActaPsychiatr Scand 1983, 67:361-370.
21. Snaith RP: The hospital anxiety and depression scale. Health Qual LifeOutcomes 2003, 1:29.
22. Black N: High-quality clinical databases: breaking down barriers. Lancet1999, 353:1205-1206.
23. Tierney WM, McDonald CJ: Practice databases and their uses in clinicalresearch. Statistics in Medicine 1999, 10:541-557, doi: 10.1002/sim.4780100406.
Pre-publication historyThe pre-publication history for this paper can be accessed here:http://www.biomedcentral.com/1472-6947/12/24/prepub
doi:10.1186/1472-6947-12-24Cite this article as: Husain et al.: HERALD (Health Economics usingRoutine Anonymised Linked Data). BMC Medical Informatics and DecisionMaking 2012 12:24.
Husain et al. BMC Medical Informatics and Decision Making 2012, 12:24http://www.biomedcentral.com/1472-6947/12/24
Page 12 of 12