Hepatic oxidative stress in Atlantic salmon (Salmo salar L.) transferred from a diet based on marine...
13
National Institute of Nutrition and Seafood Research, Bergen, Norway The aim of the present study was to examine whether a combined plant protein and vegetable oil replacement (P diet) of fish-based marine feed ingredients (F diet) imposes oxidative stress on Atlantic salmon after short- and long- term feeding. Oxidative stress was assessed by measuring a suit of hepatic biomarkers, including TBARS, enzymatic and transcriptional levels of a set of antioxidant proteins as well as antioxidant vitamins. Antioxidants assessed regularly in the long-term study were influenced by the dietary compo- sitions, mostly influencing liver astaxanthin and tocopherols. In the short-term crossover study, fish were sampled initially, at Day 2 and at Day 17 after transfer to new diet. The results showed that fish relocated from the F diet to the P diet had significantly lower transcriptional levels of CuZn SOD (Day 2, P < 0.006) and Mn SOD (Day 17, P < 0.003), in addition to lower levels of catalase protein (Day 17, P < 0.05) and total glutathione (Day 17, P < 0.05). At Day 17, both groups of fish relocated to new diets had significantly increased transcriptional levels of GSH-Px (F-P: P < 0.05, P-F: P < 0.007). This study showed that switching from a marine- based to a plant-based diet affected Atlantic salmon gene expression and the antioxidative defence in the fish. KEY WORDS KEY WORDS: antioxidants, Atlantic salmon, oxidative stress, plant ingredients, sustainable aquafeed, vitamins Received 21 August 2009, accepted 26 January 2010 Correspondence: P.A. Olsvik, National Institute of Nutrition and Seafood Research, N-5817 Bergen, Norway. E-mail: [email protected] Salmonids in aquaculture are traditionally fed diets mainly based on fish oil and fish meal extracted from wild catches. Overfishing and the decline of wild stocks exploited to pro- duce fish feed represent both an industrial and an ecological challenge. This has created an urge to develop more sus- tainable aquafeeds, with less reliance on wild fish stocks. Among sustainable alternatives to fish oil and meal are vegetable oils (VO) and plant proteins (PP). However, VO and PP contain components that may be physiologically challenging for salmonids. For example, VOs do not supply long-chain n-3 fatty acids like eicosapentaenoic acid (20:5n-3; EPA), docosapentaenoic acid (22:5n-3; DPA) and doc- osahexaenoic acid (22:6n-3; DHA), but contain high levels of n-6 fatty acids (18:2n-6) and monoene fatty acids, yielding a low n-3/n-6 ratio. Likewise, soy, wheat and corn gluten used as alternatives to fish meal contain high levels of nitrogen and differ in their contents of indispensable amino acids (IAAÕs) (Torstensen et al. 2008). In addition to possible deficiencies in essential amino acids and minerals, fish meal may also contain antinutritional factors (ANFs) and complex carbo- hydrates (NRC 1993; Francis et al. 2001; Vielma et al. 2003). Several studies have indicated that replacement of fish oils (FO) with VO in the diet in fact may enhance growth in salmonids (Torstensen et al. 2005; Karalazos et al. 2007), whereas PP-based diets may reduce growth (Espe et al. 2006). In Atlantic salmon (Salmo salar), VOs in the feed alter the fatty acid composition of the liver cells (Jordal et al. 2007) leading to differences in the hepatic transcription between dietary groups (Jordal et al. 2005; Panserat et al. 2008). Hence, including alternative dietary ingredients may have a profound effect on metabolism and growth in fish. Dietary nutrient and antioxidant composition have the potential to influence the cellular composition and thus the transcriptional patterns in an organism. Recently, it has been shown that almost every level of gene expression is to some degree regulated by different classes of small and large non-coding RNAs (Mattick & Makunin 2005). For example, dietary vitamin E has been shown to affect miRNA 2011 17; e424–e436 .............................................................................................. doi: 10.1111/j.1365-2095.2010.00778.x .............................................................................................. ȑ 2010 Blackwell Publishing Ltd Aquaculture Nutrition
Transcript of Hepatic oxidative stress in Atlantic salmon (Salmo salar L.) transferred from a diet based on marine...
National Institute of Nutrition and Seafood Research, Bergen, Norway
The aim of the present study was to examine whether a
combined plant protein and vegetable oil replacement (P
diet) of fish-based marine feed ingredients (F diet) imposes
oxidative stress on Atlantic salmon after short- and long-
term feeding. Oxidative stress was assessed by measuring a
suit of hepatic biomarkers, including TBARS, enzymatic and
transcriptional levels of a set of antioxidant proteins as well
as antioxidant vitamins. Antioxidants assessed regularly in
the long-term study were influenced by the dietary compo-
sitions, mostly influencing liver astaxanthin and tocopherols.
In the short-term crossover study, fish were sampled initially,
at Day 2 and at Day 17 after transfer to new diet. The results
showed that fish relocated from the F diet to the P diet had
significantly lower transcriptional levels of CuZn SOD (Day
2, P < 0.006) and Mn SOD (Day 17, P < 0.003), in addition
to lower levels of catalase protein (Day 17, P < 0.05) and
total glutathione (Day 17, P < 0.05). At Day 17, both groups
of fish relocated to new diets had significantly increased
transcriptional levels of GSH-Px (F-P: P < 0.05, P-F:
P < 0.007). This study showed that switching from a marine-
based to a plant-based diet affected Atlantic salmon gene
expression and the antioxidative defence in the fish.
KEY WORDSKEY WORDS: antioxidants, Atlantic salmon, oxidative stress,
plant ingredients, sustainable aquafeed, vitamins
Received 21 August 2009, accepted 26 January 2010
Correspondence: P.A. Olsvik, National Institute of Nutrition and Seafood
Research, N-5817 Bergen, Norway. E-mail: [email protected]
Salmonids in aquaculture are traditionally fed diets mainly
based on fish oil and fish meal extracted from wild catches.
Overfishing and the decline of wild stocks exploited to pro-
duce fish feed represent both an industrial and an ecological
challenge. This has created an urge to develop more sus-
tainable aquafeeds, with less reliance on wild fish stocks.
Among sustainable alternatives to fish oil and meal are
vegetable oils (VO) and plant proteins (PP). However, VO
and PP contain components that may be physiologically
challenging for salmonids. For example, VOs do not supply
long-chain n-3 fatty acids like eicosapentaenoic acid (20:5n-3;
EPA), docosapentaenoic acid (22:5n-3; DPA) and doc-
osahexaenoic acid (22:6n-3; DHA), but contain high levels of
n-6 fatty acids (18:2n-6) and monoene fatty acids, yielding a
low n-3/n-6 ratio. Likewise, soy, wheat and corn gluten used
as alternatives to fish meal contain high levels of nitrogen and
differ in their contents of indispensable amino acids (IAA�s)
(Torstensen et al. 2008). In addition to possible deficiencies
in essential amino acids and minerals, fish meal may also
contain antinutritional factors (ANFs) and complex carbo-
hydrates (NRC 1993; Francis et al. 2001; Vielma et al. 2003).
Several studies have indicated that replacement of fish oils
(FO) with VO in the diet in fact may enhance growth in
salmonids (Torstensen et al. 2005; Karalazos et al. 2007),
whereas PP-based diets may reduce growth (Espe et al.
2006). In Atlantic salmon (Salmo salar), VOs in the feed alter
the fatty acid composition of the liver cells (Jordal et al.
2007) leading to differences in the hepatic transcription
between dietary groups (Jordal et al. 2005; Panserat et al.
2008). Hence, including alternative dietary ingredients may
have a profound effect on metabolism and growth in fish.
Dietary nutrient and antioxidant composition have the
potential to influence the cellular composition and thus the
transcriptional patterns in an organism. Recently, it has
been shown that almost every level of gene expression is to
some degree regulated by different classes of small and
large non-coding RNAs (Mattick & Makunin 2005). For
example, dietary vitamin E has been shown to affect miRNA
2011 17; e424–e436. . . . . . . . . . . . . . . . . . . . . . . . . . . . . . . . . . . . . . . . . . . . . . . . . . . . . . . . . . . . . . . . . . . . . . . . . . . . . . . . . . . . . . . . . . . . . .
doi: 10.1111/j.1365-2095.2010.00778.x
. . . . . . . . . . . . . . . . . . . . . . . . . . . . . . . . . . . . . . . . . . . . . . . . . . . . . . . . . . . . . . . . . . . . . . . . . . . . . . . . . . . . . . . . . . . . . .
� 2010 Blackwell Publishing Ltd
Aquaculture Nutrition
concentrations in rat liver (Gaedicke et al. 2008). In addition,
many dietary components such as B vitamins and methyl
donor nutrients are known to modulate DNA methylation,
and imbalances of nutrients in the diet can alter DNA
methylation status via epigenetic mechanisms (Choi et al.
2009). It has been shown that the cellular oxidant/antioxi-
dant balance is a key factor determining redox-dependent
signal transduction pathways in animals (Rimbach & De
Pascual-Teresa 2005). Antioxidants and nutrients may
interact with cellular receptors and affect key enzymes such
as phosphatases and kinases. Alterations in transcriptional
factors may further lead to changes in mRNA and protein
levels or directly interact with enzymes through protein–
protein binding properties. Transcription factors affected by
oxidative stress are involved in numerous signalling path-
ways, among them pathways related to cell division and
differentiation, immunological responses, cytokine expres-
sion and inflammatory responses, xenobiotic metabolism and
more (Di Giulio & Meyer 2008).
Oxidative stress describes a condition occurring when the
generation of reactive oxygen species (ROS) in a system
exceeds its ability to neutralize and eliminate them. Aerobic
animals generate ROS naturally during normal cellular
metabolism. Mitochondrial respiration is the most important
endogenous source of ROS (Fridovich 2004). In addition to
this endogenous generation of ROS, a long number of
environmental factors and chemical pollutants can generate
ROS and enhance oxidative stress. Elevated intracellular
ROS production may ultimately damage DNA, proteins and
lipids (Halliwell & Gutteridge 1999).
ROS can affect the transcription of many genes, either
acting via various transcription factors or directly as a
result of oxidative damage (Di Giulio & Meyer 2008). ROS-
generating agents are known to induce a battery of genes via
the electrophil response element (EPRE), also called the
antioxidant response element (ARE). Oxidative stress prob-
ably alters the activity of transcription factors by altering the
redox status of the cell. Transcription factors in eukaryotes
reported to be affected by ROS include AP-1, nrf-1, nrf-2,
glucocorticoid receptors, oestrogen receptors, aryl hydro-
carbon receptor and NF-jB (Di Giulio & Meyer 2008).
Alternative feed ingredients potentially altering growth and
intermediary metabolism may therefore be expected to affect
the oxidative homoeostasis in salmonid fish. Dietary imbal-
ances might promote increased ROS generations and thus
increased oxidative stress in fish with altered metabolism.
The aim of this experiment was firstly to examine potential
chronic hepatic oxidative stress in Atlantic salmon adapted
to diets consisting of either marine ingredients or a feed with
combined replacement of fish oil and fish meal with plant
ingredients for 12 months. Secondly, in an integrated short-
term crossover designed experiment, the fish were either fed
their original diets or transferred to the complementary diets
and followed for 17 days to record a potential acute oxida-
tive stress. The transcriptional levels of six genes encoding
proteins known to be affected by oxidative stress in animals,
CuZn superoxide dismutase (SOD), Mn SOD, catalase,
glutathione peroxidase (GSH-Px), glutathione reductase and
heat shock protein 70 (HSP70), were quantified in liver of the
fish at the start of the experiment and at days two and 17
after transfer (crossover) to the new diets. Oxidative stress
and protein markers included glutathione (GSH), thiobar-
bituric-reactive substances (TBARS), total SOD, Mn SOD,
catalase and GSH-Px. As an independent stress marker,
plasma cortisol levels were also assessed. The antioxidant
status of the experimental fish was evaluated, by assessing the
liver status of vitamin C (ascorbic acid), vitamin E (a and c
tocopherol) and astaxanthin (sum astaxanthin, all-trans
astaxanthin, 13-cis astaxanthin). Although a substantial
body of literature exists on the replacement of either fish
meal or fish oil in diets for Atlantic salmon, no studies have
addressed the combined replacement of fish oil and meal and
possible effects on oxidative stress. This paper is part of a
series of publications that address the combined effects of
both fish meal and fish oil replacement in feed for fish, as part
of an IP-EU project AQUAMAX (016249-2; Torstensen
et al. 2008). One aim of the AQUAMAX research pro-
gramme was to develop fish feeds based on sustainable
alternatives to fish meal and fish oil to produce healthy and
minimally contaminated fish being nutritious and acceptable
to consumers (http://www.aquamaxip.eu/).
Same populations of Atlantic salmon were used in the long-
term feeding experiment and an integrated crossover trial.
The long-term feeding experiment is described in detail by
Torstensen et al. (2008), as part of the AQUAMAX project.
In brief, the feeding trial was carried out at Matre Aqua-
culture Research Station (Matredal, Norway) during the
period June 22nd 2006–June 15th 2007. The Atlantic salmon
were obtained from Akva Gen A/S (Tingvoll, Norway). In
June 2006, approximately 6000 smolt with a mean weight of
355 ± 92 g (mean ± SE) were distributed equally into
twelve 10 m3 indoor fibreglass tanks containing 7 m3 sea-
water, with a continuous flow-through (� 52 L min)1) of
. . . . . . . . . . . . . . . . . . . . . . . . . . . . . . . . . . . . . . . . . . . . . . . . . . . . . . . . . . . . . . . . . . . . . . . . . . . . . . . . . . . . . . . . . . . . . .
Aquaculture Nutrition 17; e424–e436 � 2010 Blackwell Publishing Ltd
seawater (salinity 34.9 g L)1) from a deepwater inlet
(Matrefjord). Temperature was continuously automatically
recorded and regulated to 8.9 ± 0.1 �C. Oxygen was also
automatically recorded in the outlet water and was never
<80% saturation.
Fish in three randomized tanks were fed on two different
diets, followed in both the long-term study and used in the
crossover experiment: (i) a diet mainly based on fish meal and
fish oil (F diet) and (ii) a diet with an estimated safe maxi-
mum replacement of both fish meal and fish oil with vege-
table meal and vegetable oil (P diet). Antioxidant additives in
the two feeds as well as gross nutrient contents are presented
in Table 1. Detailed information on feed composition is
reported by Torstensen et al. (2008).
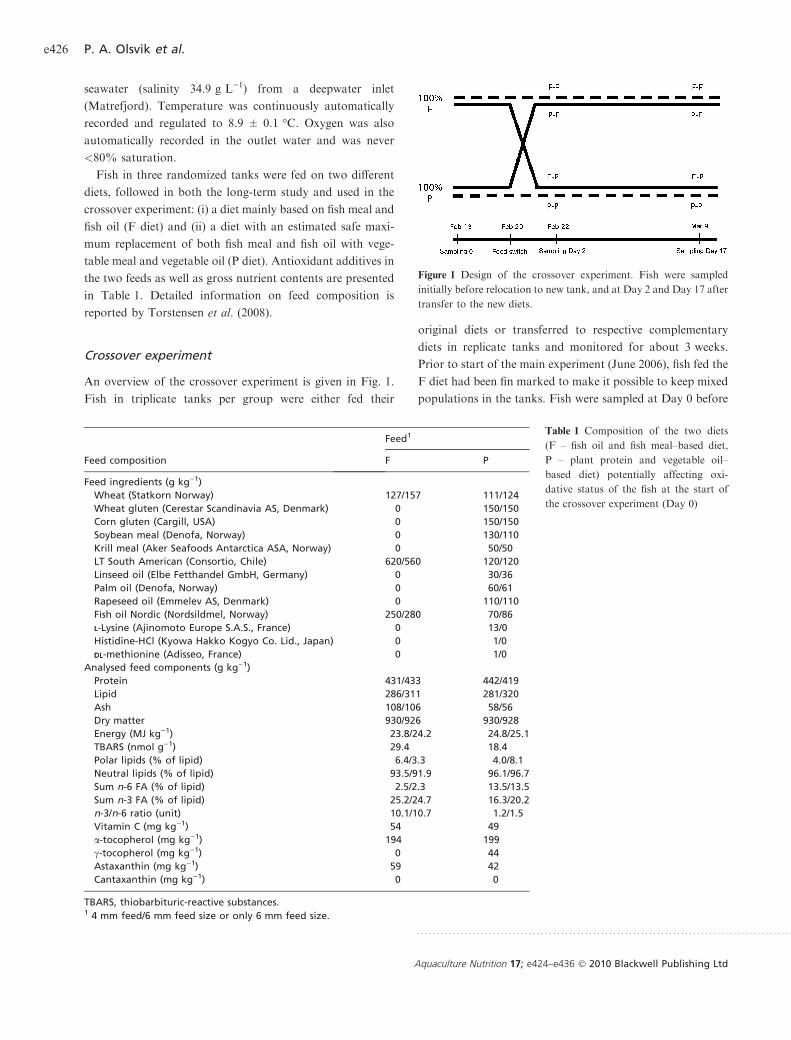
An overview of the crossover experiment is given in Fig. 1.
Fish in triplicate tanks per group were either fed their
original diets or transferred to respective complementary
diets in replicate tanks and monitored for about 3 weeks.
Prior to start of the main experiment (June 2006), fish fed the
F diet had been fin marked to make it possible to keep mixed
populations in the tanks. Fish were sampled at Day 0 before
Table 1 Composition of the two diets
(F – fish oil and fish meal–based diet,
P – plant protein and vegetable oil–
based diet) potentially affecting oxi-
dative status of the fish at the start of
the crossover experiment (Day 0)
Feed composition
Feed1
F P
Feed ingredients (g kg)1)
Wheat (Statkorn Norway) 127/157 111/124
Wheat gluten (Cerestar Scandinavia AS, Denmark) 0 150/150
Corn gluten (Cargill, USA) 0 150/150
Soybean meal (Denofa, Norway) 0 130/110
Krill meal (Aker Seafoods Antarctica ASA, Norway) 0 50/50
LT South American (Consortio, Chile) 620/560 120/120
Linseed oil (Elbe Fetthandel GmbH, Germany) 0 30/36
Palm oil (Denofa, Norway) 0 60/61
Rapeseed oil (Emmelev AS, Denmark) 0 110/110
Fish oil Nordic (Nordsildmel, Norway) 250/280 70/86
LL-Lysine (Ajinomoto Europe S.A.S., France) 0 13/0
Histidine-HCl (Kyowa Hakko Kogyo Co. Lid., Japan) 0 1/0
DLDL-methionine (Adisseo, France) 0 1/0
Analysed feed components (g kg)1)
Protein 431/433 442/419
Lipid 286/311 281/320
Ash 108/106 58/56
Dry matter 930/926 930/928
Energy (MJ kg)1) 23.8/24.2 24.8/25.1
TBARS (nmol g)1) 29.4 18.4
Polar lipids (% of lipid) 6.4/3.3 4.0/8.1
Neutral lipids (% of lipid) 93.5/91.9 96.1/96.7
Sum n-6 FA (% of lipid) 2.5/2.3 13.5/13.5
Sum n-3 FA (% of lipid) 25.2/24.7 16.3/20.2
n-3/n-6 ratio (unit) 10.1/10.7 1.2/1.5
Vitamin C (mg kg)1) 54 49
a-tocopherol (mg kg)1) 194 199
c-tocopherol (mg kg)1) 0 44
Astaxanthin (mg kg)1) 59 42
Cantaxanthin (mg kg)1) 0 0
TBARS, thiobarbituric-reactive substances.1 4 mm feed/6 mm feed size or only 6 mm feed size.
Figure 1 Design of the crossover experiment. Fish were sampled
initially before relocation to new tank, and at Day 2 and Day 17 after
transfer to the new diets.
. . . . . . . . . . . . . . . . . . . . . . . . . . . . . . . . . . . . . . . . . . . . . . . . . . . . . . . . . . . . . . . . . . . . . . . . . . . . . . . . . . . . . . . . . . . . . .
Aquaculture Nutrition 17; e424–e436 � 2010 Blackwell Publishing Ltd

transfer, at Day 2 (2 days after transfer to the new diet) and
at Day 17 (17 days after transfer to the new diet). Three fish
were sampled from each tank at each sampling time point in
a nested ANOVAANOVA design (n = 9 in each group), all together
n = 18 at S1, n = 36 at S2 and n = 36 at S3 (N = 90).
Fish were anesthetized with benzocaine (7 g L)1) prior to
tissue sampling and killed by a blow to the head. Blood
samples for plasma cortisol measurements were extracted
from the caudal blood sinus with a heparinized syringe.
Plasma was separated from the blood by centrifugation
(2000 g, 10 min, 4 �C). Tissue samples from liver for RNA
and protein examination were dissected out and immediately
frozen in cryo tubes in liquefied nitrogen, and stored at
)80 �C until further processing. After weight and length
determination, the gender of the individuals was determined
by examination of the gonads.
Plasma cortisol levels were determined using a standardized
radioimmunoassay (RIA) method (125I cortisol kit; Bio-Rad
Laboratories, Richmond, CA, USA).
For the determination of antioxidant enzymes, liver samples
were prepared as described by Lygren et al. (1999). Selenium-
dependent glutathione peroxidase (GSH-Px) activity was
measured according to Bell et al. (1985), following the rate of
NADPH oxidation in the coupled reaction with glutathione
reductase. The assay was modified to a microtiter plate
technique (Lygren et al. 2000). Measurements and calcula-
tions of catalase activity, total superoxide dismutase (SOD)
activity (CuZn SOD + Mn SOD) and concentrations of
glutathione (GSH) and protein in homogenates were per-
formed as described by Lygren et al. (1999). KCN was used
to inactivate CuZn SOD and selectively record Mn SOD
activity. Enzyme activities are given as U mg)1 protein.
Vitamin C (total ascorbic acid) content of the liver (lg g)1)
was analysed by means of a reverse-phase high-performance
liquid chromatography (HPLC) method using electrochemi-
cal detection (Mæland & Waagbø 1998). Liver vitamin E was
measured as a- and c- tocopherol with HPLC and fluori-
metric detection (CEN, Comite Europeen de Normalisation
2000), and given as lg g)1.
Liver astaxanthin was determined by HPLC and reported
as sum astaxanthin, all-trans astaxanthin and 13-cis asta-
xanthin (Ørnsrud et al. 2004).
TBARS analysis was performed on liver samples according
to a colorimetric method based on a malondialdehyde stan-
dard and 2-thiobarbituric acid solution and reported as
nmol g)1 wet tissue (Schmedes & Hølmer 1989; Hamre et al.
2001).
Tissues were thoroughly homogenized before RNA extrac-
tion using zirconium beads (4 mm) in a Retsch MM 310
homogenizer (Retsch GmbH, Haan, Germany). Total RNA
from Atlantic salmon liver was extracted using the BioRobot
EZ1 and RNA Tissue Mini Kit (Qiagen, Hilden, Germany)
and treated with DNase according to the manufacturer�s
instructions and eluted in 50 lL RNase-free MilliQ H2O.
The RNA was then stored at )80�C before further process-
ing. The quality of the RNA was assessed with the Nano-
Drop ND-1000 UV-Vis Spectrophotometer (NanoDrop
Technologies, Wilmington, DE, USA) and the Agilent 2100
Bioanalyzer (Agilent Technologies, Palo Alto, CA, USA).
The RNA 6000 Nano LabChip kit (Agilent Technologies,
Palo Alto, CA, USA) was used to evaluate the RNA integrity
of 12 randomly selected samples. The RNA integrity number
(RIN) was 9.1 or higher for all analysed samples.
A set of genes encoding oxidative stress markers was picked
for screening. Gene names, symbols and their function are
shown in Table 2. PCR primer sequences used for the
quantification of the reference genes encoding b-actin, elon-
gation factor 1 alpha (EF1A), acidic ribosomal protein
(ARP) and the target genes copper–zinc superoxide dismu-
tase (CuZn SOD), manganese superoxide dismutase (Mn
SOD), catalase, glutathione peroxidase (GSH-Px), glutathi-
one reductase and heat shock protein 70 (HSP70) are shown
in Table 2. The primer pairs amplify PCR products between
59–209 basepairs (bp) long. Table 2 also shows the GenBank
accession numbers of the examined genes and PCR efficien-
cies. PCR efficiencies ranged from 1.81–2.05.
A two-step real-time RT-PCR protocol was developed to
measure the mRNA levels of the six target genes in Atlantic
salmon. The RT reactions were run in triplicate on 96-well
reaction plates with the GeneAmp PCR 9700 machine
. . . . . . . . . . . . . . . . . . . . . . . . . . . . . . . . . . . . . . . . . . . . . . . . . . . . . . . . . . . . . . . . . . . . . . . . . . . . . . . . . . . . . . . . . . . . . .
Aquaculture Nutrition 17; e424–e436 � 2010 Blackwell Publishing Ltd

(Applied Biosystems, Foster City, CA, USA) using TaqMan
Reverse Transcription Reagent containing Multiscribe
Reverse Transcriptase (50 U lL)1) (Applied Biosystems,
Foster City, CA, USA). Twofold serial dilutions of total
RNA (a pool of all samples) were made for efficiency cal-
culations. Six serial dilutions (1000–31 ng) in triplicates were
analysed by qRT-PCR in separate sample wells and the
resulting Cts recorded. Total RNA input was 500 ng in each
reaction for all genes. No template control (ntc) and
RT-control (a duplicate RNA sample analysis where only the
RT enzyme is left out) reactions were run for quality assess-
ment. RT-controls were not performed for every individual
sample, but were run for each assay or gene, with the same
sample as used to make the dilution curves on the 96 well
plates. Reverse transcription was performed at 48 �C for
60 min by using oligo dT primers (2.5 lMM) for all genes in 30 ll
total volume. The final concentration of the other chemicals
in each RT reaction was: MgCl2 (5.5 mMM), dNTP (500 mM
of each), 10· TaqMan RT buffer (1·), RNase inhibitor (0.4
U lL)1) and Multiscribe reverse transcriptase (1.67 U ll)1).
Two microlitre cDNA from each RT reaction for all genes
was transferred to a new 96-well reaction plate and the real-
time PCR run in 20 lL reactions on the LightCycler 480
Real-Time PCR System (Roche Applied Sciences, Basel,
Switzerland). Real-time PCR was performed by using SYBR
Green Master Mix (LightCycler 480 SYBR Green master
mix kit; Roche Applied Sciences, Basel, Switzerland), which
contains FastStart DNA polymerase, and gene-specific
primers (500 nMM). PCR was achieved with initial denatur-
ation and enzyme activation for 5 min at 95 �C, followed by
40 cycles of 10 s denaturation at 95 �C, 20 s annealing at
60 �C and 30 s elongation at 72 �C.
To evaluate the stability of the three selected reference genes,
the geNorm tool was used (Vandesompele et al. 2002). The
Ct values were transformed to quantities using gene-specific
PCR efficiencies, according to the geNorm manual. geNorm
determines the individual stability of a gene within a pool of
genes, given as the M value, and calculates the stability
according to the similarity of their expression profile by pair-
wise comparison, using the geometric mean as a normalizing
factor. The M values for the three examined reference genes
ranked between 0.63–0.65 when all 90 samples were evalu-
ated together. All three reference genes were therefore
included calculating the normalization factor. One-way
ANOVAANOVA with Neuman Keuls post hoc test was used to calculate
differences in transcriptional and protein levels. Spearman
rank correlation was used for non-parametric correlation
analysis between parameters (between plasma cortisol and
gene transcript levels at Day 2 and between plasma cortisol,
TBARS, GSH, protein activities and gene transcript levels at
Day 17). An a level of 0.05 was considered significant. Values
are given as mean ± SE.
The composition of nutrients and antioxidants in the two
experimental feeds is shown in Table 1. For some of the
parameters, data are shown for both the 4 mm feed size used
early in the feeding trial and the 6 mm feed size used later on
and during the crossover experiment. The levels of ash and
TBARS, as well as the n-3/n-6 lipid ratio, were lower in the
plant-based diet (P diet) compared to the marine diet (F diet),
whereas the sum of n-6 fatty acids (FA) and c-tocopherol
levels were higher in the P diet.
The levels of a number of antioxidants in liver of the fish were
measured at five time points during the long-term feeding
Table 2 PCR primers, amplicon sizes, accession numbers and PCR efficiencies
Gene Accession no. Forward primer 5¢ – 3¢ Reverse primer 5¢ – 3¢ Amplicon size (bp) PCR efficiency
B-actin BG933897 CCAAAGCCAACAGGGAGAA AGGGACAACACTGCCTGGAT 92 2.04
EF1AB AF321836 TGCCCCTCCAGGATGTCTAC CACGGCCCACAGGTACTG 59 2.05
ARP AY255630 TCATCCAATTGCTGGATGACTATC CTTCCCACGCAAGGACAGA 101 1.81
Cu/Zn SOD BG936553 CCACGTCCATGCCTTTGG TCAGCTGCTGCAGTCACGTT 140 2.04
Mn SOD DY718412 GTTTCTCTCCAGCCTGCTCTAAG CCGCTCTCCTTGTCGAAGC 209 1.89
Catalase BG935638 GGGCAACTGGGACCTTACTG GCATGGCGTCCCTGATAAA 59 2.03
GSH-Px BE518588 GATTCGTTCCAAACTTCCTGCTA GCTCCCAGAACAGCCTGTTG 140 1.96
GR BG934480 CCAGTGATGGCTTTTTTGAACTT CCGGCCCCCACTATGAC 61 2.01
HSP70 BG933934 CCCCTGTCCCTGGGTATTG CACCAGGCTGGTTGTCTGAGT 121 2.05
ARP, acidic ribosomal protein; SOD, superoxide dismutase; GSH, glutathione; GR, glutathione reductase; HSP, heat shock protein.
. . . . . . . . . . . . . . . . . . . . . . . . . . . . . . . . . . . . . . . . . . . . . . . . . . . . . . . . . . . . . . . . . . . . . . . . . . . . . . . . . . . . . . . . . . . . . .
Aquaculture Nutrition 17; e424–e436 � 2010 Blackwell Publishing Ltd

trial from which the fish used in the crossover experiment
were taken from, summarized in Table 3. Seven parameters
were quantified in the liver of postsmolt fed the F diet in June
2006 at the start of the experiment. At September 2006,
November 2006, and February 2007 and in June 2007, the
same parameters as well some additional markers were
quantified in salmon fed both diets. Four of the quantified
parameters showed differences between the dietary groups
throughout the year. Liver glutathione (GSH) was moder-
ately higher in the liver of the P compared to F groups, with
significant difference in September. a-tocopherol was 14–
25% higher in P compared to F group during the first period
(P < 0.05 in November), while from February onwards, the
opposite trend (P 20% lower than F) was seen (P < 0.05).
c-tocopherol was only observed in the P group (not present
in the F group). From February, liver astaxanthin levels were
approximately three times higher in the F groups than the P
groups (P < 0.05).
No significant weight differences were observed in sampled
fish between the groups initially and at the Day 2 and Day 17
samplings. The fish were in average weighing 2.15 ± 0.41 kg
(lower and upper 95% Cl of geometric mean: 2.12–2.20 kg)
(mean ± SE; N = 90). Visual inspection of intestinal con-
tent in the sampled fish at Day 2 indicated that few of the fish
transferred to another diet (F-P and P-F) had comparable
feed intakes to fish continuing on the same diets (F-F and
P-P). Plasma cortisol levels, a primary stress response
parameter, were quantified at Day 2 and Day 17 during the
crossover experiment (Fig. 2). No differences were observed
between the four dietary groups (F-F, F-P, P-P, P-F) at Day
2. At Day 17, significant lower cortisol levels were observed
in the P-F group compared to the F-F, F-P and P-P groups
(one-way ANOVAANOVA, Neuman Keuls post hoc test, P < 0.05).
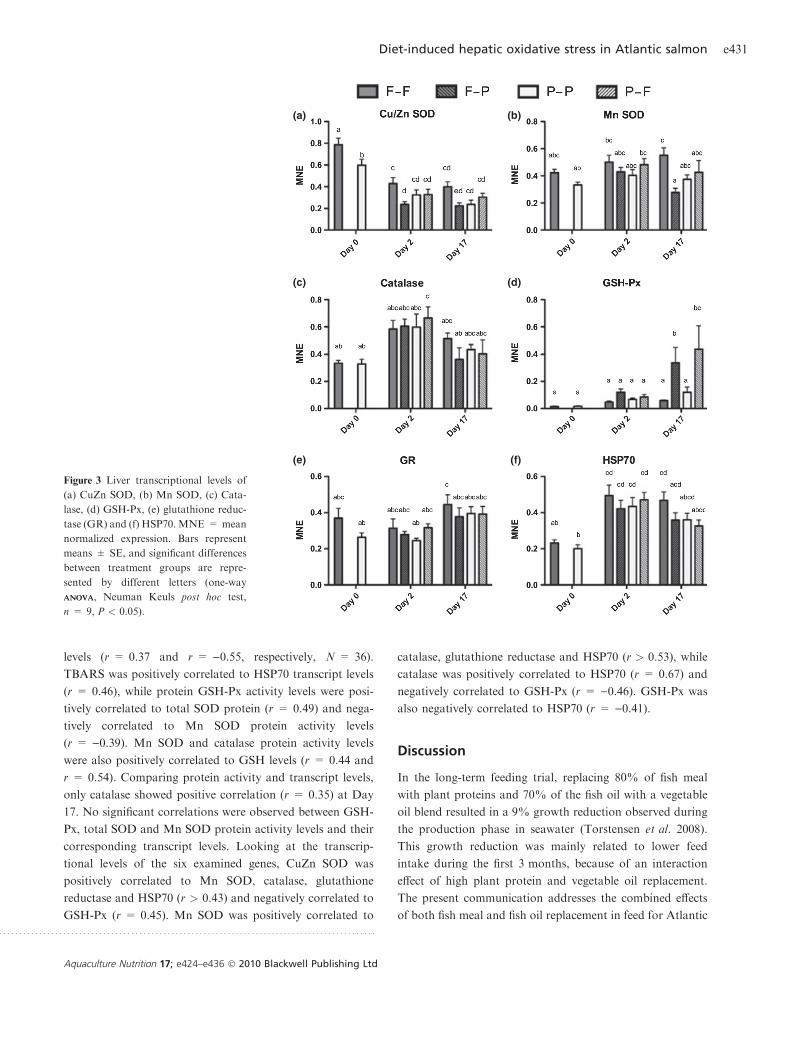
The transcriptional levels of six commonly studied oxida-
tive stress marker genes are presented in Fig. 3. These genes
were CuZn SOD, Mn SOD, catalase, GSH-Px, glutathione
reductase and HSP70. At Day 0, data are presented from fish
fed the two diets (F and P); at Day 2 and Day 17, data are
presented from fish kept at their original diets (F-F or P-P)
and from fish transferred to the complimentary diets (F-P or
P-F). Of the six target genes, only CuZn SOD (Fig. 3a)
showed any significant difference in transcriptional levels in
the liver at the start of the crossover experiment (Day 0),
being lower in fish from the P group than in fish from the
F group (one-way ANOVAANOVA, Neuman Keuls post hoc test,
P < 0.005). At Day 2, two days after transfer to the Table
3Long-term
antioxidativeparametersin
liver
ofthefish
fedthetw
oexperim
entaldiets
FandP
Sam
plin
g(w
eek)
N
Jun
e2006
Sep
tem
ber
2006
No
vem
ber
2006
Feb
ruary
2007
Jun
e2007
An
aly
sis
(un
it)
FF
PF
PF
PF
P
Mean
SEM
ean
SEM
ean
SEM
ean
SEM
ean
SEM
ean
SEM
ean
SEM
ean
SEM
ean
SE
To
tal
GSH
-Px
(Ug
)1)
3420
424
21
668
412
474
33
218
393
675
22
971
448
614
13
462
399
227
17
891
565
095
51
954
449
959
7107
521
663
14
637
544
133
16
899
SeG
SH-P
x(U
g)
1)
3312
397
14
511
326
432
17
751
279
163
13
437
403
774
20
204
298
136
36
713
GSH
(lm
ol
g)
1)
31.7
0.1
2.8
0.1
**
3.3
0.0
3.0
0.1
3.3
0.1
3.2
0.1
43.3
0.1
12.6
0.3
3.0
0.1
TB
AR
S(n
mo
lg
)1)
35.6
0.2
6.6
0.6
5.7
0.5
6.4
0.2
6.4
0.7
5.8
0.1
5.7
0.4
5.3
0.1
5.3
0.4
Asc
orb
icaci
d(l
gg
)1)
369
1139
10
157
9160
7147
7101
1110
389
5108
9
a-To
cop
hero
l(l
gg
)1)
3462
24
293
16
335
23
259
10*
324
14
669
33*
531
11
778
20*
623
47
c-To
cop
hero
l(l
gg
)1)
30
00
0***
19
20
0***
23
20
0***
21
30
0***
40
5
To
tal
SOD
(Um
g)
1p
rote
in)
327.9
1.4
25.9
2.1
27.0
0.6
*23.6
0.8
Mn
SOD
(Um
g)
1p
rote
in)
310.3
2.2
7.7
2.3
7.1
1.0
5.9
2.2
Cata
lase
(Um
g)
1p
rote
in)
3438
7447
13
469
11
446
15
Sum
ast
axa
nth
in
(lg
g)
1)
30.8
0.3
0.6
0.2
6.1
0.7
*2.3
1.1
4.8
1.0
*1.8
0.2
TB
AR
S,th
iob
arb
itu
ric-
react
ive
sub
stan
ces;
GSH
,g
luta
thio
ne;
GSH
-Px,
glu
tath
ion
ep
ero
xid
ase
.
Mean
±SE
*=
P<
0.0
5.
**
=P<
0.0
1,
***
=P<
0.0
01
sho
win
gst
ati
stic
all
yd
iffe
ren
ces
betw
een
die
tary
treatm
en
tsw
ith
ineach
tim
ep
oin
t.
. . . . . . . . . . . . . . . . . . . . . . . . . . . . . . . . . . . . . . . . . . . . . . . . . . . . . . . . . . . . . . . . . . . . . . . . . . . . . . . . . . . . . . . . . . . . . .
Aquaculture Nutrition 17; e424–e436 � 2010 Blackwell Publishing Ltd

complimentary diets, a significant down-regulation in CuZn
SOD was observed in fish transferred from the marine diet to
the vegetable-based diet (F-P group, P = 0.047). The same
pattern was observed at Day 17, with a significant down-
regulation of CuZn SOD in the F-P group (P = 0.046).
Compared to the initial transcription levels at Day 0, there
was a significant drop in CuZn SOD expression for all four
groups both at Day 2 and at Day 17 (P < 0.011). For Mn
SOD (Fig. 3b), no significant difference was observed
between fish from the four groups at Day 2. At Day 17, there
was a significant lower expression of Mn SOD in fish from
the F-P group compared to the F-F group (P = 0.002), the
same pattern as observed for CuZn SOD. The F-F group at
Day 17 also showed a higher transcript level than in the Day
0 P group (P = 0.029), whereas the Day 17 F-P transcript
level was significantly lower than the Day 2 F-F and P-F
levels (P < 0.05). Catalase showed no significant differences
between fish from the four groups either at Day 2 or at Day
17 (Fig. 3c). The P-F group at Day 2, however, showed
significantly higher expression of catalase than the initial
levels at Day 0 (both for the F and P groups, P < 0.03) and
also compared to the F-P group at Day 17 (P = 0.047).
No significant differences were observed between any of
fish groups for GSH-Px at Day 2 (Fig. 3d); however, at Day
17, both groups transferred to new diets showed increased
transcript levels compared to the groups fed their original
diets (F-P, P = 0.044; P-F, P = 0.006). The transcriptional
levels in these groups were also significantly higher than in all
other groups at Day 0 and at Day 2 (P < 0.05). Only small
differences were observed for glutathione reductase, with no
significant differences between the fish groups either at Day 2
or at Day 17 (Fig. 3e). The transcript level was significantly
higher in fish from the F-F group at Day 17 compared to fish
from the P group at Day 0 and to the P-P group at Day 2
(P < 0.05). Although no significant differences in HSP70
transcript levels were observed between any of the fish groups
at Day 2 (Fig. 3f), the transcriptional levels of this stress-
inducible gene were higher in all four groups at Day 2
compared to the initial levels at Day 0 (P < 0.013). In
addition, the transcript level was significantly lower in fish
transferred to the plant-based diet (F-P) at Day 17 compared
to the fish kept on the marine-based diet (P = 0.037).
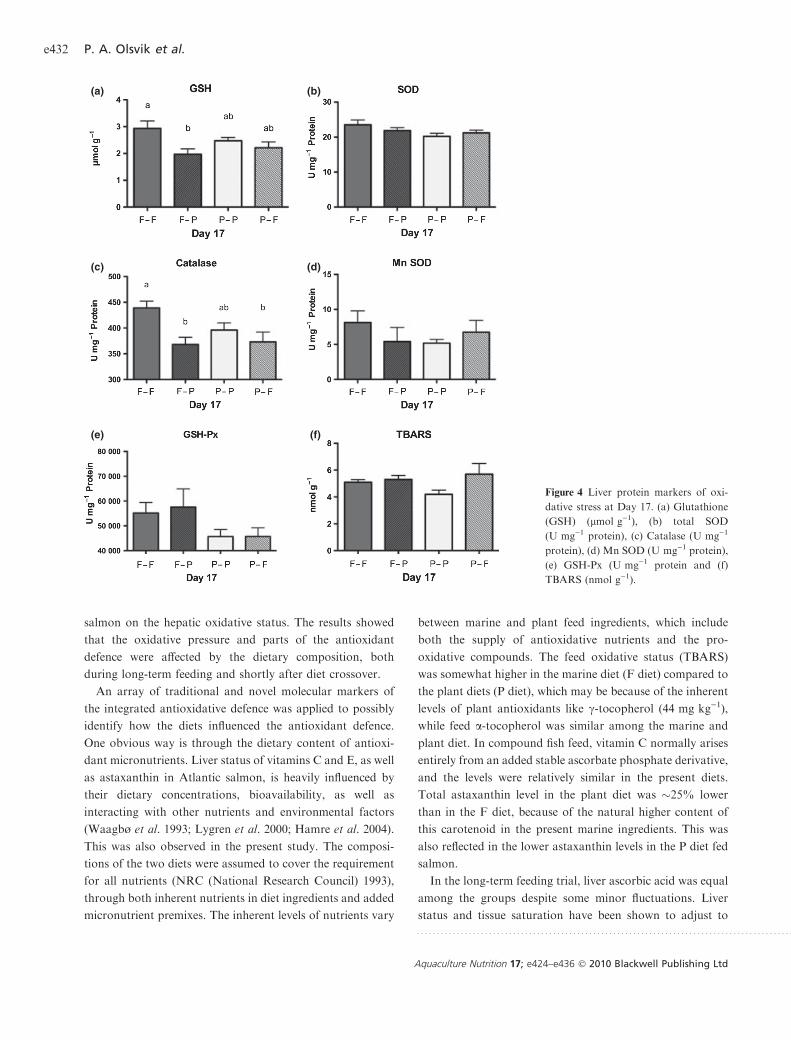
To verify the transcriptional measurements, the levels of
four oxidative stress protein markers, CuZn SOD, Mn SOD,
catalase and GSH-Px, as well as total GSH and TBARS,
were quantified in all diet groups at Day 17 (Fig. 4). Fish
from the marine-based diet transferred to the vegetable diet
(F-P) had significantly lower total GSH levels compared to
the fish kept on a marine diet (F-F) (one-way ANOVAANOVA, Neu-
man Keuls post hoc test, P < 0.05) (Fig. 4a). Both groups
transferred to new diets had lower levels of catalase com-
pared to fish from the groups kept on their original diets
(Fig. 4c, P < 0.05). No significant differences were observed
between the four different groups for CuZn SOD (Fig. 4b),
Mn SOD (Fig. 4d), GSH-Px (Fig. 4e) or TBARS (Fig. 4f ).
The measured levels of antioxidant vitamins in the fish were
different for some of the parameters between the dietary
groups (Fig. 5).
For biomarker assessment, Spearman rank correlation
analysis was performed between the individual parameters
(n = 36; P < 0.05 significance levels mentioned below). At
Day 2, positive correlations were observed between plasma
cortisol levels and CuZn SOD and Mn SOD transcript levels
(r = 0.35 and r = 0.51, respectively, N = 36). Catalase and
HSP70, both of which showed elevated levels at Day 2, were
positively correlated to CuZn SOD (r = 0.55 and r = 0.36,
respectively). Catalase was also positively correlated to Mn
SOD (r = 0.41), whereas HSP70 was negatively correlated
to GSH-Px (r = )0.33). CuZn SOD was also positively
correlated to Mn SOD, catalase, glutathione reductase and
HSP70 (r > 0.36), while Mn SOD was positively correlated
with glutathione reductase (r = 0.48). In addition, positive
correlation was observed between GSH-Px and glutathione
reductase (r = 0.41), and negative correlation between GSH-
Px and HSP70 (r = )0.33) at Day 2.
At Day 17, plasma cortisol levels were positively correlated
to catalase and negatively correlated to GSH-Px transcript
Figure 2 Plasma cortisol levels at Day 2 and Day 17. Statistical
analyses between the treatment groups were done independently at
each sampling time. Bars represent means ± SE and significant
differences between treatment groups are represented by different
letters (one-way ANOVAANOVA, n = 9, P < 0.05).
. . . . . . . . . . . . . . . . . . . . . . . . . . . . . . . . . . . . . . . . . . . . . . . . . . . . . . . . . . . . . . . . . . . . . . . . . . . . . . . . . . . . . . . . . . . . . .
Aquaculture Nutrition 17; e424–e436 � 2010 Blackwell Publishing Ltd
levels (r = 0.37 and r = )0.55, respectively, N = 36).
TBARS was positively correlated to HSP70 transcript levels
(r = 0.46), while protein GSH-Px activity levels were posi-
tively correlated to total SOD protein (r = 0.49) and nega-
tively correlated to Mn SOD protein activity levels
(r = )0.39). Mn SOD and catalase protein activity levels
were also positively correlated to GSH levels (r = 0.44 and
r = 0.54). Comparing protein activity and transcript levels,
only catalase showed positive correlation (r = 0.35) at Day
17. No significant correlations were observed between GSH-
Px, total SOD and Mn SOD protein activity levels and their
corresponding transcript levels. Looking at the transcrip-
tional levels of the six examined genes, CuZn SOD was
positively correlated to Mn SOD, catalase, glutathione
reductase and HSP70 (r > 0.43) and negatively correlated to
GSH-Px (r = 0.45). Mn SOD was positively correlated to
catalase, glutathione reductase and HSP70 (r > 0.53), while
catalase was positively correlated to HSP70 (r = 0.67) and
negatively correlated to GSH-Px (r = )0.46). GSH-Px was
also negatively correlated to HSP70 (r = )0.41).
In the long-term feeding trial, replacing 80% of fish meal
with plant proteins and 70% of the fish oil with a vegetable
oil blend resulted in a 9% growth reduction observed during
the production phase in seawater (Torstensen et al. 2008).
This growth reduction was mainly related to lower feed
intake during the first 3 months, because of an interaction
effect of high plant protein and vegetable oil replacement.
The present communication addresses the combined effects
of both fish meal and fish oil replacement in feed for Atlantic
(a)
(c)
(e)
(b)
(d)
(f)
Figure 3 Liver transcriptional levels of
(a) CuZn SOD, (b) Mn SOD, (c) Cata-
lase, (d) GSH-Px, (e) glutathione reduc-
tase (GR) and (f) HSP70. MNE = mean
normalized expression. Bars represent
means ± SE, and significant differences
between treatment groups are repre-
sented by different letters (one-way
ANOVAANOVA, Neuman Keuls post hoc test,
n = 9, P < 0.05).
. . . . . . . . . . . . . . . . . . . . . . . . . . . . . . . . . . . . . . . . . . . . . . . . . . . . . . . . . . . . . . . . . . . . . . . . . . . . . . . . . . . . . . . . . . . . . .
Aquaculture Nutrition 17; e424–e436 � 2010 Blackwell Publishing Ltd
salmon on the hepatic oxidative status. The results showed
that the oxidative pressure and parts of the antioxidant
defence were affected by the dietary composition, both
during long-term feeding and shortly after diet crossover.
An array of traditional and novel molecular markers of
the integrated antioxidative defence was applied to possibly
identify how the diets influenced the antioxidant defence.
One obvious way is through the dietary content of antioxi-
dant micronutrients. Liver status of vitamins C and E, as well
as astaxanthin in Atlantic salmon, is heavily influenced by
their dietary concentrations, bioavailability, as well as
interacting with other nutrients and environmental factors
(Waagbø et al. 1993; Lygren et al. 2000; Hamre et al. 2004).
This was also observed in the present study. The composi-
tions of the two diets were assumed to cover the requirement
for all nutrients (NRC (National Research Council) 1993),
through both inherent nutrients in diet ingredients and added
micronutrient premixes. The inherent levels of nutrients vary
between marine and plant feed ingredients, which include
both the supply of antioxidative nutrients and the pro-
oxidative compounds. The feed oxidative status (TBARS)
was somewhat higher in the marine diet (F diet) compared to
the plant diets (P diet), which may be because of the inherent
levels of plant antioxidants like c-tocopherol (44 mg kg)1),
while feed a-tocopherol was similar among the marine and
plant diet. In compound fish feed, vitamin C normally arises
entirely from an added stable ascorbate phosphate derivative,
and the levels were relatively similar in the present diets.
Total astaxanthin level in the plant diet was �25% lower
than in the F diet, because of the natural higher content of
this carotenoid in the present marine ingredients. This was
also reflected in the lower astaxanthin levels in the P diet fed
salmon.
In the long-term feeding trial, liver ascorbic acid was equal
among the groups despite some minor fluctuations. Liver
status and tissue saturation have been shown to adjust to
(a)
(c)
(e)
(b)
(d)
(f)
Figure 4 Liver protein markers of oxi-
dative stress at Day 17. (a) Glutathione
(GSH) (lmol g)1), (b) total SOD
(U mg)1 protein), (c) Catalase (U mg)1
protein), (d) Mn SOD (U mg)1 protein),
(e) GSH-Px (U mg)1 protein and (f)
TBARS (nmol g)1).
. . . . . . . . . . . . . . . . . . . . . . . . . . . . . . . . . . . . . . . . . . . . . . . . . . . . . . . . . . . . . . . . . . . . . . . . . . . . . . . . . . . . . . . . . . . . . .
Aquaculture Nutrition 17; e424–e436 � 2010 Blackwell Publishing Ltd
both dietary vitamin C levels and feed intake (Waagbø et al.
1993), be negatively influenced by oxidative conditions like
oxygenation (Lygren et al. 2000), while not influenced by
interacting pro- and antioxidant nutrients [Lygren et al.
2000; K. Hamre (unpublished results)].
Despite similar feed vitamin E level, liver a-tocopherol
varied �20% among the dietary groups during the long-term
study, obviously influenced by interacting factors. Several
factors are suggested to affect the requirement for vitamin E,
such as water temperature, concentration of selenium and
other dietary antioxidants, the quantity and quality of the
lipid source, and the developmental stage of the fish (Hamre
& Lie 1995; Hamre et al. 1997). In a recent publication on
nutrient interactions in the antioxidant system in adult
Atlantic salmon, K. Hamre (unpublished results) showed
that liver a-tocopherol correlated positively with the dietary
vitamin E level, while negatively with the dietary lipid level
(150 versus 320 g kg)1). Further, salmon liver a-tocopherol
was negatively influenced by water superoxygenation (Ly-
gren et al. 2000) and vaccination (Lygren et al. 2001). Under
extreme conditions, like vitamin E deficiency, vitamin C may
promote a vitamin E sparing effect and thereby delay the
introduction of vitamin E deficiency symptoms (Hamre et al.
1997). In the present study, the considerable amount of
c-tocopherol in the plant feed only, was seen in the plant fed
salmon livers in a minor amount. This form of tocopherol
probably exhibited most of its antioxidant protection in the
diet until absorbed, because it is not readily retained in the
tissues like the a-tocopherol. The dietary a-tocopherol does
not possess same feed protection because it is supplemented
in a stable a-tocopheryl acetate form.
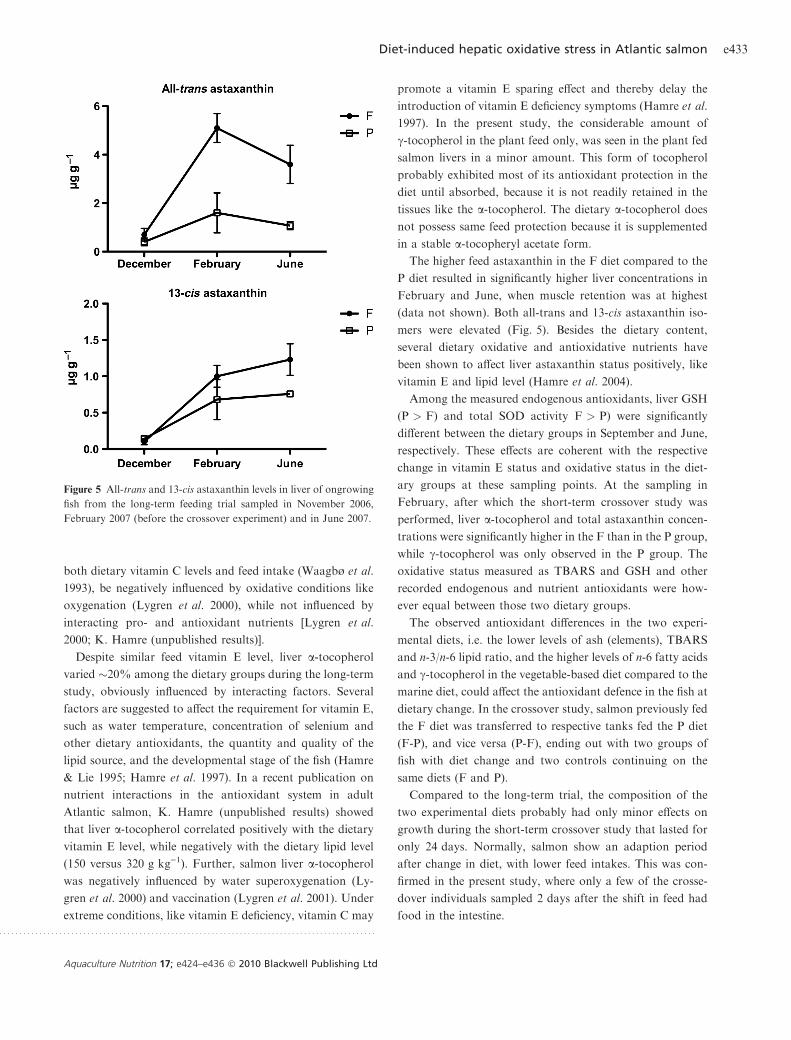
The higher feed astaxanthin in the F diet compared to the
P diet resulted in significantly higher liver concentrations in
February and June, when muscle retention was at highest
(data not shown). Both all-trans and 13-cis astaxanthin iso-
mers were elevated (Fig. 5). Besides the dietary content,
several dietary oxidative and antioxidative nutrients have
been shown to affect liver astaxanthin status positively, like
vitamin E and lipid level (Hamre et al. 2004).
Among the measured endogenous antioxidants, liver GSH
(P > F) and total SOD activity F > P) were significantly
different between the dietary groups in September and June,
respectively. These effects are coherent with the respective
change in vitamin E status and oxidative status in the diet-
ary groups at these sampling points. At the sampling in
February, after which the short-term crossover study was
performed, liver a-tocopherol and total astaxanthin concen-
trations were significantly higher in the F than in the P group,
while c-tocopherol was only observed in the P group. The
oxidative status measured as TBARS and GSH and other
recorded endogenous and nutrient antioxidants were how-
ever equal between those two dietary groups.
The observed antioxidant differences in the two experi-
mental diets, i.e. the lower levels of ash (elements), TBARS
and n-3/n-6 lipid ratio, and the higher levels of n-6 fatty acids
and c-tocopherol in the vegetable-based diet compared to the
marine diet, could affect the antioxidant defence in the fish at
dietary change. In the crossover study, salmon previously fed
the F diet was transferred to respective tanks fed the P diet
(F-P), and vice versa (P-F), ending out with two groups of
fish with diet change and two controls continuing on the
same diets (F and P).
Compared to the long-term trial, the composition of the
two experimental diets probably had only minor effects on
growth during the short-term crossover study that lasted for
only 24 days. Normally, salmon show an adaption period
after change in diet, with lower feed intakes. This was con-
firmed in the present study, where only a few of the crosse-
dover individuals sampled 2 days after the shift in feed had
food in the intestine.
Figure 5 All-trans and 13-cis astaxanthin levels in liver of ongrowing
fish from the long-term feeding trial sampled in November 2006,
February 2007 (before the crossover experiment) and in June 2007.
. . . . . . . . . . . . . . . . . . . . . . . . . . . . . . . . . . . . . . . . . . . . . . . . . . . . . . . . . . . . . . . . . . . . . . . . . . . . . . . . . . . . . . . . . . . . . .
Aquaculture Nutrition 17; e424–e436 � 2010 Blackwell Publishing Ltd
A number of parameters have been used to assess oxidative
stress in animal cells, caused either by excessive production of
ROS or by reduced antioxidant defence (Armstrong 2002).
Even so, no distinct single marker of oxidative stress has been
identified in fish, probably because of a number of con-
founding factors (van der Oost et al. 2003). One reason for
this could be that most fish populations are highly outbred
with a high degree of genetic variability compared to typical
laboratory mammalian models (Di Giulio & Meyer 2008).
Superoxide dismutases (SOD) are metalloenzymes that cat-
alyse the dismutation of superoxide anion (O2·)) into O2 and
hydrogen peroxide (H2O2) (Fridovich 1986). The CuZn SOD
(SOD1) is localized in the cytosol and nucleus, while Mn
SOD (SOD2) is located within the mitochondrial matrix.
Subsequently, H2O2 is reduced to H2O by glutathione per-
oxidases (GSH-Px) in the cytosol or by catalase in the per-
oxisomes. SOD, catalase and GSH-Px, together with
glutathione-S-transferases (GST) and glutathione reductase,
are easily induced by oxidative stress, and the activity levels
of these enzymes have therefore been used to quantify oxi-
dative stress in cells (van der Oost et al. 2003). The initial
transcriptional levels of CuZn SOD suggest that the P diet
mediated a lower superoxide production in the examined
liver cells, because this gene was lower expressed in liver of
fish from the P group at the start of the crossover experiment
(Day 0). The reason for this differential expression is not
known, but we have observed that the baseline transcript
levels of several oxidative stress relevant genes in untreated
salmon are asymmetrically expressed in liver of fish fed
soybean oil-based diets compared to fish fed fish oil–based
diets. These genes include GSH-Px, p-class GST, HSP70,
metallothionein, CYP1A, CYP2M1, CYP3A and PPARc
(unpublished results), in line with previous studies showing
differences in salmonid hepatic gene expression following
replacement of dietary fish oil and fish meal with plant
ingredients (Jordal et al. 2005; Panserat et al. 2008; Tor-
stensen et al. 2009). In particular, changes have been seen in
the transcriptional levels of genes involved in metabolic
pathways such as energy metabolism, fatty acid metabolism
and detoxification.
Plant feed reduced the transcriptional levels of CuZn SOD
in salmon transferred from the marine- to the plant-based
diet (F-P) at Day 2, suggesting that the cells were more
susceptible to oxidative stress (lower protection) in this
group. This finding was also supported by the Mn SOD
transcript data at Day 17, indicating lower protection against
mitochondrial oxidative stress in fish fed a marine-based diet
transferred to a plant-based diet. The ingredients in the P diet
may mediate lower ROS production and thus reduced oxi-
dative stress in liver cells of the fish fed P diet, as also dem-
onstrated in the long-term study. These results were,
however, not supported by the liver total SOD and Mn SOD
enzyme activities, as measured at Day 17, further empha-
sizing the low correlation often seen between mRNA and
protein abundances, especially for long-lived proteins
(Anderson & Seilhamer 1997). Only catalase displayed a
significant positive correlation between activity and tran-
scriptional levels (Spearmen rank order correlation). Both
liver glutathione (GSH) levels and catalase activity were
significantly lower in the F-P group compared to the F-F
group at Day 17, clearly suggesting that the transfer to a
plant-based diet affected the antioxidant defence in the fish.
The antioxidant GSH plays a central role in protecting cells
from oxidative modification in proteins, lipids and DNA.
Processes that induce GSH depletion, either via GSH con-
jugation or via oxidation of GSH to glutathione disulphide
(GSSG), alter the mechanism of natural cellular defence
against ROS. Thus, GSH depletion may render the cells more
vulnerable to oxidative stress. Reduced levels of catalase
activity at Day 17 in the F fish transferred to the P diet may
also result from altered b-oxidation of fatty acids in the
peroxisomes. The transcriptional levels of catalase at Day 17,
however, were not significantly different between the four
dietary groups, even though the mRNA pattern resembled
the protein pattern.
At Day 17, the transcriptional levels of GSH-Px were sig-
nificantly increased in fish from both groups crossed-over to
new diets. The GSH-Px protein activity assay did not verify
this increased expression, most likely because the mRNA
assay quantify the levels of plasma GSH-Px (GPx3), whereas
the protein assay quantifies the total level of selenocystein
GSH-Px, which includes four selenium-dependent GSH-Pxs
in mammals (Di Giulio &Meyer 2008). Clearly, the new diets
at this time point created a need to detoxify increased cellular
levels of H2O2 or to reduce fatty acid peroxides (LOOH).
GSH-Px can, unlike catalase, also reduce lipid peroxides (Di
Giulio & Meyer 2008). This finding suggests that adaptation
to new diets affected the hepatic levels of polyunsaturated
fatty acids (PUFAs), one of the most studied targets of ROS.
Thus, GSH-Px mRNA seems to be a good bioindicator of
dietary oxidative stress in liver of salmon. The increased levels
of GSH-Px in these individuals may have contributed to a
reduced stress level, as suggested by the significantly lower
levels of plasma cortisol in fish from the P-F group.
In addition to the above-mentioned effects, the transcrip-
tional data also suggest that the fish have been affected by
handling stress, because both the catalase and HSP70 mRNA
levels were higher in all four dietary groups at Day 2
. . . . . . . . . . . . . . . . . . . . . . . . . . . . . . . . . . . . . . . . . . . . . . . . . . . . . . . . . . . . . . . . . . . . . . . . . . . . . . . . . . . . . . . . . . . . . .
Aquaculture Nutrition 17; e424–e436 � 2010 Blackwell Publishing Ltd
compared to the control at Day 0. Stress proteins such as
HSP70 are primarily acute-phase chaperone proteins that are
up-regulated during proteolysis and participate in folding
and transport of newly synthesized proteins. Environmental,
chemical and physiological stress as well as oxidative stress
can all lead to increased synthesis of heat-shock proteins
(HSPs) in animals (Halliwell & Gutteridge 1999; Kalmar &
Greensmith 2009). HSPs are generally considered to be good
indicators of cellular stress in animals (Wegele et al. 2004)
and although their induction may be fast, the turnover is
slower and the proteins tend to accumulate upon prolonged
cellular stress (Schlenk et al. 2008). Two isoforms of HSP70
exist in the cytosol of mammalian cells, a constitutively
expressed 73 kDa form (HSC70) and a stress-inducible
70 kD form (HSP70) (Wegele et al. 2004), whereas several
isoforms of the inducible form have been found in teleostean
fishes (discussed in Iwama et al. 1998). In fish, however,
Iwama et al. (2004) questioned the use of HSPs as indicators
of stressed states and suggested that their use as biomarkers
of stress in teleosts is premature. Zarate & Bradley (2003)
examined how HSPs responded to hatchery stress in the
Atlantic salmon and concluded that HSP70 is not a sensitive
indicator to aquacultural disturbances like feed deprivation,
anaesthesia, capture stress, crowding stress, formalin,
hyperoxia and hypoxia. The current study, however, clearly
suggest that HSP70 mRNA can be a good indicator of
handling stress in Atlantic salmon.
In conclusion, this study showed that components in the
plant-based diet, such as tocopherols and astaxanthin, can
affect the antioxidative defence system in Atlantic salmon
compared to traditional diets based on marine ingredients,
both acutely after a shift in feed and chronically after long-
term feeding.
We thank Arnor Gullanger (IMR, Matre Aquaculture
Research Station) for fish husbandry and Jacob Wessels,
Leikny Fjeldstad and Hui-shan Tung (NIFES) for help with
technical work and molecular analyses. This study was fun-
ded by the IP-EU project �AQUAMAX� (016249-2) and by
the National Institute of Nutrition and Seafood Research
(NIFES), Bergen, Norway.
Anderson, L. & Seilhamer, J. (1997) A comparison of selected
mRNA and protein abundances in human liver. Electrophoresis,
18, 533–537.
Armstrong, D. (2002) Oxidative stress, biomarkers and antioxidant
protocols. In: Methods in Molecular Biology (Walker, J.M. ed),
pp.1–322. Humana Press, Totowa, NJ, USA.
Bell, J.G., Cowey, C.B., Adron, J.W. & Shanks, A.M. (1985) Some
effects of vitamin E and selenium deprivation on tissue enzyme
levels and indices of tissue peroxidation in rainbow trout (Salmo
gairdneri). Br. J. Nutr., 53, 149–157.
CEN (Comite Europeen de Normalisation) (2000) F. Determination
of vitamin E by high performance liquid chromatography -
Measurement of alpha-, beta-, gamma- and delta-tocopherols.
Reference: EN 12822.
Choi, S.-W., Corroher, R. & Friso, S. (2009) Nutrients and DNA
methylation. In: Nutrients and Epigenetics (Choi, S.-W. & Friso, S.
eds), pp. 105–125. CRC Press, Boca Raton, FL, USA.
Di Giulio, R.T. & Meyer, J.N. (2008) Reactive oxygen species and
oxidative stress. In: The Toxicology of Fishes (Di Giulio, R.T. &
Hinton, D.E. eds), pp. 273–324. CRC Press, Boca Raton, FL,
USA.
Espe, M., Lemme, A., Petri, A. & El-Mowafi, A. (2006) Can Atlantic
salmon (Salmo salar) grow on diets devoid of fish meal? Aqua-
culture, 255, 255–262.
Francis, G., Makkar, H.P.S. & Becker, K. (2001) Antinutritional
factors present in plant-derived alternate fish feed ingredients and
their effects in fish. Aquaculture, 199, 197–227.
Fridovich, I. (1986) Superoxide dismutases. Adv. Enzymol., 58, 61–
97.
Fridovich, I. (2004) Mitochondria: are they the seat of senescence?
Aging Cell, 3, 13–16.
Gaedicke, S., Zhang, X.N., Schmelzer, C., Lou, Y.J., Doering, F.,
Frank, J. & Rimbach, G. (2008) Vitamin E dependent microRNA
regulation in rat liver. FEBS Lett., 582, 3542–3546.
Halliwell, B. & Gutteridge, M.C. (1999) Free Radicals in Biology and
Medicine. 3rd edn. Oxford Science Publication, Oxford, NY, USA,
pp. 1-936.
Hamre, K. & Lie, Ø. (1995) Minimum requirement of vitamin E for
Atlantic salmon (Salmo salar) at startfeeding. Aquacult. Res., 26,
175–184.
Hamre, K., Waagbø, R., Berge, R.K. & Lie, Ø. (1997) Vitamins C
and E interacts in juvenile Atlantic salmon (Salmo salar, L.). Free
Rad. Biol. Med., 22, 137–149.
Hamre, K., Naess, T., Espe, M., Holm, J.C. & Lie, Ø. (2001) A
formulated diet for Atlantic halibut (Hippoglossus hippoglossus, L.)
larvae. Aquacult. Nutr., 7, 123–132.
Hamre, K., Christiansen, R., Waagbø, R., Maage, A., Torstensen,
B., Lygren, B., Lie, Ø., Wathne, E. & Albrektsen, S. (2004)
Antioxidant vitamins, minerals and lipid levels in diets for Atlantic
salmon (Salmo salar, L.): effects on growth performance and fillet
quality. Aquacult. Nutr., 10, 113–123.
Iwama, G.K., Thomas, P.T., Forsyth, R.B. & Vijayan, M.M. (1998)
Heat shock protein expression in fish. Rev. Fish Biol. Fish., 8,
35–56.
Iwama, G.K., Afonso, L.O.B., Todgham, A., Ackerman, P. &
Nakano, K. (2004) Are HSPs suitable for indicating stressed states
in fish? J. Exp. Biol., 207, 15–19.
Jordal, A.E.O., Torstensen, B.E., Tsoi, S., Tocher, D.R., Lall, S.P. &
Douglas, S.E. (2005) Dietary rapeseed oil affects the expression of
genes involved in hepatic lipid metabolism in Atlantic salmon
(Salmo salar L.). J. Nutr., 135, 2355–2361.
Jordal, A.-E.O., Lie, Ø. & Torstensen, B.E. (2007) Complete
replacement of dietary fish oil with a vegetable oil blend affect liver
lipid and plasma lipoprotein levels in Atlantic salmon (Salmo salar
L.). Aquacult. Nutr., 13, 114–130.
. . . . . . . . . . . . . . . . . . . . . . . . . . . . . . . . . . . . . . . . . . . . . . . . . . . . . . . . . . . . . . . . . . . . . . . . . . . . . . . . . . . . . . . . . . . . . .
Aquaculture Nutrition 17; e424–e436 � 2010 Blackwell Publishing Ltd

Kalmar, B. & Greensmith, L. (2009) Induction of heat shock pro-
teins for protection against oxidative stress. Adv. Drug Del. Rev.,
61, 310–318.
Karalazos, V., Bendiksen, E.A., Dick, J.R. & Bell, J.G. (2007) Effects
of dietary protein, and fat level and rapeseed oil on growth and
tissue fatty acid composition and metabolism in Atlantic salmon
(Salmo salar L.) reared at low water temperatures. Aquacult. Nutr.,
13, 256–265.
Lygren, B., Hamre, K. & Waagbø, R. (1999) Effects of dietary pro-
and antioxidants on some protective mechanisms and health
parameters in Atlantic salmon (Salmo salar). J. Aquat. Anim.
Health, 11, 211–221.
Lygren, B., Hamre, K. & Waagbø, R. (2000) Effect of induced
hyperoxia on the antioxidant status of Atlantic salmon Salmo salar
L. fed three different levels of dietary vitamin E. Aquacult. Res., 31,
401–407.
Lygren, B., Hjeltnes, B. & Waagbø, R. (2001) Immune response and
disease resistance in Atlantic salmon (Salmo salar L.) fed three
levels of dietary vitamin E and the effect of vaccination on the liver
status of antioxidant vitamins. Aquacult. Int., 9, 401–411.
Mæland, A. & Waagbø, R. (1998) Examination of the qualitative
ability of some cold water marine teleosts to synthesise ascorbic
acid. Comp. Biochem. Physiol., 121A, 249–255.
Mattick, J.S. & Makunin, I.V. (2005) Small regulatory RNAs in
mammals. Hum. Mol. Gen., 14, R121–R132.
NRC (National Research Council) (1993) Nutrient Requirements of
Fish. National Academy Press, Washington DC. USA.
van der Oost, R., Beyer, J. & Vermeulen, N.P.E. (2003) Fish bio-
accumulation and biomarkers in environmental risk assessment: a
review. Environ. Toxicol. Pharmacol., 13, 57–149.
Ørnsrud, R., Wargelius, A., Sæle, Ø., Pittman, K. & Waagbø, R.
(2004) Influence of egg vitamin A status and egg incubation tem-
perature on subsequent development of the early vertebral column
in Atlantic salmon fry. J. Fish Biol., 64, 399–417.
Panserat, S., Kolditz, C., Richard, N., Plagnes-Juan, E., Piumi, F.,
Esquerre, D., Medale, F., Corraze, G. & Kaushik, S. (2008)
Hepatic gene expression profiles in juvenile rainbow trout
(Oncorhynchus mykiss) fed fishmeal or fish oil-free diets. Br. J.
Nutr., 100, 953–967.
Rimbach, G. & De Pascual-Teresa, S. (2005) Application of nutri-
genomics tools to analyze the role of oxidants and antioxidants in
gene expression. In: Nutrigenomics (Rimbach, G., Fuchs, J. &
Packer, L. eds), pp. 1–12. Taylor & Francis, Boca Raton, FL, USA.
Schlenk, D., Handy, R., Steinert, S., Depledge, M.H. & Benson, W.
(2008) Biomarkers. In: The Toxicology of Fishes (Di Giulio, R.T. &
Hinton, D.E. eds), pp. 683–731. CRC Press, Boca Raton, FL,
USA.
Schmedes, A. & Hølmer, G. (1989) A new thiobarbituric acid
(TBARs) method for determining free malondialehyde (MDA)
and hydroperoxides selectively as a measure of lipid peroxidation.
J. Am. Oil Chem., 66, 813–817.
Torstensen, B.E., Bell, J.G., Rosenlund, G., Henderson, R.J., Graff,
I.E., Tocher, D.R., Lie, Ø. & Sargent, J.R. (2005) Tailoring of
Atlantic salmon (Salmo salar L.) flesh lipid composition and sen-
sory quality by replacing fish oil with a vegetable oil blend.
J. Agricult. Food Chem., 53, 10166–10178.
Torstensen, B.E., Espe, M., Sanden, M. et al. (2008) Novel pro-
duction of Atlantic salmon (Salmo salar) protein based on com-
bined replacement of fish meal and fish oil with plant meal and
vegetable oil blends. Aquaculture, 285, 193–200.
Torstensen, B.E., Nanton, D.A., Olsvik, P.A., Sundvold, H. &
Stubhaug, I. (2009) Gene expression of fatty acid binding proteins
(FABPs), fatty acid transport proteins (cd36 and FATP) and
b-oxidation related genes in Atlantic salmon (Salmo salar L.) fed
fish oil or vegetable oil. Aquacult. Nutr., 15, 440–451.
Vandesompele, J., De Preter, K., Pattyn, F., Poppe, B., Van Roy, N.,
De Paepe, A. & Speleman, F. (2002) Accurate normalization of
real-time quantitative RT-PCR data by geometric averaging of
multiple internal control genes. Genome Biol., 3:RESEARCH0034.
Vielma, J., Koskela, J., Ruohonen, K., Jokinen, I. & Kettunen, J.
(2003) Optimal diet composition for European whitefish (Coreg-
onus lavaretus): carbohydrate stress and immune parameter
responses. Aquaculture, 225, 3–16.
Waagbø, R., Glette, J., Nilsen, E.R. & Sandnes, K. (1993) Dietary
vitamin C, immunity and disease resistance in Atlantic salmon
(Salmo salar). Fish Physiol. Biochem., 12, 61–73.
Wegele, H., Muller, L. & Buchner, J. (2004) Hsp70 and Hsp90 - a
relay team for protein folding. Rev. Physiol. Biochem. Pharmacol.,
151, 1–44.
Zarate, J. & Bradley, T.M. (2003) Heat shock proteins are not sen-
sitive indicators of hatchery stress in salmon. Aquaculture, 223,
175–187.
. . . . . . . . . . . . . . . . . . . . . . . . . . . . . . . . . . . . . . . . . . . . . . . . . . . . . . . . . . . . . . . . . . . . . . . . . . . . . . . . . . . . . . . . . . . . . .
Aquaculture Nutrition 17; e424–e436 � 2010 Blackwell Publishing Ltd