effect of welding parameters of plasma transferred arc ... - CORE
169
TKK Dissertations 220 Espoo 2010 EFFECT OF WELDING PARAMETERS OF PLASMA TRANSFERRED ARC WELDING METHOD ON ABRASIVE WEAR RESISTANCE OF 12V TOOL STEEL DEPOSIT Doctoral Dissertation Marko Keränen Aalto University School of Science and Technology Faculty of Engineering and Architecture Department of Engineering Design and Production
-
Upload
khangminh22 -
Category
Documents
-
view
1 -
download
0
Transcript of effect of welding parameters of plasma transferred arc ... - CORE

TKK Dissertations 220Espoo 2010
EFFECT OF WELDING PARAMETERS OF PLASMA TRANSFERRED ARC WELDING METHOD ON ABRASIVE WEAR RESISTANCE OF 12V TOOL STEEL DEPOSITDoctoral Dissertation
Marko Keränen
Aalto UniversitySchool of Science and TechnologyFaculty of Engineering and ArchitectureDepartment of Engineering Design and Production


TKK Dissertations 220Espoo 2010
EFFECT OF WELDING PARAMETERS OF PLASMA TRANSFERRED ARC WELDING METHOD ON ABRASIVE WEAR RESISTANCE OF 12V TOOL STEEL DEPOSITDoctoral Dissertation
Marko Keränen
Doctoral dissertation for the degree of Doctor of Science in Technology to be presented with due permission of the Faculty of Engineering and Architecture for public examination and debate in Auditorium K215 at the Aalto University School of Science and Technology (Espoo, Finland) on the 28th of April 2010 at 12 noon.
Aalto UniversitySchool of Science and TechnologyFaculty of Engineering and ArchitectureDepartment of Engineering Design and Production
Aalto-yliopistoTeknillinen korkeakouluInsinööritieteiden ja arkkitehtuurin tiedekuntaKoneenrakennustekniikan laitos

Distribution:Aalto UniversitySchool of Science and TechnologyFaculty of Engineering and ArchitectureDepartment of Engineering Design and ProductionEngineering MaterialsP.O. Box 14200 (Puumiehenkuja 3)FI - 00076 AaltoFINLANDURL: http://edp.tkk.fi/en/Tel. +358-9-470 23538Fax +358-9-470 23537E-mail: [email protected]
© 2010 Marko Keränen
ISBN 978-952-60-3109-5ISBN 978-952-60-3110-1 (PDF)ISSN 1795-2239ISSN 1795-4584 (PDF)URL: http://lib.tkk.fi/Diss/2010/isbn9789526031101/
TKK-DISS-2743
Picaset OyHelsinki 2010

ABSTRACT OF DOCTORAL DISSERTATION AALTO UNIVERSITY
SCHOOL OF SCIENCE AND TECHNOLOGY P.O. BOX 11000, FI-00076 AALTO http://www.aalto.fi
Author Marko Keränen
Name of the dissertation Effect of welding parameters of plasma transferred arc welding method on abrasive wear resistance of 12V tool steel deposit
Manuscript submitted 29.10.2009 Manuscript revised 15.03.2010
Date of the defence 28.04.2010
Monograph Article dissertation (summary + original articles)
Faculty Faculty of Engineering and Architecture Department Department of Engineering Design and Production Field of research Engineering Materials Opponent(s) Prof. Leijun Li and Prof. Jyrki Vuorinen Supervisor Prof. Hannu Hänninen Instructor Prof. Hannu Hänninen
Abstract In the plasma transferred arc, PTA, welding method the powder consumable makes it possible to weld wide variety of alloys. The dilution of the deposit is typically 3-10 % and, thus, the properties of the deposit can be achieved with one-layer deposit. The studied alloy was an iron-based 12V tool steel reinforced with primarily precipitating vanadium carbides. Wide deposits are welded by oscillating the plasma arc and overlapping the weld beads. The mobility of the molten pool of 12V tool steel is good. The location of the plasma arc in relation with the molten pool during perpendicular movement and the shape of the plasma arc had strong effects on both the dilution control and the microstructure of the 12V tool steel deposit. The location of the plasma arc can be in the edge or on top of the molten pool. Depending on the parameter window the mean sizes and the volume fractions of vanadium carbides were 0,5-1,8 micrometers and 12,2-17,5 vol.-%, respectively. When the plasma arc was precisely in the edge of the molten pool, the size, the distance between vanadium carbides, and the shape of vanadium carbides were optimal. With the studied welding parameters, the 12V tool steel deposit is extremely sensitive to small variations in the welding parameters. If the molten pool is stirred slightly when oscillating the plasma arc, vanadium carbides cannot grow and the shapes of the carbides are mainly more needle-shaped instead of round-shape. Wear tests were made by the rubber wheel abrasion test according to standard ASTM G 65-94. Round-shaped, 1,2-1,4 micrometer-sized vanadium carbides were the most beneficial according to the wear surface examinations. The optimized PTA welded 12V tool steel deposit had better abrasive wear resistance when compared to the 12V tool steel deposit manufactured by the hot isostatic pressing, HIP. Keywords PTA, tool steel, powder consumable, dilution, vanadium carbide, abrasive wear resistance
ISBN (printed) 978-952-60-3109-5 ISSN (printed) 1795-2239
ISBN (pdf) 978-952-60-3110-1 ISSN (pdf) 1795-4584
Language English Number of pages 166 p.
Publisher Aalto University, Department of Engineering Design and Production
Print distribution Aalto University, Department of Engineering Design and Production, Engineering Materials
The dissertation can be read at http://lib.tkk.fi/Diss/2010/isbn9789526031101/


VÄITÖSKIRJAN TIIVISTELMÄ AALTO-YLIOPISTO
TEKNILLINEN KORKEAKOULU PL 11000, 00076 AALTO http://www.aalto.fi
Tekijä Marko Keränen
Väitöskirjan nimi Hitsausparametrien vaikutus jauheplasmamenetelmällä hitsatun 12V työkaluteräspinnoitteen abrasiiviseen kulumiskestävyyteen
Käsikirjoituksen päivämäärä 29.10.2009 Korjatun käsikirjoituksen päivämäärä 15.03.2010
Väitöstilaisuuden ajankohta 28.04.2010
Monografia Yhdistelmäväitöskirja (yhteenveto + erillisartikkelit)
Tiedekunta Insinööritieteiden ja arkkitehtuurin tiedekunta Laitos Koneenrakennustekniikan laitos Tutkimusala Materiaalitekniikka Vastaväittäjä(t) Prof. Leijun Li ja Prof. Jyrki Vuorinen Työn valvoja Prof. Hannu Hänninen Työn ohjaaja Prof. Hannu Hänninen
Tiivistelmä Jauheplasmamenetelmällä, PTA, hitsattaessa jauhemainen lisäaine mahdollistaa laajan lisäainevalikoiman käytön. Menetelmälle tyypillinen sekoittumisaste on 3-10 %, jolloin pinnoitteen halutut ominaisuudet saavutetaan yhdellä palkokerroksella. Koemateriaalina oli rautapohjainen 12V työkaluteräs, jossa on lujitteena primäärisesti erkautuvia vanadiinikarbideja. Leveä pinnoite hitsataan oskilloimalla plasmakaarta ja limittämällä hitsipalkoja. 12V työkaluteräksen hitsisulan liikkuvuus on hyvä. Plasmakaaren paikalla suhteessa hitsisulaan kaaren poikittaisen liikkeen aikana ja plasmakaaren muodolla oli suuri vaikutus sekä 12V työkaluteräksen sekoittumisasteen kontrollointiin että mikrorakenteeseen. Plasmakaaren paikka voi olla joko sulan reunassa tai sen päällä. Parametri-ikkunasta riippuen vanadiinikarbidien keskimääräinen koko ja tilavuusosuus olivat 0,5-1,8 mikrometriä ja12,2-17,5 til.-%, vastaavasti. Kun plasmakaari oli tarkasti sulan reunassa, vanadiinikarbidien koko, karbidien välinen etäisyys ja muoto olivat optimaaliset. Tutkituilla hitsausparametreillä 12V työkaluteräspinnoite on erityisen herkkä hitsausparametrien pienille vaihteluille. Jos hitsisulaa sekoitetaan hieman kun plasmakaarta oskilloidaan, vanadiinikarbidit eivät pääse kasvamaan kokoa, ja niiden muoto on pääasiallisesti enemmän neulasmainen pyöreän muodon sijasta. Kulutuskokeet tehtiin kumipyöräabraasiokulutuskoelaitteistolla ASTM G 65-94 standardin mukaisesti. Pyöreät, 1,2-1,4 mikrometrin kokoiset vanadiinikarbidit olivat kulutuspinnan SEM tarkastelun perusteella kaikkein hyödyllisimpiä. Optimoidulla jauheplasmalla hitsatulla 12V työkaluteräspinnoitteella oli parempi kulumiskestävyys kuin vastaavalla kuumaisostaattisella puristuksella, HIP, valmistetulla materiaalilla.
Asiasanat PTA, työkaluteräs, jauhemainen lisäaine, sekoittumisaste, vanadiinikarbidi, abrasiivinen kulumiskestävyys
ISBN (painettu) 978-952-60-3109-5 ISSN (painettu) 1795-2239
ISBN (pdf) 978-952-60-3110-1 ISSN (pdf) 1795-4584
Kieli englanti Sivumäärä 166 s.
Julkaisija Aalto-yliopisto, Koneenrakennustekniikan laitos
Painetun väitöskirjan jakelu Aalto-yliopisto, Koneenrakennustekniikan laitos, Materiaalitekniikka
Luettavissa verkossa osoitteessa http://lib.tkk.fi/Diss/2010/isbn9789526031101/


7
Preface
The study was started with the project "Surfacing with different methods", which was conducted during the years 1999-2002. The project was funded by TEKES, Metso Powdermet Oy, Metso Works Oy, Metso Paper Oy, Fortum Power and Heat Oy, Fortum Oil and Gas Oy, Sulzer Pumps Finland Oy, Plasma Modules Oy, and Esab Oy. The dissertation was conducted in the Graduate school on Metallurgy and Metals Technology during the years 2002-2006 and it was funded by Academy of Finland and Metso Powdermet Oy.
I would like to thank the supervisor of the thesis Professor Hannu Hänninen for his guidance and advices. Dr. Jari Liimatainen from Metso Powdermet Oy is acknowledged for his support and for additional funding for my studies during the years 2000-2006. Dr. Pekka Siitonen, Dr. Mikko Uusitalo, M.Sc. Mikko Luukas, Mr. Heikki Vestman, Mr. Samuli Laine, and Mr. Jari Hellgren are acknowledged for helping in the PTA welding tests. M.Sc. Tapio Saukkonen is thanked for helping in the SEM studies. M.Sc. Timo Kiesi is thanked for helping with the X-ray diffraction examinations. Laboratory of Machine Design is thanked for helping in the rubber wheel abrasion tests. Personnel and colleagues in the Laboratory of Engineering Materials are thanked for the great working atmosphere.
I am very thankful to my dear wife Sirpa for her patience and support throughout this work.
Espoo, March 2010
Marko Keränen
8
Contents
1� Introduction ............................................................................................................. 17�1.1� General ........................................................................................................................ 17�1.2� Problem description..................................................................................................... 18�2� PTA welding method .............................................................................................. 19�2.1� PTA equipments .......................................................................................................... 20�
2.1.1� Plasma torch ........................................................................................................ 20�2.1.2� Plasma nozzle ...................................................................................................... 21�2.1.3� Process gas .......................................................................................................... 25�2.1.4� Dilution control ................................................................................................... 27�
2.2� Welding parameters..................................................................................................... 28�2.2.1� Pre-set and adjustable welding parameters ......................................................... 28�2.2.2� Oscillation ........................................................................................................... 29�
2.3� Consumables ............................................................................................................... 31�2.3.1� Gas atomized powder .......................................................................................... 31�2.3.2� Micropellets ......................................................................................................... 33�2.3.3� Rods and wires .................................................................................................... 37�2.3.4� Consumable efficiency ........................................................................................ 38�
2.4� Modeling ..................................................................................................................... 39�2.4.1� Arc and melting efficiency .................................................................................. 39�2.4.2� Heat input ............................................................................................................ 41�2.4.3� Thermal changes of powder particles .................................................................. 43�2.4.4� Dilution ............................................................................................................... 46�2.4.5� Dissolution of carbides ........................................................................................ 47�2.4.6� Weld pool convection .......................................................................................... 48�2.4.7� Weld pool solidification ...................................................................................... 50�2.4.8� Interactions of welding parameters ..................................................................... 51�
2.5� Effects of main welding parameters on dilution ......................................................... 53�2.5.1� Plasma gas flow rate and plasma arc current ...................................................... 53�2.5.2� Working distance ................................................................................................. 55�2.5.3� Powder feed rate .................................................................................................. 55�2.5.4� Powder fraction ................................................................................................... 57�2.5.5� Shielding and carrier gas flow rates .................................................................... 57�2.5.6� Preheating ............................................................................................................ 58�
3� Degradation of materials ......................................................................................... 59�3.1� Wear mechanisms ....................................................................................................... 60�3.2� Abrasive wear .............................................................................................................. 61�3.3� Modeling abrasive wear .............................................................................................. 67�3.4� Strengthening mechanisms .......................................................................................... 74�3.5� Rubber wheel abrasion test ......................................................................................... 77�4� Objectives of the dissertation .................................................................................. 79�5� Experimental ........................................................................................................... 80�5.1� Materials ...................................................................................................................... 80�5.2� Welding equipment ..................................................................................................... 80�5.3� Welding experiments................................................................................................... 82�
5.3.1� Welding parameters ............................................................................................. 82�5.4� Experimental methods ................................................................................................. 85�
5.4.1� Powder consumable ............................................................................................. 85�5.4.2� Temperature of work piece.................................................................................. 85�5.4.3� Microstructure ..................................................................................................... 85�5.4.4� Rubber wheel abrasion test.................................................................................. 86�

9
6� Results ..................................................................................................................... 87�6.1� 12V tool steel powder ................................................................................................. 87�
6.1.1� Microstructure ..................................................................................................... 87�6.1.2� Powder fraction ................................................................................................... 87�
6.2� Temperature of work piece during the welding process ............................................. 89�6.3� Dilution ....................................................................................................................... 90�
6.3.1� Welding parameters A ......................................................................................... 90�6.3.2� Welding parameters B ......................................................................................... 91�6.3.3� Welding parameters C ......................................................................................... 92�6.3.4� Welding parameters D-G .................................................................................... 93�6.3.5� Hardness .............................................................................................................. 95�
6.4� Hardness distribution................................................................................................... 96�6.5� Optical metallography ................................................................................................. 98�
6.5.1� Microstructure ..................................................................................................... 98�6.5.2� Microstructural changes in weld bead cross-section ......................................... 101�
6.6� Scanning electron microscopy .................................................................................. 103�6.6.1� Welding parameters A-C ................................................................................... 103�6.6.2� Welding parameters D-F ................................................................................... 106�6.6.3� Welding parameters G ....................................................................................... 110�6.6.4� Materials manufactured by the HIP process ...................................................... 111�6.6.5� Microstructure of overlapping beads ................................................................. 114�6.6.6� Microstructural changes in weld bead in welding direction .............................. 119�
6.7� Abrasive wear resistance ........................................................................................... 122�6.7.1� Surface roughness ............................................................................................. 122�6.7.2� Applied load ...................................................................................................... 123�6.7.3� Dilution ............................................................................................................. 123�6.7.4� Hardness ............................................................................................................ 126�6.7.5� Mean size of vanadium carbides ....................................................................... 128�6.7.6� Carbide morphology .......................................................................................... 129�6.7.7� Mean free path ................................................................................................... 131�6.7.8� Volume fraction of vanadium carbides ............................................................. 133�6.7.9� Martensite and retained austenite contents ........................................................ 134�
6.8� Wear tracks ................................................................................................................ 136�6.8.1� Low stress abrasive wear ................................................................................... 136�6.8.2� High stress abrasive wear .................................................................................. 138�
7� Discussion ............................................................................................................. 139�7.1� PTA equipment ......................................................................................................... 139�7.2� Dilution ..................................................................................................................... 139�
7.2.1� Temperature of work piece................................................................................ 139�7.2.2� Plasma arc current ............................................................................................. 140�7.2.3� Powder feed rate ................................................................................................ 140�7.2.4� Location of plasma arc ...................................................................................... 141�7.2.5� Argon-hydrogen gas mixtures ........................................................................... 141�
7.3� Microstructure ........................................................................................................... 141�7.3.1� Volume fraction of vanadium carbides ............................................................. 142�7.3.2� Size and morphology of vanadium carbides ..................................................... 142�7.3.3� MFP ................................................................................................................... 143�7.3.4� Cumulative volumes of vanadium carbide sizes and MFPs .............................. 143�7.3.5� Retained austenite ............................................................................................. 143�7.3.6� Microstructural changes in weld bead ............................................................... 144�7.3.7� Oscillation mode and welding speed ................................................................. 144�7.3.8� Overlapping ....................................................................................................... 145�

10
7.4� Abrasive wear resistance ........................................................................................... 145�7.4.1� Microstructure ................................................................................................... 145�7.4.2� Dilution ............................................................................................................. 146�7.4.3� Plasma arc location ............................................................................................ 146�7.4.4� Preheating .......................................................................................................... 148�7.4.5� Wear tracks ........................................................................................................ 148�7.4.6� Welding parameters G ....................................................................................... 148�7.4.7� Reference material 15V-1 tool steel .................................................................. 149�7.4.8� Modeling abrasive wear of weld deposits ......................................................... 149�7.4.9� Optimized welding parameters .......................................................................... 150�
8� Conclusions ........................................................................................................... 151�References .................................................................................................................... 154�

11
LIST OF ABBREVIATIONS
Ar Argon B4C Boron carbide CO2 Carbon dioxide EB Electron beam welding method F.C.C. Face-centered cubic FZ Fusion zone GMAW Gas metal arc welding method GTA, TIG Gas tungsten arc welding method, tungsten inert gas welding method HAZ Heat affected zone He Helium HIP Hot isostatic pressing HPTA High power plasma transferred arc welding method H2 Hydrogen LB Laser beam welding method MFP Mean free path MIG/MAG Metal inert/active gas welding method MMC Metal matrix composite MPTA Micro-plasma transferred arc welding method O2 Oxygen PA Plasma arc welding method PH Preheated PMZ Partially melted zone PTA Plasma transferred arc welding method RT Room temperature, 20 °C RWAT Rubber wheel abrasion test according to standard ASTM G 65-94 SAW Submerged arc welding method VC Vanadium carbide

12
NOMENCLATURE
A Experimentally determined constant, maximum melting efficiency Ag Volume of a scratch groove [mm3] Ar1, Ar2 Ridges formed during deformation by indented particle or asperity [mm3] A1 Area of the first weld bead layer without the first weld bead layer dilution
[mm2] A2 Area of the first weld bead layer dilution without the first weld bead layer
deposit area [mm2] A3 Area of the second weld bead layer without the dilution from the first weld
bead layer [mm2] A4 Area of the second weld bead layer dilution from the first weld bead layer
without the second weld bead layer deposit area [mm2] a1 Empirical constant, 60 [µm] a2 Empirical constant, 0,32 B Experimentally determined constant, slope on a plot of against
( )-1
Bmf Magnetic flux vector b Unit of slip, Burgers vector [Å]br Width of the rubber wheel [mm] C Coefficient of arc concentration [m-2] CPL Specific heat rate of a powder particle at liquid state Cp Specific heat of a powder particle CR Cooling rate Dsas Secondary arm spacing, 3-8 [ m]
Diffusivity of C in austenite Dilution of the first weld bead layer [%] Dilution of the second weld bead layer [%]
d Average diameter of the reinforcing carbides [ m] da Average diameter of the abrasives [ m]
dc Circle diameter on the base material surface, [mm]
d0 Initial diameter of a powder particle [ m] E Elastic modulus [GPa] Ebm Melting enthalpy of the base material Em Melting enthalpy Epc Melting enthalpy of the powder consumable Es Specific volume enthalpy of the deposit material including latent heat of
melting Farc Impinging force of the arc plasma Fb Buoyancy force Fem Electromagnetic force F Surface tension force f Resistance opposing motion of a dislocation (a force per unit length) fab Abrasive efficiency g Gravitational acceleration [m/s2] Ha Hardness of the abrasive Hbm Hardness of the base material or the wearing material

13
Hdef Hardness measured on the wear debris h Average penetration depth of the abrasive particles [ m] hb Thickness of the weld bead [mm] hr Relative penetration depth of the abrasive particles, h/d I Arc current [A] Jcd Current density vector K Wear coefficient K’ Geometrical constant Kc Fracture toughness of the wearing material [MN/m3/2] K1, K2 Coefficients in relation with surface and abrasive hardness k Modification factor in relation with interphase interaction Lm Melting heat rate of a powder particle l Sliding distance [m] ld Displacement of the plasma arc, overlapping [mm] Ms Martensite start temperature [ºC] mnet Abrasive net mass flow rate past the specimen [g/min] mp Mass of an abrasive particle [g] mpf Packing fraction Np Number of abrasive particles in contact zone [No.] n Number of deposited beads without preheating [No.] n´ Number of deposited beads with preheating [No.]P Applied load [N] Pp Dimensionless parameter q(0) Maximum heat input along arc central axis q(r) Specific heat input at a radial distance of r from arc axis qeff Effective thermal power qeff, l Effective power of the plasma arc in local preheating qeff, n Effective thermal power at nth turn qnet Net power Re Reynolds number of plasma particles system, ~1,06 Rp Tip radius of an abrasive Rs Radius of the shaft to be deposited [mm] r Radial distance from the point source [mm]
Powder particle radius [ m] Sm Heat conducting potential of argon plasma fluid at powder particles
melting point SP Heat conducting potential of argon plasma fluid at powder particles
temperature S Heat conducting potential of argon plasma fluid at plasma temperature s Relative sliding speed between the rubber wheel and the specimen [m/s] TM Melting time for a particle [ s] TLH Liquid heating time for a particle [ s] TSH Solid heating time for a particle [ s] Tamb Ambient temperature [ºC] Tf, bm Temperature at front of the surfacing point [ºC]Tm, bm Surface temperature ensuring melting of the deposit and the base material
[ºC] Tmp Temperature of the molten pool [°C]

14
Tm, p Temperature of a powder particle at melting point [°C] Tp Temperature of a powder particle [ºC] Tr Temperature at radius r from the point source [°C]Ts Surface temperature of the molten pool [°C] T0, bm Initial temperature of the base material [ºC] T0, mp Reference temperature of the molten pool [ºC] T0, p Initial temperature of a powder particle [ºC] tdiss Time to dissolve a particle [ s] t0 Powder particle transporting time in the plasma arc [ms] U Arc voltage [V]
Carbon content in austenite close to the carbide-matrix interface [%] Carbon content in austenite [%]
Carbon content in cementite [%] V Wear volume of the deposit [mm3] Vm Abrasive wear resistance of the matrix phase Vpc Volumetric powder consumable feed rate Vpc, max Maximum volumetric powder consumable feed rate Vr Abrasive wear rate Vsp Abrasive wear resistance of the second phase Vvf Abrasive wear resistance of the composite material vf Volume fraction of the second phase [vol.-%] vft(t) Volume fraction of carbides as a function of time
Initial volume fraction of carbides [vol.-%] W Wear resistance wb Width of the weld bead [mm] xcl Contact length between the rubber wheel and the specimen [mm] x1, x2 Distance from the original deposit surface to the worn phase [mm] y Coordinate parallel to welding direction
T Temperature gradient at the weld pool surface Thermal diffusivity a Mean attack angle [º] 300 K Thermal diffusivity at 300 K Factor describing the decay of deformation with increasing depth below
the wearing surface e Coefficient of thermal expansion of liquid metal Retained austenite content [%] s Surface tension of liquid metal i Wear resistance of ith phase Relative surfacing step, ld/Rs
Arc efficiency Melting efficiency
Melting efficiency for the welds having 2D dimensional heat flow Melting efficiency for the welds having 3D dimensional heat flow
Thermal efficiency 2 Angle of abrasive tip [°]
Weighted average of the tan values of all the individual abrasives MFP Mean free path, spacing, MFP [ m] Coefficient of friction

15
c Specific volume heat capacity of the material of the component Density [g/mm3] PL Mass density of a powder particle at liquid state [g/mm3] Density of an abrasive particle [g/mm3]
lm Density of liquid metal [g/mm3] Mass density of a powder particle [g/mm3]
Stress in contact area [N/mm2] Driving force
Shear stress
Dimensionless surfacing time of n turns, n
Dislocation yield strength Welding speed [mm/s] Volume fraction of ith phase [vol.-%]
kin, mp Kinematic viscosity at melting point Thermal conductivity
Capability of deformation of the wearing material during abrasive wear Effective deformation on the wearing surface
Function of heat distribution
1 Constant po Initial powder injection speed [m/s]

16
Original features
The studied material was an iron-based 12V tool steel alloy (C 2,9 % and V 11,5 %). The plasma transferred arc welding tests and experimental data of this thesis were firstly directed to evaluate the effects of the dilution on the properties of the 12V tool steel deposit. Secondly, they were directed to the evaluation of the effects of the welding parameters on the microstructure and the abrasive wear resistance of the 12V tool steel deposit.
The following features are believed to be original:
1. Optimization of the microstructure and the abrasive wear resistance of the PTA welded 12V tool steel deposit are systematically studied by varying welding parameters.
2. The effects of varying welding parameters on the vanadium carbide size and the MFP distributions of the 12V tool steel deposit were clearly detected by using seven parameter windows.
3. The effects of varying welding parameters on the volume fraction of vanadium carbides and the retained austenite content of the 12V tool steel deposit were measured. The volume fraction of vanadium carbides of the PTA welded 12V tool steel deposit was lower than in the materials manufactured by the HIP process, but the welding parameters for the volume fraction of vanadium carbides close to that of the HIP material 12V were found.
4. The effect of the location of the plasma arc in relation with the edge of the molten pool and the effect of the main welding parameters on the microstructure were detected by measuring the vanadium carbide shape ratios from the 12V tool steel deposits. The effect of the shape ratio on the abrasive wear resistance was confirmed from the wear surfaces in the SEM examination.
5. The microstructures and the abrasive wear resistances of the PTA welded 12V tool steel deposits were compared to those of the tool steel materials manufactured by the HIP process. The microstructural differences were defined and the welding parameters having better abrasive wear resistance for the used abrasive were found.

17
1 Introduction
1.1 General
The plasma transferred arc welding method, PTA, was developed in the 1960’s from the plasma arc welding method, PA. The method has become common in the 1980’s. It is also possible to use the PTA welding method for joint welding. During last decades the focus of the development has been towards the mechanized, the robotized, or the automated PTA welding method. Therefore, it is possible to reduce the welding costs, enhance the process controllability, improve the deposit quality, and increase the deposition rate. High amount of welding parameters, their interactions, and complicated effects of welding parameters on the properties of the various deposits have restricted the optimization of the properties of the deposits welded by the PTA welding method.
The main feature of the PTA welding method is the powder consumable. The properties of the deposit can be tailored for various applications, because different kinds of powders can be tailor-mixed (Saltzman et al., 1985). Low boiling point alloys, e.g., zinc, cannot be welded because of high temperature of the plasma arc (Wahl et al., 1993). The powder consumable is fed with a flow of carrier gas from the powder consumable hopper through the plasma torch straight into the plasma arc, where the powder melts with the base material and forms the deposit. Gas atomized spherically shaped powders are preferred. The powder fraction is usually 50-150 μm. The powder fraction depends on the deposition rate and, thus, the fraction is typically larger for the high power plasma transferred arc welding method, HPTA.
One of the main features of the PTA welding method is the low dilution of the deposit, which is from 3 to 10 %. The low dilution enables the use of one-layer deposit to achieve the intended deposition properties. Other features are strong metallurgical bond between the deposit and the base material, low heat input, low spattering, low distortion, less finishing, small heat affected zone (HAZ), no significant loss of alloying elements, no slag, high quality of the deposit, and excellent properties of the deposit.
The shape of the plasma arc is narrow and sharp, because of the plasma nozzle which intensifies the plasma arc. The plasma arc is stable from low current levels to extremely high current levels. The deposition rate for the PTA welding method with powder consumable is in the range of 0,1-20 kg/h. Thickness of one bead layer is between 1 and 6 mm. It is possible to weld multi-layer deposits. By oscillating the plasma torch, which helps to control the dilution of the deposit, wider passes up to 100 mm can be welded (Dilthey et al., 1994). Bigger surfaces can be welded by overlapping (distance from the bead centerline to the next bead centerline) the weld beads.
Less expensive material like low alloyed steel can be used as a base material in the applications where wear resistance is only needed. In corrosive environments highly alloyed base materials are preferred to withstand the requirements set to the deposit. It is preferable that the base material has coefficient of thermal expansion close to that of the weld metal. Thus, cracks induced in the fusion line by different coefficients of thermal

18
expansion can be avoided during cooling of the component. Preheating, weld bead sequencing, and post-weld heat treating can be made if necessary (Raghu et al., 1996).
The equipments of the PTA welding method are nowadays relatively cheap and the PTA welding method can be mechanized or automated economically, which helps to control the welding process. Typical applications for the PTA welding method are valves, valve seats, extrusion machine screws and components for cutting, waste recycling, mining, crushing, energy industry, and pulp and paper industry.
1.2 Problem description
The PTA welding method is used to weld several millimeter thick wear and corrosion resistant deposits. Traditionally, the dilution of the deposit has been the most studied parameter. It has been thought that it is the most important parameter of the weld bead, because low dilution means that the process is cost-effective and the properties of the deposit are automatically typical to the deposit alloy. During the surfacing process the dilution of the deposit can be controlled and it is usually adjusted by plasma arc current. Welding parameters affecting most the dilution of the deposit are plasma arc current, temperature of the work piece, working distance, powder feed rate, process gas flow rates, and oscillation parameters like amplitude, frequency, and welding speed.
The 12V tool steel deposit is sensitive to the welding process variations. The abrasive wear resistance of the 12V tool steel deposit is based on the primarily precipitated vanadium carbides (VC). The microstructure of the deposit, i.e., the volume fraction of carbides, the mean free path (MFP), the size of carbides, the morphology, the distribution of carbides, and the matrix phases determine the abrasive wear resistance of the 12V tool steel deposit. The dilution of the deposit has to be controlled during the surfacing procedure to maintain basic features of the PTA welding method. A lot of welding parameters and their interactions have effects on both the dilution and the microstructure of the deposit.
The size of the molten pool is large, when welding thick abrasive wear resistant deposit by oscillating the plasma arc. The location of the plasma arc is normally in the edge of the molten pool (Hallen et al., 1992b). The risk of the weld pool stirring, i.e.,convection of the molten pool liquid by the changing location of the plasma arc increases with the size of the molten pool. The location of the plasma arc in relation with the molten pool affects the weld pool convection. The PTA welding method is not stable during the surfacing procedure, e.g., work piece temperature changes from room temperature (RT) up to approximately 300 ºC. This leads to a need to adjust welding parameters. To maintain the optimized microstructure, both the dilution and the effects of the plasma arc on the factors determining the abrasive wear resistance of the 12V tool steel deposit have to be controlled and adjusted during the PTA welding method.
Some experimental tests and models are made during the years to determine the factors, which control the dilution and the abrasive wear resistance of the weld beads. The differences between the welding parameters may be small, but they have major effects

19
on the microstructure and the abrasive wear resistance of the 12V tool steel deposit, because of high temperature and velocity of the plasma arc.
2 PTA welding method
One of the most important features of the PTA welding method is its ability to produce low dilution deposits. This is related to the good plasma arc stability and reproducibility. Low dilution saves the powder consumable and production time. The deposits produced by thermal spray technologies are only mechanically bonded. The bond between the PTA welded deposit and the base material is a metallurgical bond and, thus, the deposit is able to resist many kinds of wear modes including impact wear. The possibilities to use the PTA welded wear and corrosion resistant deposits in industry are broad.
During the last decades the dilution of the PTA welded deposits has been between 5 and 10 %. The development of the equipments has enhanced the ability to control it and nowadays the dilution is from 3 to 10 % for the majority of the PTA applications (Chattopadhyay, 1997; Harris et al., 1983). Because of the improved welding equipments and knowledge about the PTA welding method, the dilution of the deposit below 10 % is possible to maintain during the surfacing process. The dilution is one of the major parameters, which has to be controlled and adjusted during the welding process. Low dilution is important, because highly alloyed consumables are expensive and the base material and the deposit are usually dissimilar. Heat input to the base material is lower with low heat input.
The dilution of the first weld bead layer, , Figure 1, can be estimated from the cross-sectional weld bead sample by an image analysis program using equation 1. If the second weld bead layer is welded, equation 2 can be used to estimate the dilution of the second weld bead layer, . The dilution is mainly concentrated nearby the fusion line, thus, the estimated dilution is not an exact value. The dilutions of the first and the second weld bead layers are:
[%] 100 %, (1)
[%] 100 % , (2)
where A1 is the area of the first weld bead layer without the first weld bead layer dilution, A2 is the area of the first weld bead layer dilution without the first weld bead layer deposit area, A3 is the area of the second weld bead layer without the dilution from the first weld bead layer, and A4 is the area of the second weld bead layer dilution from the first weld bead layer without the second weld bead layer deposit area.

20
Figure 1 Schematic presentation of the deposit cross-section, where A1 is the deposit area without penetration and A2 is the area of penetration
2.1 PTA equipments
The mechanized PTA welding unit consists of the plasma torch, pilot and plasma arc power supplies, mechanized torch oscillation unit or robot, component manipulator or rotating table, consumable feed unit, torch cooling unit, and work piece preheating unit. The powder plasma torches have been manufactured also for manual hand welding (DuMola et al., 1988) and mechanized internal cladding for the pipes the inner diameter of which is 70 mm at minimum (Dilthey et al., 1994; Draugelates et al., 1993).
2.1.1 Plasma torch
A typical powder plasma torch is presented schematically in Figure 2. In the torch the pilot arc (non-transferred arc) is maintained between the non-consumable tungsten electrode (cathode) and the water-cooled plasma nozzle (anode). The pilot arc is needed for initiating and stabilizing the plasma transferred arc. The transferred plasma arc is maintained between the electrode and the work piece. Plasma gas is needed to form the plasma and to shield the electrode during the surfacing process. The transferred plasma arc transmits heat to the base material more efficiently than the non-transferred plasma arc does. Carrier gas is needed to transfer the powder consumable from the hopper through the plasma torch into the plasma arc, where the powder melts. Shielding gas is used to shield the molten pool against air atmosphere. Like in the conventional plasma welding process, also in the PTA welding method the plasma arc is constricted by the plasma nozzle. The shape of the plasma arc can be controlled by the plasma nozzle, which is available in different kinds of diameters.

21
Figure 2 The plasma torch of the PTA welding unit (Raghu et al., 1996)
The basic phenomenon of the plasma arc of the PTA welding method is as follows. Plasma current passes air between the electrode and the work piece, while the gas molecules accelerate and collide with each other. Binding forces between atoms and electrons collapse and electrons are released from the nucleus. The gas, consisting of neutral molecules, positively charged atoms, and negative electrons, is ionized and, thus, the gas is capable to conduct current (Craig, 1988).
The deposition rate of the mechanized PTA welding method with the powder consumable is up to 20 kg/h. The thickness of one bead layer is between 1 and 6 mm. The deposit thickness is usually as much as the tolerance of the wear part. The plasma arc is stable with low to high heat inputs. The plasma torch is designed to weld with a certain deposition rate, i.e., various welding torches have been developed to weld with different deposition rates. For the micro-plasma transferred arc welding method, MPTA, the deposition rate is below 1 kg/h and the bead thickness 0,1-0,5 mm, for instance (Saltzman et al., 1992; Sun et al., 1998).
The pilot and the plasma arcs are maintained with direct current (electrode negative), variable polarity, or alternatively pulsed current, which makes it easier to control heat input, penetration, and the shape of the molten pool (Craig, 1988; Deuis et al., 1997; Fromowicz et al., 1993). The mass flow configuration allows the gas volume to be controlled and allows variations in the gas flow to be made via computer controlled program (Shubert, 1992).
2.1.2 Plasma nozzle
Energy density and temperature of the plasma arc are much higher than those in the arc without the plasma nozzle (Elizagàrate et al., 1981). Plasma arc temperatures in the different regions of the plasma arc depend on plasma gas. Argon, Ar, hydrogen, H2, and helium, He, can be used as plasma gas and temperatures of the plasma arc are on

average 15000, 6000, and 2a plasma gas.
In Figure 3 are presented plasma transferred arc, PThighest temperature is nearwas 4,75 mm. Arc currents14,5 and 29 V, respectively
Figure 3 Differences beis plasma gas
Temperatures of the top surestimated to be about 2700weld pool determined by amean temperature of the w1,08 (Gladky et al.,1990).
Many kinds of powder plasmIn Figure 4 is presented a manufactured a torch whichflow was introduced to the pbenefits were reduced turbdecreased deposition of thpresented plasma arc tempeplasma arc currents 100 andbased on the experimentalplasma gas, plasma gas temperature range of the pplasma nozzle diameters, aal., 1990).
22
d 20000 °C, respectively. The gas mixtures can
ed differences between the gas tungsten arc,PTA, arc temperatures, when Ar is used as pearby the tip of the electrode. Diameter of thents were 200 A. Voltages of the GTA and thely (Elizagàrate et al., 1981).
between the GTA and the PTA arc temperatu(Elizagàrate et al., 1981)
surface and 4 mm below the top surface of the 00 and 1700 ºC (Feng et al., 1999). Mean tem a calorimeter, was around 1650-1700 ºC, ind weld pool is equal to melting point temperat
asma torches have been designed for the PTA wtorch, which utilizes a separate external nozz
ich utilizes a separate stabilizer gas. This sepae plasma arc between the electrode and the plasurbulence, reduced thermal load to the plasm the powder particles on the plasma torch. perature vs. various external plasma arc nozzl
and 220 A. Plasma gas was Ar. The temperatutal data. Temperature of the plasma arc depes flow rate, plasma arc current, and plasme plasma arc column with low plasma stream
and plasma arc currents is broad (Dresvin, 1
an be also used as
rc, GTA, and the plasma gas. The
the plasma nozzle he PTA arcs were
atures when argon
he weld pool were temperature of the indicating that the rature times 1,01-
welding method. ozzle. Babi (1993) eparate “cold gas” lasma nozzle. The asma nozzle, and h. In Figure 4 is zzle diameters and ature fields are set epends mainly on sma nozzle. The
am speed, various , 1972; Gladky et

Figure 4 Plasma arc tema) 100 A and 1990)
In Figure 5 is presented radiplasma nozzle. Plasma gas being moved across the arc column is 60-200 m/s. Plasrate and small plasma nocolumnar and directional p(Dresvin, 1972; Gladky et am/s for powder particle sizhigh speed camera (Siagam
Figure 5 Radial distribuplasma nozzle
23
temperatures vs. various external plasma arc nod b) 220 A plasma arc current (Dresvin, 1972
adial distribution of plasma gas flow at 1 mm das stream velocity has been estimated by a cyrc column. Plasma gas stream velocity range inlasma gas stream velocity is higher with high pnozzle radius. Higher plasma gas velocity l plasma flow from the plasma nozzle to tht al., 1990; Wilden et al., 2006). Particle velocisizes of 63 and 200 m, respectively, were mm et al., 2008). Plasma gas flow rate was 3,5 l/
ibution of plasma gas stream speed at 1 mm dizle (Dresvin, 1972; Gladky et al., 1990)
nozzle diameters: 2; Gladky et al.,
distance from the cylindrical probe, e in the plasma arc h plasma gas flow ty increases more the base material
ocities of 20 and 7 measured with a l/min.
distance from the

In Figure 6 are presentedmethod. In the PTA weldcolumnar. The electrode locenergy density of the plasmwelding method. Heat inputwith low heat input. The indistance when compared tnozzle has also an effect onreduces the intensity of therelatively long distance, whin working distance does (Koivula et al., 1992).
Figure 6 Effect of arc sand the plasm1992)
A change in plasma arc voltdistance or by resetting thincrease in working distancposition has an effect on electrode position ±1 mm ceffect of working distanceal., 1984).
24
ed the differences between the GTA and theelding method, the plasma arc is much narro locates inside the plasma nozzle. The plasma aasma arc and the production rate are larger thput concentrates to a small area, thus, producing intensity of the plasma arc reduces on about t to the GTA welding method. The diameter on the intensity of the plasma arc. The bigge
the plasma arc. The intensity of the plasma arcwhich helps to control the dilution, because a ses not have a significant effect on the plas
rc shape on intensity of the arc in the gas tungsma transferred arc, PTA, welding methods
oltage may be achieved in two ways, i.e., by ch the electrode, while the other parameters arance leads to an increase in plasma arc voltagen the dilution as well as working distance. B
changes plasma arc voltage from 0,5 to 1 V.on plasma arc voltage is presented (Hunt, 1
the PTA welding arrower and more a arc is hotter, the than in the GTA ing a narrow weld t ten times longer ter of the plasma ger plasma nozzle arc decreases on a a small alternation lasma arc density
ungsten arc, GTA, s (Koivula et al.,
changing working are constant. An age. The electrode
By resetting the V. In Figure 7 the t, 1988; Pfeiffer et

Figure 7 Effect of work140 A (Pfeiffe
In the mechanized PTA wesystem to control working control system measures pwith plasma arc voltage. Pvaries.
2.1.3 Process gas
Three gas lines are needeshielding gas line. The gas line, and it can be changemechanical and the metallualloying elements and increair atmosphere. Because carplasma arc, carrier gas mixinput, concentration, and ion
The process gas in the PTphysical properties of the gathe shape of the deposit, anshielding gas can lead to bu
The properties of the procthermal conductivity. Dens1,78, 0,18, 0,08 kg/m3 anThermal conductivity of thpool, molten pool degassingconductivity of the process
25
orking distance on plasma arc voltage with plaffer et al., 1984)
welding method it is possible to install an aug distance between the plasma torch and the wplasma arc voltage and adjusts working distPlasma arc voltage changes linearly when w
ded for the PTA welding process, i.e., plasmas can be the same in all lines, it can be differged during the welding process. The processllurgical processes in the molten pool throughcrease of some components from both the proccarrier gas and the powder consumable are fed mixtures partly with plasma gas and its prope ionization potential, can change (Craig, 1988; S
PTA welding method can be Ar, Ar-H2, Ar- gas have effects on the shape of the plasma arand the deposit microstructure. The content o
burn-out of, e.g., Si and Mn alloying elements (
rocess gas depend mainly on density, ionisatiensities and ionization energies of Ar, He, anand 15,8, 24,6, and 13,6 eV, respectively ( the process gas has an effect on temperatureing effect, welding speed, and weld shape. Thss gas is the main feature when high welding s
plasma arc current
automatic control e work piece. The istance in relation working distance
asma, carrier, and ferent gas in every ss gas affects the gh the loss of the rocess gas and the ed straight into the operties, e.g., heat ; Shubert, 1992).
-He, or He. The c, the heat input,
t of O2 or CO2 in ts (Menzel, 2003).
ation energy, and and H2 gases are (Menzel, 2003).
ture of the molten Therefore, thermal g speed is needed.

26
Thermal conductivity of Ar is around 0,015 W/cm°C at 8000 °C. Thermal conductivity of H2 is multiple at 4000 °C temperature when compared to thermal conductivity of Ar. Thermal conductivity of He is higher when compared to thermal conductivity of Ar (Menzel, 2003).
Ar is the most common process gas in the PTA welding method. It is inert and it does not oxidize or react with the weld pool. The properties of Ar as a process gas are good shielding effect due to high gas density, relatively stable narrow plasma arc, good electrical conductivity, low ionization potential, high surface tension of the weld pool, and low burning of alloying elements. While Ar is used as plasma gas it ionizes easily, which determines the ease of the plasma arc ignition and its stability. It has low thermal conductivity and, thus, the plasma arc is narrow and concentrated (Craig, 1988; Yamamoto et al., 1997).
Ar-H2 gas mixture has excellent deoxidizing and focusing effects (Lugscheider et al., 1992). Thus, Ar is mainly used as plasma and Ar-H2 gas mixture (5-10 % H2) can be used as shielding gas. Ar-H2 compound can be used also as powder carrier gas. Low amount of H2 in the plasma arc increases thermal intensity, heat input, penetration, and welding speed. Approximately at 3870 °C temperature H2 molecules dissociate, and energy is released when the molecules recombine or contact with the work piece (Craig, 1988). H2 reduces pores, surface tension of the weld pool, and bead surface oxidation. It increases fluidity and wetting of the melted powder, which is useful when the smooth deposit surface is needed (Harris et al., 1983; Hunt, 1988; Oechsle et al., 2000).
H can be transported to the deposit with a contaminated powder, for instance. Dissolution of H into the iron melt is low, about 0,00075 % per 100 g of iron at melt temperature at 1 atm. Dissolution of H into iron melt depends on temperature. Solubility decreases at the solidification temperature of iron melt. When the temperature of the molten pool further decreases the solubility of H into the iron melt still decreases. At 1371 ºC temperature the solubility of H increases temporarily. Below this temperature the problems caused by H arise. Diffusivity of H decreases with decreasing temperature. At RT iron is capable to retain only a small part of H soluble at high temperatures. Dislocation interactions can enhance the transportation of H by several orders of magnitude. H diffuses and forms molecular H2 and escapes as a gas. Under rapid cooling H is retained in the austenite and at low temperatures austenite transforms to martensite or bainite. Lattice imperfections may trap H. Inclusions and pores may trap H2. High internal stresses can develop and cracks may initiate at the discontinuities (Stout, 1987).
He has high thermal conductivity and high ionization potential, which offers increased welding speed, penetration, and improved weld quality when compared to Ar gas (Bols et al., 1997). Gas densities of He and H2 are lower than air, which causes problems to the shielding efficiency. He content in the process gas can be between 30 and 100 %, thus, flow rates have to be increased to maintain the shielding efficiency. Regular flow rates for He mixtures of 30, 50, 75, and 100 % are 18, 28, 35, and 40 l/min, respectively (Menzel, 2003; Oechsle et al., 2000).

27
Welding tests welded with various gases without preheating gave results as follows. Welding tests with Ar-He-CO2 as a shielding gas resulted in a good bead appearance only for NiCrBSi 80 12 alloy, while Ar, Ar-H2, and Ar-He gas mixtures gave good bead appearances for CoCrWC 64 29 5, NiBSi + 60 % WC, NiCrBSiAl 90 4 1, NiCrBSi 80 12, X 120 WCrMoV 6 5 4 4, and X 3 CrNiMo 18 13 3 alloys. The best weld beads were obtained with Ar and Ar-H2 gas mixture. The deposits welded with Ar had the highest hardnesses. Pores were typically found, when Ar-He gas mixture was used (Oechsle et al., 2000).
2.1.4 Dilution control
Optical spectroscopy is one of the auxiliary methods for controlling and adjusting the dilution of the weld bead. Spectroscopic analysis is typically used to analyze materials. The significant wave length, 500-1000 nm, has to be set before the welding process and after that the chemical composition of the molten pool is possible to control with the spectrometer. In Figures 8a, b is presented the local maximum and minimum wave length measurements made by the spectrometer in relation with the dilution of the deposit alloys Stellite 12 and Alloy 60. The location of the plasma arc was on the molten pool. The dilution control was more accurate with the bigger dilution ratios (Dilthey et al., 1996a; Pavlenko, 1996).
Figure 8 Relative intensities measured by an optical spectrometer as a function of dilution of the deposits deposited onto the base materials GGG 70 and St 52: a) Stellite 12 and b) Alloy 60 (Pavlenko, 1996)
28
2.2 Welding parameters
The effect of an individual welding parameter on the PTA welding method has to be known for optimizing welding parameters and to learn interactions between different welding parameters. In the mass production to obtain equal quality onto the deposited components, the surfacing process has to be consistent enough (Herrström et al., 1993).
The main advantages of the PTA welding method are heat input and cooling rate, which are in the range suitable for depositing a component with a broad range of alloys as well as for surface alloying or surface hardening. Usually brittleness, cracking, and gas porosity can be avoided.
2.2.1 Pre-set and adjustable welding parameters
A number of process and material factors affect the dilution of the deposit. 37 variables for the PTA welding method are identified, which have effects on the welding process. 18 variables were identified as pre-set variables and 19 variables as variables, which need to be adjusted. The settings preferred by welding operator and welding engineer may also vary which makes it difficult to find optimized welding parameters (Kapus, 1980).
The main parameters have the biggest effect on the PTA welding method output quality. The selection of the test conditions is vast. Often a large set of welding tests are needed. Stable process conditions during the surfacing process cannot be ensured (Nefedov et al., 1994). Even though straight passes without oscillation can be welded, the PTA welding method is usually maintained by oscillating the plasma torch. The most important factors are (Herrström et al., 1993; Hunt, 1988; Kapus, 1980; Sexton et al., 1994):
• plasma arc current • current upslope • plasma gas flow rate • composition of plasma, carrier, and shielding gas • powder consumable feed rate • moisture content of powder and gas pipes • chemical composition of powder consumable • overlapping • preheating temperature • interpass temperature • working distance • arc voltage • arc polarity • electrode diameter • electrode type • electrode setback • substrate shape and size

• substrate and consum• oscillation mode• oscillation amplitude• oscillation frequency• dwell time• welding speed • shielding gas flow ra• transport gas flow ra• deposit thickness• cooling water flow r• torch angle in relatio• melting temperature
2.2.2 Oscillation
The thickness of the deposobtained by oscillating the from 5 to 50 mm. Pilot ardilution in the reverse poincommon oscillation modepresented in Figures 9b, dmany mechanical torch trawelding unit the adjustable time, transversal welding oscillation mode is used. oscillation width amplitudeis used.
Figure 9 The most commethod: a) strc) sine wave, Sharples, 1985
The oscillation wave mode component. For instance, reheat input and penetrationwelding a bead to the surfac
When comparing the weanoticed that the surfacing p
29
sumable materials
ude ncy
rate rate
rate
tion with base material res of powder and substrate.
osit is typically between 1 and 6 mm. The wie plasma torch, Figures 9a-d. The width of a b
arc and plasma arc currents adjustment helpoints of the oscillation waves (Dilthey et al., 1
s, i.e., zigzag and rectangular wave oscillad. Sine wave is almost equal to the zigzag w
transport units utilize it. In the mechanized ole oscillation parameters are longitudinal weldig speed, and oscillation width amplitude, wd. The adjustable oscillation parameters are de, and frequency, when zigzag or sine wave o
common oscillation wave modes used in thestraight pass without oscillation, b) triangular e, and d) rectangular wave mode (Blunt, 200
985)
de can be modified to face the properties of thereverse points may have different kinds of dw
ion can be controlled more efficient way, eface edge of the component (Rasche, 1973).
ear resistance between the surfacing method parameters, e.g., the straight pass or the oscil
wider pass can be a bead is typically lps to control the , 1994). The most
illation modes are g wave mode and d or the robotized lding speed, dwell when rectangular
re welding speed, oscillation mode
the PTA welding ar or zigzag wave, 2000; Hunt, 1988;
the deposit and the dwell times. Thus,
especially, when
ods, it has to be cillation mode are

taken into account. In themovement of the plasma toand, thus, the valve head ca
Magnetic arc oscillation unoscillation unit. Oscillationelectromagnets, which are lthe plasma arc, the dwell tcontrolled independently. Tthe deposits welded by a mbead edges, which were irreand nozzle damage were sethe sweep time the penetraThe consumable efficiencyfrom the plasma arc. The causes a transverse deflecticontrolled by the field strendilution of the deposit betwe
In Figure 10 weld pool shamm and frequency 50 Hz isthe arc, melt in the moltdecreases. The result is themolten pool. The unmeltedWelding speed and oscillatithe molten pool as well as(Gladky et al., 1990).
Figure 10 Shape of the width 15 mm a
Wider surfaces can be surfbead and displacement of thheights and valleys on th
30
the small components, like the valve heads, torch can cause too high heat input to the com can be overheated and distorted (Klimpel et al.,
unit can be also used for weld surfacing insteadon and oscillation mode are therefore adjustede located parallel to the welding direction. Thll time, and the magnitude of the peak magne. The quality of the deposit is not as good, wh mechanized oscillation unit. The defects wereirregularly shaped. Also spattering, arc instabili
een during the surfacing process. By adjustintration can be controlled in the edges of the o
was low, because of excessive deflection of de interaction between the plasma arc and thection of the arc, because of the Lorentz forceength and polarity. The deposit width from 8 totween 4 and 16 % can be obtained (Blunt, 2000
hape vs. plasma torch welding speed with osciz is presented. The powder particles, which weolten pool. Therefore, the temperature of thhe decreasing effect on the size, mass, and temlted powder particles melt in the molten poolation parameters also affect the size, mass, and as arc location in relation with the edge of t
e weld pool vs. plasma torch welding speed m and frequency 50 Hz (Gladky et al., 1990)
urfaced by overlapping single weld beads. Wif the plasma arc ratio, wb/ld, is 1,1-1,2. The diffthe deposit surface is usually 20 %. When
ds, the oscillation component surface al., 2005).
ead of mechanized ted by one or two The time to sweep netic field can be
when compared to ere found from the ility, powder loss, ting the dwell and oscillation wave.f droplets ejecting
the magnetic field rce, which can be to 15 mm and the 00).
scillating width 15 were not melted in the molten pool temperature of the ool in 10-4-10-2 s. and temperature of f the molten pool
d with oscillating
Width of the weld ifference between
en the wb/ld ratio

31
increases, e.g., above wb/ld 2 the deposit may become more even (Nefedov et al., 1994).
2.3 Consumables
Term weldability is defined by the American Welding Society as “the capacity of a metal to be welded under the fabrication conditions imposed, into a specific, suitably designed structure, and to perform satisfactorily in the intended service”. The definition of this term is a complex process. The evaluation of the whole successful process from the beginning of the first plan to the use of an application in its real environment is challenging. Term weldability is mainly used to describe and to compare how weldable the consumable is.
Fe-, Co-, and Ni-based alloys are mainly used as powder consumables. All metals can be produced in the powder form. Gas or water atomization powder production methods are the dominant and perhaps the most versatile methods that produce metal powders at high production rates. Various powder production methods allow precise control of the chemical composition and the physical characteristics of the powders. Variation of the chemical composition of the powder and the powder fraction have effects on the properties of the deposit, the viscosity of the molten pool, the consumable efficiency, and the size of the molten pool, even though the chemical composition is in the approved range (Dilthey et al., 1996b; Dunkley, 1998; German, 2005).
2.3.1 Gas atomized powder
Water, nitrogen, and argon gas are used in the metal powder atomization processes. The nitrogen and argon atomized powders are usually spherical. Nitrogen atomization can lead to a poor powder shape and to a high retained gas content, which may lead to irregular and porous weld deposits (Dunkley, 1998; German, 2005; Hunt, 1988).
The water atomized as well as crushed carbide powders tend to be irregular in shape, while the gas atomized powder is spherically shaped. In Figure 11 is presented the effect of the powder manufacturing method on powder feed rate. The deposit can be thicker or thinner depending on the powder used, if welding parameters are not changed. Therefore, the dilution can also change. Powder feed rate and plasma arc current can be varied so that the thickness and the dilution of the weld bead remain constant during the PTA welding method (Dören et al., 1985; German, 2005).

Figure 11 Powder feedin(Dören et al.,
The powder consumables Figure 12. The shape of theshaped powder particles areμm. In the PTA welding mefrom 50 to 150 μm. Internprocess, and with the bigge2005; L’Estrade et al., 1988
32
ding characteristics of the water and the gas ato., 1985)
s are mainly manufactured by the gas atomthe powder particles can be controlled and usuare preferred. The range of the powder size is f method the range of the powder consumables uernal porosity exists always regardless of theger fractions the porosity increases (Dunkley,88).
atomized powders
mization method, usually spherically is from 10 to 1000 s used is typically the manufacturing ey, 1998; German,

33
Figure 12 Gas atomized powder production method (German, 2005)
2.3.2 Micropellets
The wear resistance can be enhanced by adding ceramic carbides to the matrix alloy. The deposit is then so called metal matrix composite, MMC. MMCs have a combination of mechanical and physical properties, the properties of which can be tailored by selecting a metal matrix alloy and a reinforcing phase or carbide. MMCs have high stiffness, strength, and hardness. The wear and the corrosion resistance can be tailored according to the application. The optimal microstructure of the deposit depends on the application.
Weldability of the powder alloy determines partly the properties of the deposit. The size of ceramic carbides is typically around 100 µm. High volume fraction or large-sized

34
ceramic carbides decrease the weldability of the alloy. The maximum amount of carbides in the MMC is about 60 vol.-% (Tsubouchi et al., 1997). In the wear resistant MMC deposits, large-sized original carbides of the powder consumable have to remain at least partly unmelted during the surfacing procedure. The original carbides can be introduced straight into the weld pool with the external powder feed nozzle, if necessary (Röthig et al., 1997). The melting of the original carbides in the plasma arc is, thus, prevented or minimized (Hunt, 1988; Herrström et al., 1993; Kammer et al., 1991).
The hard wear resistant carbides are commonly manufactured by crushing and, therefore, the shape of the carbides is irregular. The mixed powders, which are based on the metal powder manufactured by the gas atomization and the crushed carbides, have proneness to separate in the powder consumable hopper and the feeding cable due to differences between the density, the size, and the morphology of the particles. Surfacing layers tend also to exhibit segregation at the time of melting. The particles with a higher density tend to settle to the lower regions of the deposit and the particles with a lower density tend to settle to the upper regions of the deposit (Lugscheider et al., 1990; Lugscheider et al., 1995).
The micropelletizing produces agglomerates of spherical form, irrespective of the initial particle form, size, morphology, or density, which is the main reason to use them. Any kinds of mixtures can be adjusted. The density of the agglomerated powder is possible to enhance by sintering. The density of the powder has also an effect on the powder feeding properties (Lugscheider et al., 1990; Lugscheider et al., 1994).
By micropelletizing, it is possible to manufacture the micropellets from the sub-micrometer-sized particles. As micropellets, the fine particles are agglomerated and, thus, carried together in the powder feeding system. The dust-like fine particles may interfere the feeding of the powder, but when the fine particles are adhered to the larger particles the problems do not appear in the powder feeding system. This increases the ability of flow of the composite powders as compared with the mechanically homogenized ones (Lugscheider et al., 1990; Lugscheider et al., 1992).
In Figures 13a-d the morphology of differently produced powders are presented. In Figure 14 the basic metal matrix alloys and the reinforcing carbides, which can be included into the micropellets, are schematically presented. The morphology of the micropellets is markedly enhanced when comparing to the morphology of the tailor-mixed powders (Lugscheider et al., 1990; Lugscheider et al., 1994).

Figure 13 Morphology Lugscheider e
a) Fused tub) Cobalt-
(magnifc) Compos
tungstenis 5 μmμm (ma
d) Compostungstentungstenalloy les
35
y of differently produced powders (Ait-Meet al., 1990):
d tungsten carbide, crushed powder (magnificati-chromium-tungsten-carbon alloy, gas-ato
nification 400:1)posite powder of cobalt-chromium-tungsten-ten carbide, agglomerated, grain size of fused tm and cobalt-chromium-tungsten-carbon allo
magnification 1000:1)posite powder of cobalt-chromium-tungsten-ten carbide, agglomerated and sintered, grainten carbide is 5 μm and cobalt-chromium- less than 45 μm (magnification 1000:1)
Mekideche, 1989;
ation 400:1)atomized powder
-carbon + fused d tungsten carbide alloy less than 15
-carbon + fused rain size of fused
-tungsten-carbon

Figure 14 Metal matrix(Lugscheider
In Figure 15 is presented aThe initial components are (polyvinyl alcohol) and wathot air, where the dropletsdependent on the selected pinitial components, the micin a reducing atmosphere (agglomerated and sintered binder evaporates. The welsintering. Also heating durLugscheider et al., 1990; Lu
36
trix powder, reinforcing particles, and ther et al., 1992)
a spray dryer, which is used to manufacture tre stirred to form a suspension together with anater. The suspension is sprayed through the a
lets dry in free atmosphere. The size of thed parameters. To increase the strength of adhesicropellets can be sintered after agglomeratione (H2) at 1050 to 1150 °C with a dwell timed micropellets loose their binder content, becaelding behavior of the micropellets is improve
during free-fall evaporates the volatile agent Lugscheider et al., 1994).
the micropellets
e the micropellets. an organic binder atomizer into the
he micropellets is esion between the on. When sintered me of 60 min the ecause the organic oved as a result of
(German, 2005;

Figure 15 Spray dryer fo
2.3.3 Rods and wires
Rod, external powder feedithe same time with the poCoarse carbides can be enmetals and carbides are seoperation increases efficienpool and limit the depositiobe increased close to the meheating, which is introduced
The bead thickness and thefrom 4 to 10 mm and fromup to 23 and 33 kg/h wirespectively. The dilution wsurfacing direction was lessThe optimized welding pa
37
for manufacturing the micropellets (German, 2
eding torch for carbides, hot wire, or cold wirepowder consumable, e.g., for increasing the encased into the steel wire tubes, but optimiz seldom achieved for rod and wire welders. iently the deposition rate, while cold wire may tion rate (Sexton et al., 1994). Temperature of melting point by electrical resistance heating anced to the wire.
the deposition rate for the plasma arc hot wirom 18 to 31 kg/h, respectively (Meyer, 1976). with one 3 and 4 mm diameter hot wire
n was between 5 and 50 %. The length of the wless than 6 mm. Surfacing speed was approximparameters were plasma arc current 300-315
, 2005)
ire can be used at e deposition rate.
mized mixtures of rs. Twin hot wire ay cool the molten of the hot wire can and additional arc
wire surfacing are). Deposition rate
can be welded, e weld pool in the ximately 0,8 m2/h. 15 A, arc current

heating the wire 280-300 26-28 V, welding speed 8 mm, shielding gas Ar + 8-flow rate 2-3 l/min (Steklov
2.3.4 Consumable efficien
Before the surfacing proceseveral hours or over the nipowder feeding nozzle is nethe plasma arc. The powdediameters of which are loweplasma arc column. Instabiobtained, when the powder
In the PTA welding methobtained (Xibao, 2003). Thunmelted powder particleswelding method is betweenAlloy 60 (X40CrSiMo 10 2of +95 %. Oberländer et al.
In Figure 16 the best consuarc intensity lowers the mediameter causes a decreasechanged. Higher plasma arbecause the increased enthvolume of the powder consuof the finer particles in theefficiency with high plasmaal., 1986; Xibao et al., 1998
Figure 16 Effect of placonsumable ef
38
0 A, current passing through the wire 180- 8 m/h, frequency 60 Hz, amplitude 50 mm, w
-10 % H2 with flow rate 5-6 l/min, and plaslov et al., 1989).
iency
cess the powder consumable is usually dried night to eliminate the moisture from the powde needed for feeding the powder consumable wider range is normally 50-150 μm. The powdwer than 50 μm, tend to blow away due to highability in the plasma arc column and the molter diameter is above 150 μm.
thod the evaporation of the powder particles The loss of the powder is due to spattering les. The best reported consumable efficienceen 95-99 % (Dilthey et al., 1996b). The po
0 2). Anderson et al. (2003) reported the consum. (1992) reported the consumable efficiency o
nsumable efficiency is 97 % and the lowest 68melting efficiency of the plasma arc. An increase in the consumable efficiency, if plasma ar arc current causes an increase in the consumnthalpy of the plasma arc is then sufficient tnsumable. The finer fractions are too dust-like the plasma arc may occur. The reason for lowma arc currents presented in Figure 16 is not 98).
plasma arc current and powder fraction (N efficiency (Babiak et al., 1983; Babiak et al., 1
-200 A, voltage , wire diameter 3
lasma gas Ar with
ied at 120 ºC for der particles. The
with carrier gas to wder particles, the igh pressure of the olten pool can be
les is not usually g and the loss of
ency in the PTA powder alloy was sumable efficiency
of 80-90 %.
68 %. Decreasing crease of the grain arc current is not umable efficiency, t to melt a given
ke and evaporation lower consumable ot clear (Babiak et
(NiCrBSiFeC) on ., 1986)

39
The consumable efficiency can vary depending on how the powder is fed to the plasma arc. According to Dilthey et al. (1998) the consumable efficiency is not optimized, when external coaxial annular powder feed nozzle is utilized. This nozzle allows melting of the powder particles up to 200 μm. Also arc deflections can occur especially if the powder is fed to the arc from several channels instead of an annular nozzle. Internal powder feed system, where the powder is fed with a carrier gas through the hollow electrode straight to the plasma arc, provides longer dwell time for a powder particle. Thus, larger particles up to 300 μm can be melted. It is also possible to feed the powder straight to the molten pool, which is more common in the laser welding method, LB (Klimpel et al., 2005). A simple and useful system is to use gravitational force to assist the powder feed. Anyway, the powder traveling time in the plasma arc is very short, at least, when compared to the time in the molten pool.
With an increase in the consumable feed rate, more plasma arc heat is required to melt the consumable and less heat remains to melt the base material and, thus, the dilution decreases. At the same time the thickness of the deposit increases, if the other parameters are not changed. Larger deposition rate basically requires an increase in plasma arc current. However, it is obvious that finally, when the thickness of the bead increases the plasma arc is no more able to form penetration. The plasma arc location is then on the molten pool (DuPont, 1998; Marantz, 1980).
2.4 Modeling
The effect of the plasma arc on the PTA welding method can be modeled. The arc and the melting efficiencies and their effects on heat input as well as physical properties of materials and welding parameters have to be known to get exact estimation about the PTA welding method. The oscillation of the plasma torch is not included to the equations, thus, these equations describe more the conventional PA welding method. However, the physical properties and welding variables, which have an effect on the arc and the melting efficiencies, are determined.
2.4.1 Arc and melting efficiency
Term thermal efficiency, t, considers both the arc efficiency, a, and the melting efficiency, m. The arc efficiency describes a fraction of total heat load which has been transferred from the plasma arc to the component to be welded. A fraction of energy which has been used to melt the powder and the base material is considered as melting efficiency. The weld material has no effect on the arc efficiency. The melting efficiency depends strongly on the process parameters (DuPont et al., 1996).
The plasma arc efficiency in the PA welding method is lower and more variable than the arc efficiency in the GTA welding method, because of the plasma nozzle. However, the penetration of the weld bead at the same heat input is higher in the deposits welded by the PA welding method when compared to the deposits welded by the GTA welding method. Increasing welding speed to a certain rate and pulsating plasma arc current effectively increase the plasma arc efficiency. The effect of the pulsed plasma arc on the

40
arc efficiency is not as stable in the PA welding method as in the GTA welding method. Decreasing pulsed current duty cycle decreases the arc efficiency in the welding process, while decreasing pulsed current duty cycle increases the melting efficiency. One benefit of the pulsed current is high melting efficiency at low welding speeds. The main difference between the GTA and the PA welding methods, i.e., the plasma nozzle, has an effect on both the arc and the melting efficiency. Thus, the plasma nozzle diameter depends on, e.g., powder feed rate, following the inability to get an exact comparison between the methods and the surfacing situations. The plasma nozzle is also water-cooled, and the removed heat energy is not known. As a conclusion melting efficiencies of the PA and the GTA welding methods are close to equal. The melting efficiency was slightly better for the PA welding method (Fuerschbach et al., 1991). However, DuPont et al. (1996) measured that both calculated and measured melting efficiencies were lower in the PA welding method when compared to the other conventional welding methods.
The difference between measured and predicted results was observed to be within ± 10 % (Giedt et al., 1989). The plasma arc efficiency is assumed to be 0,47±0,03 (DuPont et al., 1996), 0,50-0,75 (Fuerschbach et al., 1991), and 0,55-0,80 (Gladky et al.,1990). The measurements conducted by Seebeck Envelope arc welding calorimeter disclose that the arc efficiency of the plasma arc decreases slowly from 0,50 to 0,44 with increasing plasma arc current from 200 to 400 A (DuPont et al., 1996). Seebeck Envelope arc welding calorimeter has been disclosed by Giedt et al. (1989). The combination of the thermopile and gradient layer forms a heat-rate meter based on the Seebeck thermoelectric effect, thus, the calorimeter is called as Seebeck Envelope Calorimeter. The arc efficiency measurements are usually based on measurements made with calorimeters. The reproducibility of the measurements is excellent, the errors being about 2 % (Dilthey et al., 1993; Giedt et al., 1989; Kou et al., 1986). Equation 3 estimates the arc efficiency, , and it is based on heat conduction and average constant thermal properties, even though fluid flow and convection heat transfer can be very important affecting the weld penetration (Giedt et al., 1989):
= [( Tamb ) ] , (3)
where Tr is temperature at radius r from the point source, Tamb is ambient temperature, is thermal conductivity, r is radial distance from the point source, U is arc voltage, I is arc current, is welding speed, is thermal diffusivity, and y is coordinate parallel to the welding direction.
A dimensionless parameter, Pp, which correlates with the melting efficiency, , is presented in equation 4 (Fuerschbach et al., 1991):
Pp , (4)
where qnet is net power, Em is melting enthalpy, kin, mp is kinematic viscosity at melting point, and 300 K is thermal diffusivity at 300 K.

41
The melting efficiency depends about two- or three-dimensional heat flow and base material thermal diffusivity. Higher thermal diffusivity as well as thicker work piece cause low melting efficiency, because heat is transported more rapidly away from the welding area. The melting efficiency depends on oscillation width, i.e., wider pass increases the melting efficiency (Rykalin, 1957). It is generally supposed that no spattering occurs. Equations 5 and 6, which are based on experimental data, disclose melting efficiencies for the welds having 2D or 3D dimensional heat flows (Fuerschbach et al., 1991):
0,407 , (5)
0,346 . (6)
The melting efficiency, , can be also estimated by equation 7 which includes experimentally determined constants A and B (DuPont et al., 1996; Fuerschbach et al., 1991):
A , (7)
where A is maximum melting efficiency, e.g. 0,5 and B is slope on a plot of against ( )-1, e.g. 175.
2.4.2 Heat input
The temperature of the molten pool depends mainly on the physical properties of the material. The main thermal parameters are thermal conductivity, , [J/mmsK], specific heat capacity, c , [J/gK], density, , [g/mm3], and thermal diffusivity, , [mm2/s]. These parameters depend on the temperature. Thus, the constants are average values of the parameters which vary in a wide temperature range (Radaj, 1992).
The transferred plasma arc, i.e., the heat source can be assumed to be a spot or a circular heat source. Thermo-physical properties of the base material are constant and correspond to the mean process temperature. Heat transfer to the air is not considered. Heat conduction from the surface of the deposited area is poor resulting in hot surface in relation with interior parts of the base material if preheating is not used.
General presentation of Gaussian distribution of radial specific heat input to the surface of the base material is presented in equation 8. It is presumably designed for the open arc, but can be used to explain the phenomena of the plasma arc. Arc intensity, i.e., plasma nozzle, plasma gas, plasma gas flow rate, and plasma arc current, have an effect on the coefficient of arc concentration. Gaussian distribution of the specific heat input to the base material is (Pavelic et al., 1969; Rykalin, 1957):
q(r) q(0) , (8)

42
where q(r) is specific heat input at a radial distance of r from arc axis, q(0) is maximum heat input along arc central axis, and C is coefficient of arc concentration.
If a uniform power density is distributed into a circle, its diameter on the base material
is dc . The energy input into this area is presented in equation 9 (Goldak et al.,
1984). More concentrated arc has smaller circle diameter, dc, and larger value of C. Energy input is then (Goldak et al., 1984; Kou, 1987):
q(0) U I. (9)
Effective thermal power of the arc, which is needed for melting the powder consumable and a thin layer from the surface of the base material, is presented in equation 10. The estimated and the measured data were in good agreement. The actual temperature of the work piece was slightly higher at the start and lower at the end when compared to the estimated work piece temperatures. Effective thermal power of the arc is (Nefedov et al., 1995):
qeff = ( Es 1,07 c (Tm, bm – Tf, bm)), (10)
where ld is displacement of the plasma arc, hb is thickness of the weld bead, Es is specific volume enthalpy of the deposit material including latent heat of melting, c is specific volume heat capacity of the material of the component, wb is width of the weld bead, Tm, bm is surface temperature ensuring melting of the deposit and the base material, and Tf, bm is temperature at front of the surfacing point.
If the component is welded by oscillating the plasma arc, heat input is difficult to estimate. Modeling of heat input can be made for the straight beads and for the rotating shafts, which are surfaced with rotational movement of the rotating table and the work piece and with linear movement of the plasma torch. Thus, the movement of the weld spot in the surface of the work piece is a spiral.
The effective thermal power of the plasma arc in the second and the subsequent beads when the rotating shaft is surfaced with longitudinal displacement of the plasma arc in relation with the shaft axle is presented in equation 11. The bead width, wb, is constant and it can be estimated from equation 10. The effective thermal power of the first and the subsequent turns is (Nefedov et al., 1995):
qeff, n 2 1,07 c [Tm, bm T0, bm
( )], (11)
where T0, bm is initial temperature of the base material, Rs is radius of a shaft to be
deposited, = n is dimensionless surfacing time of n turns, n is number of
deposited beads without preheating, qeff, n is effective thermal power at nth turn, is function of heat distribution, and is relative surfacing step (ld/ .

43
If the shaft is preheated in the area of the first bead, the effective thermal power of the first and the subsequent beads can be estimated from equations 12 and 13 (Nefedov et al., 1995):
1,07 c [ Tm, bm T0, bm ´ ] ,
(12)
qeff, n 2 1,07 c { Tm, bm T0, bm [
( ) qeff, l ´ ] }, (13)
where is effective power of the plasma arc in local preheating and n´ is number of deposited beads with preheating.
2.4.3 Thermal changes of powder particles
Thermal changes of a powder particle are (Xibao, 2003):
1. formation of a powder particle active boundary, 2. elevating of a powder particle temperature at solid state, 3. melting of a powder particle, 4. elevating of a powder particle temperature at liquid state, 5. evaporation of a powder particle.
The parts 3-5 do not initiate if the plasma arc energy is not enough to initiate these steps. The powder particle can be so large or it has high melting or evaporation point and, thus, some of these steps may not always initiate. The 50 µm sized powder particles of Fe and boron carbide, B4C, require about 0,8 and 1,0 µs for formation of powder particle active boundaries, respectively. The solid heating time, TSH, melting time, TM, and liquid heating time, TLH, for a particle in the plasma arc column can be estimated by using equations 14, 15, and 16 (Xibao et al., 2002):
, (14)
, (15)
, (16)
where is mass density of a powder particle, rp is radius of a powder particle, T0, p is initial temperature of a powder particle, Tm, p is temperature of a powder particle at melting point, Cp is specific heat of a powder particle, Tp is temperature of a powder particle, S is heat conducting potential of Ar plasma fluid at plasma temperature, SP is heat conducting potential of Ar plasma fluid at powder particles temperature, Re is

Reynolds number of plasmaparticle, Sm is heat conductpoint, PL is mass density oof the molten pool, and CPL
The plasma arc energy, whiplasma arc, affects stronglmicrostructure and propertibe increased up to 400 A(Dilthey et al., 1993). Thpossibility for isothermal htimes less than via transferrethe properties of the carbidthe transportation time. In times in the central plasmathe Fe-base and the B4C par
Table 1 Average transplasma nozzle(Xibao et al., 2
In Figures 17a-d are preseparticle sizes, powder initiaplasma torch has an externpowder particle is sphericalThe powder particle has nosize, which can be meltedpowder feed nozzle and waxial injection, 150-200 µparticles through the apertuparameters affecting it are distance (Gladky et al., 199
44
ma particle system, ~1,06, Lm is melting heat ructing potential of Ar plasma fluid at powder py of a powder particle at liquid state, Ts is surfPL is specific heat rate of a powder particle at li
hich interacts with the thermal behavior of thegly especially the ceramic carbide structures rties of the whole deposit. The non-transferred
A and transferred arc up to 200 A without Theoretically high non-transferred arc currenl heat input. Heat input via non-transferred arcerred arc. Transportation time is one of the paraide particles. Density of the powder particles hIn Table 1 is presented the estimated averagma arc column from the plasma nozzle to the particles.
nsportation times in the central plasma arc cozle to the molten pool for Fe-base and boron c, 2002)
esented powder particle trajectories in relatiotial injection speeds, and powder particle injecternal nozzle and an internal nozzle. It was ascal, under aerodynamic force, and its diameter ino effect on the plasma stream. The maximum ted in the plasma arc depends a lot about th whole powder feed design. 250-300 µm size µm sized particles with annular slit, and 80rture of nozzle tip can be melted in the plasmre diameter of the powder particle, arc curren990).
t rate of a powder r particles melting urface temperature t liquid state.
the particles in the es and further the red arc current can ut wear of anode rent improves the arc is four to five rameters affecting s has an effect on age transportation e molten pool for
column from the n carbide particles
tion with powder ection angles. The assumed that the er is above 50 µm. m powder particle the plasma torch ized particles with 80-100 µm sized
sma arc. The main rent, and working

Figure 17 Schematic prec) 50 µm and injection speedb) 35º and c), d
In Figure 18 the effect of thof the powder particles isestimated on plasma arc curthe plasma arc column. TheA plasma arc current is abothough transportation time iplasma arc current is 100 Aof which are below 80 μmthe plasma arc, when the cuthe powder fraction have todeposition rate increase (Xi
Figure 18 Maximum temcentral plasma
In Figure 19 are presented tin the plasma arc. The powAISI 306L stainless steel. H
45
resentation of powder particle trajectories in rnd b), d) 150 µm powder particle sizes, varioueeds, po, 0,5-8,0 m/s, and powder particle inje), d) 70º (Gladky et al., 1990)
f the Fe-Cr-C powder grain size on the maximu is presented. The temperatures of the powdcurrents 100 and 200 A at the moment the partihe elevation of the temperature of the Fe-basedbout three times higher than at 100 A plasma ae in the plasma arc column is not significantly A, the plasma arc can melt only the powder pam. However, the powder particles below 60 μ current is 200 A. Thus, both the lower and th to be changed, when the intensity of the plas
Xibao et al., 1998).
temperatures of Fe-Cr-C particles of various sma space (Xibao et al., 1998)
d the main parameters affecting heating of the owder consumables were Cu-Al-Fe-Mn-Zn, Nil. Heating is a result of convective exchange w
n relation with a), ous powder initial njection angles a),
mum temperatures wder particles are articles are leaving ed particles at 200 a arc current, even tly changed. When particles, the sizes
μm evaporate in the upper limit of lasma arc and the
s sizes exiting the
e powder particles Ni-Cr-Si-B-C, and e with the plasma

arc stream. Temperature grfor estimating heating of th(1979). Increasing plasma diameter enhance the abilital., 1990).
Figure 19 Heating of di(Donskoi et al
Larger particles may cool tprevented. The thermal reseparticles, but the increasingto an increase of penetrati1995).
It has to be noticed that thparticles often makes a sigconductivity and, thus, larplasma arc currents than wahigh thermal conductivity a
2.4.4 Dilution
Equation 17 discloses a promelt the powder. Thereforethe base material at all, i.evolumetric powder consumthe powder is melted in the to the consumable efficiencof which were welded onto
46
gradients of the powder particles were not obt the powder particles is described in studies oa arc intensity and working distance and dec
ility of the plasma arc to melt the powder part
different kinds of powder particles in plasmt al., 1979; Gladky et al., 1990)
the molten pool and the formation of the weeserve of the molten pool has to be enough to mng heat input via the plasma arc into the base mation and detrimental microstructure effects (
the presupposition about thermal conductivitysignificant error. Ceramic carbide particles halarger thermal load leads to melting of the swas estimated. Fe-based particles, for instance, and the estimation can be more precise (Xibao
rocess condition, where all energy of the plasmre, according to equation 17 the plasma arc is n
i.e., the dilution of the deposit is zero. Whenmable feed rate, Vpc, max, ratio to U I, in
he plasma arc Vpc, max / U I ratio below 0ncy above 0,8 according to single-pass weldin
nto A36 steel substrate with AISI 308 austeniti
obtained. Equation of Donskoi et al. ecreasing particle
articles (Gladky et
lasma arc column
weld bead may be to melt the powder e material can leads (Nefedov et al.,
ity of the powder have low thermal surface at lower ce, have relatively ao, 2003).
sma arc is used to is not used to melt hen the maximum
increases, less of 0,08 mm3/J leads ing tests, the tests
nitic stainless steel

47
powder consumable (DuPont, 1998). It is obvious that the plasma torch design has an effect on the plasma arc melting efficiency.
Equation 17 estimates the maximum volumetric powder consumable feed rate, Vpc, max, of the metal powder consumable (DuPont et al., 1996):
Vpc, max , (17)
where Epc is melting enthalpy of the powder consumable.
Estimation of the dilution is possible in theory if precise arc and melting efficiencies of the plasma arc are known. The dilution of the weld bead can be estimated by equation 18 and the melting efficiency of the arc by equations 5, 6, or 7. The correlation between the measured and the estimated melting efficiency is good for GMAW and SAW methods, moderate for the GTAW method, and poor for the PAW method. Low and varying arc efficiency of the PA welding method limits the accuracy of the melting efficiency. The dilution correlates at least with welding parameters U, I, , and volumetric powder consumable feed rate, Vpc. Equation 18 does not notice welding speed. Studied welds were deposited onto 6,4 mm thick A36 carbon steel. The powder consumable was AISI 308 austenitic stainless steel alloy. The dilution of the first bead layer is (DuPont et al., 1996):
[%] 100, (18)
where Ebm is melting enthalpy of the base material.
2.4.5 Dissolution of carbides
The dissolution of a carbide particle depends strongly on the initial particle size, d0. The thermal stability can be estimated from bond enthalpy of the particle (Lugscheider et al., 1994). The most important factors controlling the dissolution of the carbide are the temperature of the molten pool, the melting point of the carbide, the size of the carbide, the chemical content of the alloy, and the distribution of the alloying elements in the matrix. Equation 19 is valid only for short intervals, because it is derived by considering one particle in an infinite matrix. Equation is for a cementite particle in a steel matrix, but it can be used also for the other types of carbides. Time to dissolve a particle, tdiss, is (Ågren, 1990):
, (19)
where is driving force and is diffusivity of carbon in austenite. Driving force, , is a measure of driving force depending on carbon contents at the matrix and the carbide particle. Carbon content is typically higher nearby the carbide-matrix interface when compared to carbon content at a relative distance from the carbide-matrix interface. Thus, carbon tends to dissolve from the carbide. The carbon flux in cementite is

48
approximated to be negligible. Driving force is obtained from equation 20 (Ågren, 1990):
, (20)
where is carbon content in austenite close to the carbide-matrix interface, is carbon content in austenite, and is carbon content in cementite.
The volume fraction of carbides as a function of time is presented in equation 21 (Ågren, 1990):
vft(t) , (21)
where vft(t) is the volume fraction of carbides as a function of time, t, and is the initial volume fraction of carbides.
2.4.6 Weld pool convection
Fluid in gaseous or liquid form is subject to convection, which is fluid motion caused by an external force. Convection has effect on the weld pool shape, mixing, homogeneity, segregation, porosity, evaporation of alloying elements, and weld pool oscillation. Especially, convection promotes mixing and homogeneity of the weld microstructure (Messler, 1999).
The factors affecting the weld pool convection are electromagnetic or Lorentz force (Figure 20c), Fem, buoyancy or gravity force (Figure 20a), Fb, surface tension or Marangoni force (Figure 20b), F , and impinging, friction or aerodynamic drag force of the arc plasma (Figure 20d), Farc, are the driving forces for convection in the weld pool (Messler, 1999; Ushio, 1991). Only surface tension force is not originally based on an external force. Flow in the cross-section of the weld pool is called as poloidal or meridional flow. Flow from the edge to the center of the molten pool is called as convergent flow, Figure 20c and 20d, and flow from the center to the edge is called as divergent flow, Figure 20a and 20b. Convergent flow is unstable and tends to form a spin. The reason is fluid flow caused by depression of the arc in the centerline of the molten pool and the fluid flow from the other parts of the molten pool, i.e., resulting in collision between these two flows. Finally, the result can be toroidal flow, which is flow around the center hole in the molten pool. Divergent flow is more stable (David et al., 1989; Messler, 1999).

Figure 20 Convection pforce, c) electr
Electromagnetic force is cauthe weld pool and the magnThe degree of stirring is proal., 1986). An estimation oassumption that current desurface area of the base oscillation and pulsed curre
Buoyancy force is generatedifferences due to differetemperature the density of pool are in lower density tha
Surface tension gradient is the surface active agents ofluid interface according totemperature and compositiosurface tension decreases w
The impinging force is aimpinging particles and mprocess use arc, the phenomrapidly moving active partimomentum of rapidly movigreater mass. Thus, kineticmolten pool and the flow pis deposited at the central p
49
patterns induced by: a) buoyancy force, b) ctromagnetic force, and d) impinging force (Me
caused by the interaction between the divergenagnetic field, which is generated by the divergeproportional to the magnetic fields, i.e., arc currn of the electromagnetic force distribution can density is uniform on the anode area and oe material. Electromagnetic force can be inrrent (Ishizaki et al., 1994; Messler, 1999; Ushio
ated by the temperature gradients in the molteerences in local composition, and gravity. of a liquid decreases, thus, superheated region than cooler regions (Kou et al., 1986; Messler,
is caused by the temperature gradients at the fs of the molten pool. Marangoni effect descri to local changes of surface tension caused byition (Burgardt et al., 1986; Heiple et al., 19 with increasing temperature (Kou et al., 1986;
a result of momentum transfer through fr metal atoms in the molten weld pool. Sinceomenon can be called as arc plasma force. Thrticles, i.e., electrons or ions in the arc, is kine
oving electrons is greater than that of photons, tic energy of the impinging particles cause ci pattern is always from edge-to-center. Most ol part of the weld pool. Thus, penetration is d
b) surface tension Messler, 1999)
ent current path in rgent current path. urrent (Burgardt et can be made after on a cylindrical
increased by arc hio, 1991).
olten pool, density . Above melting
ions of the molten er, 1999).
e free surface and cribes the moving by distribution of 1982). In general, 6; Ushio, 1991).
friction between nce most welding The momentum of inetic energy. The s, because of their circulation in the t of the arc energy s deepening at the

50
bottom of the molten pool. Impinging force tends to promote mixing in the welds welded by the PA welding method (Messler, 1999).
Arc oscillation and current pulsing have also effects on convection of the molten pool by reducing macrosegregation, removing porosity, and refining the microstructure (Messler, 1999). It is concluded that electromagnetic force is the major determinant of the penetration shape and aerodynamic drag force has a secondary role (Yokoya et al., 1994). The weld pool convection is usually the result of combinations of forces caused by the welding method, the welding parameters, the material characteristics, and the environment (Messler, 1999).
Three major factors which have effect on the weld pool convection are (Yokoya et al., 1994):
1. the pattern of heat input from the arc, 2. the current distribution, 3. the interaction between complex convection driving factors.
The first three forces can be presented in the next three equations (Ishizaki et al., 1994; Kou, 1987; Messler, 1999; Yokoya et al., 1994):
Fem Jcd Bmf, (22)
Fb lm e g (Tmp ), (23)
F , (24)
where Jcd is current density vector, Bmf is magnetic flux vector, lm is density of liquid metal, e is coefficient of thermal expansion of liquid metal, g is gravitational acceleration, Tmp is temperature of the molten pool, T0, mp is reference temperature of the molten pool (e.g. melting temperature), s is surface tension of liquid metal, and is temperature gradient at the weld pool surface.
2.4.7 Weld pool solidification
A weld bead consists of four zones, i.e., fusion zone, FZ, partially melted zone, PMZ, unmelted heat affected zone, HAZ, and unaffected base material. Parameters, which are important in determining the microstructure of the molten pool are growth rate, temperature gradient, undercooling, and chemical composition of weld alloy. Thermal gradient is strongly affected by convection in the molten pool. Cooling rate mainly depends on welding speed. Cooling rate in the weld pool varies from 10 to 103 Ks-1 for arc welding processes. Cooling rate which is even greater can be achieved (Chen et al., 1993). For the laser, LB, and the electron beam, EB, welding methods cooling rate varies between 103-106 Ks-1 depending on the welding parameters. Solidification behaviour has a strong effect on the size and the shape of grains, segregation, distribution of inclusions, porosity, and hot cracks. Soaking time at high temperatures

51
and cooling time from 800 to 500 ºC have an effect on the microstructure and the mechanical properties of the weld deposit (David et al., 1989; Oberländer et al., 1992).
Cooling rate 0,4-8,0 x 10³ Ks-1 can be estimated with equation 25. Cooling rate can be estimated when the secondary arm spacing is measured from the microstructure and placed into equation 25 (David et al., 1989; Jones, 1990; Oberländer et al., 1992):
CR , (25)
where CR is cooling rate, a1 is an empirical constant, 60 µm, a2 is an empirical constant, 0,32, and Dsas is secondary arm spacing, 3-8 µm.
2.4.8 Interactions of welding parameters
The comparison between direct and interaction effects of welding parameters can be made by factorial analysis experiments (Box et al., 1978; Cochran et al., 1950; Harris et al., 1983). The costs and time can be reduced, when information is required about the effects of the welding parameters on the bead geometry or the dilution, for instance. Babi (1991) disclosed that the parametric relationship of the PTA welding method has unpredictable nature especially when blended nickel alloys are used. In this method it is possible to decrease the number of experimental runs. Always, successful surfacing procedure requires optimization of welding parameters to have low dilution and crack-free overlay (Murugan et al., 1994). The models can be checked for adequacy and significance by using significance tests and confidence intervals (Box et al., 1978; Harris et al., 1983; Herrström et al., 1993; Marimuthu et al., 2003).
The factorial technique for estimating weld quality has so far been utilized only for estimating deposit dimensions like height, width, hardness, and dilution. The effects of welding parameters and the interactions between welding parameters on the microstructure and the properties of the deposits in the wear tests and the real environments have not been studied. The state of the process changes during the surfacing process in a way, which is impossible to estimate, e.g., the temperature of the work piece changes. Thus, exact information of welding parameter variables on the microstructure and the deposit wear resistance are difficult to estimate (Harris et al., 1983; Kapus, 1980; Murugan et al., 1994).
The study plan for factorial analysis contains (Murugan et al., 1994):
1. identifying the important process variables, 2. identifying upper and lower limits of the studied variables, 3. developing the matrix, 4. conducting the experiments as per the design matrix, 5. recording the responses, 6. developing the mathematical models, 7. estimating the coefficients of the polynomials, 8. checking the adequacy of the models developed,

52
9. testing the significance of the regression coefficients and getting final mathematical models,
10. presenting the main effects and the significant interactions, 11. analysis of the results.
In Table 2 the effects of the welding parameters on the dilution, the hardness, the width, and the height of the deposit are presented. The effect of each of the six welding parameters was estimated at several levels of the other factors by a factorial analysis computer program. In the factorial matrix the welding parameters were plasma arc current, plasma gas, transport gas, oscillation frequency, welding speed, and working distance. One possible welding parameter to study by the factorial analysis experiment, which was not included in this test, is powder feed rate. 16 test combinations were carried out.
The studied deposit material was Stellite 6. The powder fraction range was 63-180 μm. Nominal composition of Stellite 6 was Cr 28,0 %, C 1,0 %, W 4,0 %, Si 1,0 %, and bal. Co. The base material was low alloyed steel (C 0,2 %, Mn 1,6 %, Si 0,3 %, and bal. Fe). The input factors were current 100-130 A, plasma gas Ar flow rate 1-3 l/min, carrier gas Ar flow rate 2-4 l/min, oscillation frequency 82-90 osc./min, welding speed 5-7 cm/min, torch distance 6-14 mm, and powder feed rate 1 kg/h. Shielding gas was Ar + 5 % H2
(10 l/min). Preheating was not used (Herrström et al., 1993).
The results indicate that the most significant parameters affecting the dilution and the hardness of the deposit are plasma arc current and plasma gas flow rate. The effects of welding speed and oscillation frequency on the dilution depend on the other parameters used such as powder feed, plasma arc current, oscillation mode, etc. These parameters in the first place determine the thickness and the width of the bead, even though they have a minor effect on the dilution according to the estimation. The increasing working distance has an increasing effect on the dilution. The effect of the transport gas on the dilution was unclear (Herrström et al., 1993).

Table 2 Estimated diredeposit properal., 1993)
2.5 Effects of main w
2.5.1 Plasma gas flow rate
The dilution leads to an imaterial to the deposit, whresistance (Hunt, 1988; Cconcentrated in the deposiassumed that evaporation transformations can be cont
For a given consumable feincrease in plasma arc currincrease of the dilution of ththe dilution is quite linear. Irates 1 and 4 l/min. The diinteraction between plasmaincreasing plasma gas flowmore rapidly. Thus, the effcompared to the effect of directional plasma arc coluincreasing powder feed rateis needed to melt the powdecarrier gas Ar + 5 % H2
cm/min, welding speed 7,8 μm. The base material w
53
irect and interaction effects of the welding paperties estimated from the mathematical model
welding parameters on dilution
ate and plasma arc current
n increase of alloying elements, mainly iron,which can cause a reduction in hardness, we; Chattopadhyay, 1997). The diluted elemeosit nearby the fusion line in the depth of 0,n of the alloying elements is negligible. Dentrolled by adjusting the PTA welding method.
feed rate, welding speed, and other weldingurrent leads to an increase in the penetration af the deposit. The influence of plasma arc currer. In Figure 21 welding tests were welded with p differences in the dilutions of the beads are ma gas flow rate and plasma arc current is w rate the increasing plasma arc current increa
effect of plasma gas flow rate on the dilution f plasma arc current. At a higher plasma gas lumn is obtained (Wilden et al., 2006). It is aate decreases the dilution of the deposit, becauder. Pilot arc was 100 A, shielding gas Ar + 5
3,5 l/min, oscillation width 40 mm, oscilla,8 cm/min, working distance 20 mm, and powdwas carbon steel St 37. The size of the w
parameters on the dels (Herrström et
on, from the base wear, or corrosion ments are partly
0,2-0,5 mm. It is Detrimental phase od.
ng parameters, an n and hence to an rrent in relation to th plasma gas flow
remarkable. The is obvious. When reases the dilution n is similar when as flow rate more
s also obvious that cause more energy 5 % H2 10 l/min,
illation speed 108 wder range 60-200 work piece was

300 300 30 mm. The studal., 1993; Hunt, 1988; Mara
Figure 21 Effect of plasmon the dilution
The diameter of the plasmplasma nozzle, which has a flow rates of plasma or carrthe deposit (Hallén et al., 1flow rates a pressing effecthinner in the centerline of tplasma gas flow rate, plasm
Figure 22 Effect of plasand the dilutio
According to many studiesthe deposit. The size of the on the process control. Themoves between the plasmaform penetration may disapthe dilution. The simplest
54
tudied powder alloys were FeCr- and NiCr-alloyarantz et al, 1980; Mitelea et al., 1997).
lasma arc current, plasma gas flow rate, and pion of the deposit (Hallén et al., 1992a)
sma nozzle affects plasma gas flow rate. Whes a different diameter, plasma gas flow rate chanarrier gas the turbulent stream can leave pores , 1992b; Huang et al., 1998). The plasma arcfect on the molten pool and, therefore, the
of the beads, Figure 22. Because of the negativesma gas flow rate is usually between 2-6 l/min.
lasma gas flow rate on the shape of the depostion of the deposit (Shubert, 1992)
ies plasma arc current has the biggest effect onhe molten pool and the thickness of the weld behe problem in the dilution control occurs, if t
ma arc and the base material. Thus, the plasmappear. However, plasma arc current has a signst way to control the dilution is to adjust pla
lloys (Herrström et
powder feed rate
hen changing the hanges. With large es and oxides into arc has with large e deposit may be tive effects of high
.
posit cross-section
on the dilution of bead have effects
if the molten pool sma arc ability to
ignificant effect on lasma arc current
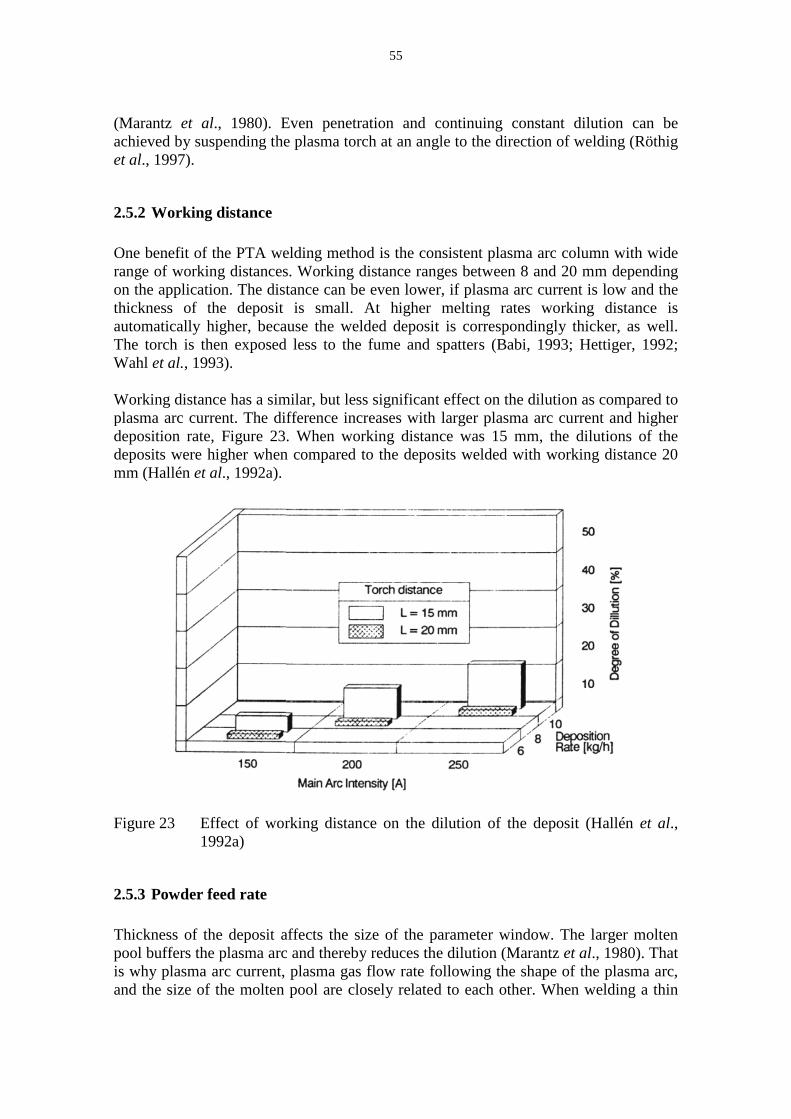
(Marantz et al., 1980). Eachieved by suspending theet al., 1997).
2.5.2 Working distance
One benefit of the PTA werange of working distances.on the application. The distthickness of the deposit automatically higher, becauThe torch is then exposed Wahl et al., 1993).
Working distance has a simplasma arc current. The difdeposition rate, Figure 23.deposits were higher whenmm (Hallén et al., 1992a).
Figure 23 Effect of wor1992a)
2.5.3 Powder feed rate
Thickness of the deposit afpool buffers the plasma arc is why plasma arc current, and the size of the molten
55
Even penetration and continuing constant dthe plasma torch at an angle to the direction of w
welding method is the consistent plasma arc coes. Working distance ranges between 8 and 20
tance can be even lower, if plasma arc currenit is small. At higher melting rates workicause the welded deposit is correspondingly ted less to the fume and spatters (Babi, 1993;
imilar, but less significant effect on the dilutiondifference increases with larger plasma arc cur
. When working distance was 15 mm, the en compared to the deposits welded with work
orking distance on the dilution of the deposi
affects the size of the parameter window. Thrc and thereby reduces the dilution (Marantz ett, plasma gas flow rate following the shape ofn pool are closely related to each other. When
t dilution can be of welding (Röthig
column with wide 20 mm depending rent is low and the rking distance is y thicker, as well. 3; Hettiger, 1992;
ion as compared to current and higher e dilutions of the
orking distance 20
sit (Hallén et al.,
The larger molten et al., 1980). That
of the plasma arc, en welding a thin

deposit, the amount of mixein welding a thick deposit plasma arc current increFigures 24a, b. The powdchemical compositions of wsmall addition of boron. Band, thus, thinner deposits a
In Figures 24a, b maximumtypical values for the PTthickness is from 1 to 6 mmof the alloy. Mobility of penetration.
Figure 24 Effects of dewelding with boron (Marant
56
ixed metal from the base material to the deposisit on the same dilution. In the thinner deposcreases the dilution faster than in the thwder alloys in Figures 24a, b are related tof which are Co 48 %, Cr 30 %, W 12 % with Boron reduces melting point of the alloy, ims at lower deposition rates were achieved.
um thicknesses of the deposits were 6,0 and 4,5PTA welding method. Even though the rang
m, the range depends strongly about the chemiof the molten pool is the main reason, whi
deposit thickness and powder feed rate on th alloys: a) Stellite 1 and b) Stellite 1 with a santz et al., 1980)
osit is smaller than osits the growing thicker deposits,
to Stellite 1, the ith and without a
improves wetting
4,5 mm, which are ange of the bead mical composition hich restricts the
on dilution, when a small amount of

2.5.4 Powder fraction
The powder particle size haincreases, when the particleis larger for the fine fractionthe coarse powder fractionsfine powder fractions, if weefficiency is larger for fine p
In Figure 25 is presented deposit on a FeCr-alloy. penetration. The dilution wato the dilution of the other sensitive to small alteratiofractions 53-180 and 53-150et al., 1992b).
Figure 25 Effect of powFeCr-alloy (H
2.5.5 Shielding and carrie
Increasing shielding gas refrigerates the molten poolhas also been shown to haveSharples, 1985). Shielding gmm working distances the1998). Shielding gas flow rit has no noticeable effects o
57
has an effect on the surfacing behavior. Basicaicle size fraction increases, because the consumtions at the same plasma arc current (Babiak et ons the plasma arc melts more the base materi welding parameters are not changed, because e powder fractions.
d the effect of the particle size range on the. The powder particle size of 53-180 μm cwas 14 %, which was about 50 % better result er powder particle size fractions. The PTA wetions, which can explain partly the result, e.150 μm. The reasons for the differences remain
owder fraction on hardness and dilution of th(Hallén et al., 1992b)
rier gas flow rates
s flow rate decreases the dilution, becauseol and the base material. An increase in shieldi
ave an increasing cooling effect on the plasma ag gas flow rates are typically between 8 and 15the shielding efficiency decreases (Babi, 1993
rate is always constant during the welding prts on the dilution of the deposit.
ically, the dilutionumable efficiencyet al., 1986). With erial than with the se the consumable
he dilution of the caused the leastlt when compared
welding method is e.g., between the in unclear (Hallén
the deposit on a
use the gas flow lding gas flow rate a arc (Hunt, 1988; 15 l/min. Over 15
993; Deuis et al., process and, thus,

Carrier gas flow rate does nrefrigerate the plasma arcvariation of carrier gas flowthe dilution. A flow rate fro14 kg/h with gas pressure 5al., 1993).
Carrier gas flow rate dependa certain limit value, carrieinto the plasma arc and porfeeding and undercutting wThe suitable flow rate is beconsumable. The welding p96 A, pilot arc current 35 Awere austenitic steel, mconsumables were cobalt-baalloys.
Figure 26 Comparison ba) sphericallyto Stellite 6, 1
2.5.6 Preheating
It is very common to use aensure the crack-free deposeffects on the welding proceis very sensitive to microcrThe work piece expands wdown. The shrinkage level material to avoid cracking prevent cracking of the depo
58
s not have a noteworthy effect on the dilution. rc a little, which can decrease the dilutionow rate is so small that it does not have a remafrom 5 to 10 l/min is needed for the deposition
5 bar (Bouaifi et al., 1999; Hallén et al., 1992
ends on the deposition rate. When carrier gas flrier gas can suffer from turbulent flow and thorosity can form in the deposit. In Figures 26a were the results of too low and high flow rate between 3 and 5 l/min depending on the shap parameters were powder feed rate <1 kg/h, pla
5 A, and welding speed 56 cm/min. The studiedmartensitic steel, and nickel-based alloysbased powders equivalent to Stellite 6, 12, F, a
between the characteristics of the deposits wly and b) irregularly shaped cobalt-based pow, 12, F, and Colmonoy 6 alloys (Takeuchi et al.
e a high preheating temperature in surfacing posit. The coefficients of thermal expansion hocess, because the interface of the deposit and thocracking if gradient-layer deposit or butter-las when it is heated and shrinks back as muchel has to be about the same in both the depo
ng in hard deposits. The main reason to use eposit (Gregory, 1991).
n. Carrier gas may on. The range of markable effect on ion rates from 8 to 92b; Herrström et
flow rate exceeds the air may enter
a, b poor powder ates of carrier gas. ape of the powder plasma arc current ied base materials ys. The studied
and Colmonoy 6
welded by using: owders equivalent
., 1985)
g a component to n have remarkable d the base material layer is not used.
uch when it cools posit and the base e preheating is to

59
Preheating temperatures of 250-300 °C are used to help the surfacing process of valve heads with cobalt-based powders (Klimpel et al., 2005). Preheating temperature of the work piece can be even 900 °C (Mathew et al., 1980). Temperature gradient in the component in front of the arc at the start and in the end of surfacing a weld bead can be 600-800 ºC (Nefedov et al., 1994). When heat input to the base material was controlled with decreasing plasma arc current, the temperature of the work piece decreased from 850 ºC (constant power) to 650 ºC (decreasing plasma arc current). The bead width increased about 1/3, when the power of the plasma arc was not adjusted (Nefedov et al., 1995). Cooling rate is lower with higher preheating temperatures. For the deposits welded by the GTA welding method the welding parameters were arc efficiency 0,7, arc current 200 A, and arc voltage 10 V; cooling rate without preheating was approximately 71 °C/s and for 250 °C preheating 20 °C/s (Kou, 1987). The preheating temperature has a remarkable effect on the dilution of the deposit. For instance, using plasma arc current 100 A and powder feed rate 1,6 kg/h, the dilution of the deposit increases about 11 %, while the preheating temperature increases from RT to 200 °C (Hunt, 1988; Sharples, 1985). The effect of preheating temperature on the dilution depends on the welding parameters, i.e., plasma arc current, plasma gas flow rate, heat input per unit length, deposition rate, bead dimensions, and oscillation parameters. The difference is higher in the thinner deposits and the smaller components.
Gatto et al. (2004) welded by the PTA welding method a bead on a groove in a small disc-shaped sample, the size of which was Ø 150 x 35 mm. The temperature of the work piece increased from RT to 230-240 °C depending on the welding parameters. Thus, the temperature of small components increases rapidly, even though preheating is not used.
3 Degradation of materials
Degradation of the welded deposits depends on many factors. Wear of the materials depends firstly on the wear mechanisms. All of the wear mechanisms can take part to the wear of the deposit. Chemical composition of the deposit has an effect on the microstructure of the deposit. Material properties like hardness, carbon content, alloy content, hard phases, microstructure, and fracture resistance have an effect on the abrasive wear (Budinski, 1988; Zum Gahr, 1987). The microstructure has many factors, like the volume fraction of carbides, the size of carbides, the MFP, and the matrix phases, which have effects on the degradation of the deposit (Buchely et al., 2005; Zum Gahr, 1987). The abrasive, its hardness and size distribution are hard to estimate. The effects of the welding operator, the welding process, and the finishing process on the properties of the deposit are remarkable. Finally, the whole environment where the component surface is planned to survive, is seldom known. Thus, it is challenging to optimize the properties of a component.
The tribological performances of the coatings and their chemical, microstructural and mechanical features change, when plasma arc current, powder mass flow rate, and welding speed are modified, for instance. At different powder consumable feed rates current intensity influences both from the mechanical and the microstructural point of view (Sintoni et al., 1992).

60
3.1 Wear mechanisms
Between two contacting surfaces exists always two or more wear mechanisms. One wear mechanism normally dominates. The role of each wear mechanism can be small or large depending mainly on the load type, the materials, and the environment. Basic material parameters, which have effects on the wear by all wear mechanisms are composition, grain size, modulus, thermal conductivity, degree of work hardening, and hardness (Bayer, 1997). The wear interactions between the two surfaces are focused on a relatively thin surface section. Wear mechanisms describe the interactions between energy, friction, contact surfaces and, thus, wear. Processes without friction are usually also without wear phenomena and increasing friction does not always mean measurable wear loss (Zum Gahr, 1995).
Interacting material surfaces have many tribological parameters. In any wear situation four tribocomponents can be identified, i.e., first and second triboelement, interfacial element, and environmental medium (Czichos, 1997). Typical interfacial element can be dust, lubricant, or wear debris. Environmental parameters are mainly air or corrosive atmospheres. Operational parameters, i.e., motion, load, velocity, temperature, and duration, characterize the functional conditions of the tribosystem. Interaction parameters between the tribocomponents characterize the contact mode between the tribocomponents. Tribological processes are also called as wear mechanisms. Depending on the source classification of the wear mechanisms varies. One of the classifications of wear mechanisms is adhesion, abrasion, surface fatigue, and tribochemical reactions (Blau, 1989; Holmberg et al., 1994). Other wear modes, which can be included to basic wear mechanisms are at least cavitation, corrosive, delamination, erosion, fretting, and impact wear.
In Figures 27a-d are presented the basic wear mechanisms. In Figure 27a is presented adhesion, where asperities of two surfaces are in contact and the surfaces may adhere strongly and asperity junctions, i.e., cold-welded junctions, can be formed. Typically surface of the softer material is removed. In Figure 27b is presented plastic deformation both in asperity wear and in abrasive wear. Abrasive wear causes removal of material because of the scratching effect of the abrasive particle or asperity of the material surface. In Figure 27c is presented surface fatigue wear. Fatigue crack growth results from surface load and unload. The stress levels are such that the substrate can manage to survive once, but after repeated cycles a crack can be initiated. Surface fatigue leads to a formation of cracks in the contact surfaces and as a result to debris formation. In Figure 27d is presented chemical wear, which is initiated by environment atmosphere and contact mechanisms. The result can be the formation of small or bigger wear debris. The formation of chemical reaction products as a result of chemical interaction between the contact surfaces can also be possible (Blau, 1989; Holmberg et al., 1994).

Figure 27 Basic wear med) tribochemic
3.2 Abrasive wear
Abrasive wear is the matribocomponent or an abrasThe abrasive particle has shshearing force on the materagainst the other surface osurfaces, Figures 28a, b. Isurfaces and microchip formsmaller in three-body abrasi
61
mechanisms: a) adhesion, b) abrasion, c) surfaical reactions (Blau, 1989; Holmberg et al., 19
main wear mechanism when a hard contarasive between surfaces plastically deforms or c sharp angular shape which is capable of prodterial surface. Abrasive wear can be two-body, e or three-body, i.e., abrasives as a third-bod. In three-body abrasion the abrasive may roormation, i.e., scratching is low. Wear loss is oasion than in two-body abrasion (Zum Gahr, 19
rface fatigue, and 1994)
ntact area of the r cuts the surface.
oducing cutting or y, i.e., one surface body between the roll between the s one to two times 1987).

Figure 28 Two abrasive (Hutchings, 19
Abrasive wear is a complicalike microstructure, mechantemperature, and environme
Figure 29 Main factors d
Abrasive wear has many chigh stress, gouging, and pstress abrasion is that the abcrushing phenomena of the enough without the ability wear scars and the subsurfac
62
ve wear types: a) two-body and b) three-body, 1992)
licated wear mechanism, because of many affechanical properties, abrasive, loading conditionmental atmosphere, Figure 29.
s determining abrasive wear (Zum Gahr, 1987)
categories. Abrasive wear can be categorized polishing abrasive wear (Budinski, 1988). C abrasive particle has to flow through the conthe abrasive particle (Bhansali, 1980). Normal fty to crush the abrasives. Usually scratches arerface deformation is minimal. Low stress abrasi
ody abrasive wear
fecting parameters on, surface finish,
7)
ized as low stress, . Criterion for low ntact area without l force is then low
are obtained in the asion can be called

63
as scratching abrasion and high stress abrasion as grinding abrasion. However, wide range of abrasive contact stresses present in high stress abrasion and at least part of those stresses are in high stress range (Avery, 1981; Bhansali, 1980; Budinski, 1988).
High stress abrasion is obtained if the wearing parts have normal force high enough to crush the abrasives (Bhansali, 1980). Crushing strength of quartzite rock is 206 MPa or 21 kg/mm2 (Avery, 1981). High stress abrasion is characterized by scratching, plastic deformation, and pitting of the indented abrasives. Plastic deformation is typically obtained with ductile materials. Deep scratches in the direction of motion are typically obtained from the wear surface. Enhancing compressive strength of the surface is an effective way to resist degradation. It is a benefit, if the surface hardness is higher than the abrasive hardness, since then crushed abrasive or at least its angular edges become more round. An example about high stress abrasion is milling of minerals (Avery, 1981; Bhansali, 1980; Budinski, 1988).
Gouging is a form of high stress abrasion where big-sized grooves and gouges are formed on the wear surface. Gouging can be a result of, e.g., low stress abrasion, high stress abrasion, or sliding wear and impact wear. The mechanism is plastic deformation and chip formation. Fatigue wear and fracture of materials may also be the result of repetitive action of, e.g., crushing of rocks. Hammermill hammers is one of the applications where gouging is obtained (Avery, 1981; Bhansali, 1980; Budinski, 1988).
Polishing wear is wear without scratching, fracture, or plastic deformation. Material is removed from the surface which causes changes in the material dimensions. Polishing causes micro-chip removal and, thus, it is a reason to categorize it to the abrasive wear mechanisms. Micro-chipping is occurring if the abrasive size is above 3 m. With small abrasive particles and low normal forces molecular or atomic scale material removal may also occur. Steel handrail is a typical application under repeated polishing wear (Budinski, 1988; Zum Gahr, 1995).
In Figures 30a-c are presented the behavior of the deposits under the abrasive wear load. In Figure 30a is presented material loss of soft and ductile material by microploughing and microcutting. Microfatigue can also occur, when material is under repeating microploughing. In Figure 30b is presented material loss of relatively hard and brittle material as compared to Figure 30a. The material loss is happening due to microcutting and microcracking. In Figure 30c is presented spalling of the deposit. Spalling can occur depending on the properties of the deposit and the deposit-base material interface. Above critical loads, spalling of the deposit becomes more important type of wear. As a result of Figures 30a-c it can be seen that a combination of the deposit hardness and toughness must be found to optimize the abrasive wear resistance of the deposit (Zum Gahr, 1995).

Figure 30 Behavior of tmicrocutting, spalling (Zum
Between the wear mechanDifferent kinds of reinforcinDuring low stress abrasionresistance of the Stellite 6 dphases vary in hardness, Ybonding to the matrix (Zumphases, which have differenmay settle into their own dis
The abrasive wear resistancphase and the size of the cawear type this may not alwploughing, microcutting, anfrom ductile to brittle wearcontact point (Zum Gahr, 19
In Figures 31a-f are preseabrasive wear of the deposboth the matrix alloy and thdigged-out and the larger oparticles can act as an abrasFigures 31d-e soft abrasivelarger reinforcement particlthe reinforcement phase andsoft particles are not ablebetween the reinforcement p31f. The abrasive wear resis
64
f the deposits under abrasive wear: a) microg, b) microcutting and microcracking, and c) m Gahr, 1995)
anisms and the microstructure is a remarkabrcing phases can be used in the deposits to resision increasing carbide content increases hard6 deposit (Shin et al., 2003). The properties of, Young’s modulus, size, shape, distribution, Zum Gahr, 1995). Sometimes several differenrent properties, are used in the same deposit. Tdistances from the FZ, because of their differen
ance mainly increases when the volume fractio carbides increase. Under different loading, ablways be true. The wear type may alter, e.g., and brittle fracture. Also microfatigue may oear depends on fracture toughness and stress fi, 1987).
sented the effects of the hard and the soft aosits. In Figures 31a-c the hard abrasive is ab the reinforcement phase. The small reinforcemr ones are cracked or cut-out. Small separated
rasive and, thus, further increase the wear loss ove is able to abrade-off only small reinforcemeicles, which are not well-bonded. When the voland the carbide size increases and, thus, the MFle to abrade-off the reinforcement particles,
nt particles cannot avoid indentation of the soft esistance of the matrix alloy is not remarkably
icroploughing and c) microcutting or
kable relationship. sist abrasive wear. ardness and wear of the reinforcing n, orientation, and rent kinds of hard t. The hard phases rent densities.
tion of the carbide abrasive size, and
between micro- occur. Transition
s fields nearby the
t abrasives on the able to abrade-off
ement particles are ted reinforcement s of the deposit. In ment particles and volume fraction of
FP decreases, the es, but the matrix ft abrasive, Figure ly enhanced, when

the volume fraction of the 1997; Yellup et al., 1996; Z
Figure 31 Schematicallyabrasives (d-f)
By modeling it was found wear loss was obtained (Hustrength between the carbidreplaced with other carbidecompound. The reinforcemprecipitated carbides.
Usually pure abrasive wear increases. 12V tool steel contained 20 vol.-% VC camanufactured by the hot isWC carbides had better abRWAT. The material withsmall-scale Nordberg labormechanisms in the RWATobviously microcutting. Thtest were cutting and preinforcements were worn obtained. Thus, the maximuwear mechanism.
The interfacial bond strengtwhich makes it difficult tointeraction between the ma
65
e reinforcing carbides is lower than 10 vol.-%Zum Gahr, 1997).
lly presented effects (a-f) of the sliding of harf) on the abrasive wear of the deposits (Zum G
nd that after 30-35 vol.-% carbide volume fracHu et al., 2005). This limit changes, when the bides and the matrix alters, e.g., when the carbides. As usual, the deposit contains more than ement can be any of the original, primarily
ar resistance is increased when the volume fracel MMCs (Ala-Kleme et al., 2007), the mcarbides reinforced with 20 or 30 vol.-% WC
isostatic pressing process, HIP. The material abrasive wear resistance in the rubber wheeith 20 vol.-% WC carbides had better wear roratory compression stone cone crusher test, AT abrasion test were microploughing, micThe wear mechanisms in the compressive ston ploughing for the matrix or plastic defrn by microcracking. Pure compression/indenmum amount of the reinforcement is strongly d
ngth is difficult to estimate and accurate value to use modeling for estimating wear (Hu et matrix and the reinforcement during the wear
% (Bouaifi et al.,
ard (a-c) and soft Gahr, 1997)
raction the lowest he interfacial bond rbide particles arean one reinforcing ly, or secondarily
raction of carbides matrix of which C carbides, were
ial with 30 vol.-% heel abrasion test,r resistance in the st, B90. The wear icrocracking, and tone cone crusher deformation. The entation was also
y dependent on the
ue is not available, et al., 2005). The ar can be digging-
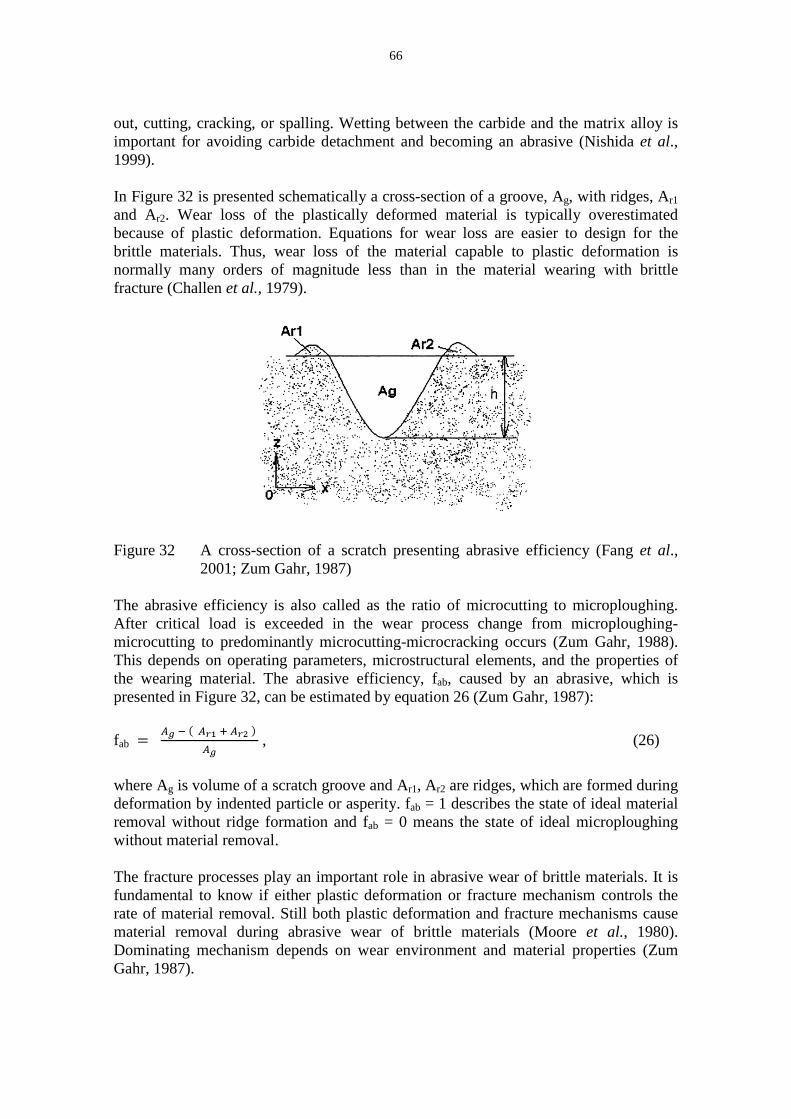
out, cutting, cracking, or spimportant for avoiding carb1999).
In Figure 32 is presented scand Ar2. Wear loss of thebecause of plastic deformabrittle materials. Thus, wenormally many orders of fracture (Challen et al., 197
Figure 32 A cross-sectio2001; Zum Ga
The abrasive efficiency is After critical load is excemicrocutting to predominanThis depends on operating the wearing material. The presented in Figure 32, can
fab ,
where Ag is volume of a scrdeformation by indented paremoval without ridge formwithout material removal.
The fracture processes playfundamental to know if eitrate of material removal. Smaterial removal during aDominating mechanism deGahr, 1987).
66
spalling. Wetting between the carbide and thearbide detachment and becoming an abrasive
schematically a cross-section of a groove, Ag,the plastically deformed material is typicallymation. Equations for wear loss are easier towear loss of the material capable to plastic of magnitude less than in the material wear979).
tion of a scratch presenting abrasive efficiencGahr, 1987)
is also called as the ratio of microcutting to mxceeded in the wear process change from mnantly microcutting-microcracking occurs (Zung parameters, microstructural elements, and the abrasive efficiency, fab, caused by an abran be estimated by equation 26 (Zum Gahr, 198
scratch groove and Ar1, Ar2 are ridges, which ar particle or asperity. fab = 1 describes the state ormation and fab = 0 means the state of ideal
ay an important role in abrasive wear of brittleeither plastic deformation or fracture mechani. Still both plastic deformation and fracture meg abrasive wear of brittle materials (Mooredepends on wear environment and material p
the matrix alloy isve (Nishida et al.,
, with ridges, Ar1
ally overestimated to design for the tic deformation is aring with brittle
ency (Fang et al.,
o microploughing. microploughing-
Zum Gahr, 1988). d the properties of brasive, which is 987):
(26)
are formed during te of ideal material al microploughing
ttle materials. It is anism controls the mechanisms cause ore et al., 1980). l properties (Zum

3.3 Modeling abrasiv
Modeling provides means fability for understandingconditions. Designing tests which can be achieved withthan 100 parameters and Average number of variablbased models, and 8,9 in eqwear coefficients are needextremely challenging to mcomplicated for modeling, not possible to estimate exa
Hardness is the material proeffect on the wear resistacorrelation between the basabrasive hardness (Ha). If H(K1 = 1,3-1,7), wear does nFigure 33 is presented the losses of single- and multipgreater than single-phase mand it works as an abrasiveabrasive wear with abrasivmaterial.
Figure 33 Effect of abramultiphase ma
For full abrasive cutting thmaterial hardness. Equationabrasive and hardness of the
67
sive wear
s for linking the different effects together follothe effects controlling the abrasive wear
sts and determining the correct variables are thith the modeling. General sliding wear has mand constants, which have an effect on the wables is 4,8 in empirical equations, 5,8 in sim equations built from the material point of view.eded per equation (Meng et al., 1995). For t model abrasive wear. Three-body abrasive weag, because time cycles of rolling and trappingxactly (Torrence, 2005).
property for resisting indentation. The abrasive stance of the wear part. The relative wear dbase material or the wearing material hardnesf Ha < K2 Hbm (K2 = 0,7-1,1), no wear occurss not depend on Ha and the wear mechanism he effect of abrasive and material hardness raltiphase materials. The wear loss of multiphase material at high wear rate, if reinforcing phase ve (Zum Gahr, 1997). Multiphase material is m
sive and material hardness ratio around 1,2, th
rasive and material hardness on the wear lossematerials (Zum Gahr, 1987; Zum Gahr, 1997)
the abrasive hardness has to be greater than ion 27 estimates the relationship between atta
the base material and the abrasive (Torrence, 20
llowing the better ear under certain the main benefits,
any factors, more wear resistance.
simple mechanics-w. On average 1,5 r this reason it is ear is already too
ng of abrasive are
ve hardness has an r depends on the ess (Hbm) and the rs; Ha > K1 Hbm
m may change. In ratio on the wear se material can be se can be detached s more resistant to than single-phase
sses of single- and
an 1,2 the base ttack angle of the
, 2005):
68
, (27)
where is mean attack angle. Attack angle 30º results Ha 1,26 Hbm. Attack angle may vary in three-body abrasive wear, because abrasives can reorientate during rolling between contact surfaces (Zum Gahr, 1987).
The wear volume caused by conical indenter can be estimated by equation 28 (Rabinowicz, 1965):
V (28)
where V is wear volume, is a weighted average of the tan values of all the individual abrasives, P is normal load, and l is sliding distance.
The effect of the carbide size distribution on the abrasive wear resistance is not largely studied. The mono-sized carbide fraction is not an optimal microstructure for the wear resistant alloys, because no constant wear exists at real environments. Larger carbides are believed to hold the wearing load and the smaller carbides shield the matrix against the wearing load with the low MFP. By modeling it was found that with 19 % large, 8 % medium, and 8 % small scale particle contents the optimum wear resistance can be obtained (Hu et al., 2005).
As well as the carbide size distribution, the abrasive size distribution has an effect on the abrasive wear resistance. Mixed abrasive particle size distribution increases abrasive wear when compared to the mono-sized abrasives (Budinski, 1988).
The MFP ( MFP), can be estimated if the volume fraction of carbides, the volume fraction of matrix, and the number of carbides per unit length is known (Nishida et al., 1993). The MFP is related to average diameter of the abrasives, da. It is more accurate to measure the MFP from the microstructure. At the ratio MFP/da > 1, the abrasive particles can wear-off the matrix, because the sizes of the abrasives are smaller than the MFP. At the ratio MFP/da < 1, the abrasive particles cannot wear-off the matrix, because the MFP is smaller than the sizes of the abrasive particles leading to situation where the counterparts for the abrasives are the carbides. Therefore, the ratio MFP/da should be <1, when high abrasive wear resistance is needed. In Figures 34a, b is presented a schematic presentation of the abrasive wear mechanism of the composite materials.

Figure 34 Schematic prereinforced wiabrasive particlonger mean fr
In Figure 35 is presented taverage size of the silica saabrasive wear of the PTA wMn 0,7 %, Fe 0,1 %, Ni 0,and Cr3C2 (75-180 µm) carabove the average size of th1993).
Figure 35 Effect of matrabrasive wearcarbides (Nish
The ratio, hr, between the avdiameter of the reinforcing
69
presentation of the abrasive wear mechanismwith carbides in relation with MFP and averrticles: a) shorter mean free path than abras free path than abrasive size (Nishida et al., 199
d the effect of the matrix mean free path in r sand on the abrasive wear resistance of the M welded Stellite 6 (C 1,3 %, Cr 30,2 %, W 4
0,1 %, Mo 0,1 %, Co bal.) reinforced with Tcarbides increases rapidly, when the mean free the silica sand ( MFP/da > 1) (Araki et al., 1994
atrix MFP in relation with average size of theear of the Stellite 6 deposit reinforced with ishida et al., 1993)
average penetration depth of the abrasives, h, ng carbides, d, determines the abrasive wear re
sm of the deposit erage size of the
rasive size and b) 1993)
relation with the MMC alloys. The 4,5 %, Si 1,3 %,
TiC (75-106 µm) free path increases 94; Nishida et al.,
the silica sand on th TiC and Cr3C2
h, and the average resistance as well

as the MFP. Equation 29 esmaterial. When the materiadepending on the ratio ofreinforcement size, d. EquatThe average penetration dparticle diameters. Relative
hr
where is stress in the cont
The same ratio between thedetermines the abrasive weaefficiently with soft matriresistance vs. relative abrainteractions between the abrrelationships. The lowest penetration depth estimatedthe relative abrasion resistawas Al 7091 (Cu 1,59 %, reinforced with 20 vol.-%was 5 m. It is necessary cross-section have effects oSahin (2005) discussed resaluminium composites that composites. It may have evapplied load, reinforcement
Figure 36 Relative wearet al., 1991)
70
estimates the abrasive penetration depth into therial and the load stress are constant the pene of the average abrasive particle size, da, auation 29 still does not take into account the eff depths are typically about 10-15 % of the ve penetration depth is (Wang et al., 1991):
,
ntact area and K’ is geometrical constant.
he penetration depth of the abrasive and the reiear resistance as well as the MFP. The effect c
trix. In Figures 36 and 37a, b are presentebrasive penetration depth and schematic presabrasive particles and the reinforcement particlest relative wear resistance is obtained, whted with equation 29 equals to 1. At lower penistance is relatively high. It has to be noticed , Mg 2,28 %, Zn 6,11 %, Co 0,4 %, Fe 0,07
SiC. The range of the SiC particles was 2-1y to notice that the angle of abrasive or aspers on indentation and cutting of the surface of thresults made by the Taguchi method for sofat abrasive grain size is one of the major param
even higher effect on the abrasive wear when cnt size, and sliding distance.
ar resistance vs. relative abrasive penetration d
the relatively soft netration depth is and the average
effect of the MFP. he mean abrasive
(29)
reinforcement size t can be explained ted relative wear resentation of the icles at various h/d when the relative penetration depths d that the deposit
%, and Al bal.) 10 m and mean
perity and leading the base material.
soft materials like ameter for the soft n compared to the
n depth, hr (Wang

Figure 37 Schematic preand the reinfor
In Figures 38a, b is presenstate wear is obtained, wheremain constant. The appliesteady state abrasive wear ion the abrasive wear, i.e., sm
Figure 38 a) Initial stage
The abrasive efficiency can
fab 1 ,
where lim is capability of dis effective deformation of tdeformation with increasingequation 31 and s from equ
,
s 2 ln
71
presentation of the interactions between the aforcement particles: a) h < d and b) h > d (Wang
sented the abrasive wear behavior of two phahen the distances of x1 and x2 from the orig
plied load per surface areas of the phases is nor is obtained (Garrison, 1982). Surface roughne, smoother surface may have a lower wear rate.
ge and b) steady state of abrasive wear (Garriso
an be estimated by equation 30 (Zum Gahr, 198
f deformation of the wearing material during aof the wearing surface, and is a factor describing depth below the wearing surface. can beequation 32 (Zum Gahr, 1987):
,
e abrasive particle ang et al., 1991)
hases. The steady riginal top surface not equal, but the hness has an effect te.
ison, 1982)
988):
(30)
abrasive wear, s
ribing the decay of be estimated from
(31)
(32)

72
where Hdef is hardness measured on the wear debris, E is elastic modulus, is coefficient of friction, 2 is angle of abrasive tip, and Rp is tip radius of an abrasive.
Hardness is not always in relationship with the wear resistance (Baeslack et al., 1996). Normal load increases the abrasive wear of the Stellite 6 deposit more efficiently when compared to sliding velocity and track radius (Shanmugam et al., 2004). The relationship between wear volume, hardness, normal load, and sliding distance in various tribological processes is estimated by equation 33. It is applied for many wear processes, especially for adhesive wear. The term hardness should have a correction multiplier from 1,5 to 3 (Budinski, 1988; Tucker, 1997). The Archard law is (Archard, 1953):
V = , (33)
where K is a wear coefficient. K is a constant related to the probability per unit encounter of production of a wear particle. Constant K is related to the sharpness, geometry of the asperity or particle causing the wear (Bayer, 1997). Magnitude of constant K can vary in a large scale.
In equation 34, the abrasive efficiency, fab, is related to Archard wear coefficient K (Kato, 1997):
K fab , (34)
where volume of a scratch groove, Ag, is (Kato, 1997; Zum Gahr, 1987):
Ag . (35)
According to the Khruschov’s rule the wear resistance of a structurally heterogeneous material is equal to the sum of losses of the volumetric shares of the separate phases multiplied by the relative wear resistances. The Khruschov’s rule cannot give exact estimations. For instance, the abrasive wear resistance of tungsten carbide with cobalt bond is 2,5 times lower than the rule estimates. The rule is designed for metal-metal composites, not for metal-ceramic composites. The Khruschov’s rule for the multiphase system is (Garrison, 1982; Khruschov, 1974):
, (36)
where W is wear resistance, is the volume fraction of ith phase, and i is wear resistance of ith phase.
Chen et al. (1990) have presented enhanced version of equation 36, which is presented in equation 37. Equation 37 has a modification factor for the second phase. Equation 37 is modified to interpret the wear data of the high-chromium white cast iron samples in which the microstructure, i.e., carbide volume fraction, carbide morphology, and matrix

structure, were varied. Abraet al., 1990):
Vvf Vm ( k Vsp Vm ) v
where vf is volume fractionmatrix phase, Vsp is abrasivfactor in relation with intemartensitic matrix have incr
The abrasive efficiency inoccur around scratches. Thmaterials or ceramics can b1997):
Vr 1 ,
where 1 is constant and K
In Figure 39 is presented oand metals (Zum Gahr, 199between wear resistance anpresented in Figure 39.
Figure 39 Wear resistanGahr, 1987)
73
brasive wear resistance of a composite materia
) vf ,
ion of the second phase, Vm is abrasive wear rsive wear resistance of the second phase, and kinterphase interaction. Both coarser carbide mncreasing effect on k values.
increases with brittle materials, because micThe wear rate may be doubled. Abrasive wean be estimated by equation 38 (Moore et al., 19
Kc is fracture toughness of the wearing materia
d overall wear resistance and fracture toughne997). Diesburg et al. (1992) found similar kind and fracture toughness of austenitic and mart
tance and fracture toughness for ceramics an
erial, Vvf, is (Chen
(37)
r resistance of the k is modification
morphology and
icrocracking can ear rate of brittle
, 1980; Zum Gahr,
(38)
rial.
ness for ceramics ind of relationship artensitic steels as
and metals (Zum

74
3.4 Strengthening mechanisms
In crystals atoms are packed together in a regularly repeating pattern. Crystals are not perfect. The defects in them determine the crystal strength. The dislocation is a defect which allows material to deform plastically. Dislocation motion produces plastic strain, i.e., crystal yields. The possibilities of increase the resistance against dislocation motion are solid solution hardening, precipitate and dispersion hardening, and work-hardening. Also combination of previously mentioned ones is possible (Ashby et al., 1980).
A crystal yields when the force (per unit length), b, exceeds the resistance opposing the motion of a dislocation, f. is a shear stress. Most crystals have a certain intrinsic strength, which is the bond between the atoms. The bond has to brake and reform when the dislocation moves. Covalent bond has a large intrinsic lattice resistance per unit length of dislocation. Because of covalent bond, e.g., diamonds and carbides have their excellent hardness and strength. Strength of pure metals is low because of low lattice resistance. The dislocation yield strength, , is (Ashby et al., 1980):
, (39)
where f is resistance opposing the motion of a dislocation (a force per unit length) and b is unit of slip, the Burgers vector.
Hardening of metal is possible by making it impure. Impurities go into solution in a solid metal. Large atoms like chromium and nickel produce barriers to dislocation motion. The atoms replace the original metal atoms and form a random substitutional solution. The size of the atoms is different and after squeezing into the structure stresses generate. These stresses “roughen” the slip plane making dislocations harder to move. The smaller the spacing of the dissolved atoms the rougher is the slip plane. Thus, the resistance opposing the motion of a dislocation, f, and the dislocation yield strength, increases (Ashby et al., 1980).
When the solute concentration in an alloy exceeds the limit of solubility of the matrix phase, nucleation and growth of second-phase particles begins if suitable thermal conditions are present. Second phase may precipitate as small particles, when it is dissolved in a metal or ceramic at a high temperature and the alloy is cooled to RT. At temperature close to solvus temperature only little driving force for the precipitation process exists even though diffusion kinetics is rapid. An optimal temperature for rapid precipitation is obtained at an intermediate temperature because of an ideal combination of particle nucleation and growth rates. It is also important to notice that dislocation looping is controlled by the spacing between particles, but not by the nature of the particle itself. Most steels are strengthened by the precipitates of the carbides obtained by this way. Small particles can be added into metals or ceramics by adding particles with powdered consumable, e.g., by the HIP process or the PTA welding method. Both ways increase the amount of small carbides in a path of dislocation, thus, preventing dislocation motion and plastic flow of materials. The greatest hardening is achieved with strong closely shaped precipitates or dispersoids, i.e., with the high volume

fraction and the small MHertzberg, 1996).
Most crystals have several sslips on {111} planes. PlaDislocations move througincreases by cold workingmobility. Dislocations inteStress-strain curve rises steelarger stresses have to be ahardening, strain hardening
In Figure 40 is presented thsolution hardening, precipeffects on the abrasive wear
Figure 40 Schematic prea function of h
In Figure 41 is presented twear resistance. The higheretained austenite. Austenmartensite during abrasivetransformation and the resuespecially for the welded de
75
MFP of precipitates or dispersoids (Ashby
al slip systems. The f.c.c. structure, which has Plastic deformation by cold working producugh crystals when crystals yield. Number ing and interactions between dislocations rednteract, obstruct each other, and accumulate teeply after yield. Additional deformation is m applied to achieve more deformation. This is
ng, or cold working (Ashby et al., 1980; Hertzb
the effect of hardness on abrasive wear resistaipitate and dispersion hardening, and work-
ear resistance.
presentation of the abrasive wear resistances of hardness (Zum Gahr, 1987)
d the effect of hardness of various materials hest abrasive wear resistance is obtained withenite phase can undergo transformation fro
ive wear. Phase transformation may induce psult can be positive compression stresses whic
deposits (Zum Gahr, 1987).
hby et al., 1980;
as four slip planes, uces dislocations.
er of dislocations reduce dislocationte in the material. more difficult and is called as work-tzberg, 1996).
istance. Also solid -hardening have
of the materials as
ls on the abrasive ith martensite and from austenite to e positive volume hich are beneficial

Figure 41 Abrasive weafunction of ha
The formation of martensithas an effect on the abrasivchange the microstructure, significant volume changes40, martensite start tempeincluded. The equation is austenite contents of the mamethod can be estimated wi
Ms (ºC) 273 12,1 C
(%) 36,412 Ms (ºC)
(%) 2,014 1,525 (%).
The matrix of the metastmartensite, and ’-martensimartensitic phase conversmartensite (Röthig et al., 19
Wear resistance of tool steecarbides, the size of carbide42 is presented the relativecarbides have high hardnemartensite.
76
ear resistances of the materials in pin abrhardness (Zum Gahr, 1987)
site and retained austenite in the matrix of irosive wear resistance. Temperature changes durre, i.e., by lowering retained austenite contentes due to the increasing amount of martensiteperature, Ms, can be estimated. Vanadium
is valid only within the stated composition lmartensitic stainless steel deposits welded by th with equations 41 and 42 (Andrews, 1965; Wu
Cr (%) 17,7 Ni (%) 7,5 Mo (%)
0,126,
Cr (%) 2,23 Ni (%) 0,945 Mo (%)
astable austenitic FeMn-deposit can contain nsite. Plastic deformation under mechanical loersion from -austenite to -martensite and 1997).
teels depends on the matrix hardness, compositiides, the MFP, and the volume fraction of carive hardness of mixed carbides and martensitedness when compared to hardness of cemen
brasion test as a
iron-based deposit uring the use may
ent and leading to ite. With equation m content is not n limits. Retained y the PTA welding
u et al., 2000):
423 N (%),(40)
(41)
%) 53,298 N (42)
in -austenite, -l load leads to the nd finally to ’-
sition, precipitated arbides. In Figure
site. MC and M2C entite, Fe3C, and

Figure 42 Relative hardnet al., 1980)
Draugelates et al. (1996(10MnMo4-5) reinforced whad VC carbides, the sizes the mean size of VC carbid%, Mo 4,5 %, W 5,8 %, Sreported that original 100 μand the size of the precipiabrasive wear, local adhescarbides. The size of the prparameters. Larger carbidmartensitic matrix are ben1990).
3.5 Rubber wheel abr
In Figure 43 the rubber wapparatus conforms to stantesting low stress three-borelatively constant abrasive1991). Normal force in the is normally 200 rpm, total 6
77
rdness of various carbides, cementite, and mar
96) found that the microstructure of the with 30 % VC carbides welded by the PTA wes of which were 5-10 μm. Wang et al. (2006ides of the LB welded deposit M4 (C 1,45 %,
, S 0,12 %, and Fe bal.) was 0,6 μm. Tsuboucμm NbC carbides partly melted during the PT
ipitated primary carbides was about 1 μm. Tesion can be also prevented by high number precipitated carbides depends on the alloy as bide volume fraction, coarser carbide mo
neficial in improving the abrasive resistanc
brasion test
r wheel abrasion test, RWAT, apparatus is tandard ASTM G 65-94. The RWAT apparatubody abrasive wear. Abrasive size above 100ive wear for various materials (Fang et al., 200he RWAT can be varied between 20-200 N. Thl 6000 revolutions.
artensite (Brandis
the deposit SG2 A welding method 06) measured that , V 3,9 %, Cr 4,5
uchi et al. (1997) PTA welding tests . Thus, as well as ber of small-sized as well as welding morphology, and nce (Chen et al.,
is presented. The atus is suitable for 100 m results in 2001; Wang et al., The rotating speed
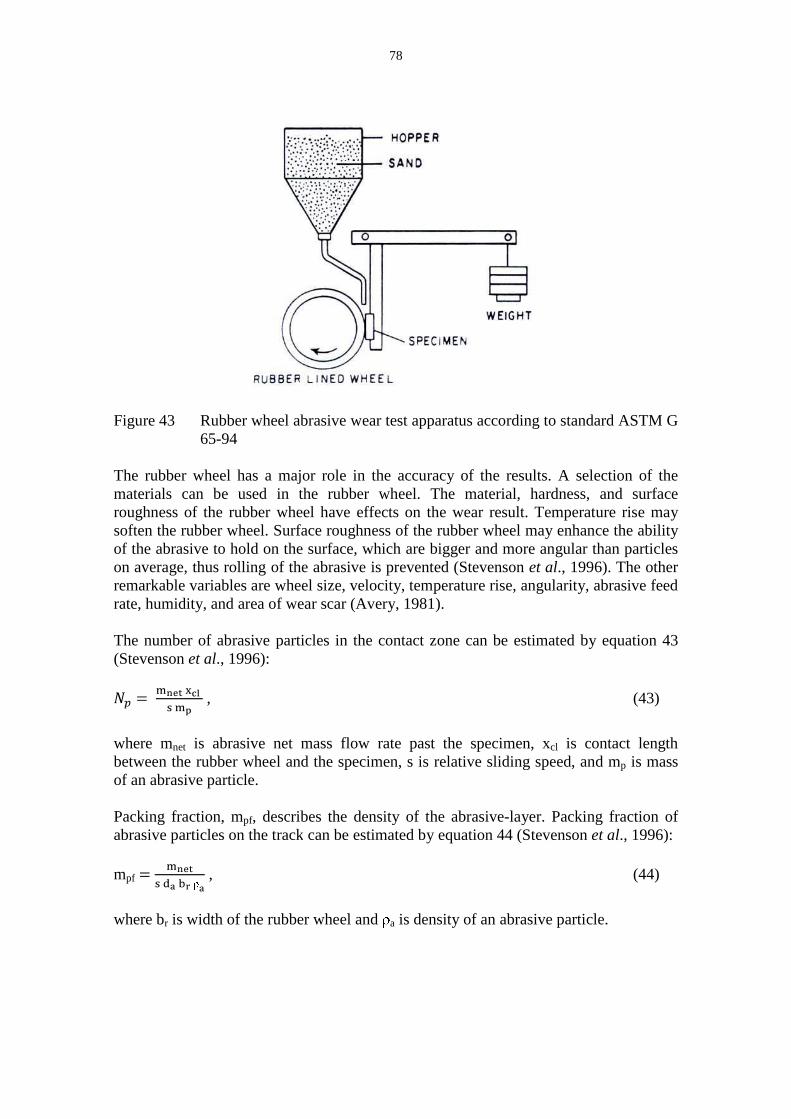
Figure 43 Rubber wheel65-94
The rubber wheel has a mmaterials can be used inroughness of the rubber whsoften the rubber wheel. Suof the abrasive to hold on thon average, thus rolling of tremarkable variables are whrate, humidity, and area of w
The number of abrasive pa(Stevenson et al., 1996):
,
where mnet is abrasive netbetween the rubber wheel aof an abrasive particle.
Packing fraction, mpf, descabrasive particles on the trac
mpf ,
where br is width of the rubb
78
eel abrasive wear test apparatus according to sta
major role in the accuracy of the results. A in the rubber wheel. The material, hardneswheel have effects on the wear result. TempeSurface roughness of the rubber wheel may enhn the surface, which are bigger and more angulof the abrasive is prevented (Stevenson et al., 1wheel size, velocity, temperature rise, angularitf wear scar (Avery, 1981).
particles in the contact zone can be estimated
net mass flow rate past the specimen, xcl isl and the specimen, s is relative sliding speed,
scribes the density of the abrasive-layer. Packtrack can be estimated by equation 44 (Stevenso
ubber wheel and a is density of an abrasive par
standard ASTM G
A selection of the ness, and surface perature rise may
enhance the ability ular than particles
., 1996). The other rity, abrasive feed
ed by equation 43
(43)
is contact length , and mp is mass
acking fraction of nson et al., 1996):
(44)
particle.

79
4 Objectives of the dissertation
The main research areas in the development of the PTA welding method are the dilution of the deposits, the mechanical tests, the wear and corrosion tests, and the welding parameters which have effects on the dimensions of the weld beads. One of the biggest features of the process is the low dilution and, thus, the properties of the deposit are achieved by one-layer deposit. It is known that plasma arc current has a remarkable effect on the dilution, when the other welding parameters are constant.
The welding parameters depend on the alloy. It is necessary to know the interactions between the welding parameters and the microstructure. When the PTA welding method is used for surfacing 12V tool steel onto the base material, the characteristic phenomenon of the welding process is the large molten pool for obtaining thick deposit by welding only one layer and, thus, problems in the dilution control. Therefore, the microstructure depends on the selected welding parameters.
Firstly, the PTA welding tests were directed to evaluate the effects of the main welding parameters on the dilution control of the 12V tool steel deposit. The welding tests have been welded in seven parameter windows. To find out the effects of the plasma arc with selected parameters on the microstructure, the welding tests were made by varying plasma arc current step by step, while the other welding parameters were kept constant.
Secondly, two welding procedures were tested: the plasma arc in the edge and on the molten pool. The microstructures of the 12V tool steel deposits surfaced with various welding parameters were analyzed after the surfacing process. Ar, Ar + 3 % H2, and Ar + 5 % H2 were used as carrier gas to find out the effect of carrier gas on the dilution control and the microstructure. The volume fractions of VCs, the sizes of VCs, the MFPs, and the retained austenite contents of the deposits were measured. The effect of the location of the plasma arc in relation with the molten pool on the microstructure was analyzed. The wear test was ASTM G 65-94 dry quartz sand rubber wheel abrasion test. The microstructures of the deposits, the welding parameters, and the wear test results were compared to find out the factors affecting most the abrasive wear resistance of the 12V tool steel deposit.

80
5 Experimental
5.1 Materials
The powder consumable of this study was 12V-1 tool steel. The fraction was sieved from the powder used for manufacturing the 12V-1 HIP material. The PTA welded deposits were tested in as-welded condition. 15V-1 tool steel was a reference material for the PTA welding parameter tests and the materials manufactured by the HIP method, i.e., 10V, 12V-1, 12V-2, and 15V-2 tool steels were reference materials for the microstructure studies and the wear tests. The materials manufactured by the HIP process were austenized at 1040-1150 ºC, dwell time was 0,5-1 h and finally the materials were double tempered 2 hours at 540-650 ºC (normally 540-570 ºC) for decreasing the retained austenite content. The chemical compositions of the 12V-1 tool steel powder and the reference materials are presented in Table 3. P and S were <0,03 wt.-% for the 12V-1 tool steel powder.
The PTA welded deposits were surfaced onto a carbon steel St 52. The nominal powder fraction of the 12V tool steel powder was 53-150 μm. In this study the vanadium carbide structure was not analyzed. The mass ratio of vanadium to carbon is 1:0,235 for VC (Xu et al., 2007). The melting point of VC is 2648 ºC, density 5,4 g/cm3, and hardness 2900-2940 HV0,2 (Bouaifi et al., 1993; Gebert et al., 2001).
Table 3 Chemical compositions of the 12V-1 and the 15V-1 tool steel powders and the reference materials manufactured by the HIP process [wt.-%]
C Cr V Mo Si Mn Fe 10V 2,4-
2,5 4,7- 5,8
9,2- 10,3
1,1- 1,5
0,7- 1,1
0,3- 0,6
Bal.
12V-1 2,9 5,25 11,5 1,3 <1,0 <1,0 Bal.12V-2 2,8 5,2 11,4 1,3 0,9 0,6 Bal.15V-1 3,4 5,0 14,5-
15,0 1,3 - - Bal.
15V-2 3,4 5,0 14,5 1,3 - - Bal.
5.2 Welding equipment
The welding tests were welded by the mechanized and the robotized welding units. The mechanized PTA welding unit equipments are presented in Table 4 and the robotized PTA welding unit equipments are presented in Table 5. In Figures 44a-c is presented the mechanized PTA welding unit and the robotized welding unit is presented in Figures 45a-b. The plasma torch was manufactured by Plasma Modules. Normally the plasma torch utilizes only plasma and carrier gas. The prototype external shielding gas torch was manufactured and installed to the plasma torch. The external shielding gas torch is presented in Figure 44c. A sintered bronze-plate was used to ensure laminar flow of

shielding gas. The powder fConstant mass flow rate for
Table 4 The equipmen Plasma torch Powder feed supply Pilot power source and prPlasma arc power sourceExternal gas shield Conveyor Oscillation mode
Table 5 The equipmen
Robot Rotating table PTA unit Plasma torch Plasma gas control uniExternal gas shield Power source
Oscillation mode
Figure 44 The mechanizplasma torch,external gas shgas
81
er feed was focused at 9 mm distance from thefor plasma gas was arranged by a control unit.
ents of the mechanized PTA welding unit Plasma Modules 200Plasma Modules TC
process gas control unit Esab PW 300 B ce Esab LUA 400
Prototype Esab Railtrack FW 1Rectangular wave m
ents of the robotized PTA welding unit
Reis Robot SRV6 6 kg RDK05 500 kg Plasma Modules Ion PPAW Plasma Modules 200 A
unit Plasma Modules prototype Prototype Cebora Sound DC 2640 TIG Inverter A Cebora Digibox TIG DC3 Sine wave mode
ized PTA welding unit: a) an overview, b) th
and the work piece, and c) the plasma torch shielding torch, and the pipes for cooling liqu
he powder nozzle.
200 ATCP 101
1000 mode
er max. 260
the conveyor, the rch, the prototype quid and shielding

82
Figure 45 The robotized PTA welding unit: a) an overview and b) the robot, the rotating table, and an automatic torch change system for the GTA, the MIG/MAG, and the PTA welding torches
5.3 Welding experiments
5.3.1 Welding parameters
The PTA welding tests were first directed to evaluate the effects of the welding parameters, mainly the effects of plasma arc current, on the dilution control of the 12V-1 tool steel deposit. To find out the effects of plasma arc current with selected parameters on the dilution, welding tests were made by varying plasma arc current step by step, while the other welding parameters were kept constant. The effects of the dilution were determined by the rubber wheel abrasion tests.
The effect of the location of the plasma arc in relation with the molten pool on the microstructure and the abrasive wear resistance was analyzed. The effects of overlapping on the microstructures between the first and the second or the third overlapping weld beads were analyzed. Small variations in welding speed were analyzed. Two welding procedures were tested, i.e., the location of the plasma arc in the edge and on the molten pool. Ar, Ar + 3 % H2, and Ar + 5 % H2 gas were used as carrier gas to find out the effects of hydrogen on the dilution control and the microstructure. The effects of the sine and the rectangular wave oscillation modes on the microstructure were analyzed. The effects of plasma gas flow rate and working distance were analyzed.
The welding tests were welded in seven parameter windows, Tables 6-11. In Tables 6 and 9 are presented constant welding parameters and in Tables 7, 8, and 10 are presented welding parameters which were varied in the tests. In Table 11 are presented welding parameters for the welding test welded with straight passes, i.e., without oscillation movement.

83
Table 6 Constant welding parameters for the welding tests welded by the mechanized welding unit
Shielding gas Ar 12 l/min Carrier gas Ar 5 l/min Oscillation wave mode Rectangular Oscillation width 25 mm Electrode ∅ 2,4 mm,
1 mm inside the plasma nozzle Pilot arc current 5 A Work piece / torch alignment
Horizontal / perpendicular to the work piece
Table 7 Variable welding parameters for the welding tests welded by the mechanized welding unit
Parameters A Parameters B Parameters C Plasma gas Ar 4, 6 l/min Ar 2 l/min Ar 2 l/min Powder feed rate 3,7 kg/h 2,7 kg/h 5,0 kg/h Plasma arc current 120-140 A 110-140 A 175 A Plasma nozzle ∅ 3,0 mm ∅ 2,7 mm ∅ 2,7 mmPreheating RT, 200 °C, 300 °C RT, 450 °C RT Overlapping Transversal speed
24 mm 15 mm/s
24 mm 15, 25 mm/s
- 15 mm/s
Movement in the end of wave 2,2 mm 2,1 mm 2,1 mm Working distance 8-12 mm 9 mm 9 mm Number of beads 2 3 1 Location of the plasma arc Size of the work piece
On the edge of the molten pool
200x100x25 mm
On the edge of the molten pool
100x100x25 mm
On top of the molten pool
200x100x25 mm
Table 8 Welding tests with welding parameters A
Test [No.]
Working distance
[mm]
Plasma gas flow rate [l/min]
Plasma arc current
[A]
Preheating temperature
[°C] 1 8 4 130 200 2 8 6 140 300 3 10 4 140 RT 4 10 6 120 200 5 12 4 120 300 6 12 6 130 RT

84
Table 9 Constant welding parameters for the welding tests welded by the robotized welding unit
Plasma gas Ar 2 l/min Oscillation wave mode Sine Electrode ∅ 2,4 mm, 1 mm inside the plasma nozzle Plasma nozzle ∅ 2,7 mm Pilot arc current 5 A Oscillation width 6,5 mm Frequency 1,2 osc./s Working distance 9 mm Overlapping 5 mm Size of the work piece Number of beads Work piece / torch alignment
100x100x25 mm 5 Horizontal / perpendicular to the work piece
Table 10 Variable welding parameters for the welding tests welded by the robotized welding unit
Parameters D Parameters E Parameters F Plasma arc current 73-95, 52-65 A 45-70 A 40-65 A Powder feed rate 0,3-1,5 kg/h 0,7 kg/h 0,7 kg/h Preheating RT, 300 °C RT RT Welding speed 1,35-1,49 mm/s 1,35 mm/s 1,35 mm/s Carrier gas Ar
5 l/min Ar + 3 % H2 5 l/min
Ar + 5 % H2 5 l/min
Shielding gas Ar 12 l/min - - Location of the plasma arc
On the edge / on top of the molten pool
On the edge of the molten pool
On top of the molten pool
Table 11 Welding parameters G for the welding tests welded with straight passes without oscillation
Plasma gas Ar 2 l/min Plasma arc current 62 A Pilot arc current 5 A Powder feed rate 0,4 kg/h Preheating RT Welding speed Overlapping
2,3 mm/s 2,6 mm
Carrier gas Ar 5 l/min Shielding gas Ar 12 l/min Electrode ∅ 2,4 mm, 1 mm inside the plasma nozzle Plasma nozzle ∅ 2,7 mm Working distance 9 mm Size of the work piece Work piece / torch alignment
100x100x25 mm Horizontal / perpendicular to the work piece

85
5.4 Experimental methods
5.4.1 Powder consumable
The fractions of the new powder and the oversprayed powder were analyzed. The oversprayed powder was collected after the welding tests welded with welding parameters D, plasma arc current 80 A. The powders were analyzed by Beckman Coulter LS Particle Analyzer. The optical method was Fraunhofer.rfd LS 320 Small Volume Module. Run length was 60 s. The fluid was 2-propanol. The measured powder was cut to the fraction 40-200 μm. The surface and a cross-section of a powder particle were investigated by SEM.
5.4.2 Temperature of work piece
The temperature of the work piece was measured during the welding test. Welding parameters D were used for the welding test with powder feed rate 0,3 kg/h. The size of the work piece was 200x100x25 mm. In both ends of the work piece was one thermocouple for the temperature measurement. The temperature of the work piece was RT in the beginning of the test.
5.4.3 Microstructure
The sections for the metallographic samples were cut mainly from the end of the weld beads in comparison with welding direction. The dimensions of the weld beads were detected from the cross-sections. The samples were prepared by grinding with SiC water abrasive paper (80, 180, 360, 800, 1200, and 2500 grit). The samples were polished with 6 and 1 μm diamond pastes. Etchant for the microstructural investigation contained 120 ml ethanol, 100 ml HCl, 8 g FeCl3, and 7 g CuCl2.
The microstructures were studied by optical microscope and scanning electron microscope with backscattering detector. The volume fractions of VCs, the sizes of VCs, and the MFPs of the tool steel materials were determined from scanning electron microscopy pictures by Imagetool image analysis program. Microstructural changes in a weld bead cross-section welded with welding parameters B were measured from pictures taken by optical microscope. The shape ratios of VCs were measured automatically by ImageJ image analysis program. The shape ratio was estimated from 0 to 1 by measuring randomly each carbide width and height from the SEM picture and comparing the results. The sizes of VCs and the MFPs were measured randomly (100 measurements) from pictures taken from the core of the deposits. The carbide surface fraction corresponds to the carbide volume fraction according to the principle based on the Delesse’s principle (Delesse, 1847). The principle is based on the idea that a two-dimensional random area of an object is an estimate of its volume fraction. Standard deviations of the volume fractions of VCs were estimated from the SEM pictures (94x70 m), the pictures of which were divided into 9 equally sized pictures.
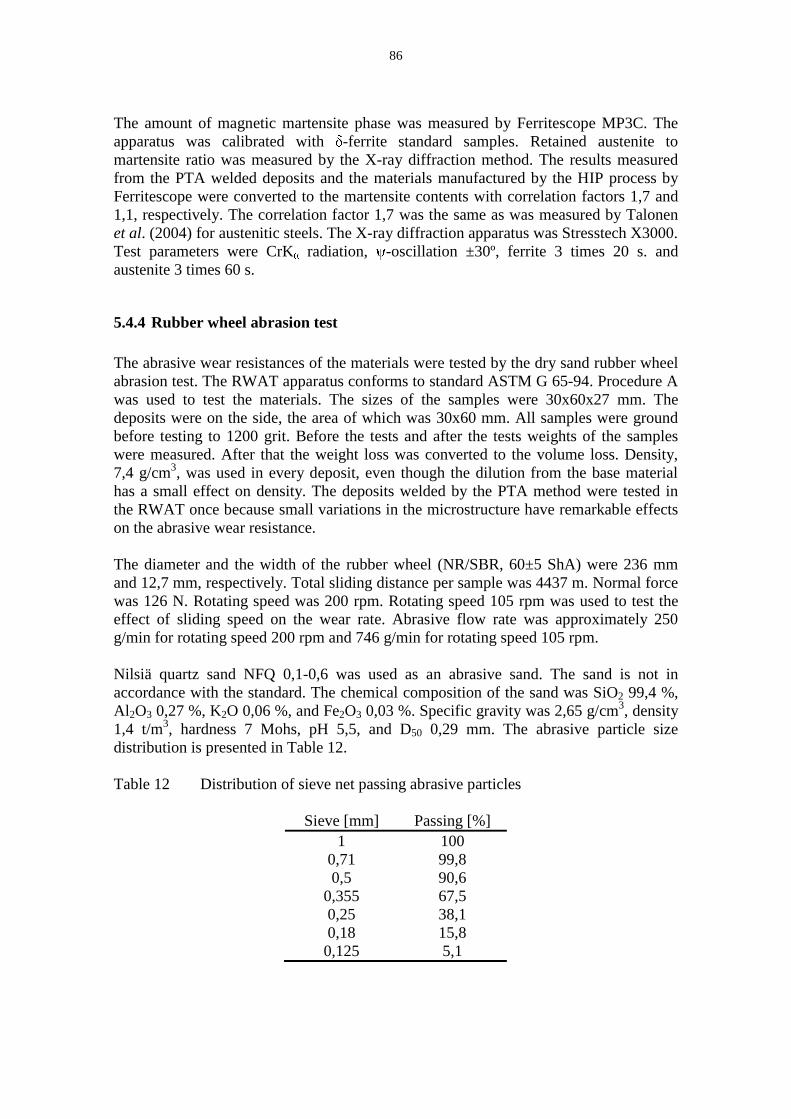
86
The amount of magnetic martensite phase was measured by Ferritescope MP3C. The apparatus was calibrated with -ferrite standard samples. Retained austenite to martensite ratio was measured by the X-ray diffraction method. The results measured from the PTA welded deposits and the materials manufactured by the HIP process by Ferritescope were converted to the martensite contents with correlation factors 1,7 and 1,1, respectively. The correlation factor 1,7 was the same as was measured by Talonen et al. (2004) for austenitic steels. The X-ray diffraction apparatus was Stresstech X3000. Test parameters were CrK radiation, -oscillation ±30º, ferrite 3 times 20 s. and austenite 3 times 60 s.
5.4.4 Rubber wheel abrasion test
The abrasive wear resistances of the materials were tested by the dry sand rubber wheel abrasion test. The RWAT apparatus conforms to standard ASTM G 65-94. Procedure A was used to test the materials. The sizes of the samples were 30x60x27 mm. The deposits were on the side, the area of which was 30x60 mm. All samples were ground before testing to 1200 grit. Before the tests and after the tests weights of the samples were measured. After that the weight loss was converted to the volume loss. Density, 7,4 g/cm3, was used in every deposit, even though the dilution from the base material has a small effect on density. The deposits welded by the PTA method were tested in the RWAT once because small variations in the microstructure have remarkable effects on the abrasive wear resistance.
The diameter and the width of the rubber wheel (NR/SBR, 60±5 ShA) were 236 mm and 12,7 mm, respectively. Total sliding distance per sample was 4437 m. Normal force was 126 N. Rotating speed was 200 rpm. Rotating speed 105 rpm was used to test the effect of sliding speed on the wear rate. Abrasive flow rate was approximately 250 g/min for rotating speed 200 rpm and 746 g/min for rotating speed 105 rpm.
Nilsiä quartz sand NFQ 0,1-0,6 was used as an abrasive sand. The sand is not in accordance with the standard. The chemical composition of the sand was SiO2 99,4 %, Al2O3 0,27 %, K2O 0,06 %, and Fe2O3 0,03 %. Specific gravity was 2,65 g/cm3, density 1,4 t/m3, hardness 7 Mohs, pH 5,5, and D50 0,29 mm. The abrasive particle size distribution is presented in Table 12.
Table 12 Distribution of sieve net passing abrasive particles
Sieve [mm] Passing [%] 1 100
0,71 99,8 0,5 90,6
0,355 67,5 0,25 38,1 0,18 15,8
0,125 5,1

87
Surface roughness of one deposit was measured during the RWAT. The sample was welded with welding parameters B, 130 A, PH. The sample was polished before the test. Surface roughness was measured by Stylus Profilometer.
After the RWAT tests, the worn surfaces of three deposits welded by the PTA method were investigated by SEM. The samples were welded with welding parameters A, C, and D. The wear track of the 12V-1 tool steel reference material manufactured by the HIP process was also studied. The effects of low and high stress levels on the wear tracks were analyzed.
6 Results
6.1 12V tool steel powder
6.1.1 Microstructure
The powder particles were spherically shaped, Figure 46a. Only very minor internal porosity was observed. The mean size of the original carbides detected from a powder particle cross-section was 0,18 m, Figure 46b. The size of the largest original carbide detected was 0,56 m. The distribution of the original carbides in a powder particle was relatively homogeneous.
Figure 46 12V-1 tool steel powder particles: a) spherically shaped powder particles and surface of a powder particle and b) microstructure of a powder particle
6.1.2 Powder fraction
The powder fractions of the new and the oversprayed powders were analyzed. The oversprayed powder was collected after the welding test with welding parameters D.

88
The consumable efficiency was 55-65 % for welding parameters D. The consumable efficiency was >95 % in the welding tests welded with welding parameters C.
The results for the new powder were: mean 96,39 μm s.d. 27,94 μm, median 90,75 μm, d10 64,17 μm, d25 73,78 μm, d50 90,75 μm, d75 116,2 μm, d90 138,3 μm, D(3,2) 88,94 μm, mode 80,07 μm, skewness 0,608 right skewed, and kurtosis 0,468 platykurtic.
The results for the oversprayed powder were: mean 103,9 μm s.d. 27,43 μm, median 101,7 μm, d10 69,16 μm, d25 81,95 μm, d50 101,7 μm, d75 123,9 μm, d90 142,8 μm, D(3,2) 96,68 μm, mode 116,3 μm, skewness 0,323 right skewed, and kurtosis 0,642 platykurtic.
In Figures 47 and 48 are presented the differential and the cumulative volumes of the new and the oversprayed powders. The powder fraction was bigger in the oversprayed powder because the plasma arc had bigger ability to melt the powder particles, the fraction of which was 50-100 μm.
Figure 47 Differential volumes of the new and the oversprayed 12V-1 tool steel powders

89
Figure 48 Cumulative volumes of the new and the oversprayed 12V-1 tool steel powders
6.2 Temperature of work piece during the welding process
The temperature of the work piece increased during the welding process from RT to 250 °C. Welding parameters D was used for the welding test. Plasma arc current was reduced during the welding process. In Figure 49 are presented temperatures of the work piece measured from two points locating in the both ends of the work piece. Plasma arc currents and dimensions of the deposit cross-section are presented in Table 13. The biggest difference in the temperature of the work piece was measured after the first weld bead was welded. Temperature rose from RT to 110 °C. After the twelfth weld bead was welded, temperature rose was from 245 to 250 °C, i.e. 5 °C.
Plasma arc current was first 74 A and finally it was 58 A. The biggest alteration was between the first and the second weld beads, from 74 to 64 A. The trend of lowering plasma arc current during the surfacing process, when the dilution had to stay constant, was similar as in the welding tests made by Nefedov et al. (1995). The mean dilution of the weld beads was 11,1 %. Because of the distortion it was difficult to measure the exact dilution. The fusion line was not straight. Therefore, the dilutions of the weld beads were slightly overestimated.
The maximum and the minimum thicknesses of the weld beads were 1,6 and 1,0 mm, respectively. The maximum penetration was 0,5 mm. In the overlapping areas lack of penetration was obtained. The highest bead was the first bead. Thickness of the deposit mainly decreased when the welding process proceeded.

90
Figure 49 Temperatures of the work piece during the welding test welded with welding parameters D
Table 13 Temperatures of the work piece, plasma arc currents, and dimensions of the deposit cross-section welded with welding parameters D
6.3 Dilution
6.3.1 Welding parameters A
In the welding tests welded with welding parameters A, plasma arc current, plasma gas flow rate, working distance, and preheating temperature were varied. In Figure 50 is presented a cross-section of a deposit welded with welding parameters A, test 4. In Table 14 are presented dilutions and thicknesses of the weld beads.
The dilutions of the deposits 1 and 6 increased slightly during the welding tests when comparing the dilutions of the weld beads 1 and 2. The dilutions of the other deposits

decreased during the weldinsecond bead, because powdsmaller than the widths of th
Figure 50 Cross-section
Table 14 Dilutions andparameters A
WeldingTest [No.]
DBe
1 182 263 174 165 116 5
6.3.2 Welding parameters
The work pieces were prehof the work pieces decreasethe displacement of the plas
The dilution increased onsame dilution was obtainedFigures 51 and 52 are preseTable 15 are presented diincreased non-linearly. In ththe dilutions of the first bea
The thickness of the deposithe third weld beads werebeads. It is also obvious thaas can be seen from Figure plasma arc, especially, whethe base material.
91
ding tests. In every deposit the bead thickness wwder feed rate was constant and the overlappinf the weld beads.
on of a deposit welded with welding parameters
nd thicknesses of the weld beads welded
DilutionBead 1 / 2
[%]
Dilution Beads 1 and 2
[%]
ThicknesBead 1 / 2
[mm]18,7 / 19,0 18,9 3,3 / 3,826,3 / 12,7 19,2 3,8 / 4,317,8 / 15,6 16,3 3,9 / 4,316,3 / 11,8 13,9 3,6 / 4,411,9 / 7,2 9,5 4,0 / 4,35,9 / 6,0 6,0 4,1 / 4,7
rs B
reheated to 570 ºC. During the surfacing proceased to 370-450 ºC. Because of the mechanizelasma torch took time.
average 7 % when plasma arc current increed without preheating with 28 A higher plasmesented a cross-sectional and a welding directidilutions and thicknesses of the weld bead
n the deposits welded with plasma arc currentseads were higher than that of the dilutions in th
osit was on average 2,9 mm. The thicknesses ofhigher when compared to the thicknesses o
that the size of the molten pool was the largestre 51. Thus, the molten pool may restrict the pehen the size of the molten pool increases due
s was higher in the ping distance was
ers A, test 4
ed with welding
ess / 2
3,84,34,34,44,34,7
cess temperatures ized welding unit,
creased 10 A. The ma arc current. In ctional sample. In ads. The dilution
nts 130 and 140 A the third beads.
of the second and s of the first weld
in the third bead penetration of the e to dilution from

Figure 51 Cross-section current 120 A
Figure 52 A sample cut i
Table 15 Dilutions andparameters B
Plasma arc current
[A] 110 A 120 A 130 A 140 A
6.3.3 Welding parameters
The dilution of the depositlocation of the plasma arc w5,5 mm. Thus, even thoughto form enough penetration
In Table 16 is presented dimIn Figure 53 is presented aC. In Figure 54 is presentobtained occasionally in parameters C.
92
on of a sample welded with welding parameter A
ut in the welding direction from Figure 51, the s
nd thicknesses of the weld beads welded
Dilution Bead 1 / 3
[%]
Dilution Beads 1-3
[%]
ThicknBead 1
[mm5,1 / 5,1 5,1 2,6 / 2
7,9 / 12,9 11,3 2,9 / 322,0 / 10,6 15,5 2,9 / 226,5 / 24,5 25,3 2,7 / 3
rs C
sit welded with welding parameters C was smc was on the molten pool. The thickness of thegh plasma arc current was 175 A, the plasma a
on.
dimensions of the deposit welded with weldin a cross-section of a deposit welded with weldnted welding defects in the fusion line. Lackn the fusion lines of the deposits welded
ters B, plasma arc
e second bead
ed with welding
kness1 / 3 m]
/ 2,8 / 3,0/ 2,9
/ 3,1
small, because the the weld bead was a arc was not able
ing parameters C. elding parameters
ack of fusion was ed with welding

The size of the molten poolto the sides of the weld bead
Table 16 Dimensions of
Dilution [%]
Pe
0,5
Figure 53 Cross-section
Figure 54 Welding defeparameters C
6.3.4 Welding parameters
In Figures 55-57 are presparameters D, F, and G. In Fwelding parameters D-G asand (95/5) were used as parameters E and F, respeexcept plasma arc current. molten pool for the depos(welding parameters D). Tspeed, 1,35 mm/s, was usedE and F.
The dilution increased apprcurrent in the deposits wel
93
ol was relatively small. Thus, the molten pool ead. Some oxides were formed on the surface o
of the weld bead welded with welding paramet
Penetration max.[mm]
Penetration min.[mm]
Thickne[mm]
0,2 0,0 5,5
on of a sample welded with welding parameters
efects in the fusion line of a deposit welded
rs D-G
esented cross-sections of the deposits weldeIn Figure 58 are presented dilutions of the deposas a function of plasma arc current. Ar-H2 gas as carrier gas for the welding tests weldedpectively. The other welding parameters wer
nt. The location of the plasma arc was set to osits welded with Ar as plasma, carrier, anThe dilution was then optimal. Thereby ad
sed also for the welding tests welded with wel
proximately 2,5 and 6,5-8,0 % per 10 A increaelded with welding parameters F and D-E, re
ol was not flowing of the deposit.
eters C
knessm]
ers C
ded with welding
ded with welding posits welded with as mixtures (97/3)
ded with welding ere kept constant
to the edge of the and shielding gas adjusted welding elding parameters
ease in plasma arc , respectively. The

dilution was easy to controdefects were found occasionmixture was used as carrier
Thicknesses of the depositsefficiency. Small amount oarc current was reducedefficiency was lower when c
The weld bead welded widilution. Heat input was lowpool. Thus, penetration waline.
One deposit was weldedmicrostructure studies, Figu5,0 % and 1,2 mm, respectiv
Figure 55 Cross-section
Figure 56 Welding defeparameters F,
94
trol when Ar + 5 % H2 was used as carrier gasionally from the fusion lines, when argon + 5 %
ier gas, Figure 56.
s were between 2,2-2,9 mm, because of varyt of hydrogen has an effect on the melting eff
for argon-hydrogen gas mixtures. Thus, tn compared to the deposits welded with Ar as p
with welding parameters D, 65 A, PH, 5,0 low. The location of the plasma arc was slightlwas not formed. Lack of fusion was obtained
ed with welding parameters G as a refigure 57. The dilution and the thickness of th
ctively.
on of the deposit welded with welding paramete
fects in the fusion line of the deposit weldeF, plasma arc current 38 A
as. Some welding 5 % hydrogen gas
ying consumable efficiency. Plasma , the consumable
process gas.
0 mm had 0,5 % htly on the molten d from the fusion
reference for the f the deposit were
eters D
ded with welding

Figure 57 Cross-section
Figure 58 Dilutions of thD-G as a funct
6.3.5 Hardness
The effect of the dilution ontool steel deposit decreasesamount of welding paramebetween the dilution and theon the volume fraction of Vmicrostructure depends on
A major part of the dilution12V-1 tool steel deposit dedeposit increases 8 %. De
95
on of the deposit welded with welding paramete
f the 12V-1 tool steel deposits welded with welnction of plasma arc current
on hardness is presented in Figure 59. Hardnees when the dilution of the deposit increases. meters it is not possible to estimate an accurthe hardness. Hardness of the 12V-1 tool steel f VCs, the size of VCs, the MFPs, and the man the welding parameters.
ions of the deposits were between 5 and 10 %. decreases approximately –15 HV10, when the
Depending on the welding parameters, hardn
eters G
elding parameters
ness of the 12V-1 s. Because of high curate relationship el deposit depends atrix phases. The
. Hardness of the the dilution of the dness of the 5 %

96
diluted deposit may vary between 780 and 880 HV10. Thus, hardness of the 12V-1 tool steel deposit is not an accurate estimate about the properties of the deposit.
Figure 59 Effect of dilution on hardness of the 12V-1 tool steel materials manufactured by the PTA and the HIP processes
6.4 Hardness distribution
In Figures 60, 61, and 62 are presented hardness profiles of the deposits welded with welding parameters A-C and D-G. Hardness of the deposits was basically in the same level from the fusion lines to the top surfaces of the deposits. Hardness varies depending on whether the indenter hits on the carbide cluster or not. Also the microstructure has an effect on the results. The biggest variation was in the PTA welded 15V-1 two-layer deposit, the microstructure of which contains larger areas of VC clusters and also large areas of retained austenite.
The hardness distribution varies depending on from which bead it was measured. From Figure 62 it can be seen that hardness of the beads varies in a way which cannot be estimated. The weld beads 1, 2, 5, and 12 were measured and every bead had different kind of hardness distribution. The last twelfth bead had the biggest hardness 810 HV1 on average and the first bead had the lowest hardness 760 HV1 on average. Although the deposit was welded with the robotized welding unit and only plasma arc current was varied the microstructure shows small variations. The temperature of the work piece increased from RT to 250 °C, when the welding process proceeded from the first bead to the twelfth bead. Thus, small variations in the carbide content, the carbide morphology, the volume fraction of VCs, the size of VCs, the MFP, and in the ratio of austenite and martensite occur.

97
Figure 60 Hardness profiles of the 12V-1 tool steel deposits welded with welding parameters A-C
Figure 61 Hardness profiles of the tool steel deposits welded with welding parameters D-G

98
Figure 62 Hardness profiles of the weld beads 1, 2, 5, and 12 of the 1,0 mm thick 12V-1 tool steel deposit welded with welding parameters D
6.5 Optical metallography
6.5.1 Microstructure
In Figures 63a-l are presented the microstructures of the deposits welded with welding parameters A-G. In Figures 64a-d are presented the microstructures of the tool steel materials manufactured by the HIP process. Some pores can be seen in the microstructures of the materials manufactured by the HIP process.

99

100
Figure 63 Microstructures of the tool steel deposits welded with welding parameters A-G: a) A, test 4, bead 2, b) A, test 6, bead 2, c) B, 120 A, bead 1, d) C, e) D, RT, 2,9 mm, f) D, PH, 5,0 mm, g) D, PH, 2,2 mm, h) E, RT, 2,5 mm, i) F, RT, 2,4 mm, j) D, RT, 1,0 mm, k) G, RT, 1,2 mm, and l) D, 15V-1, RT, 2,9 mm

101
Figure 64 Microstructures of the tool steel materials manufactured by the HIP process: a) 12V-1, b) 12V-2, c) 15V-2, and d) 10V
6.5.2 Microstructural changes in weld bead cross-section
In a cross-section of a 12V-1 tool steel deposit welded with welding parameters B, the measurements were conducted from the fusion line to the top surface of the deposit. The dilution was 16 %. The thickness of the weld bead was 3,3 mm. The volume fraction, the mean size, and the MFP of VCs from the fusion line to the top surface are presented in Figures 65-67.
The volume fraction of VCs was different nearby the fusion line, in the core, and at the top surface. Nearby the fusion line the volume fraction of VCs was approximately 3 vol.-% lower when compared to the core of the bead. The volume fraction and the mean size of VCs increase, when the distance from the fusion line increases. The volume fraction of VCs and the MFP were constant in the core of the deposit. The effect of the dilution was the highest at 0,5 mm distance from the fusion line. The minimum and the maximum penetrations were 0,2 and 1,3 mm, respectively. Therefore, low volume fraction and small-sized carbides can be found from the area, which has been originally the base material.

102
Figure 65 Volume fraction of VCs as a function of distance from the fusion line
Figure 66 Mean size of VCs as a function of distance from the fusion line

103
Figure 67 MFP as a function of distance from the fusion line
6.6 Scanning electron microscopy
6.6.1 Welding parameters A-C
In Figures 68a-g are presented the microstructures of the 12V-1 tool steel deposits welded with welding parameters A-C. In Table 17 are presented the volume fractions, the mean sizes, and the MFPs of VCs. In Figures 69 and 70 are presented the cumulative volumes of the sizes and the MFPs of VCs measured from Figures 68a-g. The sizes of VCs were below 5-10 m for similar kinds of tool steel alloys according to Teupke (2002).
In Figures 68a, b and 68c, d are presented the microstructures of the deposits welded with welding parameters A. The microstructures are relatively homogeneous and most of the VCs are round-shaped. The microstructures contain 20-40 % of carbides, the sizes of which are less than 1 m, Figure 69.
In Figure 68e is presented the microstructure of the deposit welded with welding parameters B, 120 A. Transversal welding speed was 15 mm/s. When the microstructure presented in Figure 68e is compared to the microstructures presented in Figures 68a-d, the VCs are more needle-shaped. The microstructure of the deposit welded with welding parameters B, 120 A contains 70 % of carbides, the sizes of which are less than 1 m, Figure 69.
In Figure 68f is presented the microstructure of the deposit welded with welding parameters B, transversal welding speed 25 mm/s. The microstructure contains only 3

% of carbides, the sizes of the microstructure contains
In Figure 68g is presentedparameters C. The microstneedle-shaped carbides. TheVCs is relatively high, 17,5
Table 17 Volume fractiwith welding p
Material A, test 4, bead 2 A, test 6, bead 2 B, 120 A, bead 1 B, RT, 1,6 mm
C
104
of which are above 1,5 m. In the deposit B, 1ns 20 % of carbides, the sizes of which are abov
ted the microstructure of the deposit weldedostructure contains larger round-shaped carbidhe microstructure is not homogeneous. The vo,5 vol.-%. The plasma arc was on the molten po
ctions, mean sizes, and MFPs of VCs of the g parameters A-C
Volume fraction [vol.-%]
Mean size / s.d.[ m]
15,5 1,2 / 0,5 15,7 1,4 / 0,5 13,4 1,0 / 0,5 12,2 0,8 / 0,3 17,5 1,8 / 1,0
, 120 A, 15 mm/s ove 1,5 m.
ded with welding bides and smaller volume fraction of pool.
e deposits welded
MFP / s.d. [ m]
1,4 / 0,8 1,5 / 1,0 1,4 / 0,8 1,4 / 0,9 2,2 / 1,3

Figure 68 MicrostructureA-C: a, b) A, tB, RT, 1,6 mm
Figure 69 Cumulative voparameters A-
105
ures of the tool steel deposits welded with wel, test 4, bead 2, c, d) A, test 6, bead 2, e) B, 1m, and g) C
volumes of VC sizes of the deposits welde-C
elding parameters, 120 A, bead 1, f)
lded with welding

106
Figure 70 Cumulative volumes of MFPs of the deposits welded with welding parameters A-C
6.6.2 Welding parameters D-F
In Figures 71a-i are presented the microstructures of the 12V-1 tool steel deposits welded with welding parameters D-F and the 15V-1 tool steel deposit welded with welding parameters D. In Table 18 are presented the volume fractions, the mean sizes, and the MFPs of VCs. In Figures 72 and 73 are presented the cumulative volumes of the sizes and the MFPs of VCs measured from Figures 71a, d, e, g-i.
The microstructures are close to equal in the deposits, the microstructures of which are presented in Figures 71 a, d, e, g. The deposits were welded with welding parameters D-F. The volume fractions, the mean sizes, and the MFPs of VCs are quite the same in these deposits. The microstructures are not homogeneous. Both large, 1,5-2,5 m, as well as small, 0,2-0,5 m, sized carbides present. 3-5 % amount of hydrogen in the carrier gas had a decreasing effect on the mean size of VCs and the MFP and an increasing effect on the volume fraction of VCs.
In the deposits welded with welding parameters D with increasing welding speed the volume fraction of VCs decreased. The mean size of VCs and the MFP increased with increasing welding speed. The VCs were more round-shaped, when the plasma arc distance from the molten pool increased.
The location of the plasma arc was slightly on top of the molten pool and plasma arc current was 65 A for the 5,0 mm thick deposit welded with welding parameters D. The location of the plasma arc was in the edge of the molten pool and plasma arc current was 75 A for the 2,9 mm thick deposit. The biggest difference was the mean size of

VCs, which was increased fmoved slightly on the molte
The deposits, which were warc current. The melting ewere lower. The microstrucpreheating.
15V-1 tool steel was a referwelding parameters D. In deposit. In Table 18 is preVCs of the 15V-1 tool stcontains 2,5-3,8 m sized lacarbides. In the deposit D, deposit D, 15V-1, RT, 2,9 m
Table 18 Volume fractiwelded with w
Material D, RT, 2,9 mm, 1,35D, RT, 2,8 mm, 1,42D, RT, 2,7 mm, 1,49
D, PH, 2,2 mmE, RT, 2,5 mmF, RT, 2,4 mmD, RT, 5,0 mm
D, 15V-1, RT, 2,9
107
d from 0,5 to 1,3 m, when the location of thelten pool by increasing powder feed rate.
welded with welding parameters D, PH, had efficiency decreased also, thus, thicknesses
ructures are basically similar as in the deposits
ference material. The 15V-1 tool steel deposit wIn Figure 71i is presented the microstructureresented the volume fraction, the mean size, a
steel deposit (second weld bead layer). Thed large carbides and clusters, as well as small, 0
, RT, 5,0 mm the mean size of VCs was big9 mm, Table 18 and Figure 72.
ctions, mean sizes, and MFPs of VCs of the to welding parameters D-F
Volume fraction [vol.-%]
Mean size / s.d. [ m]
,35 mm/s 14,6 0,5 / 0,3 ,42 mm/s 13,0 0,8 / 0,6 ,49 mm/s 12,5 0,9 / 0,5
m 14,3 0,5 / 0,4 m 15,0 0,5 / 0,4 m 16,0 0,5 / 0,3 m 16,9 1,3 / 0,7
,9 mm 20,3 1,0 / 0,9
he plasma arc was
ad reduced plasma of the deposits
s welded without
it was welded with ure of the 15V-1
e, and the MFP of he microstructure
l, 0,2-0,5 m sized bigger than in the
tool steel deposits
MFP / s.d. [ m]
0,8 / 0,5 1,1 / 0,7 1,5 / 1,0 0,7 / 0,4 0,6 / 0,3 0,7 / 0,5 1,7 / 1,3 1,1 / 0,8
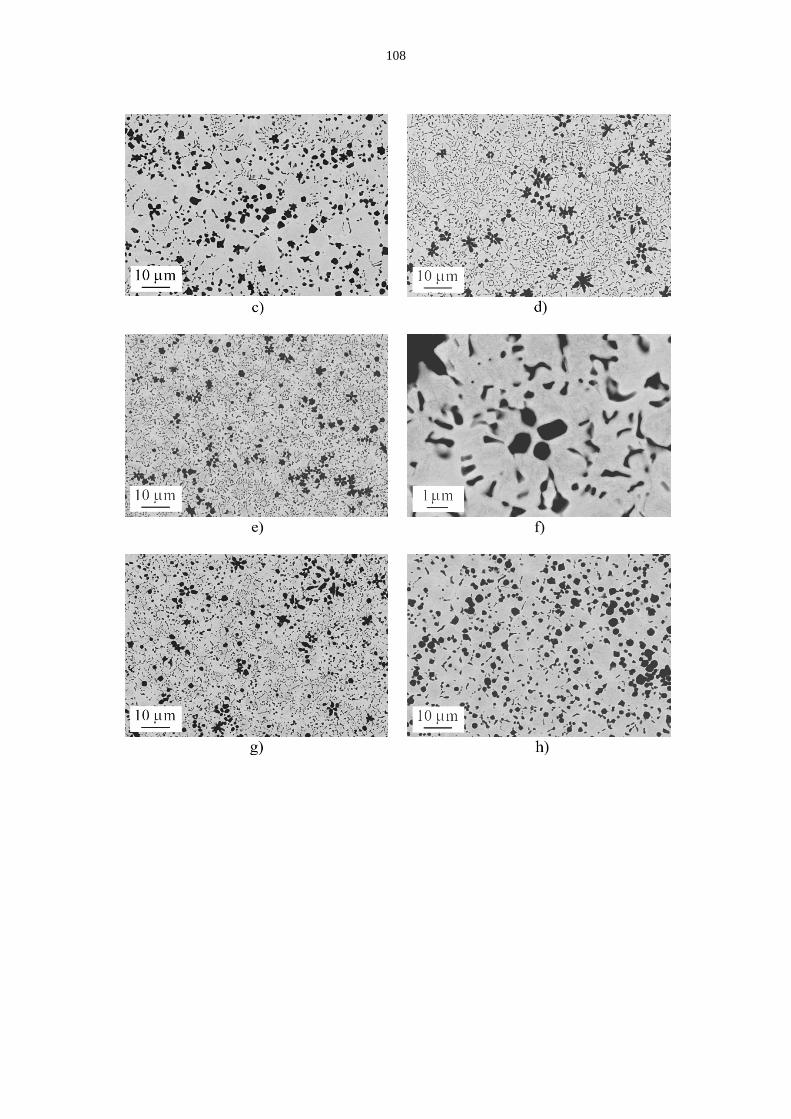
108

Figure 71 MicrostructureD-F: a) D, RTRT, 2,7 mm, 12,4 mm, h) D,
Figure 72 Cumulative voparameters D-
109
ures of the tool steel deposits welded with welRT, 2,9 mm, 1,35 mm/s, b) D, RT, 2,8 mm, 1, 1,49 mm/s, d) D, PH, 2,2 mm, e, f) E, RT, 2,5
D, PH, 5,0 mm, and i) D, 15V-1, RT, 2,9 mm
volumes of VC sizes of the deposits welde-F
elding parameters , 1,42 mm/s, c) D, 2,5 mm, g) F, RT,
lded with welding

110
Figure 73 Cumulative volumes of MFPs of the deposits welded with welding parameters D-F
6.6.3 Welding parameters G
One deposit was welded with straight weld beads without oscillation. In Figures 74a, b is presented the microstructure of the deposit. In Table 19 is presented the volume fraction, the mean size, and the MFP of VCs. The volume fraction, the mean size, and the MFP of VCs are similar as in the microstructures of the deposits welded with welding parameters D-F. The microstructure is not homogeneous. The microstructure contains both large, 2,5 m sized round-shaped, as well as small, 0,2-0,5 m, sized needle-shaped carbides, Figures 74a, b and 75.
Table 19 Volume fraction, mean size, and MFP of VCs of the deposit welded with welding parameters G
Material
Volume fraction [vol.-%]
Mean size / s.d. [ m]
MFP / s.d. [ m]
G, RT, 1,2 mm 14,5 0,7 / 0,6 0,8 / 0,6

Figure 74 a, b) Microstru
Figure 75 Cumulative vowelding param
6.6.4 Materials manufactu
In Figures 76a-d are presenpresented the volume fractio78 are presented the cumulfrom Figures 76a-d.
The distribution of VCs ifractions of VCs of the 12Vtool steel has slightly lowerquite close to each other. Tother materials, Table 20 an
111
tructure of the deposit welded with welding par
volumes of VC sizes and MFPs of the depoameters G
ctured by the HIP process
ented the microstructures of the HIP materials.ctions, the mean sizes, and the MFPs of VCs. Inulative volumes of the sizes and the MFPs of
is relatively homogeneous in every materia2V-1 and the 12V-2 tool steels are close to 18 ver volume fraction of VCs. The mean sizes of The mean size of VCs is bigger in the 10V tooand Figure 76d.
parameters G
posit welded with
ls. In Table 20 are . In Figures 77 and of VCs measured
erial. The volume 8 vol.-%. The 10V of the carbides are tool steel as in the

Table 20 Volume fractiomanufactured
Material HIP, 12V-1 HIP, 12V-2 HIP, 15V-2 HIP, 10V
Figure 76 Microstructure10V tool steel
112
ctions, mean sizes, and MFPs of VCs of the tooed by the HIP method
Volume fraction [vol.-%]
Mean size / s.d. [ m]
18,0 0,8 / 0,2 18,3 0,9 / 0,3 20,6 0,9 / 0,3 14,7 1,1 / 0,4
ures of the HIP materials: a) 12V-1, b) 12V-2, el
tool steel materials
MFP / s.d. [ m]
1,0 / 0,5 1,0 / 0,6 0,8 / 0,4 1,3 / 0,8
2, c) 15V-2, and d)

113
Figure 77 Cumulative volumes of VC sizes of the tool steel materials manufactured by the HIP method
Figure 78 Cumulative volumes of MFPs of the tool steel materials manufactured by the HIP method

114
6.6.5 Microstructure of overlapping beads
In Figures 79a-c are presented the microstructures of the weld beads welded with welding parameters B by overlapping. Plasma arc current was 120 A. The dilution of the whole deposit was 11,3 %. In Table 21 are presented the volume fractions, the mean sizes, and the MFPs of VCs. In Figures 80 and 81 are presented the cumulative volumes of the sizes and the MFPs of VCs measured from Figures 79a-c.
The microstructures of the first and the third beads are close to each other. The microstructure of the first bead has more round-shaped carbides as the microstructures of the second and the third beads have. The microstructure of the second bead contains smaller and more needle-shaped VCs as the microstructures of the first and the third beads have. The displacement of the plasma torch was made manually. Small variations in the overlapping displacement may occur, but the effects on the microstructure are not possible to analyze from small amount of samples.
Table 21 Volume fractions, mean sizes, and MFPs of VCs of the weld beads welded with welding parameters B, 120 A
Material
Volume fraction [vol.-%]
Mean size / s.d. [ m]
MFP / s.d. [ m]
B, 120 A, bead 1 13,4 1,1 / 0,5 1,4 / 0,8 B, 120 A, bead 2 14,4 0,8 / 0,5 1,1 / 0,7 B, 120 A, bead 3 14,4 1,2 / 0,7 1,8 / 1,2

115
Figure 79 Microstructures of the 12V-1 tool steel weld beads welded with welding parameters B, 120 A: a) first bead, b) second overlapping weld bead, and c) third overlapping weld bead
Figure 80 Cumulative volumes of VC sizes of the weld beads welded with welding parameters B, 120 A by overlapping

116
Figure 81 Cumulative volumes of MFPs of the weld beads welded with welding parameters B, 120 A by overlapping
In Figures 82a-h are presented the microstructures of the weld beads welded with welding parameters D by overlapping. Powder feed rate was 0,3 kg/h. In Table 22 are presented the volume fractions, the mean sizes, and the MFPs of VCs. In Figures 83 and 84 are presented the cumulative volumes of the sizes and the MFPs of VCs measured from Figures 82a, c, e, g. The deposit is the same as was presented in Table 13.
The biggest difference in the carbide morphology is between the microstructures of the first and the second beads. In the first bead the carbides are mainly round-shaped. The microstructures of the weld beads 2, 5, and 12 contain also needle-shaped VCs. The volume fraction of VCs increased when the surfacing process continued. The MFPs of the weld beads 1 and 2 are different. The second bead contains a lot of small carbides. The weld beads 1, 5 and 2, 12 have similar kinds of cumulative volume carbide size distributions, Figure 83.
Table 22 Volume fractions, mean sizes, and MFPs of VCs of the deposit welded with welding parameters D and powder feed rate 0,3 kg/h
Material
Volume fraction [vol.-%]
Mean size / s.d. [ m]
MFP / s.d. [ m]
D, RT, 1,0 mm, bead 1 12,6 0,6 / 0,2 1,2 / 0,9 D, RT, 1,0 mm, bead 2 13,6 0,5 / 0,3 0,6 / 0,4 D, RT, 1,0 mm, bead 5 14,8 0,7 / 0,3 0,9 / 0,6 D, RT, 1,0 mm, bead 12 14,1 0,5 / 0,3 1,0 / 0,6

117

Figure 82 Microstructurepowder feed rbead, and g, h
Figure 83 Cumulative vowith welding p
118
ures of the weld beads welded with welding parate 0,3 kg/h: a, b) first bead, c, d) second
, h) last twelfth bead
volumes of VC sizes of the weld beads 1, 2, 5g parameters D and powder feed rate 0,3 kg/h
parameters D andd bead, e, f) fifth
, 5, and 12 welded

119
Figure 84 Cumulative volumes of MFPs of the weld beads 1, 2, 5, and 12 welded with welding parameters D and powder feed rate 0,3 kg/h
6.6.6 Microstructural changes in weld bead in welding direction
In Figures 85a-c are presented the microstructures taken from the second weld bead welded with welding parameters B, 120 A by overlapping. The sample was cut along the centerline and in the welding direction. In Table 23 are presented the volume fractions, the mean sizes, and the MFPs of VCs measured from three locations. In Figure 85a is presented the microstructure of the weld bead approximately 15 mm from the plasma arc ignition point. In Figure 85b is presented the microstructure after 30 mm welding from the plasma arc ignition point. In Figure 85c is presented the microstructure after 50 mm welding from the plasma arc ignition point and about 25 mm from the end of the weld bead. In Figures 86 and 87 are presented the cumulative volumes of the sizes and the MFPs of VCs measured from Figures 85a-c.
The volume fraction of VCs increased from 7,5 to 13,0-14,0 vol.-% during welding a weld bead. The mean size of the carbides increased from 0,6 to 1,2-1,3 m. The MFP remained constant. Therefore, the biggest differences in the microstructure can be obtained after ignition of the plasma arc.

120
Table 23 Volume fractions, mean sizes, and MFPs of VCs of the second weld bead welded with welding parameters B, 120 A
Location
Volume fraction [vol.-%]
Mean size [ m] / s.d.
MFP [ m] / s.d.
Bead beginning 7,5 0,6 / 0,3 1,5 / 1,2 After 30 mm 13,0 1,3 / 0,6 1,6 / 1,2 After 50 mm 14,2 1,2 / 0,6 1,6 / 1,2
Figure 85 Microstructures of the second weld bead welded with welding parameters B, 120 A: a) at the beginning of the bead, b) after 30 mm welding, and c) after 50 mm welding and 25 mm from the end of the bead

121
Figure 86 Cumulative volumes of VC sizes of the second weld bead welded with welding parameters B, 120 A from the bead beginning to the bead end
Figure 87 Cumulative volumes of MFPs of the second weld bead welded with welding parameters B, 120 A from the bead beginning to the bead end

122
6.7 Abrasive wear resistance
6.7.1 Surface roughness
Surface roughness of the deposit welded with welding parameters B, 130 A, PH was measured during the RWAT. Surface roughness of the deposit (Ra) was initially 0,06±0,06 μm. The volume fraction, the mean size, and the MFP of VCs were 13,8 vol.-%, 1,1±0,4 m, and 1,5±0,6 m, respectively. The dilution was 16 %.
Surface roughness of the 12V-1 tool steel deposit increased from the initial state to 0,90±0,08 m during first one hundred rounds of the rubber wheel. Surface roughness 1,60±0,30 m was obtained after 6000 revolutions, Table 24.
Table 24 Surface roughness of the deposit B, 130 A, PH during the RWAT
Wheel revolutions [rev]
Ra / s.d. [ m]
0 0,06 / 0,06 2 0,13 / 0,01
10 0,30 / 0,06 20 0,43 / 0,09 30 0,51 / 0,08 40 0,67 / 0,06 50 0,63 / 0,15 60 0,78 / 0,05 70 0,87 / 0,11 80 0,83 / 0,07 90 0,86 / 0,06
100 0,90 / 0,08 150 0,97 / 0,07 200 1,10 / 0,04 250 0,96 / 0,02 300 1,05 / 0,11 350 1,06 / 0,07 400 1,06 / 0,12 450 1,10 / 0,09 500 1,11 / 0,04 600 1,22 / 0,17 700 1,22 / 0,16 800 1,14 / 0,13 900 1,19 / 0,13
1000 1,23 / 0,18 1500 1,05 / 0,15 3000 1,64 / 0,23 4500 1,53 / 0,36 6000 1,60 / 0,30

123
6.7.2 Applied load
In Figure 88 is presented the effect of applied normal force on the abrasive wear resistance of the deposit welded with welding parameters A. The deposit was welded with welding parameters A, test 2, bead 1. The rubber wheel abrasion tests were made with the same sample, i.e., the sample was ground after each test and was tested again.
The normal force was increased step by step from 126 to 174 N. The volume loss of the tested deposit increased linearly with the increasing normal force from 126 to 150 N. This is in accordance with the Archard’s law presented in equation 33 (Archard, 1953). With higher normal forces from 150 to 174 N the volume loss decreased. Thus, low stress abrasive wear test can be arranged below normal force 150 N and high stress abrasive wear test above it. Normal force 126 N was used to characterize the abrasive wear resistance of the studied materials.
Figure 88 Effect of normal force in the RWAT on volume loss of the deposit welded with welding parameters A, test 2, bead 1
6.7.3 Dilution
The abrasive wear resistances of the weld beads welded with welding parameters A, B, and C are compared in Figure 89 and Tables 25-27. In Figure 89 and Table 26 are presented also the effect of rubber wheel rotating speeds 105 and 200 rpm on the abrasive wear resistances of the weld beads welded with welding parameters B.
In the RWAT the volume losses of the weld beads welded with welding parameters A were higher in the first beads of the deposits 4 and 6. The abrasive wear resistances of

124
the first beads of the deposits 1, 2, 3, and 5 were higher when compared to the abrasive wear resistances of the second beads.
The effect of the dilution on the abrasive wear resistance is not clear. In Table 25 the dilutions of the deposits 2, 3, 4, and 5, decreased when the welding process proceeded. The volume losses were in the deposits 1, 2, 3, and 5 slightly higher in the second weld beads. In the deposit 4 both the volume loss and the dilution were higher in the first bead. Also in the deposits 1 and 6 the interaction between the dilution and the abrasive wear resistance remain unclear.
In the deposits welded with welding parameters B the volume loss was higher with lower sliding speed. The difference was approximately two times. The more diluted deposits had lowering abrasive wear resistance in the RWAT, when the rotating speed was 105 rpm. The abrasive wear resistance of the more diluted deposits remained almost at the same level, when the rotating speed was 200 rpm.
The abrasive wear resistances of the deposits welded with welding parameters B were mainly lower in the third beads, Table 26. In the deposits welded with plasma arc currents 130 and 140 A the dilutions were lower in the third beads, even though the volume losses were mainly higher. The dilution had no clear relationship with the abrasive wear resistance.
The location of the plasma arc was on the molten pool, when the weld bead was welded with welding parameters C. The dilution was low, Table 27. Welding defects like small pores or lack of fusion were obtained. The abrasive wear resistance was approximately two times lower when compared to the deposits welded with welding parameters A, test 4 and A, test 6.
Table 25 Dilutions and volume losses of the deposits welded with welding parameters A
WeldingTest [No.]
Dilution Bead 1 / 2
[%]
Volume loss Bead 1 / 2
[mm3] 1 18,7 / 19,0 37,4 / 44,1 2 26,3 / 12,7 39,1 / 47,4 3 17,8 / 15,6 30,1 / 35,8 4 16,3 / 11,8 29,2 / 20,4 5 11,9 / 7,2 27,6 / 31,8 6 5,9 / 6,0 26,1 / 23,9

125
Table 26 Dilutions and volume losses of the deposits welded with welding parameters B
Plasma arc current
[A]
Dilution Bead 1 / 3
[%]
Volume loss Bead 1 / 3 105 rpm [mm3]
Volume loss Bead 1 / 3 200 rpm [mm3]
110 A 5,1 / 5,1 54,7 / 61,1 34,1 / 36,5 120 A 7,9 / 12,9 65,5 / 51,9 33,8 / 31,6 130 A 22,0 / 10,6 66,9 / 61,8 38,4 / 42,0 140 A 26,5 / 24,5 79,1 / 92,8 36,1 / 43,9
Table 27 Dilution and volume loss of the deposit welded with welding parameters C
Plasma arc current
[A] Dilution
[%] Volume loss
[mm3] 175 A 0,5 50,0
Figure 89 Volume losses of the deposits welded with welding parameters A-C plotted as a function of dilutions of the weld beads
The volume losses of the deposits welded with welding parameters D-G was plotted as a function of dilution, Figure 90. The best abrasive wear resistance was obtained with the 5,0 mm thick weld bead welded with welding parameters D. The location of the plasma arc was then slightly on the molten pool. The abrasive wear resistance was at the same level as in the 12V-1 tool steel material manufactured by the HIP process.

126
The deposits welded with welding parameters D, PH, 2,2 mm had relatively low abrasion wear resistance. The location of the plasma arc was in the edge of the molten pool. The abrasive wear resistance of the deposits welded with welding parameters D decreased rapidly when the dilution increased.
The abrasive wear resistances of the deposits welded with Ar-H2 gas mixtures, i.e., welding parameters E-F, were equal. The abrasive wear resistance was lower than in the deposits welded with welding parameters D with optimized dilution. Because of the problems in the dilution control, when welding with welding parameters D, the abrasive wear resistance may be better maintained with welding parameters E and F.
Figure 90 Volume losses of the deposits welded with welding parameters D-G plotted as a function of dilutions of the deposits
6.7.4 Hardness
Hardness of the deposit is one parameter, which estimates abrasive wear resistance of the deposit. No straight relationship between abrasive wear resistance and hardness was obtained. It is difficult to estimate the abrasive wear resistance of the 12V-1 tool steel deposit as a function of hardness, even though the deposits welded with the same welding parameters are compared. Hardness of the 12V-1 tool steel deposits varied between 803 and 861 HV10 depending on the welding parameters, Table 28 and Figure 91. Average hardness of the deposits welded with welding parameters A-G and the tool steel materials manufactured by the HIP process are presented in Table 28.

127
Table 28 Hardnesses and volume losses of the deposits welded with welding parameters A-G and the tool steel materials manufactured by the HIP process
Material Hardness / s.d. [HV10]
Volume loss / s.d. [mm3]
A, test 4, bead 2 803 / 29 20,4 / - A, test 6, bead 2 828 / 32 23,9 / - B, 120 A, bead 1 854 / 14 33,8 / -
C 861 / 22 50,0 / - D, RT, 2,9 mm 815 / 22 35,3 / - D, PH, 2,2 mm 841 / 21 68,9 / - D, PH, 5,0 mm 810 / 27 30,8 / -
D, 15V-1, RT, 2,9 mm 803 / 29 41,9 / - E, RT, 2,5 mm 808 / 23 57,3 / - F, RT, 2,4 mm 845 / 20 57,7 / - G, RT, 1,2 mm 857 / 18 78,0 / -
HIP, 12V-1 755 / 4 29,9 / 3,8 HIP, 12V-2 803 / 3 28,3 / 0,8 HIP, 15V-2 796 / 7 21,9 / 0,9 HIP, 10V 734 / 5 30,0 / 2,6
Figure 91 Volume losses of the tool steel deposits welded with welding parameters A-G and the tool steel materials manufactured by the HIP process as a function of hardness

128
6.7.5 Mean size of vanadium carbides
In Figure 92 and Table 29 are presented the effect of the mean size of VCs on the abrasive wear resistance of the tool steel deposits welded with welding parameters A-G and the tool steel materials manufactured by the HIP method. The abrasive wear resistance mainly increases, when the mean size of VC carbides increases. The maximum mean size of VC carbides of the deposits welded with parameters D was 1,3 μm. The maximum abrasive wear resistance was obtained with welding parameters A, when the mean size of VCs was from 1,2 to 1,4 μm. The tool steel materials manufactured by the HIP process had the mean size of VCs from 0,8 to 1,1 m. The abrasive wear resistances of the HIP materials were better than that of the abrasive wear resistances of the deposits which had the mean size of VCs in the same range.
Table 29 Mean sizes of VCs and volume losses of the tool steel deposits welded with welding parameters A-G and the tool steel materials manufactured by the HIP process
Material Mean size / s.d.
[ m] Volume loss / s.d
[mm3] A, test 4, bead 2 1,2 / 0,5 20,4 / - A, test 6, bead 2 1,4 / 0,5 23,9 / - B, 120 A, bead 1 1,0 / 0,5 33,8 / -
C 1,8 / 1,0 50,0 / - D, RT, 2,9 mm 0,5 / 0,3 35,3 / - D, PH, 2,2 mm 0,5 / 0,4 68,9 / - D, PH, 5,0 mm 1,3 / 0,7 30,8 / -
D, 15V-1, RT, 2,9 mm 1,0 / 0,9 41,9 / - E, RT, 2,5 mm 0,5 / 0,4 57,3 / - F, RT, 2,4 mm 0,5 / 0,3 57,7 / - G, RT, 1,2 mm 0,7 / 0,6 78,0 / -
HIP, 12V-1 0,8 / 0,2 29,9 / 3,8 HIP, 12V-2 0,9 / 0,3 28,3 / 0,8 HIP, 15V-2 0,9 / 0,3 21,9 / 0,9 HIP, 10V 1,1 / 0,4 30,0 / 2,6

129
Figure 92 Volume losses of the tool steel deposits welded with welding parameters A-G and the tool steel materials manufactured by the HIP process plotted as a function of mean size of VC
6.7.6 Carbide morphology
In Table 30 and Figure 93 are presented width to height ratios of VCs of the PTA welded deposits and the materials manufactured by the HIP process. The PTA welded deposit welded with welding parameters A, test 6, bead 2 had the shape ratio of 0,83. The shape ratios of the PTA welded deposits varied between 0,66-0,83. The 15V-1 tool steel deposit had the lowest shape ratio, 0,66. The most round-shaped carbides were obtained with the tool steel materials HIP 12V-1 and HIP 12V-2, 0,86 and 0,85, respectively. The tool steel materials HIP 15V-2 and HIP 10V had the shape ratios of 0,83. The best abrasive wear resistance was obtained with the samples having the best shape ratio.
The carbides shape ratios of the weld beads 1, 2, 5, and 12 of the 1,0 mm thick deposit welded with welding parameters D were 0,78, 0,78, 0,73, and 0,75, respectively. The carbides shape ratios of the weld beads 1-3 welded with welding parameters B were 0,75, 0,71, and 0,74, respectively. Thus, the carbides shape ratios seem to decrease due to overlapping in the deposits welded with welding parameters B and D.
The carbides shape ratios of the weld beads 1 and 5 welded with welding parameters E and F were 0,74, 0,77 and 0,77, 0,80, respectively. Thus, the carbides shape ratios of the deposits welded with welding parameters E and F seem to increase during the surfacing procedure.

130
Table 30 VCs shape ratios and volume losses of the tool steel deposits welded with welding parameters A-G and the tool steel materials manufactured by the HIP process
Material Carbides shape ratio / s.d. / median
Volume loss / s.d.[mm3]
A, test 4, bead 2 0,75 / 0,20 / 0,79 20,4 / - A, test 6, bead 2 0,83 / 0,18 / 0,88 23,9 / - B, 120 A, bead 1 0,75 / 0,22 / 0,80 33,8 / - B, 120 A, bead 2 0,71 / 0,24 / 0,72 - B, 120 A, bead 3 0,74 / 0,22 / 0,78 31,6 / -
C 0,68 / 0,22 / 0,71 50,0 / - D, RT, 2,9 mm 0,74 / 0,24 / 0,79 35,3 / -
D, RT, 2,9 mm, bead 1 0,77 / 0,23 / 0,83 - D, RT, 2,9 mm, bead 5 0,71 / 0,24 / 0,74 -
D, RT, 1,42 mm/s, 2,8 mm 0,69 / 0,25 / 0,73 - D, RT, 1,49 mm/s, 2,7 mm 0,76 / 0,22 / 0,82 -
D, PH, 2,2 mm 0,70 / 0,26 / 0,75 68,9 / - D, PH, 5,0 mm 0,74 / 0,21 / 0,80 30,8 / -
D, 15V-1, RT, 2,9 mm 0,66 / 0,26 / 0,70 41,9 / - D, RT, 1,0 mm, bead 1 0,78 / 0,20 / 0,82 - D, RT, 1,0 mm, bead 2 0,78 / 0,22 / 0,85 - D, RT, 1,0 mm, bead 5 0,73 / 0,23 / 0,80 -
D, RT, 1,0 mm, bead 12 0,75 / 0,22 / 0,81 - E, RT, 2,5 mm 0,75 / 0,24 / 0,81 57,3 / -
E, RT, 2,5 mm, bead 1 0,74 / 0,25 / 0,80 - E, RT, 2,5 mm, bead 5 0,77 / 0,23 / 0,83 -
F, RT, 2,4 mm 0,78 / 0,23 / 0,86 57,7 / - F, RT, 2,4 mm, bead 1 0,77 / 0,23 / 0,85 - F, RT, 2,4 mm, bead 5 0,80 / 0,22 / 0,87 -
G, RT, 1,2 mm 0,70 / 0,25 / 0,74 78,0 / - HIP, 12V-1 0,86 / 0,17 / 0,92 29,9 / 3,8 HIP, 12V-2 0,85 / 0,17 / 0,91 28,3 / 0,8 HIP, 15V-2 0,83 / 0,18 / 0,90 21,9 / 0,9 HIP, 10V 0,83 / 0,17 / 0,88 30,0 / 2,6

131
Figure 93 Volume losses of the tool steel deposits welded with welding parameters A-G and the tool steel materials manufactured by the HIP method as a function of carbides width to height ratio
6.7.7 Mean free path
The MFPs of the 12V-1 tool steel deposits were between 0,6-2,2 μm, Table 31 and Figure 94. The lower limit of the abrasive was about 100 m. Thus, the whole abrasive is not able to degrade the matrix material between the VCs. The best abrasive wear resistance was obtained, when the MFP was 1,5 m. The sample was welded with welding parameters A. The MFPs of the tool steel materials manufactured by the HIP process were between 0,8-1,3 m.

132
Table 31 MFPs and volume losses of the tool steel deposits welded with welding parameters A-G and the tool steel materials manufactured by the HIP process
Material MFP / s.d.
[ m] Volume loss / s.d.
[mm3] A, test 4, bead 2 1,4 / 0,8 20,4 / - A, test 6, bead 2 1,5 / 1,0 23,9 / - B, 120 A, bead 1 1,4 / 0,8 33,8 / -
C 2,2 / 1,3 50,0 / - D, RT, 2,9 mm 0,8 / 0,5 35,3 / - D, PH, 2,2 mm 0,7 / 0,4 68,9 / - D, PH, 5,0 mm 1,7 / 1,3 30,8 / -
D, 15V-1, RT, 2,9 mm 1,1 / 0,8 41,9 / - E, RT, 2,5 mm 0,6 / 0,3 57,3 / - F, RT, 2,4 mm 0,7 / 0,5 57,7 / - G, RT, 1,2 mm 0,8 / 0,6 78,0 / -
HIP, 12V-1 1,0 / 0,5 29,9 / 3,8 HIP, 12V-2 1,0 / 0,6 28,3 / 0,8 HIP, 15V-2 0,8 / 0,4 21,9 / 0,9 HIP, 10V 1,3 / 0,8 30,0 / 2,6
Figure 94 Volume losses of the tool steel deposits welded with welding parameters A-G and the tool steel materials manufactured by the HIP process plotted as a function of MFP

133
6.7.8 Volume fraction of vanadium carbides
In Figure 95 is presented the effect of the volume fraction of VCs on the abrasive wear resistance. The highest volume fraction of VCs of the 12V-1 tool steel material was obtained with the 12V-1 tool steel material manufactured by the HIP process, 18,0 vol.-%. The volume fraction of VCs of the HIP material containing 11,5 % vanadium has been earlier measured to be 18,2 (Kivikytö-Reponen, 2006) and 20,0 vol.-% (Ala-Kleme et al., 2007).
The best abrasive wear resistance was in the deposits welded with welding parameters A. The volume fraction was then between 15,5-15,7 vol.-%. In the 12V-1 tool steel deposit welded by the PTA method the volume fraction of VCs was between 12,2 and 17,5 vol.-%, Tables 17 and 32. Thus, the welding parameters have a remarkable effect on the microstructure and the abrasive wear resistance.
Table 32 Volume fractions of VCs and volume losses of the tool steel deposits welded with welding parameters A-G and the tool steel materials manufactured by the HIP process
Material Volume fraction / s.d.
[vol.-%] Volume loss / s.d.
[mm3] A, test 4, bead 2 15,5 / 2,1 20,4 / - A, test 6, bead 2 15,7 / 2,8 23,9 / - B, 120 A, bead 1 13,4 / 1,7 33,8 / -
C 17,5 / 5,5 50,0 / - D, RT, 2,9 mm 14,6 / 2,0 35,3 / - D, PH, 2,2 mm 14,3 / 1,7 68,9 / - D, PH, 5,0 mm 16,9 / 1,7 30,8 / -
D, 15V-1, RT, 2,9 mm 20,3 / 3,7 41,9 / - E, RT, 2,5 mm 15,0 / 2,3 57,3 / - F, RT, 2,4 mm 16,0 / 2,4 57,7 / - G, RT, 1,2 mm 14,5 / 1,6 78,0 / -
HIP, 12V-1 18,0 / 0,8 29,9 / 3,8 HIP, 12V-2 18,3 / 1,3 28,3 / 0,8 HIP, 15V-2 20,6 / 0,7 21,9 / 0,9 HIP, 10V 14,7 / 1,2 30,0 / 2,6
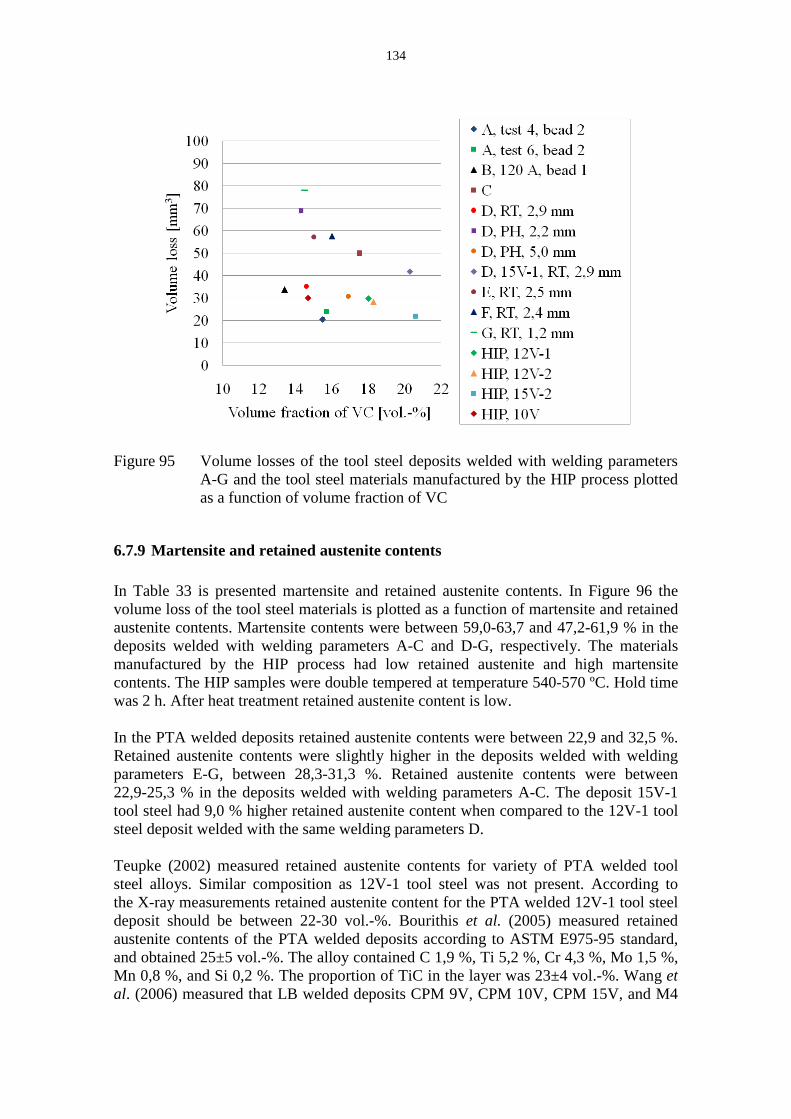
134
Figure 95 Volume losses of the tool steel deposits welded with welding parameters A-G and the tool steel materials manufactured by the HIP process plotted as a function of volume fraction of VC
6.7.9 Martensite and retained austenite contents
In Table 33 is presented martensite and retained austenite contents. In Figure 96 the volume loss of the tool steel materials is plotted as a function of martensite and retained austenite contents. Martensite contents were between 59,0-63,7 and 47,2-61,9 % in the deposits welded with welding parameters A-C and D-G, respectively. The materials manufactured by the HIP process had low retained austenite and high martensite contents. The HIP samples were double tempered at temperature 540-570 ºC. Hold time was 2 h. After heat treatment retained austenite content is low.
In the PTA welded deposits retained austenite contents were between 22,9 and 32,5 %. Retained austenite contents were slightly higher in the deposits welded with welding parameters E-G, between 28,3-31,3 %. Retained austenite contents were between 22,9-25,3 % in the deposits welded with welding parameters A-C. The deposit 15V-1 tool steel had 9,0 % higher retained austenite content when compared to the 12V-1 tool steel deposit welded with the same welding parameters D.
Teupke (2002) measured retained austenite contents for variety of PTA welded tool steel alloys. Similar composition as 12V-1 tool steel was not present. According to the X-ray measurements retained austenite content for the PTA welded 12V-1 tool steel deposit should be between 22-30 vol.-%. Bourithis et al. (2005) measured retained austenite contents of the PTA welded deposits according to ASTM E975-95 standard, and obtained 25±5 vol.-%. The alloy contained C 1,9 %, Ti 5,2 %, Cr 4,3 %, Mo 1,5 %, Mn 0,8 %, and Si 0,2 %. The proportion of TiC in the layer was 23±4 vol.-%. Wang et al. (2006) measured that LB welded deposits CPM 9V, CPM 10V, CPM 15V, and M4

135
had relative volumetric ratios of retained austenite to martensite of 8,5, 1,3, 1,5, and 0,26 in as-welded condition and 0,2, 0,1, 0,0, and 0,0 after heat treatment at 600 °C, respectively. Xu et al. (2007) measured retained austenite contents based on ferromagnetism for an alloy C 2,98 %, V 9,8 %, Cr 4,25 %, Mo 2,95 %, Si 0,65 %, Mn 0,83 %, S 0,05 %, and P 0,06 % manufactured by casting. After quenching/tempering at temperatures 900/550, 900/600, 950/550, 950/600 ºC retained austenite contents were 6,8, 2,0, 6,0, and 4,3 vol.-%, respectively.
Table 33 Martensite and retained austenite contents of the tool steel deposits welded with welding parameters A-G and the tool steel materials manufactured by the HIP process
Material Martensite / s.d [%]
Retained austenite
[%] A, test 4, bead 2 60,9 / 1,4 23,6 A, test 6, bead 2 59,0 / 0,4 25,3 B, 120 A, bead 1 63,7 / 1,0 22,9
C 59,1 / 1,1 23,4 D, RT, 2,9 mm 61,9 / 4,5 23,5 D, PH, 2,2 mm 57,9 / 1,9 27,8 D, PH, 5,0 mm 54,4 / 5,1 28,7
D, 15V-1, RT, 2,9 mm 47,2 / 3,0 32,5 E, RT, 2,5 mm 53,7 / 2,3 31,3 F, RT, 2,4 mm 54,7 / 4,7 29,3 G, RT, 1,2 mm 57,2 / 4,0 28,3
HIP, 12V-1 78,3 / 2,2 3,7 HIP, 12V-2 74,9 / 5,7 6,8 HIP, 15V-2 75,5 / 1,2 3,9 HIP, 10V 80,2 / 1,8 5,1

136
Figure 96 Volume losses of the tool steel deposits welded with welding parameters A-G and the tool steel materials manufactured by the HIP process as a function of retained austenite and martensite contents
6.8 Wear tracks
6.8.1 Low stress abrasive wear
The wear tracks of the samples welded with welding parameters A, C, and D are presented in Figures 97a-f. In Figures 98a, b is presented the wear track of the tool steel 12V-1 reference sample manufactured by the HIP process. Microcracking of VCs can be seen in every wear track.
The deposit welded with welding parameters A, test 4, bead 2, had the best abrasive wear resistance in the RWAT. In Figures 97a, b can be seen the round-shaped, relatively homogeneously precipitated VC carbides. The volume fraction of VCs in the wear track was approximately 25-30 vol.-%. The matrix metal has worn away and the carbides are slightly above the matrix surface as was presented in Figure 38b. The volume fraction of VCs has increased when compared to the microstructure, Figures 68a, b. Due to abrasive wear the carbides in different depths can be seen, thus, the volume fraction of VCs increases. Some of the VCs were crushed during the RWAT.
The abrasive wear resistance of the deposits welded with welding parameters C and D was quite the same. In Figures 97c, d and 97e, f can be seen bigger and smaller carbides as well as areas where carbides are not present. Thus, these microstructures are not as homogeneous as the microstructures presented in Figures 68a, b and 68c, d. Microcracking of VCs can be seen. The volume fractions of VCs in the wear tracks

were 20-23 vol.-%. Thus, inwere estimated from the mic
Figure 97 Wear tracktest 4, bead
In the reference material, iprocess, the wear track was parameters A, Figures 98a, of VCs was minor. The voluvol.-%, which is approximmicrostructure.
137
in the wear tracks the volume fractions of VCsmicrostructures because of abrasive wear.
cks of the samples welded with welding paramad 2, c, d) C, and e, f) D, RT, 2,9 mm, 73 A
l, i.e., the 12V-1 tool steel material manufactuas similar as the wear track of the deposit welda, b. VCs were relatively homogeneously distriolume fraction of VCs in the wear track was apimately 5 vol.-% higher amount as was estim
Cs were higher as
rameters: a, b) A,
ctured by the HIP lded with welding tributed. Cracking approximately 23 stimated from the

138
Figure 98 a, b) Wear track of the 12V-1 tool steel material manufactured by the HIP process
6.8.2 High stress abrasive wear
In Figures 99a, b is presented the wear track of the deposit welded with welding parameters A, test 2, bead 1. Normal load 174 N was used for testing high stress abrasive wear. Microcutting and microploughing can be seen in the areas where the MFP is high. Rolling of the abrasives was at least partly prevented. In Figure 99b can be seen three wear scars ending to a 3,2 m sized carbide edge. Thus, normal load has been high enough to crush abrasives. Also a lot of crushed VCs were observed on the wear track.
Figure 99 Wear track of the 12V-1 tool steel deposit welded with welding parameters A, test 2, bead 1, and abraded with load 174 N in the RWAT: a) an overview and b) three wear scars ending to the edge of the crushed 3,2 m sized vanadium carbide

139
7 Discussion
7.1 PTA equipment
In this study the deposits were surfaced by the mechanized and the robotized PTA welding units. The number of welding parameters is high in the PTA process. In mass production the surfacing process has to be very stable. The effect of each welding parameter and their interactions has to be known.
The wear resistant welded deposits are normally 1-6 mm thick. The weldability of the 12V-1 tool steel powder was good. Surfaces of the deposits were relatively even. Thickness range 2-4 mm for the 12V-1 tool steel deposits is easy to weld by the PTA method. Thickness range 4,5-6,0 mm for the 12V-1 tool steel deposit is challenging. Problems in the dilution control and, thus, welding defects may occur in the fusion line because of the large size of the molten pool.
Basically the dilution was easier to control, when the robotized PTA unit was used, because reproducibility of the process was much better. Overlapping movement was made manually with the mechanized unit, which is time consuming process. Programming of the robot takes time. Both the mechanized and the robotized welding units were suitable for the PTA process.
7.2 Dilution
7.2.1 Temperature of work piece
Preheating was used with welding parameters A, B, and D. The work pieces were preheated by the acetylene torch. The preheated work pieces were surfaced by 2-5 overlapping weld beads. One reason for inaccuracy in the dilutions of the deposits was the change in the temperature of the work piece during the welding process. Because of the mechanized welding unit, the plasma torch was displaced manually between the weld beads during the PTA welding process. This procedure took from 2 to 4 min. During this waiting time the temperature of the work piece decreased. With welding parameters D the deposits were welded by the robotized welding unit. Thus, the welding process was continuous and no decreasing temperature of the work piece was obtained.
The preheating temperatures for welding parameters A were 200 or 300 °C. Two overlapping weld beads were welded and no remarkable decreasing temperature was detected. At temperatures 200-300 °C the temperature of the work piece may decrease 20-50 °C while displacing the plasma torch. The effect of the temperature change of the work piece on the dilution was 1 % / 30 °C in the 4 mm thick deposits (Hunt, 1988; Sharples, 1985).

140
The temperature change was the biggest for the deposits welded with welding parameters B, because of high preheating temperature, 450 °C. The work piece was preheated to 570 °C, but the temperature decreased to 450 °C while welding the first bead. The temperatures of the work pieces welded with welding parameters B were on average 370-450 °C after the third bead was welded. The effect of the temperature change of the work piece on the dilution was 1 % / 30 °C in the 4 mm thick deposits and 2 % / 30 °C in the 2 mm thick deposits (Hunt, 1988; Sharples, 1985). In according to theory, the dilutions of the second and third weld beads welded with welding parameters B can be decreased approximately 2 % per each bead due to temperature changes of the work pieces.
7.2.2 Plasma arc current
The dilution of the deposit is the easiest to adjust by plasma arc current. In Table 13 was presented used plasma arc currents and the dilutions of the welded beads. The temperature of the work piece increased from RT to 250 ºC, while plasma arc current was reduced from 74 to 58 A. The dilution control is challenging, because the welding operator has to adjust plasma arc current during the welding process. Without any auxiliary equipment like optical emission spectrometer, the adjustment can be made only by experience of the welding operator.
Preheating for the 12V-1 tool steel powder is not necessary to avoid cracking of the deposit. It is possible to preheat the deposit to 250-300 °C temperature, which is typical temperature of the work piece during the PTA welding process. Typical operating temperature for the middle-sized application is on average 288 ºC (Kapus, 1980). Thus, need to adjust plasma arc current during the welding process is minor, if suitable preheating temperature is used. Therefore, preheating makes it easier to control the dilution. The PTA process is then stable, powder fraction can be more precisely tailored for used heat input and the consumable efficiency can be optimized. Then, the PTA process is economical.
7.2.3 Powder feed rate
In Table 13 was presented thicknesses of the weld beads. Because plasma arc current had to be reduced for getting the optimal dilution, the reduced heat input was not enough to melt the larger particle fractions. Therefore, thicknesses of the weld beads were reduced when plasma arc current was decreased. The decreasing size of the molten pool changes the location of the plasma arc in relation with the molten pool. This effect has an effect on the dilution, because the plasma arc heats then more the base material.
The powder fraction was the same in all welding tests, even though welding parameters changed a little. By increasing powder feed rate the decreasing consumable efficiency can be controlled. If powder feed rate is varied also plasma arc current has to be adjusted for melting the increased amount of powder. However, in the mass production the powder fraction is optimized with plasma arc current and heat input to maximize the consumable efficiency.

141
In the welding tests A, B, D, E, and F with overlapping weld beads the thickness of the deposits increased bead by bead. After the 2-5th weld bead was welded depending on the welding parameters, the thickness of the deposits achieved their maximum thickness. Because the overlapping distances were shorter than the widths of the beads, the thicknesses of the beads increased. This effect has an effect on the dilution, because the plasma arc heats then more the molten pool. To get even surface powder feed rate has to be decreased after the first weld bead is welded. Heat input has to be balanced to the changed powder feed rate.
7.2.4 Location of plasma arc
The plasma arc column was directed to the edge of the molten pool, when the deposits were welded with welding parameters A, B, D, and E. The location of the plasma arc was detected visually. The dilutions of the deposits were then optimal. When heat input and the dilution increased, the molten pool increased, too. Therefore, the plasma arc heated more the molten pool and its size increased further. This caused penetration problems, because the plasma arc moved more on the molten pool. The molten pool restricts the plasma arc ability to form penetration.
In welding tests with welding parameters C and F the location of the plasma arc was on the molten pool. Even though plasma arc current was increased, the dilution remained at low level. Welding defects were occasionally found from the fusion lines. In case of pure abrasive wear resistance some welding defects in the fusion line have no effects on the detachment of the deposit. The dilution control is easier when the location of the plasma arc is on the molten pool than in the edge of the molten pool.
7.2.5 Argon-hydrogen gas mixtures
Hydrogen increases mobility and the size of the molten pool and, thus, the molten pool restricts the formation of the penetration. Because hydrogen also increases the wettability of the molten pool, welding defects were seldom detected. The molten pool was between the plasma arc and the work piece when Ar + 5 % H2 gas mixture was used.
Because of enhanced wettability due to hydrogen, the dilution control was the easiest with welding parameters F, then with E, and worst with D. With welding parameters D the controllability of the dilution still decreased, when the temperature of the work piece was increased.
7.3 Microstructure
The microstructures of the PTA welded deposits are not completely homogeneous, thus, the point from where the picture has been taken, can have an effect on the results. The analyzing method also may have an effect on the accuracy of the results.

142
7.3.1 Volume fraction of vanadium carbides
The volume fractions of VCs in the 12V-1 tool steel deposits varied between 12,2-17,5 vol.-% depending on the welding parameters. The measurements were made from the core of the deposits. The volume fraction varies as a function of distance from the fusion line. Nearby the fusion line the volume fraction of VCs was 3 vol.-% lower when compared to the core and top of the deposit welded with welding parameters B. The dilution from the base material is the main explanation. Preheating was high with welding parameters B. Thus, the base material had no remarkable effect on cooling time nearby the fusion line.
The deposits welded with 25 mm oscillation width had slightly higher volume fraction of VCs as the deposits welded with 6,5 mm oscillation width, when the location of the plasma arc was in the edge of the molten pool. By relocating the plasma arc more on the molten pool, the volume fraction of VCs increased. The volume fractions of VCs of the deposits C, 175 A and D, RT, 5,0 mm were 17,5 and 16,9 vol.-%, respectively. The volume fraction of VCs of the 12V-1 tool steel material manufactured by the HIP process was approximately 18,0 vol.-%. The volume fractions of VCs of the deposits welded by the PTA process are lower than in the tool steel materials manufactured by the HIP process. The location of the plasma arc on the molten pool is useful when high volume fraction of VCs is necessary. The highest volume fraction of VCs was obtained with welding parameters C. The size of the molten pool and the bead thickness were the biggest.
The volume fractions of VCs of the deposits having V 10-12 % and V 15-18 % were 17-20 vol.-% and 26-31 vol.-%, respectively, when welding tests were welded by the PTA welding method, while the other chemical components were Cr 4-6 %, Mo 1-2 %, Si 1 %, and Mn 1 % (Gebert et al., 2001). The deposit welded with welding parameters C had similar volume fraction of VC.
7.3.2 Size and morphology of vanadium carbides
The mean size of VCs depends on the welding parameters. The mean size of VCs was the highest in the deposit welded with welding parameters C. The location of the plasma arc was then on the molten pool. Even though the mean size of the VCs was high, the shapes of the VCs were partly round-shaped and partly needle-shaped in the deposit welded with welding parameters C. The most round-shaped VCs was obtained with welding parameters A, test 6, bead 2, having the shape ratio of 0,83. The carbides shape ratio of the weld bead welded with welding parameters A, test 4, bead 2, 0,75, does not correlate with the shapes of the carbides presented in Figures 97a, b. The PTA welded deposits are not as homogeneous as the materials manufactured by the HIP process. In the materials manufactured by the HIP process the shape ratios were 0,83-0,86. In the other welding parameter windows the shapes of the VCs were more needle-shaped. In the microstructure of the deposit D, RT, 5,0 mm some round-shaped VCs were obtained, even though the location of the plasma arc was slightly on the molten pool. Low heat input may explain the result. In the deposits welded with welding parameters E-F, the sizes of VCs were relatively small. The shapes of VCs of the deposits welded

143
with welding parameters E and F were more needle-shaped in the first beads when compared to the shapes of VCs of the fifth beads.
Convection of the molten pool by the plasma arc has an effect on the deposit microstructure. Convection of the molten pool caused stirring effect, thus, the VCs were formed as long, narrow needle-shaped carbides. The strength of the factors affecting the weld pool convection, i.e., electromagnetic or Lorentz force, buoyancy or gravity force, surface tension or Marangoni force, and impinging, friction or aerodynamic drag force of the arc plasma, cannot be analysed from the SEM pictures.
7.3.3 MFP
The MFP was the highest in the deposit welded with welding parameters C. Also the mean size of VCs was the highest. In the deposits welded with welding parameters A, tests 4 and 6 the MFPs and the mean sizes of VCs were almost the same. Stirring by the plasma arc may produce smaller and needle-shaped VCs as well as smaller MFP. The MFP was the lowest in the deposits welded with welding parameters D-F, RT.
7.3.4 Cumulative volumes of vanadium carbide sizes and MFPs
The cumulative volumes of the VC sizes and the MFPs of the deposits were analyzed. In the deposits welded with welding parameters A, B, C, D-F, and G, 20-40, 70, 20, 40-96, and 80 % of VCs were smaller than 1 m, respectively. In the materials manufactured by the HIP process, 48-81 % of VCs were smaller than 1 m. The sizes of VCs can be controlled by adjusting the welding parameters. For instance, in the parameter window D the amount of the sub-micron-sized VCs can be in the range of 40-96 %, mainly depending on the location of the plasma arc.
The MFP is not constant in the 12V-1 tool steel deposits. In the deposit welded with welding parameters C it has remarkably higher value when compared to the other deposits. 80 % of the measured distances between the carbides were higher than 1 m. 15 % of the distances were higher than 3 m. The MFP was 0,8-1,3 m for the materials manufactured by the HIP process. Thus, the MFPs were bigger in the deposits welded with welding parameters A-C.
7.3.5 Retained austenite
Retained austenite contents were between 22,9 and 32,5 % depending on the welding parameters. The volume fraction of VCs has an effect on the retained austenite content. Retained austenite content is one of the explanations to the volume loss in the RWAT. In Figure 96 the volume loss increases rapidly when the retained austenite content increases. However, the volume loss of the PTA welded 12V-1 tool steel deposit depends on the volume fraction of VCs, the size of the VCs, the MFP, the carbides morphology, and the matrix phases.

144
Retained austenite content can be decreased by double tempering. The best abrasive wear resistance was obtained after double tempering at 560 ºC. Bouaifi et al. (1993) had the highest hardness for the 5 % diluted 240 Cr5MoV10 deposit at the same temperature. Hardness of the 240 Cr5MoV10 deposit was in as-welded condition 59-61 HRC and after double tempering 63,8-65 HRC. After double tempering at 560 ºC the volume loss of a 10 % diluted deposit welded with welding parameters E decreased from 61,4 to 43,7 mm3.
7.3.6 Microstructural changes in weld bead
The PTA method is used sometimes for surfacing small-sized components or small- sized areas. Changes in the microstructure were detected in a bead welded with welding parameters B. In Table 17 and Figure 68e are presented the volume fraction, the mean size, and the MFP of VCs of the deposit welded with welding parameters B. The original VCs melt completely and precipitate during cooling time. In the beginning of the bead, after the plasma arc is ignited, the size of the molten pool is small and cooling time is short. VCs do not have enough time to grow. As can be seen from Table 23 and Figures 85a-c the volume fraction of VCs increases from the plasma arc ignition point to the end of the bead. The shape ratio increased from 0,67±0,25, 0,71±0,20 to 0,76±0,21. The changes in the microstructure were small after 25 mm welding distance. However, it has to be noticed that the best abrasive wear resistance can be achieved at the end of the weld bead.
7.3.7 Oscillation mode and welding speed
The deposits welded with welding parameters D-F were welded with sine wave oscillation mode. The carbides were mainly needle-shaped and relatively small-sized. The welding speed was 1,35 mm/s. The welding speed was increased from 1,35 to 1,42 and 1,49 mm/s to detect its effect on the microstructure. In Table 18 and Figures 71a-c are presented the volume fraction, the mean size, and the MFP of VCs of the deposits welded with welding parameters D by varying welding speed. The increasing welding speed enhanced the shapes of VCs, i.e., with welding speed 1,49 mm/s the carbides were more round-shaped. The volume fraction decreased rapidly, thus, heat input was too low to maintain the volume fraction of VCs. The increasing welding speed had no remarkable beneficial effects on the microstructure. With sine wave oscillation mode the plasma arc has to be too far away from the molten pool to get round-shaped carbides. In the edge of the sine wave the plasma arc has not movement in the welding direction. Thus, the plasma arc moves over the molten pool and stirs it, which has a detrimental effect on the shapes of the carbides.
In the deposits welded with welding parameters B the linear movement in the end of the oscillation wave was 2,1 mm. The microstructure contained especially with higher dilutions more needle-shaped carbides. It was obvious that the plasma arc was moved slightly on the molten pool, because of the increased dilution, following the increased size of the molten pool, and the location of the plasma arc was then more on the molten pool.
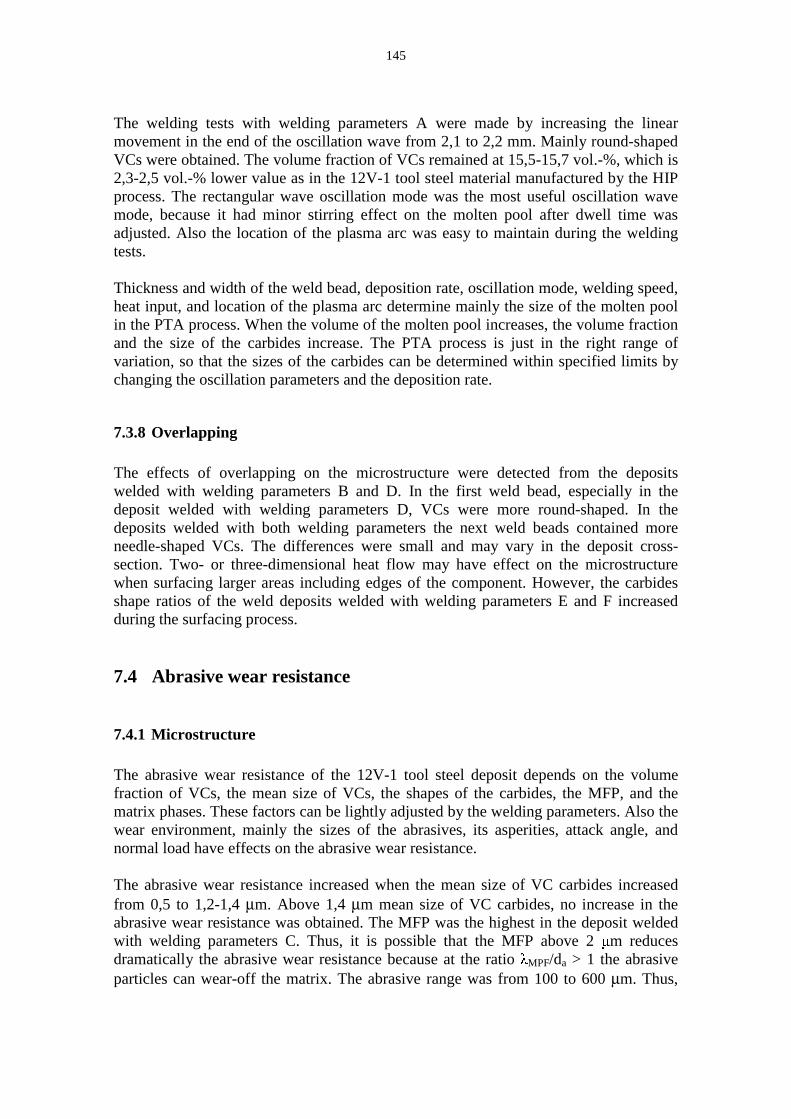
145
The welding tests with welding parameters A were made by increasing the linear movement in the end of the oscillation wave from 2,1 to 2,2 mm. Mainly round-shaped VCs were obtained. The volume fraction of VCs remained at 15,5-15,7 vol.-%, which is 2,3-2,5 vol.-% lower value as in the 12V-1 tool steel material manufactured by the HIP process. The rectangular wave oscillation mode was the most useful oscillation wave mode, because it had minor stirring effect on the molten pool after dwell time was adjusted. Also the location of the plasma arc was easy to maintain during the welding tests.
Thickness and width of the weld bead, deposition rate, oscillation mode, welding speed, heat input, and location of the plasma arc determine mainly the size of the molten pool in the PTA process. When the volume of the molten pool increases, the volume fraction and the size of the carbides increase. The PTA process is just in the right range of variation, so that the sizes of the carbides can be determined within specified limits by changing the oscillation parameters and the deposition rate.
7.3.8 Overlapping
The effects of overlapping on the microstructure were detected from the deposits welded with welding parameters B and D. In the first weld bead, especially in the deposit welded with welding parameters D, VCs were more round-shaped. In the deposits welded with both welding parameters the next weld beads contained more needle-shaped VCs. The differences were small and may vary in the deposit cross-section. Two- or three-dimensional heat flow may have effect on the microstructure when surfacing larger areas including edges of the component. However, the carbides shape ratios of the weld deposits welded with welding parameters E and F increased during the surfacing process.
7.4 Abrasive wear resistance
7.4.1 Microstructure
The abrasive wear resistance of the 12V-1 tool steel deposit depends on the volume fraction of VCs, the mean size of VCs, the shapes of the carbides, the MFP, and the matrix phases. These factors can be lightly adjusted by the welding parameters. Also the wear environment, mainly the sizes of the abrasives, its asperities, attack angle, and normal load have effects on the abrasive wear resistance.
The abrasive wear resistance increased when the mean size of VC carbides increased from 0,5 to 1,2-1,4 μm. Above 1,4 μm mean size of VC carbides, no increase in the abrasive wear resistance was obtained. The MFP was the highest in the deposit welded with welding parameters C. Thus, it is possible that the MFP above 2 m reduces dramatically the abrasive wear resistance because at the ratio MPF/da > 1 the abrasive particles can wear-off the matrix. The abrasive range was from 100 to 600 μm. Thus,

146
only asperities of the abrasives can abrade the matrix material between VCs. In the wear tracks presented in Figures 97a-f can be seen that between the carbides are lots of wear scars, the widths of which are between 0,1-0,5 μm. The abraded material may be cut-off carbides, crushed carbides, crushed abrasives, or asperities of the quartz sand particles.
The shape of VCs had remarkable effect on the abrasive wear resistance. In the deposits welded with welding parameters A the most round-shaped VCs were detected from the microstructures and especially from the wear tracks. The abrasive wear resistances of the deposits welded with welding parameters A were 1,5-3,0 times higher than in the deposits welded in the other parameter windows. The deposits welded with welding parameters A had low retained austenite contents. Thus, higher amount of martensite had greater ability to support the round-shaped carbides.
7.4.2 Dilution
The effect of the increasing dilution of the 12V-1 tool steel deposit on the abrasive wear resistance was not possible to analyze exactly. The dilution means that the alloying elements from the thin layer of the base material are diluted to the deposit. In the PTA method, 5-10 % dilution is easy to maintain during the welding process. Thus, its effect on the microstructure and the wear resistance remain constant during the welding process. In Table 13 was presented the dilution of the weld beads, which remained quite constant during the welding process.
The increasing dilution changes the location of the plasma arc in relation with the molten pool. When the dilution increases, increases the size of the molten pool and if the location of the plasma arc is not changed during the welding process, the microstructure changes because of stirring effect of the plasma arc and convection of the molten pool. This phenomena has to be noticed when the abrasive wear resistance and the dilution are compared to each other.
If only dilution is taken into account the volume loss in the deposits welded with welding parameters A and B increased from 4 to 25 mm3 per 20 % increase in the dilution. In the deposits welded with welding parameters D the increased dilution from 7 to 15 % increased the volume loss 30 mm3. In the deposits welded with welding parameters E the increased dilution from 5 to 15 % increased the volume loss 22 mm3. In the deposits welded with welding parameters F the increased dilution from 4 to 9 % increased the volume loss 3 mm3.
7.4.3 Plasma arc location
The dilution is not the only phenomenon explaining the wear resistance of the deposit. If the 6 and 0,5 %, 7 and 7 % diluted samples welded with welding parameters A and C, D and F are compared, the volume loss increased from 23,9 to 50 mm3 and from 40 to 62 mm3, respectively. Thus, even though the dilution remained constant the volume loss increased remarkably, depending on the welding parameters. The areas of the bead
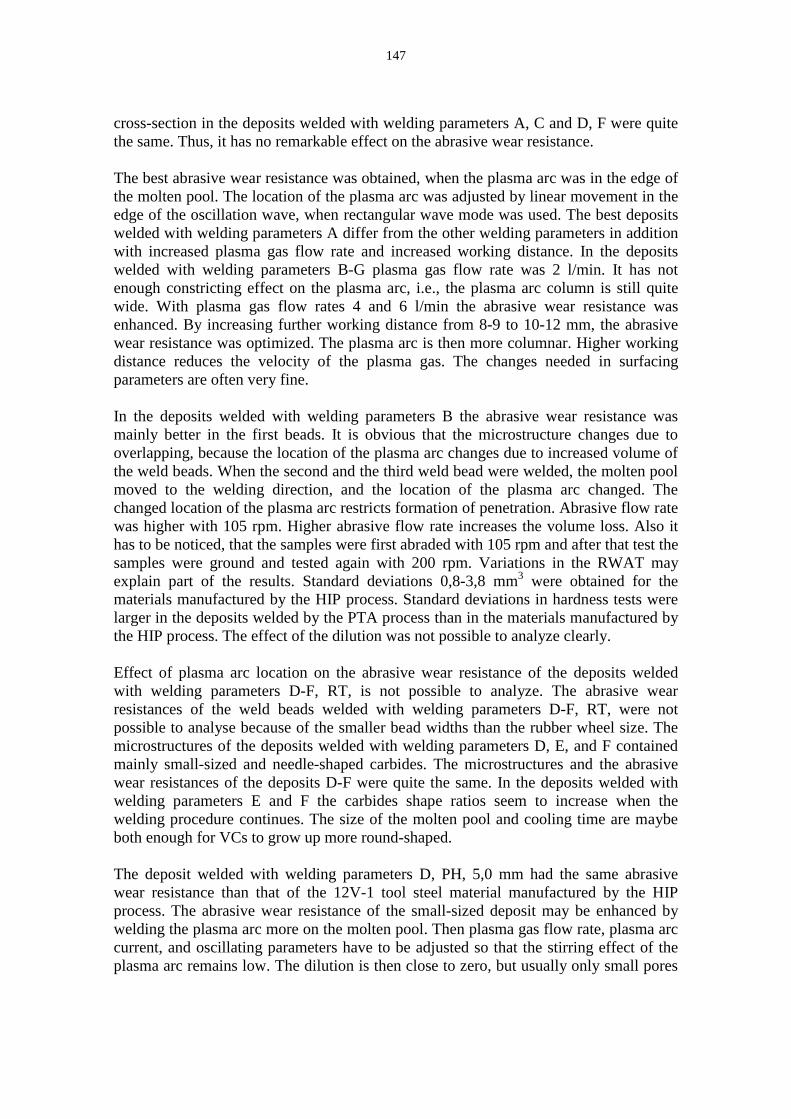
147
cross-section in the deposits welded with welding parameters A, C and D, F were quite the same. Thus, it has no remarkable effect on the abrasive wear resistance.
The best abrasive wear resistance was obtained, when the plasma arc was in the edge of the molten pool. The location of the plasma arc was adjusted by linear movement in the edge of the oscillation wave, when rectangular wave mode was used. The best deposits welded with welding parameters A differ from the other welding parameters in addition with increased plasma gas flow rate and increased working distance. In the deposits welded with welding parameters B-G plasma gas flow rate was 2 l/min. It has not enough constricting effect on the plasma arc, i.e., the plasma arc column is still quite wide. With plasma gas flow rates 4 and 6 l/min the abrasive wear resistance was enhanced. By increasing further working distance from 8-9 to 10-12 mm, the abrasive wear resistance was optimized. The plasma arc is then more columnar. Higher working distance reduces the velocity of the plasma gas. The changes needed in surfacing parameters are often very fine.
In the deposits welded with welding parameters B the abrasive wear resistance was mainly better in the first beads. It is obvious that the microstructure changes due to overlapping, because the location of the plasma arc changes due to increased volume of the weld beads. When the second and the third weld bead were welded, the molten pool moved to the welding direction, and the location of the plasma arc changed. The changed location of the plasma arc restricts formation of penetration. Abrasive flow rate was higher with 105 rpm. Higher abrasive flow rate increases the volume loss. Also it has to be noticed, that the samples were first abraded with 105 rpm and after that test the samples were ground and tested again with 200 rpm. Variations in the RWAT may explain part of the results. Standard deviations 0,8-3,8 mm3 were obtained for the materials manufactured by the HIP process. Standard deviations in hardness tests were larger in the deposits welded by the PTA process than in the materials manufactured by the HIP process. The effect of the dilution was not possible to analyze clearly.
Effect of plasma arc location on the abrasive wear resistance of the deposits welded with welding parameters D-F, RT, is not possible to analyze. The abrasive wear resistances of the weld beads welded with welding parameters D-F, RT, were not possible to analyse because of the smaller bead widths than the rubber wheel size. The microstructures of the deposits welded with welding parameters D, E, and F contained mainly small-sized and needle-shaped carbides. The microstructures and the abrasive wear resistances of the deposits D-F were quite the same. In the deposits welded with welding parameters E and F the carbides shape ratios seem to increase when the welding procedure continues. The size of the molten pool and cooling time are maybe both enough for VCs to grow up more round-shaped.
The deposit welded with welding parameters D, PH, 5,0 mm had the same abrasive wear resistance than that of the 12V-1 tool steel material manufactured by the HIP process. The abrasive wear resistance of the small-sized deposit may be enhanced by welding the plasma arc more on the molten pool. Then plasma gas flow rate, plasma arc current, and oscillating parameters have to be adjusted so that the stirring effect of the plasma arc remains low. The dilution is then close to zero, but usually only small pores

148
are detected from the fusion line, the defects of which do not have any effects on the detachment of the deposit.
7.4.4 Preheating
In parameter windows A-B and D, preheating had no measurable effect on the abrasive wear resistance. Excellent abrasive wear resistance is obtained with high amount of martensite. Preheating may have an effect on the amount of martensite. However, the effect of preheating was not possible to analyze from the welding tests. The austenite phase can undergo transformation from austenite to martensite during abrasive wear.
7.4.5 Wear tracks
The hard wear resistant carbides are needed to resist abrasive wear in the 12V-1 tool steel deposits. Because of the wear type, hard wear resistant matrix is also needed so that the benefits of the wear resistant carbides can be fully exploited. The surfaces of the 12V-1 tool steel wear test samples were even in visual inspection after the rubber wheel abrasion tests. Surface roughness measurements revealed that Ra was 1,60 m in the end of the test. Therefore, no deep grooves were formed.
In the 12V-1 tool steel deposits the abrasive wear resistance depends mainly on the volume fraction of VCs, the mean size of VCs, the carbides shape ratio, the MFP, and the matrix phases. The wear track of the deposit welded with welding parameters A contained after the RWAT relative homogeneously precipitated round-shaped carbides. The volume fraction of VCs in the wear surface was bigger than was estimated from the microstructure. The carbides were slightly above the wear surface, therefore, the volume fraction of VCs was increased. Thus, the round-shaped carbides have shielded the wearing surface very well.
In the wear tracks of the deposits welded with welding parameters C and D, the biggest carbides were left on the worn surface. A lot of crushed carbides can be seen. In the wear tracks can be seen areas, where the MFP was high. It is obvious that the smallest carbides have cut-off, while the biggest carbides are still present on the wear surface. The biggest carbides were crushing piece by piece. Some crushed and adhered carbides can be seen in the wear tracks.
In the wear track of the 12V-1 tool steel material manufactured by the HIP process can be seen 0,1-0,5 μm sized wear grooves. The distribution of VCs was homogeneous. Some crushed carbides can be seen. As a conclusion the material wears quite evenly without any dramatic carbide cut-off or grooving.
7.4.6 Welding parameters G
The deposit welded with welding parameters G was welded without oscillation, i.e., by straight passes. The microstructure contained VCs, the mean size of which was 0,7 m.

149
The abrasive wear resistance was remarkably low, 78,0 mm3. The abrasive wear resistances were 20,4-68,9 mm3 in the deposits welded with welding parameters A-F by oscillating the plasma arc. Some pores were detected from the microstructure. These defects may decrease the abrasive wear resistance.
7.4.7 Reference material 15V-1 tool steel
The reference material 15V-1 tool steel for the microstructure and the abrasive wear tests was welded with welding parameters D without preheating. Layer thickness was 2,9 mm. The 15V-1 tool steel powder was more alloyed when compared to the 12V-1 tool steel powder. The volume loss of the 15V-1 tool steel deposit was 41,9 mm3, while it was 37-112 mm3 for the 12V-1 tool steel deposits welded with the same parameters. The volume fraction of VCs was 20,3 vol.-% for the 15V-1 tool steel deposit. It was 6 vol.-% higher volume fraction when compared to the 12V-1 tool steel deposits welded with the same welding parameters. Also the mean size of VCs was higher, 1,0 m. The retained austenite content was the highest, 32,5 %, and the carbides shape ratio was the lowest.
Even though the 15V-1 tool steel powder was more alloyed, when comparing the 15V-1 tool steel deposit to the 12V-1 tool steel deposit welded with welding parameters A, the 15V-1 deposit had lower test result in the rubber wheel abrasion test. Therefore, it is obvious that by selecting more alloyed material, the wear resistance is not automatically better. The welding parameters have to be optimized for every alloy.
7.4.8 Modeling abrasive wear of weld deposits
Modeling of abrasive wear of the PTA welded deposits is very complicated. The welding parameters have all together effects on the dilution and the microstructure of the deposits. The microstructure alteration is related to the distance from the base material fusion line to the top of the deposit. Also small variations in the dilution and the microstructure may be present in the first and the following weld beads.
37 variables for the PTA welding method are identified effecting on the welding process (Kapus, 1980). General sliding wear has more than 100 different variables and constants effecting on the wear resistance (Meng et al., 1995). In equations 43 and 44 for the RWAT can been seen 7 variables. The other remarkable variables are wheel size, temperature rise, angularity, humidity, and area of wear scar (Avery, 1981). Stress level has an effect on the abrasive wear resistance in the RWAT. From the wear tracks abraded with low and high stress levels can be seen that rolling of the abrasives may prevent with high stress load, Figures 97-99. It can be said that abrasion is the main wear mechanism in the RWAT, but also other wear mechanisms can occur in small scale. In the field test the amount of process parameters effecting on the degradation of the deposits can be seldom known exactly. Interactions between different kinds of parameters have effects on the wear resistance. Welding operator and welding engineer as well as the welding unit have their own effects on the deposit quality (Kapus, 1980).

150
The differences in the microstructures of the 12V-1 tool steel deposits were low, but the effect of these differences on the wear resistance with used abrasive was high. It was also stated that the same welding parameters do not automatically fit for every alloys, even though the difference between alloy compositions is low. The abrasive wear models do not take into account the carbides shape ratio, the MFP, the size of carbides, the retained austenite content, and the volume fraction of carbides. These parameters change during the welding process, which makes it more difficult to estimate abrasive wear resistance by modeling.
7.4.9 Optimized welding parameters
The best abrasive wear resistance was obtained with welding parameters A, test 4, bead 2 and A, test 6, bead 2, 20,4 and 23,9 mm3, respectively. In both deposits the abrasive wear resistance of the first bead was lower when compared to the abrasive wear resistance of the second bead. In the abrasive wear test the standard deviation of the relatively homogeneous 12V-1 tool steel material manufactured by the HIP process was 3,8 mm3. The materials manufactured by the HIP process had the most homogeneous microstructure. Thus, the abrasive wear test results of A, test 4, bead 2 and A, test 6, bead 2 are almost in the range of standard deviation.
For optimizing the abrasive wear resistance of the first and the following beads the welding parameters have to be slightly varied. Powder feed rate can be decreased and plasma gas flow rate can be increased. The dilution of the deposit can be adjusted by plasma arc current.
The deposits welded with welding parameters A, tests 4 and A, test 6 had better abrasive wear resistance in the RWAT when compared to the 12V-1 tool steel material manufactured by the HIP process. More alloyed 15V-2 tool steel HIP material had the same abrasive wear resistance as the weld beads of the 12V-1 tool steel deposits A, test 4, bead 2 and A, test 6, bead 2 welded by the PTA method.

151
8 Conclusions
1. The main phenomenon of the 12V-1 tool steel deposit is its molten pool good mobility. The molten pool is prone to move between the plasma arc and the base material. Thus, dilution control is challenging and small variation in the plasma arc location in relation with the molten pool has large effect on the microstructure and the abrasive wear resistance.
2. The microstructure of the materials manufactured by the HIP process was the most homogeneous. Standard deviations of the volume fractions of VCs, the mean sizes of VCs, and the carbides shape ratios were lower than in the deposits welded by the PTA process. The most homogeneous deposits were welded with welding parameters A.
3. The shape ratio has an effect on the abrasive wear resistance of the 12V-1 tool steel deposit. The materials manufactured by the HIP process had the most round-shaped VCs, the shape ratio was between 0,83-0,86. The PTA welded deposits had the shape ratio between 0,66-0,83. Stirring of the molten pool by the plasma arc column seems to reduce the shape ratio in the deposits welded with welding parameters B and D. The shape ratio seems to increase in the deposits welded with welding parameters E and F during the surfacing procedure.
4. The best abrasive wear resistance of the PTA welded deposits was obtained with the mean size of VCs from 1,2 to 1,4 m. The mean size of the carbides of the materials manufactured by the HIP process was between 0,8-1,1 m.
5. The volume fraction of VCs of the PTA welded deposits was 0,5-5,5 vol.-% lower when compared to the 12V-1 tool steel material manufactured by the HIP process. The highest volume fraction was obtained in a sample welded with welding parameters C. The bead thickness was 5,5 mm and the location of the plasma arc was then on the molten pool.
6. The effect of the MFP on the abrasive wear resistance with the used abrasive size was not clearly detected. In the deposits where standard deviation of the MFP was high, it can be seen areas in the wear tracks where grooving was the dominating wear mode. Thus, even though the nominal abrasive fraction was remarkably larger than the MFP, asperities of the abrasives, crushed carbides, crushed abrasives, or detached abrasives were degrading the wearing surfaces.
7. The volume fraction of VCs increased in the wear track when compared to the microstructure. The round-shaped carbides were prone to stay in the wearing surface. The matrix wears off between the carbides and, thus, the volume fraction of the carbides increases in the wearing surface.
8. The VC size and the MFP distributions of the PTA welded deposits vary in ranges of 0,2-5,0 and 0,2-5,0 m depending on the welding parameters,

152
respectively. The materials manufactured by the HIP process had ranges of 0,2-2,2 and 0,2-4,0 m, respectively.
9. The retained austenite content was the lowest in the samples welded with welding parameters A-C. Low amount of retained austenite and high amount of martensite enhance the ability of carbides to resist abrasive wear.
10. The effect of the dilution on the abrasive wear resistance was not possible to measure exactly. The effects of the dilution of the deposits were mainly nearby the fusion line, i.e., approximately 0,5 mm from the fusion line. The volume fraction and the mean size of VCs were smaller nearby the fusion line. The location of the plasma arc in relation with the molten pool had stronger effect on the abrasive wear resistance than that of the dilution.
11. A lot of crushed carbides were detected from the wear surfaces of the deposits welded with welding parameters C and D. In the wear surfaces of the deposit welded with welding parameters A and the 12V-1 tool steel material manufactured by the HIP process, only some of the carbides were crushed during the RWAT. Round-shaped carbides resist microcracking.
12. The high stress abrasive wear test can be arranged by the rubber wheel abrasive test apparatus for tool steel alloys. With normal load 174 N the wear surface contained a lot of small grooves, especially on the areas where the MFP was large. A lot of crushed VCs can be detected. The 3,2 m sized VC carbide was capable to crush the abrasive. Rolling of the abrasives was at least partly prevented.
13. Hardness of the 12V-1 tool steel deposit cannot be used for estimating the abrasive wear resistance of the 12V-1 tool steel deposit. Hardness depends on the volume fraction of VCs, the sizes of VCs, the MFP, the retained austenite content, and the dilution. The abrasive, the wear environment, and the microstructure together determine the wear rate. Small variations in the microstructure have remarkable effects on the abrasive wear resistance.
14. Surface roughness of the 12V-1 tool steel deposit was 1,6 0,3 m in the end of the rubber wheel test. Surface roughness of 0,9±0,3 m was obtained after 100 rounds of the rubber wheel. The measurements were made from the deposit, the mean size of VCs of which was 1,1 m. Thus, when the VCs size distribution is taken into account, VCs shield the wear surface, and the penetration depth of the abrasives is smaller than the mean diameter of the abrasives.
15. The best abrasive wear resistance of both the deposits welded by the PTA method and the materials manufactured by the HIP process were detected from the deposits welded with rectangular wave mode, 4-6 l/min plasma gas flow rates, and 10-12 mm working distances. With 4-6 l/min plasma gas flow rate the plasma arc is more columnar when compared to plasma gas flow rate 2 l/min.

153
16. The PTA welding parameters have to be optimized for every tool steel alloy. The volume losses in the RWAT were from 20,4 to 146,0 mm3 depending on the welding parameters. The 15V-1 tool steel deposit welded with welding parameters D had lower wear test result as the best 12V-1 tool steel deposit welded with welding parameters A, even though 15V-1 tool steel was more alloyed.

154
References
Ait-Mekideche, A. 1989. Plasma-Pulver-Auftragschweissen verschlei fester Pseudolegierungssysteme auf Cobalt-Chrom-Wolfram-Kohlenstoff-Basis. Doctoral Thesis, Rheinisch-Westfälischen Technischen Hochschule Aachen, Germany, 154 p.
Ala-Kleme, S., Kivikytö-Reponen, P., Liimatainen, J., Hellman, J. and Hannula, S.-P. 2007. Abrasive Wear Properties of Tool Steel Matrix Composites in Rubber Wheel Abrasion Test and Laboratory Cone Crusher Experiments. Wear, 263 (1-6), pp. 180-187.
Anderson, M., Chiovelli, S. and Llewellyn, R. 2003. The Use of Tungsten Carbide Materials for Oilsand Wear Applications. In: Moreau, C. and Marple, B.R. (Eds.). Thermal Spray 2003 – Advancing the Science and Applying the Technology, Proceedings, International Thermal Spray Conference (ITC 2003), Orlando, USA, 5-8 May 2003, pp. 509-518.
Andrews, K.W. 1965. Empirical Formulae for the Calculation of Some Transformation Temperatures. Journal of the Iron and Steel Institute, 203, July 1965, pp. 721-727.
Araki, T., Nishida, M., Hirose, A. and Fujita, H. 1994. Effects of Particle Size of Carbide Powder and Silica Sand on Abrasive Wear Resistance of an Overlay Composite Alloy. Welding International, 8 (1), pp. 23-29.
Archard, J.F. 1953. Contact and Rubbing of Flat Surfaces. Journal of Applied Physics, 24 (8), pp. 981-988.
Ashby, M.F. and Jones, D.R.H. 1980. Engineering Materials 1, An Introduction to Their Properties and Applications. International Series on Materials Science and Technology, Volume 34, Pergamon Press, 280 p.
ASTM G 65-94. Standard Test Method for Measuring Abrasion Using the Dry Sand / Rubber Wheel Apparatus. American Society for Testing and Materials, Philadelphia, USA, 12 p.
Avery, H.S. 1981. An Analysis of the Rubber Wheel Abrasion Test. In: Rhee, S.K., Ruff, A.W. and Ludema, K.C. (Eds.). Wear of Materials: International Conference on Wear of Materials, New York, USA, pp. 367-378.
Babi, M. 1991. A Study of Intermetallic Compounds in Plasma Transferred Arc Co-deposited Nickel-aluminum and Nickel-boron Carbide Blends. In: ISTFA/91; The 17th International Symposium for Testing & Failure Analysis, Los Angeles, USA, 11-15 November 1991, pp. 553-560.
Babi, M.A.K. 1993. An Innovative High Deposition Rate Plasma Transferred Arc Surfacing Technique. In: Berndt, C.C. and Bernecki, T.F. (Eds.). Thermal Spray

155
Coatings: Research, Design and Applications, Proceedings, 5th National Thermal Spray Conference, Anaheim, USA, 7-11 June 1993, pp. 133-138.
Babiak, Z. and Ambroziak, A. 1983. Analysis of the Factors Influencing the Hardness of Plasma Weld Surfaced Layers. Journal of Technical University of Silesia-Mechanica, 78, Gliwice, Poland.
Babiak, Z. and Dudzi ski, W. 1986. Tungsten Carbide Stability in Plasma Weld Surfacing. Surfacing Journal International, 1 (3), pp. 87-90. Baeslack, W.A., Bucklow, I.A. and Abson, D.J. 1996. High Stress Abrasive Wear Testing of Chromium Boride/Stainless Steel and Tungsten-Vanadium-Carbide/Stainless Steel Hard-facing Materials. TWI Journal (UK), 5 (1), pp. 79-114.
Bayer, R.G. 1997. Wear Testing. In: Friction and Wear Testing, Source Book: Selected References from ASTM Standards and ASM Handbooks, ASM International, Materials Park, OH, USA, pp. 30-37.
Bhansali, K.J. 1980. Wear Coefficients of Hard-surfacing Materials. In: Peterson, M.B. and Winer, W.O. (Eds.). Wear Control Handbook, ASME, 1980, pp. 373-383.
Blau, P.J. 1989. Friction and Wear Transitions of Materials – Break-in, Run-in, Wear-in. Noyes Publications, Park Ridge, New Jersey, USA, 476 p.
Blunt, F.J. 2000. Magnetic Arc Oscillation for Weld Surfacing, Using Mechanized TIG, MIG and PTA Processes. In: Surfacing, Core Research from TWI, Abington, Cambridge, UK, Abington Publishing, pp. 80-124.
Bols, I. and Hunt, C.S. 1997. Shielding Gases – Product and Productivity. Welding Review International, 16 (1), pp. 157-159.
Bouaifi, B., Gebert, A. and Heinze., H. 1993. Plasma-Pulver-Auftragschwei ungen zum Verschlei schutz abrasiv beanspruchter Bauteile mit Kantenbelastung. Schweissen & Schneiden, 45 (9), pp. 506-509 and E170-E172.
Bouaifi, B., Bartzsch, G., Gebert, A. and Heinze, H. 1997. Untersuchungen zum Plasma-Auftragschwei en von verschlei festen Hartstoffschichten mit vanadiumcarbiden. Schweissen & Schneiden, 49 (4), pp. 213-219 and E54-E56.
Bouaifi, B. and Schultze, S. 1999. High-performance Plasma-powder-overlay Welding with CrNiMoN-alloyed Duplex Materials. Stainless Steel World, 11 (1), pp. 51-56.
Bourithis, L. and Papadimitriou, G. 2005. Three Body Abrasion Wear of Low Carbon Steel Modified Surfaces. Wear, 258 (11-12), pp. 1775-1786.
Box, G.E.P., Hunter, W.G. and Hunter, J.S. 1978. Statistics for Experiments, an Introduction to Design, Data Analysis, and Model Building. John Wiley & Sons, Inc., 657 p.

156
Brandis, H., Haberling, E. and Weigand, H.H. 1980. Metallurgical Aspects of Carbides in High-speed Steels. In: Wells, M.G.H. and Lherbier, L.W. (Eds.). Processing and Properties of High-speed Tool Steels, Las Vegas, USA, 26-28 February, TMS-AIME, pp. 1-18.
Buchely, M.F., Gutierrez, J.C., León, L.M. and Toro, A. 2005. The Effect of Microstructure on Abrasive Wear of Hardfacing Alloys. Wear, 259 (1), pp. 52-61.
Budinski, K.G. 1988. Surface Engineering for Wear Resistance. Prentice Hall, Englewood Cliffs, New Jersey, USA, 420 p.
Burgardt, P. and Heiple, C.R. 1986. Interaction between Impurities and Welding Variables in Determining GTA Weld Shape. Welding Journal, 65 (6), pp. 150-155.
Challen, J.M. and Oxley, P.L.B. 1979. An Explanation of the Different Regimes of Friction and Wear Using Asperity Deformation Models. Wear, 53 (2), pp. 229-243.
Chattopadhyay, R.N. 1998. The Effect of Dilution on Corrosion and Wear of Superalloy Weld Overlays. In: Khanna, A.S., Totlani, M.K. and Singh, S.K. (Eds.). Corrosion and its Control: Proceedings of International Conference on Corrosion, II, CORCON-97, Mumbai, India, 3-6 December 1997, pp. 1246-1250.
Chen, L.H., Chang, L.C. and Lui, T.S. 1990. The Abrasion Resistance of High-chromium White Cast Irons as a Linear Function of Carbide Volume Fraction. In: Proceedings of the Japan International Tribology Conference, Nagoya, Japan, 29 October-1 November 1990, pp. 227-231.
Chen, T.M., Lui, T.S. and Chen, L.H. 1993. Overlaying of Stellite 6 Superalloy on Austenitic Manganese Steel by PTA Method. In: Sudarshan, T.S. and Braza, J.F. (Eds.). Surface Modification Technologies VI, Chicaco, Illinois, USA, 2-5 November 1992, pp. 569-580.
Cochran, W.G. and Cox, G.M. 1950. Experimental Designs. John Wiley & Sons, Inc., New York, USA, 454 p.
Craig, E. 1988. The Plasma Arc Process – A Review. Welding Journal, 67 (2), pp. 19-25.
Czichos, H. 1997. Basic Tribological Parameters. In: Friction and Wear Testing, Source Book: Selected References from ASTM Standards and ASM Handbooks, ASM International, Materials Park, OH, USA, pp. 1-7.
David, S.A. and Vitek, J.M. 1989. Correlation between Solidification Parameters and Weld Microstructures. International Materials Reviews, 34 (5), pp. 213-245.
Delesse, M.A. 1847. Procédé Mécanique pour Déterminer la Composition des Roches. Comptes Rendus Hebdomadaires des Séances de l´Académie des Sciences. Académie des Sciences (France), Paris, 25, p. 544.

157
Deuis, R.L., Yellup, J.M. and Subramanian, C. 1997. Aluminium Composite Coatings Produced by Plasma Transferred Arc Surfacing Technique. Materials Science and Technology, 13 (6), pp. 511-522.
Deuis, R.L., Yellup, J.M. and Subramanian, C. 1998. Metal-matrix Composite Coatings by PTA Surfacing. Composites Science and Technology (UK), 58 (2), pp. 299-309.
Diesburg, D.E. and Borik, F. 1974. Optimizing Abrasion Resistance and Toughness in Steels and Irons for the Mining Industry. Symposium on Materials for the Mining Industry, Climax Molybdenum Co., Vail, USA, pp. 15-41.
Dilthey, U., Ellermeier, J., Gladkij, P. and Pavlenko, A.V. 1993. Combined Plasma-arc Powder Surfacing. Schweissen & Schneiden, 45 (5), pp. 241-244 and E75-E76.
Dilthey, U., Ellermeier, J. and Pavlenko, A.V. 1994. Computer-controlled Welding System for Combined Plasma Transferred Arc Surfacing. In: Welding, Joining, Coating and Surface Modification of Advanced Materials, Proceedings, Pre-assembly Symposium, 47th Annual Assembly of IIW, Dalian, China, 1-2 September 1994, pp. 391-396.
Dilthey, U., Pavlenko, A.V. and Ellermeier, J. 1996a. Automation of Plasma Transferred Arc Surfacing – Concepts for Operation and Control. DVS-Berichte, (175), TS96, Thermal Spraying Conference, Proceedings, Conference, Essen, Germany, 6-8 March 1996, pp. 433-437.
Dilthey, U., Pavlenko, A.V. and Ellermeier, J. 1996b. Influence of Different Alloying Elements on the Coating Quality in PTA Surfacing on Large Engine Valves with Co- and Ni-base Alloys. DVS-Berichte, (175), TS96, Thermal Spraying Conference, Proceedings, Conference, Essen, Germany, 6-8 March 1996, pp. 147-151.
Dilthey, U. and Kabatnik, L. 1998. Central Powder Feed in the Plasma Arc Powder Surfacing Process. Schweissen & Schneiden, 50 (12), pp. 766, 768-771 and E230-E232.
Donskoi, A.V. and Klubnikin, V.S. 1979. Electric Plasma Processes and Equipment in Engineering, Mashinostroenie, Leningrad, 170 p.
Draugelates, U., Bouaifi, B., Plegge, T., Franzoni, U., Sintoni, F. and Gimondo, P. 1993. Innenbeschichten von Rohren geringer Durchmesser durch Plasma-Pulver-Auftragschwei en. DVS-Berichte, (152), TS93, Thermal Spraying Conference, Proceedings, Conference, Aachen, 3-5 March 1993, pp. 160-163.
Draugelates, U., Bouaifi, B., Gie ler, S. and Schreiber, F. 1996. Wear Protection against Complex Component Impact by PTA Surfacing with Hard Phase Reinforcements. DVS-Berichte, (175), TS96, Thermal Spraying Conference, Proceedings, Conference, Essen, Germany, 6-8 March 1996, pp. 143-147.

158
Dresvin, S.V. (Ed.), Donskoi, A.V., Goldfarb, V.M., and Klubnikin, V.S. 1972. Physics and Technology of Low-temperature Plasmas. Ames, IA, The Iowa State University Press, 1977, 471 p.
DuMola, R.J. and Kammer, P.A. 1988. A New Portable Plasma Transferred-arc System for on-site Wear Applications. In: Thermal Spray, Advances in Coatings Technology, Proceedings, National Thermal Spray Conference, Orlando, USA, 14-17 September 1987, pp. 131-136.
Dunkley, J.J. 1998. Atomization. In: ASM Handbook 1998, Volume 7, Powder Metal Technologies and Applications, ASM International, Materials Park, OH, USA, pp. 35-52.
DuPont, J.N. and Marder, A.R. 1996. Dilution in Single Pass Arc Welds. Metallurgical and Materials Transactions B, 27B (3), pp. 481-489.
DuPont, J.N. 1998. On Optimization of the Powder Plasma Arc Surfacing Process. Metallurgical and Materials Transactions B, 29B (4), pp. 932-934.
Dören, H. and Wernicke, K. 1985. Influence of the Welding Parameters in Plasma Arc Overlay Welding with Powder. DVS-Berichte, (100), Welding and Cutting, Proceedings, Conference, Essen, Germany, 11-13 September 1985, pp. 72-77.
Elizagàrate, C. and Penche, J. 1981. The Use of Plasma Surfacing in Industry. Revista de Soldadura, 11 (4), pp. 187-197.
Fang, L., Xing, J., Liu, W., Xue, Q., Wu, G. and Zhang, X. 2001. Computer Simulation of Two-body Abrasion Processes. Wear, 251 (2), pp. 1356-1360.
Feng, Z., White, R.A., Willis, E. and Solomon, H.D. 1999. Development of Compressive Residual Stresses in Underwater PTA Welds. Technical Information Series, GE Research & Development Center, August 1999, 8 p.
Fromowicz, J., Ait-Mekideche, A. and Lugscheider, E. 1993. Plasmabeschichten mit gepulstem Lichtbogen. DVS-Berichte, (152), TS93, Thermal Spraying Conference, Proceedings, Conference, Aachen, Germany, 3-5 March 1993, pp. 394-398.
Fuerschbach, P.W. and Knorovsky, G.A. 1991. A Study of Melting Efficiency in Plasma Arc and Gas Tungsten Arc Welding. Welding Journal, 70 (11), pp. 287-297.
Garrison, W.M. Jr., 1982. Khruschov’s Rule and the Abrasive Wear Resistance of Multiphase Solids. Wear, 82 (2), pp. 213-220.
Gatto, A., Bassoli, E. and Fornari, M. 2004. Plasma Transferred Arc Deposition of Powdered High Performances Alloys: Process Parameters Optimisation as a Function of Alloy and Geometrical Configuration. Surface & Coatings Technology, 187 (2-3), pp. 265-271.

159
Gebert, A., Bouaifi, B. and Teupke, E. 2001. Neue vanadinkarbidhaltige Schwei zusätze zum Schutz gegen Verschlei und Korrosion. DVS-Berichte, (216), pp. 365-370.
German, R.M. 2005. Powder Metallurgy and Particulate Materials Processing, the Processes, Materials, Products, Properties, and Applications. Metal Powder Industries Federation, Princeton, New Jersey, USA, 528 p.
Giedt, W.H., Tallerico, L.N. and Fuerschbach, P.W. 1989. GTA Welding Efficiency: Calorimetric and Temperature Field Measurements. Welding Journal, 68 (1), 1989, pp. 28-32.
Gladky, P. and Pavlenko, A. 1990. Development of Physical Concepts about the Plasma Transferred Arc Surfacing. In: Machida, S. (Ed.). Advanced Technology in Welding, Materials Processing and Evaluation, Proceedings, 5th International Symposium of the Japan Welding Society, Tokyo, Japan, 17-19 April 1990, pp. 399-404.
Goldak, J., Chakravarti, A. and Bibby, M. 1984. A New Finite Element Model for Welding Heat Sources. Metallurgical Transactions B, 15B (2), pp. 299-305.
Gregory, N. 1991. Cracking of Hardfacing Alloys – Prevent, Cure or Ignore? Bulletin 3, May/June 1991, TWI, pp. 52-54.
Hallén, H., Lugscheider, E. and Ait-Mekideche, A. 1992a. Plasma Transferred Arc Surfacing with High Deposition Rates. In: Bernecki, T.F. (Ed.). Thermal Spray Coatings: Properties, Processes and Applications, Proceedings, 4th National Thermal Spray Conference, Pittsburgh, USA, 4-10 May 1991, pp. 537-539.
Hallén, H., Mathesius, H., Ait-Mekideche, A., Hettiger, F., Morkramer, U. and Lugscheider, E. 1992b. New Applications for High Power PTA Surfacing in the Steel Industry. In: Berndt, C.C. (Ed.). Thermal Spray: International Advances in Coatings Technology, Proceedings, 13th International Conference, Orlando, USA, 28 May-5 June 1992, pp. 899-902.
Harris, P. and Smith, B.L. 1983. Factorial Techniques for Weld Quality Prediction. Metal Construction, 15 (11), pp. 661-666.
Heiple, C.R. and Roper, J.R. 1982. Mechanism for Minor Element Effect on GTA Fusion Zone Geometry. Welding Journal, 61 (5), pp. 97-102.
Herrström, C., Hallén, H., Ait-Mekideche, A. and Lugscheider, E. 1993. Factorial Analysis Applied to the PTA Process. DVS-Berichte, (152), TS93 Thermal Spraying Conference, Proceedings, Conference, Aachen, 3-5 March 1993, pp. 409-412.
Hertzberg, R.W. 1996. Deformation and Fracture Mechanics of Engineering Materials. John Wiley & Sons, Inc., New York, USA, 786 p.
Hettiger, F. 1992. Plasma Welding Known Since the 50s. PMI, 24 (1), pp. 14-18.

160
Holmberg, K. and Matthews, A. 1994. Coatings Tribology: Properties, Techniques and Applications in Surface Engineering. Dowson, D. (Ed.). Tribology Series, 28, Elsevier, Amsterdam, The Netherlands, 442 p.
Hu, J., Li, D.Y. and Llewellyn, R. 2005. Computational Investigation of Microstructural Effects on Abrasive Wear of Composite Materials. Wear, 259 (1), pp. 6-17.
Huang, X., Wang, R., Xu, L., Luo, H. and Yin, X. 1998. Applications of PTA Powder Welding in Petroleum Chemical Industry. In: Proceedings of the 15th International Thermal Spray Conference, Nice, France, 25-29 May 1998, pp. 1013-1017.
Hunt, C.S. 1988. Plasma Transferred Arc (PTA) Surfacing of Small and Medium Scale Components – a Review. Welding Institute Members Report 364/1988, pp. 3-46.
Hutchings, I.M. 1992. Tribology: Friction and Wear of Engineering Materials. Department of Materials Science and Metallurgy, University of Cambridge, Great Britain, 273 p.
Ishizaki, K., Okada, T. and Yokoya, S. 1994. Electromagnetic Force near the Anode Boundary and Double Convention in a TIG Arc Weldpool. Welding International, 8 (10), pp. 790-797.
Jones, H. 1981. Experimental Methods in Rapid Quenching from the Melt. In: Herman, H. (Ed.). Treatise on Materials Science and Technology, Volume 20, Ultrarapid Quenching of Liquid Alloys, Academic Press, New York, USA, pp. 1-72.
Kammer, P.A., Weinstein, M. and DuMola, R.J. 1992. Characteristics and Applications for Composite Wear-resistant Overlays. In: Bernecki, T.F. (Ed.). Thermal Spray Coatings: Properties, Processes and Applications, Proceedings of the 4th National Thermal Spray Conference, Pittsburgh, USA, 4-10 May 1991, pp. 513-518.
Kapus, B.G. 1980. Computer Control Takes the Variations Out of Hardfacing. Welding Design & Fabrication, 53 (6), pp. 84-88.
Kato, K. 1997. Wear Mechanisms. In: Hutchings, I.M. (Ed.). New Directions in Tribology, Conference, London, UK, 8-12 September 1997, pp. 39-56.
Khruschov, M.M. 1974. Principles of Abrasive Wear. Wear, 28 (1), pp. 69-88.
Kivikytö-Reponen, P. 2006. Correlation of Material Characteristics and Wear of Powder Metallurgical Metal Matrix Composites. Doctoral Thesis, Helsinki University of Technology, Espoo, Finland, 93 p.
Klimpel, A., Dobrza ski, L.A., Lisiecki, A. and Janicki, D. 2006. The Study of the Technology of Laser and Plasma Surfacing of Engine Valves Face Made of X40CrSiMo10-2 Steel using Cobalt-based Powders. Journal of Materials Processing Technology, 175 (1-3), pp. 251-256.

161
Koivula, J., Ahola, K. and Ahola, T. 1992. Plasmahitsaus helpottuu. Hitsaustekniikka, (6), pp. 13-16.
Kou, S. and Wang, Y.H. 1986. Weld Pool Convection and Its Effect. Welding Journal, 65 (3), pp. 63-70.
Kou, S. 1987. Welding Metallurgy. John Wiley & Sons, Inc., New York, USA, 411 p.
L’Estrade, L., Hallén, H. and Ljunggren, R. 1988. Internal Porosity of Gas Atomized Powders. In: Modern Developments in Powder Metallurgy, 20, Conference, Orlando, USA, 5-10 June 1988, pp. 187-203.
Lugscheider, E. and Ait-Mekideche, A. 1990. Increasing the Life of Components by Plasma Arc Surfacing with Composite Carbide Metal and Hard Alloy Powders. Schweissen & Schneiden, 42 (2), pp. 76-82 and E26-E29.
Lugscheider, E., Morkramer, U. and Ait-Mekideche, A. 1992. Advances in PTA Surfacing. In: Bernecki, T.F. (Ed.). Thermal Spray Coatings: Properties, Processes and Applications, Proceedings of the 4th National Thermal Spray Conference, Pittsburgh, USA, 4-10 May 1991, pp. 529-535.
Lugscheider, E., Ait-Mekideche, A. and Melzer, A. 1994. Improving the Properties of Hard Alloys by Weld Surfacing with Carbide Composite Powders. Schweissen & Schneiden, 46 (3), pp. 109-114 and E34-E37.
Lugscheider, E., Dehelean, D., Molnar, R. and Morkramer, U. 1995. Improving Abrasive Wear Resistance of Functional Surfaces by Plasma Transferred Arc Surfacing Using Particle Reinforced Alloys. In: Achievements and Prospects in the Fields of Welding and Materials Testing, Proceedings of 25 Year Jubilee Conference, Timisoara, Romania, 2, 24-26 May 1995, pp. 23-32.
Marantz, D.R. and Richardson, S.J. 1980. Plasma Transferred Arc Hardfacing, an Improved Process for Surfacing. In: General Aspects of Thermal Spraying, Preprints, Paper 38, 9th International Thermal Spraying Conference, ITSC 1980, The Hague, Netherlands, 19-23 May 1980, pp. 207-210.
Marimuthu, K. and Murugan, N. 2003. Prediction and Optimization of Weld Bead Geometry of Plasma Transferred Arc Hardfaced Valve Seat Rings. Surface Engineering, 19 (2), pp. 143-149.
Mathew, M.D., Mannan, S.L. and Gupta, S.K. 1980. Influence of Preheat Temperature on Stellite Deposits. Welding Journal, 59 (7), pp. 213-216.
Meng, H.C. and Ludema, K.C. 1995. Wear Models and Predictive Equations: Their Form and Content. Wear, 181-183 (2), pp. 443-457.

162
Menzel, M. 2003. The Influence of Individual Components of an Industrial Gas Mixture on the Welding Process and the Properties of Welded Joints. Welding International, 17 (4), pp. 262-264.
Messler, R.W. Jr. 1999. Weld Pool Convection, Oscillation, and Evaporation. In: Principles of Welding, Processes, Physics, Chemistry, and Metallurgy, Chapter 10, John Wiley and Sons, Inc., New York, USA, pp. 291-312.
Meyer, J.J. 1976. Plasma Hot Wire Surfacing. Welding Journal, 55 (2), pp. 97-100.
Mitelea, I. and Molnar, R. 1997. The Influence of Some Technological Parameters on the PTA Welded Layers Dilution. In: 60 Years of Scientific Co-operation in Welding, Proceedings, Jubilee Conference, Timisoara, Romania, 19-21 November 1997, pp. 437-442.
Moore, M.A. and King, F.S. 1980. Abrasive Wear of Brittle Solids. Wear, 60 (1), pp. 123-140.
Murugan, N. and Parmar, R.S. 1994. Effects of MIG Process Parameters on the Geometry of the Bead in the Automatic Surfacing of Stainless Steel. Journal of Materials Processing Technology, 41 (4), pp. 381-398.
Nefedov, B.B. and Lyalyakin, V.P. 1994. Calculating the Conditions of Plasma-powder Hardfacing of Shafts. Welding International, 8 (3), pp. 223-225.
Nefedov, B.B, Lyalyakin, V.P. and Steshenko, V.A. 1995. Programming the Process of Plasma-powder Surfacing of Shafts. Welding International, 9 (12), pp. 989-991.
Nishida, M., Araki, T. and Fujita, H. 1993. Effect of TiC-Cr3C2 Particles Content on Abrasive Resistance of Co-base Overlay Weld Alloy. Transactions of the Japan Welding Society, 24 (2), pp. 107-112.
Nishida, M., Araki, T., Shigekawa, Y., Asano, I. and Hayashi, Y. 1999. Sliding Wear Characteristics of Cobalt-based Overlay Weld Metal with Dispersed Boride Particles. Welding International, 13 (2), pp. 123-132.
Oberländer, B.C. and Lugscheider, E. 1992. Comparison of Properties of Coatings Produced by Laser Cladding and Conventional Methods. Materials Science and Technology, 8 (8), pp. 657-665.
Oechsle, M. and Szieslo, U. 2000. Einfluss von Schutzgasen auf die Schichtqualität von Plasmapulverschwei ungen. DVS-Berichte, (209), Welding and Cutting 2000, Proceedings, Welding Conference, Nurnberg, Germany, 27-29 September 2000, pp. 326-333.
Pavelic, V., Tanbakuchi, R., Uyehara, O.A. and Myers, P.S. 1969. Experimental and Computed Temperature Histories in Gas Tungsten-arc Welding of Thin Plates. Welding Journal, 48 (7), pp. 295-305.

163
Pavlenko, A. 1996. Neue Kenntnissse über Physikalische Grundlagen des Plasma-Pulver-Auftragschwei ens als Basis für die Proze steuerung. Doctoral Thesis, Rheinisch-Westfälischen Technischen Hochschule Aachen, Germany, 119 p.
Pfeiffer, E. and Wittmann, P. 1984. Metallurgy and Welding Parameters of Mechanized Plasma Overlay Welding Processes. DVS-Berichte, (90), Schweissen und Schneiden 1984, Proceedings, Conference, Frankfurt, Germany, 26-28 September 1984, pp. 36-39.
Rabinowicz, E. 1965. Friction and Wear of Materials. John Wiley and Sons, Inc., New York, USA, 244 p.
Radaj, D. 1992. Heat Effects of Welding. Springer-Verlag, Berlin, Heidelberg, Germany, 348 p.
Raghu, D. and Webber, R. 1996. PTA Proves Its Worth in High-Volume Hardfacing Jobs. Welding Journal, 75 (2), pp. 34-40.
Rasche, S. 1973. Grundsätzliche Untersuchungen zur Physik und Technologie des Plasma-Auftragschwei ens. Doctoral Thesis, Rheinisch-Westfälischen Technischen Hochschule Aachen, Germany, 179 p.
Rykalin, N.N. 1957. Berechnung der Wärmevorgänge beim Schweissen. VEB Verlag Technik, Berlin, Germany, 326 p.
Röthig, J., Kecke, H.J., Reiter, R. and Draugelates, U. 1997. Iron Carbide Coatings with Metastable Iron-manganese Matrix. Schweissen & Schneiden, 49 (4), pp. 220-222, 224 and E56-E58.
Sahin, Y. 2005. The Prediction of Wear Resistance Model for the Metal Matrix Composites. Wear, 258 (11-12), pp. 1717-1722.
Saltzman, G.A. and Aufderhaar, W.B. 1985. New Antiwear Coatings Applied by Plasma-transferred Arc Wearsurfacing. Journal of the American Society of Lubrication Engineers, 41 (4), 39th Annual Meeting, Chigaco, USA, 7-10 May 1984, pp. 233-241.
Saltzman, G.A. and Sahoo, P. 1992. Applications of Plasma Arc Weld Surfacing in Turbine Engines. In: Bernecki, T.F. (Ed.). Thermal Spray Coatings: Properties, Processes and Applications, Proceedings, 4th National Thermal Spray Conference, Pittsburgh, USA, 4-10 May 1991, pp. 541-548.
Sexton, G.D. and Walduck, R.P. 1994. Plasma Transferred Arc Weld Surfacing. In: Eurojoin 2, Proceedings, 2nd European Conference on Joining Technology, Florence, Italy, 16-18 May 1994, pp. 545-554.
Shanmugam, R. and Murugan, N. 2004. Optimization and Sensitivity Analysis of Wear Model of Stellite-6 Hardfacing by Gas Tungsten Arc Welding Process. Journal-MM, 85, The Institution of Engineers (India), pp. 65-70.

164
Sharples, R.V. 1985. The Plasma Transferred Arc (PTA) Weld Surfacing Process. Welding Institute Members Report, 283/1985.
Shin, J.-C., Doh, J.-M., Yoon, J.-K., Lee, D.-Y. and Kim, J.-S. 2003. Effect of Molybdenum on the Microstructure and Wear Resistance of Cobalt-base Stellite Hardfacing Alloys. Surface and Coatings Technology, 166 (2-3), pp. 117-126.
Shubert, G. 1992. Advances in Plasma Transferred Arc Process Equipment and How This Can Effect New Application Development. In: Bernecki, T.F. (Ed.). Thermal Spray Coatings: Properties, Processes and Applications, Proceedings, 4th National Thermal Spray Conference, Pittsburgh, USA, 4-10 May 1991, pp. 519-524.
Siagam, A.T., Brenner, G., Giese, P. and Wesling, V. 2008. Numerical and Experimental Study of Particle Motion in Plasma Arc Welding. FDMP, 4 (2), pp. 77-83.
Sintoni, F., Gimondo, P., Grifoni, B. and Taraschi, I. 1992. Tribological and Microstructural Characterization of Grade 60 NiCrBSi Welded Coatings Deposited by PTA Technology on a Steel Substrate. In: Berndt, C.C. (Ed.). Thermal Spray: International Advances in Coatings Technology, Proceedings, 13th International Conference, Orlando, USA, 28 May-5 June 1992, pp. 887-891.
Steklov, O.I., Alekseev, A.V., Aleksandrov, O.A., Smirnov, V.I. and Ovcharenko, L.V. 1989. A High-productivity Process of Plasma Arc Hot Wire Surfacing. Welding International, 3 (12), pp. 1058-1059.
Stevenson, A.N.J. and Hutchings, I.M. 1996. Development of the Dry Sand/Rubber Wheel Abrasion Test. Wear, 195 (1), pp. 232-240.
Stout, R.D. 1987. Weldability of Steels. 4th ed., Welding Research Council, New York, USA, 441 p.
Sun, Z. and Huang, Z.H. 1998. Micro-PTA Powder Cladding on a Hot Work Tool Steel. International Journal of Materials and Product Technology, 13 (3-6), pp. 146-154.
Talonen, J., Aspegren, P. and Hänninen, H. 2004. Comparison of Different Methods for Measuring Strain Induced ´-martensite Content in Austenitic Steels. Materials Science and Technology, 20 (12), pp. 1506-1512.
Takeuchi, Y. and Nagata, M. 1985. Application of Plasma Powder Welding to Engine Valves. SAE International, SAE Technical Papers, No. 850518, 7 p.
Teupke, S.E. 2002. Entwicklung vanadinkarbidhaltiger Schwei zusätze auf Eisenbasis f r den Schutz gegen komplexe Beanspruchungen. Doctoral Thesis, Technischen Universität Clausthal, Germany, 112 p.
Torrence, A.A. 2005. Modelling Abrasive Wear. Wear, 258 (1-4), pp. 281-293.

165
Tsubouchi, K., Akiyama, M. and Okuyama, T. 1997. Development and Optimization of Carbide-reinforced Tools and Application to Hot Rolling of Stainless Steel. Journal of Tribology, 119 (4), pp. 687-693.
Tucker, R.C. Jr. 1997. Wear Failures. In: Friction and Wear Testing, Source Book: Selected References from ASTM Standards and ASM Handbooks, ASM International, Materials Park, OH, USA, pp. 168-185.
Ushio, M. 1991. Mathematical Modelling of Flow in the Weld Pool, Part II. Welding International, 5 (8), pp. 593-597.
Wahl, W. and Krauskopf, F. 1993. Plasmapulverauftragschwei en von Eisenwerkstoffen. Schweissen & Schneiden, 45 (2), pp. 84-85 and E27-E28.
Wang, A. and Rack, H.J. 1991. Abrasive Wear of Silicon Carbide Particulate- and Whisker-reinforced 7091 Aluminium Matrix Composites, Wear, 146 (2), pp. 337-348.
Wang, S.-H., Chen, J.-Y. and Xue, L. 2006. A Study of the Abrasive Wear Behaviour of Laser-clad Tool Steel Coatings. Surface & Coatings Technology, 200 (11), pp. 3446-3458.
Wilden, J., Bergmann, J.P. and Frank, H. 2006. Plasma Transferred Arc Welding – Modeling and Experimental Optimization. Journal of Thermal Spray Technology, 15 (4), pp. 779-784.
Wu, W., Hwu, L.Y., Lin, D.Y. and Lee, J.L. 2000. The Relationship between Alloying Elements and Retained Austenite in Martensitic Stainless Steel Welds. Scripta Materialia, 42 (11), pp. 1071-1076.
Xibao, W. and Hua, L. 1998. Metal Powder Thermal Behaviour during the Plasma Transferred-arc Surfacing Process. Surface and Coatings Technology, 106 (2-3), pp. 156-161.
Xibao, W., Jia, F.-S., Wang, X.-F. 2002. Evaluation of Powder’s Thermal Behaviour in Plasma Transferred-arc Space (Part I). Transactions of the China Welding Institution, 23 (4), pp. 13-16.
Xibao, W. 2003. Comparisons of Particles Thermal Behaviour between Fe-base Alloy and Boron Carbide during Plasma Transferred-arc Powder Surfacing. China Welding, 12 (1), pp. 67-71.
Xu, L., Xing, J., Wei, S., Zhang, Y. and Long, R. 2007. Study on Relative Wear Resistance and Wear Stability of High-speed Steel with High Vanadium Content. Wear, 262 (3-4), pp. 253-261.
Yamamoto, A. and Hashimoto, Y. 1997. New Surface Treatment Technology with a Plasma Transferred Arc Welding Process. Kobelco Technology Review, (20), pp. 42-46.

166
Yellup, J.M. and Wigley, P. 1996. Variation in Properties of Chromium Carbide Surfaces Deposited at Extremities of Recommended Welding Parameters. Australian Welding Research, CRC (16), 20 p.
Yokoya, S., Okada, T. and Matsunawa, A. 1994. Penetration Shape in Carbon Steel Welds Produced by a Stationary TIG Arc. Welding International, 8 (10), pp. 781-789.
Zum Gahr, K.-H. 1987. Microstructure and Wear of Materials. Tribology Series, 10, Elsevier, Amsterdam, The Netherlands, 560 p.
Zum Gahr, K.-H. 1988. Modelling of Two-body Abrasive Wear. Wear, 124 (1), pp. 87-103.
Zum Gahr, K.-H. 1995. Development of Materials to Resist Unlubricated Sliding Wear. In: Sudarshan, T.S., Jeandin, M., and Stiglich, J.J. (Eds.). Surface Modification Technologies VIII: Proceedings of the 8th International Conference on Surface Modification Technologies Held in Nice, France, September 26-28, 1994, The Institute of Materials (Great Britain), pp. 3-16.
Zum Gahr, K.-H. 1997. Wear by Hard Particles. In: Hutchings, I.M. (Ed.). New Directions in Tribology, Conference, London, UK, 8-12 September 1997, pp. 483-494.
Ågren, J. 1990. Kinetics of Carbide Dissolution. Scandinavian Journal of Metallurgy, 19 (1), pp. 2-8.

ISBN 978-952-60-3109-5ISBN 978-952-60-3110-1 (PDF)ISSN 1795-2239ISSN 1795-4584 (PDF)