Height and Prostate Cancer Risk: A Large Nested Case-Control Study (ProtecT) and Meta-analysis
23
Height and Prostate Cancer Risk: A Large Nested Case-Control Study (ProtecT) and Meta-analysis Luisa Zuccolo 1 , Ross Harris 1 , David Gunnell 1 , Steven Oliver 2 , Jane Athene Lane 1 , Michael Davis 1 , Jenny Donovan 1 , David Neal 3 , Freddie Hamdy 4 , Rebecca Beynon 1 , Jelena Savovic 1 , and Richard Michael Martin 1 1 Department of Social Medicine, University of Bristol, Bristol, United Kingdom 2 Department of Health Sciences, University of York and the Hull York Medical School, Heslington, York, United Kingdom 3 Surgical Oncology (Uro-Oncology S4), Departments of Oncology and Surgery, University of Cambridge, Addenbrooke’s Hospital, Cambridge, United Kingdom 4 Academic Urology Unit, University of Sheffield, Royal Hallamshire Hospital, Sheffield, United Kingdom Abstract Background—Height, a marker of childhood environmental exposures, is positively associated with prostate cancer risk, perhaps through the insulin-like growth factor system. We investigated the relationship of prostate cancer with height and its components (leg and trunk length) in a nested case-control study and with height in a dose-response meta-analysis. Methods—We nested a case-control study within a population-based randomized controlled trial evaluating treatments for localized prostate cancer in British men ages 50 to 69 years, including 1,357 cases detected through prostate-specific antigen testing and 7,990 controls (matched on age, general practice, assessment date). Nine bibliographic databases were searched systematically for studies on the height-prostate cancer association that were pooled in a meta-analysis. Results—Based on the nested case-control, the odds ratio (OR) of prostate-specific antigen- detected prostate cancer per 10 cm increase in height was 1.06 [95% confidence interval (95% CI): 0.97-1.16; p trend = 0.2]. There was stronger evidence of an association of height with high-grade prostate cancer (OR: 1.23; 95% CI: 1.06-1.43), mainly due to the leg component, but not with low-grade disease (OR: 0.99; 95% CI: 0.90-1.10). In general, associations with leg or trunk length were similar. A meta-analysis of 58 studies found evidence that height is positively associated Copyright © 2008 American Association for Cancer Research. Requests for reprints: Luisa Zuccolo, Department of Social Medicine, University of Bristol, Canynge Hall, Whiteladies Road, BS8 2PR, Bristol, United Kingdom. Phone: 44-117-928-7296; Fax: 44-117-928-7236. E-mail: [email protected]. Contributions: The hypothesis was developed by D. Gunnell, R.M. Martin, and S. Oliver. L. Zuccolo and R. Harris conducted the statistical analyses. L. Zuccolo and R.M. Martin cowrote the first draft and L. Zuccolo coordinated completion of the article. R.M. Martin and L. Zuccolo had full access to all the data in the study and take responsibility for the integrity of the data and the accuracy of the data analysis. R. Beynon, J. Savovic, and L. Zuccolo conducted the systematic review, deciding on inclusion/exclusion of manuscripts and extracting data for the meta-analysis. M. Davis and J.A. Lane managed the data collection and the study database. J. Donovan, D. Neal, and F. Hamdy designed the study and obtained funding for data collection. All authors critically commented on and edited earlier drafts and approved the final version of the article. The costs of publication of this article were defrayed in part by the payment of page charges. This article must therefore be hereby marked advertisement in accordance with 18 U.S.C. Section 1734 solely to indicate this fact. Disclosure of Potential Conflicts of Interest No potential conflicts of interest were disclosed. Department of Health disclaimer: The views and opinions expressed herein are those of the authors and do not necessarily reflect those of the Department of Health. Europe PMC Funders Group Author Manuscript Cancer Epidemiol Biomarkers Prev. Author manuscript; available in PMC 2009 March 25. Published in final edited form as: Cancer Epidemiol Biomarkers Prev. 2008 September ; 17(9): 2325–2336. doi: 10.1158/1055-9965.EPI-08-0342. Europe PMC Funders Author Manuscripts Europe PMC Funders Author Manuscripts
Transcript of Height and Prostate Cancer Risk: A Large Nested Case-Control Study (ProtecT) and Meta-analysis
Height and Prostate Cancer Risk:A Large Nested Case-Control Study (ProtecT) and Meta-analysis
Luisa Zuccolo1, Ross Harris1, David Gunnell1, Steven Oliver2, Jane Athene Lane1, MichaelDavis1, Jenny Donovan1, David Neal3, Freddie Hamdy4, Rebecca Beynon1, JelenaSavovic1, and Richard Michael Martin1
1Department of Social Medicine, University of Bristol, Bristol, United Kingdom2Department of Health Sciences, University of York and the Hull York Medical School, Heslington,York, United Kingdom3Surgical Oncology (Uro-Oncology S4), Departments of Oncology and Surgery, University ofCambridge, Addenbrooke’s Hospital, Cambridge, United Kingdom4Academic Urology Unit, University of Sheffield, Royal Hallamshire Hospital, Sheffield, UnitedKingdom
AbstractBackground—Height, a marker of childhood environmental exposures, is positively associatedwith prostate cancer risk, perhaps through the insulin-like growth factor system. We investigatedthe relationship of prostate cancer with height and its components (leg and trunk length) in anested case-control study and with height in a dose-response meta-analysis.
Methods—We nested a case-control study within a population-based randomized controlled trialevaluating treatments for localized prostate cancer in British men ages 50 to 69 years, including1,357 cases detected through prostate-specific antigen testing and 7,990 controls (matched on age,general practice, assessment date). Nine bibliographic databases were searched systematically forstudies on the height-prostate cancer association that were pooled in a meta-analysis.
Results—Based on the nested case-control, the odds ratio (OR) of prostate-specific antigen-detected prostate cancer per 10 cm increase in height was 1.06 [95% confidence interval (95% CI):0.97-1.16; ptrend = 0.2]. There was stronger evidence of an association of height with high-gradeprostate cancer (OR: 1.23; 95% CI: 1.06-1.43), mainly due to the leg component, but not withlow-grade disease (OR: 0.99; 95% CI: 0.90-1.10). In general, associations with leg or trunk lengthwere similar. A meta-analysis of 58 studies found evidence that height is positively associated
Copyright © 2008 American Association for Cancer Research.
Requests for reprints: Luisa Zuccolo, Department of Social Medicine, University of Bristol, Canynge Hall, Whiteladies Road, BS82PR, Bristol, United Kingdom. Phone: 44-117-928-7296; Fax: 44-117-928-7236. E-mail: [email protected]: The hypothesis was developed by D. Gunnell, R.M. Martin, and S. Oliver. L. Zuccolo and R. Harris conducted thestatistical analyses. L. Zuccolo and R.M. Martin cowrote the first draft and L. Zuccolo coordinated completion of the article. R.M.Martin and L. Zuccolo had full access to all the data in the study and take responsibility for the integrity of the data and the accuracyof the data analysis. R. Beynon, J. Savovic, and L. Zuccolo conducted the systematic review, deciding on inclusion/exclusion ofmanuscripts and extracting data for the meta-analysis. M. Davis and J.A. Lane managed the data collection and the study database. J.Donovan, D. Neal, and F. Hamdy designed the study and obtained funding for data collection. All authors critically commented onand edited earlier drafts and approved the final version of the article.
The costs of publication of this article were defrayed in part by the payment of page charges. This article must therefore be herebymarked advertisement in accordance with 18 U.S.C. Section 1734 solely to indicate this fact.
Disclosure of Potential Conflicts of InterestNo potential conflicts of interest were disclosed.
Department of Health disclaimer: The views and opinions expressed herein are those of the authors and do not necessarily reflectthose of the Department of Health.
Europe PMC Funders GroupAuthor ManuscriptCancer Epidemiol Biomarkers Prev. Author manuscript; available in PMC 2009 March 25.
Published in final edited form as:Cancer Epidemiol Biomarkers Prev. 2008 September ; 17(9): 2325–2336. doi:10.1158/1055-9965.EPI-08-0342.
Europe PM
C Funders A
uthor Manuscripts
Europe PM
C Funders A
uthor Manuscripts
with prostate cancer (random-effects OR per 10 cm: 1.06; 95% CI: 1.03-1.09), with a strongereffect for prospective studies of more advanced/aggressive cancers (random-effects OR: 1.12;95% CI: 1.05-1.19).
Conclusion—These data indicate a limited role for childhood environmental exposures—asindexed by adult height—on prostate cancer incidence, while suggesting a greater role forprogression, through mechanisms requiring further investigation.
IntroductionA growing body of evidence indicates that greater height—a marker of diet and healththroughout the growing years (1)—is positively associated with prostate cancer risk. Manycohort and case-control studies published thus far show an increase in risk of up to 20% to40% for the top compared with the bottom height quantiles, suggesting the possibility of along-term influence of childhood nutrition on carcinogenesis (2). Many studies are based onvery small numbers, overall findings are inconsistent, and few studies assess the componentsof height (leg and trunk length) in relation to prostate cancer. Examining the relationship ofcancer with leg and trunk length may indicate sensitive periods during childhood growthwhen risk factors or biological mechanisms underlying height-cancer associations operate(3). It has been shown that prepubertal growth is due more to an increase in leg length ratherthan trunk length (4), and leg length is sensitive to maternal smoking in pregnancy (5),socioeconomic conditions, nutrition (in particular milk intake; ref. 6), and energy intake inprepubertal children (7). Trunk length reflects factors influencing pubertal growth (7, 8) andis affected by “shrinkage” in late adult life due to compression of the spine (9).
The most plausible biological mechanism for the association of height with prostate canceris that involving insulin-like growth factor-I (IGF-I) levels in childhood, of which height is amarker (10). In turn, IGF-I levels in adulthood are positively associated with prostate cancer(11).
We investigated the relationship of height and its components to prostate cancer in a case-control study nested within the intensive population-based prostate-specific antigen (PSA)testing phase of the Prostate Testing for Cancer and Treatment (ProtecT) study (12).
In addition, we placed our results in the context of the available evidence by systematicallyreviewing the published literature on the association between height and prostate cancer andmeta-analyzing dose-response estimates derived from retrieved studies. Two previousreviews have been published on this topic (3, 13), but only one included a meta-analysis andwas not specifically focused on height as it was part of a broader study on body size andcomposition (13). Compared with previous studies, our analysis explored in greater detailsources of heterogeneity, including publication bias and the influence of PSA testing oneffect estimates (14, 15). We performed additional analysis in the ProtecT study and themeta-analysis by distinguishing between clinical subgroups (defined by grade and/or stage),where possible, to explore whether height could have differing effects on prostate cancerinitiation versus progression.
Subjects and MethodsNested Case-Control Study
Prostate Cancer Detection—ProtecT is an ongoing randomized controlled trial,evaluating the effectiveness of treatment for clinically localized prostate cancer (12). Menaged 50 to 69 years registered with 400 general practices located around nine U.K. cities areinvited to a prostate check clinic where PSA testing is carried out. Men with an increased
Zuccolo et al. Page 2
Cancer Epidemiol Biomarkers Prev. Author manuscript; available in PMC 2009 March 25.
Europe PM
C Funders A
uthor Manuscripts
Europe PM
C Funders A
uthor Manuscripts
PSA (≥3 ng/mL) are invited for digital rectal examination, repeat PSA test, and transrectalultrasound-guided biopsy (10 cores).
Men with a normal biopsy are offered repeat biopsy if the PSA is persistently increased or ifthere is a high index of clinical suspicion (chiefly evidence of high-grade prostaticintraepithelial neoplasia or suspicious features on initial biopsy). Histologic materialobtained at biopsy is reviewed by specialized pathologists and given a Gleason score;tumors with a Gleason score ≥7 were considered high grade. Clinical staging used thetumor-node-metastasis staging system (16). Cases with stages T1-T2 and NXM0 wereclassified as localized cancers; those with T3-T4 were classified as advanced prostatecancers.
Case-Control Selection—This study is nested within the ProtecT PSA-tested cohort.Cases were men aged 50 to 69 years with histologically confirmed prostate cancer, detectedamong the 59,217 men who attended for PSA testing and had their PSA result recordedbetween November 2001 and November 2006. Prostate cancers diagnosed over 2 years afterthe initial PSA test were excluded from this analysis to distinguish “PSA-detected” frompossible “incident” cancers. During this period, 6,329 men (11%) had increased PSA levels;of these, 2,022 (32%) had histologically confirmed prostate cancer.
All participants in the ProtecT cohort who had no evidence of prostate cancer were eligiblefor selection as controls. These included all men with a PSA below 3.0 ng/mL and any menwith a PSA above this threshold who were biopsy negative. Cases were frequency matchedto up to six controls by age of attendance at the check clinic (5-year age bands) and thegeneral practice from which they were recruited. As the clinics were held and completed ineach general practice in turn, matching for general practice automatically matched for thecalendar date of recruitment.
All study participants gave fully informed consent for the use of their data for researchpurposes. The study received ethical approval from Trent MREC.
Exposure Assessment—All participants were asked to complete a health and lifestylequestionnaire after the check clinic but before their PSA result was available. Thequestionnaire included the following questions on height and leg length: “How tall are you?”(feet and inches) and “What is your inside leg measurement? (If you do not know, pleaseexamine a pair of your trousers)” (inches). All measures were converted to centimeters, andtrunk length was calculated as total height minus leg length (estimated from inside legmeasurement). Self-reported data on current weight, lifestyle, diet, comorbidities,occupation, ethnicity, and early-life factors (including birth weight and number of siblings)were also obtained from the questionnaires.
Overall 1,419 (70% of the total) men with histologically confirmed prostate cancer [1,230(87%) localized cancers] and 8,343 controls returned the questionnaire and completed thesections on height and leg length. Sixty-two cases and 353 controls were excluded becauseof implausible values; thus, the analysis was based on 1,357 (67% of the total) cases (1,180localized) and 7,990 controls.
Statistical Analysis of the ProtecT Nested Case-Control StudyConditional logistic regression was used to estimate odds ratios (OR) and 95% confidenceintervals (95% CI) for the association of height, leg, and trunk length with PSA-detectedprostate cancer. As the men were stratum-matched in broad 5-year age bands (5 years), andthe risk of prostate cancer increases steeply with age, age as a continuous variable was alsoentered in all models. ORs were compared across quartiles of height measures, using cutoffs
Zuccolo et al. Page 3
Cancer Epidemiol Biomarkers Prev. Author manuscript; available in PMC 2009 March 25.
Europe PM
C Funders A
uthor Manuscripts
Europe PM
C Funders A
uthor Manuscripts
derived from the distribution of controls and the lowest quartile as the reference group.Estimates of dose-response effects were then derived, per 10 cm increase in height and 5 cmincrease in leg or trunk length, and per SD increase for all exposures, by fitting models withthe exposures as continuous variables. Wald tests were used to test for linear trend across theheight distribution. Additional models for leg length were adjusted for trunk length and viceversa, to account for total height and investigate whether the biologically relevantmeasurement is disproportion or absolute length of the leg or trunk (17). Geneticsusceptibility, as indexed by family history of prostate cancer, and early life factorscorrelated with adult height were adjusted for in multivariable models. These factorsincluded self-reported birth weight, number of siblings, and occupational socioeconomicclass (dichotomized as manual and nonmanual, according to their main occupationthroughout life). Number of siblings and socioeconomic class may index some of theputative risk factors for prostate cancer that height is a marker for, rather than confound theheight-cancer association, so the fully adjusted multivariable models were interpreted withcaution.
To investigate whether associations of height with prostate cancer differed for sporadiccompared with familial tumors, age, or ethnic groups—which have very different baselinerates of incident and fatal disease—we tested for interactions using likelihood ratio tests.
Associations of cancer risk with height measures were assessed separately by stage, usingmultinomial logistic regression adjusted for the matching factors, with the outcome variablegrouped into three categories: controls, localized cases (stage T1 or T2; NXM0), andadvanced cases (stage T3 or T4). Similarly, low-grade (Gleason sum <7) and high-grade(Gleason sum ≥7) cases were compared with controls in multinomial regression models.Heterogeneity in associations of height with localized compared with advanced stage orlow-grade compared with high-grade cancers were tested using Wald tests.
A different probability of detecting prostate cancer in taller men compared with shorter mencould bias the estimates of height-prostate cancer association. To evaluate the likelihood ofthis particular detection bias, the mean percentage variation of PSA levels across quartiles ofheight among controls was estimated by fitting linear regression models to logged PSAvalues, adjusting for age, center, and date of PSA testing.
Stata 10.1 was used for all statistical analyses (Stata Corp.).
Systematic ReviewThis review was undertaken as part of a systematic review on the associations of food,nutrition, and physical activity with prostate cancer, funded by the World Cancer ResearchFund (18). The review protocol is publicly available (19) and details on searches, inclusioncriteria, data extraction procedures, and statistical analysis are available in theSupplementary Methods.
We fitted to the data both fixed-effect and random-effects models; we gave preference to therandom-effects meta-analysis, which accounts for between-study heterogeneity.
Sensitivity AnalysisStudy Quality—No set of quality criteria on the design and analysis of observationalstudies is available. It is generally agreed that cohort studies provide higher quality/morerobust evidence than case-control studies. Therefore, results from prospective studies(including cohort, case-cohort and nested case-control, and hereafter referred to as “cohort”)were analyzed separately from case-control studies, and further subgroup analyses weredone on cohort results only. For the initial (main) pooled analysis, case-control studies were
Zuccolo et al. Page 4
Cancer Epidemiol Biomarkers Prev. Author manuscript; available in PMC 2009 March 25.
Europe PM
C Funders A
uthor Manuscripts
Europe PM
C Funders A
uthor Manuscripts
classified based on the selection of controls as stated by the authors. We indicated as “samepopulation” case-control studies those in which the sampled controls were such that theywould have become cases (according to the study’s definition of case) had they developedthe disease, and all the others as “non-same population,” which we considered to be of lowerquality. Differences across study design were formally tested by fitting meta-regressionmodels.
Publication Bias—Most prospective studies collect baseline data on anthropometry. Outof 31 publications from cohort studies included in this meta-analysis, 19 reported on heightor anthropometry as (one of) their primary exposure(s) in the abstract: 18 from thesystematic review and the ProtecT nested case-control study. However, 12 articles, notmentioning height in the title or abstract, included results on the height-prostate cancerassociation in the full text and we classified these as “incidental” findings. To assesswhether positive results on the height-prostate cancer association were more likely to bepublished and included in the abstract, we further distinguished between primary versusincidental reporting and tested for the difference in the pooled effect estimates by fitting alinear meta-regression model.
Detection Bias—The advent of widespread use of PSA screening started in the early1990s and changed the nature of the cases being identified from more advanced to early/small lesions. Choosing 1990 as the temporal cutoff, we did a further subgroup analysis,stratifying on whether the follow-up period was mostly pre-PSA (>50% of follow-upoccurring <1990) or during the PSA era. The contribution of the proportion of pre-PSAfollow-up time to explaining heterogeneity was explored in a meta-regression analysis.
Biological Significance—Because it is not known whether the mechanisms underlyingthe association with height act on progression rather than initiation, increasing the risk ofpoorly rather than well-differentiated lesions, we did subgroup analyses after restricting todata on advanced or aggressive cancers (available from 13 cohort studies). We referred to“advanced or aggressive” cases if the article specified any of the following in their casedefinition: (a) T stage 3 to 4 on the American Joint Committee on Cancer 1992classification, (b) advanced cancer, (c) advanced or metastatic cancer, (d) metastatic cancer,(e) stage C or D on the Whitmore/Jewett scale, (f) fatal cancer, (g) “high-stage” or “high-grade,” or (h) Gleason score ≥7.
Due to the poor reporting of ethnicity, no stratified analysis was attempted. Results onsubgroups of black men available from three cohort (20, 21) and two same population case-control studies (22, 23) from the United States were presented in narrative form.
ResultsProtecT Nested Case-Control Study
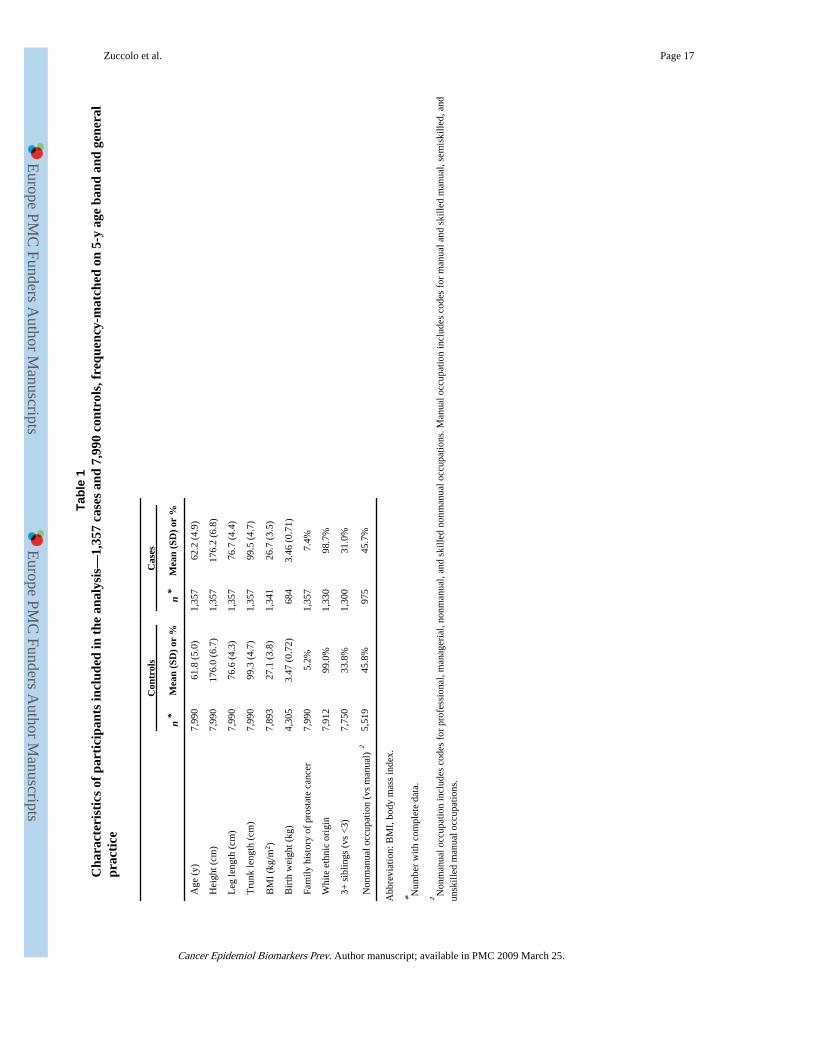
Of the 1,357 PSA-detected cases of prostate cancer included in the analysis, 173 hadadvanced-stage disease (missing for 4 cases) and 402 had Gleason score ≥7 (missing for 19cases; ≥8 for 59 cases). The distribution of demographic, anthropometric, andsocioeconomic characteristics of the 1,357 cases and 7,990 controls are presented in Table 1.
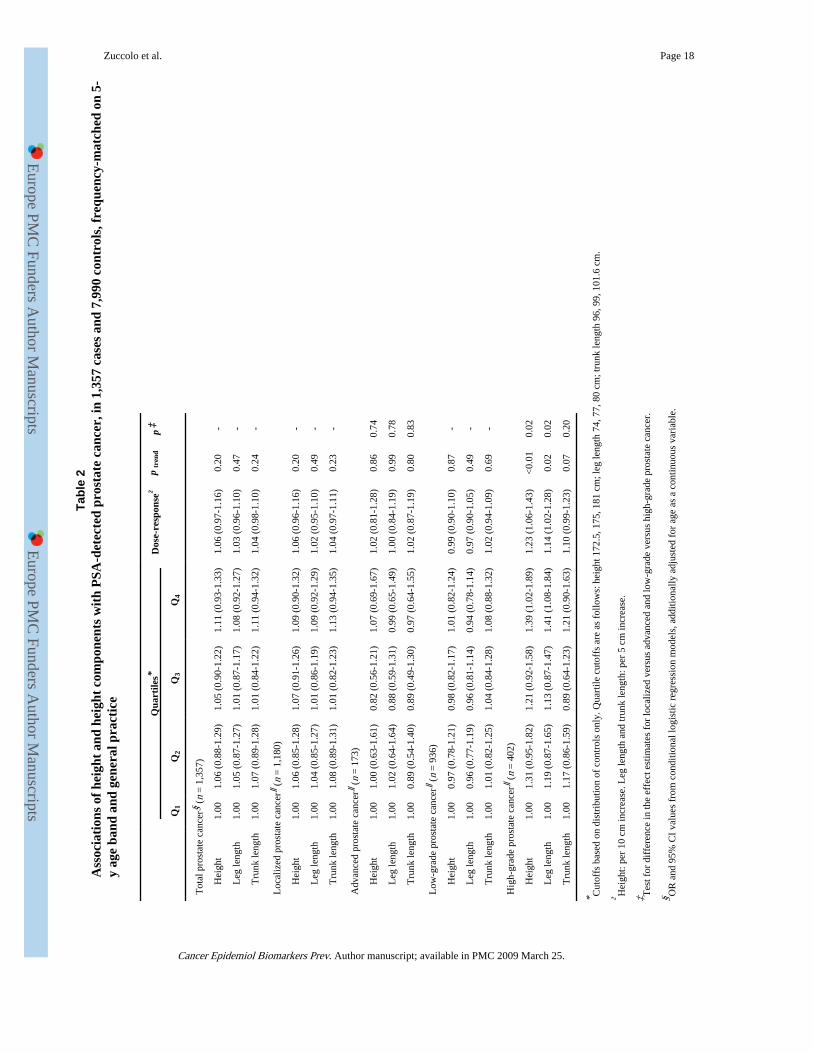
There was a 6% (95% CI, −3;-16%) increased risk of PSA-detected prostate cancer per 10cm increase in height but the statistical evidence supporting this association was weak (ptrend= 0.2). There was no evidence that associations were stronger comparing leg length versustrunk length (Table 2). Comparable results were found for localized and advanced-stageprostate cancer end points, for all height measures (all p for differences in effect estimates
Zuccolo et al. Page 5
Cancer Epidemiol Biomarkers Prev. Author manuscript; available in PMC 2009 March 25.
Europe PM
C Funders A
uthor Manuscripts
Europe PM
C Funders A
uthor Manuscripts
by stage ≥0.74; Table 2). Models including simultaneously leg and trunk length yielded verysimilar effect estimates to the ones from this main analysis (data not shown).
There was no evidence of an increased risk of low-grade tumors with increasing height, leglength, or trunk length. However, for high-grade tumors, we found strong evidence of a 23%increase in risk per 10 cm increase in height (ptrend < 0.01), with a p value of 0.02 for thedifference in height associations for low-grade compared with high-grade cancers (Table 2).This seemed to be mainly due to the leg component and in particular to long-for-total-heightlegs, as in a model including both height components there remained some evidence for aneffect of leg length (OR per 5 cm increase, 1.13; 95% CI, 1.01-1.27; ptrend = 0.04), but lessso for trunk length (OR per 5 cm increase, 1.09; 95% CI, 0.98-1.21; ptrend = 0.12). As asensitivity analysis, we reclassified as high grade only those cases with Gleason ≥8 andobtained similar point estimates with wider confidence intervals due to the limited numberof cases (n = 59). Results were very similar when ORs were estimated per SD increase inheight (SD 6.7 cm), leg length (SD 4.3 cm), and trunk length (SD 4.7 cm; data not shown).Further adjustments for family history of prostate cancer, socioeconomic position, birthweight, or number of siblings did not change the estimates and are thus not reported. Therewas no evidence of effect modification by family history of prostate cancer, age, or self-reported ethnic origin.
An analysis adjusted for age, center, and date of PSA testing showed evidence that PSAvalues were on average 9% lower (95% CI, 4-14%, p = 0.001) for controls in the tallestquartile compared with those in the shortest quartile. For both leg and trunk length, thecorresponding average PSA difference was 6% (95% CI, 1-10%, p = 0.02).
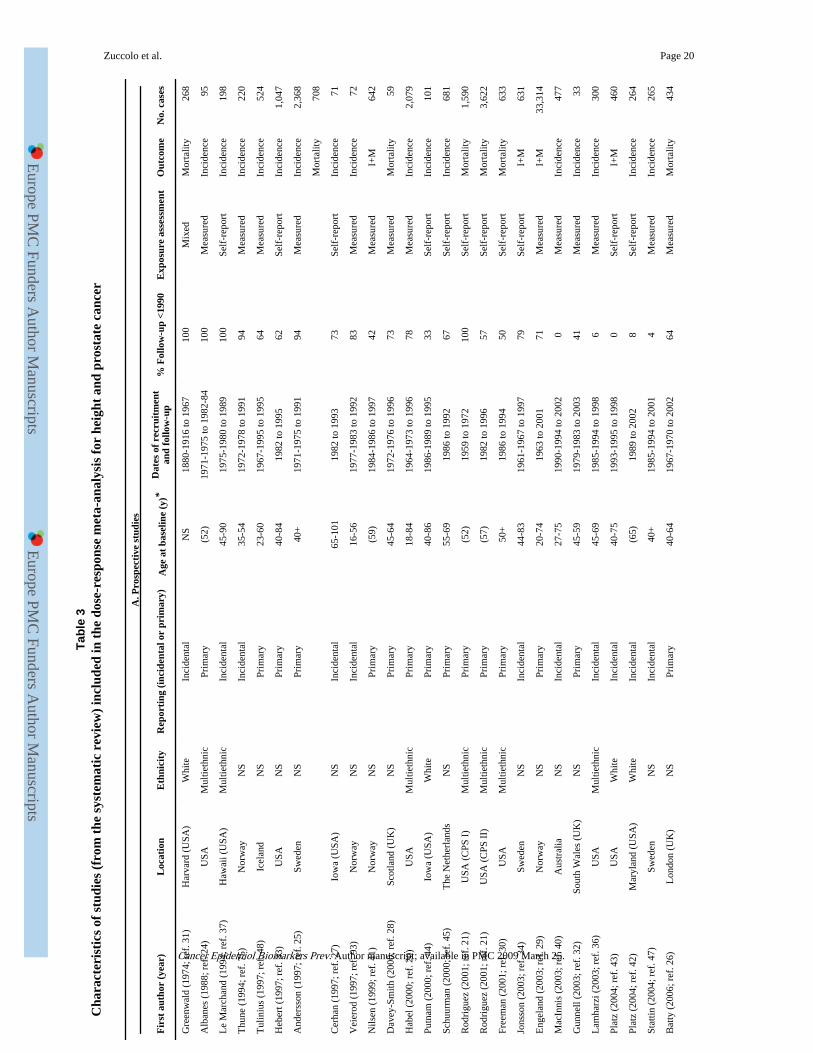
Systematic ReviewThe search strategy for the broad World Cancer Research Fund review yielded 19,448 hits,of which 1,070 were retrieved for full-text screening. From these, results on 30 cohort (20,21, 24-48) and 27 case-control studies (22, 23, 49-73) could be included in the current meta-analysis (Fig. 1). Table 3 presents the characteristics of studies identified through thesystematic searches and included in the meta-analysis. We included 20 of the 21 cohorts andall 18 case-control studies that were in the meta-analysis of MacInnis et al. (13), althoughthe article by Giovannucci et al. (74) was excluded as we included a more recent report fromthe same study (43). Additionally, we included three more cohorts (36, 42, 75) and fivecase-control studies (57, 60, 64, 65, 70) published in the period covered by MacInnis’searches (up to October 31, 2004), and six (26, 35, 38, 39, 46, 47) and four (61, 66, 67, 69)new studies published between November 1, 2004, and July 31, 2007.
Overall, the meta-analysis pooling adjusted results from all 58 studies found evidence of amodest increase in risk of prostate cancer per 10 cm increase in height (random-effects OR,1.06; 95% CI, 1.03-1.09; Fig. 2).
Results from the Egger test showed no evidence of small study effects for case-controlstudies, but some for prospective studies (cohorts, p = 0.013), which was not confirmed byBegg’s test (cohorts: p = 0.424). There was no clear indication of asymmetry from thefunnel plot, for any of the study designs (Supplementary Fig. S1).
Sensitivity AnalysisStudy Quality—There was evidence of heterogeneity across study design (pheterogeneity =0.001; Fig. 2). Evidence for, and the magnitude of, the effect of height on prostate cancerwere strongest for cohorts (OR, 1.09; 95% CI, 1.06-1.12, n = 31) and heterogeneity waslower (I2 = 23%) compared with all case-control studies. Only weak evidence of an
Zuccolo et al. Page 6
Cancer Epidemiol Biomarkers Prev. Author manuscript; available in PMC 2009 March 25.
Europe PM
C Funders A
uthor Manuscripts
Europe PM
C Funders A
uthor Manuscripts
association of height with prostate cancer was found pooling same-population case-controlstudies (OR, 1.03; 95% CI, 0.97-1.10, I2 = 36%, n = 15), and there was no evidence of aheight-prostate cancer association for non-same population studies (OR, 0.98; 95% CI,0.86-1.10; I2 = 49%, n = 12; Fig. 2).
Publication Bias—There was evidence that pooled estimates differed according towhether the study reported on height as (one of) the primary exposure(s) or only incidentally(pheterogeneity = 0.002; Table 4). Based on data from the 19 publications focused on height-cancer associations, there was evidence of an 11% increase in prostate cancer risk per 10 cmincrease in height (95% CI, 9-13%; I2 = 7%). In contrast, the 12 studies reporting results asincidental findings yielded an OR of 1.01 (95% CI, 0.95-1.07; I2 = 0%; Table 4).
Detection Bias—When stratifying on whether the follow-up period was mostly in the pre-PSA era (>50% of follow-up occurring <1990) or during the PSA era, we found similareffects (pheterogeneity = 0.12), with the former studies carrying more heterogeneity (I2 = 29%versus 4%; Table 4).
Stage and Grade—Results based on advanced or aggressive cancer outcomes, includingfatal disease, were available from 13 cohorts (12 from the review and the current ProtecTdata) and showed marked between-study heterogeneity (I2 = 47%; Table 4). The pooledestimate was higher than for the all-prostate cancer analysis based on prospective studies(OR, 1.12; 95% CI, 1.05-1.19).
Ethnicity—None of the five studies (all from the United States) presenting ethnicity-specific results found evidence of a height-prostate cancer association among high-riskethnic groups. Habel et al. (20) reported a hazard ratio of 0.75 (95% CI, 0.42-1.31)comparing the top versus bottom quintile of height among black men in a cohort study.Results on black men were included in a publication with results from rounds I and II of theCancer Prevention Study: the hazard ratio for prostate cancer comparing black men ≥70versus ≤66 inches were 0.63 (95% CI, 0.32-1.25) and 0.89 (95% CI, 0.66-1.21), respectively(21). One case-control study did not find any difference in mean height comparing blackcases and controls (23). Another presented an OR of 0.9 (95% CI, 0.6-1.5) comparing blackmen who were tall in childhood versus those who were short (22).
DiscussionBased on a meta-analysis of 58 studies, including new results from a nested case-control ofPSA-detected prostate cancer (ProtecT), we found evidence that greater stature is associatedwith an increased prostate cancer risk. The overall magnitude of the effect was modest andvaried with study design, yet results from cohort studies were compatible with a 6% to 12%increase in risk per 10 cm increase in height, and a 5% to 19% increase in risk for moreadvanced and/or aggressive cancers. Between-study heterogeneity was higher for case-control studies and for those cohorts including higher proportions of clinically detected,more advanced, or aggressive cancers. Results from the ProtecT nested case-control studywere in line with the meta-analysis, with a stronger association for high-grade cancers.
This article benefits both from the strengths offered by analyzing original data and from thepower of a meta-analysis based on inclusive systematic searches. The ProtecT case-controlseries is a population-based study that allowed us to investigate the separate effects ofdifferent height components on cancer risk, split by both stage and grade (76). These dataare unlikely to be affected by detection bias for two reasons. First, all men had been invitedto PSA testing and therefore the likelihood of cancer detection should be unrelated toconfounding factors associated with access to or take up of PSA testing. Second, we showed
Zuccolo et al. Page 7
Cancer Epidemiol Biomarkers Prev. Author manuscript; available in PMC 2009 March 25.
Europe PM
C Funders A
uthor Manuscripts
Europe PM
C Funders A
uthor Manuscripts
that PSA levels among controls were not positively associated with height, ruling out PSA-mediated access to biopsy as a potential explanation for our findings. Others also found alower probability of detecting prostate cancer following PSA testing in taller men (77-79).Histologic confirmation of all cancers guarantees high specificity, and the 10-core biopsyprotocol standardized the diagnosis of prostate cancer.
Strengths of the meta-analysis include its large power, derived from pooling results on68,133 cases overall (54,152 from cohorts and 13,981 from case-control studies) and usingdose-response models to assess trend effects per 10 cm increase in height. The extensiveeffort of the searches allowed us to minimize the effect of search and publication bias and toexplore the pattern of reporting of the height-prostate cancer associations in prospectivestudies, as well as other potential sources of between-study heterogeneity that we hadspecified a priori. One of these was detection bias, potentially introduced by opportunisticuse of PSA testing starting from the 1990s and leading to over-diagnosis of microscopiclesions that could have otherwise remained asymptomatic (80, 81). The effect of heightcould be artifactually overestimated, if taller people, often more educated and better off (82),were also more likely to undergo screening (81, 83). In the absence of data on national PSAscreening practices and coverage over time for the countries included in the meta-analysis,we compared studies whose case ascertainment occurred mainly before 1990 (includingpredominantly clinically presenting cases) with those conducted subsequently (includingincreasing proportions of asymptomatic cases) and found a modestly increased effect ofheight for the former, against the suggestion of detection bias.
The dose-dependent nature of the observed height-cancer association adds strength to theevidence of an effect. However, whether this is causal should be assessed in light of thelimitations of the studies included in this meta-analysis. Marked differences were observedacross study designs, which could be explained by different biases affecting them, mainlyselection bias from choice of control population or differential participation in case-controlstudies. More detailed investigation of heterogeneity across cohort studies suggested thatpositive results were more likely to be highlighted in the title or abstract of a publication,whereas those null findings that were published were usually only found in the body of anyarticle. However, we found no evidence of a small-study effect, suggesting that suchpositive results may not be spurious.
None of the well-established risk factors are likely to explain the association with height.Age, which was adjusted for in all prospective studies but one, is expected to be inverselyassociated with height, if anything (because of marked cohort effects on height). Adjustmentfor family history of prostate cancer, carried out by some studies including this one, did notappreciably alter the effect estimates. Ethnicity did not seem to play a role in height-cancerassociations, its relationship with stature not being obvious and ethnic-specific results forheight-prostate cancer generally being similar to those from multiethnic populations. Thereare reports of an increased risk of more advanced/fatal prostate cancer associated withobesity (84); however, adjustment for body mass index did not change the observed effectestimates in our nested case-control study.
The present nested case-control and most of the studies included in the meta-analysis usedself-reported data on height (and leg length), which are subject to measurement error.However, a validation carried out on data from the pilot phase of the study based on 4,708men found a correlation of 0.96 for measured versus self-reported height, and no systematicmisreporting (85), in line with the literature (86, 87). Data on measured and self-reported(inside leg) leg length were available for 3,673 men and showed that inside leg is a shortermeasure of leg length (by around 6 cm). However, the difference was consistent across therange of leg lengths (85); thus, it would not result in a biased estimate of the leg length-
Zuccolo et al. Page 8
Cancer Epidemiol Biomarkers Prev. Author manuscript; available in PMC 2009 March 25.
Europe PM
C Funders A
uthor Manuscripts
Europe PM
C Funders A
uthor Manuscripts
prostate cancer association. Moreover, any error is likely to be nondifferential, because bothexposures were reported before knowledge of prostate cancer diagnosis. Such error wouldattenuate rather than explain the observed associations. The same is true for trunk length,derived from total height and leg length, which is likely to have produced a largemeasurement error. The ProtecT and other studies included in the meta-analysis recordedheight of subjects late in life. However, shrinkage in middle-aged men could produce adilution of the effect (especially for the trunk component) but should not affect cancerincidence or mortality (88).
The case definition in the ProtecT nested case-control only included men with screen-detected cancers. Although the association of height with prostate cancer is unlikely to beseen only in PSA-diagnosed men, this was done to ensure homogeneity in case definition. Inany case, only two men in total were excluded who developed “incident” prostate cancer andthe results are not altered by their inclusion in our analyses. It is possible that among ourgroup of men with localized, low-grade prostate cancers, some would have been recentlyinitiated and, despite aggressive potential in some, might not have had time to become moreadvanced. This heterogeneity in the localized, low-grade group may have attenuated anydifferences in associations between height and localized versus advanced cancers in theProtecT study.
Between-study heterogeneity was investigated among the prospective studies. If height, as amarker of early environmental factors, had a different effect on various clinical subtypes ofprostate cancer, then heterogeneity of findings could be due to differing proportions (ordefinitions) of the clinical subtypes. This was suggested by our ProtecT results for low-grade versus high-grade cancers and by the pooled estimate from cohorts reporting onadvanced/aggressive cancers, consistently showing stronger effects compared with localizedor well-differentiated cancers. It was also supported by the modest difference betweenestimates from pre-PSA and PSA era studies, the latter likely to include a higher proportionof smaller asymptomatic tumors. Therefore, factors associated with height could be riskfactors for progression to fatal prostate cancer, rather than for the initiation of a well-differentiated tumor (76).
A plausible mechanism to explain the association of height with breast and prostate cancerrisk involves dietary programming of the IGF-I system (89, 90). IGF-I plays an importantrole in the regulation of postnatal growth, and there is evidence that its levels in adulthoodcan be influenced (“programmed”) by dietary manipulation in early childhood (91). IGF-Ilevels are also associated with prepubertal growth in height (10), although no strongerassociation was found for leg versus trunk length in the current study and in three publishedcohort studies (24, 32, 92). In line with our height findings, there is some evidence thatassociations of IGF-I with prostate cancer are stronger for advanced versus local disease(11). It is therefore possible that variations in the IGF-I system may underlie associations ofheight with prostate cancers that are more likely to progress (11).
We conclude that there is evidence that height is positively associated with prostate cancerrisk, but the magnitude of the effect is modest and the literature is influenced by publicationbias. Overall, these data indicate only a small role for childhood environmental exposures—as indexed by adult height—on prostate cancer incidence. However, the positive associationwith high-grade cancers in ProtecT was consistent with the evidence on advanced oraggressive cancers from the meta-analysis, suggesting that early life environmental factorsmay play some role in the development and/or progression of neoplasia with a worseprognosis. Mechanisms that could underlie a height effect on the more aggressive forms ofthe disease now need to be elucidated.
Zuccolo et al. Page 9
Cancer Epidemiol Biomarkers Prev. Author manuscript; available in PMC 2009 March 25.
Europe PM
C Funders A
uthor Manuscripts
Europe PM
C Funders A
uthor Manuscripts
Supplementary MaterialRefer to Web version on PubMed Central for supplementary material.
AcknowledgmentsWe thank the tremendous contribution of all members of the ProtecT study research group and especially thefollowing who were involved in this research: Prasad Bollina, Sue Bonnington, Debbie Cooper, Andrew Doble,Alan Doherty, Emma Elliott, David Gillatt, Pippa Herbert, Peter Holding, Joanne Howson, Mandy Jones, RogerKockelbergh, Howard Kynaston, Teresa Lennon, Norma Lyons, Hilary Moody, Philip Powell, Stephen Prescott,Liz Salter, and Pauline Thompson. We thank Prof. Jonathan Sterne, Dr. Trudy Bekkering, Margaret Burke, and Dr.Anne-Marie Mayer for their help and assistance at different stages of the systematic review.
Grant support: The ProtecT trial is funded by the National Health Service Health Technology AssessmentProgram (projects 96/20/06, 96/20/99). The database and analytical support for epidemiological studies wassupported by a project grant from the National Cancer Research Institute (administered by the Medical ResearchCouncil), which provided funding through ProMPT (Prostate Mechanisms of Progression and Treatment), andgrants from Cancer Research UK (project grant C18281/A7062) and the World Cancer Research Fund (grants2006/15 and 2007/07). The systematic review was funded by the World Cancer Research Fund. L. Zuccolo waspartially funded by a fellowship from the Cancer Epidemiology Unit, CeRMS and CPO Piemonte, University ofTurin, Turin (Italy), and partly by a Medical Research Council Special Training Fellowship. The sponsors had norole in the analysis, the interpretation of the results, the preparation of the manuscript, or the decision to submit themanuscript for publication.
References1. Tanner, JM. Foetus into man: physical growth from conception to maturity. Ware (United
Kingdom): Castlemead Publications; 1989.
2. Gunnell D. Can adult anthropometry be used as a ‘biomarker’ for prenatal and childhood exposures?Int J Epidemiol. 2002; 31:390–4. [PubMed: 11980801]
3. Gunnell D, Okasha M, Smith GD, Oliver SE, Sandhu J, Holly JMP. Height, leg length, and cancerrisk: a systematic review. Epidemiol Rev. 2001; 23:313–42. [PubMed: 12192740]
4. Leitch I. Growth and health. Br J Nutr. 1951; 5:142–51. [PubMed: 14886531]
5. Leary S, Smith GD, Ness A. Smoking during pregnancy and components of stature in offspring. AmJ Hum Biol. 2006; 18:502–12. [PubMed: 16788904]
6. Rogers I, Emmett P, Gunnell D, Dunger D, Holly J. Milk as a food for growth? The insulin-likegrowth factors link. Public Health Nutr. 2006; 9:359–68. [PubMed: 16684388]
7. Gunnell DJ, Smith GD, Frankel SJ, Kemp M, Peters TJ. Socio-economic and dietary influences onleg length and trunk length in childhood: a reanalysis of the Carnegie (Boyd Orr) survey of diet andhealth in prewar Britain (1937-39). Paediatr Perinat Epidemiol. 1998; 12(Suppl 1):96–113.[PubMed: 9690276]
8. Wadsworth ME, Hardy RJ, Paul AA, Marshall SF, Cole TJ. Leg and trunk length at 43 years inrelation to childhood health, diet and family circumstances; evidence from the 1946 national birthcohort. Int J Epidemiol. 2002; 31:383–90. [PubMed: 11980800]
9. Chandler PJ, Bock RD. Age changes in adult stature: trend estimation from mixed longitudinal data.Ann Hum Biol. 1991; 18:433–40. [PubMed: 1952801]
10. Rogers I, Metcalfe C, Gunnell D, Emmett P, Dunger D, Holly J. Insulin-like growth factor-I andgrowth in height, leg length, and trunk length between ages 5 and 10 years. J Clin EndocrinolMetabol. 2006; 91:2514–9. [PubMed: 16670160]
11. Renehan AG, Zwahlen M, Minder C, O’Dwyer ST, Shalet SM, Egger M. Insulin-like growthfactor (IGF)-I, IGF binding protein-3, and cancer risk: systematic review and meta-regressionanalysis. Lancet. 2004; 363:1346–53. [PubMed: 15110491]
12. Donovan J, Mills N, Smith M, et al. Quality improvement report: improving design and conduct ofrandomised trials by embedding them in qualitative research: ProtecT (prostate testing for cancerand treatment) study. BMJ. 2002; 325:766–70. [PubMed: 12364308]
13. MacInnis R, English D. Body size and composition and prostate cancer risk: systematic review andmeta-regression analysis. Cancer Causes Control. 2006; 17:989–1003. [PubMed: 16933050]
Zuccolo et al. Page 10
Cancer Epidemiol Biomarkers Prev. Author manuscript; available in PMC 2009 March 25.
Europe PM
C Funders A
uthor Manuscripts
Europe PM
C Funders A
uthor Manuscripts
14. Hankey BF, Feuer EJ, Clegg LX, et al. Cancer surveillance series: interpreting trends in prostatecancer-part I: evidence of the effects of screening in recent prostate cancer incidence, mortality,and survival rates. J Natl Cancer Inst. 1999; 91:1017–24. [PubMed: 10379964]
15. Kvale R, Auvinen A, Adami HO, et al. Interpreting trends in prostate cancer incidence andmortality in the five Nordic countries. J Natl Cancer Inst. 2007; 99:1881–7. [PubMed: 18073376]
16. Ohori M, Wheeler TM, Scardino PT. The new American Joint Committee on Cancer andInternational Union Against Cancer TNM classification of prostate cancer. Cancer. 1994; 73:104–14. [PubMed: 7516262]
17. Gunnell D. Can adult anthropometry be used as a biomarker for prenatal and childhood exposures?Int J Epidemiol. 2002; 31:390–4. [PubMed: 11980801]
18. American Institute for Cancer Research and World Cancer Research Fund. Food, nutrition,physical activity, and the prevention of cancer: a global perspective. Washington DC: AICR; 2007.
19. WCRF. Systematic literature review protocol. Accessed 2008 Jan 23WCRF Web site 2008 January23. Available from http://www.wcrf.org/research/research_pdfs/prostate_protocol.pdf
20. Habel LA, Van Den Eeden SK, Friedman GD. Body size, age at shaving initiation, and prostatecancer in a large, multiracial cohort. Prostate. 2000; 43:136–43. [PubMed: 10754529]
21. Rodriguez C, Patel AV, Calle EE, Jacobs EJ, Chao A, Thun MJ. Body mass index, height, andprostate cancer mortality in two large cohorts of adult men in the United States. Cancer EpidemiolBiomarkers Prev. 2001; 10:345–53. [PubMed: 11319175]
22. Hayes RB, Ziegler RG, Gridley G, et al. Dietary factors and risks for prostate cancer among blacksand whites in the United States. Cancer Epidemiol Biomarkers Prev. 1999; 8:25–34. [PubMed:9950236]
23. Whittemore AS, Kolonel LN, Wu AH, et al. Prostate cancer in relation to diet, physical activity,and body size in blacks, whites, and Asians in the United States and Canada. J. 1995; 87:652–61.[see comment]. [PubMed: 7752270]
24. Albanes D, Jones DY, Schatzkin A, Micozzi MS, Taylor PR. Adult stature and risk of cancer.Cancer Res. 1988; 48:1658–62. [PubMed: 3345534]
25. Andersson SO, Wolk A, Bergstrom R, et al. Body size and prostate cancer: a 20-year follow-upstudy among 135006 Swedish construction workers. J. 1997; 89:385–9. [PubMed: 9060961]
26. Batty GD, Shipley MJ, Langenberg C, Marmot MG, Davey Smith G. Adult height in relation tomortality from 14 cancer sites in men in London (UK): evidence from the original Whitehallstudy. Ann Oncol. 2006; 17:157–66. [PubMed: 16249213]
27. Cerhan JR, Torner JC, Lynch CF, et al. Association of smoking, body mass, and physical activitywith risk of prostate cancer in the Iowa 65+ Rural Health Study (United States). Cancer CausesControl. 1997; 8:229–38. [PubMed: 9134247]
28. Davey-Smith G, Hart C, Upton M, et al. Height and risk of death among men and women:aetiological implications of associations with cardiorespiratory disease and cancer mortality. JEpidemiol Community Health. 2000; 54:97–103. [PubMed: 10715741]
29. Engeland A, Tretli S, Bjorge T. Height, body mass index, and prostate cancer: a follow-up of950000 Norwegian men. Br J Cancer. 2003; 89:1237–42. [PubMed: 14520453]
30. Freeman VL, Liao Y, Durazo-Arvizu R, Cooper RS. Height and risk of fatal prostate cancer:findings from the National Health Interview Survey (1986 to 1994). Ann Epidemiol. 2001; 11:22–7. [PubMed: 11164116]
31. Greenwald P, Damon A, Kirmss V, Polan AK. Physical and demographic features of men beforedeveloping cancer of the prostate. J. 1974; 53:341–6. [PubMed: 4843267]
32. Gunnell D, May M, Ben-Shlomo Y, Yarnell J, Smith GD. Height, leg length, and cancer: theCaerphilly Study. Nutr Cancer. 2003; 47:34–9. [PubMed: 14769535]
33. Hebert PR, Ajani U, Cook NR, Lee IM, Chan KS, Hennekens CH. Adult height and incidence ofcancer in male physicians (United States). Cancer Causes Control. 1997; 8:591–7. [PubMed:9242474]
34. Jonsson F, Wolk A, Pedersen NL, et al. Obesity and hormone-dependent tumors: cohort and co-twin control studies based on the Swedish Twin Registry. Int J Cancer. 2003; 106:594–9.[PubMed: 12845658]
Zuccolo et al. Page 11
Cancer Epidemiol Biomarkers Prev. Author manuscript; available in PMC 2009 March 25.
Europe PM
C Funders A
uthor Manuscripts
Europe PM
C Funders A
uthor Manuscripts
35. Kurahashi N, Iwasaki M, Sasazuki S, Otani T, Inoue M, Tsugane S. Association of body massindex and height with risk of prostate cancer among middle-aged Japanese men. Br J Cancer.2006; 94:740–2. [PubMed: 16465189]
36. Lamharzi N, Johnson MM, Goodman G, et al. Polymorphic markers in the 5A-reductase type IIgene and the incidence of prostate cancer. Int J Cancer. 2003; 105:480–3. [PubMed: 12712437]
37. Le Marchand L, Kolonel LN, Wilkens LR, Myers BC, Hirohata T. Animal fat consumption andprostate cancer: a prospective study in Hawaii. Epidemiology. 1994; 5:276–82. [see comment].[PubMed: 8038241]
38. Littman AJ, White E, Kristal AR. Anthropometrics and prostate cancer risk. Am J Epidemiol.2007; 165:1271–9. [PubMed: 17395597]
39. Lund HL, Wisloff TF, Holme I, Nafstad P. Metabolic syndrome predicts prostate cancer in acohort of middle-aged Norwegian men followed for 27 years. Am J Epidemiol. 2006; 164:769–74.[PubMed: 16952929]
40. MacInnis RJ, English DR, Gertig DM, Hopper JL, Giles GG. Body Size and composition andprostate cancer risk. Cancer Epidemiol Biomarkers Prev. 2003; 12:1417–21. [PubMed: 14693731]
41. Nilsen TI, Vatten LJ. Anthropometry and prostate cancer risk: a prospective study of 22,248Norwegian men. Cancer Causes Control. 1999; 10:269–75. [PubMed: 10482485]
42. Platz EA, De Marzo AM, Erlinger TP, et al. No association between pre-diagnostic plasma C-reactive protein concentration and subsequent prostate cancer. Prostate. 2004; 59:393–400.[PubMed: 15065087]
43. Platz EA, Leitzmann MF, Hollis BW, Willett WC, Giovannucci E. Plasma 1,25-dihydroxy- and25-hydroxyvitamin D and subsequent risk of prostate cancer. Cancer Causes Control. 2004;15:255–65. [PubMed: 15090720]
44. Putnam SD, Cerhan JR, Parker AS, et al. Lifestyle and anthropometric risk factors for prostatecancer in a cohort of Iowa men. Ann Epidemiol. 2000; 10:361–9. [PubMed: 10964002]
45. Schuurman AG, Goldbohm RA, Dorant E, van den Brandt PA. Anthropometry in relation toprostate cancer risk in the Netherlands Cohort Study. Am J Epidemiol. 2000; 151:541–9. [seecomment]. [PubMed: 10733035]
46. Sequoia JSP, Wright ME, McCarron P, et al. A Prospective Investigation of Height and ProstateCancer Risk. Cancer Epidemiol Biomarkers Prev. 2006; 15:2174–8. [PubMed: 17119043]
47. Stattin P, Bylund A, Biessy C, Kaaks R, Hallmans G, Adlercreutz H. Prospective study of plasmaenterolactone and prostate cancer risk (Sweden). Cancer Causes Control. 2004; 15:1095–102.[PubMed: 15801493]
48. Tulinius H, Sigfusson N, Sigvaldason H, Bjarnadottir K, Tryggvadottir L. Risk factors formalignant diseases: a cohort study on a population of 22,946 Icelanders. Cancer EpidemiolBiomarkers Prev. 1997; 6:863–73. [PubMed: 9367058]
49. Andersson SO, Baron J, Wolk A, Lindgren C, Bergstrom R, Adami HO. Early life risk factors forprostate cancer: a population-based case-control study in Sweden. Cancer Epidemiol BiomarkersPrev. 1995; 4:187–92. [PubMed: 7606192]
50. Dal ML, Zucchetto A, la VC, et al. Prostate cancer and body size at different ages: an Italianmulticentre case-control study. Br J Cancer. 2004; 90:2176–80. [PubMed: 15150581]
51. Demark-Wahnefried W, Conaway MR, Robertson CN, Mathias BJ, Anderson EE, Paulson DF.Anthropometric risk factors for prostate cancer. Nutr Cancer. 1997; 28:302–7. [PubMed: 9343840]
52. Fincham SM, Hill GB, Hanson J, Wijayasinghe C. Epidemiology of prostatic cancer: a case-control study. Prostate. 1990; 17:189–206. [PubMed: 2235728]
53. Friedenreich CM, McGregor SE, Courneya KS, Angyalfi SJ, Elliott FG. Case-control study ofanthropometric measures and prostate cancer risk. Int J Cancer. 2004; 110:278–83. [PubMed:15069694]
54. Furuya Y, Akimoto S, Akakura K, Ito H. Smoking and obesity in relation to the etiology anddisease progression of prostate cancer in Japan. Int J Urol. 1998; 5:134–7. [PubMed: 9559838]
55. Giles GG, Severi G, English DR, et al. Early growth, adult body size and prostate cancer risk. Int JCancer. 2003; 103:241–5. [PubMed: 12455039]
Zuccolo et al. Page 12
Cancer Epidemiol Biomarkers Prev. Author manuscript; available in PMC 2009 March 25.
Europe PM
C Funders A
uthor Manuscripts
Europe PM
C Funders A
uthor Manuscripts
56. Hayes RB, de Jong FH, Raatgever J, et al. Physical characteristics and factors related to sexualdevelopment and behaviour and the risk for prostatic cancer. Eur J Cancer Prev. 1992; 1:239–45.[PubMed: 1467769]
57. Hill P, Wynder EL, Garbaczewski L, Walker AR. Effect of diet on plasma and urinary hormones inSouth African black men with prostatic cancer. Cancer Res. 1982; 42:3864–9. [PubMed: 6179613]
58. Hsieh CC, Thanos A, Mitropoulos D, Deliveliotis C, Mantzoros CS, Trichopoulos D. Risk factorsfor prostate cancer: a case-control study in Greece. Int J Cancer. 1999; 80:699–703. [PubMed:10048970]
59. Hsing AW, Deng J, Sesterhenn IA, et al. Body size and prostate cancer: a population-based case-control study in China. Cancer Epidemiol Biomarkers Prev. 2000; 9:1335–41. [PubMed:11142419]
60. Huang SP, Chou YH, Chang WS, et al. Androgen receptor gene polymorphism and prostate cancerin Taiwan. J Formos Med Assoc. 2003; 102:680–6. [PubMed: 14691592]
61. John EM, Schwartz GG, Koo J, Van Den BD, Ingles SA. Sun exposure, vitamin D receptor genepolymorphisms, and risk of advanced prostate cancer. Cancer Res. 2005; 65:5470–9. [PubMed:15958597]
62. Key TJ, Silcocks PB, Davey GK, Appleby PN, Bishop DT. A case-control study of diet andprostate cancer. Br J Cancer. 1997; 76:678–87. [PubMed: 9303371]
63. Kolonel LN, Yoshizawa CN, Hankin JH. Diet and prostatic cancer: a case-control study in Hawaii.Am J Epidemiol. 1988; 127:999–1012. [PubMed: 3358418]
64. Koppel M, Meranze DR, Shimkin MB. Characteristics of patients with prostatic carcinoma: acontrol case study on 83 autopsy pairs. J Urol. 1967; 98:229–33. [PubMed: 6047000]
65. La Vecchia C, Negri E, Parazzini F, et al. Height and cancer risk in a network of case-controlstudies from Northern Italy. Int J Cancer. 1990; 45:275–9. [PubMed: 2303293]
66. Lightfoot N, Conlon M, Kreiger N, Sass-Kortsak A, Purdham J, Darlington G. Medical history,sexual, and maturational factors and prostate cancer risk. Ann Epidemiol. 2004; 14:655–62.[PubMed: 15380796]
67. Liu X, Rybicki BA, Casey G, Witte JS. Relationship between body size and prostate cancer in asibling based case-control study. J Urol. 2005; 174:2169–73. [PubMed: 16280757]
68. Norrish AE, McRae CU, Holdaway IM, Jackson RT. Height-related risk factors for prostatecancer. Br J Cancer. 2000; 82:241–5. [PubMed: 10638996]
69. Porter MP, Stanford JL. Obesity and the risk of prostate cancer. Prostate. 2005; 62:316–21.[PubMed: 15389806]
70. Rao AV, Fleshner N, Garwal S. Serum and tissue lycopene and biomarkers of oxidation in prostatecancer patients: a case-control study. Nutr Cancer. 1999; 33:159–64. [PubMed: 10368811]
71. Villeneuve PJ, Johnson KC, Kreiger N, Mao Y, The Canadian Cancer Registries EpidemiologyResearch Group. Risk factors for prostate cancer: results from the Canadian National EnhancedCancer Surveillance System. Cancer Causes Control. 1999; 10:355–67. [PubMed: 10530605]
72. Walker AR, Walker BF, Tsotetsi NG, Sebitso C, Siwedi D, Walker AJ. Case-control study ofprostate cancer in black patients in Soweto, South Africa. Br J Cancer. 1992; 65:438–41.[PubMed: 1558801]
73. Wynder EL, Mabuchi K, Whitmore WF Jr. Epidemiology of cancer of the prostate. Cancer. 1971;28:344–60. [PubMed: 5109447]
74. Giovannucci E, Rimm EB, Stampfer MJ, Colditz GA, Willett WC. Height, body weight, and riskof prostate cancer. Cancer Epidemiol Biomarkers Prev. 1997; 6:557–63. [PubMed: 9264267]
75. Thune I, Lund E. Physical activity and the risk of prostate and testicular cancer: a cohort study of53,000 Norwegian men. Cancer Causes Control. 1994; 5:549–56. [PubMed: 7827242]
76. Giovannucci E, Liu Y, Platz EA, Stampfer MJ, Willett WC. Risk factors for prostate cancerincidence and progression in the health professionals follow-up study. Int J Cancer. 2007;121:1571–8. [PubMed: 17450530]
77. Fowke JH, Signorello LB, Chang SS, et al. Effects of obesity and height on prostate-specificantigen (PSA) and percentage of free PSA levels among African-American and Caucasian men.Cancer. 2006; 107:2361–7. [PubMed: 17031814]
Zuccolo et al. Page 13
Cancer Epidemiol Biomarkers Prev. Author manuscript; available in PMC 2009 March 25.
Europe PM
C Funders A
uthor Manuscripts
Europe PM
C Funders A
uthor Manuscripts
78. Werny DM, Thompson T, Saraiya M, et al. Obesity is negatively associated with prostate-specificantigen in U.S. men, 2001-2004. Cancer Epidemiol Biomarkers Prev. 2007; 16:70–6. [PubMed:17179487]
79. Fowke JH, Motley SS, Cookson MS, et al. The association between body size, prostate volume andprostate-specific antigen. Prostate Cancer Prostatic Dis. 2006; 10:137–42. [PubMed: 17179979]
80. Draisma G, Boer R, Otto SJ, et al. Lead times and overdetection due to prostate-specific antigenscreening: estimates from the European Randomized Study of Screening for Prostate Cancer. JNatl Cancer Inst. 2003; 95:868–78. [PubMed: 12813170]
81. Etzioni R, Penson DF, Legler JM, et al. Overdiagnosis due to prostate-specific antigen screening:lessons from U.S. prostate cancer incidence trends. J Natl Cancer Inst. 2002; 94:981–90. [PubMed:12096083]
82. Batty GD, Leon DA. Socio-economic position and coronary heart disease risk factors in childrenand young people: evidence from UK epidemiological studies. Eur J Public Health. 2002; 12:263–72. [PubMed: 12506501]
83. Spencer BA, Babey SH, Etzioni DA, et al. A population-based survey of prostate-specific antigentesting among California men at higher risk for prostate carcinoma. Cancer. 2006; 106:765–74.[PubMed: 16419068]
84. Freedland SJ, Platz EA. Obesity and prostate cancer: making sense out of apparently conflictingdata. Epidemiol Rev. 2007; 29:88–97. [PubMed: 17478439]
85. Oliver, SE. PhD Thesis. Department of Social Medicine, University of Bristol; 2002.
86. Gunnell D, Berney L, Holland P, et al. How accurately are height, weight and leg length reportedby the elderly, and how closely are they related to measurements recorded in childhood? Int JEpidemiol. 2000; 29:456–64. [PubMed: 10869317]
87. Spencer EA, Appleby PN, Davey GK, Key TJ. Validity of self-reported height and weight in 4808EPIC-Oxford participants. Public Health Nutr. 2002; 5:561–5. [PubMed: 12186665]
88. Wannamethee SG, Shaper AG, Lennon L, Whincup PH. Height loss in older men: associationswith total mortality and incidence of cardiovascular disease. Arch Intern Med. 2006; 166:2546–52.[PubMed: 17159023]
89. Chan JM, Stampfer MJ, Giovannucci E, et al. Plasma insulin-like growth factor I and prostatecancer risk: A prospective study. Science. 1998; 279:563–6. [PubMed: 9438850]
90. Vatten LJ, Kvinnsland S. Body height and risk of breast cancer. A prospective study of 23,831Norwegian women. Br J Cancer. 1990; 61:881–5. [PubMed: 2372490]
91. Ben-Shlomo Y, Holly J, McCarthy A, Savage P, Davies D, Davey Smith G. Pre and post natalmilk supplementation and adult insulin-like growth factor I: long term follow-up of a randomisedcontrolled trial. Cancer Epidemiol Biomarkers Prev. 2005; 14:1336–9. [PubMed: 15894699]
92. Chyou PH, Nomura AM, Stemmermann GN. A prospective study of weight, body mass index andother anthropometric measurements in relation to site-specific cancers. Int J Cancer. 1994;57:313–7. [PubMed: 8168989]
93. Veierod MB, Laake P, Thelle DS. Dietary fat intake and risk of prostate cancer: a prospectivestudy of 25,708 Norwegian men. Int J Cancer. 1997; 73:634–8. [PubMed: 9398038]
Zuccolo et al. Page 14
Cancer Epidemiol Biomarkers Prev. Author manuscript; available in PMC 2009 March 25.
Europe PM
C Funders A
uthor Manuscripts
Europe PM
C Funders A
uthor Manuscripts

Figure 1.Flow diagram of study selection.
Zuccolo et al. Page 15
Cancer Epidemiol Biomarkers Prev. Author manuscript; available in PMC 2009 March 25.
Europe PM
C Funders A
uthor Manuscripts
Europe PM
C Funders A
uthor Manuscripts
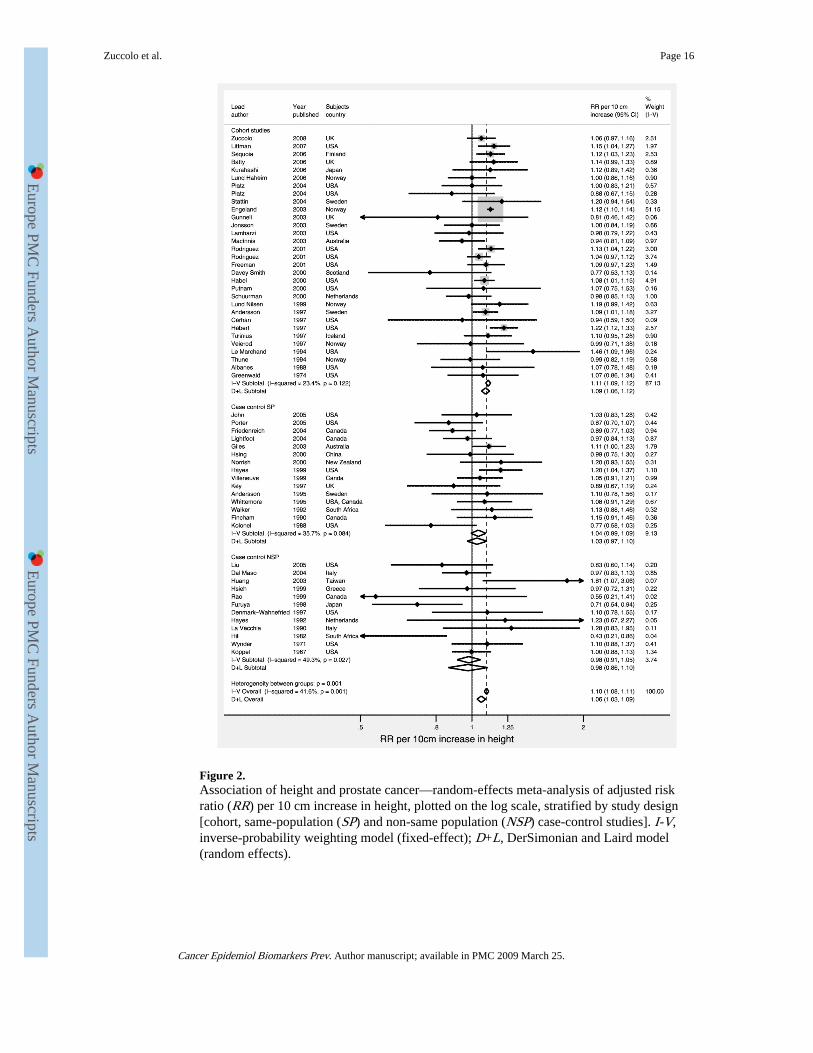
Figure 2.Association of height and prostate cancer—random-effects meta-analysis of adjusted riskratio (RR) per 10 cm increase in height, plotted on the log scale, stratified by study design[cohort, same-population (SP) and non-same population (NSP) case-control studies]. I-V,inverse-probability weighting model (fixed-effect); D+L, DerSimonian and Laird model(random effects).
Zuccolo et al. Page 16
Cancer Epidemiol Biomarkers Prev. Author manuscript; available in PMC 2009 March 25.
Europe PM
C Funders A
uthor Manuscripts
Europe PM
C Funders A
uthor Manuscripts
Europe PM
C Funders A
uthor Manuscripts
Europe PM
C Funders A
uthor Manuscripts
Zuccolo et al. Page 17
Tabl
e 1
Cha
ract
eris
tics
of
part
icip
ants
incl
uded
in t
he a
naly
sis—
1,35
7 ca
ses
and
7,99
0 co
ntro
ls, f
requ
ency
-mat
ched
on
5-y
age
band
and
gen
eral
prac
tice
Con
trol
sC
ases
n *
Mea
n (S
D)
or %
n *
Mea
n (S
D)
or %
Age
(y)
7,99
061
.8 (
5.0)
1,35
762
.2 (
4.9)
Hei
ght (
cm)
7,99
017
6.0
(6.7
)1,
357
176.
2 (6
.8)
Leg
leng
th (
cm)
7,99
076
.6 (
4.3)
1,35
776
.7 (
4.4)
Tru
nk le
ngth
(cm
)7,
990
99.3
(4.
7)1,
357
99.5
(4.
7)
BM
I (k
g/m
2 )7,
893
27.1
(3.
8)1,
341
26.7
(3.
5)
Bir
th w
eigh
t (kg
)4,
305
3.47
(0.
72)
684
3.46
(0.
71)
Fam
ily h
isto
ry o
f pr
osta
te c
ance
r7,
990
5.2%
1,35
77.
4%
Whi
te e
thni
c or
igin
7,91
299
.0%
1,33
098
.7%
3+ s
iblin
gs (
vs <
3)7,
750
33.8
%1,
300
31.0
%
Non
man
ual o
ccup
atio
n (v
s m
anua
l) †
5,51
945
.8%
975
45.7
%
Abb
revi
atio
n: B
MI,
bod
y m
ass
inde
x.
* Num
ber
with
com
plet
e da
ta.
† Non
man
ual o
ccup
atio
n in
clud
es c
odes
for
pro
fess
iona
l, m
anag
eria
l, no
nman
ual,
and
skill
ed n
onm
anua
l occ
upat
ions
. Man
ual o
ccup
atio
n in
clud
es c
odes
for
man
ual a
nd s
kille
d m
anua
l, se
mis
kille
d, a
ndun
skill
ed m
anua
l occ
upat
ions
.
Cancer Epidemiol Biomarkers Prev. Author manuscript; available in PMC 2009 March 25.
Europe PM
C Funders A
uthor Manuscripts
Europe PM
C Funders A
uthor Manuscripts
Zuccolo et al. Page 18
Tabl
e 2
Ass
ocia
tion
s of
hei
ght
and
heig
ht c
ompo
nent
s w
ith
PSA
-det
ecte
d pr
osta
te c
ance
r, in
1,3
57 c
ases
and
7,9
90 c
ontr
ols,
fre
quen
cy-m
atch
ed o
n 5-
y ag
e ba
nd a
nd g
ener
al p
ract
ice
Qua
rtile
s*D
ose-
resp
onse
†p
tren
dp
‡
Q1
Q2
Q3
Q4
Tot
al p
rost
ate
canc
er§
(n =
1,3
57)
H
eigh
t1.
001.
06 (
0.88
-1.2
9)1.
05 (
0.90
-1.2
2)1.
11 (
0.93
-1.3
3)1.
06 (
0.97
-1.1
6)0.
20-
L
eg le
ngth
1.00
1.05
(0.
87-1
.27)
1.01
(0.
87-1
.17)
1.08
(0.
92-1
.27)
1.03
(0.
96-1
.10)
0.47
-
T
runk
leng
th1.
001.
07 (
0.89
-1.2
8)1.
01 (
0.84
-1.2
2)1.
11 (
0.94
-1.3
2)1.
04 (
0.98
-1.1
0)0.
24-
Loc
aliz
ed p
rost
ate
canc
er∥
(n =
1,1
80)
H
eigh
t1.
001.
06 (
0.85
-1.2
8)1.
07 (
0.91
-1.2
6)1.
09 (
0.90
-1.3
2)1.
06 (
0.96
-1.1
6)0.
20-
L
eg le
ngth
1.00
1.04
(0.
85-1
.27)
1.01
(0.
86-1
.19)
1.09
(0.
92-1
.29)
1.02
(0.
95-1
.10)
0.49
-
T
runk
leng
th1.
001.
08 (
0.89
-1.3
1)1.
01 (
0.82
-1.2
3)1.
13 (
0.94
-1.3
5)1.
04 (
0.97
-1.1
1)0.
23-
Adv
ance
d pr
osta
te c
ance
r∥ (
n =
173
)
H
eigh
t1.
001.
00 (
0.63
-1.6
1)0.
82 (
0.56
-1.2
1)1.
07 (
0.69
-1.6
7)1.
02 (
0.81
-1.2
8)0.
860.
74
L
eg le
ngth
1.00
1.02
(0.
64-1
.64)
0.88
(0.
59-1
.31)
0.99
(0.
65-1
.49)
1.00
(0.
84-1
.19)
0.99
0.78
T
runk
leng
th1.
000.
89 (
0.54
-1.4
0)0.
89 (
0.49
-1.3
0)0.
97 (
0.64
-1.5
5)1.
02 (
0.87
-1.1
9)0.
800.
83
Low
-gra
de p
rost
ate
canc
er∥
(n =
936
)
H
eigh
t1.
000.
97 (
0.78
-1.2
1)0.
98 (
0.82
-1.1
7)1.
01 (
0.82
-1.2
4)0.
99 (
0.90
-1.1
0)0.
87-
L
eg le
ngth
1.00
0.96
(0.
77-1
.19)
0.96
(0.
81-1
.14)
0.94
(0.
78-1
.14)
0.97
(0.
90-1
.05)
0.49
-
T
runk
leng
th1.
001.
01 (
0.82
-1.2
5)1.
04 (
0.84
-1.2
8)1.
08 (
0.88
-1.3
2)1.
02 (
0.94
-1.0
9)0.
69-
Hig
h-gr
ade
pros
tate
can
cer∥
(n
= 4
02)
H
eigh
t1.
001.
31 (
0.95
-1.8
2)1.
21 (
0.92
-1.5
8)1.
39 (
1.02
-1.8
9)1.
23 (
1.06
-1.4
3)<
0.01
0.02
L
eg le
ngth
1.00
1.19
(0.
87-1
.65)
1.13
(0.
87-1
.47)
1.41
(1.
08-1
.84)
1.14
(1.
02-1
.28)
0.02
0.02
T
runk
leng
th1.
001.
17 (
0.86
-1.5
9)0.
89 (
0.64
-1.2
3)1.
21 (
0.90
-1.6
3)1.
10 (
0.99
-1.2
3)0.
070.
20
* Cut
offs
bas
ed o
n di
stri
butio
n of
con
trol
s on
ly. Q
uart
ile c
utof
fs a
re a
s fo
llow
s: h
eigh
t 172
.5, 1
75, 1
81 c
m; l
eg le
ngth
74,
77,
80
cm; t
runk
leng
th 9
6, 9
9, 1
01.6
cm
.
† Hei
ght:
per
10 c
m in
crea
se. L
eg le
ngth
and
trun
k le
ngth
: per
5 c
m in
crea
se.
‡ Tes
t for
dif
fere
nce
in th
e ef
fect
est
imat
es f
or lo
caliz
ed v
ersu
s ad
vanc
ed a
nd lo
w-g
rade
ver
sus
high
-gra
de p
rost
ate
canc
er.
§ OR
and
95%
CI
valu
es f
rom
con
ditio
nal l
ogis
tic r
egre
ssio
n m
odel
s, a
dditi
onal
ly a
djus
ted
for
age
as a
con
tinuo
us v
aria
ble.
Cancer Epidemiol Biomarkers Prev. Author manuscript; available in PMC 2009 March 25.
Europe PM
C Funders A
uthor Manuscripts
Europe PM
C Funders A
uthor Manuscripts
Zuccolo et al. Page 19∥ R
elat
ive
risk
rat
ios
and
95%
CIs
fro
m lo
gist
ic r
egre
ssio
n, a
djus
ted
for
mat
chin
g fa
ctor
s. F
or d
efin
ition
s of
loca
lized
/adv
ance
d st
age
and
low
/hig
h gr
ade,
see
Sub
ject
s an
d M
etho
ds.
Cancer Epidemiol Biomarkers Prev. Author manuscript; available in PMC 2009 March 25.
Europe PM
C Funders A
uthor Manuscripts
Europe PM
C Funders A
uthor Manuscripts
Zuccolo et al. Page 20
Tabl
e 3
Cha
ract
eris
tics
of
stud
ies
(fro
m t
he s
yste
mat
ic r
evie
w)
incl
uded
in t
he d
ose-
resp
onse
met
a-an
alys
is f
or h
eigh
t an
d pr
osta
te c
ance
r
A. P
rosp
ecti
ve s
tudi
es
Fir
st a
utho
r (y
ear)
Loc
atio
nE
thni
city
Rep
orti
ng (
inci
dent
al o
r pr
imar
y)A
ge a
t ba
selin
e (y
)*D
ates
of
recr
uitm
ent
and
follo
w-u
p%
Fol
low
-up
<199
0E
xpos
ure
asse
ssm
ent
Out
com
eN
o. c
ases
Gre
enw
ald
(197
4; r
ef. 3
1)H
arva
rd (
USA
)W
hite
Inci
dent
alN
S18
80-1
916
to 1
967
100
Mix
edM
orta
lity
268
Alb
anes
(19
88; r
ef. 2
4)U
SAM
ultie
thni
cPr
imar
y(5
2)19
71-1
975
to 1
982-
8410
0M
easu
red
Inci
denc
e95
Le
Mar
chan
d (1
994;
ref
. 37)
Haw
aii (
USA
)M
ultie
thni
cIn
cide
ntal
45-9
019
75-1
980
to 1
989
100
Self
-rep
ort
Inci
denc
e19
8
Thu
ne (
1994
; ref
. 75)
Nor
way
NS
Inci
dent
al35
-54
1972
-197
8 to
199
194
Mea
sure
dIn
cide
nce
220
Tul
iniu
s (1
997;
ref
. 48)
Icel
and
NS
Prim
ary
23-6
019
67-1
995
to 1
995
64M
easu
red
Inci
denc
e52
4
Heb
ert (
1997
; ref
. 33)
USA
NS
Prim
ary
40-8
419
82 to
199
562
Self
-rep
ort
Inci
denc
e1,
047
And
erss
on (
1997
; ref
. 25)
Swed
enN
SPr
imar
y40
+19
71-1
975
to 1
991
94M
easu
red
Inci
denc
e2,
368
Mor
talit
y70
8
Cer
han
(199
7; r
ef. 2
7)Io
wa
(USA
)N
SIn
cide
ntal
65-1
0119
82 to
199
373
Self
-rep
ort
Inci
denc
e71
Vei
erod
(19
97; r
ef. 9
3)N
orw
ayN
SIn
cide
ntal
16-5
619
77-1
983
to 1
992
83M
easu
red
Inci
denc
e72
Nils
en (
1999
; ref
. 41)
Nor
way
NS
Prim
ary
(59)
1984
-198
6 to
199
742
Mea
sure
dI+
M64
2
Dav
ey-S
mith
(20
00; r
ef. 2
8)Sc
otla
nd (
UK
)N
SPr
imar
y45
-64
1972
-197
6 to
199
673
Mea
sure
dM
orta
lity
59
Hab
el (
2000
; ref
. 20)
USA
Mul
tieth
nic
Prim
ary
18-8
419
64-1
973
to 1
996
78M
easu
red
Inci
denc
e2,
079
Putn
am (
2000
; ref
. 44)
Iow
a (U
SA)
Whi
tePr
imar
y40
-86
1986
-198
9 to
199
533
Self
-rep
ort
Inci
denc
e10
1
Schu
urm
an (
2000
; ref
. 45)
The
Net
herl
ands
NS
Prim
ary
55-6
919
86 to
199
267
Self
-rep
ort
Inci
denc
e68
1
Rod
rigu
ez (
2001
; ref
. 21)
USA
(C
PS I
)M
ultie
thni
cPr
imar
y(5
2)19
59 to
197
210
0Se
lf-r
epor
tM
orta
lity
1,59
0
Rod
rigu
ez (
2001
; ref
. 21)
USA
(C
PS I
I)M
ultie
thni
cPr
imar
y(5
7)19
82 to
199
657
Self
-rep
ort
Mor
talit
y3,
622
Free
man
(20
01; r
ef. 3
0)U
SAM
ultie
thni
cPr
imar
y50
+19
86 to
199
450
Self
-rep
ort
Mor
talit
y63
3
Jons
son
(200
3; r
ef. 3
4)Sw
eden
NS
Inci
dent
al44
-83
1961
-196
7 to
199
779
Self
-rep
ort
I+M
631
Eng
elan
d (2
003;
ref
. 29)
Nor
way
NS
Prim
ary
20-7
419
63 to
200
171
Mea
sure
dI+
M33
,314
Mac
Inni
s (2
003;
ref
. 40)
Aus
tral
iaN
SIn
cide
ntal
27-7
519
90-1
994
to 2
002
0M
easu
red
Inci
denc
e47
7
Gun
nell
(200
3; r
ef. 3
2)So
uth
Wal
es (
UK
)N
SPr
imar
y45
-59
1979
-198
3 to
200
341
Mea
sure
dIn
cide
nce
33
Lam
harz
i (20
03; r
ef. 3
6)U
SAM
ultie
thni
cIn
cide
ntal
45-6
919
85-1
994
to 1
998
6M
easu
red
Inci
denc
e30
0
Plat
z (2
004;
ref
. 43)
USA
Whi
teIn
cide
ntal
40-7
519
93-1
995
to 1
998
0Se
lf-r
epor
tI+
M46
0
Plat
z (2
004;
ref
. 42)
Mar
ylan
d (U
SA)
Whi
teIn
cide
ntal
(65)
1989
to 2
002
8Se
lf-r
epor
tIn
cide
nce
264
Stat
tin (
2004
; ref
. 47)
Swed
enN
SIn
cide
ntal
40+
1985
-199
4 to
200
14
Mea
sure
dIn
cide
nce
265
Bat
ty (
2006
; ref
. 26)
Lon
don
(UK
)N
SPr
imar
y40
-64
1967
-197
0 to
200
264
Mea
sure
dM
orta
lity
434
Cancer Epidemiol Biomarkers Prev. Author manuscript; available in PMC 2009 March 25.
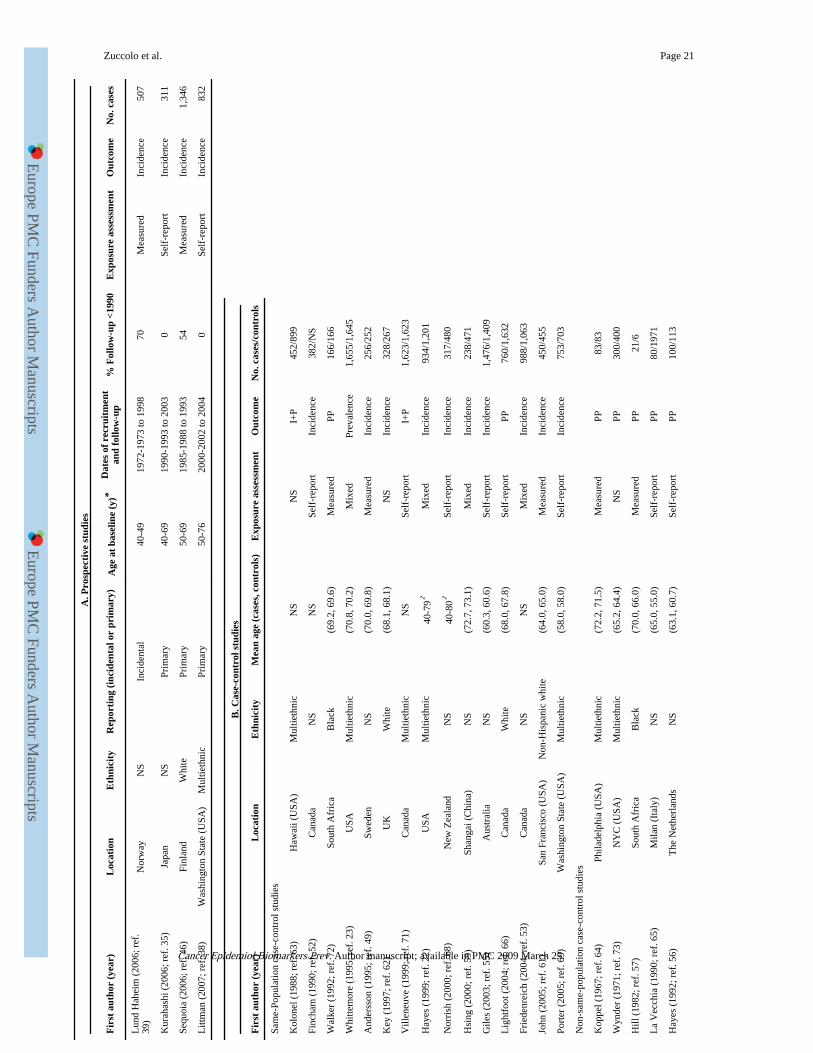
Europe PM
C Funders A
uthor Manuscripts
Europe PM
C Funders A
uthor Manuscripts
Zuccolo et al. Page 21
A. P
rosp
ecti
ve s
tudi
es
Fir
st a
utho
r (y
ear)
Loc
atio
nE
thni
city
Rep
orti
ng (
inci
dent
al o
r pr
imar
y)A
ge a
t ba
selin
e (y
)*D
ates
of
recr
uitm
ent
and
follo
w-u
p%
Fol
low
-up
<199
0E
xpos
ure
asse
ssm
ent
Out
com
eN
o. c
ases
Lun
d H
ahei
m (
2006
; ref
.39
)N
orw
ayN
SIn
cide
ntal
40-4
919
72-1
973
to 1
998
70M
easu
red
Inci
denc
e50
7
Kur
ahas
hi (
2006
; ref
. 35)
Japa
nN
SPr
imar
y40
-69
1990
-199
3 to
200
30
Self
-rep
ort
Inci
denc
e31
1
Sequ
oia
(200
6; r
ef. 4
6)Fi
nlan
dW
hite
Prim
ary
50-6
919
85-1
988
to 1
993
54M
easu
red
Inci
denc
e1,
346
Litt
man
(20
07; r
ef. 3
8)W
ashi
ngto
n St
ate
(USA
)M
ultie
thni
cPr
imar
y50
-76
2000
-200
2 to
200
40
Self
-rep
ort
Inci
denc
e83
2
B. C
ase-
cont
rol s
tudi
es
Fir
st a
utho
r (y
ear)
Loc
atio
nE
thni
city
Mea
n ag
e (c
ases
, con
trol
s)E
xpos
ure
asse
ssm
ent
Out
com
eN
o. c
ases
/con
trol
s
Sam
e-Po
pula
tion
case
-con
trol
stu
dies
Kol
onel
(19
88; r
ef. 6
3)H
awai
i (U
SA)
Mul
tieth
nic
NS
NS
I+P
452/
899
Finc
ham
(19
90; r
ef. 5
2)C
anad
aN
SN
SSe
lf-r
epor
tIn
cide
nce
382/
NS
Wal
ker
(199
2; r
ef. 7
2)So
uth
Afr
ica
Bla
ck(6
9.2,
69.
6)M
easu
red
PP16
6/16
6
Whi
ttem
ore
(199
5; r
ef. 2
3)U
SAM
ultie
thni
c(7
0.8,
70.
2)M
ixed
Prev
alen
ce1,
655/
1,64
5
And
erss
on (
1995
; ref
. 49)
Swed
enN
S(7
0.0,
69.
8)M
easu
red
Inci
denc
e25
6/25
2
Key
(19
97; r
ef. 6
2)U
KW
hite
(68.
1, 6
8.1)
NS
Inci
denc
e32
8/26
7
Vill
eneu
ve (
1999
; ref
. 71)
Can
ada
Mul
tieth
nic
NS
Self
-rep
ort
I+P
1,62
3/1,
623
Hay
es (
1999
; ref
. 22)
USA
Mul
tieth
nic
40-7
9†M
ixed
Inci
denc
e93
4/1,
201
Nor
rish
(20
00; r
ef. 6
8)N
ew Z
eala
ndN
S40
-80†
Self
-rep
ort
Inci
denc
e31
7/48
0
Hsi
ng (
2000
; ref
. 59)
Shan
gai (
Chi
na)
NS
(72.
7, 7
3.1)
Mix
edIn
cide
nce
238/
471
Gile
s (2
003;
ref
. 55)
Aus
tral
iaN
S(6
0.3,
60.
6)Se
lf-r
epor
tIn
cide
nce
1,47
6/1,
409
Lig
htfo
ot (
2004
; ref
. 66)
Can
ada
Whi
te(6
8.0,
67.
8)Se
lf-r
epor
tPP
760/
1,63
2
Frie
denr
eich
(20
04; r
ef. 5
3)C
anad
aN
SN
SM
ixed
Inci
denc
e98
8/1,
063
John
(20
05; r
ef. 6
1)Sa
n Fr
anci
sco
(USA
)N
on-H
ispa
nic
whi
te(6
4.0,
65.
0)M
easu
red
Inci
denc
e45
0/45
5
Port
er (
2005
; ref
. 69)
Was
hing
ton
Stat
e (U
SA)
Mul
tieth
nic
(58.
0, 5
8.0)
Self
-rep
ort
Inci
denc
e75
3/70
3
Non
-sam
e-po
pula
tion
case
-con
trol
stu
dies
Kop
pel (
1967
; ref
. 64)
Phila
delp
hia
(USA
)M
ultie
thni
c(7
2.2,
71.
5)M
easu
red
PP83
/83
Wyn
der
(197
1; r
ef. 7
3)N
YC
(U
SA)
Mul
tieth
nic
(65.
2, 6
4.4)
NS
PP30
0/40
0
Hill
(19
82; r
ef. 5
7)So
uth
Afr
ica
Bla
ck(7
0.0,
66.
0)M
easu
red
PP21
/6
La
Vec
chia
(19
90; r
ef. 6
5)M
ilan
(Ita
ly)
NS
(65.
0, 5
5.0)
Self
-rep
ort
PP80
/197
1
Hay
es (
1992
; ref
. 56)
The
Net
herl
ands
NS
(63.
1, 6
0.7)
Self
-rep
ort
PP10
0/11
3
Cancer Epidemiol Biomarkers Prev. Author manuscript; available in PMC 2009 March 25.
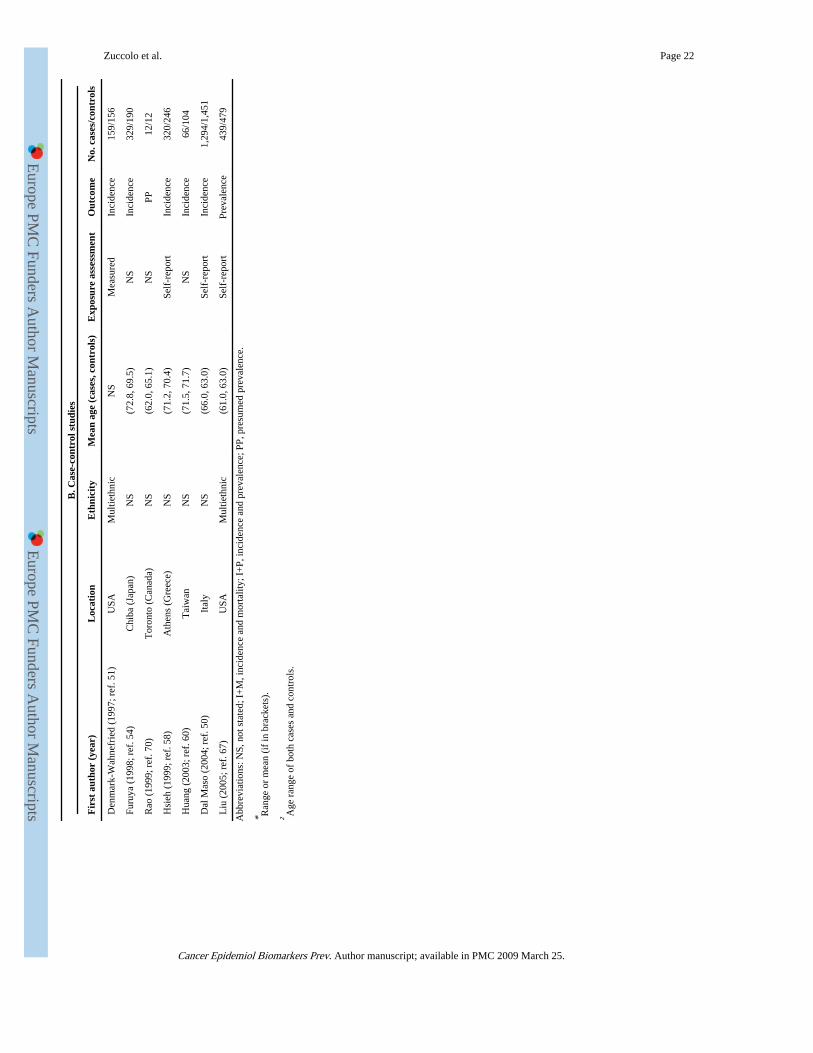
Europe PM
C Funders A
uthor Manuscripts
Europe PM
C Funders A
uthor Manuscripts
Zuccolo et al. Page 22
B. C
ase-
cont
rol s
tudi
es
Fir
st a
utho
r (y
ear)
Loc
atio
nE
thni
city
Mea
n ag
e (c
ases
, con
trol
s)E
xpos
ure
asse
ssm
ent
Out
com
eN
o. c
ases
/con
trol
s
Den
mar
k-W
ahne
frie
d (1
997;
ref
. 51)
USA
Mul
tieth
nic
NS
Mea
sure
dIn
cide
nce
159/
156
Furu
ya (
1998
; ref
. 54)
Chi
ba (
Japa
n)N
S(7
2.8,
69.
5)N
SIn
cide
nce
329/
190
Rao
(19
99; r
ef. 7
0)T
oron
to (
Can
ada)
NS
(62.
0, 6
5.1)
NS
PP12
/12
Hsi
eh (
1999
; ref
. 58)
Ath
ens
(Gre
ece)
NS
(71.
2, 7
0.4)
Self
-rep
ort
Inci
denc
e32
0/24
6
Hua
ng (
2003
; ref
. 60)
Tai
wan
NS
(71.
5, 7
1.7)
NS
Inci
denc
e66
/104
Dal
Mas
o (2
004;
ref
. 50)
Ital
yN
S(6
6.0,
63.
0)Se
lf-r
epor
tIn
cide
nce
1,29
4/1,
451
Liu
(20
05; r
ef. 6
7)U
SAM
ultie
thni
c(6
1.0,
63.
0)Se
lf-r
epor
tPr
eval
ence
439/
479
Abb
revi
atio
ns: N
S, n
ot s
tate
d; I
+M
, inc
iden
ce a
nd m
orta
lity;
I+
P, in
cide
nce
and
prev
alen
ce; P
P, p
resu
med
pre
vale
nce.
* Ran
ge o
r m
ean
(if
in b
rack
ets)
.
† Age
ran
ge o
f bo
th c
ases
and
con
trol
s.
Cancer Epidemiol Biomarkers Prev. Author manuscript; available in PMC 2009 March 25.
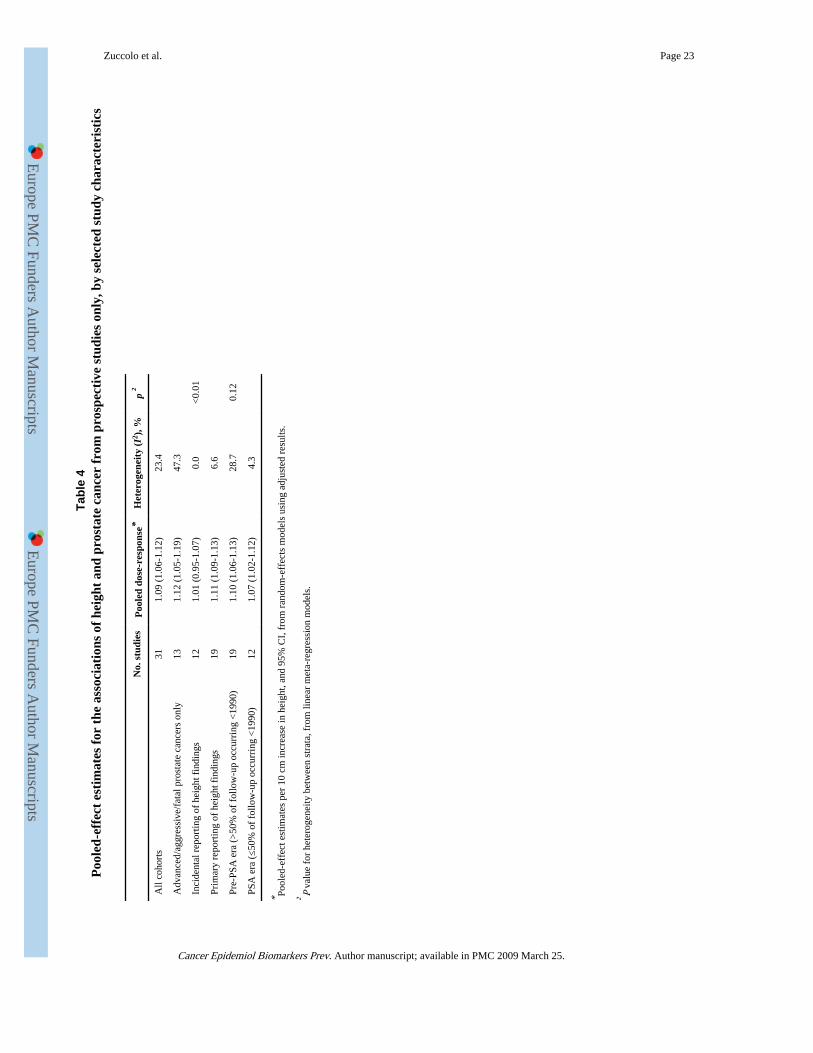
Europe PM
C Funders A
uthor Manuscripts
Europe PM
C Funders A
uthor Manuscripts
Zuccolo et al. Page 23
Tabl
e 4
Poo
led-
effe
ct e
stim
ates
for
the
ass
ocia
tion
s of
hei
ght
and
pros
tate
can
cer
from
pro
spec
tive
stu
dies
onl
y, b
y se
lect
ed s
tudy
cha
ract
eris
tics
No.
stu
dies
Poo
led
dose
-res
pons
e*H
eter
ogen
eity
(I2 )
, %p
†
All
coho
rts
311.
09 (
1.06
-1.1
2)23
.4
Adv
ance
d/ag
gres
sive
/fat
al p
rost
ate
canc
ers
only
131.
12 (
1.05
-1.1
9)47
.3
Inci
dent
al r
epor
ting
of h
eigh
t fin
ding
s12
1.01
(0.
95-1
.07)
0.0
<0.
01
Prim
ary
repo
rtin
g of
hei
ght f
indi
ngs
191.
11 (
1.09
-1.1
3)6.
6
Pre-
PSA
era
(>
50%
of
follo
w-u
p oc
curr
ing
<19
90)
191.
10 (
1.06
-1.1
3)28
.70.
12
PSA
era
(≤5
0% o
f fo
llow
-up
occu
rrin
g <
1990
)12
1.07
(1.
02-1
.12)
4.3
* Pool
ed-e
ffec
t est
imat
es p
er 1
0 cm
incr
ease
in h
eigh
t, an
d 95
% C
I, f
rom
ran
dom
-eff
ects
mod
els
usin
g ad
just
ed r
esul
ts.
† P va
lue
for
hete
roge
neity
bet
wee
n st
rata
, fro
m li
near
met
a-re
gres
sion
mod
els.
Cancer Epidemiol Biomarkers Prev. Author manuscript; available in PMC 2009 March 25.