Hedging and Firm Value: Measuring the Implications of Airline ...
55
Hedging and Firm Value Page 1 of 55 Hedging and Firm Value: Measuring the Implications of Airline Hedging Programs ABSTRACT This paper examines the relation between hedging and firm value for global airline sample from 2000 to 2012, resulting in 411 firm-year observations. We show that hedging strategies are effective at reducing the variability of operating cash flows. We find an average value premium of 6.5% associated with hedging for low cost carriers but no value premium for major carriers. Our results empirically evidence the value maximization via hedging when firms have potential financial distress costs and significant investment opportunities (alleviating the underinvestment problem), which has been the case for low cost carriers during their high growth stage. In a frictionless Modigliani and Miller (1958) world, corporate hedging is irrelevant and the value of the firm is independent of whether or not it hedges. Based on frictionless market assumptions (no taxes, no information asymmetry and no transactions costs), authors argue that investors can identify and hedge their own exposures and do not pay premium for firm level hedging. Introducing capital market imperfections to the Modigliani and Miller world, prior studies rationalize hedging behavior with minimization of tax volatility, maximization of tax shields, reduction of firm level risk (through financial distress costs), managerial risk aversion and reduction in agency costs (alleviation of potential underinvestment problems (Smith and Stulz, 1985; Mayers and Smith 1987 Graham and Smith, 1998; Tufano, 1996; Stultz, 1996; Froot et al. 1993)). 1 1 Underinvestment problem is essentially an agency problem between the management and creditors of the firm. However, the term has been used interchangeably with coordinating
-
Upload
khangminh22 -
Category
Documents
-
view
2 -
download
0
Transcript of Hedging and Firm Value: Measuring the Implications of Airline ...

Hedging and Firm Value Page 1 of 55
Hedging and Firm Value:
Measuring the Implications of Airline Hedging Programs
ABSTRACT
This paper examines the relation between hedging and firm value for global
airline sample from 2000 to 2012, resulting in 411 firm-year observations. We
show that hedging strategies are effective at reducing the variability of operating
cash flows. We find an average value premium of 6.5% associated with hedging
for low cost carriers but no value premium for major carriers. Our results
empirically evidence the value maximization via hedging when firms have
potential financial distress costs and significant investment opportunities
(alleviating the underinvestment problem), which has been the case for low cost
carriers during their high growth stage.
In a frictionless Modigliani and Miller (1958) world, corporate hedging is irrelevant
and the value of the firm is independent of whether or not it hedges. Based on
frictionless market assumptions (no taxes, no information asymmetry and no
transactions costs), authors argue that investors can identify and hedge their
own exposures and do not pay premium for firm level hedging.
Introducing capital market imperfections to the Modigliani and Miller world, prior
studies rationalize hedging behavior with minimization of tax volatility,
maximization of tax shields, reduction of firm level risk (through financial distress
costs), managerial risk aversion and reduction in agency costs (alleviation of
potential underinvestment problems (Smith and Stulz, 1985; Mayers and Smith
1987 Graham and Smith, 1998; Tufano, 1996; Stultz, 1996; Froot et al. 1993)).1
1 Underinvestment problem is essentially an agency problem between the management and
creditors of the firm. However, the term has been used interchangeably with coordinating

Hedging and Firm Value Page 2 of 55
Academics have long been interested in empirically testing these theoretical
arguments, yet the direct empirical examination of firm value and hedging is a
relatively new phenomenon. The pioneering work that examines the relation
between firm value and hedging is the Allayannis and Weston (2001) study.
Examining the foreign currency derivative use in a sample of nonfinancial US
firms between 1990 and 1995, and using Tobin’s Q as a measure of firm value,
authors observe that hedging is associated with value premium of 4.87%. More
recently, Carter et al. (2004, 2006) examining the US airline industry report a jet
fuel hedging premium of 12% to 16% for the 1994 to 2000 period and 5% to 10%
for the 1992 to 2003 period.
In this paper, we revisit the argument of the hedging and firm value using a
dataset consisting of 54 global publicly traded airline companies over a 13-year
period from 2000 to 2012. There lie three fundamental reasons for the motivation
to examine jet fuel hedging and shareholder value maximization in the airline
industry.
The first reason is the noticeable discrepancy in the empirical findings of studies
focusing on shareholder value maximization via commodity price risk
management for commodity producers and end-users. Empirical studies support
the shareholder value maximization proposal for commodity end-users (airline
industry - Carter et al., 2004, 2006), but reject it for commodity producers (oil
producers - Jin and Jorion, 2006; gold miners – Tufano 1996). It can be argued
that investors’ different risk perception for the two sides in commodity price risk
equilibrium is the reason for the divergence in empirical findings. For example,
Jin and Jorion (2006) state that investors may invest in oil-producing firms to gain
exposure to oil price movements.
investment and financing hypothesis (Gay and Nam, 1998; Carter et al. 2006). The fact that both hypotheses propose that hedging significantly contributes to the efficiency in investments is most likely the reason for the joint use of the two terms. In this paper, we will follow suit the literature and refer to the underinvestment hypothesis as the one discussed in Froot et al. (1993) study.

Hedging and Firm Value Page 3 of 55
The second reason is that despite the recent interest in the area of commodity
price risk management, there still are a number of arguments, particularly in the
airline industry, that are overlooked by the literature. These arguments can
potentially have economical and statistical significance for the implications of jet
fuel price risk management. For example, unlike Carter et al. (2006), we split our
sample into a more up-to-date business model classifications, namely; low cost
carriers (abbreviated as LCCs) and major carriers (abbreviated as MCs) 2.
Low cost carriers have gained significant strength from the beginning of the early
2000s. Descriptive statistics and univariate analysis in Panels B of Tables II and
III provide evidence of the investment opportunities, measured by capital
expenditures as a percentage of revenues (CAPEX/Revenues) and retention
ratio, calculated as (
) for LCCs and MCs. Both measures
indicate that LCCs have a greater set of investment opportunities and reinvest
more of their internal cash flows for future growth opportunities. Based on these
statistical observations, this period can be ascribed as a high-growth period for
the low cost carriers. Thus, the partition of the sample into low cost carrier and
major carrier sub-samples enables us to control and test for the association
between hedging and potential underinvestment problems for the two different
business models; one in high growth state and the other in the mature state.
Airline companies in the Carter et al. (2006) study are classified into major
carriers and small carriers based on the scale of annual revenues which is the
2 Major Carriers built hub-and-spoke networks with a dynamic revenue management system
where different seats are priced differently depending on the class and the availability of the
seats. These carriers are dependent on their operations within their hub-and-spoke network and
continue to serve routes within these networks regardless of the route being profitable or not. The
abandonment of a given route would be penalized by the network structure with a loss of
potential customers on related routes. Low cost carriers, on the other hand, has much more
flexibility in terms of route construction, operate under one business class and operate same type
of aircraft (which are easier to maintain and cost efficient), and usually use secondary airports
with lower fares and higher punctuality. These companies serve the short-haul segment of
passenger travel and have more mobile network structure compared to major carriers.

Hedging and Firm Value Page 4 of 55
classification of the Air Transport Association in the US. Within that sample,
however, the majority of the firms regarded as small carriers are actually regional
carriers. These carriers have a totally different business model in comparison to
both LCCs and MCs3, particularly in two aspects. First, these carriers mostly
have fixed-fee agreements with major airline contractors which are set to cover
the regional carriers’ operating costs and to guarantee a pre-determined level of
profit. These fixed-fee contract schemes, which are effectively used since the
late 1990s, eliminate all of the risks related to passenger demand and profit
margins. More precisely, unlike the high price elasticity of passenger demand
statement made in Carter et al. (2006), in practice the size of revenues for
regional carriers is independent of the number of passengers carried. Second,
their business model allows them to transfer the majority of the jet fuel price risk
to their contractor firms which provide them with the most effective risk
management tool available. Appendix I provides further evidence on the fuel
price risk management by some of these regional carriers.
Unsurprisingly, regional carriers hedge almost none of their jet fuel price risks
and are the only airline companies that do not hedge in the sample of Carter et
al. (2006). This fact is somewhat acknowledged by the authors with the use of
fuel pass-through and charter dummies to control for other means of risk
management practices. However, fuel pass-through schemes are not only
utilized by regional carriers but also periodically utilized by major carriers.
Additionally, the use of fuel pass-through dummy variables doesn’t adequately
capture the magnitude of cash flow volatility (as a result of fuel price fluctuations)
transferred from regional carriers to major carriers. We argue that an analysis
examining firm value and hedging with a sample composition involving regional
carriers (which can utilize close to perfect operational hedging strategy by
3 Regional carriers operate passenger services on routes that do not attract sufficient demand for
mainline services of larger players. In general regional carriers function as a feeder airline (usually contract based with a larger carrier or as a subsidiary of a larger carrier) - serving the hub and spoke network structure of major carriers and have much lower scale of operations and mostly ununionized labor. (Forbes and Lederman, 2007).

Hedging and Firm Value Page 5 of 55
transferring almost all the oil price risk to the parent contractor airline company)
alongside with major and low cost carriers (that have to utilize financial hedging
strategies) will produce potential endogeneity bias. Such analysis will effectively
collapse to a comparison between financial hedging and operational hedging. As
a result, we exclude regional carriers from our analysis.
The partition of the sample into low cost and major carrier sub-samples also
serves this purpose of controlling for a potential bias towards a specific business
model which can affect the hedging decision. We observe similar jet fuel hedging
levels for the two sub-samples; 33% for the low cost carriers and 35% for the
major carriers, which eliminates the risk of endogeneity. Both samples
demonstrate variability in hedging levels and constitute homogeneity in our test
variable which is the percentage of the next year’s consumption hedged.
Finally, in this paper, we expand the analysis to the global level that enables us
to control for cross regional differences among airline companies. This is
important in terms of capturing differences between deregulated markets like the
US and/or Europe and the rest of the world. Additionally, our dataset allows us to
control for the implications of government ownership on risk management
practices in the industry.
The airline industry offers an ideal environment to study hedging behavior for a
number of reasons. First, the industry is significantly exposed to the availability
and price of oil. Consequently, airline companies extensively use financial
instruments to manage fuel prices. System-wide fuel expenses reached $140B in
2012, which is equivalent to one-third of operating expenditures and hence, have
a major effect on profitability (The International Air Transport Association, 2012).
Second, the likelihood of speculation through hedging is very low, since low
operating margins make the industry extremely cash conscious and firms are
very likely to be risk averse. Third, the industry does not benefit from natural
hedging. The increased demand for air travel (and as a result expected

Hedging and Firm Value Page 6 of 55
increases in revenues) from the stimulation in the economy is shared among the
entire industry, whereas increases in oil prices as a result of the same economic
activity will have a direct and a proportionate impact on the fuel expenditure of
each and every airline company (in the absence of hedging). Finally, the industry
makes extensive use of debt financing, which accompanied with highly
competitive low-margin environment, increase the probability of experiencing
financial distress costs. Consequently, potential benefits from hedging are
expected to be high for the industry4.
Avoiding firm year observations for which there has been insufficient disclosure
of hedging practices (avoiding dummy variables) and excluding regional carriers,
we obtain 411 firm-year observations from a global sample of 54 publicly traded
airline companies. To the best of our knowledge, this is the largest sample
examined that uses non-binary hedging variables. Further, our study is the first to
extend the coverage of the airline industry to a global scale comprising of 13 US,
14 European, and 27 international airline companies. The first major contribution
of this study is that this research instrument facilitates analysis of any value
premium using actual fuel hedging data for a global sample of airline companies.
This paper differentiates from the existing literature by taking a two-step
approach in testing the implications of corporate hedging. The single most
important underlying motivation for corporate risk management is the elimination
of the undesired volatility risk inherent in future operating cash flows (Smith and
Stulz, 1985; Froot et al., 1993; Nance, Smith and Smithson, 1993). Often,
empirical studies that examine the value premium associated with corporate
hedging disregard the core principle of cash flow volatility reduction via hedging.
4 The theory of corporate risk management states that there is little or no benefit from hedging for
firms with little or no debt financing. Having virtually zero probability of financial distress risks,
these firms can find it easier to access external funding and have more room for increasing debt
capacity at lower costs absent hedging. Consequently, hedging is expected to be most beneficial
for firms with high financial leverage and inadequate cash balances to service obligatory
payments and utilize investment opportunities.
Hedging and Firm Value Page 7 of 55
As an example, none of the studies analyzing corporate hedging and firm value
in commodity price risk management tests whether hedging is useful in terms of
reducing variability in operating cash flows.
Parallel to the corporate risk management theory, in the first stage of our
analysis we examine whether hedging is useful in terms of reducing variability in
operating cash flows as a percentage of revenues (CFO/Revenues) and the level
of fuel costs as a percentage of operating expenses (Fuel Costs/OPEX). We
separate our sample into hedging-year and non-hedging-year sub-samples and
conduct a univariate test of differences in variances of operating cash flows.
Additionally, in order to measure the fuel economies achieved via hedging, we
test the relation between hedging and fuel costs as a percentage of operating
expenses (Fuel Costs/OPEX), which, via the “effective fuel cost estimation”5
proposed by the two main accounting systems (IFRS and US GAAP), show a
direct relation.
Our results indicate that hedging enabled airline companies (both LCCs and
MCs) to reduce the variability in operating cash flows, satisfying the fundamental
motivation for corporate risk management. Additionally, univariate analysis of
hedging and non-hedging year-observations demonstrate that fuel costs as a
percentage of operating expenses (Fuel Costs/OPEX) are, on average, 6% lower
for the hedging sub-sample compared to non-hedging sub-sample. Similarly, the
multivariate analysis in the section III indicates that hedging is statistically
negatively associated with fuel costs scaled by operating expenses (Fuel
Costs/OPEX).
5 Effective fuel cost is the effective USD price paid per barrel of jet fuel consumed. This effective
fuel price paid includes the entire fuel cost savings (loss) realized from the derivatives instruments in addition to the fuel costs realized in the spot market. It is calculated as the USD spot price paid per barrel of fuel costs less (plus) USD gains (losses) from the derivative instruments.

Hedging and Firm Value Page 8 of 55
The second contribution of this paper is to test why we would expect investors to
pay premium for firms that hedge at all using a larger sample than prior work? If
investors are well-diversified, most of the risks related to oil prices should not
materially increase the risk of their portfolio. However, when the magnitude of the
financial risks becomes such that the volatility in the operating cash flows
significantly increases the probability of financial distress, even well-diversified
investors will be concerned (Stulz, 1996). The probability of financial distress is a
direct function of a company’s fixed claims relative to its total assets (Nance,
Smith and Smithson, 1993), a ratio which is typically very high for the airline
industry. Additionally, the industry operates on low profit margins and jet fuel
expenses constitute more than one third of all cash expenses. As a result, the
industry is exposed to significant risk of financial distress and investors are
particularly cognizant of the importance of the oil price risk management6.
Moreover, if investors can easily identify and hedge their own risk exposures,
why would they ever need firm level hedging? Despite the rationale behind in-
house risk management argument, quantifying the risk exposure might not be as
straightforward for investors as theoretically argued when there are information
asymmetries (Myers and Majluf, 1984; Miller and Rock, 1985; Noe and Rebello,
1996; Krishnaswami and Subramaniam, 1999). The ability to measure and
hedge the firm-specific risks might be limited by the quantity and/or quality of
financial disclosure. The information as to the level of exposure to a specific risk
factor is harder to obtain for companies in emerging markets in comparison to
companies in established markets. For example, in the case of a US airline
company, a US investor may calculate the approximate risk exposure to oil
6 Most of the airline companies have institutional shareholders with well-diversified portfolios.
Around 20% of the total sample, however, involves significant government ownership (equity
ownership of 20% of the total shares or above). We expect managements of these companies to
be less risk averse given implicit and/or explicit potential for government endorsements at times
of most need. As a result, these companies are expected to hedge lower proportion of their future
jet fuel consumption compared to privately held airline companies. Both in univariate and in
multivariate analysis we control for the government ownership.

Hedging and Firm Value Page 9 of 55
prices. The information related to the periodical fuel consumption is readily
(mandatorily) available for these companies. However, the same information is
only voluntarily disclosed for non-US firms. In fact, for a US airline company an
investor faces a single dimensional risk of oil prices that are traded in the same
functional currency of a US airline company.
For a non-US airline company, however, the risks related to oil prices also have
US dollar exchange rate dimension that makes the overall risk exposure harder
to quantify. A non-US airline company that hedges a certain portion of its US
dollar fuel expenditures might prefer to net-out some of the currency risks related
to the hedged portion of oil price exposure using its receivables. This might
function as an effective means of operational hedge but the information related to
the extent of such strategy is likely to be company specific. As a result, investors
with the information asymmetry might over or under hedge the actual exposure.
Given these information asymmetries and the significant probability of
experiencing financial distress costs, investors might prefer airline companies
that acknowledge and implement operational and/or financial hedging strategies
against these risk factors. Hedging might contribute to firm value maximization if
it reduces cash flow volatility and preserves internally generated cash funds
which help reduce potential underinvestment problems and the probability of
financial distress. Thus, the second stage of our analysis examines the value-
additive proposal of corporate hedging.
Our results indicate a positive relation between hedging and firm value for the
sub-sample of low cost carriers. We don’t find any evidence supporting the
association between firm value and hedging for major carriers. Based on the
33% average hedging level we calculate a value premium of 6.5% for the low
cost carrier sample. Provided that hedging is beneficial in terms of reducing the
variability in operating cash flows for both major carriers and low cost carriers,
the value maximization proposal can be explained as a function of the availability

Hedging and Firm Value Page 10 of 55
of future growth opportunities and the degree of competition. Low cost carriers
have significant investment opportunities and hold a significantly greater portion
of earnings within the company. This observation indicates that these firms use
retained earnings to make necessary cash infusions to ongoing/future investment
projects and/or help increase borrowing capacity. In either case, it is reasonable
to expect that a significant portion of these airlines market value is the present
value of their investment opportunities rather than assets in place, which is the
case for mature companies (MCs).
Our results confirm the theoretical and empirical evidence indicating that the
availability of internal cash flows when they are most needed, either to fund
investments or to repay debt, might be more pronounced for high-growth firms.
Given a significantly greater set of investment opportunities available, the risk of
experiencing underinvestment problem is more intensified for these companies
(Myers, 1977; Brennan and Schwartz, 1981; Essig, 1991; Aretz and Bartram,
2010). In line with agency theory, positive association between hedging and firm
value for the low cost carriers might be the alleviation of the potential
underinvestment problem.
As is the case for any empirical corporate finance research, our study might be
subject to potential endogeneity related problems. Our test variable; the
percentage level of next year’s fuel consumption hedged, is determined by
company management. In the decision making process, management might be
influenced by factors which are unobservable such as the ability to transfer the
portion of fuel costs on to customers (fuel surcharges), managerial expectations
about future cash flows and managerial risk aversion. All these unobservable
factors subject our analysis to potential omitted variable bias. We tackle this
potential omitted variable bias using first differenced analysis and fixed effects
models in section IV.

Hedging and Firm Value Page 11 of 55
On the other hand, some of the firm-specific factors, such as government
ownership, differences in business models and operating regions are observable
variables that we control for in order to prevent potential endogeneity related
bias. We conduct univariate tests in section III and use a dummy variable in an
interaction regression analysis in section IV which controls for government
ownership. Our results suggest a positive association between hedging and firm
value for the low cost carrier subsample are strongly robust to these control
variables and analyses.
The remainder of the paper is structured as follows. Section I analyzes the
theoretical arguments and empirical observations for hedging. Section II
describes the sample selection and methodology. Section III conducts univariate
tests for control variables and cash flow volatility. Section IV tests the value-
additive proposal. Section V concludes.
I. Arguments for Corporate Hedging
Drawing from the frictionless market assumptions of the Modigliani and Miller
(1958, 1963) framework, corporate hedging literature theorize and empirically
test whether and why firms hedge. Additionally, empirical studies question the
hypothesis of shareholder value maximization via hedging. The literature
proposes four rationales for corporate hedging and shareholder value
maximization that are based on lowering cash flow volatility via hedging.
The tax incentives argument states that hedging reduces the variability of pretax
earnings and expected taxes payable, which in turn increases firm value (Smith
and Stulz, 1985; Nance et al. 1993). However, empirical evidence on the tax
convexity motivation for hedging has not been strongly supported; Foo and
Merlyn (2009), Mian (1996), Graham and Rogers (2002), and Gézcy et al. (1997)
find no evidence of tax convexity incentives for hedging. Shanker (2000) shows

Hedging and Firm Value Page 12 of 55
that the tax incentive to hedge is conditioned on the ability to move tax loss
carryforwards both forward and back.
The second argument for the tax incentives for corporate hedging is the
expected benefits of tax shields obtained from debt financing (Morellec and
Smith, 2007). As a result of increased debt financing, firms enjoy greater tax
shield benefits (Graham and Rogers, 2002). Even though increased financial
leverage might result in agency problems, such as the underinvestment and/or
asset substitution problems (Mayers and Smith 1987), Leland (1998) argues that
the expected tax benefits from increased leverage are much higher than the
agency related costs.
Despite its tax shield benefits, increased leverage brings the risk of direct and
indirect costs of financial distress (Smith and Stulz, 1985). Nance et al. (1993)
argue that the probability that a company will face financial distress costs
increases as the proportion of fixed claims in total assets increase. Hedging
reduces the expected costs of bankruptcy by reducing the variance of firm value
(Mayers and Smith, 1982; Smith and Stulz, 1985). Empirical support for the
financial distress hypothesis is weak (Mian, 1996; Purnanandam, 2005).
Additionally, the misalignment of management and shareholder interests is
considered to be an important determinant of corporate hedging. Management is
likely to have an appetite for risk that may not necessarily conform to
shareholders’ best interests (Smith and Stulz, 1985). This is usually the case
when a large portion of managers’ personal wealth is strongly tied to the value of
the business. Managers that are unable to diversify away personal wealth from
company-specific risk factors become more risk-averse and might be more
inclined to hedge to reduce firm level risks (Smith and Stulz, 1985).
Stock options provide greater flexibility in terms of wealth diversification and
might offer management greater incentives for risk taking. Smith and Stulz

Hedging and Firm Value Page 13 of 55
(1985) argue that there are greater incentives to hedge if managers’
compensation depends on stock performance and managers are unable to
diversify away their wealth from firm specific factors. There is some empirical
support for the managerial risk aversion hypothesis (Tufano, 1996; Bartram et
al., 2007; Gay and Nam, 1998; and Haushalter, 2000).
Finally, Froot et al. (1993) investigate the role of hedging on firm-level capital
investments under imperfect markets assumptions. They argue that the
underinvestment problem occurs if corporations forego profitable investment
opportunities when they have a cash flow shortfall and/or face costly external
financing. The uncertain nature of cash flows creates a mismatch between timing
of available internal cash funds and investment opportunities, leaving
corporations with two options when they have insufficient amount of internal cash
funds. They can either forgo profitable investment opportunities or they can
resort to external financing. In reality, debt financing is constrained by direct and
indirect costs such as issuance and transaction costs (Myers, 1977), asymmetric
information problems (Myers and Majluf, 1984), and contracting problems
(Jensen and Meckling, 1976; Myers, 1977). Hedging is beneficial to the extent
that it can reduce the variability in operating cash flows and thus preserve
internally generated funds that can be used in value-adding investment
opportunities without the need for costly external financing.
II. Sample Selection and Research Method
We use COMPUSTAT Global database with a SIC code of 4512 resulting in 972
firm year observations. In order to achieve as much economically meaningful
data as possible, we apply three selection criteria on this data sample. First, the
airline must be publicly traded to calculate the Tobin’s Q ratio. Second, in order
to prevent endogeneity, it must operate in the passenger business (excluding
cargo carriers) but not be a regional carrier. In Appendix 1 we show that regional

Hedging and Firm Value Page 14 of 55
carriers transfer the fuel cost burden (and the related volatility in their operating
cash flows) to the major carriers through operational hedging. And finally, it must
disclose sufficient information on its use of fuel derivatives, including the
percentage of jet fuel consumption hedged7. Based on the above selection
criteria and after the exclusion of small jets with trivial scale of business, we are
left with 70 airline companies. Of these 70 airline companies, 16 disclosed no
hedging data, giving us a final sample of 54 airline companies. Examining the
time period from 2000 to 2012 provides us with 411 firm-year observations in
total. To our knowledge this sample is the largest in the literature that uses
hedging percentage data rather than the less informative dichotomous hedging
dummy variables. Similarly, to our best knowledge, this is also the first global
airline sample studied with actual percentage hedging information to date with 13
US, 14 European and 27 international airline companies.
The test variable, the percentage of the next year’s fuel consumption hedged, is
readily available for most airline companies that have an established risk
management policy. The availability of this data avoids the hazard of making
subjective assumptions about the size, scope, and tenure of derivative contracts.
Panels A and B of Table I present the descriptive statistics. The first 16 airline
companies are low cost carriers and the rest of the sample are major carriers.
The table is sorted from the highest level of fuel consumption hedged to the
lowest. It demonstrates that for both low cost and major carrier subsamples, as
the level of forecasted fuel consumption hedged increases fuel costs as a
percentage of operating expenses decreases.
7 The advantage of the airline industry is that the data related to jet fuel price hedges are easier
to obtain in comparison to many other industries. Economically, there is a substantial difference
between 5% hedging and 50% hedging, regardless of the scope of the risk exposure (whether it
is a commodity or currency risk or a combination of both). The economical substance of the
actual amount of fuel consumption hedged would be disregarded by the use of dichotomous
hedging variables, which would be a non-trivial oversight for the airline industry.

Hedging and Firm Value Page 15 of 55
A limitation of our paper is that our sample is constrained by the lack of
consistency in the disclosure of hedging data for non-US airline companies.
European airline companies only started to disclose the necessary information
on fuel risk management after the implementation of International Accounting
Standard 32 (Disclosure of Financial Instruments, IAS32) for financial years
beginning in January 2005, prior to which disclosure is voluntary. Some of the
international airlines do not fall under the umbrella of the International Generally
Accepted Accounting Principles (iGAAP) or US Generally Accepted Accounting
Principles (US GAAP). Having controlled for the regional differences, we find no
evidence that the accounting, financial, and economic fundamentals of airlines
that voluntarily disclose such information are materially different from mandatory
disclosers. These techniques result in an unbalanced panel, but we obtain the
most diversified sample on the airline industry.
We use company annual and quarterly reports, 10-K filings, and company
presentations to gather fuel hedging levels and financial data. We obtain stock
price data from DataStream and Bloomberg to calculate Tobin’s Q as a measure
of firm value. We adjust for off-balance-sheet leases to more reliably reflect the
assets, liabilities, operational leverage, asset turnover, and profitability
measures. Following Damodaran (2002), we add the present value of operating
leases to assets and liabilities and obtain Q values (Adjusted Q) that reflect the
impact of hidden assets and liabilities that take into account the true amount of
firm commitments.
<<Insert Table I about here>>
There are many different ways to estimate the Q value but there is a lack of
consensus as to the best measure (Whited, 2001). We use Chung and Pruitt
(1994) approximation which gives unadjusted Q measure as:
(1)

Hedging and Firm Value Page 16 of 55
The numerator is the summation of the market value of equity, which we
estimate by multiplying the number of shares outstanding with share price, the
liquidation value of preferred stocks outstanding, and the book value of short and
long-term debt. The denominator is total assets.
It is well known that the airline industry makes extensive use of off balance sheet
leasing arrangements to facilitate its operations. Following Damodaran (2002), in
the last column of Panel D in Table II we show that for our sample, the ratio of
off-balance-sheet leases to total assets is 41% for low cost carriers (growth
firms) and 24% for major airlines (mature firms). The adjusted measure of
Tobin’s Q for the robustness test performed is:
(2)
As Jin and Jorion (2006) state, to prevent endogeneity in hedging and firm value
variables, it is preferable to have a dataset that incorporates firms with different
levels of hedge ratios. Table II Panels A, B, and C exhibit our analysis on the
hedging percentages and control variables. Panel A summarizes the hedging
and non-hedging firm-year data for the total sample and the low-cost and major
airlines subsamples. Columns 2 to 10 show the hedging levels in percentages
ranging from zero to 90%, where H stands for hedging percentage. These
subsamples yield 88 non-hedging-firm year and 323 hedging-firm year
observations. On the other hand, 60% of the low-cost carriers sample and 45%
of the major carriers sample are hedging less than their group average hedge
levels and 25% and 35% of the airlines are hedging less than 10% and 20%,
respectively. Average hedging levels of each group are summarized in Table II,
Panels B and C, as 34%, 33%, and 35% for the “total sample”, “low-cost
carriers”, and “major carriers”, respectively. The similarity in the hedging levels
reassures us that our sample does not suffer from the endogeneity problem. We

Hedging and Firm Value Page 17 of 55
also provide summary statistics for the US, European, and international airline
company regional subsamples that we examine for the robustness of our
analysis.
<<Insert Table II about here>>
Column 9 in Panels B and C of Table II, display the unadjusted and adjusted
values for Tobin’s Q. After adjusting for off-balance-sheet leases, the largest
reduction in the average value of Tobin’s Q is observed for the low cost carriers.
The relatively lower asset base for these companies is the main reason for the
drop in Q value but this has no impact on regression findings. Columns 2 and 3
of Panels B and C show the amount of expected fuel consumption hedged and
the average percentage of fuel costs in total operating expenses.
The airline companies in our sample that do not hedge in any year of the sample
period examined are Jet Airways, Kingfisher, and SpiceJet (India); Jazeera
(UAE); Asiana (Korea); and Hainan and China Southern (China). However, some
airlines hedge sporadically, and when they do hedge, it is usually a small
percentage of their fuel consumption. Turkish Airlines (Turkey) did not hedge
until 2009 and since then has only hedged between 10% and 20% of total
consumption. Allegiant (US) hedged insignificant amounts (10% and 2% in 2006
and 2007, respectively) and stopped hedging in 2008. Air Arabia (Saudi Arabia)
did not hedge from 2007-2010 and then only hedged 17% and 25% in 2011 and
2012, respectively. Similarly, US Airways abandoned hedging in year 2008 and
has not hedged since.

Hedging and Firm Value Page 18 of 55
III. Univariate Tests of Control Variables
The fundamental underlying of hedging, alongside theoretically documented
incentives, is to facilitate the timely delivery of forecast cash flows. Although it is
not possible to eliminate all the risks to future cash flows, those related to
hedgeable risk factors are manageable using financial instruments. Hedging can
be referred to as a “success” if it helps reduce the undesired level of volatility in
cash flows. If the target level of variability in cash flows is assured, management
can focus on its core operations more efficiently. Hence, this section begins by
testing if hedging is useful in lowering variability in internal cash flows.
Panel A of Table III conducts univariate analysis for hedging and non-hedging
firm-year observations. We report both mean and median level differences for
each control variable as well as adjusted and unadjusted Q dependent variables.
Neither mean nor median values for control variables are statistically different
from one another except for fuel costs-to-total operating expenses and leverage
(both unadjusted and adjusted for off-balance sheet leases). Our results indicate
that, on average, hedging firm years coincide with 6% lower fuel costs-to-total
operating expenses compared to non-hedging firm-year observations.
Additionally, in line with our expectations, we observe lower variability in
operating cash flows (CFO/Rev) and capital expenditures (Capex/Rev), both
scaled by revenues, for hedging-year observations compared to non-hedging
year observations. Non-hedging firms tend to use significantly more financial
leverage compared to hedging firms. However, the sustainability of heavy
reliance on external financing of investments and/or day-to-day operations in the
extremely concentrated, low-margin environment of the airline industry is
questionable.
In addition, multivariate analysis in Panel C test for the effect of one period
lagged percentage of the next year’s consumption hedged on the level of fuel
costs scaled by total operating expenses. The one year lagged hedge variable is

Hedging and Firm Value Page 19 of 55
used as an independent variable in order to better reflect the timely impact of the
hedging decision that is made in year and the results from actual hedging
that materializes in year . In the airline industry, fuel is a nonfinancial asset and
is reported as the “net effective fuel cost” (i.e., the difference between actual jet
fuel costs on the spot market including taxes, less (plus) any gain (loss) from the
hedging transactions). As a result, any financial impact from hedging
transactions at time will be recognized in fuel cost expenses at time .
Hence, we test the following equation:
⁄ (3)
The results show that the ratio of fuel costs to operating expenses at time is
significant and negatively associated with the hedging percentage entered into at
time , and significant and positively associated with jet fuel prices at time .
Given the accounting requirements of IAS39 and the US equivalent SFAS133,
we interpret these results as evidence that hedging reduces fuel costs.
The analysis in Panel B of Table III is a univariate test of control variables for
low-cost and major airline subsamples. We observe statistically significant
differences in firm value, measured by both unadjusted (UAQ) and adjusted
Tobin’s Q (Adj.Q); the level of investment opportunities, measured by Capex-to-
revenues (Capex/Rev); the level of operating cash flows; measured by cash
flows from operations scaled by revenues (CFO/Rev); and profitability, measured
by both unadjusted (RoA) and adjusted return on assets (RoA Adj.).
The results in Panel B of Table III demonstrate the superior performance of the
low cost carrier business model over the major carrier business model for the
sample period. We observe significantly greater capital expenditures, cash flows
from operations, and return on assets for the low-cost sub-sample, indicating
higher growth expectations, compared to the major airlines sub-sample.

Hedging and Firm Value Page 20 of 55
Additionally, major carriers have utilized significantly more external financing
than low-cost carriers. This suggests that compared to major carriers, low-cost
carriers finance a greater proportion of their investment opportunity set by using
internal funds which is also evidenced by the analysis in Figure 2. Whether this is
attributable to capital budgeting policy or to limitations on the extent of the
availability of external financing, or both, it might suggest that as high growth
firms, low-cost carriers can be more sensitive to the level of internal cash funds
(see Figure 2). Consequently, the deficiency of internally generated cash flows
might expose low cost carriers to significant underinvestment problems. This
argument is analyzed in greater detail using multivariate analysis in section IV.
<<Insert Table III about here>>
The deregulation of the airline industry outside of the US occurred gradually
largely because governments put national interests before operational efficiency.
Although aviation markets are more efficient compared to 20 years ago, there
still remains some government intervention within the managements of some of
the major carriers; also called “flagship carriers”. About 40% of the airline
companies in the major carriers sample have government ownership at or above
20% of the total shares outstanding (see Appendix II), which theoretically can
exert significant influence over planning and budgeting decisions. In our opinion,
these airline companies might enjoy competitive protectionism and financial
support from their governments to a certain extent that might make them less risk
averse compared to privately owned airline companies.
Univariate analysis in Panel A of Table IV compares airline companies with
government ownership to privately owned airline companies. Privately owned
airline companies include all of the low cost airlines in addition to major airlines
with no government ownership. The analysis in Panel B of Table IV compares

Hedging and Firm Value Page 21 of 55
major carriers with government ownership to major carriers with no government
ownership.
<<Insert Table IV about here>>
In both panels, we observe higher firm value for airline companies with no
government ownership. Parallel to our expectations, in both panels, major
carriers with significant government ownership hedge a significantly lower
amount of their total expected fuel consumption compared to airline companies
with no government ownership. We argue that the differences in hedging
behavior might be a result of the comfort of having the financial support from
governments (too big to fail) and/or lack of effective risk management policies8.
These results should not necessarily suggest a positive association between
hedging and firm value for these privately owned airline companies. Univariate
tests in Panels A and B in Table IV are not a direct examination of hedging and
firm value relationship. Higher firm values for privately owned airline companies
might be a result of differences in operational efficiency other than hedging,
which we cannot capture with univariate tests. Consequently, we control for
government ownership in the multivariate regression analyses in section IV.
IV. Value-Additive Proposal
8 Despite being privately owned, some airline companies still receive government support. This is
usually the case if the airline in question is a national carrier (flag carrier) of a country. An
example of such transaction has been Japanese Airlines (JAL) which received ¥350B from
Japanese government during the re-structuring period in 2010. We are unable to capture majority
of similar implicit government and a carrier relationships as the information with regards to
government subsidies are not usually publicized. Additionally, the degree of government support
for these national carriers might not necessarily be in the form of net cash infusion but rather in
the form of easier access to external capital through state owned borrowing channels.

Hedging and Firm Value Page 22 of 55
Panels A and B of Table IV present the results of regression analyses testing for
the association between hedging and firm value for the low-cost carriers, and
major airlines. The model that we test is:
(4)
The dependent variable; , is the natural logarithm of the unadjusted and
adjusted Tobin’s Q. The independent control variables are as follows:
1. Log (assets): Firm size is directly and positively related to derivatives usage
(Nance et al., 1993; Mian, 1996 and Gézcy et al., 1997). Prior studies test
whether firm size, for which they use the natural logarithm of total assets as the
proxy, is associated with firm value. Their results are mixed. Allayannis and
Weston (2001) and Carter et al. (2006) find a negative relationship between the
two but Jin and Jorion (2006) reports a positive relation. We find a negative value
relation between firm value and firm size for low-cost carriers and a positive
value relation for major carriers.
2. Leverage: To control for financial leverage we use the ratio of total debt to total
equity. Consistent with Carter et al. (2006), we find no relation between firm
value and leverage.
3. RoA: We use return on assets (Net Income/Total Assets) as a control variable
for profitability. Carter et al. (2006) do not control for a profitability variable and
Jin and Jorion (2006) find no association between return on assets (RoA) and
firm value. Unlike prior studies, we find that the relation between return on assets
and firm value is largely positively and significant for both unadjusted RoA and
RoA adjusted for off-balance sheet leases.
4. Capex/Rev: We use the ratio of capital expenditure-to-revenues to control for
the investment expenditure of airlines. Consistent with Jin and Jorion (2006), we

Hedging and Firm Value Page 23 of 55
find that firm value is positively associated with our proxy for investment
opportunities for low-cost carriers and the total samples. For major airlines the
association is positive, but not significant.
5. CFO/Rev: To control for internal cash flow generation we use the ratio of cash
flow from operations to sales revenue. Consistent with prior studies, we observe
a significant positive association between internally generated cash flows and
firm value.
6. Fuel/Opex: We add the ratio of fuel expenditures to operating expenses to
examine the importance of fuel costs on firm value. We expect this variable to be
negatively related to firm value, i.e., an increase in fuel costs will reduce airlines’
profit margins. Our results show no direct relation between fuel costs and firm
value.
7. Dividends: We add a dummy variable to indicate whether the firm paid a
dividend to its ordinary shareholders. This is a test for “reaching the financial
market” (Jin and Jorion, 2006). Contrary to prior studies, we observe negative
relation between dividends and firm value.
8. Interest rate hedging (HIR): We use a dummy variable to indicate whether a
firm has hedged its interest rate exposure or not.
9. Foreign currency risk hedging (HFXP): We control for the foreign currency risk
management using a dummy variable. Some US companies (usually low cost
carriers) have no foreign currency exposure. Our dummy variable takes into
consideration whether an airline company is exposed to foreign currency risk or
not. We use an interaction dummy variable where if the firm is exposed to
currency risk and hedges we assign a dummy variable (HFXP) of 1, and 0
otherwise. Firms with no exposure to foreign currency risk are not hedging.

Hedging and Firm Value Page 24 of 55
However, neither the interest rate nor the currency hedging dummy variable
provide information as to the level of hedges in our analysis. Unfortunately, using
dummy variables to control for these hedges, we assume that 5% hedging has
the same economical substance as 90% hedging.
10. Time effects: We add a time dummy variable for year observations. Our
test variable, hedging is robust to time effects.
Panels A and B of Table V present regression results using unadjusted and
adjusted Tobin’s Q as dependent variables and hedging as a test variable
alongside with control variables. Columns 2 and 3 show the results of our
estimations for the low-cost carriers sub-sample (LCC), and columns 4 and 5
show the results for major carriers sub-sample (MC). In all regressions we use
ordinary least squares (OLS R.) and generalized least squares regressions
(GLS. R), both with heteroskedastically adjusted standard errors. The analyses
indicate a significant and positive association between hedging and firm value for
the low-cost carriers. The results in Panel B are robust to firm value (adjusted
Tobin’s Q), firm size, firm leverage and profitability control variables, adjusted for
off-balance sheet leases in all of the regressions. We do not observe, however,
any statistically significant relation between firm value and the percentage of fuel
consumption hedged for major airlines.
<<Insert Table V about here>>
In Panels A and B of Table VI we tackle the potential issue of omitted variable
bias that may influence the hedging premium for the low cost carrier sub-sample.
Following Allayannis and Weston (2001), in columns 2 and 3 in Panel A, we
conduct a first-differenced regression on the hedging variable and firm value
where the dependent variable in the column 3 is the adjusted Tobin’s Q. Our
analyses examine whether the value premium from hedging is driven by actual
Hedging and Firm Value Page 25 of 55
changes in the levels of hedging, enabling us to control for potential omitted
variable bias. Results indicate that for both unadjusted and adjusted Q
measures, hedging is a robust contributor to firm value for the low cost carriers
sub-sample.
In the analysis reported in columns 4 and 5 in Panel A of Table VI, we use
quantile regressions to control for the influence of possible outliers. For the
analysis in column 4 with unadjusted Q measure as the dependent variable, we
observe the association between hedging and firm value is at the p=0.11 level,
which is slightly outside the usual significance levels. In column 5, our analysis
using adjusted Q measure is robust at p=0.05.
<<Insert Table VI about here>>
Next, in columns 2 and 3 in Panel B of Table VI we conduct fixed effect
regressions using both unadjusted and adjusted Tobin’s Q as a dependent
variable, respectively. Results in both columns indicate that the association
between hedging and firm value is robust to potential omitted variable bias for
the low cost carriers sub-sample. Additionally, in columns 4 and 5 we allow for
correlation within each group of observations (airline companies) using cluster
analysis. By relaxing the assumption of independent observations, in both
regressions we obtain the same positive results for hedging and firm value for
the low cost carriers sub-sample.
Panel A and B of Table VII test for the categorical variable bias. Columns 2 to 5
use a low cost carrier dummy variable (LCCdummy), alongside with its
interaction (hedgeLCC) with our test variable; hedging for the total sample for
unadjusted and adjusted firm value and control variables. In these analyses we
aim to test whether the positive results for hedging and firm value for the low cost
carriers are robust to hidden “low cost carrier” firm bias. More precisely, the

Hedging and Firm Value Page 26 of 55
question we ask is; whether our results are driven by unobservable
characteristics of the low cost carriers (managerial abilities etc.). If the direct
positive relation between hedging variable and firm value is genuine, then the
coefficient between the interaction variable (hedgeLCC) and firm value should be
positive regardless of the coefficient between the low cost carrier dummy
variable (LCCdummy) and the firm value. We use heteroskedasticity adjusted
ordinary least squares regression (OLS R.) and generalized least square
regression (GLS. R.), with robust standard errors. In all of the regressions, we
observe positive association between the interaction variable (HedgeLCC) and
firm value, regardless of the coefficient for low cost carrier categorical variable
(LCCdummy). These results indicate that the association between fuel hedging
and firm value is robust to a possible low cost carrier firm bias.
The analyses in Panel B of Table VII divide the sample into US, European, and
international subsamples and assign dummy variables (USdummy for US
firms and EUdummy for EU firms and use international sample as base) to
control for the potential influence of jurisdictional differences. Additionally,
interaction variables are used to (HedgeUS and HedgeEU for US and European
firms, respectively) control for the next year’s fuel consumption hedged by airline
companies from both regions. This is important since we have a set of global
airline companies that are subject to different accounting regulations and industry
specific characteristics which we could not control for. We perform
heteroskedasticity adjusted ordinary least squares regression (OLS R.) and
generalized least square regression (GLS. R.), with robust standard errors in all
regressions for both unadjusted and adjusted firm value and control variables.
Results indicate that hedging and firm value relation is robust to low cost carrier
hedging interaction variable indicating that there is no significant regional level
outlier that affects our results.
Finally, Table VIII examines whether there is an influence of government
ownership on our results. Hedging and firm value relation for the low cost carrier

Hedging and Firm Value Page 27 of 55
sample might be driven by the relatively poor financial performance of the major
carriers with government ownership. If this is the case, we would expect to see a
positive firm value and hedging relation for privately owned major carriers. In this
context, in all columns a dummy variable (GOVdummy) is added that takes the
value of 1 if the government ownership is at or more than 20% of the total
number of outstanding shares and a variable (hedgeGOV) is added to represent
the interaction between government ownership and hedging. Columns 2 and 3
conduct categorical variable regression analysis on the unadjusted data for the
major carriers sub-sample and columns 4 and 5 conduct categorical variable
regression analysis on the adjusted data for the major carriers sub-sample. Both
ordinary least squares (OLS R.) and generalized least squares (GLS R.)
regressions use heteroskedasticity adjusted robust standard errors. The variable
“hedging” in all columns represents the hedging coefficient for privately owned
major carriers.
Results in all columns indicate significantly lower firm values for airline
companies with government ownership. This is in line with our expectations
stated in sections I and III. However, the interaction variable (hedgeGOV)
presents no statistical relation between firm value and hedging for these airlines
in any of the regressions. Hedging coefficient for major carriers is insensitive to
the government ownership control variable. These findings suggest that the
results for the low cost carriers might be driven by the investors’ appreciation of
greater growth potential and relatively higher sensitivity for internal cash funds for
low cost carriers’ business model and as a result, the need for fuel risk
management to assure an orderly cash flow stream. Based on 33% average
level of hedging for the low cost carrier sample, the coefficient for hedging
corresponds to a value premium of 6.5% on average.

Hedging and Firm Value Page 28 of 55
IV. Summary and Conclusion
In this paper we use a sample of 54 publicly traded airline companies yielding
411 firm year observations for the13 year period between 2000 and 2012. To the
best of our knowledge, this is the largest sample that examines corporate
hedging and firm value maximization using actual hedging variables.
The benefits of examining the airline industry can be outlined under four
headings. First, the industry is significantly exposed to jet-fuel price risk; the
proportion of jet fuel prices has exceeded one third of total operating expenses.
Consequently, the industry cash flows and investments are extremely sensitive
to adverse movements in oil prices. Second, the percentage levels of jet fuel
hedges are readily available for the majority of the airline companies. Third,
given the intense competitive environment, the industry can only transfer a
limited portion of jet fuel price risks to customers, hence the availability of
operational hedges are somewhat limited (excluding regional carriers). And
fourth, the industry operates at low profit margins and utilizes significant financial
leverage, potentially exposing companies to the risk of financial distress. Our
analysis enables us to examine the implications of jet fuel hedging for an industry
in which theoretically the benefits from hedging are expected to be highest.
The basic tenet of corporate risk management theory is the reduction in
variability of operating cash flows. Necessarily, the first question we ask is
whether hedging is useful in reducing variability in internal cash flows? The
results of the univariate analysis suggest that the variability in operating cash
flows and capital expenditures are significantly lower for hedgers compared to
non-hedgers. Multivariate analysis in section IV also indicate that both internal
cash flows and capital expenditures are important contributors to firm value.

Hedging and Firm Value Page 29 of 55
Additionally, fuel costs as a percentage of total operating expenses are 6% lower
for hedging year observations compared to non-hedging year observations.
These results indicate the benefits of jet fuel hedging in terms of preserving
internal cash funds and alleviating potential underinvestment problems for both
low cost carriers and major carriers.
Next, we examine the value premium associated with hedging under conditions
when there are information asymmetries and greater risk of financial distress that
are inherent in our sample of global airline companies. We separate our sample
in two sub-samples of 1) low cost carriers, 2) major carriers. This allows us to
control for economically important differences between these two business
models, one in its high growth state (low cost carriers) and the other in its mature
state (major carriers). Using two Q measures for each regression, one of which is
adjusted for off-balance sheet leases, we find that hedging has contributed to
firm value for the low-cost carriers with a value premium of 6.5%, on average.
We find no association between hedging and firm value for the major carrier
sample examined.
At their growth stage we would expect market values of low cost carrier firms to
be largely comprised of the present value of future growth opportunities. Lacking
implicit/explicit financial support of governments, and significant competition for
investment opportunities, we observe that low cost carriers use significantly
lower debt financing relative to major carriers. This, in our opinion, makes these
high-growth firms more sensitive to the level of internally generated cash flows.
Accordingly, we would expect low cost carriers to be more prone to significant
underinvestment problems if they are unable to take advantage of investment
opportunities due to funding constraints. Our empirical observations suggest that
investors acknowledge the potential benefits of hedging for these high-growth
firms and reward the awareness and/or penalize the ignorance of risks related to
oil prices for these companies. These findings confirm the agency theory of
corporate finance.

Hedging and Firm Value Page 30 of 55
We subject our results to a number of endogeneity tests where we take potential
omitted variable bias into account and additionally control for the influence of
government ownership and locational differences among sample airlines.
Empirical observation of positive association between hedging and firm value for
the low cost carriers sub-sample is stable and statistically robust across these
different estimations.
In this paper we find evidence supporting the value maximization via hedging
when firms have significant investment opportunities and potential financial
distress costs which confirm the theoretical incentive for corporate risk
management. Albeit contributing to the empirical evidence documenting the
benefits of hedging for commodity end-user risk profile, our results, just as any
prior study, may also be influenced by differences in risk management strategies
and financial instruments used which could be a subject for further research.

Hedging and Firm Value Page 31 of 55
REFERENCES
Allayannis, George, and James Weston, 2001, The use of foreign currency
derivatives and firm market value, Review of Financial Studies 14, 243-276.
Allayannis, George and Ofek Eli, 2001, Exchange rate exposure, hedging, and
the use of foreign currency derivatives, Journal of International Money and
Finance 20, 273-296.
Aretz, Kevin, and Söhnke Bartram, 2010, Corporate hedging and shareholder
value, Journal of Financial Research, 14088.
Bartram, Söhnke, Gregory Brown, and Frank Fehle, 2009, International evidence
on financial derivatives usage, Financial Management, 38, 185-206.
Bodnar, Gordon, Hayt Gregory, Marston Richard, Smithson W. Charles, 1995,
Wharton survey of derivative usage by US non-financial firms, Financial
Management, 24, 104-114.
Brennan, Michael and Schwartz Eduardo, 1981, The case for convertibles,
Chase Financial Quarterly.
Brown, Gregory, Crabb R. Peter, and Haushalter David, 2003, Are firms
successful at selective hedging? Journal of Business, 79, 2925-2949.
Carter, A. David, Rogers A. Daniel, and Simkins J. Betty, 2004, Does hedging
affect firm value? Working paper.
Carter, A. David, Rogers A. Daniel, and Simkins J. Betty, 2006, Does hedging
affect firm value? Evidence from the US airline industry, Financial
Management 35, 53-86.
Carter, A. David, Rogers A. Daniel, and Simkins J. Betty, 2006, Fuel hedging in
airline industry: The case of Southwest Airlines.
Damodaran, Aswath, 2002, Investment valuation: tools and techniques for
determining the value of any asset, 2nd edition, John Wiley & Sons, New
York.
DeMarzo, Peter, and Darrell Duffie, 1995, Corporate incentives for hedging and
hedge accounting, Review of Financial Studies 8, 743–771

Hedging and Firm Value Page 32 of 55
Froot, Kenneth, David Scharfstein, and Jeremy Stein, 1993, Risk management:
Coordinating corporate investment and financing policies, Journal of
Finance 48, 1629–1658.
Gay, D. Gerald, and Jouahn Nam, 1998, The underinvestment problem and
corporate derivatives use, Financial Management 4, 53-69.
Guay, Wayne, and S. P. Kothari, 2003, How much do firms hedge with
derivatives? Journal of Financial Economics 80, 423–461.
Graham R. John, and Daniel A. Rogers, 1999, Does corporate hedging increase
firm value? An empirical analysis.
Graham, R. John, and Daniel Rogers, 2002, Do firms hedge in response to tax
incentives? Journal of Finance 57, 815–839.
Haushalter, David, 2000, Financing policy, basis risk, and corporate hedging:
Evidence from oil and gas producers, Journal of Finance 55, 107–152.
Healy, M. Paul and Palepu G. Khrishna, 2001, Information asymmetry, corporate
disclosure, and the capital markets: a review of the empirical disclosure
literature, Journal of Accounting and Economics 31, 405-440.
Hentschel, Ludger and S. P. Kothari, 2001, Are corporations reducing or taking
risks with derivatives? Journal of Financial and Quantitative Analysis 36,
93-118.
Jin, Yanbo and Philippe Jorion, 2006, Firm value and hedging: Evidence from US
oil and gas producers, Journal of Finance 30, 811-821.
Jensen, C. Michael, and William H. Meckling, 1976, Theory of the firm:
managerial behavior, agency costs and ownership structure, Journal of
Financial Economics 4, 305-360.
Krishnaswami, Sudha and Subramaniam Venkat, 1999, Information asymmetry,
valuation and the corporate spine-off decision, Journal of Financial
Economics 53, 73-112.
Leland, E. Hayne, 2002, Agency costs, risk management and capital structure,
Journal of Finance 53, 1213-1243.
Meulbroek, K. Lisa, 2002, Integrated risk management for the firm: A senior
manager’s guide, Journal of Applied Corporate Finance 14, 56-70.

Hedging and Firm Value Page 33 of 55
Myers, Stewart, 1977, The determinants of corporate borrowing, Journal of
Financial Economics, 875-56.
Mayers, David, and Clifford W. Smith, 1982, On the corporate demand for
insurance, Journal of Business 55, 281–296.
Mian, Shehzad, 1996, Evidence on corporate hedging policy, Journal of Financial
and Quantitative Analysis 31, 419–439.
Miller, Merton and Rock Kevin, 1985, Dividend policy under asymmetric
information, The Journal of Finance 40, 1031-1051.
Myers, C. Stewart, and Nicholas S. Majluf, 1984, Corporate financing and
investment decisions when firms have information that investors do not
have, Journal of Financial Economics 13, 187-221.
Morrell, Peter, and William Swan, 2006, Airline jet fuel hedging: theory and
practice, Transport Reviews 26, 713-730.
Morellec, Erwan and, Clifford W. Smith, 2007, Agency conflicts and risk
management, Review of Finance 11, 1-23.
Myers, C. Stewart, 1977, Determinants of corporate borrowing, Journal of
Financial Economics 5, 147-175.
Nance, Deana, Clifford Smith, and Charles Smithson, 1993, On the determinants
of corporate hedging, Journal of Finance 48, 267–284.
Noe, H. Thomas and Rebello J. Michael, 1996, Asymmetric information,
managerial opportunism, financing and payout policies, The Journal of
Finance 51, 637-660.
Purnanandam, Amiyatosh, 2008, Financial distress and corporate risk
management: theory and evidence, Journal of Financial Economics 87,
706-739.
Smith, W. Clifford, and Rene Stulz, 1985, The determinants of firms’ hedging
policies, Journal of Financial and Quantitative Analysis 20, 391-405.
Stulz, René, 1984, Optimal hedging policies, Journal of Financial and
Quantitative Analysis 19, 127–140.
Hedging and Firm Value Page 34 of 55
Tufano, Peter, 1996, Who manages risk? An empirical examination of risk
management practices in the gold mining industry, Journal of Finance 51,
1097-1137.

Hedging and Firm Value Page 35 of 55
Table I Statistical Properties of the Sample
This table exhibits the mean levels of the control variables used in the sample ordered by the highest level of
next year’s fuel consumption hedged (column 2). Panel A is unadjusted for off-balance sheet leases, and
Panel B is adjusted for off-balance sheet leases. In column 1, the first 16 companies are low-cost carriers
(LCCs) and the following 38 companies are major carriers (MCs). Columns 2 and 3 show the amount of next
year’s fuel consumption hedged and the proportion of fuel expenses in total operating costs in percentages.
These two data do not change in Panel B. Column 4 exhibits the Return On Assets control variable for
profitability calculated as; “Net Income/Total Assets”. This ratio is adjusted for off-balance-sheet leases and
is lower for each company in Panel B. Columns 5 and 6 measure the financial leverage calculated as; “Total
Debt/Shareholder’s Equity” and firm size as Log of Assets. Columns 7 and 8 show the levels of cash flows
and capital expenditures both scaled by revenues. Column 9 shows the average level of firm value measured
by Tobin’s Q. Q measure is adjusted for off-balance sheet leases in Panel B.
PANEL A: Firm Level Data Unadjusted for Off-Balance Sheet Leases
Hedging F/O RoA Lvrg Lnasset CF/Rev Capex/Rev TBQ
Low Cost Carriers
Ryanair 73% 32% 6% 1.31 8.29 35% 39% 2.11
Southwest 63% 25% 3% 1.45 9.45 15% 14% 1.54
Vueling 52% 26% 6% 1.43 6.20 10% 0% 1.14
Air Berlin 50% 23% -2% 6.00 7.70 1% 7% 1.04
Easyjet 46% 23% 4% 1.09 7.57 14% 19% 1.22
Airtran 31% 31% 1% 4.74 7.10 5% 4% 1.47
Virgin Blue 30% 27% 6% 2.14 7.76 19% 27% 1.40
Airasia 30% 46% 6% 2.20 8.81 19% 58% 1.65
GOL 28% 37% 4% 1.77 7.76 7% 9% 1.44
Jetblue 27% 31% 1% 3.19 8.39 15% 39% 1.30
Westjet 19% 27% 5% 1.66 7.53 19% 27% 1.75
Frontier Airlines 8% 23% 0% 3.61 6.44 7% 17% 1.24
Air Arabia 8% 43% 6% 0.16 8.72 24% 13% 0.95
Allegiant 2% 45% 9% 0.86 6.13 17% 11% 2.29
Jazeera 0% 46% 0% 5.11 4.73 15% 35% 1.36
Spice Jet 0% 42% -12% 13.41 9.28 -7% 18% 1.86
Major Carriers
ANA 77% 18% 1% 3.36 14.35 10% 15% 1.22
Lufthansa 74% 16% 1% 3.13 9.99 10% 8% 1.02
JAL 73% 18% -20% 7.89 14.54 4% 6% 1.18
British Airways 60% 28% 3% 3.99 9.31 9% 5% 1.05
IAG 60% 37% -5% 2.92 9.90 2% 7% 0.95
Aer Lingus 59% 24% 0% 1.29 7.53 4% 6% 0.95
Air New Zealand 58% 33% 2% 2.08 8.51 12% 13% 0.95
Qantas 57% 23% 2% 2.36 9.91 10% 10% 0.99
Air France KLM 55% 22% 1% 2.89 10.10 7% 10% 0.90
Finnair 53% 21% 0% 1.75 7.52 6% 9% 0.95

Hedging and Firm Value Page 36 of 55
Aeromexico 50% 35% 7% 3.10 10.12 8% 7% 1.38
SAS AB 49% 17% -3% 2.82 10.79 0% 7% 0.92
Iberia 47% 21% 3% 2.15 8.60 4% 6% 1.10
Alaska Airlines 42% 24% 1% 3.86 8.23 12% 13% 1.12
Hawaiian 37% 29% 3% 7.77 6.93 11% 10% 1.15
El Al Israel 37% 37% -1% 7.97 8.76 6% 8% 0.98
LAN 36% 36% 7% 4.66 14.52 18% 22% 1.94
Thai 36% 36% 1% 3.27 12.47 9% 11% 0.99
Cathay Pacific 33% 36% 4% 1.47 11.62 12% 11% 1.14
Singapore 33% 32% 5% 0.69 10.00 20% 19% 1.14
United 30% 32% 9% 13.90 10.23 6% 2% 1.07
Latam 28% 35% 2% 3.62 9.44 13% 25% 1.57
Atlantic Airways 28% 26% 3% 0.74 6.00 17% 10% 0.74
Delta 27% 29% -10% 33.48 10.40 3% 5% 1.00
Air Canada 25% 27% -1% 4.04 9.27 3% 7% 0.88
AMR Corp 24% 24% -3% 69.35 10.23 4% 8% 1.01
Copa 23% 37% 10% 1.77 7.61 22% 23% 1.65
Air China 16% 36% 3% 2.53 11.57 17% 18% 1.41
Aegean 16% 26% 2% 1.14 6.02 4% 4% 1.08
China Eastern 15% 34% -2% 12.75 11.34 8% 10% 1.62
US Airways 9% 27% -2% 33.43 8.95 2% 2% 1.18
Turkish Airlines 5% 27% 6% 1.84 8.50 15% 8% 1.07
Jet Airways 0% 34% -1% 25.29 11.92 5% 21% 1.33
Kingfisher 0% 37% -18% 4.78 11.27 -13% 3% 0.89
Hainan 0% 35% 1% 5.59 11.07 24% 40% 1.11
Asiana 0% 35% 0% 4.98 8.59 6% 4% 1.06
China Southern 0% 34% 3% 3.72 11.61 16% 23% 1.03
Pakistan Air. 0% 37% -5% 27.57 11.33 1% 10% 1.10
PANEL B: Firm Level Data Adjusted for Off-Balance Sheet Leases
Hedging F/O RoA Lvrg Lnasset CF/Rev Capex/Rev TBQ
Low Cost Carriers
Ryanair 73% 32% 6% 1.44 8.35 35% 39% 2.02
Southwest 63% 25% 3% 1.89 9.61 15% 14% 1.44
Vueling 52% 26% 4% 2.71 6.61 10% 0% 1.10
Air Berlin 50% 23% -1% 11.67 8.20 1% 7% 1.02
Easyjet 46% 23% 4% 1.35 7.68 14% 19% 1.17
Airtran 31% 31% 0% 15.00 8.15 5% 4% 1.14
Virgin Blue 30% 27% 5% 2.86 7.97 19% 27% 1.32
Airasia 30% 46% 6% 2.37 8.85 19% 58% 1.58
GOL 28% 37% 3% 2.56 8.02 7% 9% 1.33

Hedging and Firm Value Page 37 of 55
Jetblue 27% 31% 1% 4.32 8.63 15% 39% 1.22
Westjet 19% 27% 4% 2.53 7.82 19% 27% 1.55
Frontier Airlines 8% 23% -1% 4.47 7.23 7% 17% 1.09
Air Arabia 8% 43% 6% 0.25 8.79 24% 13% 0.95
Allegiant 2% 45% 9% 0.94 6.17 17% 11% 2.29
Jazeera 0% 46% 0% 5.11 4.73 15% 35% 1.25
Spice Jet 0% 42% -5% -0.98 10.15 -7% 18% 1.47
Major Carriers
ANA 77% 18% 1% 3.72 14.43 10% 15% 1.18
Lufthansa 74% 16% 1% 3.34 10.04 10% 8% 1.02
JAL 73% 18% -17% 9.24 14.68 4% 6% 1.10
British Airways 60% 28% 3% 4.76 9.45 9% 5% 1.04
IAG 60% 37% -4% 3.70 10.08 2% 7% 0.96
Aer Lingus 59% 24% 0% 1.52 7.62 4% 6% 0.96
Air New Zealand 58% 33% 2% 2.61 8.67 12% 13% 0.95
Qantas 57% 23% 2% 2.86 10.04 10% 10% 0.98
Air France KLM 55% 22% 1% 3.28 10.23 7% 10% 0.91
Finnair 53% 21% 0% 1.68 7.52 6% 9% 0.96
Aeromexico 50% 35% 2% 5.25 10.54 8% 7% 1.25
SAS AB 49% 17% -3% 2.82 10.79 0% 7% 0.92
Iberia 47% 21% 2% 2.97 8.83 4% 6% 1.08
Alaska Airlines 42% 24% 1% 5.02 8.43 12% 13% 1.07
Hawaiian 37% 29% 1% 15.76 7.52 11% 10% 1.09
El Al Israel 37% 37% -1% 8.16 8.78 6% 8% 0.99
LAN 36% 36% 5% 1.81 14.83 18% 22% 1.73
Thai 36% 36% 1% 3.27 12.47 9% 11% 0.98
Cathay Pacific 33% 36% 3% 1.74 11.73 12% 11% 1.13
Singapore 33% 32% 5% 0.82 10.07 20% 19% 1.13
United 30% 32% 6% 12.10 10.54 6% 2% 1.05
Latam 28% 35% 2% 3.82 9.48 13% 25% 1.54
Atlantic Airways 28% 26% 3% 1.12 6.04 17% 10% 0.81
Delta 27% 29% -7% 28.02 10.65 3% 5% 0.99
Air Canada 25% 27% -1% 3.81 9.43 3% 7% 0.89
AMR Corp 24% 24% -3% 57.64 10.50 4% 8% 1.00
Copa 23% 37% 9% 2.06 7.71 22% 23% 1.61
Air China 16% 36% 1% 2.94 11.68 17% 18% 1.38
Aegean 16% 26% 1% 2.10 6.40 4% 4% 1.08
China Eastern 15% 34% -2% 15.20 11.51 8% 10% 1.59
US Airways 9% 27% 0% 49.90 9.73 2% 2% 1.08
Turkish Airlines 5% 27% 6% 1.98 8.54 15% 8% 1.07
Jet Airways 0% 34% -1% 40.33 12.78 5% 21% 1.17
Kingfisher 0% 37% -10% -5.93 11.82 -13% 3% 0.92

Hedging and Firm Value Page 38 of 55
Hainan 0% 35% 1% 6.33 11.17 24% 40% 1.10
Asiana 0% 35% 0% 6.51 8.82 6% 4% 1.13
China Southern 0% 34% 3% 4.85 11.81 16% 23% 1.02
Pakistan Air. 0% 37% -5% 20.82 11.35 1% 10% 1.10

Hedging and Firm Value Page 39 of 55
Table II
Descriptive Statistics Panel A summarizes the total firm–year data observable for various levels of hedging percentages (abbreviated as
H) for three main subsamples studied in the analysis and for additional regional samples. The table ranges from
zero hedging in column 2 to 90% hedging in column 10. In columns 2 to 10 we also summarize the ratio of total
number of firm-years in each hedging level. The subsamples; Total sample, Low-Cost Carriers (LCC) sample and
Major Carriers (MC) sample, are the main samples we study. We also display the statistics for a regional samples
examining the US, European. and international companies. The mean levels of hedging are 35% for the “total
sample”, 33% for the “LCC sample”, 35% for the “major carriers sample”, 26% for the “US sample”, 49% for the
“European sample”, and 26% for the “international sample”. Panels B and C tabulate the mean levels for the
control variables used. Panel B uses unadjusted data. Panel C uses “off-balance-sheet leasing” adjusted data
where the present values of operating leases are added back on “Total Assets” and “Total Debt”, which in turn
adjust “Return on Assets”, “Financial Leverage” and “Tobin’s Q”. The first three study groups are “total sample”,
“low cost carriers” and “major carriers” sample. We also present summary statistics for additional regional
subsamples in both panels: US firms, European firms, and International firms. In Panel B and C, Columns 2, 3,
and 4 show the mean levels of fuel cosnumption hedged, the ratio of fuel cost to operating expenses, and return
on assets (Net Income/Total Assets) in percentages. Columns 5 and 6 show the amount of financial leverage used
(Total Debt/Total Equity) and the natural logarithm of the assets. In columns 8, 9, and 10 we display cash flow
from operations and capital expenditures both scaled by revenues (CFO/Rev and Capex/Rev) and unadjusted and
adjusted values of Tobin’s Q. The only variables that are different in Panels B and C are profitability, leveage,
firm size control variables, and the firm value. Panel D provides further summary statistics. Columns 1, 2, and 3
show the number of airline companies and the number of hedging and non-hedging airlines for each subsample.
Columns 4 and 5 show the average and median market capitalizations in US dollars for each group. Column 6
shows the proportion of off-balance sheet leases used relative to total assets.
Panel A: Distribution of Firm Year Observations per Hedging Percentage Level
SAMPLE
GROUPS H≤0% H≤10% H≤20% H≤Mean H≤50% H≤60% H≤70% H≤80% H≤90%
88 101 142 201 297 333 363 392 405 Study Sample
Total Sample
LCC Sample 33 42 57 82 97 106 114 127 134
MC Sample 55 59 85 124 200 227 249 265 271
Pct. of Total S. 22% 25% 35% 49% 73% 81% 89% 96% 99%
Pct. of LCCs 24% 31% 42% 60% 71% 78% 84% 93% 99%
Pct. of MCs 20% 21% 30% 44% 71% 81% 89% 94% 97%
Reg. Sample
US Airlines 20 29 52 64 115 118 121 125 127
European Air. 9 12 18 48 51 72 96 111 120
Int. Airlines 59 59 71 84 128 140 144 153 155
Pct. of US S. 16% 23% 41% 50% 90% 92% 95% 98% 99%
Pct. of EU S. 7% 10% 15% 39% 42% 59% 79% 91% 98%
Pct. of INT S. 37% 37% 45% 53% 81% 88% 91% 96% 97%

Hedging and Firm Value Page 40 of 55
PANEL B: Summary Statistics of Unadjusted Control Variables
Panel C: Summary Statistics of Control Variables Adjusted for Off-Balance Sheet Leases
Hedging Fuel/Opex RoA Lvrg. Log assets CFO/Rev Capex/Rev TBQ
Study Sample
Total Sample 34% 28% 1% 9.6 9.4 11% 14% 1.18
LCC Sample 32% 30% 3% 4.3 8.1 16% 23% 1.40
MC Sample 34% 28% 1% 11.8 9.9 9% 11% 1.08
Regional Sample
US Airlines 27% 28% 1% 8.7 21.9 9% 12% 1.22
Euro. Airlines 48% 23% 2% 3.1 8.5 9% 10% 1.10
Int. Airlines 26% 33% 1% 10.2 5.0 11% 15% 1.19
Panel D: Average Market Capitalization and Off-Balance Sheet Leasing Used
Num. Firms Hedging Non-Hedging MCAP $ (mean)
MCAP $ (median)
Off-BS Leases/T. Assets
Study Sample
Total Sample 54 45 10 3605 1905 31%
LCC Sample 17 13 4 2842 1300 41%
MC Sample 38 32 6 3985 2432 24%
Regional Sample
US Airlines 13 13 0 2699 1347 33%
Euro. Airlines 14 13 0 3753 1944 15%
Int. Airlines 27 19 8 3170 1933 27%
PANEL B: Summary Statistics of Unadjusted Control Variables
Hedging Fuel/Opex ROA Lvrg. Log(assets) CFO/Rev Capex/Rev TBQ
Study Sample
Total Sample 34% 28% 1% 6.7 9.1 11% 14% 1.2
LCC Sample 32% 30% 3% 2 8 16% 23% 1.48
MC Sample 34% 28% 0% 8.5 9.7 8.6% 10.7% 1.13
Regional Sample
US Airlines 27% 28% 1.0% 14.5 8.3 8.6% 11.7% 1.3
Euro. Airlines 48% 23% 2.0% 2.2 8.3 9.2% 10.0% 1.1
Int. Airlines 26% 33% 0.9% 3.6 10.0 10.7% 15.3% 1.2

Hedging and Firm Value Page 41 of 55
Table III Test of Cash Flow Variability and Fuel Cost Efficiency
In Panel A, we statistically analyze the differences among hedging-firm year observations and non-hedging firm
year observations. We compare the mean and median values of both unadjusted firm value (UAQ) and adjusted
firm value (Adj.Q), capital expenditures (Capex/Rev), operating cash flows (CFO/Rev), return on assets (RoA),
fuel costs as a percentage of operating expenses (Fuel/Opex) and leverage (Leverage) for hedging and non-
hedging firm-year observations. Additionally we also estimate standard deviations of all the control variables. In
Panel B we compare the same control variables as in the Panel A for low-cost carriers and major carriers. In both
Panel A and B, we assume unequal variance for mean differences using Welch (1947) degress of freedom and
Wilcoxon (1945) rank-sum test for the median differences. In the final columns of Panels A and C we report p
values of statistical significance. Numbers in brackets are critical t-values. Star signs above the paranthesis
represents significance levels; * used for 10%, ** used for 5% and *** used for 1% significance levels.
In Panel B we analyze the relation between Fuel/Opex and the percentage of the next year's fuel consumption
hedged (hedging (t-1)) at time (t-1). We use the equally weighted average of spot market jet fuel prices and firm
size as control variables.
Fuel Costs/Opex (t) = β1× Hedging (t-1)+β2×Avg.(Jet Fuel Prices) + β3×Log (Assets) + ϵ
Panel A: Univariate Test of Control Variables for the Hedging and Non-Hedging Firm-Year Observations
Variable Hedgers Sample Non-Hedgers Sample Difference t-statistics (mean)
z-statistics (median) p-Value
UAQ (mean) 1.23 1.3 -0.08 -1.3 0.2
UAQ (median) 1.09 1.13 -0.04 -1.3 0.2
UAQ Std. Dev. 49% 48% 0.01 0 1
Adj.Q. (mean) 1.18 1.23 -0.05 -1 0.3
Adj.Q. (median) 1.08 1.1 -0.02 -0.4 0.7
Adj. Q Std. Dev. 42% 36% 0.05 0 1
Capex /Rev (mean) 13.4% 17.4% -4% -2 0
Capex/Rev (median) 10% 10% 0% -0.3 0.7
Capex/Rev Std. Dev. 15% 21% -6% 0.4 0.7
CFO/Rev (mean) 10.7% 9.30% 1.4% 1.1 0.3
CFO/Rev (median) 10.4% 11% -0.6% 0.1 0.9
CFO/Rev Std. Dev. 10% 14% -4% 2.3 0.02
RoA (mean) 1.5% 0.00% 1.5% 1.2 0.2
RoA (median) 2.3% 3.00% -1.3% -0.2 0.9
RoA Std. Dev. 10% 10% 0% 0 1
RoA Adj. (mean) 1.2% 0.7% 0.5% 0.6 0.6
RoA. Adj. (median) 1.8% 1% 0.8% 0 1
RoA. Adj. Std. Dev. 8% 7% 1% 0 1
Fuel/Opex (mean) 28% 34% -6% -5.8 0
Fuel/Opex (median) 29% 31% -2% -5.7 0
Fuel/Opex Std. Dev. 9% 9% 0% 0 1

Hedging and Firm Value Page 42 of 55
Leverage (mean) 5 11.6 -6% -3.6 0
Leverage (median) 2.5 4.2 -1.7% 7.1 0
Leverage Std. Dev. 12% 24% -12% 0 1
Leverage Adj. (mean) 6.8 18.2 -11% -4.4 0
Leverage Adj.
(median) 3 5.2 -2.2% -4 0
Leverage Adj. Std.
Dev. 15% 37% -21% 0 1
Panel B: Univariate Test of Control Variables for the Low Cost and Major Carriers
Variable LCC Sample MC Sample Difference t-statistic (mean)
z-statistic (median) p-Value
UAQ (mean) 1.48 1.13 0.35 7.89 0
UAQ (median) 1.31 1.06 0.25 26 0
Adj.Q (mean) 1.38 1.1 0.28 7.37 0
Adj.Q (median) 1.2 1.04 0.16 28.4 0
Hedging (mean) 33% 35% -2% -0.67 0.5
Hedging (median) 30% 34% -4% -1.79 0.18
Capex /Rev (mean) 23% 11% 12% 6.9 0
Capex/Rev (median) 15% 8% 7% 16 0
CFO/Rev (mean) 16% 9% 7% 5.95 0
CFO/Rev (median) 14% 9% 5% 17.95 0
RoA (mean) 3% 1% 2% 2.31 0.02
RoA (median) 4% 2% 2% 14.39 0
RoA Adj. (mean) 3% 1% 2% 2.44 0.02
RoA. Adj. (median) 3% 1% 2% 9.8 0
Fuel/Opex (mean) 30% 28% 2% 2.692 0
Fuel/Opex (median) 29% 28% 1% 0.3 0.59
Panel C: Dependent Variable is Fuel Costs/Operating Expenses
Total Sample LCC Sample MC Sample
Observations 334 120 235
R2
0.39 0.51 0.24
Hedging (t-1) -0.122***
(-8.65)
-0.08***
(-3.49)
-0.153***
(-9.48)
Jet Fuel Prices 0.0016***
(13.45)
0.0019***
(9.13)
0.0015***
(11.05)
Log (assets)
0.0003
(0.16)
0.008
(1.59)
0.006***
(2.93)

Hedging and Firm Value Page 43 of 55
Table IV Univariate Test of Government Ownership
Panel A conducts a univariate test on the differences between mean and median values of both unadjusted firm
value (UAQ) and adjusted firm value (Adj.Q), hedging, capital expenditures (Capex/Rev), operating cash flows
(CFO/Rev), return on assets (RoA), and fuel costs as a percentage of operating expenses (Fuel/Opex) for airline
companies with government ownership to privately owned airline companies. The first column lists the control
variables tested. The second and third columns list the parameters for privately owned and airlines with
government ownership respectively. The fourth column shows the differences between control variable and
column five displays statistical significance of the differences. We assume unequal variance for mean differences
using Welch (1947) degress of freedom and Wilcoxon (1945) rank-sum test for the median differences. In the
final column we report p values of statistical significance.
Panel A: Univariate Test for Airlines with Government Ownership vs. Private Ownership
Variables Priv. Own Gov. Own Difference t-statistics (mean)
z-statistics (median) p-Value
UAQ (mean) 1.31 1.06 0.26 7.20 0.00
UAQ (median) 1.14 0.98 0.16 6.81 0.00
Adj.Q (mean) 1.11 1.06 0.04 5.86 0.00
Adj.Q (median) 1.24 0.99 0.25 6.08 0.00
Hedging (mean) 35% 30% 5% 2.21 0.00
Hedging (median) 37% 29% 8% 2.00 0.05
Capex /Rev (mean) 16% 12% 4% 3.56 0.00
Capex/Rev (median) 10% 9% 1% 1.59 0.11
CFO/Rev (mean) 11% 10% 1% 2.70 0.00
CFO/Rev (median) 11% 8% 3% 2.52 0.01
RoA (mean) 1.4% 0.5% 1% 1.10 0.27
RoA (median) 2.7% 1.8% 1% 2.69 0.00
RoA Adj. (mean) 1.4% 0.5% 1% 1.58 0.12
RoA. Adj. (median) 2% 1.4 0.6% 2.50 0.01
Fuel/Opex (mean) 29% 30% 0% 1.06 0.29
Fuel/Opex (median) 29% 31% 0% 0.78 0.44

Hedging and Firm Value Page 44 of 55
Panel B: Univariate Test for Major Carriers with Government Ownership vs. Private Ownership
Variable Non-Gov.MC Gov. MC Difference t-statistics (mean)
z-statistics (med.) p-Value
UAQ (mean) 1.15 1.06 0.09 3.09 0.00
UAQ (median) 1.09 0.98 0.12 4.63 0.00
Adj.Q (mean) 1.11 1.06 0.04 2.05 0.04
Adj.Q Measure (median) 1.06 0.99 0.07 3.83 0.00
Hedging (mean) 39% 26% 13% 2.88 0.00
Hedging (median) 38% 29% 9% 2.53 0.01
Capex /Rev (mean) 10% 12% -2% -0.28 0.78
Capex/Rev (median) 8% 9% -1% -0.40 0.62
CFO/Rev (mean) 9% 10% -1% 0.32 0.74
CFO/Rev (median) 9% 8% 1% 0.69 0.49
RoA (mean) 0% 0% 0% -0.17 0.87
RoA (median) 2% 2% 0% 0.74 0.46
RoA Adj. (mean) 0% 0% 0% 0.06 0.95
RoA. Adj. (median) 1% 1% 0% 0.70 0.49
Fuel/Opex (mean) 27% 29% -2% -0.82 0.41
Fuel/Opex (median) 27% 29% -2% -0.82 0.39

Hedging and Firm Value Page 45 of 55
Table V Multivariate Analysis of Firm Value and Hedging
Panel A below displays the regression analysis examining the relationship between firm value and hedging for the
2 sub-sample groups examined; low cost carriers sample and major carriers sample. In Panel A we analyse firm
value and hedging relationship using the following model:
Log of Tobins Q = β1× Hedging +Σ(βi×Conrol Variable i )+ ε.
There are a total of 411 firm-years of which 136 belong to the low cost carriers sample and 275 belong to the
major carriers sample. Panel A examines the relation between unadjusted firm value and hedging. Panel B
examines the relation between firm value adjusted for off-balance sheet leases and hedging. For all samples
examined, we use the usual ordinary least squares model with Huber-Sandwich robust standard errors (OLS R.)
and the genealize least squares regression with robust standard errors adjusted for heteroskedasticity (GLS R.).
Numbers in paranthesis represent t-values for the OLS models and z-values for FGLS model. Numbers in
brackets represent critical t and z values for OLS and FGLS regressions respectively. Star signs above the
parantheses represents significance levels; * used for 10%, ** used for 5% and *** used for 1% significance
levels.
Panel A: Dependent Variable is Unadjusted Tobin's Q
LCC Sample MC Sample
OLS R. GLS R. OLS R. GLS R.
Observations 136 136 275 275
R2 0.4
0.28
Wald chi2
118.26
83.49
Log(assets) -0.079
**
(-2.51) -0.12
***
(-5.15) 0.03
***
(4.82) 0.02
***
(4.39)
Leverage 0.005 (1.03)
0.0011 (0.39)
0.0003 (1.41)
0.0001 (0.95)
ROA 1.11 (2.3)
1.34***
(3.8)
0.39 (1.44)
0.152** (2.65)
Fuel/Opex 0.17
(0.45) 0.064 (0.24)
0.264 (1.00)
-0.05 (-0.41)
Hedge 0.25
**
(2.27) 0.36
***
(3.81) -0.013 (-0.25)
-0.043 (-1.20)
CFO/Rev 0.41
(1.48) 0.65
**
(2.69) 0.29
*
(1.67) 0.49
**
(2.66)
Capex/Rev 0.35
***
(3.15) 0.29
***
(2.81) 0.24
(1.42) 0.104 (0.86)
Dividends -0.11
(-1.06) 0.00
(0.13) 0.013 (0.45)
-0.002 (1.32)
HIR -0.017 (-0.30)
-0.01 (-0.24)
0.04* (1.86)
0.146 (0.73)
HFXP -0.07
(-1.29) -0.08
(-1.04) -0.146 (-4.77)
-0.115 (-5.18)

Hedging and Firm Value Page 46 of 55
Panel B: Dependent Variable is Adjusted Tobin's Q
LCC Sample MC Sample
OLS R. GLS R. OLS R. GLS R.
Observations 136 136 275 275
R2 0.37
0.28
Wald chi2
133.68
95.74
Log(assets) -0.060
**
(-2.24) -0.083
***
(-4.20) 0.025
***
(4.47) 0.018
***
(4.11)
Leverage -0.0018 (-0.72)
-0.0002 (-0.24)
0.0001 (2.05)
0.0000 (1.24)
ROA 2.05
***
(3.26) 1.83
***
(3.92) 0.33
(1.92) 0.19
(2.43)
Fuel/Opex 0.16
(0.55) 0.17
(0.83) 0.10
(-0.33) -0.10
(-1.17)
Hedge 0.24
**
(2.10) 0.33
***
(4.06) -0.056 (-0.75)
-0.07 (-0.23)
CFO/Rev 0.196 (0.73)
0.43**
(2.09) 0.485
**
(2.22) 0.43
***
(2.90)
Capex/Rev 0.284
***
(3.13) 0.27
***
(3.13) 0.188 (1.16)
0.078 (0.86)
Dividends -0.107 (-1.15)
-0.019 (-0.34)
0.0045 (1.05)
0.027 (1.65)
HIR 0.018 (0.39)
-0.00 (-0.19)
0.032 (1.46)
0.012 (0.70)
HFXP -0.062 (-1.26)
-0.04 (-1.14)
-0.114 (-4.40)
-0.097 (-5.00)

Hedging and Firm Value Page 47 of 55
Table VI Low Cost Carriers Robustness Analysis I
Panel A and B of Table VI conduct robustness checks on the value premia obtained for low-cost carriers hedging
practices. Columns 2 and 3 present OLS regression results on the first differenced data analysis for unadjusted
and adjusted firm value and control variables.
ΔLog of Unadjusted/Adjusted Tobin’s Q = β1 + β2 ×(ΔPercentage Hedged) +Σi×( βi × ΔControl Variable i ) + ε
Columns 4 and 5 provide a quantile regression analysis on unadjusted and adjusted firm value and control
variables. Columns 2 and 3 of Panel B perform fixed effects models for both unadjusted and adjusted firm value
and control variables. Columns 4 and 5 of Panels B use Quantile regressions on both unadjusted and adjusted
firm value and control variables. Star signs above the paranthesis represents significance levels; * used for 10%,
** used for 5% and *** used for 1% significance levels.
Panel:A Dependent Variable Log of Tobin’s Q
First Diff. First Diff. Adj. Quantile Quantile Adj.
Observations 120 120 136 136
R2 0.35 0.31 0.2183 0.2
Log(assets) -0.36
***
(-4.1) -0.52
***
(-3.40) -0.064
***
(-2.18) -0.041
**
(-1.76)
Leverage 0.003 (1.26)
-0.0017 (-1.43)
0.013***
(3.03)
-0.0001 (-0.1)
Roa 1.083
***
(5.17) 1.24
***
(3.70) 1.063
**
(2.27) 0.91
(1.44)
Fuel/Opex 0.15
(0.39) 0.36
(0.67) -0.418 (-1.14)
-0.12 (-0.43)
Hedge 0.167
**
(2.00) 0.315
***
(2.74) 0.208 (1.60)
0.198**
(1.91)
CFO/Rev 0.15
(0.87) 0.028 (0.13)
0.473 (1.49)
0.47**
(1.78)
Capex/Rev -0.065 (-0.62)
-0.16 (-0.96)
0.33**
(2.18) 0.298
**
(2.40)
Dividends -0.022 (-0.35)
-0.0035 (-0.06)
-0.002 (-0.02)
-0.0037 (-0.05)

Hedging and Firm Value Page 48 of 55
Panel B: Dependent Variable Log of Tobin's Q
FE FE Adj. Cluster Cluster Adj.
Observations 136 136 136 136
R2 0.72 0.69 0.33 0.37
Log(assets) -0.33
***
(-8.96) -0.29
***
(8.96) -0.078 (-1.27)
-0.065 (-1.11)
Leverage 0.000 (0.32)
0.000 (-1.41)
0.003 (1.30)
-0.018*
(-1.79)
Roa 1.09
***
(4.47) 1.02
***
(4.47) 1.10
***
(3.29) 2.05
***
(4.50)
Fuel/Opex 0.08
(0.24) 0.08
(0.24) 0.333 (1.11)
0.16 (0.36)
Hedge 0.29
***
(3.40) 0.26
***
(3.4) 0.17
(1.25) 0.24
*
(1.91)
CFO/Rev 0.28
(1.39) 0.15
(0.82) 0.41
(1.38) 0.18
(0.65)
Capex/Rev 0.07
(0.73) 0.17 (0.2)
0.35***
(2.89)
0.30***
(2.54)
Dividends -0.1
(-1.58) -0.006 (-1.60)
-0.10**
(-0.80) -0.95
(-0.85)
HIR 0.019 (0.26)
0.033 (0.54)
-0.17 (-0.16)
0.018 (0.19)
HFXP 0.20
(0.22) 0.00
(0.04) -0.07
(-0.76) -0.06
(-0.76)
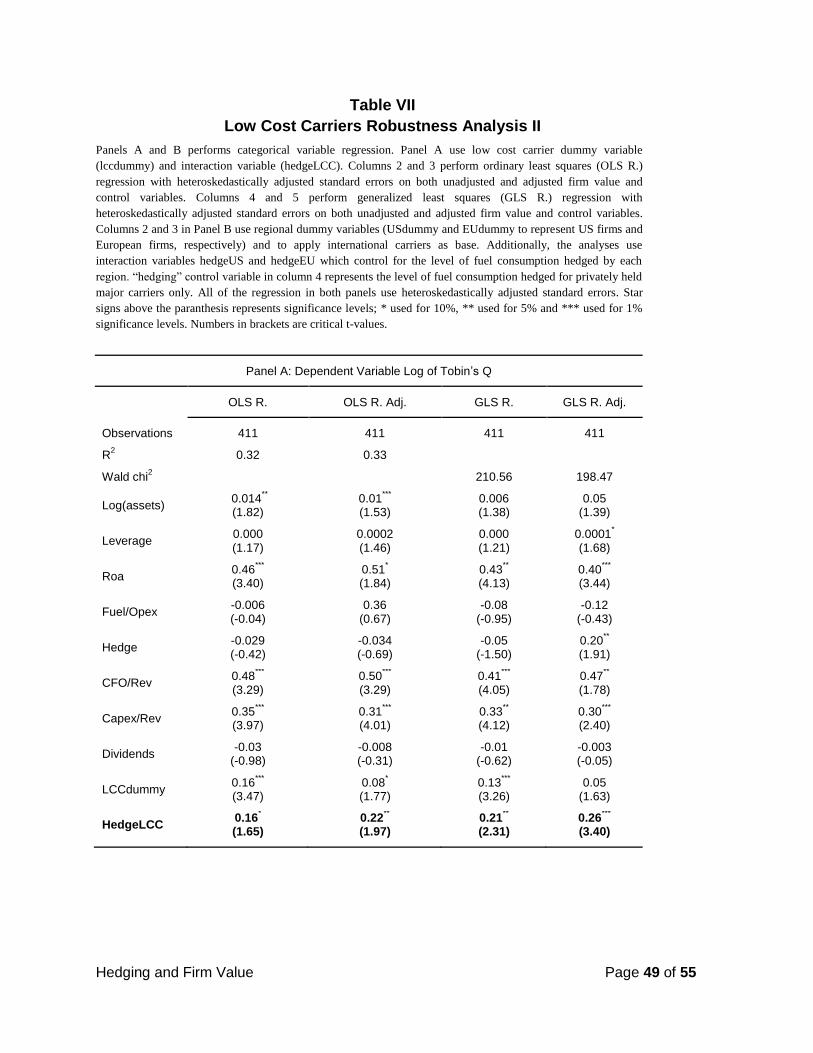
Hedging and Firm Value Page 49 of 55
Table VII
Low Cost Carriers Robustness Analysis II
Panels A and B performs categorical variable regression. Panel A use low cost carrier dummy variable
(lccdummy) and interaction variable (hedgeLCC). Columns 2 and 3 perform ordinary least squares (OLS R.)
regression with heteroskedastically adjusted standard errors on both unadjusted and adjusted firm value and
control variables. Columns 4 and 5 perform generalized least squares (GLS R.) regression with
heteroskedastically adjusted standard errors on both unadjusted and adjusted firm value and control variables.
Columns 2 and 3 in Panel B use regional dummy variables (USdummy and EUdummy to represent US firms and
European firms, respectively) and to apply international carriers as base. Additionally, the analyses use
interaction variables hedgeUS and hedgeEU which control for the level of fuel consumption hedged by each
region. “hedging” control variable in column 4 represents the level of fuel consumption hedged for privately held
major carriers only. All of the regression in both panels use heteroskedastically adjusted standard errors. Star
signs above the paranthesis represents significance levels; * used for 10%, ** used for 5% and *** used for 1%
significance levels. Numbers in brackets are critical t-values.
Panel A: Dependent Variable Log of Tobin’s Q
OLS R. OLS R. Adj. GLS R. GLS R. Adj.
Observations 411 411 411 411
R2 0.32 0.33
Wald chi
2
210.56 198.47
Log(assets) 0.014
**
(1.82) 0.01
***
(1.53) 0.006 (1.38)
0.05 (1.39)
Leverage 0.000 (1.17)
0.0002 (1.46)
0.000 (1.21)
0.0001*
(1.68)
Roa 0.46
***
(3.40) 0.51
*
(1.84) 0.43
**
(4.13) 0.40
***
(3.44)
Fuel/Opex -0.006 (-0.04)
0.36 (0.67)
-0.08 (-0.95)
-0.12 (-0.43)
Hedge -0.029 (-0.42)
-0.034 (-0.69)
-0.05 (-1.50)
0.20**
(1.91)
CFO/Rev 0.48
***
(3.29) 0.50
***
(3.29) 0.41
***
(4.05) 0.47
**
(1.78)
Capex/Rev 0.35
***
(3.97) 0.31
***
(4.01) 0.33
**
(4.12) 0.30
***
(2.40)
Dividends -0.03
(-0.98) -0.008 (-0.31)
-0.01 (-0.62)
-0.003 (-0.05)
LCCdummy 0.16
***
(3.47) 0.08
*
(1.77) 0.13
***
(3.26) 0.05
(1.63)
HedgeLCC 0.16
*
(1.65) 0.22
**
(1.97) 0.21
**
(2.31) 0.26
***
(3.40)

Hedging and Firm Value Page 50 of 55
Panel B: Dependent Variable Log of Tobin’s Q
OLS R. OLS R. Adj. GLS R. GLS R. Adj.
Observations 411 411 411 411
R2 0.34 0.35
Wald chi
2
274.5 239.67
Log(assets) 0.000 (1.03)
0.003 (0.36)
-0.02 (-0.51)
-0.001 (-0.23)
Leverage 0.000 (1.07)
0.0002 (1.23)
0.000 (1.01)
0.0001 (1.49)
Roa 0.47
*
(1.84) 0.53
**
(1.97) 0.41
***
(3.80) 0.38
***
(3.28)
Fuel/Opex -0.185 (-1.03)
0.06 (-0.35)
-0.22**
(-2.3) -0.13
(-1.53)
Hedge 0.06
(0.70) 0.04
(0.50) 0.03
(0.61) 0.02
(0.04)
CFO/Rev 0.46
***
(2.65) 0.47
***
(3.20) 0.37
***
(3.64) 0.37
***
(3.78)
Capex/Rev 0.32
***
(3.19) 0.29
***
(3.78) 0.24
***
(3.40) 0.23
***
(3.82)
Dividends -0.05
(-1.34) -0.02
(-0.81) -0.025 (-1.29)
-0.02 (-1.09)
LCCdummy 0.13
**
(2.10) 0.06
(1.16) 0.12
***
(2.83) 0.05
(1.28)
HedgeLCC 0.21
(1.56) 0.27
**
(2.25) 0.18
**
(2.03) 0.25
***
(3.17)
USdummy -0.003 (-0.05)
0.002 (0.05)
-0.064*
(-1.68) -0.06
**
(-1.98)
EUdummy -0.14
(-1.80) -0.10
(-1.42) -0.14
***
(-2.89) -0.10
**
(-2.18)
hedgeUS -0.11
(-0.67) -0.14
(-0.90) 0.076 (0.73)
0.05 (0.64)
hedgeEU -0.024 (-0.17)
-0.03 (-0.24)
0.0195 (0.22)
0.005 (0.06)
constant 0.065 (0.49)
0.011 (0.09)
0.14 (2.09)
0.09 (1.36)

Hedging and Firm Value Page 51 of 55
Table VIII
Government Ownership Analysis
The table below represents the results of the analysis examining the effects of government ownership in our
earlier results. Columns 2 and 3 perform ordinary least squares (OLS R.) regression with heteroskedastically
adjusted standard errors on both unadjusted and adjusted firm value and control variables. Columns 4 and 5
perform generalized least squares (GLS R.) regression with heteroskedastically adjusted standard errors on both
unadjusted and adjusted firm value and control variables. The dummy variable (GOVdummy) represents the
government ownership in excess of 20% of the total shares outstanding. The interaction variable (HedgeGOV)
represents the combined effect of hedging variable and government ownership on firm value. “hedging” test
variable represents the consumption of jet fuel hedged for privately owned major carriers. Star signs above the
paranthesis represents significance levels; * used for 10%, ** used for 5% and *** used for 1% significance
levels. Numbers in brackets are critical t-values.
Dependent Variable Log of Tobin’s Q
OLS R. OLS R. Adj. GLS R. GLS R. Adj.
Observations 0.27 275 275 275
R2 0.34 0.25
Wald chi
2
101.57 92.41
Log(assets) 0.025 (3.33)
0.02 (2.97)
0.025 (4.03)
0.02 (3.69)
Leverage 0.000 (1.08)
0.0002 (1.35)
0.000 (0.67)
0.0001 (0.67)
Roa 0.28
*
(1.47) 0.34
**
(2.04) 0.28
***
(2.47) 0.34
(2.77)
Fuel/Opex 0.15
(1.31) 0.15
(1.45) 0.15
(1.04) 0.15
(1.14)
Hedge -0.04
(-0.53) -0.015 (-0.26)
-0.04 (-0.55)
-0.015 (-0.24)
CFO/Rev 0.51
(2.86) 0.44
(3.16) 0.50
(3.12) 0.45
**
(3.14)
Capex/Rev 0.32
(1.85) 0.22
(1.51) 0.32
***
(2.39) 0.22
**
(1.85)
Dividends -0.006 (0.22)
0.014 (0.61)
0.005 (0.22)
-0.015 (0.64)
GOVdummy -0.083 (-1.67)
-0.12 (-0.45)
-0.08 (-2.04)
-0.02 (-0.55)
HedgeGOV -0.091 (-0.89)
-0.13 (-1.52)
-0.091 (-0.95)
-0.14 (-1.59)
Constant -0.23 (-2.8)
-0.22 (-2.84)
-0.24 (-3.29)
-0.22 (-3.37)

Hedging and Firm Value Page 52 of 55
Figure 1: Implications of Global Economic Activity on Airline Industry Performance:
Figure 1 demonstrates the relationships between jet fuel prices, passenger numbers,
economic activity and earnings margins. Figures 1-a, 1-b and 1-c graph the association
between world GDP per year and total airline revenues, jet fuel prices and passenger
numbers, respectively. Figure 1-d shows the sensitivity of profit margins (including
transacion costs) to jet fuel prices. The increase in jet fuel costs is fuelled through two
channels: 1) increases in spot jet fuel prices and 2) increase in fuel consumption through
increased operating activity and capacity (measured by available seat kilometers).

Hedging and Firm Value Page 53 of 55
Figure 2: The Analysis of Cash Holdings, Investments and Profitability: Figure 2 demonstrate the association between the cash holdings
(which include cash + cash equivalents) as a percentage of total assets and the level of financial leverage used for the sample airline companies.
The grey bars which are abbreviated as CCE/TA are scaled to the left axis and represent the proportion of cash and cash equivalents held in
proportion to total assets. The black straight line which is abbreviated as lvrg is the natural log of financial leverage and scaled to the left axis. The
dotted black line is the mean RoA estimates as Net Income/ Total Assets and is scaled to the left axis. Low cost carriers are identified with (LCC).
The figure is ordered by the highest level of CCE/TA holdings. If we call the firms with the highest CCE/TA levels as the most liquid firms, we
observe 7 low cost carriers among the top 10 most liquid airline companies. Additionally, 10 out of all of 16 low cost carriers in our sample is
among the most liquid 20 airline companies in our sample. Expectedly these low cost carriers also have the lowest level of financial leveage which
graphically confirms our estiates in the univariate analysis in Panel B of Table III in section III that low cost carriers can be more sensitive to the
level of internal cash funds relative to major carriers.
0,10
1,00
10,00
100,00
-30%
-20%
-10%
0%
10%
20%
30%
40%
50%
Allegian
t (LCC
)
Aer Lin
gus
Vu
eling (LC
C)
Aegean
Ryan
air (LCC
)
Iberia
Easyjet (LCC
)
Air A
rabia (LC
C)
Virgin
Blu
e (LCC
)
GO
L (LCC
)
Airtran
(LCC
)
Haw
aiian
Fron
tier Airlin
es (LCC
)
US A
irways
Alaska A
irlines
Air N
ew Ze
aland
Westjet (LC
C)
Hain
an
Finn
air
Atlan
tic Airw
ays
Spice Jet (LC
C)
British
Airw
ays
Qan
tas
Air C
anad
a
Un
ited
Co
pa
Sou
thw
est (LCC
)
Turkish
Airlin
es
Cath
ay Pacific
Singap
ore
Lufth
ansa
Jetblu
e (LCC
)
Aero
me
xico
AM
R C
orp
Air B
erlin
(LCC
)
Airasia (LC
C)
IAG
SAS A
B
Air Fran
ce KLM
AN
A
Delta
JAL
El Al Israel
LAN
Ch
ina So
uth
ern
Jet Airw
ays
Pakistan
Air.
Air C
hin
a
Thai
Latam
Jazeera (LCC
)
Ch
ina Eastern
Asian
a
Kin
gfisher
CCE/TA RoA lvrg

Hedging and Firm Value Page 54 of 55
Appendix I: Excerpts from Regional Carriers’ Annual Reports
Excerpt from Skywest 2010 SEC Filing:
“Our code-share agreements with Delta, United and Continental provide for fuel
used in the performance of the code-share agreements to be reimbursed by our
major partners, thereby reducing our exposure to fuel price fluctuations. United
purchased fuel directly from fuel vendors for our United Express aircraft under
contract operated out of Chicago, San Francisco, Los Angeles and Denver;
Continental purchased all of the fuel for our Continental aircraft directly from
Continental's fuel vendors; and as of June 1, 2009, Delta purchased the majority
of the fuel for our Delta aircraft under contract directly from its fuel vendors.
During the year ended December 31, 2010, approximately 76% of our fuel
purchases were associated with our Delta and United code-share agreements
and were reimbursed or paid directly by our major partners and approximately
24% of our fuel purchases were associated with our pro-rate operations.”
Excerpt from Republic Airlines 2011 SEC Filing:
Fuel Hedging Transactions
Under our fixed-fee agreements we are not exposed to changes in fuel
prices. Our fixed-fee agreements provide for our partners to purchase fuel
directly or reimburse us for fuel expense as a pass through cost.
As of December 31, 2011, we did not have a hedge position. We will
continue to monitor fuel prices closely and may take advantage of fuel hedging
opportunities as they become available.”

Hedging and Firm Value Page 55 of 55
Appendix II: Government Ownership of Major Carriers This table exhibits the descriptive statistics for the major airline companies with government ownership equal to or
exceeding 20% of the total shares outstanding. One exception in the table is the Asiana airlines where the
ownership ratio is 19% which is very close to the theoretical level at which a shareholder can exert significant
influence. Additionally, the company doesn’t hedge its fuel consumption. Our results in regression analyses in
Table VIII are not affected by the addition and inclusion of Asiana. As a result we add Asiana Airlines in the list.
The first column lists the 12 airline companies with government ownership equal to or less than 20% of the total
shares outstanding. The second column demonstrates the level of government ownership for each airline company.
The third and fourth columns show the level of the next year’s fuel consumption hedged and furl costs as a
percentage of operating expenses, respectively. The final column shows the firm value measured by the Q measure.
Airline Company Hedge Ratio Fuel/Opex TBQ
Asiana 0% 35% 1.06
Aer Lingus 59% 24% 0.95
Air France 55% 22% 0.9
Thai Airways 36% 36% 0.99
Finnair 53% 21% 0.95
SAS AB 49% 17% 0.92
Turkish Airlines 5% 27% 1.07
Air New Zealand 58% 33% 0.95
Pakistan Airlines 0% 37% 1.1
Atlantic Airways 28% 36% 0.74
Air China 16% 36% 1.41
China Eastern 15% 34% 1.62
China Southern 0% 34% 1.03
Hainan 0% 35% 1.11
Aeromexico 50% 35% 1.38
min 0% 17% 0.74
mean 32% 34% 0.97
max 59% 37% 1.62
Standard Deviation 23% 7% 24%