Heat Loss Due to Domestic Hot Water Pipes - MDPI
19
energies Article Heat Loss Due to Domestic Hot Water Pipes Anti Hamburg 1, *, Alo Mikola 1 , Tuule-Mall Parts 1 and Targo Kalamees 1,2 Citation: Hamburg, A.; Mikola, A.; Parts, T.-M.; Kalamees, T. Heat Loss Due to Domestic Hot Water Pipes. Energies 2021, 14, 6446. https:// doi.org/10.3390/en14206446 Academic Editor: Gerardo Maria Mauro Received: 3 September 2021 Accepted: 30 September 2021 Published: 9 October 2021 Publisher’s Note: MDPI stays neutral with regard to jurisdictional claims in published maps and institutional affil- iations. Copyright: © 2021 by the authors. Licensee MDPI, Basel, Switzerland. This article is an open access article distributed under the terms and conditions of the Creative Commons Attribution (CC BY) license (https:// creativecommons.org/licenses/by/ 4.0/). 1 nZEB Research Group, Tallinn University of Technology, 19086 Tallinn, Estonia; [email protected] (A.M.); [email protected] (T.-M.P.); [email protected] (T.K.) 2 Smart City Centre of Excellence (Finest Twins), Tallinn University of Technology, 19086 Tallinn, Estonia * Correspondence: [email protected]; Tel.: +372-53-419-274 Abstract: Domestic hot water (DHW) system energy losses are an important part of energy consump- tion in newly built or in reconstructed apartment buildings. To reach nZEB or low energy building targets (renovation cases) we should take these losses into account during the design phase. These losses depend on room and water temperature, insulation and length of pipes and water circulation strategy. The target of our study is to develop a method which can be used in the early stages of design in primary energy calculations. We are also interested in how much of these losses cannot be utilised as internal heat gain and how much heat loss depends on the level of energy performance of the building. We used detailed DHW system heat loss measurements and simulations from an nZEB apartment building and annual heat loss data from a total of 22 apartment buildings. Our study showed that EN 15316-3 standard equations for pipe length give more than a twice the pipe length in basements. We recommend that for pipe length calculation in basements, a calculation based on the building’s gross area should be used and for pipe length in vertical shafts, a building’s heating area-based calculation should be used. Our study also showed that up to 33% of pipe heat losses can be utilised as internal heat gain in energy renovated apartment buildings but in unheated basements this figure drops to 30% and in shafts rises to 40% for an average loss (thermal pipe insulation thickness 40 mm) of 10.8 W/m and 5.1 W/m. Unutilised delivered energy loss from DHW systems in smaller apartment buildings can be up to 12.1 kWh/(m 2 ·a) and in bigger apartment buildings not less than 5.5 kWh/(m 2 ·a) (40 mm thermal pipe insulation). Keywords: DHW heat loss; DHW circulation; energy performance 1. Introduction Nearly zero energy (nZEB) apartment buildings have a relatively higher share of energy use for domestic hot water (DHW) because of reduced heat loss from the well- insulated building envelope, the use of ventilation heat recovery and LED lighting systems. DHW energy consumption can be divided between energy used to heat the water and en- ergy consumed by system losses. Bøhm and Danig showed [1] that in apartment buildings the heat losses from the hot water system correspond to approximately 65% of the energy consumption for domestic hot water and the cause of these heat losses should be further investigated. Later, Bøhm specified [2] that most of the energy demand for DHW is lost in the circulation system. As the system’s apartment building’s DHW heat loss was 23–70%, its efficiency was 0.30–0.77. Gassel [3] showed that if the DHW circulation is constantly in operation, this equates to 15 kWh/m 2 ·a energy consumption, the circulation share being 19% of total DHW heating demand. Horvath et.al [4] showed that when the specific DHW annual heat demand is between 23.2 and 32.2 kWh/(m 2 ·a), the distribution and circulation losses are between 5.7 and 9.9 kWh/(m 2 ·a). Zhang et al. [5] indicated that recirculation loop pipes heat loss represented about one third of a system’s fuel energy consumption and the average overall system efficiency was only about 34%. Similar results were found in the study by Marszal-Pomianowska et al. [6], where DHW accounted for 16% to 50% of total DHW heating consumption. Huhn and Davids [7] showed that the energy losses from Energies 2021, 14, 6446. https://doi.org/10.3390/en14206446 https://www.mdpi.com/journal/energies
-
Upload
khangminh22 -
Category
Documents
-
view
4 -
download
0
Transcript of Heat Loss Due to Domestic Hot Water Pipes - MDPI

energies
Article
Heat Loss Due to Domestic Hot Water Pipes
Anti Hamburg 1,*, Alo Mikola 1, Tuule-Mall Parts 1 and Targo Kalamees 1,2
�����������������
Citation: Hamburg, A.; Mikola, A.;
Parts, T.-M.; Kalamees, T. Heat Loss
Due to Domestic Hot Water Pipes.
Energies 2021, 14, 6446. https://
doi.org/10.3390/en14206446
Academic Editor: Gerardo
Maria Mauro
Received: 3 September 2021
Accepted: 30 September 2021
Published: 9 October 2021
Publisher’s Note: MDPI stays neutral
with regard to jurisdictional claims in
published maps and institutional affil-
iations.
Copyright: © 2021 by the authors.
Licensee MDPI, Basel, Switzerland.
This article is an open access article
distributed under the terms and
conditions of the Creative Commons
Attribution (CC BY) license (https://
creativecommons.org/licenses/by/
4.0/).
1 nZEB Research Group, Tallinn University of Technology, 19086 Tallinn, Estonia; [email protected] (A.M.);[email protected] (T.-M.P.); [email protected] (T.K.)
2 Smart City Centre of Excellence (Finest Twins), Tallinn University of Technology, 19086 Tallinn, Estonia* Correspondence: [email protected]; Tel.: +372-53-419-274
Abstract: Domestic hot water (DHW) system energy losses are an important part of energy consump-tion in newly built or in reconstructed apartment buildings. To reach nZEB or low energy buildingtargets (renovation cases) we should take these losses into account during the design phase. Theselosses depend on room and water temperature, insulation and length of pipes and water circulationstrategy. The target of our study is to develop a method which can be used in the early stages ofdesign in primary energy calculations. We are also interested in how much of these losses cannot beutilised as internal heat gain and how much heat loss depends on the level of energy performance ofthe building. We used detailed DHW system heat loss measurements and simulations from an nZEBapartment building and annual heat loss data from a total of 22 apartment buildings. Our studyshowed that EN 15316-3 standard equations for pipe length give more than a twice the pipe lengthin basements. We recommend that for pipe length calculation in basements, a calculation based onthe building’s gross area should be used and for pipe length in vertical shafts, a building’s heatingarea-based calculation should be used. Our study also showed that up to 33% of pipe heat losses canbe utilised as internal heat gain in energy renovated apartment buildings but in unheated basementsthis figure drops to 30% and in shafts rises to 40% for an average loss (thermal pipe insulationthickness 40 mm) of 10.8 W/m and 5.1 W/m. Unutilised delivered energy loss from DHW systemsin smaller apartment buildings can be up to 12.1 kWh/(m2·a) and in bigger apartment buildings notless than 5.5 kWh/(m2·a) (40 mm thermal pipe insulation).
Keywords: DHW heat loss; DHW circulation; energy performance
1. Introduction
Nearly zero energy (nZEB) apartment buildings have a relatively higher share ofenergy use for domestic hot water (DHW) because of reduced heat loss from the well-insulated building envelope, the use of ventilation heat recovery and LED lighting systems.DHW energy consumption can be divided between energy used to heat the water and en-ergy consumed by system losses. Bøhm and Danig showed [1] that in apartment buildingsthe heat losses from the hot water system correspond to approximately 65% of the energyconsumption for domestic hot water and the cause of these heat losses should be furtherinvestigated. Later, Bøhm specified [2] that most of the energy demand for DHW is lost inthe circulation system. As the system’s apartment building’s DHW heat loss was 23–70%,its efficiency was 0.30–0.77. Gassel [3] showed that if the DHW circulation is constantly inoperation, this equates to 15 kWh/m2·a energy consumption, the circulation share being19% of total DHW heating demand. Horvath et.al [4] showed that when the specific DHWannual heat demand is between 23.2 and 32.2 kWh/(m2·a), the distribution and circulationlosses are between 5.7 and 9.9 kWh/(m2·a). Zhang et al. [5] indicated that recirculationloop pipes heat loss represented about one third of a system’s fuel energy consumptionand the average overall system efficiency was only about 34%. Similar results were foundin the study by Marszal-Pomianowska et al. [6], where DHW accounted for 16% to 50% oftotal DHW heating consumption. Huhn and Davids [7] showed that the energy losses from
Energies 2021, 14, 6446. https://doi.org/10.3390/en14206446 https://www.mdpi.com/journal/energies

Energies 2021, 14, 6446 2 of 19
hot water circulation are in the range of 25% to 75% of the energy used for DHW supply. Inbuildings with low DHW consumption, the efficiency is particularly poor. When DHWuse is small than DHW circulation heat loss is more or less the same as in buildings with abigger DHW consumption, but the relative share of DHW system losses in those buildingsis bigger.
Minimising DHW distribution and circulation losses improves the efficiency of thesystem and the energy performance of the whole building. Kitzberger et al. [8] showed thatminimising the runtime of the circulation pumps and decreasing hot water flow and storagecapacities reduces the annual energy consumption for DHW by 15–25%. Mühlbacher andCarter [9] deduced a dependency between the energy loss and the operating time of thecirculation pump in buildings with DHW circulation energy use from 21% to 65%. Withouta reduction in the operating time of the circulation pump, energy loss from circulationwas more than 60%. Cholewa et al. [10] showed in their long term field measurements onperformance of DHW, that a significant part (57% to 71%) of the heat loss is allocated to thecirculation of hot water. Using temperature control valves in the risers of the circulationinstallation to limit the circulation flow during periods of time when it is not required,generated average energy savings of 19%. Adam et al. [11] proposed shortening thecirculation runtime (a minimum of 16 h per day) to decrease DHW circulation heat loss.Bøhm [2] suggested that replacing the bypass function with an in-line supply pipe anda heat pump can help to reduce the return temperature of the decentralised substationsystem. As a result, the annual distribution heat loss decreased by 12%.
Lowering circulation time is one possibility but it depends on how people use DHW.Ahmed et.al. [12] studied hourly DHW consumption in 86 apartments with 191 occupantsover the course of one year and found that almost 90% of hourly consumption was between0 and 20 L/(person·h). Two sharp peak consumption periods were present on week-days.Morning peak consumption was between 7:00 and 9:00 whereas evening peak consumptionwas between 20:00 and 22:00. The average consumption was 4.1 and 1.1 L/(person·h) forpeak and non-peak hours respectively. Overnight, DHW consumption was almost zero.
Another possibility for decreasing DHW energy consumption is to lower the DHWtemperature. Navalón [13] showed that by reducing the return temperature to 52 ◦C(limit temperature to avoid Legionella), the theoretical saving is 15–18%. The growthof Legionella bacteria is high risk and that is why water temperatures between 25 ◦Cand 45 ◦C should be avoided, ideally maintaining hot water above 50 ◦C. To improveenergy efficiency and avoid the risk of Legionella, Brand [14] suggested stopping the useof DHW circulation.
In old apartment buildings, heat from DHW distribution and circulation heat lossesare distributed mainly in unheated basements and through shaft walls into apartments.Grasmanis et.al [15] showed that DHW circulation heat losses in an unheated basement varybetween 10–12% during the non-heating season and 12–15% during the heating season.Depending on the season, the rate of circulation heat losses from vertical distributioncirculation loop pipes varies from 55% to 60% for five floor buildings and 62% to 67% for9 or 12 floor buildings. Rocheron [16] showed that the insulation of storage and distributionsystems is an essential parameter in the process of energy savings, especially in the case ofthe DHW circulation.
Hamburg and Kalamees [17–19] have found that in reconstructed apartment buildingswith DHW circulation, the energy consumption for circulation is on average 14 kWh/(m2·a)higher than in buildings without circulation (apartment-based boilers) in the cold Estonianclimate. To minimise the energy performance gap, more accurate design work is needed.During the early stages of design, exact and accurate input data for dynamic simulation isusually missing. Over-optimistic assumptions in the initial data and over-simplified energycalculations may lead to energy performance targets not being met [20]. Arumägi [21]studied the design of the first net-zero energy buildings in Estonia and concluded thatmore thorough analyses are needed in the very first stage of the design to find suitablesolutions and possible compromises between architecture and energy efficiency. Attia and

Energies 2021, 14, 6446 3 of 19
De Herde [22] compared ten early design simulation tools for net zero energy buildingsand showed that for nZEBs we should invest more in the early design applications andtools. At the detailed design stage, it is possible to get the exact length of DHW pipesfrom the final building information model (BIM), but this information is missing in thepreliminary design, which is when the designer must demonstrate that energy performancehas been achieved. The length of DHW pipes and their heat loss can be calculated withEN 15316-3 standard [23], based on the length and width of the building. However, theseparameters are complicated to find in existing buildings which are not rectangular in shape.This is why using equations of lengths and widths in L-shaped and other irregular shapedbuildings becomes so complex. Therefore, there is a need for a tool that estimates the DHWsystem parameters and energy performance that can be used at an early stage of design,and for the improvement of the methodology for assessing the energy performance ofa building.
The working hypotheses of this study are the following:
• It is possible to estimate accurately enough the length of DHW piping based on thegeneral characteristics of the building at the early design stage of the building.
• Based on the data of the early design stage, it is possible to calculate DHW circulationlosses with sufficient accuracy and to propose a corresponding supplement to thecalculation method.
Our goal was to find a better equation for calculating DHW and DHW circulationpipe lengths in basements and shafts than that used in EN 15316-3 standard equations [23].
2. Methods2.1. Research Scheme to Investigate DHW and DHW Circulation Heat Losses
Our goal was to investigate DHW pipe length and heat loss in Estonian apartmentbuildings. We used for this a detailed model of an nZEB case building and compared theresults with measured data from different apartment buildings:
Detailed calibrated dynamic indoor climate and energy simulation model for a nZEBapartment building (nZEB case building in the information we have from 4 types ofbuilding categories is shown in Table 1.
1. Detailed calibrated dynamic indoor climate and energy simulation model for a nZEBapartment building (nZEB case building in Table 1) to determine heat loss factors onroom (21 ◦C heated and unheated basement) and water temperature, insulation (0, 20,40 mm with and without valve insulation) and length of pipes and water circulationstrategy (continuous circulation, clock based);
2. Design DHW pipe length from 15 apartment buildings (Test building in Table 1);3. Generating a method for calculating pipe length and heat loss from pipes to be used
in early stages of design;4. Validating of pipe length equation in7 reference apartment buildings (Reference
buildings in Table 1);5. Validation of DHW heat loss with earlier studied 23 buildings measured heat losses.
In following Table 1 are shown which kind of information we have from 4 types ofbuilding categories.
2.2. nZEB Case Building
The nZEB case building has 80 small sized, one or two bedroomed apartments. Moreor less the same sized typical apartment buildings from the period end of 1970s untilearly 1990s usually have 60 apartments. The building is a 5-storey, large concrete panelapartment building with a total heated area of 3562 m2, constructed in 1986 (Figure 1) drenovated to nZEB in 2018 [24,25]. We chose this building because it had a good monitoringsystem in place after its reconstruction, therefore we have hourly data from DHW use,DHW heating and DHW circulation.

Energies 2021, 14, 6446 4 of 19
Table 1. Research scheme and description of studied buildings.
Characteristic nZEB CaseBuilding Test Buildings Reference
BuildingsEarlier Studied
Buildings
Target Calibration of model andenergy use of DHW
Determination of pipelength equations
Validating of pipe lengthequation
Validating ofDHW heat loss
Description
No. of buildings 1 15 7 23
Building’s basic data Heated area, net area, layout area (floor gross area), volume, length, width, height, number of: floors,apartments, DHW shafts.
Building pipe lengthDetailed 3D BIM and
energy simulation modelwith real length of pipes
Measured length of pipesfrom 2D-design
drawings + onsite survey
Measured length of pipesfrom 2D-design
drawings + onsite survey
A. Length of DHW and DHW circulation pipes
Pipe lengths Detailed simulation withmeasured pipe lengths
Generating of Equationwith real pipe length
Validation of theperformance of Equation
with real pipe length
Calculated pipelength withgeneratedEquations
B. Heat loss of DHW pipes
DHW and DHWcirculation heat loss
Detailed simulationmodel, calibrated based
on detailed fieldmeasurements
Calculated pipe heat losswith measured length,calculated length and
assumed measured lossesfrom earlier study
Calculated pipe heat losswith measured length,calculated length and
assumed measured lossesfrom earlier study
Measured DHWsystem energy
losses
The influence of DHWsystem heat loss.
Calibrated modelcalculations with
different renovationscenarios
Calculated DHW systemunutilised heat loss
Calculated DHW systemunutilised heat loss
Calculated DHWsystem heat losscomparison with
measuredconsumption
Figure 1. Overview of the nZEB case building after the renovation.
The DHW consumption and heating energy consumption, together with DHW andDHW circulation heating, was measured from all apartments. In the case study buildingwhich we chose for calibrating our pipe heat loss model, we measured hourly data fromevery source (detailed information about DHW volumes and DHW heating energy perevery hour and also circulation energy use) between the period June to November 2019. Theindoor temperature in the main basement room was also measured during the same period.
2.3. Test Buildings and Reference Buildings
We selected test buildings from among the buildings where we have detailed infor-mation about pipe length and energy use (DHW, DHW circulation) in both basement and
Energies 2021, 14, 6446 5 of 19
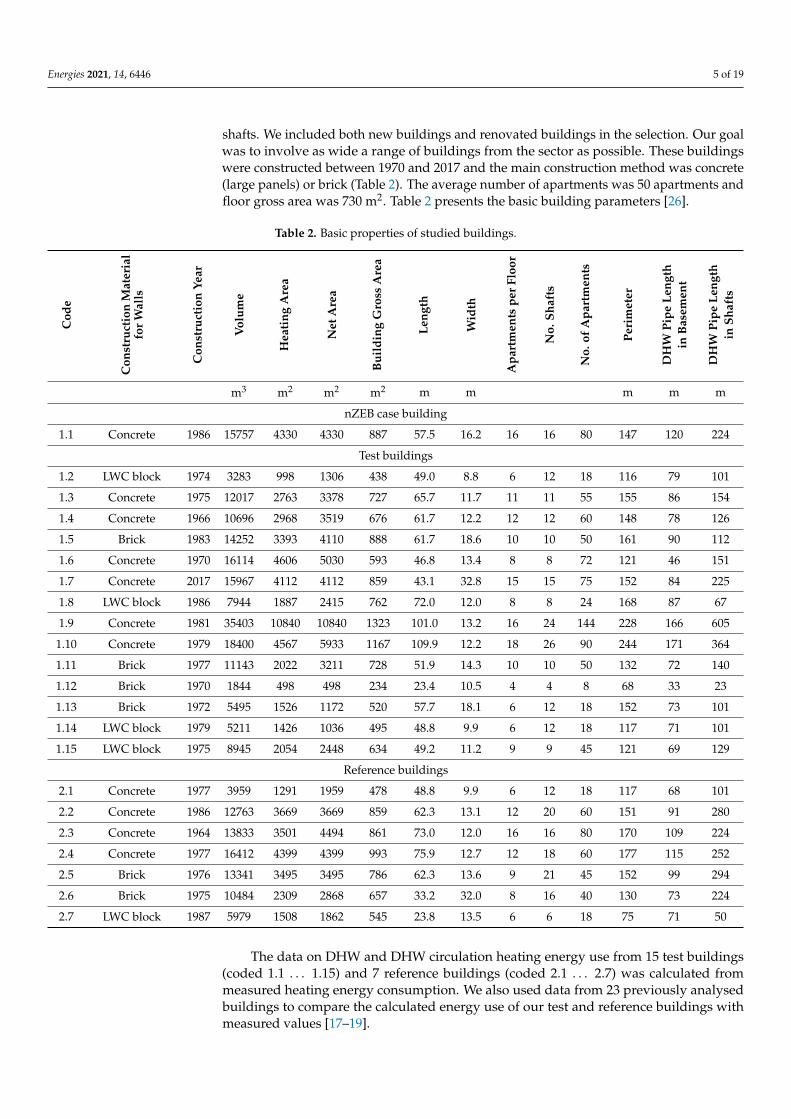
shafts. We included both new buildings and renovated buildings in the selection. Our goalwas to involve as wide a range of buildings from the sector as possible. These buildingswere constructed between 1970 and 2017 and the main construction method was concrete(large panels) or brick (Table 2). The average number of apartments was 50 apartments andfloor gross area was 730 m2. Table 2 presents the basic building parameters [26].
Table 2. Basic properties of studied buildings.
Cod
e
Con
stru
ctio
nM
ater
ial
for
Wal
ls
Con
stru
ctio
nYe
ar
Vol
ume
Hea
ting
Are
a
Net
Are
a
Bui
ldin
gG
ross
Are
a
Leng
th
Wid
th
Apa
rtm
ents
per
Floo
r
No.
Shaf
ts
No.
ofA
part
men
ts
Peri
met
er
DH
WPi
peLe
ngth
inB
asem
ent
DH
WPi
peLe
ngth
inSh
afts
m3 m2 m2 m2 m m m m m
nZEB case building
1.1 Concrete 1986 15757 4330 4330 887 57.5 16.2 16 16 80 147 120 224
Test buildings
1.2 LWC block 1974 3283 998 1306 438 49.0 8.8 6 12 18 116 79 101
1.3 Concrete 1975 12017 2763 3378 727 65.7 11.7 11 11 55 155 86 154
1.4 Concrete 1966 10696 2968 3519 676 61.7 12.2 12 12 60 148 78 126
1.5 Brick 1983 14252 3393 4110 888 61.7 18.6 10 10 50 161 90 112
1.6 Concrete 1970 16114 4606 5030 593 46.8 13.4 8 8 72 121 46 151
1.7 Concrete 2017 15967 4112 4112 859 43.1 32.8 15 15 75 152 84 225
1.8 LWC block 1986 7944 1887 2415 762 72.0 12.0 8 8 24 168 87 67
1.9 Concrete 1981 35403 10840 10840 1323 101.0 13.2 16 24 144 228 166 605
1.10 Concrete 1979 18400 4567 5933 1167 109.9 12.2 18 26 90 244 171 364
1.11 Brick 1977 11143 2022 3211 728 51.9 14.3 10 10 50 132 72 140
1.12 Brick 1970 1844 498 498 234 23.4 10.5 4 4 8 68 33 23
1.13 Brick 1972 5495 1526 1172 520 57.7 18.1 6 12 18 152 73 101
1.14 LWC block 1979 5211 1426 1036 495 48.8 9.9 6 12 18 117 71 101
1.15 LWC block 1975 8945 2054 2448 634 49.2 11.2 9 9 45 121 69 129
Reference buildings
2.1 Concrete 1977 3959 1291 1959 478 48.8 9.9 6 12 18 117 68 101
2.2 Concrete 1986 12763 3669 3669 859 62.3 13.1 12 20 60 151 91 280
2.3 Concrete 1964 13833 3501 4494 861 73.0 12.0 16 16 80 170 109 224
2.4 Concrete 1977 16412 4399 4399 993 75.9 12.7 12 18 60 177 115 252
2.5 Brick 1976 13341 3495 3495 786 62.3 13.6 9 21 45 152 99 294
2.6 Brick 1975 10484 2309 2868 657 33.2 32.0 8 16 40 130 73 224
2.7 LWC block 1987 5979 1508 1862 545 23.8 13.5 6 6 18 75 71 50
The data on DHW and DHW circulation heating energy use from 15 test buildings(coded 1.1 . . . 1.15) and 7 reference buildings (coded 2.1 . . . 2.7) was calculated frommeasured heating energy consumption. We also used data from 23 previously analysedbuildings to compare the calculated energy use of our test and reference buildings withmeasured values [17–19].

Energies 2021, 14, 6446 6 of 19
2.4. Determining DHW Pipe Length
To come up with an appropriate method for determining DHW pipe length, weselected 15 buildings with basic data available (which are presented in (Table 2). Weanalysed the data (building volume, heating area, net area, floor gross area, total numberof apartments, etc.) from 15 test buildings to find out which data could be used and how toformulate an equation to generate the length and energy use of the DHW systems. Thebuildings’ perimeter and the number of DHW shafts were calculated and counted from thedesign drawings of these buildings.
We used R square to find the best parameter model with intercept and for the twoparameter model we used a bootstrapping method [27] to find best frequency by randomlysampling 2 parameters 10,000 times. Our goal was to find a minimum pipe length differencefrom measured values. All measured pipe lengths in the buildings are presented in (Table 2).Measured DHW pipes and DHW circulation pipes were more or less the same (measuredpipe length in test and reference buildings), which is why we decided to present, formeasured pipe length, an average DHW and DHW circulation pipe length in each building.
These so-determined DHW and DHW circulation pipe lengths were compared withEN standard (EN-15316-3 [23]) calculated pipe lengths.
Pipe length of DHW (lDHW) (1) and DHW circulation system (lcirc.) (2) in the basementcan be calculated by standard EN-15316-3 [23]. In the Equations, LL is length and LW iswidth of the building.
lDHWb = LL + 0.0625·LL·LW, (m) (1)
lcirc.b = 2·LL + 0.0125·LL·LW, (m) (2)
Pipe length of DHW (lDHWs) (lDHWs = 0.038·LL·LW·Nlev·Hfl, (m)) and DHW circulationsystem (lcirc.s) (4) in the shafts can be calculated by standard EN-15316-3 [23]. In EquationsLL is length, LW is width, Nlev is number of floors and Hfl is height of floor of the building.
lDHWs = 0.038·LL·LW·Nlev·Hfl, (m) (3)
lcirc.s = 0.0752·LL·LW·Nlev·, (m) (4)
2.5. Indoor Climate and Energy Performance by nZEB Case Building Calibration
The indoor climate and energy performance model was built in the simulation pro-gram IDA ICE 4.8 [28,29]. This software allows the modelling of a multizone building,internal heat gains and external solar loads, outdoor climate, heating and ventilation sys-tems and dynamic simulation of heat transfer and air flows. We were also able to modelheat losses from the zones in which they occurred and represent uninsulated valves byusing a 2 m uninsulated pipe length, which is more or less an average from calculatedvalues [30].
To calibrate the model we built up a complex model using detailed DHW and DHW cir-culation drawings for the reference building and then simplified it to create our calculationmodel (Figure 2).
Building a simulation model that matched all losses with the zones where those losseswere occurring was very complex. Therefore we simplified the basement to a one zonemodel (originally this was a multizone basement with 14 rooms, as we wanted to see howheat losses affected indoor temperatures in the basement in different thermal insulationcases (0, 20, 40 mm with and without valve insulation)) but calculated with the differentEPC that we used in earlier studies of the same building [31].

Energies 2021, 14, 6446 7 of 19
Figure 2. Simplified case building DHW and DHW circulation piping in basement and shafts.
The calculations can be repeated when the design of DHW and DHW circulation hasbeen simplified by using a standard length for all main pipe lengths between shafts, andall pipe lengths and thermal insulation thicknesses have been described. The pipe modelused is important, as is showing where pipes are located (in which zone). All pipes in themodel must be hydraulically balanced, and inlet and outlet water temperature from theplant should be accurately represented.
Using measured pipe lengths in basement and shafts, we built up a dynamic sim-ulation model with previously calibrated building heat losses. We measured indoortemperatures in the basement and used this for calibrating measured heat losses withcalculated ones.
2.6. Heat Losses Calculations from DHW and DHW Circulation Pipes
Heat loss was calculated based on standard EN 15316-3 [23]. By this standard, pipeheat losses are calculated per length when the temperature difference is 1 Kelvin (Table 3).In this case, we can assume heat loss from pipes when we know the average basement orshaft temperature and pipe length in those places. However, indoor temperatures and howmuch these losses can be utilised as internal heat gain are both unknown.
Table 3. The dependence of pipe’s heat loss on insulation thickness and pipe diameter.
Pipe’s OuterDiameter, mm 50 40 25 20
Thermal pipe insulationthickness, mm Pipe’s linear thermal transmittance Ψ (W/m·K)
40 0.25 0.22 0.17 0.15
20 0.37 0.32 0.23 0.21
0 1.22 0.98 0.62 0.50
2.7. The Influence of DHW and DHW Circulation Heat Loss on the Whole Building EnergyPerformance and Indoor Climate
The dependence of DHW heat loss on the energy performance of the building wasanalysed by using IDA ICE 4.8 dynamic simulation software. That is why we analysed theannual loss in the nZEB case building (Figure 1) with different thicknesses of thermal pipeinsulation and with the different building envelope thermal insulations which are typicallyused in renovation scenarios in Estonia. Inputs for the simulation model are presented asthe following:
Simulations were done in two different cases, with a heated basement and with anunheated basement. For this reason, we used two different heated areas 3562 m2 (without
Energies 2021, 14, 6446 8 of 19
basement) and 4324 m2 (with basement). In the Figures, EPC classes are designated byclass symbols (A, C, D, E and F).
Our goal was to find out, firstly, how much energy could be utilised from DHW systempipe losses in the basement and in shafts per calculated length and how large non-utilisedlosses per calculated length would be and, secondly, what the EPC class would be withand without pipe losses in the different cases.
3. Results3.1. Measured and Calculated DHW Circulation Losses in Case Building
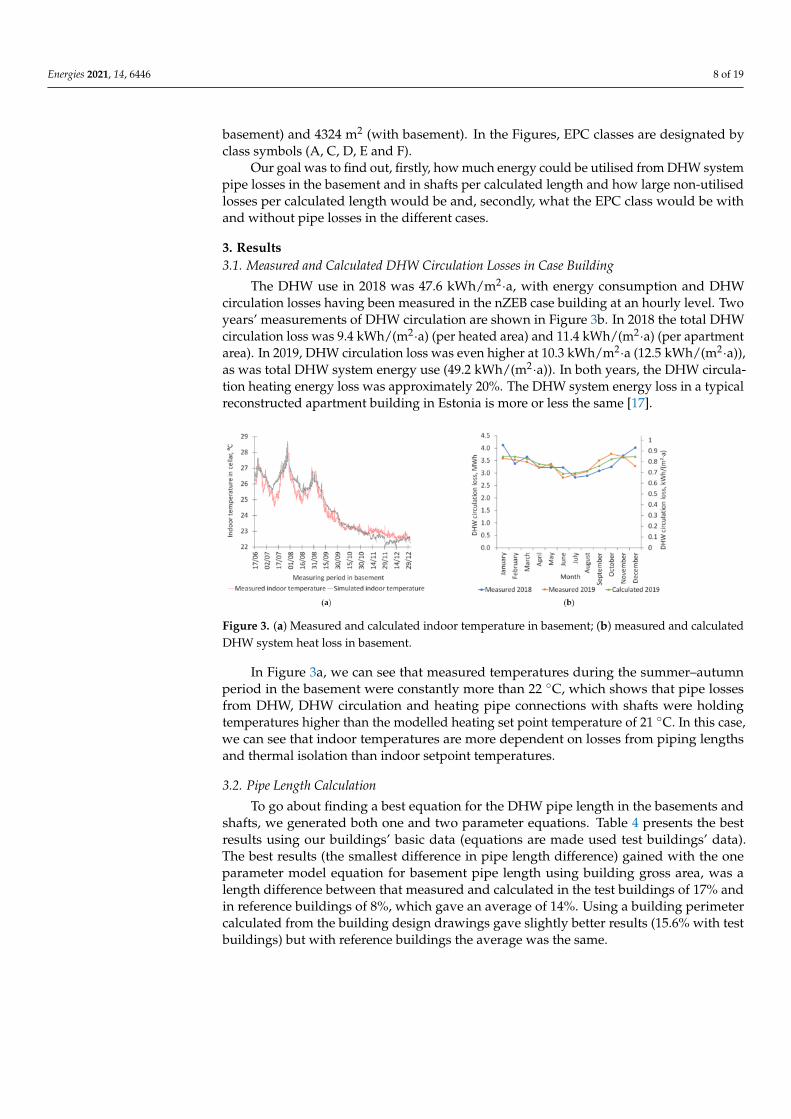
The DHW use in 2018 was 47.6 kWh/m2·a, with energy consumption and DHWcirculation losses having been measured in the nZEB case building at an hourly level. Twoyears’ measurements of DHW circulation are shown in Figure 3b. In 2018 the total DHWcirculation loss was 9.4 kWh/(m2·a) (per heated area) and 11.4 kWh/(m2·a) (per apartmentarea). In 2019, DHW circulation loss was even higher at 10.3 kWh/m2·a (12.5 kWh/(m2·a)),as was total DHW system energy use (49.2 kWh/(m2·a)). In both years, the DHW circula-tion heating energy loss was approximately 20%. The DHW system energy loss in a typicalreconstructed apartment building in Estonia is more or less the same [17].
Figure 3. (a) Measured and calculated indoor temperature in basement; (b) measured and calculatedDHW system heat loss in basement.
In Figure 3a, we can see that measured temperatures during the summer–autumnperiod in the basement were constantly more than 22 ◦C, which shows that pipe lossesfrom DHW, DHW circulation and heating pipe connections with shafts were holdingtemperatures higher than the modelled heating set point temperature of 21 ◦C. In this case,we can see that indoor temperatures are more dependent on losses from piping lengthsand thermal isolation than indoor setpoint temperatures.
3.2. Pipe Length Calculation
To go about finding a best equation for the DHW pipe length in the basements andshafts, we generated both one and two parameter equations. Table 4 presents the bestresults using our buildings’ basic data (equations are made used test buildings’ data).The best results (the smallest difference in pipe length difference) gained with the oneparameter model equation for basement pipe length using building gross area, was alength difference between that measured and calculated in the test buildings of 17% andin reference buildings of 8%, which gave an average of 14%. Using a building perimetercalculated from the building design drawings gave slightly better results (15.6% with testbuildings) but with reference buildings the average was the same.

Energies 2021, 14, 6446 9 of 19
Table 4. Case study building EPC classes with different building envelope thermal transmittances and ventilation strategy.
Energy Performance of Building—Primary Energy (PE) Use and Energy Performance Certificate(EPC) Class
EPC “A *” and “B”PE ≤ 125
kWh/(m2·a)
EPC “C”PE ≤ 150
kWh/(m2·a)
EPC “D”PE ≤ 180
kWh/(m2·a)
EPC “E”PE ≤ 220
kWh/(m2·a)
EPC “F”PE ≤ 280
kWh/(m2·a)
Thermaltransmittance
of buildingenvelope U,W/(m2·K)
External wall 0.13 0.17 0.22 0.22 1.0
Basement wall 0.10 0.21 0.61 0.61 0.61
Basement floor 0.23 0.38 0.39 0.39 0.39
Roof 0.11 0.17 0.17 0.22 0.76
Window 0.82 1.0 1.2 1.4 1.7
Ventilationstrategy
Apartments Mechanical ventilation 0.5 L/(s·m2), ventilation heat recovery(VHR) 0.8. 0.5 L/(s·m2)
no VHR0.35 L/(s·m2)
no VHRCommon rooms
and heatedbasement
Mechanical ventilation 0.5 L/(s·m2),VHR 0.8.
No VHR0.5 L/(s·m2)
In unheated room 0.15 L/(s·m2) without heat recovery
* A is together with solar collectors and locally used PV panel electricity production (PE ≤ 105 kWh/(m2·a).
Pipe lengths in shafts was the best fit with the building heating area equation (pipelength difference from measured lengths were on average 28.3%).
Using for analyses also mean bias error or root mean square error, we can see (Table 5)that the equation selected in the first step fits well in both cases.
Table 5. Pipe length (in meters) equations, R-square values in test buildings, length difference from measured values, meanbias errors and root mean square errors in test and reference buildings.
FactorEquation to
Calculate thePipe Length, m
R2 Difference between Measuredand Calculated, % MBE (Mean Bias Error) RMSE (Root Mean Square Error)
TestBuild-ings
TestBuild-ings
ReferenceBuild-ings
AllBuildingsAverage
TestBuild-ings
ReferenceBuild-ings
AllBuildingsAverage
TestBuild-ings
ReferenceBuild-ings
AllBuildingsAverage
One parameter model Pipe length in basementx = Volume l = 0.0034·x + 46 0.56 23.8 9.2 19.2 −0.57 −5.8 −2.2 24.4 9.5 20.8
x = Heating area l = 0.0109·x + 53 0.52 23.2 6.8 18.0 −0.04 −4.6 −1.5 25.4 9.2 21.6x = Net area l = 0.0112·x + 49 0.57 24.6 7.8 19.2 0.03 −4.5 −1.4 23.9 9.4 20.5
x = Gross area l = 0.1235·x − 2 0.82 17.1 8.4 14.4 −0.01 0.2 0.1 15.7 7.7 13.6x = Apartments
per floor l = 7.2845·x + 13 0.68 22.5 14.5 19.9 0.00 −4.6 −1.5 1.0 14.6 18.9
x = No. shafts l = 6.1258·x + 11 0.89 13.0 28.7 18.0 0.00 17.1 5.4 12.3 28.4 18.9x = Perimeter of
building l = 0.8015·x − 31 0.85 15.6 11.8 14.4 0.00 −8.9 −2.8 14.1 16.4 14.9
One parameter model Pipe length in shaftsx = Volume l = 0.0163·x − 24 0.87 33.9 31.6 33.2 −0.1 −48.4 −15.5 50.7 65.2 55.7
x = Heating area l = 0.0538·x + 3 0.88 26.8 31.6 28.3 0.1 −45.8 −14.5 48.7 65.0 54.4x = Net area l = 0.0522·x − 11 0.87 33.9 29.9 32.6 −0.1 −54.1 11.3 50.7 71.9 60.0
x = Gross area l = 0.4471·x − 151 0.74 55.9 32.5 48.5 0.0 −23.8 −7.6 69.9 56.8 66.0x = Apartments
per floor l = 25.768·x − 91 0.59 36.9 34.7 36.2 0.0 −41.1 −13.1 88.2 85.8 87.4
x = Totapartments l = 3.6964·x − 24 0.86 34.7 34.7 34.7 0.0 −58.2 −18.5 53.5 83.3 64.5
x = No shafts l = 21.648·x − 98 0.77 36.5 25.1 32.8 0.0 35.5 11.3 66.1 44.4 60.0x = Perimeter l = 2.5985·x − 211 0.62 59.3 37.4 52.3 0.0 −54.1 −17.2 85.0 71.9 81.1
Energies 2021, 14, 6446 10 of 19
Table 5. Cont.
FactorEquation to
Calculate thePipe Length, m
R2 Difference between Measuredand Calculated, % MBE (Mean Bias Error) RMSE (Root Mean Square Error)
TestBuild-ings
TestBuild-ings
ReferenceBuild-ings
AllBuildingsAverage
TestBuild-ings
ReferenceBuild-ings
AllBuildingsAverage
TestBuild-ings
ReferenceBuild-ings
AllBuildingsAverage
Two parameter model Pipe length in basementx = Gross area
andy = No. shafts
l = 1.04236·x +3.56701·y 0.94 9.7 18.4 12.5 0.8 10.9 4.0 9.4 18.9 13.2
x = No. shafts andy = Perimeter
l = 3.02566·x +0.44814·y − 16 0.96 10.3 18.4 12.9 0.5 4.1 1.7 9.7 18.2 13.0
EN 15316-3 42.6 30.6 38.8 33.3 20.6 29.3 36.8 27.9 34.2
Two parameter model Pipe length in shaftsx = no. shafts andy = heating area
l = 10.1399·x +0.03717·y − 67 0.94 23.8 14.3 9.8 0.0 −5.7 −1.8 20.2 20.6 20.4
EN 15316-3 325.3 144.7 267.8 515.2 −94.6 321.2 610.3 114.3 508.0
For the two parameter equation we used a bootstrapping method. Best results forpipe lengths in basements when combining building gross area and number of DHW shafts(frequency from 1000 samples was 182) gave an average calculated length difference frommeasured length in the test buildings of 10%. However, we were unable to produce goodresults using any of the other basic building parameters which are known in the earlydesign stages. The same lack of good results occurred when calculating pipes in shafts.
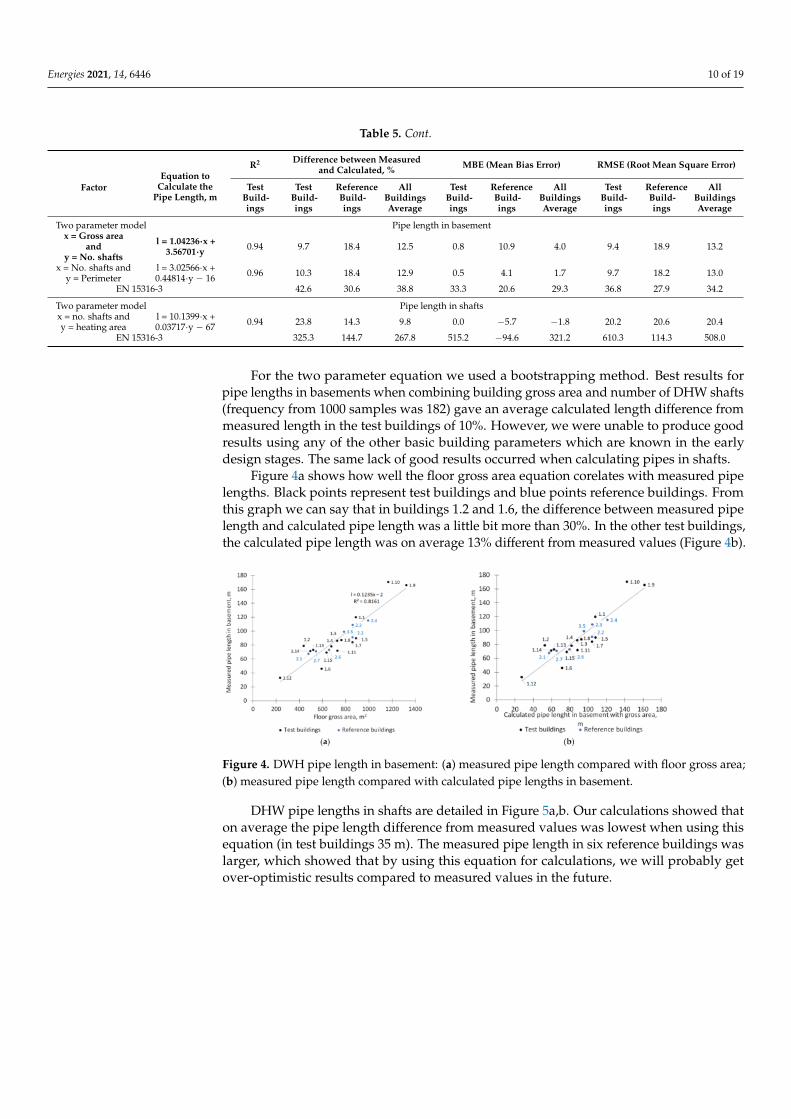
Figure 4a shows how well the floor gross area equation corelates with measured pipelengths. Black points represent test buildings and blue points reference buildings. Fromthis graph we can say that in buildings 1.2 and 1.6, the difference between measured pipelength and calculated pipe length was a little bit more than 30%. In the other test buildings,the calculated pipe length was on average 13% different from measured values (Figure 4b).
Figure 4. DWH pipe length in basement: (a) measured pipe length compared with floor gross area;(b) measured pipe length compared with calculated pipe lengths in basement.
DHW pipe lengths in shafts are detailed in Figure 5a,b. Our calculations showed thaton average the pipe length difference from measured values was lowest when using thisequation (in test buildings 35 m). The measured pipe length in six reference buildings waslarger, which showed that by using this equation for calculations, we will probably getover-optimistic results compared to measured values in the future.

Energies 2021, 14, 6446 11 of 19
Figure 5. DHW pipe length in shaft: (a) measured pipe length compared with heating area;(b) measured pipe length compared with calculated pipe lengths in shafts.
Compared with the EN standard calculation method of using the heating area in thecalculations, we can see large differences in the results for pipe lengths in shafts whencompared to our equations. In test buildings, the average length difference using the ENstandard equation was 258%. In comparison, our generated equation using the heated areagave an average length difference of 28%. In Figure 6a, we can see that the EN standardequation gave us results that were a little too pessimistic. The calculated pipe lengths inbasements, when using the EN standard, was better than in shafts. The difference frommeasured length on average (test and reference buildings) was 39%, while the differencefrom calculated length, when using floor gross area, was 14% (Figure 6b).
Figure 6. (a) Calculated pipe length in shafts with EN standard 15316-3 and using heating area;(b) calculated pipe length in basement with EN standard 15316-3 and using building gross area.
3.3. Parameters Influencing Heat Loss from DHW Circulation Piping
We investigated DHW pipe heat losses in the reference building:
• With different thickness of thermal insultation (0, 20 and 40 mm);• With and without DHW circulation balancing valve insulation;• Temperature in basement 21 ◦C or unheated;• With different energy performance classes (EPC) (A, C, D, E, and F);• Circulation pump working time.
To visualise how the various parameters influence energy loss from pipes, we decidedto compare all EPC classes separately with different thicknesses of DHW thermal pipeinsulation when the basement is both unheated and heated. In Figure 7a, we can see thatwith different EPC classes, unutilised DHW system losses varied between 48% to 81% in theunheated basement and this variance did not depend on the thickness of the pipes’ thermalinsulation. In the heated basement, unutilised heat loss from DHW pipes was between 24%to 71% (Figure 8b). Figure 7 shows the influence of thermal pipe insulation. When DHWsystem pipes are insulated with 20 mm of thermal insulation (EPC class A) than the totalheat loss from pipes is 16 kWh/(m2·a) but unutilised pipe losses are , which means that
Energies 2021, 14, 6446 12 of 19
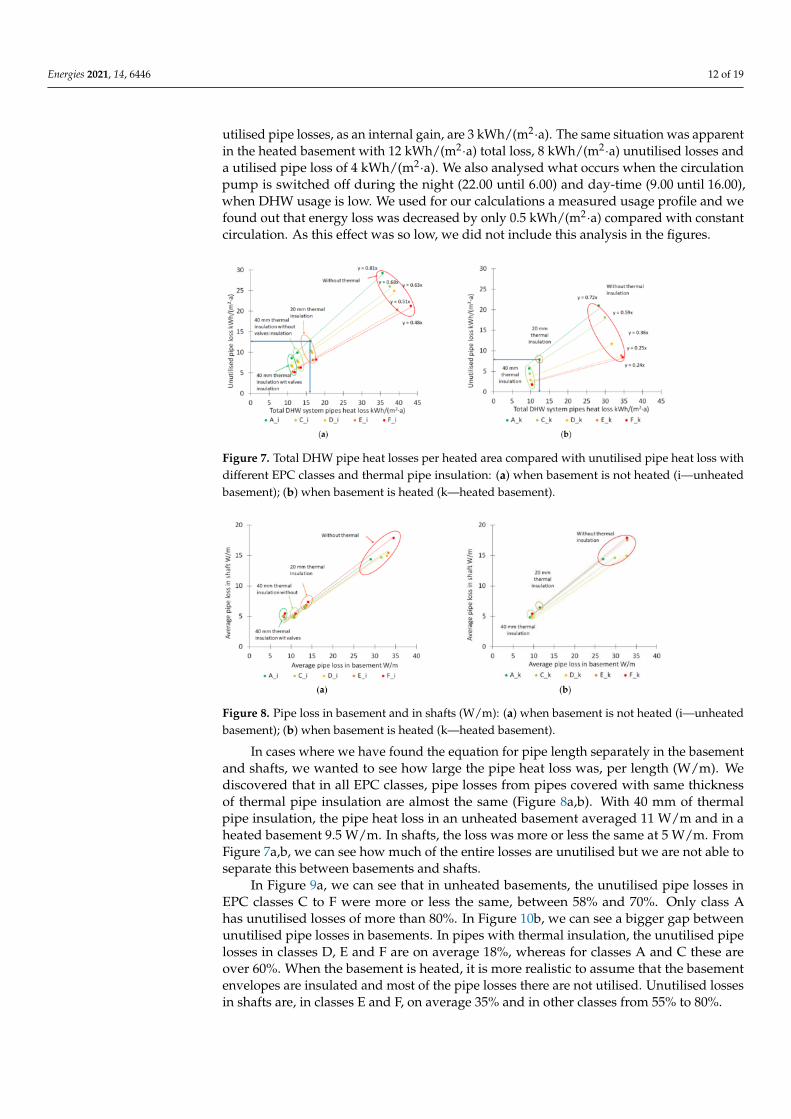
utilised pipe losses, as an internal gain, are 3 kWh/(m2·a). The same situation was apparentin the heated basement with 12 kWh/(m2·a) total loss, 8 kWh/(m2·a) unutilised losses anda utilised pipe loss of 4 kWh/(m2·a). We also analysed what occurs when the circulationpump is switched off during the night (22.00 until 6.00) and day-time (9.00 until 16.00),when DHW usage is low. We used for our calculations a measured usage profile and wefound out that energy loss was decreased by only 0.5 kWh/(m2·a) compared with constantcirculation. As this effect was so low, we did not include this analysis in the figures.
Figure 7. Total DHW pipe heat losses per heated area compared with unutilised pipe heat loss withdifferent EPC classes and thermal pipe insulation: (a) when basement is not heated (i—unheatedbasement); (b) when basement is heated (k—heated basement).
Figure 8. Pipe loss in basement and in shafts (W/m): (a) when basement is not heated (i—unheatedbasement); (b) when basement is heated (k—heated basement).
In cases where we have found the equation for pipe length separately in the basementand shafts, we wanted to see how large the pipe heat loss was, per length (W/m). Wediscovered that in all EPC classes, pipe losses from pipes covered with same thicknessof thermal pipe insulation are almost the same (Figure 8a,b). With 40 mm of thermalpipe insulation, the pipe heat loss in an unheated basement averaged 11 W/m and in aheated basement 9.5 W/m. In shafts, the loss was more or less the same at 5 W/m. FromFigure 7a,b, we can see how much of the entire losses are unutilised but we are not able toseparate this between basements and shafts.
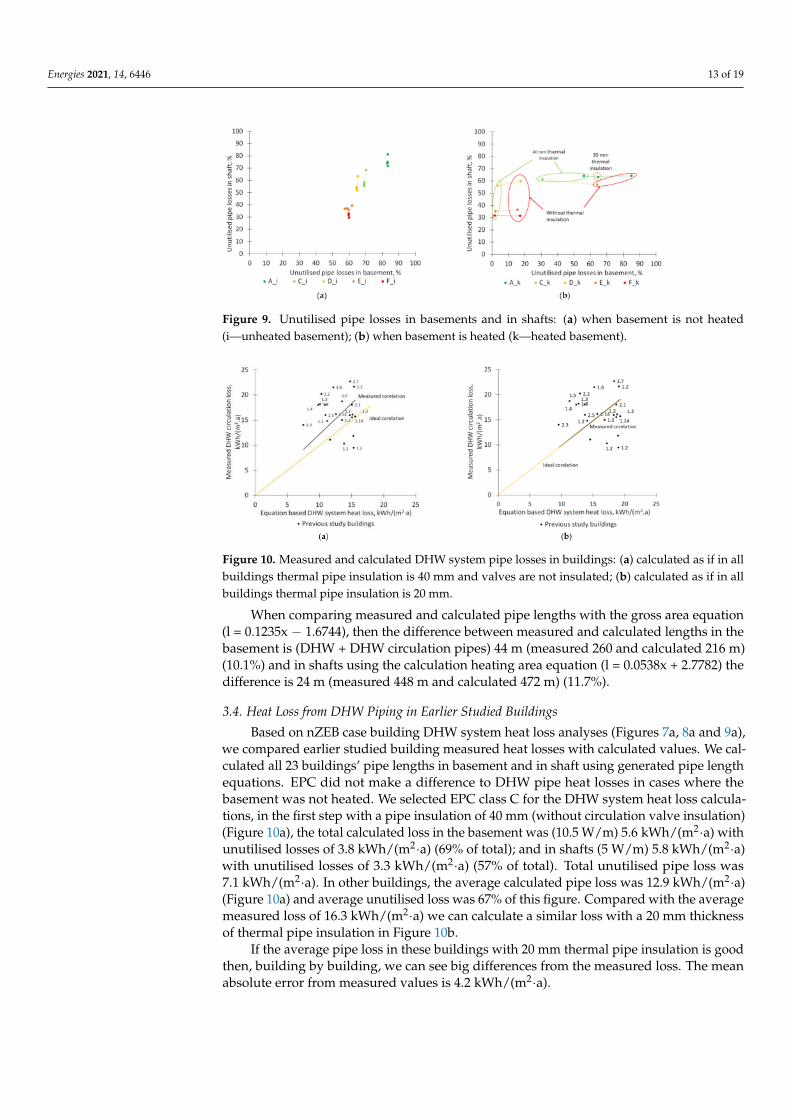
In Figure 9a, we can see that in unheated basements, the unutilised pipe losses inEPC classes C to F were more or less the same, between 58% and 70%. Only class Ahas unutilised losses of more than 80%. In Figure 10b, we can see a bigger gap betweenunutilised pipe losses in basements. In pipes with thermal insulation, the unutilised pipelosses in classes D, E and F are on average 18%, whereas for classes A and C these areover 60%. When the basement is heated, it is more realistic to assume that the basementenvelopes are insulated and most of the pipe losses there are not utilised. Unutilised lossesin shafts are, in classes E and F, on average 35% and in other classes from 55% to 80%.
Energies 2021, 14, 6446 13 of 19
Figure 9. Unutilised pipe losses in basements and in shafts: (a) when basement is not heated(i—unheated basement); (b) when basement is heated (k—heated basement).
Figure 10. Measured and calculated DHW system pipe losses in buildings: (a) calculated as if in allbuildings thermal pipe insulation is 40 mm and valves are not insulated; (b) calculated as if in allbuildings thermal pipe insulation is 20 mm.
When comparing measured and calculated pipe lengths with the gross area equation(l = 0.1235x − 1.6744), then the difference between measured and calculated lengths in thebasement is (DHW + DHW circulation pipes) 44 m (measured 260 and calculated 216 m)(10.1%) and in shafts using the calculation heating area equation (l = 0.0538x + 2.7782) thedifference is 24 m (measured 448 m and calculated 472 m) (11.7%).
3.4. Heat Loss from DHW Piping in Earlier Studied Buildings
Based on nZEB case building DHW system heat loss analyses (Figures 7a, 8a and 9a),we compared earlier studied building measured heat losses with calculated values. We cal-culated all 23 buildings’ pipe lengths in basement and in shaft using generated pipe lengthequations. EPC did not make a difference to DHW pipe heat losses in cases where thebasement was not heated. We selected EPC class C for the DHW system heat loss calcula-tions, in the first step with a pipe insulation of 40 mm (without circulation valve insulation)(Figure 10a), the total calculated loss in the basement was (10.5 W/m) 5.6 kWh/(m2·a) withunutilised losses of 3.8 kWh/(m2·a) (69% of total); and in shafts (5 W/m) 5.8 kWh/(m2·a)with unutilised losses of 3.3 kWh/(m2·a) (57% of total). Total unutilised pipe loss was7.1 kWh/(m2·a). In other buildings, the average calculated pipe loss was 12.9 kWh/(m2·a)(Figure 10a) and average unutilised loss was 67% of this figure. Compared with the averagemeasured loss of 16.3 kWh/(m2·a) we can calculate a similar loss with a 20 mm thicknessof thermal pipe insulation in Figure 10b.
If the average pipe loss in these buildings with 20 mm thermal pipe insulation is goodthen, building by building, we can see big differences from the measured loss. The meanabsolute error from measured values is 4.2 kWh/(m2·a).

Energies 2021, 14, 6446 14 of 19
3.5. Generating Heat Loss Equation from DHW Piping
While generating the equation from our nZEB case building, we noticed that, to acertain extent, pipe heat loss and DHW system loss utilisation as an internal heat gaindepend on the EPC class and also on how much the DHW system pipes are insulated.Basement heat losses also depend on whether the basement is heated or not. We decidednot to include EPC classes D, E and F with heated basements into the generated equation.
Our reference building showed that pipe losses per length were more or less the sameacross the different EPC classes.
From our research we generated an equation for DHW system heat loss from ourcase study loss analyses. In Table 6., pipe losses per length are presented with differentthicknesses of thermal pipe insulation and also how much the pipe losses are unutilised asinternal heat gain.
Table 6. Pipe losses per length with different thicknesses of thermal pipe insulation (qa) and howmuch of the losses are unutilised as internal heat gain (Qunut.).
Insulation of Pipes Basement is Unheated
Base
men
tlos
ses
qa.basement, W/mQunut. basement, %
EPC “A” EPC “C”
40 mm (insulated valves) 8.3
83 7040 mm (uninsulated valves) 10.8
20 mm 13.6
Basement is heated +21 ◦C
qa.basement, W/m Qunut. basement, %
40 mm (insulated valves) 7.0
56 4840 mm (uninsulated valves) 9.2
20 11.5
Shaf
tlos
ses qa.shaft, W/m Qunut. shaft, %
40 mm 5.1
69 5920 mm 6.8
0 mm 15.5
From this, we can generate a different heat loss equation for unutilised DHW sys-tem heat loss in the basement (ΦaDHW basement Equation (5)) and in shafts (ΦaDHW shaftEquation (6)):
ΦaDHW basement = lDHW cella·qa.basement·Qunut. basement·8760·10−3/Aheat, kWh/(m2·a) (5)
ΦaDHW shaft = lDHW shaft·qa.shaft·Qunut.shaft·8760·10−3/Aheat kWh/(m2·a) (6)
Aheat is building heating area (m2)lDHW is calculated pipe length (l)qa is pipe heat loss per calculated length (W/m)Qunut. is unutilised pipe loss (%)8760 is hours per year (h)
Using for our calculations the best equation to find the pipe length in basements (equa-tion with floor gross area) and in shafts (equation with heating area), we then calculated, inall test and reference buildings with thermal pipe insulation of 40 mm (without thermalinsulation on circulation pipe valves), the annual heat loss per heated area (basement isunheated). In Figure 10, we can see good correlation with the heating area. Buildingswhich have a larger heating area have lower pipe losses. The minimum unutilised pipeheat loss in a building is 5.5 kWh/(m2·a) (total 7.6 kWh/(m2·a)) even though the heated

Energies 2021, 14, 6446 15 of 19
area is more than twice as large as the second biggest building. From this graph we can saythat, for over 5000 m2 of heated area, the pipe heat losses are the same. In smaller buildingshowever, there can be unutilised losses of up to 12.1 kWh/(m2·a).
All buildings calculated average was 8.7 kWh/(m2·a) and median 8.2 kWh/(m2·a).
4. Discussion
In existing buildings where circulation losses are not measured separately, it is hard toseparate the share of these losses from the entire building’s energy use. In a previous study,we also analysed DHW circulation losses. In 23 buildings, the DHW circulation losses werenot directly measured but were calculated from measured DHW consumption and theknown total energy consumption for DHW. The graph Figure 11. presents all the buildings’DHW circulation heat loss against the heated area. In those buildings, DHW circulationheat loss was 16.3 kWh/(m2·a) except in one outlier building, where it was extremely high(34 kWh/(m2·a)). Earlier studies of other buildings’ measured DHW system heat lossshowed that, in similar buildings, it can vary considerably.
Figure 11. Test and reference building calculated unutilised DHW system pipe heat loss with 40 mmthermal pipe insulation without circulation valve thermal insulation and basement heating (EPC A).
From the Figure, we can see that across the same types of building (code 1.2), themeasured DHW system energy loss can be from 9.5 to 34 kWh/(m2·a) and the calculatedloss (with 40 mm pipe insulation) 15.4 kWh/(m2·a). In all seven of these buildings, theDHW and DHW circulation pipe lengths are very similar. The differences in heat losscame from the quality of the thermal pipe insulation installation work and the thickness ofinsulation. Basement heat losses in those buildings were also different.
In earlier studies we have noticed, when comparing volume-based measured DHW-calculated energy use with measured entire DHW energy consumption, that losses frompipes were on average 16.3 kWh/(m2·a) [17–19]. From all the buildings’ DHW energyneed this was 27–62%, the average from 22 buildings was 44%. Very similar results werefound in earlier studies. Bøhm and Danig showed, from the entire DHW heating energyneed, a 65% loss [1] and later Bøhm specified it as 23–70% [2]. Similar losses have alsobeen shown by Gassel [3] and Zhang et al. [5]. Horvath et al. [4] showed a slightly lowerDHW system heat loss of between 5.7 and 9.9 kWh/(m2·a). Our calculations showed that5.5 kWh/(m2·a) is the minimum loss in apartment buildings.
If DHW system pipe losses are not integrated into energy efficiency calculations wehave shown that the predicted energy consumption is lower than the actual measuredvalues taken in use. Furthermore, the expected EPC might be one class higher (C classimproved to D class). One of our goals for finding an equation for DHW system pipelengths was that, in the design phase, we would be able to make accurate predictions ofthe probable future energy consumption of apartment buildings.
In our research, we analysed different factors such as building volume, heating area,net area, floor gross area, total number of apartments. Our decision was not to analyseas per EN standard (EN 15316-3 [23]) with building lengths and DHW pipe lengths inthe basement.

Energies 2021, 14, 6446 16 of 19
From our analysis, we decided to consider in our future calculation method forassuming DHW and DHW circulation pipe length, that for pipes located in basements,we would use the building gross area and for pipes located in shafts, the building heatingarea. Our analysis showed that the two parameter model quality is no better than the oneparameter model, which is why we decided to only use the one parameter model for thelength calculations.
As we had data from DHW system pipe losses from buildings studied earlier, wewanted to see how the calculated length correlated with measured pipe losses. As we haddetailed the measured DHW losses in our reference building, we were able to analyse pipelosses in different EPC classes (A, C, D, E and F) with different thickness of thermal pipeinsulation and with heated and without heated basements. From these analyses, we havefound that in different EPC class buildings, pipe loss per heated area is more or less thesame. The difference is in how these losses are utilised as an internal heat gain, and herethere is a difference between heated and unheated basements. In an EPC class C buildingwith an unheated basement, we can utilise, in the entire building, ca. 33% of pipe heatlosses, but separately basement losses of 30% and shaft losses of 40%. If we focus on 40 mmof pipe insulation then heat loss per pipe length in the basement is 10.5 W/m and in shafts5.0 W/m. From this we can calculate, for a similar building with calculated pipe length, theentire DHW system pipe losses. With a larger heated area, we have lower heat loss frompipes and our calculation showed in Figure 11 that, in buildings of over 5000 m2 heatedarea, the unutilised loss cannot fall below 5.5 kWh/(m2·a) (total 7.6 kWh/(m2·a)) with40 mm of thermal pipe insulation, when the basement is unheated. We have also shownthat the maximum unutilised heat loss is 12.1 kWh/(m2·a) (total 15.7 kWh/(m2·a)). Thisshows that in smaller apartment buildings, the same piping heat loss from DHW systemsis over 6 kWh/(m2·a) greater. The EPC class in smaller buildings can be affected by the netDHW system loss of 12.1 kWh/(m2·a) with a primary energy factor 0.65 (efficient districtheating), 8.7 kWh/(m2·a) (district heating efficiency 0.9) and with factor 1.0 (heating withgas) 12.7 kWh/(m2·a) (gas boiler efficiency 0.95). To reach current EPC limits we should, inthe future, also include in the calculations the DHW unutilised system losses.
Comparing the calculated length in all buildings (test and reference) then, on average,the pipe length in shafts is 0.11 m/m2 (per heated area) with the Finnish method forcalculating heat loss for EPC classes giving 0.2 m/m2 [32]. According to this regulation, theloss from pipes in heated areas (depending on pipe insulation) is 6 or 10 W/m. Comparethis to our calculation, which gave an average of 5 or 7 W/m. The Finnish regulation forcalculated length in basements was not simplified. There is, however, a sentence in theregulation which states that pipe length in basements should be measured.
If volume-based DHW energy use by Estonian regulations [33] is 30 kWh/(m2·a) andcalculated unutilised circulation loss is between 5.5 kWh/(m2·a) and 12.1 kWh/(m2·a),then circulation loss is between 18% and 40%. This is more than Grasmanis at.al. [15]have found.
Himpe [34] concluded that simplified heat loss calculation methods can be signifi-cantly improved when the estimation of two influential parameters, that is the averagetemperature of the heat conducting medium and the working time of the system, reflectsthe actual design and operation of the systems. In their suggested equation, there is a sim-ple question regarding the length of DHW and DHW circulation pipes. Our study showedthat EN standard equations give us an overly pessimistic pipe length in basements andshafts and also that indoor temperatures in basements vary depending on the basement’sthermal envelope properties.
5. Conclusions
Pipe heat losses in low-energy or nZEB apartment buildings can be more than 10% ofthe entire primary energy consumption. At this point in time, DHW and DHW circulationenergy consumption heat losses are based on the volume of water consumption. Most

Energies 2021, 14, 6446 17 of 19
apartment buildings have unheated basements where the main pipelines for DHW andDHW circulation are located.
Our work shows that:
• Pipe length is the most important value to use when assessing pipe heat losses inapartment buildings;
# Pipe length with EN standard equation is not relevant for Estonianapartment buildings:
n Length and width of buildings in the Estonian Registry of Buildingsdatabase is presented as a maximum and is not useful for nonrectangu-lar shaped buildings;
n Length according to EN 15316-3 standard for pipe gives over-long pipelengths compared to Estonian apartment buildings;
# Using floor gross area for calculating basement pipe length gave an average14% difference from measured pipe length in all buildings;
# Using the building heating area for calculating vertical shaft pipe lengths gavean average 28.3% difference from measured pipe length in all buildings;
# With 40 mm thermal insulation on the pipes, heat losses from pipes in an EPCC class basement were 10.8 W/m and in shafts 5.1 W/m, and with 20 mmthermal insulation heat losses were 13.6 W/m in the basement and 6.5 W/m inthe shafts.
• Pipe heat loss calculations in the reference building showed that the difference betweenthermal insulation levels on pipes did not affect how much heat loss from pipes canbe utilised as internal heat gain;
# For EPC class C buildings without basement heating, utilised pipe heat losseswere in total 33%, and separately, in basements 30% and in shafts 40%.
• Heat loss from calculated lengths compared between the different thicknesses ofthermal pipe insulation was more or less the same in buildings with different EPCclasses and the actual value itself was more or less the same, which enables ourequations to be used in all EPC classes of buildings.
Our study gives an alternative method for calculating heat losses from DHW systemsin apartment buildings.
Author Contributions: A.H. carried out analyses of the measured data for the thesis. T.K. helpedto develop the research principles of the study with the main author. A.M. helped build up thecalibration model and T.-M.P. helped with equations. All authors have read and agreed to thepublished version of the manuscript.
Funding: This research was supported by the Estonian Centre of Excellence in Zero Energy andResource Efficient Smart Buildings and Districts, ZEBE, grant TK146, funded by the EuropeanRegional Development Fund, by the personal research funding grant PRG483, Moisture Safety ofInterior Insulation, Constructional Moisture and Thermally Efficient Building Envelope, and FinestTwins (grant No. 856602).
Acknowledgments: Authors would also like to thank Fund Kredex for cooperation and financialsupport for our previous research work.
Conflicts of Interest: No potential conflict of interest was reported by the authors.
References1. Bøhm, B.; Danig, P. Monitoring the energy consumption in a district heated apartment building in Copenhagen, with specific
interest in the thermodynamic performance. Energy Build. 2004, 36, 229–236. [CrossRef]2. Bøhm, B. Production and distribution of domestic hot water in selected Danish apartment buildings and institutions. Analysis of
consumption, energy efficiency and the significance for energy design requirements of buildings. Energy Convers. Manag. 2013,67, 152–159. [CrossRef]
3. Gassel, A. Beiträge zur Berechnung Solarthermischer und Exergieeffizienter Energiesysteme. Ph.D. Thesis, TU Dresden, Dresden,Germany, 1999.

Energies 2021, 14, 6446 18 of 19
4. Horváth, M.; Hrabovszky-Horvath, S.; Csoknyai, T. Parametric analysis of solar hot water production in “commi-block” buildings.In Proceedings of the 5th International Youth Conference on Energy (IYCE), Pisa, Italy, 27–30 May 2015; Institute of Electrical andElectronics Engineers (IEEE): Piscataway, NJ, USA, 2015; pp. 1–5.
5. Zhang, Y.; Bonneville, C.; Wilson, S.; Maroney, M.; Staller, J.; Yun Wei, J. Using Energy Flow Analysis to Assess Energy Savingsfrom Recirculation Controls in Multi-Family Central Domestic Hot Water System. ASHRAE Trans. 2012, 118, 357–366.
6. Marszal-Pomianowska, A.; Zhang, C.; Pomianowski, M.; Heiselberg, P.; Gram-Hanssen, K.; Hansen, A.R. Simple methodology toestimate the mean hourly and the daily profiles of domestic hot water demand from hourly total heating readings. Energy Build.2019, 184, 53–64. [CrossRef]
7. Huhn, R.; Davids, A. Savings potential: Decrease of the circulation losses in centralized drinking water heating systemsEinsparpotenziale: Senkung der Zirkulationsverluste in Zentralen Trinkwassererwärmungsanlagen. Euroheat Power/FernwarmeInt. 2008, 37, 38–39.
8. Kitzberger, T.; Kilian, D.; Kotik, J.; Pröll, T. Comprehensive analysis of the performance and intrinsic energy losses of centralizedDomestic Hot Water (DHW) systems in commercial (educational) buildings. Energy Build. 2019, 195, 126–138. [CrossRef]
9. Mühlbacher, H.; Carter, J. Warmwasserbereitung-Vergleich Zentraler und Dezentraler Warmwasserversorgung; Forschungsstelle fürEnergiewirtschaft eV (FfE): München, Germany, 2002.
10. Cholewa, T.; Siuta-Olcha, A.; Anasiewicz, R. On the possibilities to increase energy efficiency of domestic hot water preparationsystems in existing buildings—Long term field research. J. Clean. Prod. 2019, 217, 194–203. [CrossRef]
11. Adam, M.; Walter, D.; Backes, K.; Steinweg, J. Classification of hydraulic designs and hardware-in-the-loop-tests of solarassisted heating systems for multi-family houses. In Proceedings of the 2016 International Energy and Sustainability Conference(IESC), Cologne, Germany, 30 June–1 July 2016; Institute of Electrical and Electronics Engineers (IEEE): Piscataway, NJ, USA,2016; pp. 1–6.
12. Ahmed, K.; Pylsy, P.; Kurnitski, J. Hourly consumption profiles of domestic hot water for different occupant groups in dwellings.Sol. Energy 2016, 137, 516–530. [CrossRef]
13. Navalón, P.S. Evaluation of Heat Losses from a Domestic Hot Water Circulation System. Ph.D. Thesis, University of Gävle, Gävle,Sweden, 2015.
14. Brand, M. Heating and Domestic Hot Water Systems in Buildings Supplied by Low-Temperature District Heating. Ph.D. Thesis,Technical University of Denmark, Copenhagen, Denmark, 2013.
15. Grasmanis, D.; Talcis, N.; Grek, is, A. Heat Consumption assessment of the domestic hot water systems in the apartment buildings.In Proceedings of the REHVA Annual Conference 2015 “Advanced HVAC and Natural Gas Technologies”, Riga, Latvia, 6–9 May2015; RTU Press, Riga Technical University Press: Riga, Latvia, 2015; pp. 167–176.
16. Rocheron, C. Domestic Hot Water—An Energy Approach Application of Heat Pumps for Residential Apartment Buildings.Master’s Thesis, Chalmers University of Technology, Gothenburg, Sweden, 2012.
17. Hamburg, A.; Kalamees, T. The Influence of Energy Renovation on the Change of Indoor Temperature and Energy Use. Energies2018, 11, 3179. [CrossRef]
18. Hamburg, A.; Kalamees, T. Improving the Indoor Climate and Energy Saving in Renovated Apartment Buildings in Estonia. InProceedings of the Cold Climate HVAC Conference, Kiruna, Sweden, 12–15 March 2018; Springer Science and Business MediaLLC: Berlin/Heidelberg, Germany, 2018; pp. 243–251.
19. Hamburg, A.; Kalamees, T. How well are energy performance objectives being achieved in renovated apartment buildings inEstonia? Energy Build. 2019, 199, 332–341. [CrossRef]
20. Raide, I.; Kalamees, T.; Mauring, T. Lessons learnt from the first public buildings in Estonia intended to be passive houses. Proc.Estonian Acad. Sci. 2015, 64, 157. [CrossRef]
21. Arumägi, E.; Kalamees, T. Design of the first net zero energy buildings in Estonia. Sci. Technol. Built Environ. 2016, 22,1039–1049. [CrossRef]
22. Attia, S.G.; de Herde, A. Early design simulation tools for net zero energy buildings: A comparison of ten tools. In Proceedings ofthe 12th International Building Performance Simulation Association, Sydney, Australia, 14–16 November 2011.
23. European Standards. EN 15316-3. Energy Performance of Buildings—Method for Calculation of System Energy Requirements andSystem Efficiencies—Part 3: Space Distribution Systems (DHW, Heating and Cooling), Module M3-6, M4-6, M8-6; European Standards:Brussels, Belgium, 2017.
24. Kuusk, K.; Kalamees, T. nZEB Retrofit of a Concrete Large Panel Apartment Building. Energy Procedia 2015, 78, 985–990. [CrossRef]25. Journal of Physics: Conference Series; IOPscience: Bristol, UK, 2013; Volume 132, pp. 1006–1011. [CrossRef]26. Majandus-ja Kommunikatsiooniministeerium. Estonian Registry of Buildings Database. 2021. Available online: www.ehr.ee
(accessed on 2 September 2021).27. Davison, A.C.; Hinkley, D.V. Bootstrap Methods and Their Application; Cambridge University Press: Cambridge, UK, 1997.28. Shalin, P. Modelling and Simulation Methods for Modular Continuous System in Buildings; KTH: Stockholm, Sweden, 1996.29. Björsell, N.; Bring, A.; Eriksson, L.; Grozman, P.; Lindgren, M.; Sahlin, P.; Shapovalov, A. IDA indoor climate and energy. In
Proceedings of the IBPSA Building Simulation 99 Conference, Kyoto, Japan, 13–15 September 1999; pp. 1–8.30. ISO. ISO/DIS 12241 Thermal Insulation for Building Equipment and Industrial Installations—Calculation Rules; ISO: Geneva, Switzer-
land, 2008.

Energies 2021, 14, 6446 19 of 19
31. Hamburg, A.; Kalamees, T. The influence of heat loss from pipes in an unheated basement on the heating energy consumption ofan entire typical apartment building. E3S Web Conf. 2020, 172, 12005. [CrossRef]
32. Ympäristöministeriö, Energiatehokkuus, Rakennuksen energiankulutuksen ja lämmitystehontarpeen laskenta, (Ministry of theEnvironment, Energy efficiency, Calculation of building energy consumption and heating power demand), Regulation, Helsinki,Finland. 2018.
33. 7 RT I, 19.01.2018. MKM määrus nr. 58, Hoonete energiatõhususe arvutamise metoodika (Minister of Economic Affairs andCommunications regulation nr. 58, Methodology for calculating the energy performance of buildings). 2018.
34. Himpe, E.; Rebollar, J.V.; Janssens, A. Heat losses in collective heat distribution systems: Comparing simplified calculationmethods with dynamic simulations. In Proceedings of the 13th International Conference of the International Building PerformanceSimulation Association (Building Simulation 2013), Chambéry, France, 26–28 August 2013; International Building PerformanceSimulation Association (IBPSA): Chambery, France, 2013; pp. 3432–3439.