Health-related quality of life in a binational population with diabetes at the Texas-Mexico border
10
154 Rev Panam Salud Publica/Pan Am J Public Health 23(3), 2008 Health-related quality of life in a binational population with diabetes at the Texas-Mexico border Nelda Mier, 1 Anabel Bocanegra-Alonso, 2 Dongling Zhan, 3 Miguel A. Zuniga, 1 and Rosa I. Acosta 2 Objectives. To examine physical and mental health domains of health-related quality of life (HRQL) in a binational adult population with type 2 diabetes at the Texas-Mexico border, and to explore individual and social correlates to physical and mental health status. Methods. Adults 18 years and older with type 2 diabetes residing in the South Texas Lower Rio Grande Valley and in Reynosa, Tamaulipas, Mexico, were recruited using a convenience sampling technique and interviewed face-to-face with a structured survey. HRQL was mea- sured using physical and mental health summary components of the Medical Outcomes Study Short Form. HRQL correlates included demographic characteristics, health factors, access to healthcare, and family support. Samples characteristics were compared using the Student’s t- test or Mann-Whitney U test. Associations between dependent and independent variables were examined using unadjusted and adjusted (multiple variable) logistic regression models. Results. There were no significant differences between Valley and Reynosa respondents in physical or mental health status scores. Valley participants with lower socioeconomic status and those perceiving their supportive relative’s level of diabetes-related knowledge as “low” were more likely to report worse physical health than those lacking those characteristics. In the Reynosa group, lower physical health status was associated with duration of diabetes and in- sulin use. Both sample populations with clinical depressive symptoms were more likely to have worse physical and mental health than those without such symptoms. Conclusions. HRQL is an important outcome in monitoring health status. Understanding the levels and influences of HRQL in U.S.-Mexico border residents with diabetes may help im- prove diabetes management programs. Quality of life; diabetes mellitus, type 2; risk factors; border health; Mexican Americans; Texas; Mexico; United States. ABSTRACT Diabetes is a major public health issue on the U.S.-Mexico border. The diabetes death rate for Hispanics liv- ing in U.S. counties along the border (46.7 age-adjusted per 100,000 popula- tion) is almost three times the rate for non-Hispanic whites along the border (16.3 age-adjusted per 100,000 popula- tion) (1), while the overall prevalence Key words Investigación original / Original research Mier N, Bocanegra-Alonso A, Zhan D, Zuniga MA, Acosta RI. Health-related quality of life in a bi- national population with diabetes at the Texas-Mexico border. Rev Panam Salud Publica. 2008; 23(3):154–63. Suggested citation 1 South Texas Center, School of Rural Public Health, Texas A&M Health Science Center, McAllen, Texas, United States of America. Send correspon- dence and reprint requests to: Nelda Mier, South Texas Center, School of Rural Public Health, Texas A&M Health Science Center, 2101 South McColl Rd, Room 134, McAllen, TX 78503, United States of America; telephone: (956) 668-6326; fax: (956) 668- 6302; email: [email protected] 2 Unidad Académica Multidisciplinaria Reynosa- Aztlán, Universidad Autónoma de Tamaulipas, Reynosa, Tamaulipas, Mexico. 3 Department of Statistics, Texas A&M University, College Station, Texas, United States of America.
-
Upload
independent -
Category
Documents
-
view
1 -
download
0
Transcript of Health-related quality of life in a binational population with diabetes at the Texas-Mexico border
154 Rev Panam Salud Publica/Pan Am J Public Health 23(3), 2008
Health-related quality of life in a binationalpopulation with diabetes at the Texas-Mexico border
Nelda Mier,1 Anabel Bocanegra-Alonso,2 Dongling Zhan,3
Miguel A. Zuniga,1 and Rosa I. Acosta2
Objectives. To examine physical and mental health domains of health-related quality of life(HRQL) in a binational adult population with type 2 diabetes at the Texas-Mexico border, andto explore individual and social correlates to physical and mental health status.Methods. Adults 18 years and older with type 2 diabetes residing in the South Texas LowerRio Grande Valley and in Reynosa, Tamaulipas, Mexico, were recruited using a conveniencesampling technique and interviewed face-to-face with a structured survey. HRQL was mea-sured using physical and mental health summary components of the Medical Outcomes StudyShort Form. HRQL correlates included demographic characteristics, health factors, access tohealthcare, and family support. Samples characteristics were compared using the Student’s t-test or Mann-Whitney U test. Associations between dependent and independent variableswere examined using unadjusted and adjusted (multiple variable) logistic regression models. Results. There were no significant differences between Valley and Reynosa respondents inphysical or mental health status scores. Valley participants with lower socioeconomic statusand those perceiving their supportive relative’s level of diabetes-related knowledge as “low”were more likely to report worse physical health than those lacking those characteristics. In theReynosa group, lower physical health status was associated with duration of diabetes and in-sulin use. Both sample populations with clinical depressive symptoms were more likely to haveworse physical and mental health than those without such symptoms. Conclusions. HRQL is an important outcome in monitoring health status. Understandingthe levels and influences of HRQL in U.S.-Mexico border residents with diabetes may help im-prove diabetes management programs.
Quality of life; diabetes mellitus, type 2; risk factors; border health; MexicanAmericans; Texas; Mexico; United States.
ABSTRACT
Diabetes is a major public healthissue on the U.S.-Mexico border. The
diabetes death rate for Hispanics liv-ing in U.S. counties along the border(46.7 age-adjusted per 100,000 popula-tion) is almost three times the rate fornon-Hispanic whites along the border(16.3 age-adjusted per 100,000 popula-tion) (1), while the overall prevalence
Key words
Investigación original / Original research
Mier N, Bocanegra-Alonso A, Zhan D, Zuniga MA, Acosta RI. Health-related quality of life in a bi-national population with diabetes at the Texas-Mexico border. Rev Panam Salud Publica. 2008;23(3):154–63.
Suggested citation
1 South Texas Center, School of Rural Public Health,Texas A&M Health Science Center, McAllen,Texas, United States of America. Send correspon-dence and reprint requests to: Nelda Mier, SouthTexas Center, School of Rural Public Health, TexasA&M Health Science Center, 2101 South McCollRd, Room 134, McAllen, TX 78503, United States ofAmerica; telephone: (956) 668-6326; fax: (956) 668-6302; email: [email protected]
2 Unidad Académica Multidisciplinaria Reynosa-Aztlán, Universidad Autónoma de Tamaulipas,Reynosa, Tamaulipas, Mexico.
3 Department of Statistics, Texas A&M University,College Station, Texas, United States of America.
rate among U.S.-Mexico border resi-dents from all ethnic groups is almosttwice the level of the general U.S. pop-ulation (15.7% vs. 9.6%, respectively)(2–4). One study found that diabeteshospital discharge rates are higheramong Hispanics living in bordercounties than among non-Hispanicwhites along the border and Hispanicsin non-border U.S. counties (5). On theMexican side of the border, diabetes isthe third leading cause of death, andthe prevalence rate (15.1%) is higherthan other regions in Mexico (4, 6).
Diabetes is a chronic disease withhigh economic costs for both the U.S.and Mexico healthcare systems andcommunities (6, 7) and affects pa-tients’ health-related quality of life(HRQL). HRQL has emerged as an im-portant outcome in monitoring thehealth status of a population as well asin assessing disease burden and effec-tiveness of health interventions (8).HRQL is related to an individual’scapacity to function to the highest de-gree possible physically, psychologi-cally, emotionally, and socially (9),and represents the effect of a diseasesubjectively on an individual (10). Ac-cording to the conceptual frameworkdeveloped by Wilson and Cleary(1995) (11), HRQL is influenced by bi-ological, social, and environmentalfactors. Research with non-Hispanicwhites shows that type 2 diabetes isassociated with a reduced HRQL (2,12, 13). Studies also indicate that fac-tors correlating with HRQL includediabetes-related complications (12, 14)and diabetes-related risk factors suchas heart failure, depression, high med-ication intake (12), low socioeconomicstatus, older age, female gender, andlack of health insurance (14).
Although the U.S-Mexico borderpopulation suffers a disproportionateburden of diabetes compared to thegeneral population in the UnitedStates and Mexico, there is a paucity ofstudies examining HRQL in borderresidents with type 2 diabetes. HealthyBorder 2010, an agenda adopted by theU.S.-Mexico Border Health Commis-sion for improving the health of bor-der residents, identifies diabetes asone of 11 priority areas on the bilateral
health agenda aiming at reducing boththe diabetes mortality and hospitaliza-tion rate (15). Understanding the levelsand influences of HRQL in personswith diabetes may be helpful in in-creasing the success of diabetes man-agement programs. Therefore, thisstudy aimed to: (1) examine the differ-ences in the physical and mental do-mains of HRQL in a binational adultpopulation with type 2 diabetes at theTexas-Mexico border; and (2) exploreindividual and social correlates tophysical and mental health status foreach population. Correlates of HRQLin this study included demographiccharacteristics, health factors, access tohealthcare, and family support.
MATERIALS AND METHODS
Subjects and sampling
This was a cross-sectional studybased on a survey conducted in2004–2005 in the South Texas LowerRio Grande Valley (“Valley”) and inReynosa, Tamaulipas, Mexico. Usinga convenience sampling technique,the study recruited participants onboth sides of the border from clinicalsettings (hospitals and physician of-fices). Eligibility criteria included:being 18 years of age and older; hav-ing been diagnosed with type 2 dia-betes for at least one year; and will-ingness to give informed consent.Physicians and nurses at the recruit-ment sites identified patients withtype 2 diabetes and referred them tothe researchers. Graduate studentsfrom health-related programs on bothsides of the border were trained toconduct the interviews. Participantswere interviewed in either English orSpanish. On the U.S. side, the inter-viewers were bilingual. A total of 199individuals in the Valley and 200 inReynosa agreed to participate in thestudy. The final sample size was 399respondents. Participants signed in-formed consent forms and received abox of dietetic sugar for participatingin the study. This study was approvedby the Texas A&M University Institu-tional Review Board.
Measures
The dependent variable, HRQL, wasassessed using the Medical OutcomesStudy Short Form (SF-8™) instrument.The SF-8™ health survey is an 8-itemsurvey that provides a health profileconsisting of two summary compo-nents: physical component summary(PCS) and mental component sum-mary (MCS) (16). Although both sum-mary components are continuous vari-ables (as measured by the SF-8™), adifferent calculation was used undertwo global categories. To examinevariables in a logistic fashion, PCS andMCS were divided by the median, cre-ating the categories: “PCS Lower vs.Higher score” and “MCS Lower vs.Higher score.” The median was usedto create these global categories be-cause the PCS and MCS scales werenot normally distributed. In studieswith skewed distributions, use of themedian rather than the mean has beenfound to be more accurate in repre-senting the majority of cases (17, 18).The medians for the PCS and MCSwere 42.36 and 46.65, respectively. Themedian was calculated for all partici-pants because there were no signifi-cant median differences between thetwo groups included in the study.
Independent variables examined inthe study included demographic andhealth factors, access to healthcare,and family support. Demographicvariables included gender, age (meanand standard deviation; various agegroups), marital status (“not married”vs. “married”), education level (“lessthan high school” vs. “high school or more”), and socioeconomic status(“low” vs. “high”). Socioeconomiclevel was assessed by asking partici-pants about their employment status,an indicator of socioeconomic position(19, 20). Household income was not in-cluded due to missing values.
Health factors were based on self-re-ported information and included: BodyMass Index (BMI); age when diagnosedwith diabetes (mean and standard devi-ation); duration with diabetes (“lessthan 10 years” vs. “10 years or more”);high blood pressure (“yes” vs. “no”);heart disease (“yes” vs. “no”); high cho-
Rev Panam Salud Publica/Pan Am J Public Health 23(3), 2008 155
Mier et al. • Quality of life and diabetes at the Texas-Mexico border Original research
lesterol (“yes” vs. “no”); insulin use(“yes” vs. “no”); amputations (“yes” vs.“no”); smoking (“yes” vs. “no”); and de-pressive symptoms (“clinical” vs. “non-clinical”). BMI was calculated fromstudy participants’ self-reported heightsand weights. BMI was expressed asweight (in kilograms) divided by thesquare of height (in meters) and catego-rized according to the parameters of theCenters for Disease Control and Preven-tion (CDC) (21): “normal” (18.5–24.9kg/m2), “overweight” (25–29.9 kg/m2),“obesity” (30–34.9 kg/m2), and “severeobesity” (35 kg/m2 and higher). Depres-sive symptoms were measured usingthe English and Spanish versions of the20-item Center for EpidemiologicalStudies Depression Scale (CES-D). Thereliability and validity of the scale havebeen tested in general and clinical pop-ulations, yielding very good internalconsistency, with an alpha of 0.85 for thegeneral population and 0.90 for a psy-chiatric (clinical) population. Scores of16 and above indicate clinical depres-sive symptoms (22, 23).
Access-to-healthcare variables in-cluded number of doctor visits, emer-gency room (ER) visits, and hospitalstays, as well as diet counseling and di-abetes education sessions over the past12 months (“never” vs. “one or moretimes”). “Glucose level check” was mea-sured using the question, “How manytimes, on average, do you check yourblood sugar per week”? As a majority of Reynosa respondents did not checktheir glucose level daily or weekly, the following categories were createdfor the purpose of analysis: “never,”“monthly,” “weekly,” and “daily.”
Family support was measured usingthe Diabetes Family Behavior Check-list (DFBC), which assesses the actionsof the relative identified by partici-pants as the person most supportive of their efforts to manage their dia-betes. DFBC items include the sup-portive relative’s behaviors related tomedication, glucose testing, exercise,diet, and “in general.” A positive sum-mary score (“high” vs. “low” familysupport) was obtained by averag-ing the frequency ratings over all fivesupportive behaviors. The reliabilityand predictive validity of this scale is
between 0.64 and 0.84. The DFBC also asks the participant to rate thediabetes-related knowledge level ofthe supportive relative (“low” vs.“moderate” vs. “high”) (24).
Statistical analyses
Summary statistics were calculated to describe the population in terms of sociodemographic status, HRQL, and other variables. These statisticsincluded means, standard deviations,and/or percentages, as appropriate.Study participant demographic, health,healthcare access, and family supportcharacteristics were compared using theStudent’s t-test or Mann-Whitney Utest. Associations between dependentand independent variables were exam-ined using unadjusted and adjusted
(multiple variable) logistic regressionmodels. The cross-tabulation methodand Pearson chi-square test were usedto analyze associations in univariateanalysis to derive the percentage of eachindependent variable significant to PCSand MCS. Multivariate analyses werereported using odds ratios (OR), 95%confidence intervals (CI), and p values.A p value of <0.05 was considered sig-nificant for all statistical tests con-ducted. The analyses were performedusing the Statistical Package for the So-cial Sciences (SPSS version 13.0 for Win-dows; SPSS Inc., Chicago, IL, USA) (25).
RESULTS
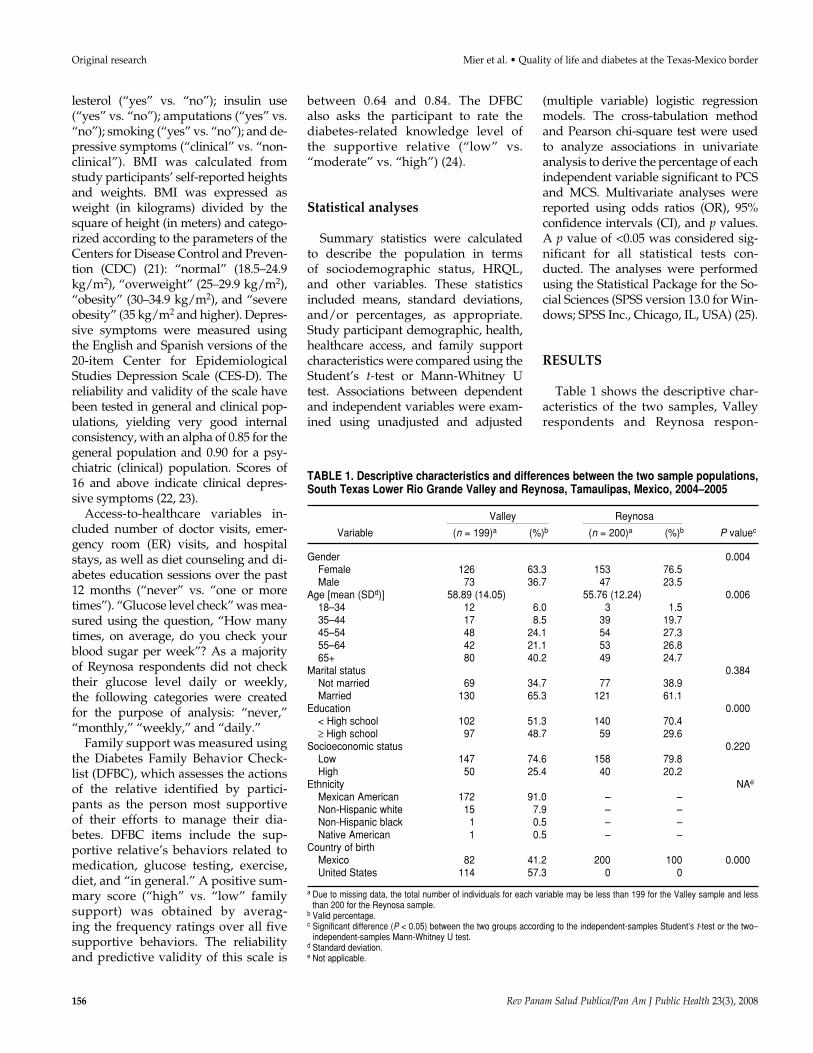
Table 1 shows the descriptive char-acteristics of the two samples, Valleyrespondents and Reynosa respon-
156 Rev Panam Salud Publica/Pan Am J Public Health 23(3), 2008
Original research Mier et al. • Quality of life and diabetes at the Texas-Mexico border
TABLE 1. Descriptive characteristics and differences between the two sample populations,South Texas Lower Rio Grande Valley and Reynosa, Tamaulipas, Mexico, 2004–2005
Valley Reynosa
Variable (n = 199)a (%)b (n = 200)a (%)b P valuec
Gender 0.004Female 126 63.3 153 76.5Male 73 36.7 47 23.5
Age [mean (SDd)] 58.89 (14.05) 55.76 (12.24) 0.00618–34 12 6.0 3 1.535–44 17 8.5 39 19.745–54 48 24.1 54 27.355–64 42 21.1 53 26.865+ 80 40.2 49 24.7
Marital status 0.384Not married 69 34.7 77 38.9Married 130 65.3 121 61.1
Education 0.000< High school 102 51.3 140 70.4≥ High school 97 48.7 59 29.6
Socioeconomic status 0.220Low 147 74.6 158 79.8High 50 25.4 40 20.2
Ethnicity NAe
Mexican American 172 91.0 – –Non-Hispanic white 15 7.9 – –Non-Hispanic black 1 0.5 – –Native American 1 0.5 – –
Country of birthMexico 82 41.2 200 100 0.000United States 114 57.3 0 0
a Due to missing data, the total number of individuals for each variable may be less than 199 for the Valley sample and lessthan 200 for the Reynosa sample.
b Valid percentage. c Significant difference (P < 0.05) between the two groups according to the independent-samples Student’s t-test or the two–
independent-samples Mann-Whitney U test. d Standard deviation.e Not applicable.
dents. Significant differences betweensamples were found for gender, age,and education.
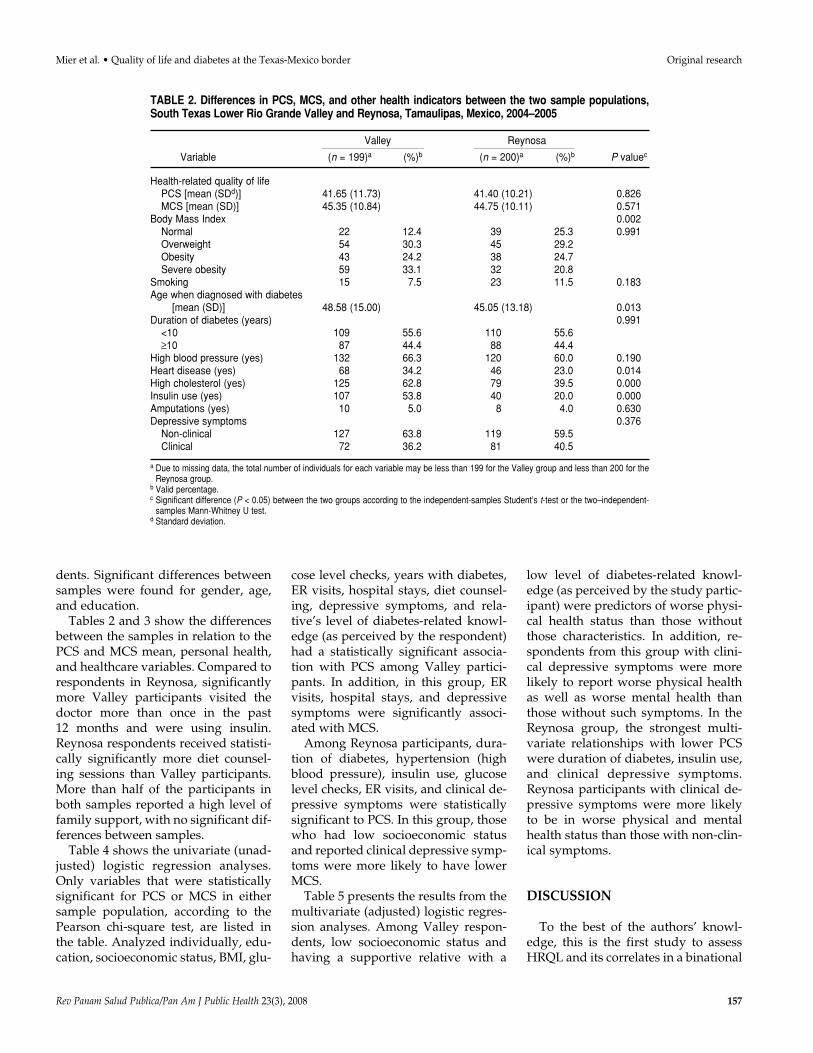
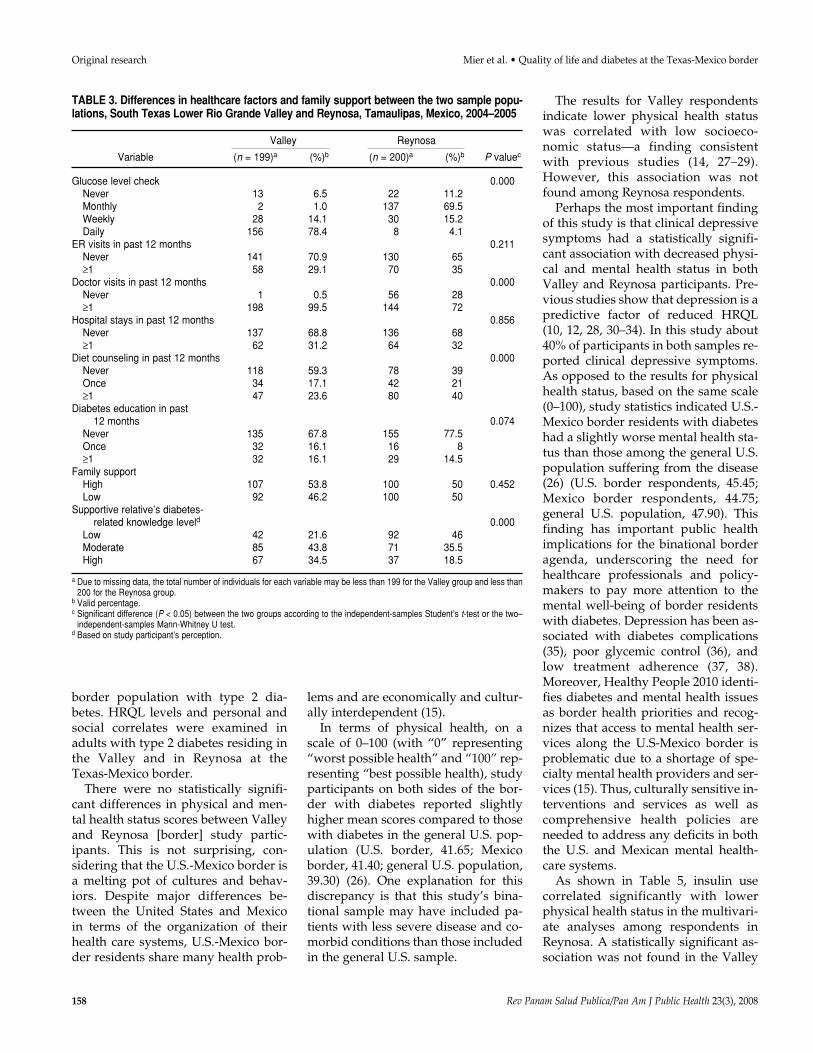
Tables 2 and 3 show the differencesbetween the samples in relation to thePCS and MCS mean, personal health,and healthcare variables. Compared torespondents in Reynosa, significantlymore Valley participants visited thedoctor more than once in the past 12 months and were using insulin.Reynosa respondents received statisti-cally significantly more diet counsel-ing sessions than Valley participants.More than half of the participants inboth samples reported a high level offamily support, with no significant dif-ferences between samples.
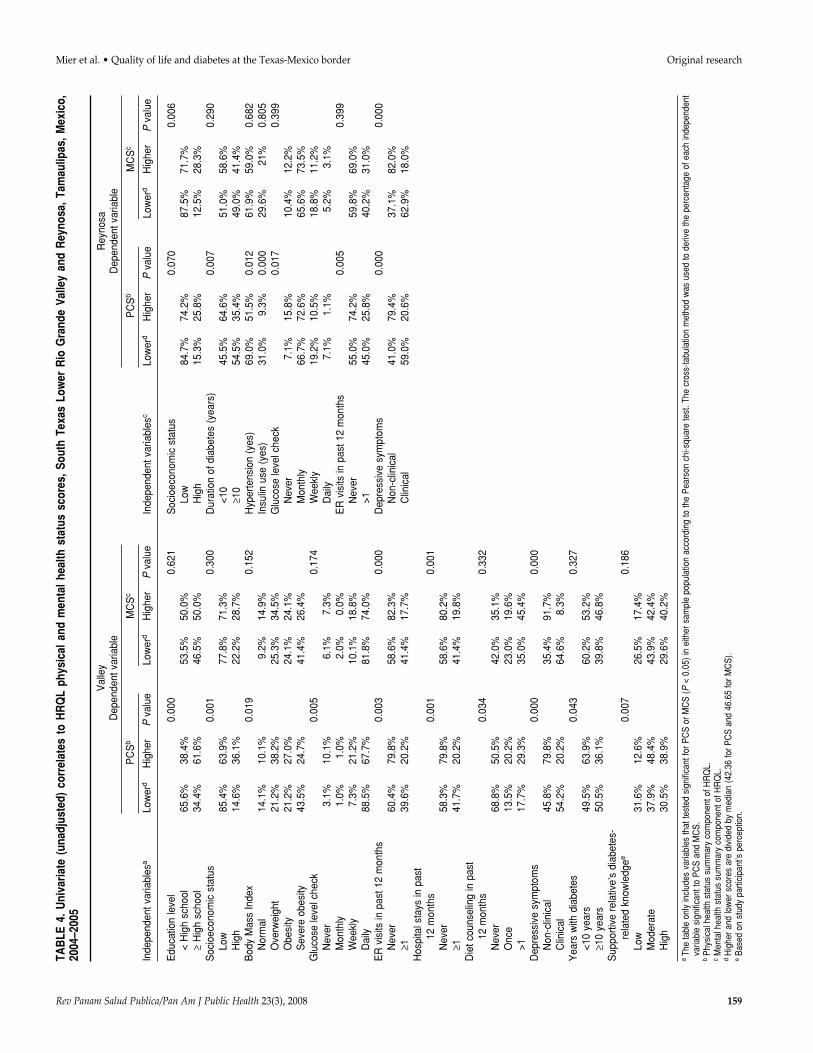
Table 4 shows the univariate (unad-justed) logistic regression analyses.Only variables that were statisticallysignificant for PCS or MCS in eithersample population, according to thePearson chi-square test, are listed inthe table. Analyzed individually, edu-cation, socioeconomic status, BMI, glu-
cose level checks, years with diabetes,ER visits, hospital stays, diet counsel-ing, depressive symptoms, and rela-tive’s level of diabetes-related knowl-edge (as perceived by the respondent)had a statistically significant associa-tion with PCS among Valley partici-pants. In addition, in this group, ERvisits, hospital stays, and depressivesymptoms were significantly associ-ated with MCS.
Among Reynosa participants, dura-tion of diabetes, hypertension (highblood pressure), insulin use, glucoselevel checks, ER visits, and clinical de-pressive symptoms were statisticallysignificant to PCS. In this group, thosewho had low socioeconomic statusand reported clinical depressive symp-toms were more likely to have lowerMCS.
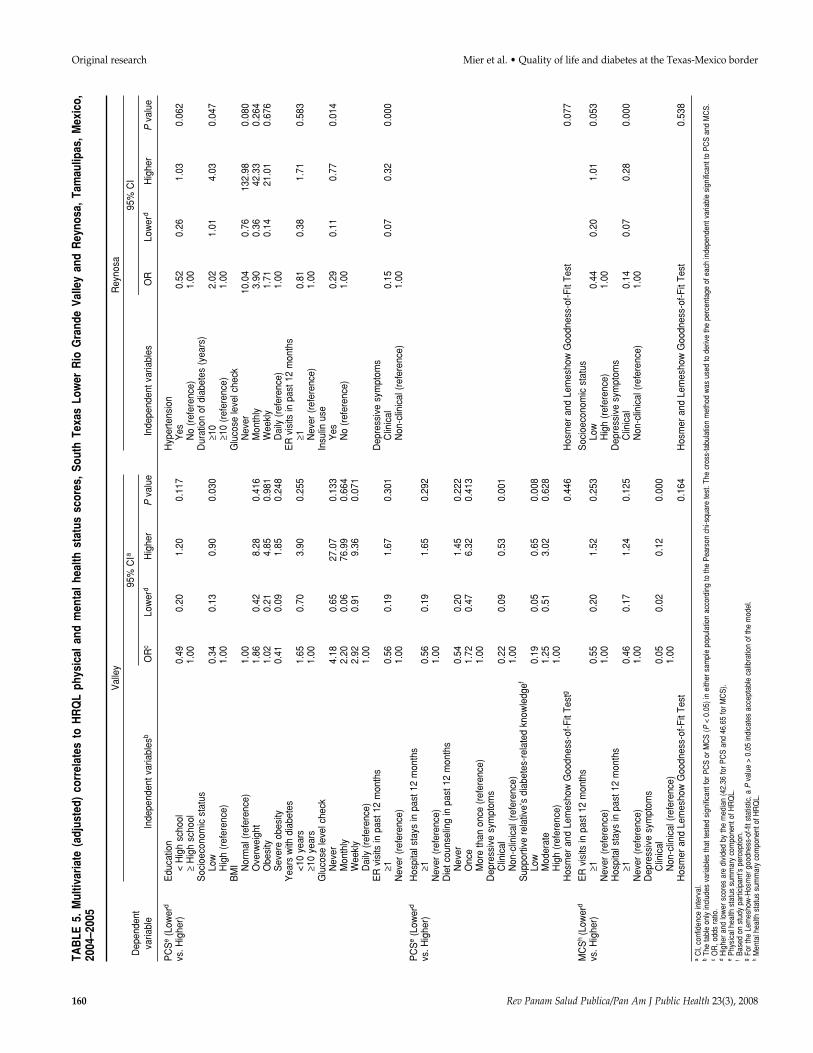
Table 5 presents the results from themultivariate (adjusted) logistic regres-sion analyses. Among Valley respon-dents, low socioeconomic status andhaving a supportive relative with a
low level of diabetes-related knowl-edge (as perceived by the study partic-ipant) were predictors of worse physi-cal health status than those withoutthose characteristics. In addition, re-spondents from this group with clini-cal depressive symptoms were morelikely to report worse physical healthas well as worse mental health thanthose without such symptoms. In theReynosa group, the strongest multi-variate relationships with lower PCSwere duration of diabetes, insulin use,and clinical depressive symptoms.Reynosa participants with clinical de-pressive symptoms were more likelyto be in worse physical and mentalhealth status than those with non-clin-ical symptoms.
DISCUSSION
To the best of the authors’ knowl-edge, this is the first study to assessHRQL and its correlates in a binational
Rev Panam Salud Publica/Pan Am J Public Health 23(3), 2008 157
Mier et al. • Quality of life and diabetes at the Texas-Mexico border Original research
TABLE 2. Differences in PCS, MCS, and other health indicators between the two sample populations,South Texas Lower Rio Grande Valley and Reynosa, Tamaulipas, Mexico, 2004–2005
Valley Reynosa
Variable (n = 199)a (%)b (n = 200)a (%)b P valuec
Health-related quality of lifePCS [mean (SDd)] 41.65 (11.73) 41.40 (10.21) 0.826MCS [mean (SD)] 45.35 (10.84) 44.75 (10.11) 0.571
Body Mass Index 0.002Normal 22 12.4 39 25.3 0.991Overweight 54 30.3 45 29.2Obesity 43 24.2 38 24.7Severe obesity 59 33.1 32 20.8
Smoking 15 7.5 23 11.5 0.183Age when diagnosed with diabetes
[mean (SD)] 48.58 (15.00) 45.05 (13.18) 0.013Duration of diabetes (years) 0.991
<10 109 55.6 110 55.6≥10 87 44.4 88 44.4
High blood pressure (yes) 132 66.3 120 60.0 0.190Heart disease (yes) 68 34.2 46 23.0 0.014High cholesterol (yes) 125 62.8 79 39.5 0.000Insulin use (yes) 107 53.8 40 20.0 0.000Amputations (yes) 10 5.0 8 4.0 0.630Depressive symptoms 0.376
Non-clinical 127 63.8 119 59.5Clinical 72 36.2 81 40.5
a Due to missing data, the total number of individuals for each variable may be less than 199 for the Valley group and less than 200 for theReynosa group.
b Valid percentage. c Significant difference (P < 0.05) between the two groups according to the independent-samples Student’s t-test or the two–independent-
samples Mann-Whitney U test. d Standard deviation.
border population with type 2 dia-betes. HRQL levels and personal andsocial correlates were examined inadults with type 2 diabetes residing inthe Valley and in Reynosa at theTexas-Mexico border.
There were no statistically signifi-cant differences in physical and men-tal health status scores between Valleyand Reynosa [border] study partic-ipants. This is not surprising, con-sidering that the U.S.-Mexico border isa melting pot of cultures and behav-iors. Despite major differences be-tween the United States and Mexico in terms of the organization of theirhealth care systems, U.S.-Mexico bor-der residents share many health prob-
lems and are economically and cultur-ally interdependent (15).
In terms of physical health, on ascale of 0–100 (with “0” representing“worst possible health” and “100” rep-resenting “best possible health), studyparticipants on both sides of the bor-der with diabetes reported slightlyhigher mean scores compared to thosewith diabetes in the general U.S. pop-ulation (U.S. border, 41.65; Mexicoborder, 41.40; general U.S. population,39.30) (26). One explanation for thisdiscrepancy is that this study’s bina-tional sample may have included pa-tients with less severe disease and co-morbid conditions than those includedin the general U.S. sample.
The results for Valley respondentsindicate lower physical health statuswas correlated with low socioeco-nomic status—a finding consistentwith previous studies (14, 27–29).However, this association was notfound among Reynosa respondents.
Perhaps the most important findingof this study is that clinical depressivesymptoms had a statistically signifi-cant association with decreased physi-cal and mental health status in bothValley and Reynosa participants. Pre-vious studies show that depression is apredictive factor of reduced HRQL(10, 12, 28, 30–34). In this study about40% of participants in both samples re-ported clinical depressive symptoms.As opposed to the results for physicalhealth status, based on the same scale(0–100), study statistics indicated U.S.-Mexico border residents with diabeteshad a slightly worse mental health sta-tus than those among the general U.S.population suffering from the disease(26) (U.S. border respondents, 45.45;Mexico border respondents, 44.75;general U.S. population, 47.90). Thisfinding has important public healthimplications for the binational borderagenda, underscoring the need forhealthcare professionals and policy-makers to pay more attention to themental well-being of border residentswith diabetes. Depression has been as-sociated with diabetes complications(35), poor glycemic control (36), andlow treatment adherence (37, 38).Moreover, Healthy People 2010 identi-fies diabetes and mental health issuesas border health priorities and recog-nizes that access to mental health ser-vices along the U.S-Mexico border isproblematic due to a shortage of spe-cialty mental health providers and ser-vices (15). Thus, culturally sensitive in-terventions and services as well ascomprehensive health policies areneeded to address any deficits in boththe U.S. and Mexican mental health-care systems.
As shown in Table 5, insulin usecorrelated significantly with lowerphysical health status in the multivari-ate analyses among respondents inReynosa. A statistically significant as-sociation was not found in the Valley
158 Rev Panam Salud Publica/Pan Am J Public Health 23(3), 2008
Original research Mier et al. • Quality of life and diabetes at the Texas-Mexico border
TABLE 3. Differences in healthcare factors and family support between the two sample popu-lations, South Texas Lower Rio Grande Valley and Reynosa, Tamaulipas, Mexico, 2004–2005
Valley Reynosa
Variable (n = 199)a (%)b (n = 200)a (%)b P valuec
Glucose level check 0.000Never 13 6.5 22 11.2Monthly 2 1.0 137 69.5Weekly 28 14.1 30 15.2Daily 156 78.4 8 4.1
ER visits in past 12 months 0.211Never 141 70.9 130 65≥1 58 29.1 70 35
Doctor visits in past 12 months 0.000Never 1 0.5 56 28≥1 198 99.5 144 72
Hospital stays in past 12 months 0.856Never 137 68.8 136 68≥1 62 31.2 64 32
Diet counseling in past 12 months 0.000Never 118 59.3 78 39Once 34 17.1 42 21≥1 47 23.6 80 40
Diabetes education in past 12 months 0.074
Never 135 67.8 155 77.5Once 32 16.1 16 8≥1 32 16.1 29 14.5
Family supportHigh 107 53.8 100 50 0.452Low 92 46.2 100 50
Supportive relative’s diabetes-related knowledge leveld 0.000
Low 42 21.6 92 46Moderate 85 43.8 71 35.5High 67 34.5 37 18.5
a Due to missing data, the total number of individuals for each variable may be less than 199 for the Valley group and less than200 for the Reynosa group.
b Valid percentage.c Significant difference (P < 0.05) between the two groups according to the independent-samples Student’s t-test or the two–
independent-samples Mann-Whitney U test. d Based on study participant’s perception.
Rev Panam Salud Publica/Pan Am J Public Health 23(3), 2008 159
Mier et al. • Quality of life and diabetes at the Texas-Mexico border Original researchTA
BLE
4. U
niva
riate
(un
adju
sted
) co
rrel
ates
to
HR
QL
phys
ical
and
men
tal h
ealth
sta
tus
scor
es, S
outh
Tex
as L
ower
Rio
Gra
nde
Valle
y an
d R
eyno
sa, T
amau
lipas
, Mex
ico,
2004
–200
5
Val
ley
Dep
ende
nt v
aria
ble
PC
Sb
MC
Sc
Inde
pend
ent v
aria
bles
aLo
wer
dH
ighe
rP
valu
eLo
wer
dH
ighe
rP
valu
e
Edu
catio
n le
vel
0.00
00.
621
< H
igh
scho
ol65
.6%
38.4
%53
.5%
50.0
%≥
Hig
h sc
hool
34.4
%61
.6%
46.5
%50
.0%
Soc
ioec
onom
ic s
tatu
s0.
001
0.30
0Lo
w85
.4%
63.9
%77
.8%
71.3
%H
igh
14.6
%36
.1%
22.2
%28
.7%
Bod
y M
ass
Inde
x0.
019
0.15
2N
orm
al14
.1%
10.1
%9.
2%14
.9%
Ove
rwei
ght
21.2
%38
.2%
25.3
%34
.5%
Obe
sity
21.2
%27
.0%
24.1
%24
.1%
Sev
ere
obes
ity43
.5%
24.7
%41
.4%
26.4
%G
luco
se le
vel c
heck
0.00
50.
174
Nev
er3.
1%10
.1%
6.1%
7.3%
Mon
thly
1.0%
1.0%
2.0%
0.0%
Wee
kly
7.3%
21.2
%10
.1%
18.8
%D
aily
88.5
%67
.7%
81.8
%74
.0%
ER
vis
its in
pas
t 12
mon
ths
0.00
30.
000
Nev
er60
.4%
79.8
%58
.6%
82.3
%≥1
39.6
%20
.2%
41.4
%17
.7%
Hos
pita
l sta
ys in
pas
t 12
mon
ths
0.00
10.
001
Nev
er58
.3%
79.8
%58
.6%
80.2
%≥1
41.7
%20
.2%
41.4
%19
.8%
Die
t cou
nsel
ing
in p
ast
12 m
onth
s0.
034
0.33
2N
ever
68.8
%50
.5%
42.0
%35
.1%
Onc
e13
.5%
20.2
%23
.0%
19.6
%>1
17.7
%29
.3%
35.0
%45
.4%
Dep
ress
ive
sym
ptom
s0.
000
0.00
0N
on-c
linic
al45
.8%
79.8
%35
.4%
91.7
%C
linic
al54
.2%
20.2
%64
.6%
8.3%
Yea
rs w
ith d
iabe
tes
0.04
30.
327
<10
year
s49
.5%
63.9
%60
.2%
53.2
%≥1
0 ye
ars
50.5
%36
.1%
39.8
%46
.8%
Sup
porti
ve r
elat
ive’
s di
abet
es-
rela
ted
know
ledg
ee0.
007
0.18
6Lo
w31
.6%
12.6
%26
.5%
17.4
%M
oder
ate
37.9
%48
.4%
43.9
%42
.4%
Hig
h30
.5%
38.9
%29
.6%
40.2
%
aTh
e ta
ble
only
incl
udes
var
iabl
es th
at te
sted
sig
nific
ant f
or P
CS
or M
CS
(P <
0.0
5) in
eith
er s
ampl
e po
pula
tion
acco
rdin
g to
the
Pea
rson
chi
-squ
are
test
. The
cro
ss-ta
bula
tion
met
hod
was
use
d to
der
ive
the
perc
enta
ge o
f eac
h in
depe
nden
tva
riabl
e si
gnifi
cant
to P
CS
and
MC
S.
bP
hysi
cal h
ealth
sta
tus
sum
mar
y co
mpo
nent
of H
RQ
L.c
Men
tal h
ealth
sta
tus
sum
mar
y co
mpo
nent
of H
RQ
L.d
Hig
her a
nd lo
wer
sco
res
are
divi
ded
by m
edia
n (4
2.36
for P
CS
and
46.
65 fo
r MC
S).
eB
ased
on
stud
y pa
rtici
pant
’s p
erce
ptio
n.
Rey
nosa
Dep
ende
nt v
aria
ble
PC
Sb
MC
Sc
Inde
pend
ent v
aria
bles
cLo
wer
dH
ighe
rP
valu
eLo
wer
dH
ighe
rP
valu
e
Soc
ioec
onom
ic s
tatu
s0.
070
0.00
6Lo
w84
.7%
74.2
%87
.5%
71.7
%H
igh
15.3
%25
.8%
12.5
%28
.3%
Dur
atio
n of
dia
bete
s (y
ears
)0.
007
0.29
0<1
045
.5%
64.6
%51
.0%
58.6
%≥1
054
.5%
35.4
%49
.0%
41.4
%H
yper
tens
ion
(yes
)69
.0%
51.5
%0.
012
61.9
%59
.0%
0.68
2In
sulin
use
(ye
s)31
.0%
9.3%
0.00
029
.6%
21%
0.80
5G
luco
se le
vel c
heck
0.01
70.
399
Nev
er7.
1%15
.8%
10.4
%12
.2%
Mon
thly
66.7
%72
.6%
65.6
%73
.5%
Wee
kly
19.2
%10
.5%
18.8
%11
.2%
Dai
ly7.
1%1.
1%5.
2%3.
1%E
R v
isits
in p
ast 1
2 m
onth
s0.
005
0.39
9N
ever
55.0
%74
.2%
59.8
%69
.0%
>145
.0%
25.8
%40
.2%
31.0
%D
epre
ssiv
e sy
mpt
oms
0.00
00.
000
Non
-clin
ical
41.0
%79
.4%
37.1
%82
.0%
Clin
ical
59.0
%20
.6%
62.9
%18
.0%
160 Rev Panam Salud Publica/Pan Am J Public Health 23(3), 2008
Original research Mier et al. • Quality of life and diabetes at the Texas-Mexico border
TAB
LE 5
. M
ultiv
aria
te (
adju
sted
) co
rrel
ates
to
HR
QL
phys
ical
and
men
tal
heal
th s
tatu
s sc
ores
, So
uth
Texa
s Lo
wer
Rio
Gra
nde
Valle
y an
d R
eyno
sa,
Tam
aulip
as,
Mex
ico,
2004
–200
5
Val
ley
Rey
nosa
Dep
ende
nt95
% C
Ia95
% C
I
varia
ble
Inde
pend
ent v
aria
bles
bO
Rc
Low
erd
Hig
her
Pva
lue
Inde
pend
ent v
aria
bles
OR
Low
erd
Hig
her
Pva
lue
PC
Se
(Low
erd
Edu
catio
nH
yper
tens
ion
vs. H
ighe
r)<
Hig
h sc
hool
0.49
0.20
1.20
0.11
7Y
es0.
520.
261.
030.
062
≥H
igh
scho
ol1.
00N
o (r
efer
ence
)1.
00S
ocio
econ
omic
sta
tus
Dur
atio
n of
dia
bete
s (y
ears
)Lo
w0.
340.
130.
900.
030
≥10
2.02
1.01
4.03
0.04
7H
igh
(ref
eren
ce)
1.00
≥10
(ref
eren
ce)
1.00
BM
IG
luco
se le
vel c
heck
Nor
mal
(re
fere
nce)
1.00
Nev
er10
.04
0.76
132.
980.
080
Ove
rwei
ght
1.86
0.42
8.28
0.41
6M
onth
ly3.
900.
3642
.33
0.26
4O
besi
ty1.
020.
214.
850.
981
Wee
kly
1.71
0.14
21.0
10.
676
Sev
ere
obes
ity0.
410.
091.
850.
248
Dai
ly (
refe
renc
e)1.
00Y
ears
with
dia
bete
sE
R v
isits
in p
ast 1
2 m
onth
s<1
0 ye
ars
1.65
0.70
3.90
0.25
5≥1
0.81
0.38
1.71
0.58
3≥1
0 ye
ars
1.00
Nev
er (
refe
renc
e)1.
00G
luco
se le
vel c
heck
Insu
lin u
seN
ever
4.18
0.65
27.0
70.
133
Yes
0.29
0.11
0.77
0.01
4M
onth
ly2.
200.
0676
.99
0.66
4N
o (r
efer
ence
)1.
00W
eekl
y2.
920.
919.
360.
071
Dai
ly (
refe
renc
e)1.
00E
R v
isits
in p
ast 1
2 m
onth
sD
epre
ssiv
e sy
mpt
oms
≥10.
560.
191.
670.
301
Clin
ical
0.15
0.07
0.32
0.00
0N
ever
(re
fere
nce)
1.00
Non
-clin
ical
(re
fere
nce)
1.00
PC
Se
(Low
erd
Hos
pita
l sta
ys in
pas
t 12
mon
ths
vs. H
ighe
r)≥1
0.56
0.19
1.65
0.29
2N
ever
(re
fere
nce)
1.00
Die
t cou
nsel
ing
in p
ast 1
2 m
onth
sN
ever
0.54
0.20
1.45
0.22
2O
nce
1.72
0.47
6.32
0.41
3M
ore
than
onc
e (r
efer
ence
)1.
00D
epre
ssiv
e sy
mpt
oms
Clin
ical
0.22
0.09
0.53
0.00
1N
on-c
linic
al (
refe
renc
e)1.
00S
uppo
rtive
rel
ativ
e’s
diab
etes
-rel
ated
kno
wle
dgef
Low
0.19
0.05
0.65
0.00
8M
oder
ate
1.25
0.51
3.02
0.62
8H
igh
(ref
eren
ce)
1.00
Hos
mer
and
Lem
esho
w G
oodn
ess-
of-F
it Te
stg
0.44
6H
osm
er a
nd L
emes
how
Goo
dnes
s-of
-Fit
Test
0.07
7
MC
Sh
(Low
erd
ER
vis
its in
pas
t 12
mon
ths
Soc
ioec
onom
ic s
tatu
svs
. Hig
her)
≥10.
550.
201.
520.
253
Low
0.44
0.20
1.01
0.05
3 N
ever
(re
fere
nce)
1.00
Hig
h (r
efer
ence
)1.
00H
ospi
tal s
tays
in p
ast 1
2 m
onth
sD
epre
ssiv
e sy
mpt
oms
≥10.
460.
171.
240.
125
Clin
ical
0.14
0.07
0.28
0.00
0 N
ever
(re
fere
nce)
1.00
Non
-clin
ical
(re
fere
nce)
1.00
Dep
ress
ive
sym
ptom
sC
linic
al0.
050.
020.
120.
000
Non
-clin
ical
(re
fere
nce)
1.00
Hos
mer
and
Lem
esho
w G
oodn
ess-
of-F
it Te
st0.
164
Hos
mer
and
Lem
esho
w G
oodn
ess-
of-F
it Te
st0.
538
aC
I, co
nfid
ence
inte
rval
.b
The
tabl
e on
ly in
clud
es v
aria
bles
that
test
ed s
igni
fican
t for
PC
S o
r MC
S (P
< 0
.05)
in e
ither
sam
ple
popu
latio
n ac
cord
ing
to th
e P
ears
on c
hi-s
quar
e te
st. T
he c
ross
-tabu
latio
n m
etho
d w
as u
sed
to d
eriv
e th
e pe
rcen
tage
of e
ach
inde
pend
ent v
aria
ble
sign
ifica
nt to
PC
S a
nd M
CS
.c
OR
, odd
s ra
tio.
dH
ighe
r and
low
er s
core
s ar
e di
vide
d by
the
med
ian
(42.
36 fo
r PC
S a
nd 4
6.65
for M
CS
).e
Phy
sica
l hea
lth s
tatu
s su
mm
ary
com
pone
nt o
f HR
QL.
f B
ased
on
stud
y pa
rtici
pant
’s p
erce
ptio
n.g
For t
he L
emes
how
-Hos
mer
goo
dnes
s-of
-fit s
tatis
tic, a
Pva
lue
> 0.
05 in
dica
tes
acce
ptab
le c
alib
ratio
n of
the
mod
el.
hM
enta
l hea
lth s
tatu
s su
mm
ary
com
pone
nt o
f HR
QL.
Rev Panam Salud Publica/Pan Am J Public Health 23(3), 2008 161
Mier et al. • Quality of life and diabetes at the Texas-Mexico border Original research
sample. This finding resonates withprevious research showing that in-sulin use is a predictor of decreasedHRQL (10, 27, 39–42). Twenty percentof Reynosa participants reported useof insulin compared to 53.8% of theircounterparts in the Valley (see Table3), a finding that is also consistent withprevious research (42). However, itshould be noted that the percentage ofReynosa insulin users in this study(20%) was higher than that reported inMexican national surveys with Mexi-can cohorts from non-border regions(4.6% to 5.8%) (6, 43). To better under-stand the impact of insulin use withina public health perspective, further re-search should focus on examining fac-tors influencing insulin-related behav-iors among border (U.S. and Mexican)patients with diabetes, including atti-tudes and beliefs toward insulin use,insulin-related knowledge deficitsamong health providers, and issues ofaffordability.
Another study finding was thatMexican respondents with less than 10years with diabetes were more likelyto have worse physical health statusthan those with long-term experiencewith the disease (10 years or more).Other studies have found this associa-tion (14, 39, 41, 44). Diabetes self-man-agement education, at diagnosis, maythus be beneficial to patients.
Valley respondents perceiving thattheir supportive relative had poordiabetes-related knowledge weremore likely to have worse physicalhealth than those with supportive rel-atives with good knowledge of the dis-
ease (as perceived by the study partic-ipant). Research indicates that familyencouragement of healthy behaviorsrelated to diabetes management maybe a key factor in providing appropri-ate support to individuals with dia-betes (45, 46). For instance, Wilson et al. (47) found that meal planningand medication reminders from rela-tives are critical for treatment adher-ence among individuals with diabetes.Health interventions on both sides ofthe border targeting residents of Mex-ican origin with diabetes should con-sider the inclusion of patients’ rela-tives, as family is a very importantconstruct in Mexican culture (48).
Although some studies found a sig-nificant correlation between obesityand HRQL (33, 39, 40), this study didnot—consistent with the results of a2006 study by Wexler et al. (41). Fur-ther investigation is warranted to bet-ter understand the perception thatborder patients have toward obeso-genesis and obesity-related behaviorsas well as its influence on diabetes bur-den and complications.
This study had several limitations.First, the use of a convenience sample ofpatients diagnosed with type 2 diabeteslimits generalizations, so causal infer-ences cannot be made. Furthermore,due to the heterogeneity of the samplesin terms of ethnicity and use of lan-guage (English and Spanish), studyfindings may not be generalized to allborder residents with type 2 diabetes. Inaddition, the use of both English andSpanish in the interviews may have in-troduced measurement errors. Finally,
both dependent and independent vari-ables were measured using a self-reporting instrument, which carries in-trinsic respondent biases.
Despite its limitations, this may bethe first binational study documentingthe impact of personal and social fac-tors on HRQL among adults with type2 diabetes from both sides of theTexas-Mexico border. Assessing theHRQL of adults with type 2 diabetes inthese populations may advance publichealth research and border policy ef-forts to increase the quality and yearsof healthy life of those affected by thisdebilitating disease.
Acknowledgments. This researchwas supported by the Texas Depart-ment of State Health Services and theHealth Services Research Program, acollaborative research venture of theTexas A&M Health Science Center(TAMHSC) School of Rural PublicHealth (SRPH), the Scott and WhiteHospital and Clinic College of Medi-cine, and the Scott and White HealthPlan. The authors wish to extend their gratitude to Maria Alen of theTAMHSC; Diana Garcia and Pama Ellis of the Rio Grande Regional Hos-pital Diabetes Management Center; Josefa Lopez and Carolina Rivera of the Hospital General de Reynosa; Marcel Twahira and Juan Campos,local physicians; and Grace Lawson ofthe El Milagro Clinic for their assistanceand insightful input during the designand implementation of this study.
1. U.S. Centers for Disease Control and Preven-tion, National Center for Health Statistics.QuickStats: diabetes death rate for Hispanicscompared with non-Hispanic whites—UnitedStates versus counties along the U.S.-Mexicoborder, 2000–2002. MMWR Morbid MortalWkly Rep. 2006;55(32):882.
2. Rubin RR, Peyrot M. Quality of life and diabe-tes. Diabetes Metab Res Rev. 1999;15(3):205–18.
3. U.S. Centers for Disease Control and Preven-tion, National Center for Chronic Disease Pre-
vention and Health Promotion. Diabetes Pub-lic Health Resource. Data & trends. NationalDiabetes Surveillance System. State-specificestimates of diagnosed diabetes among adults[Internet site]. Atlanta: U.S. Department ofHealth and Human Services. Available from:http://www.cdc.gov/diabetes/statistics/prev/state/tPrevalenceTotal.htm. Accessed 2 August 2006.
4. Pan American Health Organization; Centersfor Disease Control and Prevention. The U.S.-
Mexico Border Diabetes Prevention and Con-trol Project: first report of results [Internetsite]. Washington: PAHO; 2005. Availablefrom: http://www.fep.paho.org/english/publicaciones/Diabetes/Diabetes%20first%20report%20of%20Results.pdf. Accessed 15November 2006.
5. Albertorio-Diaz JR, Notzon FC, Rodriguez-Lainz A. Diabetes hospitalization at the U.S.-Mexico border. Prev Chronic Dis [serial on-line]. 2007 Apr. Available from: http://www.
REFERENCES
162 Rev Panam Salud Publica/Pan Am J Public Health 23(3), 2008
Original research Mier et al. • Quality of life and diabetes at the Texas-Mexico border
cdc.gov/pcd/issues/2007/apr/06_0073.htm.Accessed 30 April 2007.
6. Rull JA, Aguilar-Salinas CA, Rojas R, Rios-Torres JM, Gomez-Perez FJ, Olaiz G. Epi-demiology of type 2 diabetes in Mexico. ArchMed Res. 2005;36(3):188–96.
7. Killilea T. Long-term consequences of type 2diabetes mellitus: economic impact on societyand managed care. Am J Managed Care. 2002;8(16 suppl):S441–9.
8. U.S. Department of Health and Human Ser-vices. Healthy People 2010. 2nd ed. Vols. I–II:Understanding and improving health andObjectives for improving health. Washington:U.S. Government Printing Office; 2000.
9. Giachello AL. Health outcomes research onHispanics/Latinos. J Med Systems. 1996;20(5):235–54.
10. Wändell PE. Quality of life of patients with di-abetes mellitus: an overview of research inprimary health care in the Nordic countries.Scand J Prim Health Care. 2005;23(2):68–74.
11. Wilson IB, Cleary PD. Linking clinical vari-ables with health-related quality of life. A con-ceptual model of patient outcomes. JAMA.1995;273(1):59–65.
12. Wexler DJ, Grant RW, Wittenberg E, Bosch JL,Cagliero E, Delahanty L, et al. Correlates ofhealth-related quality of life in type 2 dia-betes. Diabetologia. 2006;49(7):1489–97.
13. Manuel DG, Schultz SE. Health-related qual-ity of life and health-adjusted life expectancyof people with diabetes in Ontario, Canada,1996–1997. Diabetes Care. 2004;27(2):407–14.
14. Glasgow RE, Ruggiero L, Eakin EG, Dryfoos J,Chobanian L. Quality of life and associatedcharacteristics in a large national sample ofadults with diabetes. Diabetes Care. 1997;20(4):562–7.
15. U.S.-Mexico Border Health Commission.Healthy Border 2010: an agenda for improv-ing health on the United States-Mexico bor-der. El Paso (TX): USMBHC; 2003.
16. Ware JE, Kosinski M, Dewey JE, Gandek B.How to score and interpret single-item healthstatus measures: a manual for users of the SF-8™ Health Survey. Lincoln (RI): QualityMet-ric Inc.; 2001.
17. Ottenbacher KJ. The interpretation of aver-ages in health professions research: an empir-ical examination. Eval Health Prof. 1993;16(3):333–41.
18. Dreger RM. Sorting data sets and computingmedians for skewed distributions. Educ Psy-chol Meas. 1993;55(5):785–90.
19. Powers MG. Measures of socioeconomic sta-tus: an introduction. In: Powers MG, ed. Mea-sures of socioeconomic status: current issues.Boulder (CO): Westview; 1981. Pp. 1–28.
20. Krieger N, Williams DR, Moss NE. Measuringsocial class in U.S. public health research: con-cepts, methodologies, and guidelines. AnnuRev Pub Health. 1997;18(1):341–78.
21. U.S. Centers for Disease Control and Preven-tion. BMI—Body Mass Index [Internet site].Atlanta: CDC. Available from: http://www.
cdc.gov/nccdphp/dnpa/bmi/index.htm.Accessed 25 August 2005.
22. Radloff LS. The CES-D scale: a self-report de-pression scale for research in the general pop-ulation. App Psychol Meas. 1977;1(3):385–401.
23. Hann D, Winter K, Jacobsen P. Measurementof depressive symptoms in cancer patients:evaluation of the Center for EpidemiologicalStudies Depression Scale (CES-D). J Psycho-somatic Res. 1999;46(5):437–43.
24. Glasgow RE, Toobert DJ. Social environmentand regimen adherence among type II diabeticpatients. Diabetes Care. 1988;11(5):377–86.
25. SPSS Inc. Statistical Package for the Social Sci-ences (SPSS) for Windows, version 13.0.Chicago: SPSS Inc.; 2004.
26. Ware JE, Kosinski M, Keller SD. SF-36® Phys-ical and Mental Health Summary Scales: auser’s manual. Boston: The Health Institute,New England Medical Center; 1994.
27. Rejeski WJ, Lang W, Neiberg RH, VanDorsten B, Foster GD, Maciejewski ML, et al.Correlates of health-related quality of life inoverweight and obese adults with type 2 dia-betes. Obesity. 2006;14(5):870–83.
28. Maddigan SL, Feeny DH, Majumdar SR, Far-ris KB, Johnson JA. Understanding the deter-minants of health for people with type 2 dia-betes. Am J Public Health. 2006;96(9):1649–55.
29. Connell CM, Davis WK, Gallant MP, SharpePA. Impact of social support, social cognitivevariables, and perceived threat on depressionamong adults with diabetes. Health Psychol.1994;13(3):263–73.
30. Paschalides C, Wearden AJ, Dunkerley R,Bundy C, Davies R, Dickens CM. The associa-tions of anxiety, depression and personal ill-ness representations with glycaemic controland health-related quality of life in patientswith type 2 diabetes mellitus. J PsychosomaticRes. 2004;57(6):557–64.
31. Hänninen JA, Takala JK, Keinänen-Kiukaanniemi SM. Depression in subjectswith type 2 diabetes: predictive factors and re-lation to quality of life. Diabetes Care. 1999;22(6):997–8.
32. Chyun DA, Melkus GD, Katten DM, Price WJ,Davey JA, Grey N, et al. The association ofpsychological factors, physical activity, neu-ropathy, and quality of life in type 2 diabetes.Biol Res Nurs. 2006;7(4):279–88.
33. Brown GC, Brown MM, Sharma S, Brown H,Gozum M, Denton P. Quality of life associ-ated with diabetes mellitus in an adult popu-lation. J Diabetes Complications. 2000;14(1):18–24.
34. Kohen D, Burgess AP, Catalán J, Lant A. Therole of anxiety and depression in quality oflife and symptom reporting in people withdiabetes mellitus. Qual Life Res. 1998;7(3):197–204.
35. de Groot M, Anderson R, Freedland KE,Clouse RE, Lustman PJ. Association of de-pression to diabetes complications: a meta-analysis. Psychosomatic Med. 2001;63(4):619–30.
36. Gross R, Olfson M, Gameroff MJ, CarasquilloO, Shea S, Feder A, et al. Depression and gly-cemic control in Hispanic primary care pa-tients with diabetes. J Gen Int Med. 2005;20(5):460–6.
37. Kilbourne AM, Reynolds III CF, Good CB,Sereika SM, Justice AC, Fine MJ. How doesdepression influence diabetes medication ad-herence in older patients? Am J Ger Psych.2005;13(3):202–10.
38. Awad N, Gagnon M, Messier C. The relation-ship between impaired glucose tolerance,type 2 diabetes, and cognitive function. J ClinExp Neuropsychol. 2004;26(8):1044–80.
39. Hänninen J, Takala J, Keinänen-KiukaanniemiS. Quality of life in NIDDM patients assessedwith the SF-20 questionnaire. Diabetes ResClin Pract. 1998;42(1):17–27.
40. Redekop WK, Koopmanschap MA, Stolk RP,Rutten GE, Wolffenbuttel BH, Niessen LW.Health-related quality of life and treatmentsatisfaction in Dutch patients with type 2 dia-betes. Diabetes Care. 2002;25(3):458–63.
41. Wexler DJ, Grant RW, Wittenberg E, Bosch JL,Cagliero E, Delahanty L, et al. Correlates ofhealth-related quality of life in type 2 dia-betes. Diabetologia. 2006;49(7):1489–97.
42. Gonzélez C, Stern MP, Mitchell BD, ValdezRA, Haffner SM, Pérez BA. Clinical character-istics of type II diabetic subjects consuminghigh versus low carbohydrate diets in MexicoCity and San Antonio, Texas. Diabetes Care.1994;17(5):397–404.
43. Aguilar-Salinas CA, Monroy OV, Gomez-Perez FJ, Chavez AG, Esqueda AL, CuevasVM, et al. Characteristics of patients with type2 diabetes in Mexico: results from a largepopulation-based nationwide survey. Dia-betes Care. 2003;26(7):2021–6.
44. Keinänen-Kiukaanniemi S, Ohinmaa A, Pa-junpaa H, Koivukangas P. Health relatedquality of life in diabetic patients as measuredby the Nottingham Health Profile. Diab Med.1996;13(4):382–8.
45. Hörnquist JO, Wikby A, Stenström U, Ander-sson PO, Akerlind I. Type II diabetes andquality of life: a review of the literature. Phar-macoeconomics. 1995;8(suppl 1):12–6.
46. Cox DJ, Gonder-Frederick L. Major develop-ments in behavioral diabetes research. J Con-sult Clin Psychol. 1992;60(4):628–38.
47. Wilson W, Ary DV, Biglan A, Glasgow RE,Toobert DJ, Campbell DR. Psychosocial predic-tors of self-care behaviors (compliance) andglycemic control in non-insulin-dependent dia-betes mellitus. Diabetes Care. 1986;9(6):614–22.
48. Marin G, Marin BV. Research with Hispanicpopulations. Newbury Park (CA): Sage; 1991.
Manuscript received 15 May 2007. Revised version ac-cepted for publication 14 January 2008.
Rev Panam Salud Publica/Pan Am J Public Health 23(3), 2008 163
Objetivos. Analizar los dominios de salud física y mental de la calidad de vida re-lacionada con la salud (CVRS) en una población binacional de adultos con diabetestipo 2 en la frontera Texas-México y explorar los factores individuales y sociales rela-cionados con el estado de la salud física y mental.Métodos. Se realizó un muestreo de conveniencia de personas de 18 años de edad omás con diabetes tipo 2 que vivían en Lower Rio Grande Valley, al sur de Texas, y enReynosa, Tamaulipas, México, y se les realizó una entrevista estructurada presencial.La CVRS se midió mediante los componentes abreviados de salud física y mental delMOS-SF8 (Medical Outcomes Study Short Form 8). Entre los factores relacionados conla CVRS estaban las características demográficas, los factores de salud, el acceso a laatención sanitaria y el apoyo familiar. Se compararon las características de las mues-tras mediante la prueba de la t de Student o la prueba de la U de Mann-Whitney. Lasasociaciones entre las variables independientes y la dependiente se analizaron me-diante modelos de regresión logística múltiple, ajustados y sin ajustar.Resultados. No se encontraron diferencias significativas entre los entrevistados deValley y de Reynosa en cuanto a la puntuación del estado de salud física y mental. Losparticipantes de Valley con menor estatus socioeconómico y los que consideraban quelos parientes que los apoyaban tenían un “bajo” nivel de conocimiento sobre la dia-betes presentaron una mayor probabilidad de informar un peor estado de salud físicaque los que no tenían esas características. En el grupo de Reynosa, el peor estado desalud física se asoció con la duración de la diabetes y el uso de insulina. En ambosgrupos, las personas con síntomas clínicos de depresión tuvieron una mayor proba-bilidad de informar una peor salud física y mental que los que no presentaban esossíntomas.Conclusiones. La CVRS es un importante criterio en el análisis del estado de salud.La comprensión de los niveles de CVRS de los diabéticos que viven en la fronteraentre los EE.UU. y México y de los factores que influyen en su CVRS puede contribuira mejorar los programas de control de la diabetes.
Calidad de vida, diabetes mellitus tipo 2, factores de riesgo, salud fronteriza,americanos mexicanos, Texas, México, Estados Unidos.
RESUMEN
La calidad de vida relacionadacon la salud en una población
diabética binacional de lafrontera Texas-México
Palabras clave
Mier et al. • Quality of life and diabetes at the Texas-Mexico border Original research