Health assessment of Black-crowned Night-herons (Nycticorax nycticorax) of the New York Harbor...
12
Health assessment of Black-crowned Night-herons (Nycticorax nycticorax) of the New York Harbor estuary Scott H. Newman a,1,2 , Veronica M. Padula a, ⁎ , Carolyn Cray b , Laura D. Kramer c a Wildlife Trust, 460 West 34th Street, 17th Floor, New York, NY 10001, USA b Division of Comparative Pathology, University of Miami Miller School of Medicine, Miami, FL 33101 USA c Wadsworth Center, New York State Department of Health, Slingerlands, NY 12159, USA Received 7 March 2007; received in revised form 5 July 2007; accepted 5 July 2007 Available online 14 July 2007 Abstract Blood samples from 145 Black-crowned Night-heron (Nycticorax nycticorax, BCNH) chicks (mean age 3 weeks) were taken from four island colonies (Goose (2004), Canarsie Pol (2005), Hoffman (2004 and 2005) and North Brother (2004 and 2005)) in New York Harbor in 2004 and 2005 to establish baseline health reference ranges for this species and to compare health indices of birds reared on different islands. Packed cell volume (PCV) and total solids (TS) did not differ among islands in either year. Herons raised on Hoffman Island in 2004 had lower white blood cell count (WBC), and higher activities of creatine phosphokinase (CPK), lactate dehydrogenase (LDH), aspartate amino transferase (AST), higher concentrations of potassium (K) and phosphorous (PHOS) and lower liver derived proteins (TP, prealbumin, albumin, alpha 1 globulins, alpha 2 globulins, beta globulins and gamma globulins) compared to herons from Goose and North Brother Islands. These changes suggest compromised health in chicks reared on Hoffman Island in 2004. On Hoffman in 2005, these biochemical analytes did not differ from concentrations and enzyme activities measured from birds on other islands. Although no single etiology can explain these extensive changes, it is likely that exposure to contaminants at foraging sites used by birds nesting on Hoffman and/or changes in prey availability and abundance causing birds to forage in different locations between years, led to differences measured in blood-based health indices. Avian health assessments coupled with foraging ecology serve as an excellent method for evaluating ecosystem health of the New York Harbor estuary system. © 2007 Elsevier Inc. All rights reserved. Keywords: Black-crowned Night-heron; Nycticorax nycticorax; Hematology; Biochemistry; Baseline health; Aspergillosis; West Nile virus; disease; NY harbor; Ecosystem health 1. Introduction The Black-crowned Night-heron (Nycticorax nycticorax, BCNH) is one of the most populous heron species (25,000– 50,000 individuals) in the United States (Butler et al., 2000). Herons are important top consumers and they are sensitive indi- cators of ecosystem health in brackish and freshwater systems. Although BCNH populations in the eastern United States have been declining since the late 1970s (Parsons et al., 2001), wading birds such as herons, egrets and ibis have been increasing on the limited nesting habitat on islands in New York Harbor (Parsons, 1994). In 2005, BCNH nested on at least 8 islands in New York Harbor (Bernick, 2007), and although they appear to be thriving, decreasing numbers of nests have been observed on certain islands over the past 5 years, raising concern about the quality of the nesting habitat, availability of prey in New York Harbor, and the health of wild birds (Newman et al., 2004; Bernick, 2005a). The islands on which BCNH nest are part of the New York Harbor estuary which is a watershed that encompasses over 42,000 km 2 in 5 states and supports over 20 million people (Adams and Benyi, 2003). Habitat destruction and human activity like bulkheading, filling, dredging, channelization and inputs of toxic Available online at www.sciencedirect.com Comparative Biochemistry and Physiology, Part B 148 (2007) 363 – 374 www.elsevier.com/locate/cbpb ⁎ Corresponding author. 20 Plymouth Road, Paterson, NJ 07502, USA. Tel.: +1 973 902 1351 or +1 973 790 6093; fax: +1 973 458 0802. E-mail address: [email protected] (V.M. Padula). 1 Current address: Food and Agriculture Organization of the United Nations, Infectious Diseases Group, Animal Health Service, Viale delle Terme di Caracalla, 00100, Rome, Italy. 2 Current address: Wildlife Conservation Society, Field Veterinary Program, Bronx, NY0460, USA. 1096-4959/$ - see front matter © 2007 Elsevier Inc. All rights reserved. doi:10.1016/j.cbpb.2007.07.003
-
Upload
independent -
Category
Documents
-
view
4 -
download
0
Transcript of Health assessment of Black-crowned Night-herons (Nycticorax nycticorax) of the New York Harbor...

Available online at www.sciencedirect.com
gy, Part B 148 (2007) 363–374www.elsevier.com/locate/cbpb
Comparative Biochemistry and Physiolo
Health assessment of Black-crowned Night-herons (Nycticorax nycticorax)of the New York Harbor estuary
Scott H. Newman a,1,2, Veronica M. Padula a,⁎, Carolyn Cray b, Laura D. Kramer c
a Wildlife Trust, 460 West 34th Street, 17th Floor, New York, NY 10001, USAb Division of Comparative Pathology, University of Miami Miller School of Medicine, Miami, FL 33101 USA
c Wadsworth Center, New York State Department of Health, Slingerlands, NY 12159, USA
Received 7 March 2007; received in revised form 5 July 2007; accepted 5 July 2007Available online 14 July 2007
Abstract
Blood samples from 145 Black-crowned Night-heron (Nycticorax nycticorax, BCNH) chicks (mean age 3 weeks) were taken from four islandcolonies (Goose (2004), Canarsie Pol (2005), Hoffman (2004 and 2005) and North Brother (2004 and 2005)) in New York Harbor in 2004 and2005 to establish baseline health reference ranges for this species and to compare health indices of birds reared on different islands. Packed cellvolume (PCV) and total solids (TS) did not differ among islands in either year. Herons raised on Hoffman Island in 2004 had lower white bloodcell count (WBC), and higher activities of creatine phosphokinase (CPK), lactate dehydrogenase (LDH), aspartate amino transferase (AST), higherconcentrations of potassium (K) and phosphorous (PHOS) and lower liver derived proteins (TP, prealbumin, albumin, alpha 1 globulins, alpha 2globulins, beta globulins and gamma globulins) compared to herons from Goose and North Brother Islands. These changes suggest compromisedhealth in chicks reared on Hoffman Island in 2004. On Hoffman in 2005, these biochemical analytes did not differ from concentrations andenzyme activities measured from birds on other islands. Although no single etiology can explain these extensive changes, it is likely that exposureto contaminants at foraging sites used by birds nesting on Hoffman and/or changes in prey availability and abundance causing birds to forage indifferent locations between years, led to differences measured in blood-based health indices. Avian health assessments coupled with foragingecology serve as an excellent method for evaluating ecosystem health of the New York Harbor estuary system.© 2007 Elsevier Inc. All rights reserved.
Keywords: Black-crowned Night-heron; Nycticorax nycticorax; Hematology; Biochemistry; Baseline health; Aspergillosis; West Nile virus; disease; NY harbor;Ecosystem health
1. Introduction
The Black-crowned Night-heron (Nycticorax nycticorax,BCNH) is one of the most populous heron species (25,000–50,000 individuals) in the United States (Butler et al., 2000).Herons are important top consumers and they are sensitive indi-cators of ecosystem health in brackish and freshwater systems.
⁎ Corresponding author. 20 Plymouth Road, Paterson, NJ 07502, USA.Tel.: +1 973 902 1351 or +1 973 790 6093; fax: +1 973 458 0802.
E-mail address: [email protected] (V.M. Padula).1 Current address: Food and Agriculture Organization of the United Nations,
Infectious Diseases Group, Animal Health Service, Viale delle Terme diCaracalla, 00100, Rome, Italy.2 Current address: Wildlife Conservation Society, Field Veterinary Program,
Bronx, NY0460, USA.
1096-4959/$ - see front matter © 2007 Elsevier Inc. All rights reserved.doi:10.1016/j.cbpb.2007.07.003
Although BCNH populations in the eastern United Stateshave been declining since the late 1970s (Parsons et al., 2001),wading birds such as herons, egrets and ibis have beenincreasing on the limited nesting habitat on islands in NewYork Harbor (Parsons, 1994). In 2005, BCNH nested on at least8 islands in New York Harbor (Bernick, 2007), and althoughthey appear to be thriving, decreasing numbers of nests havebeen observed on certain islands over the past 5 years, raisingconcern about the quality of the nesting habitat, availability ofprey in New York Harbor, and the health of wild birds (Newmanet al., 2004; Bernick, 2005a) .
The islands on which BCNH nest are part of the New YorkHarbor estuary which is a watershed that encompasses over42,000 km2 in 5 states and supports over 20million people (Adamsand Benyi, 2003). Habitat destruction and human activity likebulkheading, filling, dredging, channelization and inputs of toxic

364 S.H. Newman et al. / Comparative Biochemistry and Physiology, Part B 148 (2007) 363–374
contaminants have all played a role in altering this ecosystem,leaving approximately 20,000 ac of wetlands in the harbor, or 20–25% of the historical range of wetlands (Steinberg et al., 2004).
Although the New York/New Jersey Harbor Ecosystem hasexperienced significant environmental damage, efforts such as theabatement of untreated sewage have helped to improve its condition(Brosnan and O'Shea, 1996). In 1987 the New York/New JerseyHarbor Ecosystem was designated as an Estuary of NationalSignificance (Adams and Benyi, 2003), resulting in significantrestoration projects and a decrease in the amount of raw sewage andtoxic materials discharged into the estuary (Steinberg et al., 2004).
In this ecosystem, BCNH serve as useful indicators ofenvironmental pollution because they are top predators in theirfood chain, conspicuous, long-lived, and easily observed (BurgerandGochfeld, 2004). Because BCNHderive all of their food fromNew York Harbor during breeding season, their physiologicalhealth is linked directly to the health of New York Harbor. Thus,BCNH serve as proxies for human health in the NewYork Harborregion as all organisms within this ecosystem are subject tosimilar environmental factors such as water resources, climate,and pollution. In veterinary and humanmedicine, hematology andclinical pathology tests enable one to obtain a snapshot of healthincluding an assessment of organ function such as the pan-creas, liver, kidney, muscle and brain, the hematopoieticsystem, electrolytes and nutrients. If problems exist withenvironmental conditions, animals living on resources de-rived in this system are likely to be affected as indicated bychanges in blood health indices.
Since the first sighting of BCNH in New York Harbor aquarter of a century ago, no studies have been conducted tounderstand their baseline health. The objective of this study is toestablish baseline health data for BCNH inhabiting New YorkHarbor and to determine if birds reared on different islands inthe harbor differed in health.
2. Materials and methods
In 2004, blood samples were taken from BCNH chicks fromthe following locations: 41 from Hoffman Island (RichmondCounty, New York; 40° 34′ 43″N, 74° 03′ 14″W) on 7 June;6 from Goose Island (Bronx County, New York; 40° 51′ 55″N,73° 49′ 08″W) on 15 June; and 20 and 10 from North BrotherIsland (Bronx County, New York; 40° 48′ 03″N, 73° 53′ 56″W)on 16 June and 22 July respectively. In 2005, additional sampleswere collected including: 3, 3, and 2 from Canarsie Pol (KingsCounty, New York; 40° 37′ 15″N, 73° 52′ 17″W) on 8 June,20 June, and 12 July respectively; 30 from Hoffman Island on15 June; and 30 from North Brother on 21 June.
2.1. Collection and field sampling
Field teams consisting of 5–10 people landed on a givenisland between 8:55 and 11:20 AM and BCNH chicks wereremoved from their nests and processed within 15 min of re-moval from nests. Weight, culmen length and tarsus length weremeasured prior to taking blood samples. If chicks weighed morethan 200 g, blood was taken (0.3–0.6 cc/100 g bird mass) from
the right jugular vein using a 25 G needle and 3 mL or 6 mLsyringe. U.S. Fish and Wildlife Service size 7 A bands wereplaced on the left leg. Bands were color anodized with chicksfrom Goose and Canarsie Pol receiving blue colored bands,chicks from Hoffman receiving gold colored bands, and chicksfrom North Brother receiving black colored bands. Chicks werethen returned to their nests.
Two blood smears were prepared immediately after bloodcollection and air dried. The remaining blood was placed inlithium heparin blood tubes (Vacuette, Monroe, NC, USA).Blood tubes were stored at approximately 3 °C until they couldbe centrifuged between 4–8 h after collection.
2.2. Chick aging
Chick age was determined using culmen length (cm) andthe following equation: 1.706 (culmen length in cm)+13.195(Parsons, pers. comm.).
2.3. Hematologic analysis
Blood samples were analyzed for packed-cell volume (PCV(%)) (Jain 1986), total solids (TS (g/dL)) (Campbell, 1995), andwhite blood cell count (WBC; indicator of immune competence)(Zinkl, 1986) within 48 h of blood collection. Blood smearsprepared in the field were stained with Dif Quik™ (AmericanScientific Products,McGrawPark, IL, USA) and used to calculatedifferential WBC counts, in which slides were examined at 1000×using a light microscope and 100 white blood cells were countedand categorized as eosinophils, heterophils, lymphocytes, mono-cytes or basophils.AnEosinophil UnopetteDetermination kit Test5877 (Becton-Dickinson and Co., Franklin Lakes, NJ, USA) wasused to performWBC count. Based on the differential white bloodcell counts, the total WBC was calculated (Campbell, 1995).
2.4. Biochemical analysis
Lithium heparin gel separator tubes were centrifuged andplasma was transferred to a 4 mL cryovial and frozen at(−80 °C). Frozen plasma samples were sent to the University ofMiami for biochemical analysis using an Ortho (KodakEktahem) 700XR. Activity levels of alanine amino transferase(ALT), aspartate amino transferase (AST) and lactate dehydro-genase (LDH) were measured as indicators of liver function;creatine phosphokinase (CPK) was measured as an indicator ofmuscle function; amylase (AMY) and lipase (LIPA) weremeasured as indicators of pancreas function; concentrations ofsodium (NA), potassium (K), total CO2 (CO2), calcium (CA),and phosphorus (PHOS) were measured as indicators of elec-trolyte activity and acid: base balance; concentrations of cho-lesterol (CHOL), triglycerides (TRIG), ,and glucose (GLU)were measured as indicators of nutrition and metabolism; bloodurea nitrogen (BUN), creatinine (CREA), and uric acid (URIC)were measured as indicators of kidney function. Total protein(TP) was measured with a refractometer, and prealbumin, al-bumin, alpha 1, alpha 2, beta globulins (liver derived proteins)and gamma globulins (indicators of immunocompetency) were

able 1ean±SE (sample size), median and range reported for mass, culmen length,rsus length, PCV, TS, WBC and biochemical analytes for chicks sampled fromoose Island, Hoffman Island and North Brother Island in 2004
iochemicalnalyte
Goose Hoffman NorthBrother
All p-value
ass (g)Mean±SE (n) 345±31
(8)469±28(42)
360±21(24)
420±28(74)
Median 322 440 360 422Range 87–595 145–860 94–568 87–860ulmen (mm)Mean±SE (n) 36±1.4
(8)44±1.3(42)
40±0.7(22)
42±1.2(72)
Median 36 42 40 41Range 24–47 34–64 33–48 24–64arsus (mm)Mean±SE (n) 45±2.8
(8)59±2.0(42)
53±1.4(22)
56±2.1(72)
Median 47 57 54 55Range 24–70 38–85 38–73 24–85CV (%)Mean±SE (n) 37±0.4
(6) A34±1.0(39) A
35±1.0(21) A
35±0.5(66)
0.26
Median 37 35 35 35Range 35–38 24–42 29–42 24–42S (g/dL)Mean±SE (n) 3.0±0.2
(6) A3.2±0.1(40) A
3.2±0.1(21) A
3.1±0.1(67)
0.59
Median 3.1 3.2 3.1 3.2Range 2.2–3.4 2.0–4.4 2.6–4.0 2.0–4.4BC (cells/μL) a
Mean±SE (n) 19,566±2251(5) AB
15,732±1583(40) B
25,029±3018(19) A
18,792±1430 (64)
0.02
Median 22,568 13711 20,630 17,532Range 12,203–
23,3441227–43,949
11,260–54,784
1227–54,784
eterophils(cells/μL) b
Mean±SE (n) 9861± 119(5) A
7646±40(40) A
12,164±81(19) A
9170±26(64)
0.93
Range 3905–14,940
233–41,742
3265–37,253
233–52,045
ymphocytes(cells/μL)Mean±SE (n) 8413±140
(5) A6324±35(40) A
10,362±75(19) A
7667±23(64)
0.87
Range 2929–13,306
86–33,833
2702–32,870
86–42,184
atio of heterophilsto lymphocytes
1.17 1.21 1.17 1.20
osinophils(cells/μL)Mean±SE (n) 1683±56
(5) A2061±16(40) A
3154±537(19) A
2368±12(64)
0.32
Range 122–3735 37–13,182
450–15,887
12–16,435
onocytes(cells/μL)Mean±SE (n) 391±16
(5) A409±5(40) A
751±20(19) A
506±4(64)
0.88
Range 0–934 0–4394 0–4931 0–5478asophils(cells/μL)Mean±SE (n) 0±0 (5) A 4±0 (40)
A0±2 (19)A
6±0 (64) 0.78
Table 1 (continued )
Biochemicalanalyte
Goose Hoffman NorthBrother
All p-value
Basophils(cells/μL)Range 0–0 0–439 0–548 0–548
GLU (mg/dL)Mean±SE (n) 150±25
(6) A182±5(41) A
182±7(29) A
180±4(76)
0.38
Median 138 185 181 182Range 79–224 121–244 105–242 79–244
CHOL (mg/dL)Mean±SE (n) 105±17
(5) B165±6(41) A
125±8(30) B
146±5(76)
0.0001
Median 116 159 124 140Range 59–150 101–256 50–216 50–256
TRIG (mg/dL)Mean±SE (n) 76±18
(6) A78±8(41) A
79±15(30) A
78±7(77)
0.83
Median 78 62 66 63Range 24–124 19–266 19–466 19–466
NA (mmol/L)Mean±SE (n) 134±8
(6) A134±1(40) A
111±3(30) B
125±2(76)
b0.0001
Median 141 137 108 132Range 98–151 109–147 77–138 77–151
K (mmol/L)Mean±SE (n) 1.4±0.2
(4) B2.3±0.1(40) A
1.9±0.1(30) B
2.1±0.1(74)
0.004
Median 1.3 2.1 1.6 1.9Range 1–1.9 1.1–4 0.9–3.3 0.9–4
CO2 (mmol/L)Mean±SE (n) 15±1 (6)
B20±1(40) A
19±1(30) A
19±0(76)
0.008
Median 15 20 20 20Range 10–18 13–27 12–26 10–27
CA (mg/dL)Mean±SE (n) 7.3±1.0
(6) B9.4±0.1(41) A
8.1±0.3(30) B
8.7±0.2(77)
b0.0001
Median 7.7 9.5 8.1 9.1Range 4.5–9.7 7.5–10.7 4.3–11.9 4.3–11.9
PHOS (mg/dL)Mean±SE (n) 6.9±1.3
(6) B11.0±0.3(41) A
7.2±0.4(30) B
9.2±0.3(77)
b0.0001
Median 6.7 11.1 6.9 9.6Range 3.6–11.1 7.1–14.6 3.5–13.1 3.5–14.6
AMY (U/L)Mean±SE (n) 481±79
(6) B825±27(41) A
787±39(30) A
783±24(77)
0.005
Median 495 847 791 802Range 242–683 432–1134 266–1291 242–1291
LIPA (U/L)Mean±SE (n) 26±9
(6) B57±6(40) A
35±3(30) B
46±4(76)
0.003
Median 16 49 29 36Range 6–55 13–148 12–89 6–148
AST (U/L)Mean±SE (n) 78±15
(6) B165±13(41) A
135±11(29) AB
147±9(76)
0.004
Median 75 140 133 135Range 31–132 69–466 56–354 31–466
ALT (U/L)Mean±SE (n) 21±0
(6) A19±1(40) A
18±1(29) A
19±1(75)
0.49
Median 21 18 19 19Range 19–22 7–33 8–28 7–33
(continued on next page)
365S.H. Newman et al. / Comparative Biochemistry and Physiology, Part B 148 (2007) 363–374
TMtaG
Ba
M
C
T
P
T
W
H
L
R
E
M
B
(continued on next page)
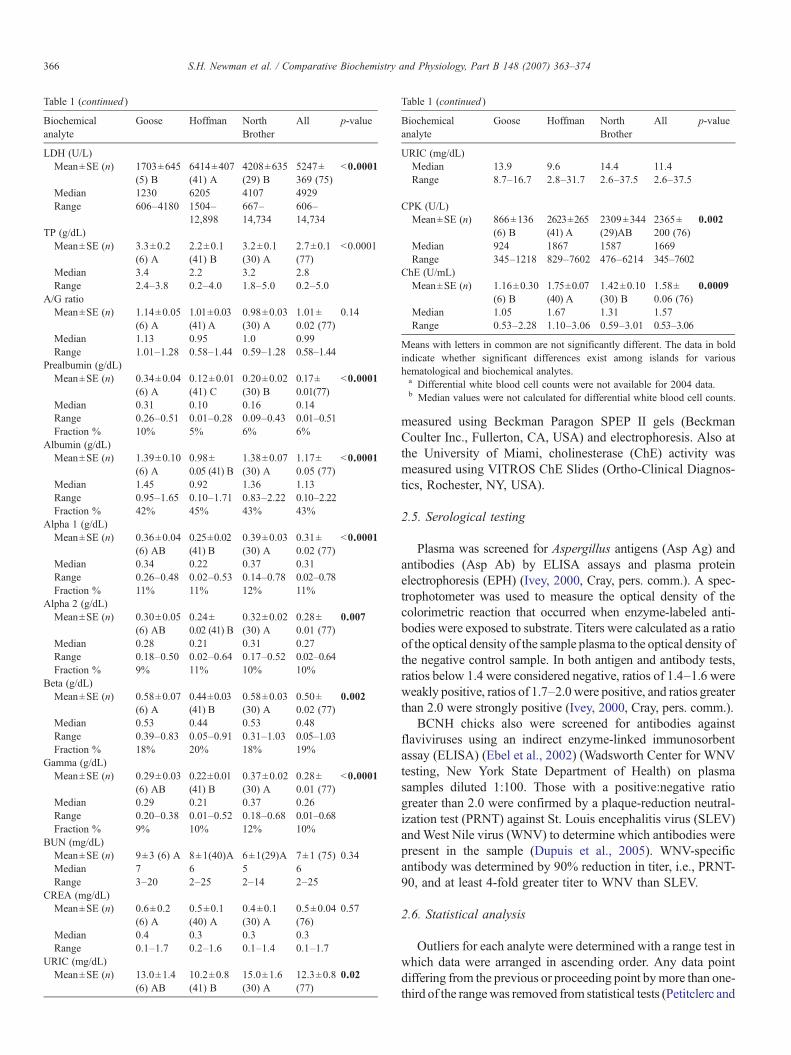
Table 1 (continued )
Biochemicalanalyte
Goose Hoffman NorthBrother
All p-value
LDH (U/L)Mean±SE (n) 1703±645
(5) B6414±407(41) A
4208±635(29) B
5247±369 (75)
b0.0001
Median 1230 6205 4107 4929Range 606–4180 1504–
12,898667–14,734
606–14,734
TP (g/dL)Mean±SE (n) 3.3±0.2
(6) A2.2±0.1(41) B
3.2±0.1(30) A
2.7±0.1(77)
b0.0001
Median 3.4 2.2 3.2 2.8Range 2.4–3.8 0.2–4.0 1.8–5.0 0.2–5.0
A/G ratioMean±SE (n) 1.14±0.05
(6) A1.01±0.03(41) A
0.98±0.03(30) A
1.01±0.02 (77)
0.14
Median 1.13 0.95 1.0 0.99Range 1.01–1.28 0.58–1.44 0.59–1.28 0.58–1.44
Prealbumin (g/dL)Mean±SE (n) 0.34±0.04
(6) A0.12±0.01(41) C
0.20±0.02(30) B
0.17±0.01(77)
b0.0001
Median 0.31 0.10 0.16 0.14Range 0.26–0.51 0.01–0.28 0.09–0.43 0.01–0.51Fraction % 10% 5% 6% 6%
Albumin (g/dL)Mean±SE (n) 1.39±0.10
(6) A0.98±0.05 (41) B
1.38±0.07(30) A
1.17±0.05 (77)
b0.0001
Median 1.45 0.92 1.36 1.13Range 0.95–1.65 0.10–1.71 0.83–2.22 0.10–2.22Fraction % 42% 45% 43% 43%
Alpha 1 (g/dL)Mean±SE (n) 0.36±0.04
(6) AB0.25±0.02(41) B
0.39±0.03(30) A
0.31±0.02 (77)
b0.0001
Median 0.34 0.22 0.37 0.31Range 0.26–0.48 0.02–0.53 0.14–0.78 0.02–0.78Fraction % 11% 11% 12% 11%
Alpha 2 (g/dL)Mean±SE (n) 0.30±0.05
(6) AB0.24±0.02 (41) B
0.32±0.02(30) A
0.28±0.01 (77)
0.007
Median 0.28 0.21 0.31 0.27Range 0.18–0.50 0.02–0.64 0.17–0.52 0.02–0.64Fraction % 9% 11% 10% 10%
Beta (g/dL)Mean±SE (n) 0.58±0.07
(6) A0.44±0.03(41) B
0.58±0.03(30) A
0.50±0.02 (77)
0.002
Median 0.53 0.44 0.53 0.48Range 0.39–0.83 0.05–0.91 0.31–1.03 0.05–1.03Fraction % 18% 20% 18% 19%
Gamma (g/dL)Mean±SE (n) 0.29±0.03
(6) AB0.22±0.01(41) B
0.37±0.02(30) A
0.28±0.01 (77)
b0.0001
Median 0.29 0.21 0.37 0.26Range 0.20–0.38 0.01–0.52 0.18–0.68 0.01–0.68Fraction % 9% 10% 12% 10%
BUN (mg/dL)Mean±SE (n) 9±3 (6) A 8±1(40)A 6±1(29)A 7±1 (75) 0.34Median 7 6 5 6Range 3–20 2–25 2–14 2–25
CREA (mg/dL)Mean±SE (n) 0.6±0.2
(6) A0.5±0.1(40) A
0.4±0.1(30) A
0.5±0.04(76)
0.57
Median 0.4 0.3 0.3 0.3Range 0.1–1.7 0.2–1.6 0.1–1.4 0.1–1.7
URIC (mg/dL)Mean±SE (n) 13.0±1.4
(6) AB10.2±0.8(41) B
15.0±1.6(30) A
12.3±0.8(77)
0.02
Table 1 (continued )
Biochemicalanalyte
Goose Hoffman NorthBrother
All p-value
URIC (mg/dL)Median 13.9 9.6 14.4 11.4Range 8.7–16.7 2.8–31.7 2.6–37.5 2.6–37.5
CPK (U/L)Mean±SE (n) 866±136
(6) B2623±265(41) A
2309±344(29)AB
2365±200 (76)
0.002
Median 924 1867 1587 1669Range 345–1218 829–7602 476–6214 345–7602
ChE (U/mL)Mean±SE (n) 1.16±0.30
(6) B1.75±0.07(40) A
1.42±0.10(30) B
1.58±0.06 (76)
0.0009
Median 1.05 1.67 1.31 1.57Range 0.53–2.28 1.10–3.06 0.59–3.01 0.53–3.06
Means with letters in common are not significantly different. The data in boldindicate whether significant differences exist among islands for varioushematological and biochemical analytes.a Differential white blood cell counts were not available for 2004 data.b Median values were not calculated for differential white blood cell counts.
366 S.H. Newman et al. / Comparative Biochemistry and Physiology, Part B 148 (2007) 363–374
measured using Beckman Paragon SPEP II gels (BeckmanCoulter Inc., Fullerton, CA, USA) and electrophoresis. Also atthe University of Miami, cholinesterase (ChE) activity wasmeasured using VITROS ChE Slides (Ortho-Clinical Diagnos-tics, Rochester, NY, USA).
2.5. Serological testing
Plasma was screened for Aspergillus antigens (Asp Ag) andantibodies (Asp Ab) by ELISA assays and plasma proteinelectrophoresis (EPH) (Ivey, 2000, Cray, pers. comm.). A spec-trophotometer was used to measure the optical density of thecolorimetric reaction that occurred when enzyme-labeled anti-bodies were exposed to substrate. Titers were calculated as a ratioof the optical density of the sample plasma to the optical density ofthe negative control sample. In both antigen and antibody tests,ratios below 1.4 were considered negative, ratios of 1.4–1.6 wereweakly positive, ratios of 1.7–2.0 were positive, and ratios greaterthan 2.0 were strongly positive (Ivey, 2000, Cray, pers. comm.).
BCNH chicks also were screened for antibodies againstflaviviruses using an indirect enzyme-linked immunosorbentassay (ELISA) (Ebel et al., 2002) (Wadsworth Center for WNVtesting, New York State Department of Health) on plasmasamples diluted 1:100. Those with a positive:negative ratiogreater than 2.0 were confirmed by a plaque-reduction neutral-ization test (PRNT) against St. Louis encephalitis virus (SLEV)andWest Nile virus (WNV) to determine which antibodies werepresent in the sample (Dupuis et al., 2005). WNV-specificantibody was determined by 90% reduction in titer, i.e., PRNT-90, and at least 4-fold greater titer to WNV than SLEV.
2.6. Statistical analysis
Outliers for each analyte were determined with a range test inwhich data were arranged in ascending order. Any data pointdiffering from the previous or proceeding point bymore than one-third of the rangewas removed from statistical tests (Petitclerc and

Table 2Mean±SE (sample size), median and range reported for mass, culmen length,tarsus length, PCV, TS, WBC and biochemical analytes for chicks sampled fromCanarsie Pol, Hoffman Island and North Brother Island in 2005
Biochemicalanalyte
CanarsiePol
Hoffman NorthBrother
All p-value
Mass (g)Mean±SE (n) 517±34
(8)525±35(33)
423±28(34)
478±33(75)
Median 483 520 365 450Range 217–930 140–908 146–761 140–930
Culmen (mm)Mean±SE (n) 50±1.8 (8) 48±1.6
(31)42±1.3(34)
46±1.6(73)
Median 50 49 40 45Range 33–68 31–71 30–58 30–71
Tarsus (mm)Mean±SE (n) 63±2.9 (8) 6 8 ± 2 . 2
(31)58±2.3(34)
63±2.4(73)
Median 64 70 54 62Range 37–89 44–86 38–83 37–89
PCV (%)Mean±SE (n) 34±1.0
(8) A35±1.0(30) A
34±1.0(30) A
34±0(68)
0.52
Median 33 35 34 34Range 28–39 26–42 23–40 23–42
TS (g/dL)Mean±SE (n) 3.2±0.2
(8) A3.0±0.1(30) A
3.1±0.1(30) A
3.1±0.1(68)
0.20
Median 3.1 3.0 3.2 3.0Range 2.6–3.8 2.0–4.0 1.5–4.2 1.5–4.2
WBC (cells/μL)Mean±SE (n) 20,808±
1681(7) A
19,936±1811(30) A
20,456±1765(29) A
20,257±1133 (66)
0.65
Median 21,085 17,109 18,416 18,478Range 14,578–
28,1378131–51,200
5908–39,624
5908–51,200
Heterophils(cells/μL) a
Mean±SE (n) 10,612±1040 (7) A
9171±399(30) A
8592±614(29) A
9116±405 (66)
0.42
Range 7283–15,606
4585–13,357
2250–14,319
2228–15,193
Lymphocytes(cells/μL)Mean±SE (n) 5618±
1040 (7) AB5183±390(30) B
6955±614(29) A
6077±203
0.046
Range 1457–8947
2592–9370
2046–13,501
1418–13,370
Ratio of heterophilsto lymphocytes
1.89 1.77 1.24 1.50
Eosinophils(cells/μL)Mean±SE (n) 2497±
624 (7) A2990±199(30) A
2659±205(29) A
2836±203 (66)
0.36
Range 1248–4578
797–5781 818–7364 810–7293
Monocytes(cells/μL)Mean±SE (n) 2081±
624 (7) A2392±399(30) A
2046±409(29) A
2228±203 (66)
0.57
Range 208–5826 0–7775 0–6750 0–7900Basophils(cells/μL)Mean±SE (n) 0±0 (7) A 0±0 (30)A 0±0 (29)A 0±0 (66) 0.02
(continued on next page)
367S.H. Newman et al. / Comparative Biochemistry and Physiology, Part B 148 (2007) 363–374
Kelly, 1981; Solberg, 1981). For any analyte, it was not necessaryto remove anymore than 2 data points. In the case of Goose Islandbirds (sampled in 2004) and Canarsie Pol birds (sampled in 2005)where sample sizes were less than 10, no outliers were removedbecause the sample size was already very small.
Descriptive statistics (mean, median, standard error and range)were calculated with JMP IN Statistical Software (Brooks/Cole— Thomson Learning, Belmont, CA, USA). The Kruskal–Wallis rank sum test was used to identify statistically significantdifferences (p≤0.05) among means for blood parameters forbirds being reared on different islands.ATukey–KramerHSD testwas used to find specific differences among the three islands if theKruskall–Wallis test found significant differences.
Two-way ANOVA tests were used to investigate whetherhematologic parameters (PCV, TP and WBC) measured onNorth Brother and Hoffman Islands differed (p≤0.05) between2004 and 2005. Parametric tests could be used for this analysisbecause samples from North Brother and Hoffman Islands forboth years were normally distributed. Effects of site and yearwere analyzed individually and the interaction of the two factorswas analyzed, with island serving as the “between” factor andyear serving as the “within” factor.
3. Results
In total, 145 blood samples were collected from BCNHchicks in the NewYork Harbor. The mean age of chicks sampledin 2004 and 2005 was 21±0.2 days (range: 18–25 days). Meansand ranges for mass, culmen length, and tarsus length arereported in Tables 1 and 2.
3.1. Hematologic analysis
PCVand TS did not differ significantly in 2004 among GooseIsland, Hoffman Island andNorth Brother Island birds, butWBCwas significantly higher on North Brother (25,029 cells/μL±3018) compared to Hoffman (15,732 cells/μL±1583) (Table 1).No significant differences were found among islands for PCV,TS andWBC in 2005. In 2005, lymphocyte counts were found todiffer significantly among islands, specifically between NorthBrother (6955 cells/μL±614) and Hoffman (5183 cells/μL±390) (Table 2).
Mean PCV and TS were similar in 2004 and 2005 on NorthBrother and Hoffman Islands. Between 2004 and 2005, WBCcount decreased significantly on North Brother (25,029 cells/μL±3018 to 20,456 cells/μL±1765) and increased significant-ly on Hoffman (15,732 cells/μL±1583 to 19,936 cells/μL±1811) (Fig. 1). Interactions between island and year were sig-nificant (p≤0.029) for WBC.
3.2. Biochemical analysis
Of 28 analytes in the biochemistry panel, results for 16analytes from Hoffman Island BCNH differed significantlyfrom one or both of the other islands. In 2004, CHOL, K, CA,PHOS, LIPA, AST, CPK, and ChE were significantly higher onHoffman Island, while TP, prealbumin, albumin, alpha 1, alpha

Table 2 (continued )
Biochemicalanalyte
CanarsiePol
Hoffman NorthBrother
All p-value
Basophils(cells/μL)Range 0–0 0–399 0–205 0–405
GLU (mg/dL)Mean±SE (n) 202±12
(7) AB200±8(30) B
228±8(31) A
213±5(68)
0.009
Median 201 202 237 218Range 171–266 71–293 124–308 71–308
CHOL (mg/dL)Mean±SE (n) 144±9
(7) AB126±7(30) B
161±10(26) A
142±6(63)
0.01
Median 143 125 161 141Range 111–180 60–217 56–258 56–258
TRIG (mg/dL)Mean±SE (n) 111±22
(7) AB85±8(30) B
116±7(28) A
101±6(65)
0.02
Median 111 81 117 97Range 39–220 29–166 31–187 29–220
NA (mmol/L)Mean±SE (n) 123±3
(7) A114±4(30) A
123±3(24) A
119±2(61)
0.08
Median 123 117 129 123Range 113–133 75–151 78–142 75–151
K (mmol/L)Mean±SE (n) 1.3±0.2
(6) B1.6±0.1(21) B
2.9±0.2(24) A
2.2±0.1(51)
b0.0001
Median 1.3 1.4 2.7 2Range 0.9–2.0 1.0–2.9 1.9–6.0 0.9–6.0
CO2 (mmol/L)Mean±SE (n) 22±1
(7) A16±1(30) B
20±1(24) A
18±1(61)
b0.0001
Median 21 15 20 18Range 19–26 11–23 12–30 11–30
CA (mg/dL)Mean±SE (n) 8.6±0.3
(7) AB7.3±0.4(30) B
8.8±0.4(31) A
8.2±0.3(68)
0.004
Median 8.8 7.9 9.5 8.9Range 7.1–9.9 2.8–12.6 1.9–11.4 1.9–12.6
PHOS (mg/dL)Mean±SE (n) 8.2±0.7
(7) AB7.7±0.6(30) B
9.6±0.4(31) A
8.6±0.3(68)
0.01
Median 7.7 7.3 10.1 8.9Range 6.4–11.3 2.8–14.9 4.1–13.0 2.8–14.9
AMY (U/L)Mean±SE (n) 805±81
(7) A667±29(30) A
730±45(30) A
709±25(67)
0.18
Median 806 661 773 740Range 461–
1055375–975
305–1120
305–1120
LIPA (U/L)Mean±SE (n) 49±15
(7) A26±4(30) A
21±3(29) A
26±3(66)
0.07
Median 36 19 16 19Range 14–105 4–105 5–65 4–105
AST (U/L)Mean±SE (n) 151±21
(7) A102±10(30) B
109±9(29) AB
110±7(66)
0.03
Median 130 80 94 95Range 97–249 38–273 22–235 22–273
ALT (U/L)Mean±SE (n) 23±3 (7) A 20±1
(30) A21±1(24) A
21±1(61)
0.42
Median 22 21 21 21Range 16–36 10–26 11–34 10–36
Table 2 (continued )
Biochemicalanalyte
CanarsiePol
Hoffman NorthBrother
All p-value
LDH (U/L)Mean±SE (n) 3314±
522 (7) AB2678±390(30) B
4461±435(31) A
3556±284 (68)
0.01
Median 3989 1573 4646 3699Range 1220–
4722693–8239 741–8287 693–8287
TP (g/dL)Mean±SE (n) 2.8±0.2
(8) A2.3±0.1(30) A
2.4±0.2(31) A
2.4±0.1(69)
0.2
Median 2.9 2.4 2.6 2.6Range 2.0–3.4 0.4–3.6 0.2–4.0 0.2–4.0
A/G ratioMean±SE (n) 0.88±
0.03 (8) B1.15±0.04(30) A
1.08±0.05(31) A
1.09±0.03 (69)
0.004
Median 0.91 1.15 1.05 1.07Range 0.76–0.99 0.61–1.68 0.47–1.79 0.47–1.79
Prealbumin (g/dL)Mean±SE (n) 0.10±
0.03 (8) A0.17±0.02(30) A
0.19±0.02(31) A
0.17±0.01 (69)
0.07
Median 0.10 0.14 0.19 0.14Range 0.02–0.26 0.03–0.37 0.01–0.38 0.01–0.38Fraction % 4% 7% 8% 7%
Albumin (g/dL)Mean±SE (n) 1.21±
0.08 (8) A1.06±0.06(30) A
1.03±0.06(31) A
1.06±0.04 (69)
0.45
Median 1.16 1.11 1.08 1.11Range 0.88–1.52 0.18–1.68 0.08–1.66 0.08–1.68Fraction % 43% 46% 43% 44%
Alpha 1 (g/dL)Mean±SE (n) 0.29±
0.03 (8) A0.24±0.02(30) A
0.26±0.02(31) A
0.26±0.01 (69)
0.29
Median 0.29 0.26 0.28 0.27Range 0.19–0.41 0.06–0.39 0.02–0.49 0.02–0.49Fraction % 10% 10% 11% 11%
Alpha 2 (g/dL)Mean±SE (n) 0.49±
0.07 (8) A0.28±0.02(30) B
0.46±0.04(31) A
0.39±0.02 (69)
0.0005
Median 0.50 0.25 0.52 0.36Range 0.15–0.71 0.06–0.58 0.04–0.87 0.04–0.87Fraction % 18% 12% 25% 16%
Beta (g/dL)Mean±SE (n) 0.40±
0.05 (8) A0.35±0.03(30) A
0.23±0.02(31) B
0.31±0.02 (69)
0.0008
Median 0.36 0.38 0.23 0.28Range 0.25–0.68 0.03–0.63 0.01–0.56 0.01–0.68Fraction % 14% 15% 10% 13%
Gamma (g/dL)Mean±SE (n) 0.31±
0.03 (8) A0.23±0.02(30) A
0.23±0.02(31) A
0.24±0.01 (69)
0.13
Median 0.28 0.22 0.23 0.23Range 0.21–0.43 0.02–0.48 0.02–0.46 0.02–0.48Fraction % 11% 10% 10% 10%
BUN (mg/dL)Mean±SE (n) 5±1
(7) A5±1(30) A
8±1(25) A
6±1 (62) 0.12
Median 5 5 7 5Range 3–9 2–13 2–21 2–21
CREA (mg/dL)Mean±SE (n) 0.4±0.1
(7) AB0.3±0.02(29) B
0.5±0.1(25) A
0.4±0.03(61)
0.008
Median 0.4 0.3 0.5 0.3Range 0.2–0.6 0.2–0.8 0.2–1.6 0.2–1.6
URIC (mg/dL)
368 S.H. Newman et al. / Comparative Biochemistry and Physiology, Part B 148 (2007) 363–374

Table 2 (continued )
Biochemicalanalyte
CanarsiePol
Hoffman NorthBrother
All p-value
Mean±SE (n) 5.3±1.6(7) AB
9.0±1.4(30) A
3.2±0.2(31) B
6.0±0.7(68)
0.002
Median 2.7 7.0 3.1 4.0Range 1.7–12.8 0.9–29.2 1.3–5.6 0.9–29.2
CPK (U/L)Mean±SE (n) 1028±465
(6) A1007±116(27) A
612±66(28) A
828±77(61)
0.08
Median 603 1090 611 699Range 321–3299 92–1920 70–1634 70–3299
ChE (U/mL)Mean±SE (n) 1.65±
0.22 (7) A1.14±0.06(30) B
1.35±0.11(24) AB
1.28±0.06 (61)
0.03
Median 1.46 1.09 1.44 1.22Range 1.05–2.56 0.46–2.01 0.48–2.21 0.46–2.56
Means with letters in common are not significantly different. The data in boldindicate whether significant differences exist among islands for varioushematological and biochemical analytes.a Median values were not calculated for differential white blood cell counts.
Fig. 1. Graph of the changes in mean WBC count on North Brother (red) andHoffman (blue) from 2004 to 2005. (For interpretation of the references tocolour in this figure legend, the reader is referred to the web version of thisarticle.)
369S.H. Newman et al. / Comparative Biochemistry and Physiology, Part B 148 (2007) 363–374
2, beta, gamma, and URIC were significantly lower. In 2005,only URIC was significantly higher on Hoffman Island whileGLU, CHOL, TRIG, CO2, PHOS, AST, LDH, alpha 2, CREA,and ChE were significantly lower. Additional differencesamong islands are presented in Tables 1 and 2.
3.3. Serological analysis
In 2004, 25% of BCNH chicks were positive (titer≥1.4) forAspergillus antibodies (Asp Ab), while 50%, 9%, and 37% werepositive from Goose Island, Hoffman Island and North BrotherIsland, respectively (Table 5). In the same year, 31% of BCNHchicks were positive for Aspergillus antigens (Asp Ag), while50%, 31%, and 27% were positive from Goose Island, HoffmanIsland and North Brother Island, respectively (Table 5). OneBCNH chick on Goose Island and one chick on Hoffman Islandtested in the strongly positive range. In 2005, no BCNH chickstested positive for Aspergillus antibodies or antigens on CanarsiePol. Also in 2005, 35% of BCNH chicks were poõsitive for AspAb, while 50%, and 28% were positive from Hoffman Island andNorthBrother Island, respectively (Table 5). In the same year, 38%were positive for AspAg, while 27%, and 58%were positive fromHoffman Island and North Brother Island, respectively (Table 5).
Flavivirus testing indicated that overall, 14% of birds testedin 2004 had antibody to WNV: 50%, 10%, and 13% werepositive from Goose Island, Hoffman Island and North BrotherIsland, respectively (Table 6). A total of 9% of birds tested in2005 had antibody to WNV, but no BCNH chicks sampled onCanarsie Pol tested positive. In that same year, 10% of BCNHchicks sampled on both Hoffman Island and North BrotherIsland tested positive for WNV antibodies (Table 6).
4. Discussion
Hematology and clinical chemistry parameters are importantin animal health evaluations because they specifically assess the
function and condition of organs, identify pathology, and po-tential exposure to diseases and contaminants. Establishingreference ranges for hematologic and biochemical parameterscan be difficult because variation in species, capture methods,sample collection techniques, storage and handling of samples,and methods of analysis may prevent accurate interpretations ofresults (Drew et al., 1993; Low et al., 2006). Parameters mayalso vary with age, sex, state of health and nourishment, habitat,height above sea level, hormone balance and season, and evo-lutionary and ecological implications (Keys et al., 1986;Sturkie, 1986; Hüppop, 1988; Palomeque et al., 1991; Newmanet al., 1997). Even in the face of these difficulties, they remainessential tools for distinguishing healthy birds from sick birds(Averbeck, 1991).
No blood-derived baseline health data for free rangingBCNH in New York Harbor or elsewhere exist although limiteddata on captive BCNH exist (International Species InformationSystem (ISIS) 2002; Celdrán et al., 1994; Polo et al., 1994).Data from captive BCNH studies are reported in Tables 3 and 4alongside the reference ranges established in this study, butdirect comparisons cannot be made because wild birds aresubject to different environmental stressors including thosefrom weather, climate, contaminants, pathogens and food re-sources, compared to captive birds.
4.1. Hematology and infectious agents
WBC is used to determine immune system function and is anindicator of an organism's response to infection (Hylton et al.,2006). It reflects the balance between supply and the need forleukocytes to defend the body against pathogens and other for-eign materials introduced into the body (Amand, 1986; Ravenand Johnson, 2002).
The total WBC reference range for 3-week-old BCNH inNew York Harbor is higher (x=19,535 cells/μL±908) thanWBC reference ranges reported for captive, adult BCNH(x=8430 cells/μL±3640 and 13,330 cells/μL±7451) (Celdránet al., 1994; ISIS, 2002 respectively) (Table 3), with chicks from

Table 3Comparison between previous research on hematology of captive adult BCNHand the reference ranges calculated for BCNH chicks in New York Harbor(2004–2005)
Hematologicalparameter
ISIS a Hematology fromCeldrán et al. 1994 b
New York HarborBCNH (2004–2005)
PCVMean±SE (n) 42.8±5.5 (24) 44.8±3.0 (48) 34.5±0.4 (134)Median – – 35.0Range 32.0–53.0 38.0–51.0 23.0–42.0
TSMean±SE (n) – – 3.1±0.04 (135)Median – – 3.1Range – – 1.5–4.4
WBC (cells/μL)Mean±SE (n) 13,330±7451
(21)8430±3640 (48) 19,535±908 (130)
Median – – 17,806Range 1700–29,400 3120–19,000 1227–54,784a Results from ISIS are reported as Mean±SD.b Results from Celdrán et al. (1994) are reported as Mean±SD.
Table 4Comparison between previous research on biochemistry of captive adult BCNH andthe reference ranges calculated for BCNH chicks in New York Harbor (2004–2005)
Biochemicalanalyte
ISIS a Polo et al.(1994) b
New York Harbor BCNH(2004–2005)
GLU (mg/dL)Mean±SE (n) 259±64 (17) 239±38 (45) 195±4 (144)Median – – 199Range 129–420 148–326 71–308
CHOL (mg/dL)Mean±SE (n) 172±54 (9) 240±54 (45) 144±4 (139)Median – – 141Range 69–234 93–329 50–258
TRIG (mg/dL)Mean±SE (n) 84±51 (2) 83±18 (45) 89±5 (142)Median – – 82Range 48–120 35–159 19–466
NA (mmol/L)Mean±SE (n) 149±5 (10) 151±11 (36) 122±1 (137)Median – – 126Range 142–156 128– 169 75–151
K (mmol/L)Mean±SE (n) 2.5±0.6 (10) 3.9±0.7 (36) 2.1±0.1 (125)Median – – 1.9Range 1.7–3.4 2.7–5.7 0.9–6.0
CO2 (mmol/L)Mean±SE (n) 14±4 (6) – 19±0.4 (137)Median – – 19Range 7–17 – 10–30
CA (mg/dL)Mean±SE (n) 10.7±3.2 (16) 8.8±1.6 (36) 8.5±0.2 (145)Median – – 9.1Range 7.9–18.0 6.4–16.8 1.9–12.6
PHOS (mg/dL)Mean±SE (n) 4.9±3.6 (13) 19.2±3.7 (36) 8.9±0.2 (145)Median – – 9.2Range 1.7–14.7 13.3–30.7 2.8–14.9
AMY (U/L)Mean±SE (n) 1490±212 (4) – 749±18 (144)Median – – 767Range 1200–1671 – 242–1291
LIPA (U/L)Mean±SE (n) – – 37±2 (142)Median – – 29Range – – 4–148
AST (U/L)Mean±SE (n) 129±48 (16) 79±44 (45) 130±6 (142)Median – – 112Range 56–220 7–217 22–466
ALT (U/L)Mean±SE (n) 11±2 (4) 13±6 (45) 20±0.4 (136)Median – – 20Range 9–13 2–35 7–36
LDH (U/L)Mean±SE (n) 171±86 (11) 534±270 (45) 4443±246 (143)Median – – 4490Range 88–375 195–1183 606–14734
CPK (U/L)Mean±SE (n) 735±591 (12) 407±296 (45) 1681±133 (137)Median – – 1236Range 147–2113 112–1456 89–7602
TP (g/dL)Mean±SE (n) 3.9±0.8 (23) 3.4±0.5 (39) 2.6±0.1 (146)Median – – 2.6Range 2.6–6.6 2.1–4.3 0.2–5.0
A/G ratioMean±SE (n) – – 1.05±0.02 (146)
370 S.H. Newman et al. / Comparative Biochemistry and Physiology, Part B 148 (2007) 363–374
North Brother Island (2004) having the highest mean WBC(25,029 cells/μL±3018). Chicks generally have higher WBCthan adults, especially in wild populations, potentially due totheir being immunologically naïve and being exposed for thefirst time, to a variety of antigens (del Pilar Lanzarot et al.,2001).
Elevated WBC counts may also be the consequence of ex-posure to contaminants or bacteria, parasites, viruses, fungi, orparasites. In 2004, 25% of BCNH chicks were positive for AspAb, and 31% were positive for Asp Ag, while in 2005, a slightlyhigher percentage of birds were positive for both Asp Ab (35%)and Asp Ag (38%) (Table 5). In comparison, 14% of BCNHchicks were positive for WNV antibodies in 2004, compared to9% in 2005 (Table 6). Of the 11 WNV positive birds in 2004, 4were also positive for Asp Ab and 1 was positive for Asp Ag.
It is possible that these positive WNV results in 3-week-oldBCNH may demonstrate passive transfer of maternal WNVantibodies via the egg to the young, as demonstrated in screechowls, whereWNVantibodies were detected for a month in chicks(Hahn et al., 2006). However, passive transfer ofWNVantibodiesto chicks seems less likely than birds actually being exposed toWNV because no chicks from Canarsie Pol were positive forWNVin 2005. If passive transfer were occurring, one would haveexpected Canarsie Pol birds to be positive also. Furthermore,maternal transfer of antibodies to Aspergillus has been demon-strated in African black-footed penguins (Graczyk and Cranfield,1995). Interestingly, birds from Canarsie Pol were also free ofantibodies and antigens to Aspergillosis, suggesting that birdsreared in this locationwere less likely to be exposed to 2 infectiousagents known to be prevalent in the New York metropolitan area.The reason for this is not known, and this result may be due tosmall sample sizes, but further investigation would provideinsight into whether chicks reared on this island are truly“protected” from exposure to potential pathogens.
Inter-annual comparisons of Hoffman Island and NorthBrother Island revealed that geographic location (the islandfactor), as well as the interaction between island and year had a

Table 4 (continued )
Biochemicalanalyte
ISIS a Polo et al.(1994) b
New York Harbor BCNH(2004–2005)
A/G ratioMedian – – 1.03Range – – 0.47–1.79
Prealbumin (g/dL)Mean±SE (n) – 0.408 ± 0.204
(39)0.169±0.008 (146)
Median – – 0.143Range – 0.068–0.748 0.008–0.505
Albumin (g/dL)Mean±SE (n) 1.400 ± 0.200
(13)1.462 ± 0.238(39)
1.121±0.031 (146)
Median – – 1.108Range 1.000–1.700 1.020–1.870 0.084–2.215
Alpha 1 (g/dL) c
Mean±SE (n) – 0.612 ± 0.136(39)
0.285±0.011 (146)
Median – – 0.275Range – 0.340–1.020 0.016–0.779
Alpha 2 (g/dL)Mean±SE (n) – – 0.329±0.014 (146)Median – – 0.298Range – – 0.021–0.868
Beta (g/dL)Mean±SE (n) – 0.646 ± 0.136
(39)0.410±0.016 (146)
Median – – 0.400Range – 0.374–0.850 0.015–1.025
Gamma (g/dL)Mean±SE (n) – 0.272 ± 0.102
(39)0.262±0.010 (146)
Median – – 0.241Range – 0.068–0.544 0.014–0.675
BUN (mg/dL)Mean±SE (n) 2±1 (3) 3±2 (45) 7±0.4 (137)Median – – 6Range 1–3 1–7 2–25
CREA (mg/dL)Mean±SE (n) 0.8±0.2 (4) 1.6±2.1 (45) 0.4±0.03 (137)Median – – 0.3Range 0.5–0.9 0.7–9.4 0.1–1.7
URIC (mg/dL)Mean±SE (n) 4.3±2.0 (15) 0.006 ± 0.002
(45)9.3±0.6 (145)
Median – – 7.3Range 0.6–7.2 0.003–0.012 0.9–37.5a Results from ISIS are reported as Mean±SD.b Results from Polo et al. (1994) are reported as Mean±SD.c Alpha globulins are not separated in the Polo et al. (1994) study, and are
reported as one mean.
Table 5Results of Aspergillus antibody and antigen tests on 2004 and 2005 data,reported as percentages of weak positives, moderate positives and strongpositives
Goose Island2004 (n=6)
Hoffman Island2004 (n=33)
North Brother Island2004 (n=30)
Asp Ab% Weakpositives (n)
17% (1) 3% (1) 27% (8)
% Moderatepositives (n)
17% (1) 3% (1) 10% (3)
% Strongpositives (n)
17% (1) 3% (1) 0% (0)
Total positive(2004)
50% (3) 9% (3) 37% (11)
Goose Island2004 (n=6)
Hoffman Island2004 (n=39)
North Brother Island2004 (n=30)
Asp Ag% Weakpositives (n)
50% (3) 31% (12) 27% (8)
% Moderatepositives (n)
0% (0) 0% (0) 0% (0)
% Strongpositives (n)
0% (0) 0% (0) 0% (0)
Total positive(2004)
50% (3) 31% (12) 27% (8)
Canarsie Pol2005 (n=7)
Hoffman Island2005 (n=30)
North Brother Island2005 (n=29)
Asp Ab% Weakpositives (n)
0% (0) 37% (11) 21% (6)
% Moderatepositives (n)
0% (0) 13% (4) 7% (2)
% Strongpositives (n)
0% (0) 0% (0) 0% (0)
Total positive(2005)
0% (0) 50% (15) 28% (8)
Canarsie Pol2005 (n=7)
Hoffman Island2005 (n=29)
North Brother Island2005 (n=29)
Asp Ag% Weakpositives (n)
0% (0) 7% (2) 17% (5)
% Moderatepositives (n)
0% (0) 13 % (4) 41% (12)
% Strongpositives (n)
0% (0) 7% (2) 0% (0)
Total positive(2005)
0% (0) 28% (8) 59% (17)
371S.H. Newman et al. / Comparative Biochemistry and Physiology, Part B 148 (2007) 363–374
significant effect on the WBC count. North Brother Island islocated 27.86 km from Hoffman Island and BCNH nesting onNorth Brother Island forage in Long Island Sound and the HarlemRiver while BCNH nesting on Hoffman Island forage in StatenIsland and Monmouth Country, NJ . However, BCNH from bothislands have been observed foraging in the HackensackMeadow-lands region of New Jersey (Bernick, 2007). Such foragingpatternsmay provide greater insight intowhy spatial and temporaltrends in BCNH WBC may be taking place.
Prey items in BCNH diets typically include a variety of fish,invertebrates, reptiles, and mammals (Bernick, 2007), and there
is a close relationship between food intake and the bioaccumu-lation of contaminants (Gray, 2002). Contaminants can act asantigens or inflammatory agents when ingested, and this may bean important factor in WBC variation between BCNH onHoffman and North Brother Islands. Industrialization, urbani-zation, and habitat removal/alteration have intensely degradedthe New York Harbor ecosystem, resulting in the input ofcontaminants such as PCBs and organophosphates (Iannuzziet al., 2004). Killifish (mummichog — Fundulus heteroditus)from the New York/New Jersey Harbor Estuary, a prey item forBCNH (Bernick, 2007), have PCB tissue concentrationsapproximately 10-fold higher than reference fish from non-

Table 6Results from West Nile Virus screening for 2004 and 2005 data
GooseIsland 2004(n=6)
HoffmanIsland 2004(n=40)
North BrotherIsland 2004(n=31)
TotalPositive2004
% PRNT-90 positivefor WNVantibodies (n)
50% (3) 10% (4) 13% (4) 14% (11)
CanarsiePol 2005(n=8)
HoffmanIsland 2005(n=30)
North BrotherIsland 2005(n=30)
TotalPositive2005
% PRNT-90 positivefor WNVantibodies (n)
0% (0) 10% (3) 10% (3) 9% (6)
372 S.H. Newman et al. / Comparative Biochemistry and Physiology, Part B 148 (2007) 363–374
contaminated sites in Long Island and Rhode Island (Iannuzzi etal., 2004). Top predators in aquatic systems like BCNH aresensitive to exposure to PCBs, which can affect reproduction bycausing decreased production, decreased hatchability (embryomortality) and abnormal breeding behavior. Exposure to PCBscan also compromise immune status, hormonal homeostasis andbehavior (O'Hara and Rice, 1996).
The H:L ratio has also been utilized as an indicator ofimmune system function and long-term changes in the envi-ronment (Gross and Siegel, 1983). The H:L ratios were 1:2 in2004 and 1:5 in 2005, compared to 0.4 in unstressed chickens(Gross and Siegel, 1983; Amand, 1986). An increased het-erophil count in NY Harbor BCNH due to stress or exposure tobacteria, parasites, viruses fungi, or contaminants is likely thecause of the high H:L ratio observed in herons in NY Harbor.
4.2. Biochemistry
In 2004, CHOL, K, CA, PHOS, LIPA, AST, CPK, and ChEwere significantly higher in birds from Hoffman Island and TP,prealbumin, albumin, alpha 1, alpha 2, beta, gamma, and URICwere significantly lower than one or both of the other islands.These results suggest slightly compromised health in BCNHchicks reared on Hoffman Island in 2004 with changes mostcommonly being associated with muscle, liver and the immunesystem. Possible explanations for these subtle differences, in-clude: (1) contaminant levels at foraging sites used by birdsnesting on Hoffman differed between 2004 and 2005; (2) preyavailability and abundance differed among years causing birdsto forage in different locations in 2004, although regurgitantanalyses have shown no significant differences in prey itemsfrom 2004 to 2005 for BCNH from Hoffman Island (Bernick,pers. comm.); or (3) local island conditions such as air tem-perature, weather, vegetation changes leading to less protectionfrom the wind, sun and rain, or humidity could have differed,thereby leading to changes in biochemical analytes associatedwith increased exertion and stress during handling.
On Hoffman Island in 2004 a total of 16 biochemicalanalytes differed significantly from North Brother and GooseIslands. Significant differences were measured from BCNH onHoffman Island in 2004, but some of the more important find-ings include higher activity of AST, LDH, and CPK. Increased
AST activity has been associated with hepatic disease in cagedbirds (Galvin, 1980), and muscle damage and muscular dys-trophy in domestic fowl (Dobado-Berrios et al., 1998). LDHand CPK levels were extremely high in BCNH on Hoffman in2004, possibly signifying that chicks on that island were moresensitive to capture and handling. Increased LDH activity hasalso been associated with increased muscle activity or musclestress in birds (Franson et al., 1985). In a study of Alaskanseabirds, it was found that extended handling of birds could leadto capture myopathy, a potentially fatal syndrome, which in turnresulted in elevated AST, LDH, and CPK activity (Wobeser,1981; Franson, 1982; Allen, 1988; Newman et al., 1997). In2005, activity of AST, LDH, and CPK decreases to such anextent that they are significantly lower than activity of AST,LDH, and CPK of BCNH chicks from Canarsie Pol and NorthBrother Island suggesting that in 2004, some aspect of localenvironmental conditions or previous disturbances on the is-land, such as increased human visitation or boat harassment,differed for birds reared on Hoffman Island.
Also, on Hoffman Island in 2004, TP and the alpha 1, alpha 2,beta and gamma globulins were significantly lower than Gooseand North Brother Islands. Additionally, WBC on HoffmanIsland in 2004 was the lowest of all 3 islands. The levels of theseglobulins are influenced by inflammation, infection, and nu-tritional and physiological condition (Driver, 1981; Grasman etal., 2000). Elevated globulin levels are usually associated withexposure to antigens and, if birds are healthy, a good immuneresponse (Rosskopf et al., 1982). This appears to not haveoccurred in 2004 for Hoffman Island birds, suggesting com-promised health.
It is worth noting that sample quality may affect the valuesfound in this study. There were no significant differences in TSvalues measured after sample collection, but there were significantdifferences in TP values in 2004, measured from serum samplesthat had been frozen for almost a year. Both were measured usingrefractometers. However, the refractometer used for TS (HeskaVeterinary Refractometer, CAT 317) was temperature compensat-ed, while the refractometer for TPwas not, whichmay have causeda difference. A study of samples from orange-winged Amazonparrots showed that freezing and hemolysis can affect biochemicalvalues (Hawkins et al., 2006).
Additionally, the growth rate of BCNH chicks in New YorkHarbor raises questions about their overall health. Custer andPeterson (1991) found that the growth rate of BCNH chicks inTexas and Rhode Island were similar among colonies. In com-parison, current growth rates and the growth rates of BCNHchicks in New York in the 1990s and earlier this decade arenoticeably slower than chicks in Texas and Rhode Island(Parsons, pers. comm.). Ultimately these differing growthrates may be linked back to the overall health of BCNH inNew York — less optimal health conditions potentially due toincreased contaminants or lower quality or abundance of prey,leading to slower growth rates.
The most interesting finding in this bi-annual assessment ofBCNH in New York Harbor has been the changing health ofBCNH chicks on Hoffman Island from 2004 to 2005: (1) 16 ofthe 28 biochemical analytes examined differed significantly on

373S.H. Newman et al. / Comparative Biochemistry and Physiology, Part B 148 (2007) 363–374
Hoffman Island in 2004 compared to other island birds; (2)inter-annual comparison showed that in 2005, 10 of the 16analytes no longer differed; (3) the increased globulin concen-trations but decreased WBC in 2004 on Hoffman Island; (4) theslower growth rates of BCNH chicks in New York Harborcompared to BCNH chicks elsewhere. Collectively, these pro-vide strong evidence that some aspect of their ecological con-ditions or habitat compromised the health of BCNH chicks onHoffman Island in 2004.
This study is the first of its kind in the New York Harbor, andis only the first step to understanding the overall health of thisecosystem and the ways in which it is used by wildlife. Thefindings in this study highlight the need to conduct more de-tailed health studies on these top predatory birds in this eco-system, determine precisely where birds nesting on differentislands forage, and, at the same time, conduct toxicologicalassessments of prey they consume or feed to their offspring.
Acknowledgements
Thanks to all the field personnel: Dr. S. Elbin, Dr. C.Weseloh,Dr. F. Koontz, S. Schmidt, K. Tripp, A. Bernick, J. Ball, L.Powell, A. Summers, V. Carr, M. Greenberg, E. Lammers, A.Harari, D. Adams, N. McVay, J. Hurley, S. Newman, R.Summers, A. Gomez, S. Green, and L. Keith. Thanks to theDivision ofComparative Pathology at theUniversity ofMiami forbiochemical analytes and Aspergillus titers and M.J. Jones, J.G.Maffei, A.P. Dupuis II of the Arbovirus Laboratory at theNew York State Department of Health for WNV testing, andDr. R. Anderson and Dr. R. Sambrotto of Lamont-DohertyEarth Observatory of Columbia University for use of labspace. Thanks to the following people for consultation andfacilitating research: Dr. K. Parsons of MANOMET, P. Kerlinger,Y. Gelb, and E.J. McAdams of New York City Audubon, A.Brash, B. Tai and M. Feller of New York City Parks andRecreation, D. Reipe of the American Littoral Society, T. Kubiakof the Environmental Contaminants Division of the New JerseyField Office, USFWS, Dr. T. Custer of USGS, C. Corsiglia, Dr.F. Tseng, S. Zelman, and Dr. M. Pokras of Tufts UniversitySchool of Veterinary Medicine, Dr. J. Zinkl of University ofCalifornia Davis, Dr. K. Quesenberry of the Animal MedicalCenter, New York, Dr. M. Denver of the Baltimore Zoo, A.Dupuis II of the New York State Department of Health —Wadsworth Center, Dr. J. Burger and Dr. M. Gochfeld ofRutgers University, C. VonSchilgen, J. Pane, and D. Rosenblattof New York Department of Environmental Conservation, J,Hall of the Palisades Interstate Park Commission, D. Taft, C.Olijnyk, C. Grayson, S. Schiffe, and B. Commins of GatewayNational Recreation Area, R. Merriken and R. Murphy ofBayhead Marina, R. Poppenga of University of PennsylvaniaSchool of Veterinary Medicine, M. Karpfinger and D. Kunstlerof Pelham Bay Park, L. Dierauf of USGS National WildlifeHealth Center, Dr. B.Mailloux and Dr. J. Glendinning of BarnardCollege, and Dr.M. Palmer of Columbia University. Fundingwasprovided by Wildlife Trust, VKR (V. Kann RasmussenFoundation), the New York Community Trust, and the NewYork Bioscape Initiative. Permits were provided by NYC Parks
and Recreation, Gateway National Recreation Area — NationalPark Service, and Palisades Interstate Park Commission. Thiswork was conducted under New York State Permit (LCP03-593),National Park Service (GATE-2004-SCI-0006), and USGSfederal banding permit (23070). We would like to express oursincerest appreciation to A. Bernick of CUNY — GraduateCenter, Staten Island, and Dr. S. Elbin of Wildlife Trust forfacilitating this project.
References
Adams, D.A., Benyi, S., 2003. Sediment quality of the NY/NJ Harbor system: a5-year revisit. An Investigation Under the Regional EnvironmentalMonitoring and Assessment Program (REMAP). U. S. E. P. Agency,Edison, NJ.
Allen, J.L., 1988. An overview of avian serum chemical profiles. In: Jacbonson,E.R., Kollias, G.V. (Eds.), Exotic Animals. Churchill Livingstone, NewYork, NY.
Amand,W.B., 1986. Avian clinical hematology and blood chemistry. In: Fowler,M.E. (Ed.), Zoo and Wild Animal Medicine. W. B. Saunders Co,Philadelphia, Pennsylvania, pp. 264–276.
Averbeck, C., 1991. Herring gull Larus argentatus Pont. and great black-backedgull Larus marinus L. haematology as a tool in bioindication. ZeitschriftVerein Jordsand 12 (4), 74–78.
Bernick, A.J., 2005. New York City Audubon's Harbor Herons Project: 2005Interim Nesting Survey. New York City Audubon, New York.
Bernick, A.J. (2007). Foraging Ecology of Black-crowned Night-Herons in theNew York City Area, City University of New York—Graduate Center. PhDDissertation.
Brosnan, T.M., O'Shea, M., 1996. Long-term improvements in water qualitydue to sewage abatement in the lower Hudson River. Estuaries 19 (4),890–900.
Burger, J., Gochfeld, M., 2004. Marine Birds as Sentinels of EnvironmentalPollution. EcoHealth.
Butler, R.W., Kushlan, J.A., Davidson, I.J., 2000. Herons in North America,Central America and the West Indies. In: Kushlan, J.A., Hafner, H. (Eds.),Heron Conservation. Academic Press, San Diego, CA, pp. 151–176.
Campbell, T.W., 1995. Avian Hematology and Cytology, 2nd Edition. IowaState Press.
Celdrán, J., Polo, F.J., Peinado, V.I., Viscor, G., Palomeque, J., 1994. Haematologyof captive herons, egrets, spoonbill, ibis and gallinule. ComparativeBiochemistry and Physiology Part A: Physiology 107 (2), 337–341.
Custer, T.W., Peterson, D.W., 1991. Growth rates of great egret, snowy egret andblack-crowned night heron chicks. Colonial Waterbirds 14 (1), 46–50.
del Pilar Lanzarot, M., Montesinos, A., Andres, M.I.S., Rodrıguez, C.,Barahona, M.V., 2001. Hematological, protein electrophoresis and cholin-esterase values of free-living nestling peregrine falcons in Spain. Journal ofWildlife Diseases 37 (1), 172–177.
Dobado-Berrios, P.M., Tella, J.L., Ceballos, O., Donázar, J.A., 1998. Effects ofage and captivity on plasma chemistry values of the Egyptian vulture. TheCondor 100 (4), 719–725.
Drew, M.L., Joyner, K., Lobingier, R., 1993. Laboratory reference intervals for agroup of captive thick-billed parrots (Rhynchopsitta pachyrhyncha). Journalof the Association of Avian Veterinarians 7 (1), 35–38.
Driver, E.A., 1981. Hematological and Blood Chemical Values of Mallard,Anas p. platyrhynchos, Drakes Before, During and After Remige Moult.,17, pp. 413–421.
Dupuis II, A.P., Marra, P.P., Reitsma, R., Jones, M.J., Louie, K.L., Kramer, L.D.,2005. Serologic evidence for West Nile virus transmission in Puerto Ricoand Cuba. American Journal of Tropical Medicine and Hygiene 73 (2),474–476.
Ebel, G.D., Dupuis, A.P., Nicholas, D., Young, D., Maffei, J., Kramer, L.D.,2002. Detection by enzyme-linked immunosorbent assay of antibodies toWest Nile virus in birds. Emerging Infectious Diseases 8 (9), 979–982.
Franson, J.C., 1982. Enzyme activities in plasma, liver and kidney of blackducks and mallards. Journal of Wildlife Diseases 18 (4), 481–485.

374 S.H. Newman et al. / Comparative Biochemistry and Physiology, Part B 148 (2007) 363–374
Franson, J.C., Murray, H.C., Bunck, C., 1985. Enzyme activities in plasma,kidney, liver, and muscle of five avian species. Journal of Wildlife Diseases21 (1), 33–39.
Galvin, C.E., 1980. Laboratory diagnostic aids in pet bird practice. Proceedingsof the American Animal Hospital Association. A.A.H.A., South Bend, IN.
Graczyk, T.K., Cranfield, M.R., 1995. Maternal transfer of anti-Aspergillus spp.Immunoglobulins in African black-footed penguins (Spheniscus demersus).Journal of Wildlife Diseases 31 (4), 545–549.
Grasman, K.A., Armstrong, M., Hammersley, D.L., Scanlon, P.F., Fox, G.A.,2000. Geographic variation in blood plasma protein concentrations of youngherring gulls (Larus argentatus) and Caspian terns (Sterna caspia) from theGreat Lakes and Lake Winnipeg. Comparative Biochemistry and Physiol-ogy. Part C, Pharmacology Toxicology and Endocrinology 125 (3),365–375.
Gray, J.S., 2002. Biomagnification in marine systems: the perspective of anecologist. Marine Pollution Bulletin 45 (1–12), 46–52.
Gross, W.B., Siegel, H.S., 1983. Evaluation of the heterophil/lymphocyte ratioas a measure of stress in chickens. Avian Diseases 27 (4), 972–979.
Hahn, D.C., Nemeth, N.M., Edwards, E., Bright, P.R., Komar, N., 2006. PassiveWest Nile virus antibody transfer from maternal eastern screech-owls(Megascops asio) to progeny. Avian Diseases 50 (3), 454–455.
Hawkins, M.G., Kass, P.H., Zinkl, J.G., Tell, L.A., 2006. Comparison ofbiochemical values in serum and plasma, fresh and frozen plasma, andhemolyzed samples from orange-winged Amazon parrots (Amazonaamazonica). Veterinary Clinical Pathology 35 (2), 219–225.
Hüppop, O., 1988. Seasonal changes of erythrocyte numbers and haemoglobincontent in the blood of herring gulls (Larus argentatus). Seabirds 11, 12–16.
Hylton, R.A., Frederick, P.C., Fuente, T.E.D.L., Spalding, M.G., 2006. Effectsof nestling health on postfledging survival of wood storks. The Condor 108(1), 97–106.
Iannuzzi, T.J., Armstrong, T.N., Thelen, J.B., Ludwig, D.F., Firstenberg, C.E.,2004. Chemical contamination of aquatic organisms from an urbanized riverin the New York/New Jersey Harbor Estuary. Human and Ecological RiskAssessment 10 (2), 389–413.
ISIS, 2002. Nycticorax nycticorax, Black-crowned Night-heron.Ivey, E.S., 2000. Serologic and plasma protein electrophoretic findings in 7
Psittacine birds with Aspergillosis. Journal of Avian Medicine and Surgery14 (2), 103–106.
Jain, N.C., 1986. Schalm's Veterinary Hematology, 4th Edition. Lea andFebiger, Philadelphia, PA, pp. 20–87.
Keys, C.C., Fleischer, R.C., Rothstein, S.J., 1986. Relationship betweenelevation, reproduction and the hematocrit level of Brown-headed Cow-birds. Comparative Biochemistry and Physiology. Part A. Physiology 83(A), 765–769.
Low, M., Eason, D., Elliott, G., McInnes, K., Paul-Murphy, J., 2006.Hematologic and biochemical reference ranges for the kakapo (Strigopshabroptilus): generation and interpretation in a field-based wildlife recoveryprogram, School of Veterinary Medicine, University of Wisconsin.
Newman, S.H., Carr, V., Greenberg, M., 2004. Health Assessments of Black-crowned Night Heron Chicks from Island in the New York Harbor Estuary.Wildlife Trust, New York, p. 15.
Newman, S.H., Piatt, J.F., White, J., 1997. Hematological and Plasmabiochemical reference ranges of Alaskan seabirds: their ecologicalsignificance and clinical importance. Colonial Waterbirds 20 (3), 492–504.
O'Hara, T.M., Rice, C.D., 1996. Polychlorinated biphenyls. In: Fairbrother, A.,Locke, L., Hoff, G.L. (Eds.), Non-infectious Diseases ofWildlife. Iowa StateUniversity Press, Ames, IA, pp. 71–86.
Palomeque, J., Pinto, D., Viscor, G., 1991. Hematologic and blood chemistryvalues of the Masai ostrich (Struthio camelus). J Wildl Dis 27 (1), 34–40.
Parsons, K.C., 1994. The Arthur Kill oil spills: biological effects in birds. In:Burger, J. (Ed.), Before and After an Oil Spill: The Arthur Kill. RutgersUniversity Press, New Brunswick, NJ, pp. 215–237.
Parsons, K.C., Schmidt, S.R., Matz, A.C., 2001. Regional patterns of wadingbird productivity in northeastern U.S. estuaries. Waterbirds 24 (3), 323–330.
Petitclerc, C., Kelly, A., 1981. Transferability of reference data. In: Grasbeck,R., Alstom, T. (Eds.), Reference Values in Laboratory Medicine. John Wileyand Sons, New York, NY, pp. 177–192.
Polo, F.J., Celdrán, J., Viscor, G., Palomeque, J., 1994. Blood-chemistry ofcaptive herons, egrets, spoonbill, ibis and gallinule. Comparative Biochem-istry and Physiology. Part A, Physiology 107 (2), 343–347.
Raven, P.H., Johnson, G.B., 2002. Biology. McGraw Hill, New York, NY.Rosskopf, W.J., Woerpel, R.W., Rosskopf, G., VanDeWater, D., 1982.
Hematologic and blood chemistry values for common pet avian species.V.M./S.A.C., vol. 77, p. 1233.
Solberg, H., 1981. Statistical treatment of collected reference values anddetermination of reference limits. In: Grasbeck, R., Alstom, T. (Eds.),Reference Values in Laboratory Medicine. John Wiley and Sons, New York,NY, pp. 193–205.
Steinberg, N., Suszkowski, D.J., Clark, L., Way, J., 2004. Health of theharbor: the first comprehensive look at the state of the NY/NJ harborestuary. New York, NY, NY/NJ Harbor Estuary Program; Hudson RiverFoundation, p. 82.
Sturkie, P.D., 1986. Avian Physiology. Springer, New York.Wobeser, G.A. (Ed.), 1981. Diseases of wild waterfowl. Plenum Press, New
York.Zinkl, J.G., 1986. Avian Hematology. Schalm's Veterinary Hematology, 4th
Edition. Lea and Febiger, N.C. Jain. Philadelphia, PA, pp. 256–274.