Head and Media Challenges for 3 Tb/inSq Microwave Assisted Magnetic Recording
9
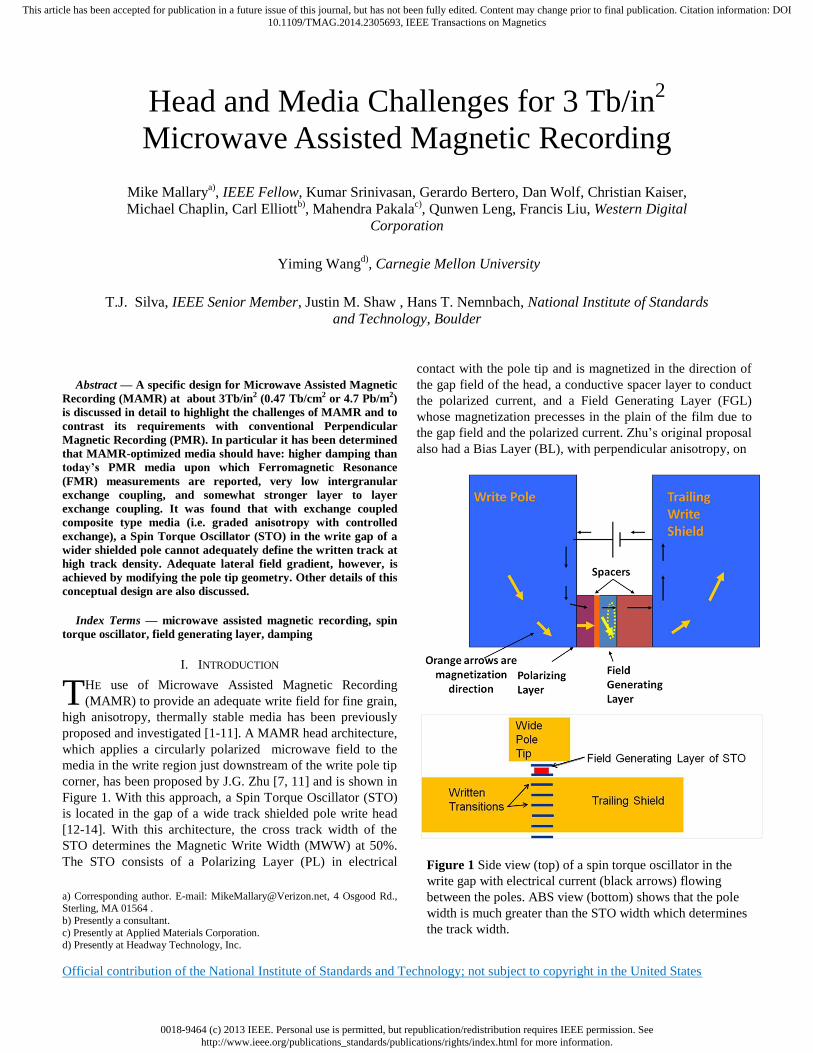
0018-9464 (c) 2013 IEEE. Personal use is permitted, but republication/redistribution requires IEEE permission. See http://www.ieee.org/publications_standards/publications/rights/index.html for more information. This article has been accepted for publication in a future issue of this journal, but has not been fully edited. Content may change prior to final publication. Citation information: DOI 10.1109/TMAG.2014.2305693, IEEE Transactions on Magnetics Official contribution of the National Institute of Standards and Technology; not subject to copyright in the United States Abstract — A specific design for Microwave Assisted Magnetic Recording (MAMR) at about 3Tb/in 2 (0.47 Tb/cm 2 or 4.7 Pb/m 2 ) is discussed in detail to highlight the challenges of MAMR and to contrast its requirements with conventional Perpendicular Magnetic Recording (PMR). In particular it has been determined that MAMR-optimized media should have: higher damping than today’s PMR media upon which Ferromagnetic Resonance (FMR) measurements are reported, very low intergranular exchange coupling, and somewhat stronger layer to layer exchange coupling. It was found that with exchange coupled composite type media (i.e. graded anisotropy with controlled exchange), a Spin Torque Oscillator (STO) in the write gap of a wider shielded pole cannot adequately define the written track at high track density. Adequate lateral field gradient, however, is achieved by modifying the pole tip geometry. Other details of this conceptual design are also discussed. Index Terms — microwave assisted magnetic recording, spin torque oscillator, field generating layer, damping I. INTRODUCTION HE use of Microwave Assisted Magnetic Recording (MAMR) to provide an adequate write field for fine grain, high anisotropy, thermally stable media has been previously proposed and investigated [1-11]. A MAMR head architecture, which applies a circularly polarized microwave field to the media in the write region just downstream of the write pole tip corner, has been proposed by J.G. Zhu [7, 11] and is shown in Figure 1. With this approach, a Spin Torque Oscillator (STO) is located in the gap of a wide track shielded pole write head [12-14]. With this architecture, the cross track width of the STO determines the Magnetic Write Width (MWW) at 50%. The STO consists of a Polarizing Layer (PL) in electrical a) Corresponding author. E-mail: [email protected], 4 Osgood Rd., Sterling, MA 01564 . b) Presently a consultant. c) Presently at Applied Materials Corporation. d) Presently at Headway Technology, Inc. contact with the pole tip and is magnetized in the direction of the gap field of the head, a conductive spacer layer to conduct the polarized current, and a Field Generating Layer (FGL) whose magnetization precesses in the plain of the film due to the gap field and the polarized current. Zhu’s original proposal also had a Bias Layer (BL), with perpendicular anisotropy, on Figure 1 Side view (top) of a spin torque oscillator in the write gap with electrical current (black arrows) flowing between the poles. ABS view (bottom) shows that the pole width is much greater than the STO width which determines the track width. Head and Media Challenges for 3 Tb/in 2 Microwave Assisted Magnetic Recording Mike Mallary a) , IEEE Fellow, Kumar Srinivasan, Gerardo Bertero, Dan Wolf, Christian Kaiser, Michael Chaplin, Carl Elliott b) , Mahendra Pakala c) , Qunwen Leng, Francis Liu, Western Digital Corporation Yiming Wang d) , Carnegie Mellon University T.J. Silva, IEEE Senior Member, Justin M. Shaw , Hans T. Nemnbach, National Institute of Standards and Technology, Boulder T
-
Upload
independent -
Category
Documents
-
view
2 -
download
0
Transcript of Head and Media Challenges for 3 Tb/inSq Microwave Assisted Magnetic Recording
0018-9464 (c) 2013 IEEE. Personal use is permitted, but republication/redistribution requires IEEE permission. Seehttp://www.ieee.org/publications_standards/publications/rights/index.html for more information.
This article has been accepted for publication in a future issue of this journal, but has not been fully edited. Content may change prior to final publication. Citation information: DOI10.1109/TMAG.2014.2305693, IEEE Transactions on Magnetics
Official contribution of the National Institute of Standards and Technology; not subject to copyright in the United States
Abstract — A specific design for Microwave Assisted Magnetic
Recording (MAMR) at about 3Tb/in2 (0.47 Tb/cm2 or 4.7 Pb/m2)
is discussed in detail to highlight the challenges of MAMR and to
contrast its requirements with conventional Perpendicular
Magnetic Recording (PMR). In particular it has been determined
that MAMR-optimized media should have: higher damping than
today’s PMR media upon which Ferromagnetic Resonance
(FMR) measurements are reported, very low intergranular
exchange coupling, and somewhat stronger layer to layer
exchange coupling. It was found that with exchange coupled
composite type media (i.e. graded anisotropy with controlled
exchange), a Spin Torque Oscillator (STO) in the write gap of a
wider shielded pole cannot adequately define the written track at
high track density. Adequate lateral field gradient, however, is
achieved by modifying the pole tip geometry. Other details of this
conceptual design are also discussed.
Index Terms — microwave assisted magnetic recording, spin
torque oscillator, field generating layer, damping
I. INTRODUCTION
HE use of Microwave Assisted Magnetic Recording
(MAMR) to provide an adequate write field for fine grain,
high anisotropy, thermally stable media has been previously
proposed and investigated [1-11]. A MAMR head architecture,
which applies a circularly polarized microwave field to the
media in the write region just downstream of the write pole tip
corner, has been proposed by J.G. Zhu [7, 11] and is shown in
Figure 1. With this approach, a Spin Torque Oscillator (STO)
is located in the gap of a wide track shielded pole write head
[12-14]. With this architecture, the cross track width of the
STO determines the Magnetic Write Width (MWW) at 50%.
The STO consists of a Polarizing Layer (PL) in electrical
a) Corresponding author. E-mail: [email protected], 4 Osgood Rd., Sterling, MA 01564 .
b) Presently a consultant.
c) Presently at Applied Materials Corporation. d) Presently at Headway Technology, Inc.
contact with the pole tip and is magnetized in the direction of
the gap field of the head, a conductive spacer layer to conduct
the polarized current, and a Field Generating Layer (FGL)
whose magnetization precesses in the plain of the film due to
the gap field and the polarized current. Zhu’s original proposal
also had a Bias Layer (BL), with perpendicular anisotropy, on
Figure 1 Side view (top) of a spin torque oscillator in the
write gap with electrical current (black arrows) flowing
between the poles. ABS view (bottom) shows that the pole
width is much greater than the STO width which determines
the track width.
Head and Media Challenges for 3 Tb/in2
Microwave Assisted Magnetic Recording
Mike Mallarya), IEEE Fellow, Kumar Srinivasan, Gerardo Bertero, Dan Wolf, Christian Kaiser,
Michael Chaplin, Carl Elliottb)
, Mahendra Pakalac), Qunwen Leng, Francis Liu, Western Digital
Corporation
Yiming Wangd)
, Carnegie Mellon University
T.J. Silva, IEEE Senior Member, Justin M. Shaw , Hans T. Nemnbach, National Institute of Standards
and Technology, Boulder
T
0018-9464 (c) 2013 IEEE. Personal use is permitted, but republication/redistribution requires IEEE permission. Seehttp://www.ieee.org/publications_standards/publications/rights/index.html for more information.
This article has been accepted for publication in a future issue of this journal, but has not been fully edited. Content may change prior to final publication. Citation information: DOI10.1109/TMAG.2014.2305693, IEEE Transactions on Magnetics
top of the FGL to stabilize its precession in the absence of an
applied perpendicular field. However, the study reported here
has determined that the BL is not needed because of the
presence of the gap field of the head (so it is not in Figure 1).
With the STO shown in Figure 1, a negative (i.e. the
electrons flow from right to left) polarized electric current
flows from the FGL to the PL. The partial polarization of this
current in the direction of the in-plane FGL magnetization can
be resolved into perpendicular components that are parallel
and anti-parallel to the PL magnetization. The parallel (to the
PL magnetization) component selectively propagates into the
PL while the other is selectively reflected by the surface and
bulk GMR effects. This anti-parallel reflected component
torques the FGL magnetization against the applied gap field
causing it to precess in the plane. This generates an elliptically
polarized microwave field in the media. Its chirality is the
same as that of the precession of the magnetization of the
media grains in the region between the STO and the pole tip
(which are anti-parallel to the pole tip field before they
switch). As such, it causes them to precess to larger angles to
their easy axis and therefore switch at a pole tip field strength
that is much lower than that which would be needed if there
were no microwave field [10]. Thus, MAMR can be used to
affect switching of very high anisotropy media with thermally
stable fine grains in order to achieve higher Areal Density
(AD).
In section II we report on high AD micromagnetic write
simulations of single layer PMR-like media. Section III
reports simulation results on Continuous Granular Coupled
(CGC) [15] two layer media with properties that approximate
present PMR media. Section IV reports on Ferromagnetic
Resonance (FMR) measurements of CGC-like PMR media
samples and micromagnetic simulations of FMR on similar
media. Section V reports measurements of STOs and
compares them to simulation results. Section VI details
simulation results for a high AD exchange coupled composite
media, ECC [16], design with a write pole geometry that
produces a cross track pole field gradient to improve fringing.
Section VII gives overall conclusions and comments.
II. SINGLE LAYER MEDIA SIMULATIONS
Initially micromagnetic studies of the MAMR write process
were conducted on a single layer media design. The code for
the LLG Voronoi model and read back sensitivity used was
provided by the Data Storage System Center at Carnegie
Mellon University [17].
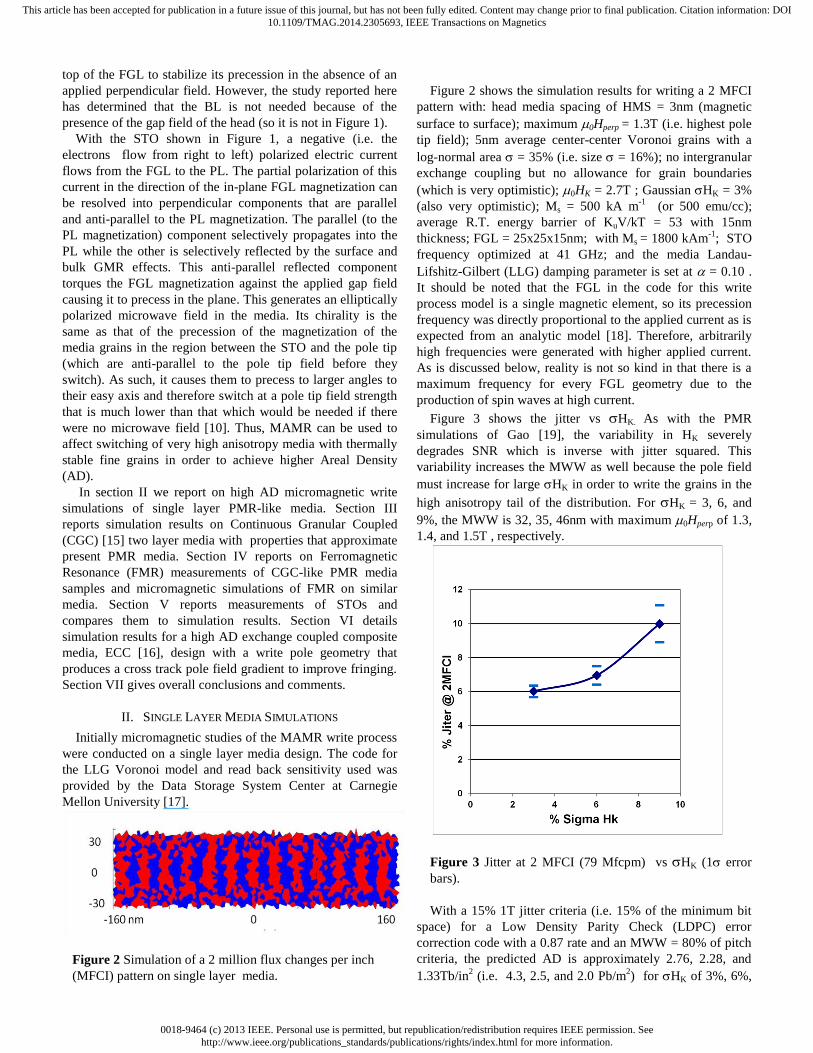
Figure 2 Simulation of a 2 million flux changes per inch
(MFCI) pattern on single layer media.
Figure 2 shows the simulation results for writing a 2 MFCI
pattern with: head media spacing of HMS = 3nm (magnetic
surface to surface); maximum 0Hperp = 1.3T (i.e. highest pole
tip field); 5nm average center-center Voronoi grains with a
log-normal area = 35% (i.e. size = 16%); no intergranular
exchange coupling but no allowance for grain boundaries
(which is very optimistic); 0HK = 2.7T ; Gaussian HK = 3%
(also very optimistic); Ms = 500 kA m-1
(or 500 emu/cc);
average R.T. energy barrier of KuV/kT = 53 with 15nm
thickness; FGL = 25x25x15nm; with Ms = 1800 kAm-1
; STO
frequency optimized at 41 GHz; and the media Landau-
Lifshitz-Gilbert (LLG) damping parameter is set at = 0.10 .
It should be noted that the FGL in the code for this write
process model is a single magnetic element, so its precession
frequency was directly proportional to the applied current as is
expected from an analytic model [18]. Therefore, arbitrarily
high frequencies were generated with higher applied current.
As is discussed below, reality is not so kind in that there is a
maximum frequency for every FGL geometry due to the
production of spin waves at high current.
Figure 3 shows the jitter vs HK. As with the PMR
simulations of Gao [19], the variability in HK severely
degrades SNR which is inverse with jitter squared. This
variability increases the MWW as well because the pole field
must increase for large HK in order to write the grains in the
high anisotropy tail of the distribution. For HK = 3, 6, and
9%, the MWW is 32, 35, 46nm with maximum 0Hperp of 1.3,
1.4, and 1.5T , respectively.
Figure 3 Jitter at 2 MFCI (79 Mfcpm) vs HK (1 error
bars).
With a 15% 1T jitter criteria (i.e. 15% of the minimum bit
space) for a Low Density Parity Check (LDPC) error
correction code with a 0.87 rate and an MWW = 80% of pitch
criteria, the predicted AD is approximately 2.76, 2.28, and
1.33Tb/in2 (i.e. 4.3, 2.5, and 2.0 Pb/m
2) for HK of 3%, 6%,

0018-9464 (c) 2013 IEEE. Personal use is permitted, but republication/redistribution requires IEEE permission. Seehttp://www.ieee.org/publications_standards/publications/rights/index.html for more information.
This article has been accepted for publication in a future issue of this journal, but has not been fully edited. Content may change prior to final publication. Citation information: DOI10.1109/TMAG.2014.2305693, IEEE Transactions on Magnetics
3
Pag
e3
and 9%, respectively. For HK = 3% and HMS = 3nm, this
consists of 635 KTPI x4350 KFCI (i.e. 25 Million-tracks-per-
meter x 171 Million-flux-changes-per-meter or 25 Mtpm
x171 Mfcpm) . Of course the lack of grain boundaries and the
very low HMS and HK dispersion assumed above is optimistic.
This will be dealt with below. Another source of optimism is
the assumed media damping of= 0.10 (which is much
higher than the measurement results from our FMR study
discussed below). If media damping is much lower, a thinner
FGL (i.e. ~ 50%) can be used but jitter and MWW are greatly
increased. This increase in jitter at low damping is shown in
Figure 4. Another source of AD reduction is higher HMS. The
AD reductions per nm for increased HMS are -8.4%, -7.8%,
and -5%, for HK = 3, 6, and 9%, respectively.
Figure 4 Jitter at 2 MFCI (79 Mfcpm) vs media intrinsic
damping. Note that the statisical error bars are 1 s.d. and are
calculated from the jitter divided by the square root of the
degrees of freedom (i.e. number of transitions minus 1).
III. CONTINUOUS GRANULAR COUPLED MEDIA
In order to better understand the damping issue and MAMR
performance on conventional media, micromagnetic studies of
the write process and FMR were performed on CGC-like
media. A granular layer with 0HK = 1.6 T (i.e. 16 kOe) was
exchange coupled (Eex = 1.5 mJ m-2
or 1.5 ergs/cm2) to a
continuous layer with 0HK = 0.8 T. The intergranular
exchange field in the cap was 0.4 T (all of the neighbors
together). The top and bottom layers were 3 and 11nm thick
and their saturation magnetization, Ms, was 600 and 640 kA
m-1
(i.e. 600 and 640 emu/cc), respectively. The average
center-to-center grain separation was 9nm with a 2.8nm grain-
to-grain boundary on the lower layer. These parameters
approximate those of conventional CoCrPt PMR media.
The growth of jitter and MWW with reduced damping for
this media is shown in Figures 5 and 6. Here, HMS was a
more realistic 5.5nm and the FGL thickness was optimized for
minimum jitter (i.e. 7 < FGL thickness < 15nm) for each
damping configuration. The frequency optimized at 21 GHz in
all cases. From these results, it can be seen that high damping
(i.e. top = 0.20) in the top layer is sufficient to minimize jitter
and MWW even when the bottom layer has low damping (i.e.
bottom= 0.01). The exchange coupling between the layers is
strong enough (i.e. 1.5 mJ m-2
) to damp the bottom one when
the top has high damping.
Figure 5 Jitter at 1 MFCI vs bottom layer damping for: top
damping = bottom (blue diamonds), top damping oftop= 0.10
(yellow triangles), top damping of top= 0.20 (red squares).
Figure 6 MWW vs bottom layer damping for: top damping
= bottom damping (red squares); and top damping of top =
0.20 (blue diamonds) .
In order to quantify the potential advantage of MAMR over
conventional PMR, Overwrite (OVW) and Adjacent Track
Erasure (ATE) were investigated but with high damping (top
= 0.20 and bottom = 0.04). Figure 7 shows the results for
OVW of a low frequency pattern written on top of a high

0018-9464 (c) 2013 IEEE. Personal use is permitted, but republication/redistribution requires IEEE permission. Seehttp://www.ieee.org/publications_standards/publications/rights/index.html for more information.
This article has been accepted for publication in a future issue of this journal, but has not been fully edited. Content may change prior to final publication. Citation information: DOI10.1109/TMAG.2014.2305693, IEEE Transactions on Magnetics
frequency pattern where the low frequency pattern transition
linear density varied from 250 KFCI to 900 KFCI (i.e. 9.8 to
35 Mfcpm) which was written on top of a 1 MFCI (i.e. 39
Mfcpm). OVW varied from -24 to -33 dB in this range. This
result was limited by the number of transitions in the string
(i.e. 18), so it should be taken as a lower limit (i.e. longer
strings would have shown better OVW due to better SNR in
the Fourier analysis).
Figure 7 Simulated OVW writing on a 1 MFCI (39.4
Mfcpm) pattern overwritten with a density from 10 to 900
KFCI ( 0.4 to 35.5 Mfcpm).
Figure 8 ATE simulation with 400 KFCI (15.8 Mfcpm)
written 36nm from a 1 MFCI (39.4 Mfcpm) track increasing
its jitter from 6.5 % to 7% of the 25.4 nm bit space.
An example of an ATE simulation is shown in Figure 8, in
which 400 KFCI (i.e. 15.8 Mfcpm) was written 36nm away
from a 1 MFCI track (i.e. 39.4 Mfcpm). In this case, the jitter
increased from 6.5% to 7% (i.e. -0.6 dB loss in transition
SNR). Taking this as the maximum acceptable encroachment,
and allowing 10% for Track Mis-registration (TMR), a track
density of 660 KTPI or 26 Mtpm can be supported with this
25x25nm FGL sitting on a 100nm wide pole tip. For an
allowed 1T jitter of 15%, the 7% (ATE corrupted jitter) at 1
MFCI (i.e. 39.4 Mfcpm) could support 1.9 MFCI (i.e. 74.9
Mfcpm). Including the LDPC rate of 0.87 gives an AD of
about 1.2Tb/in2 or 1.9 Pb/m
2. This is a moderate gain on what
could be achieved with PMR but at a greatly reduced applied
field. For PMR, this media needed maximum 0Hperp > 1.1 T
while the MAMR write needed only ~0.5 T. Therefore, even
with damped media, MAMR on today’s PMR media is
expected to yield only a moderate gain in AD. However, a
large gain in OVW is expected due to the much lower pole
field requirement from a pole that is much wider (i.e. 100nm
here) than would be needed for PMR at high TPI. The MAMR
gain is mainly in TPI with an FGL width of 25nm, so wider
FGLs would just break even with PMR.
IV. MEDIA FMR STUDIES
The above studies clearly indicate the need for high
damping for MAMR media. But the small sample thickness
(i.e. 14 nm data layer) makes it particularly difficult to
determine the intrinsic damping by use of FMR
measurements. In addition, the large amount of inhomogeneity
due to HK and irregular grain size (local demagnetization
field variation) compounds the difficulty. N. Mo et al. [20]
made complex fits to angle-dependent FMR measurements on
thick, continuous, low anisotropy CoCr films and concluded
that = 0.004. Recently, S. Hinata, et al., [21] reported FMR
data on commercial-like CoCrPt media with the aim of
extracting the intergranular exchange field. Even with the
sources of line broadening discussed above, close examination
of Figure 4 of ref. 21 indicates that residual inhomgenetity and
intrinsic damping resulted in a half width at half height
of (i.e.after integration to get a Lorenzian-like curve
whose Lorenzian like half width at half height would be the
LLG damping if there were no inhomogeneities). Therefore
the intrinsic damping is less than 0.023 .
To further investigate the variation of damping in
multilayer media, we performed perpendicular-geometry FMR
measurements for a variety of media samples with a precision,
70 GHz bandwidth FMR spectrometer that uses amplitude-
detection with a vector network analyzer [22]. The applied
magnetic field was perpendicular to the surface plane. Such a
measurement geometry minimizes the contribution of two-
magnon-scattering (linear spin-wave generation) to the
measured linewidth [23]. Data are shown in Figures 9 and 10
for two samples. The first sample has exchange-decoupled
grains (8.7 nm thick) without a capping layer, and the second
sample is identical except for the inclusion of a 9-nm-thick
continuous capping layer strongly exchange coupled to it (i.e.
no exchange break layer). Guided by micromagnetic
simulations (discussed further below), the capping layer
thickness, which is about three times larger than typical for
commercial media, was chosen to maximize the intergranular
exchange coupling in order to minimize the inhomogeneous
line broadening. A potential explanation for this effect (i.e. the
suppression of anisotropy dispersion induced line broadening),
observed in the simulation results, is that large intergranular
exchange causes clusters of grains to precess in unison thus
averaging down the granular inhomogeneities.
We present data for resonance field vs. excitation
frequency in Figure 9. The data indicate the extrapolated zero-
applied-field resonance frequency was raised by the addition
of the capping layer from 25.2 GHz to 31.7 GHz. Note that
simulations indicate that STO operation at the FMR frequency
extrapoplated to zero-applied-field is optimal for MAMR
performance. The fitted values for net effective perpendicular
anisotropy field 0Hk were 0.8 T and 1.0 T, and the fitted
values for the spectroscopic g-factor were 2.25 and 2.17,
respectively.
0018-9464 (c) 2013 IEEE. Personal use is permitted, but republication/redistribution requires IEEE permission. Seehttp://www.ieee.org/publications_standards/publications/rights/index.html for more information.
This article has been accepted for publication in a future issue of this journal, but has not been fully edited. Content may change prior to final publication. Citation information: DOI10.1109/TMAG.2014.2305693, IEEE Transactions on Magnetics
5
Pag
e5
.
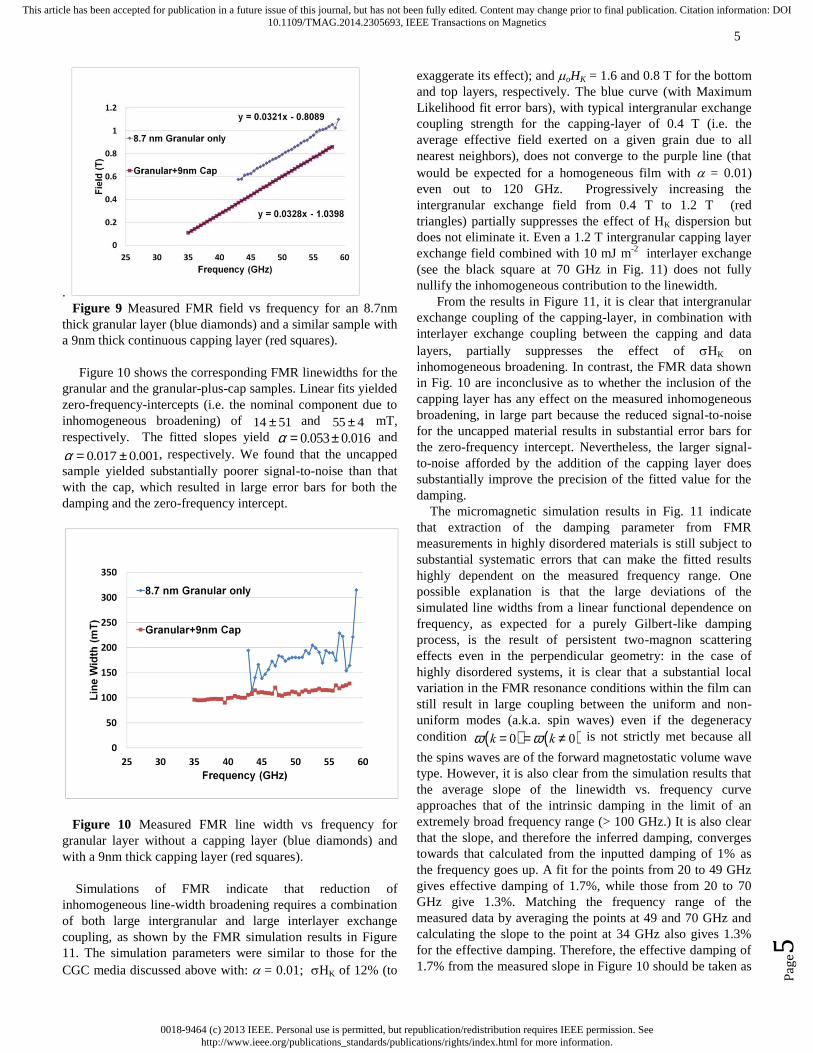
Figure 9 Measured FMR field vs frequency for an 8.7nm
thick granular layer (blue diamonds) and a similar sample with
a 9nm thick continuous capping layer (red squares).
Figure 10 shows the corresponding FMR linewidths for the
granular and the granular-plus-cap samples. Linear fits yielded
zero-frequency-intercepts (i.e. the nominal component due to
inhomogeneous broadening) of 14 ± 51 and 55 ± 4 mT,
respectively. The fitted slopes yield a = 0.053± 0.016 and
a = 0.017 ± 0.001, respectively. We found that the uncapped
sample yielded substantially poorer signal-to-noise than that
with the cap, which resulted in large error bars for both the
damping and the zero-frequency intercept.
Figure 10 Measured FMR line width vs frequency for
granular layer without a capping layer (blue diamonds) and
with a 9nm thick capping layer (red squares).
Simulations of FMR indicate that reduction of
inhomogeneous line-width broadening requires a combination
of both large intergranular and large interlayer exchange
coupling, as shown by the FMR simulation results in Figure
11. The simulation parameters were similar to those for the
CGC media discussed above with: = 0.01; HK of 12% (to
exaggerate its effect); and oHK = 1.6 and 0.8 T for the bottom
and top layers, respectively. The blue curve (with Maximum
Likelihood fit error bars), with typical intergranular exchange
coupling strength for the capping-layer of 0.4 T (i.e. the
average effective field exerted on a given grain due to all
nearest neighbors), does not converge to the purple line (that
would be expected for a homogeneous film with = 0.01)
even out to 120 GHz. Progressively increasing the
intergranular exchange field from 0.4 T to 1.2 T (red
triangles) partially suppresses the effect of HK dispersion but
does not eliminate it. Even a 1.2 T intergranular capping layer
exchange field combined with 10 mJ m-2
interlayer exchange
(see the black square at 70 GHz in Fig. 11) does not fully
nullify the inhomogeneous contribution to the linewidth.
From the results in Figure 11, it is clear that intergranular
exchange coupling of the capping-layer, in combination with
interlayer exchange coupling between the capping and data
layers, partially suppresses the effect of HK on
inhomogeneous broadening. In contrast, the FMR data shown
in Fig. 10 are inconclusive as to whether the inclusion of the
capping layer has any effect on the measured inhomogeneous
broadening, in large part because the reduced signal-to-noise
for the uncapped material results in substantial error bars for
the zero-frequency intercept. Nevertheless, the larger signal-
to-noise afforded by the addition of the capping layer does
substantially improve the precision of the fitted value for the
damping.
The micromagnetic simulation results in Fig. 11 indicate
that extraction of the damping parameter from FMR
measurements in highly disordered materials is still subject to
substantial systematic errors that can make the fitted results
highly dependent on the measured frequency range. One
possible explanation is that the large deviations of the
simulated line widths from a linear functional dependence on
frequency, as expected for a purely Gilbert-like damping
process, is the result of persistent two-magnon scattering
effects even in the perpendicular geometry: in the case of
highly disordered systems, it is clear that a substantial local
variation in the FMR resonance conditions within the film can
still result in large coupling between the uniform and non-
uniform modes (a.k.a. spin waves) even if the degeneracy
condition w k = 0( ) = w k ¹ 0( ) is not strictly met because all
the spins waves are of the forward magnetostatic volume wave
type. However, it is also clear from the simulation results that
the average slope of the linewidth vs. frequency curve
approaches that of the intrinsic damping in the limit of an
extremely broad frequency range (> 100 GHz.) It is also clear
that the slope, and therefore the inferred damping, converges
towards that calculated from the inputted damping of 1% as
the frequency goes up. A fit for the points from 20 to 49 GHz
gives effective damping of 1.7%, while those from 20 to 70
GHz give 1.3%. Matching the frequency range of the
measured data by averaging the points at 49 and 70 GHz and
calculating the slope to the point at 34 GHz also gives 1.3%
for the effective damping. Therefore, the effective damping of
1.7% from the measured slope in Figure 10 should be taken as
0018-9464 (c) 2013 IEEE. Personal use is permitted, but republication/redistribution requires IEEE permission. Seehttp://www.ieee.org/publications_standards/publications/rights/index.html for more information.
This article has been accepted for publication in a future issue of this journal, but has not been fully edited. Content may change prior to final publication. Citation information: DOI10.1109/TMAG.2014.2305693, IEEE Transactions on Magnetics
6
Pag
e6
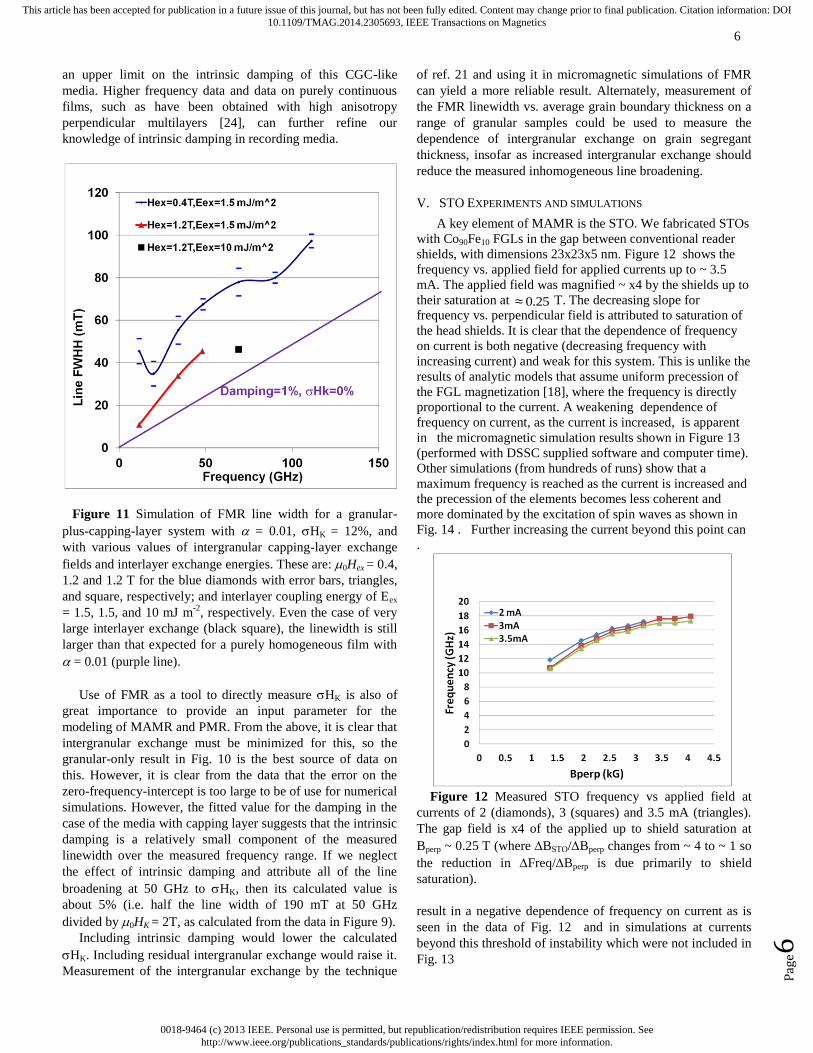
an upper limit on the intrinsic damping of this CGC-like
media. Higher frequency data and data on purely continuous
films, such as have been obtained with high anisotropy
perpendicular multilayers [24], can further refine our
knowledge of intrinsic damping in recording media.
Figure 11 Simulation of FMR line width for a granular-
plus-capping-layer system with = 0.01, HK = 12%, and
with various values of intergranular capping-layer exchange
fields and interlayer exchange energies. These are: 0Hex = 0.4,
1.2 and 1.2 T for the blue diamonds with error bars, triangles,
and square, respectively; and interlayer coupling energy of Eex
= 1.5, 1.5, and 10 mJ m-2
, respectively. Even the case of very
large interlayer exchange (black square), the linewidth is still
larger than that expected for a purely homogeneous film with
= 0.01 (purple line).
Use of FMR as a tool to directly measure HK is also of
great importance to provide an input parameter for the
modeling of MAMR and PMR. From the above, it is clear that
intergranular exchange must be minimized for this, so the
granular-only result in Fig. 10 is the best source of data on
this. However, it is clear from the data that the error on the
zero-frequency-intercept is too large to be of use for numerical
simulations. However, the fitted value for the damping in the
case of the media with capping layer suggests that the intrinsic
damping is a relatively small component of the measured
linewidth over the measured frequency range. If we neglect
the effect of intrinsic damping and attribute all of the line
broadening at 50 GHz to HK, then its calculated value is
about 5% (i.e. half the line width of 190 mT at 50 GHz
divided by 0HK = 2T, as calculated from the data in Figure 9).
Including intrinsic damping would lower the calculated
HK. Including residual intergranular exchange would raise it.
Measurement of the intergranular exchange by the technique
of ref. 21 and using it in micromagnetic simulations of FMR
can yield a more reliable result. Alternately, measurement of
the FMR linewidth vs. average grain boundary thickness on a
range of granular samples could be used to measure the
dependence of intergranular exchange on grain segregant
thickness, insofar as increased intergranular exchange should
reduce the measured inhomogeneous line broadening.
V. STO EXPERIMENTS AND SIMULATIONS
A key element of MAMR is the STO. We fabricated STOs
with Co90Fe10 FGLs in the gap between conventional reader
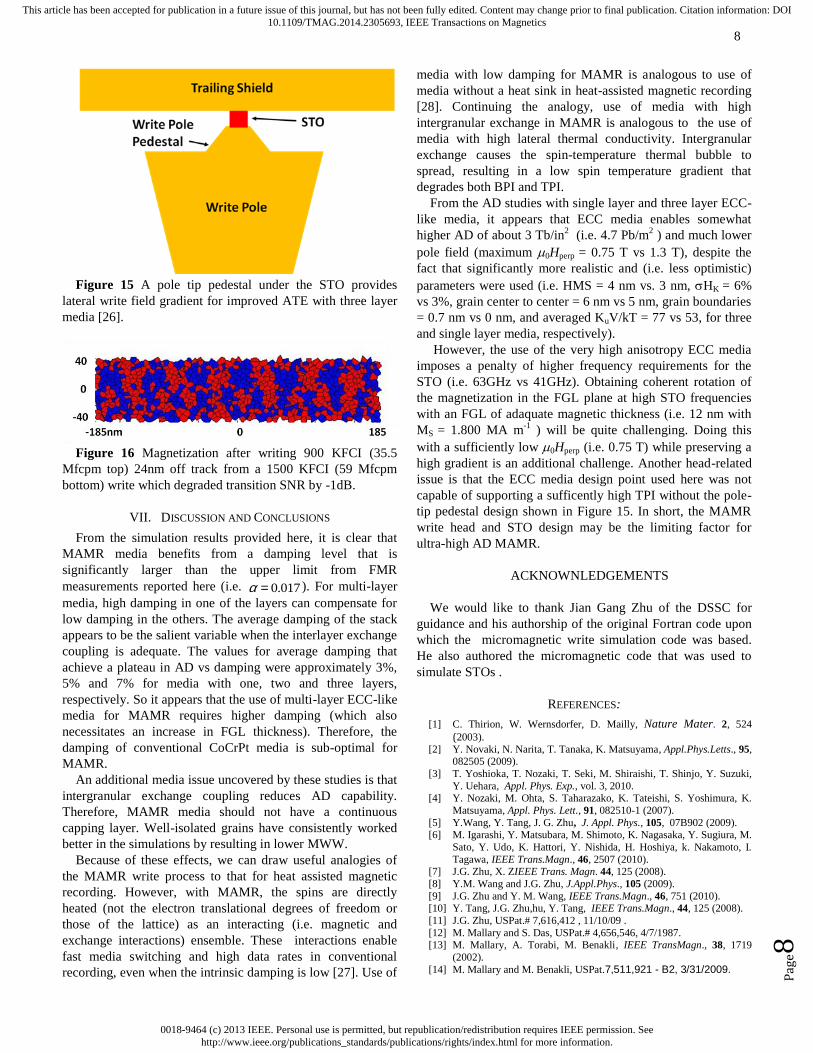
shields, with dimensions 23x23x5 nm. Figure 12 shows the
frequency vs. applied field for applied currents up to ~ 3.5
mA. The applied field was magnified ~ x4 by the shields up to
their saturation at » 0.25 T. The decreasing slope for
frequency vs. perpendicular field is attributed to saturation of
the head shields. It is clear that the dependence of frequency
on current is both negative (decreasing frequency with
increasing current) and weak for this system. This is unlike the
results of analytic models that assume uniform precession of
the FGL magnetization [18], where the frequency is directly
proportional to the current. A weakening dependence of
frequency on current, as the current is increased, is apparent
in the micromagnetic simulation results shown in Figure 13
(performed with DSSC supplied software and computer time).
Other simulations (from hundreds of runs) show that a
maximum frequency is reached as the current is increased and
the precession of the elements becomes less coherent and
more dominated by the excitation of spin waves as shown in
Fig. 14 . Further increasing the current beyond this point can
.
Figure 12 Measured STO frequency vs applied field at
currents of 2 (diamonds), 3 (squares) and 3.5 mA (triangles).
The gap field is x4 of the applied up to shield saturation at
Bperp ~ 0.25 T (where BSTO/Bperp changes from ~ 4 to ~ 1 so
the reduction in Freq/Bperp is due primarily to shield
saturation).
result in a negative dependence of frequency on current as is
seen in the data of Fig. 12 and in simulations at currents
beyond this threshold of instability which were not included in
Fig. 13

0018-9464 (c) 2013 IEEE. Personal use is permitted, but republication/redistribution requires IEEE permission. Seehttp://www.ieee.org/publications_standards/publications/rights/index.html for more information.
This article has been accepted for publication in a future issue of this journal, but has not been fully edited. Content may change prior to final publication. Citation information: DOI10.1109/TMAG.2014.2305693, IEEE Transactions on Magnetics
7
Pag
e7
Figure 13 Simulated STO frequency vs field for currents
of 2, 3 & 4 mA (purple diamonds, red squares, and green
triangles , respectively).
Figure 14 High STO current causes disordered precession,
at which the fairly uniform precession of the FGL breaks
down into complex spin waves and moving vortices.
The lack of a strong dependence of frequency on current
combined with a strong dependence of frequency on field
makes it difficult to simultaneously adjust frequency and write
field to optimize MAMR. Novel write head designs [25] and
STO designs will be needed to address this difficulty. In
addition, obtaining a high enough precession frequency in an
acceptable deep gap field will be challenging for high AD
MAMR. As the thickness of the FGL increases, the frequency
at which instability sets in decreases.
VI. EXCHANGE COUPLED COMPOSITE THREE LAYER MEDIA
In order to explore the AD limits of MAMR, we have
simulated it on three-layer ECC-type media. In this approach,
HK increases progressively from the top to bottom layer, with
controlled exchange coupling strength (Eex) between the
layers. This results in higher thermal stability for a given
write-field limit. It also reduces the effective switching field
distribution and PMR write fringing. The ECC approach is
combined with the CGC approach by utilization of a
continuous top layer to control the intergranular exchange of
the isolated grains in the bottom layers and with graded
anisotropy.
In the study reported here, the media parameters that
were used (for each layer from bottom to top) were:
thicknesses of 2.5, 2.5 and 3.5 nm, 0HK of 5.2, 4.2 and 3.1 T,
LLG damping of 0.01, 0.01, and 0.15, and grain boundaries of
0.7, 0.7, and 0 nm. The interlayer exchange energy was 3 mJ
m-2
. The capping layer had a very weak intergranular
exchange field of 40 mT to minimize fringing, where the
average effective exchange field at a given grain is that due to
all neighboring grains. All layers had: Ms = 650 kA m-1
, 6 nm
average center-to-center with a log-normal area,
Gaussian HK = 6%, and = 3o. The HMS was 4 nm
(magnetic ABS to the top magnetic surface of the media). The
ABS-SUL distance was 30 nm.
The STO FGL was 18x18x12 nm, Ms = 1.8 MA m-2
, and
its center was positioned 9 nm from the pole corner. With such
ECC media parameters, write fringing was more problematic,
so a novel pole design shown in Figure 15 was used [26]. The
STO sat on a 30 nm-tall pedestal with 45o side walls to
provide a lateral write field gradient. In addition, a uniform 0.1
T perpendicular field was added to the field map to suppress
shield edge erasure due to the very low HMS [14].
With the above configuration, micromagnetic write
simulations were performed at 1500 KFCI ( 5.9 ´105 Mfcpm).
The jitter (average over 108 transitions) was 6.3%. A 900
KFCI ( 3.5 ´105 Mfcpm) adjacent track write at 24 nm off
track of one of the runs increased its jitter from 5.9 to 6.3%
(i.e. -0.7 dB loss of transition Signal to Noise Ratio, SNR).
This is shown in Figure 16. Again, assuming a 15% 1T jitter
criteria, 10% TMR, and an LDPC code rate of 0.87, this
corresponds to an AD of about 3 Tb/in2 (i.e. 960 KTPI x 3100
KBPI or 4.7Pb/m2 with 38 Mtpm x 122 Mbpm ).
In principle, there is a lot of room for improvement in that
the maximum 0Hperp was optimized at 0.75 T. (Note that
PMR needs maximum 0Hperp = 2.2 T to write this media)
while the write pole structure was capable of 1.3 T. Therefore,
much higher HK media could be written with finer grains.
However, the STO frequency was set to 63 GHz, which is the
upper limit of what can be achieved with a proprietary STO
design that employs a 9-nm-thick FGL. This thinner FGL
would require a reduction of the top-layer damping from top
= 0.15 to top = 0.11, which increases the jitter to 7.1% (i.e. an
11% AD loss).
0018-9464 (c) 2013 IEEE. Personal use is permitted, but republication/redistribution requires IEEE permission. Seehttp://www.ieee.org/publications_standards/publications/rights/index.html for more information.
This article has been accepted for publication in a future issue of this journal, but has not been fully edited. Content may change prior to final publication. Citation information: DOI10.1109/TMAG.2014.2305693, IEEE Transactions on Magnetics
8
Pag
e8
Figure 15 A pole tip pedestal under the STO provides
lateral write field gradient for improved ATE with three layer
media [26].
Figure 16 Magnetization after writing 900 KFCI (35.5
Mfcpm top) 24nm off track from a 1500 KFCI (59 Mfcpm
bottom) write which degraded transition SNR by -1dB.
VII. DISCUSSION AND CONCLUSIONS
From the simulation results provided here, it is clear that
MAMR media benefits from a damping level that is
significantly larger than the upper limit from FMR
measurements reported here (i.e. a = 0.017 ). For multi-layer
media, high damping in one of the layers can compensate for
low damping in the others. The average damping of the stack
appears to be the salient variable when the interlayer exchange
coupling is adequate. The values for average damping that
achieve a plateau in AD vs damping were approximately 3%,
5% and 7% for media with one, two and three layers,
respectively. So it appears that the use of multi-layer ECC-like
media for MAMR requires higher damping (which also
necessitates an increase in FGL thickness). Therefore, the
damping of conventional CoCrPt media is sub-optimal for
MAMR.
An additional media issue uncovered by these studies is that
intergranular exchange coupling reduces AD capability.
Therefore, MAMR media should not have a continuous
capping layer. Well-isolated grains have consistently worked
better in the simulations by resulting in lower MWW.
Because of these effects, we can draw useful analogies of
the MAMR write process to that for heat assisted magnetic
recording. However, with MAMR, the spins are directly
heated (not the electron translational degrees of freedom or
those of the lattice) as an interacting (i.e. magnetic and
exchange interactions) ensemble. These interactions enable
fast media switching and high data rates in conventional
recording, even when the intrinsic damping is low [27]. Use of
media with low damping for MAMR is analogous to use of
media without a heat sink in heat-assisted magnetic recording
[28]. Continuing the analogy, use of media with high
intergranular exchange in MAMR is analogous to the use of
media with high lateral thermal conductivity. Intergranular
exchange causes the spin-temperature thermal bubble to
spread, resulting in a low spin temperature gradient that
degrades both BPI and TPI.
From the AD studies with single layer and three layer ECC-
like media, it appears that ECC media enables somewhat
higher AD of about 3 Tb/in2 (i.e. 4.7 Pb/m
2 ) and much lower
pole field (maximum 0Hperp = 0.75 T vs 1.3 T), despite the
fact that significantly more realistic and (i.e. less optimistic)
parameters were used (i.e. HMS = 4 nm vs. 3 nm, HK = 6%
vs 3%, grain center to center = 6 nm vs 5 nm, grain boundaries
= 0.7 nm vs 0 nm, and averaged KuV/kT = 77 vs 53, for three
and single layer media, respectively).
However, the use of the very high anisotropy ECC media
imposes a penalty of higher frequency requirements for the
STO (i.e. 63GHz vs 41GHz). Obtaining coherent rotation of
the magnetization in the FGL plane at high STO frequencies
with an FGL of adaquate magnetic thickness (i.e. 12 nm with
MS = 1.800 MA m-1
) will be quite challenging. Doing this
with a sufficiently low 0Hperp (i.e. 0.75 T) while preserving a
high gradient is an additional challenge. Another head-related
issue is that the ECC media design point used here was not
capable of supporting a sufficently high TPI without the pole-
tip pedestal design shown in Figure 15. In short, the MAMR
write head and STO design may be the limiting factor for
ultra-high AD MAMR.
ACKNOWNLEDGEMENTS
We would like to thank Jian Gang Zhu of the DSSC for
guidance and his authorship of the original Fortran code upon
which the micromagnetic write simulation code was based.
He also authored the micromagnetic code that was used to
simulate STOs .
REFERENCES:
[1] C. Thirion, W. Wernsdorfer, D. Mailly, Nature Mater. 2, 524
(2003). [2] Y. Novaki, N. Narita, T. Tanaka, K. Matsuyama, Appl.Phys.Letts., 95,
082505 (2009).
[3] T. Yoshioka, T. Nozaki, T. Seki, M. Shiraishi, T. Shinjo, Y. Suzuki,
Y. Uehara, Appl. Phys. Exp., vol. 3, 2010. [4] Y. Nozaki, M. Ohta, S. Taharazako, K. Tateishi, S. Yoshimura, K.
Matsuyama, Appl. Phys. Lett., 91, 082510-1 (2007).
[5] Y.Wang, Y. Tang, J. G. Zhu, J. Appl. Phys., 105, 07B902 (2009). [6] M. Igarashi, Y. Matsubara, M. Shimoto, K. Nagasaka, Y. Sugiura, M.
Sato, Y. Udo, K. Hattori, Y. Nishida, H. Hoshiya, k. Nakamoto, I.
Tagawa, IEEE Trans.Magn., 46, 2507 (2010). [7] J.G. Zhu, X. ZIEEE Trans. Magn. 44, 125 (2008).
[8] Y.M. Wang and J.G. Zhu, J.Appl.Phys., 105 (2009).
[9] J.G. Zhu and Y. M. Wang, IEEE Trans.Magn., 46, 751 (2010). [10] Y. Tang, J.G. Zhu,hu, Y. Tang, IEEE Trans.Magn., 44, 125 (2008).
[11] J.G. Zhu, USPat.# 7,616,412 , 11/10/09 .
[12] M. Mallary and S. Das, USPat.# 4,656,546, 4/7/1987. [13] M. Mallary, A. Torabi, M. Benakli, IEEE TransMagn., 38, 1719
(2002).
[14] M. Mallary and M. Benakli, USPat.7,511,921 - B2, 3/31/2009.

0018-9464 (c) 2013 IEEE. Personal use is permitted, but republication/redistribution requires IEEE permission. Seehttp://www.ieee.org/publications_standards/publications/rights/index.html for more information.
This article has been accepted for publication in a future issue of this journal, but has not been fully edited. Content may change prior to final publication. Citation information: DOI10.1109/TMAG.2014.2305693, IEEE Transactions on Magnetics
9
Pag
e9
[15] A.M. Goodman, J.S. Greaves, Y. Sonobe, M. Muraoka, Y.
Nakamura, J. Appl. Phys., 91, 8064 (2002).
[16] R.H. Victora and X. Shen, IEEE Trans.Magn., 41, 537 (2005).
[17] Y.M. Wang, Physics and Micromagnetic Analysis of Advanced
Recording Technologies, thesis dissertation, Carnegie Mellon University, April 2011.
[18] X. Zhu and J.G. Zhu, IEEE Trans.Magn., 42, No.10, 2670 (2006).
[19] K. Gao and N.H. Bertram, J. Appl. Phys., 91, 8369 (2002). [20] N. Mo, J. Hohlfeld, M.U. Islam, C.S. Brown, E. Girt, P. Krivosik, W.
Tong, A. Rebei, C.E. Patton, Appl. Phys. Letts. 95, 052509 (2009).
[21] S. Hinata, S. Saito, M. Takahashi, J. Appl. Phys., 111,07B722 (2012). [22] H.T. Nembach, T.J. Silva, J.M. Shaw,M.L. Schneider, M.J. Carey, S.
Maat, J.R. Childress, Phys. Rev. B, vol. 84, 054424 (2011).
[23] R. D. McMichael and P. Krivosik, IEEE Trans. Magn., vol. 40, 2 (2004).
[24] J. M. Shaw, H.T. Nembach, T.J. Silva, Phys. Rev. B, vol. 85, 054412
(2012)]. [25] K. Yamada, H. Iwasaki,M. Takagishi, USPat. Appl. #2010/0134922-
A1 (2010).
[26] M. Mallary, USPat.# 8,456,967, 6/4/13.
[27] M. Benakli, A.F. Torabi, H. Zhou, M. Mallary,H.N. Beretram IEEE
Trans. Magn., 37, 1564 (2001)
[28] W.A. Challener, C. Peng, A.V. Itagi, D. Karns, W. Peng, Y. Peng,
X.M. Yang, X. Zhu, N.J. Gokemeijer, Y.T. Hsia, R.E. Rottmayer,
M.A. Seigler, E.C. Gage, Nature Photonics, 3, 303 (2009).