BUMRUNGRAD HOSPITAL BH TB
8
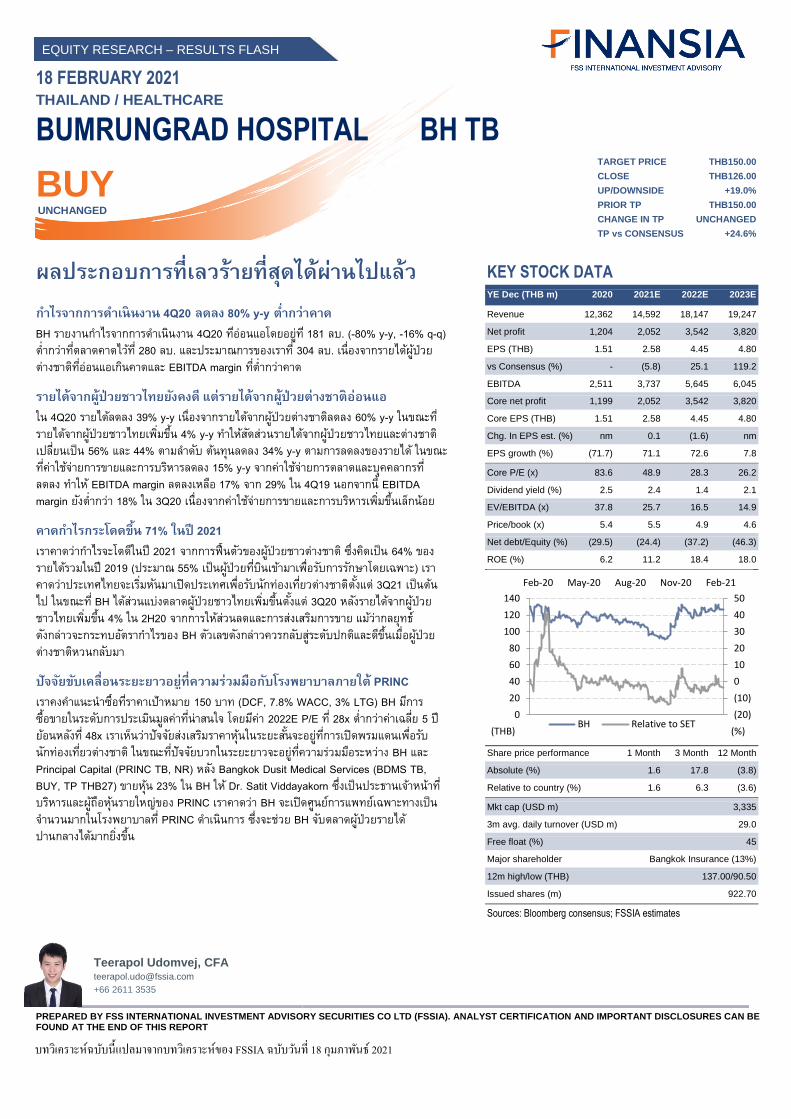
Teerapol Udomvej, CFA [email protected] +66 2611 3535 PREPARED BY FSS INTERNATIONAL INVESTMENT ADVISORY SECURITIES CO LTD (FSSIA). ANALYST CERTIFICATION AND IMPORTANT DISCLOSURES CAN BE FOUND AT THE END OF THIS REPORT EQUITY RESEARCH – RESULTS FLASH 18 FEBRUARY 2021 THAILAND / HEALTHCARE BUMRUNGRAD HOSPITAL BH TB BUY UNCHANGED ผลประกอบการที่เลวร้ายที่สุดได้ผ่านไปแล้ว กาไรจากการดาเนินงาน 4Q20 ลดลง 80% y-y ต่ากว่าคาด BH รายงานกาไรจากการดาเนินงาน 4Q20 ที ่อ่อนแอโดยอยู ่ที ่ 181 ลบ. (-80% y-y, -16% q-q) ต ่ากว่าที ่ตลาดคาดไว้ที ่ 280 ลบ. และประมาณการของเราที ่ 304 ลบ. เนื ่องจากรายได้ผู้ป ่วย ต่างชาติที ่อ่อนแอเกินคาดและ EBITDA margin ที ่ต ่ากว่าคาด รายได้จากผู ้ป่วยชาวไทยยังคงดี แต่รายได้จากผู ้ป่วยต่างชาติอ่อนแอ ใน 4Q20 รายได้ลดลง 39% y-y เนื ่องจากรายได้จากผู้ป ่วยต่างชาติลดลง 60% y-y ในขณะที ่ รายได้จากผู้ป่วยชาวไทยเพิ่มขึ ้น 4% y-y ทาให้สัดส่วนรายได้จากผู้ป่วยชาวไทยและต่างชาติ เปลี ่ยนเป็น 56% และ 44% ตามลาดับ ต้นทุนลดลง 34% y-y ตามการลดลงของรายได้ ในขณะ ที ่ค่าใช้จ่ายการขายและการบริหารลดลง 15% y-y จากค่าใช้จ่ายการตลาดและบุคคลากรที ่ ลดลง ทาให้ EBITDA margin ลดลงเหลือ 17% จาก 29% ใน 4Q19 นอกจากนี ้ EBITDA margin ยังต ่ากว่า 18% ใน 3Q20 เนื ่องจากค่าใช้จ่ายการขายและการบริหารเพิ่มขึ ้นเล็กน้อย คาดกาไรกระโดดขึ้น 71% ในปี 2021 เราคาดว่ากาไรจะโตดีในปี 2021 จากการฟื ้นตัวของผู ้ป่วยชาวต่างชาติ ซึ ่งคิดเป็น 64% ของ รายได้รวมในปี 2019 (ประมาณ 55% เป็นผู้ป่วยที ่บินเข้ามาเพื ่อรับการรักษาโดยเฉพาะ) เรา คาดว่าประเทศไทยจะเริ่มหันมาเปิดประเทศเพื ่อรับนักท่องเที ่ยวต่างชาติตั้งแต่ 3Q21 เป็นต้น ไป ในขณะที ่ BH ได้ส่วนแบ่งตลาดผู้ป่วยชาวไทยเพิ่มขึ ้นตั้งแต่ 3Q20 หลังรายได้จากผู้ป่วย ชาวไทยเพิ่มขึ ้น 4% ใน 2H20 จากการให้ส่วนลดและการส่งเสริมการขาย แม้ว่ากลยุทธ์ ดังกล่าวจะกระทบอัตรากาไรของ BH ตัวเลขดังกล่าวควรกลับสู ่ระดับปกติและดีขึ ้นเมื ่อผู้ป ่วย ต่างชาติหวนกลับมา ปัจจัยขับเคลื่อนระยะยาวอยู ่ที่ความร่วมมือกับโรงพยาบาลภายใต้ PRINC เราคงคาแนะนาซื ้อที ่ราคาเป้าหมาย 150 บาท (DCF, 7.8% WACC, 3% LTG) BH มีการ ซื ้อขายในระดับการประเมินมูลค่าที ่น่าสนใจ โดยมีค่า 2022E P/E ที ่ 28x ต ่ากว่าค่าเฉลี ่ย 5 ปี ย้อนหลังที ่ 48x เราเห็นว่าปัจจัยส่งเสริมราคาหุ้นในระยะสั ้นจะอยู ่ที ่การเปิดพรมแดนเพื ่อรับ นักท่องเที ่ยวต่างชาติ ในขณะที ่ปัจจัยบวกในระยะยาวจะอยู ่ที ่ความร่วมมือระหว่าง BH และ Principal Capital (PRINC TB, NR) หลัง Bangkok Dusit Medical Services (BDMS TB, BUY, TP THB27) ขายหุ้น 23% ใน BH ให้ Dr. Satit Viddayakorn ซึ ่งเป็นประธานเจ้าหน้าที ่ บริหารและผู้ถือหุ้นรายใหญ่ของ PRINC เราคาดว่า BH จะเปิดศูนย์การแพทย์เฉพาะทางเป็น จานวนมากในโรงพยาบาลที ่ PRINC ดาเนินการ ซึ ่งจะช่วย BH จับตลาดผู้ป่วยรายได้ ปานกลางได้มากยิ่งขึ ้น TARGET PRICE THB150.00 CLOSE THB126.00 UP/DOWNSIDE +19.0% PRIOR TP THB150.00 CHANGE IN TP UNCHANGED TP vs CONSENSUS +24.6% KEY STOCK DATA YE Dec (THB m) 2020 2021E 2022E 2023E Revenue 12,362 14,592 18,147 19,247 Net profit 1,204 2,052 3,542 3,820 EPS (THB) 1.51 2.58 4.45 4.80 vs Consensus (%) - (5.8) 25.1 119.2 EBITDA 2,511 3,737 5,645 6,045 Core net profit 1,199 2,052 3,542 3,820 Core EPS (THB) 1.51 2.58 4.45 4.80 Chg. In EPS est. (%) nm 0.1 (1.6) nm EPS growth (%) (71.7) 71.1 72.6 7.8 Core P/E (x) 83.6 48.9 28.3 26.2 Dividend yield (%) 2.5 2.4 1.4 2.1 EV/EBITDA (x) 37.8 25.7 16.5 14.9 Price/book (x) 5.4 5.5 4.9 4.6 Net debt/Equity (%) (29.5) (24.4) (37.2) (46.3) ROE (%) 6.2 11.2 18.4 18.0 Share price performance 1 Month 3 Month 12 Month Absolute (%) 1.6 17.8 (3.8) Relative to country (%) 1.6 6.3 (3.6) Mkt cap (USD m) 3,335 3m avg. daily turnover (USD m) 29.0 Free float (%) 45 Major shareholder Bangkok Insurance (13%) 12m high/low (THB) 137.00/90.50 Issued shares (m) 922.70 Sources: Bloomberg consensus; FSSIA estimates (20) (10) 0 10 20 30 40 50 0 20 40 60 80 100 120 140 ก.พ.-20 เม.ย.-20 มิ.ย.-20 ส.ค.-20 ต.ค.-20 ธ.ค.-20 (%) (THB) BH Relative to SET Feb-20 May-20 Aug-20 Nov-20 Feb-21 บทวิเคราะห์ฉบับนี ้แปลมาจากบทวิเคราะห์ของ FSSIA ฉบับวันที่ 18 กุมภาพันธ์ 2021
-
Upload
khangminh22 -
Category
Documents
-
view
1 -
download
0
Transcript of BUMRUNGRAD HOSPITAL BH TB
Teerapol Udomvej, CFA [email protected]
+66 2611 3535
PREPARED BY FSS INTERNATIONAL INVESTMENT ADVISORY SECURITIES CO LTD (FSSIA). ANALYST CERTIFICATION AND IMPORTANT DISCLOSURES CAN BE FOUND AT THE END OF THIS REPORT
EQUITY RESEARCH – RESULTS FLASH
18 FEBRUARY 2021 THAILAND / HEALTHCARE
BUMRUNGRAD HOSPITAL BH TB
BUY UNCHANGED
ผลประกอบการทเลวรายทสดไดผานไปแลว
ก าไรจากการด าเนนงาน 4Q20 ลดลง 80% y-y ต ากวาคาด BH รายงานก าไรจากการด าเนนงาน 4Q20 ทออนแอโดยอยท 181 ลบ. (-80% y-y, -16% q-q) ต ากวาทตลาดคาดไวท 280 ลบ. และประมาณการของเราท 304 ลบ. เนองจากรายไดผปวยตางชาตทออนแอเกนคาดและ EBITDA margin ทต ากวาคาด
รายไดจากผปวยชาวไทยยงคงด แตรายไดจากผปวยตางชาตออนแอ ใน 4Q20 รายไดลดลง 39% y-y เนองจากรายไดจากผปวยตางชาตลดลง 60% y-y ในขณะทรายไดจากผปวยชาวไทยเพมขน 4% y-y ท าใหสดสวนรายไดจากผปวยชาวไทยและตางชาตเปลยนเปน 56% และ 44% ตามล าดบ ตนทนลดลง 34% y-y ตามการลดลงของรายได ในขณะทคาใชจายการขายและการบรหารลดลง 15% y-y จากคาใชจายการตลาดและบคคลากรทลดลง ท าให EBITDA margin ลดลงเหลอ 17% จาก 29% ใน 4Q19 นอกจากน EBITDA margin ยงต ากวา 18% ใน 3Q20 เนองจากคาใชจายการขายและการบรหารเพมขนเลกนอย
คาดก าไรกระโดดขน 71% ในป 2021 เราคาดวาก าไรจะโตดในป 2021 จากการฟนตวของผปวยชาวตางชาต ซงคดเปน 64% ของรายไดรวมในป 2019 (ประมาณ 55% เปนผปวยทบนเขามาเพอรบการรกษาโดยเฉพาะ) เราคาดวาประเทศไทยจะเรมหนมาเปดประเทศเพอรบนกทองเทยวตางชาตตงแต 3Q21 เปนตนไป ในขณะท BH ไดสวนแบงตลาดผปวยชาวไทยเพมขนตงแต 3Q20 หลงรายไดจากผปวยชาวไทยเพมขน 4% ใน 2H20 จากการใหสวนลดและการสงเสรมการขาย แมวากลยทธดงกลาวจะกระทบอตราก าไรของ BH ตวเลขดงกลาวควรกลบสระดบปกตและดขนเมอผปวยตางชาตหวนกลบมา
ปจจยขบเคลอนระยะยาวอยทความรวมมอกบโรงพยาบาลภายใต PRINC เราคงค าแนะน าซอทราคาเปาหมาย 150 บาท (DCF, 7.8% WACC, 3% LTG) BH มการ ซอขายในระดบการประเมนมลคาทนาสนใจ โดยมคา 2022E P/E ท 28x ต ากวาคาเฉลย 5 ปยอนหลงท 48x เราเหนวาปจจยสงเสรมราคาหนในระยะสนจะอยทการเปดพรมแดนเพอรบนกทองเทยวตางชาต ในขณะทปจจยบวกในระยะยาวจะอยทความรวมมอระหวาง BH และ Principal Capital (PRINC TB, NR) หลง Bangkok Dusit Medical Services (BDMS TB, BUY, TP THB27) ขายหน 23% ใน BH ให Dr. Satit Viddayakorn ซงเปนประธานเจาหนาทบรหารและผถอหนรายใหญของ PRINC เราคาดวา BH จะเปดศนยการแพทยเฉพาะทางเปนจ านวนมากในโรงพยาบาลท PRINC ด าเนนการ ซงจะชวย BH จบตลาดผปวยรายได ปานกลางไดมากยงขน
TARGET PRICE THB150.00
CLOSE THB126.00
UP/DOWNSIDE +19.0%
PRIOR TP THB150.00
CHANGE IN TP UNCHANGED
TP vs CONSENSUS +24.6%
KEY STOCK DATA
YE Dec (THB m) 2020 2021E 2022E 2023E
Revenue 12,362 14,592 18,147 19,247
Net profit 1,204 2,052 3,542 3,820
EPS (THB) 1.51 2.58 4.45 4.80
vs Consensus (%) - (5.8) 25.1 119.2
EBITDA 2,511 3,737 5,645 6,045
Core net profit 1,199 2,052 3,542 3,820
Core EPS (THB) 1.51 2.58 4.45 4.80
Chg. In EPS est. (%) nm 0.1 (1.6) nm
EPS growth (%) (71.7) 71.1 72.6 7.8
Core P/E (x) 83.6 48.9 28.3 26.2
Dividend yield (%) 2.5 2.4 1.4 2.1
EV/EBITDA (x) 37.8 25.7 16.5 14.9
Price/book (x) 5.4 5.5 4.9 4.6
Net debt/Equity (%) (29.5) (24.4) (37.2) (46.3)
ROE (%) 6.2 11.2 18.4 18.0
Share price performance 1 Month 3 Month 12 Month
Absolute (%) 1.6 17.8 (3.8)
Relative to country (%) 1.6 6.3 (3.6)
Mkt cap (USD m) 3,335
3m avg. daily turnover (USD m) 29.0
Free float (%) 45
Major shareholder Bangkok Insurance (13%)
12m high/low (THB) 137.00/90.50
Issued shares (m) 922.70
Sources: Bloomberg consensus; FSSIA estimates
(20)
(10)
0
10
20
30
40
50
0
20
40
60
80
100
120
140
ก.พ.-20 เม.ย.-20 ม.ย.-20 ส.ค.-20 ต.ค.-20 ธ.ค.-20
(%) (THB) BH Relative to SET
Feb-20 May-20 Aug-20 Nov-20 Feb-21
บทวเคราะหฉบบนแปลมาจากบทวเคราะหของ FSSIA ฉบบวนท 18 กมภาพนธ 2021

Bumrungrad Hospital BH TB Teerapol Udomvej, CFA
2 FINANSIA
Exhibit 1: 4Q20 results summary
4Q19 1Q20 2Q20 3Q20 4Q20 -------- Change ------- 2019 2020 Change
(THB m) (THB m) (THB m) (THB m) (THB m) (q-q %) (y-y %) (THB m) (THB m) (y-y %)
Sales 4,772 4,106 2,431 2,897 2,928 1 (39) 18,474 12,362 (33)
COGS (incl. depreciation) (2,715) (2,297) (1,642) (1,859) (1,880) 1 (31) (10,191) (7,677) (25)
Gross profit 2,058 1,808 790 1,038 1,049 1 (49) 8,283 4,685 (43)
SG&A (1,012) (913) (795) (828) (858) 4 (15) (3,699) (3,394) (8)
Operating profit 1,045 895 (5) 211 190 (10) (82) 4,584 1,291 (72)
Net other income 22 22 21 16 19 17 (14) 85 78 (8)
Interest income 42 42 35 29 22 (26) (48) 159 128 (20)
Interest expense (32) (32) (32) (32) (32) (1) (1) (127) (128) 0
Pretax profit 1,077 927 18 224 199 (11) (81) 4,701 1,369 (71)
Income Tax (175) (166) 32 1 (17) (1,540) (90) (802) (150) (81)
Associates (2) (2) 0 0 (0) (361) (92) (3) (2) n/a
Minority interest (5) (4) (2) (10) (2) (84) (70) (13) (17) n/a
Core profit 894 755 48 215 181 (16) (80) 3,883 1,199 (69)
Extraordinaries, GW & FX (8) 10 (4) 6 (8) (224) (11) (135) 5 n/a
Reported net profit 886 765 44 222 173 (22) (80) 3,748 1,204 (68)
0 0
Outstanding shares (m) 729 795 795 795 795 0 9 729 795 9
Core EPS (THB) 1.23 0.95 0.06 0.27 0.23 (16) (81) 5 2 (72)
EPS (THB) 1.22 0.96 0.06 0.28 0.22 (22) (82) 5 2 (71)
COGS (excl. depreciation) 2,407 1,986 1,336 1,558 1,577 1 (34) 8,968 6,457 (28)
Depreciation 308 311 305 301 303 1 (2) 1,223 1,220 (0)
EBITDA 1,375 1,228 321 527 512 (3) (63) 5,892 2,588 (56)
Key ratios (%) (%) (%) (%) (%) (ppt) (ppt) (%) (%) (ppt)
Gross margin 43 44 32 36 36 (0) (7) 45 38 (7)
SG&A/Revenue 21 22 33 29 29 1 8 20 27 7
EBITDA margin 29 30 13 18 17 (1) (11) 32 21 (11)
Net profit margin 19 19 2 8 6 (2) (13) 20 10 (11)
Operating stats (y-y %) (y-y %) (y-y %) (y-y %) (y-y %)
Total revenue growth 1 (12) (43) (39) (39)
OPD revenue growth 1 (20) (53) (42) n/a
IPD revenue growth 1 (3) (32) (35) n/a
International patient revenue growth 1 (16) (59) (60) (60)
Thai patient revenue growth 1 (3) (13) 3 4
Sources: BH; FSSIA estimates
Exhibit 2: International patient revenue Exhibit 3: Thai patient revenue
Source: BH
Source: BH
3.1 2.8 3.1 3.1 2.7 1.2 1.3 1.3
2.3 4.1 2.4 1.1
(16.4)
(58.9)
(59.9) (59.8)
(70)
(60)
(50)
(40)
(30)
(20)
(10)
0
10
0.0
0.5
1.0
1.5
2.0
2.5
3.0
3.5
1Q
19
2Q
19
3Q
19
4Q
19
1Q
20
2Q
20
3Q
20
4Q
20
(%)(THB b)International patient revenue (LHS)
Change y-y (RHS)
1.5 1.5 1.7 1.6 1.4 1.3 1.6 1.6
(4.0)
0.6
2.5 0.9
(2.5)
(13.0)
3.4 4.2
(14)
(12)
(10)
(8)
(6)
(4)
(2)
0
2
4
6
0.0
0.2
0.4
0.6
0.8
1.0
1.2
1.4
1.6
1.8
1Q
19
2Q
19
3Q
19
4Q
19
1Q
20
2Q
20
3Q
20
4Q
20
(%)(THB b) Thai patient revenue (LHS)
Change y-y (RHS)

Bumrungrad Hospital BH TB Teerapol Udomvej, CFA
3 FINANSIA
Financial Statements Bumrungrad Hospital
Profit and Loss (THB m) Year Ending Dec 2019 2020 2021E 2022E 2023E
Revenue 18,474 12,362 14,592 18,147 19,247
Cost of goods sold (8,968) (6,457) (7,272) (8,771) (9,264)
Gross profit 9,507 5,905 7,320 9,376 9,983
Other operating income - - - - -
Operating costs (3,699) (3,394) (3,583) (3,731) (3,937)
Operating EBITDA 5,807 2,511 3,737 5,645 6,045
Depreciation (1,223) (1,220) (1,262) (1,320) (1,428)
Goodwill amortisation - - - - -
Operating EBIT 4,584 1,291 2,474 4,325 4,617
Net financing costs 32 0 (6) (15) 32
Associates (3) (2) (2) (3) (3)
Recurring non operating income 82 75 78 80 82
Non recurring items (135) 5 0 0 0
Profit before tax 4,563 1,371 2,546 4,390 4,732
Tax (802) (150) (484) (835) (900)
Profit after tax 3,760 1,221 2,062 3,555 3,832
Minority interests (13) (17) (10) (13) (13)
Preferred dividends - - - - -
Other items - - - - -
Reported net profit 3,748 1,204 2,052 3,542 3,820
Non recurring items & goodwill (net) 135 (5) 0 0 0
Recurring net profit 3,883 1,199 2,052 3,542 3,820
Per share (THB)
Recurring EPS * 5.33 1.51 2.58 4.45 4.80
Reported EPS 5.14 1.51 2.58 4.45 4.80
DPS 2.95 3.20 3.05 1.73 2.67
Diluted shares (used to calculate per share data) 729 796 796 796 796
Growth
Revenue (%) 0.8 (33.1) 18.0 24.4 6.1
Operating EBITDA (%) (5.9) (56.8) 48.8 51.1 7.1
Operating EBIT (%) (8.2) (71.8) 91.7 74.8 6.8
Recurring EPS (%) (6.6) (71.7) 71.1 72.6 7.8
Reported EPS (%) (9.7) (70.6) 70.4 72.6 7.8
Operating performance
Gross margin inc depreciation (%) 44.8 37.9 41.5 44.4 44.4
Gross margin of key business (%) 44.8 37.9 41.5 44.4 44.4
Operating EBITDA margin (%) 31.4 20.3 25.6 31.1 31.4
Operating EBIT margin (%) 24.8 10.4 17.0 23.8 24.0
Net margin (%) 21.0 9.7 14.1 19.5 19.8
Effective tax rate (%) 17.1 10.9 19.0 19.0 19.0
Dividend payout on recurring profit (%) 55.4 212.1 118.3 38.8 55.6
Interest cover (X) (145.6) (5,021.5) 427.5 286.5 (145.4)
Inventory days 14.7 18.1 16.5 16.0 17.0
Debtor days 52.4 73.1 49.7 31.9 24.8
Creditor days 37.3 44.5 37.6 36.4 38.7
Operating ROIC (%) 30.6 8.7 14.7 26.0 29.9
ROIC (%) 27.6 8.3 14.2 24.8 28.4
ROE (%) 20.2 6.2 11.2 18.4 18.0
ROA (%) 15.2 4.8 8.6 14.3 14.0
* Pre-exceptional, pre-goodwill and fully diluted
Revenue By Division (THB m) 2019 2020 2021E 2022E 2023E
Thai patient revenue 6,627 5,996 6,356 6,546 6,743
International patient revenue 11,782 6,470 8,370 11,782 12,700
Other revenue 65 (104) (133) (181) (196)
Sources: Bumrungrad Hospital; FSSIA estimates
Bumrungrad Hospital BH TB Teerapol Udomvej, CFA
4 FINANSIA
Financial Statements Bumrungrad Hospital
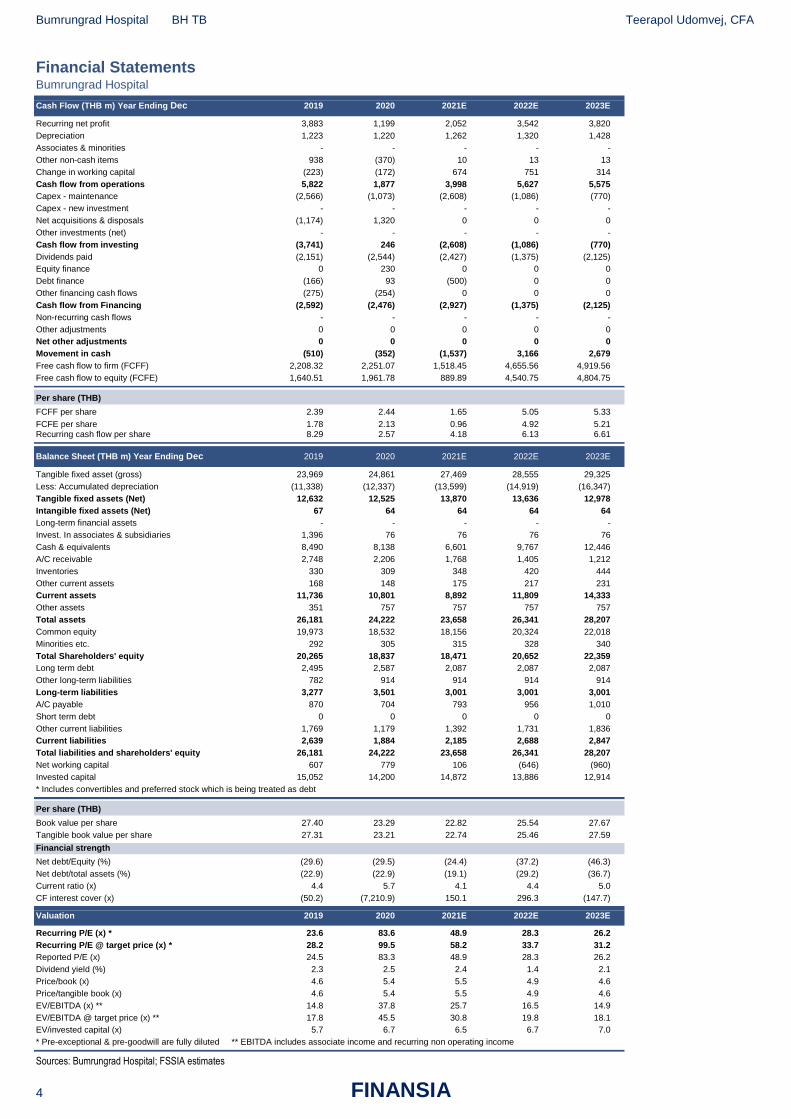
Cash Flow (THB m) Year Ending Dec 2019 2020 2021E 2022E 2023E
Recurring net profit 3,883 1,199 2,052 3,542 3,820
Depreciation 1,223 1,220 1,262 1,320 1,428
Associates & minorities - - - - -
Other non-cash items 938 (370) 10 13 13
Change in working capital (223) (172) 674 751 314
Cash flow from operations 5,822 1,877 3,998 5,627 5,575
Capex - maintenance (2,566) (1,073) (2,608) (1,086) (770)
Capex - new investment - - - - -
Net acquisitions & disposals (1,174) 1,320 0 0 0
Other investments (net) - - - - -
Cash flow from investing (3,741) 246 (2,608) (1,086) (770)
Dividends paid (2,151) (2,544) (2,427) (1,375) (2,125)
Equity finance 0 230 0 0 0
Debt finance (166) 93 (500) 0 0
Other financing cash flows (275) (254) 0 0 0
Cash flow from Financing (2,592) (2,476) (2,927) (1,375) (2,125)
Non-recurring cash flows - - - - -
Other adjustments 0 0 0 0 0
Net other adjustments 0 0 0 0 0
Movement in cash (510) (352) (1,537) 3,166 2,679
Free cash flow to firm (FCFF) 2,208.32 2,251.07 1,518.45 4,655.56 4,919.56
Free cash flow to equity (FCFE) 1,640.51 1,961.78 889.89 4,540.75 4,804.75
Per share (THB)
FCFF per share 2.39 2.44 1.65 5.05 5.33
FCFE per share 1.78 2.13 0.96 4.92 5.21 Recurring cash flow per share 8.29 2.57 4.18 6.13 6.61
Balance Sheet (THB m) Year Ending Dec 2019 2020 2021E 2022E 2023E
Tangible fixed asset (gross) 23,969 24,861 27,469 28,555 29,325
Less: Accumulated depreciation (11,338) (12,337) (13,599) (14,919) (16,347)
Tangible fixed assets (Net) 12,632 12,525 13,870 13,636 12,978
Intangible fixed assets (Net) 67 64 64 64 64
Long-term financial assets - - - - -
Invest. In associates & subsidiaries 1,396 76 76 76 76
Cash & equivalents 8,490 8,138 6,601 9,767 12,446
A/C receivable 2,748 2,206 1,768 1,405 1,212
Inventories 330 309 348 420 444
Other current assets 168 148 175 217 231
Current assets 11,736 10,801 8,892 11,809 14,333
Other assets 351 757 757 757 757
Total assets 26,181 24,222 23,658 26,341 28,207
Common equity 19,973 18,532 18,156 20,324 22,018
Minorities etc. 292 305 315 328 340
Total Shareholders' equity 20,265 18,837 18,471 20,652 22,359
Long term debt 2,495 2,587 2,087 2,087 2,087
Other long-term liabilities 782 914 914 914 914
Long-term liabilities 3,277 3,501 3,001 3,001 3,001
A/C payable 870 704 793 956 1,010
Short term debt 0 0 0 0 0
Other current liabilities 1,769 1,179 1,392 1,731 1,836
Current liabilities 2,639 1,884 2,185 2,688 2,847
Total liabilities and shareholders' equity 26,181 24,222 23,658 26,341 28,207
Net working capital 607 779 106 (646) (960)
Invested capital 15,052 14,200 14,872 13,886 12,914
* Includes convertibles and preferred stock which is being treated as debt
Per share (THB)
Book value per share 27.40 23.29 22.82 25.54 27.67
Tangible book value per share 27.31 23.21 22.74 25.46 27.59
Financial strength
Net debt/Equity (%) (29.6) (29.5) (24.4) (37.2) (46.3)
Net debt/total assets (%) (22.9) (22.9) (19.1) (29.2) (36.7)
Current ratio (x) 4.4 5.7 4.1 4.4 5.0
CF interest cover (x) (50.2) (7,210.9) 150.1 296.3 (147.7)
Valuation 2019 2020 2021E 2022E 2023E
Recurring P/E (x) * 23.6 83.6 48.9 28.3 26.2
Recurring P/E @ target price (x) * 28.2 99.5 58.2 33.7 31.2
Reported P/E (x) 24.5 83.3 48.9 28.3 26.2
Dividend yield (%) 2.3 2.5 2.4 1.4 2.1
Price/book (x) 4.6 5.4 5.5 4.9 4.6
Price/tangible book (x) 4.6 5.4 5.5 4.9 4.6
EV/EBITDA (x) ** 14.8 37.8 25.7 16.5 14.9
EV/EBITDA @ target price (x) ** 17.8 45.5 30.8 19.8 18.1
EV/invested capital (x) 5.7 6.7 6.5 6.7 7.0
* Pre-exceptional & pre-goodwill are fully diluted ** EBITDA includes associate income and recurring non operating income
Sources: Bumrungrad Hospital; FSSIA estimates

Bumrungrad Hospital BH TB Teerapol Udomvej, CFA
5 FINANSIA
Corporate Governance report of Thai listed companies 2020
EXCELLENT LEVEL
AAV ADVANC AF AIRA AKP AKR ALT AMA AMATA AMATAV ANAN
AOT AP ARIP ARROW ASP BAFS BANPU BAY BCP BCPG BDMS
BEC BEM BGRIM BIZ BKI BLA BOL BPP BRR BTS BWG
CENTEL CFRESH CHEWA CHO CIMBT CK CKP CM CNT COL COMAN
COTTO CPALL CPF CPI CPN CSS DELTA DEMCO DRT DTAC DTC
DV8 EA EASTW ECF ECL EGCO EPG ETE FNS FPI FPT
FSMART GBX GC GCAP GEL GFPT GGC GPSC GRAMMY GUNKUL HANA
HARN HMPRO ICC ICHI III ILINK INTUCH IRPC IVL JKN JSP
JWD K KBANK KCE KKP KSL KTB KTC LANNA LH LHFG
LIT LPN MAKRO MALEE MBK MBKET MC MCOT METCO MFEC MINT
MONO MOONG MSC MTC NCH NCL NEP NKI NOBLE NSI NVD
NYT OISHI ORI OTO PAP PCSGH PDJ PG PHOL PLANB PLANET
PLAT PORT PPS PR9 PREB PRG PRM PSH PSL PTG PTT
PTTEP PTTGC PYLON Q-CON QH QTC RATCH RS S S & J SAAM
SABINA SAMART SAMTEL SAT SC SCB SCC SCCC SCG SCN SDC
SEAFCO SEAOIL SE-ED SELIC SENA SIRI SIS SITHAI SMK SMPC SNC
SONIC SORKON SPALI SPI SPRC SPVI SSSC SST STA SUSCO SUTHA
SVI SYMC SYNTEC TACC TASCO TCAP TFMAMA THANA THANI THCOM THG
THIP THRE THREL TIP TIPCO TISCO TK TKT TMB TMILL TNDT
TNL TOA TOP TPBI TQM TRC TSC TSR TSTE TSTH TTA
TTCL TTW TU TVD TVI TVO TWPC U UAC UBIS UV
VGI VIH WACOAL WAVE WHA WHAUP WICE WINNER TRUE
VERY GOOD LEVEL
2S ABM ACE ACG ADB AEC AEONTS AGE AH AHC AIT
ALLA AMANAH AMARIN APCO APCS APURE AQUA ASAP ASEFA ASIA ASIAN
ASIMAR ASK ASN ATP30 AUCT AWC AYUD B BA BAM BBL
BFIT BGC BJC BJCHI BROOK BTW CBG CEN CGH CHARAN CHAYO
CHG CHOTI CHOW CI CIG CMC COLOR COM7 CPL CRC CRD
CSC CSP CWT DCC DCON DDD DOD DOHOME EASON EE ERW
ESTAR FE FLOYD FN FORTH FSS FTE FVC GENCO GJS GL
GLAND GLOBAL GLOCON GPI GULF GYT HPT HTC ICN IFS ILM
IMH INET INSURE IRC IRCP IT ITD ITEL J JAS JCK
JCKH JMART JMT KBS KCAR KGI KIAT KOOL KTIS KWC KWM
L&E LALIN LDC LHK LOXLEY LPH LRH LST M MACO MAJOR
MBAX MEGA META MFC MGT MILL MITSIB MK MODERN MTI MVP
NETBAY NEX NINE NTV NWR OCC OGC OSP PATO PB PDG
PDI PICO PIMO PJW PL PM PPP PRIN PRINC PSTC PT
QLT RCL RICHY RML RPC RWI S11 SALEE SAMCO SANKO SAPPE
SAWAD SCI SCP SE SEG SFP SGF SHR SIAM SINGER SKE
SKR SKY SMIT SMT SNP SPA SPC SPCG SR SRICHA SSC
SSF STANLY STI STPI SUC SUN SYNEX T TAE TAKUNI TBSP
TCC TCMC TEAM TEAMG TFG TIGER TITLE TKN TKS TM TMC
TMD TMI TMT TNITY TNP TNR TOG TPA TPAC TPCORP TPOLY
TPS TRITN TRT TRU TSE TVT TWP UEC UMI UOBKH UP
UPF UPOIC UT UTP UWC VL VNT VPO WIIK WP XO
YUASA ZEN ZIGA ZMICO
GOOD LEVEL
7UP A ABICO AJ ALL ALUCON AMC APP ARIN AS AU
B52 BC BCH BEAUTY BGT BH BIG BKD BLAND BM BR
BROCK BSBM BSM BTNC CAZ CCP CGD CITY CMAN CMO CMR
CPT CPW CRANE CSR D EKH EP ESSO FMT GIFT GREEN
GSC GTB HTECH HUMAN IHL INOX INSET IP JTS JUBILE KASET
KCM KKC KUMWEL KUN KWG KYE LEE MATCH MATI M-CHAI MCS
MDX MJD MM MORE NC NDR NER NFC NNCL NPK NUSA
OCEAN PAF PF PK PLE PMTA POST PPM PRAKIT PRECHA PRIME
PROUD PTL RBF RCI RJH ROJNA RP RPH RSP SF SFLEX
SGP SISB SKN SLP SMART SOLAR SPG SQ SSP STARK STC
SUPER SVOA TC TCCC THMUI TIW TNH TOPP TPCH TPIPP TPLAS
TTI TYCN UKEM UMS VCOM VRANDA WIN WORK WPH
Description Score Range
Excellent 90-100
Very Good 80-89
Good 70-79
Disclaimer:
The disclosure of the survey results of the Thai Institute of Directors Association (‘IOD”) regarding corporate governance is made pursuant to the policy of the Office of the Securities and Exchange Commission. The survey of the IOD is based on the information of a company listed on the Stock Exchange of Thailand and the Market for Alternative Investment disclosed to the public and able to be accessed by a general public investor. The result, therefore, is from the perspective of a third party. It is not an evaluation of operation and is not based on inside information. The survey result is as of the date appearing in the Corporate Governance Report of Thai Listed Companies. As a result, the survey results may be changed after that date. FSS International Investment Advisory Company Limited does not confirm nor certify the accuracy of such survey results. * CGR scoring should be considered with news regarding wrong doing of the company or director or executive of the company such unfair practice on securities trading, fraud, and corruption SEC imposed a civil sanction against insider trading of director and executive; ** delisted Source: Thai Institute of Directors Association (IOD); FSSIA’s compilation

Bumrungrad Hospital BH TB Teerapol Udomvej, CFA
6 FINANSIA
Anti-corruption Progress Indicator 2020
CERTIFIED
2S ADVANC AI AIE AIRA AKP AMA AMANAH AP AQUA ARROW
ASK ASP AYUD B BAFS BANPU BAY BBL BCH BCP BCPG
BGC BGRIM BJCHI BKI BLA BPP BROOK BRR BSBM BTS BWG
CEN CENTEL CFRESH CGH CHEWA CHOTI CHOW CIG CIMBT CM CMC
COL COM7 CPALL CPF CPI CPN CSC DCC DELTA DEMCO DIMET
DRT DTAC DTC EASTW ECL EGCO FE FNS FPI FPT FSS
FTE GBX GC GCAP GEL GFPT GGC GJS GPSC GSTEEL GUNKUL
HANA HARN HMPRO HTC ICC ICHI IFS INET INSURE INTUCH IRPC
ITEL IVL K KASET KBANK KBS KCAR KCE KGI KKP KSL
KTB KTC KWC L&E LANNA LHFG LHK LPN LRH M MAKRO
MALEE MBAX MBK MBKET MC MCOT MFC MFEC MINT MONO MOONG
MPG MSC MTC MTI NBC NEP NINE NKI NMG NNCL NSI
NWR OCC OCEAN OGC ORI PAP PATO PB PCSGH PDG PDI
PDJ PE PG PHOL PL PLANB PLANET PLAT PM PPP PPPM
PPS PREB PRG PRINC PRM PSH PSL PSTC PT PTG PTT
PTTEP PTTGC PYLON Q-CON QH QLT QTC RATCH RML RWI S & J
SABINA SAT SC SCB SCC SCCC SCG SCN SEAOIL SE-ED SELIC
SENA SGP SIRI SITHAI SMIT SMK SMPC SNC SNP SORKON SPACK
SPC SPI SPRC SRICHA SSF SSSC SST STA SUSCO SVI SYNTEC
TAE TAKUNI TASCO TBSP TCAP TCMC TFG TFI TFMAMA THANI THCOM
THIP THRE THREL TIP TIPCO TISCO TKT TMB TMD TMILL TMT
TNITY TNL TNP TNR TOG TOP TPA TPCORP TPP TRU TSC
TSTH TTCL TU TVD TVI TVO TWPC U UBIS UEC UKEM
UOBKH UWC VGI VIH VNT WACOAL WHA WHAUP WICE WIIK XO
ZEN TRUE
DECLARED
7UP ABICO AF ALT AMARIN AMATA AMATAV ANAN APURE B52 BKD
BM BROCK BUI CHO CI COTTO DDD EA EFORL EP ERW
ESTAR ETE EVER FSMART GPI ILINK IRC J JKN JMART JMT
JSP JTS KWG LDC MAJOR META NCL NOBLE NOK PK PLE
ROJNA SAAM SAPPE SCI SE SHANG SINGER SKR SPALI SSP STANLY
SUPER SYNEX THAI TKS TOPP TRITN TTA UPF UV WIN ZIGA
Level
Certified This level indicates practical participation with thoroughly examination in relation to the recommended procedures from the audit committee or the SEC’s certified auditor, being a certified member of Thailand's Private Sector Collective Action Coalition Against Corruption programme (Thai CAC) or already passed examination to ensure independence from external parties.
Declared This level indicates determination to participate in the Thailand's Private Sector Collective Action Coalition Against Corruption programme (Thai CAC)
Disclaimer: The disclosure of the Anti-Corruption Progress Indicators of a listed company on the Stock Exchange of Thailand, which is assessed by Thaipat Institute, is made in order to comply with the policy and sustainable development plan for the listed companies of th e Office of the Securities and Exchange Commission. Thaipat Institute made this assessment based on the information received from the listed company, as stipulated in the form for the assessment of Anti-corruption which refers to the Annual Registration Statement (Form 56-1), Annual Report (Form 56-2), or other relevant documents or reports of such listed company . The assessment result is therefore made from the perspective of Thaipat Institute that is a third party. It is not an assessment of operation and is not based on any inside information. Since this assessment is only the assessment result as of the date appearing in the assessment result, it may be changed after that date or when there is any change to the relevant information. Nevertheless, FSS International Investment Advisory Company Limited does not confirm, verify, or certify the accuracy and completeness of the assessment results.
Note: Companies participating in Thailand's Private Sector Collective Action Coalition Against Corruption programme (Thai CAC) under Thai Institute of Directors (as of June 24, 2019) are categorised into: 1) companies that have declared their intention to join CAC, and; 2) companies certified by CAC. Source: The Securities and Exchange Commission, Thailand; * FSSIA’s compilation

Bumrungrad Hospital BH TB Teerapol Udomvej, CFA
7 FINANSIA
GENERAL DISCLAIMER
ANALYST(S) CERTIFICATION
Teerapol Udomvej, CFA FSS International Investment Advisory Securities Co., Ltd
The individual(s) identified above certify(ies) that (i) all views expressed in this report accurately reflect the personal view of the analyst(s) with regard to
any and all of the subject securities, companies or issuers mentioned in this report; and (ii) no part of the compensation of the analyst(s) was, is, or will
be, directly or indirectly, related to the specific recommendations or views expressed herein.
This report has been prepared by FSS International Investment Advisory Company Limited (FSSIA). The information herein has been obtained from
sources believed to be reliable and accurate; however FSS makes no representation as to the accuracy and completeness of such information.
Information and opinions expressed herein are subject to change without notice. FSS has no intention to solicit investors to buy or sell any security in
this report. In addition, FSS does not guarantee returns nor price of the securities described in the report nor accept any liability for any loss or damage
of any kind arising out of the use of such information or opinions in this report. Investors should study this report carefully in making investment
decisions. All rights are reserved.
This report may not be reproduced, distributed or published by any person in any manner for any purpose without permission of FSSIA. Investment in
securities has risks. Investors are advised to consider carefully before making investment decisions.
History of change in investment rating and/or target price
Bumrungrad Hospital (BH TB)
Date Rating Target price Date Rating Target price Date Rating Target price
05-Feb-2019 07-Oct-2019
HOLD BUY
180.00 160.00
02-Apr-2020 30-Jul-2020
BUY HOLD
160.00 124.00
09-Dec-2020 BUY 150.00
Teerapol Udomvej, CFA started covering this stock from 30-Jul-2020
Price and TP are in local currency
Source: FSSIA estimates
Bangkok Dusit Medical Services (BDMS TB)
Date Rating Target price Date Rating Target price Date Rating Target price
05-Feb-2019 16-Oct-2019 02-Apr-2020
BUY BUY BUY
32.00 31.00 31.00
30-Jul-2020 29-Sep-2020 17-Nov-2020
BUY BUY BUY
28.00 28.00 28.00
24-Nov-2020 BUY 27.00
Teerapol Udomvej, CFA started covering this stock from 30-Jul-2020
Price and TP are in local currency
Source: FSSIA estimates
70
90
110
130
150
170
190
210
230
ก.พ.-18 เม.ย.-18 ม.ย.-18 ส.ค.-18 ต.ค.-18 ธ.ค.-18 ก.พ.-19 เม.ย.-19 ม.ย.-19 ส.ค.-19 ต.ค.-19 ธ.ค.-19 ก.พ.-20 เม.ย.-20 ม.ย.-20 ส.ค.-20 ต.ค.-20 ธ.ค.-20
(THB) Bumrungrad Hospital Target Price
Feb-18 Aug-18 Feb-19 Aug-19 Feb-20 Aug-20 Feb-21
10
15
20
25
30
ก.พ.-18 เม.ย.-18 ม.ย.-18 ส.ค.-18 ต.ค.-18 ธ.ค.-18 ก.พ.-19 เม.ย.-19 ม.ย.-19 ส.ค.-19 ต.ค.-19 ธ.ค.-19 ก.พ.-20 เม.ย.-20 ม.ย.-20 ส.ค.-20 ต.ค.-20 ธ.ค.-20
(THB) Bangkok Dusit Medical Services Target Price
Feb-18 Aug-18 Feb-19 Aug-19 Feb-20 Aug-20 Feb-21
Bumrungrad Hospital BH TB Teerapol Udomvej, CFA
8 FINANSIA
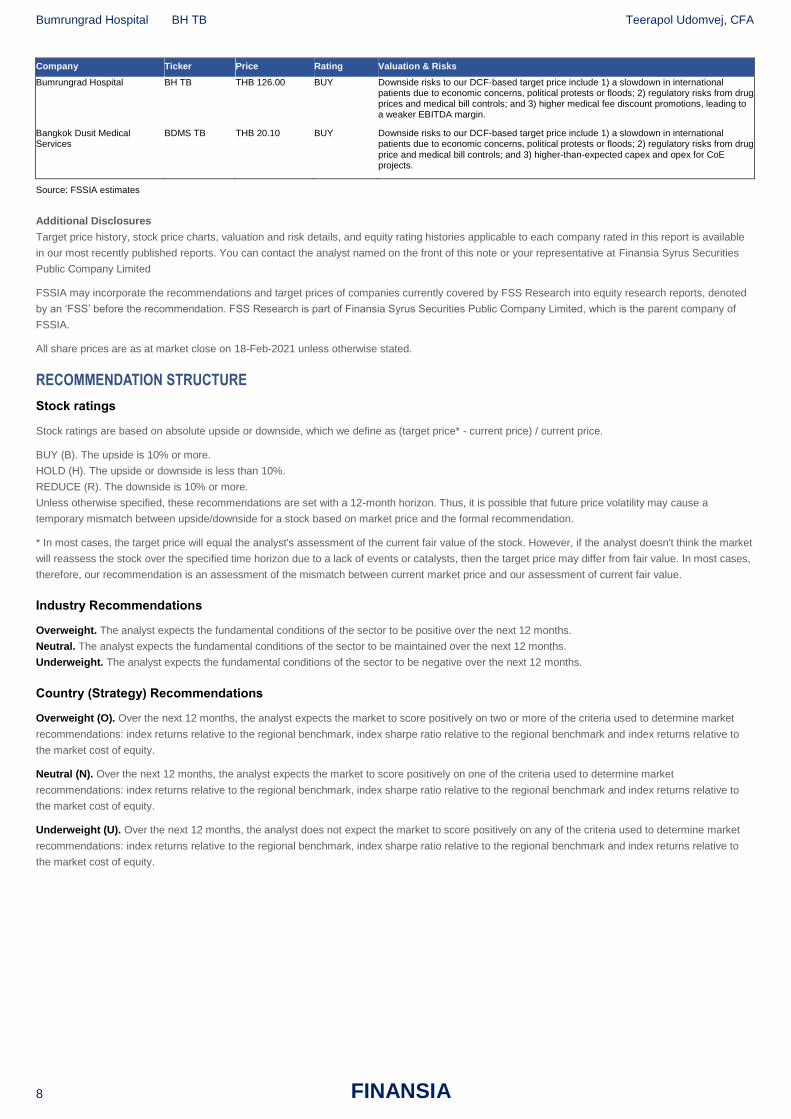
Company Ticker Price Rating Valuation & Risks
Bumrungrad Hospital BH TB THB 126.00 BUY Downside risks to our DCF-based target price include 1) a slowdown in international patients due to economic concerns, political protests or floods; 2) regulatory risks from drug prices and medical bill controls; and 3) higher medical fee discount promotions, leading to a weaker EBITDA margin.
Bangkok Dusit Medical Services
BDMS TB THB 20.10 BUY Downside risks to our DCF-based target price include 1) a slowdown in international patients due to economic concerns, political protests or floods; 2) regulatory risks from drug price and medical bill controls; and 3) higher-than-expected capex and opex for CoE projects.
Source: FSSIA estimates
Additional Disclosures
Target price history, stock price charts, valuation and risk details, and equity rating histories applicable to each company rated in this report is available
in our most recently published reports. You can contact the analyst named on the front of this note or your representative at Finansia Syrus Securities
Public Company Limited
FSSIA may incorporate the recommendations and target prices of companies currently covered by FSS Research into equity research reports, denoted
by an ‘FSS’ before the recommendation. FSS Research is part of Finansia Syrus Securities Public Company Limited, which is the parent company of
FSSIA.
All share prices are as at market close on 18-Feb-2021 unless otherwise stated.
RECOMMENDATION STRUCTURE
Stock ratings
Stock ratings are based on absolute upside or downside, which we define as (target price* - current price) / current price.
BUY (B). The upside is 10% or more.
HOLD (H). The upside or downside is less than 10%.
REDUCE (R). The downside is 10% or more.
Unless otherwise specified, these recommendations are set with a 12-month horizon. Thus, it is possible that future price volatility may cause a
temporary mismatch between upside/downside for a stock based on market price and the formal recommendation.
* In most cases, the target price will equal the analyst's assessment of the current fair value of the stock. However, if the analyst doesn't think the market
will reassess the stock over the specified time horizon due to a lack of events or catalysts, then the target price may differ from fair value. In most cases,
therefore, our recommendation is an assessment of the mismatch between current market price and our assessment of current fair value.
Industry Recommendations
Overweight. The analyst expects the fundamental conditions of the sector to be positive over the next 12 months.
Neutral. The analyst expects the fundamental conditions of the sector to be maintained over the next 12 months.
Underweight. The analyst expects the fundamental conditions of the sector to be negative over the next 12 months.
Country (Strategy) Recommendations
Overweight (O). Over the next 12 months, the analyst expects the market to score positively on two or more of the criteria used to determine market
recommendations: index returns relative to the regional benchmark, index sharpe ratio relative to the regional benchmark and index returns relative to
the market cost of equity.
Neutral (N). Over the next 12 months, the analyst expects the market to score positively on one of the criteria used to determine market
recommendations: index returns relative to the regional benchmark, index sharpe ratio relative to the regional benchmark and index returns relative to
the market cost of equity.
Underweight (U). Over the next 12 months, the analyst does not expect the market to score positively on any of the criteria used to determine market
recommendations: index returns relative to the regional benchmark, index sharpe ratio relative to the regional benchmark and index returns relative to
the market cost of equity.