Handling Missing Values in SAS - Sites at Dartmouth
83
Copyright © SAS Institute Inc. All rights reserved. Handling Missing Values in SAS SAS 9.4 & SAS Viya Melodie Rush Global Customer Success Principal Data Scientist https://www.linkedin.com/in/melodierush
-
Upload
khangminh22 -
Category
Documents
-
view
7 -
download
0
Transcript of Handling Missing Values in SAS - Sites at Dartmouth

Copyright © S AS Inst i tute Inc. A l l r i ghts reserved.
Handling Missing Values in SASSAS 9.4 & SAS Viya
Melodie RushGlobal Customer Success Principal Data Scientisthttps://www.linkedin.com/in/melodierush

Copyright © S AS Inst i tute Inc. A l l r i ghts reserved.
AgendaWhat are missing values
General Definition
SAS Definition
Why do missing values happen
Options
How to manage missing values in SAS
Programming
Products
Reasons

Copyright © S AS Inst i tute Inc. A l l r i ghts reserved.
What is Missing Data?Definition
In statistics, missing data, or missing values, occur when no data value is stored for the variable in an observation. Missing data are a common occurrence and can have a significant effect on the conclusions that can be drawn from the data. - Wikipedia

Copyright © S AS Inst i tute Inc. A l l r i ghts reserved.
What is Missing Data?SAS
Missing Value
• is a value that indicates that no data value is stored for the variable in the current observation. There are three kinds of missing values:
• numeric• character• special numeric
By default, SAS prints a missing numeric value as a single period (.) and a missing character value as a blank space. See Creating Special Missing Values for more information about special numeric missing values.

Copyright © S AS Inst i tute Inc. A l l r i ghts reserved.
Why is the data missing?
Missing Completely At Random (MCAR)
Missing At Random (MAR)
Not Missing at Random (NMAR)
The probability of missingness doesn't depend on anything.
The probability of missingness does not depend on the unobserved value of the missing variable, but it can depend on any of the other variables in your dataset
The probability of missingness depends on the unobserved value of the missing variable itself

Copyright © S AS Inst i tute Inc. A l l r i ghts reserved.Copyright © S AS Inst i tute Inc. A l l r i ghts
reserved.
When should you be concerned?
Reporting• May draw inaccurate conclusions or
inference about the data
Predictive Modeling• Bias in the estimation of parameters• Significant effect on the conclusions

Copyright © S AS Inst i tute Inc. A l l r i ghts reserved.
Replace with Constant or Zero
Replace with mean or mode
Replace using an imputation method
Remove observation(s)
Wh
at s
ho
uld
yo
u d
o a
bo
ut
mis
sin
g va
lues
?

Copyright © S AS Inst i tute Inc. A l l r i ghts reserved.
Functions

Copyright © S AS Inst i tute Inc. A l l r i ghts reserved.
Useful FunctionsCharacter
MISSING(expression)
• Returns a number that indicates whether the argument contains a missing value.• missing_flag = missing(gender);
CMISS(argument-1 <, argument-2,…>)
• Counts the number of missing arguments.• char_miss = cmiss(BP_Status, Chol_Status, Smoking_Status, Weight_Status);
COALESCEC(expression[, ...expression])
• Returns the first non-null or nonmissing value from a list of character arguments.• charvar = coalescec(charvar, "***NOT ANSWERED***");
Function Documentation
Copyright © S AS Inst i tute Inc. A l l r i ghts reserved.
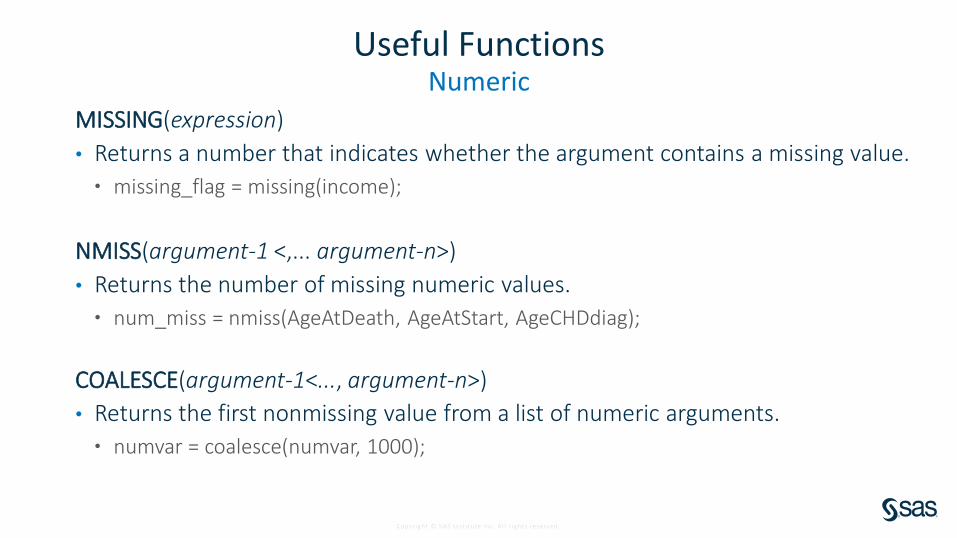
Useful FunctionsNumeric
MISSING(expression)
• Returns a number that indicates whether the argument contains a missing value.• missing_flag = missing(income);
NMISS(argument-1 <,... argument-n>)
• Returns the number of missing numeric values.• num_miss = nmiss(AgeAtDeath, AgeAtStart, AgeCHDdiag);
COALESCE(argument-1<..., argument-n>)
• Returns the first nonmissing value from a list of numeric arguments.• numvar = coalesce(numvar, 1000);

Copyright © S AS Inst i tute Inc. A l l r i ghts reserved.
Useful FunctionsNumeric
Both return zero for missing values
• y=sum(x,0);
• y=coalesce(x,0);
In SQL use the mean or coalesce function
• case when missing(var1) then mean(var1) else var1 end as var1
• coalesce(var1, mean(var1)) as var1

Copyright © S AS Inst i tute Inc. A l l r i ghts reserved.
Procedures

Copyright © S AS Inst i tute Inc. A l l r i ghts reserved.
Remove observations

Copyright © S AS Inst i tute Inc. A l l r i ghts reserved.
WHERE
IF
CASE
In data steps, proc SQL, and procedures
In data steps
proc SQL

Copyright © S AS Inst i tute Inc. A l l r i ghts reserved.
Replace Value(s)

Copyright © S AS Inst i tute Inc. A l l r i ghts reserved.
PROC STDIZE

Copyright © S AS Inst i tute Inc. A l l r i ghts reserved.
Replacing Missing ValuesPROC STDIZE
• Replace all numeric missing values with zero
PROC STDIZE data=table1 out=table2 reponly missing=0;
run;
• Replace all numeric missing values with the mean
PROC STDIZE data=table1 out=table2 reponly method=mean;
var _numeric_;
run;
reponly – only replace; do not standardize
missing – can be any constant
method –includes MEDIAN, SUM and others for doing standardization activities
PROC STDIZE Documentation

Copyright © S AS Inst i tute Inc. A l l r i ghts reserved.
PROC STANDARD

Copyright © S AS Inst i tute Inc. A l l r i ghts reserved.
Replacing Missing ValuesPROC STANDARD
• Replace all numeric missing values with mean
PROC STANDARD data=table 1 out=table2 replace;
run;
PROC STANDARD Documentation

Copyright © S AS Inst i tute Inc. A l l r i ghts reserved.
Use Imputation Method

Copyright © S AS Inst i tute Inc. A l l r i ghts reserved.
PROC HPIMPUTE

Copyright © S AS Inst i tute Inc. A l l r i ghts reserved.
Replacing Missing ValuesPROC HPIMPUTE
proc hpimpute data=sampsio.hmeq out=out1;
input mortdue value clage debtinc;
impute mortdue / value = 70000;
impute value / method = mean;
impute clage / method = random;
impute debtinc / method = pmedian;
run;
HPIMPUTE Procedure Documentation
MEAN, RANDOM, PMEDIAN or Constant Value

Copyright © S AS Inst i tute Inc. A l l r i ghts reserved.
Multiple Imputation PROC MI & PROC MIANALYZE

Copyright © S AS Inst i tute Inc. A l l r i ghts reserved.
3. Pooling•Point estimates. Average across M analyses•Standard errors. Combine variances
1. Imputation
Make M=5 to >25* copies of incomplete data set filling in with conditionally random values
2. AnalysisOf each data set separately
Multiple Imputation In 3 StepsUsing PROC MI & PROC MIANALYZE
PROC MI Documentation

Copyright © S AS Inst i tute Inc. A l l r i ghts reserved.
Multiple ImputationStep 1 Proc MI Example: Imputation
Oxygen RunTime RunPulse
44.609 11.37 178
54.297 8.65 156
49.874 9.22 .
. 11.95 176
39.442 13.08 174
50.541 . .
44.754 11.12 176
51.855 10.33 166
40.836 10.95 168
46.774 10.25 .
39.407 12.63 174
45.441 9.63 164
PROC MI data=mi_example out=outmi
seed=1234;
var Oxygen RunTime RunPulse;
run;

Copyright © S AS Inst i tute Inc. A l l r i ghts reserved.
Multiple Imputation
Oxygen RunTime RunPulse
44.609 11.37 178
54.297 8.65 156
49.874 9.22 .
. 11.95 176
39.442 13.08 174
50.541 . .
44.754 11.12 176
51.855 10.33 166
40.836 10.95 168
46.774 10.25 .
39.407 12.63 174
45.441 9.63 164
PROC MI data=mi_example out=outmi
seed=1234;
var Oxygen RunTime RunPulse;
run;
Step 1: Imputation
Step 2:Analysis
Step 3:Pooling

Copyright © S AS Inst i tute Inc. A l l r i ghts reserved.
Oxygen RunTime RunPulse
44.609 11.37 178
54.297 8.65 156
49.874 9.22 .
. 11.95 176
39.442 13.08 174
50.541 . .
44.754 11.12 176
51.855 10.33 166
40.836 10.95 168
46.774 10.25 .
39.407 12.63 174
45.441 9.63 164
Oxygen RunTime RunPulse
44.609 11.37 178
54.297 8.65 156
49.874 9.22 .
. 11.95 176
39.442 13.08 174
50.541 . .
44.754 11.12 176
51.855 10.33 166
40.836 10.95 168
46.774 10.25 .
39.407 12.63 174
45.441 9.63 164
Oxygen RunTime RunPulse
44.609 11.37 178
54.297 8.65 156
49.874 9.22 .
. 11.95 176
39.442 13.08 174
50.541 . .
44.754 11.12 176
51.855 10.33 166
40.836 10.95 168
46.774 10.25 .
39.407 12.63 174
45.441 9.63 164
48.987169.856
10.932 178.697
157.241
50.095173.309
161.803
Multiple imputed datasets created
11.769 158.932
Step 1 Results: ImputationMultiple Imputation

Copyright © S AS Inst i tute Inc. A l l r i ghts reserved.
Multiple Imputation
PROC REG data=outmi outest=outreg covout noprint; model Oxygen = RunTime RunPulse; by _Imputation_;
run;
outreg
by _Imputation_
Other model options: Reg, Logistic, Genmod, Mixed, GLM
Step 1: Imputation
Step 2:Analysis
Step 3:Pooling

Copyright © S AS Inst i tute Inc. A l l r i ghts reserved.
Multiple ImputationStep 2 Results: Parameter Estimates & Covariance Matrices
PROC PRINT data=outreg (obs=8);
var _Imputation_ _Type_ _Name_ Intercept RunTime RunPulse;
run;
Obs _Imputation_ _TYPE_ _NAME_ Intercept RunTime RunPulse
1 1 PARMS 82.9694 -2.44422 -0.06121
2 1 COV Intercept 65.1698 0.26463 -0.39518
3 1 COV RunTime 0.2646 0.14005 -0.0101
4 1 COV RunPulse -0.3952 -0.0101 0.00293
5 2 PARMS 85.1831 -3.0485 -0.03452
6 2 COV Intercept 85.3406 -0.44671 -0.46786
7 2 COV RunTime -0.4467 0.13629 -0.00581
8 2 COV RunPulse -0.4679 -0.00581 0.00308

Copyright © S AS Inst i tute Inc. A l l r i ghts reserved.
Multiple Imputation
PROC MIANALYZE data=outreg;
modeleffects Intercept RunTime RunPulse;
run;
Parameter Estimate Std Error DF Minimum Maximum Pr > |t|
Intercept 92.696519 12.780914 65.35758 120.0355 14.412 82.969385 101.288118 <.0001
RunTime -2.915452 0.48346 -3.90873 -1.9222 26.264 -3.146336 -2.444217 <.0001
RunPulse -0.086795 0.070425 -0.23209 0.0585 24.163 -0.13547 -0.034519 0.2296
Multiple Imputation Parameter Estimates
95% Confidence Limits
Notice the dependent variable is not included here
Replaces var
PROC MIANALYZE Documentation
Step 1: Imputation
Step 2:Analysis
Step 3:Pooling

Copyright © S AS Inst i tute Inc. A l l r i ghts reserved.
PROC SURVEYIMPUTE

Copyright © S AS Inst i tute Inc. A l l r i ghts reserved.
PROC SURVEYIMPUTEBrand new in SAS/Stat 14.1
Impute missing values – PROC SURVEYIMPUTE
The SURVEYIMPUTE procedure imputes missing values of an item in a sample survey by replacingthem with observed values from the same item. Imputation methods include single and multiple hot-deckImputation, Approximate Bayesian bootstrap (ABB) imputation, Fractional hotdeck imputation (FHDI), and fully efficient fractional imputation (FEFI)
PROC SURVEYIMPUTE Documentation
/* Joint imputation for Department and Response*/proc surveyimpute data=SIS_Survey_Sub method=fefi varmethod=jackknife;
class Department Response;var Department Response;strata State NewUser;cluster School;weight SamplingWeight;output out=SIS_Survey_Imputed outjkcoefs=SIS_JKCoefs;
run;

Copyright © S AS Inst i tute Inc. A l l r i ghts reserved.
Products

Copyright © S AS Inst i tute Inc. A l l r i ghts reserved.
SAS Studio

Copyright © S AS Inst i tute Inc. A l l r i ghts reserved.
Replacing Missing Values 3 Ways
1. Task – Data→ Describe Missing Data
2. Task – Data → Standardize Data• Omit row
• Replace Value
3. SAS Code• PROC STDIZE - documentation
• PROC STANDARD - documentation
• PROC HPIMPUTE - documentation
• SAS/STAT PROC MI - documentation
SAS Studio

Copyright © S AS Inst i tute Inc. A l l r i ghts reserved.
Describe Missing Data TaskFrequencies
Copyright © S AS Inst i tute Inc. A l l r i ghts reserved.
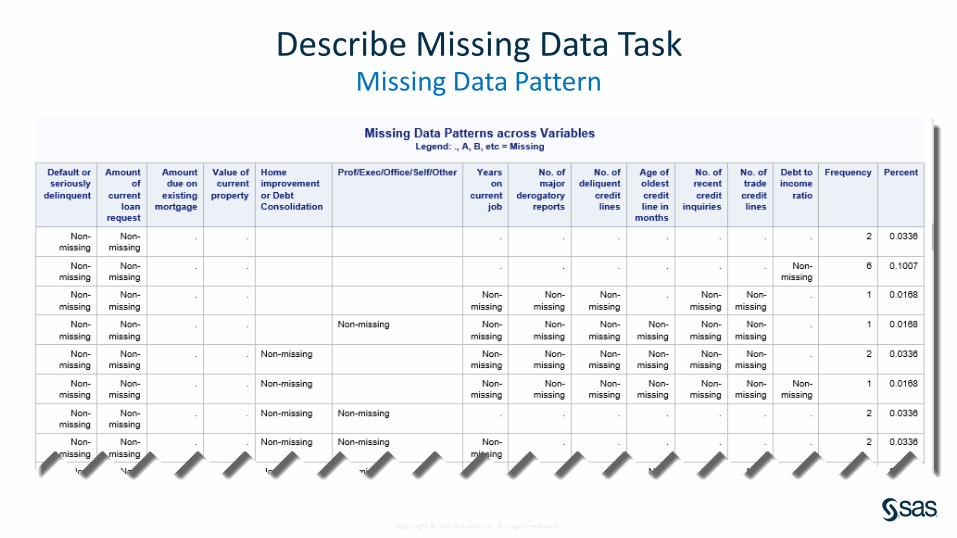
Describe Missing Data TaskMissing Data Pattern

Copyright © S AS Inst i tute Inc. A l l r i ghts reserved.
Standardize Data TaskSelect Missing Values Method & How to replace missing values

Copyright © S AS Inst i tute Inc. A l l r i ghts reserved.
SAS Enterprise Guide

Copyright © S AS Inst i tute Inc. A l l r i ghts reserved.
Replacing Missing Values 3 Ways
1. Task - Query Builder using Computed Column –> Replace Values (numeric & character)
2. Task – Data → Standardize Data (numeric only -replaces with mean)
3. SAS Code
• PROC STDIZE - documentation
• PROC STANDARD - documentation
• PROC HPIMPUTE - documentation
• SAS/STAT PROC MI - documentation
SAS Enterprise Guide

Copyright © S AS Inst i tute Inc. A l l r i ghts reserved.
Query Builder TaskReplace Value or Replace Condition for Character Variable

Copyright © S AS Inst i tute Inc. A l l r i ghts reserved.
Query Builder TaskReplace Value or Replace Condition for Numeric Variable

Copyright © S AS Inst i tute Inc. A l l r i ghts reserved.
Standardize Data TaskUncheck New mean & New standard deviation
Copyright © S AS Inst i tute Inc. A l l r i ghts reserved.
SAS Enterprise Miner

Copyright © S AS Inst i tute Inc. A l l r i ghts reserved.
Replacing Missing Values 3 Ways1. Replacement Node
• Missing values with constants
2. Impute Node
• Class variables – count, default constant value, distribution, tree, tree surrogate
• Target variables – count, default constant value, distribution
• Interval variables – mean, median, midrange, distribution, tree, tree surrogate, mid-minimum spacing, Tukey’s Biweight, Huber, Andrew’s Wave, default constant
3. SAS Code Node
• PROC STDIZE - documentation
• PROC STANDARD - documentation
• PROC HPIMPUTE - documentation
• SAS/STAT PROC MI - documentation
SAS Enterprise Miner

Copyright © S AS Inst i tute Inc. A l l r i ghts reserved.
• Used to interactively specify replacement values for class and interval levels
• Trim outliers
• Replace Missing
• Use to generate score code to process unknown levels when scoring
Replacement NodeReplacing Missing Values

Copyright © S AS Inst i tute Inc. A l l r i ghts reserved.
Replacing Missing ValuesImpute Node
• Used to replace missing values• Many modeling techniques will
drop rows of data that have any missing values
• Creates imputation indicator variables
Class Variables
Interval Variables
Copyright © S AS Inst i tute Inc. A l l r i ghts reserved.
SAS ViyaVisual Statistics, Visual Data Mining and Machine Learning
Copyright © S AS Inst i tute Inc. A l l r i ghts reserved.
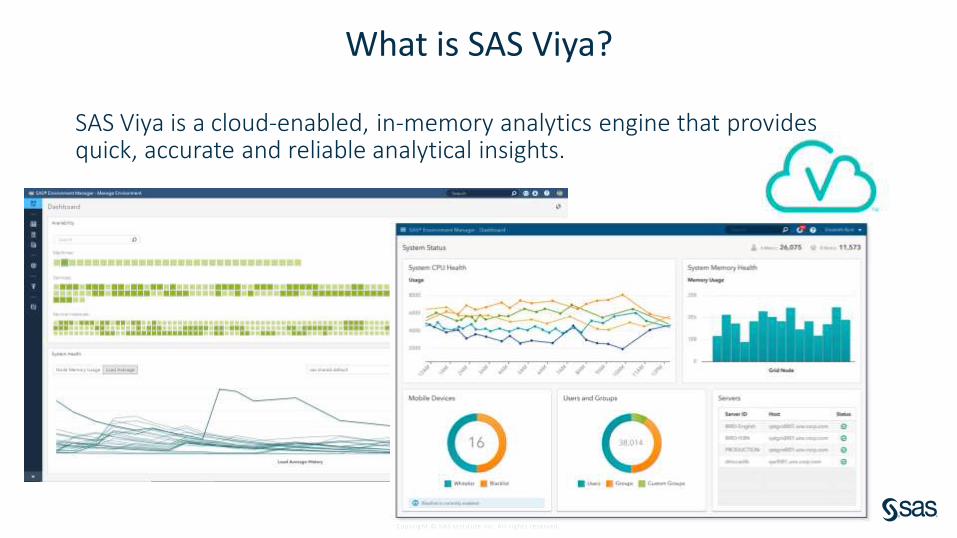
What is SAS Viya?
SAS Viya is a cloud-enabled, in-memory analytics engine that provides quick, accurate and reliable analytical insights.

Copyright © S AS Inst i tute Inc. A l l r i ghts reserved.
SAS Viya ProductsSAS Viya takes advantage of a cloud-enabled, open platform. Most offerings include both a coding interface as well a visual interface.
• SAS Visual Analytics
• SAS Visual Statistics
• SAS Visual Data Mining and Machine Learning
• SAS Visual Forecasting
• SAS Visual Text Analytics
• SAS Optimization
• SAS Econometrics
• SAS Model Manager
• SAS Data Preparation
• SAS Visual Investigator
• SAS Business Analytics
• SAS Intelligent Decisioning
• SAS Cybersecurity
• SAS Detection and Investigation
• SAS Event Stream Processing
• And more…
Copyright © S AS Inst i tute Inc. A l l r i ghts reserved.
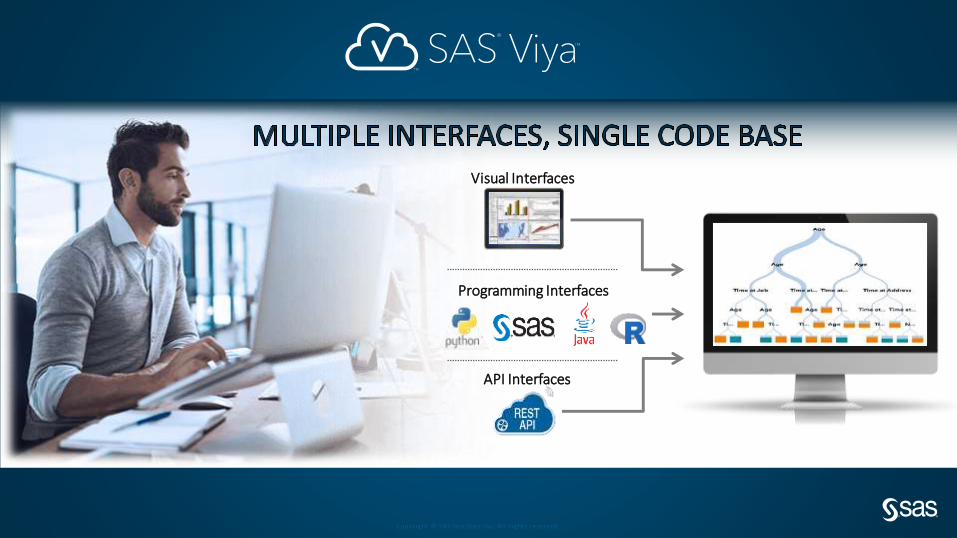
Visual Interfaces
Programming Interfaces
API Interfaces

Copyright © S AS Inst i tute Inc. A l l r i ghts reserved.
Visual Interfaces

Copyright © S AS Inst i tute Inc. A l l r i ghts reserved.
Visual InterfacesExplore and Visualize Data

Copyright © S AS Inst i tute Inc. A l l r i ghts reserved.
Visual InterfacesExplore and Visualize Data

Copyright © S AS Inst i tute Inc. A l l r i ghts reserved.
Visual InterfacesExplore and Visualize Data
Available for• Logistic Regression
LOGSELECT• Linear Regression
REGSELECT• Generalized Linear
Model GENSELECT• Neural Network NNET• Support Vector
Machines SVMACHINE

Copyright © S AS Inst i tute Inc. A l l r i ghts reserved.
Visual InterfacesExplore and Visualize Data
Available• Filter out
missing values• Replace with
constant

Copyright © S AS Inst i tute Inc. A l l r i ghts reserved.
Visual InterfacesPrepare Data
Use Code or Calculated Column • Replace with Constant
or Zero• Code for imputation

Copyright © S AS Inst i tute Inc. A l l r i ghts reserved.
Visual InterfacesPrepare Data

Copyright © S AS Inst i tute Inc. A l l r i ghts reserved.
Visual InterfacesPrepare Data

Copyright © S AS Inst i tute Inc. A l l r i ghts reserved.
Visual InterfacesBuild Models - Pipelines

Copyright © S AS Inst i tute Inc. A l l r i ghts reserved.
Visual InterfacesBuild Models – Pipelines – Imputation Node

Copyright © S AS Inst i tute Inc. A l l r i ghts reserved.
Visual InterfacesBuild Models – Pipelines – Replacement Node
The Replacement node is a Data Mining Preprocessing node. It is used to generate score code to replace outliers and unknown class levels with specified values. In some cases, you might want to reassign specified nonmissing values (trim your variable's distribution) before performing imputation calculations for the missing values. This is a typical task for the Replacement node.

Copyright © S AS Inst i tute Inc. A l l r i ghts reserved.
Programming InterfacesSAS Studio and Open Source

Copyright © S AS Inst i tute Inc. A l l r i ghts reserved.
Programming InterfacesSAS Studio – Develop SAS Code
Same options as described for SAS 9
PLUS

Copyright © S AS Inst i tute Inc. A l l r i ghts reserved.
Programming InterfacesSAS Studio – Develop SAS Code
Replace with• mean• median• random number• mode

Copyright © S AS Inst i tute Inc. A l l r i ghts reserved.
Programming InterfacesSAS Studio – Develop SAS Code

Copyright © S AS Inst i tute Inc. A l l r i ghts reserved.
Programming InterfacesSAS Studio – Develop SAS Code

Copyright © S AS Inst i tute Inc. A l l r i ghts reserved.
Programming InterfacesDevelop Code using CAS Actions
• CAS – Cloud Analytic Server
• CAS actions are the tools used to interact with data on the CAS server.
• CAS actions are wrappers for parallel processing algorithms.
• CAS actions can load data, transform data, compute statistics, perform analytics, and create output.
Python Functions ≡ SAS 9.4 Procedures ≡ CAS Actions
CASL – Cloud Analytic Server Language

Copyright © S AS Inst i tute Inc. A l l r i ghts reserved.
Programming InterfacesCAS Actions Hierarchies
Action Sets
Actions
Parameters
Options

Copyright © S AS Inst i tute Inc. A l l r i ghts reserved.
Programming InterfacesDevelop Code using CAS Actions
DataPreprocess Action Set
• Actions
• impute
• transform

Copyright © S AS Inst i tute Inc. A l l r i ghts reserved.
sas.datapreprocess.impute(table = dict(),inputs = value_list,methodContinuous = “median”,methodNominal=“mode”,casOut = dict()replace=TRUE
)
Programming InterfacesCAS Actions Hierarchies
• The functionality mimics the look and feel of Python syntax, making it easy for Python users to take advantage of CAS.
Action SetsActions
ParametersOptions

Copyright © S AS Inst i tute Inc. A l l r i ghts reserved.
Programming InterfacesDevelop Code using CAS Actions
PROC CAS;

Copyright © S AS Inst i tute Inc. A l l r i ghts reserved.
Programming InterfacesDevelop Code using CAS Actions
Jupyter Notebook
Using SWAT available from GitHub

Copyright © S AS Inst i tute Inc. A l l r i ghts reserved.
ResourcesWhere to learn more

Copyright © S AS Inst i tute Inc. A l l r i ghts reserved.
Where to learn more?SAS Documentation
• Working with Missing Data in SAS
• Proc HPIMPUTE Documentation
• SAS Enterprise Miner Impute Missing Values
• Proc MI Documentation
• Proc MIANALYZE Documentation

Copyright © S AS Inst i tute Inc. A l l r i ghts reserved.
Where to learn more?Book
Multiple Imputation of Missing Data Using SAS

Copyright © S AS Inst i tute Inc. A l l r i ghts reserved.
Where to learn more?Videos
• Getting Started with SAS Enterprise Miner: Exploring Input Data and Replacing Missing Values
• SAS Enterprise Miner Tip: Imputing Missing Values
• Handling Missing Values in Survey Data
• SAS Missing Data
• Missing Values in SAS Data Step

Copyright © S AS Inst i tute Inc. A l l r i ghts reserved.
Where to learn more?Papers
• Managing Missing Data Using SAS® Enterprise Guide® http://support.sas.com/resources/papers/proceedings14/SAS257-2014.pdf
• Hot-Deck Imputation: A Simple DATA Step Approach https://analytics.ncsu.edu/sesug/1999/075.pdf
• Imputing Dose Levels for Adverse Events https://www.lexjansen.com/pharmasug/2013/HO/PharmaSUG-2013-HO03.pdf
• Identifying and Overcoming Common Data Mining Mistakes http://www2.sas.com/proceedings/forum2007/073-2007.pdf
• A SAS® Macro for Single Imputation https://www.lexjansen.com/pharmasug/2008/sp/SP10.pdf

Copyright © S AS Inst i tute Inc. A l l r i ghts reserved.
SAS® ViyaResources
Videos• 6 minutes getting started video
• 5 minutes getting started video
• 8 minute demo video
• Feature Engineering video

Copyright © S AS Inst i tute Inc. A l l r i ghts reserved.
SAS® ViyaResources
SAS Visual Statistics User’s Guide
http://support.sas.com/software/products/visual-statistics/index.html#s1=2
SAS Visual Data Mining and Machine Learning User’s Guide
http://support.sas.com/software/products/visual-data-mining-machine-learning/index.html#s1=1
Overview, Training, Samples and Tips
• SAS Viya Overview
• SAS Viya Training
• A Beginner’s Guide to Programming in the SAS® Cloud Analytics Services Environment

Copyright © S AS Inst i tute Inc. A l l r i ghts reserved.
ResourcesProgramming
• SAS Studio
• CAS actions documentation
• SAS Github page for SWAT-Python
• SAS Github page for SWAT-R
• More example scripts for using SWAT-R & SWAT-Python

Copyright © S AS Inst i tute Inc. A l l r i ghts reserved.
Where to learn more?Training
• https://www.statistics.com/missing-data/
• https://uisug.org.uiowa.edu/sites/uisug.org.uiowa.edu/files/wysiwyg_uploads/Handling%20Missing%20Values%20with%20SAS.pdf
• https://statisticalhorizons.com/sensitivity-analysis
• https://stats.idre.ucla.edu/wp-content/uploads/2017/01/Missing-Data-Techniques_UCLA.pdf

sas.com
Copyright © S AS Inst i tute Inc. A l l r i ghts reserved.
Questions?Thank you for your time and attention!Connect with me:LinkedIn: https://www.linkedin.com/in/melodierushTwitter: @Melodie_Rush