HAC Agenda 2 February 2016.pdf - MidCentral District Health ...
169
Distribution Committee Members Barbara Robson (Chair) Lindsay Burnell (Deputy Chair) Kate Joblin Karen Naylor Phil Sunderland (ex officio) Dennis Emery Duncan Scott Cynric Temple-Camp Vacancy Board Members Diane Anderson Adrian Broad Barbara Cameron Ann Chapman Nadarajah Manoharan Oriana Paewai Management Team Kathryn Cook, CEO Mike Grant, General Manager, Clinical Services & Transformation Neil Wanden, General Manager, Finance & Corporate Support Jill Matthews, PAO Carolyn Donaldson, Committee Secretary Communications Dept, MDHB External Auditor Board Records National Health Board Nicola Holden, Account Manager Public Copies x 9 www.midcentraldhb.govt.nz/orderpaper MIDCENTRAL DISTRICT HEALTH BOARD A g e n d a Hospital Advisory Committee Part 1 Date: 2 February 2016 Time: 8.45 am Place: Board Room Board Office Heretaunga Street Palmerston North Contact Details Telephone 06-3508913 Facsimile 06-3550616 Next Meeting Date: 15 March 2016 Deadline for Agenda Items: 26 February 2016
-
Upload
khangminh22 -
Category
Documents
-
view
1 -
download
0
Transcript of HAC Agenda 2 February 2016.pdf - MidCentral District Health ...
Distribution
Committee Members Barbara Robson (Chair) Lindsay Burnell (Deputy Chair) Kate Joblin Karen Naylor Phil Sunderland (ex officio) Dennis Emery Duncan Scott Cynric Temple-Camp Vacancy
Board Members Diane Anderson Adrian Broad Barbara Cameron Ann Chapman Nadarajah Manoharan Oriana Paewai
Management Team Kathryn Cook, CEO Mike Grant, General Manager, Clinical Services
& Transformation Neil Wanden, General Manager, Finance &
Corporate Support Jill Matthews, PAO Carolyn Donaldson, Committee Secretary Communications Dept, MDHB External Auditor Board Records
National Health Board Nicola Holden, Account Manager
Public Copies x 9 www.midcentraldhb.govt.nz/orderpaper
MIDCENTRAL DISTRICTHEALTH BOARD
A g e n d a
Hospital Advisory Committee
Part 1
Date: 2 February 2016
Time: 8.45 am
Place: Board Room Board Office Heretaunga Street Palmerston North
Contact Details Telephone 06-3508913 Facsimile 06-3550616
Next Meeting Date: 15 March 2016 Deadline for Agenda Items: 26 February 2016

MIDCENTRAL DISTRICT HEALTH BOARD
Hospital Advisory Committee Meeting 2 February 2016 Part 1
O r d e r
1. APOLOGIES
2. LATE ITEMS
3. CONFLICT AND/OR REGISTER OF INTERESTS UPDATE
3.1. Amendments to the Register of Interests
3.2. Declaration of conflicts in relation to today's business
4. MINUTES
Pages: 1 - 6 Documentation: minutes of 24 November 2015
Recommendation: that the minutes of the previous meeting held on 24 November 2015 be confirmed as a true and correct record.
4.1. Recommendations to Board
To note that the Board approved all recommendations contained in the minutes.
5. MATTERS ARISING FROM THE MINUTES
To consider any matters arising from the minutes of the meeting held on 24 November 2015 for which specific items do not appear on the agenda or in management reports.
6. 2015/16 WORK PROGRAMME
Pages: 7 - 14 Documentation: Chief Executive Officer’s report dated 26 January 2016 Recommendation: that the updated work programme for 2015/16 be noted.
7. STRATEGIC PLANNING
7.1. Regional Service Plan Implementation – 2016/17 RSP Development update
Pages: 15 - 20 Documentation: Report from the Manager, DHB Planning and Accountability
dated 20 January 2016 Recommendation: that this report be received
7.2. Annual Plan Implementation – Patient Safety and Clinical Effectiveness, update 1
Pages: 21 - 99 Documentation: Report from the Director, Patient Safety & Clinical Effectiveness
dated 15 January 2016 Recommendation: that this report be received
7.3. Annual Plan Implementation – Workforce update 1
Pages: 100 - 118 Documentation: Report from the Manager, Human Resources and Organisational
Development dated 11 January 2016 Recommendation: that this report be received.
7.4. Annual Leave update
Pages: 119 - 123 Documentation: Report from the Manager, Human Resources and Organisational
Development dated 18 January 2016 Recommendation: that this report be received.
8. GOVERNANCE
8.1. Terms of Reference Review and Committee Structure
Pages: 124 - 136 Documentation: Report from the Chairman dated 22 December 2015
Recommendation: that the report be received, and members’ views on future committee structures and roles be provided to the Board Chair.
9. OPERATIONAL REPORTS
9.1. Provider Division Operations Report, November/December 2015
Pages: 137 - 166 Documentation: Report from the General Manager, Clinical Services and
Transformation dated 22 January 2016 Recommendation: that this report be received.
10. LATE ITEMS
To discuss any such items as identified under item 2 above.
11. DATE OF NEXT MEETING
15 March 2016
12. EXCLUSION OF PUBLIC
Recommendation: that the public be excluded from this meeting in accordance with the Official Information Act 1992, section 9 for the following items for the reasons stated:
Item Reason Reference “In Committee” minutes of the previous meeting
For reasons stated in the previous agenda
Operations Report: : Potential Serious Adverse Events and
Complaints
To protect personal privacy
9(2)(a)
Women’s Health update Subject of negotiations and to protect personal privacy
9(2)(a) and (j)
Quarterly Contracts update Subject of negotiations 9(2)(j) Annual Plan Process update – Funding Envelope 2016/17
Subject of negotiations 9(2)(j)
MidCentral District Health Board
Minutes of the Hospital Advisory Committee meeting held on 24 November 2015 commencing at 8.45 am in the Boardroom, MidCentral District Health
Board
PRESENT
Barbara Robson (Chair) Lindsay Burnell Karen Naylor Phil Sunderland
Cynric Temple-Camp Dennis Emery Duncan Scott
In attendance Kathryn Cook, CEO Mike Grant, General Manager, Clinical Services and Transformation Carolyn Donaldson, Committee Secretary
Ann Chapman (part meeting) Nadarajah Manoharan, Board Member Amanda Driffill, Service Manager, Medical Subspecialties (part meeting) Anne Amoore, Manager, Human Resources & Organisational Development Barbara Ruby, Quality & Clinical Risk Coordinator Carrie Naylor-Williams, Service Manager Patient Flow (part meeting) Chris Nolan, Service Director, Mental Health Service (part meeting) Chris Simpson, Service Manager, Sub-Specialties, Peri-operative/Anaesthetic/ICU Services (part meeting) Cushla Lucas, Service Manager, RCTS (part meeting) Di Orange, Team Leader, Radiology (part meeting) Greig Russell, Medical Administration Trainee Janine Ingram, Project Manager, Mental Health (part meeting) Lee Welch, Quality & Clinical Risk Coordinator Leona Dann, Director of Midwifery (part meeting) Lyn Horgan, Operations Director, Hospital Services Maggie Oulaghan, Business Manager (part meeting) Michele Coghlan, Director of Nursing Muriel Hancock, Director, Patient Safety & Clinical Effectiveness Neil Wanden, General Manager, Finance & Corporate Support Nicholas Glubb, Operations Director, Specialist Community & Regional Services Robyn Shaw, Service Manager, Electives (part meeting) Sarah Donnelly, Service Manager, Medical & Surgical Wards and Emergency Department (part meeting) Stephanie Turner, Director of Maori Health & Disability Syed Ahmer, Clinical Director, Mental Health & Addiction Service (part meeting) Vivienne Ayres, Manager, DHB Planning and Accountability Wayne Blissett, Maori Health & Disability Public (3) Communications (1) Media
WELCOME
A welcome was extended to Mr & Mrs Hume.
1. APOLOGIES
1
Page 2
An apology was received from Kate Joblin.
2. LATE ITEMS
There were no late items.
3. CONFLICT AND/OR REGISTER OF INTERESTS
3.1 Amendments to the register of interests
There were no amendments.
3.2 Declaration of conflicts in relation to today’s business
Karen Naylor declared a conflict in relation to the part 2 section of the Operations Report, item 14, in terms of her role in the women’s health service.
Duncan Scott declared a conflict in relation to the Regional Service Plan, Radiology Information System, in terms of the MRI contract held by his company.
The general declaration of a conflict of interest in relation to the Operations Report was noted for Cynric Temple-Camp due to his coronial duties.
The Chair advised Mrs Hume had asked to address members.
Mrs Hume spoke to the meeting. The main points mentioned were:
- Dialectial behaviour therapies (DBT) reporting (database and reporting update/identification of ongoing quarterly timeframes for reporting this data)
- Erica’s action plan (the action plan report didn’t meet their expectations; feedback on what should be included in this plan was not included; specific expectations for outcomes or timeframes).
- A request that the reporting keep to the original template to allow comparative tracking.
The General Manager, Clinical Services and Transformation responded, thanking them for raising the issues, and for partnering with MidCentral Health on what was a very difficult journey. He advised the issues relating to the DBT database and reporting would be covered at the workshop being held following this meeting. The other issues raised would be covered at a meeting scheduled for later in the afternoon between Mr & Mrs Hume, and the Clinical and Service Directors, Mental Health & Addiction Services. The CEO acknowledged the concerns expressed, and said that going forward an opportunity to see information relating to Erica’s action plan would be provided to Mr & Mrs Hume before it was made public. This had not occurred this time, for which she apologised.
4. MINUTES
It was recommended
that the minutes of the meeting held on 13 October 2015 be confirmed as a true and correct record.
4.1 Recommendations to Board
It was noted that the Board approved all recommendations contained in the minutes.
5. MATTERS ARISING FROM THE MINUTES
There were no matters arising from the minutes.
6. WORK PROGRAMME
2
Page 3
It was recommended
that the updated work programme for 2015/16 be noted.
The order paper was rearranged, so that the Mental Health Service update was discussed next.
6.4 Mental Health Service – Update 2
The Chair expressed concern about phase 2, noting that a lot of progress had been made and staff were to be commended for their hard work to make improvements, however she did not feel she had an insight into the care provided in the community – what had changed since the review, how were things measured etc. The Clinical Director, Mental Health & Addiction Service, advised this information was available, but the Committee needed to clarify what sort of data they wanted to see. He agreed the information had not yet been provided to members. The General Manager, Clinical Services and Transformation, said the request was very similar to that expressed by Gloria Johnson back in February at an earlier workshop, who had asked “how would the committee know and be confident, that the service was providing optimum care for patients and families”. The Service Director Mental Health & Addiction Service, confirmed the issues raised relating to reporting, particularly around the clinical review of Erica Hume, and processes by which there would be input into the formulation of reporting, would be discussed at the workshop following this meeting. The workshop would also discuss the concerns raised about community services. The discussion would look at the total picture, how it works and what improvements can be made in future.
The Service Director Mental Health & Addiction Service then went through the report, commenting on the key initiatives. Following the Mental Health Advisory Group forum last week, there was now a plan to progress a gap analysis and work with the community to cover a variety of issues. The report indicated working with PHO partners and practices to include a primary mental health model. Other options being considered included development of a paper for redesigning the unit. This would be a considerable challenge. The report commented on the over-utilisation of the unit, double shifts, and overtime. Future reporting would provide some clarity on issues and better data.
Mr Emery noted that 17 percent of the MCH population were Iwi Maori. He said the report was very light on reference to Iwi Maori, and he wanted to see more involvement in future reports. Management advised this would happen in terms of Maori Mental Health and the consumer engagement with Mana o Te Tangata Trust (previously Journeys to Wellbeing), and there was a specific item on this matter on the workshop agenda.
The Chair referred to the Partners in Recovery forum held earlier in November, and asked if it would be possible to have a brief summary report of the key themes that came out of it, for the next meeting. Management agreed adding there was a considerable amount of work being done around the outcomes from the meeting, and that a report was being written.
The work of the Director of Area Mental Health Services was acknowledged.
The Service Director Mental Health & Addiction Service said he hoped to present more detail about where improvements were being made at the forthcoming workshop. Considerable work had been undertaken to ensure the HAC report and relevant data was clear and understandable and work will be ongoing to ensure that data represented in the report was accurate and timely. The issue of over utilisation of capacity and double shifts in ward 21 would be discussed as well at the workshop. A project has commenced which aims to improve the match of resource to demand including rostering improvements and staffing levels. One of the learnings was that the necessity for double shifts had stabilised but not decreased. Consideration was being given to residential placements, and how a patient changed from being an inpatient to being an outpatient and required services. Dr Ahmer advised on the structure used at Hawkes Bay DHB. Whilst MDHB’s arrangement was similar, it did not have transitional sub acute beds for use for people being discharged. Lindsay Burnell left the meeting.
3
Page 4
There was discussion on some of the issues relating to patient flow, which could not work without networking. Residential care could be a “log jam” which created issues. A more effective service coordination process was needed within the district that was both mental health and aged residential care focused. This would provide a seamless flow for patients post discharge from the ward.
Lindsay Burnell returned to the meeting.
There was discussion on the graphs in the appendices. In response to a query about why there was a spike on certain days, management advised it could be for a number of reasons, eg the condition of patients.
Mrs Naylor expressed concern at not seeing any improvement in the number of double shifts and overtime. The Service Director Mental Health & Addiction Service said this issue was a top priority along with managing the over-utilisation of the unit. He outlined the work being done including recruitment, rostering, managing the over-utilisation, and unexpected staff absences. It was important to recruit staff above the requirement for the funded 24 beds. Members were referred to the information on page 104 of the report, which covered bed state, (funded and unfunded,) and occupancy.
Management advised they would provide more information in relation to recommendations 4 and 5 of the key actions arising from the longitudinal clinical review of the care of Erica Hume.
Management also commented on the recent surveillance audit. There were no new corrective actions for mental health. Two previous ones remain at a low level as they require a bit more work. Overall, the result of the audit was positive.
It was recommended
that this report be received.
7. STRATEGIC PLANNING
7.1 Regional Service Plan Implementation – Update Quarter 1, 2015/16
Mr Emery advised a Maori Caucus Board had been formed to work with Hospice NZ in relation to palliative care.
The low MDHB figures for accessing maternal mental healthcare were noted. Management felt it was related to data collection in terms of the low starting point of nurses who provide the service and the collection of the data to maternal mental health. This issue would be resolved.
It was recommended
that this report be received.
7.2 Development of the 2016/17 Regional Service Plan – approach and timeline/16
It was advised the possibility of establishing a regional residential maternal mental health service, similar to those in Auckland and Christchurch, was not being considered.
It was recommended
that this report be received.
7.3 Secondary Care initiatives update
It was noted that although the heart failure patient case review and management service being established was based at Kauri Health Care, the service would be progressively rolled
4
Page 5
out across all the Integrated Family Health Centres. This would cover up to 80 percent of the population.
The need for further education in supporting clinicians to capture all eligible patients with a high suspicion of cancer, when triaging referrals for the faster cancer treatment initiative was noted. MDHB wanted to move to a more effective approach, for example a reduction in patients presenting with first symptoms of cancer through the Emergency Department, noting that patients can enter the system in a number of ways.
Mr Sunderland advised he had just received the latest Health Target results, which were good for MDHB.
Members were advised a business case was to be presented to the Minister shortly, looking at rolling out a bowel screening programme possibly in 2017.
Dr Temple-Camp left the meeting.
Management were commended on this report, which members felt provided good information for them.
It was recommended
that this report be received.
7.4 Non-financial Performance Measures for quarter ended September 2015
It was noted there were a number of changes to the performance measures and reporting deliverables this year, in addition to increases in target values for several of the performance measures.
Issues with data quality, particularly mental health data held by the Ministry of Health, were noted.
Dr Temple-Camp returned.
It was recommended
that this report be received.
7.5 Evaluation of MidCentral District Health Board’s Team Development Programme
It was recommended
that this report be received.
8. OPERATIONAL REPORT
8.1 Provider Division Operating Report - September/October 2015
The committee was updated on the recent certification audit visit, which was very positive. Nine of the previous 30 actions have been closed, leaving 21 corrective actions. There are no high priority actions. The final report was expected in 4-5 weeks.
The General Manager, Clinical Services and Transformation then spoke to the financial section of the report, noting there was a deficit of $300,000 for the month, which was a variance of $800,000 to budget. Good work was continuing in terms of working on a new financial forecast for year end. However, it will be January/February before any improvement in the financial situation is seen.
The Manager, Human Resources and Development, advised that while overall there was a reduction in the “over two years” leave balances from July figures, that was mainly due to
5

Page 6
leave buy-out and termination balances. The accrued annual leave in most months was higher than the leave being taken. A more detailed analysis of annual leave accruals, annual leave taken, and the financial impact will be provided to the next meeting. This would include the detail of the calculations (maths detail). A member expressed her concern that there was not any progress being made in reducing the outstanding leave balance, and suggested long service leave should probably be included in the reporting. The CEO assured members that every staff member with excess leave was required to have a plan in place to reduce it.
Management advised they had received good feedback from patients and families on last week’s patient safety initiative.
Management confirmed that as far as was currently known, the national mental health serious adverse events report would be a separate report again this year. It was not known when it would be published.
The reducing average length of stay was noted, with a suggestion it would be good to keep an eye on readmission rates.
Ann Chapman arrived.
It was noted that the number of new patients waiting >4 months in urology as at October 2015, (figure 1, page 226), should be 2, not 30.
It was recommended
that this report be received.
9. LATE ITEMS
There were no late items.
10. DATE OF NEXT MEETING
2 February 2016
11. EXCLUSION OF PUBLIC
It was recommended that the public be excluded from this meeting in accordance with the Official Information Act 1992, section 9 for the following items for the reasons stated:
Item Reason Reference “In Committee” minutes of the previous meeting
For reasons stated in the previous agenda
Operations Report: : Potential Serious Adverse Events
and Complaints
To protect personal privacy
9(2)(a)
2016/17 Annual Plan Development: Update and Assumptions
Subject of negotiations 9(2)(j)
6
COPY TO:
CEO’s Department MidCentral DHB Heretaunga Street PO Box 2056 Palmerston North
Phone Fax
+64 (6) 350 8910 +64 (6) 355 0616
TO Hospital Advisory Committee
FROM Chief Executive Officer
DATE 26 January 2016
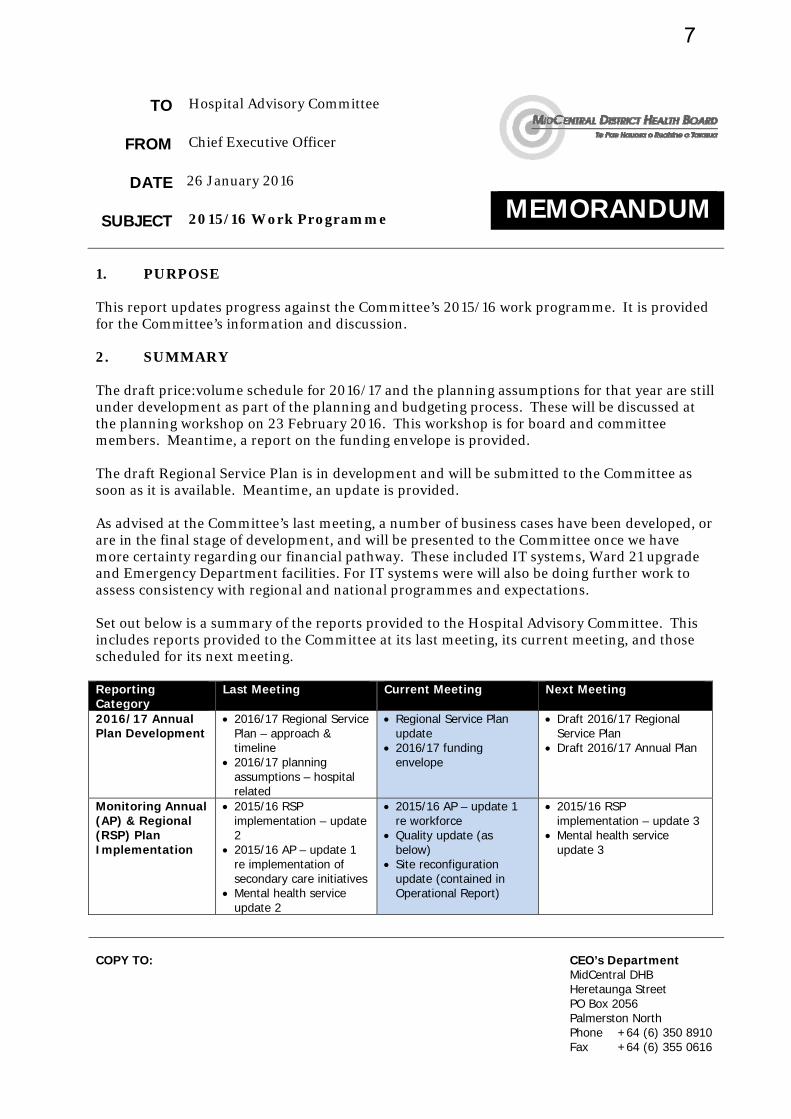
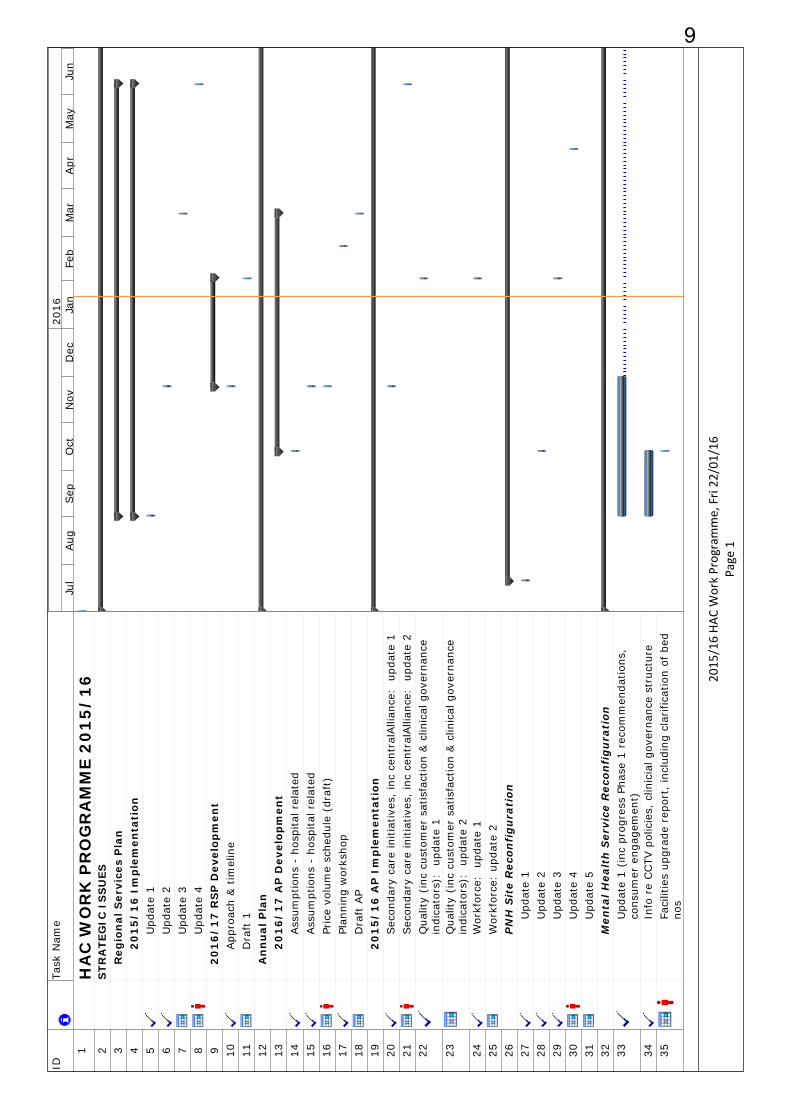
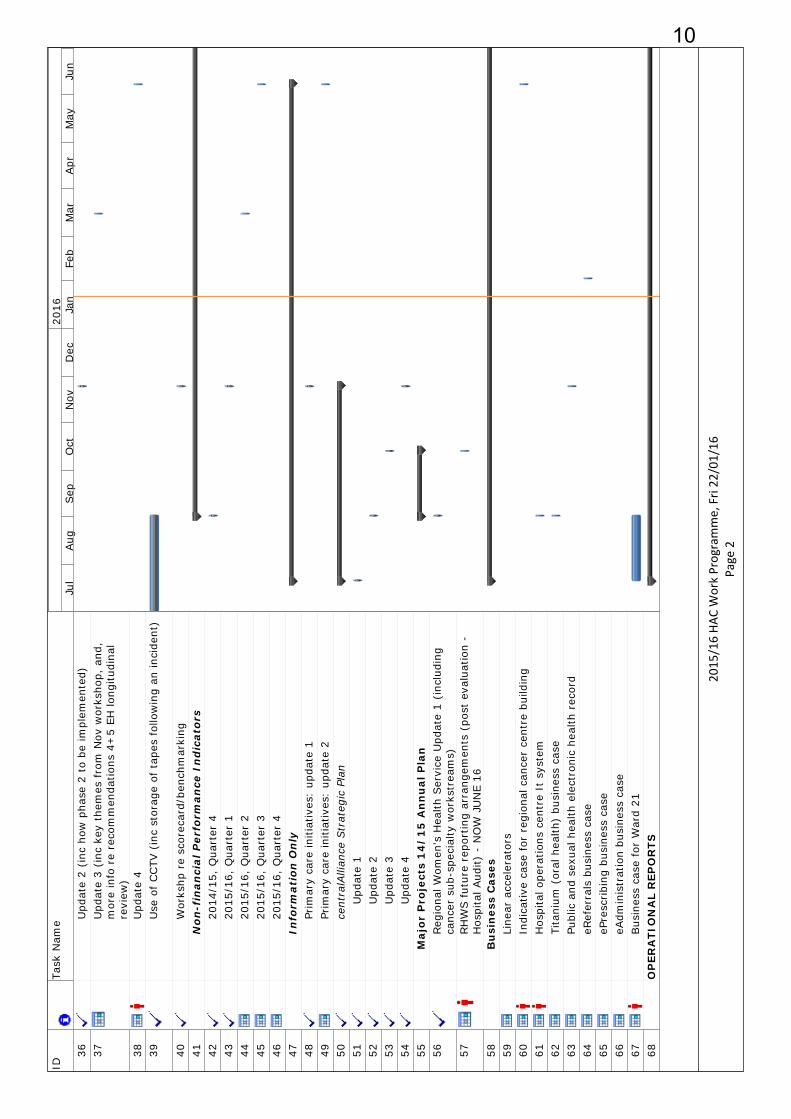
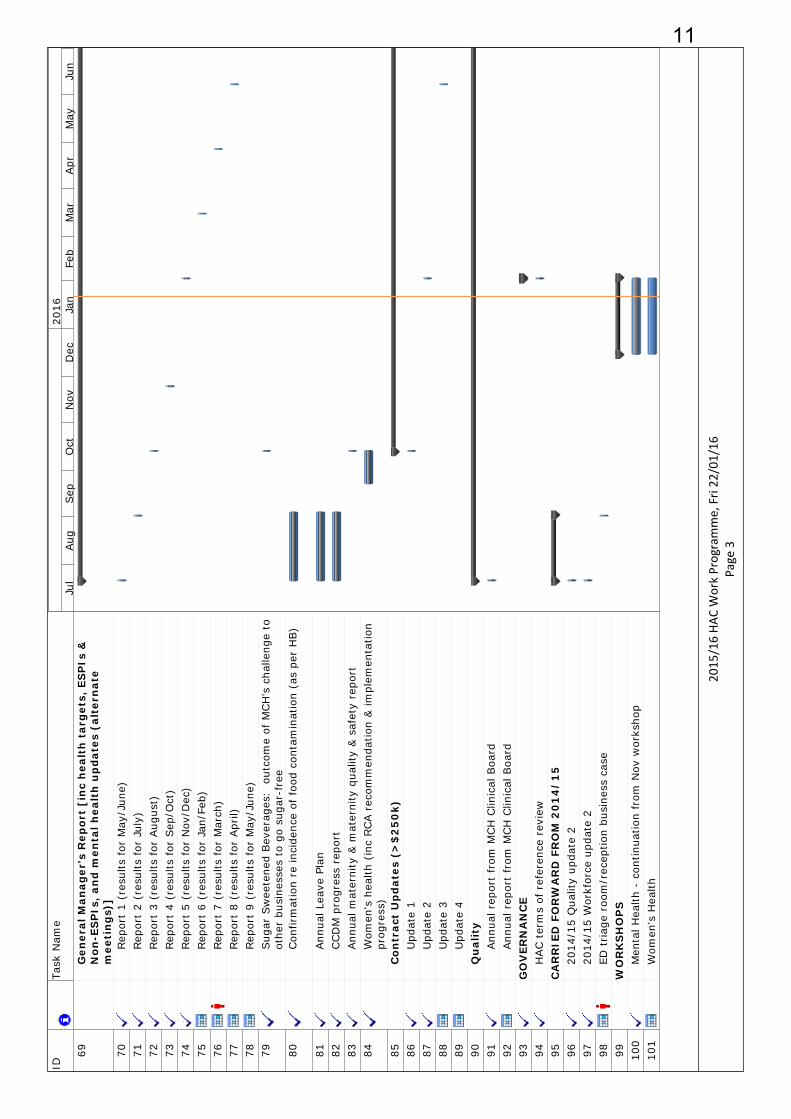
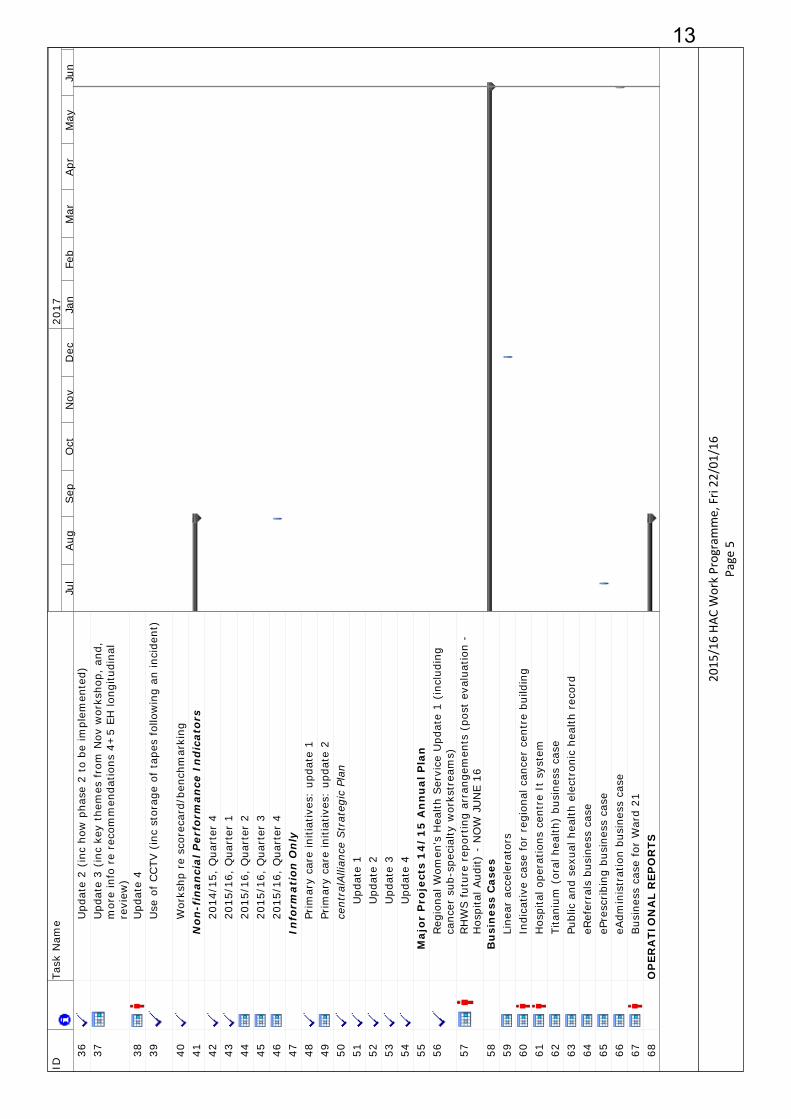
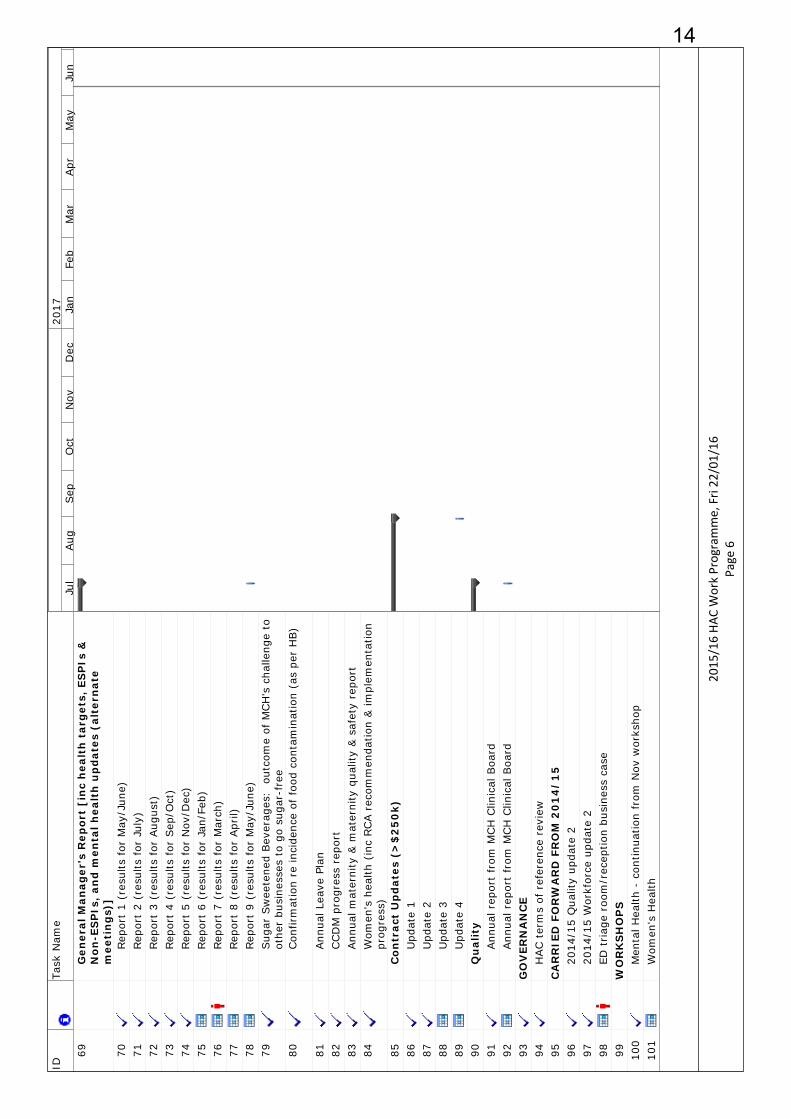
MEMORANDUM SUBJECT 2015/16 Work Programme 1. PURPOSE This report updates progress against the Committee’s 2015/16 work programme. It is provided for the Committee’s information and discussion. 2. SUMMARY The draft price:volume schedule for 2016/17 and the planning assumptions for that year are still under development as part of the planning and budgeting process. These will be discussed at the planning workshop on 23 February 2016. This workshop is for board and committee members. Meantime, a report on the funding envelope is provided. The draft Regional Service Plan is in development and will be submitted to the Committee as soon as it is available. Meantime, an update is provided. As advised at the Committee’s last meeting, a number of business cases have been developed, or are in the final stage of development, and will be presented to the Committee once we have more certainty regarding our financial pathway. These included IT systems, Ward 21 upgrade and Emergency Department facilities. For IT systems were will also be doing further work to assess consistency with regional and national programmes and expectations. Set out below is a summary of the reports provided to the Hospital Advisory Committee. This includes reports provided to the Committee at its last meeting, its current meeting, and those scheduled for its next meeting. Reporting Category
Last Meeting Current Meeting Next Meeting
2016/17 Annual Plan Development
2016/17 Regional Service Plan – approach & timeline
2016/17 planning assumptions – hospital related
Regional Service Plan update
2016/17 funding envelope
Draft 2016/17 Regional Service Plan
Draft 2016/17 Annual Plan
Monitoring Annual (AP) & Regional (RSP) Plan Implementation
2015/16 RSP implementation – update 2
2015/16 AP – update 1 re implementation of secondary care initiatives
Mental health service update 2
2015/16 AP – update 1 re workforce
Quality update (as below)
Site reconfiguration update (contained in Operational Report)
2015/16 RSP implementation – update 3
Mental health service update 3
7
Sub-regional work - centralAlliance
2015/16 AP: update re centralAlliance secondary care initiatives
Quality Non-financial performance measures for quarter ended September 2015
2015/15 AP – update 1 re Quality
Non-financial performance measures for quarter ended December 2015
Operational Matters
September/October results
Team development evaluation
Contracts update Annual leave report November/December
results Women’s health report
January/February results Business cases – Titanium;
hospital operations centre; Ward 21 facilities; ED reception/triage; and eReferrals
Governance Terms of reference review
Reporting Work programme update Work programme update Work programme update Workshops Mental health strategic
planning workshop Mental health strategic
planning workshop Annual planning (23 Feb)
Women’s health workshop
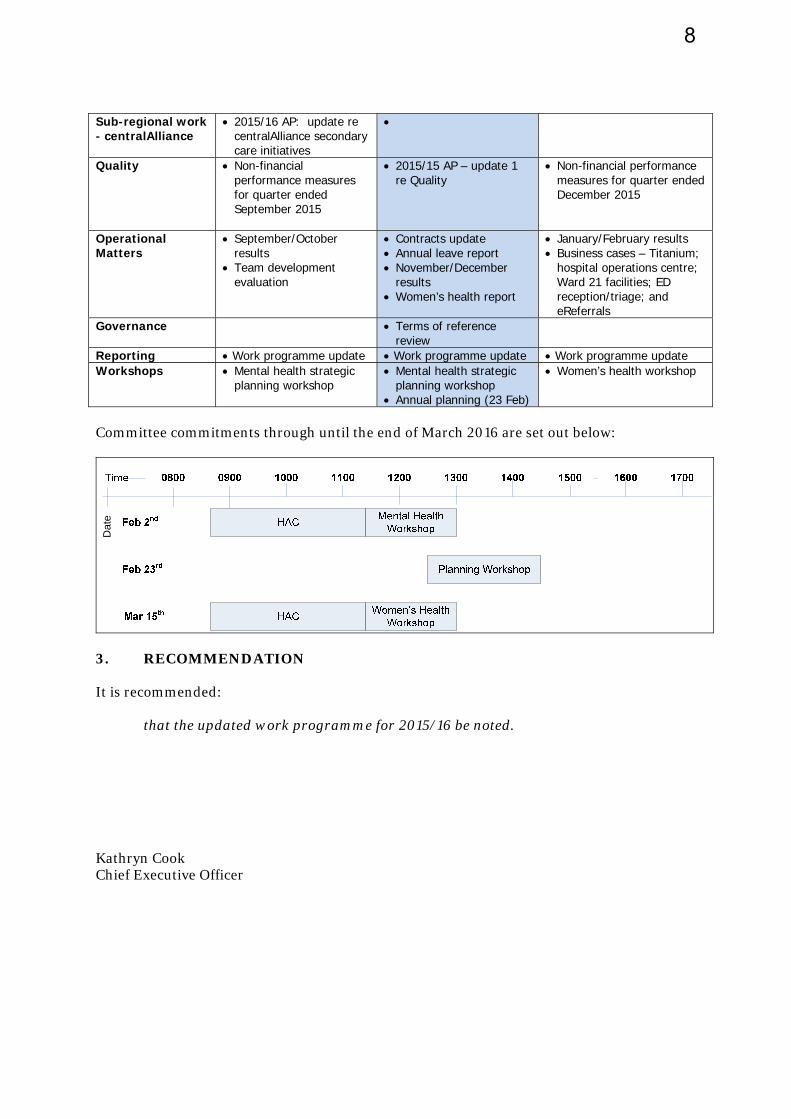
Committee commitments through until the end of March 2016 are set out below:
Dat
e
3. RECOMMENDATION It is recommended: that the updated work programme for 2015/16 be noted. Kathryn Cook Chief Executive Officer
8
IDTa
sk N
ame
1H
AC
WO
RK
PR
OG
RA
MM
E 2
01
5/
16
2S
TRA
TEG
IC I
SS
UES
3R
egio
nal
Ser
vice
s P
lan
42
01
5/
16
Im
ple
men
tati
on5
Upd
ate
16
Upd
ate
27
Upd
ate
38
Upd
ate
49
20
16
/1
7 R
SP
Dev
elop
men
t10
App
roac
h &
tim
elin
e11
Dra
ft 1
12A
nn
ual
Pla
n13
20
16
/1
7 A
P D
evel
opm
ent
14Ass
umpt
ions
- h
ospi
tal r
elat
ed15
Ass
umpt
ions
- h
ospi
tal r
elat
ed16
Pric
e vo
lum
e sc
hedu
le (
draf
t)17
Plan
ning
wor
ksho
p18
Dra
ft A
P19
20
15
/1
6 A
P I
mp
lem
enta
tion
20Sec
onda
ry c
are
initi
ativ
es,
inc
cent
ralA
llian
ce:
upd
ate
121
Sec
onda
ry c
are
initi
ativ
es,
inc
cent
ralA
llian
ce:
upd
ate
222
Qua
lity
(inc
cus
tom
er s
atis
fact
ion
& c
linic
al g
over
nanc
e in
dica
tors
):
upda
te 1
23Q
ualit
y (i
nc c
usto
mer
sat
isfa
ctio
n &
clin
ical
gov
erna
nce
indi
cato
rs):
up
date
224
Wor
kfor
ce:
upd
ate
125
Wor
kfor
ce:
upda
te 2
26P
NH
Sit
e R
econ
fig
ura
tion
27U
pdat
e 1
28U
pdat
e 2
29U
pdat
e 3
30U
pdat
e 4
31U
pdat
e 5
32M
enta
l Hea
lth
Ser
vice
Rec
onfi
gu
rati
on33
Upd
ate
1 (i
nc p
rogr
ess
Phas
e 1
reco
mm
enda
tions
, co
nsum
er e
ngag
emen
t)34
Info
re
CCTV
pol
icie
s, c
linic
ial g
over
nanc
e st
ruct
ure
35Fa
cilit
ies
upgr
ade
repo
rt,
incl
udin
g cl
arifi
catio
n of
bed
no
s
Jul
Aug
Sep
Oct
Nov
Dec
Jan
Feb
Mar
Apr
May
Jun
2016
2015
/16 HA
C Work Programme, Fri 22
/01/16
Page 1
9
IDTa
sk N
ame
36U
pdat
e 2
(inc
how
pha
se 2
to
be im
plem
ente
d)37
Upd
ate
3 (i
nc k
ey t
hem
es f
rom
Nov
wor
ksho
p, a
nd,
mor
e in
fo r
e re
com
men
datio
ns 4
+5
EH lo
ngitu
dina
l re
view
)38
Upd
ate
439
Use
of
CCTV
(in
c st
orag
e of
tap
es f
ollo
win
g an
inci
dent
)
40W
orks
hp r
e sc
orec
ard/
benc
hmar
king
41N
on-f
inan
cial
Per
form
ance
In
dic
ator
s42
2014
/15,
Qua
rter
443
2015
/16,
Qua
rter
144
2015
/16,
Qua
rter
245
2015
/16,
Qua
rter
346
2015
/16,
Qua
rter
447
Info
rmat
ion
On
ly48
Prim
ary
care
initi
ativ
es:
upda
te 1
49Pr
imar
y ca
re in
itiat
ives
: up
date
250
cent
ralA
llian
ce S
trat
egic
Pla
n51
Upd
ate
152
Upd
ate
253
Upd
ate
354
Upd
ate
455
Maj
or
Pro
ject
s 1
4/
15
An
nu
al P
lan
56Reg
iona
l Wom
en's
Hea
lth S
ervi
ce U
pdat
e 1
(inc
ludi
ng
canc
er s
ub-s
peci
alty
wor
kstr
eam
s)57
RH
WS f
utur
e re
port
ing
arra
ngem
ents
(po
st e
valu
atio
n -
Hos
pita
l Aud
it) -
NO
W J
UN
E 16
58B
usi
nes
s C
ases
59Li
near
acc
eler
ator
s60
Indi
cativ
e ca
se f
or r
egio
nal c
ance
r ce
ntre
bui
ldin
g61
Hos
pita
l ope
ratio
ns c
entr
e It
sys
tem
62Ti
tani
um (
oral
hea
lth)
busi
ness
cas
e63
Publ
ic a
nd s
exua
l hea
lth e
lect
roni
c he
alth
rec
ord
64eR
efer
rals
bus
ines
s ca
se65
ePre
scribi
ng b
usin
ess
case
66eA
dmin
istr
atio
n bu
sine
ss c
ase
67Bus
ines
s ca
se f
or W
ard
2168
OP
ERA
TIO
NA
L R
EPO
RTS
Jul
Aug
Sep
Oct
Nov
Dec
Jan
Feb
Mar
Apr
May
Jun
2016
2015
/16 HA
C Work Programme, Fri 22
/01/16
Page 2
10
IDTa
sk N
ame
69G
ener
al M
anag
er's
Rep
ort
[in
c h
ealt
h t
arg
ets,
ES
PIs
&
No
n-E
SP
Is,
and
men
tal h
ealt
h u
pd
ates
(al
tern
ate
mee
tin
gs)
]70
Rep
ort
1 (r
esul
ts f
or M
ay/J
une)
71Rep
ort
2 (r
esul
ts f
or J
uly)
72Rep
ort
3 (r
esul
ts f
or A
ugus
t)73
Rep
ort
4 (r
esul
ts f
or S
ep/O
ct)
74Rep
ort
5 (r
esul
ts f
or N
ov/D
ec)
75Rep
ort
6 (r
esul
ts f
or J
an/F
eb)
76Rep
ort
7 (r
esul
ts f
or M
arch
)77
Rep
ort
8 (r
esul
ts f
or A
pril)
78Rep
ort
9 (r
esul
ts f
or M
ay/J
une)
79Sug
ar S
wee
tene
d Bev
erag
es:
out
com
e of
MCH
's c
halle
nge
to
othe
r bu
sine
sses
to
go s
ugar
-fre
e80
Con
firm
atio
n re
inci
denc
e of
foo
d co
ntam
inat
ion
(as
per
HB)
81Ann
ual L
eave
Pla
n82
CCD
M p
rogr
ess
repo
rt83
Ann
ual m
ater
nity
& m
ater
nity
qua
lity
& s
afet
y re
port
84W
omen
's h
ealth
(in
c RCA r
ecom
men
datio
n &
impl
emen
tatio
n pr
ogre
ss)
85C
ontr
act
Up
dat
es (
>$
25
0k)
86U
pdat
e 1
87U
pdat
e 2
88U
pdat
e 3
89U
pdat
e 4
90Q
ual
ity
91Ann
ual r
epor
t fr
om M
CH
Clin
ical
Boa
rd92
Ann
ual r
epor
t fr
om M
CH
Clin
ical
Boa
rd93
GO
VER
NA
NC
E94
HAC t
erm
s of
ref
eren
ce r
evie
w95
CA
RR
IED
FO
RW
AR
D F
RO
M 2
01
4/
15
9620
14/1
5 Q
ualit
y up
date
297
2014
/15
Wor
kfor
ce u
pdat
e 2
98ED
triag
e ro
om/r
ecep
tion
busi
ness
cas
e99
WO
RK
SH
OP
S10
0M
enta
l Hea
lth -
con
tinua
tion
from
Nov
wor
ksho
p10
1W
omen
's H
ealth
Jul
Aug
Sep
Oct
Nov
Dec
Jan
Feb
Mar
Apr
May
Jun
2016
2015
/16 HA
C Work Programme, Fri 22
/01/16
Page 3
11

IDTa
sk N
ame
1H
AC
WO
RK
PR
OG
RA
MM
E 2
01
5/
16
2S
TRA
TEG
IC I
SS
UES
3R
egio
nal
Ser
vice
s P
lan
42
01
5/
16
Im
ple
men
tati
on5
Upd
ate
16
Upd
ate
27
Upd
ate
38
Upd
ate
49
20
16
/1
7 R
SP
Dev
elop
men
t10
App
roac
h &
tim
elin
e11
Dra
ft 1
12A
nn
ual
Pla
n13
20
16
/1
7 A
P D
evel
opm
ent
14Ass
umpt
ions
- h
ospi
tal r
elat
ed15
Ass
umpt
ions
- h
ospi
tal r
elat
ed16
Pric
e vo
lum
e sc
hedu
le (
draf
t)17
Plan
ning
wor
ksho
p18
Dra
ft A
P19
20
15
/1
6 A
P I
mp
lem
enta
tion
20Sec
onda
ry c
are
initi
ativ
es,
inc
cent
ralA
llian
ce:
upd
ate
121
Sec
onda
ry c
are
initi
ativ
es,
inc
cent
ralA
llian
ce:
upd
ate
222
Qua
lity
(inc
cus
tom
er s
atis
fact
ion
& c
linic
al g
over
nanc
e in
dica
tors
):
upda
te 1
23Q
ualit
y (i
nc c
usto
mer
sat
isfa
ctio
n &
clin
ical
gov
erna
nce
indi
cato
rs):
up
date
224
Wor
kfor
ce:
upd
ate
125
Wor
kfor
ce:
upda
te 2
26P
NH
Sit
e R
econ
fig
ura
tion
27U
pdat
e 1
28U
pdat
e 2
29U
pdat
e 3
30U
pdat
e 4
31U
pdat
e 5
32M
enta
l Hea
lth
Ser
vice
Rec
onfi
gu
rati
on33
Upd
ate
1 (i
nc p
rogr
ess
Phas
e 1
reco
mm
enda
tions
, co
nsum
er e
ngag
emen
t)34
Info
re
CCTV
pol
icie
s, c
linic
ial g
over
nanc
e st
ruct
ure
35Fa
cilit
ies
upgr
ade
repo
rt,
incl
udin
g cl
arifi
catio
n of
bed
no
s
Jul
Aug
Sep
Oct
Nov
Dec
Jan
Feb
Mar
Apr
May
Jun
2017
2015
/16 HA
C Work Programme, Fri 22
/01/16
Page 4
12
IDTa
sk N
ame
36U
pdat
e 2
(inc
how
pha
se 2
to
be im
plem
ente
d)37
Upd
ate
3 (i
nc k
ey t
hem
es f
rom
Nov
wor
ksho
p, a
nd,
mor
e in
fo r
e re
com
men
datio
ns 4
+5
EH lo
ngitu
dina
l re
view
)38
Upd
ate
439
Use
of
CCTV
(in
c st
orag
e of
tap
es f
ollo
win
g an
inci
dent
)
40W
orks
hp r
e sc
orec
ard/
benc
hmar
king
41N
on-f
inan
cial
Per
form
ance
In
dic
ator
s42
2014
/15,
Qua
rter
443
2015
/16,
Qua
rter
144
2015
/16,
Qua
rter
245
2015
/16,
Qua
rter
346
2015
/16,
Qua
rter
447
Info
rmat
ion
On
ly48
Prim
ary
care
initi
ativ
es:
upda
te 1
49Pr
imar
y ca
re in
itiat
ives
: up
date
250
cent
ralA
llian
ce S
trat
egic
Pla
n51
Upd
ate
152
Upd
ate
253
Upd
ate
354
Upd
ate
455
Maj
or
Pro
ject
s 1
4/
15
An
nu
al P
lan
56Reg
iona
l Wom
en's
Hea
lth S
ervi
ce U
pdat
e 1
(inc
ludi
ng
canc
er s
ub-s
peci
alty
wor
kstr
eam
s)57
RH
WS f
utur
e re
port
ing
arra
ngem
ents
(po
st e
valu
atio
n -
Hos
pita
l Aud
it) -
NO
W J
UN
E 16
58B
usi
nes
s C
ases
59Li
near
acc
eler
ator
s60
Indi
cativ
e ca
se f
or r
egio
nal c
ance
r ce
ntre
bui
ldin
g61
Hos
pita
l ope
ratio
ns c
entr
e It
sys
tem
62Ti
tani
um (
oral
hea
lth)
busi
ness
cas
e63
Publ
ic a
nd s
exua
l hea
lth e
lect
roni
c he
alth
rec
ord
64eR
efer
rals
bus
ines
s ca
se65
ePre
scribi
ng b
usin
ess
case
66eA
dmin
istr
atio
n bu
sine
ss c
ase
67Bus
ines
s ca
se f
or W
ard
2168
OP
ERA
TIO
NA
L R
EPO
RTS
Jul
Aug
Sep
Oct
Nov
Dec
Jan
Feb
Mar
Apr
May
Jun
2017
2015
/16 HA
C Work Programme, Fri 22
/01/16
Page 5
13
IDTa
sk N
ame
69G
ener
al M
anag
er's
Rep
ort
[in
c h
ealt
h t
arg
ets,
ES
PIs
&
No
n-E
SP
Is,
and
men
tal h
ealt
h u
pd
ates
(al
tern
ate
mee
tin
gs)
]70
Rep
ort
1 (r
esul
ts f
or M
ay/J
une)
71Rep
ort
2 (r
esul
ts f
or J
uly)
72Rep
ort
3 (r
esul
ts f
or A
ugus
t)73
Rep
ort
4 (r
esul
ts f
or S
ep/O
ct)
74Rep
ort
5 (r
esul
ts f
or N
ov/D
ec)
75Rep
ort
6 (r
esul
ts f
or J
an/F
eb)
76Rep
ort
7 (r
esul
ts f
or M
arch
)77
Rep
ort
8 (r
esul
ts f
or A
pril)
78Rep
ort
9 (r
esul
ts f
or M
ay/J
une)
79Sug
ar S
wee
tene
d Bev
erag
es:
out
com
e of
MCH
's c
halle
nge
to
othe
r bu
sine
sses
to
go s
ugar
-fre
e80
Con
firm
atio
n re
inci
denc
e of
foo
d co
ntam
inat
ion
(as
per
HB)
81Ann
ual L
eave
Pla
n82
CCD
M p
rogr
ess
repo
rt83
Ann
ual m
ater
nity
& m
ater
nity
qua
lity
& s
afet
y re
port
84W
omen
's h
ealth
(in
c RCA r
ecom
men
datio
n &
impl
emen
tatio
n pr
ogre
ss)
85C
ontr
act
Up
dat
es (
>$
25
0k)
86U
pdat
e 1
87U
pdat
e 2
88U
pdat
e 3
89U
pdat
e 4
90Q
ual
ity
91Ann
ual r
epor
t fr
om M
CH
Clin
ical
Boa
rd92
Ann
ual r
epor
t fr
om M
CH
Clin
ical
Boa
rd93
GO
VER
NA
NC
E94
HAC t
erm
s of
ref
eren
ce r
evie
w95
CA
RR
IED
FO
RW
AR
D F
RO
M 2
01
4/
15
9620
14/1
5 Q
ualit
y up
date
297
2014
/15
Wor
kfor
ce u
pdat
e 2
98ED
triag
e ro
om/r
ecep
tion
busi
ness
cas
e99
WO
RK
SH
OP
S10
0M
enta
l Hea
lth -
con
tinua
tion
from
Nov
wor
ksho
p10
1W
omen
's H
ealth
Jul
Aug
Sep
Oct
Nov
Dec
Jan
Feb
Mar
Apr
May
Jun
2017
2015
/16 HA
C Work Programme, Fri 22
/01/16
Page 6
14
Page 1
Copy to: Strategy, Planning and Performance Board Office, Heretaunga Street
PO Box 2056 Palmerston North
Phone (06) 350 8626
TO Community & Public Health Advisory Committee Hospital Advisory Committee
FROM Vivienne Ayres
Manager DHB Planning and Accountability
DATE 20 January 2016
SUBJECT 2016/17 REGIONAL SERVICE PLAN DEVELOPMENT
1 Purpose To provide the Committees with an update on the development of the 2016/17 Regional Service Plan. This update is for information – no decision is required. 2 Summary Development of the Central Region’s Regional Service Plan (RSP) for 2016/17 is underway. The regional planning process continues to be facilitated and coordinated by the Central Region’s Technical Advisory Service (TAS) programme management office. At this stage, development of the RSP is not sufficiently advanced to submit to MidCentral District Health Board as a work in progress draft. The strategic component of the RSP is being further considered through the regional Chief Executives Forum. This is particularly in response to the requested refresh and update to the 2008 Regional Clinical Services Plan and the combined Boards’ indications from the regional workshops in the latter part of 2015. The Ministry advises that the RSP, as with DHB Annual Plans, should reflect the strategic intentions and roadmap of the refreshed New Zealand Health Strategy, and that there is a clear “line of sight” evident in each of the planning documents. Consultation on the draft Strategy closed in early December; further information and advice is expected to be received from the Ministry of Health in February. The implementation planning component of the RSP is currently progressing with the development of action plans for each of the work programmes that reflect regional priorities, Government priorities and the planning guidelines issued by the Ministry of Health. The work in progress for each of the work programmes builds on prior years’ work and achievements guided by the relevant regional networks. The working draft work programmes will be subject to a moderation process via the DHBs’ planners in the first instance (scheduled for end of January) before being submitted to the regional executive and governance groups for their consideration.
MEMORANDUM
15
Page 2
The indicative timeframe issued by the Ministry of Health has the first draft of the RSP being submitted to the Ministry on 31 March 2016 for their review, at the same time as the DHBs’ Annual Plans and Maori Health Plans. It is expected that the Committees will receive a copy of the draft RSP for consideration at their meetings in March 2016. 3 Recommendation It is recommended: that this report be received Vivienne Ayres Manager, DHB Planning and Accountability
16
Page 3
Copy to: Strategy, Planning and Performance Board Office, Heretaunga Street
PO Box 2056 Palmerston North
Phone (06) 350 8626
4 Update Implementation planning for each of the regional work programmes for the 2016/17 year is currently underway. The work in progress for each of the work programmes builds on prior years’ work and achievements guided by the relevant regional networks. MidCentral DHB has a number of clinical and non-clinical staff involved in the regional networks, so is contributing to the development of the 2016/17 work programmes through those networks. The regional programmes of work are: Elective Services Cardiac Services Mental Health and Addictions Stroke Services Health of Older People Major Trauma Hepatitis C Health Informatics Workforce As for this current year, cancer services will be included in the RSP under the umbrella of the Regional Cancer Networks’ work programme. This will include implementing priorities of the New Zealand Cancer Plan: Better, Faster cancer care, 2015 – 2018 as the priority for regional planning. The draft plan to date has a focus on improving equity of access to cancer services, timeliness of services across the whole cancer pathway and the quality of cancer services delivered. Although capital planning will continue to be an integral part of the RSP planning processes, the requirement for a regional Capital Plan has been superseded by the new Investment Management and Asset Performance (IMAP) process as advised by Treasury, which took effect from July 2015. All District Health Boards are required to complete a Long Term Investment Plan, which must be formally refreshed every three years (notwithstanding regular review). As a ‘non-intensive investment agency’, MidCentral DHB is expected to submit its LTIP by October 2016. The RSP planning processes will need to reflect the intentions from each DHB in this regard. A clear ‘line of sight’ between the outcomes and objectives of Government priorities (including the refreshed New Zealand Health Strategy), national entities, the Regional Service Plans and DHB Annual Plans is expected to be shown in each of the documents. This will be demonstrated in MidCentral’s Annual Plan and the RSP by clear referencing of the linkages between the respective programme plans. A further update on the refreshed NZ Health Strategy is expected from the Ministry of Health in February. Draft work plans for each of the regional programmes will be considered by DHB planners and the TAS planning team at the end of January before being submitted as working drafts for consideration by the regional executive and governance groups in February and March. The strategic component of the RSP is being further considered through the regional Chief Executives Forum. This is particularly in response to the requested refresh and update to the 2008 Regional Clinical Services Plan and the combined Boards’ indications from the regional workshops in the latter part of 2015. The Chief Executives will be further discussing this at their meeting in February, focusing on the opportunity for the collective
17
Page 4 regional approach to be reframed in order to address emerging challenges as well as build on the regional progress that has been made to date. 5 2016/17 Regional Service Plan – Programme Priorities The current priorities and regional objectives for which action plans are being developed for the Regional Service Plan are outlined below. 5.1 Regional Clinical Services Elective Services
o Improve access to elective services o Maintain reduced waiting times for elective first specialist assessments and treatment o Improve equity of access to services, so patients receive similar access regardless of
where they live
Cardiac Services o Improve access and timeliness of cardiac services o Patients with a similar level of need receive comparable access to services, regardless
of where they live o More patients survive acute coronary events and the likelihood of subsequent events is
reduced o Patients with suspected Acute Coronary Syndrome receive seamless, coordinated care
across the clinical pathway o Patients with heart failure are optimally managed at admission, reducing the need for
further readmission o Reviewing and auditing Accelerated Chest Pain Pathways in Emergency Departments
Mental Health and Addictions o Improve access to the range of eating disorders services o Improve youth forensic service capacity and responsiveness o Improve perinatal and maternal mental health acute service options as part of a
service continuum o Improve the physical health of people with low prevalence disorders
Stroke Services o Improve primary and secondary stroke prevention and reduce stroke related disability
and mortality o Improve access to quality assured organised acute, rehabilitation and community
stroke services (including 24/7 thrombolysis services) o Ensure all stroke patients have access to high-quality stroke services regardless of age,
gender, ethnicity or geographic domicile
Health of Older People o Continue strengthening dementia pathways, dementia awareness, education and
support programmes across primary, secondary and community settings and in supporting informal carers
o Proactive use of interRAI data across primary and secondary care to identify equity, population and service trends
18
Page 5 Major Trauma
o Implement a regional trauma system that will result in a reduction of preventable levels of mortality, complications and lifelong disability of patients who have sustained a major trauma (as defined by the National Trauma Network). Includes reporting national minimum dataset to regional registries, clinical guidelines and Regional Destination policies for major trauma patients
Hepatitis C o Implement a single clinical pathway for Hepatitis C care across all regions in order to
provide consistent services (including minimum requirements, minimum standards and data collection)
o Implement integrated hepatitis C assessment and treatment services across community, primary and secondary care services in the region (includes HCV testing and care that will include Fibroscan services)
Cancer services As for this current year, cancer services will be under the umbrella of the Regional Cancer Networks’ work programmes and referred as such in the RSP. This will include implementing priorities of the New Zealand Cancer Plan: Better, Faster cancer care, 2015 – 2018 as the priority for regional planning. The plan is expected to focus on improving equity of access to cancer services, timeliness of services across the whole cancer pathway and the quality of cancer services delivered
5.2 Regional Enablers Workforce
o Facilitate regionally based solutions to address national workforce priorities, enabling ‐ implementation of community based attachments for prevocational trainees ‐ increasing participation of Maori and Pacific in the health workforce ‐ implementation of the Children’s Action Plan ‐ recruitment of new palliative care specialist nurses and education ‐ support for the role of nurse practitioners, clinical nurse specialists and nurses
performing endoscopies ‐ support for the training of sonographers and medical physicists
o Identify and progress a regional coordinated approach to “new models of care”, planning and development
o Demonstrate leadership and commitment that supports the development of the region’s health workforce
o Strengthen local and regional health workforce intelligence o Build on 2015/16 RSPs, demonstrating further progress on actions to meet milestones
Health Informatics
Continue the critical health informatics and technology priorities of the 2015/16 national and regional programmes, building on platforms to create an electronic medical record that supports a new level of digital capability in hospitals) o The RSP must include the prioritised 3-year plan of all local, regional and national IT
initiatives, including the applicable critical IT priorities (see national priorities below), with budget allocation and key deliverable to be achieved in the year. Include actions in Annual Plan on implementation of the National Maternity Information Systems Platform (MISP-NZ)
o The strategies the region has put in place to address the following IT delivery challenges: ‐ regional governance, leadership and decision-making ‐ regional funding and approval model(s) ‐ regional capacity and capability
19

Page 6
‐ roadmap for development of an EMR environment o National priority initiatives:
‐ Electronic Prescribing and Administration (ePA), where applicable regionally where not implemented as individual DHBs
‐ Regional clinical workstation (Clinical Portal) and clinical data repository ‐ Regional PAS (webPAS) ‐ Integration with the national electronic health record (design phase)
MidCentral’s contribution to the Regional Service Plan from a DHB annual planning or sub-regional perspective will otherwise be coordinated through the Strategy, Planning and Performance group in collaboration with the centralAlliance where appropriate.
20
COPY TO:
Patient Safety & Clinical Effectiveness MidCentral Health Heretaunga Street
PO Box 2056 Palmerston North
Phone +64(6) 350 8030
TO Hospital Advisory Committee
FROM Muriel Hancock Director Patient Safety and Clinical Effectiveness
DATE 15 January 2016
SUBJECT Annual Plan Update
Patient Safety and Clinical Effectiveness 1. PURPOSE
The purpose of this report is to provide a first update on what has been achieved against the 2015/16 Annual Plan (AP) initiatives for Patient Safety and Clinical Effectiveness (attached as Appendix 1). The report includes results of the first five inpatient experience surveys. The report also provides an overview of work in progress within and beyond Patient Safety and Clinical Effectiveness including a wide range of improvement initiatives. It is for the Hospital Advisory Committee’s (HAC) information and does not require a decision. 2. SUMMARY
Risk management is an effective business tool that not only supports decision making, but safeguards the organisation from likely threats and enhances organisational strategy and service delivery. We maintain one risk register incorporated into the electronic risk system. The risk system has reached a level of maturity that enhances the organisation’s risk management capabilities for known risk and also identifies new risk through incident trending. The effectiveness of risk management is endorsed in the recent certification audit report that identified we maintain good risk management processes including risk identification, monitoring and mitigation. The Health Quality and Safety Commission (HQSC) offered us the opportunity to work in partnership with them to pilot a new way of delivering the Partners in Care Programme to District Health Boards (DHB). Previously this programme had been offered in centralised locations requiring staff and consumers from DHBs to travel away to undertake the programme. Partners in Care is generally referred to as Co-design. Co-design is about designing solutions with our patients/whanau at every step of the way, right from the initial concept to implementation and not considering it as another model, but as the best and only way of working that ensures we deliver the right solutions. We consulted across our organisation to identify areas/issues that might benefit from this approach. Ongoing consultation resulted in four teams nominating themselves for this programme. Each team includes a minimum of four DHB staff and one consumer. The inpatient experience survey continues to be undertaken quarterly with five survey rounds completed. The ratings of our respondents are similar to those of other DHB’s respondents. In the most recent survey, ratings on Partnership and Co-ordination are seen to diverge. Positive comments were far more numerous than negative comments.
MEMORANDUM
21

Page 2
Negative comments from respondents relating to Partnership covered lack of attention to personal cares and patients feeling they were being rushed through. Negative comments relating to Co-ordination included patients being given conflicting information and a perceived lack of aftercare. We are continuing to achieve our target of 80 per cent of prioritised patients receiving medication reconciliation. The implementation of stage two of the clinical portal will include an electronic medication reconciliation module, with process measures relating to this already developed by the HQSC. A timeframe for moving to stage two of the clinical portal is not yet confirmed however when this occurs we will be able to expand medication reconciliation to a wider group of patients. We continue to participate in the HQSC lead “Open for Better Care” campaign which focuses on reducing harm to patients. We also continue to co-ordinate this work for the central region. The campaign branding “Open for Better Care” provides opportunities for strengthening the patient safety work already in progress, while at the same time learning from others about new initiatives that reduce harm to patients. In January 2016 the campaign moved to addressing issues of leadership and capability with regard to patient safety, in particular looking at patient safety competencies, professional development and clinical governance etc. We are partnering with the HQSC in implementing a national breakthrough collaborative on the safe use of opioids in hospitals. The goal of the collaborative is to reduce harm from opioids in hospitals, and to build capability within hospitals in medication safety and quality improvement. Our Opioid Collaborative Working Group has established our local context around opioid related constipation, prescribing practices, documentation and monitoring in Star 2. The suite of Quality and Safety Markers are detailed within this report. Two areas are below the expected target, hand hygiene and one measure of three in the surgical site infection surveillance. Improvement plans are continuing to be revised and strengthened. The surgical safety checklist marker has been retired and changed to a measure relating to Teamwork and Communication with the objective of reducing opportunity for patient harm and improving patient outcomes. We are continuing to make improvements in relation to falls injury reduction. We achieved 92 per cent against the target of 90 per cent for older people having a falls risk assessment and 99 per cent against the target of 90 per cent for those older people assessed as being at risk of falling having an individualised care plan in place. The HQSC has reported a 40 per cent reduction in fractured neck of femur resulting from in-hospital falls and approximately $1.8 million in savings to DHBs, in addition to the reduced impact on patients and families. The central region featured at the forefront of this reduction. Hand hygiene results for the last audit period are reported at 75 per cent which is below the target of 80 per cent. A range of strategies have been developed to strengthen our achievement in this area including clinical leadership from a multidisciplinary taskforce to support and facilitate team work and advocate for local clinical leadership and accountability. In November 2015 over a three day period, we underwent a surveillance audit for certification against the Health and Disability Service Standards (HDSS). Eleven of the 30 corrective actions we received in May 2014 were closed. The remaining 19 corrective actions either remained the same or were modified in relation to the improvements that have been made. Two new corrective actions were made which makes a total of 21 corrective actions. Five of the 21 are rated as moderate risk and 16 as low risk. In addition, for the first time, we received a Continuous Improvement rating for Infection Prevention and Control in relation to the Staff Influenza Vaccination Programme for 2015. Improvements related to Family Violence Intervention continue with regular ongoing training and refresher courses now also being provided. The Ministry of Health (MoH) requested a
22
Page 3
second snapshot audit for the period from 1 April to 30 June 2015. The services audited included the Emergency Department, Women’s Health (post natal maternity), Child Health and Sexual Health. Significant improvement has been made in all services apart from Child Health. Next year the Mental Health and Addictions Service will also be included. This snapshot audit will be an ongoing annual requirement. We are also required to develop and progress at least two “plan, do, study, act” (PDSA) cycles to improve screening or disclosure rates where audit results require improvement. The two that we have developed focus on improving disclosure rates in Postnatal Maternity and in the Children’s Ward to facilitate the screening process. The Health and Safety at Work Act 2015 comes into force on 4 April 2016. The Act and its associated regulations have a clear focus on staff education and staff engagement. We have a number of activities underway to ensure organisational compliance is achieved. These include a review of Health and Safety (H&S) representative training, hazard management and dedicated time for H&S representatives to actively carry out their roles. As a result of the work already in progress here, on broadening out the concept of spirituality, the Interchurch Council for Hospital Chaplaincy (ICHC), the direct employer of chaplains, are partnering with us in supporting a Spiritual Care Advisory Group to:
Improve the level and quality of spiritual care for patients, family/whanau and staff. Add value to the existing chaplaincy service. Develop new ways of working collaboratively to meet changing conditions. Overall the purpose of the group is to ensure spirituality becomes an integral part of healthcare in our organisation. We achieved 60 per cent uptake of influenza vaccine for our staff compared to the national average of 66 per cent. Improvement from 50 per cent in the previous year was gained by a team approach and leadership support. Key strategies that improved coverage included implementation of a Ward Based Vaccinator Programme. This programme has been widely used in DHBs where vaccination rates continue to improve and requires commitment from line and professional managers. The current pool of vaccinators includes two pharmacists and 12 nurses. Another eight vaccinators are being trained for the 2016 programme. 3. RECOMMENDATION
It is recommended that: this report be received
23
Page 4
4. CLINICAL GOVERNANCE AND QUALITY IMPROVEMENT FRAMEWORK This report continues to be structured using the four dimensions of this framework as described below. In “Getting it right”, we believe that you the patient and community deserve care, when
it is required, that is based on best available evidence and provided within the funding we get. We are obliged to demonstrate efficient use of our resources and that they are applied effectively using accepted standards of practice to obtain the desired results for our patients and communities. One strategy in delivering the best possible care to patients is evidence-based medicine, which is defined as “the integration of best research evidence with clinical expertise and patient values”. Together with our skilled staff, we will adopt new techniques, equipment and protocols, such as the Map of Medicine® Collaborative Clinical Pathways, to bring the best possible care that we can afford to patients.
“Being consumer and community focused” means having the patient/consumer at the centre of all that we do. Our priority is to meet the needs of the people we serve based on a clear understanding of their healthcare needs and the health status of our population. Getting you to tell us about your experience of the care you receive helps us to better understand current problems, review what needs to change, monitor the impact of change, help with informed choices and improve care. We exist in a wider community and need to ensure that we connect with a range of communities that contribute to the health and wellbeing of individuals and our population.
In “Being up to the job” we are ensuring that we have the right systems for having the
right people in the right place, at the right time, doing the right things. We support a culture of teamwork and leadership so that you receive safe, quality care and that our workforce is valued for their professional efforts. By working together and by providing ongoing learning opportunities, you can be confident that our staff are selected and developed to be competent, courteous and fit to practice, in fit-for-purpose facilities using appropriate materials and equipment in order to provide excellence in health care.
“Being willing and able to learn” means that we take continuous quality improvement
as “a way of life” in all that we do. We do this by having a common purpose in continually reviewing our performance, learning from our mistakes and having the courage to be innovative. A willingness to share information about what works and what doesn’t is based on a shared understanding of what ‘good quality’ healthcare is and a common measurement system which reflects this understanding.
5. GETTING IT RIGHT
5.1 Certification and Accreditation Update In November 2015 over a three day period, we underwent a surveillance audit for certification against the Health and Disability Service Standards (HDSS). Eleven of the 30 corrective actions we received in May 2014 were closed. The remaining 19 corrective actions either remained the same or were modified in relation to the improvements that have been made. Two new corrective actions were made which makes a total of 21 corrective actions. Five of the 21 are rated as moderate risk and 16 as low risk. For the first time we have also received a rating of Continuous Improvement against the Infection Prevention and Control standard relating to the Staff Influenza Vaccination Programme. The final report including agreed and finalised corrective actions has been received for review and factual correction. It is not anticipated that any change to the corrective actions will occur. The corrective actions, as tabled on the last day of audit are reported in Appendix 2 and identify the senior management owner as well as including a reporting template. When the finalised report is available this will be provided to the Committee as well as progress updates on a six monthly basis. Reports to HealthCert are expected to be approximately March and July 2016.
24
Page 5
In September 2015 staff from MidCentral District Health Board (MDHB) including the Central PHO attended the New Zealand Business Excellence Foundation (NZBEF) training. This was a four day training opportunity to learn the criteria within the framework and how we could apply this going forward. The training was positively received by those who attended and the consensus was the framework would support the ongoing improvement and development of our organisation. Work is yet to progress on determining next steps for this. 5.2 Document Management System MDHB’s document database held approximately 3,000 controlled documents as at June 2013. A controlled document is one that must meet the set style standards and be approved following a prescribed sign off process, e.g. policy, procedure and guideline etc. During the certification audit held in May 2014 a high priority corrective action was received that noted a large number of controlled documents overdue for review, i.e. approximately 60 per cent. In the November 2015 surveillance audit, the auditors commented on the positive progress that had been made to move policies, procedures, forms and all documents requiring control to the electronic Sharepoint system. Improvements have been made to streamline and simplify the review and authorisation process. The number of overdue documents continues to reduce with 26 per cent now overdue. The auditors have indicated that there is still work to be done on reducing the percentage of overdue documents. An area that was also identified at audit was that a number of clinical areas have paper versions of policy manuals that are not being kept up to date. The audit showed the paper versions were not consistent with the electronic version in the Sharepoint system and staff were working off outdated paper versions. Work is in progress in partnership with clinical areas to remove unnecessary policy manuals and ensure that alternatives are workable and efficient for each area. 5.3 Privacy Self Assessment Good practice in privacy and security underpins our ability to safely and appropriately use information to deliver people-centred services, and to maintain trust and confidence in our delivery systems. To support continuous improvement in privacy, an enduring function has been established through the Government Chief Privacy Officer (GCPO). The GCPO complements the roles of the State Services Commission, the Privacy Commission and the Government Chief Information Officer (GCIO). The GCPO has worked collaboratively with a number of agencies, to deliver clear and cohesive guidance and tools, with ongoing support from agencies. The GCPO has issued expectations that represent good practice for privacy management and governance in State Services. A Privacy Maturity Assessment Framework and core expectations have been issued to help with assessing existing capability and to implement appropriate improvements. DHBs came under the mandate of the GCPO in July 2015 and are therefore required to complete the self assessment report. This report is to be submitted to the GCPO no later than 31 March 2016 and is to be signed off by the Chief Executive Officer and Board Chair. This assessment and report is in progress. An annual work plan will be developed as a result of the self assessment 5.4 Riskman Three modules out of the four within Riskman have been implemented. Extensive training has occurred on the feedback module following the recent upgrade. All of the features of this module are now fully functional including a process to alert and manage complaints as well as notifications to charge nurses of compliments for their areas. Work continues to align our processes with those of the Central PHO wherever this is practicable.
25
Implemwith anupgradein the sOnce thavailabl Work isboth th
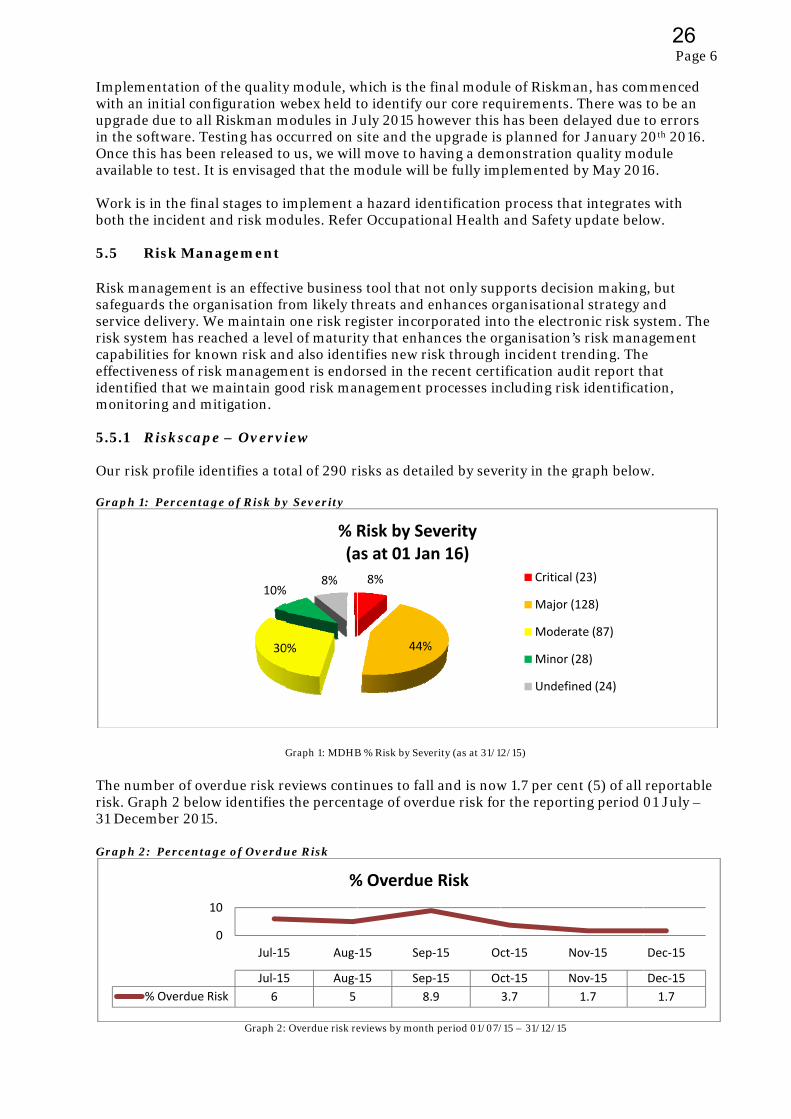
5.5 Risk masafeguaservice risk syscapabilieffectividentifimonitor 5.5.1 Our risk Graph 1
The numrisk. Gr31 Dece Graph 2
mentation ofn initial confe due to all oftware. Te
his has beenle to test. It
s in the finae incident a Risk Man
anagement ards the org delivery. Wstem has reaities for knoeness of rised that we mring and mi
Riskscape
k profile ide
1: Percentag
mber of overaph 2 belowember 2015
2: Percentag
1
% Overdue R
f the qualityfiguration w Riskman m
esting has ocn released tot is envisage
al stages to iand risk mo
nagement
is an effectianisation fr
We maintainached a leveown risk ank managemmaintain goitigation.
e – Overvi
entifies a to
ge of Risk by
G
erdue risk rew identifies .
ge of Overdu
Graph 2:
30
10%
0
10
Jul‐15
Jul‐15
isk 6
y module, wwebex held tmodules in J
ccurred on so us, we willed that the m
implement adules. Refe
ive businessrom likely th one risk re
el of maturitd also ident
ment is endoood risk ma
iew
tal of 290 r
y Severity
Graph 1: MDHB
eviews cont the percent
ue Risk
Overdue risk re
0%
8%
% R(a
5 Aug‐
5 Aug‐
5
%
which is the to identify o
July 2015 hosite and thel move to hamodule will
a hazard ider Occupatio
s tool that nhreats and e
egister incorty that enhatifies new ri
orsed in the anagement p
isks as deta
B % Risk by Sev
tinues to faltage of over
eviews by month
8%
44%
Risk by Seas at 01 Ja
‐15 Sep
‐15 Sep
8
% Overdue
final modulour core reqowever this e upgrade isaving a dem be fully im
entificationonal Health
not only supenhances orrporated intances the orisk through recent certprocesses in
ailed by seve
erity (as at 31/1
ll and is nowrdue risk for
h period 01/07/
%
everity an 16)
p‐15 O
p‐15 O
.9
e Risk
le of Riskmquirements. has been ds planned fomonstration
mplemented
n process tha and Safety
pports decisrganisationto the electrrganisation
h incident trification au
ncluding ris
erity in the g
2/15)
w 1.7 per cenr the report
/15 – 31/12/15
Critical
Major (
Moder
Minor (
Undefi
ct‐15 N
ct‐15 N
3.7
man, has com. There was elayed due
or January 2n quality mo by May 201
at integrate update belo
sion makingnal strategy ronic risk sy’s risk mana
rending. Theudit report th
k identifica
graph below
nt (5) of all ting period
(23)
(128)
ate (87)
(28)
ned (24)
Nov‐15
Nov‐15
1.7
Page 6
mmenced to be an to errors 20th 2016. odule 16.
es with ow.
g, but and ystem. The agement e hat
ation,
w.
reportable 01 July –
Dec‐15
Dec‐15
1.7
6
26

Page 7
We continue to support accountable owners and responsible managers in both identifying new risk and mitigating current risk. 5.5.2 Recent Risk Activity During this reporting period the number of reportable critical risks has fallen by 30 per cent due to either sound mitigation strategies being introduced or in relation to key milestones for project risk being achieved. An example is the Patient Flow Improvement Programme that has significantly reduced the severity of a number of related risks. In addition the ongoing investment and upgrade of Information Systems (IS) is having a positive impact on the residual severity rating of some IS risks. It is anticipated that as the IS upgrade nears completion other reportable IS risks will either reduce in severity or no longer be reported as a risk. 5.5.3 Enhanced Risk Reporting As reported previously all recommendations from the Internal Audit report to improve risk reporting have been actioned. The reports presented to the relevant groups including Group Audit Committee have undergone subtle change and now include key risk information (by both category and severity) and incident trending against key risks. It is anticipated that future risk reporting will include: Identification of key strategic risks the organisation could/will face in the future. An explanation as to why we believe these risks to be relevant. A decision tree as to whether to accept and mitigate, seek further information or take no
further action.
5.5.4 Incident Trending The use of incident trending verifies the effectiveness of mitigation strategies for known risk and also identifies new risks. The use of incident trending has been beneficial to teams such as Occupational Health and Safety in identifying catalysts (causes of injuries), raising awareness through key messaging and promoting safe practice. 5.5.5 Risk Management Enhancement Risk identification and assessment gives an organisation a clear view of the potential internal and external obstacles it needs to manage and overcome, and the opportunities on which it can capitalise. The focus for the Risk Management team over the coming reporting period will be on continuing to build a strong risk management culture by: Ensuring the continued quality of information and process is being delivered. Enhanced reporting at governance level to support strategic and operational decision
making processes and promote ongoing dialogue around current business activities and future business strategies.
Risk forecasting to test existing activities (Value at Risk) and possible threats in the future. Investigating third party risk to ensure due diligence, value for money and safeguard the
organisation against reputational harm.
27
Page 8
5.6 Clinical Records Overview Clinical Records (CR) have a team of 34 staff working over seven days a week. The hours are: Monday to Friday – 0600 – 1000. Saturdays, Sundays and statutory holidays – 0900 – 1700. Afterhours, patient files are retrieved by orderlies trained to undertake this or duty nurse managers. CR transitioned into a new two level building in 2011. To continue to manage workflows and meet the requirements of service delivery in a timely way, it was decided for some staff to remain working from the basement. Whilst the new building provides a great working environment for staff, there are challenges as patient files are now housed in four areas onsite – ground floor, first floor and two basement filing rooms. Patient files are stored by last known year of patient contact with benefits as follows: Identifying at a glance which files are culled (moved) to the next storage area. Sending files to our offsite provider. Destruction/Retention of the patient file. Where there are multiple patient file volumes, when one patient has multiple volumes, the latest volumes are housed in the appropriate storage area and the oldest volumes are housed in the basement. A snapshot of daily duties/tasks: Preparing files for up to 65 clinics per day. Clinics can have from 3 to 43 patients and there
are patients who have multiple volumes which add to the total of files processed. Files returned are tracked into department using the HOMER system. There can be up to
1,100 files that are filed onto the filing shelves daily. Receive up to 19,800 pieces of paper, diagnostics, patient information, dictated letters etc
weekly. This takes approximately 3 FTE to process over a week. Up to 120 fax and computer generated daily requests for files or patient information is
received internally as well as from other DHBs and general practices. One fax can have requests for a number of files that add to the daily total of files sent out.
Files must be moved from one storage area to another making room for the continuous growth of files.
Destruction/Retention (DR) of patient files/information was carried out in 2007. The next destruction took place in 2013. This was a huge undertaking as there were no clear guidelines. A destruction process flowchart was created that included the General Disposal Authority (GDA) and MidCentral Health (MCH) policies to ensure process was followed correctly. To date a total of 2,169 boxes containing patient files have been destroyed. One box can contain from 12 to 50 patient files. DR continues to be carried out annually, although it has been a challenge to catch up on the years that destruction did not take place. Responsibility for Mental Health and Addiction Services clinical records transitioned to the centralised team in April 2013. Services are provided Monday to Friday 0800 – 1630. Afterhours retrievals are provided by the Mental Health Emergency Team. The files are held in Ruahine House for all people seen within the last two years. Locations of file storage include Ruahine House, Northside and Clinical Records basement.
28
Page 9
A snapshot of daily duties/tasks:
Requests received internally as well as from other DHBs, Forensic Services, Correction Services, general practice and private providers etc.
Files are placed in green bags for pickup and delivery by orderlies. Files going to the rural teams are padlocked for security and sent via the mail room. Loose paperwork is received daily for filing. Retrieving files from Northside and/or Clinical Records basement. 6. BEING CONSUMER AND COMMUNITY FOCUSED
6.1 Partners in Care Programme (Co-design)
HQSC offered us the opportunity to work in partnership with them to pilot a new way for them to deliver the Partners in Care Programme to DHBs. Previously this programme had been offered in centralised locations requiring staff and consumers from DHBs to travel away to undertake the programme. Numbers attending this programme were lower than HQSC anticipated primarily as a result of the location and DHBs ability to release several people to attend.
Partners in Care is generally referred to as Co-design. Co-design is about designing solutions with our patients/whanau at every step of the way, right from the initial concept to implementation and not considering it as another model, but as the best and only way of working that ensures we deliver the right solutions.
The programme was delivered by Dr Lynne Maher, Director Innovation Ko Awatea, Counties Manukau DHB and Dr Chris Walsh, Director Consumer Engagement HQSC. The programme commenced with two days on site training in early October and has been followed by two webex sessions to date with another four to be completed prior to final reporting in April 2016. The two days of training focused on the tools and techniques for Co-design and improvement methodology with very generous resources being provided to support our work.
We consulted across our organisation to identify areas/issues that might benefit from this approach. There was very keen and enthusiastic interest. Ongoing consultation resulted in four teams nominating themselves for this programme. Each team had to consist of a minimum of four DHB staff and one consumer.
The programme is progressing very well with positive feedback from Lynne Maher on progress to date. Details of each team’s area of focus follows noting the very different styles of how each team has presented their information which has been included unchanged.
6.1.1 Emergency Department Rescue: A Journey from the front door to seeing a
treating clinician This team includes a quality co-ordinator, associate charge nurse, clerical assistant, registered nurse, senior medical officer and a consumer representative. We are exploring the reality of the patient experience from front door to seeing the first treating clinician. “We all worry about our patients in the waiting room. Can you see the 94 year old man sitting quietly in a wheelchair in the waiting room? He has a rug on his lap because it is a cold morning. He fell overnight landing beside his bed and couldn’t get up. His daughter went to visit and found him on the floor covered in excrement. He managed to pull the bedspread over him to keep warm. She showered him and took him to his GP. The GP referred him to the Emergency Department (ED) for assessment. He was triaged and placed in the waiting room. It won’t be long until he gets a bed.
29
Page 10
Now four hours later, uncomplaining, there he sits, still in the wheelchair. His daughter had to leave to attend to an urgent task. She doesn’t complain or enquire either. A different generation. You can see him. He is in your thoughts to bring him into the department but other patients keep trumping him. He is slightly slumped forward. He has not been spoken to. He is patiently waiting. Doesn’t want to make a fuss. Other people arrive. They must be sicker as they get rushed in. Five hours in waiting room. He finally gets a bed. His diagnosis is a fractured hip. There he sat, uncomplaining for five hours. No one spoke to this man because he was quietly, patiently waiting. Let’s change this. Come with us on a journey to listen to the patient story. Let’s change our practice. Let’s help our patients.” Work so far has consisted of collaboration on an experience survey for patients and a similar one for staff. The development of the patient narrative above has been undertaken with the help of consumer representatives, the ‘Friends of the Emergency Department’ volunteers and the gathering of some patient stories to highlight what matters for the members of our community. This foundation work will help us identify the ‘quick wins’ for improvement work, and ensure the efforts undertaken will actually effect the patient experience not just create work. In the coming weeks the team will be meeting to analyse the results from the surveys and look to further develop their work plan and driver diagram. 6.1.2 Spiritual Care at End of Life for Refugee Communities The team includes a nurse director, chaplain, clinical psychologist from the central cancer network, registered nurse from Arohanui Hospice and a consumer representative. Meeting spiritual needs of patients, family and whanau has been found to lead to better outcomes for all. However, health service delivery evidence shows that the spiritual needs of patients are sometimes under recognised in contrast to their more physical needs. This is particularly complex for the refugee community who have particular needs around the provision of spiritual care that can leave them marginalised when it comes to accessing care. These may include language barriers, poorly understood religious practices and expectations, lack of familiarity with established systems and conventions. The spiritual care group aims to improve the quality of spiritual assessment and support for the refugee community by first of all gaining a better understanding of the experience and needs of those from the refugee community. The group have made initial contacts and held a first meeting with some of the refugee community and Red Cross representatives with more meetings planned for the beginning of 2016. The initial meeting has highlighted some of the challenges in Co-design projects, particularly around the balance of power and vulnerability, who directs the project and what outcomes are possible. For instance, whilst the initial decision to look at end of life care was carefully considered, the group’s first meeting made it clear that what may be important to the refugee community may be how they experience the health system in general. 6.1.3 Severe Nausea and Vomiting in Early Pregnancy The team consists of a lead maternity carer (LMC), maternity quality co-ordinator, clinical nurse specialist gynaecology, regional midwifery advisor and a consumer representative. Severe nausea and vomiting in early pregnancy (NVP) is defined by the woman and has symptoms that are disabling, with intractable vomiting leading to dehydration, electrolyte and acid base disturbances, weight loss and nutritional deficiency. The reality for some women is that they are often not able to undertake their daily tasks or their work outside the home. NVP is a hidden disorder and can lead to isolation, depression and severely impact on the women’s and families’ lives. Some women might have thoughts about ending the pregnancy and for some this may be a reality to treat the disorder.
30
Page 11
The project aims to: Understand the experiences and support needs of women and their families/whanau that
have severe NVP. Understand the experiences of health care providers who support those women and their
families/whanau. Explore the out of hospital rehydration of women with severe NVP and where appropriate
the management of these women in the primary care setting. To explore referral for admission to hospital for those women who are not eligible for out of
hospital rehydration/treatment. Develop a consumer information leaflet about severe nausea and vomiting in pregnancy.
A number of face to face interviews, with consumers and health professionals, have been undertaken and a thematic analysis of the transcripts is in progress looking for emergent patterns. An initial meeting has been held with Primary Options for Acute Care (POAC) to discuss this project and to share project goals and the Auckland map of medicine regarding rehydration to consider how it might be adapted to include pregnant women. A number of patient questionnaires have been distributed and the group are now waiting the return and analysis of these. The group’s consumer representative is exploring ways of contacting women and families who have experienced NVP through various groups including use of social media, e.g. Facebook. Next steps include: 10 face to face interviews with women and/or their families. 10 face to face interviews with health professionals. Receive 20 completed surveys from women and/or their families. Commence analysis of surveys and interviews. Compare guidelines on diagnosis and treatment of Hyperemesis, Start work on the map of medicine with POAC team. Start work on information brochure. 6.1.4 Medication on Discharge This team includes a hospital clinical pharmacist, community pharmacist, chief pharmacist, staff nurse Ward 25 and a consumer representative. The team is focusing on Safe Efficient and Effective Discharge (SEED) for patients. SEED has gathered information from a variety of sources - patients, nursing staff, resident medical doctors and from general practitioners. The SEED consumer representative’s journey to our hospital pharmacy from a medical ward was also filmed so that we can understand this journey through patients’ eyes. The themes from the walkthrough and other information gathered from staff and patients include: Themes from the walk through: Signage to the Pharmacy was either non-existent or difficult to find (not at eye-level). There were no easy area identifier as to where the patient was at the start of the journey, i.e.
Where am I walking from?
31
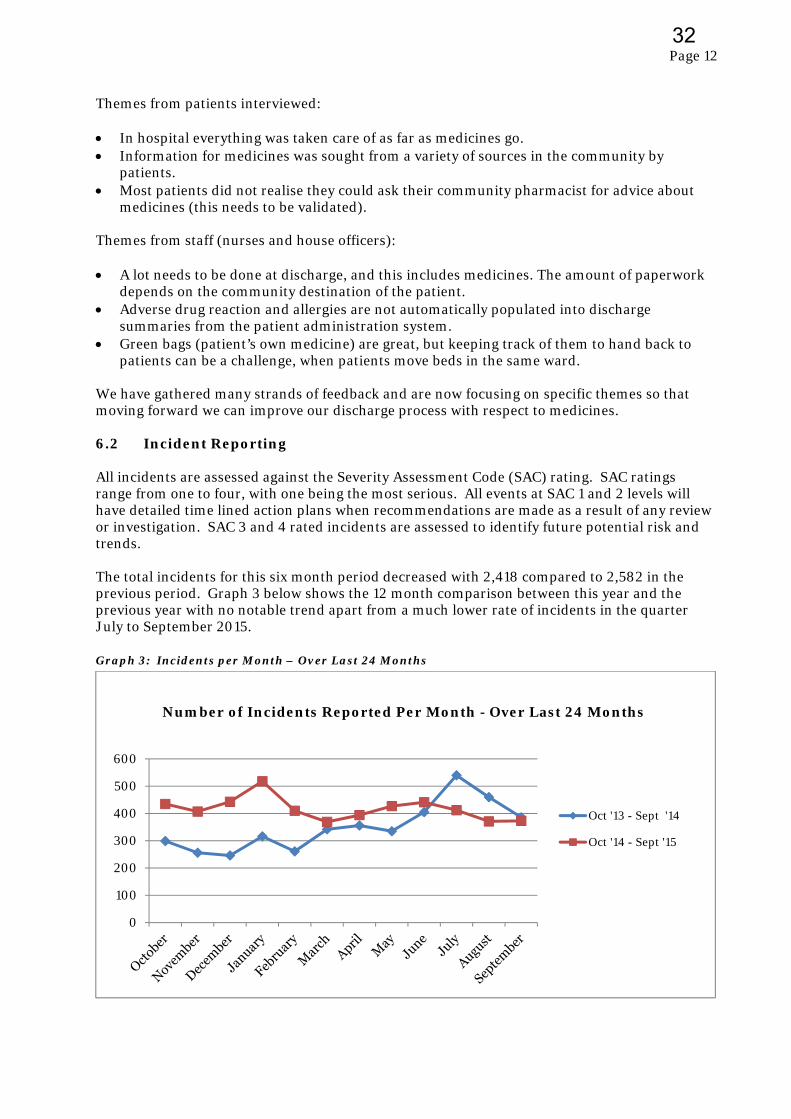
Page 12
Themes from patients interviewed: In hospital everything was taken care of as far as medicines go. Information for medicines was sought from a variety of sources in the community by
patients. Most patients did not realise they could ask their community pharmacist for advice about
medicines (this needs to be validated). Themes from staff (nurses and house officers): A lot needs to be done at discharge, and this includes medicines. The amount of paperwork
depends on the community destination of the patient. Adverse drug reaction and allergies are not automatically populated into discharge
summaries from the patient administration system. Green bags (patient’s own medicine) are great, but keeping track of them to hand back to
patients can be a challenge, when patients move beds in the same ward. We have gathered many strands of feedback and are now focusing on specific themes so that moving forward we can improve our discharge process with respect to medicines. 6.2 Incident Reporting All incidents are assessed against the Severity Assessment Code (SAC) rating. SAC ratings range from one to four, with one being the most serious. All events at SAC 1 and 2 levels will have detailed time lined action plans when recommendations are made as a result of any review or investigation. SAC 3 and 4 rated incidents are assessed to identify future potential risk and trends. The total incidents for this six month period decreased with 2,418 compared to 2,582 in the previous period. Graph 3 below shows the 12 month comparison between this year and the previous year with no notable trend apart from a much lower rate of incidents in the quarter July to September 2015. Graph 3: Incidents per Month – Over Last 24 Months
0
100
200
300
400
500
600
Oct '13 - Sept '14
Oct '14 - Sept '15
Number of Incidents Reported Per Month - Over Last 24 Months
32
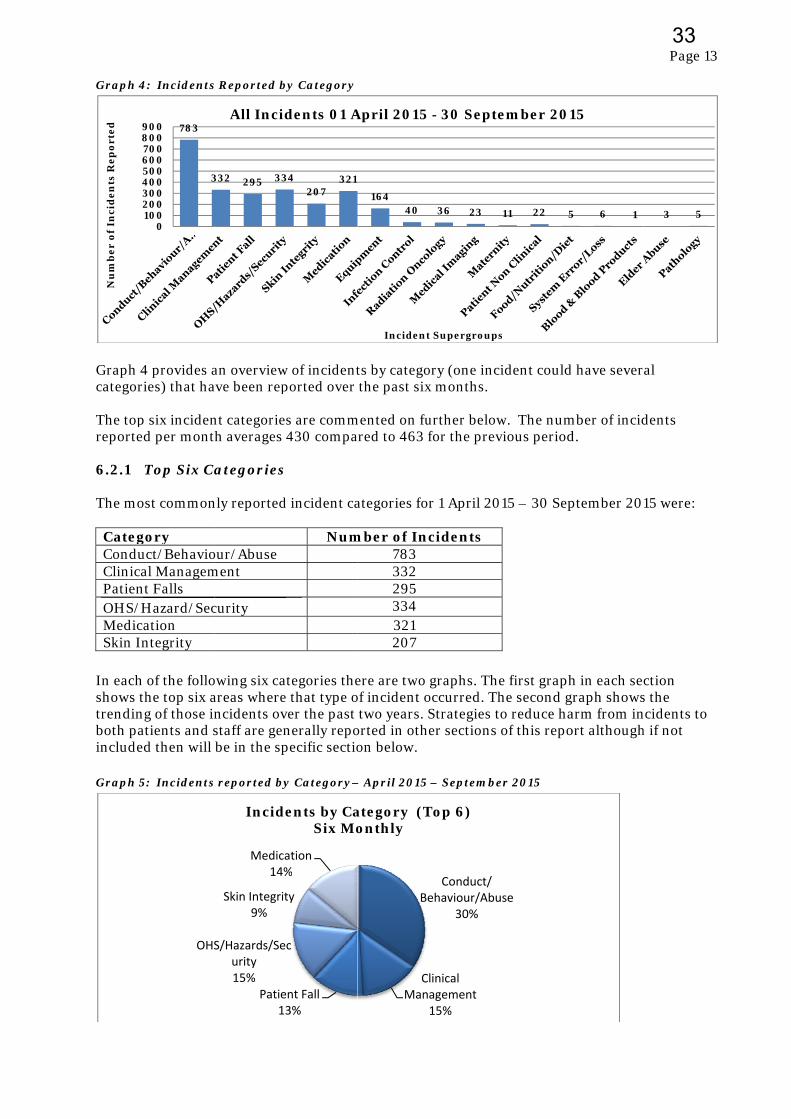
Graph 4
Graph 4categor The topreporte 6.2.1 The mo CategConduClinicaPatienOHS/HMedicSkin In
In eachshows ttrendinboth painclude Graph 5
23456
89
Nu
mb
er
of
Inci
de
nts
Re
po
rte
d
4: Incidents
4 provides aries) that ha
p six incidend per mont
Top Six Ca
ost common
gory uct/Behavioal Managem
nt Falls Hazard/Secation ntegrity
of the follothe top six a
ng of those inatients and sed then will
5: Incidents
783
3
0100200300400500600700800900
OHS
s Reported b
an overviewave been rep
nt categorieh averages
Categories
nly reported
our/Abuse ment
curity
owing six caareas wherencidents ovstaff are gen be in the sp
s reported by
332 295 33
All Incid
Patie13
S/Hazards/Seurity15%
Skin Integrit9%
Medica14%
Incide
by Category
w of incidentported over
s are comm430 compa
d incident ca
Num
ategories thee that type over the past nerally repopecific sectio
y Category–
34207
321
dents 01 A
ent Fall3%
c
ty
ation%
ents by CaSix Mo
ts by catego the past six
mented on fuared to 463 f
ategories fo
mber of Inc783 332 295 334 321 207
ere are two of incident o two years. Sorted in otheon below.
– April 2015
16440
Incident
April 2015
Be
CMan
ategory (Tonthly
ory (one incix months.
urther belowfor the prev
r 1 April 20
cidents
graphs. Theoccurred. ThStrategies toer sections
– Septembe
36 23
t Supergroups
- 30 Septe
Conduct/ehaviour/Abu
30%
linical agement15%
Top 6)
ident could
w. The numvious period
15 – 30 Sep
e first graphhe second go reduce haof this repo
er 2015
11 22 5
s
ember 201
use
d have sever
mber of incidd.
ptember 20
h in each segraph showsarm from inort although
5 6 1
15
Page 13
al
dents
15 were:
ction s the ncidents to h if not
3 5
3
33

Page 14
6.2.2 Patient Falls Any slip, trip or fall that may or may not cause injury, which happens to any patient or visitor while on MCH property or in the course of MCH business. The total number of falls decreased compared to the previous reporting period, from 342 to 295. This is an overall decrease of 63 in the 12 month period. Three serious falls were reported during this six month period which is an increase by one from the previous period however the overall reduction in SAC 1 and 2 falls continues. Serious falls where a fracture or other significant injury occurs are rated SAC 2 and are the subject of further investigation. Graph 6: April 2015 – September 2015 Patient Falls by Location
Graph 7: 2014-15 and 2015-16 Falls Incidents
Refer section 6.4.1 below for more information on falls. 6.2.3 Conduct/Behaviour/Abuse An incident that involves any of the following: intimidation, intent to harm, threatening behaviour, sexually aggressive or inappropriate behaviour or rape. Incidents of violence are always of concern and are mostly experienced in the Mental Health and Addictions Service and Older Adult Mental Health. These incidents reflect that the patient
0 10 20 30 40 50 60
Star 2
Ward 25
Ward 26
Star 4
Ward 24
Ward 29
0
20
40
60
80
100
Jul Aug Sep Oct Nov Dec Jan Feb Mar Apr May Jun
Falls
14/15 15‐16 UCL LCL
34
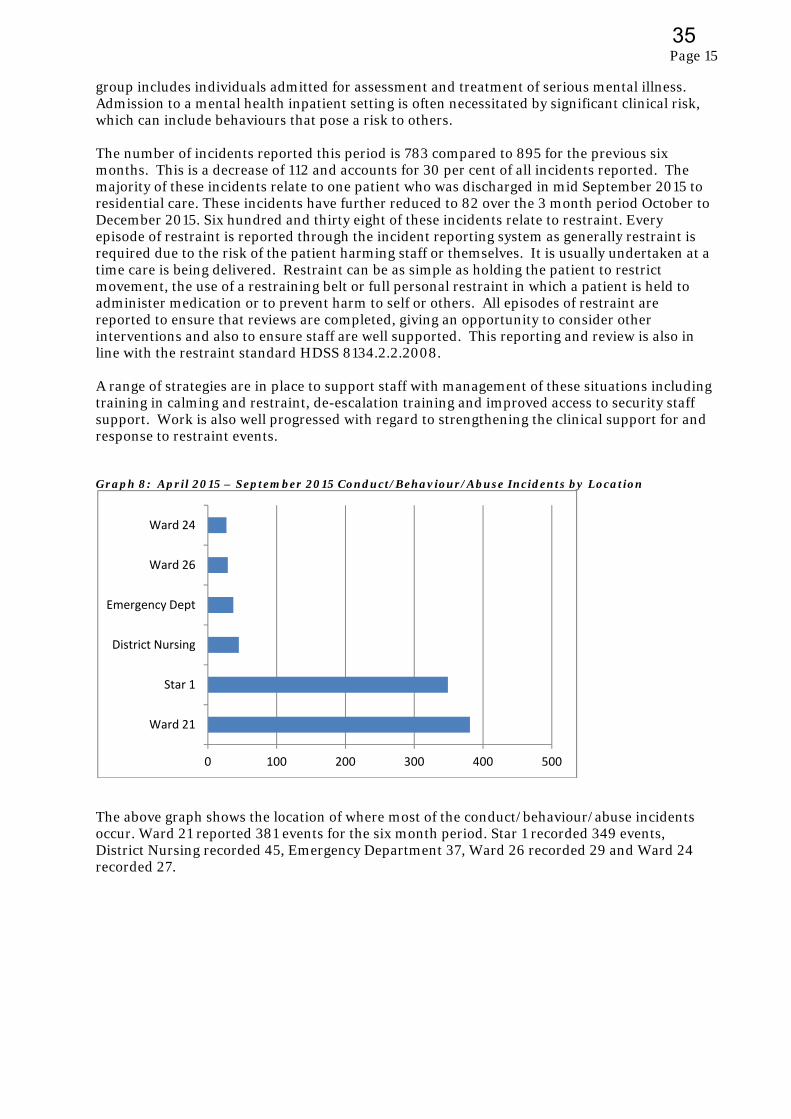
Page 15
group includes individuals admitted for assessment and treatment of serious mental illness. Admission to a mental health inpatient setting is often necessitated by significant clinical risk, which can include behaviours that pose a risk to others. The number of incidents reported this period is 783 compared to 895 for the previous six months. This is a decrease of 112 and accounts for 30 per cent of all incidents reported. The majority of these incidents relate to one patient who was discharged in mid September 2015 to residential care. These incidents have further reduced to 82 over the 3 month period October to December 2015. Six hundred and thirty eight of these incidents relate to restraint. Every episode of restraint is reported through the incident reporting system as generally restraint is required due to the risk of the patient harming staff or themselves. It is usually undertaken at a time care is being delivered. Restraint can be as simple as holding the patient to restrict movement, the use of a restraining belt or full personal restraint in which a patient is held to administer medication or to prevent harm to self or others. All episodes of restraint are reported to ensure that reviews are completed, giving an opportunity to consider other interventions and also to ensure staff are well supported. This reporting and review is also in line with the restraint standard HDSS 8134.2.2.2008. A range of strategies are in place to support staff with management of these situations including training in calming and restraint, de-escalation training and improved access to security staff support. Work is also well progressed with regard to strengthening the clinical support for and response to restraint events. Graph 8: April 2015 – September 2015 Conduct/Behaviour/Abuse Incidents by Location
The above graph shows the location of where most of the conduct/behaviour/abuse incidents occur. Ward 21 reported 381 events for the six month period. Star 1 recorded 349 events, District Nursing recorded 45, Emergency Department 37, Ward 26 recorded 29 and Ward 24 recorded 27.
0 100 200 300 400 500
Ward 21
Star 1
District Nursing
Emergency Dept
Ward 26
Ward 24
35
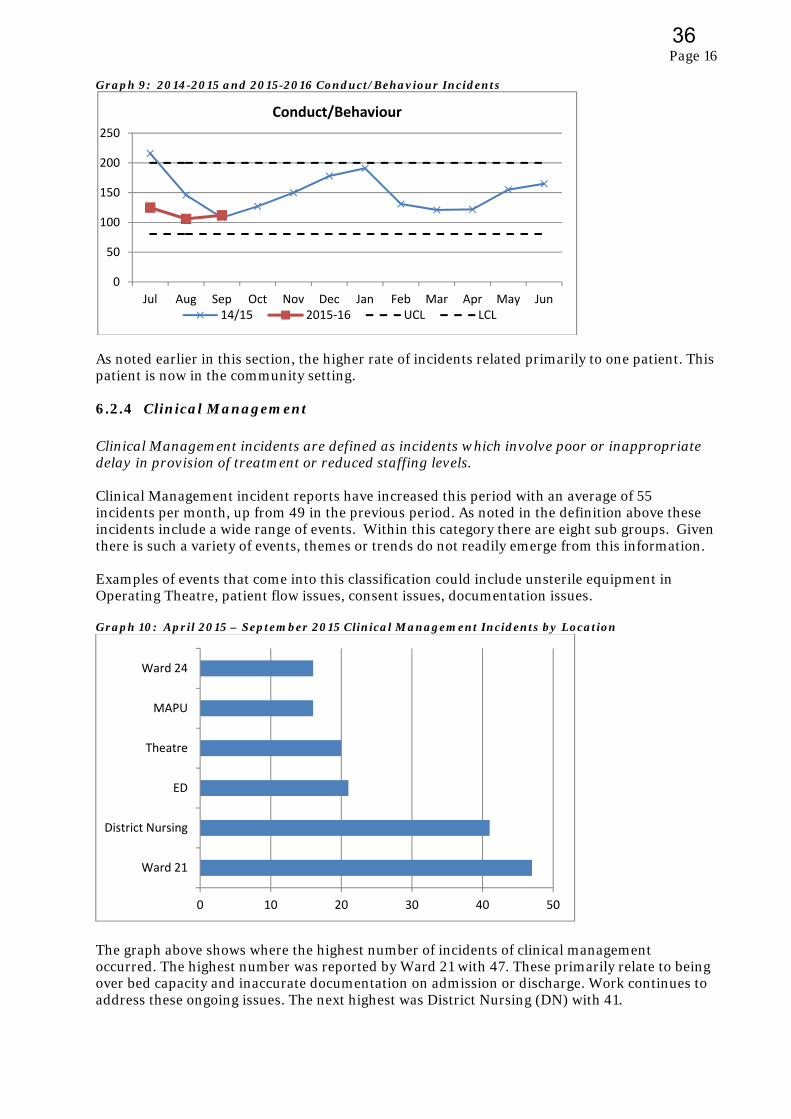
Page 16
Graph 9: 2014-2015 and 2015-2016 Conduct/Behaviour Incidents
As noted earlier in this section, the higher rate of incidents related primarily to one patient. This patient is now in the community setting. 6.2.4 Clinical Management Clinical Management incidents are defined as incidents which involve poor or inappropriate delay in provision of treatment or reduced staffing levels. Clinical Management incident reports have increased this period with an average of 55 incidents per month, up from 49 in the previous period. As noted in the definition above these incidents include a wide range of events. Within this category there are eight sub groups. Given there is such a variety of events, themes or trends do not readily emerge from this information. Examples of events that come into this classification could include unsterile equipment in Operating Theatre, patient flow issues, consent issues, documentation issues. Graph 10: April 2015 – September 2015 Clinical Management Incidents by Location
The graph above shows where the highest number of incidents of clinical management occurred. The highest number was reported by Ward 21 with 47. These primarily relate to being over bed capacity and inaccurate documentation on admission or discharge. Work continues to address these ongoing issues. The next highest was District Nursing (DN) with 41.
0
50
100
150
200
250
Jul Aug Sep Oct Nov Dec Jan Feb Mar Apr May Jun
Conduct/Behaviour
14/15 2015‐16 UCL LCL
0 10 20 30 40 50
Ward 21
District Nursing
ED
Theatre
MAPU
Ward 24
36
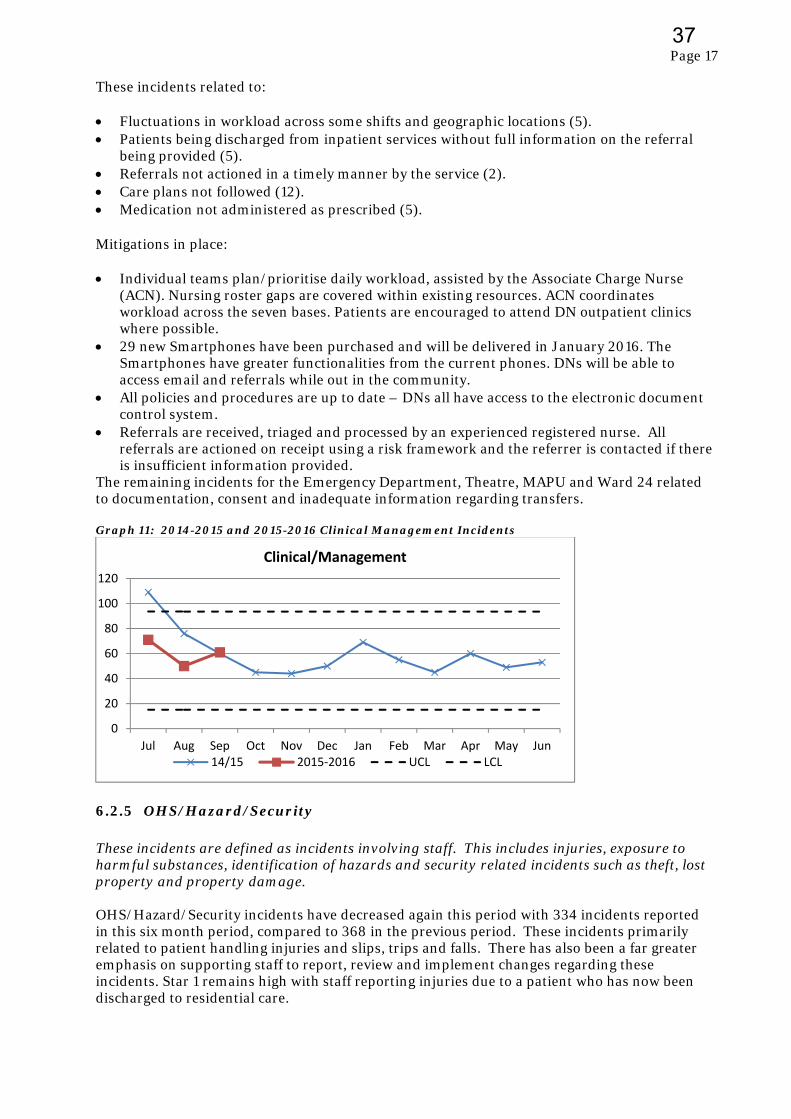
Page 17
These incidents related to: Fluctuations in workload across some shifts and geographic locations (5). Patients being discharged from inpatient services without full information on the referral
being provided (5). Referrals not actioned in a timely manner by the service (2). Care plans not followed (12). Medication not administered as prescribed (5).
Mitigations in place: Individual teams plan/prioritise daily workload, assisted by the Associate Charge Nurse
(ACN). Nursing roster gaps are covered within existing resources. ACN coordinates workload across the seven bases. Patients are encouraged to attend DN outpatient clinics where possible.
29 new Smartphones have been purchased and will be delivered in January 2016. The Smartphones have greater functionalities from the current phones. DNs will be able to access email and referrals while out in the community.
All policies and procedures are up to date – DNs all have access to the electronic document control system.
Referrals are received, triaged and processed by an experienced registered nurse. All referrals are actioned on receipt using a risk framework and the referrer is contacted if there is insufficient information provided.
The remaining incidents for the Emergency Department, Theatre, MAPU and Ward 24 related to documentation, consent and inadequate information regarding transfers. Graph 11: 2014-2015 and 2015-2016 Clinical Management Incidents
6.2.5 OHS/Hazard/Security These incidents are defined as incidents involving staff. This includes injuries, exposure to harmful substances, identification of hazards and security related incidents such as theft, lost property and property damage. OHS/Hazard/Security incidents have decreased again this period with 334 incidents reported in this six month period, compared to 368 in the previous period. These incidents primarily related to patient handling injuries and slips, trips and falls. There has also been a far greater emphasis on supporting staff to report, review and implement changes regarding these incidents. Star 1 remains high with staff reporting injuries due to a patient who has now been discharged to residential care.
0
20
40
60
80
100
120
Jul Aug Sep Oct Nov Dec Jan Feb Mar Apr May Jun
Clinical/Management
14/15 2015‐2016 UCL LCL
37
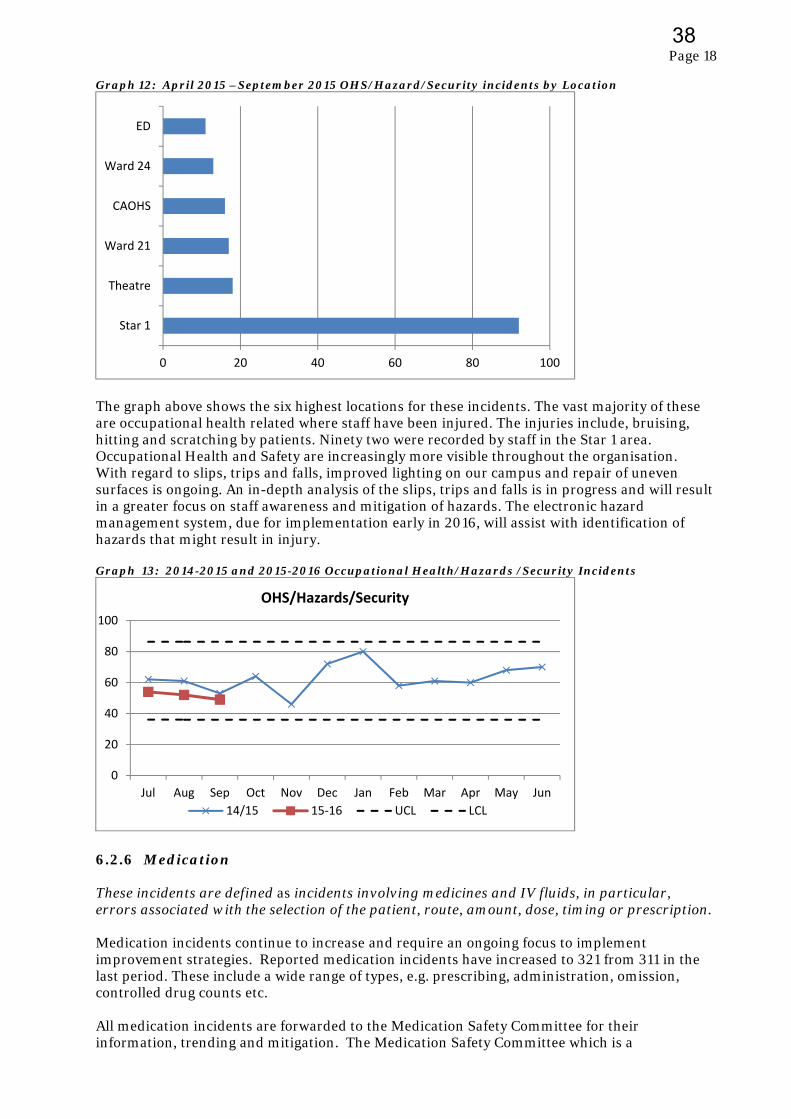
Page 18
Graph 12: April 2015 –September 2015 OHS/Hazard/Security incidents by Location
The graph above shows the six highest locations for these incidents. The vast majority of these are occupational health related where staff have been injured. The injuries include, bruising, hitting and scratching by patients. Ninety two were recorded by staff in the Star 1 area. Occupational Health and Safety are increasingly more visible throughout the organisation. With regard to slips, trips and falls, improved lighting on our campus and repair of uneven surfaces is ongoing. An in-depth analysis of the slips, trips and falls is in progress and will result in a greater focus on staff awareness and mitigation of hazards. The electronic hazard management system, due for implementation early in 2016, will assist with identification of hazards that might result in injury. Graph 13: 2014-2015 and 2015-2016 Occupational Health/Hazards /Security Incidents
6.2.6 Medication These incidents are defined as incidents involving medicines and IV fluids, in particular, errors associated with the selection of the patient, route, amount, dose, timing or prescription. Medication incidents continue to increase and require an ongoing focus to implement improvement strategies. Reported medication incidents have increased to 321 from 311 in the last period. These include a wide range of types, e.g. prescribing, administration, omission, controlled drug counts etc. All medication incidents are forwarded to the Medication Safety Committee for their information, trending and mitigation. The Medication Safety Committee which is a
0 20 40 60 80 100
Star 1
Theatre
Ward 21
CAOHS
Ward 24
ED
0
20
40
60
80
100
Jul Aug Sep Oct Nov Dec Jan Feb Mar Apr May Jun
OHS/Hazards/Security
14/15 15‐16 UCL LCL
38
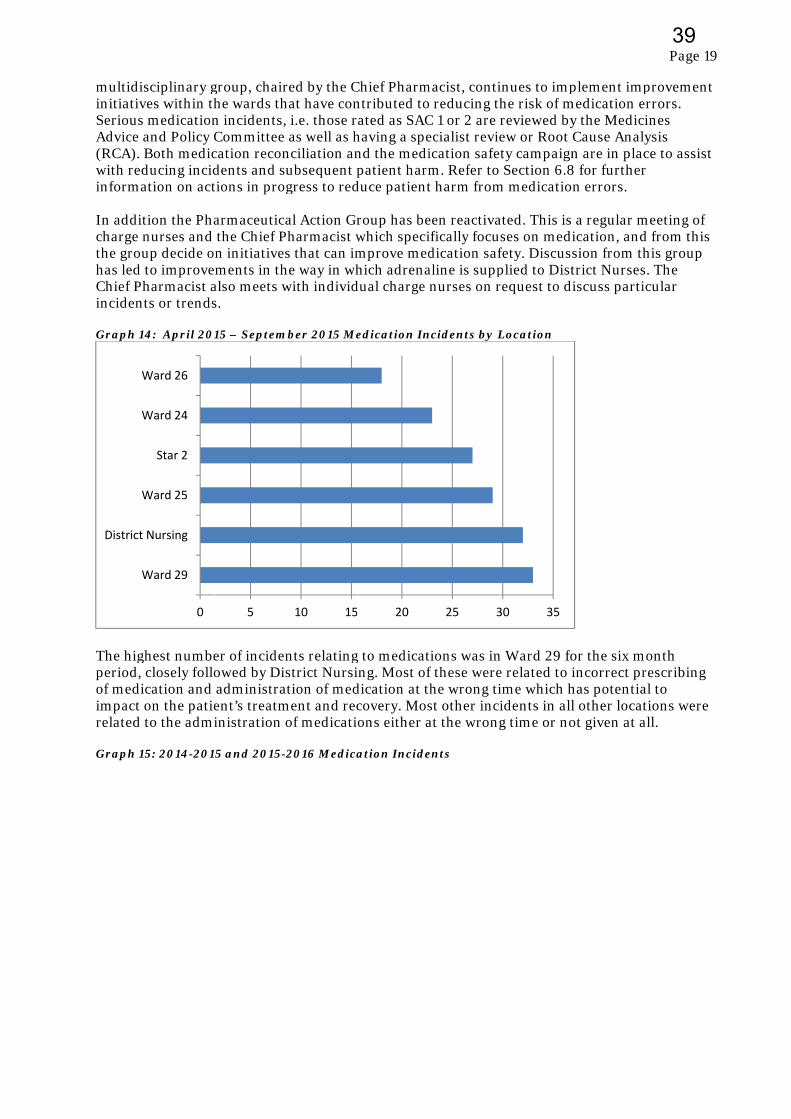
multidiinitiativSeriousAdvice (RCA). with redinforma In additcharge nthe grouhas led Chief Phinciden Graph 1
The higperiod, of mediimpact related Graph 1
W
District
W
W
W
sciplinary gves within ths medicationand Policy C Both medicducing incidation on act
tion the Phanurses and up decide o to improveharmacist a
nts or trends
14: April 201
ghest numbe closely folloication and on the patie to the admi
15: 2014-201
0
Ward 29
Nursing
Ward 25
Star 2
Ward 24
Ward 26
group, chairhe wards thn incidents,Committee cation recondents and sutions in prog
armaceutica the Chief Pn initiatives
ements in thalso meets ws.
15 – Septem
er of incidenowed by Dis administraent’s treatministration o
5 and 2015-2
5
red by the Chat have con i.e. those r as well as hnciliation anubsequent pgress to red
al Action GrPharmacist ws that can im
he way in whwith individ
mber 2015 Me
nts relatingstrict Nursi
ation of medment and rec
of medicati
2016 Medica
10 15
Chief Pharmntributed toated as SAC
having a spend the medipatient harm
duce patient
roup has bewhich specimprove medhich adrena
dual charge
edication In
g to medicating. Most ofdication at tcovery. Mosons either a
ation Incide
20
macist, contio reducing thC 1 or 2 are recialist revieication safetm. Refer to t harm from
een reactivaifically focudication safaline is supp nurses on r
ncidents by L
tions was inf these werehe wrong tist other inciat the wrong
ents
25 3
inues to imphe risk of mreviewed byew or Root ty campaign Section 6.8
m medicatio
ated. This isses on medifety. Discusplied to Distrequest to d
Location
n Ward 29 foe related to iime which hidents in allg time or no
30 35
plement impmedication e
y the Medic Cause Analn are in pla
8 for furthern errors.
a regular mication, andsion from thtrict Nursesiscuss parti
or the six mincorrect pr
has potential other locatot given at a
Page 19
provement errors. cines lysis ce to assist r
meeting of d from this his group s. The icular
month rescribing al to tions were all.
9
39

Page 20
6.2.7 Skin Integrity Skin Integrity incidents are defined as “incidents involving pressure ulcers and wounds such as skin tears, blisters, bruises, burns, cellulitis, haematomas, rashes and other wounds”. Reported skin integrity incidents have decreased further to 207 this period from 230 in the last period. Approximately 55 of these are pressure injury related with 15 of those reported on admission, i.e. occurred outside of the hospital setting. The nursing team have developed an improvement plan to ensure that occurrence is minimised and reporting is supported. There is work underway nationally to look at improved assessment, identification, reporting and management. Graph 16: April 2015 – September 2015 Skin Integrity Incidents by Location
The highest number of reported incidents for Skin Integrity was in Ward 24. Twenty of the 35 were skin tears, with the remaining 15 related to pressure injuries. Three of the pressure injuries were present on admission and 12 developed during the patient’s stay in hospital. Some examples from Ward 24 during July 2015, when acuity was higher than usual, include; four were pre-hospital (2 skin tears, 1 pressure area, 1 laceration) seven were due to medical co-morbidities and/or fragile skin– all of these cases had
been provided with regular pressure area cares by nursing staff; one resulted from a fall in the ward bathroom three were of unknown cause one resulted from poor handover processes at shift change
The National Survey Care Indicators (NSCI) included assessment of patients/residents for pressure injury prevention and management. The findings of the report will result in a regional approach to improving pressure injury management lead by the Central Region Directors of Nursing.
0 5 10 15 20 25 30 35 40
Ward 24
Star 4
Star 2
Ward 26
Ward 25
ICU
40
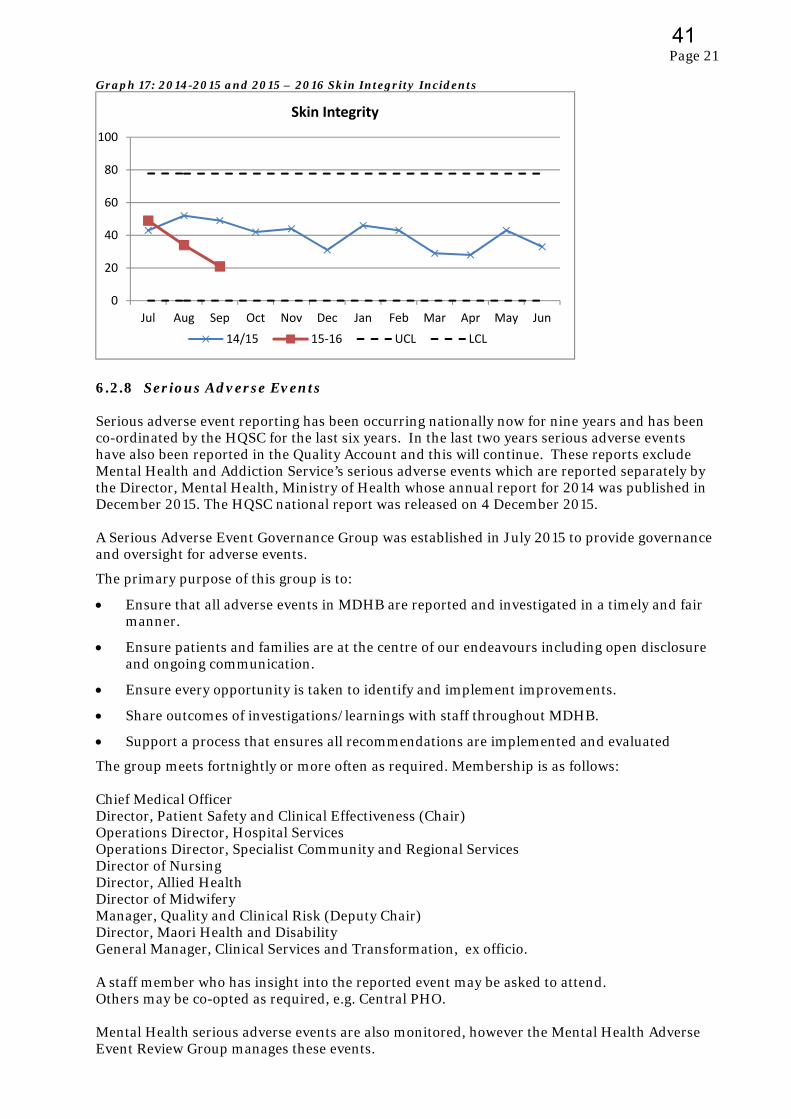
Page 21
Graph 17: 2014-2015 and 2015 – 2016 Skin Integrity Incidents
6.2.8 Serious Adverse Events Serious adverse event reporting has been occurring nationally now for nine years and has been co-ordinated by the HQSC for the last six years. In the last two years serious adverse events have also been reported in the Quality Account and this will continue. These reports exclude Mental Health and Addiction Service’s serious adverse events which are reported separately by the Director, Mental Health, Ministry of Health whose annual report for 2014 was published in December 2015. The HQSC national report was released on 4 December 2015. A Serious Adverse Event Governance Group was established in July 2015 to provide governance and oversight for adverse events.
The primary purpose of this group is to:
Ensure that all adverse events in MDHB are reported and investigated in a timely and fair manner.
Ensure patients and families are at the centre of our endeavours including open disclosure and ongoing communication.
Ensure every opportunity is taken to identify and implement improvements.
Share outcomes of investigations/learnings with staff throughout MDHB.
Support a process that ensures all recommendations are implemented and evaluated
The group meets fortnightly or more often as required. Membership is as follows: Chief Medical Officer Director, Patient Safety and Clinical Effectiveness (Chair) Operations Director, Hospital Services Operations Director, Specialist Community and Regional Services Director of Nursing Director, Allied Health Director of Midwifery Manager, Quality and Clinical Risk (Deputy Chair) Director, Maori Health and Disability General Manager, Clinical Services and Transformation, ex officio. A staff member who has insight into the reported event may be asked to attend. Others may be co-opted as required, e.g. Central PHO. Mental Health serious adverse events are also monitored, however the Mental Health Adverse Event Review Group manages these events.
0
20
40
60
80
100
Jul Aug Sep Oct Nov Dec Jan Feb Mar Apr May Jun
Skin Integrity
14/15 15‐16 UCL LCL
41
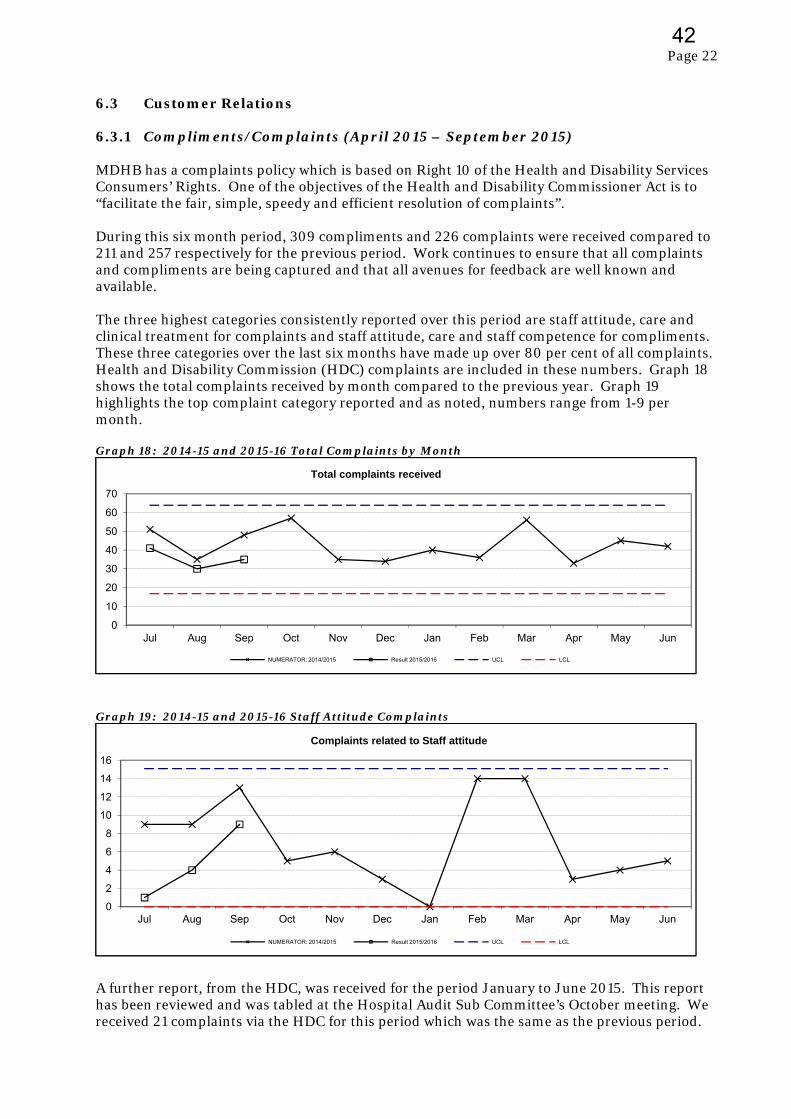
Page 22
6.3 Customer Relations 6.3.1 Compliments/Complaints (April 2015 – September 2015) MDHB has a complaints policy which is based on Right 10 of the Health and Disability Services Consumers’ Rights. One of the objectives of the Health and Disability Commissioner Act is to “facilitate the fair, simple, speedy and efficient resolution of complaints”. During this six month period, 309 compliments and 226 complaints were received compared to 211 and 257 respectively for the previous period. Work continues to ensure that all complaints and compliments are being captured and that all avenues for feedback are well known and available. The three highest categories consistently reported over this period are staff attitude, care and clinical treatment for complaints and staff attitude, care and staff competence for compliments. These three categories over the last six months have made up over 80 per cent of all complaints. Health and Disability Commission (HDC) complaints are included in these numbers. Graph 18 shows the total complaints received by month compared to the previous year. Graph 19 highlights the top complaint category reported and as noted, numbers range from 1-9 per month. Graph 18: 2014-15 and 2015-16 Total Complaints by Month
Graph 19: 2014-15 and 2015-16 Staff Attitude Complaints
A further report, from the HDC, was received for the period January to June 2015. This report has been reviewed and was tabled at the Hospital Audit Sub Committee’s October meeting. We received 21 complaints via the HDC for this period which was the same as the previous period.
0
10
20
30
40
50
60
70
Jul Aug Sep Oct Nov Dec Jan Feb Mar Apr May Jun
Total complaints received
NUMERATOR: 2014/2015 Result 2015/2016 UCL LCL
0
2
4
6
8
10
12
14
16
Jul Aug Sep Oct Nov Dec Jan Feb Mar Apr May Jun
Complaints related to Staff attitude
NUMERATOR: 2014/2015 Result 2015/2016 UCL LCL
42

Page 23
It has been identified that staff education is a critical strategy to assist the organisation in decreasing complaints both coming into the organisation and going to HDC.
Work is ongoing to address the primary themes, address issues of process and system and to better equip staff to respond in a timely and appropriate way with the objective of ensuring every opportunity is taken to resolve a complaint within our organisation rather than patients and families resorting to the HDC complaint process. We are however obliged to promote the HDC complaint process and patients and families have a right to utilise this avenue. Conversely, where complaints are challenging to resolve, or patients and family members require support with the process, it is at times suggested that they seek support from the Nationwide Health and Disability Advocacy Service. The HDC is now also more frequently referring patients/families to this service. Below is an overview of various aspects of work in progress and/or systems and support that are in place.
Complaint Management
There are two full time staff dedicated to supporting staff to respond to and resolve concerns both as they are recognised and/or following formal feedback.
Patients, families, visitors and staff have ready access to our own feedback process with feedback being able to be submitted in many ways including by phone, face to face, email, website or in writing. We also have ‘Tell us What you Think’ forms located prominently in all areas where patients, families and visitors access.
All feedback is formally acknowledged within five days. Previously the person was given information about other options for feedback including the HDC at this point, however that is now being changed to be provided at the time the response is finalised.
Our electronic feedback system ensures feedback is distributed efficiently and those responsible for the response are alerted regularly with regard to timeframes.
An audit of our response times is undertaken bi-monthly and the results are provided to relevant senior management for discussion with teams. The five day acknowledgement results show an average 99 per cent compliance. The 15 day response time averages 84 per cent, which is an improvement from the last period of 75 per cent. A new process of alerts has been set up to indicate, several days in advance, when responses are due, as well as more time required letters needed.
Those staff who lead complaint resolution are encouraged and supported to make phone calls and/or meet with complainants in a timely way. This is occurring much more frequently than in the past and is resulting in more timely resolution.
Staff Education
All new staff are given a brief introduction to our feedback process and Complaints Policy as well as briefly work-shopping some scenarios. This also includes an introduction to the Code of Health and Disability Services Consumers’ Rights 1996 and cue cards about this are supplied at this time.
Our legislative compliance programme includes seminars on Code of Rights and complaints management at least annually. The MDHB Legislative Compliance Handbook includes information on the Health and Disability Commissioner Act 1994 and Code of Health and Disability Services’ Consumer Rights 1996. Our legislative compliance course has been added to the Ko Awatea training site so that staff can complete a legislative compliance review of current legislation to remain upskilled.
In September 2015 Open Disclosure education was provided to 85 frontline staff across our organisation, following the success of sessions held for Mental Health and Addictions staff in February 2015. These were provided by the Cognitive Institute with reference to HDC guidelines and MDHB’s Open Disclosure Policy.
43
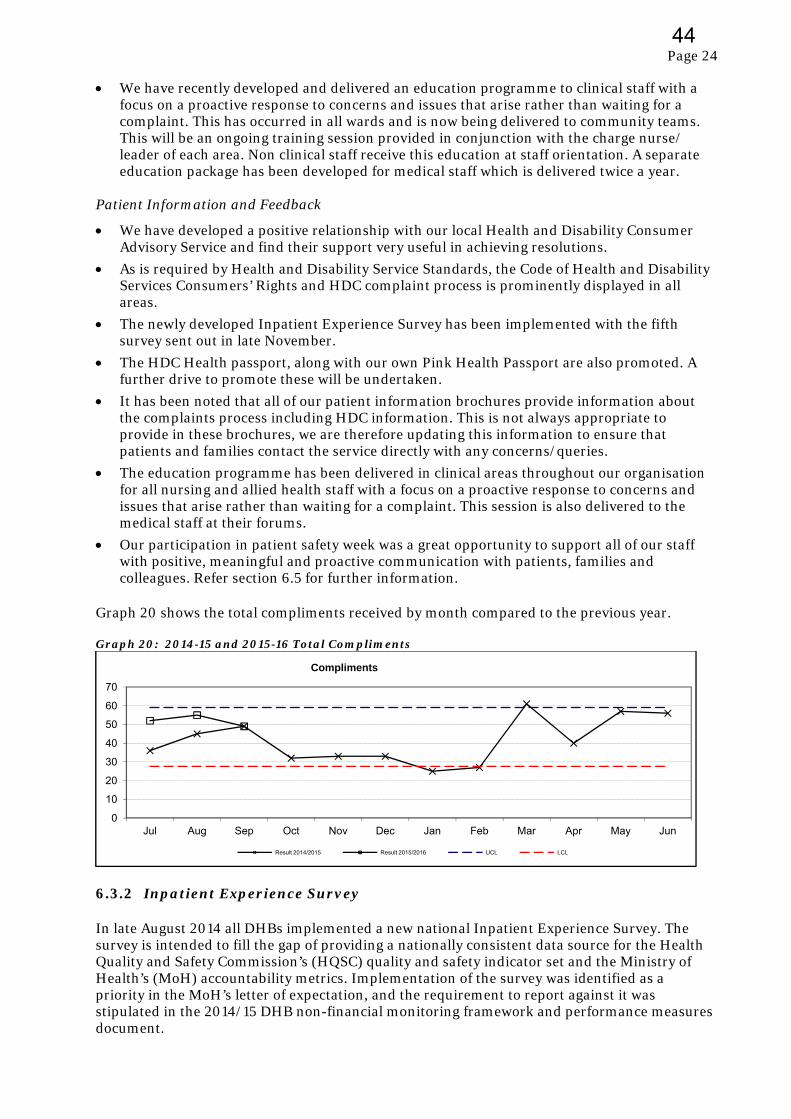
Page 24
We have recently developed and delivered an education programme to clinical staff with a focus on a proactive response to concerns and issues that arise rather than waiting for a complaint. This has occurred in all wards and is now being delivered to community teams. This will be an ongoing training session provided in conjunction with the charge nurse/ leader of each area. Non clinical staff receive this education at staff orientation. A separate education package has been developed for medical staff which is delivered twice a year.
Patient Information and Feedback
We have developed a positive relationship with our local Health and Disability Consumer Advisory Service and find their support very useful in achieving resolutions.
As is required by Health and Disability Service Standards, the Code of Health and Disability Services Consumers’ Rights and HDC complaint process is prominently displayed in all areas.
The newly developed Inpatient Experience Survey has been implemented with the fifth survey sent out in late November.
The HDC Health passport, along with our own Pink Health Passport are also promoted. A further drive to promote these will be undertaken.
It has been noted that all of our patient information brochures provide information about the complaints process including HDC information. This is not always appropriate to provide in these brochures, we are therefore updating this information to ensure that patients and families contact the service directly with any concerns/queries.
The education programme has been delivered in clinical areas throughout our organisation for all nursing and allied health staff with a focus on a proactive response to concerns and issues that arise rather than waiting for a complaint. This session is also delivered to the medical staff at their forums.
Our participation in patient safety week was a great opportunity to support all of our staff with positive, meaningful and proactive communication with patients, families and colleagues. Refer section 6.5 for further information.
Graph 20 shows the total compliments received by month compared to the previous year. Graph 20: 2014-15 and 2015-16 Total Compliments
6.3.2 Inpatient Experience Survey In late August 2014 all DHBs implemented a new national Inpatient Experience Survey. The survey is intended to fill the gap of providing a nationally consistent data source for the Health Quality and Safety Commission’s (HQSC) quality and safety indicator set and the Ministry of Health’s (MoH) accountability metrics. Implementation of the survey was identified as a priority in the MoH’s letter of expectation, and the requirement to report against it was stipulated in the 2014/15 DHB non-financial monitoring framework and performance measures document.
0
10
20
30
40
50
60
70
Jul Aug Sep Oct Nov Dec Jan Feb Mar Apr May Jun
Compliments
Result 2014/2015 Result 2015/2016 UCL LCL
44

Page 25
This survey was designed by the HQSC following a period of consultation with DHBs. The survey drew upon the PICKER library of questions and was structured to cover the four domains of the patient experience: Communication
Partnership
Co-ordination
Physical and emotional needs The survey takes a random sample of inpatients aged 15 and older, who had an overnight stay in hospital in a selected fortnight, and whose event ended with a routine or self discharge. Specific exclusions are patients admitted to a mental health specialty, patients who are transferred to another health facility, and patients who died in hospital. Respondents are guaranteed anonymity unless they choose to provide their contact details because they wish to contact someone at the DHB. The national administrator of the survey is a contracted third party. They provide the random sample of patients, taken from the file provided by MidCentral District Health Board (MDHB) to be surveyed, and where electronic contact details are available send out the survey. They also provide the secure portal where respondents enter their responses. They then provide back to the HQSC and DHBs a reporting portal with weighted responses to the survey questions. Each DHB also receives their own data file with all (anonymous) responses and comments. The survey is intended to be conducted electronically by either email or SMS (text) with a unique survey link provided to enter responses in a secure website. Reminders are sent to patients seven days after the initial contact. Respondents are given 21 days to respond. MidCentral District Health Board initially lacked the infrastructure to capture patients email or SMS details therefore the surveys have been done entirely by post. Work has now been completed to enable capture of email details. Recipients of these postal surveys were provided with information to enable them to complete the survey online if they preferred. During the August survey 10 surveys were emailed out of the 400. All of those with email addresses are chosen first out of the 400, prior to the remaining sample being selected to meet the 400 required. Due to the manual nature of the survey an additional 12 hours of administration support is required for each survey which is done every quarter. This requirement will reduce as more surveys are emailed. A core set of 20 questions are asked. In addition MDHB also chose to ask questions relating to whether patients felt they had enough privacy, whether their ward or room was clean, and whether they had religious or spiritual support when required. MDHB also added a screening question whether respondents had a long term disability or impairment. Survey Results
The four graphs below show the trends in overall scores in each of the four domains for our DHB’s respondents compared with all DHBs. A rating of 10 corresponds to very good and 0 to very poor.
45
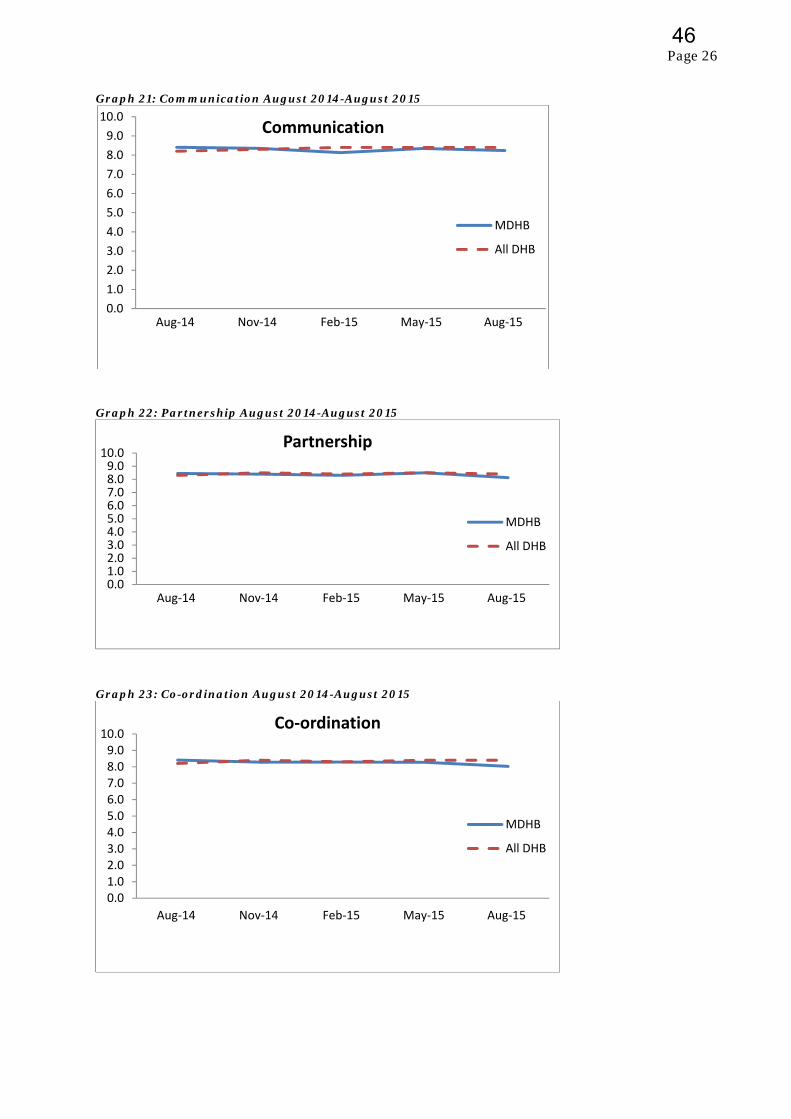
Page 26
Graph 21: Communication August 2014-August 2015
Graph 22: Partnership August 2014-August 2015
Graph 23: Co-ordination August 2014-August 2015
0.0
1.0
2.0
3.0
4.0
5.0
6.0
7.0
8.0
9.0
10.0
Aug‐14 Nov‐14 Feb‐15 May‐15 Aug‐15
Communication
MDHB
All DHB
0.01.02.03.04.05.06.07.08.09.010.0
Aug‐14 Nov‐14 Feb‐15 May‐15 Aug‐15
Partnership
MDHB
All DHB
0.01.02.03.04.05.06.07.08.09.010.0
Aug‐14 Nov‐14 Feb‐15 May‐15 Aug‐15
Co‐ordination
MDHB
All DHB
46
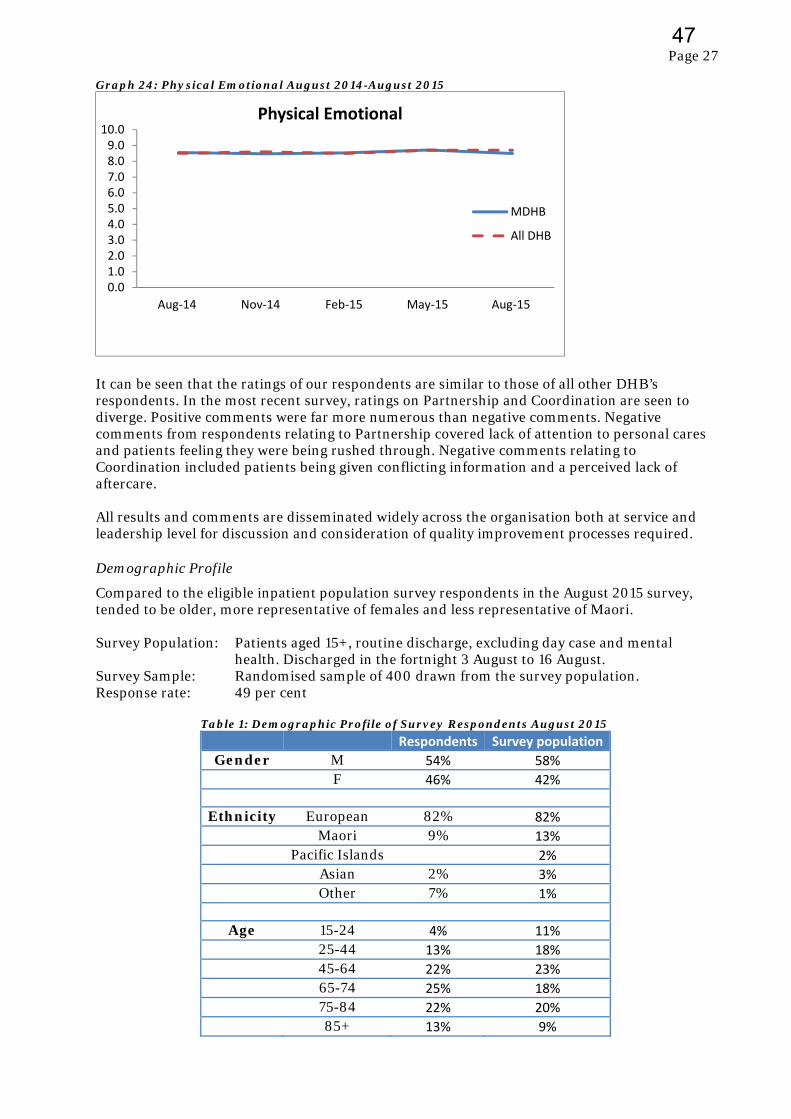
Page 27
Graph 24: Physical Emotional August 2014-August 2015
It can be seen that the ratings of our respondents are similar to those of all other DHB’s respondents. In the most recent survey, ratings on Partnership and Coordination are seen to diverge. Positive comments were far more numerous than negative comments. Negative comments from respondents relating to Partnership covered lack of attention to personal cares and patients feeling they were being rushed through. Negative comments relating to Coordination included patients being given conflicting information and a perceived lack of aftercare. All results and comments are disseminated widely across the organisation both at service and leadership level for discussion and consideration of quality improvement processes required. Demographic Profile
Compared to the eligible inpatient population survey respondents in the August 2015 survey, tended to be older, more representative of females and less representative of Maori. Survey Population: Patients aged 15+, routine discharge, excluding day case and mental
health. Discharged in the fortnight 3 August to 16 August. Survey Sample: Randomised sample of 400 drawn from the survey population. Response rate: 49 per cent Table 1: Demographic Profile of Survey Respondents August 2015
Respondents Survey population
Gender M 54% 58%
F 46% 42%
Ethnicity European 82% 82%
Maori 9% 13%
Pacific Islands 2%
Asian 2% 3%
Other 7% 1%
Age 15-24 4% 11%
25-44 13% 18%
45-64 22% 23%
65-74 25% 18%
75-84 22% 20%
85+ 13% 9%
0.01.02.03.04.05.06.07.08.09.0
10.0
Aug‐14 Nov‐14 Feb‐15 May‐15 Aug‐15
Physical Emotional
MDHB
All DHB
47
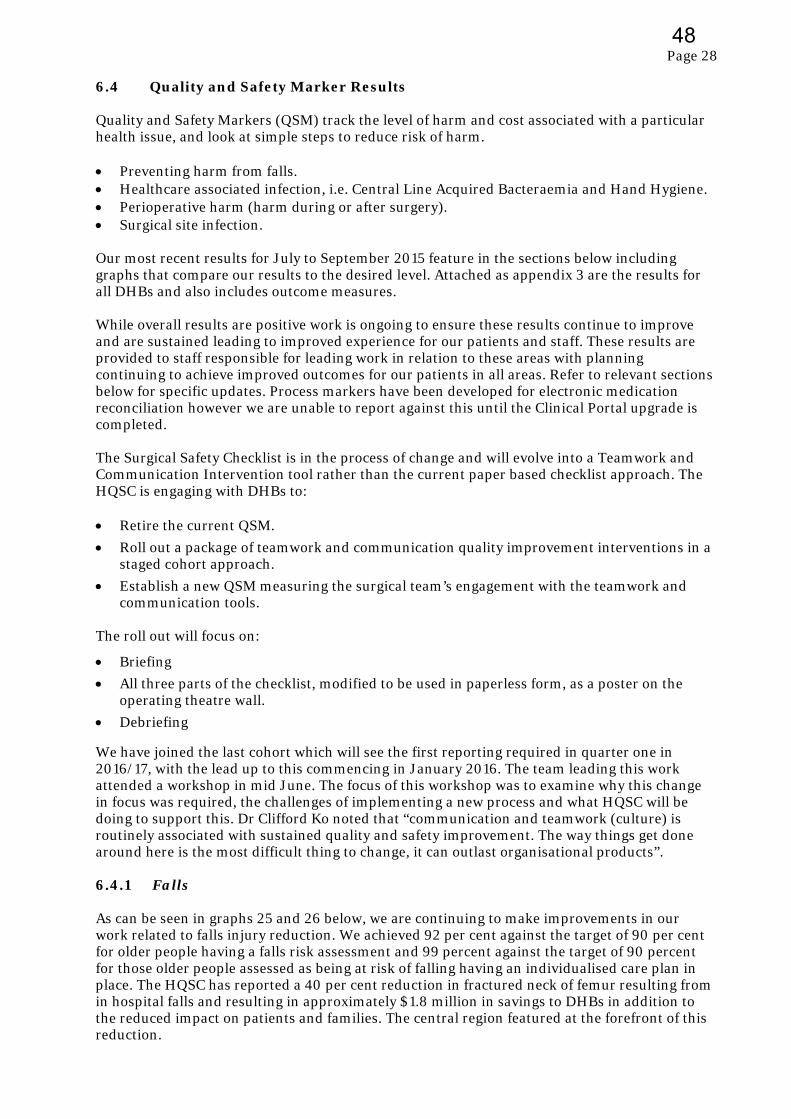
Page 28
6.4 Quality and Safety Marker Results Quality and Safety Markers (QSM) track the level of harm and cost associated with a particular health issue, and look at simple steps to reduce risk of harm. Preventing harm from falls. Healthcare associated infection, i.e. Central Line Acquired Bacteraemia and Hand Hygiene. Perioperative harm (harm during or after surgery). Surgical site infection. Our most recent results for July to September 2015 feature in the sections below including graphs that compare our results to the desired level. Attached as appendix 3 are the results for all DHBs and also includes outcome measures. While overall results are positive work is ongoing to ensure these results continue to improve and are sustained leading to improved experience for our patients and staff. These results are provided to staff responsible for leading work in relation to these areas with planning continuing to achieve improved outcomes for our patients in all areas. Refer to relevant sections below for specific updates. Process markers have been developed for electronic medication reconciliation however we are unable to report against this until the Clinical Portal upgrade is completed. The Surgical Safety Checklist is in the process of change and will evolve into a Teamwork and Communication Intervention tool rather than the current paper based checklist approach. The HQSC is engaging with DHBs to: Retire the current QSM.
Roll out a package of teamwork and communication quality improvement interventions in a staged cohort approach.
Establish a new QSM measuring the surgical team’s engagement with the teamwork and communication tools.
The roll out will focus on:
Briefing
All three parts of the checklist, modified to be used in paperless form, as a poster on the operating theatre wall.
Debriefing
We have joined the last cohort which will see the first reporting required in quarter one in 2016/17, with the lead up to this commencing in January 2016. The team leading this work attended a workshop in mid June. The focus of this workshop was to examine why this change in focus was required, the challenges of implementing a new process and what HQSC will be doing to support this. Dr Clifford Ko noted that “communication and teamwork (culture) is routinely associated with sustained quality and safety improvement. The way things get done around here is the most difficult thing to change, it can outlast organisational products”. 6.4.1 Falls As can be seen in graphs 25 and 26 below, we are continuing to make improvements in our work related to falls injury reduction. We achieved 92 per cent against the target of 90 per cent for older people having a falls risk assessment and 99 percent against the target of 90 percent for those older people assessed as being at risk of falling having an individualised care plan in place. The HQSC has reported a 40 per cent reduction in fractured neck of femur resulting from in hospital falls and resulting in approximately $1.8 million in savings to DHBs in addition to the reduced impact on patients and families. The central region featured at the forefront of this reduction.
48
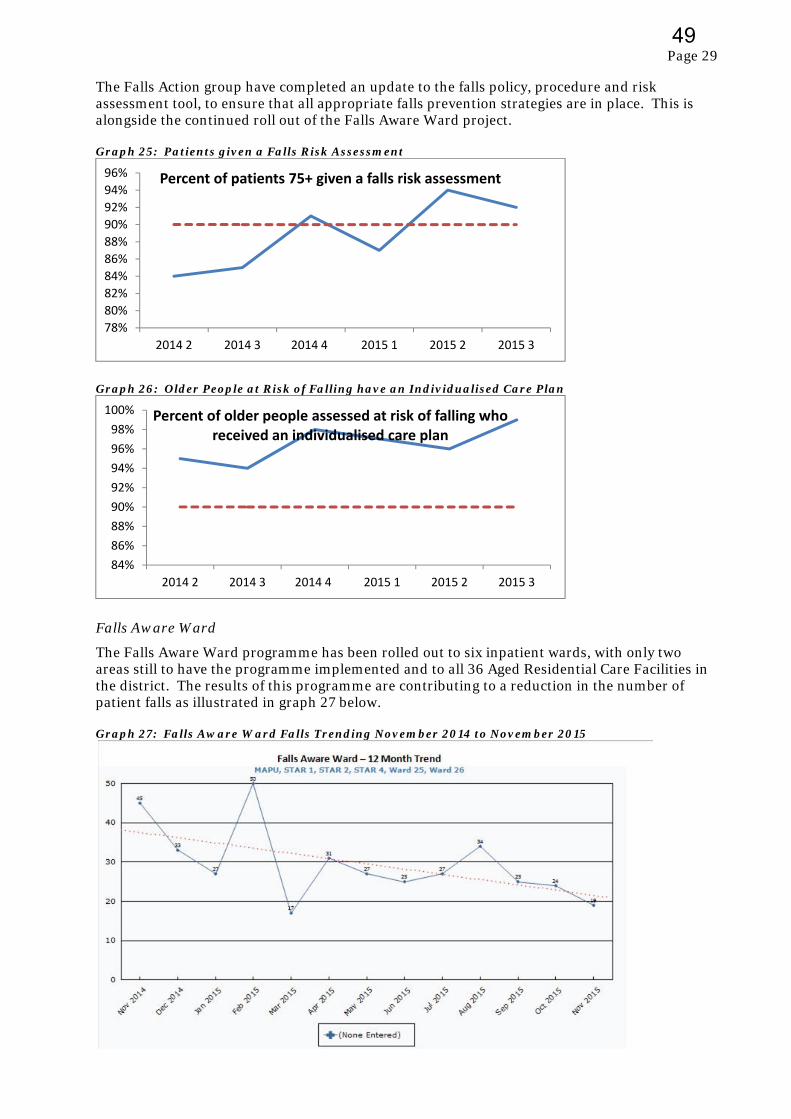
Page 29
The Falls Action group have completed an update to the falls policy, procedure and risk assessment tool, to ensure that all appropriate falls prevention strategies are in place. This is alongside the continued roll out of the Falls Aware Ward project. Graph 25: Patients given a Falls Risk Assessment
Graph 26: Older People at Risk of Falling have an Individualised Care Plan
Falls Aware Ward
The Falls Aware Ward programme has been rolled out to six inpatient wards, with only two areas still to have the programme implemented and to all 36 Aged Residential Care Facilities in the district. The results of this programme are contributing to a reduction in the number of patient falls as illustrated in graph 27 below. Graph 27: Falls Aware Ward Falls Trending November 2014 to November 2015
78%
80%
82%
84%
86%
88%
90%
92%
94%
96%
2014 2 2014 3 2014 4 2015 1 2015 2 2015 3
Percent of patients 75+ given a falls risk assessment
84%
86%
88%
90%
92%
94%
96%
98%
100%
2014 2 2014 3 2014 4 2015 1 2015 2 2015 3
Percent of older people assessed at risk of falling who received an individualised care plan
49
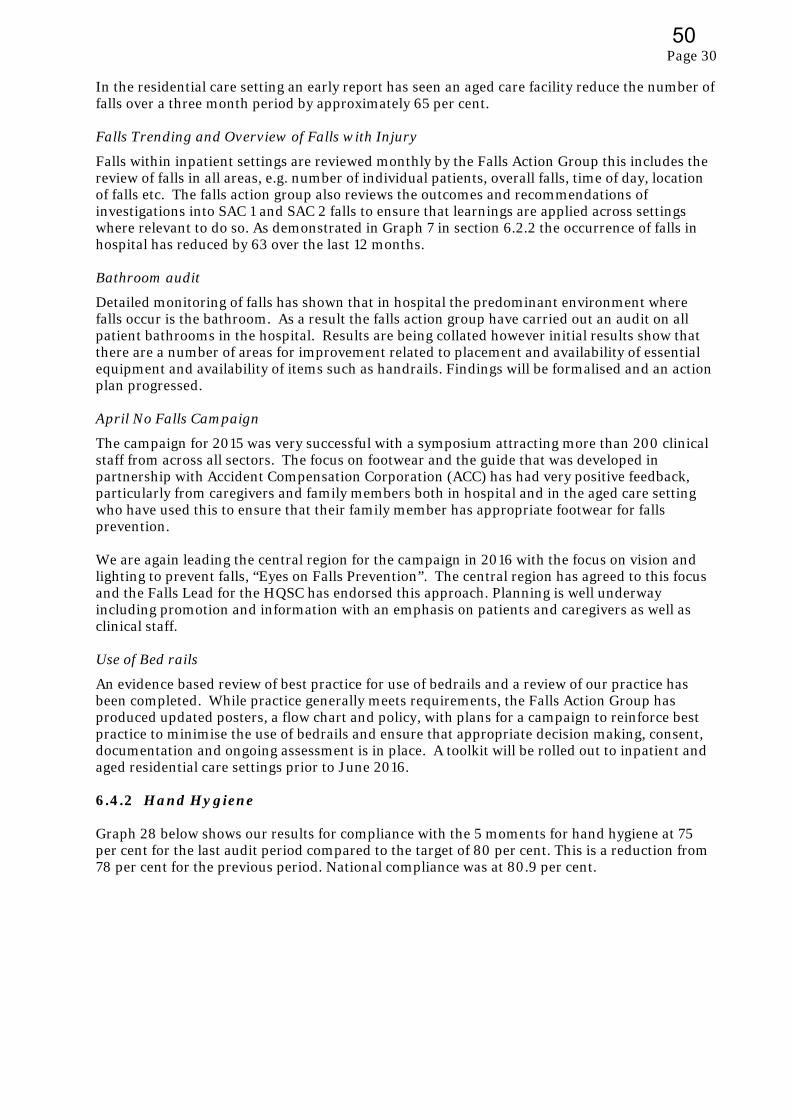
Page 30
In the residential care setting an early report has seen an aged care facility reduce the number of falls over a three month period by approximately 65 per cent. Falls Trending and Overview of Falls with Injury
Falls within inpatient settings are reviewed monthly by the Falls Action Group this includes the review of falls in all areas, e.g. number of individual patients, overall falls, time of day, location of falls etc. The falls action group also reviews the outcomes and recommendations of investigations into SAC 1 and SAC 2 falls to ensure that learnings are applied across settings where relevant to do so. As demonstrated in Graph 7 in section 6.2.2 the occurrence of falls in hospital has reduced by 63 over the last 12 months. Bathroom audit
Detailed monitoring of falls has shown that in hospital the predominant environment where falls occur is the bathroom. As a result the falls action group have carried out an audit on all patient bathrooms in the hospital. Results are being collated however initial results show that there are a number of areas for improvement related to placement and availability of essential equipment and availability of items such as handrails. Findings will be formalised and an action plan progressed. April No Falls Campaign
The campaign for 2015 was very successful with a symposium attracting more than 200 clinical staff from across all sectors. The focus on footwear and the guide that was developed in partnership with Accident Compensation Corporation (ACC) has had very positive feedback, particularly from caregivers and family members both in hospital and in the aged care setting who have used this to ensure that their family member has appropriate footwear for falls prevention. We are again leading the central region for the campaign in 2016 with the focus on vision and lighting to prevent falls, “Eyes on Falls Prevention”. The central region has agreed to this focus and the Falls Lead for the HQSC has endorsed this approach. Planning is well underway including promotion and information with an emphasis on patients and caregivers as well as clinical staff. Use of Bed rails
An evidence based review of best practice for use of bedrails and a review of our practice has been completed. While practice generally meets requirements, the Falls Action Group has produced updated posters, a flow chart and policy, with plans for a campaign to reinforce best practice to minimise the use of bedrails and ensure that appropriate decision making, consent, documentation and ongoing assessment is in place. A toolkit will be rolled out to inpatient and aged residential care settings prior to June 2016. 6.4.2 Hand Hygiene Graph 28 below shows our results for compliance with the 5 moments for hand hygiene at 75 per cent for the last audit period compared to the target of 80 per cent. This is a reduction from 78 per cent for the previous period. National compliance was at 80.9 per cent.
50
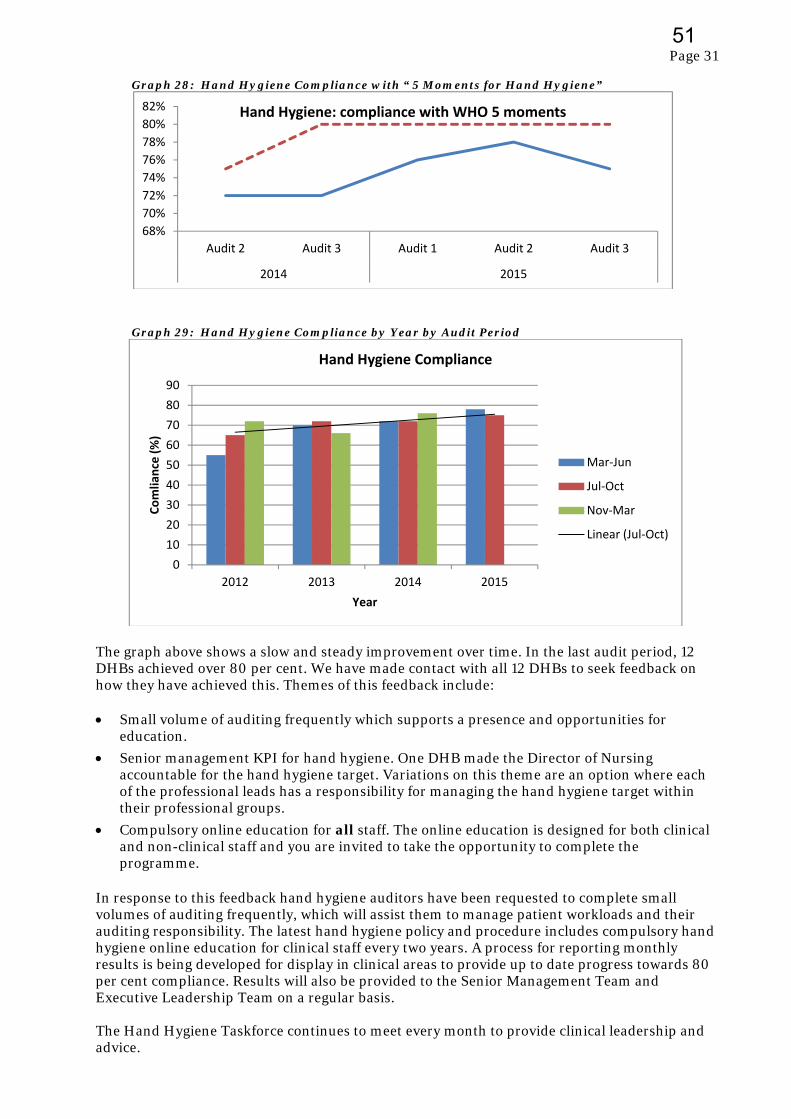
Page 31
Graph 28: Hand Hygiene Compliance with “ 5 Moments for Hand Hygiene”
Graph 29: Hand Hygiene Compliance by Year by Audit Period
The graph above shows a slow and steady improvement over time. In the last audit period, 12 DHBs achieved over 80 per cent. We have made contact with all 12 DHBs to seek feedback on how they have achieved this. Themes of this feedback include: Small volume of auditing frequently which supports a presence and opportunities for
education.
Senior management KPI for hand hygiene. One DHB made the Director of Nursing accountable for the hand hygiene target. Variations on this theme are an option where each of the professional leads has a responsibility for managing the hand hygiene target within their professional groups.
Compulsory online education for all staff. The online education is designed for both clinical and non-clinical staff and you are invited to take the opportunity to complete the programme.
In response to this feedback hand hygiene auditors have been requested to complete small volumes of auditing frequently, which will assist them to manage patient workloads and their auditing responsibility. The latest hand hygiene policy and procedure includes compulsory hand hygiene online education for clinical staff every two years. A process for reporting monthly results is being developed for display in clinical areas to provide up to date progress towards 80 per cent compliance. Results will also be provided to the Senior Management Team and Executive Leadership Team on a regular basis. The Hand Hygiene Taskforce continues to meet every month to provide clinical leadership and advice.
68%
70%
72%
74%
76%
78%
80%
82%
Audit 2 Audit 3 Audit 1 Audit 2 Audit 3
2014 2015
Hand Hygiene: compliance with WHO 5 moments
0
10
20
30
40
50
60
70
80
90
2012 2013 2014 2015
Comliance (%)
Year
Hand Hygiene Compliance
Mar‐Jun
Jul‐Oct
Nov‐Mar
Linear (Jul‐Oct)
51
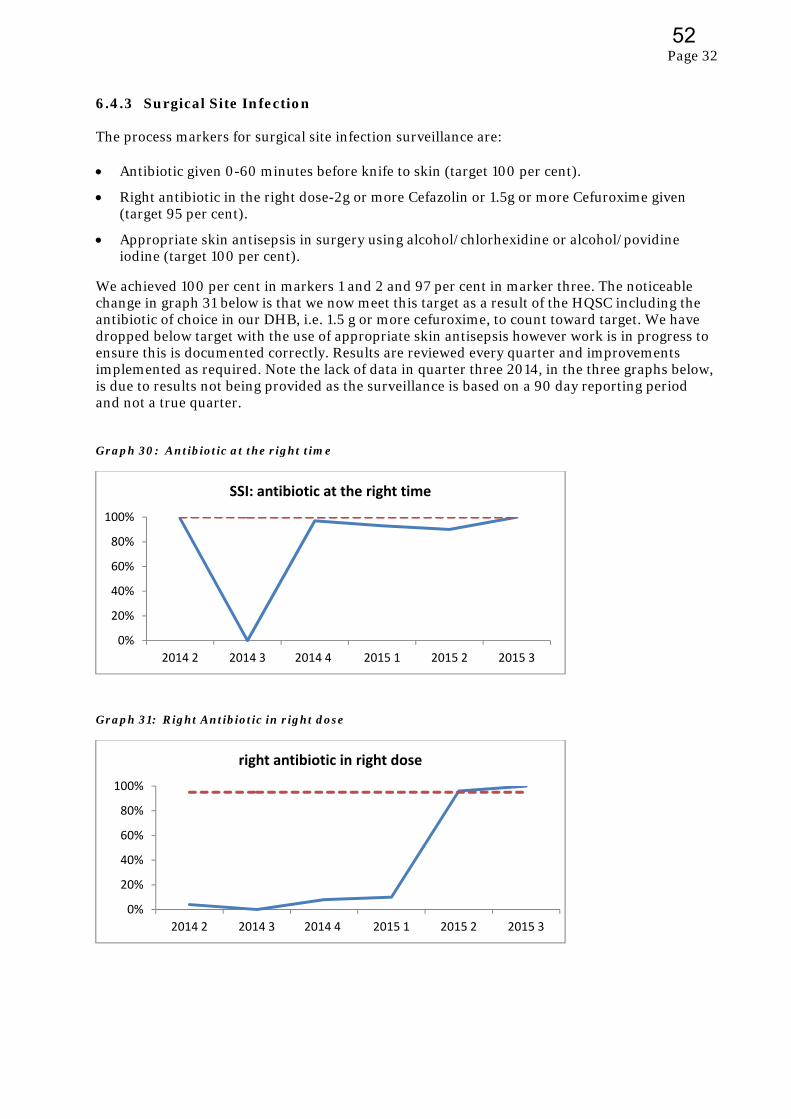
Page 32
6.4.3 Surgical Site Infection The process markers for surgical site infection surveillance are: Antibiotic given 0-60 minutes before knife to skin (target 100 per cent).
Right antibiotic in the right dose-2g or more Cefazolin or 1.5g or more Cefuroxime given (target 95 per cent).
Appropriate skin antisepsis in surgery using alcohol/chlorhexidine or alcohol/povidine iodine (target 100 per cent).
We achieved 100 per cent in markers 1 and 2 and 97 per cent in marker three. The noticeable change in graph 31 below is that we now meet this target as a result of the HQSC including the antibiotic of choice in our DHB, i.e. 1.5 g or more cefuroxime, to count toward target. We have dropped below target with the use of appropriate skin antisepsis however work is in progress to ensure this is documented correctly. Results are reviewed every quarter and improvements implemented as required. Note the lack of data in quarter three 2014, in the three graphs below, is due to results not being provided as the surveillance is based on a 90 day reporting period and not a true quarter. Graph 30: Antibiotic at the right time
Graph 31: Right Antibiotic in right dose
0%
20%
40%
60%
80%
100%
2014 2 2014 3 2014 4 2015 1 2015 2 2015 3
SSI: antibiotic at the right time
0%
20%
40%
60%
80%
100%
2014 2 2014 3 2014 4 2015 1 2015 2 2015 3
right antibiotic in right dose
52
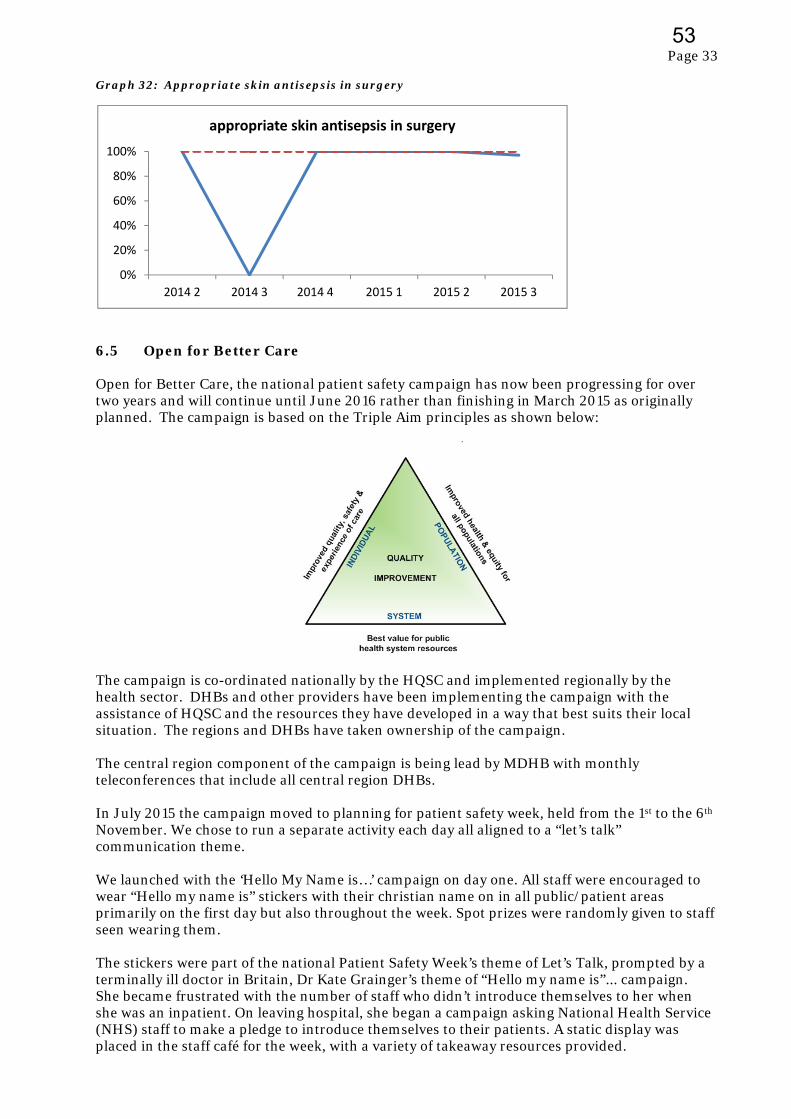
Page 33
Graph 32: Appropriate skin antisepsis in surgery
6.5 Open for Better Care Open for Better Care, the national patient safety campaign has now been progressing for over two years and will continue until June 2016 rather than finishing in March 2015 as originally planned. The campaign is based on the Triple Aim principles as shown below:
The campaign is co-ordinated nationally by the HQSC and implemented regionally by the health sector. DHBs and other providers have been implementing the campaign with the assistance of HQSC and the resources they have developed in a way that best suits their local situation. The regions and DHBs have taken ownership of the campaign. The central region component of the campaign is being lead by MDHB with monthly teleconferences that include all central region DHBs. In July 2015 the campaign moved to planning for patient safety week, held from the 1st to the 6th November. We chose to run a separate activity each day all aligned to a “let’s talk” communication theme. We launched with the ‘Hello My Name is…’ campaign on day one. All staff were encouraged to wear “Hello my name is” stickers with their christian name on in all public/patient areas primarily on the first day but also throughout the week. Spot prizes were randomly given to staff seen wearing them. The stickers were part of the national Patient Safety Week’s theme of Let’s Talk, prompted by a terminally ill doctor in Britain, Dr Kate Grainger’s theme of “Hello my name is”... campaign. She became frustrated with the number of staff who didn’t introduce themselves to her when she was an inpatient. On leaving hospital, she began a campaign asking National Health Service (NHS) staff to make a pledge to introduce themselves to their patients. A static display was placed in the staff café for the week, with a variety of takeaway resources provided.
0%
20%
40%
60%
80%
100%
2014 2 2014 3 2014 4 2015 1 2015 2 2015 3
appropriate skin antisepsis in surgery
53
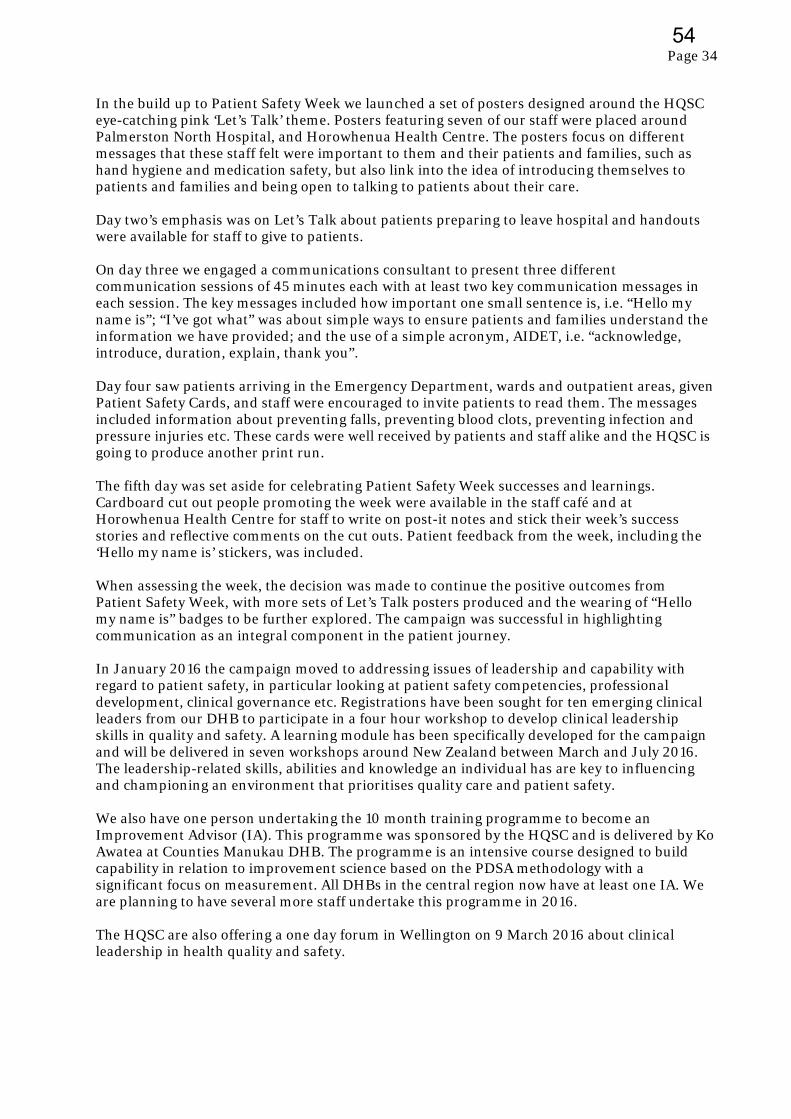
Page 34
In the build up to Patient Safety Week we launched a set of posters designed around the HQSC eye-catching pink ‘Let’s Talk’ theme. Posters featuring seven of our staff were placed around Palmerston North Hospital, and Horowhenua Health Centre. The posters focus on different messages that these staff felt were important to them and their patients and families, such as hand hygiene and medication safety, but also link into the idea of introducing themselves to patients and families and being open to talking to patients about their care. Day two’s emphasis was on Let’s Talk about patients preparing to leave hospital and handouts were available for staff to give to patients. On day three we engaged a communications consultant to present three different communication sessions of 45 minutes each with at least two key communication messages in each session. The key messages included how important one small sentence is, i.e. “Hello my name is”; “I’ve got what” was about simple ways to ensure patients and families understand the information we have provided; and the use of a simple acronym, AIDET, i.e. “acknowledge, introduce, duration, explain, thank you”. Day four saw patients arriving in the Emergency Department, wards and outpatient areas, given Patient Safety Cards, and staff were encouraged to invite patients to read them. The messages included information about preventing falls, preventing blood clots, preventing infection and pressure injuries etc. These cards were well received by patients and staff alike and the HQSC is going to produce another print run. The fifth day was set aside for celebrating Patient Safety Week successes and learnings. Cardboard cut out people promoting the week were available in the staff café and at Horowhenua Health Centre for staff to write on post-it notes and stick their week’s success stories and reflective comments on the cut outs. Patient feedback from the week, including the ‘Hello my name is’ stickers, was included. When assessing the week, the decision was made to continue the positive outcomes from Patient Safety Week, with more sets of Let’s Talk posters produced and the wearing of “Hello my name is” badges to be further explored. The campaign was successful in highlighting communication as an integral component in the patient journey. In January 2016 the campaign moved to addressing issues of leadership and capability with regard to patient safety, in particular looking at patient safety competencies, professional development, clinical governance etc. Registrations have been sought for ten emerging clinical leaders from our DHB to participate in a four hour workshop to develop clinical leadership skills in quality and safety. A learning module has been specifically developed for the campaign and will be delivered in seven workshops around New Zealand between March and July 2016. The leadership-related skills, abilities and knowledge an individual has are key to influencing and championing an environment that prioritises quality care and patient safety. We also have one person undertaking the 10 month training programme to become an Improvement Advisor (IA). This programme was sponsored by the HQSC and is delivered by Ko Awatea at Counties Manukau DHB. The programme is an intensive course designed to build capability in relation to improvement science based on the PDSA methodology with a significant focus on measurement. All DHBs in the central region now have at least one IA. We are planning to have several more staff undertake this programme in 2016. The HQSC are also offering a one day forum in Wellington on 9 March 2016 about clinical leadership in health quality and safety.
54
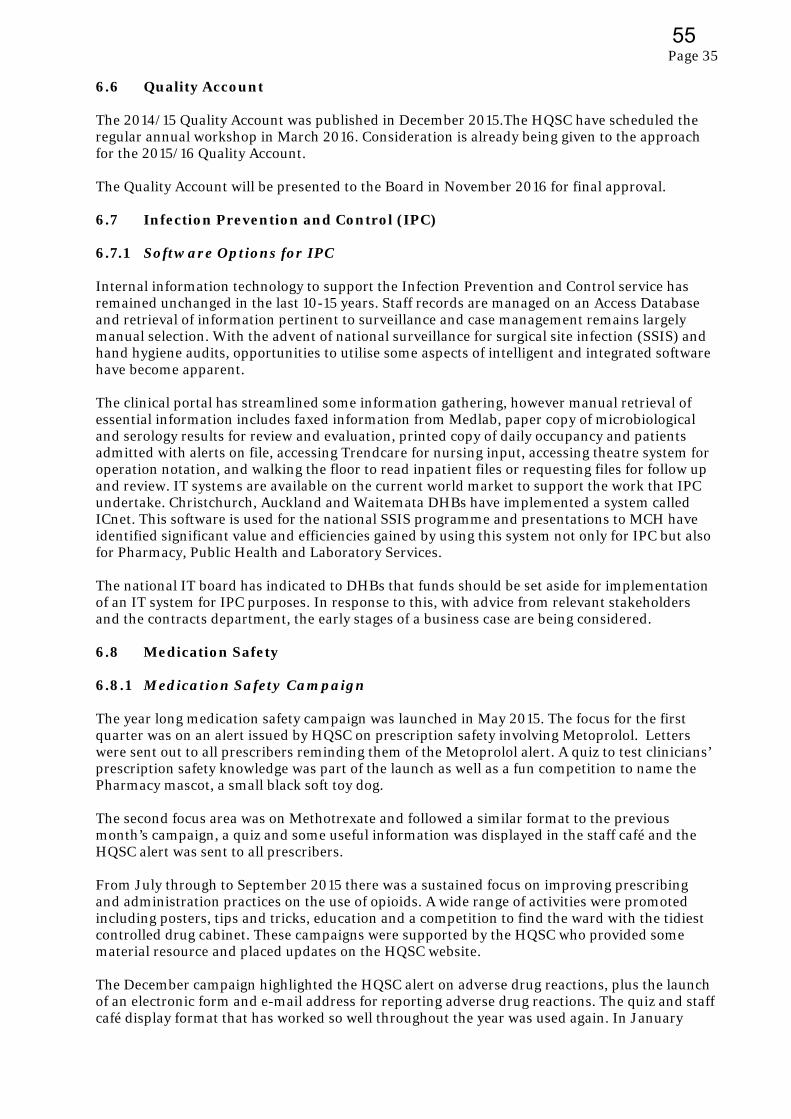
Page 35
6.6 Quality Account The 2014/15 Quality Account was published in December 2015.The HQSC have scheduled the regular annual workshop in March 2016. Consideration is already being given to the approach for the 2015/16 Quality Account. The Quality Account will be presented to the Board in November 2016 for final approval. 6.7 Infection Prevention and Control (IPC) 6.7.1 Software Options for IPC Internal information technology to support the Infection Prevention and Control service has remained unchanged in the last 10-15 years. Staff records are managed on an Access Database and retrieval of information pertinent to surveillance and case management remains largely manual selection. With the advent of national surveillance for surgical site infection (SSIS) and hand hygiene audits, opportunities to utilise some aspects of intelligent and integrated software have become apparent. The clinical portal has streamlined some information gathering, however manual retrieval of essential information includes faxed information from Medlab, paper copy of microbiological and serology results for review and evaluation, printed copy of daily occupancy and patients admitted with alerts on file, accessing Trendcare for nursing input, accessing theatre system for operation notation, and walking the floor to read inpatient files or requesting files for follow up and review. IT systems are available on the current world market to support the work that IPC undertake. Christchurch, Auckland and Waitemata DHBs have implemented a system called ICnet. This software is used for the national SSIS programme and presentations to MCH have identified significant value and efficiencies gained by using this system not only for IPC but also for Pharmacy, Public Health and Laboratory Services. The national IT board has indicated to DHBs that funds should be set aside for implementation of an IT system for IPC purposes. In response to this, with advice from relevant stakeholders and the contracts department, the early stages of a business case are being considered. 6.8 Medication Safety 6.8.1 Medication Safety Campaign The year long medication safety campaign was launched in May 2015. The focus for the first quarter was on an alert issued by HQSC on prescription safety involving Metoprolol. Letters were sent out to all prescribers reminding them of the Metoprolol alert. A quiz to test clinicians’ prescription safety knowledge was part of the launch as well as a fun competition to name the Pharmacy mascot, a small black soft toy dog. The second focus area was on Methotrexate and followed a similar format to the previous month’s campaign, a quiz and some useful information was displayed in the staff café and the HQSC alert was sent to all prescribers. From July through to September 2015 there was a sustained focus on improving prescribing and administration practices on the use of opioids. A wide range of activities were promoted including posters, tips and tricks, education and a competition to find the ward with the tidiest controlled drug cabinet. These campaigns were supported by the HQSC who provided some material resource and placed updates on the HQSC website. The December campaign highlighted the HQSC alert on adverse drug reactions, plus the launch of an electronic form and e-mail address for reporting adverse drug reactions. The quiz and staff café display format that has worked so well throughout the year was used again. In January
55
Page 36
2016 the medication safety team plan to launch the new insulin prescribing and administration charts. The overall objective of this sustained campaign is to reduce the opportunity for prescribing and administration errors, improve knowledge and expertise of staff and reduce potential for patient harm. There is to date no evidence that this has reduced errors however the next audit of medication charts, planned for early 2016, may reveal some improvements. 6.8.2 Safe Use of Opioids Collaborative We are partnering with the HQSC in implementing a national breakthrough collaborative on the safe use of opioids in hospitals. The goal of the collaborative is to reduce harm from opioids in hospitals, and to build capability within hospitals in medication safety and quality improvement. Our Opioid Collaborative Working Group has established the local context around opioid related constipation, prescribing practices, documentation and monitoring in Star 2. Baseline figures indicate that 25 per cent of Star 2 patients are prescribed regular opioids with only 50 per cent of these being co-prescribed a regular laxative. Of the 25 per cent of Star 2 patients who are prescribed regular opioids, 13 per cent are identified as being constipated. The aim of the working group is to reduce the numbers of patients who are prescribed regular opioids who are identified with constipation by 50 per cent by the end of June 2016. The group has also developed and tested improvements, for example, patient information brochures, posters, nursing documentation and draft guidance for medical and nursing staff for co-prescribing and the management of opioid induced constipation. From the baseline figures only 50 per cent of patients on regular opioids being co-prescribed regular laxatives, this has slowly improved to 77 per cent from the introduction of a new standardised way of nursing documentation of bowel movements for patients. To date the numbers of patients who are prescribed regular opioids who are identified with constipation is unchanged; however the duration of constipation for these patients has reduced by half a day which is an early indication of improvement. Two members of our Opioid Collaborative Working Group attended learning session three in Auckland in November 2015. These learning sessions are an essential component of the collaborative methodology and bring together all DHBs to share current learnings and further develop improvements to reduce harm from opioid use. Our team received very positive feedback and were complimented on their process and progress. In addition very positive feedback was received regarding this work from the auditors during surveillance. 6.8.3 Management of Refrigerated Medications The Pharmacy and Infection Prevention and Control have achieved cold chain accreditation, and a number of wards, which will hold vaccines in the future, are currently engaged in the cold chain accreditation process. Cold chain is the prescribed process for ensuring that vaccines are kept at temperatures between +2 and +8 degrees celsius at all times from the point of manufacture to being used. This is now well progressed with the final tasks to obtain cold chain accreditation due in February 2016. Previously reported initiatives, such as the introduction of the fridge failure card, have been well accepted. New digital maximum thermometers have been purchased and installed. These thermometers, as well as reading medication fridge maximum/minimum temperatures, also read the maximum/minimum temperatures of the medication rooms. The Storage of Medicines Policy has been updated as a result of the changes introduced. The new policy has been well accepted with recording of minimum/maximum temperatures of medication fridges and medication rooms dramatically improved across hospital wards although still requires further improvement.
56
Page 37
6.8.4 Compounding, Dispensing and Delivery of Chemotherapy The delays experienced with the ePharmacy project have meant that simulation of the new process required for the provision of chemotherapy using this system has not occurred. The pharmacy team have however identified other changes occurring in current processes and responded by improving checklists to accommodate these changes. These checklists have proven to be successful, with the detection of a minor mistake made by the third party compounder. Pharmacists have developed processes that assure the quality of the products produced. Direct microbiological monitoring for medicines produced in batches has been introduced successfully. The monitoring introduced has been approved by Medicines Control. Recently these processes have allowed the Pharmacy to respond to a national outage of pre-drawn intrathecal morphine syringes and prepare this item for use in theatre. 6.8.5 Repacking of Bulk Medicines The Pharmacy has identified 25 lines that can be packed down from large packs for more convenient supply to hospital wards. This will improve inventory control and reduce wastage of medicines. In order to avoid multiple lines appearing in ward stock in white bottles with black and white labels, which could increase risk of incorrect medicine selection, the Pharmacy has developed a series of labels with coloured strips and employed the HQSC tallman lettering recommendations for medicines. Tallman lettering is where parts of a medication name that might sound or look the same as others is written in mixed case letters to help draw attention to the dissimilarities in the names. Initial feedback received from wards has been positive. 6.8.6 Medicines Reconciliation Medicines reconciliation is an on-going priority for the Pharmacy. Currently 80-85 per cent of prioritised patients have their medicines reconciled by a pharmacist within 24 hours of admission. In 2016 pharmacists undertaking this work will endeavour to add to this service by conducting a five step medicines review using an evidence based tool currently used in acute admission units in Danish hospitals. This process is expected to start in March 2016 and will be reported on to the Medicines Advice and Policy Committee (MAPC). 7. BEING UP TO THE JOB 7.1 Critical Event Debriefing A multidisciplinary working group of representatives from several services was formed in August 2015 to look at what policies and procedures are in place to assist individuals and teams to cope when an event happens to them or around them. The outcome of the initial discussion was that various help channels such as the Employee Assistance Programme (EAP) and community, professional and spiritual help organisations were available however the contacts details and information was not easy to find, information was held in various places and one solution might not necessarily suit all staff. As an initial step in the process of setting up a robust assistance system, a single repository for information and contacts was developed and this intranet site, owned by Occupational Health and Safety, continues to be enhanced with a wide range of information and other suggestions being submitted by the many staff already accessing the site. This intranet site is known as the ‘Self Care’ site. Positive feedback has been received about the usefulness of this site. Work continues on an easy to follow decision tree for the first page of the self care site to assist staff and managers select options for assistance when an event occurs with a view to strengthening what we already do and enhancing options that can be accessed.
57
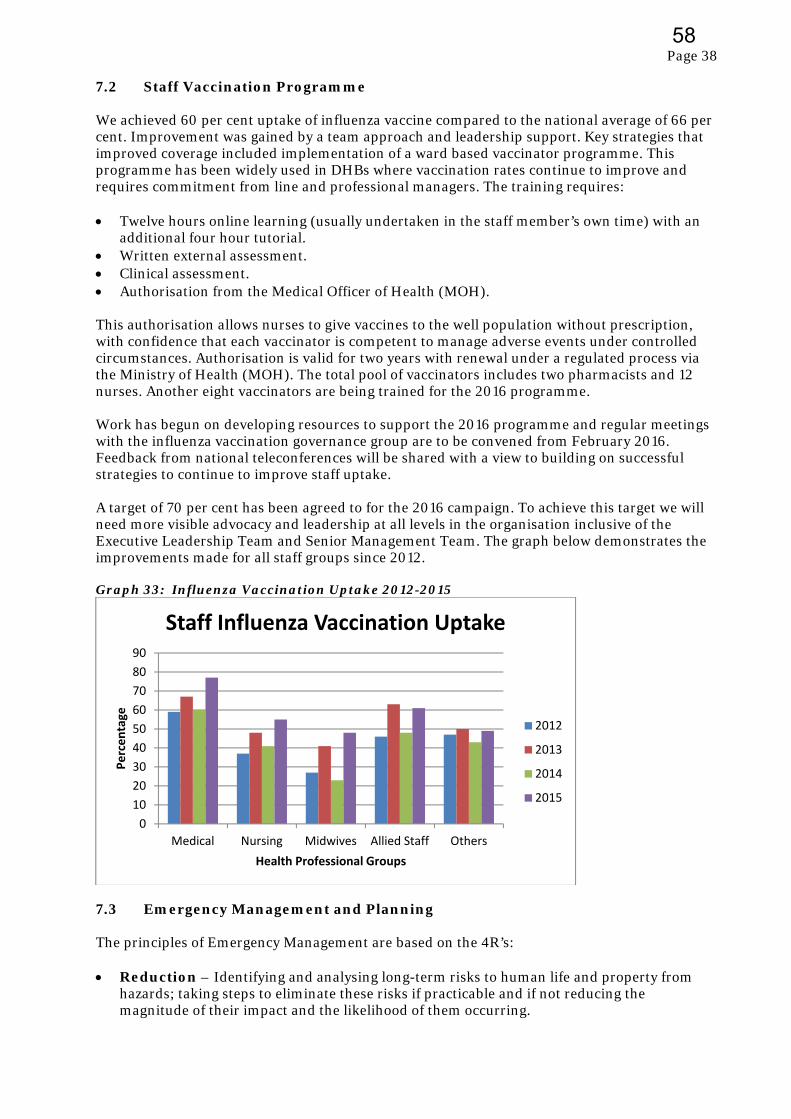
Page 38
7.2 Staff Vaccination Programme We achieved 60 per cent uptake of influenza vaccine compared to the national average of 66 per cent. Improvement was gained by a team approach and leadership support. Key strategies that improved coverage included implementation of a ward based vaccinator programme. This programme has been widely used in DHBs where vaccination rates continue to improve and requires commitment from line and professional managers. The training requires: Twelve hours online learning (usually undertaken in the staff member’s own time) with an
additional four hour tutorial. Written external assessment. Clinical assessment. Authorisation from the Medical Officer of Health (MOH). This authorisation allows nurses to give vaccines to the well population without prescription, with confidence that each vaccinator is competent to manage adverse events under controlled circumstances. Authorisation is valid for two years with renewal under a regulated process via the Ministry of Health (MOH). The total pool of vaccinators includes two pharmacists and 12 nurses. Another eight vaccinators are being trained for the 2016 programme. Work has begun on developing resources to support the 2016 programme and regular meetings with the influenza vaccination governance group are to be convened from February 2016. Feedback from national teleconferences will be shared with a view to building on successful strategies to continue to improve staff uptake. A target of 70 per cent has been agreed to for the 2016 campaign. To achieve this target we will need more visible advocacy and leadership at all levels in the organisation inclusive of the Executive Leadership Team and Senior Management Team. The graph below demonstrates the improvements made for all staff groups since 2012. Graph 33: Influenza Vaccination Uptake 2012-2015
7.3 Emergency Management and Planning The principles of Emergency Management are based on the 4R’s: Reduction – Identifying and analysing long-term risks to human life and property from
hazards; taking steps to eliminate these risks if practicable and if not reducing the magnitude of their impact and the likelihood of them occurring.
0
10
20
30
40
50
60
70
80
90
Medical Nursing Midwives Allied Staff Others
Percentage
Health Professional Groups
Staff Influenza Vaccination Uptake
2012
2013
2014
2015
58
Page 39
Readiness – Developing operational systems and capabilities before a civil defence emergency happens; including self-help and response programmes for the general public, and specific programmes for emergency services, lifeline utilities and other agencies.
Response – Actions taken immediately before, during or directly after a civil defence
emergency to save lives and protect property, and to help communities recover. Recovery - The coordinated efforts and processes to bring about the immediate, medium-
term and long-term holistic regeneration of a community following a civil defence emergency.
7.3.1 Organisational Resilience Organisational resilience is achieved by effectively applying the 4R’s and refers to an organisations ability to adapt and evolve, to respond to short term shocks—be they natural disasters or significant changes in dynamics and to shape itself to respond to long term challenges. From an Emergency Management perspective our key focus is the continued investment in growing resilience to ensure a level of business continuity whatever the event. This is being achieved in such ways as: Amalgamation of Risk Management and Emergency Management
Risk Management is an effective business tool that not only supports decision making, but safeguards the organisation from likely threats and enhances organisational strategy and service delivery. The amalgamation of Risk and Emergency Management has been highly successful and considered an effective Reduction tool. Co-ordinated Incident Management System (CIMS in Health) Training
CIMS in Health has rolled over into its third year of delivery and currently we have in excess of 150 personnel trained at this level. The delivery of CIMS in Health is now limited to two courses a year to facilitate the increased demand for advanced CIMS training in the following key roles: Planning Intelligence Operations CIMS in Health (to include Advanced CIMS) has been highly successful and is considered an essential Response tool. Emergency Preparedness Presentations
These presentations promote the theme of ‘prepared at home to be prepared for work’ and are delivered on New Staff days, at the request of departments as part of their scheduled training days and recently at the request of the Bipartite Action Group (BAG). In all cases the information focuses on the ‘get ready get thru’ Civil Defence Emergency Management messaging campaign and the need to maintain staffing levels during crisis events. The Emergency Planning presentation is considered a highly effective Readiness tool. 7.3.2 Recent Emergency Management Activity A Welfare Manager role has been established within the CIMS structure, intended to focus on the immediate needs of our staff during and post event. In addition the Social Work Clinical Coordinator has developed and delivered an informative psychosocial presentation entitled
59
Page 40
‘What about me – Principles of Psychosocial Recovery’ that focuses on the impact of secondary trauma associated with emergency workers in times of civil disaster or emergency response. New Zealand Civil Defence Emergency Management (NZCDEM) conducted an earthquake drill (NZ Shakeout) as part of their national ‘Get Ready – Get Thru’ annual campaign. Some of the activities promoted to our staff during this campaign included: Individual staff and services conducting the “Drop/Cover/Hold” drill.
Staff attending presentations to include ‘Prepared at home to be prepared for work’ and
‘What about me – Principles of Psychosocial Recovery’.
The Manager, Risk and Emergency Management attended the Christchurch Hospital Shakeout exercise to observe and assist the Hospital Incident Management Team conducting a mass casualty table top exercise. The opportunity was mutually beneficial in providing feedback, promoting information exchange and measuring the effectiveness of our own emergency response plans. The following key points were noted:
‐ Christchurch Hospital has yet to incorporate the latest changes to the Coordinated
Incident Management Structure (CIMS) and the delivery of Advanced CIMS, both of which are standard practice for us. We have shared our training resource with them.
‐ Canterbury District Health Board (CDHB) had yet to develop a Strategic Business
Continuity Policy and supporting plan which we have had in place for 18 months. We have shared ours and have offered support to develop theirs.
‐ The CDHB Incident Management Team primarily consists of Senior Management/Head of Department equivalents and as a collective demonstrates a clear understanding of the values at threat and the likely response actions required. Conversely our Incident Management Team comprises mostly of middle management personnel providing a greater operational focus but lacking the strategic overview. We will increase representation at the Senior Management/Head of Department level within our Incident Management Team.
7.3.3 Emergency Management Next Steps Aligning our Health Emergency Plan (HEP) to the revised National Health Emergency Plan
(NHEP) released by the Ministry of Health (MOH) in October 2015. The NHEP has undergone a significant change in focus since the Christchurch earthquake and now has greater focus on psychosocial response. This plan uses a comprehensive, risk based approach to emergency management, intended to support all health stakeholders to better understand the risk context they are required to manage and to deliver services in. An emergency can affect access to health services and the health and disability sector’s ability to respond to the public’s health needs. The greater the complexity, impact and geographic scope of an emergency, the more multi-agency co-ordination will be required. To prevent, prepare for, respond to and recover from such emergencies, a whole of sector approach is needed which combines expertise and capabilities at all levels across all agencies.
This change in focus in the NHEP has also meant that the responsibility for National Psychosocial Welfare has been transferred from the Ministry of Social Development (MSD) to MoH with regional responsibility delegated to the relevant District Health Boards. It is anticipated that the transfer to MDHB will be conducted over the next six months and will be a significant focus for Mental Health and Addictions Services, Allied Health Services and Emergency Management. A workshop regarding this change has been scheduled by the Ministry of Health in March 2016.
60

Page 41
Introduction of table top exercises to test and confirm our ‘Whole of Hospital - Incident Management response’ in preparation for the Ministry of Health’s Emergo Mass Casualty exercise due to be conducted in early 2017. The first in a series of exercises will commence in early 2016 and form part of a multiagency exercise lead by the New Zealand Fire Service. The key internal testing elements will be: o Notification and activation of the Incident Management Team. o Effectiveness of the Incident Management Team to include:
‐ Leadership ‐ Decision making ‐ Cohesion ‐ Communication
o Testing of our Mass Casualty Plan. o Stakeholder interaction/agreements.
7.4 Family Violence Intervention Programme (FVIP) The Family Violence Intervention Programme’s Strategic Plan has been revised and will be published early in 2016 for the 2015 – 2018 period. It has five priority areas: To improve the health professional workforce’s ability to work effectively with Whanau
Maori, Pasifika and ethnic minorities, when working with family violence.
To have an informed health professional workforce across our district who are skilled in identifying and responding to both actual and potential family violence.
To respond to situations of family violence by working in partnership to co-ordinate consistent and timely actions, by utilising process, system and pathways to prevent injury and other harm.
Implementation of policy, processes and support systems to enhance staff’s response to family violence and increase support to staff.
Implement a consistent Family Violence Intervention Programme model for delivery across primary health care and community settings.
These priorities align with the Children’s Action Plan, the action plan from the annual audit of the programme and the new service specifications. Family Violence Intervention training days continue to be offered 10 times per year and have greatly increased the awareness of the serious impact family violence has on people’s health with nearly 800 staff attending to date. Staff are taught to routinely screen for family violence, identify possible child abuse or neglect and provide support and relevant referrals. There are ongoing projects within services to further improve screening rates, including refresher training and changes to documentation. Revised service specifications and a contract for the three years commencing July 2015 were received in mid June. The focus of the service specifications remains on ensuring the Children’s Action Plan is fully implemented and also planning for implementing violence intervention programmes in primary care. 7.4.1 Snapshot Audit The MoH requested a second snapshot audit for the period from 1 April-30 June 2015 with 125 files audited across specified services. These services included the Emergency Department, Women’s Health (post natal maternity), Child Health and Sexual Health. Next year the Mental Health and Addictions Service will also be included. This snapshot audit will be an ongoing requirement every year. We are also required to develop and progress at least two “plan, do, study, act” (PDSA) cycles to improve screening or disclosure rates where audit results require
61
Page 42
improvement. The two that we have developed focus on improving disclosure rates in post natal maternity and in children’s ward to facilitate screening beginning. Child Injury and Intimate Partner Violence-Emergency Department Dedicated child triage clipboards were implemented at triage in February 2015. A spot audit was completed a week after this and found a marked improvement from 56 per cent to 68 per cent. A further audit in May continued to show the effectiveness of these clipboards with the result up to 79 per cent. The rate for the recent snapshot audit is 76 per cent, this is an excellent rate when compared to the national average of 23 per cent. The audit included screening for intimate partner violence in ED and the screening rate was 68 per cent, again an excellent result in an area where screening can be particularly difficult to achieve. Women’s Health
Women’s Health post natal inpatient screening has improved significantly from the first snapshot result of 16 per cent with the most recent audit indicating 77 per cent achieved. We are now moving to using the family violence screening documentation in the Maternity Clinical Information System electronic notes. We have put forward requested changes of the system to the National Change Reference Group (CRG) to ensure all essential data is captured. Child Health
The snapshot audit results for the Child Health inpatient ward continue to show no screening of female carers is being undertaken. Child Health will begin screening in early 2016. Six additional training sessions were held dedicated to this service to enable all nursing staff to attend. The documentation process is also being reviewed to ensure consistent comprehensive information is captured and that it is noted in an easily identifiable place in the clinical record. All staff in the Neonatal Unit are trained and they screen appropriately. Sexual Health
The snapshot audit was new for this service however they continue to consistently screen both men and women for family violence. The rate for the snapshot was 76 per cent with a 53 per cent disclosure rate. 7.4.2 Auckland University of Technology (AUT) Audit Each year AUT is contracted by the MoH to complete an audit of the FVI programme, across nine domains for both partner abuse and child abuse and neglect. The final results gave scores of 98 per cent for partner abuse and 96 per cent for child abuse and neglect, which is a slight increase for both scores on the previous audit from 2014. 7.4.3 Refreshed Guidelines for FVI programme The Family Violence Assessment and Intervention Guidelines - Child Abuse and Intimate Partner Violence, were first published in 2002 and have for the first time been refreshed by the MoH. These are due for release in early 2016. The revision includes incorporating up to date material around child protection and strangulation, changes in the screening questions asked and the level of response expected from staff. Additional training will be needed to inform staff of these changes and policy documents will also be modified.
62
Page 43
7.5 Occupational Health and Safety 7.5.1 Health and Safety Statement A revised health and safety statement has recently been developed and following consultation and feedback from both operational groups and union partners, has been accepted and will be submitted to the Board in late February 2016 for approval. Using the Clinical Governance and Quality Improvement Framework, which staff are already familiar with, the statement demonstrates health and safety responsibilities and the organisation’s commitment to the health and safety of all who work on our sites. A copy of the statement is attached as appendix 4. 7.5.2 Health and Safety Legislation
The Health and Safety at Work Act 2015 comes into force on 4 April 2016. The Act and its associated regulations have a clear focus on staff education and staff engagement. Occupational Health and Safety have a number of activities underway to ensure organisational compliance is achieved which includes a review of Health and Safety (H&S) representative training, hazard management and dedicated time for H&S representatives to actively carry out their roles. H&S Representative Training
Historically our H&S representatives have received a four hour ‘in house’ training on their role and on hazard management. Under the new regulations H&S representatives will have to sit and achieve a New Zealand Qualifications Authority (NZQA) unit standard before being considered ‘trained’. To ensure organisational compliance discussion is underway with the Combined Trade Unions (CTU) about providing a one day transition training programme and assessment for our existing H&S representatives commencing early in 2016. Hazard Management
The Health and Safety at Work Act 2015 requires that all hazards are assessed and all ‘reasonably practicable steps’ are taken to control the impact on workers. At present the organisation uses a paper based hazard management process and workplace inspection check list. In early 2016 a new electronic hazard management system will be introduced as part of our current electronic incident module. This will enable reporting and recording of hazards, which can then be risk assessed, and for those hazards unable to be eliminated ongoing monitoring of the risk can be established. Training to use this system for both H&S representatives and their workplace leaders is planned to commence in February 2016. It is anticipated that as a result of the training and ongoing activities there will be increased health and safety focus at the ward/ service level. Dedicated time for H & S Representatives
Dedicated time for nominated H&S representatives from all areas is currently being identified. There will be variation of time required from no specific time required as it is covered within the requirements of a particular role or up to 3-4 hours per month depending on the hazards and number of staff in a particular area. Dedicated time will enable the H&S representatives to be actively engaged with activities relating to health and safety such as workplace inspections, using the electronic hazard management system, induction of new staff, and attending area health and safety committee meetings. This will assist in fostering positive health and safety management practices, and support and champion H&S at ward/area level. 7.5.3 Patient Manual Handling Following the successful reinvigoration of the O’Shea No Lift Programme the working party is continuing in an oversight and monitoring role. The purpose will be to monitor the three main components of the programme which are; staff competency, compliance and equipment. In addition to new clinical staff attending No Lift training at orientation, 28 additional trainer/
63
Page 44
champions have completed additional training to champion no lift at ward/area level and quarterly trainer education sessions for current trainer/champions have been delivered this year to support the programme. New equipment purchased this year includes four new air assisted transfer devices and two new replacement hoists to assist with safe patient transfers. 7.5.4 Bariatric Patient Management There is an increasing need for the management of the bariatric patient group, with greater numbers of these patients being admitted to inpatient settings. An organisation wide working party is in progress to develop a bariatric patient management pathway which covers from admission through to discharge. This project is being lead by nursing with representation from other areas including Occupational Health and Safety. The table below indicates the numbers of staff injuries relating to the management of this patient group and the associated costs. Table 2 – Staff Injuries Associated with Bariatric Patient Handling Year Staff related injuries Injury costs 2013/14 4 $20,397 2014/15 8 $39,823 2015/16 (6 months) 5 $8,478 7.5.5 Chemical Material Safety Data Sheets Purchase of an electronic Chemical Management system, that supports the management of Chemical Material Safety Data Sheets (MSDS), has recently been completed. Work is now underway to establish the system whereby all users will have simple electronic access to safety data sheets for all non pharmaceutical chemicals. Access will include all onsite contractors e.g. Spotless, Medlab and Fleetwise. The advantages are that the information will be up to date and areas do not have to hold hard copies of each MSDS. The programme will be monitored and managed by Materials Management. 8. BEING WILLING AND ABLE TO LEARN 8.1 Central Region Quality and Safety Alliance The Central Region Quality and Safety Alliance (CRQSA) was established in mid 2014 and reports to the Regional Executive Committee. The key purpose of CRQSA is to: Make recommendations on regional quality and safety strategies and plans to the Regional
Executive Committee.
Share information that supports a regional perspective on quality and safety.
Act strategically and act as a link for national quality and safety programmes for the central region.
The Alliance meets every six weeks alternating face to face meetings and teleconference calls. The focus of the work programme is to complete the actions from the Quality and Safety section of the 2015/16 Regional Services Plan (RSP) and contribute to planning for this section of the RSP for 2016/17. Other areas of focus have included: National Survey Care Indicators completed across the central region. Developing regional reporting of the Quality and Safety Markers with HQSC. Strengthening partnerships with quality and risk managers between DHBs and PHOs. Exploring options to strengthen and share clinical audit process and outcomes.
64
Page 45
Considering common corrective actions from certification audit. Stocktake of Collaborative Clinical Pathways. Atlas of HealthCare Variation presented by HQSC. Connected Health Care presentation and consideration. 8.2 Integrated Quality Team The Central PHO and MCH quality teams are working together in an ongoing manner to ensure that our partnership contributes to improved outcomes. The team’s objective is to have a shared approach to quality and safety across primary and secondary care. The team continues to meet every six weeks. A work programme is in place with a further plan to be developed for 2016/17. The focus of the work plan is on three key areas: Shared continuing professional development with an initial focus on quality improvement
and patient safety related programmes.
Integration of Riskman to align analysis and reporting of data to strengthen improvement and learning opportunities.
Shared communication to include shared policies, shared learning process and shared patient stories.
8.3 Spiritual Support 8.3.1 Addressing Spiritual Care in a Cancer Treatment Ward: a quality
improvement project Although there has been a steady growth of cross-disciplinary peer reviewed publications showing the value, importance and contribution of spirituality in health, evidence shows that the spiritual needs of patients are sometimes under recognised in contrast to their more physical needs. To begin addressing these needs, a quality improvement initiative was undertaken in Ward 23, part of the Regional Cancer Treatment Service. From November 2014-January 2015, all new admissions were asked four simple questions about meaning and purpose, based on a validated spiritual assessment tool developed by Dr Christina Puchalski. Key findings from the project were that 65 per cent of the patients, (71 respondents) considered themselves to be in some way spiritual and or religious, with 45 of those indicating that family and friends were the most important for them in adjusting to their illness. The importance of family and friends is consistent with the work of Professor Elizabeth MacKinlay when she identified relationships as one of the doorways to ultimate meaning. Although 81 per cent of staff were initially confident about engaging with patients around spirituality many of them found the process challenging. Difficulties with language, role definition, time and knowledge, along with patient perceptions about chaplaincy were identified as barriers and complicated the project. The project raised the profile of the chaplaincy team and the issue of spirituality. It demonstrated the need for an ongoing and systematic development of a process similar to that piloted in the ward so that all people have equity of access to spiritual care. In addition, the project highlighted the potential of the chaplain to act as a ‘specialist’ in spiritual care within the multi-disciplinary team and the limitations of the often isolating traditional model. Furthermore, the project enabled the chaplain to work as a change agent and educator with a multi-disciplinary team to champion a more systematised/collaborative approach in the area of spiritual care.
65
Page 46
Recommendations that are being considered by the Spiritual Care Advisory Group are to: Develop organisational commitment to and policy around spiritual care.
Identify necessary procedures to have policy implemented.
The need for spiritual care competency education as part of professional development.
Strengthen the process for spiritual screening/assessment and appropriate referrals.
Develop guidelines for greater integration of chaplaincy role into the multi-disciplinary teams including the ability to document in patients’ clinical notes.
Undertake further research into identifying patient needs in terms of spiritual care.
Address the staff and public perceptions about spirituality in healthcare that get in the way of providing spiritual care in a modern healthcare environment.
8.3.2 Spiritual Care Advisory Group (SCAG) As a result of the work already in progress here, on broadening out the concept of spirituality, the Interchurch Council for Hospital Chaplaincy (ICHC), the direct employer of chaplains, are partnering with us in the development of a Spiritual Care Advisory Group to:
Improve the level and quality of spiritual care for patients, family/whanau and staff.
Add value to the existing chaplaincy service.
Develop new ways of working collaboratively to meet changing conditions. Overall the purpose of the group is to ensure spirituality becomes an integral part of healthcare in our organisation. This will involve: Ensuring spiritual care is developed and integrated across our sites.
Advising the chaplaincy team about needs and priorities to be incorporated into a strategic work plan.
Acting as champions for initiatives relating to spiritual care and the work of the chaplaincy team.
Supporting the chaplaincy team during a change and development phase in consultation with ICHC and its Local Service Provider Committee (LSP).
Members of the SCAG are drawn from across the multi-disciplinary spectrum including, nursing, Maori health, palliative care, medicine, pain service, public health, social work, psychology, chaplaincy and community care. During 2015 the SCAG met regularly to familiarise themselves with the literature and joint experience around spiritual care in healthcare settings. This included three facilitated workshops to help settle on priorities. A small project group was formed to be part of the Health Quality and Safety Commission’s Partners in Care project. They are working on engaging with refugee communities on needs at end of life. A work plan is now being considered for 2016. Priorities include the recommendations from the Ward 23 project (see above) and also to: Collaborate with the Regional Lead Cancer Clinical Psychologist as the universal screening
tool is developed.
Trial chaplain involvement in selected multi-disciplinary teams, e.g. palliative care, elder health as a formal action research, quality improvement initiative.
Prioritise particular groupings for spiritual care co-design, in particular Maori, no particular religious tradition, Roman Catholic and other existing faith traditions that have particular needs.
66
Page 47
Ensure chapel space is upgraded to offer sanctuary for all patients, families and whanau and is flexible enough to accommodate individual reflection and life transition gatherings.
Fostering implementation of the new Palliative Care Bereavement Support Guidelines and Toolkit.
8.4 Clinical Library Initiative The Clinical Library has introduced a leisure reading collection for staff. This has been a healthy staff initiative driven by the library to promote relaxation which is an essential component of a healthy lifestyle. There are a number of physical activities promoted within the organisation for staff to support stress reduction and healthy lifestyle choices. Recreational reading also supports stress reduction and can easily be done during a tea or meal break. The library called for donations of books from staff and was rewarded with a large, and still growing, selection of books. Some spare shelving was utilised to create a space adjacent to the library’s lounge area. As well as giving staff the opportunity to pick up some recreational reading, the library also hopes that it will build awareness of the other resources and services available from the library for which the primary focus is the support of professional and educational needs. The leisure reading collection was officially launched on 30 November 2015 with a pleasing amount of interest from staff. 9. CONCLUSION Work against the Annual Plan (AP) initiatives for 2015/16 has progressed well with no areas of concern. All of the programmes that have to date been part of the Open for Better Care campaign and also result in Quality and Safety Markers are continuing longer term given there are still improvements to be made with these and they are in line with the long term focus for HQSC. Where ongoing improvement is required improvement plans are in place. The implementation of the final module of Riskman is underway and will be fully implemented by May 2016. This will see the culmination of three year’s work and will enable some sharing of information and comparative work to be developed. Opportunities to align more closely with Whanganui DHB are ongoing. Proactive work to address the corrective actions from the November 2015 audit is in progress and will lead into the next full audit in approximately May 2017. Wherever possible this work has been aligned to other work and progressed as overall improvement plans. Building our capacity and capability for emergency management remains high on our priorities to ensure that we are able to respond in a timely and appropriate way to any event that may occur. Particular attention will continue to be paid to proactive management of complaints to ensure that communication with patients and families is positive and constructive. There will also be a greater focus on the six reported incident categories to ensure that improvement plans are in place and implemented.
67
Page 48
Building our capacity, capability and clinical leadership in quality will be a high priority for 2016 with the support of HQSC providing ongoing resource, sponsorship and educational sessions.
Muriel Hancock Director Patient Safety and Clinical Effectiveness Attachments: Appendix 1: 2015/16 DAP Initiatives – Patient Safety & Clinical Effectiveness
Appendix 2: Draft Corrective Actions from Surveillance Audit
Appendix 3: Quality and Safety Marker Results – July to September 2015
Appendix 4: Health and Safety Statement
68
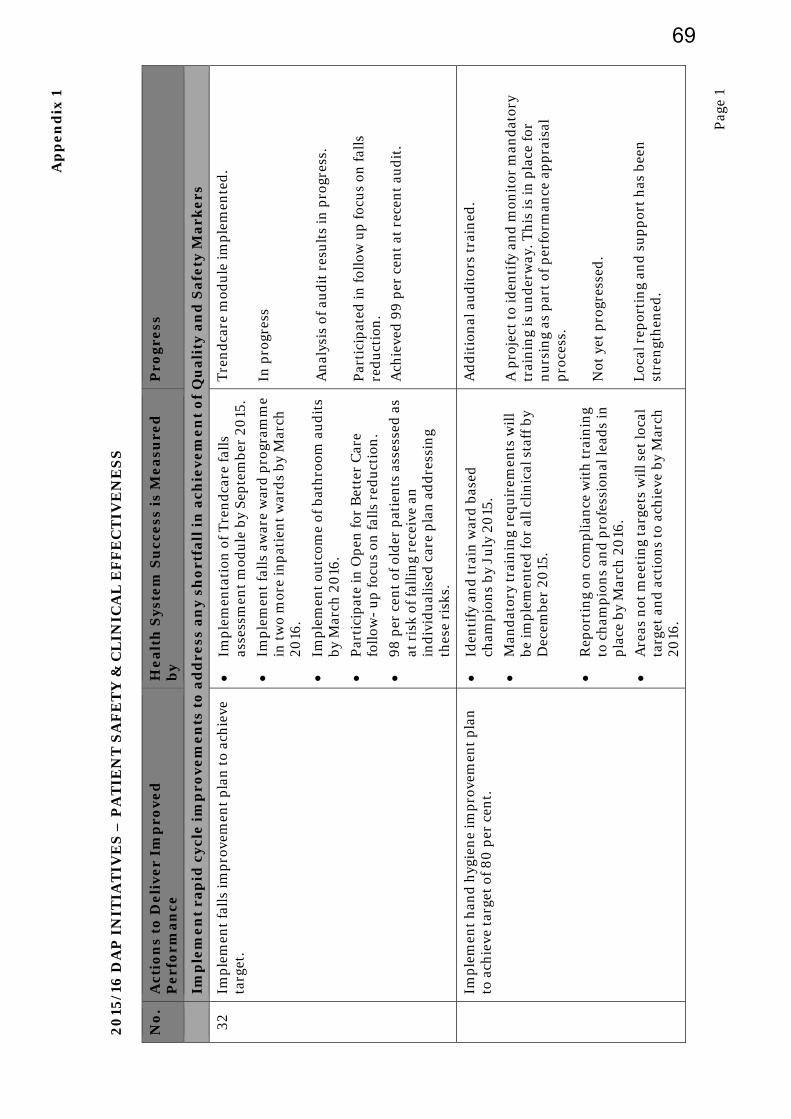
Ap
pe
nd
ix 1
Pag
e 1
20
15/1
6 D
AP
IN
ITIA
TIV
ES
– P
AT
IEN
T S
AF
ET
Y &
CL
INIC
AL
EF
FE
CT
IVE
NE
SS
N
o.
Act
ion
s to
De
liv
er
Imp
rov
ed
P
erf
orm
an
ce
He
alt
h S
yste
m S
ucc
ess
is
Me
asu
red
b
y P
rog
ress
Im
ple
me
nt
rap
id c
ycle
im
pro
ve
me
nts
to
ad
dre
ss a
ny
sh
ort
fall
in
ach
ieve
me
nt
of
Qu
ali
ty a
nd
Sa
fety
Ma
rke
rs
32
Imp
lem
ent
fall
s im
pro
vem
ent
pla
n t
o ac
hie
ve
targ
et.
Im
ple
men
tati
on o
f T
ren
dca
re f
alls
as
sess
men
t m
odu
le b
y S
epte
mbe
r 20
15.
Im
ple
men
t fa
lls
awar
e w
ard
pro
gram
me
in t
wo
mor
e in
pat
ien
t w
ard
s by
Mar
ch
2016
.
Im
ple
men
t ou
tcom
e of
bat
hro
om a
ud
its
by M
arch
20
16.
P
arti
cip
ate
in O
pen
for
Bet
ter
Car
e fo
llow
- u
p fo
cus
on fa
lls
red
uct
ion
.
98
per
cen
t of
old
er p
atie
nts
ass
esse
d a
s at
ris
k of
fall
ing
rece
ive
an
ind
ivid
ual
ised
car
e p
lan
ad
dre
ssin
g th
ese
risk
s.
Tre
nd
care
mod
ule
imp
lem
ente
d.
In p
rogr
ess
An
alys
is o
f au
dit
res
ult
s in
pro
gres
s.
Par
tici
pat
ed in
foll
ow u
p fo
cus
on fa
lls
red
uct
ion
. A
chie
ved
99
per
cen
t at
rec
ent
aud
it.
Im
ple
men
t h
and
hyg
ien
e im
pro
vem
ent
pla
n
to a
chie
ve t
arge
t of
80
per
cen
t.
Id
enti
fy a
nd
tra
in w
ard
bas
ed
cham
pio
ns
by J
uly
20
15.
M
and
ator
y tr
ain
ing
requ
irem
ents
wil
l be
imp
lem
ente
d f
or a
ll c
lin
ical
sta
ff b
y D
ecem
ber
2015
.
R
epor
tin
g on
com
pli
ance
wit
h t
rain
ing
to c
ham
pio
ns
and
pro
fess
ion
al le
ads
in
pla
ce b
y M
arch
20
16.
A
reas
not
mee
tin
g ta
rget
s w
ill s
et lo
cal
targ
et a
nd
act
ion
s to
ach
ieve
by
Mar
ch
2016
.
Ad
dit
ion
al a
ud
itor
s tr
ain
ed.
A p
roje
ct t
o id
enti
fy a
nd
mon
itor
man
dat
ory
trai
nin
g is
un
der
way
. Th
is is
in p
lace
for
nu
rsin
g as
par
t of
per
form
ance
ap
pra
isal
p
roce
ss.
Not
yet
pro
gres
sed
. L
ocal
rep
orti
ng
and
su
pp
ort
has
bee
n
stre
ngt
hen
ed.
69
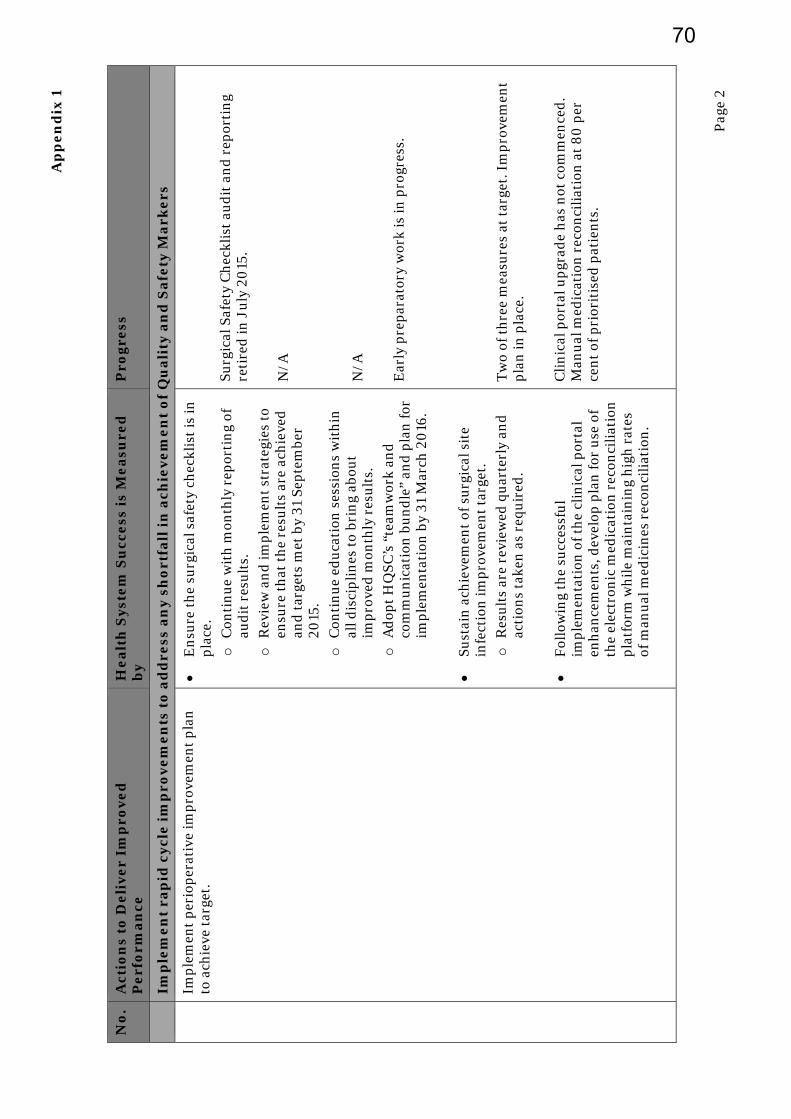
Ap
pe
nd
ix 1
Pag
e 2
No
. A
ctio
ns
to D
eli
ve
r Im
pro
ve
d
Pe
rfo
rma
nce
H
ea
lth
Sys
tem
Su
cce
ss i
s M
ea
sure
d
by
Pro
gre
ss
Im
ple
me
nt
rap
id c
ycle
im
pro
ve
me
nts
to
ad
dre
ss a
ny
sh
ort
fall
in
ach
ieve
me
nt
of
Qu
ali
ty a
nd
Sa
fety
Ma
rke
rs
Im
ple
men
t p
erio
per
ativ
e im
pro
vem
ent
pla
n
to a
chie
ve t
arge
t.
E
nsu
re t
he
surg
ical
saf
ety
chec
klis
t is
in
pla
ce.
o
Con
tin
ue
wit
h m
onth
ly r
epor
tin
g of
au
dit
res
ult
s.
o
Rev
iew
an
d im
ple
men
t st
rate
gies
to
ensu
re t
hat
th
e re
sult
s ar
e ac
hie
ved
an
d t
arge
ts m
et b
y 31
Sep
tem
ber
2015
. o
C
onti
nu
e ed
uca
tion
ses
sion
s w
ith
in
all d
isci
pli
nes
to
brin
g ab
out
imp
rove
d m
onth
ly r
esu
lts.
o
A
dop
t H
QS
C’s
“te
amw
ork
and
co
mm
un
icat
ion
bu
nd
le”
and
pla
n fo
r im
ple
men
tati
on b
y 31
Mar
ch 2
016
.
Su
stai
n a
chie
vem
ent
of s
urg
ical
sit
e in
fect
ion
imp
rove
men
t ta
rget
. o
R
esu
lts
are
revi
ewed
qu
arte
rly
and
ac
tion
s ta
ken
as
requ
ired
.
F
ollo
win
g th
e su
cces
sfu
l im
ple
men
tati
on o
f th
e cl
inic
al p
orta
l en
han
cem
ents
, dev
elop
pla
n fo
r u
se o
f th
e el
ectr
onic
med
icat
ion
rec
onci
liat
ion
p
latf
orm
wh
ile
mai
nta
inin
g h
igh
rat
es
of m
anu
al m
edic
ines
rec
onci
liat
ion
.
Surg
ical
Saf
ety
Ch
eckl
ist
aud
it a
nd
rep
orti
ng
reti
red
in J
uly
20
15.
N/A
N
/A
Ear
ly p
rep
arat
ory
wor
k is
in p
rogr
ess.
T
wo
of t
hre
e m
easu
res
at t
arge
t. I
mp
rove
men
t p
lan
in p
lace
. C
lin
ical
por
tal u
pgr
ade
has
not
com
men
ced
. M
anu
al m
edic
atio
n r
econ
cili
atio
n a
t 8
0 p
er
cen
t of
pri
orit
ised
pat
ien
ts.
70
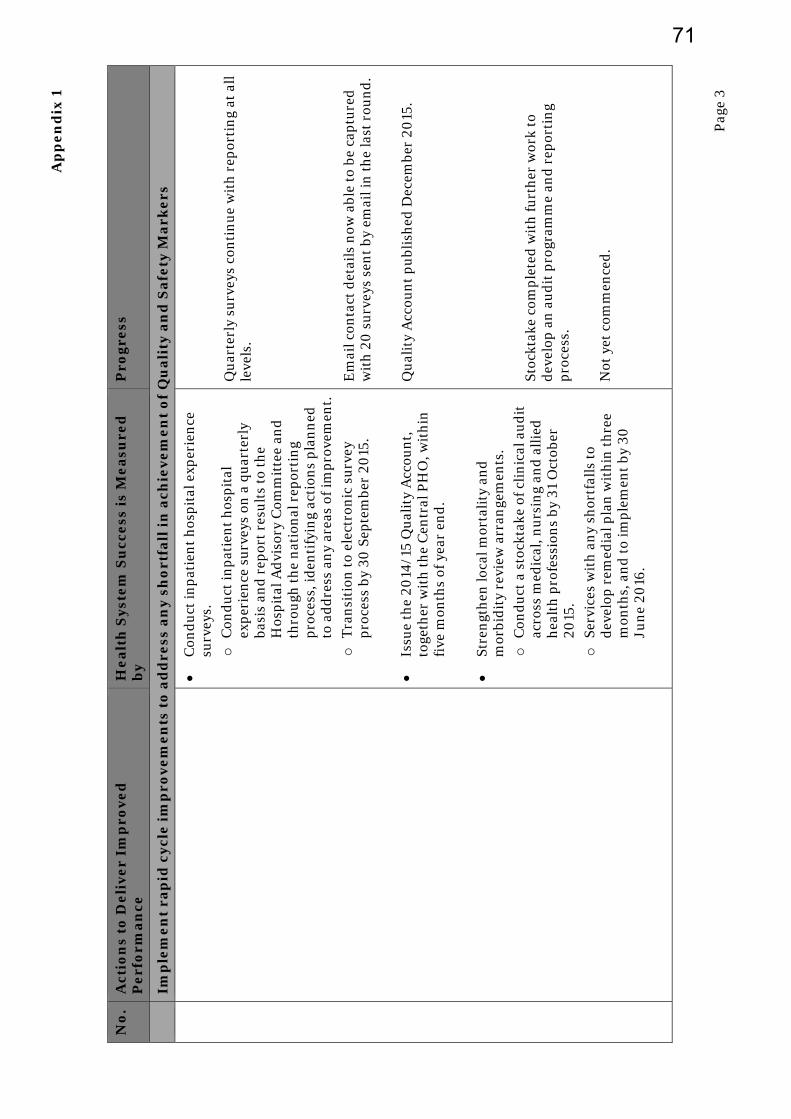
Ap
pe
nd
ix 1
Pag
e 3
No
. A
ctio
ns
to D
eli
ve
r Im
pro
ve
d
Pe
rfo
rma
nce
H
ea
lth
Sys
tem
Su
cce
ss i
s M
ea
sure
d
by
Pro
gre
ss
Im
ple
me
nt
rap
id c
ycle
im
pro
ve
me
nts
to
ad
dre
ss a
ny
sh
ort
fall
in
ach
ieve
me
nt
of
Qu
ali
ty a
nd
Sa
fety
Ma
rke
rs
C
ond
uct
inp
atie
nt
hos
pit
al e
xper
ien
ce
surv
eys.
o
C
ond
uct
inp
atie
nt
hos
pit
al
exp
erie
nce
su
rvey
s on
a q
uar
terl
y ba
sis
and
rep
ort
resu
lts
to t
he
Hos
pit
al A
dvi
sory
Com
mit
tee
and
th
rou
gh t
he
nat
ion
al r
epor
tin
g p
roce
ss, i
den
tify
ing
acti
ons
pla
nn
ed
to a
dd
ress
an
y ar
eas
of im
pro
vem
ent.
o
T
ran
siti
on t
o el
ectr
onic
su
rvey
p
roce
ss b
y 30
Sep
tem
ber
2015
.
Is
sue
the
2014
/15
Qu
alit
y A
ccou
nt,
to
geth
er w
ith
th
e C
entr
al P
HO
, wit
hin
fi
ve m
onth
s of
yea
r en
d.
St
ren
gth
en lo
cal m
orta
lity
an
d
mor
bid
ity
revi
ew a
rran
gem
ents
. o
C
ond
uct
a s
tock
take
of c
lin
ical
au
dit
ac
ross
med
ical
, nu
rsin
g an
d a
llie
d
hea
lth
pro
fess
ion
s by
31
Oct
ober
20
15.
o
Serv
ices
wit
h a
ny
shor
tfal
ls t
o d
evel
op r
emed
ial p
lan
wit
hin
th
ree
mon
ths,
an
d t
o im
ple
men
t by
30
Ju
ne
2016
.
Qu
arte
rly
surv
eys
con
tin
ue
wit
h r
epor
tin
g at
all
le
vels
. E
mai
l con
tact
det
ails
now
abl
e to
be
cap
ture
d
wit
h 2
0 s
urv
eys
sen
t by
em
ail i
n t
he
last
rou
nd
. Q
ual
ity
Acc
oun
t p
ubl
ish
ed D
ecem
ber
2015
. St
ockt
ake
com
ple
ted
wit
h fu
rth
er w
ork
to
dev
elop
an
au
dit
pro
gram
me
and
rep
orti
ng
pro
cess
. N
ot y
et c
omm
ence
d.
71

Ap
pe
nd
ix 1
Pag
e 4
No
. A
ctio
ns
to D
eli
ve
r Im
pro
ve
d
Pe
rfo
rma
nce
H
ea
lth
Sys
tem
Su
cce
ss i
s M
ea
sure
d
by
Pro
gre
ss
Im
ple
me
nt
rap
id c
ycle
im
pro
ve
me
nts
to
ad
dre
ss a
ny
sh
ort
fall
in
ach
ieve
me
nt
of
Qu
ali
ty a
nd
Sa
fety
Ma
rke
rs
38
Q
ual
ity
mod
ule
of R
iskm
an im
ple
men
ted
w
ith
in b
oth
Mid
Cen
tral
Hea
lth
an
d t
he
Cen
tral
PH
O b
y 30
Dec
embe
r 20
15.
T
oget
her
wit
h t
he
Cen
tral
PH
O, i
den
tify
a
dis
tric
t-w
ide
accr
edit
atio
n s
yste
m a
nd
as
soci
ated
res
ourc
es b
y 31
Mar
ch 2
016
.
o
Scop
e re
quir
emen
ts f
or c
ust
omis
atio
n
by S
epte
mbe
r 20
15.
o
Cu
stom
ise
and
imp
lem
ent
by
Dec
embe
r 20
15.
o
Dev
elop
an
d d
eliv
er t
rain
ing
by
Dec
embe
r 20
15.
o
Dev
elop
rep
orti
ng
requ
irem
ents
by
Mar
ch 2
016
.
Com
ple
ted
In
pro
gres
s D
elay
ed u
nti
l Mar
ch 2
016
D
elay
ed u
nti
l May
20
16
Tra
inin
g fo
r N
ew Z
eala
nd
Bu
sin
ess
Exc
elle
nce
co
mp
lete
d
Dis
tric
t-w
ide
qual
ity
and
saf
ety
wor
k p
rogr
amm
e d
evel
oped
an
d im
ple
men
ted
.
o
Inte
grat
ed e
du
cati
on a
nd
pro
fess
ion
al
dev
elop
men
t, in
clu
din
g P
lan
, Do
Stu
dy,
A
ct, f
or q
ual
ity
imp
rove
men
t in
pla
ce
by D
ecem
ber
2015
. o
T
en s
har
ed p
olic
ies
fin
alis
ed b
y M
arch
20
16.
o
Shar
ed le
arn
ing
from
feed
back
an
d
adve
rse
even
ts im
ple
men
ted
by
Oct
ober
20
15.
Dev
elop
men
t of
th
is a
pp
roac
h c
onti
nu
es w
ith
P
DSA
use
d m
ore
rou
tin
ely,
e.g
. Par
tner
s in
C
are
and
Op
ioid
Col
labo
rati
ve.
Pol
icy
alig
nm
ent
in p
rogr
ess.
Sh
arep
oin
t in
pla
ce.
72

Ap
pe
nd
ix 2
DAA Group Lim
ited
MidCen
tral District Health Board
Page 1
MidCentral District Health Board
Draft Corrective Action Requests (CAR)
ODSCRS= Operations Director Specialist Regional and Community Services
SDMHA= Service Director Mental H
ealth and Addictions Service
ODHS= Operations Director Hospital Services
DON= Director of Nursing
CMO= Chief Medical Officer
DPSCE=
Director Patient Safety and Clin
ical Effectiveness
MHROD= M
anager Human
Resources and Organ
isational Development
RMD= Regional M
idwifery Director
GMCST= General M
anager Clin
ical Services an
d Transform
ation
GMCS= Group M
anager Commercial Support
Rating
Certification Findings November 2015
Owner
Timefram
e
Evidence to be Provided
PA
Low
The stan
dard re
quire
s: The
service respects th
e ph
ysical, visu
al, aud
itory, and
persona
l privacy of th
e consum
er and
their b
elon
ging
s at a
ll tim
es.
Certification Finding – November 2015
As iden
tified
in the previous audit, the area in the pharmacy that has been
designated
for private conversations with patients is insufficient for this purpose. It is
cram
ped and not always available when req
uired
.
In W
ard 21, the m
ental health unit, patient privacy is still often
compromised
as a
result of the environmen
t in the High Needs Unit and seclusion rooms. In
the Star 1
ward the facilities also do not promote an environmen
t conducive to privacy for
patients and fam
ilies.
Progress Update
ODSCRS
SDMHA
180 days
Ded
icated
space will be
available for pharmacy by
July 2017.
Glazing will be upgraded
.
Options paper for facility
changes will be provided
.
73
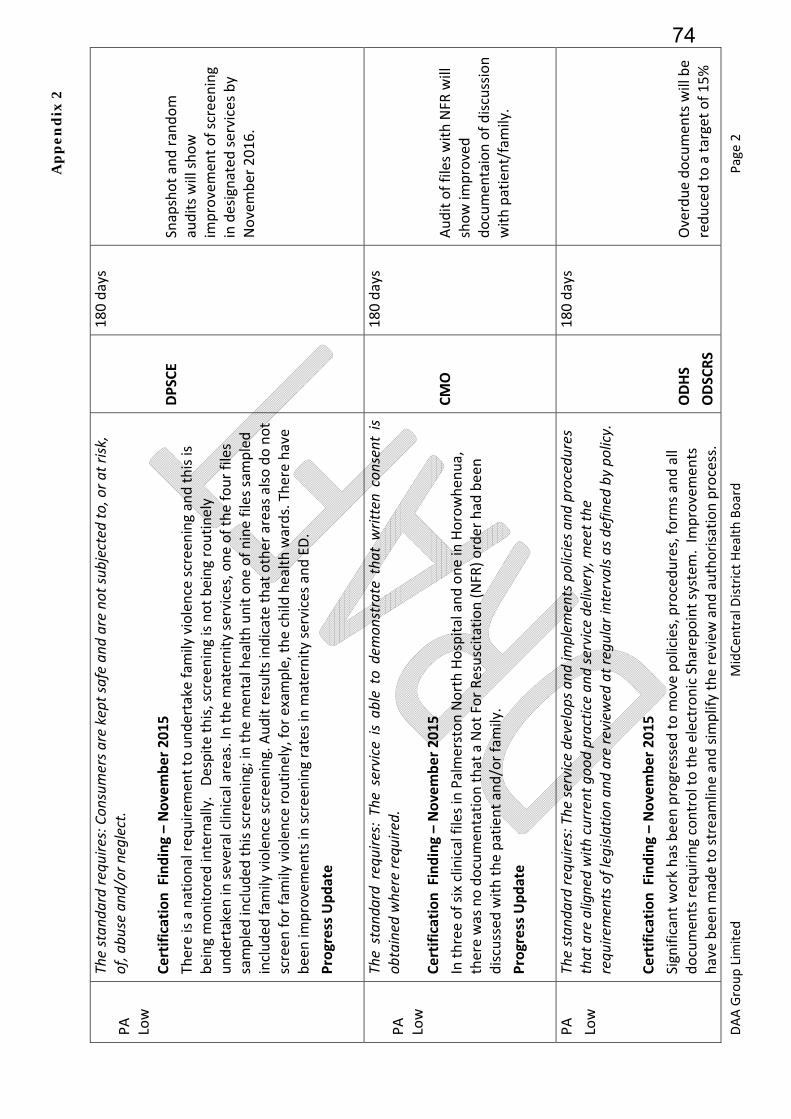
Ap
pe
nd
ix 2
DAA Group Lim
ited
MidCen
tral District Health Board
Page 2
PA
Low
The stan
dard re
quire
s: Con
sumers a
re kept safe an
d are no
t sub
jected
to, or a
t risk
, of, abu
se and
/or n
eglect.
Certification Finding – November 2015
There is a national req
uirem
ent to undertake fam
ily violence screening and this is
being monitored internally. Despite this, screening is not being routinely
undertaken in several clinical areas. In the m
aternity services, one of the four files
sampled included
this screening; in
the m
ental health unit one of nine files sampled
included
fam
ily violence screening. Audit results indicate that other areas also do not
screen
for family violence routinely, for exam
ple, the child
health wards. There have
been im
provemen
ts in
screening rates in m
aternity services and ED.
Progress Update
DPSCE
180 days
Snapshot and random
audits will show
improvemen
t of screen
ing
in designated
services by
November 2016.
PA
Low
The stan
dard requires: The
service is ab
le to demon
strate tha
t written consent is
obtained
where re
quire
d.
Certification Finding – November 2015
In three of six clinical files in Palmerston North Hospital and one in
Horowhen
ua,
there was no documen
tation that a Not For Resuscitation (NFR) order had
been
discussed
with the patient and/or family.
Progress Update
CMO
180 days
Audit of files with NFR
will
show im
proved
documen
taion of discussion
with patient/family.
PA
Low
The stan
dard re
quire
s: The
service develops and
implem
ents policies a
nd procedu
res
that are aligned with
current goo
d practice an
d service delivery, m
eet the
requ
irements of legislation an
d are review
ed at regular intervals a
s defined
by po
licy.
Certification Finding – November 2015
Significant work has been progressed to m
ove policies, procedures, form
s and all
documen
ts req
uiring control to the electronic Sharep
oint system
. Im
provemen
ts
have been m
ade to streamline and sim
plify the review
and authorisation process.
ODHS
ODSCRS
180 days
Overdue documen
ts will be
reduced to a target of 15%
74

Ap
pe
nd
ix 2
DAA Group Lim
ited
MidCen
tral District Health Board
Page 3
The numbers of overdue policies continue to red
uce with 26% now overdue. 10% ‐
15% of med
ication related policies are out of date. Progress is regularly reported and
monitored through
the Clinical Board.
They area of focus now needs to be in
the clinical areas where there remains a
number of paper versions of policy manuals; these are not being kept up to date,
with some policies review
ed being last updated
in 2006 ‐ 2007. These m
anuals are
being used to greater and lesser degrees (eg, m
ost of the tim
e in
child
health, and
rarely, if ever, in ward 25). G
iven
these documen
ts are still available, this poses a risk
that out of date policies may be used.
Progress Update
SDMHS
DPSCE
by May 2017.
Four random audits of 6
clinical areas will show no
out of date hard copy
documen
ts in
use by
November 2016.
PA
Low
The stan
dard re
quire
s: A sy
stem
to identify, plan, fa
cilitate an
d record ong
oing
education for service providers to
provide
safe and
effe
ctive services to
con
sumers.
Certification Finding – November 2015
Monitoring of completion of mandatory training requirem
ents rem
ains an
issue with
numbers completed or not completed unable to be easily established
across the
organisation. There are good examples at the clinical level w
here the charge nurse
accesses this inform
ation about their staff but there is inconsisten
t and an
organisational level view was not available. Data is available around RN and EN
‘Nurse Essential Skills’ – this ranges from 59% (legislative compliance review) to 88%
for level 4 CPR updates; and 92% for the four yearly refresher fire safety.
Likewise, completion of staff perform
ance appraisals is variable, as is the record
keep
ing and m
onitoring of this. Some areas are very good at keep
ing up to date with
staff perform
ance appraisals while others are not.
Progress Update
It is recognised
that the curren
t restraint minim
isation and safe practice training
available to staff is not based on curren
t best practice. Discussion around the best
way to address this is underway. The developmen
t of an
appropriate program
me for
MHROD
DON
180 days
A project will commen
ce in
early 2016 to determine
mandatory training at an
organisational level. The
project will consider how to
monitor the completion of
the m
andatory training
determined
.
A revised
restraint
minim
isation and safe
practice training
program
me will be
75
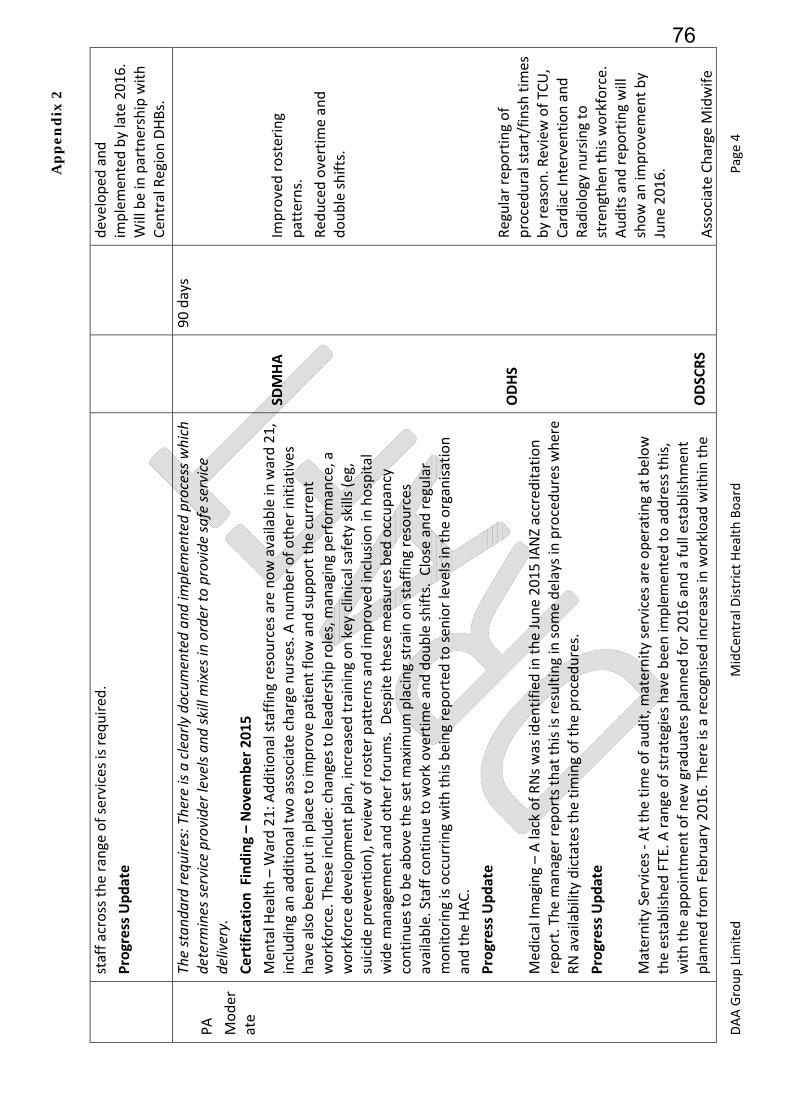
Ap
pe
nd
ix 2
DAA Group Lim
ited
MidCen
tral District Health Board
Page 4
staff across the range of services is req
uired
.
Progress Update
developed
and
implemen
ted by late 2016.
Will be in
partnership with
Cen
tral Region DHBs.
PA
Moder
ate
The stan
dard re
quire
s: There is a clearly docum
ented an
d im
plem
ented process w
hich
determ
ines se
rvice provider levels an
d skill m
ixes in order to
provide
safe se
rvice
delivery.
Certification Finding – November 2015
Men
tal H
ealth – W
ard 21: A
dditional staffing resources are now available in
ward 21,
including an
additional two associate charge nurses. A
number of other initiatives
have also been put in place to im
prove patient flow and support the curren
t workforce. These include: changes to leadership roles, m
anaging perform
ance, a
workforce developmen
t plan, increased training on key clinical safety skills (eg,
suicide prevention), review of roster patterns and im
proved inclusion in
hospital
wide m
anagem
ent and other forums. D
espite these m
easures bed
occupancy
continues to be above the set m
axim
um placing strain on staffing resources
available. Staff continue to work overtim
e and double shifts. Close and regular
monitoring is occurring with this being reported
to sen
ior levels in
the organisation
and the HAC.
Progress Update
Med
ical Im
aging – A lack of RNs was iden
tified
in the June 2015 IA
NZ accred
itation
report. The m
anager rep
orts that this is resulting in some delays in
procedures where
RN availability dictates the tim
ing of the procedures.
Progress Update
Maternity Services ‐ At the tim
e of audit, m
aternity services are operating at below
the established
FTE. A
range of strategies have been im
plemen
ted to address this,
with the appointm
ent of new
graduates planned
for 2016 and a full establishmen
t planned
from Feb
ruary 2016. There is a recognised
increase in workload
within the
SDMHA
ODHS
ODSCRS
90 days
Improved rostering
patterns.
Red
uced overtim
e and
double shifts.
Regular reporting of
procedural start/finsh tim
es
by reason. R
eview of TC
U,
Cardiac Interven
tion and
Radiology nursing to
strengthen
this workforce.
Audits and rep
orting will
show an im
provemen
t by
June 2016.
Associate Charge M
idwife
76
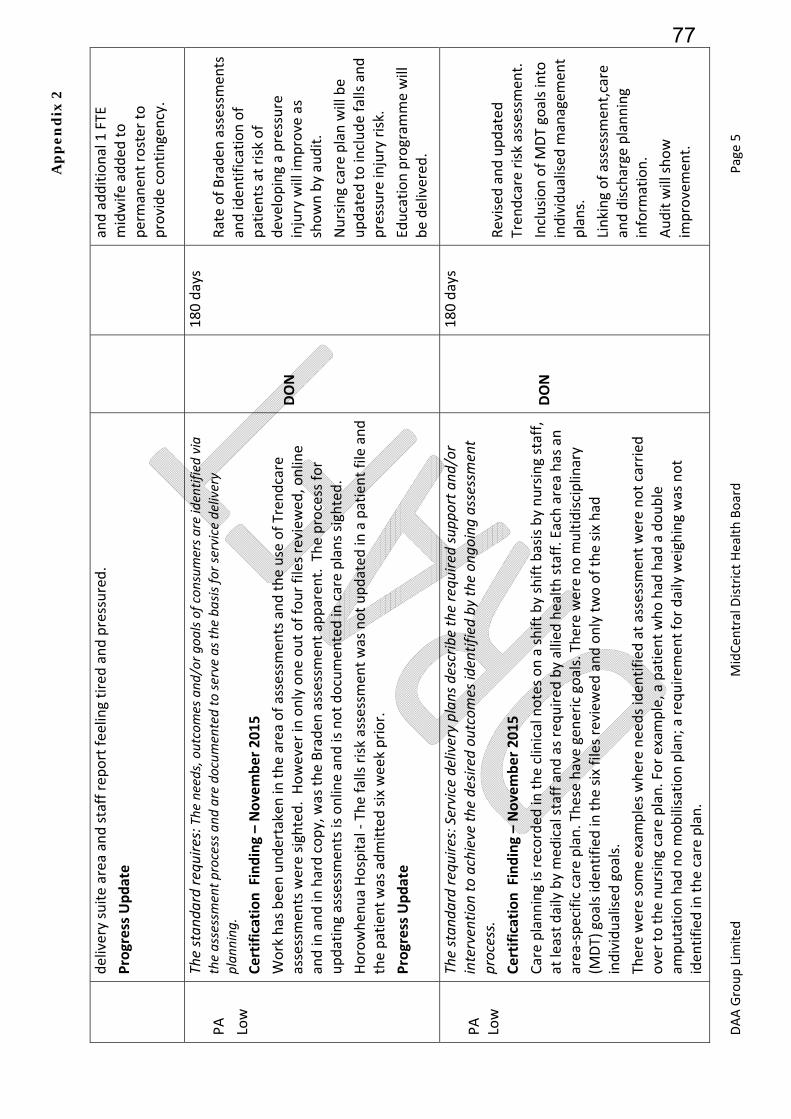
Ap
pe
nd
ix 2
DAA Group Lim
ited
MidCen
tral District Health Board
Page 5
delivery suite area and staff rep
ort feeling tired and pressured.
Progress Update
and additional 1 FTE
midwife added to
permanen
t roster to
provide contingency.
PA
Low
The stan
dard re
quire
s: The
needs, outcomes and
/or g
oals of con
sumers a
re identified via
the assessment p
rocess and
are docum
ented to se
rve as th
e ba
sis fo
r service delivery
plan
ning
. Certification Finding – November 2015
Work has been undertaken in
the area of assessmen
ts and the use of Tren
dcare
assessmen
ts were sighted. However in
only one out of four files review
ed, online
and in
and in
hard copy, was the Braden
assessm
ent apparen
t. The process for
updating assessmen
ts is online and is not documen
ted in
care plans sighted.
Horowhen
ua Hospital ‐ The falls risk assessmen
t was not updated
in a patient file and
the patient was admitted six week prior.
Progress Update
DON
180 days
Rate of Braden
assessm
ents
and iden
tification of
patients at risk of
developing a pressure
injury will im
prove as
shown by audit.
Nursing care plan will be
updated
to include falls and
pressure injury risk.
Education program
me will
be delivered
.
PA
Low
The stan
dard re
quire
s: Service delivery plan
s describe the requ
ired supp
ort a
nd/or
interventio
n to achieve th
e desired
outcomes identified by th
e on
going assessment
process.
Certification Finding – November 2015
Care planning is recorded
in the clinical notes on a shift by shift basis by nursing staff,
at least daily by med
ical staff and as required
by allied health staff. Each area has an
area
‐specific care plan. These have gen
eric goals. There were no m
ultidisciplinary
(MDT) goals iden
tified
in the six files review
ed and only two of the six had
individualised
goals.
There were some exam
ples where needs iden
tified
at assessmen
t were not carried
over to the nursing care plan. For exam
ple, a patient who had
had
a double
amputation had
no m
obilisation plan; a req
uirem
ent for daily weighing was not
iden
tified
in the care plan.
DON
180 days
Revised
and updated
Tren
dcare risk assessmen
t.
Inclusion of MDT goals into
individualised
managem
ent
plans.
Linking of assessmen
t,care
and discharge planning
inform
ation.
Audit will show
improvemen
t.
77
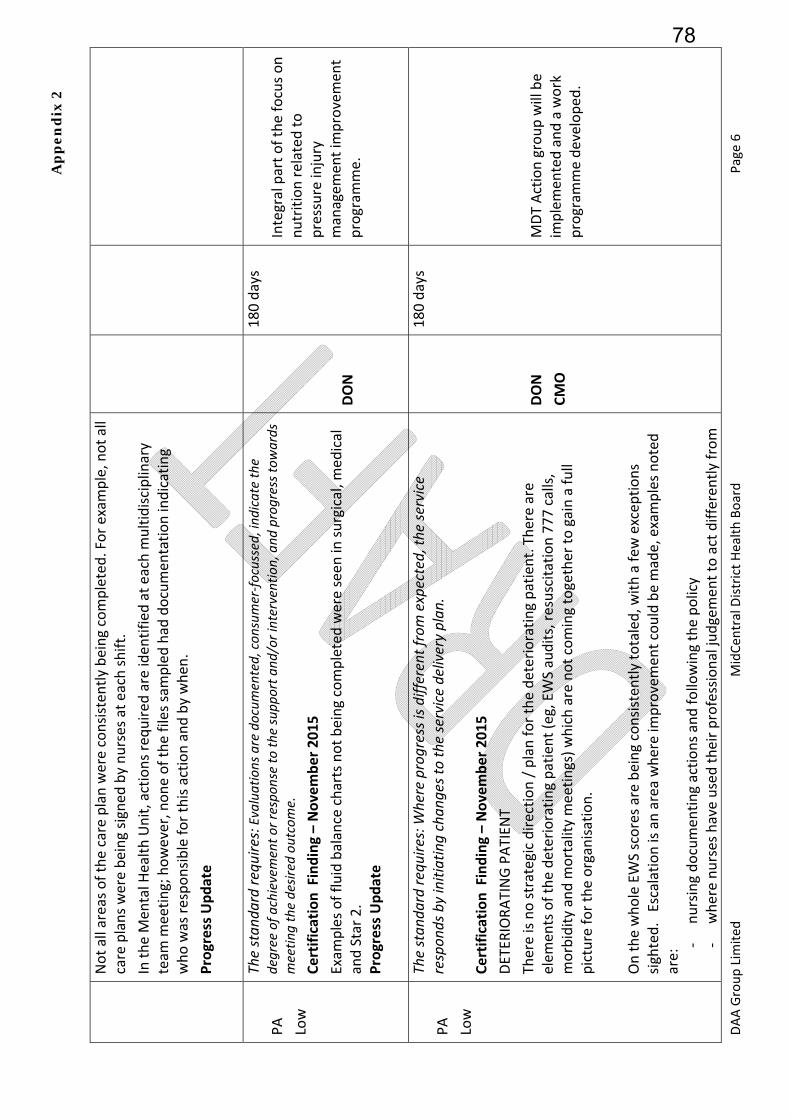
Ap
pe
nd
ix 2
DAA Group Lim
ited
MidCen
tral District Health Board
Page 6
Not all areas of the care plan were consisten
tly being completed. For exam
ple, not all
care plans were being signed
by nurses at each shift.
In the M
ental H
ealth Unit, actions required
are iden
tified
at each m
ultidisciplinary
team
meeting; however, none of the files sampled had
documen
tation indicating
who was responsible for this action and by when
.
Progress Update
PA
Low
The stan
dard re
quire
s: Evaluations are docum
ented, con
sumer‐fo
cussed, ind
icate the
degree of a
chievement o
r respo
nse to th
e supp
ort a
nd/or intervention, and
progress tow
ards
meetin
g the desired
outcome.
Certification Finding – November 2015
Exam
ples of fluid balance charts not being completed were seen in
surgical, m
edical
and Star 2.
Progress Update
DON
180 days
Integral part of the focus on
nutrition related
to
pressure injury
managem
ent im
provemen
t program
me.
PA
Low
The stan
dard re
quire
s: W
here progress is d
ifferent from expected, th
e service
respon
ds by initiating chan
ges to the service delivery plan
. Certification Finding – November 2015
DETER
IORATING PATIEN
T
There is no strategic direction / plan for the deteriorating patient. There are
elem
ents of the deteriorating patient (eg, EWS audits, resuscitation 777 calls,
morbidity and m
ortality meetings) which are not coming together to gain a full
picture for the organisation.
On the whole EWS scores are being consisten
tly totaled, w
ith a few
excep
tions
sighted. Escalation is an area where im
provemen
t could be m
ade, examples noted
are: ‐
nursing documen
ting actions and following the policy
‐ where nurses have used their professional judgemen
t to act differently from
DON
CMO
180 days
MDT Action group will be
implemen
ted and a work
program
me developed
.
78

Ap
pe
nd
ix 2
DAA Group Lim
ited
MidCen
tral District Health Board
Page 7
policy the reasoning should be documen
ted.
‐ Med
ical staff are not always responding in tim
e indicated
by policy; especially
at night when
there is only one House Surgeo
n and one Registrar on duty and
nurses are documenting that the doctor will come ‘when
they can’.
Med
ical staff do not consisten
tly documen
t that they are responding to an EWS call.
Some exam
ples were seen
where medical staff documen
tation in
relation to a 777
call was ambiguous. ‘continue to m
onitor’ – with no indication of freq
uen
cy.
Not all nursing staff spoken with were familiar with the ISBAR communication tool.
Variance to EWS scores is not being carried out when
patients’ observations remain
outside norm
al for some time, and nursing staff are recording with no action as per
policy.
Progress Update
PA
Low
The stan
dard re
quire
s: Service providers identify, docum
ent a
nd m
inim
ise risks a
ssociated
with
each consum
er’s tran
sition, exit, discha
rge or tran
sfer, including
expressed
con
cerns o
f the consum
er and
, if a
ppropriate, fam
ily/w
hana
u or cho
ice or other re
presentativ
es.
Certification Finding – November 2015
In the m
aternity services at Palmerston North Hospital, there is a lack of discharge
and transfer inform
ation in
both the electronic and paper clinical records.
In the surgical and m
edical wards, discharge planning is not consisten
tly documen
ted
in m
ultidisciplinary team
meeting minutes or care planning documen
ts.
Progress Update
RMD
DON
180 days
Revised
discharge sticker.
MCIS will be locked
down
after version 9.1 (early
2016) and im
provemen
t in
clinical records is
anticipated
as a result as
eviden
ced by audit.
Revised
and updated
Tren
dcare risk assessmen
t.
Inclusion of MDT goals into
individualised
managem
ent
plans.
79
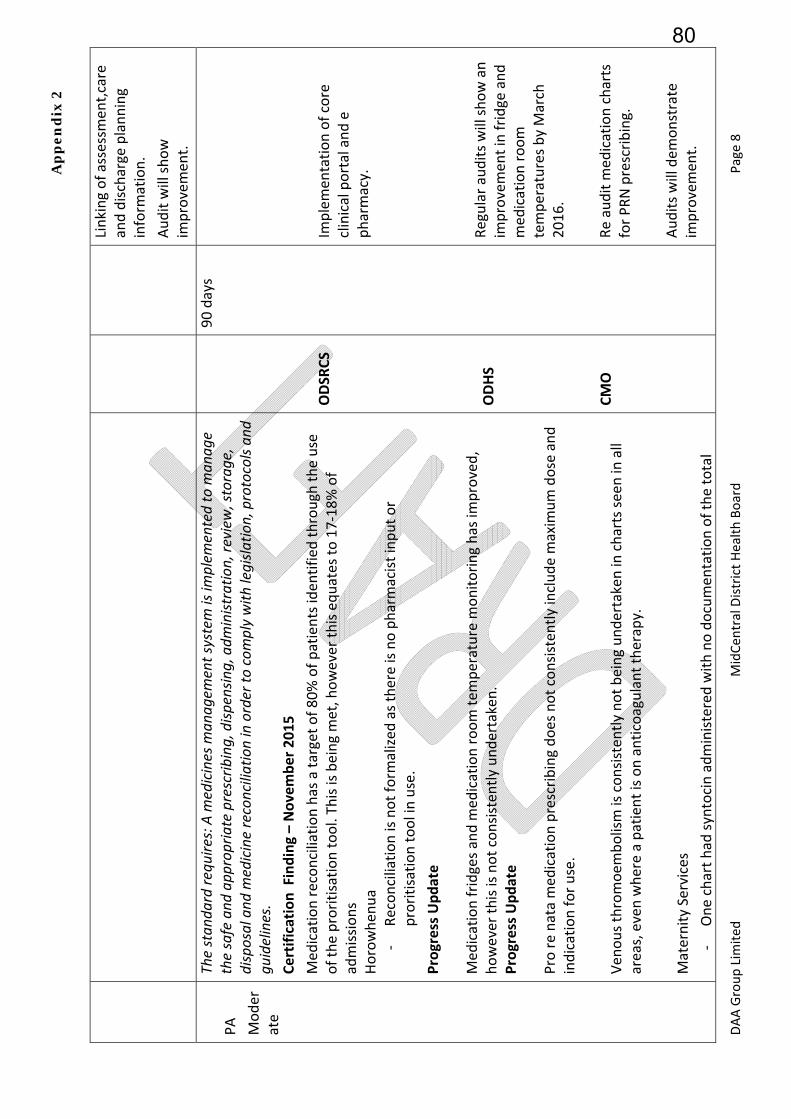
Ap
pe
nd
ix 2
DAA Group Lim
ited
MidCen
tral District Health Board
Page 8
Linking of assessmen
t,care
and discharge planning
inform
ation.
Audit will show
improvemen
t.
PA
Moder
ate
The stan
dard re
quire
s: A m
edicines man
agem
ent system is im
plem
ented to m
anag
e the safe and
app
ropriate prescrib
ing, disp
ensin
g, adm
inistratio
n, re
view
, storage,
disposal and
medicine reconciliation in order to
com
ply with
legisla
tion, protocols an
d gu
idelines.
Certification Finding – November 2015
Med
ication reconciliation has a target of 80% of patients iden
tified
through
the use
of the proritisation tool. This is being met, however this equates to 17‐18% of
admissions
Horowhen
ua
‐ Reconciliation is not form
alized
as there is no pharmacist input or
proritisation tool in use.
Progress Update
Med
ication fridges and m
edication room tem
perature m
onitoring has im
proved,
however this is not consisten
tly undertaken.
Progress Update
Pro re nata med
ication prescribing does not consisten
tly include m
axim
um dose and
indication for use.
Ven
ous thromoem
bolism is consistently not being undertaken in
charts seen in
all
areas, even where a patient is on anticoagulant therapy.
Maternity Services
‐ One chart had
syntocin administered with no documen
tation of the total
ODSR
CS
ODHS
CMO
90 days
Implemen
tation of core
clinical portal and e
pharmacy.
Regular audits will show an
improvemen
t in fridge and
med
ication room
temperatures by March
2016.
Re audit m
edication charts
for PRN prescribing.
Audits will dem
onstrate
improvemen
t.
80
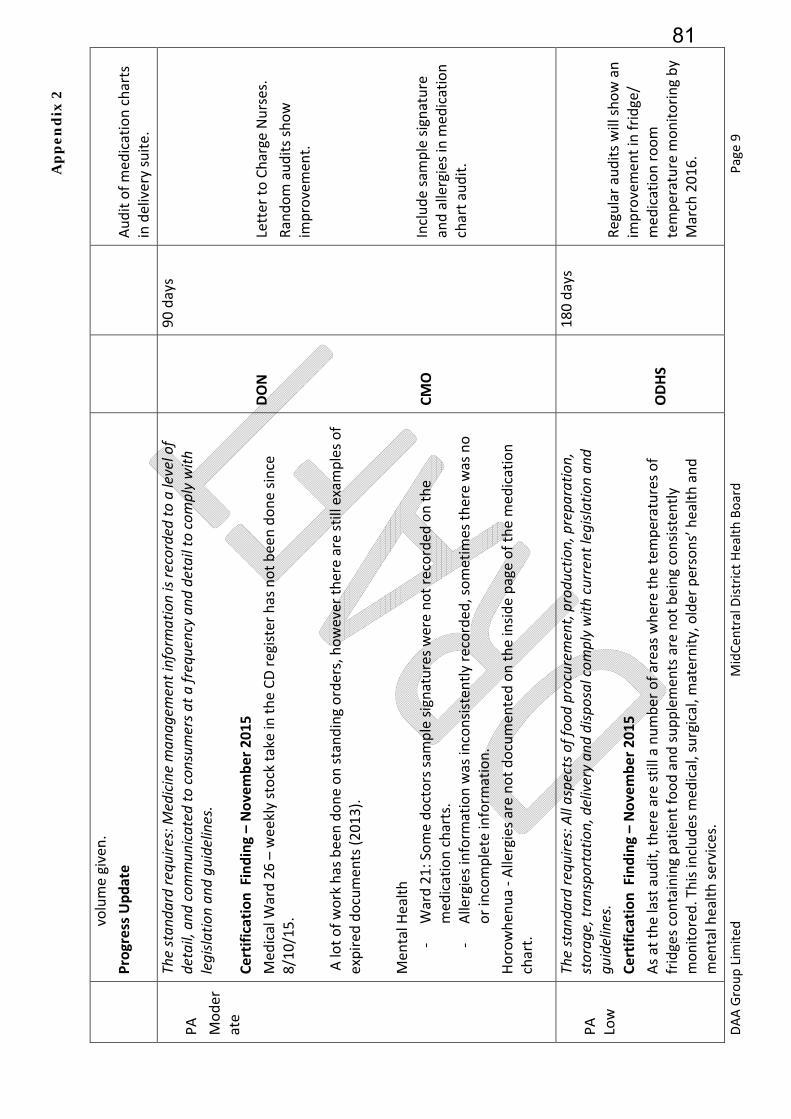
Ap
pe
nd
ix 2
DAA Group Lim
ited
MidCen
tral District Health Board
Page 9
volume given.
Progress Update
Audit of med
ication charts
in delivery suite.
PA
Moder
ate
The stan
dard re
quire
s: M
edicine man
agem
ent information is recorded
to a level of
detail, and
com
mun
icated
to con
sumers a
t a frequency an
d detail to com
ply with
legisla
tion an
d gu
idelines.
Certification Finding – November 2015
Med
ical W
ard 26 – weekly stock take in the CD register has not been done since
8/10/15.
A lot of work has been done on standing orders, however there are still examples of
expired documen
ts (2013).
Men
tal H
ealth
‐ Ward 21: Some doctors sam
ple signatures were not recorded
on the
med
ication charts.
‐ Allergies inform
ation was inconsisten
tly recorded, sometim
es there was no
or incomplete inform
ation.
Horowhen
ua ‐ Allergies are not documen
ted on the inside page of the m
edication
chart.
DON
CMO
90 days
Letter to Charge Nurses.
Random audits show
improvemen
t.
Include sam
ple signature
and allergies in m
edication
chart audit.
PA
Low
The stan
dard re
quire
s: All aspects o
f foo
d procurem
ent, prod
uctio
n, prepa
ratio
n,
storag
e, tran
sportatio
n, delivery an
d disposal com
ply with
current legisla
tion an
d gu
idelines.
Certification Finding – November 2015
As at the last audit, there are still a number of areas where the tem
peratures of
fridges containing patient food and supplemen
ts are not being consisten
tly
monitored. This includes m
edical, surgical, m
aternity, older persons’ health and
men
tal health services.
ODHS
180 days
Regular audits will show an
improvemen
t in fridge/
med
ication room
temperature m
onitoring by
March 2016.
81
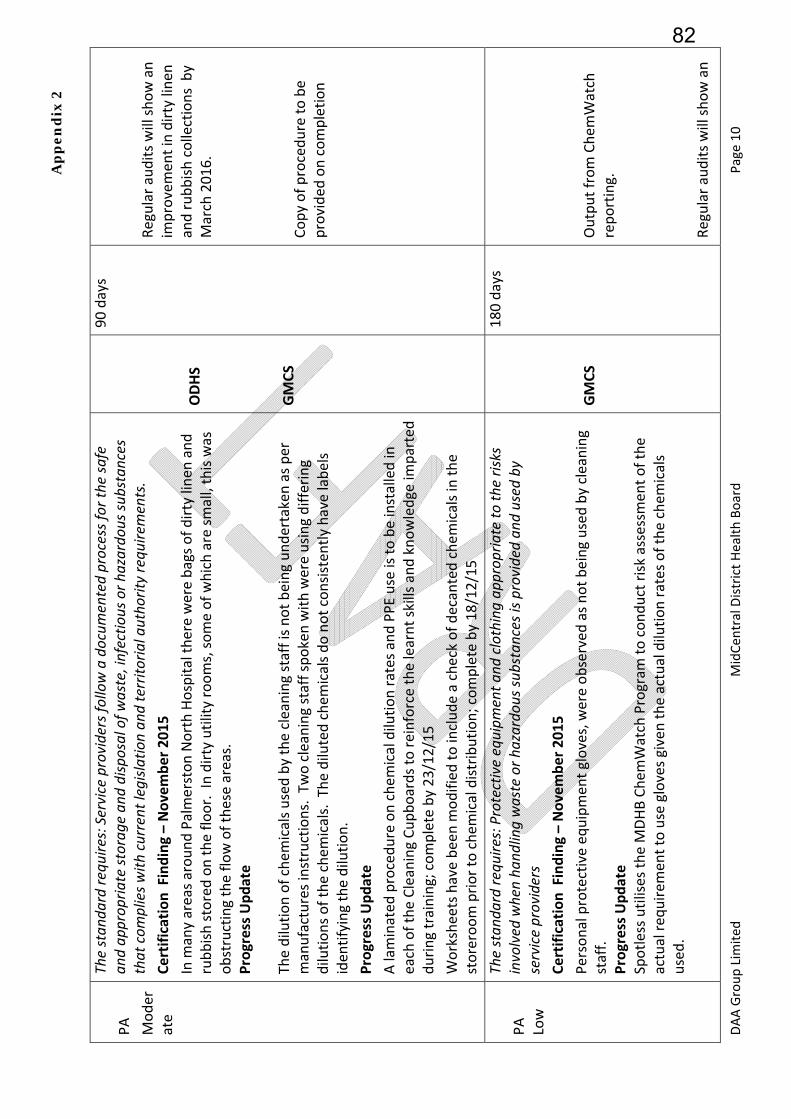
Ap
pe
nd
ix 2
DAA Group Lim
ited
MidCen
tral District Health Board
Page 10
PA
Moder
ate
The stan
dard re
quire
s: Service providers fo
llow a docum
ented process for th
e safe
and ap
prop
riate storag
e an
d disposal of w
aste, infectio
us or h
azardo
us su
bstances
that com
plies w
ith current legisla
tion an
d territo
rial autho
rity requ
irements.
Certification Finding – November 2015
In m
any areas around Palmerston North Hospital there were bags of dirty linen
and
rubbish stored on the floor. In dirty utility rooms, some of which are small, this was
obstructing the flow of these areas.
Progress Update
The dilution of chem
icals used by the cleaning staff is not being undertaken as per
manufactures instructions. Two cleaning staff spoken with were using differing
dilutions of the chem
icals. The diluted chem
icals do not consisten
tly have labels
iden
tifying the dilution.
Progress Update
A laminated
procedure on chem
ical dilution rates and PPE use is to be installed in
each of the Cleaning Cupboards to reinforce the learnt skills and knowledge im
parted
during training; complete by 23/12/15
Worksheets have been m
odified to include a check of decanted chem
icals in the
storeroom prior to chem
ical distribution; complete by 18/12/15
ODHS
GMCS
90 days
Regular audits will show an
improvemen
t in dirty linen
and rubbish collections by
March 2016.
Copy of procedure to be
provided
on completion
PA
Low
The stan
dard re
quire
s: Protective equipm
ent a
nd clothing ap
prop
riate to
the risks
involved
when ha
ndling waste or h
azardo
us su
bstances is provided an
d used
by
service providers
Certification Finding – November 2015
Personal protective equipmen
t gloves, were observed
as not being used by cleaning
staff.
Progress Update
Spotless utilises the M
DHB Chem
Watch Program
to conduct risk assessmen
t of the
actual req
uirem
ent to use gloves given the actual dilution rates of the chem
icals
used.
GMCS
180 days
Output from Chem
Watch
reporting.
Regular audits will show an
82
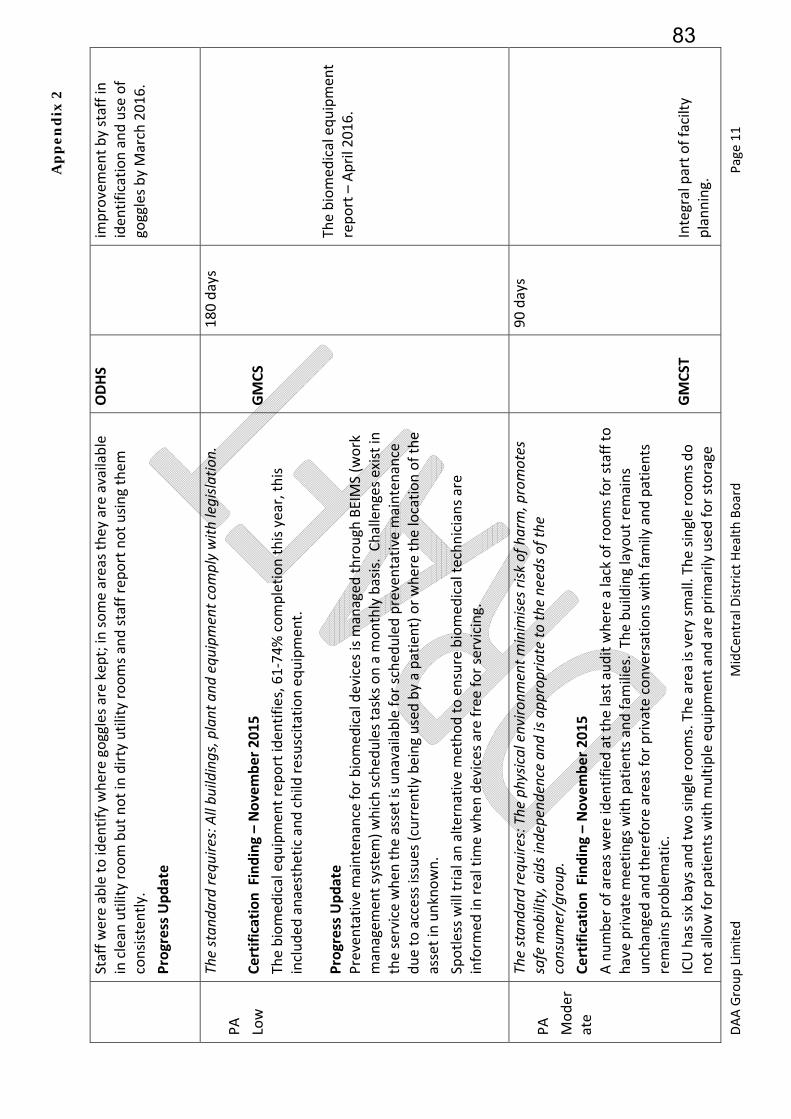
Ap
pe
nd
ix 2
DAA Group Lim
ited
MidCen
tral District Health Board
Page 11
Staff were able to iden
tify where goggles are kept; in
some areas they are available
in clean
utility room but not in dirty utility rooms and staff report not using them
consisten
tly.
Progress Update
ODHS
improvemen
t by staff in
iden
tification and use of
goggles by March 2016.
PA
Low
The stan
dard re
quire
s: All bu
ildings, plant and
equ
ipment com
ply with
legisla
tion.
Certification Finding – November 2015
The biomed
ical equipmen
t report iden
tifies, 61‐74% completion this year, this
included
anaesthetic and child
resuscitation equipmen
t.
Progress Update
Preventative m
aintenance for biomed
ical devices is m
anaged
through
BEIMS (w
ork
managem
ent system
) which sched
ules tasks on a m
onthly basis. Challenges exist in
the service when
the asset is unavailable for sched
uled preventative m
aintenance
due to access issues (curren
tly being used by a patient) or where the location of the
asset in unknown.
Spotless will trial an alternative method to ensure biomed
ical technicians are
inform
ed in
real tim
e when
devices are free for servicing.
GMCS
180 days
The biomed
ical equipmen
t report – April 2016.
PA
Moder
ate
The stan
dard re
quire
s: The
physic
al enviro
nment m
inim
ises risk
of h
arm, promotes
safe m
obility, aids ind
ependence an
d is ap
prop
riate to
the needs o
f the
consum
er/group
. Certification Finding – November 2015
A number of areas were iden
tified
at the last audit where a lack of rooms for staff to
have private m
eetings with patients and fam
ilies. The building layout remains
unchanged and therefore areas for private conversations with fam
ily and patients
remains problematic.
ICU has six bays and two single rooms. The area is very sm
all. The single rooms do
not allow for patients with m
ultiple equipmen
t and are primarily used for storage
GMCST
90 days
Integral part of facilty
planning.
83
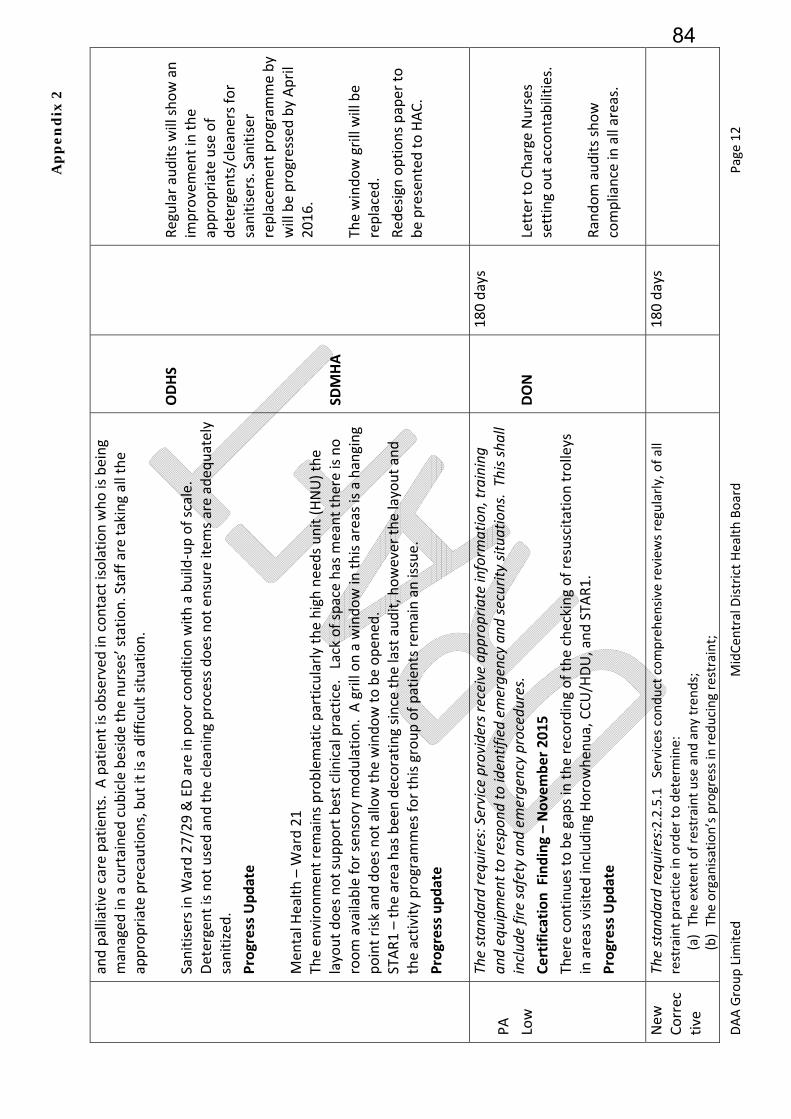
Ap
pe
nd
ix 2
DAA Group Lim
ited
MidCen
tral District Health Board
Page 12
and palliative care patients. A patient is observed
in contact isolation who is being
managed
in a curtained
cubicle beside the nurses’ station. Staff are taking all the
appropriate precautions, but it is a difficult situation.
Sanitisers in W
ard 27/29 & ED are in
poor condition with a build
‐up of scale.
Detergent is not used and the cleaning process does not en
sure item
s are adeq
uately
sanitized
.
Progress Update
Men
tal H
eal th – W
ard 21
The environmen
t remains problematic particularly the high needs unit (HNU) the
layout does not support best clinical practice. Lack of space has m
eant there is no
room available for sensory m
odulation. A grill on a window in
this areas is a hanging
point risk and does not allow the window to be open
ed.
STAR1 – the area has been decorating since the last audit, however the layout and
the activity program
mes for this group of patients rem
ain an issue.
Progress update
ODHS
SDMHA
Regular audits will show an
improvemen
t in the
appropriate use of
detergents/cleaners for
sanitisers. Sanitiser
replacemen
t program
me by
will be progressed by April
2016.
The window grill will be
replaced.
Red
esign options paper to
be presented to HAC.
PA
Low
The stan
dard re
quire
s: Service providers re
ceive ap
prop
riate inform
ation, training
an
d equipm
ent to respon
d to identified em
ergency an
d security situa
tions. This shall
includ
e fire safety and
emergency procedures.
Certification Finding – November 2015
There continues to be gaps in the recording of the checking of resuscitation trolleys
in areas visited
including Horowhen
ua, CCU/HDU, and STA
R1.
Progress Update
DON
180 days
Letter to Charge Nurses
setting out accontabilities.
Random audits show
compliance in all areas.
New
Correc
tive
The stan
dard re
quire
s:2.2.5.1 Services conduct comprehensive reviews regularly, of all
restraint practice in
order to determine:
(a) The extent of restraint use and any tren
ds;
(b) The organisation’s progress in red
ucing restraint;
180 days
84

Ap
pe
nd
ix 2
DAA Group Lim
ited
MidCen
tral District Health Board
Page 13
Action
PA
Low
(c) Adverse outcomes;
(d) Service provider compliance with policies and procedures;
(e) Whether the approved restraint is necessary, safe, or an
appropriate duration and
appropriate in light of consumer and service provider feed
back an
d curren
t accepted
practice;
(f)
If individual plans of care/support iden
tified
alternative techniques to restraint and
dem
onstrate restraint evaluation;
(g) Whether changes to policy, procedures or guidelines are req
uired
; and
(h) Whether there are additional education or training needs or changes required
to
existing ed
ucation.
In the M
ental H
ealth Unit, restraint use is m
onitored and rep
orted
; however, the unit
is not able to dem
onstrate that restraint use is being consisten
tly minim
ised
and that
alternative interven
tions have always been applied to ensure that patients are
treated in
the least restrictive environmen
t.
Progress Update
SDMHA
Eviden
ce of continuing
reduction in
restraint use
Improved documen
tation of
alternatives used or
considered
as shown by
audit.
PA
Low
The stan
dard re
quire
s: The responsibility for infection control is clearly defined
and
there are clear lines of accountability for infection control m
atters in
the organisation
leading to the governing body and/or senior managem
ent.
Certification Finding – November 2015
There has been some im
provemen
t to this area, however im
provemen
t continues to
be req
uired
to ensure the early involvem
ent of the Infection Prevention and Control
when
changes are proposed. For exam
ple equipmen
t in the ward 27 clinic.
Progress Update
DPSCE
180 days
Eviden
ce of involvem
ent in
all capex purchases both
building and equipmen
t.
85
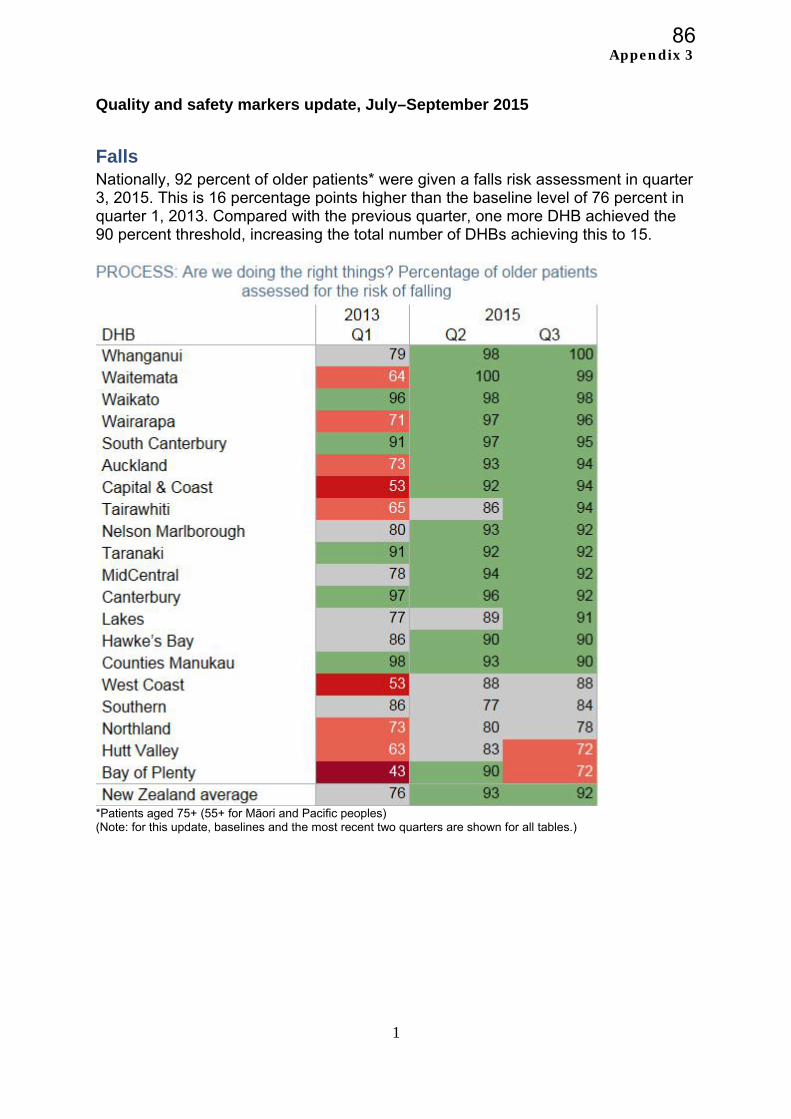
Appendix 3
1
Quality and safety markers update, July–September 2015
Falls Nationally, 92 percent of older patients* were given a falls risk assessment in quarter 3, 2015. This is 16 percentage points higher than the baseline level of 76 percent in quarter 1, 2013. Compared with the previous quarter, one more DHB achieved the 90 percent threshold, increasing the total number of DHBs achieving this to 15.
*Patients aged 75+ (55+ for Māori and Pacific peoples) (Note: for this update, baselines and the most recent two quarters are shown for all tables.)
86
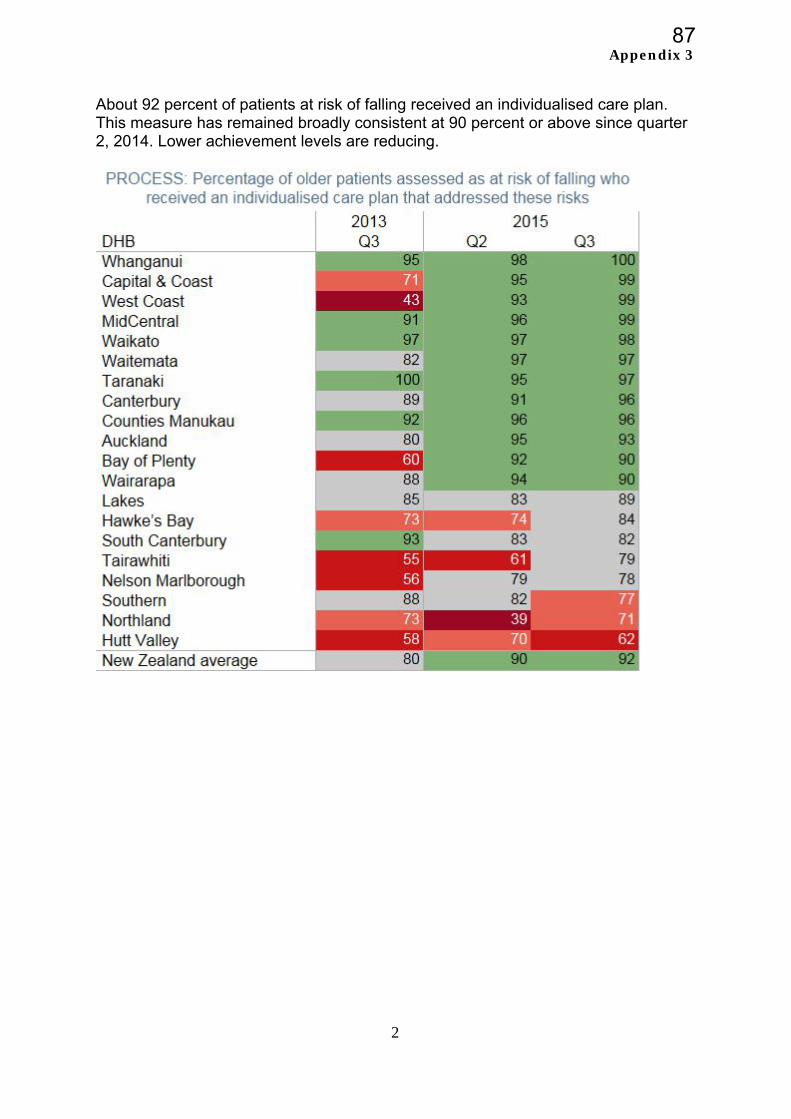
Appendix 3
2
About 92 percent of patients at risk of falling received an individualised care plan. This measure has remained broadly consistent at 90 percent or above since quarter 2, 2014. Lower achievement levels are reducing.
87
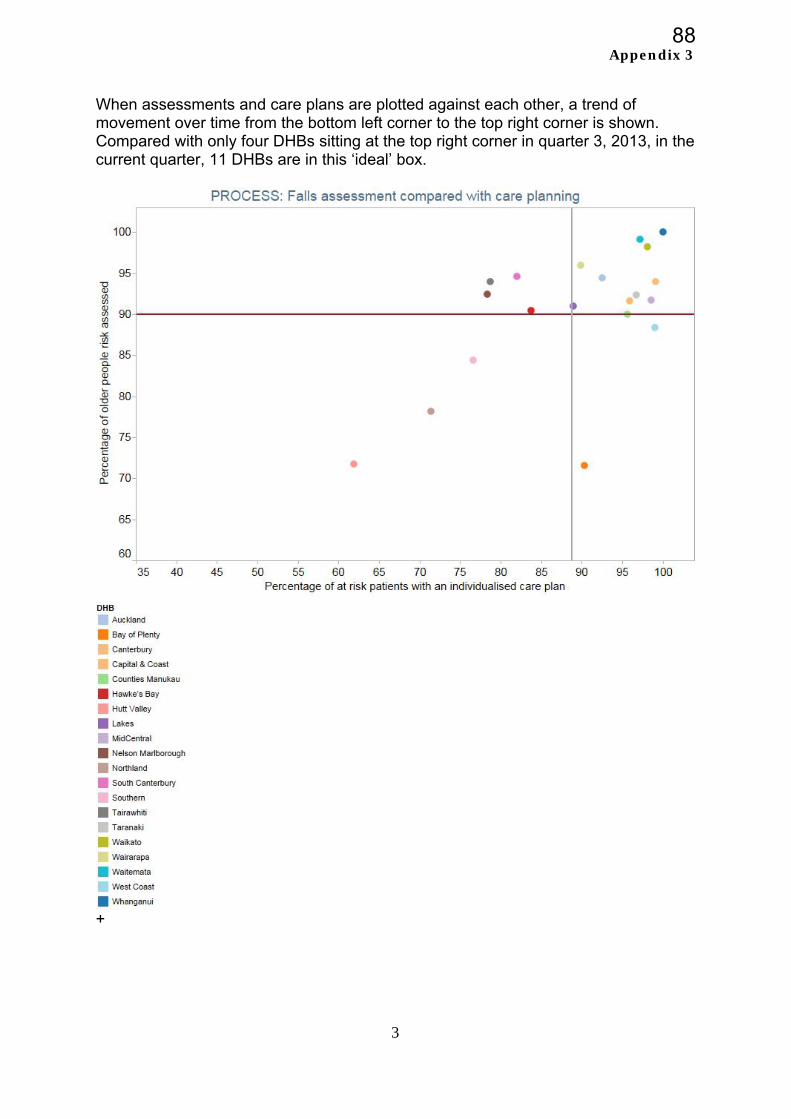
Appendix 3
3
When assessments and care plans are plotted against each other, a trend of movement over time from the bottom left corner to the top right corner is shown. Compared with only four DHBs sitting at the top right corner in quarter 3, 2013, in the current quarter, 11 DHBs are in this ‘ideal’ box.
+
88
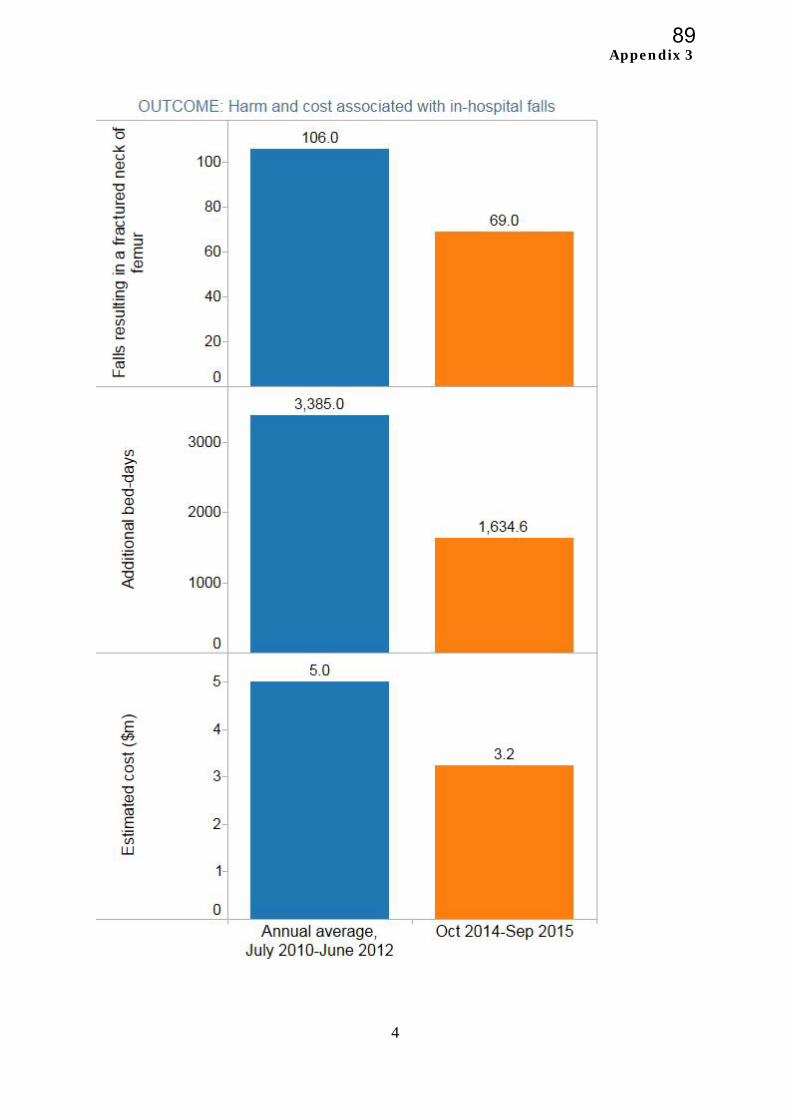
Appendix 3
4
89
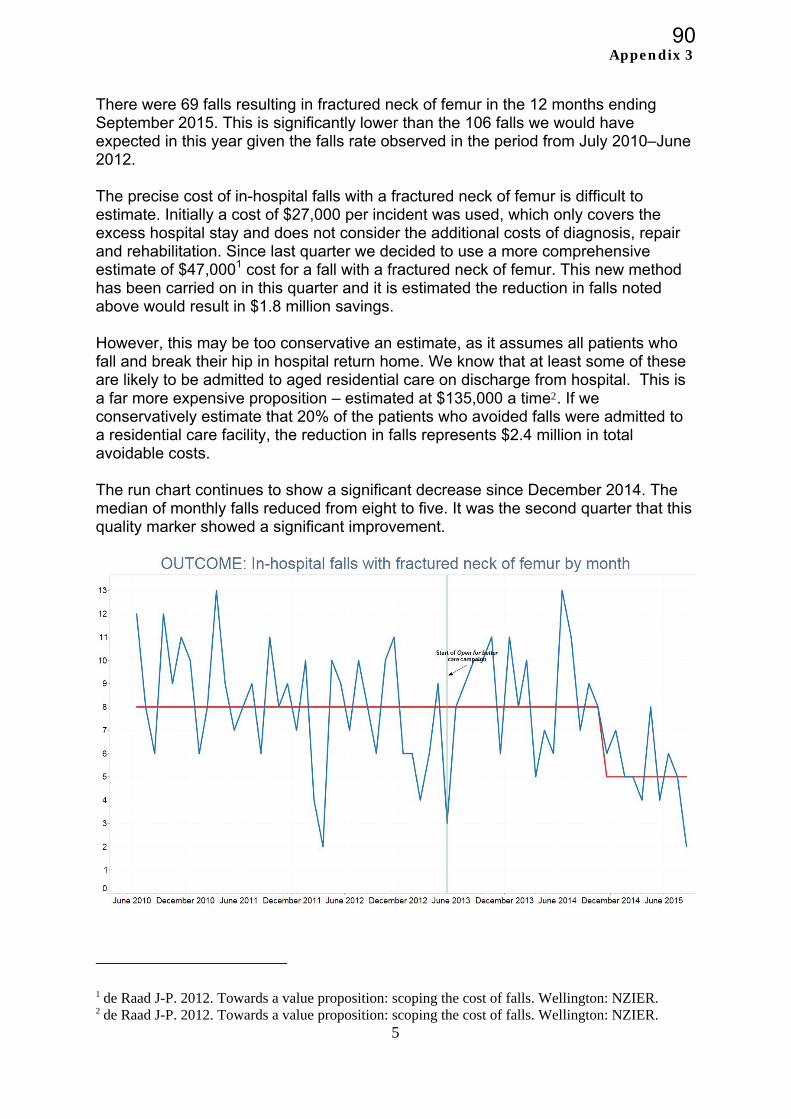
Appendix 3
5
There were 69 falls resulting in fractured neck of femur in the 12 months ending September 2015. This is significantly lower than the 106 falls we would have expected in this year given the falls rate observed in the period from July 2010–June 2012. The precise cost of in-hospital falls with a fractured neck of femur is difficult to estimate. Initially a cost of $27,000 per incident was used, which only covers the excess hospital stay and does not consider the additional costs of diagnosis, repair and rehabilitation. Since last quarter we decided to use a more comprehensive estimate of $47,0001 cost for a fall with a fractured neck of femur. This new method has been carried on in this quarter and it is estimated the reduction in falls noted above would result in $1.8 million savings. However, this may be too conservative an estimate, as it assumes all patients who fall and break their hip in hospital return home. We know that at least some of these are likely to be admitted to aged residential care on discharge from hospital. This is a far more expensive proposition – estimated at $135,000 a time2. If we conservatively estimate that 20% of the patients who avoided falls were admitted to a residential care facility, the reduction in falls represents $2.4 million in total avoidable costs. The run chart continues to show a significant decrease since December 2014. The median of monthly falls reduced from eight to five. It was the second quarter that this quality marker showed a significant improvement.
1 de Raad J-P. 2012. Towards a value proposition: scoping the cost of falls. Wellington: NZIER. 2 de Raad J-P. 2012. Towards a value proposition: scoping the cost of falls. Wellington: NZIER.
90
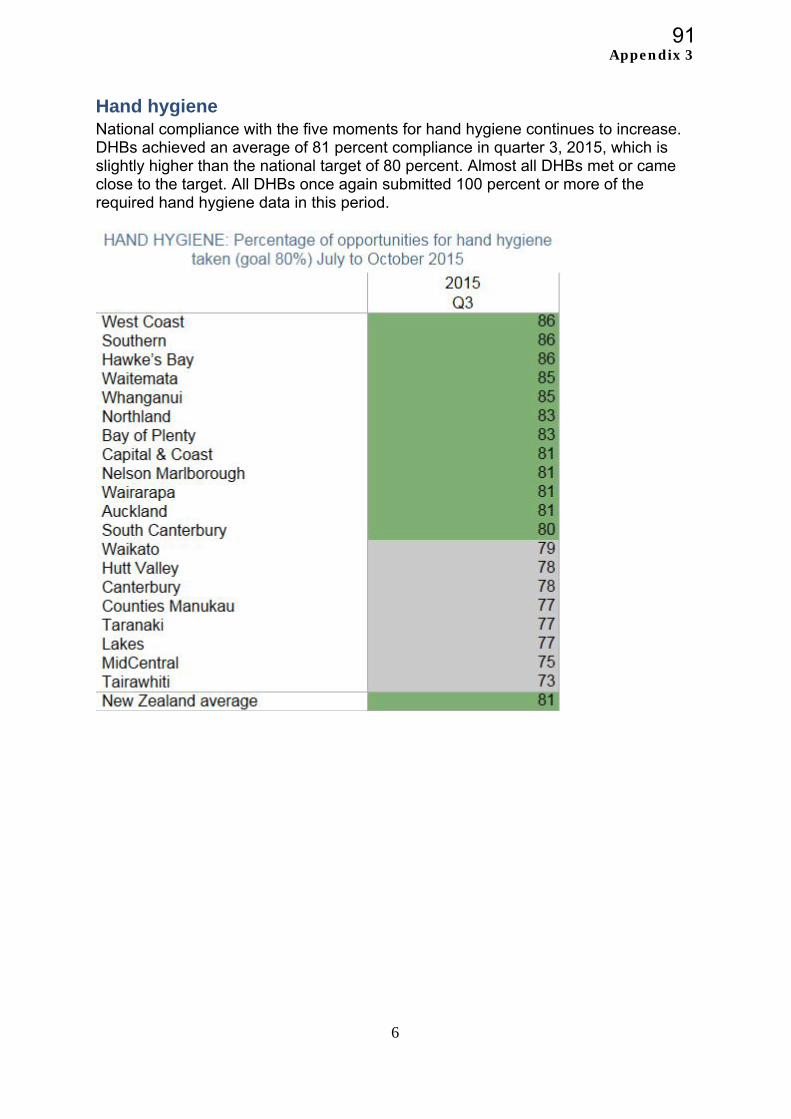
Appendix 3
6
Hand hygiene National compliance with the five moments for hand hygiene continues to increase. DHBs achieved an average of 81 percent compliance in quarter 3, 2015, which is slightly higher than the national target of 80 percent. Almost all DHBs met or came close to the target. All DHBs once again submitted 100 percent or more of the required hand hygiene data in this period.
91
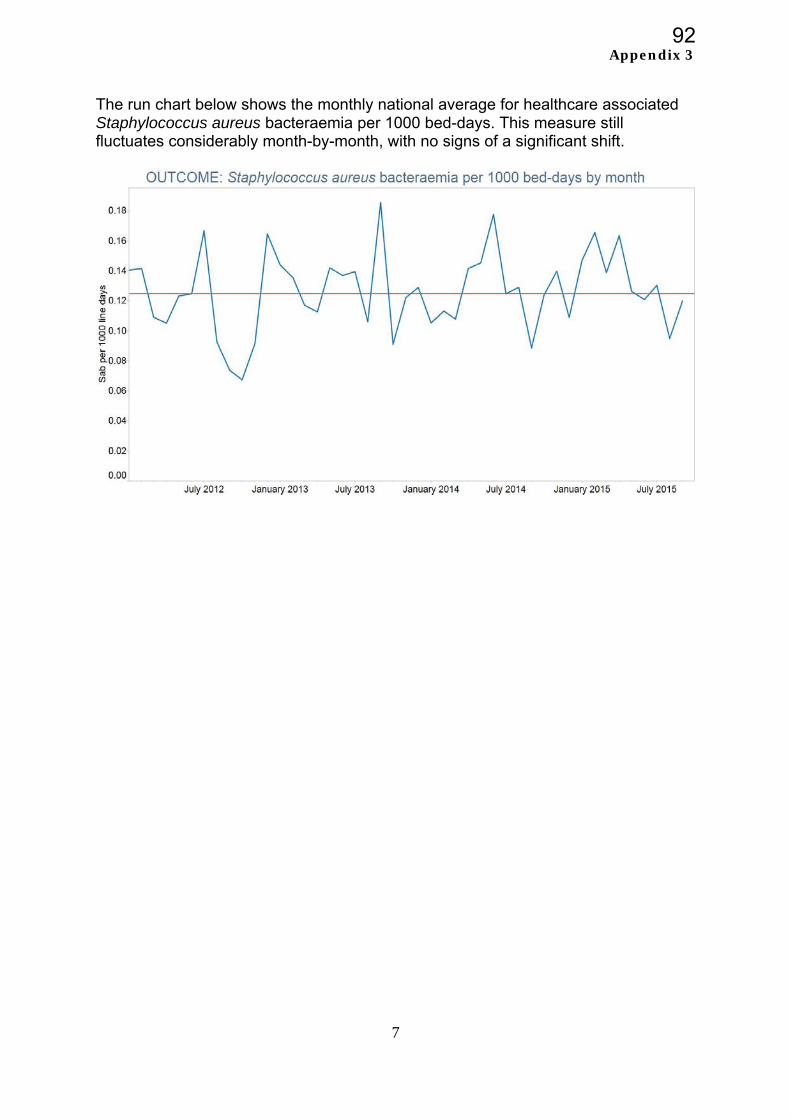
Appendix 3
7
The run chart below shows the monthly national average for healthcare associated Staphylococcus aureus bacteraemia per 1000 bed-days. This measure still fluctuates considerably month-by-month, with no signs of a significant shift.
92
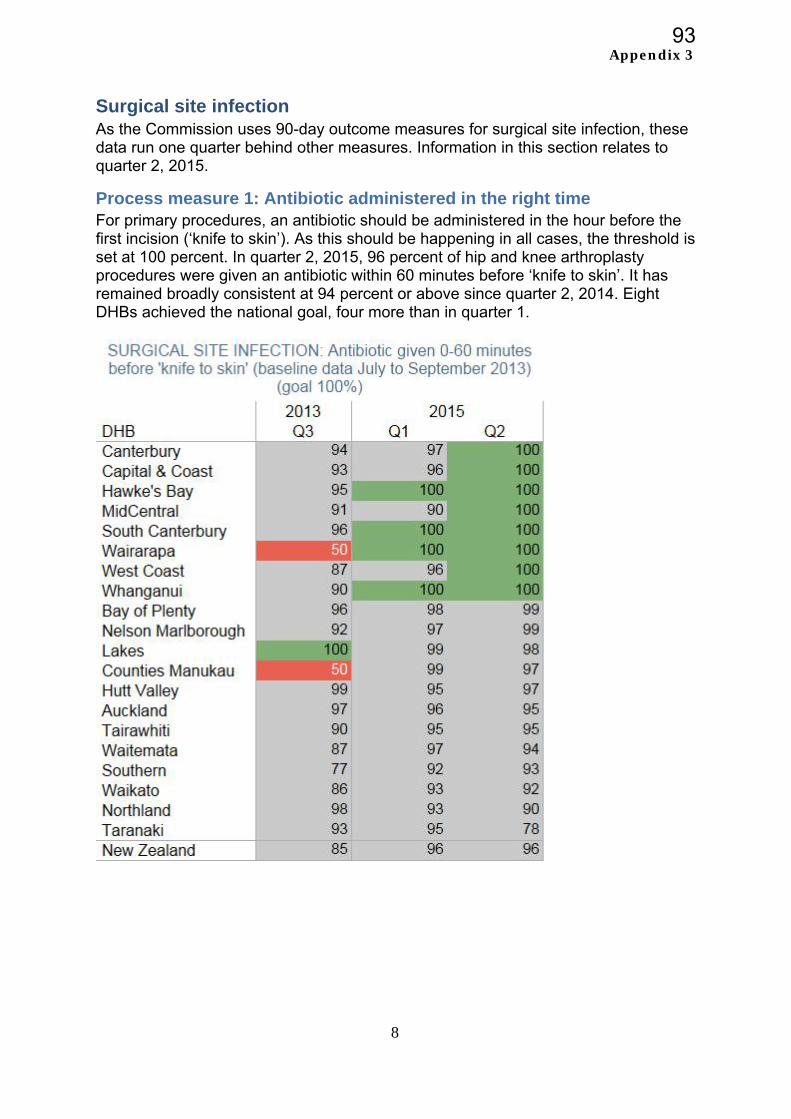
Appendix 3
8
Surgical site infection As the Commission uses 90-day outcome measures for surgical site infection, these data run one quarter behind other measures. Information in this section relates to quarter 2, 2015.
Process measure 1: Antibiotic administered in the right time For primary procedures, an antibiotic should be administered in the hour before the first incision (‘knife to skin’). As this should be happening in all cases, the threshold is set at 100 percent. In quarter 2, 2015, 96 percent of hip and knee arthroplasty procedures were given an antibiotic within 60 minutes before ‘knife to skin’. It has remained broadly consistent at 94 percent or above since quarter 2, 2014. Eight DHBs achieved the national goal, four more than in quarter 1.
93
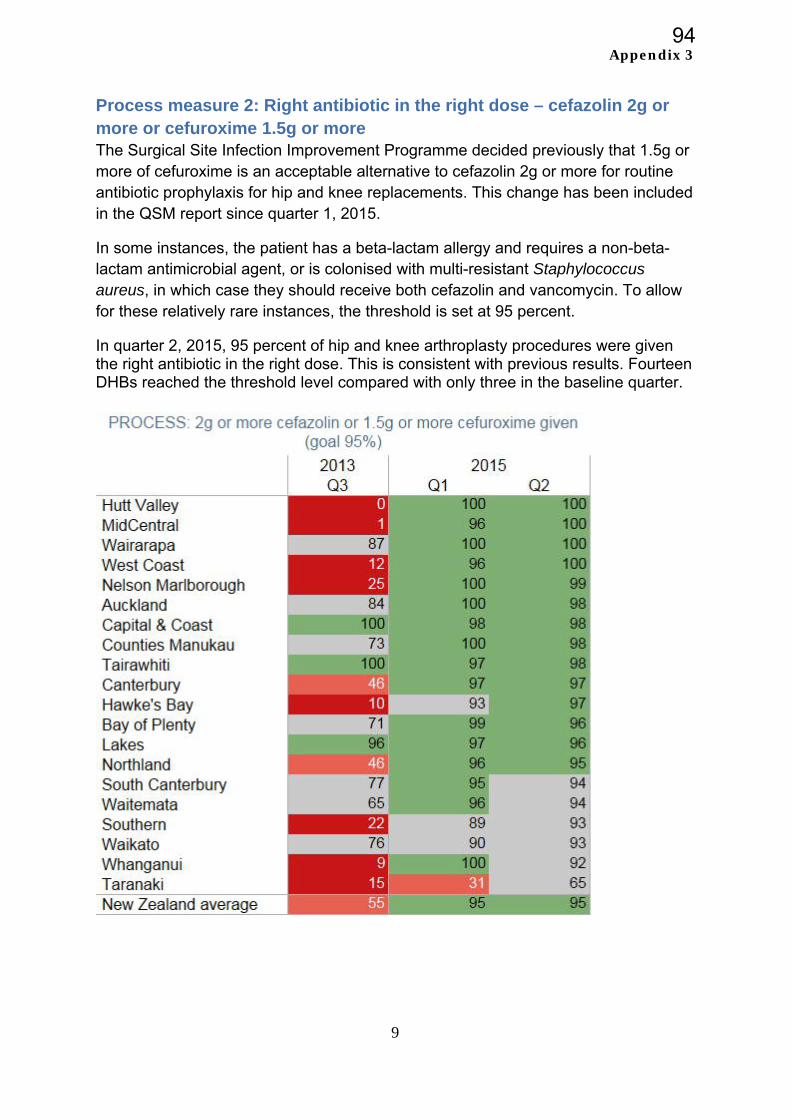
Appendix 3
9
Process measure 2: Right antibiotic in the right dose – cefazolin 2g or more or cefuroxime 1.5g or more The Surgical Site Infection Improvement Programme decided previously that 1.5g or more of cefuroxime is an acceptable alternative to cefazolin 2g or more for routine antibiotic prophylaxis for hip and knee replacements. This change has been included in the QSM report since quarter 1, 2015.
In some instances, the patient has a beta-lactam allergy and requires a non-beta-lactam antimicrobial agent, or is colonised with multi-resistant Staphylococcus aureus, in which case they should receive both cefazolin and vancomycin. To allow for these relatively rare instances, the threshold is set at 95 percent.
In quarter 2, 2015, 95 percent of hip and knee arthroplasty procedures were given the right antibiotic in the right dose. This is consistent with previous results. Fourteen DHBs reached the threshold level compared with only three in the baseline quarter.
94
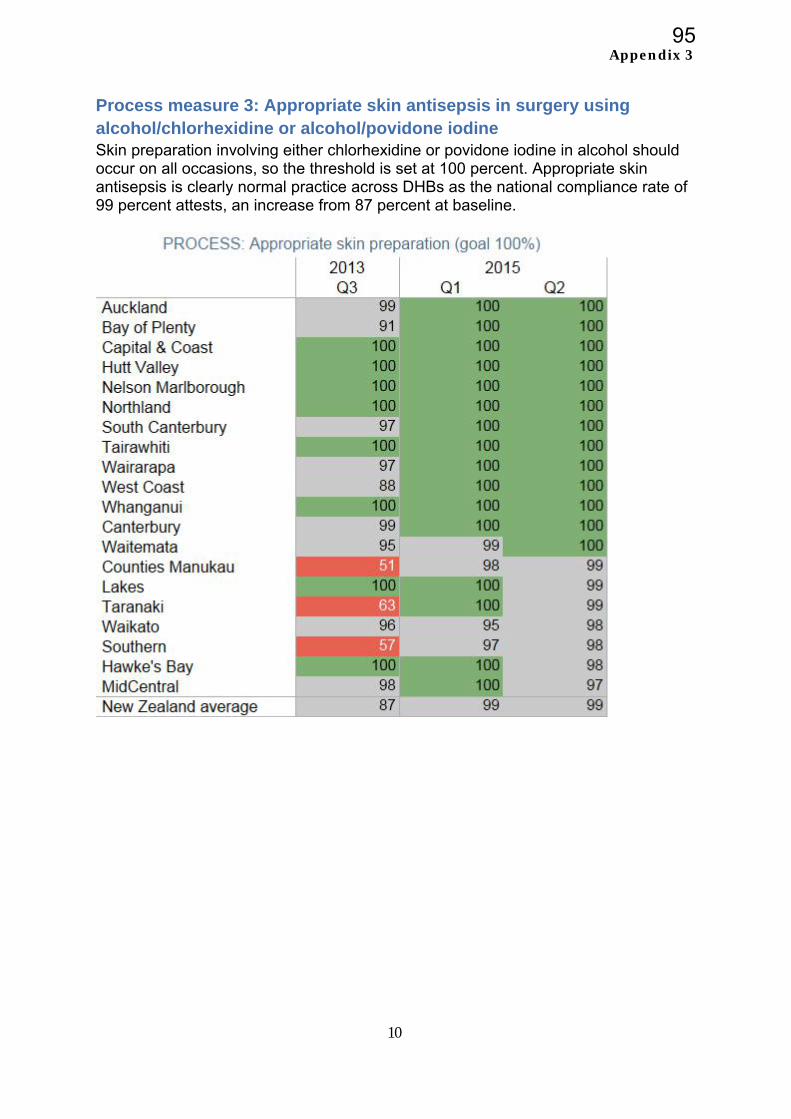
Appendix 3
10
Process measure 3: Appropriate skin antisepsis in surgery using alcohol/chlorhexidine or alcohol/povidone iodine Skin preparation involving either chlorhexidine or povidone iodine in alcohol should occur on all occasions, so the threshold is set at 100 percent. Appropriate skin antisepsis is clearly normal practice across DHBs as the national compliance rate of 99 percent attests, an increase from 87 percent at baseline.
95
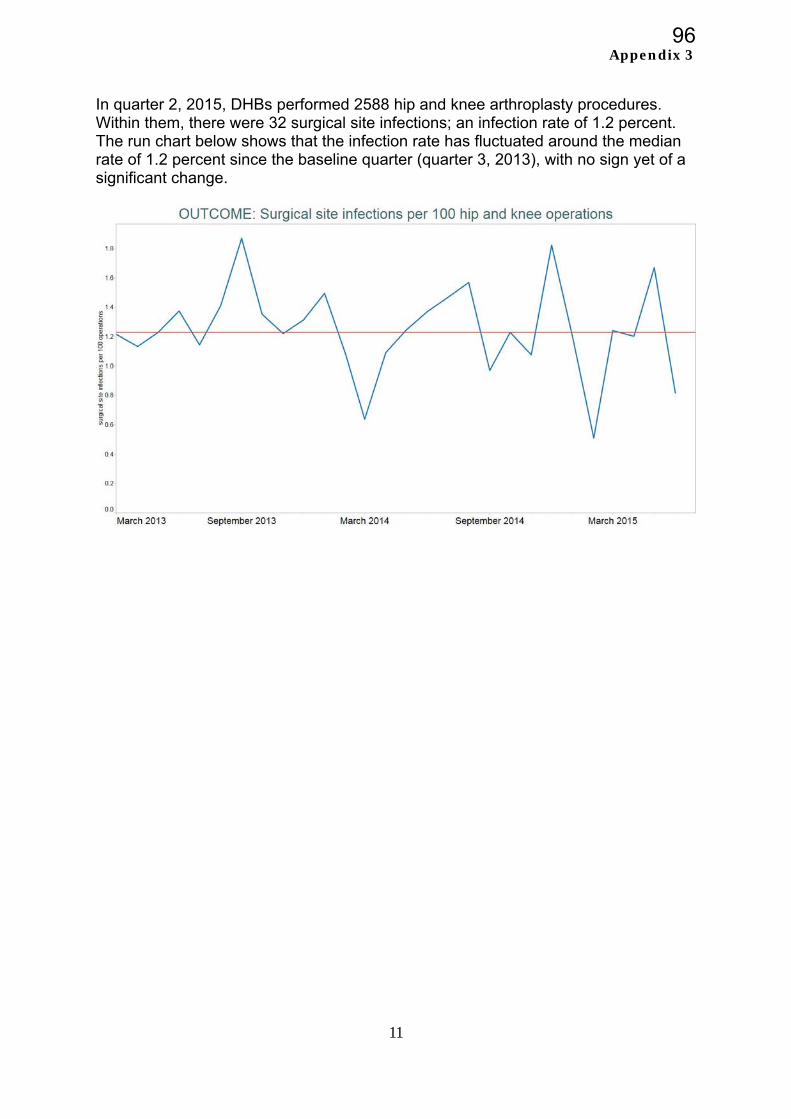
Appendix 3
11
In quarter 2, 2015, DHBs performed 2588 hip and knee arthroplasty procedures. Within them, there were 32 surgical site infections; an infection rate of 1.2 percent. The run chart below shows that the infection rate has fluctuated around the median rate of 1.2 percent since the baseline quarter (quarter 3, 2013), with no sign yet of a significant change.
96

Appendix 3
12
Medication safety
We introduced a quality and safety marker for medication safety in September 2014. It focuses on medication reconciliation – a process by which health care professionals ensure all medicines a patient is taking and their adverse reaction history are accurately documented and the information is used across health care. An accurate medicine list can be reviewed to ensure medicines are appropriate and safe. Medicines which should be continued, stopped or temporarily stopped can be documented on the list. This reduces the risk of medicines with potentially dangerous interactions being prescribed.
A key first step to allow medication reconciliation to be undertaken routinely and in a more straightforward manner is the introduction of an electronic system, known as electronic medication reconciliation (eMR). There is a national programme to roll out eMR throughout the country; five DHBs have access to the system currently.
Structure: Implementation of eMR (preliminary results only)
DHB Status
Counties Manukau Implemented
Northland Implemented
Taranaki Implemented
Waitemata Implemented
Canterbury Implemented
Auckland Q1, 2016
Bay of Plenty Not implemented
Capital & Coast Not implemented
Hawke’s Bay Not implemented
Hutt Valley Not implemented
Lakes Not implemented
MidCentral Not implemented
Nelson Marlborough Not implemented
South Canterbury Not implemented
Southern Not implemented
Tairawhiti Not implemented
Waikato Not implemented
Wairarapa Not implemented
West Coast Not implemented
Whanganui Not implemented
97
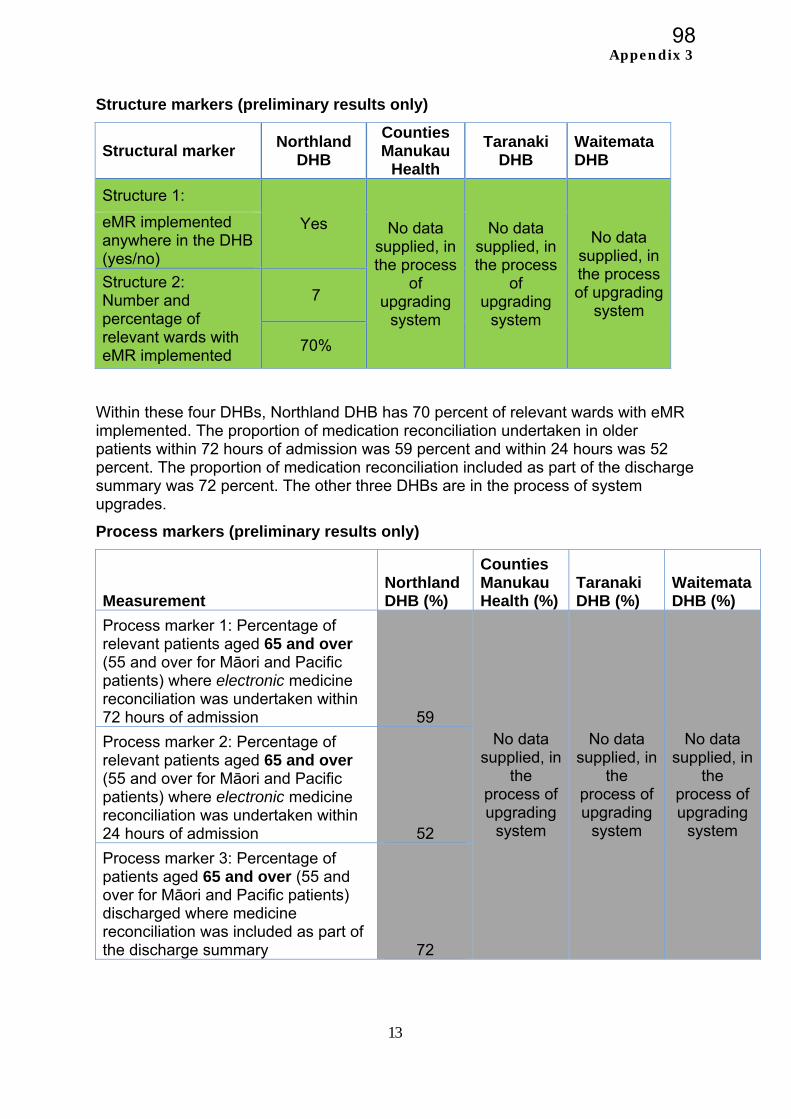
Appendix 3
13
Structure markers (preliminary results only)
Structural marker Northland
DHB
Counties Manukau
Health
Taranaki DHB
Waitemata DHB
Structure 1:
Yes No data supplied, in the process
of upgrading
system
No data supplied, in the process
of upgrading
system
No data supplied, in the process of upgrading
system
eMR implemented anywhere in the DHB (yes/no)
Structure 2: Number and percentage of relevant wards with eMR implemented
7
70%
Within these four DHBs, Northland DHB has 70 percent of relevant wards with eMR implemented. The proportion of medication reconciliation undertaken in older patients within 72 hours of admission was 59 percent and within 24 hours was 52 percent. The proportion of medication reconciliation included as part of the discharge summary was 72 percent. The other three DHBs are in the process of system upgrades.
Process markers (preliminary results only)
Measurement Northland DHB (%)
Counties Manukau Health (%)
Taranaki DHB (%)
Waitemata DHB (%)
Process marker 1: Percentage of relevant patients aged 65 and over (55 and over for Māori and Pacific patients) where electronic medicine reconciliation was undertaken within 72 hours of admission 59
No data supplied, in
the process of upgrading
system
No data supplied, in
the process of upgrading
system
No data supplied, in
the process of upgrading
system
Process marker 2: Percentage of relevant patients aged 65 and over (55 and over for Māori and Pacific patients) where electronic medicine reconciliation was undertaken within 24 hours of admission 52
Process marker 3: Percentage of patients aged 65 and over (55 and over for Māori and Pacific patients) discharged where medicine reconciliation was included as part of the discharge summary 72
98
A
pp
en
dix
4
99

Page 1 of 19
TO Hospital Advisory Committee
Community and Public Health Advisory Committee
FROM Anne Amoore Manager, Human Resources and Organisational Development
DATE 11 January 2016 SUBJECT WORKFORCE STRATEGY: SIX MONTHLY UPDATE
1.0 PURPOSE Attached is the six monthly update on the progress made against the workforce initiatives for 2015/16 listed in MidCentral District Health Board’s (MDHB’s) Annual Plan. This report is for information only; no decision is sought.
2.0 EXECUTIVE SUMMARY
Good progress continues to be made towards initiatives that support our workforce goals and objectives. With regard to MDHB’s culture change programme, the most significant initiative is the development, led by MDHB’s Chief Executive, of MDHB’s Strategic Framework for the next five to ten years which includes our vision, purpose, values and strategic imperatives. As part of developing our values, the behaviours (both below and above the line) which align to these, will also be determined. The first draft of the Framework was developed on the basis of workshops held in October and December with the Board and senior management/clinician representatives. This is ongoing work and there has been good engagement and lively debate at internal forums and workshops held with staff. A number of very useful suggestions have been taken forward in wording changes and it is expected that the Strategic Framework will be finalised in April 2016. Conversations will also be had with community groups, providers and other stakeholders about our Framework and plan, with a view to hearing what they consider should be progressed as a priority and what they think needs to occur. Following this, a refreshed Workforce Strategy and an Organisational Development Plan will be developed to support the strategic direction set. These plans will also include initiatives to address the safety culture survey findings, and other feedback from staff that has been received. Although our vacancy levels have increased over the past six months, these continue at low levels at an average of 45.06 FTE per month (2.8 percent of total FTEs across Allied Health, Nursing, Midwifery and Medical). This is up from the previous six months which showed an average of 39.49 FTE vacancies per month (2.45 percent of total FTEs) for the occupational groups for which we collect vacancy data. Staff leaving the organisation, and staff stability rates are also at low levels and well within target. Year to date sick leave rates are tracking slightly above our target of 3.2 percent at an average of 3.33 percent per month. This can be attributed to the higher sick leave rates which are traditionally experienced during the winter period. It is anticipated that sick leave rates will reduce to within our target for the next six months.
MEMORANDUM
100
Page 2 of 19
Accrued annual leave over two years continues to be above our target and is a key area of focus. The Annual Leave Plan initiatives are in place to address this and progress against the plan is included in a separate report. Over the past six months other key areas of focus include:
Continuing to provide education and development opportunities for staff, including leadership development programmes. Over the past year 595 internal education sessions have been held attended by over 4900 staff (some staff attended more than one session).
In August 2015, MDHB joined Ko Awatea, an e-learning system established by Counties Manakau DHB. To-date 621 staff have completed modules on MDHB’s site.
MDHB held its annual Careers Fair and attended a number of other events promoting health as a career and MDHB as an employer of choice.
The evaluation of MDHB’s Team Development Programme showed that this had been of real value for teams. While the rollout of the programme has been paused until MDHB’s Strategic Framework has been determined, aspects of the programme will continue to be utilised.
MDHB undertook its second Staff Safety Culture Survey in March 2016. Seven themes for going forward in a positive way came out of the comments and suggestions staff made. Initiatives to address the findings will form part of the Organisational Development Plan.
Implementing healthy staff initiatives that improve the working environment for staff continues, with a further roll-out of the Next Steppers programme held in October 2015.
Implementing the requirements of the Vulnerable Children Act, including ensuring the provisions that apply to new core children’s workers commencing with MDHB from 1 July 2015, are in place. Planning is underway for commencing the existing worker checks starting from 2016.
3.0 RECOMMENDATION
It is recommended
that this report be received.
Anne Amoore Manager Human Resources and Organisational Development
101
Page 3 of 19
Contents Page 1.0 Introduction 4 2.0 MDHB’s Workforce Profile 4 3.0 All DHBs’ Workforce at a Glance 5 4.0 Update of Progress 6 4.1 Organisational Culture 6 4.1.1 Strategic Framework
4.1.2 MDHB’s Team Development Programme 6 6
4.1.3 Safety Culture Survey 7 4.1.4 Bipartite Action Group Workplan 8 4.2 Leadership 8 4.3 Capacity and Capability 9 4.3.1 Regional Training Hub 9 4.3.2 Education and Development 9 4.3.3 Implementation of the Vulnerable Children Act 9 4.3.4 Healthy Staff Initiatives 13 4.3.5 Strengthening MDHB’s profile as an employer of choice 14 4.3.6 Health Professionals Recognised 14 4.3.7 Recruitment 15 4.4 MidCentral Health Workforce Programme
15
4.4.1 DHBs’ Human Resource KPIs 16 4.4.2 Other Measures 17 5.0 Summary 17 6.0 Recommendation 18 Appendix One: MDHB’s Maori Workforce Information 19
102
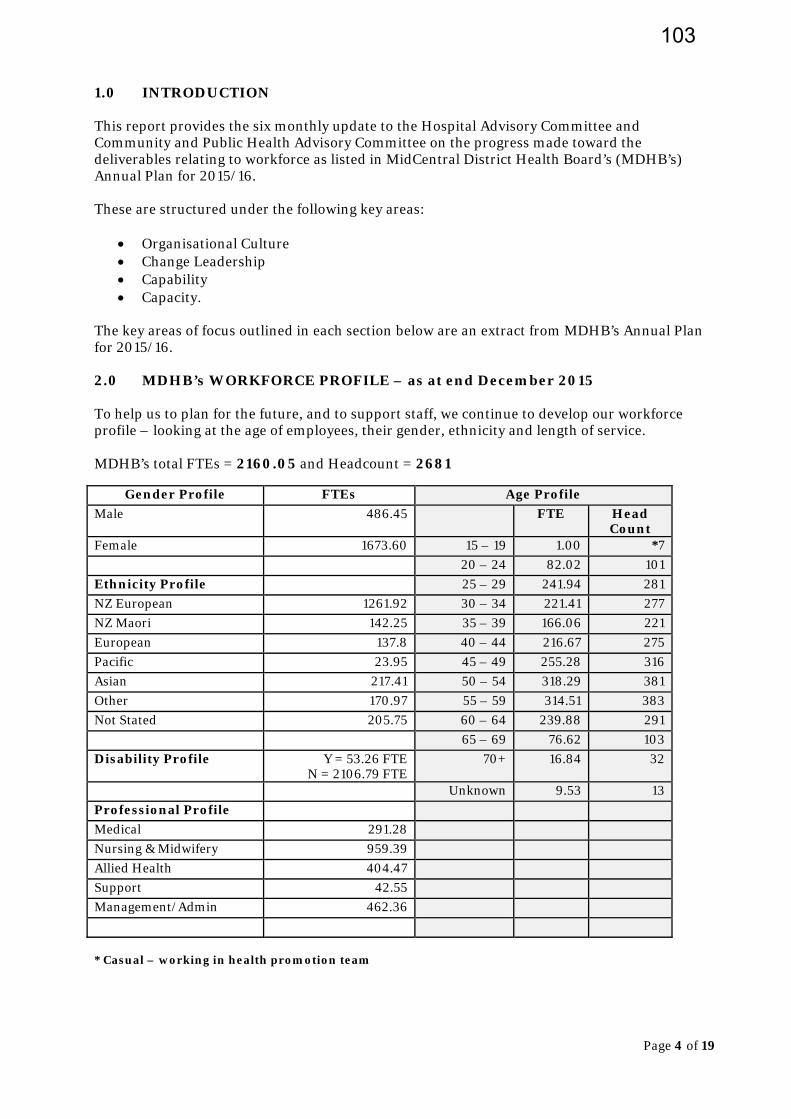
Page 4 of 19
1.0 INTRODUCTION This report provides the six monthly update to the Hospital Advisory Committee and Community and Public Health Advisory Committee on the progress made toward the deliverables relating to workforce as listed in MidCentral District Health Board’s (MDHB’s) Annual Plan for 2015/16. These are structured under the following key areas:
Organisational Culture Change Leadership Capability Capacity.
The key areas of focus outlined in each section below are an extract from MDHB’s Annual Plan for 2015/16. 2.0 MDHB’s WORKFORCE PROFILE – as at end December 2015 To help us to plan for the future, and to support staff, we continue to develop our workforce profile – looking at the age of employees, their gender, ethnicity and length of service. MDHB’s total FTEs = 2160.05 and Headcount = 2681
Gender Profile FTEs Age Profile
Male 486.45 FTE Head Count
Female 1673.60 15 – 19 1.00 *7
20 – 24 82.02 101
Ethnicity Profile 25 – 29 241.94 281
NZ European 1261.92 30 – 34 221.41 277
NZ Maori 142.25 35 – 39 166.06 221
European 137.8 40 – 44 216.67 275
Pacific 23.95 45 – 49 255.28 316
Asian 217.41 50 – 54 318.29 381
Other 170.97 55 – 59 314.51 383
Not Stated 205.75 60 – 64 239.88 291
65 – 69 76.62 103
Disability Profile Y = 53.26 FTE N = 2106.79 FTE
70+ 16.84 32
Unknown 9.53 13
Professional Profile
Medical 291.28
Nursing & Midwifery 959.39
Allied Health 404.47
Support 42.55
Management/Admin 462.36
* Casual – working in health promotion team
103
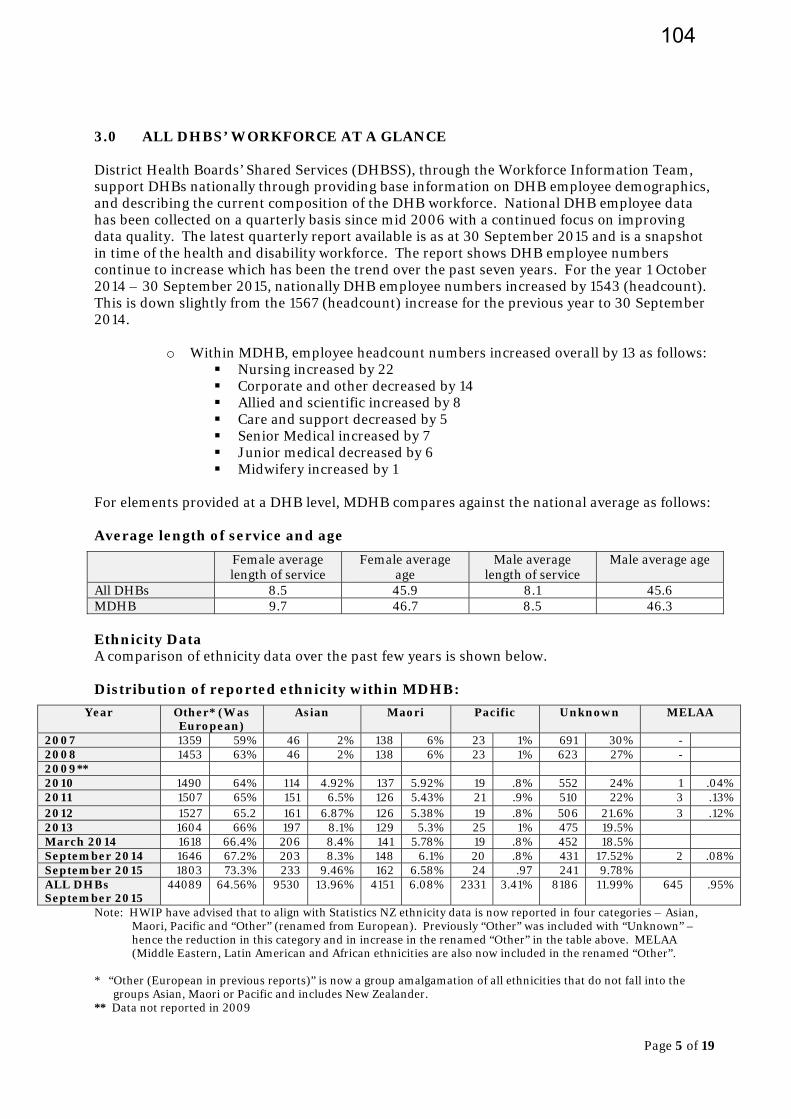
Page 5 of 19
3.0 ALL DHBS’ WORKFORCE AT A GLANCE District Health Boards’ Shared Services (DHBSS), through the Workforce Information Team, support DHBs nationally through providing base information on DHB employee demographics, and describing the current composition of the DHB workforce. National DHB employee data has been collected on a quarterly basis since mid 2006 with a continued focus on improving data quality. The latest quarterly report available is as at 30 September 2015 and is a snapshot in time of the health and disability workforce. The report shows DHB employee numbers continue to increase which has been the trend over the past seven years. For the year 1 October 2014 – 30 September 2015, nationally DHB employee numbers increased by 1543 (headcount). This is down slightly from the 1567 (headcount) increase for the previous year to 30 September 2014.
o Within MDHB, employee headcount numbers increased overall by 13 as follows:
Nursing increased by 22 Corporate and other decreased by 14 Allied and scientific increased by 8 Care and support decreased by 5 Senior Medical increased by 7 Junior medical decreased by 6 Midwifery increased by 1
For elements provided at a DHB level, MDHB compares against the national average as follows: Average length of service and age
Female average length of service
Female average age
Male average length of service
Male average age
All DHBs 8.5 45.9 8.1 45.6 MDHB 9.7 46.7 8.5 46.3 Ethnicity Data A comparison of ethnicity data over the past few years is shown below. Distribution of reported ethnicity within MDHB:
Year Other* (Was European)
Asian Maori Pacific Unknown MELAA
2007 1359 59% 46 2% 138 6% 23 1% 691 30% - 2008 1453 63% 46 2% 138 6% 23 1% 623 27% - 2009** 2010 1490 64% 114 4.92% 137 5.92% 19 .8% 552 24% 1 .04% 2011 1507 65% 151 6.5% 126 5.43% 21 .9% 510 22% 3 .13% 2012 1527 65.2 161 6.87% 126 5.38% 19 .8% 506 21.6% 3 .12% 2013 1604 66% 197 8.1% 129 5.3% 25 1% 475 19.5% March 2014 1618 66.4% 206 8.4% 141 5.78% 19 .8% 452 18.5% September 2014 1646 67.2% 203 8.3% 148 6.1% 20 .8% 431 17.52% 2 .08% September 2015 1803 73.3% 233 9.46% 162 6.58% 24 .97 241 9.78% ALL DHBs September 2015
44089 64.56% 9530 13.96% 4151 6.08% 2331 3.41% 8186 11.99% 645 .95%
Note: HWIP have advised that to align with Statistics NZ ethnicity data is now reported in four categories – Asian, Maori, Pacific and “Other” (renamed from European). Previously “Other” was included with “Unknown” – hence the reduction in this category and in increase in the renamed “Other” in the table above. MELAA (Middle Eastern, Latin American and African ethnicities are also now included in the renamed “Other”.
* “Other (European in previous reports)” is now a group amalgamation of all ethnicities that do not fall into the
groups Asian, Maori or Pacific and includes New Zealander. ** Data not reported in 2009
104

Page 6 of 19
MDHB’s Maori workforce as at December 2015 is 177 (headcount) - as at January 2015 this was 174. To give a full picture, MDHB figures include our casual staff which are excluded from the HWIP data above. Appendix One shows MDHB’s Maori workforce information broken down into job category, employment status and service. 4.0 UPDATE OF PROGRESS Key areas of focus from the Annual Plan are outlined below, and an update given on the progress that has been made to date. An in-depth update regarding some workforce initiatives, for example, occupational health and safety initiatives, is contained in the annual update from the Director Patient Safety and Clinical Effectiveness which is also being provided for the Committees’ February meetings. To avoid duplication those initiatives are not included in this report. 4.1 Organisational Culture Key areas of focus for 2015/16:
Determine the desired organisational culture Develop and implement an organisational culture change plan Implement team development programme throughout the DHB Undertake a further safety culture survey and implement a work programme to address
the findings Finalise and implement the Bipartite Action Group’s work programme for 2015/16.
4.1.1 Strategic Framework MDHB’s Chief Executive is leading the development of MDHB’s Strategic Framework which is progressing well. Workshops have been held with the Board, senior executives and leadership teams in October - December 2015. This includes determining the organisation’s vision, purpose, values and strategic imperatives. Good engagement is also being had at a number of internal staff forums and workshops, with a number of useful suggestions for wording changes being taken forward by those attending. Built into discussions on the vision, purpose and values is determining the culture we want for the organisation, and the ‘above the line/below the line behaviours that support and align to our values. Staff have been well engaged and have put forward plenty of suggestions around wording and composition of the behaviours we desire. The intention is to broaden the discussions out to the wider sector in early 2016. The process of engagement is seen as critical to the widespread acceptance and adoption of the strategy through the organisation and across the sector. This will lead to a refreshed Workforce Strategy and Organisational Development Plan. 4.1.2 MDHB’s Team Development Programme As reported to the Committee in November, to date, over 500 staff have taken part in the team development process. Some teams have not completed all components of the programme due to difficulties in releasing staff from the workplace, particularly within inpatient wards. Sixteen teams have completed all components of the programme. These teams are within Mental Health, Public Health, Medical Services, Medical Imaging, Regional Cancer Treatment Service,
105
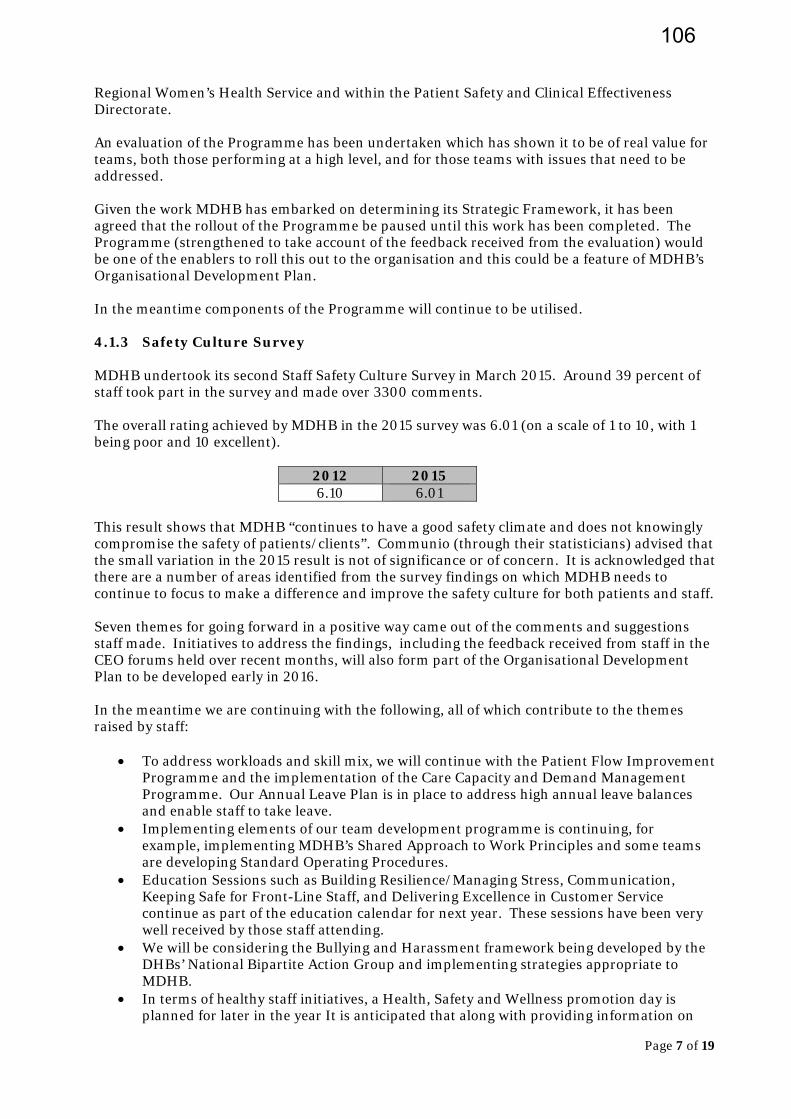
Page 7 of 19
Regional Women’s Health Service and within the Patient Safety and Clinical Effectiveness Directorate. An evaluation of the Programme has been undertaken which has shown it to be of real value for teams, both those performing at a high level, and for those teams with issues that need to be addressed. Given the work MDHB has embarked on determining its Strategic Framework, it has been agreed that the rollout of the Programme be paused until this work has been completed. The Programme (strengthened to take account of the feedback received from the evaluation) would be one of the enablers to roll this out to the organisation and this could be a feature of MDHB’s Organisational Development Plan. In the meantime components of the Programme will continue to be utilised. 4.1.3 Safety Culture Survey MDHB undertook its second Staff Safety Culture Survey in March 2015. Around 39 percent of staff took part in the survey and made over 3300 comments. The overall rating achieved by MDHB in the 2015 survey was 6.01 (on a scale of 1 to 10, with 1 being poor and 10 excellent).
2012 2015 6.10 6.01
This result shows that MDHB “continues to have a good safety climate and does not knowingly compromise the safety of patients/clients”. Communio (through their statisticians) advised that the small variation in the 2015 result is not of significance or of concern. It is acknowledged that there are a number of areas identified from the survey findings on which MDHB needs to continue to focus to make a difference and improve the safety culture for both patients and staff. Seven themes for going forward in a positive way came out of the comments and suggestions staff made. Initiatives to address the findings, including the feedback received from staff in the CEO forums held over recent months, will also form part of the Organisational Development Plan to be developed early in 2016. In the meantime we are continuing with the following, all of which contribute to the themes raised by staff:
To address workloads and skill mix, we will continue with the Patient Flow Improvement Programme and the implementation of the Care Capacity and Demand Management Programme. Our Annual Leave Plan is in place to address high annual leave balances and enable staff to take leave.
Implementing elements of our team development programme is continuing, for example, implementing MDHB’s Shared Approach to Work Principles and some teams are developing Standard Operating Procedures.
Education Sessions such as Building Resilience/Managing Stress, Communication, Keeping Safe for Front-Line Staff, and Delivering Excellence in Customer Service continue as part of the education calendar for next year. These sessions have been very well received by those staff attending.
We will be considering the Bullying and Harassment framework being developed by the DHBs’ National Bipartite Action Group and implementing strategies appropriate to MDHB.
In terms of healthy staff initiatives, a Health, Safety and Wellness promotion day is planned for later in the year It is anticipated that along with providing information on
106
Page 8 of 19
health and safety, it will be the opportunity for the promotion of healthy lifestyles and MDHB’s healthy work place initiatives. A further roll out of MDHB’s Next Steppers is planned for February 2016.
4.1.4 Bipartite Action Group (BAG) Work Plan BAG’s Work Plan for 2015/16 was reviewed and focused on:
Overseeing the implementation of MDHB’s Organisational Culture Programme – this is ongoing with updates provided to BAG on the roll out of Team Development and the work around the Strategic Framework.
Leave planning – BAG is overseeing the initiative to reduce annual leave balances across MidCentral Health. Reducing annual leave balances is also a key area of focus for Operations Directors and Service Managers. Initially the focus is on reducing annual leave balances for staff with greater than two years’ annual leave. Annual leave plans are being developed with these staff using a standard annual leave plan format. Service Managers are reporting progress on a monthly basis to the Operations Directors. Annual leave balances are tracking down.
Health and Safety – regular updates are provided to BAG on health and safety issues or concerns, including updates on any changes in legislation. The following three health and safety objectives were agreed:
1. All staff have ready access to resources and information to support understanding of their responsibilities and accountabilities within six months post the introduction of the new Health and Safety legislation the ‘Health and Safety at Work Act’.
2. The No-Lift programme is sustained as evidenced by ongoing lower rates of patient handling injuries compared to 2014-2015.
3. All services will be proactive in their support of their health and safety representatives by allowing sufficient time for them to be active and participate in health and safety related activities which will include completing audits and attendance at line/service health and safety meetings.
4.2 Leadership Key areas of focus for 2015/16
Undertaking two transformational leadership programmes. Coach and mentor clinical and operational leaders to enhance their skill base in line with
MDHB’s desired organisational culture. Roll-out a further introductory training and development programme to medical leaders. Enhance project management expertise across MDHB.
Progress to date: During 2015, a further 20 staff at team leader level attended MDHB’s first level leadership programme. The programme is delivered by an experienced educator from Hawkes Bay District Health Board. Over the past five years the programme has been delivered to around 120 team leaders and has been well received by most attending. Led by MDHB’s Nurse Director - Clinical Practice Development, two further Transformational Leadership Programmes for both MDHB and Primary Health Care staff were held again in 2015. This six day programme develops understanding of the transformational leaders’ role, identifies personal leadership style, and develops skills to lead and manage change and improvement. It blends theory and experiential learning to enable staff to apply the knowledge and skills in their workplace with access to coaches for support and advice. The programme has been delivered 14 times to over 300 participants since it commenced in 2009.
107
Page 9 of 19
Word-of-mouth feedback sees the programme having a continued waiting list. The experiential nature of the programme is a particular strength, as participants are able to practise applying the newly learned tools in a simulated setting prior to applying these in the workplace.
The Medical Leadership introductory training development programme, put in place by MDHB’s Chief Medical Officer, was held over March–May 2015. This programme included a set of tutorials aimed at upskilling another generation of medical leaders within MidCentral.
Up to 30 of our Senior Medical staff attended the sessions and actively participated (some were not able to attend all sessions due to other commitments). The programme was very well received by the SMOs attending. Some attendees may now consider progressing into Medical Head or Clinical Director roles in the future. The programme may also lead to some SMOs exploring the Associate or Fellowship training programmes of the Australasian College of Medical Administrators.
It is intended to run another programme in 2016.
4.3 Capacity and Capability Key Focus Areas for 2015/16
Expand the knowledge and use of the “Plan, Do, Study, Act” model throughout MDHB’s district.
Continue to implement Care Capacity and Demand Management (CCDM) and Releasing Time to Care (RTC).
Embed the mental health change programme. Liaise with the Regional Director of Workforce Development to increase the regional
capacity and capability of RMOs, including sharing innovations and training opportunities within the Central Region.
Implement the worker safety checks as required under the Vulnerable Children Act. Review our health and safety policies and procedures to ensure compliance with the
amendments to the Health & Safety Act. Continue the BCC innovation project Progress to date:
An update about CCDM, RTC and the mental health report was provided to the Committees at their November meeting. 4.3.1 Regional Training Hub MDHB has four representatives on the Central Region Training Hub (CRTH). Our Education and Development Steering Group is keeping an overview of the work being undertaken within the CRTH. The CRTH reports that their work streams are mainly on track. Currently the challenge with the capacity and capability of Resident Medical Officers (RMOs) is around the Medical Council of New Zealand’s (Council) new requirement that all Post-Graduate Years 1 and 2 RMOs, spend 13 weeks in a community based setting within their first two years. Community based attachments have a focus on caring for the patient and managing their illness in the context of their family and community. They can take place in a wide variety of settings, including but not exclusive to, general practice, urgent care, hospice, community mental health and other community based services.
108
Page 10 of 19
The Council have approved a staged transition, with a goal of 10 percent of interns completing a community based clinical attachment from November 2015 and working towards 100 percent compliance by November 2020. MDHB has been providing attachments in general practice for a number of years and is one of the few DHBs to do so, with our initiative being promoted by the Medical Council and the Regional Training Hub. Currently we have twelve three monthly attachments available in general practice and Hospice, which is well over the transition requirements of the Medical Council. Our goal is to move to 20 attachments over the next 3 -4 years, which again will meet the Medical Council requirements. 4.3.2 Education and Development In August 2015 MDHB launched Ko Awatea an e-learning platform provided through Counties Manukau. This has been very well received by our staff, with eleven modules currently available on MDHB’s site. To date, 621 staff have completed modules. Over time it is expected that where appropriate, a good number of education and development programmes will be delivered online, rather than face to face, or through other avenues such as workbooks. We are also opening the site up to Primary Care and other providers within our district. Over the past year, 595 internal education sessions have been held and were attended by 4972 staff members (some staff attend more than one session). MDHB’s Education and Development Steering Group met in October and determined the programmes to be delivered during 2016. Sessions will not be held during those times of the year where previous data showed attendance was not high, eg winter months, and/or when sessions were often cancelled due to poor numbers of bookings. Over the past year cancellations have decreased markedly given the rationalisation that was undertaken in 2015. Regular hour long education sessions are held throughout the year. Some of the topics covered have been changes to MDHB’s policy re Hypoglycaemia in Diabetes, Jehovah’s Witnesses beliefs about the use of blood or blood products, and the Mental Health Act and what it means for practice in the acute clinical service areas. The Cognitive Institute was on site at the end of September to deliver four three hourly workshops on Open Disclosure. These workshops focused on supporting staff who are likely to be involved in Open Disclosure with patients and families and took into account MDHB’s Open Disclosure policy and the HDC guidelines. These workshops were very well attended and received positive feedback. In addition to this, over the past six months, a number of education sessions were provided by Buddle Findlay:
Health and Safety at work – the upcoming changes to the health and safety regime in New Zealand and an understanding what the changes mean for staff and the organisation
The Lecretia Seales case and the current state of New Zealand’s law in terms of a patient’s “right to die”
Open disclosure – how and when disclosure should occur, practical tips to manage open disclosure and responding to adverse events.
The Communication education sessions introduced in 2014 continue to be very well attended. These three communication modules which build on each other can be attended separately or as a series. Due to demand, extra courses were run during 2015. All MDHB staff are eligible to attend and the sessions are appropriate to all staff. Excellent feedback has been received from those attending these sessions including staff giving examples of how they have put their learnings into practice.
109
Page 11 of 19
As a result of feedback received from the Safety Culture Survey, Building Resilience and Managing Stress workshops were put in place and these have been well attended. Those providing feedback from the sessions say that they will have a different approach to work and home life, continue to work on building their resilience, see more of the positives, and change the way they respond to situations, particularly stressful situations. Delivering Excellence in Customer Service is another workshop that was well attended and received. The content of this workshop includes what drives the way we think, feel and act and why it is important for great customer service.
The module “Keeping Safe at Work” which was targeted specifically to frontline staff who may deal with aggressive or other behaviours, has also been very well attended. 4.3.3 Implementation of the Vulnerable Children Act
Introduction & Background On 1 July 2014 the Vulnerable Children Act (“the Act”) passed into law. The Act forms a significant part of the government’s measures to protect and improve the wellbeing of vulnerable children in New Zealand, and strengthen our child protection systems. The Act requires five government departments to be jointly accountable for vulnerable children. They must work together to develop, deliver and report on a cross-agency plan to improve and protect vulnerable children’s wellbeing and their departments, and the organisations they fund to provide children’s services must have child protection policies in place. The shared legislated accountability applies to NZ Police and the Ministries of Health, Education, Justice and Social Development. MDHB has worked with its Planning and Funding staff, contacts at the Ministry of Health, and staff in other DHBs to implement the Act’s requirements within the DHB. The following outlines what has been done to date, and what is planned for 2016 and beyond. Child Protection Policy Importantly, the Act requires DHBs, School Boards and other organisations to have in place child protection policies – this requirement also applies to organisations funded to provide children’s services. MDHB has in place The Child/Young Person Abuse and/or Neglect ‘Child in Need’ Policy and Procedure, which is available on the DHB’s internet site (as it is required to be under the Act). MDHB has also ensured that every contract or funding arrangement that the DHB enters into with an independent person providing children’s services, has a child protection policy in place. Accordingly, MDHB renewed all service agreements that expired on 30 June 2014 and for contract variations or new contracts entered into after this date, where all or some of the agreement relates to children’s services, a new child protection clause has been included. Children’s Team – Horowhenua/Otaki As part of the cross-agency measures to protect vulnerable children, local Children’s Teams are being established across the country. For the MidCentral district, this Team covers the Horowhenua (Levin, Shannon, Foxton) and Otaki areas. MDHB has been involved with the local Children’s Team and working closely with the Children’s Action Plan staff to establish the Team. This has involved coordinating the safety checking process for MDHB staff who are participating in the local Children’s Team – either on the Governance Group, as part of the Children’s Team Panel, or as Lead Professionals or Child’s Action Network members.
110

Page 12 of 19
Safety checks for employees/contractors/students The Act also introduced new vetting and screening checks for government and community staff working with children (“children’s workers”). These checks apply to new and existing employees whose work involves regular or overnight contact with a child/ren and where that work takes place without a parent or guardian of the child/ren being present. Within this definition of a “children’s worker”, there are additional classifications of core worker and non-core worker, as below. A core worker is a “children’s worker” whose work in or providing a regulated service requires or allows that, when the person is present with a child/ren in the course of that work, the person –
o Is the only children’s worker present; or o Is the children’s worker who has primary responsibility for, or authority over, the
child/ren present. A non-core worker is a “children’s worker” who does not fall under the definition of a core worker – as above. The Act provides that the safety checks for “children’s workers” must include:
confirmation of the identity of the person; consideration of specific information; a police vet; a risk assessment that assesses the risk the person would pose to the safety of
children if employed or engaged as a children's worker.
MDHB has been safety checking all new “core” children’s workers employed to provide regulated services to children since the safety checking requirements came into force on 1 July 2015. This has involved developing a list of “core” children’s workers that are employed by MDHB, and a flowchart to help determine if a particular role falls under the requirements of the Act. Related processes have been updated to embed the new procedures. This work has been done in conjunction with other DHBs as part of the Vulnerable Children Act DHBs Working Group, of which one of our Human Resource Consultants is the representative for the Lower North Island. The matter of screening and vetting students prior to them being placed within the DHB for clinical placement has been challenging. Under the Act, work that is undertaken as part of an educational or vocational training course – even if unpaid – is also subject to the requirements of the Act. There is however, work being undertaken by the Ministry of Health and the Tertiary Education Commission on the engagement of students and it is hoped that ultimately it will be the educational institutions that will complete the safety checks prior to the student starting their placement. The appointment of honorary staff at MDHB has been reviewed in light of the Act, and the requirement to conduct safety checks for unpaid “workers” has been embedded in the appointment process. In relation to contractors engaged by MDHB, Human Resources have worked with the Contracts Department to incorporate the requirements of the Act into the contract process, as applicable. MDHB has also written to its main contracted organisations (for example, Spotless, Medlab, NZ Blood, Central MRS, Geneva) setting out the DHB’s expectation that the contracted organisation will comply with the new legislation where they are providing staff to work on our hospital sites and in our services. Since 1 July 2015, MDHB has been embedding procedures for safety checking for all new “core” workers as well as holding education sessions for managers on the requirements of the Act and
111
Page 13 of 19
the importance they need to be given when employing new core worker staff. Various workshops have also been held with Human Resources staff to ensure they have a good understanding of the Act’s requirements. Human Resources have created and made available to managers in the DHB a range of resources to help navigate the VCA requirements. These are found on the Human Resources section of the intranet. As part of this work, various HR forms and processes have been reviewed and updated to cater for the new requirements, for example, making changes to application forms, creating information sheets and checklists for managers and prospective employees, updating offer templates, and so on. Looking ahead to 2016 and beyond For new “non-core” children’s workers, the requirements begin on 1 July 2016. Further requirements to safety check existing core workers must occur by 1 July 2018, and all other existing non-core staff by 1 July 2019. Every children’s worker employed by MDHB must then be safety checked within three years of the date that person was safety-checked in compliance with the Act. Planning is underway for commencing the existing worker checks starting from 2016. Staggering the implementation of the existing worker checks will avoid placing additional administrative burden on managers, Human Resources staff, and the NZ Police Vetting Services. For MDHB, key services dealing with children will be the focus of the initial effort, for example, Child Health Services, CAFS, Public Health Nursing Service, Women’s Health Services, Emergency Department. 4.3.4 Healthy Staff Initiatives As part of the Safety Culture Survey and other surveys we have conducted over the past few years, the overwhelming response was that staff wanted more wellness programmes with a focus on fitness and nutrition. To this end, we decided to try something new and in November 2014 launched a web-based wellness initiative referred to as “tracksuit-inc®”. This programme is available to all staff and their families and provides the opportunity to participate in a range of health-related activities throughout the year. The initiative has been well received by staff with the web-site having over 16487 hits, or an average of 1268 views per month. To date, 238 staff have completed the health questionnaire and 285 staff have participated in health challenges. MDHB has three loan bikes available for staff use. Anyone who works at Palmerston North Hospital can borrow these bikes, whether it’s for a week to get around, or just to head to a meeting. Safety equipment is also available and the bikes continue to be well utilised by our staff. A further roll-out of MDHB’s Next Steppers six week fitness programme was held in October 2015 with 130 staff participating. This programme encourages participants to bike, cycle, swim or dance their way around New Zealand. This is the sixth roll-out over the past years and over 930 staff have taken part in the programme. It is intended to have a further roll-out in February 2016. MDHB’s Staff at MidCentral Advantage Scheme (SMASCH) continues to be developed and well received by staff. A good number of new organisations joined the scheme. Free financial assistance was offered to our staff by ANZ. one of our SMACH partners.
112
Page 14 of 19
4.3.5 Strengthening MDHB’s Profile as an Employer of Choice During 2015, MDHB health professionals, supported by Human Resources, attended and held a number of events promoting careers in health, including:
Careers Expo ‘Sort it’ sponsored by the Mayor of Palmerston North and the Mayor of Manawatu on 5 May 2015. This Careers Expo provided workshops, seminars and forums throughout the day with a range of job, career, training and development focused topics covered
Careers Day at Horowhenua College in Levin, attended by other Horowhenua Schools A Health Careers event at Dannevirke and Feilding High Schools, and an event at Otaki
College MDHB’s ‘Careers in Health’ Day was held in the Education Centre at Palmerston North
Hospital campus on 19 June. A range of health professionals including medical, midwives, social work, medical imaging, radiation therapy, pharmacy, physiotherapy, St John paramedics and MASH attended with displays. Hands-on activities included CPR and a wheelchair obstacle course. Some traditionally hard to recruit to areas, for example Cardiac Physiology, attended for the first time. Schools were encouraged to send students who are considering a career in health and wanted the opportunity to find out more about a particular profession, or about the range of professions. Students attended from Palmerston North Girls’ High, Palmerston North Boys’ High, Freyberg High, St Peter’s College, Longburn Adventist College and Queen Elizabeth College. Students were able to speak directly to health professionals, hear their stories and experience some of the work involved in the health professions.
MDHB had a Careers Stand at the “More Vibes Day” held at Te Hotu Manawa O Rangitaane O Manawatu Marae on Saturday 3 October
MDHB representatives attended a biennial community Careers Event in Dannevirke The final event for the year was part of a Wellness Day run by a senior Boys High student
for senior high school students just prior to exams, held at the Convention Centre and attended by MDHB.
Planning for 2016 is already underway with a stand booked at the Sort It Expo on 19 May and the MDHB Careers Day on 24 June. With the appointment of Doug Edwards as the Manager, Maori Workforce Development, we look forward to continuing this work and forging stronger relationships with young Maori across the DHB. At the end of November 2015, seventeen first year House Officers (PGY1’s) commenced with MDHB and spent their first four days orientating before taking up their clinical duties. Seven of the House Officers had spent their final trainee intern year at MidCentral through the Wellington Otago School of Medicine. MDHB’s Chief Executive and Chief Medical Officer attended an informal “get together” evening to welcome the House Officers and wish them well in their future careers. Also in attendance were other management representatives and clinical supervisors. The House Officers introduced each other to the group, and it was interesting to hear about their wide ranging interests outside of medicine. The evening was rounded off by informal discussions and refreshments. 4.3.6 Health Professionals Recognised Over the past six months, our health professionals have been recognised in the following ways:
World Pharmacist Day was celebrated in September with this year’s theme being “Pharmacist: Your Partner in Health”
Social Workers celebrated in September Occupational Therapy Week was celebrated in October
113
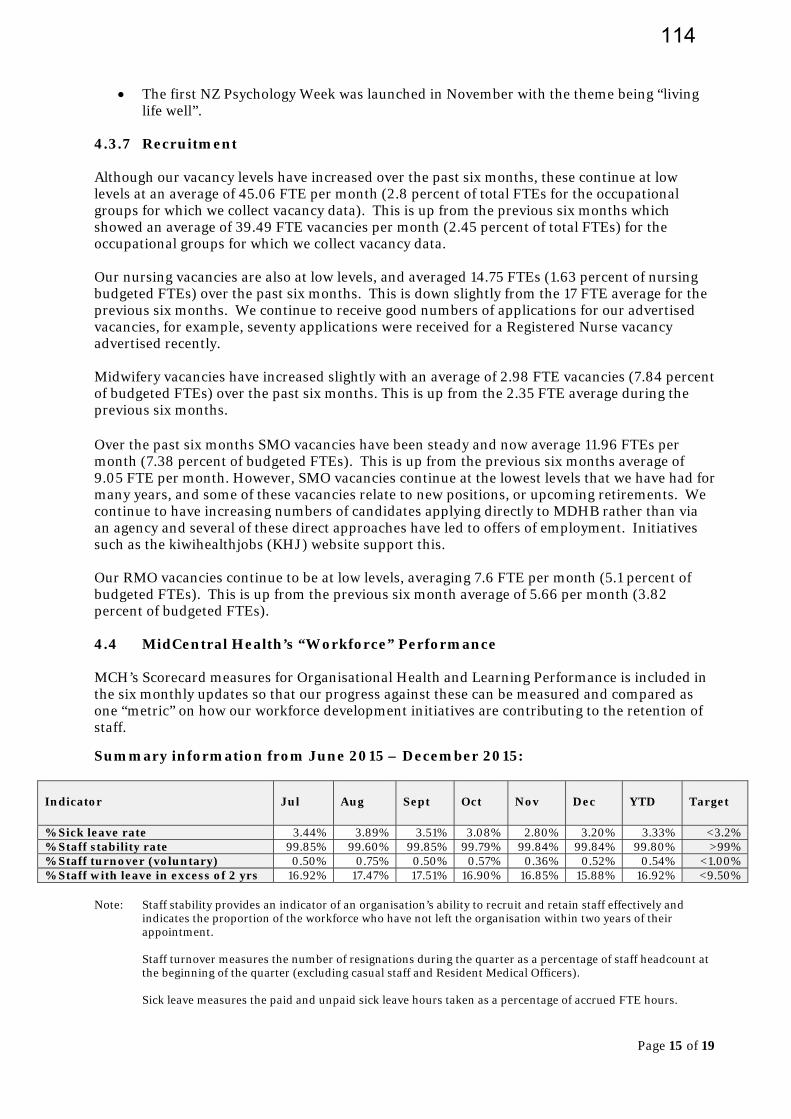
Page 15 of 19
The first NZ Psychology Week was launched in November with the theme being “living life well”.
4.3.7 Recruitment Although our vacancy levels have increased over the past six months, these continue at low levels at an average of 45.06 FTE per month (2.8 percent of total FTEs for the occupational groups for which we collect vacancy data). This is up from the previous six months which showed an average of 39.49 FTE vacancies per month (2.45 percent of total FTEs) for the occupational groups for which we collect vacancy data. Our nursing vacancies are also at low levels, and averaged 14.75 FTEs (1.63 percent of nursing budgeted FTEs) over the past six months. This is down slightly from the 17 FTE average for the previous six months. We continue to receive good numbers of applications for our advertised vacancies, for example, seventy applications were received for a Registered Nurse vacancy advertised recently. Midwifery vacancies have increased slightly with an average of 2.98 FTE vacancies (7.84 percent of budgeted FTEs) over the past six months. This is up from the 2.35 FTE average during the previous six months. Over the past six months SMO vacancies have been steady and now average 11.96 FTEs per month (7.38 percent of budgeted FTEs). This is up from the previous six months average of 9.05 FTE per month. However, SMO vacancies continue at the lowest levels that we have had for many years, and some of these vacancies relate to new positions, or upcoming retirements. We continue to have increasing numbers of candidates applying directly to MDHB rather than via an agency and several of these direct approaches have led to offers of employment. Initiatives such as the kiwihealthjobs (KHJ) website support this. Our RMO vacancies continue to be at low levels, averaging 7.6 FTE per month (5.1 percent of budgeted FTEs). This is up from the previous six month average of 5.66 per month (3.82 percent of budgeted FTEs). 4.4 MidCentral Health’s “Workforce” Performance MCH’s Scorecard measures for Organisational Health and Learning Performance is included in the six monthly updates so that our progress against these can be measured and compared as one “metric” on how our workforce development initiatives are contributing to the retention of staff.
Summary information from June 2015 – December 2015:
Indicator
Jul
Aug
Sept
Oct
Nov
Dec
YTD
Target
% Sick leave rate 3.44% 3.89% 3.51% 3.08% 2.80% 3.20% 3.33% <3.2% % Staff stability rate 99.85% 99.60% 99.85% 99.79% 99.84% 99.84% 99.80% >99% % Staff turnover (voluntary) 0.50% 0.75% 0.50% 0.57% 0.36% 0.52% 0.54% <1.00% % Staff with leave in excess of 2 yrs 16.92% 17.47% 17.51% 16.90% 16.85% 15.88% 16.92% <9.50%
Note: Staff stability provides an indicator of an organisation’s ability to recruit and retain staff effectively and
indicates the proportion of the workforce who have not left the organisation within two years of their appointment.
Staff turnover measures the number of resignations during the quarter as a percentage of staff headcount at the beginning of the quarter (excluding casual staff and Resident Medical Officers). Sick leave measures the paid and unpaid sick leave hours taken as a percentage of accrued FTE hours.
114
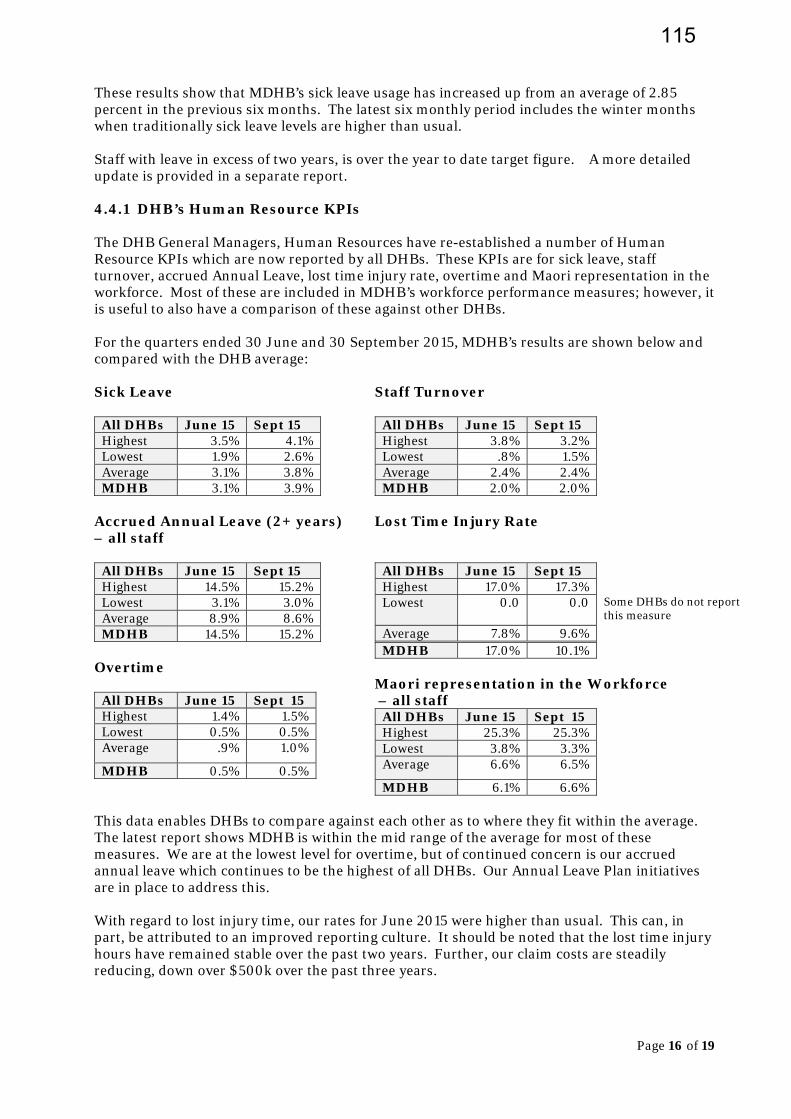
Page 16 of 19
These results show that MDHB’s sick leave usage has increased up from an average of 2.85 percent in the previous six months. The latest six monthly period includes the winter months when traditionally sick leave levels are higher than usual. Staff with leave in excess of two years, is over the year to date target figure. A more detailed update is provided in a separate report. 4.4.1 DHB’s Human Resource KPIs The DHB General Managers, Human Resources have re-established a number of Human Resource KPIs which are now reported by all DHBs. These KPIs are for sick leave, staff turnover, accrued Annual Leave, lost time injury rate, overtime and Maori representation in the workforce. Most of these are included in MDHB’s workforce performance measures; however, it is useful to also have a comparison of these against other DHBs. For the quarters ended 30 June and 30 September 2015, MDHB’s results are shown below and compared with the DHB average: Sick Leave
All DHBs June 15 Sept 15 Highest 3.5% 4.1% Lowest 1.9% 2.6% Average 3.1% 3.8% MDHB 3.1% 3.9%
Staff Turnover
All DHBs June 15 Sept 15 Highest 3.8% 3.2% Lowest .8% 1.5% Average 2.4% 2.4% MDHB 2.0% 2.0%
Accrued Annual Leave (2+ years) – all staff
All DHBs June 15 Sept 15 Highest 14.5% 15.2% Lowest 3.1% 3.0% Average 8.9% 8.6% MDHB 14.5% 15.2%
Lost Time Injury Rate
All DHBs June 15 Sept 15 Highest 17.0% 17.3% Lowest 0.0 0.0
Some DHBs do not report this measure
Average 7.8% 9.6%
Overtime
All DHBs June 15 Sept 15 Highest 1.4% 1.5% Lowest 0.5% 0.5% Average .9% 1.0%
MDHB 0.5% 0.5%
MDHB 17.0% 10.1% Maori representation in the Workforce – all staff
All DHBs June 15 Sept 15 Highest 25.3% 25.3% Lowest 3.8% 3.3% Average 6.6% 6.5%
MDHB 6.1% 6.6%
This data enables DHBs to compare against each other as to where they fit within the average. The latest report shows MDHB is within the mid range of the average for most of these measures. We are at the lowest level for overtime, but of continued concern is our accrued annual leave which continues to be the highest of all DHBs. Our Annual Leave Plan initiatives are in place to address this. With regard to lost injury time, our rates for June 2015 were higher than usual. This can, in part, be attributed to an improved reporting culture. It should be noted that the lost time injury hours have remained stable over the past two years. Further, our claim costs are steadily reducing, down over $500k over the past three years.
115
Page 17 of 19
4.4.2 Other Measures In addition to those workforce measures for Organisational Health and Learning in the balanced scorecard, and the feedback we have received from the various surveys of our staff as outlined in this report, our exit interview process allows resigning employees to participate and provide feedback about their experiences at MDHB. This process is working well. Although it is not compulsory, there is an option to complete it anonymously. Seventy two percent (down from 80 percent) of employees who completed the survey over the past six months, stated that they would return to work at MDHB. The positive experiences/comments that people highlighted, and what they enjoyed about their jobs were:
Enjoyed my time with MidCentral. I had a very fulfilling position and enjoyed working with and caring for patients. Also great staff – I will miss the working environment
I’ve been happy working at MidCentral for the last 13 years from starting as a new graduate
Happy in my work Enjoyed my time and had much respect for the department in which I worked My time with MDHB has always been interesting and never a dull moment. There will
always be challenges within the public health system in terms of capacity and capability. I will miss the people and the environment greatly.
Suggestions for improvement:
Several people suggested that some tasks currently undertaken by health professionals could be undertaken by administrative staff which would be less costly and free up time for health professionals to provide direct patient care.
Some less than positive experiences people highlighted were:
Administration pay rates are low Team leader/supervisor did not have the skills to lead the team and had no
understanding of the work required. Staff not treated equally or fairly Bullying behaviour occurs and needs better management Focus tends to be on targets, rather than patient care Not enough Allied Health staff Management does not acknowledge staff hard work, efforts and achievements.
The Exit Survey process provides the opportunity for MDHB to address any of these less than positive experiences staff members report. Where the employee gave details of the area in which they worked, the improvements they have suggested or issues they have highlighted are brought to the attention of the appropriate senior manager. Often these have been addressed, or are being addressed. 5.0 SUMMARY Our workforce development initiatives have contributed to our vacancy rates continuing to be at low levels. This, together with a number of our longer term strategies, has contributed to the continuing positive results against our staff stability target of 99 percent on average, per month or better (tracking YTD 99.80 percent), staff turnover target of <1 percent on average per month or better (tracking YTD .54 percent). Sick leave is tracking at 3.33 percent YTD, up from the previous six months average of 2.85 percent.
116
Page 18 of 19
While our vacancies are at low levels and we are achieving positive results against our scorecard measures, we are mindful that this can change as the global economy improves. With this in mind, we are continuing to focus on our workforce initiatives and we are committed to improving the working environment for our staff. Looking forward, the focus will be continue to be on the transformational culture change within MDHB to support our aim to be a high performing health system where all staff are fully engaged in setting and delivering on the organisation’s strategic direction. The most significant initiative is the development, led by the CEO, of MDHB’s Strategic Framework which includes our vision, purpose, values and strategic imperatives. The first draft of the Framework was developed on the basis of the workshops held in October and December. This is ongoing work and there has been good engagement and lively debate at internal forums and workshops held with staff. A number of useful suggestions have been taken forward in wording changes and it is expected that the Strategic Framework will be finalised in April 2016. Conversations will also be had with community groups, providers and other stakeholders about our Framework and plan, with a view to hearing what they consider should be progressed as a priority and what they think needs to occur. Following this a refreshed Workforce Strategy and an Organisational Development Plan to support the strategic direction set will be developed and agreed. The plan will include initiatives to address the safety culture survey findings and other feedback that has been received. 6.0 RECOMMENDATION It is recommended That this report be received.
Anne Amoore Manager Human Resources and Organisational Development
117

Page 19 of 19
Appendix One MDHB’s Maori Workforce Information The tables below show the headcount and percentage of the total Maori workforce in the “category”. The tables below show the headcount and percentage of the total Maori workforce in the “category”. Professional Profile
Medical 12 6.78% Nursing/Midwifery 75 42.37% Allied Health 42 23.73% Support 2 1.13% Management/Administration 46 25.99% Total 177
Employment Status
Permanent 152 85.88% Temporary 12 6.78% Casual 13 7.34% Total 177
Age Profile
15 - 19 3 1.69% 20 -24 7 3.95% 25 -29 17 9.60% 30 -34 19 10.73% 35 -39 20 11.30% 40 -44 23 12.99% 45 -49 20 11.30% 50 -54 31 17.51% 55 -59 14 7.91% 60 -64 11 6.21% 65 -69 6 3.39% 70+ 4 2.26% Unknown 2 1.13% Total 177
Service Line
Child Health 4 2.26% Clinical Support 5 2.82% Corporate Services 10 5.65% Dental Health 2 1.13% Elderly Health 9 5.08% Emergency 6 3.39% Enable NZ 13 7.34% Funding 2 1.13% Maori Health 9 5.08% ICU/Anaesthetics 3 1.69% Internal Medicine 17 9.60% Mental Health 34 19.21% Patient Safety & Clinical Effectiveness 9 5.08% Primary Health 1 0.56% Public Health 12 6.78% Regional Cancer Treatment Service 6 3.39% Rehab & Therapy 8 4.52% Rural Health 2 1.13% Surgical Specialties 17 9.60% Women's Health 8 4.52% Total 177
118
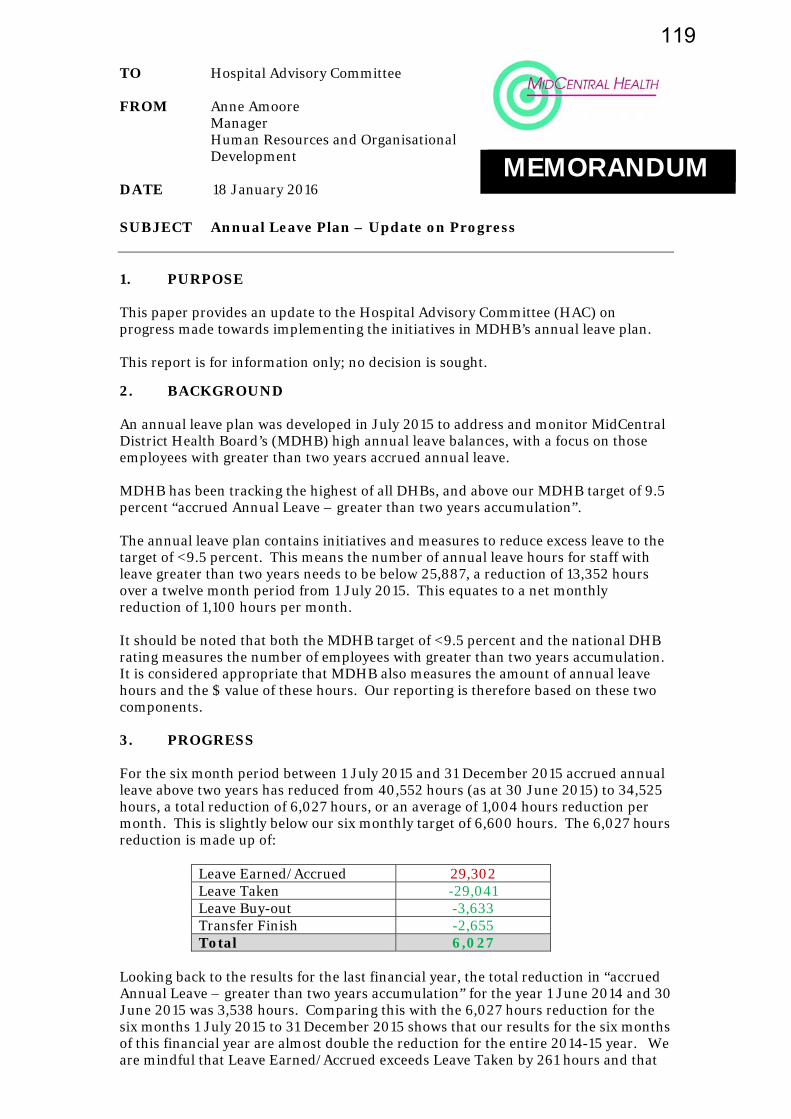
TO Hospital Advisory Committee FROM Anne Amoore
Manager Human Resources and Organisational Development
DATE 18 January 2016 SUBJECT Annual Leave Plan – Update on Progress
1. PURPOSE This paper provides an update to the Hospital Advisory Committee (HAC) on progress made towards implementing the initiatives in MDHB’s annual leave plan. This report is for information only; no decision is sought.
2. BACKGROUND An annual leave plan was developed in July 2015 to address and monitor MidCentral District Health Board’s (MDHB) high annual leave balances, with a focus on those employees with greater than two years accrued annual leave. MDHB has been tracking the highest of all DHBs, and above our MDHB target of 9.5 percent “accrued Annual Leave – greater than two years accumulation”. The annual leave plan contains initiatives and measures to reduce excess leave to the target of <9.5 percent. This means the number of annual leave hours for staff with leave greater than two years needs to be below 25,887, a reduction of 13,352 hours over a twelve month period from 1 July 2015. This equates to a net monthly reduction of 1,100 hours per month. It should be noted that both the MDHB target of <9.5 percent and the national DHB rating measures the number of employees with greater than two years accumulation. It is considered appropriate that MDHB also measures the amount of annual leave hours and the $ value of these hours. Our reporting is therefore based on these two components. 3. PROGRESS For the six month period between 1 July 2015 and 31 December 2015 accrued annual leave above two years has reduced from 40,552 hours (as at 30 June 2015) to 34,525 hours, a total reduction of 6,027 hours, or an average of 1,004 hours reduction per month. This is slightly below our six monthly target of 6,600 hours. The 6,027 hours reduction is made up of:
Leave Earned/Accrued 29,302 Leave Taken -29,041 Leave Buy-out -3,633 Transfer Finish -2,655 Total 6,027
Looking back to the results for the last financial year, the total reduction in “accrued Annual Leave – greater than two years accumulation” for the year 1 June 2014 and 30 June 2015 was 3,538 hours. Comparing this with the 6,027 hours reduction for the six months 1 July 2015 to 31 December 2015 shows that our results for the six months of this financial year are almost double the reduction for the entire 2014-15 year. We are mindful that Leave Earned/Accrued exceeds Leave Taken by 261 hours and that
MEMORANDUM
119
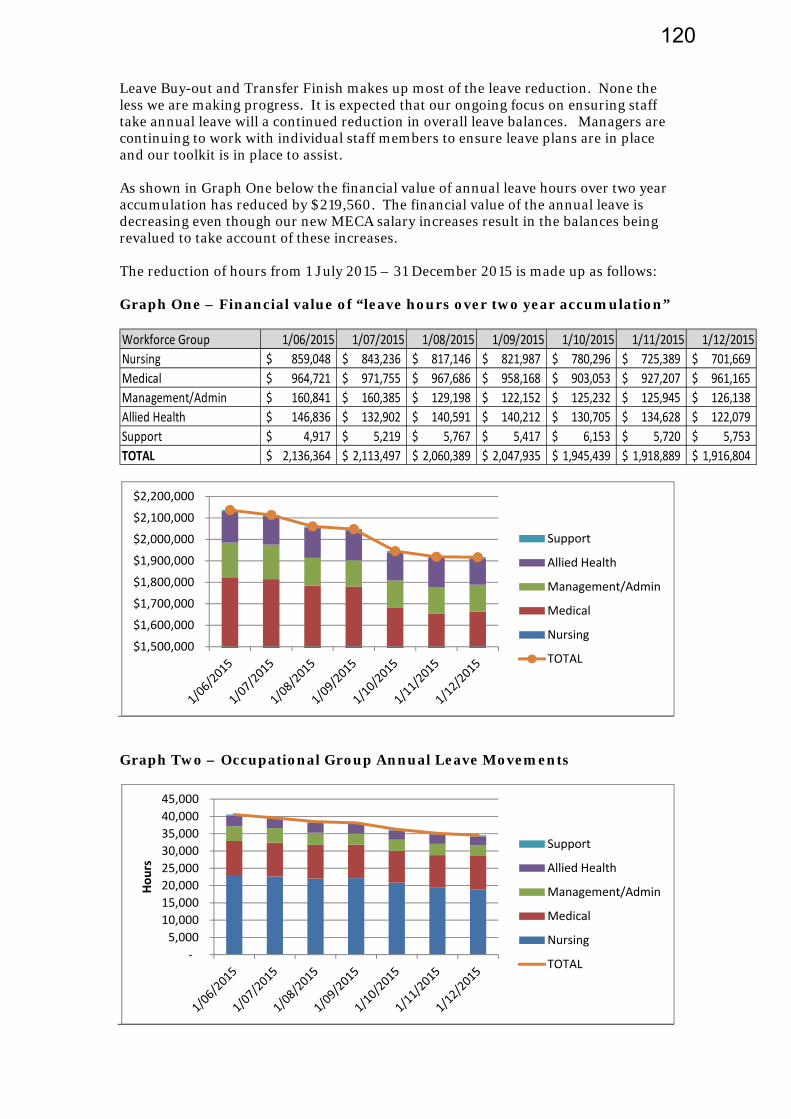
Leave Buy-out and Transfer Finish makes up most of the leave reduction. None the less we are making progress. It is expected that our ongoing focus on ensuring staff take annual leave will a continued reduction in overall leave balances. Managers are continuing to work with individual staff members to ensure leave plans are in place and our toolkit is in place to assist. As shown in Graph One below the financial value of annual leave hours over two year accumulation has reduced by $219,560. The financial value of the annual leave is decreasing even though our new MECA salary increases result in the balances being revalued to take account of these increases. The reduction of hours from 1 July 2015 – 31 December 2015 is made up as follows: Graph One – Financial value of “leave hours over two year accumulation” Workforce Group 1/06/2015 1/07/2015 1/08/2015 1/09/2015 1/10/2015 1/11/2015 1/12/2015
Nursing 859,048$ 843,236$ 817,146$ 821,987$ 780,296$ 725,389$ 701,669$
Medical 964,721$ 971,755$ 967,686$ 958,168$ 903,053$ 927,207$ 961,165$
Management/Admin 160,841$ 160,385$ 129,198$ 122,152$ 125,232$ 125,945$ 126,138$
Allied Health 146,836$ 132,902$ 140,591$ 140,212$ 130,705$ 134,628$ 122,079$
Support 4,917$ 5,219$ 5,767$ 5,417$ 6,153$ 5,720$ 5,753$
TOTAL 2,136,364$ 2,113,497$ 2,060,389$ 2,047,935$ 1,945,439$ 1,918,889$ 1,916,804$
Graph Two – Occupational Group Annual Leave Movements
$1,500,000
$1,600,000
$1,700,000
$1,800,000
$1,900,000
$2,000,000
$2,100,000
$2,200,000
Support
Allied Health
Management/Admin
Medical
Nursing
TOTAL
‐
5,000
10,000
15,000
20,000
25,000
30,000
35,000
40,000
45,000
Hours
Support
Allied Health
Management/Admin
Medical
Nursing
TOTAL
120
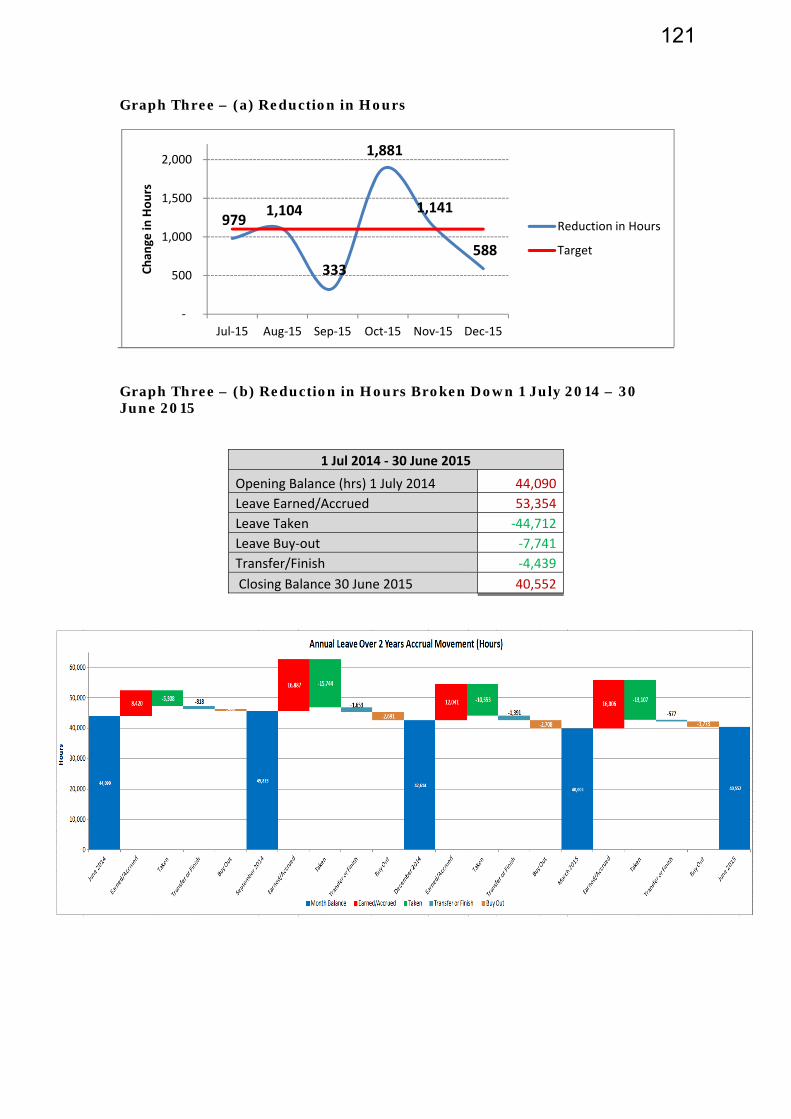
Graph Three – (a) Reduction in Hours
Graph Three – (b) Reduction in Hours Broken Down 1 July 2014 – 30 June 2015
1 Jul 2014 ‐ 30 June 2015
Opening Balance (hrs) 1 July 2014 44,090
Leave Earned/Accrued 53,354
Leave Taken ‐44,712
Leave Buy‐out ‐7,741
Transfer/Finish ‐4,439
Closing Balance 30 June 2015 40,552
979 1,104
333
1,881
1,141
588
‐
500
1,000
1,500
2,000
Jul‐15 Aug‐15 Sep‐15 Oct‐15 Nov‐15 Dec‐15
Chan
ge in
Hours
Reduction in Hours
Target
121

Graph Three – (c) Reduction in Hours Broken Down 1 July 2015 – 31 December 2015
1 July ‐ 31 December 2015
Period July August Sept Oct Nov Dec
Reduction 1 July ‐ 31 Dec
2015
Leave Earned/Accrued 4,446 6,418 4,765 4,366 4,946 4361
Leave Taken ‐4,553 ‐5,418 ‐4,334 ‐5,055 ‐5,167 ‐4514
Leave Buy‐out ‐796 ‐1,776 ‐502 ‐811 ‐741 ‐435
Transfer/Finish ‐76 ‐328 ‐263 ‐381 ‐179 Nil
‐979 ‐1,104 ‐334 ‐1,881 ‐1,141 ‐588 ‐6,027
40,552 38,136 34,526
15,630 13,674
‐14,304
‐14,737‐667
‐559‐3,074
‐1,988
0
10,000
20,000
30,000
40,000
50,000
60,000
Hours
Annual Leave Over 2 Years Accrual Movement (Hours)
Buy Out
Transfer or Finish
4. LONG SERVICE LEAVE
The Committee asked at their November meeting that long service leave balances also be provided and this is shown in the table below. It should be noted that some years ago our collective employment agreements provided for long service leave to be taken within five years of entitlement. As part of long service leave provisions being renegotiated over the past few years, the five year limit was negotiated out of most agreements. Long Service Leave is not defined as annual leave in terms of the Holidays Act, therefore, any provisions regarding buyout or taking of annual leave do not apply to Long Service Leave. Like most other DHBs, MDHB has not determined a limit on when our employees can take their long service leave.
However, Long Service Leave balances are provided to managers as part of monthly leave reporting and form part of annual leave planning with staff members.
122
Page 5 of 5
5. SUMMARY
Progress is being made to reduce our “accrued Annual Leave – greater than two years accumulation”. For the six month period between 1 July 2015 and 31 December 2015 accrued annual leave above two years has reduced from 40,552 hours to 34,525 hours, a total reduction of 6,027 hours, or an average of 1,004 hours reduction per month. This is slightly below our six monthly target of 6,600 hours. The reduction does compare favourably with the total reduction in “accrued Annual Leave – greater than two years accumulation” for the year between 1 June 2014 and 30 June 2015 which was 3538 hours.
It is acknowledged that Leave Earned/Accrued remains higher than Leave Taken and that Leave Buy-out and Transfer/Finish makes up most of the leave reduction. However, we are making progress. Our focus will continue to be on reducing annual leave balances to allow our employees the opportunity for rest and recreation and to enjoy regular breaks from the workplace. 6. RECOMMENDATION It is recommended
that this report be received.
Anne Amoore Manager, Human Resources and Organisational Development
123

COPY TO
FR
DA
SUBJ
1. This reis soug 2. The Coam givicommidirectio In Octothe orgstrateg MidCeninvolveachievelook foevaluat At a mastructu I believwell poany chaplenty
O:
TO HosComComDisa
ROM Cha
ATE 22 D
ECT Ter
Com
PURPOS
eport is proght.
SUMMAR
ommittees’ing considittee, its keon.
ober 2015, ganisation.gic imperat
ntral DHBed investmed a lot ove
orward agaite and rene
anagemenures within
ve it is impositioned toange will b of time to
spital Advimmunity &mmittee ability Sup
airman
December
rms of Remmittee S
SE
ovided for t
RY
’ terms of reration to
ey focus, an
the DHB c This fram
tives for th
B’s last formment in 10 p
er this periin. Recentew the org
t and opern the DHB t
portant thao support t
be in place fully debat
sory Comm& Public He
pport Advis
2015
eference RStructure
the Comm
reference a our commnd member
commencemework wil
e next five
mal strategpriority areiod and not changes wanisation’s
rational levto ensure t
at as governthe achieve for the newte this mat
mittee ealth Advis
sory Comm
Review, ae
mittee’s con
are due for mittee struc
rship, to en
ed the establl establish to 10 year
gic plan coveas and waow has a strwithin the s strategic
vel, the CEOthey are ali
nors we alsement of ow financialtter.
sory
mittee
and
sideration
their regulcture, inclunsure it is a
blishment h our visionrs.
vered the pas successfurong foundDHB have direction.
O is leadinigned to ou
so look at our strategil year, ie 1
CMHPPPF
MEMO
and discu
lar review.uding the coaligned to
of a strategn, purpose,
period 200ully deliverdation, howe highlighte
ng review our future d
our structuic framewo July 2016
Chairman’s OMidCentral DHHeretaunga StPO Box 2056 Palmerston NoPhone Fax
+64 +64
ORAN
ssion. No
. At the samonfiguratio our strateg
gic framew, values an
5 to 2015. red. MidCewever it is ted the need
f leadershidirection.
ures to ensuork. I envis so that we
Office HB treet
orth 4440 (6) 350 8841 (6) 355 0616
DUM
decision
me time, I on of each gic
work for d
It entral time to d to re-
ip
ure we are sage that have
124

One change to the structure has already been made, being the amalgamation of three audit committees into a single Finance, Risk and Audit Committee (FRAC). This change will come into effect on 1 January 2016. Membership initially will be those who previously served on the Group Audit Committee, with two new committee members to be recruited, being an independent chair with financial expertise and a member with clinical risk management experience. (Refer Appendix A for a copy of the draft terms of reference.) Looking at the configuration of our statutory committees, HAC, CPHAC and DSAC, I see these playing an important part in the achievement of our strategic goals. My early thinking is HAC should increase its focus on quality and clinical governance, and that CPHAC’s focus on strategy development and implementation should increase. I also suggest that to improve the effectiveness of DSAC and to ensure a disability perspective is incorporated into all our strategies, this committee should merge with CPHAC. These are suggestions only and I would like to hear the Committees’ views. These would then be pulled together for a workshop at which we can give more in-depth consideration to this matter, including the terms of reference for each Committee. Meantime, it is suggested that the current terms of reference remain in place. In respect of membership, the three statutory committees benefit from external membership. It is proposed that this membership continue through until the end of the current term (30 June 2017). This will ensure continuity of experience and knowledge, including through the 2016 DHB election process. 3. RECOMMENDATION It is recommended: that the report be received, and members’ views on future committee structures
and roles be provided to the Board Chair. 4. DISCUSSION 4.1 Legislative Requirements Under the NZ Health & Disability Act 2000, DHBs must establish: a committee to advise on health improvement measures, called the community and
public health advisory committee, and must provide for Maori representation on the committee;
a committee to advise on disability issues, called the disability support advisory
committee, and must provide for Maori representation on the community; and
a committee to advise on matters relating to hospitals, called the hospital advisory committee, and must provide for Maori representation on the committee.
The legislation sets out the functions of each committee and these are reflected in the current terms of reference which MidCentral DHB has in place for HAC, CPHAC and
125
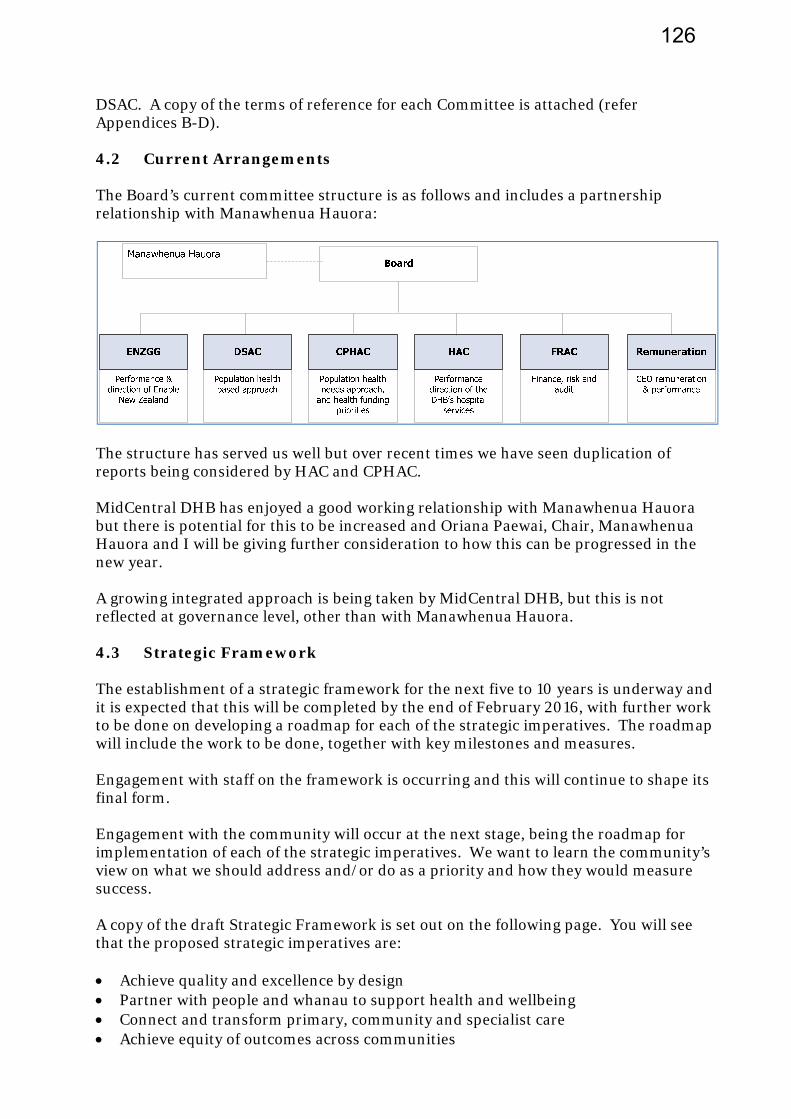
DSAC. A copy of the terms of reference for each Committee is attached (refer Appendices B-D). 4.2 Current Arrangements The Board’s current committee structure is as follows and includes a partnership relationship with Manawhenua Hauora:
The structure has served us well but over recent times we have seen duplication of reports being considered by HAC and CPHAC. MidCentral DHB has enjoyed a good working relationship with Manawhenua Hauora but there is potential for this to be increased and Oriana Paewai, Chair, Manawhenua Hauora and I will be giving further consideration to how this can be progressed in the new year. A growing integrated approach is being taken by MidCentral DHB, but this is not reflected at governance level, other than with Manawhenua Hauora. 4.3 Strategic Framework The establishment of a strategic framework for the next five to 10 years is underway and it is expected that this will be completed by the end of February 2016, with further work to be done on developing a roadmap for each of the strategic imperatives. The roadmap will include the work to be done, together with key milestones and measures. Engagement with staff on the framework is occurring and this will continue to shape its final form. Engagement with the community will occur at the next stage, being the roadmap for implementation of each of the strategic imperatives. We want to learn the community’s view on what we should address and/or do as a priority and how they would measure success. A copy of the draft Strategic Framework is set out on the following page. You will see that the proposed strategic imperatives are: Achieve quality and excellence by design Partner with people and whanau to support health and wellbeing Connect and transform primary, community and specialist care Achieve equity of outcomes across communities
126
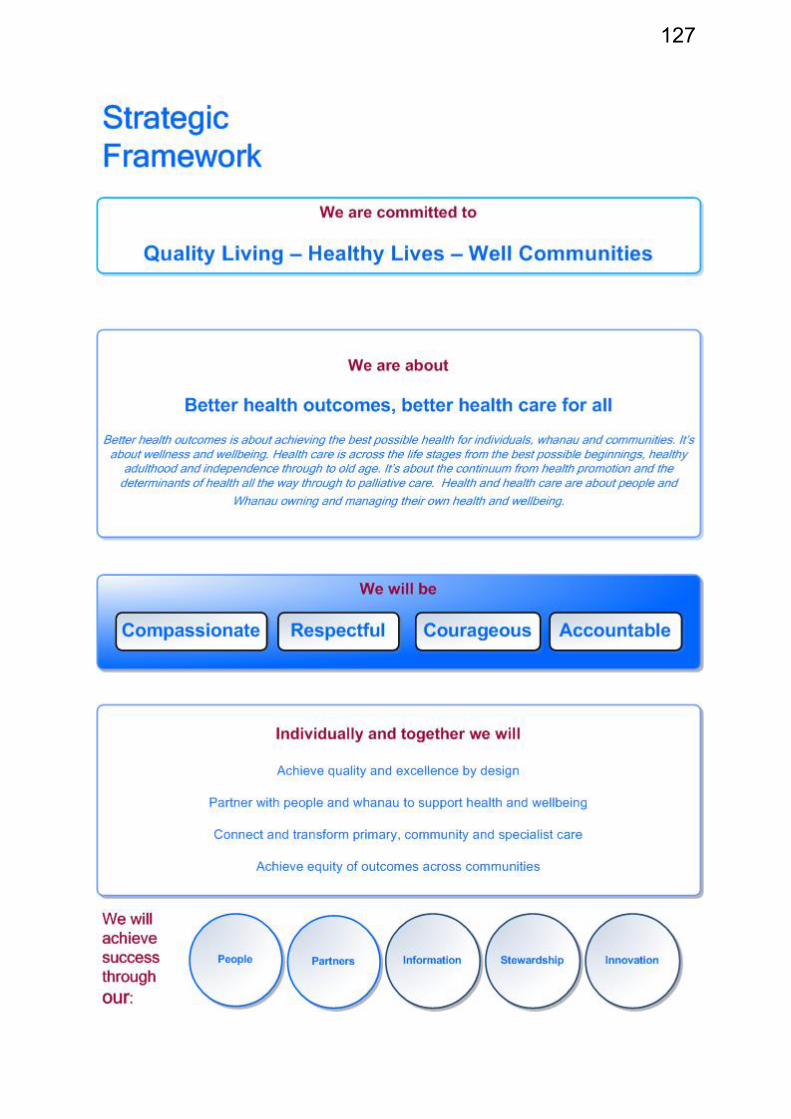
127
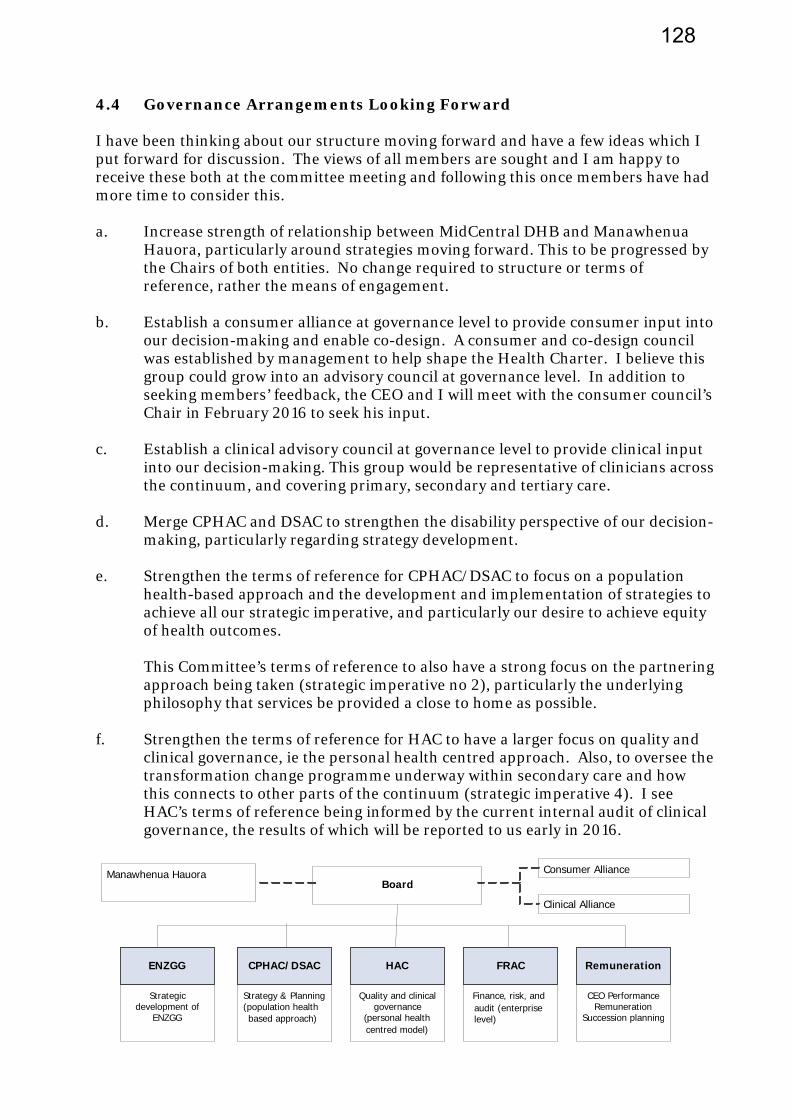
4.4 Governance Arrangements Looking Forward I have been thinking about our structure moving forward and have a few ideas which I put forward for discussion. The views of all members are sought and I am happy to receive these both at the committee meeting and following this once members have had more time to consider this. a. Increase strength of relationship between MidCentral DHB and Manawhenua
Hauora, particularly around strategies moving forward. This to be progressed by the Chairs of both entities. No change required to structure or terms of reference, rather the means of engagement.
b. Establish a consumer alliance at governance level to provide consumer input into
our decision-making and enable co-design. A consumer and co-design council was established by management to help shape the Health Charter. I believe this group could grow into an advisory council at governance level. In addition to seeking members’ feedback, the CEO and I will meet with the consumer council’s Chair in February 2016 to seek his input.
c. Establish a clinical advisory council at governance level to provide clinical input
into our decision-making. This group would be representative of clinicians across the continuum, and covering primary, secondary and tertiary care.
d. Merge CPHAC and DSAC to strengthen the disability perspective of our decision-
making, particularly regarding strategy development. e. Strengthen the terms of reference for CPHAC/DSAC to focus on a population
health-based approach and the development and implementation of strategies to achieve all our strategic imperative, and particularly our desire to achieve equity of health outcomes. This Committee’s terms of reference to also have a strong focus on the partnering approach being taken (strategic imperative no 2), particularly the underlying philosophy that services be provided a close to home as possible.
f. Strengthen the terms of reference for HAC to have a larger focus on quality and
clinical governance, ie the personal health centred approach. Also, to oversee the transformation change programme underway within secondary care and how this connects to other parts of the continuum (strategic imperative 4). I see HAC’s terms of reference being informed by the current internal audit of clinical governance, the results of which will be reported to us early in 2016.
Board Consumer AllianceManawhenua Hauora
Quality and clinicalgovernance
(personal healthcentred model)
HAC
Clinical Alliance
CPHAC/DSAC
Strategy & Planning
(population health based approach)
FRAC
Finance, risk, and audit (enterprise level)
Remuneration
CEO Performance Remuneration
Succession planning
ENZGG
Strategic development of
ENZGG
128
5. NEXT STEPS The next steps in the review and development of our governance structure would be: committee feedback and amendment to proposed structure in line with their
thoughts (February/March); development of draft terms of reference for each committee (April); workshop of board and committee members (May);
formal proposal submitted for the Board’s consideration (June). As part of the development of a FRAC, the Board has asked that a mapping exercise be done to provide clarity around the role of that committee and the statutory committees. I would see a similar exercise being done as part of the development of draft terms of reference for all committees so that we can clearly see the interface between committees, and that there is clarity around the role and responsibilities of each Committee. We must also be able to assure ourselves that all key aspects of governance are covered. Phil Sunderland Chairman
129
Appendix A: FRAC Terms of Reference Purpose: The purpose of the Finance, Risk and Audit Committee (FRAC) is to advise and assist the MidCentral District Health Board (MDHB) to meet governance responsibilities relating to finance, risk, safety and quality management, audit and compliance. Functions: The functions of FRAC are to provide oversight in respect of: 1. Finance: a) Ensure that appropriate reporting processes are in place to enable the Board and sub-
committees to monitor and make decisions on the financial and commercial affairs of MDHB and its divisions;
b) Monitor the overall financial performance of MDHB, including the performance of the Provider Arm;
c) Monitor the capital expenditure and the overall financial position of MDHB. 2. Risk, Safety and Quality Management: a) Monitor and review the adequacy and performance of MDHB risk management
framework, strategies, processes and reporting; b) Ensure appropriate patient safety and clinical quality measures and reporting are in
place, are maintained and managed, and working effectively. 3. Audit: a) Provide assurance that all audit processes required by statute and the Board are
completed; b) Ensure that effective control environment and assurance programmes are in place; c) Ensure all issues identified by audits are appropriately addressed. 4. Compliance: a) Ensure MDHB is complying with all relevant statutory, regulatory and policy obligations
and requirements. 5. Planning: a) Review and advise the Board on those aspects of the Annual Plan and Budget related to
finance, risk, safety and quality Level of Authority: FRAC has the authority to give advice and make recommendations to the MDHB Board. FRAC is authorised by the Board to investigate any activity it deems appropriate. It is authorised to seek any information from any officer or employee of the organisation, all of whom are directed to co-operate with any request made by the Committee or on its behalf. FRAC is authorised to engage any firm of professionals as the Committee sees fit to provide independent counsel and advice to assist in any review or investigation on such matters as the Committee deems appropriate. Meetings: The Committee shall meet at least 6 times per year;
130
In addition to scheduled meetings, the Chair shall call a meeting at any time if requested to do so by any member, Board member, the Chief Executive, the Internal Auditor or the External Auditor; All meetings shall be held with the public excluded; Matters may be dealt with between meetings through discussion with the Chair and other relevant members of the Committee. Workplan: Each year the committee will adopt a workplan to provide review and oversight of the matters within its scope. Reporting: The Chair shall report on Committee business to the Board with such recommendations as the Committee may deem appropriate; The minutes of the Committee’s meetings shall be submitted to the Board for its consideration and approval; The Committee shall recommend approval of the interim and annual financial statements and other audit obligations along with any other certificates requiring approval to the Board.
131
Appendix B: CPHAC Terms of Reference
1 Committee of the Board
The Community and Public Health Advisory Committee is a committee of the Board, established in accordance with Section 34 of the New Zealand Public Health and Disability Act 2000 (the Act). These Terms of Reference are supplementary to the provisions of the Act and Schedule 4 of the Act.
2 Functions of the Community and Public Health Advisory Committee
a. To provide advice to the Board on the needs, and any factors that the committee believes may adversely affect the health status of the resident population of the district health board.
b. To provide advice to the Board on priorities for use of the health funding provided.
c. To ensure that the following maximise the overall health gain for the population the committee serves:
i. All service interventions the district health board has provided or funded or could provide or fund for the care of that population.
ii.- All policies the district health board has adopted or could adopt for the care of that population.
d. Such advice must not be inconsistent with the New Zealand Health Strategy.
e. To consider annual purchasing plans and recommend same to the Board for approval.
f. To recommend policies relating to the planning and purchasing of health services for the district.
g. To develop an annual workplan for the Board's consideration and approval.
h. To report regularly to the Board on the committee's findings (generally the Minutes of each meeting will be placed on the Agenda of the next Board meeting).
3 Delegated Authority
The Community and Public Health Advisory Committee shall not have any powers except as specifically delegated by the Board from time to time. The following authorities are delegated to the Community and Public Health Advisory Committee:
a. To require the Chief Executive Officer and/or delegated staff to attend its meetings, provide advice, provide information and prepare reports upon request.
b. To interface with any other committee(s) that may be formed from time to time.
4 Membership and Procedure
Membership of the Community and Public Health Advisory Committee shall be as directed by the Board from time to time. All matters of procedure are provided in Schedule 4 of the Act, together with Board and Committee Standing Orders.
5 Meetings
The Community and Public Health Advisory Committee shall hold meetings as frequently as it considers necessary or upon the instruction of the Board. It is anticipated that eight meetings will be held annually.
132
Note
For the purposes of this document, the definition of 'public health' is incorporated in the Act, which means the health of all of the community in the district health board's region.
133
Appendix C: DSAC Terms of Reference
1 Committee of the Board
The Disability Support Advisory Committee is a committee of the Board, established in accordance with Section 35 of the New Zealand Public Health and Disability Act 2000 (the Act). These Terms of Reference are supplementary to the provisions of the Act and Schedule 4 of the Act.
2 Functions of the Disability Support Advisory Committee
a. To provide advice to the Board on the disability support needs of the resident population of the district health board.
b. To provide advice to the Board on priorities for use of the disability support funding provided.
c. To ensure that the following promote the inclusion and participation in society, and maximise the independence of people with disabilities within the district health board's resident population:
i. The kinds of disability support services the district health board has provided or funded or could provide or fund for those people.
ii. All policies the district health board has adopted or could adopt for those people.
d. Such advice must not be inconsistent with the New Zealand Disability Strategy.
e. To advocate to external parties and organisations on the means by which their practices may be modified so as to assist, on a population basis, those experiencing disability.
f. To consider and recommend the disability support component of the annual purchasing plan and the annual provider business plan.
g. To recommend policies relating to the planning and purchasing of disability support services for the district.
h. To develop an annual workplan for the Board's consideration and approval.
i. To report regularly to the Board on the committee's findings (generally the Minutes of each meeting will be placed on the Agenda of the next Board meeting).
3 Delegated Authority
The Disability Support Advisory Committee shall not have any powers except as specifically delegated by the Board from time to time. The following authorities are delegated to the Disability Support Advisory Committee:
a. To require the Chief Executive Officer and/or delegated staff to attend its meetings, provide advice, provide information and prepare reports upon request.
b. To interface with any other committee(s) that may be formed from time to time.
4 Membership and Procedure
Membership of the Disability Support Advisory Committee shall be as directed by the Board from time to time. All matters of procedure are provided in Schedule 4 of the Act, together with Board and Committee Standing Orders.
134
5 Meetings
The Disability Support Advisory Committee shall hold meetings as frequently as it considers necessary or upon the instruction of the Board. It is anticipated that at least three to four meetings will be held annually.
Note
For the purposes of this document, the definition of 'disability support services' is as incorporated in the Act, which means disability support for all of the community in the district health board's region.
135
Appendix D: HAC Terms of Reference
1. Committee of the Board
The Hospital Advisory Committee is a committee of the Board, established in accordance with Section 36 of the New Zealand Public Health and Disability Act 2000 (the Act). These Terms of Reference are supplementary to the provisions of the Act and Schedule 4 of the Act.
2 Functions of the Hospital Advisory Committee
a. To monitor the financial and operational performance of the hospitals (and related services) of the district health board.
b. To assess strategic issues relating to the provision of hospital services by or through the district health board.
c. To give the Board advice and recommendations on that monitoring and that assessment as noted in 2(a) and (b) above.
d. To consider annual business plans and recommend same to the Board for approval.
e. To recommend policies relative to the good governance of hospital services.
f. To develop an annual workplan for the Board's consideration and approval.
g. To report regularly to the Board on the committee's findings (generally the Minutes of each meeting will be placed on the Agenda of the next Board meeting).
3 Delegated Authority
The Hospital Advisory Committee shall not have any powers except as specifically delegated by the Board from time to time.
The following authorities are delegated to the Hospital Advisory Committee:
a. To require the Chief Executive Officer and/or delegated staff to attend its meetings, provide advice, provide information and prepare reports upon request.
b. To interface with any other committee(s) that may be formed from time to time.
4 Membership and Procedure
Membership of the Hospital Advisory Committee shall be as directed by the Board from time to time. All matters of procedure are provided in Schedule 4 of the Act, together with Board and Committee Standing Orders.
5 Meetings
The Hospital Advisory Committee shall hold meetings as frequently as it considers necessary or upon the instruction of the Board. It is anticipated that eight meetings will be held annually.
Note
For the purposes of this document, 'Hospital' means all public health services owned by the Crown and previously known as 'Hospital and Health Services'.
136
HAC – Operations Report – Part 1 Page 1 November/December 2015
TO Hospital Advisory Committee
FROM Mike Grant
General Manager Clinical Services and Transformation
DATE 22 January 2016 MEMORANDUM SUBJECT MCH Operations Report – November/December 2015
1 PURPOSE
This report is for the Committee’s information and discussion. It provides information about MCH’s (MCH) financial and operating performance for November/December 2015. The report also provides updates on the progress MCH has made towards meeting the Ministry of Health’s health targets and other initiatives currently under way.
2 SUMMARY
The focus on MidCentral Health’s financial performance is showing positive results, with the December result much improved on previous months. This will remain a top priority with business initiatives in place to address revenue shortfalls and to manage expenditure in order to achieve or better budget by year end. These relate to targeted improvements on a service by service basis, in addition to the ongoing emphasis on improvements in patient flow, average length of stay and bed utilisation. Managing expenditure in the Mental Health and Addictions Service remains challenging, with expenditure on locum medical staff and outsourced services for patient support in the community running at high levels for December. Achieving sustainable levels of service delivery is the top priority for this service.
The number of patients presenting to the Emergency Department continued to be high for November and December. The higher than typical patient admissions have been managed with the “summer plan” arrangements coming into place in late November 2015. Managing with the reduced bed numbers has been achieved through the ongoing improved patient flow and reduced length of stay. The shorter stays in the Emergency Department target results were November (94.7 per cent) and December (94.4 per cent) contributing to a second quarter result of 94.3 per cent.
The holiday period has impacted on our compliance with the Elective Services Patient Flow Indicators (ESPIs) 2 and 5. Plans are in place with the clinical teams to address the number of patients waiting greater than 4 months in order for MCH to achieve compliance.It is anticipated that the results will be rectified without any penalty by mid February with Operating Theatre capacity returning to normal from 18 January.
The Faster Cancer Treatment 62 day target was achieved in November and December 2015. Increasing participation and leveraging improvements for all cancer patients is a key focus of the FCT in secondary care project. Nationally MidCentral DHB continues to perform well.
Progress continues with the implementation of the Mental Health and Addiction Services external review recommendations and wider service development, including consumer advisor positions, consultation ‘hui’, consultation on the new acute care team model, integrated specialist older persons mental health service, key performance indicator planning and cultural/workforce development.
137
HAC – Operations Report – Part 1 Page 2 November/December 2015
3 RECOMMENDATION
It is recommended that this report be received
138
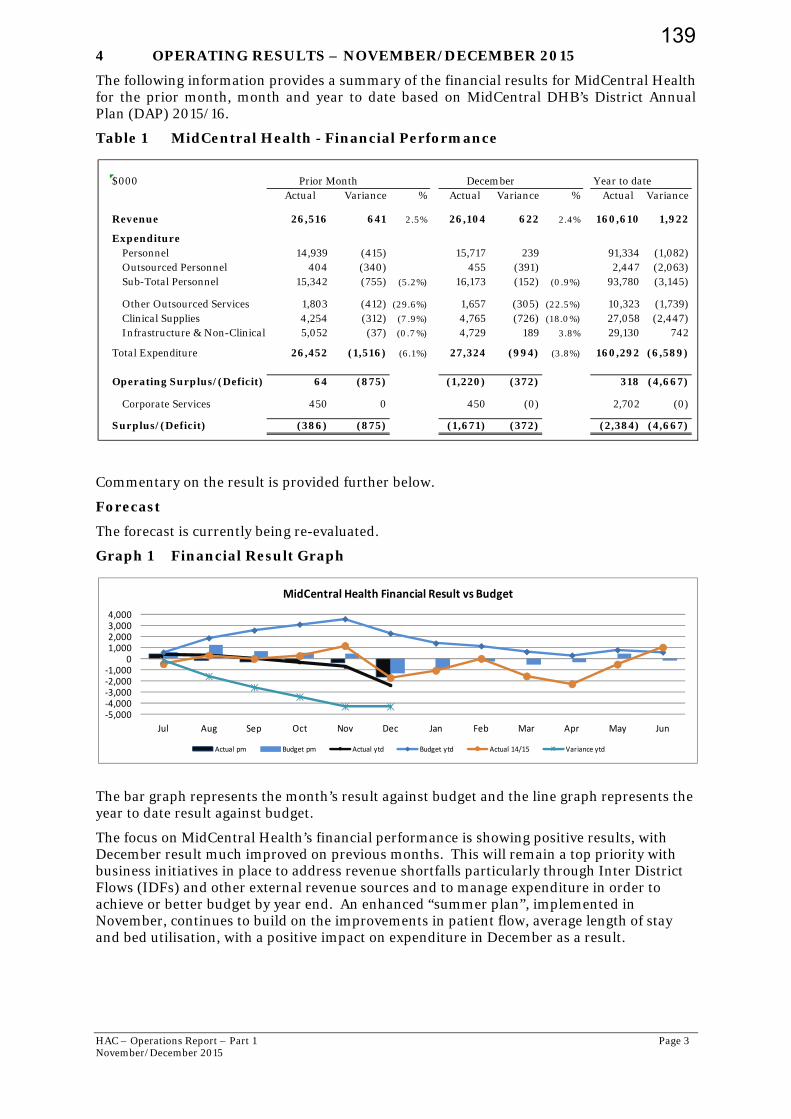
HAC – Operations Report – Part 1 Page 3 November/December 2015
4 OPERATING RESULTS – NOVEMBER/DECEMBER 2015
The following information provides a summary of the financial results for MidCentral Health for the prior month, month and year to date based on MidCentral DHB’s District Annual Plan (DAP) 2015/16.
Table 1 MidCentral Health - Financial Performance
Commentary on the result is provided further below.
Forecast
The forecast is currently being re-evaluated.
Graph 1 Financial Result Graph
The bar graph represents the month’s result against budget and the line graph represents the year to date result against budget.
The focus on MidCentral Health’s financial performance is showing positive results, with December result much improved on previous months. This will remain a top priority with business initiatives in place to address revenue shortfalls particularly through Inter District Flows (IDFs) and other external revenue sources and to manage expenditure in order to achieve or better budget by year end. An enhanced “summer plan”, implemented in November, continues to build on the improvements in patient flow, average length of stay and bed utilisation, with a positive impact on expenditure in December as a result.
$000 Year to date Actual Variance % Actual Variance % Actual Variance
Revenue 26,516 641 2.5% 26,104 622 2.4% 160,610 1,922
ExpenditurePersonnel 14,939 (415) 15,717 239 91,334 (1,082)Outsourced Personnel 404 (340) 455 (391) 2,447 (2,063)Sub-Total Personnel 15,342 (755) (5.2%) 16,173 (152) (0.9%) 93,780 (3,145)
Other Outsourced Services 1,803 (412) (29.6%) 1,657 (305) (22.5%) 10,323 (1,739)Clinical Supplies 4,254 (312) (7 .9%) 4,765 (726) (18.0%) 27,058 (2,447)Infrastructure & Non-Clinical 5,052 (37) (0.7 %) 4,729 189 3.8% 29,130 742
Total Expenditure 26,452 (1,516) (6.1%) 27,324 (994) (3.8%) 160,292 (6,589)
Operating Surplus/(Deficit) 64 (875) (1,220) (372) 318 (4,667)
Corporate Services 450 0 450 (0) 2,702 (0)
Surplus/(Deficit) (386) (875) (1,671) (372) (2,384) (4,667)
Prior Month December
‐5,000‐4,000‐3,000‐2,000‐1,000
01,0002,0003,0004,000
Jul Aug Sep Oct Nov Dec Jan Feb Mar Apr May Jun
MidCentral Health Financial Result vs Budget
Actual pm Budget pm Actual ytd Budget ytd Actual 14/15 Variance ytd
139
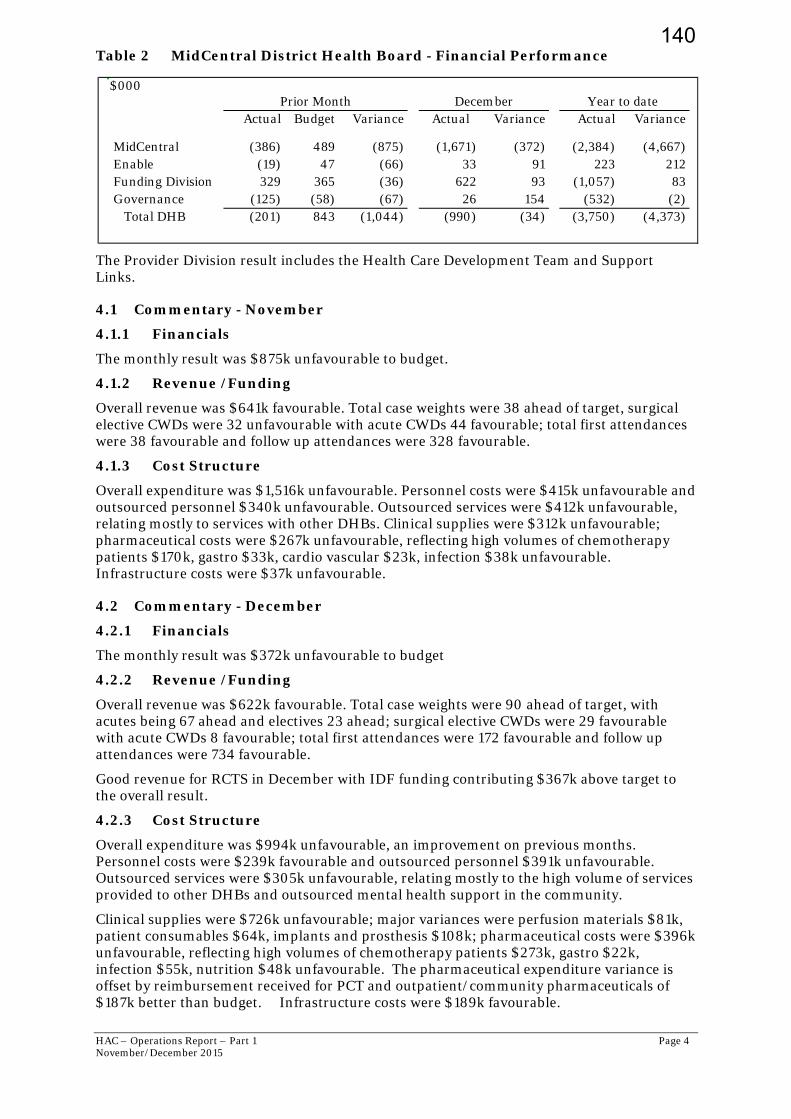
HAC – Operations Report – Part 1 Page 4 November/December 2015
Table 2 MidCentral District Health Board - Financial Performance
The Provider Division result includes the Health Care Development Team and Support Links.
4.1 Commentary - November
4.1.1 Financials
The monthly result was $875k unfavourable to budget.
4.1.2 Revenue /Funding
Overall revenue was $641k favourable. Total case weights were 38 ahead of target, surgical elective CWDs were 32 unfavourable with acute CWDs 44 favourable; total first attendances were 38 favourable and follow up attendances were 328 favourable.
4.1.3 Cost Structure
Overall expenditure was $1,516k unfavourable. Personnel costs were $415k unfavourable and outsourced personnel $340k unfavourable. Outsourced services were $412k unfavourable, relating mostly to services with other DHBs. Clinical supplies were $312k unfavourable; pharmaceutical costs were $267k unfavourable, reflecting high volumes of chemotherapy patients $170k, gastro $33k, cardio vascular $23k, infection $38k unfavourable. Infrastructure costs were $37k unfavourable.
4.2 Commentary - December
4.2.1 Financials
The monthly result was $372k unfavourable to budget
4.2.2 Revenue /Funding
Overall revenue was $622k favourable. Total case weights were 90 ahead of target, with acutes being 67 ahead and electives 23 ahead; surgical elective CWDs were 29 favourable with acute CWDs 8 favourable; total first attendances were 172 favourable and follow up attendances were 734 favourable.
Good revenue for RCTS in December with IDF funding contributing $367k above target to the overall result.
4.2.3 Cost Structure
Overall expenditure was $994k unfavourable, an improvement on previous months. Personnel costs were $239k favourable and outsourced personnel $391k unfavourable. Outsourced services were $305k unfavourable, relating mostly to the high volume of services provided to other DHBs and outsourced mental health support in the community.
Clinical supplies were $726k unfavourable; major variances were perfusion materials $81k, patient consumables $64k, implants and prosthesis $108k; pharmaceutical costs were $396k unfavourable, reflecting high volumes of chemotherapy patients $273k, gastro $22k, infection $55k, nutrition $48k unfavourable. The pharmaceutical expenditure variance is offset by reimbursement received for PCT and outpatient/community pharmaceuticals of $187k better than budget. Infrastructure costs were $189k favourable.
$000
Actual Budget Variance Actual Variance Actual Variance
MidCentral (386) 489 (875) (1,671) (372) (2,384) (4,667)Enable (19) 47 (66) 33 91 223 212Funding Division 329 365 (36) 622 93 (1,057) 83Governance (125) (58) (67) 26 154 (532) (2) Total DHB (201) 843 (1,044) (990) (34) (3,750) (4,373)
Y ear to date Prior Month December
140

HAC – Operations Report – Part 1 Page 5 November/December 2015
The high “winter like” demand experienced in previous months has reduced somewhat, with the implementation of the “summer plan” from late November reflected in a consequent reduction in associated costs. This has been achieved even though presentations to ED and admissions to hospital in November and December this year are 10 percent more than the same time in 2014/15.
High activity continues to impact services, in particular RCTS, Mental Health and Internal Medicine, with associated outsourced costs and clinical supplies. The high demand results in unfunded over delivery year to date to a value of $4.5m, of which $3.2m is for our local population and $1.2m inter district flows.
Table 3 Actual to Budget Trend
The schedule shows the actual and the next budgeted months of the financial year
$000 <Actual Budget >Oct Nov Dec Jan Feb Mar
Revenue 27,154 26,516 26,104 24,631 24,645 26,977
Expenditure Personnel 15,279 14,939 15,717 15,101 14,678 16,359Outsourced Personnel 342 404 455 64 63 64Total Personnel 15,621 15,342 16,173 15,165 14,741 16,423
Outsourced Clinical Services 1,764 1,803 1,657 1,338 1,312 1,472Clinical Supplies 4,790 4,254 4,765 3,854 3,723 4,181Intrastructure & Non-Clinical 4,828 5,052 4,729 4,714 4,666 4,971
Expenditure 27,003 26,452 27,324 25,070 24,441 27,048
Recharging 450 450 450 450 450 450
Net Result (299) (386) (1,671) (889) (247) (521)
141
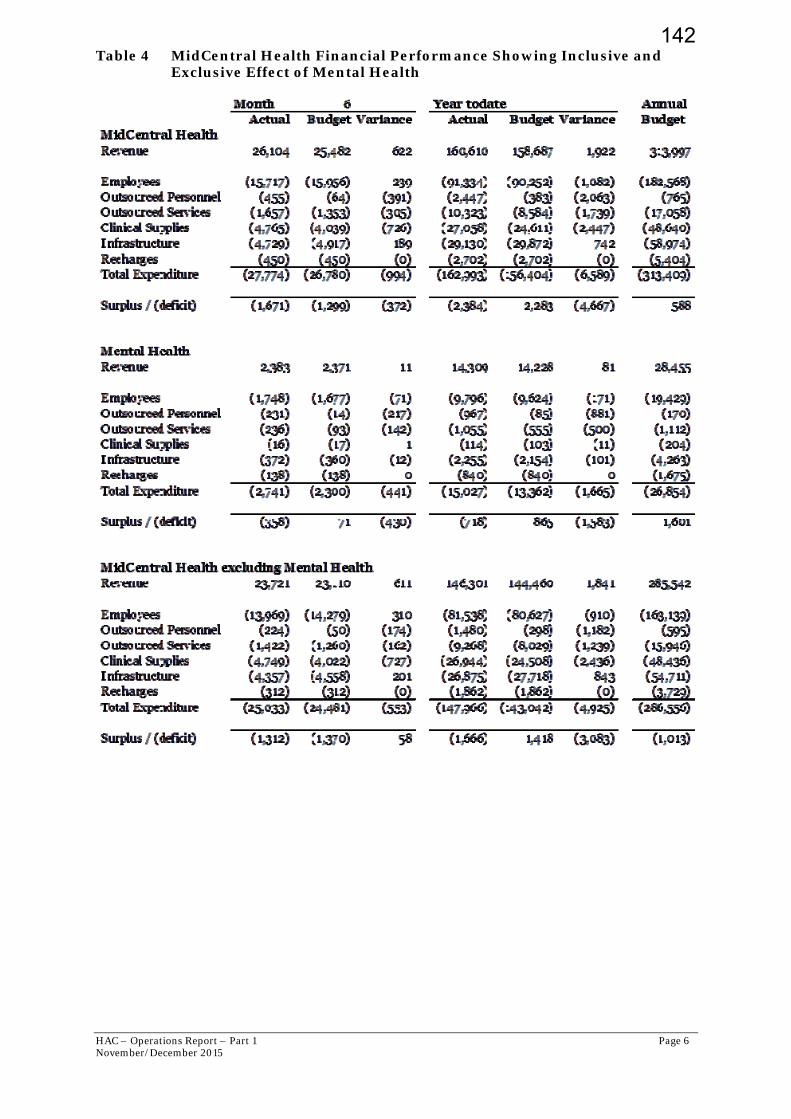
HAC – Operations Report – Part 1 Page 6 November/December 2015
Table 4 MidCentral Health Financial Performance Showing Inclusive and Exclusive Effect of Mental Health
142

HAC – Operations Report – Part 1 Page 7 November/December 2015
4.3 Capital Expenditure
Table 5 Capital Expenditure Programme 2015/16
Capital Expenditure Programme 2015/16MCH Year Ended 30 June 2016-December 15 Month End
Budget 2015/16 Approved$'000's $'000's
MCH ProviderCommercial SupportGenerators 605 605Substation (Phase 2) 400Laundry Substation 250 250Seismic Work 450 450Fire Cell Penetration 485Items under $250k 2,225 871
4,415MCH Linac Sinking Fund 360Bed Replacement Programme 427 312Planning Equipment -Radiotheraphy 350Anaesthetic Machines 530 530Medical Imaging equipment 1,250 280Items Under $250k 4,275 437
7,192
InvestmentMaster Health Services Plan- Hospital Reconfiguration 2,000 2,000
2,000Total MCH Provider (MCH & Comm Support) 13,607 5,735
TOTAL CAPEX 2015/16Earlier Years 14,369Current Year 13,607Total 27,976
Total Cfwd 30 June 2015 (Approved or in action at 30 June 2015)Earlier Years 14,369Total 14,369
CAPITAL SPENT YTD Carried Forward Approved CAPEX Prior Years 4,637CAPEX Programme 2015/16 1,308 Total 5,945
143
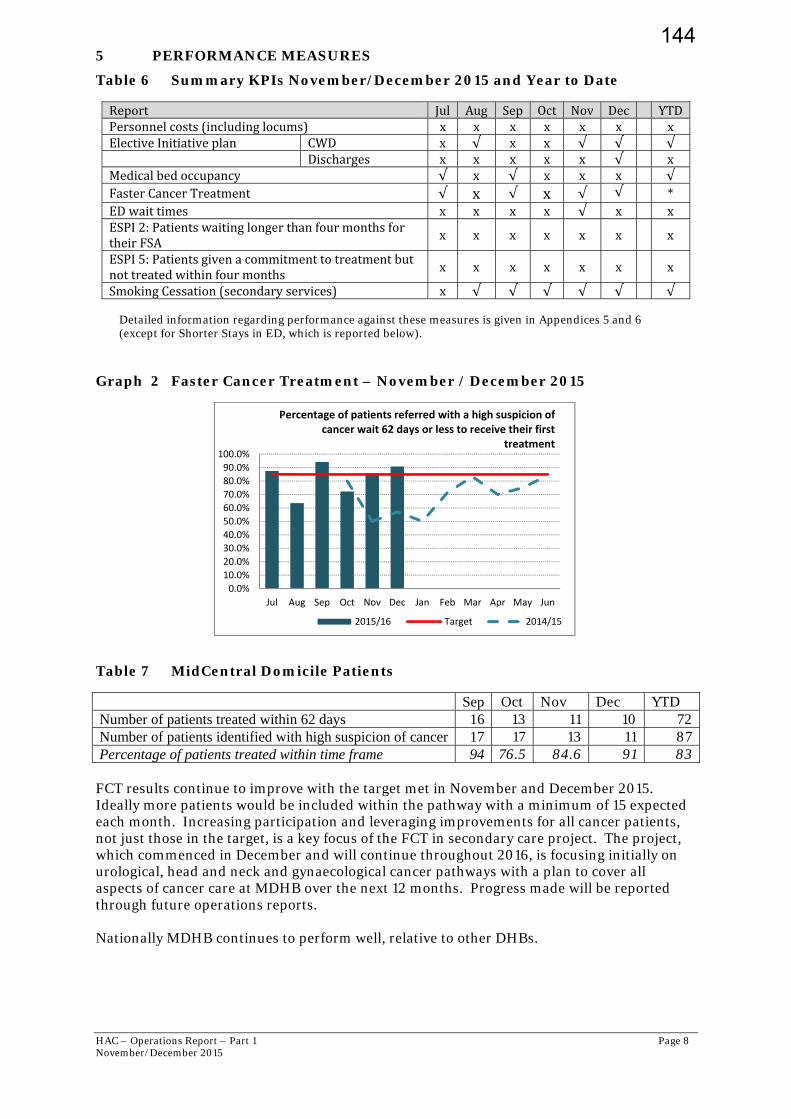
HAC – Operations Report – Part 1 Page 8 November/December 2015
5 PERFORMANCE MEASURES
Table 6 Summary KPIs November/December 2015 and Year to Date
Report Jul Aug Sep Oct Nov Dec YTDPersonnelcosts(includinglocums) x x x x x x xElectiveInitiativeplan CWD x √ x x √ √ √ Discharges x x x x x √ xMedicalbedoccupancy √ x √ x x x √FasterCancerTreatment √ x √ x √ √ *EDwaittimes x x x x √ x xESPI2:PatientswaitinglongerthanfourmonthsfortheirFSA
x x x x x x x
ESPI5:Patientsgivenacommitmenttotreatmentbutnottreatedwithinfourmonths x x x x x x x
SmokingCessation(secondaryservices) x √ √ √ √ √ √ Detailed information regarding performance against these measures is given in Appendices 5 and 6 (except for Shorter Stays in ED, which is reported below).
Graph 2 Faster Cancer Treatment – November / December 2015
Table 7 MidCentral Domicile Patients
Sep Oct Nov Dec YTD Number of patients treated within 62 days 16 13 11 10 72 Number of patients identified with high suspicion of cancer 17 17 13 11 87 Percentage of patients treated within time frame 94 76.5 84.6 91 83
FCT results continue to improve with the target met in November and December 2015. Ideally more patients would be included within the pathway with a minimum of 15 expected each month. Increasing participation and leveraging improvements for all cancer patients, not just those in the target, is a key focus of the FCT in secondary care project. The project, which commenced in December and will continue throughout 2016, is focusing initially on urological, head and neck and gynaecological cancer pathways with a plan to cover all aspects of cancer care at MDHB over the next 12 months. Progress made will be reported through future operations reports. Nationally MDHB continues to perform well, relative to other DHBs.
0.0%
10.0%
20.0%
30.0%
40.0%
50.0%
60.0%
70.0%
80.0%
90.0%
100.0%
Jul Aug Sep Oct Nov Dec Jan Feb Mar Apr May Jun
Percentage of patients referred with a high suspicion of cancer wait 62 days or less to receive their first
treatment
2015/16 Target 2014/15
144
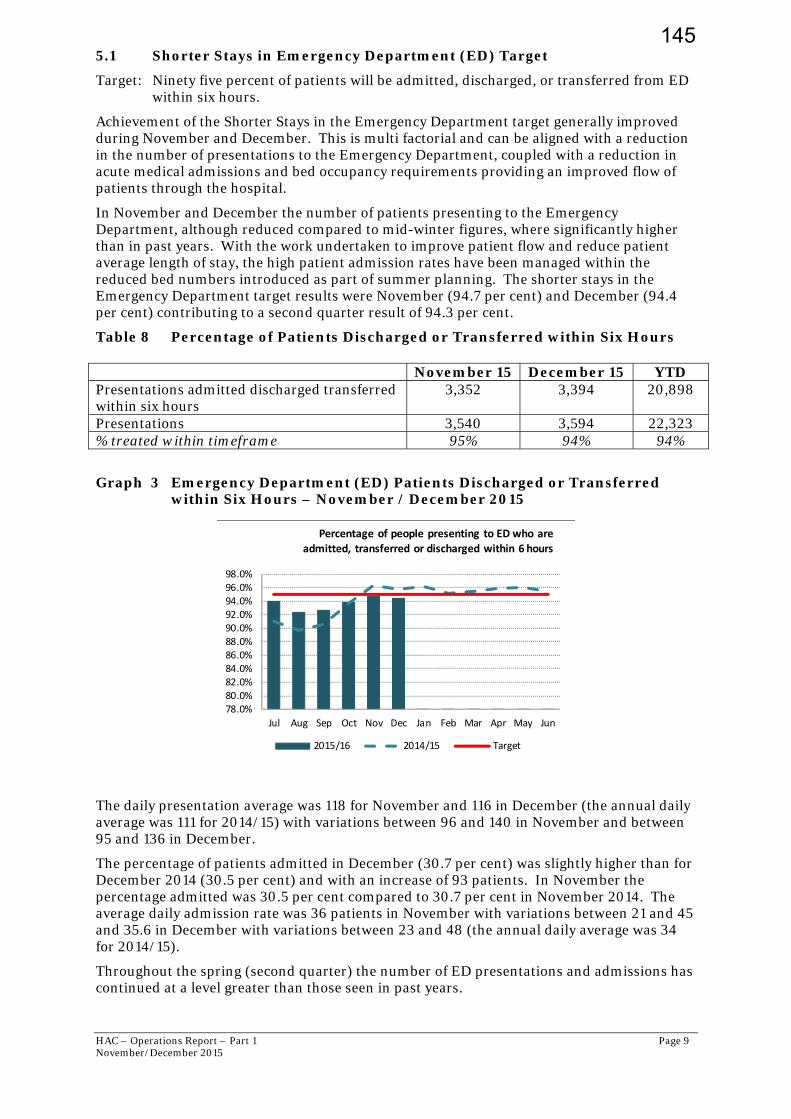
HAC – Operations Report – Part 1 Page 9 November/December 2015
5.1 Shorter Stays in Emergency Department (ED) Target
Target: Ninety five percent of patients will be admitted, discharged, or transferred from ED within six hours.
Achievement of the Shorter Stays in the Emergency Department target generally improved during November and December. This is multi factorial and can be aligned with a reduction in the number of presentations to the Emergency Department, coupled with a reduction in acute medical admissions and bed occupancy requirements providing an improved flow of patients through the hospital.
In November and December the number of patients presenting to the Emergency Department, although reduced compared to mid-winter figures, where significantly higher than in past years. With the work undertaken to improve patient flow and reduce patient average length of stay, the high patient admission rates have been managed within the reduced bed numbers introduced as part of summer planning. The shorter stays in the Emergency Department target results were November (94.7 per cent) and December (94.4 per cent) contributing to a second quarter result of 94.3 per cent.
Table 8 Percentage of Patients Discharged or Transferred within Six Hours
Graph 3 Emergency Department (ED) Patients Discharged or Transferred within Six Hours – November / December 2015
The daily presentation average was 118 for November and 116 in December (the annual daily average was 111 for 2014/15) with variations between 96 and 140 in November and between 95 and 136 in December.
The percentage of patients admitted in December (30.7 per cent) was slightly higher than for December 2014 (30.5 per cent) and with an increase of 93 patients. In November the percentage admitted was 30.5 per cent compared to 30.7 per cent in November 2014. The average daily admission rate was 36 patients in November with variations between 21 and 45 and 35.6 in December with variations between 23 and 48 (the annual daily average was 34 for 2014/15).
Throughout the spring (second quarter) the number of ED presentations and admissions has continued at a level greater than those seen in past years.
78.0%80.0%82.0%84.0%86.0%88.0%90.0%92.0%94.0%96.0%98.0%
Jul Aug Sep Oct Nov Dec Jan Feb Mar Apr May Jun
Percentage of people presenting to ED who are
admitted, transferred or discharged within 6 hours
2015/16 2014/15 Target
November 15 December 15 YTD Presentations admitted discharged transferred within six hours
3,352 3,394 20,898
Presentations 3,540 3,594 22,323 % treated within timeframe 95% 94% 94%
145
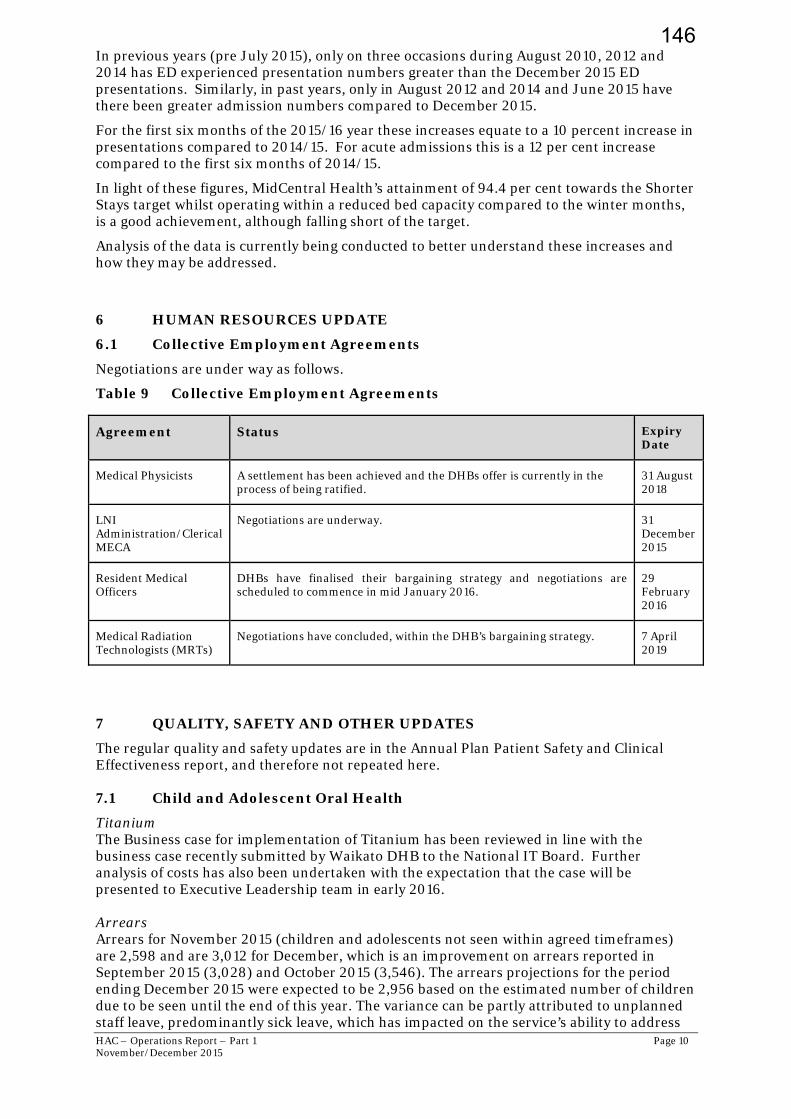
HAC – Operations Report – Part 1 Page 10 November/December 2015
In previous years (pre July 2015), only on three occasions during August 2010, 2012 and 2014 has ED experienced presentation numbers greater than the December 2015 ED presentations. Similarly, in past years, only in August 2012 and 2014 and June 2015 have there been greater admission numbers compared to December 2015.
For the first six months of the 2015/16 year these increases equate to a 10 percent increase in presentations compared to 2014/15. For acute admissions this is a 12 per cent increase compared to the first six months of 2014/15.
In light of these figures, MidCentral Health’s attainment of 94.4 per cent towards the Shorter Stays target whilst operating within a reduced bed capacity compared to the winter months, is a good achievement, although falling short of the target.
Analysis of the data is currently being conducted to better understand these increases and how they may be addressed.
6 HUMAN RESOURCES UPDATE
6.1 Collective Employment Agreements
Negotiations are under way as follows.
Table 9 Collective Employment Agreements
Agreement Status Expiry Date
Medical Physicists A settlement has been achieved and the DHBs offer is currently in the process of being ratified.
31 August 2018
LNI Administration/Clerical MECA
Negotiations are underway. 31 December 2015
Resident Medical Officers
DHBs have finalised their bargaining strategy and negotiations are scheduled to commence in mid January 2016.
29 February 2016
Medical Radiation Technologists (MRTs)
Negotiations have concluded, within the DHB’s bargaining strategy. 7 April 2019
7 QUALITY, SAFETY AND OTHER UPDATES
The regular quality and safety updates are in the Annual Plan Patient Safety and Clinical Effectiveness report, and therefore not repeated here.
7.1 Child and Adolescent Oral Health
Titanium The Business case for implementation of Titanium has been reviewed in line with the business case recently submitted by Waikato DHB to the National IT Board. Further analysis of costs has also been undertaken with the expectation that the case will be presented to Executive Leadership team in early 2016. Arrears Arrears for November 2015 (children and adolescents not seen within agreed timeframes) are 2,598 and are 3,012 for December, which is an improvement on arrears reported in September 2015 (3,028) and October 2015 (3,546). The arrears projections for the period ending December 2015 were expected to be 2,956 based on the estimated number of children due to be seen until the end of this year. The variance can be partly attributed to unplanned staff leave, predominantly sick leave, which has impacted on the service’s ability to address
146

HAC – Operations Report – Part 1 Page 11 November/December 2015
arrears. At a recent staff training day, a session with Occupational Health provided a refresher to staff around managing their health and its impact on their work.
7.2 Regional Cancer Treatment Service
The Radiotherapy Department treated through the holiday season again this year, closed only on Christmas Day, to ensure that all essential treatment was provided over that time. Although normally an 'office hours' department, staff are always willing to work public holidays so that that patients do not have vital continuity of treatment disrupted. It's a team effort with not just MDHB staff from all disciplines working, but also with the generous support of the Cancer Society volunteer drivers and Ozanam House. Dr Simon Allan was recognised in the New Years Honours for his contribution to palliative care, as an Officer of the New Zealand Order of Merit. Although Dr Allan is more widely known for his role in Arohanui Hospice and as a tireless advocate for Palliative Care Services, he continues to works part time for the Hospital Palliative Care Service. He previously worked in the Medical Oncology Service as an oncologist and as the RCTS Clinical Director for many years.
7.3 Mental Health
The Mental Health and Addiction Services (MHAS) Advisory Group continue to oversight the implementation of the Mental Health external review. The consumer advisor positions have commenced and there has been progress to organise a consultation “Hui’ in March 2016 to provide input to development priorities. Progress has also been made with the development of an integrated specialist older person’s mental health service. Cultural changes are continuing, with further workforce development planning supported by an appointment of a service multi disciplinary focused workforce development coordinator.
Consultation on the new Acute Care Team model of care commenced in early January and also planned for in January is a KPI executive forum following an executive half day planning and clinical team manager workshops held for team development.
The options paper for the redesign of Ward 21 will be provided to the HAC meeting in April 2016.
Key broader service progress includes the joint review of the primary mental health model of care with the PHO; appointment of a project manager to lead development of a collaborative provider network; the planned external review of the Alcohol and Drug Opioid Substitution service; development of quality improvement key result areas in January; continuing SMO recruitment and maintaining interim locum cover; continued effective discharge to our four transition beds; purchase of ECT equipment removing sole equipment dependency for this acute treatment.
Overall there has been good progress with resolution of complaints but continuing rates of incidents in ward 21 related to periods of higher occupancy early and late December. The readmission rates continue to be reported at a higher than national KPI level, although less in November and work continues to improve the detail in our reporting on this KPI. The use of double shifts in the inpatient unit showed a small reduction. Staffing to higher levels due to improved rostering is planned for January which will better match demand of occupancy regularly sitting at 26-28 patients. Further detail can be located in Appendix 8 – Mental Health Service Indicators.
The Erica Hume action plan is being implemented with reports to be developed in the New Year.
7.4 Nursing
Bedside Handover
Bedside handover is now well embedded in the two releasing time to care wards (Ward 24 and 26). The process of handover has been audited to ensure that all required information is passed on using a consistent format and that patients are involved in the handover of care between shifts. A survey is underway to gain feedback from patients about their experience and views on bedside handover. Early indications are that patients are very positive about
147
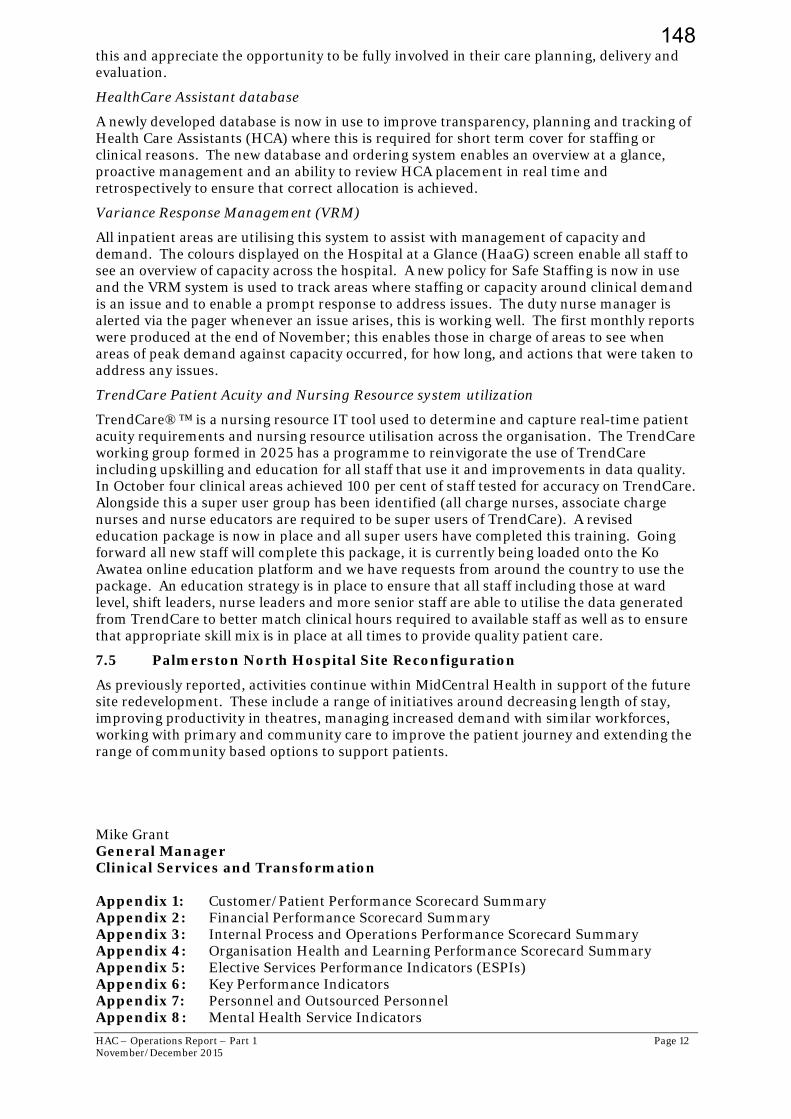
HAC – Operations Report – Part 1 Page 12 November/December 2015
this and appreciate the opportunity to be fully involved in their care planning, delivery and evaluation.
HealthCare Assistant database
A newly developed database is now in use to improve transparency, planning and tracking of Health Care Assistants (HCA) where this is required for short term cover for staffing or clinical reasons. The new database and ordering system enables an overview at a glance, proactive management and an ability to review HCA placement in real time and retrospectively to ensure that correct allocation is achieved.
Variance Response Management (VRM)
All inpatient areas are utilising this system to assist with management of capacity and demand. The colours displayed on the Hospital at a Glance (HaaG) screen enable all staff to see an overview of capacity across the hospital. A new policy for Safe Staffing is now in use and the VRM system is used to track areas where staffing or capacity around clinical demand is an issue and to enable a prompt response to address issues. The duty nurse manager is alerted via the pager whenever an issue arises, this is working well. The first monthly reports were produced at the end of November; this enables those in charge of areas to see when areas of peak demand against capacity occurred, for how long, and actions that were taken to address any issues.
TrendCare Patient Acuity and Nursing Resource system utilization
TrendCare®™ is a nursing resource IT tool used to determine and capture real-time patient acuity requirements and nursing resource utilisation across the organisation. The TrendCare working group formed in 2025 has a programme to reinvigorate the use of TrendCare including upskilling and education for all staff that use it and improvements in data quality. In October four clinical areas achieved 100 per cent of staff tested for accuracy on TrendCare. Alongside this a super user group has been identified (all charge nurses, associate charge nurses and nurse educators are required to be super users of TrendCare). A revised education package is now in place and all super users have completed this training. Going forward all new staff will complete this package, it is currently being loaded onto the Ko Awatea online education platform and we have requests from around the country to use the package. An education strategy is in place to ensure that all staff including those at ward level, shift leaders, nurse leaders and more senior staff are able to utilise the data generated from TrendCare to better match clinical hours required to available staff as well as to ensure that appropriate skill mix is in place at all times to provide quality patient care.
7.5 Palmerston North Hospital Site Reconfiguration
As previously reported, activities continue within MidCentral Health in support of the future site redevelopment. These include a range of initiatives around decreasing length of stay, improving productivity in theatres, managing increased demand with similar workforces, working with primary and community care to improve the patient journey and extending the range of community based options to support patients. Mike Grant General Manager Clinical Services and Transformation Appendix 1: Customer/Patient Performance Scorecard Summary Appendix 2: Financial Performance Scorecard Summary Appendix 3: Internal Process and Operations Performance Scorecard Summary Appendix 4: Organisation Health and Learning Performance Scorecard Summary Appendix 5: Elective Services Performance Indicators (ESPIs) Appendix 6: Key Performance Indicators Appendix 7: Personnel and Outsourced Personnel Appendix 8: Mental Health Service Indicators
148
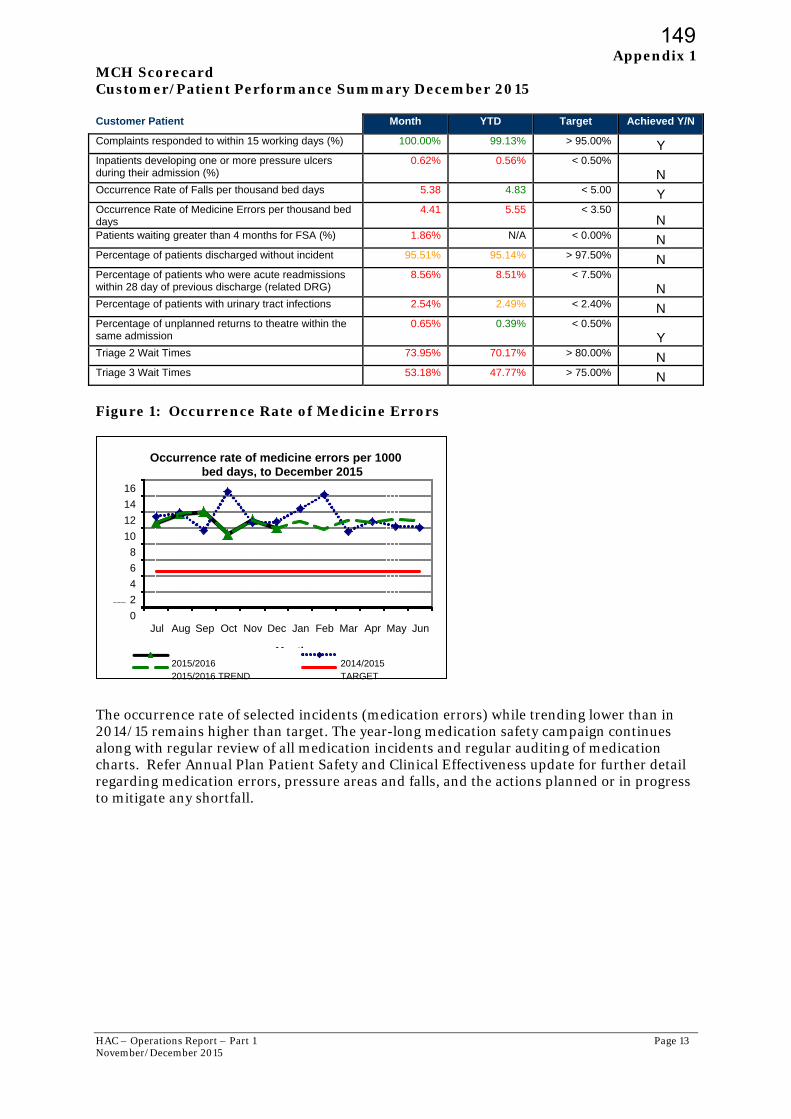
HAC – Operations Report – Part 1 Page 13 November/December 2015
Appendix 1 MCH Scorecard Customer/Patient Performance Summary December 2015 Customer Patient Month YTD Target Achieved Y/N
Complaints responded to within 15 working days (%) 100.00% 99.13% > 95.00% Y Inpatients developing one or more pressure ulcers during their admission (%)
0.62% 0.56% < 0.50%
N Occurrence Rate of Falls per thousand bed days 5.38 4.83 < 5.00 Y Occurrence Rate of Medicine Errors per thousand bed days
4.41 5.55 < 3.50 N
Patients waiting greater than 4 months for FSA (%) 1.86% N/A < 0.00% N Percentage of patients discharged without incident 95.51% 95.14% > 97.50% N Percentage of patients who were acute readmissions within 28 day of previous discharge (related DRG)
8.56% 8.51% < 7.50%
N Percentage of patients with urinary tract infections 2.54% 2.49% < 2.40% N Percentage of unplanned returns to theatre within the same admission
0.65% 0.39% < 0.50%
Y Triage 2 Wait Times 73.95% 70.17% > 80.00% N Triage 3 Wait Times 53.18% 47.77% > 75.00% N Figure 1: Occurrence Rate of Medicine Errors
The occurrence rate of selected incidents (medication errors) while trending lower than in 2014/15 remains higher than target. The year-long medication safety campaign continues along with regular review of all medication incidents and regular auditing of medication charts. Refer Annual Plan Patient Safety and Clinical Effectiveness update for further detail regarding medication errors, pressure areas and falls, and the actions planned or in progress to mitigate any shortfall.
0
2
4
6
8
10
12
14
16
Jul Aug Sep Oct Nov Dec Jan Feb Mar Apr May Jun
Rate/1,000 beddays
Month
Occurrence rate of medicine errors per 1000 bed days, to December 2015
2015/2016 2014/20152015/2016 TREND TARGET
149
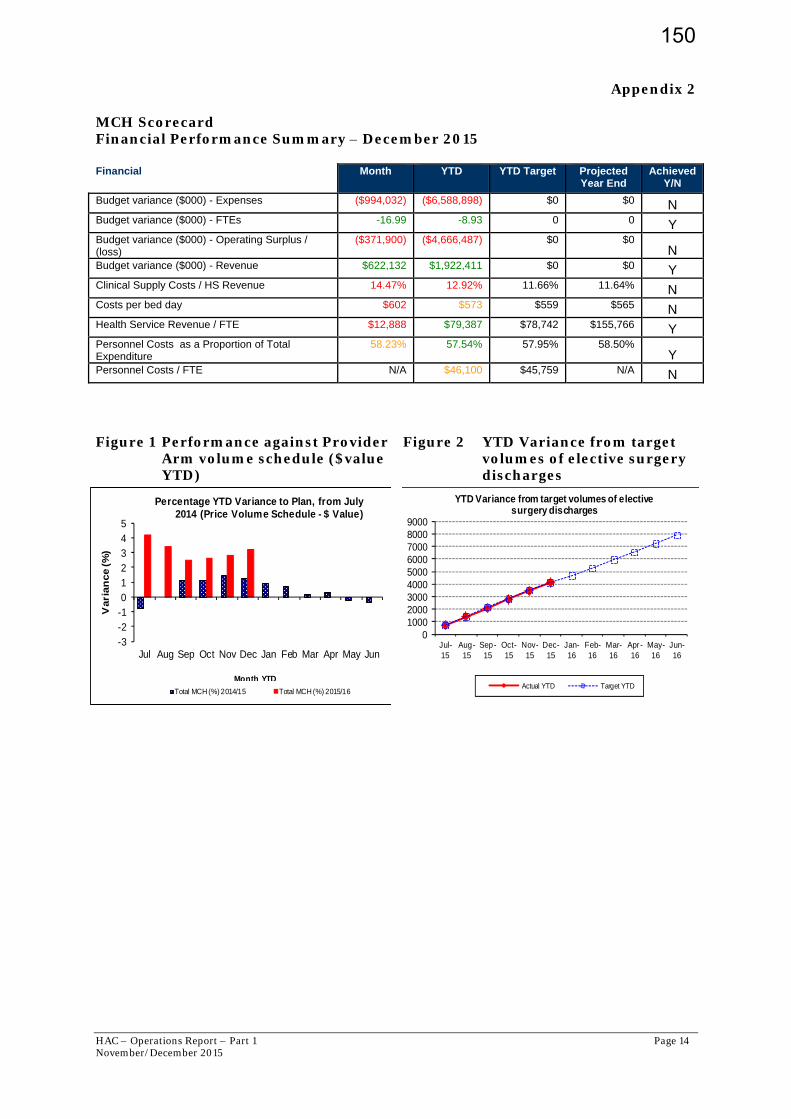
HAC – Operations Report – Part 1 Page 14 November/December 2015
0100020003000400050006000700080009000
Jul-15
Aug-15
Sep-15
Oct-15
Nov-15
Dec-15
Jan-16
Feb-16
Mar-16
Apr-16
May-16
Jun-16
YTD Variance from target volumes of elective surgery discharges
Actual YTD Target YTD
-3-2-1012345
Jul Aug Sep Oct Nov Dec Jan Feb Mar Apr May Jun
Vari
an
ce (%
)
Month YTD
Percentage YTD Variance to Plan, from July 2014 (Price Volume Schedule - $ Value)
Total MCH (%) 2014/15 Total MCH (%) 2015/16
Appendix 2 MCH Scorecard Financial Performance Summary – December 2015 Financial Month YTD YTD Target Projected
Year End Achieved
Y/N
Budget variance ($000) - Expenses ($994,032) ($6,588,898) $0 $0 N Budget variance ($000) - FTEs -16.99 -8.93 0 0 Y Budget variance ($000) - Operating Surplus / (loss)
($371,900) ($4,666,487) $0 $0 N
Budget variance ($000) - Revenue $622,132 $1,922,411 $0 $0 Y Clinical Supply Costs / HS Revenue 14.47% 12.92% 11.66% 11.64% N Costs per bed day $602 $573 $559 $565 N Health Service Revenue / FTE $12,888 $79,387 $78,742 $155,766 Y Personnel Costs as a Proportion of Total Expenditure
58.23% 57.54% 57.95% 58.50% Y
Personnel Costs / FTE N/A $46,100 $45,759 N/A N Figure 1 Performance against Provider
Arm volume schedule ($value YTD)
Figure 2 YTD Variance from target volumes of elective surgery discharges
150
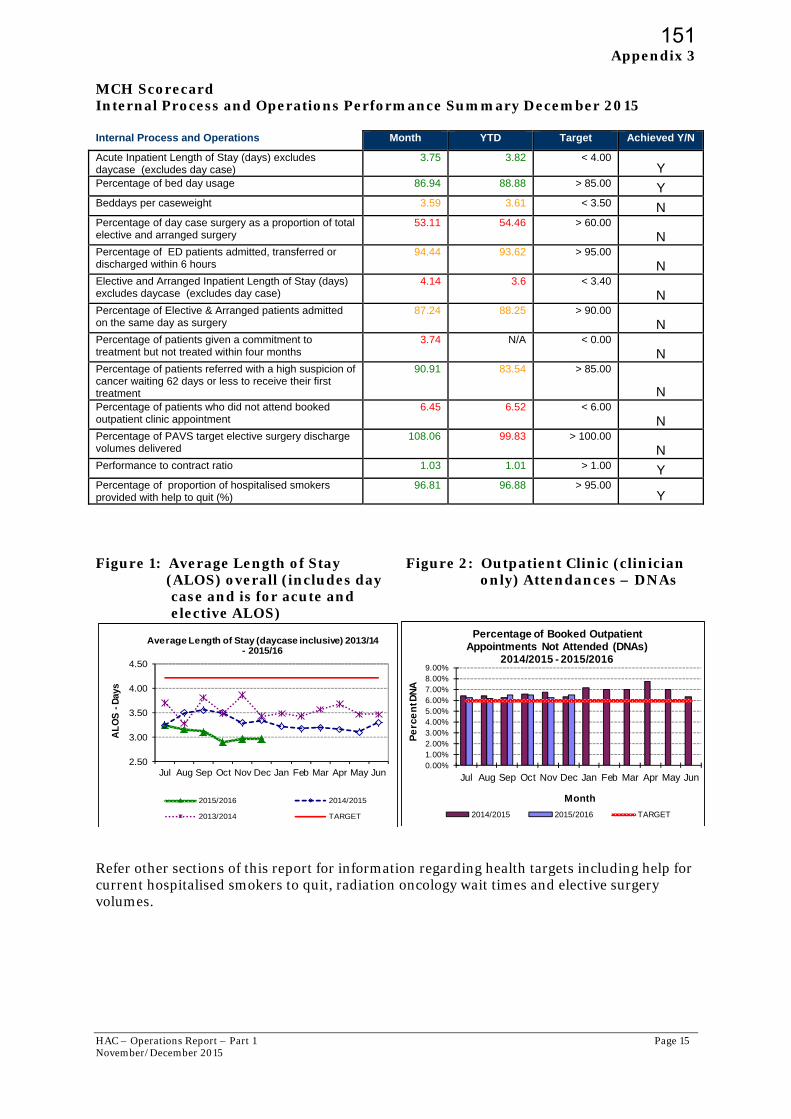
HAC – Operations Report – Part 1 Page 15 November/December 2015
Appendix 3
MCH Scorecard Internal Process and Operations Performance Summary December 2015 Internal Process and Operations Month YTD Target Achieved Y/N
Acute Inpatient Length of Stay (days) excludes daycase (excludes day case)
3.75 3.82 < 4.00 Y
Percentage of bed day usage 86.94 88.88 > 85.00 Y Beddays per caseweight 3.59 3.61 < 3.50 N Percentage of day case surgery as a proportion of total elective and arranged surgery
53.11 54.46 > 60.00
N Percentage of ED patients admitted, transferred or discharged within 6 hours
94.44 93.62 > 95.00
N Elective and Arranged Inpatient Length of Stay (days) excludes daycase (excludes day case)
4.14 3.6 < 3.40
N Percentage of Elective & Arranged patients admitted on the same day as surgery
87.24 88.25 > 90.00
N Percentage of patients given a commitment to treatment but not treated within four months
3.74 N/A < 0.00
N Percentage of patients referred with a high suspicion of cancer waiting 62 days or less to receive their first treatment
90.91 83.54 > 85.00
N Percentage of patients who did not attend booked outpatient clinic appointment
6.45 6.52 < 6.00
N Percentage of PAVS target elective surgery discharge volumes delivered
108.06 99.83 > 100.00
N Performance to contract ratio 1.03 1.01 > 1.00 Y Percentage of proportion of hospitalised smokers provided with help to quit (%)
96.81 96.88 > 95.00 Y
Figure 1: Average Length of Stay (ALOS) overall (includes day
case and is for acute and elective ALOS)
Figure 2: Outpatient Clinic (clinician only) Attendances – DNAs
Refer other sections of this report for information regarding health targets including help for current hospitalised smokers to quit, radiation oncology wait times and elective surgery volumes.
2.50
3.00
3.50
4.00
4.50
Jul Aug Sep Oct Nov Dec Jan Feb Mar Apr May Jun
AL
OS
-D
ays
Average Length of Stay (daycase inclusive) 2013/14 - 2015/16
2015/2016 2014/2015
2013/2014 TARGET
0.00%1.00%2.00%3.00%4.00%5.00%6.00%7.00%8.00%9.00%
Jul Aug Sep Oct Nov Dec Jan Feb Mar Apr May Jun
Pe
rce
nt D
NA
Month
Percentage of Booked Outpatient Appointments Not Attended (DNAs)
2014/2015 - 2015/2016
2014/2015 2015/2016 TARGET
151

HAC – Operations Report – Part 1 Page 16 November/December 2015
0
10
20
30
40
50
60
70
Sep Oct Nov Dec Jan Feb Mar Apr May Jun Jul Aug Sep
Staff Vacancies by Staff Group -Rolling 13 months
Medical Nursing Allied HealthTotal Baseline
0.0%
1.0%
2.0%
3.0%
4.0%
5.0%
6.0%
Jul Aug Sep Oct Nov Dec Jan Feb Mar Apr May Jun
Rate
(%
)
Staff Sick Leave Rate - Annual Comparison, to December 2015
2015/2016 2014/2015
2015/2016 TREND TARGET
Appendix 4 MCH Scorecard Organisation Health and Learning Performance Summary December 2015 Organisational Health and Learning Month YTD Target Achieved Y/N
Percentage of sick leave rate 3.20 3.33 < 3.20 N Percentage of staff stability rate 99.84 99.80 > 99.00 Y Percentage of staff turnover rate (voluntary) average per month
0.52 0.54 < 1.00 Y
Percentage of staff with leave entitlement in excess of two years
15.88 16.92 < 9.50 N
152
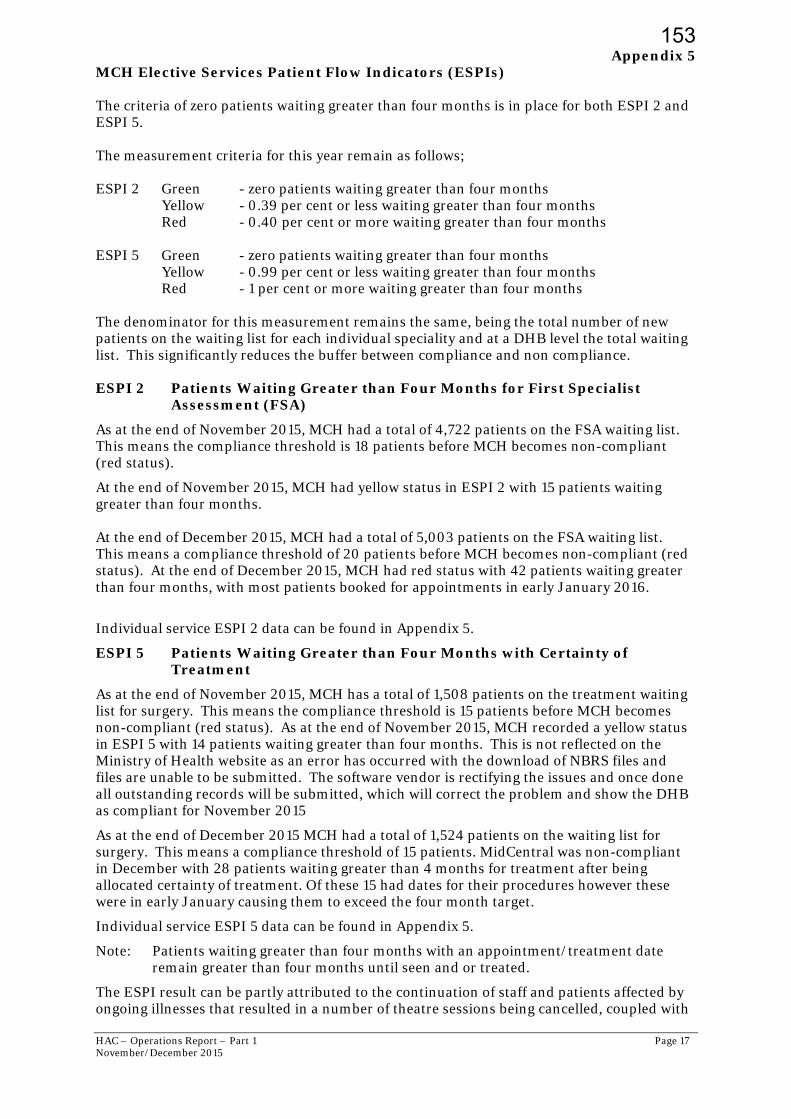
HAC – Operations Report – Part 1 Page 17 November/December 2015
Appendix 5 MCH Elective Services Patient Flow Indicators (ESPIs) The criteria of zero patients waiting greater than four months is in place for both ESPI 2 and ESPI 5. The measurement criteria for this year remain as follows; ESPI 2 Green - zero patients waiting greater than four months Yellow - 0.39 per cent or less waiting greater than four months Red - 0.40 per cent or more waiting greater than four months ESPI 5 Green - zero patients waiting greater than four months Yellow - 0.99 per cent or less waiting greater than four months Red - 1 per cent or more waiting greater than four months The denominator for this measurement remains the same, being the total number of new patients on the waiting list for each individual speciality and at a DHB level the total waiting list. This significantly reduces the buffer between compliance and non compliance. ESPI 2 Patients Waiting Greater than Four Months for First Specialist
Assessment (FSA)
As at the end of November 2015, MCH had a total of 4,722 patients on the FSA waiting list. This means the compliance threshold is 18 patients before MCH becomes non-compliant (red status).
At the end of November 2015, MCH had yellow status in ESPI 2 with 15 patients waiting greater than four months. At the end of December 2015, MCH had a total of 5,003 patients on the FSA waiting list. This means a compliance threshold of 20 patients before MCH becomes non-compliant (red status). At the end of December 2015, MCH had red status with 42 patients waiting greater than four months, with most patients booked for appointments in early January 2016.
Individual service ESPI 2 data can be found in Appendix 5.
ESPI 5 Patients Waiting Greater than Four Months with Certainty of Treatment
As at the end of November 2015, MCH has a total of 1,508 patients on the treatment waiting list for surgery. This means the compliance threshold is 15 patients before MCH becomes non-compliant (red status). As at the end of November 2015, MCH recorded a yellow status in ESPI 5 with 14 patients waiting greater than four months. This is not reflected on the Ministry of Health website as an error has occurred with the download of NBRS files and files are unable to be submitted. The software vendor is rectifying the issues and once done all outstanding records will be submitted, which will correct the problem and show the DHB as compliant for November 2015
As at the end of December 2015 MCH had a total of 1,524 patients on the waiting list for surgery. This means a compliance threshold of 15 patients. MidCentral was non-compliant in December with 28 patients waiting greater than 4 months for treatment after being allocated certainty of treatment. Of these 15 had dates for their procedures however these were in early January causing them to exceed the four month target.
Individual service ESPI 5 data can be found in Appendix 5.
Note: Patients waiting greater than four months with an appointment/treatment date remain greater than four months until seen and or treated.
The ESPI result can be partly attributed to the continuation of staff and patients affected by ongoing illnesses that resulted in a number of theatre sessions being cancelled, coupled with
153
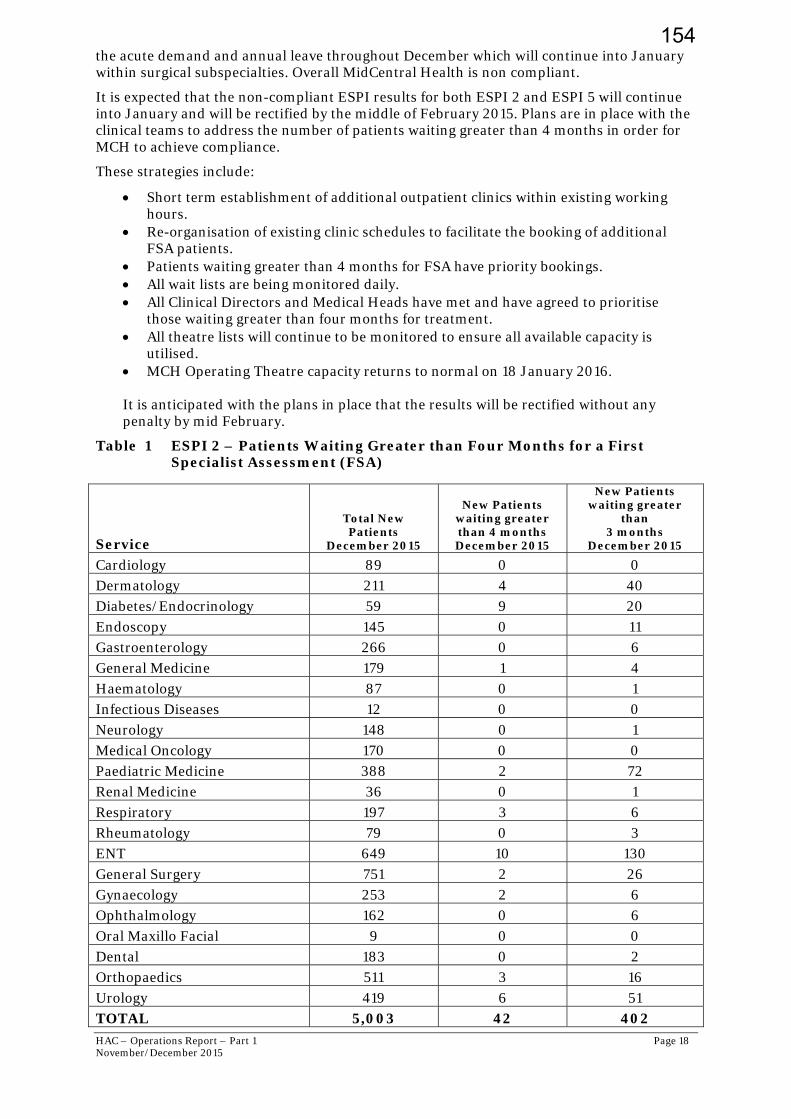
HAC – Operations Report – Part 1 Page 18 November/December 2015
the acute demand and annual leave throughout December which will continue into January within surgical subspecialties. Overall MidCentral Health is non compliant.
It is expected that the non-compliant ESPI results for both ESPI 2 and ESPI 5 will continue into January and will be rectified by the middle of February 2015. Plans are in place with the clinical teams to address the number of patients waiting greater than 4 months in order for MCH to achieve compliance.
These strategies include:
Short term establishment of additional outpatient clinics within existing working hours.
Re-organisation of existing clinic schedules to facilitate the booking of additional FSA patients.
Patients waiting greater than 4 months for FSA have priority bookings. All wait lists are being monitored daily. All Clinical Directors and Medical Heads have met and have agreed to prioritise
those waiting greater than four months for treatment. All theatre lists will continue to be monitored to ensure all available capacity is
utilised. MCH Operating Theatre capacity returns to normal on 18 January 2016. It is anticipated with the plans in place that the results will be rectified without any penalty by mid February.
Table 1 ESPI 2 – Patients Waiting Greater than Four Months for a First Specialist Assessment (FSA)
Service
Total New Patients
December 2015
New Patients waiting greater than 4 months December 2015
New Patients waiting greater
than 3 months
December 2015
Cardiology 89 0 0 Dermatology 211 4 40 Diabetes/Endocrinology 59 9 20 Endoscopy 145 0 11 Gastroenterology 266 0 6 General Medicine 179 1 4 Haematology 87 0 1 Infectious Diseases 12 0 0 Neurology 148 0 1 Medical Oncology 170 0 0 Paediatric Medicine 388 2 72 Renal Medicine 36 0 1 Respiratory 197 3 6 Rheumatology 79 0 3 ENT 649 10 130 General Surgery 751 2 26 Gynaecology 253 2 6 Ophthalmology 162 0 6 Oral Maxillo Facial 9 0 0 Dental 183 0 2 Orthopaedics 511 3 16 Urology 419 6 51 TOTAL 5,003 42 402
154
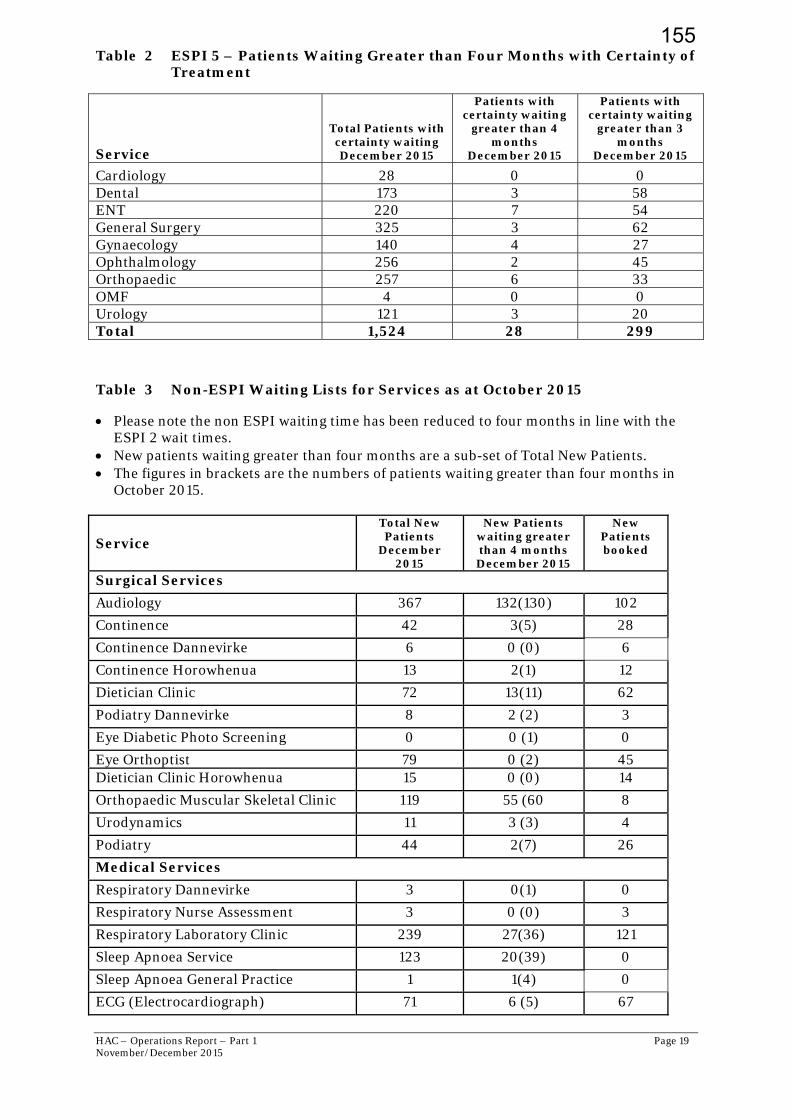
HAC – Operations Report – Part 1 Page 19 November/December 2015
Table 2 ESPI 5 – Patients Waiting Greater than Four Months with Certainty of Treatment
Service
Total Patients with certainty waiting December 2015
Patients with certainty waiting
greater than 4 months
December 2015
Patients with certainty waiting
greater than 3 months
December 2015
Cardiology 28 0 0 Dental 173 3 58 ENT 220 7 54 General Surgery 325 3 62 Gynaecology 140 4 27 Ophthalmology 256 2 45 Orthopaedic 257 6 33 OMF 4 0 0 Urology 121 3 20 Total 1,524 28 299
Table 3 Non-ESPI Waiting Lists for Services as at October 2015
Please note the non ESPI waiting time has been reduced to four months in line with the ESPI 2 wait times.
New patients waiting greater than four months are a sub-set of Total New Patients. The figures in brackets are the numbers of patients waiting greater than four months in
October 2015.
Service
Total New Patients
December 2015
New Patients waiting greater than 4 months December 2015
New Patients booked
Surgical Services
Audiology 367 132(130) 102
Continence 42 3(5) 28
Continence Dannevirke 6 0 (0) 6
Continence Horowhenua 13 2(1) 12
Dietician Clinic 72 13(11) 62
Podiatry Dannevirke 8 2 (2) 3
Eye Diabetic Photo Screening 0 0 (1) 0
Eye Orthoptist 79 0 (2) 45 Dietician Clinic Horowhenua 15 0 (0) 14
Orthopaedic Muscular Skeletal Clinic 119 55 (60 8
Urodynamics 11 3 (3) 4
Podiatry 44 2(7) 26
Medical Services
Respiratory Dannevirke 3 0(1) 0
Respiratory Nurse Assessment 3 0 (0) 3
Respiratory Laboratory Clinic 239 27(36) 121
Sleep Apnoea Service 123 20(39) 0
Sleep Apnoea General Practice 1 1(4) 0
ECG (Electrocardiograph) 71 6 (5) 67
155
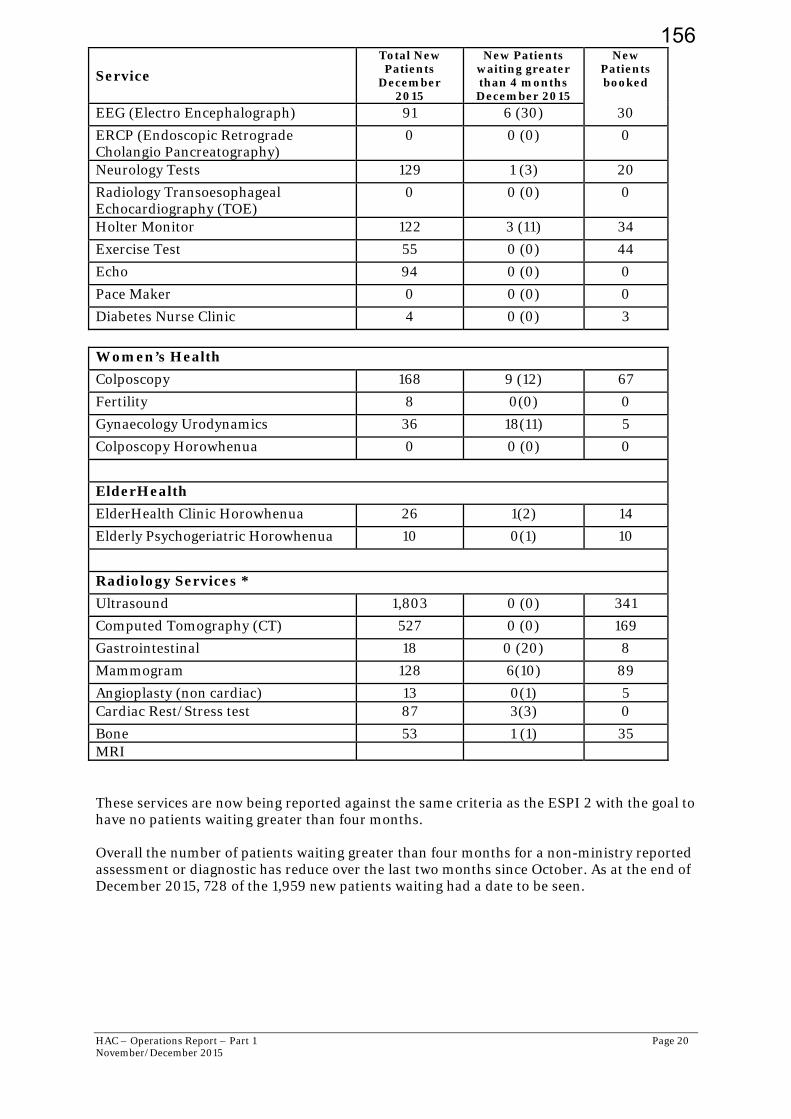
HAC – Operations Report – Part 1 Page 20 November/December 2015
Service
Total New Patients
December 2015
New Patients waiting greater than 4 months December 2015
New Patients booked
EEG (Electro Encephalograph) 91 6 (30) 30
ERCP (Endoscopic Retrograde Cholangio Pancreatography)
0 0 (0) 0
Neurology Tests 129 1 (3) 20
Radiology Transoesophageal Echocardiography (TOE)
0 0 (0) 0
Holter Monitor 122 3 (11) 34
Exercise Test 55 0 (0) 44
Echo 94 0 (0) 0
Pace Maker 0 0 (0) 0
Diabetes Nurse Clinic 4 0 (0) 3
Women’s Health
Colposcopy 168 9 (12) 67
Fertility 8 0(0) 0
Gynaecology Urodynamics 36 18(11) 5
Colposcopy Horowhenua 0 0 (0) 0
ElderHealth
ElderHealth Clinic Horowhenua 26 1(2) 14
Elderly Psychogeriatric Horowhenua 10 0(1) 10
Radiology Services *
Ultrasound 1,803 0 (0) 341
Computed Tomography (CT) 527 0 (0) 169
Gastrointestinal 18 0 (20) 8
Mammogram 128 6(10) 89
Angioplasty (non cardiac) 13 0(1) 5 Cardiac Rest/Stress test 87 3(3) 0
Bone 53 1 (1) 35 MRI These services are now being reported against the same criteria as the ESPI 2 with the goal to have no patients waiting greater than four months. Overall the number of patients waiting greater than four months for a non-ministry reported assessment or diagnostic has reduce over the last two months since October. As at the end of December 2015, 728 of the 1,959 new patients waiting had a date to be seen.
156
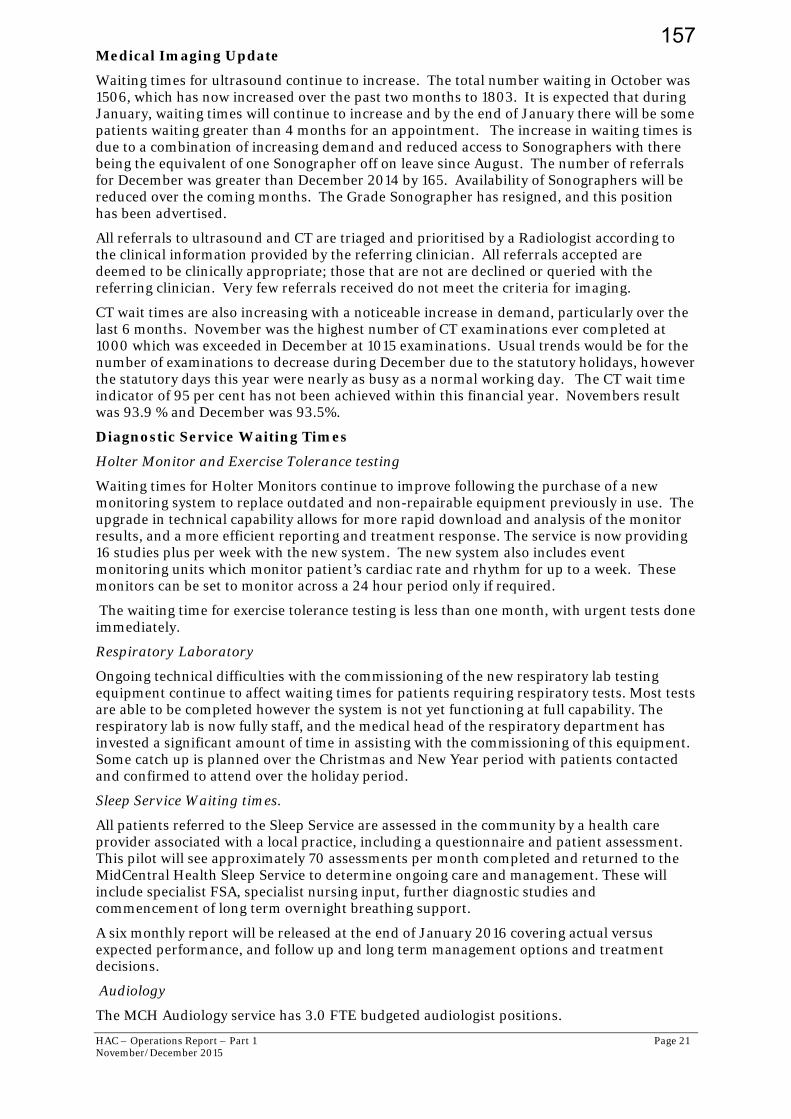
HAC – Operations Report – Part 1 Page 21 November/December 2015
Medical Imaging Update
Waiting times for ultrasound continue to increase. The total number waiting in October was 1506, which has now increased over the past two months to 1803. It is expected that during January, waiting times will continue to increase and by the end of January there will be some patients waiting greater than 4 months for an appointment. The increase in waiting times is due to a combination of increasing demand and reduced access to Sonographers with there being the equivalent of one Sonographer off on leave since August. The number of referrals for December was greater than December 2014 by 165. Availability of Sonographers will be reduced over the coming months. The Grade Sonographer has resigned, and this position has been advertised.
All referrals to ultrasound and CT are triaged and prioritised by a Radiologist according to the clinical information provided by the referring clinician. All referrals accepted are deemed to be clinically appropriate; those that are not are declined or queried with the referring clinician. Very few referrals received do not meet the criteria for imaging.
CT wait times are also increasing with a noticeable increase in demand, particularly over the last 6 months. November was the highest number of CT examinations ever completed at 1000 which was exceeded in December at 1015 examinations. Usual trends would be for the number of examinations to decrease during December due to the statutory holidays, however the statutory days this year were nearly as busy as a normal working day. The CT wait time indicator of 95 per cent has not been achieved within this financial year. Novembers result was 93.9 % and December was 93.5%.
Diagnostic Service Waiting Times
Holter Monitor and Exercise Tolerance testing
Waiting times for Holter Monitors continue to improve following the purchase of a new monitoring system to replace outdated and non-repairable equipment previously in use. The upgrade in technical capability allows for more rapid download and analysis of the monitor results, and a more efficient reporting and treatment response. The service is now providing 16 studies plus per week with the new system. The new system also includes event monitoring units which monitor patient’s cardiac rate and rhythm for up to a week. These monitors can be set to monitor across a 24 hour period only if required.
The waiting time for exercise tolerance testing is less than one month, with urgent tests done immediately.
Respiratory Laboratory
Ongoing technical difficulties with the commissioning of the new respiratory lab testing equipment continue to affect waiting times for patients requiring respiratory tests. Most tests are able to be completed however the system is not yet functioning at full capability. The respiratory lab is now fully staff, and the medical head of the respiratory department has invested a significant amount of time in assisting with the commissioning of this equipment. Some catch up is planned over the Christmas and New Year period with patients contacted and confirmed to attend over the holiday period.
Sleep Service Waiting times.
All patients referred to the Sleep Service are assessed in the community by a health care provider associated with a local practice, including a questionnaire and patient assessment. This pilot will see approximately 70 assessments per month completed and returned to the MidCentral Health Sleep Service to determine ongoing care and management. These will include specialist FSA, specialist nursing input, further diagnostic studies and commencement of long term overnight breathing support.
A six monthly report will be released at the end of January 2016 covering actual versus expected performance, and follow up and long term management options and treatment decisions.
Audiology
The MCH Audiology service has 3.0 FTE budgeted audiologist positions.
157

HAC – Operations Report – Part 1 Page 22 November/December 2015
Following the resignation in April 2015 of the senior audiologist, recruitment into this vacancy, as well as the newly funded position following the audiology service review in 2014, has been slow.
During this time, support for the 1 remaining full time audiologist has been provided by a locum Audiologist working 1 day per week as recruitment progresses. This audiologist provides specialist audiology testing for babies and children.
A second full-time audiologist was appointed in September 2015, and it is likely that the third position will be recruited to in early 2016.
The service accepts only urgent adult referrals, and paediatric assessments and testing – some of these tests take a considerable amount of time, with some tests requiring 2 audiologists to complete.
It is expected that there will be an improvement in the wait list numbers with the return from a long period of planned leave by one of the full time audiologists who travelled to the Philippines to get married during December / January.
First Specialist Assessment (FSA) – Declines
Definition of “decline” for the purpose of this table is decline due to reasons of service capacity and ability to see the patient within four months.
Table 4 First Specialist Assessment (FSA) – Referral Declines
Services
Referral Decline
September 2015
Referral Decline October
2015
Referral Decline
November 2015
Referral Decline
December 2015
Medical
Cardiology 10 6 19 13
Dermatology 14 13 12 5
Diabetes/Endocrinology 3 0 1 0
Endoscopy 0 0 0 0
Gastroenterology 0 0 3 5
General Medicine 1 1 3 1
Haematology 0 0 0 0
Infectious Diseases 0 0 0 0
Neurology 22 11 8 5
Oncology 0 0 0 0
Paediatric Medicine 0 0 0 0
Renal Medicine 13 12 7 11
Respiratory 4 0 1 2
Rheumatology 6 6 3 1 ENT 11 7 11 7 General Surgery 4 4 3 2
Gynaecology 43 43 42 3
Ophthalmology 40 25 25 19
Oral Maxillo Facial 0 0 0 0
Dental 9 0 1 0
Orthopaedics 27 31 33 14 Urology 2 0 2 0
TOTAL 209 159 174 88 Over the last four months, 13,330 referrals have been received into the organisation. Of those 12,712 (95 per cent) were accepted and a total of 618 were declined and returned to their GP for ongoing management as they did not meet the access threshold at the time.
158
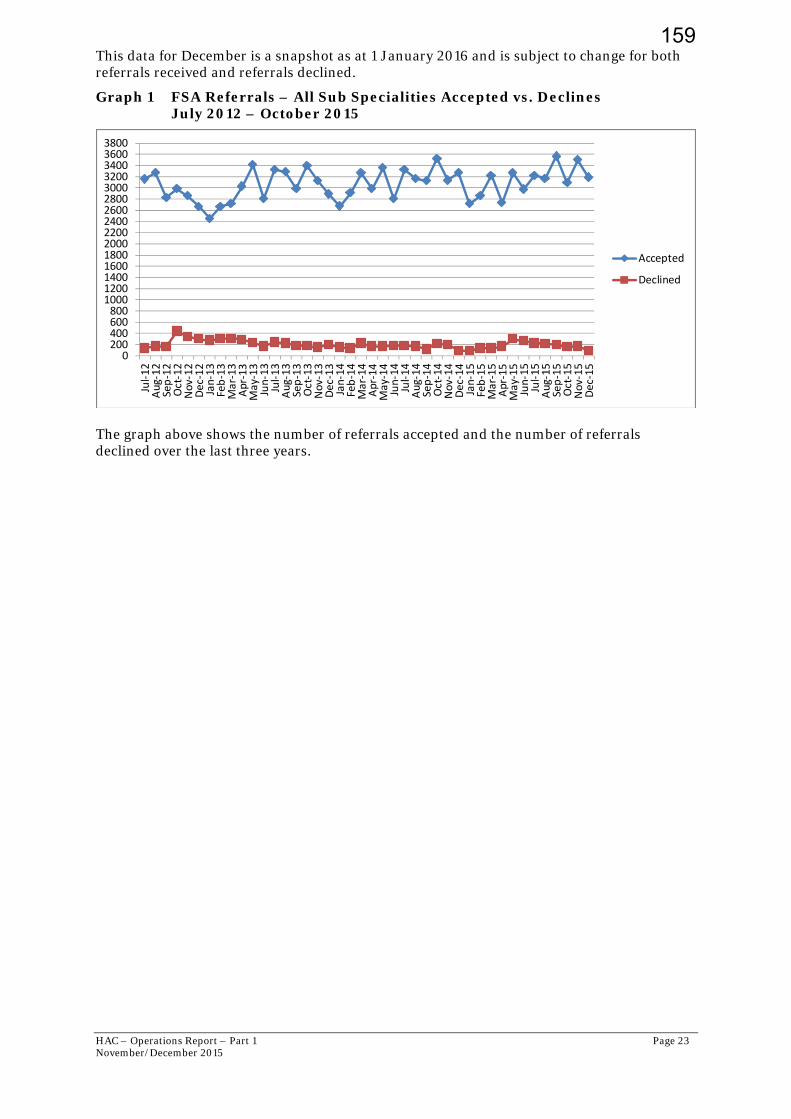
HAC – Operations Report – Part 1 Page 23 November/December 2015
This data for December is a snapshot as at 1 January 2016 and is subject to change for both referrals received and referrals declined.
Graph 1 FSA Referrals – All Sub Specialities Accepted vs. Declines July 2012 – October 2015
The graph above shows the number of referrals accepted and the number of referrals declined over the last three years.
0200400600800100012001400160018002000220024002600280030003200340036003800
Jul‐12
Aug‐12
Sep‐12
Oct‐12
Nov‐12
Dec‐12
Jan‐13
Feb‐13
Mar‐13
Apr‐13
May‐13
Jun‐13
Jul‐13
Aug‐13
Sep‐13
Oct‐13
Nov‐13
Dec‐13
Jan‐14
Feb‐14
Mar‐14
Apr‐14
May‐14
Jun‐14
Jul‐14
Aug‐14
Sep‐14
Oct‐14
Nov‐14
Dec‐14
Jan‐15
Feb‐15
Mar‐15
Apr‐15
May‐15
Jun‐15
Jul‐15
Aug‐15
Sep‐15
Oct‐15
No v‐15
Dec‐15
Accepted
Declined
159
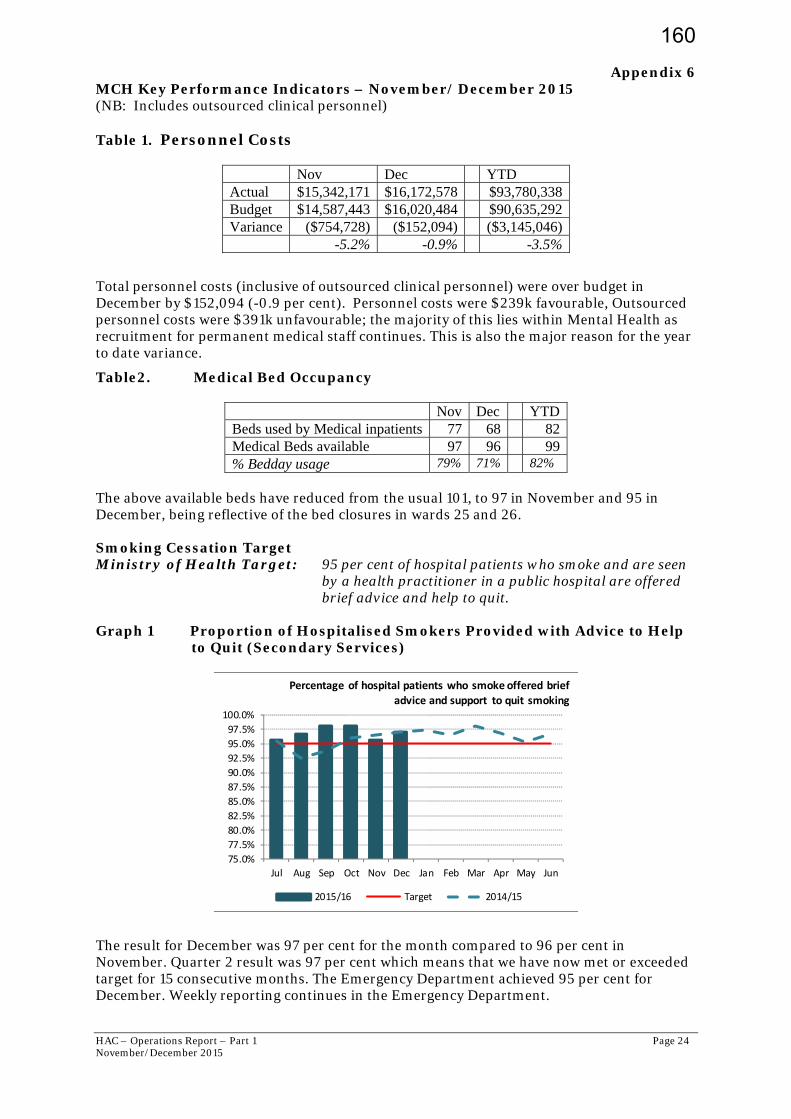
HAC – Operations Report – Part 1 Page 24 November/December 2015
Appendix 6
MCH Key Performance Indicators – November/ December 2015 (NB: Includes outsourced clinical personnel) Table 1. Personnel Costs
Nov Dec YTD Actual $15,342,171 $16,172,578 $93,780,338 Budget $14,587,443 $16,020,484 $90,635,292 Variance ($754,728) ($152,094) ($3,145,046) -5.2% -0.9% -3.5%
Total personnel costs (inclusive of outsourced clinical personnel) were over budget in December by $152,094 (-0.9 per cent). Personnel costs were $239k favourable, Outsourced personnel costs were $391k unfavourable; the majority of this lies within Mental Health as recruitment for permanent medical staff continues. This is also the major reason for the year to date variance.
Table2. Medical Bed Occupancy
Nov Dec YTD Beds used by Medical inpatients 77 68 82 Medical Beds available 97 96 99 % Bedday usage 79% 71% 82%
The above available beds have reduced from the usual 101, to 97 in November and 95 in December, being reflective of the bed closures in wards 25 and 26. Smoking Cessation Target Ministry of Health Target: 95 per cent of hospital patients who smoke and are seen
by a health practitioner in a public hospital are offered brief advice and help to quit.
Graph 1 Proportion of Hospitalised Smokers Provided with Advice to Help
to Quit (Secondary Services)
The result for December was 97 per cent for the month compared to 96 per cent in November. Quarter 2 result was 97 per cent which means that we have now met or exceeded target for 15 consecutive months. The Emergency Department achieved 95 per cent for December. Weekly reporting continues in the Emergency Department.
75.0%
77.5%
80.0%
82.5%
85.0%
87.5%
90.0%
92.5%
95.0%
97.5%
100.0%
Jul Aug Sep Oct Nov Dec Jan Feb Mar Apr May Jun
Percentage of hospital patients who smoke offered brief
advice and support to quit smoking
2015/16 Target 2014/15
160
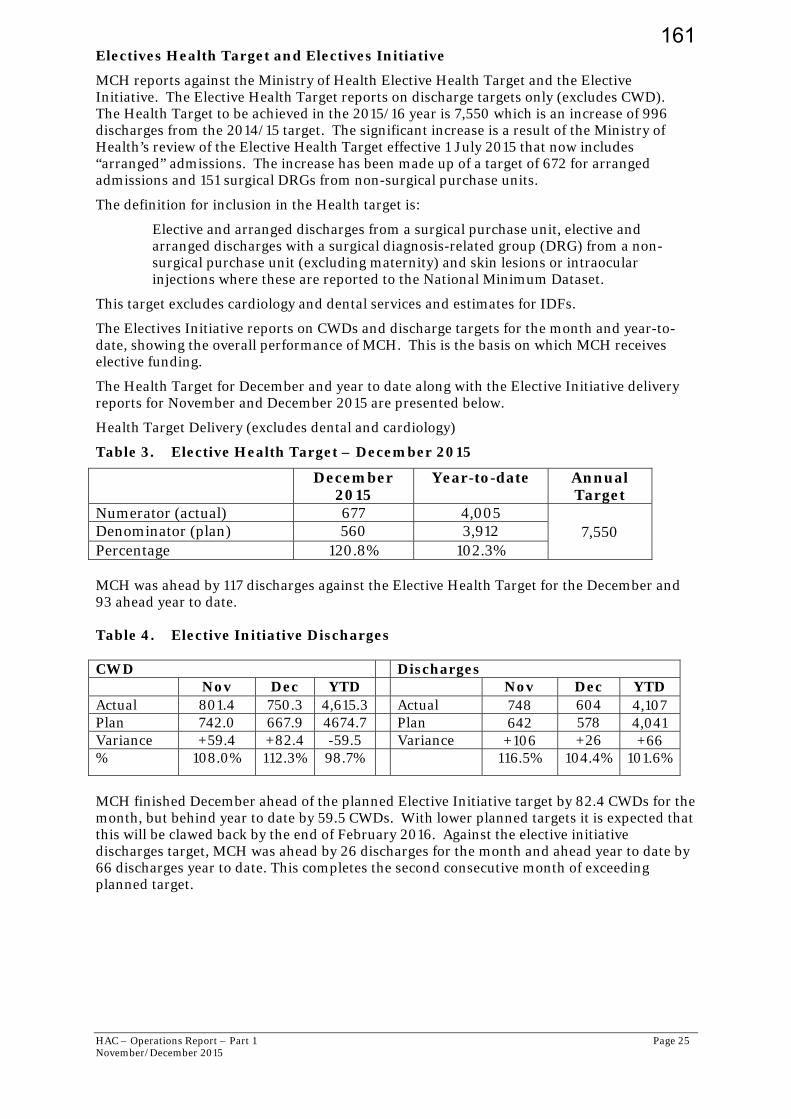
HAC – Operations Report – Part 1 Page 25 November/December 2015
Electives Health Target and Electives Initiative
MCH reports against the Ministry of Health Elective Health Target and the Elective Initiative. The Elective Health Target reports on discharge targets only (excludes CWD). The Health Target to be achieved in the 2015/16 year is 7,550 which is an increase of 996 discharges from the 2014/15 target. The significant increase is a result of the Ministry of Health’s review of the Elective Health Target effective 1 July 2015 that now includes “arranged” admissions. The increase has been made up of a target of 672 for arranged admissions and 151 surgical DRGs from non-surgical purchase units.
The definition for inclusion in the Health target is:
Elective and arranged discharges from a surgical purchase unit, elective and arranged discharges with a surgical diagnosis-related group (DRG) from a non-surgical purchase unit (excluding maternity) and skin lesions or intraocular injections where these are reported to the National Minimum Dataset.
This target excludes cardiology and dental services and estimates for IDFs.
The Electives Initiative reports on CWDs and discharge targets for the month and year-to-date, showing the overall performance of MCH. This is the basis on which MCH receives elective funding.
The Health Target for December and year to date along with the Elective Initiative delivery reports for November and December 2015 are presented below.
Health Target Delivery (excludes dental and cardiology)
Table 3. Elective Health Target – December 2015
December 2015
Year-to-date Annual Target
Numerator (actual) 677 4,005 7,550 Denominator (plan) 560 3,912
Percentage 120.8% 102.3% MCH was ahead by 117 discharges against the Elective Health Target for the December and 93 ahead year to date. Table 4. Elective Initiative Discharges CWD Discharges Nov Dec YTD Nov Dec YTD Actual 801.4 750.3 4,615.3 Actual 748 604 4,107 Plan 742.0 667.9 4674.7 Plan 642 578 4,041 Variance +59.4 +82.4 -59.5 Variance +106 +26 +66 % 108.0% 112.3% 98.7% 116.5% 104.4% 101.6%
MCH finished December ahead of the planned Elective Initiative target by 82.4 CWDs for the month, but behind year to date by 59.5 CWDs. With lower planned targets it is expected that this will be clawed back by the end of February 2016. Against the elective initiative discharges target, MCH was ahead by 26 discharges for the month and ahead year to date by 66 discharges year to date. This completes the second consecutive month of exceeding planned target.
161
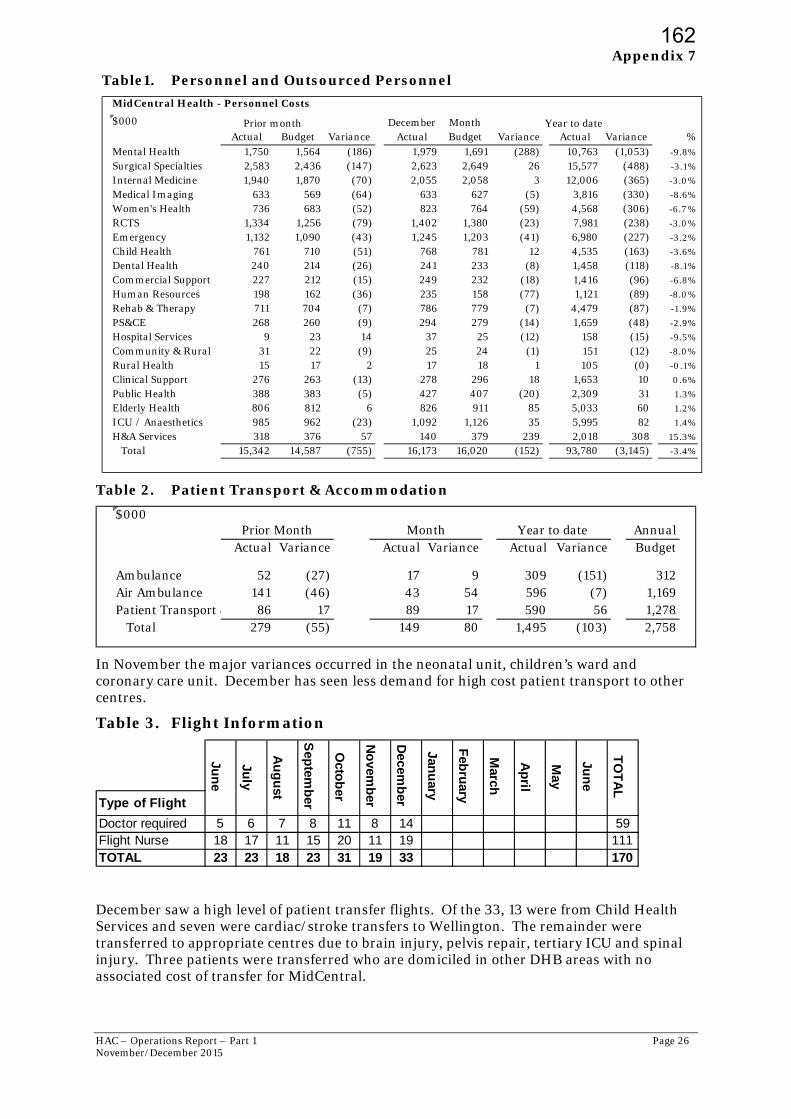
HAC – Operations Report – Part 1 Page 26 November/December 2015
Appendix 7
Table1. Personnel and Outsourced Personnel
Table 2. Patient Transport & Accommodation
In November the major variances occurred in the neonatal unit, children’s ward and coronary care unit. December has seen less demand for high cost patient transport to other centres.
Table 3. Flight Information
December saw a high level of patient transfer flights. Of the 33, 13 were from Child Health Services and seven were cardiac/stroke transfers to Wellington. The remainder were transferred to appropriate centres due to brain injury, pelvis repair, tertiary ICU and spinal injury. Three patients were transferred who are domiciled in other DHB areas with no associated cost of transfer for MidCentral.
MidCentral Health - Personnel Costs
$000 December Month Y ear to dateActual Budget Variance Actual Budget Variance Actual Variance %
Mental Health 1,750 1,564 (186) 1,979 1,691 (288) 10,763 (1,053) -9.8%
Surgical Specialties 2,583 2,436 (147) 2,623 2,649 26 15,577 (488) -3.1%
Internal Medicine 1,940 1,870 (70) 2,055 2,058 3 12,006 (365) -3.0%
Medical Imaging 633 569 (64) 633 627 (5) 3,816 (330) -8.6%
Women's Health 736 683 (52) 823 764 (59) 4,568 (306) -6.7 %
RCTS 1,334 1,256 (79) 1,402 1,380 (23) 7,981 (238) -3.0%
Emergency 1,132 1,090 (43) 1,245 1,203 (41) 6,980 (227) -3.2%
Child Health 761 710 (51) 768 781 12 4,535 (163) -3.6%
Dental Health 240 214 (26) 241 233 (8) 1,458 (118) -8.1%
Commercial Support 227 212 (15) 249 232 (18) 1,416 (96) -6.8%
Human Resources 198 162 (36) 235 158 (77) 1,121 (89) -8.0%
Rehab & Therapy 711 704 (7) 786 779 (7) 4,479 (87) -1.9%
PS&CE 268 260 (9) 294 279 (14) 1,659 (48) -2.9%
Hospital Services 9 23 14 37 25 (12) 158 (15) -9.5%
Community & Rural 31 22 (9) 25 24 (1) 151 (12) -8.0%
Rural Health 15 17 2 17 18 1 105 (0) -0.1%
Clinical Support 276 263 (13) 278 296 18 1,653 10 0.6%
Public Health 388 383 (5) 427 407 (20) 2,309 31 1.3%
Elderly Health 806 812 6 826 911 85 5,033 60 1.2%
ICU / Anaesthetics 985 962 (23) 1,092 1,126 35 5,995 82 1.4%
H&A Services 318 376 57 140 379 239 2,018 308 15.3%
Total 15,342 14,587 (755) 16,173 16,020 (152) 93,780 (3,145) -3.4%
Prior month
$000Annual
Actual Variance Actual Variance Actual Variance Budget
Ambulance 52 (27) 17 9 309 (151) 312Air Ambulance 141 (46) 43 54 596 (7) 1,169Patient Transport & 86 17 89 17 590 56 1,278 Total 279 (55) 149 80 1,495 (103) 2,758
Prior Month Month Year to date
Type of Flight
Doctor required 5 6 7 8 11 8 14 59Flight Nurse 18 17 11 15 20 11 19 111TOTAL 23 23 18 23 31 19 33 170
Jun
e
TO
TA
L
Decem
ber
Janu
ary
Feb
ruary
March
Ap
ril
May
No
vemb
er
Jun
e
July
Au
gu
st
Sep
temb
er
Octo
ber
162
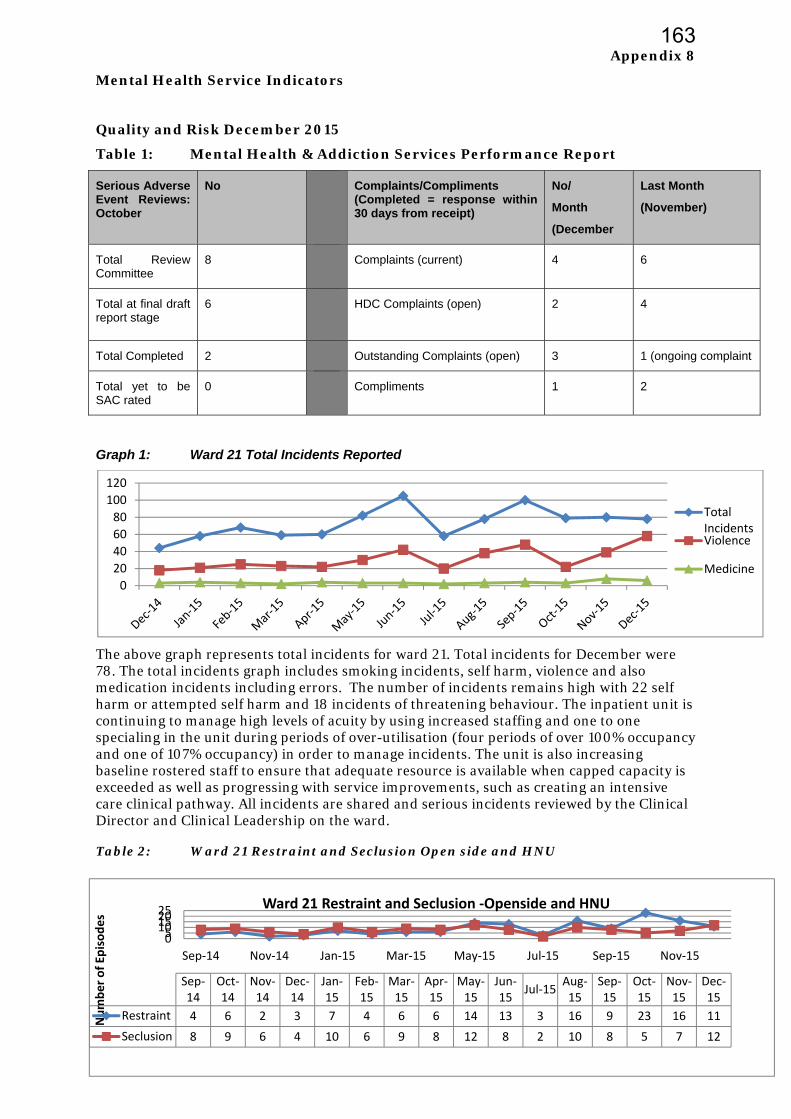
HAC – Operations Report – Part 1 Page 27 November/December 2015
Appendix 8
Mental Health Service Indicators
Quality and Risk December 2015
Table 1: Mental Health & Addiction Services Performance Report
Serious Adverse Event Reviews: October
No Complaints/Compliments (Completed = response within 30 days from receipt)
No/
Month
(December
Last Month
(November)
Total Review Committee
8 Complaints (current) 4 6
Total at final draft report stage
6 HDC Complaints (open)
2 4
Total Completed 2 Outstanding Complaints (open) 3 1 (ongoing complaint
Total yet to be SAC rated
0 Compliments 1 2
Graph 1: Ward 21 Total Incidents Reported
The above graph represents total incidents for ward 21. Total incidents for December were 78. The total incidents graph includes smoking incidents, self harm, violence and also medication incidents including errors. The number of incidents remains high with 22 self harm or attempted self harm and 18 incidents of threatening behaviour. The inpatient unit is continuing to manage high levels of acuity by using increased staffing and one to one specialing in the unit during periods of over-utilisation (four periods of over 100% occupancy and one of 107% occupancy) in order to manage incidents. The unit is also increasing baseline rostered staff to ensure that adequate resource is available when capped capacity is exceeded as well as progressing with service improvements, such as creating an intensive care clinical pathway. All incidents are shared and serious incidents reviewed by the Clinical Director and Clinical Leadership on the ward. Table 2: Ward 21 Restraint and Seclusion Open side and HNU
0
20
40
60
80
100
120
Total IncidentsViolence
Medicine
0510152025
Sep‐14 Nov‐14 Jan‐15 Mar‐15 May‐15 Jul‐15 Sep‐15 Nov‐15
Number of Ep
isodes
Sep‐14
Oct‐14
Nov‐14
Dec‐14
Jan‐15
Feb‐15
Mar‐15
Apr‐15
May‐15
Jun‐15
Jul‐15Aug‐15
Sep‐15
Oct‐15
Nov‐15
Dec‐15
Restraint 4 6 2 3 7 4 6 6 14 13 3 16 9 23 16 11
Seclusion 8 9 6 4 10 6 9 8 12 8 2 10 8 5 7 12
Ward 21 Restraint and Seclusion ‐Openside and HNU
163

HAC – Operations Report – Part 1 Page 28 November/December 2015
The record of use of seclusion reflects high acuity and disturbed behaviour for admitted clients during the month of December with an increase in use of seclusion from October and November.
Ward 21 Occupancy, Utilisation Admission/Discharge
Graph 2: Ward 21 Average bed occupancy for April 2014 – December 2015
Graph 3: Ward 21 Actual bed occupancy per day for December 2015
Graph 4: Ward 21 Occupancy per day including patient leave for December 2015
Graph 5: Ward 21 - 28 Day Acute Inpatient Readmission Rate
Percentage of all inpatients discharged in a given month who were readmitted within 28 days. Data for December is not available as 28 days need to elapse after the last discharges
25
22
2523 23
2223 23 23
24 25
21
24 2423
2223
22
24 25
23
15
17
19
21
23
25
27W21 Bed Occupancy
Resourced Capped
28
26
2425
2222
2425
2323
26
2424
2625
2425
202020
24
222323
19192020
2322
28
18
20
22
24
26
28
30
B
e
d
s
O
c
c
u
p
i
e
d
Ward 21 Bed Occupancy by Day December 2015 (TrendCare)
Capped BedsDay
Reserved Beds
05101520253035
Shifts per day
W21 Occupied beds and on leave
Leave
Ward
Capped
Resourced
164
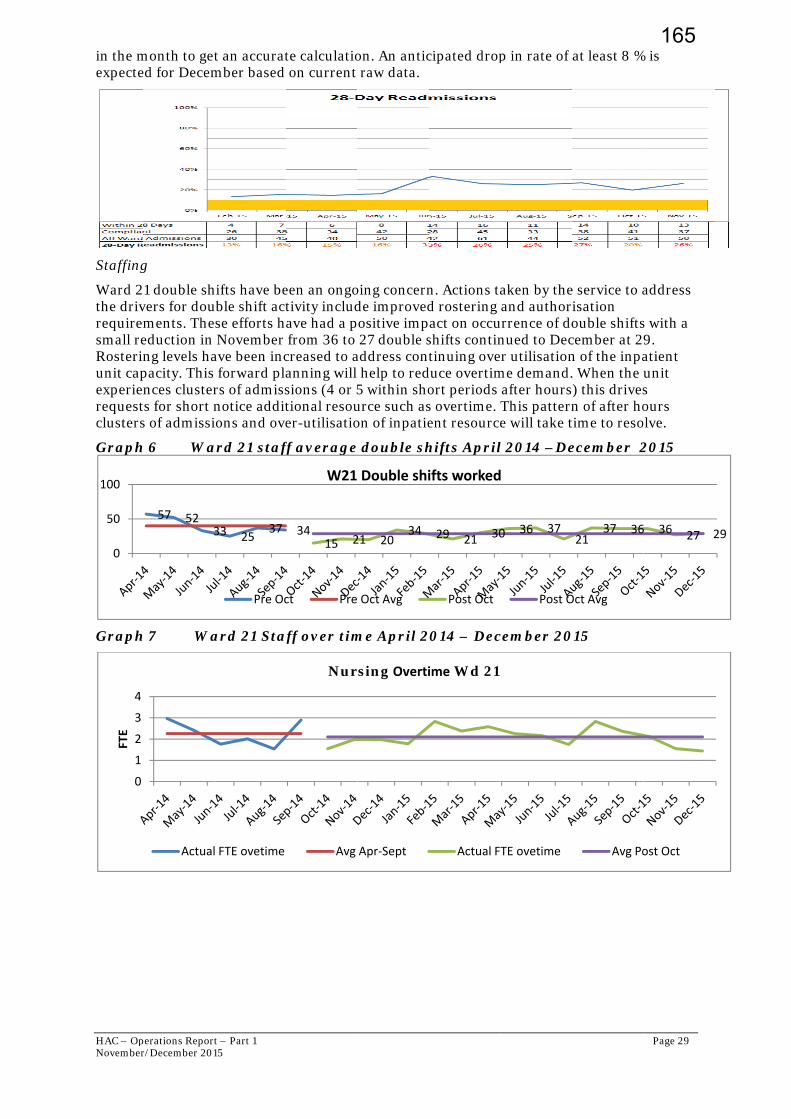
HAC – OpNovember
in the mexpecte
Staffing
Ward 2the drivrequiresmall reRosteriunit capexperierequestclusters
Graph
Graph
0
50
100
0
1
2
3
4
FTE
perations Reportr/December 201
month to geted for Decem
g
1 double shvers for douments. Theeduction in ng levels hapacity. This nces cluster
ts for short ns of admissi
h 6 Wa
h 7 Wa
57 523
Actual
t – Part 1 15
t an accuratmber based
hifts have beuble shift actese efforts h November ave been inc forward plars of admissnotice additions and ove
ard 21 staff
ard 21 Staf
33 2537
Pre Oc
l FTE ovetime
te calculatio on current
een an ongotivity includave had a p from 36 to creased to aanning will sions (4 or 5tional resouer-utilisatio
ff average
aff over tim
3415 2
W21
ct Pre
Nur
Avg
on. An antic raw data.
oing concernde improvedositive imp 27 double s
address cont help to red5 within shource such ason of inpatie
double sh
me April 2
21 2034
Double shi
Oct Avg
rsing Overti
Apr‐Sept
cipated drop
n. Actions tad rostering act on occushifts contintinuing ove
duce overtimort periods s overtime. Tent resource
hifts April
014 – Dec
29 21 30
ifts worked
Post Oct
ime Wd 21
Actual F
p in rate of
aken by the and author
urrence of donued to Decer utilisationme demand. after hoursThis patterne will take t
l 2014 –De
cember 20
0 36 37
d
Post O
TE ovetime
at least 8 %
e service to aisation ouble shiftscember at 2n of the inpa. When the ) this drivesn of after hotime to reso
ecember 2
015
2137 36
Oct Avg
Avg Po
Page 29
% is
address
s with a 9. atient unit s ours
olve.
2015
6 36 27 2
ost Oct
29
165