Habitat preference, accessibility, and competition limit the global distribution of breeding...
27
Ecological Monographs, 81(1), 2011, pp. 141–167 Ó 2011 by the Ecological Society of America Habitat preference, accessibility, and competition limit the global distribution of breeding Black-browed Albatrosses EWAN D. WAKEFIELD, 1,9 RICHARD A. PHILLIPS, 1 PHILIP N. TRATHAN, 1 JAVIER ARATA, 2 ROSEMARY GALES, 3 NIC HUIN, 4 GRAHAM ROBERTSON, 5 SUSAN M. WAUGH, 6 HENRI WEIMERSKIRCH, 7 AND JASON MATTHIOPOULOS 8 1 British Antarctic Survey, Natural Environment Research Council, High Cross, Madingley Road, Cambridge CB3 0ET United Kingdom 2 Instituto Anta ´rtico Chileno, Plaza Mu ˜ noz Gamero 1055 Chile 3 Biodiversity Conservation Branch, Department of Primary Industries and Water, P.O. Box 40 Hobart, Tasmania 7001 Australia 4 Falklands Conservation, P.O. Box 26, Stanley FIQQ 1ZZ Falkland Islands 5 Australian Antarctic Division, Channel Highway, Kingston, Tasmania 7050 Australia 6 Sextant Technology Ltd, 116 Wilton Road, Wellington 6012 New Zealand 7 Centre d’Etudes Biologiques de Chize ´, Centre National de la Recherche Scientifique, 79360 Villiers-en-Bois, France 8 Sea Mammal Research Unit and Centre for Research into Ecological and Environmental Modeling, Scottish Oceans Institute, University of St. Andrews, Fife KY16 8LB United Kingdom Abstract. Telemetry methods and remote sensing now make it possible to record the spatial usage of wide-ranging marine animals and the biophysical characteristics of their pelagic habitats. Furthermore, recent statistical advances mean that such data can be used to test ecological hypotheses and estimate species’ distributions. Black-browed Albatrosses Thalassarche melanophrys are highly mobile marine predators with a circumpolar breeding and foraging distribution in the Southern Hemisphere. Although they remain relatively abundant, increased fisheries bycatch has led to their listing as endangered by conservation bodies. We satellite-tracked 163 breeding Black-browed Albatrosses and eight closely related Campbell Albatrosses T. impavida from nine colonies. We then quantified habitat usage, and modeled population-level spatial distribution at spatiotemporal scales .50 km and 1 month, as a function of habitat accessibility, habitat preference, and intraspecific competition, using mixed-effects generalized additive models (GAMM). During incubation, birds foraged over a wider area than in the post-brood chick-rearing period, when they are more time constrained. Throughout breeding, the order of habitat preference of Black-browed Albatrosses was for neritic (0–500 m), shelf-break and upper shelf-slope (500–1000 m), and then oceanic (.1000 m) waters. Black-browed Albatrosses also preferred areas with steeper (.38) bathymetric relief and, in addition, during incubation, warmer sea surface temperatures (peak preference ;168C). Although this suggests specialization in neritic habitats, incubation-stage Black- browed Albatrosses from South Georgia also foraged extensively in oceanic waters, preferring areas with high eddy kinetic energy (.250 cm 2 /s 2 ), especially the Brazil-Malvinas Confluence, a region of intense mesoscale turbulence. During chick-rearing, this species had a more southerly distribution, and following the seasonal retreat of sea ice, birds from some populations utilized neritic polar waters. Campbell Albatrosses showed similar bathymetric preferences but also preferred positive sea level anomalies. Black-browed Albatross foraging areas were partially spatially segregated with respect to colony and region, with birds preferring locations distant from neighboring colonies, presumably in order to reduce competition between parapatric conspecifics. At the global scale, the greatest concentrations of breeding Black-browed Albatrosses are in southern South American neritic, shelf-break, and shelf-slope waters. These regions also hold large fisheries and should therefore be a priority for introduction of bycatch mitigation measures. Key words: Black-browed Albatross; Campbell Albatross; central-place foraging; GAMM; niche specialization; satellite tracking; spatial modeling; spatial segregation; Thalassarche impavida; Thalas- sarche melanophrys. INTRODUCTION Understanding the factors that influence the distribu- tion of organisms in space is one of the primary aims of ecologists. When this understanding is sufficiently complete it becomes possible to use spatial models to identify habitats and geographical areas necessary for the survival of endangered species (Guisan and Zim- Manuscript received 4 May 2009; revised 16 February 2010; accepted 7 April 2010. Corresponding Editor: B. J. Danielson. 9 Present address: Institute of Integrative and Comparative Biology, Faculty of Biological Sciences, University of Leeds, Leeds LS2 9JT United Kingdom. E-mail: E.D.Wakefi[email protected] 141
Transcript of Habitat preference, accessibility, and competition limit the global distribution of breeding...
Ecological Monographs, 81(1), 2011, pp. 141–167� 2011 by the Ecological Society of America
Habitat preference, accessibility, and competition limit the globaldistribution of breeding Black-browed Albatrosses
EWAN D. WAKEFIELD,1,9 RICHARD A. PHILLIPS,1 PHILIP N. TRATHAN,1 JAVIER ARATA,2 ROSEMARY GALES,3 NIC HUIN,4
GRAHAM ROBERTSON,5 SUSAN M. WAUGH,6 HENRI WEIMERSKIRCH,7 AND JASON MATTHIOPOULOS8
1British Antarctic Survey, Natural Environment Research Council, High Cross, Madingley Road,Cambridge CB30ET United Kingdom
2Instituto Antartico Chileno, Plaza Munoz Gamero 1055 Chile3Biodiversity Conservation Branch, Department of Primary Industries and Water, P.O. Box 40 Hobart, Tasmania 7001 Australia
4Falklands Conservation, P.O. Box 26, Stanley FIQQ 1ZZ Falkland Islands5Australian Antarctic Division, Channel Highway, Kingston, Tasmania 7050 Australia
6Sextant Technology Ltd, 116 Wilton Road, Wellington 6012 New Zealand7Centre d’Etudes Biologiques de Chize, Centre National de la Recherche Scientifique, 79360 Villiers-en-Bois, France
8Sea Mammal Research Unit and Centre for Research into Ecological and Environmental Modeling, Scottish Oceans Institute,University of St. Andrews, Fife KY16 8LB United Kingdom
Abstract. Telemetry methods and remote sensing now make it possible to record thespatial usage of wide-ranging marine animals and the biophysical characteristics of theirpelagic habitats. Furthermore, recent statistical advances mean that such data can be used totest ecological hypotheses and estimate species’ distributions. Black-browed AlbatrossesThalassarche melanophrys are highly mobile marine predators with a circumpolar breedingand foraging distribution in the Southern Hemisphere. Although they remain relativelyabundant, increased fisheries bycatch has led to their listing as endangered by conservationbodies. We satellite-tracked 163 breeding Black-browed Albatrosses and eight closely relatedCampbell Albatrosses T. impavida from nine colonies. We then quantified habitat usage, andmodeled population-level spatial distribution at spatiotemporal scales .50 km and 1 month,as a function of habitat accessibility, habitat preference, and intraspecific competition, usingmixed-effects generalized additive models (GAMM). During incubation, birds foraged over awider area than in the post-brood chick-rearing period, when they are more time constrained.Throughout breeding, the order of habitat preference of Black-browed Albatrosses was forneritic (0–500 m), shelf-break and upper shelf-slope (500–1000 m), and then oceanic (.1000m) waters. Black-browed Albatrosses also preferred areas with steeper (.38) bathymetric reliefand, in addition, during incubation, warmer sea surface temperatures (peak preference;168C). Although this suggests specialization in neritic habitats, incubation-stage Black-browed Albatrosses from South Georgia also foraged extensively in oceanic waters, preferringareas with high eddy kinetic energy (.250 cm2/s2), especially the Brazil-Malvinas Confluence,a region of intense mesoscale turbulence. During chick-rearing, this species had a moresoutherly distribution, and following the seasonal retreat of sea ice, birds from somepopulations utilized neritic polar waters. Campbell Albatrosses showed similar bathymetricpreferences but also preferred positive sea level anomalies. Black-browed Albatross foragingareas were partially spatially segregated with respect to colony and region, with birdspreferring locations distant from neighboring colonies, presumably in order to reducecompetition between parapatric conspecifics. At the global scale, the greatest concentrationsof breeding Black-browed Albatrosses are in southern South American neritic, shelf-break,and shelf-slope waters. These regions also hold large fisheries and should therefore be apriority for introduction of bycatch mitigation measures.
Key words: Black-browed Albatross; Campbell Albatross; central-place foraging; GAMM; nichespecialization; satellite tracking; spatial modeling; spatial segregation; Thalassarche impavida; Thalas-sarche melanophrys.
INTRODUCTION
Understanding the factors that influence the distribu-
tion of organisms in space is one of the primary aims of
ecologists. When this understanding is sufficiently
complete it becomes possible to use spatial models to
identify habitats and geographical areas necessary for
the survival of endangered species (Guisan and Zim-
Manuscript received 4 May 2009; revised 16 February 2010;accepted 7 April 2010. Corresponding Editor: B. J. Danielson.
9 Present address: Institute of Integrative and ComparativeBiology, Faculty of Biological Sciences, University of Leeds,Leeds LS2 9JT United Kingdom.E-mail: [email protected]
141

mermann 2000, Austin 2007). Hence, in order to meet
both ecological and conservation objectives it may be
necessary to quantify the effects of habitat preference,
competition, and habitat accessibility (e.g., Lewis et al.
2001, Adler and Gordon 2003, Matthiopoulos 2003).
While the effects of such factors on terrestrial animals,
which are relatively straightforward to observe, have
received much attention (Begon et al. 2006), there have,
until recently, been far fewer attempts to examine their
influence on wide-ranging marine animals (fish, ceta-
ceans, pinnipeds, and seabirds; Wakefield et al. 2009a).
In the main, this reflects the difficulty of simultaneously
measuring the habitat characteristics and spatial usage
of animals that range over wide areas of open ocean,
remote from human observation. Although distribution
and abundance data collected by ship-based surveys can
provide insights into the spatial ecology of these animals
(e.g., Hunt et al. 1996, Spear et al. 2001, Ballance et al.
2006, Louzao et al. 2006) such Eulerian studies are
limited because they tend to provide only partial spatial
and temporal coverage of animals’ home ranges and
may be biased by the behavioral response of target
animals to survey vessels (Hyrenbach 2001, Buckland et
al. 2004). Furthermore, it is generally difficult or
impossible to determine individual characteristics (prov-
enance, breeding status, sex, age, etc.) of animals
observed from ships (Burger and Shaffer 2008). These
problems are increasingly being circumvented by adopt-
ing a Lagrangian approach to the study of wide-ranging
marine animals in which the individual movement is
measured using miniature animal-attached devices, such
as satellite-tracking tags (Turchin 1998, Burger and
Shaffer 2008, Tremblay et al. 2009). Data from these
devices can be combined with environmental data
collected by satellite remote-sensing (Martin 2004) to
give a simultaneous view of both the environment and
the movement of known individuals throughout the full
extent of their potential home range (e.g., Guinet et al.
2001, Hays et al. 2001, Hyrenbach et al. 2002).
Furthermore, advances in statistical modeling are
increasingly making it possible to test ecological
hypotheses using the large volumes of data that these
technologies provide (Guisan and Zimmermann 2000,
Aarts et al. 2008, Patterson et al. 2008).
Black-browed Albatrosses Thalassarche melanophrys
(BBA) are among the most mobile and wide-ranging of
marine predators, routinely commuting hundreds to
thousands of kilometers from their subantarctic colonies
to forage (Weimerskirch et al. 1997, Huin 2002, Phillips
et al. 2004). Although they are polyphagous, during
chick provisioning they show a marked preference for
relatively few prey taxa (Croxall and Prince 1980, Cherel
and Klages 1998), and spend the majority of their time
in productive neritic, shelf-break, and upper shelf-slope
waters (Weimerskirch et al. 1997, Gremillet et al. 2000,
Wood et al. 2000, Huin 2002, Pinaud and Weimerskirch
2002, Phillips et al. 2004, Terauds et al. 2006b).
However, birds from some populations also forage in
oceanic habitats, including the Antarctic Polar Frontal
Zone (APFZ; Phillips et al. 2004, Pinaud and Weimer-
skirch 2007), and nonbreeding birds associate with
mesoscale eddies (Petersen et al. 2008). Until recently,
the BBA was considered to comprise the nominate
subspecies and the Campbell Albatross (formerly T.
melanophrys impavida). Genetic evidence now suggests
that the Campbell Albatross (CBA) should be regarded
as a species in its own right, T. impavida, a view which
has gained wide acceptance (Roberson and Nunn 1998,
Burg and Croxall 2001). The entire world population of
21 000 pairs of CBA breed at Campbell Island in the
western Pacific (Gales 1998, Moore 2004). Although a
small number of BBA breed sympatrically on Campbell
Island, it is not clear whether the two species diverged by
parapatric or sympatric speciation (Alderman et al.
2005). Tracking data show that in qualitative terms the
habitats used by the CBA and BBA are very similar and
the two species are often regarded as having the same
habitat requirements (Waugh et al. 1999). However, to
date, differences in habitat use and preference have
not been quantitatively compared so this may be a
misleading assumption.
Although BBA are the most abundant of the southern
hemisphere albatrosses (current world breeding popula-
tion ;601 000 pairs), increased incidental mortality since
the mid 1980s in longline and trawl fisheries has caused
widespread and unsustainable population declines
(;8.5% in total over the past 10 years), such that they
are now classified as Endangered (IUCN 2008). Hence,
we used satellite-tracking and remotely-sensed environ-
mental data to estimate the habitat preferences and
global distribution of this species during the breeding
season. In so doing, we investigated a number of aspects
of the ecology of this wide-ranging marine animal.
Firstly, the central-place constraint imposed during the
breeding season when such animals must return
periodically to their colonies means that the accessibility
of points in space is not equal (Orians and Pearson
1979). Therefore, the cost (in time or energy) of
accessing different locations increases as a function of
distance (Matthiopoulos 2003). In addition, in polar
waters the seasonal retreat of sea ice considerably
increases the area accessible to foraging albatrosses as
the breeding season progresses (Tickell 2000). Secondly,
habitat use and requirements may vary with breeding
stage (Phillips et al. 2004, Breed et al. 2009). Breeding
birds must first incubate their egg, and then provision
their chick until it fledges. In seabirds, the change of
duties is often marked by a shift in spatial usage
(Weimerskirch et al. 1993, Phillips et al. 2004), either
because of intrinsic factors, such as differences in the
severity of the central-place constraint (Shaffer et al.
2003) or differences in the dietary requirements of adult
and chick (Williams et al. 2008), or extrinsic factors,
such as seasonal changes in prey availability (Hum-
phreys et al. 2006). Given that some populations of BBA
switch foraging areas with breeding stage (Huin 2002,
EWAN D. WAKEFIELD ET AL.142 Ecological MonographsVol. 81, No. 1
Javier Arata
Resaltado
Javier Arata
Resaltado
Javier Arata
Resaltado
Phillips et al. 2004), habitat preferences probably also
change. Thirdly, competition may modify spatial usage:Because of niche overlap, competition between conspe-
cifics is often more intense than that between species(Simberloff and Dayan 1991). In some central-place
foragers this may lead to spatial partitioning of animalsfrom adjacent colonies (parapatric conspecifics; Brownand Gordon 2000, Griffin and Thomas 2000, Adler and
Gordon 2003). Unlike many central-place foragers,seabirds do not defend foraging territories, yet partial
spatial segregation along colonial lines has beenobserved in some species (Ainley et al. 2003, 2004,
Gremillet et al. 2004). It has been hypothesized that thefactor mediating partitioning is direct or indirect
competition, the intensity of which varies with conspe-cific density (Ashmole 1963, Furness and Birkhead 1984,
Cairns 1989, Lewis et al. 2001). A degree of spatialpartitioning is exhibited by BBA in the Falkland Islands
and Kerguelen, but there is some overlap in the foragingareas of birds from adjacent colonies (Weimerskirch et
al. 1988, Huin 2002). Therefore, it is not known to whatextent intraspecific competition causes spatial segrega-
tion of BBA populations during the breeding season.In this study we aimed to quantify the effects of
central-place constraint, habitat preference, and compe-tition on the spatial usage of breeding albatrosses. Wethen demonstrate that by modeling these effects,
individual movement data can be used to quantitativelyestimate the population-level global distribution of an
endangered wide-ranging marine animal, the BBA.Following Aarts et al. (2008), we used mixed-effects
generalized additive models (GAMMs), fitted to envi-ronmental and satellite-tracking data from 171 breeding
BBA and CBA, from nine colonies located throughoutthe subantarctic, to model spatial usage as a function of
habitat preference and intraspecific competition, whilecontrolling for the effects of unequal habitat accessibil-
ity. In so doing, we addressed a number of relatedhypotheses: (1) that spatial usage decreases at a rate
proportional to distance from the colony, (2) that BBAexpress stage-dependent habitat preferences, (3) that
BBA and CBA have measurably different habitatpreferences, and (4) that spatial usage decreases withparapatric intraspecific competition (competition be-
tween birds from neighboring colonies).
METHODS
Conceptual framework and definitions
We adopted the analytical approach of Aarts et al.
(2008), defining a habitat as a point or region inenvironmental space, the coordinates of which are the
values of environmental covariates. Note that theirdefinition differs considerably from geographical defini-
tions, such as ‘‘the place where an animal lives’’ (Hall etal. 1997). The probability of a satellite-tracked animal’slocation being recorded in the ith habitat is defined by a
binomial response variable ui. Locations (Fig. 1a) areassumed to be generated by a heterogeneous, spatial
Poisson process, with a rate proportional to a spatial
probability density function f1(Xs), where Xs is a vector
of environmental covariates (Fig. 1c–h) at a given point
s in geographical space. Adopting a case-control
approach, we complemented each animal location
recorded by satellite-tracking with three temporally
matched, randomly generated pseudo-absence (control)
locations, at which ui takes the value 0 (Fig. 1b). This
framework permits the selection of control points from a
biologically realistic null model. This null model
expresses the expectation of where an animal might be
if it had movement constraints but not preferences. In
the case of central-place foragers, a simple null model of
usage assumes that the cost (in time or energy) of
visiting a point in space is proportional to distance from
the colony dc, the inverse of which is termed accessibility
a (Matthiopoulos 2003). Hence, we selected control
locations via a spatial Poisson process, at a rate f0(Xs)
proportional to a. The response variable ui is then
approximated by a Bernoulli process, with probability
hi. Aarts et al. (2008) show that, at point s,
hðXsÞ ¼k1 f1ðXsÞ
k0 f0ðXsÞ þ k1 f1ðXsÞð1Þ
where k1 is the number of telemetry locations and k0 is
the number of control locations. Rearranging Eq. 1, the
probability of spatial usage at location s can be
estimated by
f1ðXsÞ ¼hðXsÞ
1� hðXsÞrf0ðXsÞ ð2Þ
where r ¼ k0/k1. The quantity h can be estimated
empirically from the case–control data. To allow for the
possibility of a nonlinear response to environmental
covariates, we modeled hi as a GAMM:
hi ¼ g�1ðgiÞ ¼egi
1þ egi
gi ¼ b0 þ s1ðxi;1Þ þ . . .þ sjðxi; jÞ þ . . . ð3Þ
where g�1 is the inverse of the logit link function and gi
is the linear predictor. We structured gi such that it
could include parametric smooths of single covariates,
and to allow for the possibility of interactions, tensor
product smooths of pairs of covariates (Wood 2006).
Because tracked individuals are observed repeatedly, we
treated individual birds as a random effect. We then
assessed competing models by cross-validation, with
forward selection, maximizing log-likelihood. Although
cross-validation is a somewhat conservative approach
(Burnham and Anderson 1998), we adopted it because
tracking data tend to be inherently spatially and serially
autocorrelated, which are properties that can lead to
overparameterized models if information criteria (e.g.,
the AIC) are used for model selection. Furthermore,
parameters were estimated using penalized quasi-likeli-
February 2011 143ALBATROSS DISTRIBUTION AND HABITAT
Javier Arata
Resaltado

hood (Wood 2006), which also makes the use of model
selection criteria, such as the AIC, inappropriate
(Venables and Ripley 2002).
Aarts et al. (2008) define the quantity h(Xs) as an
animal’s preference for environmental conditions Xs at
the point s in geographical space. This is the animal’s
habitat preference, which can be defined more generally
as a statistical description of habitat use relative to a
particular sample of availability. The implication in these
definitions is that animals spend more time in habitats
that are preferred (Johnson 1980, Manly et al. 2002).
However, under certain circumstances this assumption
may be invalid (Van Horne 1983, Kennedy and Gray
1993, Pulliam 2000). Firstly, central-place foragers may
spend more time in poorer quality habitat patches if
these are closer to the central place than more distant
but higher quality patches (Matthiopoulos 2003).
Following Aarts et al. (2008) we accounted for this
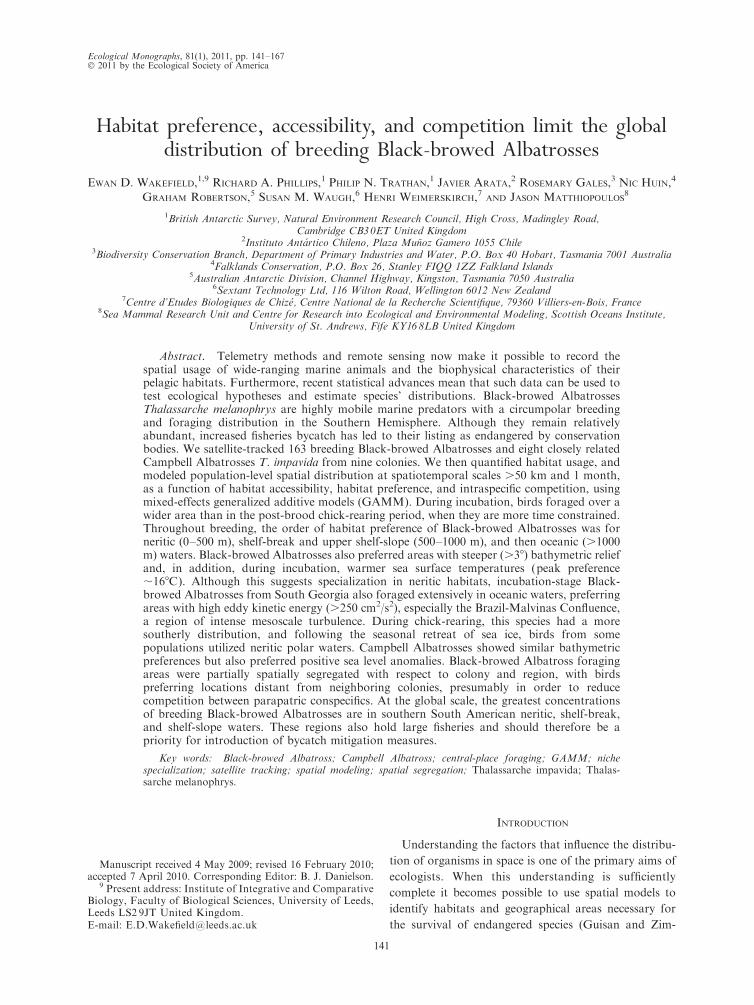
FIG. 1. Examples of the data used to fit the spatial usage models. (a) ARGOS locations of incubation stage Black-browedAlbatrosses (Thalassarche melanophrys) foraging from six colonies (SG, northwest South Georgia; FK, northwest FalklandsIslands; DA, Isla Diego de Almagro; DF, Islas Ildefonso; DR, Islas Diego Ramirez; and BE, Beauchene Island). (b) Minimumbiological distance to all grid cells from the Beauchene Island super-colony (dc) and randomly generated control (pseudo-absence)locations, selected by a spatial Poisson process with a rate proportional to d�1
c . (c) Depth, (d) depth slope, (e) mean optimallyinterpolated sea surface temperature (SST), (f ) mean sea level anomaly (SLA), and (g) mean eddy kinetic energy (EKE). (h)Minimum biological distance to the next nearest super-colony to Beauchene Island (dn). Values of time-varying covariates in panels(e), (f ), and (g) are for November 2000. Mean sea ice extent (�15% cover) is shown for November.
EWAN D. WAKEFIELD ET AL.144 Ecological MonographsVol. 81, No. 1
effect by adopting a mechanistic null usage model that
assumes that the probability of locations being used
declines with distance from the central place (see Null
model and control locations below). Secondly, animals
may be excluded from high-quality habitats by domi-
nant competitors and so spend more time in lower
quality habitats. In some species this factor affects
habitat choice at the scale of the home range (source-
sink dynamics; Lidicker 1975, Van Horne 1983, Pulliam
1988). However, albatrosses are long-lived (60þ years),
have low fecundity (maximum one offspring per year),
and high philopatry (.95% of juveniles recruit to their
natal colonies), so source–sink effects are unlikely to be
marked (see also Bock and Jones 2004). However, at the
scale of individual foraging trips, intraspecific competi-
tion may exclude birds from high-quality foraging
habitats in the vicinity of neighboring colonies that
would otherwise have been selected (Gremillet et al.
2004). We estimated this effect by considering para-
patric intraspecific competition as an explanatory
covariate (we had insufficient a priori information to
include its effects in the null model), in effect, treating
this term as an additional environmental covariate.
Hence, having accounted for unequal accessibility, we
made the assumption that birds spend more time in
high-quality, low-competition habitats. However, we
hereafter use the term habitat preference advisedly,
recognizing that other factors, not quantified in our
study may also affect spatial usage (Kennedy and Gray
1993).
FIG. 1. Continued.
February 2011 145ALBATROSS DISTRIBUTION AND HABITAT
Tracking data
Between 1994 and 2003, we used Platform Terminal
Transmitters (PTTs) to record the spatial usage of
foraging BBA breeding at eight colonies, located in
southern Chile (Isla Diego de Almagro, Islas Ildefonso,
Islas Diego Ramirez), the Falkland Islands (Beauchene
Island, Saunders Island), South Georgia (Bird Island),
which together hold 96% of the world population, as
well as Ile Kerguelen in the southern Indian Ocean and
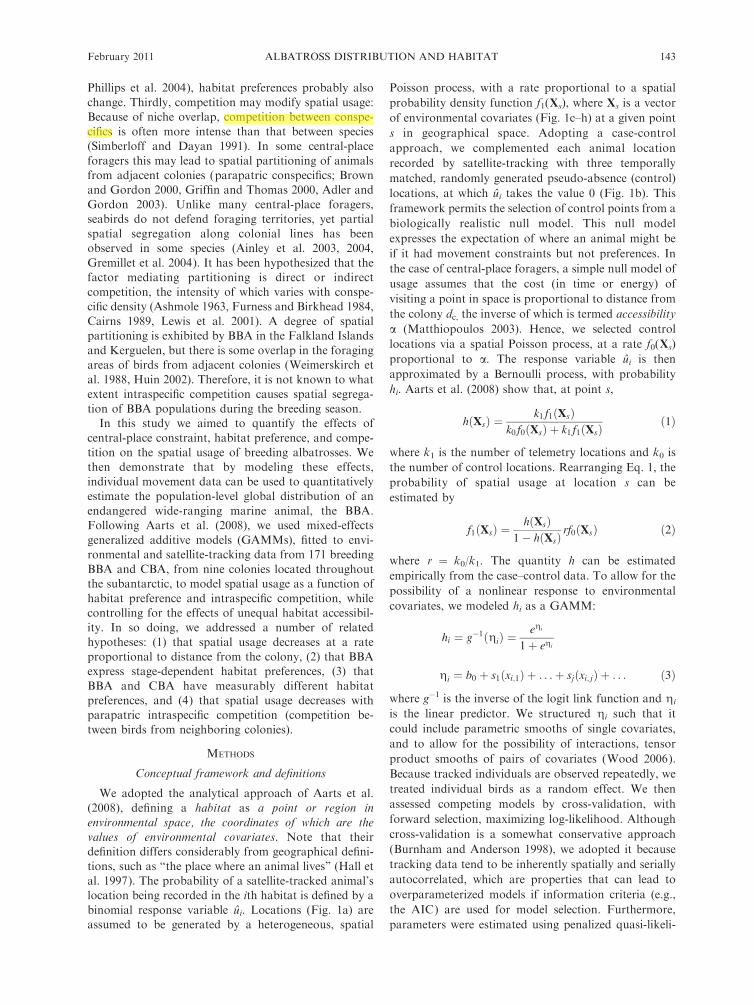
Macquarie Island in the southwest Pacific (Fig. 2, Table
1, Appendix A; for further details see Weimerskirch et
al. 1997, Phillips et al. 2004, Terauds et al. 2006a, Pinaud
and Weimerskirch 2007). In addition, CBA were tracked
from Campbell Island (Waugh et al. 1999). Birds were
tracked during the incubation or the post-brood chick-
rearing stage (hereafter ‘‘chick-rearing’’). During the
former (late October–early January), parents incubate a
single egg, taking turns to make long (;1 week) foraging
trips. Once the chick hatches, it is brooded and/or
guarded continuously for ;3 weeks. During the chick-
rearing stage (late January–mid May), when the chick
can be left alone, parents forage simultaneously,
returning to provision it after short (;2 d) or sometimes
long trips. We captured birds at the nest, either by hand
or using a 1.5-m pole fitted with a wire crook and
equipped them with a PTT (Microwave Telemetry
PTT100 [Columbia, Maryland, USA], Telonics ST10
[Mesa, Arizona, USA], Toyocom T2038 [Tokyo, Japan],
or Sirtrack 101 [Havelock North, New Zealand]; mass
20–55 g) attached to mantle feathers using Tesa tape.
PTT transmission rate was set to every 60 or 90 sec,
providing ARGOS class 3, 2, 1, 0, A, or B locations on
average every 2.1 h. We recaptured birds after one or
more foraging trips and recovered the devices. Total
instrument mass, including attachment materials and in
some cases, an additional, small (5–10 g) logger, was
,2% of birds’ body mass, which did not result in injury
in any cases, and was well below the threshold likely to
cause measureable changes in behavior (Phillips et al.
2003). As errors associated with PTT locations are
variable and sometimes large (Vincent et al. 2002), we
filtered tracking data (McConnell et al. 2002), removing
those locations that gave rise to unrealistically high
average speeds (.80 m/s). In order to get a more
balanced sample across individuals, we used data from
only one trip per bird, selecting trips randomly when
multiple trips had been recorded.
Null model and control locations
To reduce computing time, we amalgamated colonies
,50 km apart into 21 super-colonies, comprising all
known BBA and CBA breeding sites (Appendix A).
However, we excluded two of these from our analysis
because they held ,100 breeding pairs (i.e., ,0.01% of
FIG. 2. Breeding locations of Black-browed and Campbell (T. impavida) Albatrosses, indicating colonies from which birds weresatellite-tracked. Numbers for super-colonies refer to Table 1 and Appendix A. The mean location of the Antarctic Polar Front isfrom Moore et al. (1999).
EWAN D. WAKEFIELD ET AL.146 Ecological MonographsVol. 81, No. 1
the world population). For each month we then used the
ArcGIS 9.2 spatial analyst package (ESRI 2006) to
calculate the minimum biological distance dc (Matthio-
poulos 2003) from each super-colony to all points on a
10-km polar stereographic grid, assuming that alba-
trosses would not cross extensive land barriers or sea ice
(Tickell 2000). We defined areas of sea ice (�15%
coverage) using monthly passive microwave data (Fet-
terer et al. 2002, updated 2008). We assumed birds
would not travel beyond 3300 km (1.1 times the
maximum dc reached by any bird during our study).
Within this range, we then calculated accessibility a, as a¼ d�1
c (cf. Matthiopoulos 2003). Finally, we selected
three control locations matched temporally to each
tracking location, quasi-randomly, via a spatial Poisson
process, with a rate proportional to a for the appropri-
ate month (Fig. 1b). However, as the true relationship
between a and dc was unknown (the null model may
over- or under-predict accessibility), following Aarts et
al. (2008), we also included dc as a candidate covariate in
the spatial usage models.
Environmental covariates
In a case–control spatial model of the type employed
in this study, locations with missing environmental data
are effectively treated as inaccessible. Hence, any
systematic pattern in the occurrence of missing values
results in a spurious null model. In consequence, we
were unable to consider remotely-sensed chlorophyll-a
or conventional sea surface temperature (SST) as
candidate environmental covariates because cloud cover
causes a systematic reduction in satellite acquisition of
these data at high latitudes (Woodward and Gregg
1998). Furthermore, as the first tracking data set was
collected in 1994 (Table 1), the only contemporaneous
cloud-free SST data set available (NOAA_OI_SST_V2)
had a relatively low spatial resolution (18). Bearing in
mind these restrictions, we selected environmental
covariates because, firstly, we had an a priori reason
for supposing that they, or a phenomenon for which
they are a proxy, would influence albatross spatial usage
at our scale of interest (.50 km, months; Austin 2007),
and secondly, because their spatial coverage was
uniform across our study area. The covariates we
considered were: (1) Depth, which we obtained on a
0.18 grid from the GEBCO digital atlas (IOC 2003). We
hypothesized that spatial usage varies with bathymetric
regime because these regimes are characterized by
different levels of productivity (e.g., neritic mesotrophic
vs. oceanic oligotrophic waters). (2) Depth slope, which
we calculated as the maximum rate of change of depth
(resampled on a 10-km Cartesian grid, in polar
stereographic projection) between each cell and its
neighboring eight cells. We hypothesized that spatial
usage varies with slope, ultimately because of the
occurrence of productive fronts associated with the
steeper slopes and especially with the shelf-break that
occurs at the edge of peri-insular and continental
shelves. (3) Monthly mean optimally interpolated sea
surface temperature (SST), which was supplied on a 18
grid from NOAA/OAR/ESRL PSD, Boulder, Colora-
do, USA (available online).10 This data set
(NOAA_OI_SST_V2) combines satellite and in-situ
observations to provide an estimate of SST in both
cloud free and cloud obscured areas (Reynolds et al.
2002). We hypothesized that spatial usage varies with
water mass (including macroscale frontal zones) for
which SST is a proxy, for two reasons: firstly, because
the distribution of prey species may be limited (either
directly or indirectly) by temperature and secondly,
because productivity varies with water mass. (4) Seven-
day mean sea level anomaly (SLA), which can be used to
identify mesoscale phenomena such as eddies and
meanders, were obtained on a 0.38 Mercator grid, and
then averaged by month. We hypothesized that spatial
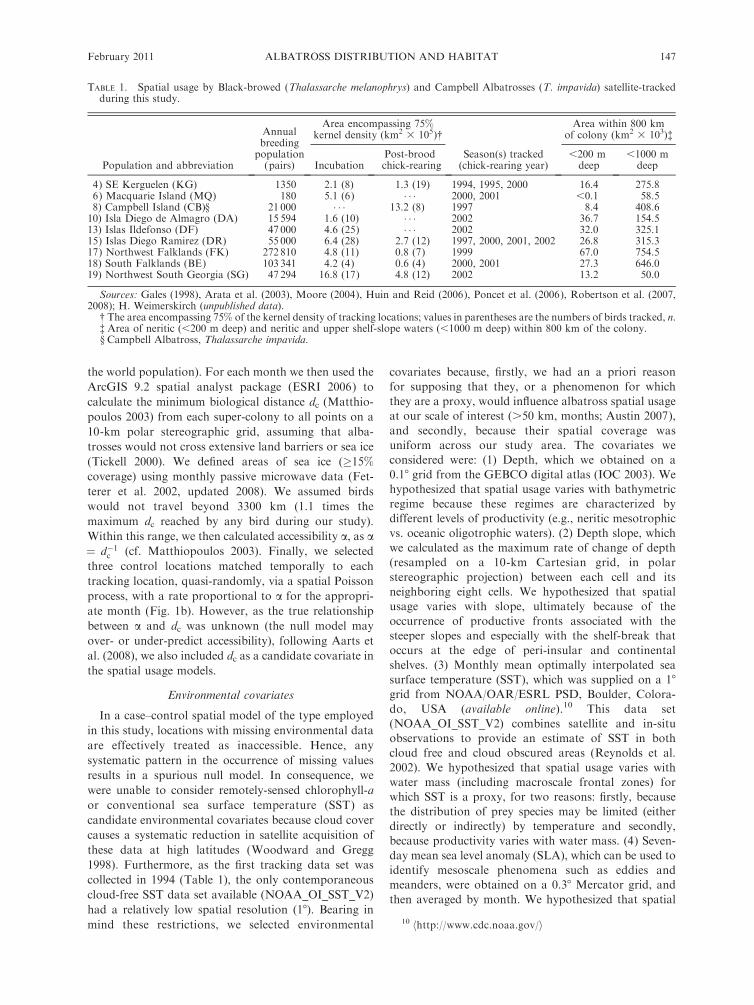
TABLE 1. Spatial usage by Black-browed (Thalassarche melanophrys) and Campbell Albatrosses (T. impavida) satellite-trackedduring this study.
Population and abbreviation
Annualbreedingpopulation(pairs)
Area encompassing 75%kernel density (km2 3 105)�
Season(s) tracked(chick-rearing year)
Area within 800 kmof colony (km2 3 103)�
IncubationPost-broodchick-rearing
,200 mdeep
,1000 mdeep
4) SE Kerguelen (KG) 1350 2.1 (8) 1.3 (19) 1994, 1995, 2000 16.4 275.86) Macquarie Island (MQ) 180 5.1 (6) � � � 2000, 2001 ,0.1 58.58) Campbell Island (CB)§ 21 000 � � � 13.2 (8) 1997 8.4 408.610) Isla Diego de Almagro (DA) 15 594 1.6 (10) � � � 2002 36.7 154.513) Islas Ildefonso (DF) 47 000 4.6 (25) � � � 2002 32.0 325.115) Islas Diego Ramirez (DR) 55 000 6.4 (28) 2.7 (12) 1997, 2000, 2001, 2002 26.8 315.317) Northwest Falklands (FK) 272 810 4.8 (11) 0.8 (7) 1999 67.0 754.518) South Falklands (BE) 103 341 4.2 (4) 0.6 (4) 2000, 2001 27.3 646.019) Northwest South Georgia (SG) 47 294 16.8 (17) 4.8 (12) 2002 13.2 50.0
Sources: Gales (1998), Arata et al. (2003), Moore (2004), Huin and Reid (2006), Poncet et al. (2006), Robertson et al. (2007,2008); H. Weimerskirch (unpublished data).
� The area encompassing 75% of the kernel density of tracking locations; values in parentheses are the numbers of birds tracked, n.� Area of neritic (,200 m deep) and neritic and upper shelf-slope waters (,1000 m deep) within 800 km of the colony.§ Campbell Albatross, Thalassarche impavida.
10 hhttp://www.cdc.noaa.gov/i
February 2011 147ALBATROSS DISTRIBUTION AND HABITAT

usage may vary with SLA because large SLAs are
indicative of warm (þve) or cold (�ve) mesoscale eddies,
which may exhibit higher production than surrounding
waters. Such eddies are associated with macroscale
fronts and currents. (5) Eddy kinetic energy (EKE) is
another index of mesoscale activity, where EKE ¼ 1/
2(u2aþ v2
a) and ua and va are the eastward and northward
geostrophic current anomalies (Ducet et al. 2000). We
obtained seven day mean values of ua and va on a 0.38
Mercator grid, calculated EKE, and then averaged these
values by month. Both ua and va and SLA were
produced by Ssalto/Duacs and distributed by Aviso,
with support from CNES (available online).11 We
hypothesized that spatial usage may vary with the
intensity of mesoscale activity for which EKE is an index
because productivity tends to increase with EKE.
Parapatric intraspecific competition
To test hypothesis 4, we calculated two indices of
parapatric intraspecific competition (see Fig. 3 for
worked examples), which we considered as candidate
explanatory covariates of spatial usage: (1) The mini-
mum biological distance to the next nearest super-
colony (dn), assuming that the accessibility of a point inspace to parapatric intraspecifics was }1/dn. We
calculated dn for each month and super-colony, in asimilar manner to dc. (2) Relative parapatric conspecific
density (qc), assuming that absolute parapatric conspe-
cific density is proportional not only to the distance-squared from the ith super-colony, but also to the size of
its breeding population (Pi ). Hence, at the jth location,
qcj ¼X Pi
d2ni; j
: ð4Þ
For each super-colony, we calculated grids of dn for allother super-colonies, and then used estimates of the
breeding population at those locations (Appendix A) tocalculate qc. These density covariates formalize the
notion of opportunity to use a location. Hence, ifhabitat preferences are captured by all the other
covariates in the model, they offer the location in
question to one colony or another.
Model fitting and selection
We modeled probability hi as a function of the
covariates outlined above using GAMMs, implementedwithin the mgcv package (Wood 2004) in R (R
Development Core Team 2007). Hypothesis 2 could
not be tested directly in a single model, because the mgcvpackage does not allow GAMMs containing interac-
tions between categorical covariates (breeding stage)and smooths to be specified (Wood 2004). Hence, we
fitted a separate model for each breeding stage(incubation were models I and II; chick-rearing, models
III and IV). If the covariates retained in these models
differed, we concluded that habitat preferences differedbetween breeding stages. Furthermore, because of the
prohibitively large amount of computing time andmemory required, it is currently unfeasible to fit
GAMMs to very large data sets using desktop comput-ers (Wood 2006). In our case, models could only be fit
successfully to be less than ;10 000 tracking and control
locations. Given this constraint, we used only everyfourth tracking location to model spatial usage.
Habitat preference models fitted to data from onegeographic area may perform poorly when applied to
another geographical area because of differences in the
availability of habitats may lead to behavioral changes(Mysterud and Ims 1998, Boyce et al. 2002). Hence, we
tested the ability of global models to explain the spatialusage of individual populations. If the global model
(models I and III) explained spatial usage of a
population poorly, we also fitted a separate model(models II and IV) for that population. We structured
candidate covariates either as parametric variables orsmooths of single variables. In order to improve the
spread of the data, we double square root-transformeddepth slope and log-transformed EKE and qc (Wood
2006). As the shelf-break is often located close to deep-
water trenches, our models initially predicted spuriously
FIG. 3. Calculation of the two indices of parapatricintraspecific competition considered in this study. In thishypothetical example, there are three super-colonies (A, B,and C; the size of breeding populations is shown inparentheses). Black grid squares indicate land, and opensquares are sea. Consider a bird from super-colony A foragingat the location shown by the open circle. The first index is dn,the minimum biological distance to the next nearest super-colony, which is colony C (distance 340 km, dashed line). Thisindex is a measure of the competition from birds from thenearest neighboring super-colony. The second index q is ameasure of the total null density of birds from all neighboringsuper-colonies (see Eq. 4). In this example, q ¼ (1000/7202) þ(200/3402) ¼ 0.004 pairs/km2 (the distance from colony A tocolony B is 720 km, as shown by the solid line). This indexreaches local maxima in the vicinity of neighboring colonies.Note that albatrosses do not routinely cross high land barriers.Hence, the minimum ‘‘biological distance’’ between thealbatrosses and colony B is 720 km (solid line).
11 hhttp://atoll-motu.aviso.oceanobs.com/i
EWAN D. WAKEFIELD ET AL.148 Ecological MonographsVol. 81, No. 1

high spatial usage in distant abyssal areas. To avoid this
issue, and with the justification that bathymetric
variability does not directly give rise to surface
biological variability in these areas, we truncated depth
at 4000 m. To allow for plausible, biologically inter-
pretable interactions between terms, we considered
tensor product smooths of the following pairs of
variables: depth and depth slope, depth and SLA, depth
and EKE, SST and EKE, and dc and dn. We determined
minimum adequate models by forward selection, using
K-fold cross-validation, where K is the number of
colonies, maximizing the log-likelihood L,
L ¼lnXn
i¼1
hum;i
i ð1� hiÞð1�um;iÞ
nð5Þ
where um,i is the ith observation from the mth colony,
and n is the number of locations from that colony (cf.
Aarts et al. 2008). We proceeded with model selection as
follows: Firstly, we fitted all possible models containing
either a single covariate or a single tensor product
smooth and ranked them according to L. We next
selected the highest ranked model, to which we added
each of the remaining terms in turn, retaining the
resulting model if L increased. We continued this
process until no further increase in L occurred. To
reduce the chances of overfitting, we replaced smooths
with parametric terms at each stage and, again, retained
the resultant model if L increased. As an additional
measure against overparameterization, smooths were
produced using cubic regression splines with shrinkage,
allowing covariates to be penalized out of the model
entirely during fitting (Wood 2006).
Estimating spatial usage
Spatial predictions were made using the models’ fixed
effects. Following Eq. 2, for each super-colony, we
calculated the probability density f1(Xs) across a regular
0.18 grid centered on each super-colony. We then
normalized this to one and multiplied the resulting
values by Pi (Appendix A), assuming that during
incubation only half the breeding population would be
at sea, while during chick-rearing, birds would spend a
negligible amount of time at the nest.
RESULTS
Observed spatial distribution and habitat use
We satellite-tracked 109 birds, from eight colonies,
and a further 62 birds, from six colonies, during
incubation and chick-rearing, respectively (Table 1).
During incubation, BBA tended to forage in areas either
near or to the north of their colonies, ranging
throughout neritic, shelf-break, upper shelf-slope, and,
to a lesser extent, adjacent oceanic waters. This included
the Chilean coastal waters and the Humboldt Current
Upwelling south of 348 S, the Patagonian Shelf south of
408 S, the eastern Bass Strait, and the peri-insular shelves
of South Georgia, Kerguelen, and Macquarie Island
(Fig. 4). In addition, birds from northwest South
Georgia foraged in the deep oceanic waters of the
APFZ and the Brazil Malvinas Confluence during
incubation and during both incubation and chick-
rearing, birds from the Chilean colonies entered coastal
fjords and channels. During chick-rearing, BBA simi-
larly spent the majority of their time in neritic, shelf-
break, and upper shelf-slope waters, but tended to have
a more southerly distribution, with birds from northwest
South Georgia and the Islas Diego Ramirez foraging in
ice-free neritic areas around the Antarctic Peninsula and
South Orkney Islands. CBA spent the majority of their
time on and at the margins of the Campbell Plateau,
especially in the vicinity of the Subantarctic Front, but
they also ranged widely in oceanic waters between 378 S
and 688 S, especially in the APFZ. Segregation of BBA
foraging areas occurred at two scales. At the super-
colony level, birds from the south and northwest
Falkland Islands tended to be absent from the immedi-
ate vicinity of the neighboring super-colony, especially
during chick-rearing (Fig. 4). In contrast, the foraging
zones utilized by BBA from adjacent Chilean colonies
overlapped considerably. At the regional scale, birds
from Chile, the Falkland Islands, and South Georgia
foraged in mutually exclusive areas. There was no
correlation between foraging area, as defined by the size
of the 75% kernel density contour (Table 1), and colony
size (incubation r2 ¼ 0.17, F1,6 , 0.01, P ¼ 0.98; chick-
rearing r2 ¼�0.02, F1,6 ¼ 0.92, P ¼ 0.39).
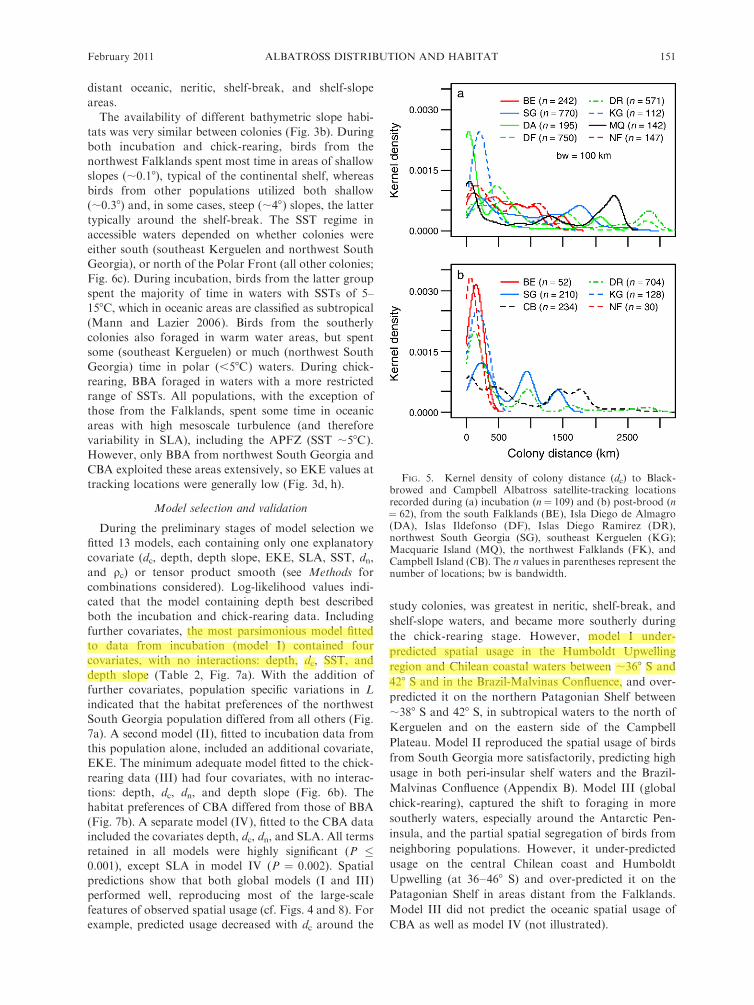
Spatial usage decreased with dc, the rate of decrease
being greater during chick-rearing than incubation (Fig.
5). During incubation, albatrosses made long trips, with
a median duration of 8.3 days (range 0.9–24.2 d),
reaching a median maximum dc of 987 km (20–3039
km). Birds from some populations (e.g., northwest
South Georgia and Macquarie Island) visited one or
more discrete, distant areas, giving rise to multimodal
distributions of dc, whereas the spatial usage of birds
from the Falkland Islands tended to decline more
uniformly with dc. Large areas of oceanic waters were
accessible to all populations, but the amount of
accessible neritic and upper shelf-slope waters (,1000
m deep) differed (Fig. 6a, Table 1), being greatest for the
population at the Falkland Islands, and least for that at
Macquarie. Typically, foraging BBA spent a dispropor-
tionately large amount of time in neritic waters,
compared to the amount of such habitat available.
The exception was birds from northwest South Georgia,
which, during incubation, spent more time in the deep
(more than ;4500 m) oceanic waters of the Brazil-
Malvinas Confluence. During chick-rearing, BBA made
shorter trips (median 2.0 d, range 0.4–23.8 d), closer to
their colonies (median maximum dc 298, range 10–2949
km). Birds from the Falklands and southeast Kerguelen
remained in neritic and slope waters, adjacent to their
colonies (dc , ;1000 km), and those from Islas Diego
Ramirez and northwest South Georgia also traveled to
February 2011 149ALBATROSS DISTRIBUTION AND HABITAT
Javier Arata
Resaltado
Javier Arata
Resaltado
Javier Arata
Resaltado
Javier Arata
Resaltado

FIG. 4. Kernel density of Black-browed and Campbell Albatross satellite-tracking locations recorded during (a) incubation (n¼109), and (b) post-brood chick-rearing (n¼ 62). Colored lines represent 75% kernel density contours for each population tracked:BE, south Falklands; DA, Isla Diego de Almagro; DF, Islas Ildefonso; DR, Islas Diego Ramirez; SG, northwest South Georgia;KG, southeast Kerguelen; MQ, Macquarie Island; FK, northwest Falklands; and CB, Campbell Island). Kernel density wasestimated following Phillips et al. (2005) with a cell size of 20 km and a search radius of 100 km. Mean location of the AntarcticPolar Front is after Moore et al. (1999); mean sea ice extent (�15% cover) is shown for November and February; 200 m and 1000 mdepth contours are from the GEBCO digital atlas (IOC 2003).
EWAN D. WAKEFIELD ET AL.150 Ecological MonographsVol. 81, No. 1
distant oceanic, neritic, shelf-break, and shelf-slope
areas.
The availability of different bathymetric slope habi-
tats was very similar between colonies (Fig. 3b). During
both incubation and chick-rearing, birds from the
northwest Falklands spent most time in areas of shallow
slopes (;0.18), typical of the continental shelf, whereas
birds from other populations utilized both shallow
(;0.38) and, in some cases, steep (;48) slopes, the latter
typically around the shelf-break. The SST regime in
accessible waters depended on whether colonies were
either south (southeast Kerguelen and northwest South
Georgia), or north of the Polar Front (all other colonies;
Fig. 6c). During incubation, birds from the latter group
spent the majority of time in waters with SSTs of 5–
158C, which in oceanic areas are classified as subtropical
(Mann and Lazier 2006). Birds from the southerly
colonies also foraged in warm water areas, but spent
some (southeast Kerguelen) or much (northwest South
Georgia) time in polar (,58C) waters. During chick-
rearing, BBA foraged in waters with a more restricted
range of SSTs. All populations, with the exception of
those from the Falklands, spent some time in oceanic
areas with high mesoscale turbulence (and therefore
variability in SLA), including the APFZ (SST ;58C).
However, only BBA from northwest South Georgia and
CBA exploited these areas extensively, so EKE values at
tracking locations were generally low (Fig. 3d, h).
Model selection and validation
During the preliminary stages of model selection we
fitted 13 models, each containing only one explanatory
covariate (dc, depth, depth slope, EKE, SLA, SST, dn,
and qc) or tensor product smooth (see Methods for
combinations considered). Log-likelihood values indi-
cated that the model containing depth best described
both the incubation and chick-rearing data. Including
further covariates, the most parsimonious model fitted
to data from incubation (model I) contained four
covariates, with no interactions: depth, dc, SST, and
depth slope (Table 2, Fig. 7a). With the addition of
further covariates, population specific variations in L
indicated that the habitat preferences of the northwest
South Georgia population differed from all others (Fig.
7a). A second model (II), fitted to incubation data from
this population alone, included an additional covariate,
EKE. The minimum adequate model fitted to the chick-
rearing data (III) had four covariates, with no interac-
tions: depth, dc, dn, and depth slope (Fig. 6b). The
habitat preferences of CBA differed from those of BBA
(Fig. 7b). A separate model (IV), fitted to the CBA data
included the covariates depth, dc, dn, and SLA. All terms
retained in all models were highly significant (P �0.001), except SLA in model IV (P ¼ 0.002). Spatial
predictions show that both global models (I and III)
performed well, reproducing most of the large-scale
features of observed spatial usage (cf. Figs. 4 and 8). For
example, predicted usage decreased with dc around the
study colonies, was greatest in neritic, shelf-break, and
shelf-slope waters, and became more southerly during
the chick-rearing stage. However, model I under-
predicted spatial usage in the Humboldt Upwelling
region and Chilean coastal waters between ;368 S and
428 S and in the Brazil-Malvinas Confluence, and over-
predicted it on the northern Patagonian Shelf between
;388 S and 428 S, in subtropical waters to the north of
Kerguelen and on the eastern side of the Campbell
Plateau. Model II reproduced the spatial usage of birds
from South Georgia more satisfactorily, predicting high
usage in both peri-insular shelf waters and the Brazil-
Malvinas Confluence (Appendix B). Model III (global
chick-rearing), captured the shift to foraging in more
southerly waters, especially around the Antarctic Pen-
insula, and the partial spatial segregation of birds from
neighboring populations. However, it under-predicted
usage on the central Chilean coast and Humboldt
Upwelling (at 36–468 S) and over-predicted it on the
Patagonian Shelf in areas distant from the Falklands.
Model III did not predict the oceanic spatial usage of
CBA as well as model IV (not illustrated).
FIG. 5. Kernel density of colony distance (dc) to Black-browed and Campbell Albatross satellite-tracking locationsrecorded during (a) incubation (n¼ 109) and (b) post-brood (n¼ 62), from the south Falklands (BE), Isla Diego de Almagro(DA), Islas Ildefonso (DF), Islas Diego Ramirez (DR),northwest South Georgia (SG), southeast Kerguelen (KG);Macquarie Island (MQ), the northwest Falklands (FK), andCampbell Island (CB). The n values in parentheses represent thenumber of locations; bw is bandwidth.
February 2011 151ALBATROSS DISTRIBUTION AND HABITAT
Javier Arata
Resaltado
Javier Arata
Resaltado

Habitat preference
All covariates included in the two global spatial usage
models (I and III) were retained as smooths, except
colony distance, dc, which was retained as a linear term
(Fig. 9). In both cases, dc had a negative slope, implying
that, counter to hypothesis 1, spatial usage decreases at a
greater rate than 1/dc. On the scale of the linear
FIG. 6. Kernel density of environmental covariates at Black-browed and Campbell Albatross control locations and satellite-tracking locations during (a–d) incubation and (e–h) post-brood chick-rearing. Birds were tracked from the south Falklands (BE),Isla Diego de Almagro (DA), Islas Ildefonso (DF), Islas Diego Ramirez (DR), northwest South Georgia (SG), southeast Kerguelen(KG); Macquarie Island (MQ), the northwest Falklands (FK), and Campbell Island (CB). Approximate summertime values of seasurface temperature (SST) are marked for the Antarctic Divergence (AD), Antarctic Polar Front (APF), and the SubtropicalConvergence (STC). Other abbreviations are: EKE, eddy kinetic energy (originally measured in cm2/s2); n, number of controllocations (number of tracking locations ¼ n/3); and bw, bandwidth used during kernel estimation.
EWAN D. WAKEFIELD ET AL.152 Ecological MonographsVol. 81, No. 1

predictor, the gradient of dc vs. the response was greater
for model III (�2.07 3 10�3 6 0.25 3 10�3; mean 6 SE)
than model I (�1.61 3 10�3 6 0.14 3 10�3), confirming
that spatial usage declined more sharply with dc during
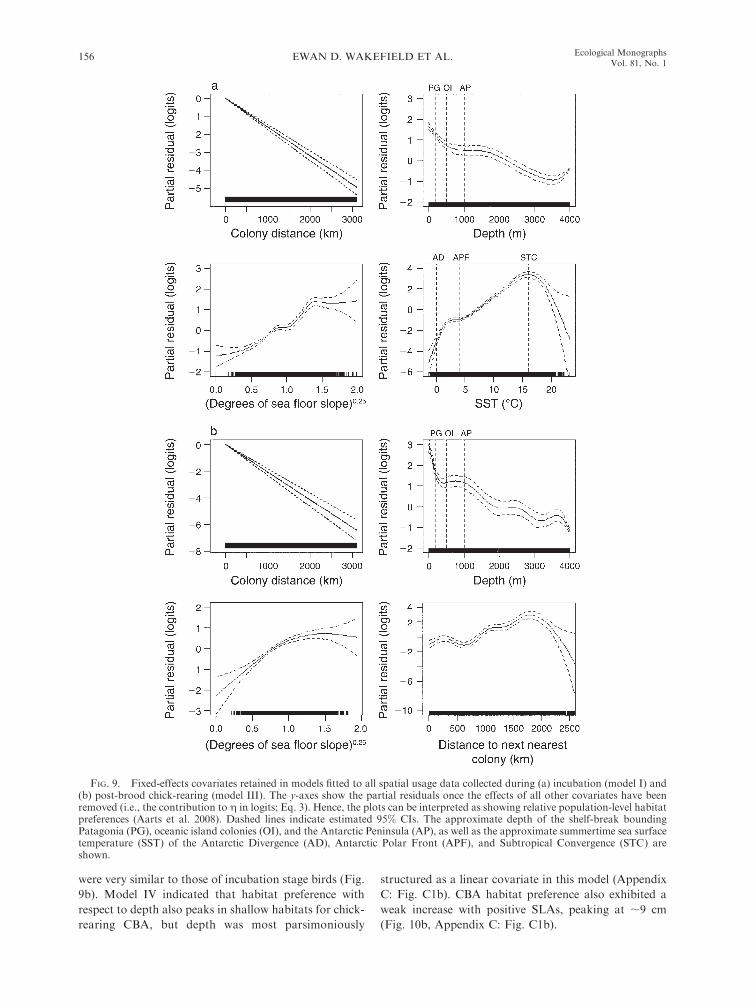
chick-rearing than incubation. Model I shows that
during the latter stage, BBA habitat preference peaks
in shallow, neritic habitats. Habitat preference decreases
with depth to ;500 m (encompassing South American
continental and most peri-insular shelf waters), is similar
from ;500–1600 m (further encompassing deeper peri-
insular waters, such as those around Kerguelen) and
decreases thereafter. Furthermore, habitat preference
was highest for steeper (.38) sea floor slopes and
decreased for slopes shallower than this value. Habitat
preference with respect to SST peaked at ;168C, this
temperature being indicative in oceanic areas of the
FIG. 6. Continued.
February 2011 153ALBATROSS DISTRIBUTION AND HABITAT
Javier Arata
Resaltado
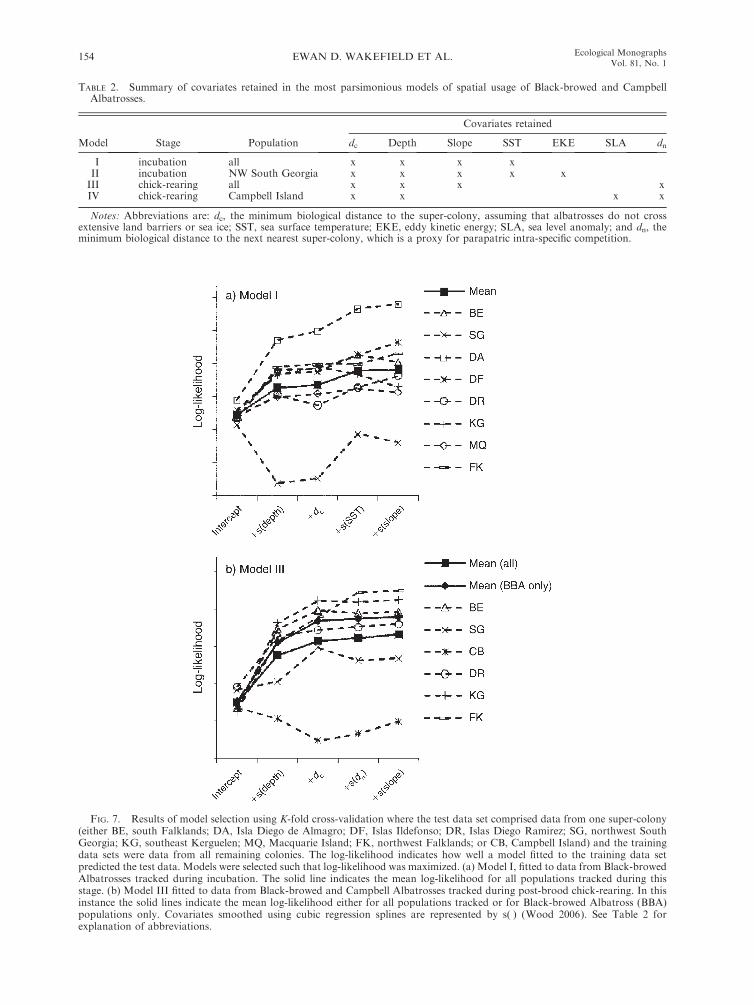
FIG. 7. Results of model selection using K-fold cross-validation where the test data set comprised data from one super-colony(either BE, south Falklands; DA, Isla Diego de Almagro; DF, Islas Ildefonso; DR, Islas Diego Ramirez; SG, northwest SouthGeorgia; KG, southeast Kerguelen; MQ, Macquarie Island; FK, northwest Falklands; or CB, Campbell Island) and the trainingdata sets were data from all remaining colonies. The log-likelihood indicates how well a model fitted to the training data setpredicted the test data. Models were selected such that log-likelihood was maximized. (a) Model I, fitted to data from Black-browedAlbatrosses tracked during incubation. The solid line indicates the mean log-likelihood for all populations tracked during thisstage. (b) Model III fitted to data from Black-browed and Campbell Albatrosses tracked during post-brood chick-rearing. In thisinstance the solid lines indicate the mean log-likelihood either for all populations tracked or for Black-browed Albatross (BBA)populations only. Covariates smoothed using cubic regression splines are represented by s( ) (Wood 2006). See Table 2 forexplanation of abbreviations.
TABLE 2. Summary of covariates retained in the most parsimonious models of spatial usage of Black-browed and CampbellAlbatrosses.
Model Stage Population
Covariates retained
dc Depth Slope SST EKE SLA dn
I incubation all x x x xII incubation NW South Georgia x x x x xIII chick-rearing all x x x xIV chick-rearing Campbell Island x x x x
Notes: Abbreviations are: dc, the minimum biological distance to the super-colony, assuming that albatrosses do not crossextensive land barriers or sea ice; SST, sea surface temperature; EKE, eddy kinetic energy; SLA, sea level anomaly; and dn, theminimum biological distance to the next nearest super-colony, which is a proxy for parapatric intra-specific competition.
EWAN D. WAKEFIELD ET AL.154 Ecological MonographsVol. 81, No. 1

Subtropical Convergence Zone (STCZ). Above and
below this value, it decreases, but was constant from
;3–58C (i.e., in the southern part of the APFZ). Model
II indicated that the habitat preference of birds from
northwest South Georgia were similar to the global
mean, but also showed an increase in habitat preference
with EKE above values of ;250 cm2/s2 (Fig. 10a,
Appendix C: Fig. C1a). Although there was no variation
in habitat preference with SST for chick-rearing birds,
model III shows their depth and depth slope preferences
FIG. 8. Probability of the presence of satellite-tracked Black-browed Albatrosses predicted using the fixed-effects part of (a)model I, fitted to all data from incubation, and (b) model III, fitted to all data from post-brood chick-rearing. Mean sea ice extent(�15% cover) is shown for November and February; 200 m and 1000 m depth contours are from the GEBCO digital atlas (IOC 2003).
February 2011 155ALBATROSS DISTRIBUTION AND HABITAT
were very similar to those of incubation stage birds (Fig.
9b). Model IV indicated that habitat preference with
respect to depth also peaks in shallow habitats for chick-
rearing CBA, but depth was most parsimoniously
structured as a linear covariate in this model (Appendix
C: Fig. C1b). CBA habitat preference also exhibited a
weak increase with positive SLAs, peaking at ;9 cm
(Fig. 10b, Appendix C: Fig. C1b).
FIG. 9. Fixed-effects covariates retained in models fitted to all spatial usage data collected during (a) incubation (model I) and(b) post-brood chick-rearing (model III). The y-axes show the partial residuals once the effects of all other covariates have beenremoved (i.e., the contribution to g in logits; Eq. 3). Hence, the plots can be interpreted as showing relative population-level habitatpreferences (Aarts et al. 2008). Dashed lines indicate estimated 95% CIs. The approximate depth of the shelf-break boundingPatagonia (PG), oceanic island colonies (OI), and the Antarctic Peninsula (AP), as well as the approximate summertime sea surfacetemperature (SST) of the Antarctic Divergence (AD), Antarctic Polar Front (APF), and Subtropical Convergence (STC) areshown.
EWAN D. WAKEFIELD ET AL.156 Ecological MonographsVol. 81, No. 1

Parapatric intraspecific density (qc) was not retained
in any model. However, the minimum biological
distance to the next nearest super-colony (dn), was
retained in model III, indicating that during chick-
rearing, BBA habitat preference increases with dn up to
;250 km from the nearest colony, decreases again to a
minima at ;700 km, before increasing again to a
maximum at ;1800 km (Fig. 6b).
Estimated usage
Monthly plots of predicted mean spatial usage show
that the majority of the world’s breeding BBA are
confined to the southwest Atlantic, southern Chilean
coastal waters, and the Humboldt Current (Fig. 11).
During incubation, they are predicted to range from
;318 S to 608 S, whereas during chick-rearing their
range extends southward, to 758 S on the Antarctic
Peninsula. During incubation, estimated densities are
highest (maximum 15 birds/km2) in waters deeper than
1500 m on the Patagonian Shelf, south of the Rio de la
Plata (368 S), and around Cape Horn, the Chilean coast,
and Humboldt Current Upwelling south of Chiloe
Island (428 S). Smaller areas of high density are
predicted in the Brazil-Malvinas Confluence (;428 S,
0538 W), the APFZ to the north of South Georgia, and
on the South Georgia peri-insular shelf. Birds are
predicted to occur at lower densities in oceanic waters
bounding these areas, especially in the APFZ and STCZ
in the southwest Atlantic. During chick-rearing, the
maximum predicted density is higher (73 birds/km2),
with birds concentrated in the same neritic areas as
FIG. 11. Estimated worldwide distribution (birds/km2) ofbreeding Black-browed Albatrosses during (a) incubation(November 2000) and (b) post-brood chick-rearing (February2001). Predictions were made using model II for incubation-stage South Georgia birds, model I for all other incubation-stage populations, and model III for all post-brood chick-rearing populations. The 200-m and 1000-m depth contours arefrom the GEBCO digital atlas (IOC 2003).
FIG. 10. Selected fixed-effects covariates retained in modelsof spatial usage fitted to data from (a) Black-browedAlbatrosses tracked from northwest South Georgia duringincubation (model II) and (b) Campbell albatrosses trackedduring post-brood chick-rearing (model IV). The y-axes showthe partial residuals once the effects of all other covariates havebeen removed (i.e., the contribution to g in logits; Eq. 3).Hence, the plots can be interpreted as showing relativepopulation-level habitat preferences (Aarts et al. 2008). Dashedlines indicate estimated 95% CIs; EKE is eddy kinetic energy;and SLA is sea level anomaly. For remaining covariates seeAppendix C.
February 2011 157ALBATROSS DISTRIBUTION AND HABITAT
Javier Arata
Resaltado
during incubation, but at lower densities in oceanic
areas. The ice-free, neritic waters of the western
Antarctic Peninsula and the South Orkney islands are
also expected to hold large numbers of BBA during
chick-rearing. During both stages, BBA are also
predicted to occur at relatively low densities in neritic
waters close to breeding colonies in the southern Indian
and Pacific Oceans. Plots of the estimated spatial usage
for the post-brood chick-rearing period show the
predicted effects of intraspecific competition: namely,
that the degree of overlap between the foraging areas
predicted for populations from adjacent colonies is
smaller than would be expected if such competition were
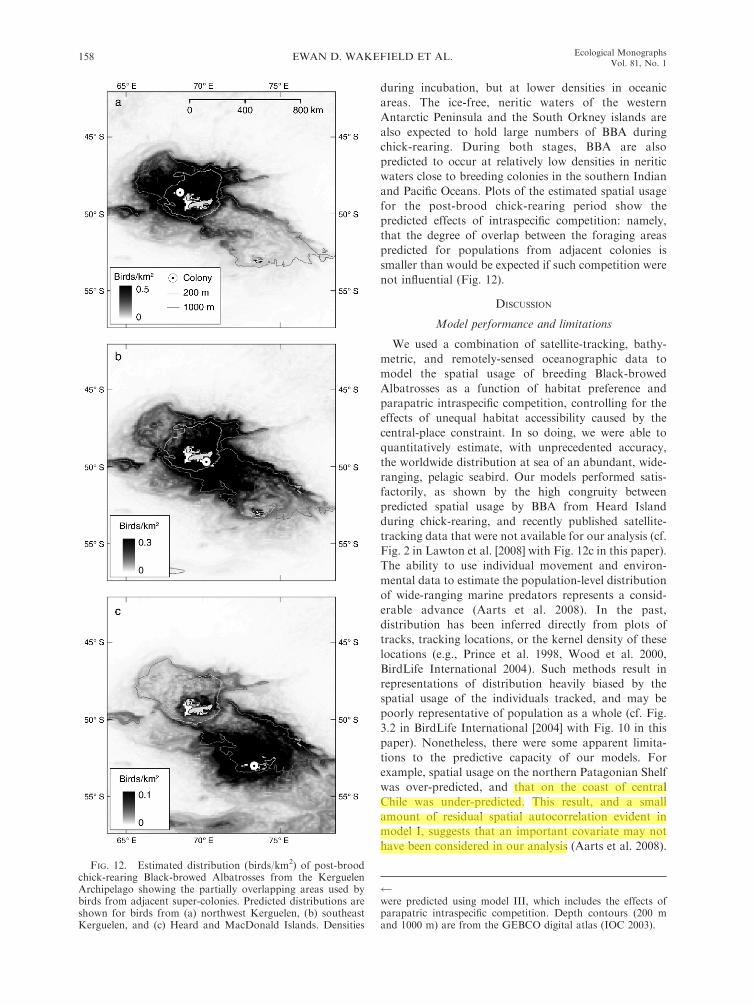
not influential (Fig. 12).
DISCUSSION
Model performance and limitations
We used a combination of satellite-tracking, bathy-
metric, and remotely-sensed oceanographic data to
model the spatial usage of breeding Black-browed
Albatrosses as a function of habitat preference and
parapatric intraspecific competition, controlling for the
effects of unequal habitat accessibility caused by the
central-place constraint. In so doing, we were able to
quantitatively estimate, with unprecedented accuracy,
the worldwide distribution at sea of an abundant, wide-
ranging, pelagic seabird. Our models performed satis-
factorily, as shown by the high congruity between
predicted spatial usage by BBA from Heard Island
during chick-rearing, and recently published satellite-
tracking data that were not available for our analysis (cf.
Fig. 2 in Lawton et al. [2008] with Fig. 12c in this paper).
The ability to use individual movement and environ-
mental data to estimate the population-level distribution
of wide-ranging marine predators represents a consid-
erable advance (Aarts et al. 2008). In the past,
distribution has been inferred directly from plots of
tracks, tracking locations, or the kernel density of these
locations (e.g., Prince et al. 1998, Wood et al. 2000,
BirdLife International 2004). Such methods result in
representations of distribution heavily biased by the
spatial usage of the individuals tracked, and may be
poorly representative of population as a whole (cf. Fig.
3.2 in BirdLife International [2004] with Fig. 10 in this
paper). Nonetheless, there were some apparent limita-
tions to the predictive capacity of our models. For
example, spatial usage on the northern Patagonian Shelf
was over-predicted, and that on the coast of central
Chile was under-predicted. This result, and a small
amount of residual spatial autocorrelation evident in
model I, suggests that an important covariate may not
have been considered in our analysis (Aarts et al. 2008).
FIG. 12. Estimated distribution (birds/km2) of post-broodchick-rearing Black-browed Albatrosses from the KerguelenArchipelago showing the partially overlapping areas used bybirds from adjacent super-colonies. Predicted distributions areshown for birds from (a) northwest Kerguelen, (b) southeastKerguelen, and (c) Heard and MacDonald Islands. Densities
were predicted using model III, which includes the effects ofparapatric intraspecific competition. Depth contours (200 mand 1000 m) are from the GEBCO digital atlas (IOC 2003).
EWAN D. WAKEFIELD ET AL.158 Ecological MonographsVol. 81, No. 1
Javier Arata
Resaltado
Javier Arata
Resaltado
We accounted for the effects of unequal habitat
accessibility and intraspecific competition in our models,
and then assumed that within tolerable limits the
remaining variability in spatial usage was the result of
habitat selection. In reality, a number of other factors
may also have affected spatial usage. For example,
contrary to the assumptions of the ideal free distribution
(Fretwell and Lukas 1970), albatrosses may have an
incomplete knowledge of the distribution of habitat
patches accessible to them (Kennedy and Gray 1993).
Hence, poor-quality habitat patches may have been used
while birds were searching for more suitable foraging
areas (Fauchald 1999, Pinaud and Weimerskirch 2005).
At small scales this can lead to a mismatch between the
distributions of high-quality habitat and foraging
albatrosses (Kennedy and Gray 1993). Furthermore,
commuting birds may use poor-quality habitats inci-
dentally or they may remain faithful to foraging areas,
despite the fact that habitat quality varies over time in
those areas (Gremillet et al. 2008). Such factors would
reduce the accuracy of our estimates of habitat
preference and our models’ predictive performance at
small spatial scales, but would be less likely to
compromise our large-scale predictions, because at these
scales pelagic seabirds are thought to rely on predictably
distributed resources (reviewed by Weimerskirch 2007).
Future studies should aim to quantify such behavioral
effects and so produce more accurate estimates of
albatross habitat preferences and distributions (Wake-
field et al. 2009a). In addition, the results of spatial
models could usefully be complimented by demographic
approaches to quantifying habitat quality (Pulliam 2000,
Johnson 2007).
The spatiotemporal resolution of our models was also
limited by that of the environmental data used
(minimum of 33 km, 1 month), but was sufficient to
detect responses to mesoscale phenomena such as eddies
and meanders. However, because the SST data set we
used (NOAA_OI_SST_V2) had a relatively low spatial
resolution (18), we were only able to detect responses to
water masses at large scales (.100 km). More recent
studies would be able to exploit SST data with higher
spatial (25 km) and temporal (daily) resolution to
examine interactions with oceanic frontal systems, such
as the Antarctic Polar Front (Boehme et al. 2008). In
addition, GPS loggers (which can be accurate to ,10 m)
are now readily available, and enable more detailed
investigations of factors limiting spatial usage at the
submesoscale level (Awkerman et al. 2005). Such data
might have improved our capacity to model the hot
spots of spatial usage in central Chilean coastal waters,
which we suspect occur in response to high levels of
primary production associated with the Humboldt
Current Upwelling (Longhurst 1998). A higher resolu-
tion spatial model, fitted at regional or colony level,
could also resolve the response of BBA to topograph-
ically constrained fronts on the Patagonian Shelf (Acha
et al. 2004), and spatial usage in the complex channels of
the Chilean fjords. In addition, our models could be
extended to consider time-lagged biological responses to
physical processes, such as phytoplankton blooms
induced by mixing or ice recession (Ainley et al. 1993,
Hunt et al. 1999, Gremillet et al. 2008). Furthermore,
the inclusion of individual characteristics (sex, age,
experience, quality, and so forth) would have been an
appropriate refinement (Aarts et al. 2008), particularly
as male and female BBA from at least one population
exhibit different spatial usage patterns (Phillips et al.
2004). However, such characteristics were not known
for the majority of birds tracked. Finally, anthropogenic
activities (i.e., fishing) may affect spatial usage of BBA
in relation to the physical environment (Thompson
1992, Waugh et al. 2005).
Accessibility
Our data support hypothesis 1 that the spatial usage
of breeding BBA and CBA decreases with distance from
the colony dc. Hence, this aspect of their behavior is as
predicted by central-place foraging theory (Orians and
Pearson 1979) and is similar to that of some but not all
central-place foragers examined so far (e.g., Adler and
Gordon 2003, Olsson et al. 2008, Osborne et al. 2008).
Although other studies of pelagic seabird habitat use
have acknowledged the importance of central-place
constraints, few have explicitly considered accessibility
in their analyses, which is clearly an important omission
(Pinaud and Weimerskirch 2005, Louzao et al. 2006). In
our approach, we assumed a null model in which spatial
usage in the absence of other factors was proportional to
accessibility a (i.e., the central-place constraint was built
into the model by generating pseudo-absence [control]
locations at a rate proportional to 1/dc). However, in
addition colony distance (dc) was also retained in our
most parsimonious models as an explanatory covariate,
indicating that in reality a declines at a greater rate than
1/dc. This tendency has also been observed in some other
colonial breeders (Matthiopoulos 2003, Nemeth et al.
2005, Aarts et al. 2008) and suggests that further
refinement could be made in the null usage model. This
could be achieved by firstly determining whether
energetic (intrinsic) or time (extrinsic) costs ultimately
limit a (Ydenberg et al. 1994, Hedenstrom and Alerstam
1995). During incubation, the time available for
foraging trips is determined by the partner’s ability to
fast on the nest, whereas during chick-rearing, it is the
endurance of the chick that is limiting (Shaffer et al.
2003, Humphreys et al. 2006). In order to fledge
successfully, a chick requires a high rate of energy
delivery; hence, its parent returns much more frequently
than during incubation. The rate of decline in a with dcis greater during chick-rearing than incubation, suggest-
ing that extrinsic factors limit a; a conclusion further
supported by the low energetic cost of flight in
albatrosses (Bevan et al. 1995, Arnould et al. 1996).
Secondly, both the temporal and energetic costs of
albatross flight also vary with relative wind speed
February 2011 159ALBATROSS DISTRIBUTION AND HABITAT
Javier Arata
Resaltado
Javier Arata
Resaltado
Javier Arata
Resaltado
Javier Arata
Resaltado
Javier Arata
Resaltado
Javier Arata
Resaltado
Javier Arata
Resaltado
Javier Arata
Resaltado
Javier Arata
Resaltado

(Weimerskirch et al. 2000, Wakefield et al. 2009b). As
wind field is a highly dynamic variable, its relationship
to a is potentially complex. However, could this
relationship be modeled, it would further refine models
of spatial usage (Felicisimo et al. 2008, Wakefield et al.
2009b). Finally, a alters dramatically in polar regions
due to seasonal changes in the extent of sea ice.
Although we allowed this to restrict accessibility on a
monthly time scale, sea ice cover may change more
rapidly (Heil and Allison 1999), and therefore a higher
temporal resolution might improve model fit.
Black-browed Albatross habitat preferences
Previous studies have described habitat use of
breeding BBA (Weimerskirch et al. 1997, Gremillet et
al. 2000, Wood et al. 2000, Huin 2002, Pinaud and
Weimerskirch 2002, 2007, Phillips et al. 2004, Terauds et
al. 2006b) and CBA (Waugh et al. 1999), but this is the
first study to quantify and compare their habitat
preferences. By accounting for the effects of unequal
habitat accessibility comparing habitat use with avail-
ability (Manly et al. 2002), our study confirms that, in all
populations, habitat preference decreases with depth;
birds use neritic habitats (0–500 m) more frequently
than would be expected by chance alone, followed by
shelf-break and shelf-slope (500–1000 m), and then
oceanic habitats (.1000 m). Habitat preference also
increases with sea floor slope, to a maximum of ;38.
Although such slopes are typical of the shelf-break, the
interaction between depth and depth slope was not
retained in our models, indicating that areas with steeper
relief are used more frequently, regardless of depth.
Comparison of spatial usage collected over multiple
breeding seasons suggests that this preference varies
little between years (Prince et al. 1998, Wood et al. 2000,
Pinaud and Weimerskirch 2002, Phillips et al. 2004).
Primary production in neritic and shelf-break waters is
often strongly seasonal, peaking in spring, summer, and
autumn, when albatrosses are breeding. Hence, aggrega-
tions of prey occur predictably at large temporal and
spatial scales (months, hundreds of kilometers) in the
neritic waters accessible to BBA (e.g., Murphy et al. 1997,
Waluda et al. 2001, Murphy et al. 2007, Duhamel and
Hautecoeur 2009). Furthermore, prey aggregate predict-
ably at smaller scales (days, tens of kilometers) due to the
presence of tidal and shelf-break fronts. As these and
other shallow water processes are topographically
constrained, they occur at similar depths in different
regions (Lefevre 1986, Acha et al. 2004). Consequently,
physical forcing may explain why bathymetric habitat
preferences are similar for birds from widely separated
colonies, despite considerable variation in the depths of
different continental and peri-insular shelves (e.g.,
Patagonian Shelf ;200 m; Antarctic Peninsula Shelf
;500 m; Kerguelen Shelf ;1000 m). Given that BBA
prefer neritic waters and that, in biological terms, the
transition between neritic and oceanic regimes, which
occurs in the vicinity of the shelf-break, is often abrupt,
one might expect a step in the preference function (Fig. 9)
at the shelf-break depth. That this does not occur may be
because at some spatial scales, depth increases with dc(i.e., shallow habitats are more accessible), although the
form of this relationship is highly variable with location
(cf. the bathymetry around Macquarie with that of the
Falklands). Hence, it could be hypothesized that BBA
utilize neritic waters more frequently simply because their
breeding islands lie on continental or peri-insular shelves.
Although it is difficult to separate the ultimate and
proximate causes of specialization, this seems unlikely:
Firstly, because BBA also forage in distant neritic waters
(e.g., during chick-rearing, birds from northwest South
Georgia and Islas Diego Ramirez travel .1600 km to
forage on the shelf of the west Antarctic Peninsula), and
secondly because sympatric congeners, such as the Grey-
headed Albatross T. chrysostoma, which is morpholog-
ically very similar to the BBA, forages more frequently in
oceanic waters (Nel et al. 2001, Phillips et al. 2004).
In common with the majority of seabirds, BBA are
long-lived, have low fecundity, locate patchily dispersed
prey by searching, and have a catholic diet, which
includes carrion (Croxall and Prince 1994, Cherel and
Klages 1998). Although these are all traits typical of
generalists (Begon et al. 2006), we have shown that the
same habitats were most frequently used by all but one
population, suggesting a degree of habitat specialization.
This exception was exhibited by BBA from northwest
South Georgia during incubation, which foraged not
only in neritic, shelf-break, and shelf-slope habitats, but
also in the distant oceanic waters of the Brazil-Malvinas
Confluence. This was reflected by an increase in habitat
preference with EKE above ;250 cm2/s2 for that
population. Because we did not track all populations
in the same year (Table 1), it is conceivable that this
difference arose because of anomalous environmental
conditions in 2002, the year in which BBA from
northwest South Georgia were tracked. For example,
in any one breeding season, either Antarctic krill
Euphausia superba, fish, or squid may predominate in
the diet of BBA from this population (Xavier et al.
2003). Although this may simply reflect changes in the
relative abundance of prey, which varies between years
in the vicinity of South Georgia (Murphy et al. 2007,
Xavier et al. 2007), it is also possible that BBA make
large-scale switches in foraging areas in response to
changes in prey distribution and environmental condi-
tions. However, the broad-scale spatial usage of the
populations which we tracked during the same breeding
stage in multiple years (southeast Kerguelen and Isla
Diego Ramirez) showed little interannual variability.
Therefore, it is unlikely that the South Georgia BBA’s
use of the Brazil-Malvinas Confluence is anomalous.
Eddy kinetic energy in the Brazil-Malvinas Confluence
exceeded 3600 cm2/s2, indicating intense mesoscale
activity. In the subtropical Southern Hemisphere such
activity occurs only in this region, the Agulhas Current
EWAN D. WAKEFIELD ET AL.160 Ecological MonographsVol. 81, No. 1
Javier Arata
Resaltado

Extension off the Cape of Good Hope, and on the east
coast of Australia (Ducet et al. 2000). Notably, the latter
two areas are exploited by nonbreeding BBA (Tickell
2000, Phillips et al. 2005, Petersen et al. 2008).Mixing and
advection at the edges of mesoscale meanders and eddies,
where EKE values are highest, may lead to enhanced
primary and secondary production, as well as the
aggregation of prey (Mann and Lazier 2006). Numerous
studies have demonstrated associations with mesoscale
eddies by wide-ranging higher predators, including
southern elephant seals Mirounga leonine in the Brazil–
Malvinas Confluence (Campagna et al. 2006) and Grey-
headed Albatrosses in the APFZ (Nel et al. 2001).
Stage-specific habitat preference
Although the variation in habitat preference with
depth was similar across breeding stages, the spatial
usage of birds during incubation also varied with SST,
supporting hypothesis 2, that BBA express stage-specific
habitat preferences. During incubation, birds from some
populations also made occasional, or in the case of birds
from northwest South Georgia, frequent, trips into
distant oceanic waters. This can be interpreted in a
number of ways. For example, during incubation, BBA
have sufficient time to make longer trips, allowing them
to access oceanic subantarctic waters between the APF
and the STCZ. This may be profitable because complex
fronts, meanders and eddies give rise to comparatively
high levels of primary and secondary production in these
areas (Lutjeharms et al. 1985). Alternatively, the peak in
habitat preference at warmer SSTs may be spurious,
arising because BBA have a more northerly distribution
during incubation for other reasons, e.g., if BBA were
broadly tracking resources, because primary production
peaks during November in the mid-southern latitudes,
and two months later in high latitudes (Yoder et al.
1993). If this is the explanation, any causal link between
SST and spatial usage would be indirect. However,
Pinaud and Weimerskirch (2002) have shown that, over
an 18-year period, breeding success of BBA at Kergue-
len is positively correlated with the mean monthly SST
anomaly in core foraging areas, implying a more direct
link between SST and foraging success. During chick-
rearing, there was no significant variation in BBA
habitat preference with SST. However, 21 of the 54
BBA we tracked in this stage visited areas covered by sea
ice earlier in the season, whereas during incubation, only
one of 109 birds visited the marginal ice zone. This shift
to foraging in marginal sea ice was synchronized with
recession of pack ice, which is followed a period of high
productivity (El Sayed and Taguchi 1981). Alternatively,
BBA may simply be exploiting previously inaccessible
neritic, shelf-break, and shelf-slope areas, which are
preferred per se (Ainley et al. 1993). Indeed, the extent of
open water ,1000 m deep within 3200 km of the Islas
Diego Ramirez increases on average by 230 000 km2 as
the sea ice retreats between December and February,
and such areas are often replete with Antarctic krill
(Murphy et al. 2007). Finally, changes in dietary
requirement with breeding stage may play a role in
habitat selection. Although there is a wealth of data on
the diets of seabirds during chick-rearing, very little is
known about the diet of incubating, or indeed non-
breeding, birds (e.g., Croxall and Prince 1980, Cherel
and Klages 1998). However, fatty acid analysis has
shown recently that diet may differ between breeding
stages (Williams et al. 2008). Such a shift is likely to
occur in some populations of BBA, because they forage
south of the APF (which marks the biogeographical
limit of the Southern Ocean) only during chick-rearing
(Fig. 4). Hence, the differences in BBA habitat
preference we observed could be interpreted in terms
of stage-dependent foraging niches, mediated by intrin-
sic factors such as the dietary or energetic requirements
of adults and chicks (Charrassin et al. 1998, Humphreys
et al. 2006), or by extrinsic factors.
Campbell Albatross habitat preference
Closely related species often occupy different niches.
As such, it may be unsurprising that the chick-rearing
stage habitat preferences of CBA and BBA differ.
However, differences in habitat preference can also arise
due to differences between the relative availability of
habitats to different (allopatric) populations (Mysterud
and Ims 1998, Boyce et al. 2002). The oceanographic
regime in waters surrounding the Campbell Island
differs in a number of respects from that in waters
bounding BBA colonies. Firstly, although the Campbell
Plateau is extensive, it is also deep (600–1000 m) in
comparison to typical continental or peri-insular shelves
(usually ,200 m deep). Hence, although CBA have
access to comparatively small areas of neritic waters
close to their colony, there are large areas of waters of
intermediate depth (Table 1). Secondly, topographic
steering of the Antarctic Circumpolar Current around
the plateau gives rise to intense mesoscale eddy activity
in the subantarctic and subtropical frontal zones, in very
predictable areas close to the island (Morris et al. 2001).
Hence, because of the paucity of truly neritic waters
around Campbell Island, CBA may select shallower
waters in a similar way to BBA, but also exploit
predictable oceanic frontal zones (Waugh et al. 1999), as
indicated by an increase in habitat preference with
positive SLA values. As such, the habitat preference of
CBA during incubation may be similar to that of BBA
from South Georgia. The questions of whether observed
differences in chick-rearing stage habitat preference of
CBA and BBA arise due to specialization or are simply
differences in the relative availability of habitats could
be addressed by tracking and modeling the habitat
preferences of the small population of BBA that breed
sympatrically with CBA on Campbell Island.
Parapatric intraspecific competition
Our null model assumes that spatial usage decreases
with dc (Matthiopoulos 2003). A corollary of this is that
February 2011 161ALBATROSS DISTRIBUTION AND HABITAT

the capacity of individuals to compete for resources
declines with dc, because energetic reserves and/or the
time available to locate and capture prey also diminish
with dc. Direct competition between BBA can be intense,
with frequent agonistic encounters between birds over
prey (Cherel et al. 2002) (see Plate 1). Hence, in order to
minimize intraspecific competition, locations should be
preferred if they are both close to the nest and distant
from other colonies. If prey is uniformly distributed, this
would give rise to a partial spatial segregation along
colony lines, perhaps enhanced by cultural effects and
wind patterns (Gremillet et al. 2004). Such segregation
has been noted between some adjacent populations of
BBA (Weimerskirch et al. 1988, Huin 2002), and in
other colonial central-place foragers, including seabirds
(e.g., Giraldeau et al. 1994, Brown and Gordon 2000,
Ainley et al. 2003, Gremillet et al. 2004). However, if
colonies are far enough apart, the decrease in usage with
dc alone may be sufficient to give rise to an apparent
exclusivity in foraging areas (Lea et al. 2008). The
hinterland model (Cairns 1989) proposes a similar
mechanism to explain spatial segregation in seabirds.
However, our tracking data show that this model is
inappropriate for BBA: Firstly, because it predicts that
the foraging zones of birds from adjacent colonies are
always mutually exclusive, whereas foraging BBA from
the three main Chilean colonies, which are located 100–
700 km from one another, overlap extensively (Figs. 1a
and 4a), and secondly, because the predicted positive
correlation between foraging area and colony size does
not hold true for BBA. Similarly, contrary to Lewis et al.
(2001), BBA from larger colonies do not necessarily
travel further to forage (Fig. 5), a mechanism by which
it was proposed birds could avoid indirect competition
with sympatric intraspecifics. Indeed, birds from Beau-
chene Island, which is the second largest BBA colony in
the world, forage relatively close to their colony (Figs. 3
and 4). This is perhaps unsurprising, as it seems
reasonable to assume that on average the fitness of
two birds from the same colony diminishes at the same
rate with dc (see also Forero et al. 2002).
During model selection, we rejected parapatric
intraspecific density (qc) as an explanatory variable.
Distance to the next nearest colony (dn) was, however,
retained in our post-guard model (III). BBA apparently
responded to dn at two scales. At the mesoscale, they
showed a preference for areas ;200 km from the next
nearest colony, while at the macroscale (thousands of
PLATE 1. Agonistic interactions between Black-browed Albatrosses foraging in association with Northern Giant Petrels in thevicinity of South Georgia. Photo credit: E. D. Wakefield.
EWAN D. WAKEFIELD ET AL.162 Ecological MonographsVol. 81, No. 1

kilometers), they preferred areas ;1800 km away. We
interpret this as a behavioral response to an increased
need to avoid direct competition with parapatric
conspecifics during chick-rearing (Fig. 12). During this
stage, encounters with parapatric conspecifics in the
vicinity of neighboring colonies would be more likely,
both because foraging ranges contract and twice as
many adults are at sea (during incubation, half of the
breeding population must remain on the nest). Hence,
BBA either make short trips in the vicinity of the home
colony but far from neighboring colonies (such as in the
Falklands populations), and/or longer trips to areas
remote from both the home and neighboring colonies.
The latter strategy is exhibited by BBA from South
Georgia and Islas Diego Ramirez, which also travel to
the South Orkneys Islands and the west Antarctic
Peninsula during chick-rearing (Fig. 4b). Hence, while
hypothesis 4 is supported, it should be emphasized that
spatial usage is a function not just of intraspecific
competition but also of accessibility and habitat
preference. Therefore, in some circumstances, gains
associated with reducing competition may be out-
weighed by gains associated with reduced travel costs
(if two colonies are very close together, foraging zones
may still overlap) or access to richer resources.
CONCLUSIONS
We have shown that BBA breeding at colonies
throughout the species’ range prefer to forage in neritic
habitats. Furthermore, tracking and ringing recoveries
indicate that nonbreeding BBA generally overwinter in
neritic areas (Tickell 1975, Gremillet et al. 2000, Phillips
et al. 2005), leading to the conclusion that this species is
primarily a neritic specialist. However, important
differences in habitat preference were found between
BBA from South Georgia and other populations and
between BBA and closely related CBA. In the latter
case, this may reflect divergent niche specialization. In
contrast, differences in habitat preference were not
noted between BBA from the Falkland Islands and
intraspecifics from other populations, despite the fact
that it has been argued that the Falkland Island
population is genetically distinct enough to warrant
subspecies status (Burg and Croxall 2001). Differences
or similarities in habitat preference may arise because of
the relative composition of habitats available to
different populations and so should be interpreted with
caution. Indeed, our results indicate that differences in
habitat preferences estimated using use–availability data
can be as great within species as between species.
Because we tracked populations in different years we
were unable to quantify the uncertainty in our estimates
of spatial usage associated with interannual variability.
As multiyear tracking data sets become available it
should be a priority for marine ecologists to investigate
how foraging site choice varies from year to year at both
the individual and population level (Pinaud et al. 2005).
Our estimates of spatial usage show that the vast
majority of the world’s BBA are concentrated during the
breeding season on the Patagonian Shelf, Southern
Chilean continental shelf, and in the Humboldt Current
Upwelling (Fig. 11). These highly productive areas
support large trawl and longline fisheries, which are
responsible for unsustainable levels of BBA bycatch
(Croxall and Gales 1998, Sullivan et al. 2006). To date,
although considerable efforts have been made to put
bycatch mitigation measures in place on the Patagonian
Shelf, less attention has been paid to Chilean waters,
which hold large numbers of BBA throughout the year
(Moreno et al. 2006). Efforts to reduce the bycatch of
this endangered species should therefore focus on both
areas as a priority.
ACKNOWLEDGMENTS
This study was carried out while the first author was inreceipt of a UK Natural Environment Research Council CASEstudentship (NER/S/A/2005/13648) in partnership with theBritish Antarctic Survey. We are indebted to Geert Aarts, whoinitially developed the modeling techniques used in this study.We thank Simon Wood for advice on the implementation ofGAMMs, and Andrew Fleming and Peter Fretwell for theprovision of environmental data. We also thank Larkin Powelland an anonymous reviewer for constructive comments on anearlier version of this paper.
LITERATURE CITED
Aarts, G., M. MacKenzie, B. McConnell, M. Fedak, and J.Matthiopoulos. 2008. Estimating space-use and habitatpreference from wildlife telemetry data. Ecography 31:140–160.
Acha, E. M., H. W. Mianzan, R. A. Guerrero, M. Favero, andJ. Bava. 2004. Marine fronts at the continental shelves ofaustral South America physical and ecological processes.Journal of Marine Systems 44:83–105.
Adler, F. R., and D. M. Gordon. 2003. Optimization, conflict,and nonoverlapping foraging ranges in ants. AmericanNaturalist 162:529–543.
Ainley, D. G., R. G. Ford, E. D. Brown, R. M. Suryan, andD. B. Irons. 2003. Prey resources, competition, andgeographic structure of kittiwake colonies in Prince WilliamSound. Ecology 84:709–723.
Ainley, D. G., C. A. Ribic, G. Ballard, S. Heath, I. Gaffney,B. J. Karl, K. J. Barton, P. R. Wilson, and S. Webb. 2004.Geographic structure of Adelie Penguin populations: overlapin colony-specific foraging areas. Ecological Monographs 74:159–178.
Ainley, D. G., C. A. Ribic, and L. B. Spear. 1993. Species-habitat relationships among Antarctic seabirds: a function ofphysical or biological factors. Condor 95:806–816.
Alderman, R., M. C. Double, J. Valencia, and R. P. Gales.2005. Genetic affinities of newly sampled populations ofWandering and Black-browed Albatross. Emu 105:169–179.
Arata, J., G. Robertson, J. Valencia, and K. Lawton. 2003. TheEvangelistas Islets, Chile: a new breeding site for black-browed albatrosses. Polar Biology 26:687–690.
Arnould, J. P. Y., D. R. Briggs, J. P. Croxall, P. A. Prince, andA. G. Wood. 1996. The foraging behaviour and energetics ofwandering albatrosses brooding chicks. Antarctic Science 8:229–236.
Ashmole, N. P. 1963. The regulation of numbers of tropicaloceanic birds. Ibis 103:458–473.
Austin, M. 2007. Species distribution models and ecologicaltheory: a critical assessment and some possible newapproaches. Ecological Modelling 200:1–19.
February 2011 163ALBATROSS DISTRIBUTION AND HABITAT
Javier Arata
Resaltado
Javier Arata
Resaltado
Awkerman, J. A., A. Fukuda, H. Higuchi, and D. J. Anderson.2005. Foraging activity and submesoscale habitat use ofwaved albatrosses Phoebastria irrorata during chick-brood-ing period. Marine Ecology Progress Series 291:289–300.
Ballance, L. T., R. L. Pitman, and P. C. Fiedler. 2006.Oceanographic influences on seabirds and cetaceans of theeastern tropical Pacific: a review. Progress in Oceanography69:360–390.
Begon, M., C. R. Townsend, and J. L. Harper. 2006. Ecology:from individuals to ecosystems. Blackwell, Malden, Massa-chusetts, USA.
Bevan, R. M., P. J. Butler, A. J. Woakes, and P. A. Prince.1995. The energy expenditure of free-ranging black-browedalbatrosses. Philosophical Transactions of the Royal SocietyB 350:119–131.
BirdLife International. 2004. Tracking ocean wanderers: theglobal distribution of albatrosses and petrels. Results fromthe Global Procellariiform Tracking Workshop, 1–5 Septem-ber, 2003, Gordon’s Bay, South Africa. BirdLife Interna-tional, Cambridge, UK.
Bock, C. E., and Z. F. Jones. 2004. Avian habitat evaluation:Should counting birds count? Frontiers in Ecology and theEnvironment 2:403–410.
Boehme, L., M. P. Meredith, S. E. Thorpe, M. Biuw, and M.Fedak. 2008. Antarctic Circumpolar Current frontal systemin the South Atlantic: monitoring using merged Argo andanimal-borne sensor data. Journal of Geophysical Research-Oceans 113. [doi: 10.1029/2007JC004647]
Boyce, M. S., P. R. Vernier, S. E. Nielsen, and F. K. A.Schmiegelow. 2002. Evaluating resource selection functions.Ecological Modelling 157:281–300.
Breed, G. A., I. D. Jonsen, R. A. Myers, W. D. Bowen, andM. L. Leonard. 2009. Sex-specific, seasonal foraging tacticsof adult grey seals (Halichoerus grypus) revealed by state–space analysis. Ecology 90:3209–3221.
Brown, M. J. F., and D. M. Gordon. 2000. How resources andencounters affect the distribution of foraging activity in aseed-harvesting ant. Behavioral Ecology and Sociobiology47:195–203.
Buckland, S. T., D. R. Anderson, K. P. Burnham, J. L. Laake,D. L. Borchers, and L. Thomas. 2004. Advanced distancesampling. Oxford University Press, Oxford, UK.
Burg, T. M., and J. P. Croxall. 2001. Global relationshipsamongst black-browed and grey-headed albatrosses: analysisof population structure using mitochondrial DNA andmicrosatellites. Molecular Ecology 10:2647–2660.
Burger, A. E., and S. A. Shaffer. 2008. Application of trackingand data-logging technology in research and conservation ofseabirds. Auk 125:253–264.
Burnham, K. P., and D. R. Anderson. 1998. Model selectionand multimodel inference. Second edition. Springer, NewYork, New York, USA.
Cairns, D. K. 1989. The regulation of seabird colony size: ahinterland model. American Naturalist 134:141–146.
Campagna, C., A. R. Piola, M. R. Marin, M. Lewis, and T.Fernandez. 2006. Southern elephant seal trajectories, frontsand eddies in the Brazil/Malvinas Confluence. Deep-SeaResearch Part I-Oceanographic Research Papers 53:1907–1924.
Charrassin, J. B., C. A. Bost, K. Putz, L. Lage, T. Dahier, T.Zorn, and Y. Le Maho. 1998. Foraging strategies ofincubating and brooding king penguins Aptenodytes patago-nicus. Oecologia 114:194–201.
Cherel, Y., and N. T. W. Klages. 1998. A review of the food ofalbatrosses. Pages 113–136 in G. Robertson and R. Gales,editors. Albatross biology and conservation. Surrey Beattyand Sons, Chipping Norton, New South Wales, Australia.
Cherel, Y., H. Weimerskirch, and C. Trouve. 2002. Dietaryevidence for spatial foraging segregation in sympatricalbatrosses (Diomedea spp.) rearing chicks at Iles Nuageuses,Kerguelen. Marine Biology 141:1117–1129.
Croxall, J. P., and R. Gales. 1998. An assessment of theconservation status of albatrosses. Pages 46–65 in G.Robertson and R. Gales, editors. Albatross biology andconservation. Surrey Beatty and Sons, Chipping Norton,New South Wales, Australia.
Croxall, J. P., and E. D. Prince. 1980. Food, feeding ecologyand ecological segregation of seabirds at South Georgia.Biological Journal of the Linnean Society 14:103–131.
Croxall, J. P., and P. A. Prince. 1994. Dead or alive, night orday: How do albatrosses catch squid? Antarctic Science 6:155–162.
Ducet, N., P. Y. Le Traon, and G. Reverdin. 2000. Global high-resolution mapping of ocean circulation from TOPEX/Poseidon and ERS-1 and -2. Journal of GeophysicalResearch-Oceans 105:19477–19498.
Duhamel, G., and M. Hautecoeur. 2009. Biomass, abundanceand distribution of fish in the Kerguelen Islands Eez (CcamlrStatistical Division 58.5.1). CCAMLR Science 16:1–32.
El Sayed, S. Z., and S. Taguchi. 1981. Primary production andstanding crop of phytoplankton along the ice-edge in theWeddell Sea. Deep-Sea Research Part a-OceanographicResearch Papers 28:1017–1032.
ESRI. 2006. ArcGIS spatial analyst package. Version 9.2.ESRI, Redlands, California, USA.
Fauchald, P. 1999. Foraging in a hierarchical patch system.American Naturalist 153:603–613.
Felicisimo, A. M., J. Munoz, and J. Gonzalez-Solis. 2008.Ocean surface winds drive dynamics of transoceanic aerialmovements. PLoS ONE 3:e2928.
Fetterer, F., K. Knowles, W. Meier, and M. Savoie. 2002,updated 2008. Sea ice index. National Snow and Ice DataCenter, Boulder, Colorado, USA. Digital media.
Forero, M. G., J. L. Tella, K. A. Hobson, M. Bertellotti, andG. Blanco. 2002. Conspecific food competition explainsvariability in colony size: a test in Magellanic Penguins.Ecology 83:3466–3475.
Fretwell, S. D., and H. L. Lukas. 1970. On terrestrial behaviourand other factors influenecing habitat distribution in birds.Acta Biotheoretica 19:16–36.
Furness, R. W., and T. R. Birkhead. 1984. Seabird colonydistributions suggest competition for food supplies during thebreeding season. Nature 311:655–656.
Gales, R. 1998. Albatross populations: status and threats. Pages20–45 in G. Robertson and R. Gales, editors. Albatrossbiology and conservation. Surrey Beatty and Sons, ChippingNorton, New South Wales, Australia.
Giraldeau, L. A., D. L. Kramer, I. Deslandes, and H. Lair.1994. The effect of competitors and distance on central placeforaging eastern chipmunks, Tamias striatus. Animal Behav-iour 47:621–632.
Gremillet, D., G. Dell’Omo, P. G. Ryan, G. Peters, Y. Ropert-Coudert, and S. J. Weeks. 2004. Offshore diplomacy, or howseabirds mitigate intra-specific competition: a case studybased on GPS tracking of Cape gannets from neighbouringcolonies. Marine Ecology Progress Series 268:265–279.
Gremillet, D., S. Lewis, L. Drapeau, C. D. van der Lingen, J. A.Huggett, J. C. Coetzee, H. M. Verheye, F. Daunt, S.Wanless, and P. G. Ryan. 2008. Spatial match-mismatch inthe Benguela upwelling zone: should we expect chlorophylland sea-surface temperature to predict marine predatordistributions? Journal of Applied Ecology 45:610–621.
Gremillet, D., R. P. Wilson, S. Wanless, and T. Chater. 2000.Black-browed albatrosses, international fisheries and thePatagonian Shelf. Marine Ecology Progress Series 195:269–280.
Griffin, L. R., and C. J. Thomas. 2000. The spatial distributionand size of rook (Corvus frugilegus) breeding colonies isaffected by both the distribution of foraging habitat and byintercolony competition. Proceedings of the Royal Society B267:1463–1467.
EWAN D. WAKEFIELD ET AL.164 Ecological MonographsVol. 81, No. 1

Guinet, C., L. Dubroca, M. A. Lea, S. Goldsworthy, Y. Cherel,G. Duhamel, F. Bonadonna, and J. P. Donnay. 2001. Spatialdistribution of foraging in female Antarctic fur sealsArctocephalus gazella in relation to oceanographic variables:a scale-dependent approach using geographic informationsystems. Marine Ecology Progress Series 219:251–264.
Guisan, A., and N. E. Zimmermann. 2000. Predictive habitatdistribution models in ecology. Ecological Modelling 135:147–186.
Hall, L. S., P. R. Krausman, and M. L. Morrison. 1997. Thehabitat concept and a plea for standard terminology. WildlifeSociety Bulletin 25:173–182.
Hays, G. C., M. Dray, T. Quaife, T. J. Smyth, N. C. Mironnet,P. Luschi, F. Papi, and M. J. Barnsley. 2001. Movements ofmigrating green turtles in relation to AVHRR derived seasurface temperature. International Journal of RemoteSensing 22:1403–1411.
Hedenstrom, A., and T. Alerstam. 1995. Optimal flight speed ofbirds. Philosophical Transactions of the Royal Society B 348:471–487.
Heil, P., and I. Allison. 1999. The pattern and variability ofAntarctic sea-ice drift in the Indian Ocean and westernPacific sectors. Journal of Geophysical Research-Oceans 104:15789–15802.
Huin, N. 2002. Foraging distribution of the black-browedalbatross, Thalassarche melanophris, breeding in the FalklandIslands. Aquatic Conservation: Marine and FreshwaterEcosystems 12:89–99.
Huin, N., and T. Reid. 2006. Census of the Black-browedAlbatross population of the Falkland Islands 2000 and 2005.Falklands Conservation. hhttp://www.falklandsconservation.com/wildlife/birds/AlbatrossCensusReport05-06.pdfi
Humphreys, E. M., S. Wanless, and D. M. Bryant. 2006. Stage-dependent foraging in breeding black-legged kittiwakesRissa tridactyla: distinguishing behavioural responses tointrinsic and extrinsic factors. Journal of Avian Biology 37:436–446.
Hunt, G. L., K. O. Coyle, S. Hoffman, M. B. Decker, and E. N.Flint. 1996. Foraging ecology of short-tailed shearwatersnear the Pribilof Islands, Bering Sea. Marine EcologyProgress Series 141:1–11.
Hunt, G. L., F. Mehlum, R. W. Russell, D. Irons, M. B.Decker, and P. H. Becker. 1999. Physical processes, preyabundance, and the foraging ecology of seabirds. Pages2040–2056 in 22nd International Ornithological Congress.BirdLife South Africa, Durban, South Africa.
Hyrenbach, K. D. 2001. Albatross response to survey vessels:implications for studies of the distribution, abundance, andprey consumption of seabird populations. Marine EcologyProgress Series 212:283–295.
Hyrenbach, K. D., P. Fernandez, and D. J. Anderson. 2002.Oceanographic habitats of two sympatric North Pacificalbatrosses during the breeding season. Marine EcologyProgress Series 233:283–301.
Intergovernmental Oceanographic Commission [IOC]. 2003.Centenary edition of the GEBCO Digital Atlas. Intergov-ernmental Oceanographic Commission and the InternationalHydrographic Organization as part of the General Bathy-metric Chart of the Oceans, British Oceanographic DataCentre, Liverpool, UK. [CD-ROM.]
IUCN. 2008. Thalassarche melanophrys. 2008 IUCN red list ofthreatened species. IUCN, Gland, Switzerland. hwww.iucnredlist.orgi
Johnson, D. H. 1980. The comparison of usage and availabilitymeasurements for evaluating resource preference. Ecology61:65–71.
Johnson, M. D. 2007. Measuring habitat quality: a review.Condor 109:489–504.
Kennedy, M., and R. D. Gray. 1993. Can ecological theorypredict the distribution of foraging animals: a critical analysis
of experiments on the ideal free distribution. Oikos 68:158–166.
Lawton, K., R. Kirkwood, G. Robertson, and B. Raymond.2008. Preferred foraging areas of Heard Island albatrossesduring chick raising and implications for the management ofincidental mortality in fisheries. Aquatic Conservation:Marine and Freshwater Ecosystems 18:309–320.
Lea, M. A., C. Guinet, Y. Cherel, M. Hindell, L. Dubroca, andS. Thalmann. 2008. Colony-based foraging segregation byAntarctic fur seals at the Kerguelen Archipelago. MarineEcology Progress Series 358:273–287.
Lefevre, J. 1986. Aspects of the biology of frontal systems.Advances in Marine Biology 23:163–299.
Lewis, S., T. N. Sherratt, K. C. Hamer, and S. Wanless. 2001.Evidence of intra-specific competition for food in a pelagicseabird. Nature 412:816–819.
Lidicker, W. Z. 1975. The role of dispersal in the demographyof small mammals. Pages 103–128 in F. B. Golley, K.Petrusewicz, and L. Ryszkowski, editors. Small mammals:their productivity and population dynamics. CambridgeUniversity Press, Cambridge, UK.
Longhurst, A. L. 1998. Ecological geography of the sea.Academic Press, San Diego, California, USA.
Louzao, M., K. D. Hyrenbach, J. M. Arcos, P. Abello, L. G.De Sola, and D. Oro. 2006. Oceanographic habitat of anendangered Mediterranean procellariiform: implications formarine protected areas. Ecological Applications 16:1683–1695.
Lutjeharms, J. R. E., N. M. Walters, and B. R. Allanson. 1985.Oceanic frontal systems and biological enhancement. Pages11–21 in W. R. Siegfried, P. R. Condy, and R. M. Laws,editors. Antarctic nutrient cycles and food webs. Springer-Verlag, Berlin, Germany.
Manly, B. F., L. McDonald, D. L. Thomas, T. L. McDonald,and W. P. Erickson. 2002. Resource selection by animals.Statistical design and analysis for field studies. Secondedition. Springer-Verlag, Berlin, Germany.
Mann, K. H., and J. R. N. Lazier. 2006. Dynamics of marineecosystems. Third edition. Blackwell Publishing, Malden,Massachusetts, USA.
Martin, S. 2004. An introduction to ocean remote sensing.Cambridge University Press, Cambridge, UK.
Matthiopoulos, J. 2003. The use of space by animals as afunction of accessibility and preference. Ecological Modelling159:239–268.
McConnell, B., M. Fedak, H. R. Burton, G. H. Engelhard, andP. J. H. Reijnders. 2002. Movements and foraging areas ofnaive, recently weaned southern elephant seal pups. Journalof Animal Ecology 71:65–78.
Moore, J. K., M. R. Abbott, and J. G. Richman. 1999.Location and dynamics of the Antarctic Polar Front fromsatellite sea surface temperature data. Journal of GeophysicalResearch-Oceans 104:3059–3073.
Moore, P. J. 2004. Abundance and population trends ofmollymawks on Campbell Island. Science for Conservation242. Department of Conservation, Wellington, New Zealand.
Moreno, C. A., J. A. Arata, P. Rubilar, R. Hucke-Gaete, andG. Robertson. 2006. Artisanal longline fisheries in SouthernChile: lessons to be learned to avoid incidental seabirdmortality. Biological Conservation 127:27–36.
Morris, M., B. Stanton, and H. Neil. 2001. Subantarcticoceanography around New Zealand: preliminary results froman ongoing survey. New Zealand Journal of Marine andFreshwater Research 35:499–519.
Murphy, E., P. Trathan, I. Everson, G. Parkes, and F. Daunt.1997. Krill fishing in the Scotia Sea in relation to bathymetry,including the detailed distribution around South Georgia.CCAMLR Science 4:1–17.
Murphy, E. J., et al. 2007. Spatial and temporal operation ofthe Scotia Sea ecosystem: a review of large-scale links in a
February 2011 165ALBATROSS DISTRIBUTION AND HABITAT
krill centred food web. Philosophical Transactions of theRoyal Society B 362:113–148.
Mysterud, A., and R. A. Ims. 1998. Functional responses inhabitat use: availability influences relative use in trade-offsituations. Ecology 79:1435–1441.
Nel, D. C., J. R. E. Lutjeharms, E. A. Pakhomov, I. J. Ansorge,P. G. Ryan, and N. T. W. Klages. 2001. Exploitation ofmesoscale oceanographic features by grey-headed albatrossThalassarche chrysostoma in the southern Indian Ocean.Marine Ecology Progress Series 217:15–26.
Nemeth, E., P. Bossew, and C. Plutzar. 2005. A distance-dependent estimation of foraging ranges of neighbouring birdcolonies. Ecological Modelling 182:67–73.
Olsson, O., J. S. Brown, and K. L. Helf. 2008. A guide tocentral place effects in foraging. Theoretical PopulationBiology 74:22–33.
Orians, G. H., and N. E. Pearson. 1979. On the theory ofcentral place foraging. Pages 155–177 in D. J. Horn, G. R.Stairs, and R. G. Mitchelle, editors. Analysis of ecologicalsystems. Ohio State University Press, Columbus, Ohio, USA.
Osborne, J. L., A. P. Martin, N. L. Carreck, J. L. Swain, M. E.Knight, D. Goulson, R. J. Hale, and R. A. Sanderson. 2008.Bumblebee flight distances in relation to the forage land-scape. Journal of Animal Ecology 77:406–415.
Patterson, T. A., L. Thomas, C. Wilcox, O. Ovaskainen, and J.Matthiopoulos. 2008. State-space models of individualanimal movement. Trends in Ecology and Evolution 23:87–94.
Petersen, S. L., R. A. Phillips, P. G. Ryan, and L. G. Underhill.2008. Albatross overlap with fisheries in the BenguelaUpwelling System: implications for conservation and man-agement. Endangered Species Research 5:117–127.
Phillips, R. A., J. R. D. Silk, J. P. Croxall, V. Afanasyev, andV. J. Bennett. 2005. Summer distribution and migration ofnonbreeding albatrosses: individual consistencies and impli-cations for conservation. Ecology 86:2386–2396.
Phillips, R. A., J. R. D. Silk, B. Phalan, P. Catry, and J. P.Croxall. 2004. Seasonal sexual segregation in two Thalas-sarche albatross species: competitive exclusion, reproductiverole specialization or foraging niche divergence? Proceedingsof the Royal Society B 271:1283–1291.
Phillips, R. A., J. C. Xavier, and J. P. Croxall. 2003. Effects ofsatellite transmitters on albatrosses and petrels. Auk 120:1082–1090.
Pinaud, D., Y. Cherel, and H. Weimerskirch. 2005. Effect ofenvironmental variability on habitat selection, diet, provi-sioning behaviour and chick growth in yellow-nosed alba-trosses. Marine Ecology Progress Series 298:295–304.
Pinaud, D., and H. Weimerskirch. 2002. Ultimate andproximate factors affecting the breeding performance of amarine top-predator. Oikos 99:141–150.
Pinaud, D., and H. Weimerskirch. 2005. Scale-dependenthabitat use in a long-ranging central place predator. Journalof Animal Ecology 74:852–863.
Pinaud, D., and H. Weimerskirch. 2007. At-sea distributionand scale-dependent foraging behaviour of petrels andalbatrosses: a comparative study. Journal of Animal Ecology76:9–19.
Poncet, S., G. Robertson, R. A. Phillips, K. Lawton, B. Phalan,P. N. Trathan, and J. P. Croxall. 2006. Status anddistribution of wandering, black-browed and grey-headedalbatrosses breeding at South Georgia. Polar Biology 29:772–781.
Prince, E. D., J. P. Croxall, P. N. Trathan, and A. G. Wood.1998. The pelagic distribution of South Georgia albatrossesand their relationship with fisheries. Pages 137–167 in G.Robertson and R. Gales, editors. Albatross biology andconservation. Surrey Beatty and Sons, Chipping Norton,New South Wales, Australia.
Pulliam, H. R. 1988. Sources, sinks, and population regulation.American Naturalist 132:652–661.
Pulliam, H. R. 2000. On the relationship between niche anddistribution. Ecology Letters 3:349–361.
R Development Core Team. 2007. R: A language andenvironment for statistical computing. R Foundation forStatistical Computing, Vienna, Austria. hhttp://www.R-project.orgi
Reynolds, R. W., N. A. Rayner, T. M. Smith, D. C. Stokes, andW. Q. Wang. 2002. An improved in situ and satellite SSTanalysis for climate. Journal of Climate 15:1609–1625.
Roberson, C. J. R., and G. B. Nunn. 1998. Towards a newtaxonomy for albatrosses. Pages 13–19 in G. Robertson andR. Gales, editors. Albatross biology and conservation. SurreyBeatty and Sons, Chipping Norton, New South Wales,Australia.
Robertson, G., C. A. Moreno, K. Lawton, J. Arata, J.Valencia, and R. Kirkwood. 2007. An estimate of thepopulation sizes of black-browed (Thalassarche melanophrys)and grey-headed (T. chrysostoma) albatrosses breeding in theDiego Ramirez archipelago, Chile. Emu 107:239–244.
Robertson, G., C. Moreno, K. Lawton, R. Kirkwood, and J.Valencia. 2008. Comparing census methods for black-browedalbatrosses breeding at the Ildefonso Archipelago, Chile.Polar Biology 31:153–162.
Shaffer, S. A., D. P. Costa, and H. Weimerskirch. 2003.Foraging effort in relation to the constraints of reproductionin free-ranging albatrosses. Functional Ecology 17:66–74.
Simberloff, D., and T. Dayan. 1991. The guild concept and thestructure of ecological communities. Annual Review ofEcology and Systematics 22:115–143.
Spear, L. B., L. T. Ballance, and D. G. Ainley. 2001. Responseof seabirds to thermal boundaries in the tropical Pacific: thethermocline versus the Equatorial Front. Marine EcologyProgress Series 219:275–289.
Sullivan, B. J., T. A. Reid, and L. Bugoni. 2006. Seabirdmortality on factory trawlers in the Falkland Islands andbeyond. Biological Conservation 131:495–504.
Terauds, A., R. Gales, G. B. Baker, and R. Alderman. 2006a.Foraging areas of black-browed and grey-headed albatrossesbreeding on Macquarie Island in relation to marine protectedareas. Aquatic Conservation: Marine and Freshwater Eco-systems 16:133–146.
Terauds, A., M. D. Sumner, R. Gales, and R. Alderman. 2006b.Foraging areas of Macquarie Island black-browed and grey-headed albatrosses and their relationship with mesoscaleoceanographic features. Aquatic Conservation: Marine andFreshwater Ecosystems 16:133–146.
Thompson, K. R. 1992. Quantitative analysis of the use ofdiscards from squid trawlers by black-browed albatrossesDiomedea melanophris in the vicinity of the Falkland Islands.Ibis 134:11–21.
Tickell, W. L. N. 1975. The distribution of black-browed andgrey-headed albatrosses. Emu 76:64–68.
Tickell, W. L. N. 2000. Albatrosses. Pica Press, Sussex, UK.Tremblay, Y., S. Bertrand, R. W. Henry, M. A. Kappes, D. P.Costa, and S. A. Shaffer. 2009. A review of analyticalapproaches to investigate seabird-environment interactions.Marine Ecology Progress Series 391:153–163.
Turchin, P. 1998. Quantitative analysis of movement: measur-ing and modeling population redistribution in animals andplants. Sinauer Associates, Victoria, Australia.
Van Horne, B. 1983. Density as a misleading indicator ofhabitat quality. Journal of Wildlife Management 47:893–901.
Venables, W. N., and B. D. Ripley. 2002. Modern appliedstatistics with S. Fourth edition. Springer-Verlag, New York,New York, USA.
Vincent, C., B. J. McConnell, V. Ridoux, and M. A. Fedak.2002. Assessment of Argos location accuracy from satellitetags deployed on captive gray seals. Marine Mammal Science18:156–166.
Wakefield, E. D., R. A. Phillips, and J. Matthiopoulos. 2009a.Quantifying the habitat use and preference of pelagic seabirds
EWAN D. WAKEFIELD ET AL.166 Ecological MonographsVol. 81, No. 1

using individual movement data: a review. Marine EcologyProgress Series 391:165–182.
Wakefield, E. D., R. A. Phillips, J. Matthiopoulos, A. Fukuda,H. Higuchi, G. J. Marshall, and P. Trathan. 2009b. Windfield and sex constrain the flight speeds of central placeforaging albatrosses. Ecological Monographs 79:663–679.
Waluda, C. M., P. G. Rodhouse, P. N. Trathan, and G. J.Pierce. 2001. Remotely sensed mesoscale oceanography andthe distribution of Illex argentinus in the South Atlantic.Fisheries Oceanography 10:207–216.
Waugh, S., D. Filippi, A. Fukuda, M. Suzuki, H. Higuchi, A.Setiawan, and L. Davis. 2005. Foraging of royal albatrosses,Diomedea epomophora, from the Otago Peninsula and itsrelationships to fisheries. Canadian Journal of Fisheries andAquatic Sciences 62:1410–1421.
Waugh, S. M., H. Weimerskirch, Y. Cherel, U. Shankar, P. A.Prince, and P. M. Sagar. 1999. Exploitation of the marineenvironment by two sympatric albatrosses in the PacificSouthern Ocean. Marine Ecology Progress Series 177:243–254.
Weimerskirch, H. 2007. Are seabirds foraging for unpredictableresources? Deep-Sea Research Part II-Topical Studies inOceanography 54:211–223.
Weimerskirch, H., J. A. Bartle, P. Jouventin, and J. C. Stahl.1988. Foraging ranges and partitioning of feeding zones inthree species of southern albatrosses. Condor 90:214–219.
Weimerskirch, H., T. Guionnet, J. Martin, S. A. Shaffer, andD. P. Costa. 2000. Fast and fuel efficient? Optimal use ofwind by flying albatrosses. Proceedings of the Royal SocietyB 267:1869–1874.
Weimerskirch, H., T. Mougey, and X. Hindermeyer. 1997.Foraging and provisioning strategies of black-browedalbatrosses in relation to the requirements of the chick:natural variation and experimental study. Behavioral Ecol-ogy 8:635–643.
Weimerskirch, H., M. Salamolard, F. Sarrazin, and P.Jouventin. 1993. Foraging strategy of wandering albatrosses
through the breeding-season: a study using satellite telemetry.Auk 110:325–342.
Williams, C. T., S. J. Iverson, and C. L. Buck. 2008. Stableisotopes and fatty acid signatures reveal age- and stage-dependent foraging niches in tufted puffins. Marine EcologyProgress Series 363:287–298.
Wood, A. G., B. Naef-Daenzer, P. A. Prince, and J. P. Croxall.2000. Quantifying habitat use in satellite-tracked pelagicseabirds: application of kernel estimation to albatrosslocations. Journal of Avian Biology 31:278–286.
Wood, S. N. 2004. Stable and efficient multiple smoothingparameter estimation for generalized additive models.Journal of the American Statistical Association 99:673–686.
Wood, S. N. 2006. Generalized additive models: an introduc-tion with R. Chapman and Hall/CRC, Boca Raton, Florida,USA.
Woodward, R. H., and W. W. Gregg. 1998. An assessment ofSeaWiFS and MODIS ocean coverage. NASA/TM-1998-208607. NASA, Goddard Space Flight Center, Greenbelt,Maryland, USA.
Xavier, J. C., J. P. Croxall, and K. Reid. 2003. Interannualvariation in the diets of two albatross species breeding atSouth Georgia: implications for breeding performance. Ibis145:593–610.
Xavier, J. C., A. G. Wood, P. G. Rodhouse, and J. P. Croxall.2007. Interannual variations in cephalopod consumption byalbatrosses at South Georgia: implications for futurecommercial exploitation of cephalopods. Marine and Fresh-water Research 58:1136–1143.
Ydenberg, R. C., C. V. J. Welham, R. Schmidhempel, P.Schmidhempel, and G. Beauchamp. 1994. Time and energyconstraints and the relationships between currencies inforaging theory. Behavioral Ecology 5:28–34.
Yoder, J. A., C. R. McClain, G. C. Feldman, and W. E. Esaias.1993. Annual cycles of phytoplankton chlorophyll concen-trations in the global ocean: a satellite view. GlobalBiogeochemical Cycles 7:181–193.
APPENDIX A
Estimated breeding population and locations of all known Thalassarche melanophrys and T. impavida super-colonies (EcologicalArchives M081-007-A1).
APPENDIX B
Probability of the presence of Black-browed Albatrosses satellite-tracked from northwest South Georgia during incubation,predicted using the fixed effects part of model I, fitted to data from all populations and model III, fitted to data from northwestSouth Georgia alone (Ecological Archives M081-007-A2).
APPENDIX C
Remaining fixed-effects covariates retained in model II, fitted to spatial usage data from incubation-stage Black-browedAlbatrosses from northwest South Georgia, and model IV, fitted to data from post-brood-stage Campbell Albatrosses (EcologicalArchives M081-007-A3).
February 2011 167ALBATROSS DISTRIBUTION AND HABITAT