H4#fovi FOURTH SYMPOSIUM ON
184
VOLUME 62, NUMBER 3 JULY 1967 H4#fovi QUARTERLY OF THE COLORADO SCHOOL OF MINES FOURTH SYMPOSIUM ON OIL SHALE i
-
Upload
khangminh22 -
Category
Documents
-
view
3 -
download
0
Transcript of H4#fovi FOURTH SYMPOSIUM ON

VOLUME 62, NUMBER 3
JULY 1967
H4#fovi
QUARTERLY OF THE
COLORADO SCHOOL OF MINES
FOURTH SYMPOSIUM ON
OIL SHALE
i


JTotU
QUARTERLY OF THE
COLORADO SCHOOL OF MINES
Volume 62ju)y 1967 Number 3
FOURTH SYMPOSIUM
ON OIL SHALE
Price $4.00
Published quarterly at Golden, Colorado 80401.
Second-class postage paid at Golden,
Colorado.
Copyright 1967 by the Colorado School
ofMines. Printed in the United States Qrj0 g Childs
of America. Sherman W. Spear, Editor. President

SPONSORING ORGANIZATIONS
American Institute of Mining, Metallurgical and Petroleum Engineers Ad
Hoc Oil Shale Committee
Clifford J. Hicks
Assistant Secretary, AIME
W. F. Kieschnick, Jr. Chairman
The Atlantic Refining Company
E. H. Crabtree, Jr.
Colorado School of Mines Research Foundation, Inc.
John H. Ferry
Denver United States National Bank
Denver U.S. Center
James H. Gary
Colorado School ofMines
Bruce F .Grant
Sinclair Research, Inc.
George R. Hill
University of Utah
Raymond D. Sloan
Humble Oil and Refining Company
Colorado School ofMines
Orlo E. Childs, President
Colorado School ofMines Research Foundation, Inc.
E. H. Crabtree, Jr., Director
Symposium held April 6-7, 1967.

CONTENTS
Colorado School ofMines Oil Shale Symposium
John A. Love 1
The Oil Shale Industry'sWater Problems
Northcutt Ely 9
Impact of Dawsonite and Nacolite on Piceance Creek Basin Oil
Shale Economics
Walter E. Heinrich, Jr. 19
Abstract 19
Introduction 19
Responsibility of Government and Industry 20
Nacolite and Dawsonite Considerations 21
Development, Mining Methods and Costs 22
Conclusions 23
Potential Resources of Dawsonite and Nahcolite in the Piceance
Creek Basin. Northwest Colorado
Robert J. Hite and John R. Dyni 25
Abstract 25
Introduction 25
Geographic Setting 26
Stratigraphy 26
Structure 28
Dawsonite and Nahcolite Deposits . 29
Geochemistry 31
Economics 33
Summary 38
Alaskan Oil Shale
John R. Donnell, Irvin L. Tailleur, and Harry A. Tourtelot 39
Fracturing Oil Shale with Electricity
Noel M. Melton and Theodore S. Cross 45
Abstract 45
Introduction 45
Laboratory Experiments 46
Preliminary Studies 46
Fracturing Studies 46
Small-Scale Field Tests 49
Mine-Tunnel Experiments 49
Shallow-Well Experiment 52
III

Conclusions and Future Work 60
Explosive Fracturing Tested in Oil Shale
/. 5. Miller and W. D. Howell 63
Abstract 63
Introduction 63
Experimental Procedures 64
Evaluation of Results 71
Conclusions 72
The Characteristics of a Low Temperature In Situ Shale Oil
George Richard Hill and Paul Dougan 75
Abstract 75
Text 75
Shale Residue 81
Shale Oil Developments : Kinetics of Oil Shale Pyrolysis
V. Dean Allred 91
Unraveling the Kinetics 92
Components of Pryolysis 92
Material Balance 93
Experimental Techniques 93
Steady-State Considerations 94
True Conditions for Design 95
Time-Temperature Considerations 97
First-Order or Logistic Rate 99
Temperature Coefficient 99
Complex Reactions 102
Pyrolysis Mechanism 103
Conduction Heating of Oil Shale Formations
Herbert A. Lesser, George II. Bruce, and Herbert L. Stone 111
Abstract 111
Introduction 111
Model Description 112
Application of the Model 114
Description of Example Cases 114
Computational Results 116
Conclusions 120
Nomenclature 121
H-Oil Upgrading of Shale Oil Feeds
K. C. Hellwig, S. Feigelman, and S. B. Alpert 123
Introduction 123
Shale Oil Characteristics 123
H-Oil Process [ 124
Experimental Results 125
Economics 126
IV

Hydrotorting Use of Hydrogen for Improved Recovery of Shale Oil
Warren G. Schlinger and Dale R. Jesse ..133
Introduction 133
Background 133
Procedure 135
Discussion 137
Conclusions 140
Present Trends in Estonian-Russian Work on Oil Shale
Wladislaw J. Cieslewicz 141
Nature of Estonian Oil-Shale Deposits and Their
Commercial Exploitation 141
Current Oil Shale Research and Development Mining 143
Mining 144
Processing 145
Some Recent Russian Studies on Processing of Oil Shale 148
Pertinence of Russian Work and Experience with Oil Shale
to our Studies of Colorado Oil Shale 162
Biographies 167


COLORADO SCHOOL OF MINES OIL SHALE SYMPOSIUM
John A. Love
I welcome the opportunity to discuss with this distinguished group a
subject which is of such paramount importance to our nation and to the
State of Colorado.
At no time in the past has there been more unanimity among the private
and public sectors of our economy that the oil shale of Colorado, Utah, and
Wyoming will be needed to supplement our growing national energy require
ments. The years of preparation and the millions of dollars which you and
the organizations you represent have spent in research and other activities
are about to bear fruit.
We in Colorado welcome you and are prepared to assist in every way
possible in the development and growth of the oil shale, nahcolite, and
dawsonite industries.
Substantial research efforts by both private industry and the federal
government over the past 20 years have resulted in the development of a
large body of technology in mining, retorting, and refining of oil shale and
its products. Whatever the problem, you have been resourceful in findingthe solution. Today, we have a proven mining system available, with others
under consideration and study. Today, we have not one, but at least four
above-ground retorting processes at various stages of development. Today,
we have improving technology for converting shale oil to useful end-products.
In summary, today we have a body of experience available to produce shale
oil as a supplement to other existing sources of domestic liquid fuels.
It may be well to point out here that what we have been calling the "Oil
ShaleIndustry"
may turn out to be a very different one a multiple-minerals
industry. The United States is the world's largest consumer of aluminum and
an importer of 90 percent of its requirements. Needless to say, the occurrence
in Colorado of substantial deposits which can be developed as a source of
aluminum would be of great signficance to our nation's economy as well as
to the oil shale industry.
The answer to those who ask, "Is there a need for shale oil?", is Yes!
unless we are prepared to accept, within the next decade, the alternatives of
(1) reliance on external sources of energy vulnerable to the changes and
pressures of international political and military developments; (2) alteration
Governor, State of Colorado

2 Quarterly of the Colorado School of Mines
of our industrial and transportation base to accommodate less convenient
fuel sources ; or ( 3 ) the uncertainties of substitute energy sources.
In 1966, the United States imported approximately two and one-half
million barrels of oil, the bulk of which came from Venezuela and the Middle
Eastern countries. While it is important that we continue our friendly rela
tionships with these countries, both economic and strategic considerations
require that we not rely entirely on these sources.
In September 1963, President Kennedy requested the heads of nine
federal departments to undertake a comprehensive study of "the development
and utilization of our total energy resources to aid in determining the most
effective allocation of our research and developmentresources."
This inter
departmental study resulted in a report entitled, Energy R&D and National
Progress, known as the Cambel Report. In a summary memorandum of this
report produced by the interdepartmental Steering Committee in 1966, we
note that the cumulative projection of energy requirements for the period
1960 to 2000 is estimated at 3.2 quintillion BTU's. The requirement for
liquid hydrocarbons (petroleum products) is 1.4 quintillion BTU's, or 46
percent of the total. Yet, for the same report, known reserves of crude oil
and natural gas liquids recoverable by primary and secondary recovery
methods under present economic and technological conditions are equal to
only .3 quintillion BTU's, or 2 percent of the requirement for this forty-year
period.
Of course, no one questions that we will continue to add to our petroleum
stocks by continued exploration for and development of conventional re
sources. The only questions are, at what cost and at what rate?
Oil shale, as a source of these liquid hydrocarbons, must compete with
new discoveries of petroleum, tar sands, and coal to meet these increased
demands. Liquid fuels, in spite of their convenience and acceptance in our
present society, must compete with other energy sources coal, gas, hydro
electric, nuclear and solar. We are fortunate to have so many alternatives.
In my opinion, all will be needed, all will be developed and this will be
done without dislocation of our economy, unless we delay too long; and in
this connection, I would urge that the Department of Interior note with care
the measures adopted by the Canadian government to encourage the development of the tar sands industries.
It is a paradox that our government has spent billions of dollars in the
development of other energy resources, while at the same time pursuing a
policy of frustration and delay in dealing with the oil shale industry.
One of the most encouraging developments of the last year has been
Secretary Udall's recently announced Five-Point Program because it reflects
an increased awareness on the part of the present administration of the im-

Oil Shale Symposium 3
portance of oil shale and associated minerals to the nation's economy and
the need for action in encouraging rather than discouraging their development.
We are not only pleased by the various elements of the program itself,but are gratified by the stated objectives of the program which the Secretary
enumerated in his testimony before the Senate Committee on Interior and
Insular Affairs on February 21 of this year. In emphasizing certain goals,
Mr. Udall made several significant statements of policy which evidence a
sound, overall philosophy. I quote as follows.
1. "The central core of this effort to get oil shale into the main
stream of the American economy is aimed directly at development of the
resource itself. . .
2. "Our objective is to get the broadest kind of industrial participa
tion, either through a number of individual companies or through
joint venturers. . .
3. "Heavy emphasis will also be placed on maximum recovery and
development of all the minerals present sodium and aluminum as
well as oil shale.
4. "We will take particular care to secure and evaluate the voices of
the three states involved, since we are acutelv aware that they have a deepinterest in the subject and that their cooperation is essential to the adoption
of total conservation"
In connection with the last stated objective, vou will be interested to
know that on May 4. 1967. I. together with the Governors of our sister states
Wyoming and Utah, plan to meet with Secretary Udall to discuss other
measures in addition to his Five-Point Program which will aid in forwardingoil shale, nahcolite, and dawsonite development.
Before turning to these additional measures, I would like to comment
in passing on one phase of the Secretary's research program and two aspects
of Interior's recent handling of these resources.
While we are always interested in scientific research in areas calculated
to stimulate the economy of Colorado and to preserve its natural beauties,
we would caution against too much reliance on the successful outcome of
experiments in in situ production through atomic explosions. It is never
sound to rely solely or primarily on one line of attack, particularly an
experimental one, to the detriment of established techniques. We do not
believe that attention to this in situ effort should be permitted to divert
energies from large-scale development by underground or other mining
techniques already known to be feasible. The effect of such an explosion upon
nahcolite and the aluminum compounds creates additional complexities to
the problem of sustaining combustion of underground solids. In this con-

4 Quarterly of the Colorado School of Mines
nection. I can think of no more suitable project for the Colorado School of
Mines Research Foundation facilities at Anvil Points than an interim, scaled-
up experiment in in situ production to bridge the gap between the bench
experiments of the Bureau of Mines at Laramie and the proposed Bronco
experiment.
There is another subject to which I, as a lawyer as well as the Governor
of one of the nation's great mining states, must direct your attention. Duringthe past several months Department of Interior officials have devoted con
siderable time and space to their views of the responsibilities of the Depart
ment in the administration of mining laws. There is no question of the role
of department officials as trustees of the nation's resources, but I would add
that these fiduciary obligations also extend to that portion of the public
which is entitled to rely upon the assumption that proper administration of
the mining laws must have as its objective the carrying out of Congressional
intent.
The rights and obligations of the Government and mining claimants have
long been defined by statute and court interpretation. The policies behind
the mining laws have stood for more than 95 years. The intent of Congress
to vest in the prospector who made a valuable discovery and perfected his
claim through appropriate location procedures an interest in real estate which
is taxable and inheritable and as fully transferrable as any other interest in
real estate, is beyond question. It is apparently the view of some individuals
in the Department that these laws and the policies behind them are now ana
chronisms; and that an executive agency has the right, without the sanction
of Congress, to place upon these laws which have been well understood by the
industry and by the public, new interpretations tending to vest in the Federal
Government the role of prosecutor rather than administrator. Such a view,
I submit, is inimical to the development of our country and inconsistent with
our basic concepts of government.
While I recognize that changes in the mining laws are inevitable, and
even desirable, and look forward to the recommendations of the Public Land
Law Review Commission for future action in this area, I cannot agree that
it is the function of the Department of Interior to legislate. If there is dis
satisfaction with the laws under which the Department is charged, then the
forum is Congress and there should be presented to that body reasons for and
suggested changes in the laws now governing these matters. It is only when
we recognize and respect the separate prerogatives of the Legislative, the
Judicial, and the Administrative branches of Government that we can go
forward to meaningful and constructive solutions of the complex problems
which confront us.
Oil Shale Symposium 5
The Department complains that a vast area of land which should be
available for leasing under the Leasing Act of 1920 has now been cluttered
with unpatented dawnsonite mining claims. These claims now confront the
Government with gigantic expenditures of time and effort to test their validity.
While I recognize the magnitude of the problem and sympathize with the
Department of Interior, let us place the responsibility where it belongs. It
was the Department of Interior which first learned of the existence of daw
sonite and which first released to the public information which led to the
staking of the claims in question a result highly predictable in view of the
conduct of the American public in past similar situations. Had the Depart
ment acted promptly in anticipation of what was likely to result from its own
disclosures, it could have, by a timely withdrawal of these lands and a prompt
classification of the minerals discovered, prevented a tremendous expenditure
of effort and avoided the confusion now confronting both government and
industry.
It is not my intent here to engage in destructive criticism by these com
ments, but rather to point out that the public is entitled to prompt and re
sponsive administrative action and that undue delay tends to increase rather
than diminish the complexities of the Department's problems.
There are at least four steps, in addition to those proposed by Secretary
Udall, which could and should be taken to get oil shale into the mainstream of
our economy. Two require action by the Federal Government.
1. Depletion Allowance.
The Treasury Department should eliminate the discriminatory tax treat
ment against oil shale which now exists because of administrative interpreta
tions of those portions of the Internal Revenue Code dealing with the deple
tion allowance.
The Internal Revenue Service has taken the position that under the
Federal Tax Law the depletion rate applicable to oil shale is limited to 15
percent. The Treasury Department has indicated it will apply the rate to
the value of mined and crushed shale rock rather than to the value of the first
oil produced at the retort. Approximately one-half the costs of production
of the initial oil product are those costs related to mining and crushing. Thus,
the value of the mined and crushed rock would be approximately half the
value of the oil. Applying the 15 percent rate to the crushed material, therefore
has the anomalous result of reducing the depletion allowance for oil shale to
15 percent of one-half the value of the extracted crude oil. If the proposed
depletion treatment of oil shale as a petroleum source is compared to the
treatment of conventional petroleum, or if shale oil that is mined and retorted

6 Quarterly of the Colorado School of Mines
is compared to shale oil produced by in situ retorting techniques, the in
equity of such a program becomes apparent.
The questionable, if not unreasonable, situation, which I have pointed
out, is clear to the executive departments concerned. Corrective measures
can and should be undertaken now by the proper policy revisions. The time
for a reformed and progressive policy has arrived. Shale oil should be given
an opportunity to compete in the marketplace. Competitive discrimination
in the tax laws against one type of petroleum production ought to be
promptly eliminated.
2. Oil Import Regulations.
As a second and very important step, the Federal Government should
clarify its policy dealing with the qualification of shale crude oil as a re
finery input for purposes of impart quota allocation. The present import
regulations are unclear as to whether domestic shale crude oil will be treated
as a qualified refinery input like all other domestic crude production. The
uncertainties created by such hazy regulatory language should be removed.
The primary objective of the import quota system to maintain a vigorous
domestic petroleum industry would be seriously jeopardized without the
necessary corrective action.
There are two other areas which can and should be appropriately dealt
with primarily at the state level. Your state government is not only aware
of these important problem areas but is prepared to move ahead with con
structive programs in each one.
1. Water Resources.
First, the State of Colorado, in cooperation with the Federal Government,
can contribute meaningfully to the development of oil shale in water resource
planning and development. I have noted with dismay the Secretary's latest
plan for the Colorado River Basin, which defers the West Divide Project and
others important to Colorado. We intend to press for an immediate authoriza
tion of the West Divide Project. In the White River Basin the feasibility re
port on the Yellow Jacket Project is now almost completed. This would be a
major project to provide industrial water supplies in that area. Under a co
operative venture with the United States Geological Survey, we are now
bringing to completion a survey of the ground water resources of the
Piceance Basin.
I have asked the legislature for an appropriation, part of which will be
used to fund a study of water resource development specifically designed to
meet the needs of the oil shale, nahcolite, and dawsonite industries and to
devise a plan for the supply of water for the development of these resources
through the Colorado River Water Conservation District, or such other local

Oil Shale Symposium 7
quasi-municipal authority as may be appropriate, in cooperation with the
Bureau of Reclamation and private industries.
2. Conservation.
Second, the imminent development. of an industry on privately owned
and federally held lands in Colorado requires immediate attention to and
planning for resource conservation and the abatement and prevention of
air and water pollution. Colorado has taken a position of strong leadershipin these fields and we will continue to discharge our responsibilities at the
local level where the problems are and where the people affected reside.
Sound conservation practices require that maximum economic value be
recovered from the shale and that the residue be left in such condition that it
will not be a nuisance to those who reside in the area or who depend on the
water from the streams that flow through the area for life and livelihood.
This applies whether the shale is processed in a surface plant or by in situ
operations and whether underground or strip mining is involved.
There is a community of interest in the problem of spent shale disposal
between the land holders, both private and federal, and the citizens of the
State. If we work together in solving these problems, I am confident that
criteria and methods acceptable to all concerned will be quickly found.
In this connection, I am prepared to request a substantial appropriation
from the State Legislature to be used for studying the problems and for
developing proposals for research projects in the field of spent shale disposal.
With this seed money available, we will be able to identify the problem areas ;
to determine what research programs are necessary: and to prepare detailed
proposals for such programs.
In conducting the research and development programs which will stem
from these proposals, we would expect and will seek the support of both
industry and the Federal Government. I note with interest that the Depart
ment of Interior, in the proposed oil shale resource development program an
nounced in February of this year, estimates that 3.5 million will have to be
expended over a 10-year period in research on the "Impact of an Oil Shale
Industry on theEnvironment.*'
Our great private and state universities, with
their affiliated institutions for the conduct of research and development, are
eminently qualified for conducting research relating to spent shale dis
posal, prevention of stream and air pollution from this source, and other
attendant problems.
In closing, I will summarize by saying that if we at state and federal
administrative levels will address ourselves promptly to eliminating the
iniquities of federal depletion policy and the uncertainties of import regula
tions, to assuring ourselves of an adequate and orderly water supply and

8 Quarterly of the Colorado School of Mines
to the conserving of our resources, I am confident that industry is prepared
to furnish the technology and capital necessary to press to fruition the
promise of oil shale and its associated minerals.

THE OIL SHALE INDUSTRY'S WATER PROBLEMS
Northcutt Ely
I have been invited to talk to you today about the water supply problems
which will confront the oil shale industry as it develops in the states of Colo
rado, Utah, and Wyoming. The invitation came to me because these three
states are in the Colorado River Basin, and the problem of finding a water
supply will bring this new industry into contact with the mysteries of several
compacts, statutes, and treaties. These have the effect of restricting the
quantity of water available for consumptive use in those states to a sub
stantially smaller quantity than that physically available. This interstate
problem is the one to which I shall give primary attention today. But first
let us put the problem in perspective against its background.
Many of us, myself included, had not realized the magnitude of the
future water demands of the oil shale industry until Raymond D. Sloan of
Humble Oil and Refining Company made a speech on this subject at a meet
ing of the Colorado River Water Users Association in Las Vegas in Decem
ber 1965. A little later, C. E. Reistle, Jr., Chairman of the Board of Humble,
in a speech to the American Institute of Mining, Metallurgical and Petroleum
Engineers,1and Mr. Sloan, in another
paper,2
stated the supply and demand
equation for shale oil quite graphically. As this equation really controls the
potential demand for water for this new industry, let me take just a moment
to review this forecast.
On the demand side, the energy requirements of the United States are in
creasing at a rate which doubles them every 20 to 25 years. On the supply
side, natural gas and petroleum are currently supplying 70 percent of our
energy, compared with 55 percent in 1950. The United States is con
suming 11 million barrels of petroleum products per day, and this is ex
pected to increase to 18 million barrels daily by 1980. To meet this demand,
the oil industry must develop reserves on the order of 89 billion barrels by1985. This is almost three times the existing known domestic reserve of 31
billion barrels. If we do not succeed in this, we will become primarily
dependent on importations. This total of required reserves, to be achieved in
less than 20 years, represents more liquid energy than the United States has
consumed in the past 100 years. Even after taking into account various
offsetting factors, such as the likelihood of increases in drilling costs and
Ely and Duncan, Washington, D.C.

10 Quarterly of the Colorado School of Mines
the law of diminishing returns on discovering significant new oil and gas
fields, and, on the other hand, the probability that nuclear energy and other
new sources will supply an increasing share of the total demand, the con
clusion nevertheless appears inescapable: Synthetic liquid fuels will become
a major domestic source of energy well within twodecades.
In this frame of reference, the statistics of the domestic oil shale reserves
are impressive indeed . The Nation's oil shale covers about 16,500 square
miles in northwestern Colorado, the Uinta Basin in northeastern Utah, and
the Green River Basin of southwestern Wyoming. Let us put to one side the
estimates of total oil content in place, which are astronomical. Let us re
strict the estimate to the richer portion of the shales in Colorado, which
average 25 gallons of oil per ton. Let us further restrict the estimates to
take into account only the presently known technology of mining, retorting,
and upgrading. The estimate of the recoverable reserve in Colorado, re
stricted in this fashion, is 280 billion barrels of oil. This is nearly 10 times
our presently known domestic reserve of liquid petroleum.
Getting the oil out of the shale at prices competitive with other sources
of energy is another matter. I can contribute nothing on that subject to this
audience, compared with what I shall learn from you. But I accept as a
premise the forecast of the experts that we can expect production of oil from
shale at competitive costs on a large scale in the early 1970's, and that this will
amount to at least 2 million barrels daily in the 1980's. This will be about
10 percent of the total domestic oil production projected for that time.
The resulting water problems, as is generally the case, fall into two cate
gories, quantity and quality.
As to quantity, Mr. Sloan has estimated that the production of two
million barrel of oil a day from oil shale will require the consumption of
about 1.2 times that amount of water in processing, retorting, and upgrading.
This works out to about 112,000 acre-feet per year. If the oil is refined local
ly, this requirement will increase to 200,000 acre-feet annually. If in situ
methods of retorting were used, this total quantity might be more than
doubled. And these are only the direct uses of the industry. In addition, the
population and related activities which will grow up around the new industrywill consume large quantities of water. Assuming an associated population of
500,000 to 1 million, as much as 200,000 acre-feet annually of indirect
uses must be added. We are thus dealing with a total water requirement of
the general order of 500,000 acre-feet, stated in terms of consumptive use.
Considerably more water than this must be diverted, since consumptive use,
by definition, is the difference between the quantity diverted and the
quantity returned to the stream. This demand will mature well before the
turn of the century. It will, therefore, coincide with the predicted onset of

The Oil Shale Industry's Water Problems 11
basin-wide water shortages, to which I will refer in a moment. This time
of troubles is forecast for about the last decade of the present century.
Moreover, the question of quality is involved. The return flow of effluent
from oil shale operations must necessarily be of much lower quality than the
water diverted. This pollution can reach serious proportions if atomic
blasting is used in preparation for in situ retorting. Many of the acquifers in
this area carry a high sodium content, I am told, and this might be rendered
radioactive. It is being suggested that the alumina content of the oil shale
rocks, carried as dawsonite. and the sodium content, found as nahcolite, be
mined and processed in some sort of combination with the recovery of the
oil from the shale. Some of the proposed processes for the recovery of as
sociated minerals involve leaching, thus adding to the water contamination
problem. The states of the Colorado River Basin have agreed on an ap
portionment of the water among them in terms of quantity, as I will explain
in a moment, but they are still struggling to arrive at an agreement on the
allocation of the pollution absorption capability of the Colorado River system.
The Secretary of the Interior has final authority to prescribe water quality
standards, under recent legislation.
The quality of the water which is now being diverted from the Colorado
River for use in Los Angeles, San Diego, and other Lower Basin cities
carries more than 700 parts per million of salts, which is 200 parts worse
than the Public Health Service standards for drinking water. This is destined
to grow to 1,000 parts per million, we are told, quite aside from any con
sideration of the adverse impact of the oil shale industry on water quality.
In addition, we have been having quality problems with Mexico. That na
tion is increasingly restless about the quality of water reaching it for irriga
tion in the delta. This has reached a salt concentration approaching 2,000
parts per million, has leveled off now at about 1,400, but is destined to be
come worse as more water is consumed upstream without reduction is the
total weight of the solid content returned to the stream.
I now turn to the problem of quantity and the limitations on supply
imposed by the various interstate and international agreements. I have said
that the oil shale industry, with its dependent population and associated new
industries, can be expected to consume roughly a half million acre-feet of
water a year, on a conservative forecast. This will require a diversion of a
greater quantity, perhaps a total of 750,000, assuming that a third of the
quantity diverted returns to the stream. The finding of water for a new de
mand of this magnitude in this particular area presents some fascinating,
although by no means insuperable, problems.
It is quite probable that most companies seeking a water supply for oil
shale development regard this as simply a problem of either appropriating

12 Quarterly of the Colorado School of Mines
water under the laws of Colorado, Utah, or Wyoming, or of buying existing
water rights. This, of course, is the first and essential step, to acquire water
rights which are recognized by the laws of the state in which the water is to
be used, but the problem is not quite that simple.
The great hazard to the availability of an adequate supply of water for
oil shale development rests in the mortgages which the states of origin of this
water have assumed in their various interstate compacts and which the
United States has assumed in its treaty with Mexico. These have the effect of
drastically limiting the quantity of water ultimately available for use in
Colorado, New Mexico, Utah, andWyoming.
The most extreme example of this interstate problem is Colorado.
This deserves particular examination in view of the fact that the richest of
the oil shale reserves appear to be in the Piceance Basin, which is within the
watershed of the White River in that state. This is one of the five streams
originating in the State of Colorado which flow into the river of that name
and on down to the Lower Basin and Mexico.
Colorado's over-all situation is this: Over 11,000,000 acre-feet annually
of the water supply of the Colorado River System originates in the state
of Colorado. But about 8 million acre-feet of this apparently abundant
supply must ultimately flow out of the state in discharge of compact and
treaty commitments to downstream users. Some of these obligations are
stated in fixed quantities of acre-feet, some in percentages. The effect, when
these percentage commitments are reckoned against the total water supply
predicted by most experts, is that less than 3,000,000 acre-feet, less than 25
percent of the 11 million which the state produces, can be permanently
used in Colorado. More than 75 percent must ultimately flow out of the
state. This burden is expected to fully mature well before the end of this
century, at about the time when the new oil shale industry's demand for
water is itself maturing on a large scale. Let us see how this has come about.
Three commitments limit the use of water in the four Upper Basin States.
In chronological order these are the Colorado River Compact, to which these
States and the Lower Basin States of Arizona, California, and Nevada are
parties, the Mexican Water Treaty, and the Upper Colorado River Basin
Compact. Collectively, they are referred to as the "law of theRiver,"
along
with several Supreme Court opinions.
The Colorado River Compact was signed is 1922. It is an agreement al
locating rights and obligations between the Upper Basin and Lower Basin
as blocks. The division point between the two basins is Lee's Ferry, in
northeastern Arizona. The Compact does not allocate water to individual
states. It purports I use that word for reasons which will appear to ap
portion to the Upper Basin and to the Lower Basin, each, the consumptive

The Oil Shale Industry's Water Problems 13
use of 7.5 million acre-feet annually. It permits the Lower Basin to increase
its use by an additional one million. The uses so apportioned or allocated
include, by definition, the uses of the waters of the tributaries. Mexico was
to be supplied first out of the water surplus to those required to satisfy these
quantities of consumptive use. If that surplus was insufficient, each basin
was to contribute one-half of the deficiency. The four Upper States promised
not to deplete the flow at Lee's Ferry below an aggregate of 75 million acre-
feet in each ten year period and agreed to add to this their half of the
Mexican deficiency, if any. It is thus apparent that the negotiators thought
that the resource, after supplying the Mexican obligation (which at that
time was not yet fixed), could support 16 million acre-feet of consumptive
use in the United States. Just how much of this was expected to be satisfied
from Lower Basin tributaries was never very clear, and the subject has been
greatly clouded by later Supreme Court opinions.
In 1922 the Compact negotiators assumed that the flow at Lee's Ferrywould average in a state of nature at least 18 million acre-feet. But we now
know that the average of the so-called virgin flow at Lee's Ferry, the supply
which would be available in the absence of all Upper Basin depletions, has
averaged not over 15 million for the 60-year period for which records or
estimates are now available. For the 45-year period since the Compact was
signed, it is about 14 million. For the most recent 30 years, it is not much
over 13 million.
Compare these statistics with the Compact's arithmetic. Subtract the
Upper Basin's Lee's Ferry mortgage of 75 million acre-feet per decade,
equated to 7.5 million per year, from any one of the three supply figures
that I have just given. If the whole supply is only 13 million, the Upper
Basin residue is 5.5: if 14 million, it is 6.5; if 15 million, it is 7.5. The
Upper Basin States have recently agreed among themselves, based on a
joint hydrologic investigation, that the residue that they can depend on is
an intermediate figure of about 6.2 millionacre-feet,3
available for the four
Upper States, exclusive of Arizona's small share. This includes reservoir
evaporation of about 700,000 acre-feet, leaving a net supply available for
consumptive use of about 5.5 million acre-feet, measured at site of use.
However, this assumes that the Upper Basin will not have to deliver ad
ditional water to help satisfy Mexico. The Mexican Water Treaty, ratified
in 1945, obligates the United States to deliver 1.5 million acre-feet annually
at the border. Evaporation losses between Lee's Ferry and the border, and
unavoidable over-deliveries to Mexico, raise the Mexican burden to the
equivalent at Lee's Ferry of about 1.8 million acre-feet annually. The
Upper States claim, and the Lower States deny, that under the terms of the
Colorado River Compact the Lower Basin tributaries can and shouldcon-
14 Quarterly of the Colorado School of Mines
tribute to this burden to an extent which relieves the Upper Basin of any
obligation to deliver additional water at Lee's Ferry for Mexico. If the
Lower Basin position were sustained, the 6.2 million acre-foot residue on
which the Upper States are counting would shrink to about 5.5 million, but
as 700,000 acre-feet of this must be lost in reservoir evaporation, the residue
available for consumptive use would be about 4.8 million at site of use.
To digress a moment, the situation in the Lower Basin is just as bleak.
If the Upper Basin contention about the Treaty burden prevails, and the
whole inflow to be counted on at Lee's Ferry is only 75 million acre-feet
per decade or 7.5 million per year, then only about 5 million of that can
be used from the mainstream in Arizona, California, and Nevada. This is
because 1.5 million must flow on to Mexico, and another million is lost in
transit by evaporation over and above all contributions by Lower Basin
tributaries.
Now to the last of these interstate agreements, the Upper Colorado
River Basin Compact. This agreement, made in 1948, gives Arizona 50,000
acre-feet, and divides the residue, whatever it may be, on a percentage basis :
Colorado 51.75 percent, New Mexico 11.25 percent, Utah 23 percent, Wyo
ming 14 percent.
To take Colorado as the major example, the application of its ratio of
51.75 percent to the residue available for consumption at site of use would
produce a figure in the range between about 2.5 and 2.9 million acre-feet, the
differences in these quantities being due entirely to the difference in legal
assumptions as to the Upper Basin's Mexican Treaty obligation.
Substantially all of Colorado's dependable supply is, or soon will be,
committed. The State's Water Conservation Board has tabulated Colorado's
"present, authorized, andcommitted"
projects as capable of consuming
about 2.4 million acre-feet. Projects now pending in Congress would bringthis up to about 2.7 million, measured at site of use. Of this, about 150,000
acre-feet can be identified with oil shale development. If no other projects
were authorized, a demand of 2.7 million could be satisfied with a margin
to spare of about 200,00 acre-feet, if the favorable assumption is made
about the Treaty burden, but would create a deficit of about 200,000, if the
Treaty question were answered adversely. Other projects not yet authorized
or committed, but in various stages of planning, would add about 500,000
acre-feet to the demand, but there is no long-term supply now available for
them. These include about 100,000 acre-feet earmarked for oil shale
development.
Let us transpose these factors to the White River Basin, which encom
passes the richest of the known oil shale reserves in the Piceance Basin.

The Oil Shale Industry's Water Problems 15
Five major streams flow out of Colorado into other Colorado River
Basin States, en route to Lee's Ferry. These, from north to south, are the
Green, which receives the Yampa just before leaving Colorado; the White,
which joins the Green in Utah: the Colorado; the Dolores: and the San
Juan ( a river which, during its passage through New Mexico, receives a
half-dozen streams which originate in Colorado, then itself enters Colorado
and flows a very short distance across the State's southwest corner before
entering Utah) .
The two Compacts. Colorado River and Upper Basin, are both silent as
to which streams must bear the burden of curtailment of use in Colorado to
supply Colorado's neighbors. As to the White River, figures furnished bythe State show a "virgin
production"
of 610,000 acre-feet annually, a present
consumptive use of 35,000 and "remaining State Lineflow"
of 575,000
acre-feet. But if the White is to bear the same proportionate burden of
supplying the guaranteed flow at Lee's Ferry as Colorado's streams as a
whole must bear (77 percent), then, of the White's total "virginproduction"
of 610,000 acre-feet, only 23 percent, or about 140,000, is permanently
available for use in Colorado. Existing appropriations add up to more than
that. This is aside from any local interstate contests between water users in
Utah, particularly the Ute Indians, and the oil shale industry using White
River water in Colorado.
The problem of how to allocate the State of Colorado's Compact burdens
among that State's streams has not been thought through by anyone as
yet, so far as I know. The Upper Basin Compact authorizes an interstate
commission to make findings of supply and projected depletions, but this
has not been done.
It will be many years before the Compact"ceiling"
becomes critical.
One respectable estimate by the State is the year 2000. Others say later,
some say earlier. But collision is inevitable between the total demand, ampli
fied by the oil shale industry, and the compact-restricted supply. The question
is simply one of time.
This prospect has prompted Colorado to join California and Arizona
in seeking importations into the Colorado from other watersheds. Legislation
proposed by Chairman Aspinall of the House Interior and Insular Affairs
Committee provides that whenever 2.5 million acre-feet annually is imported,
this will relieve both basins of the Treaty burden. In such event, even though
this importation would come into the river below Lee's Ferry, the Upper
Basin supply would be relieved of about 900,000 acre-feet of the potential
Treaty obligation, and Colorado's by 51.75 percent of this, or about 460,000
acre-feet. Hopefully, this will occur well before the 2000. Other features of

16 Quarterly of the Colorado School of Mines
the bill contemplate the ultimate importation of an additional 2,000,000
acre-feet for the account of the Upper Basin, but this is a long way off.
The conclusion from this discussion of the water budget can be sum
marized in this way :
First, as to demand. An oil shale industry producing 2 million barrels of
oil daily can be expected to require each year the diversion of about 750,000
acre-feet, for direct use plus use by the population and affiliated industries
which oil shale development will add to the economy of the Upper Colorado
River Basin. Of this, about 500,000 would be consumed and say 250,000
returned to the river. This return flow, as in all cases of return flow every
where, will carry with it some degree of contamination. Such pollution
could create a serious problem, locally and interstate. To the extent that it
reduces the usability of the river downstream, the impairment may con
ceivably be characterized as an additional consumptive use, but this is in a
sensitive and unsettled legal area.
Second, as to supply. The total lawfully usable supply in the Upper
Basin is a good deal less than the total visible supply. This is due to inter
state commitments to downstream users. The effect, particularly in Colorado,
is that there is not enough uncommitted water available for use in the state of
origin to supply the anticipated water requirements of the oil shale industry,
and these requirements must be met in large part by the purchase of existing
water rights, perhaps reducing the State's agricultural economy in some
degree as a partial offset to the benefits to be derived from the new industry.
The ultimate remedy, which may well come about, is the importation of
several million acre-feet annually into the Colorado River Basin from other
watersheds.
Third, as to timing. If the foregoing analysis of supply and demand is
even approximately correct, the time of water supply troubles will be the
last two decades of this century, which coincides with the anticipated period
of vigorous growth of the oil shale industry. It is high time for those interest
ed in the development of an oil shale industry to bring their needs much
more actively to the attention of the Bureau of Reclamation and the States
concerned. So far, oil shale water requirements have been a vague subject,
recognized in words but not in figures in the planning of the region's water
budget. When water projects are once built, decisions become literally set
in cement and steel. The oil shale industry ought to make its needs known
in the planning of the region's water supply structure, rather than in its
subsequent remodeling. The reshaping of an economy which is based on
already existing uses of waters is an expensive and sometimes tragic business.

The Oil Shale Industry's Water Problems 17
REFERENCES
1 C. E. Reistle, Jr., "Shale Oil: From Potential toProduction,"
before the 95th
annual meeting, A.I.M.E., New York, March 1, 1966.
2Raymond D. Sloan, "The Future of ShaleOil,"
a paper presented to the Petroleum
Accountants Society of Houston, December 8, 1966.
3See report of Royce J. Tipton of Tipton and Kalmbach, Inc., engineers, Denver,Colorado, to the Upper Colorado River Commission, reprinted in Hearings of the
Committe on Interior and Insular Affairs (Subcommittee on Irrigation and Recla
mation) on H.R. 4671, 89th Cong., 1st Sess., p. 512 (1965). See also colloquy
between Chairman Aspinall and Governor Love of Colorado in hearings of the same
Committee March 17, 1967 (transcript, p. 718, et seq.) .


IMPACT OF DAWSONITE AND NACOLITE
ON
PICEANCE CREEK BASIN OIL SHALE ECONOMICS
Walter E. Heinrichs, Jr.
ABSTRACT
Recent identification of major quantities of dawsonite and nacolite oil
shale in the Green River Formation of the Piceance Creek Basin, may have
crucial effect on local oil shale development. The total resource potential
has been vastly increased and thus the ultimate importance of early conserva
tive exploitation becomes even more essential.
It is incumbent upon government and industry to cooperate on ways and
means to immediately initiate long range programs and begin testing various
development methods. It will take the combined know-how of both groups,
under a climate of healthy private enterprise incentives and competition to
gain maximum public benefit. If this is not done soon, the tremendous value
to our economy will soon pass and the opportunity to apply it toward im
proving our own living standard and that of others will be lost forever.
INTRODUCTION
Another year and here we commiserate again on the status of the oil
shale industry. What progress was made during the past year? How do we
stand now? What does the future portend? What facts are available and
what is rank speculation? Based on some stale experience but mostly on a
rather recently crammed birdseye background, and at the risk of contradic
tion by the more constant experts, I want to outline the salient factors as I
see them.
For over a year, my company has been retained by Mr. Joe Juhan to
make certain preliminary studies regarding the association of low grade soda
ash and aluminum ores with the oil shale in the Piceance Basin. Other facili
ties and personnel at the University of Arizona contributed substantially, in
particular Dr. John Anthony, who made extensive mineralogical examination
of continuous drill core of the pertinent section from Mr. Juhan's well located
near the center of the basin.
Seemingly the oil shale record is almost drowned in technical literature,
studies, and re-studies dating back to 1920 and older. Although progress
President and General Manager, Heinrichs Geoexploration Company, Tucson
Arizona.
19

20 Quarterly of the Colorado School of Mines
has been made each time, there are still important diverging opinions. Finally,
now there may be more room for compromise and action.
Everyone agrees we are dealing with a resource potentially of major
geo-political magnitude, but this potential will not last forever. If we are to
benefit most constructively from this resource, we must move now, regardless
of necessary compromise. History and common sense inevitably tie the
health of society to raw material production. No better example exists than
our own case since 1850, Canada since 1940, and Australia since 1960, as a
more recent example.
Certainly it is unfortunate that our best decisions too often do not meet
the test of mass popularity, and here, of course, is the root to much of our
present ecological conflict. Policy of our Interior Department can have pro
found effect on these matters; however Interior is not part of Congress and
should not operate on a Gallup Poll basis. Culmination of today's gravest
mineral land problems are exemplified in our present oil shale situation.
These are largely the result of mutual non-feasance, short sightedness, and
past expediencies of both government and industry.
Surely by now this nation has the technical knowledge, leadership, and
foresight to forge broad, firm, and equitable policies for the urgent needs of
long-range development and orderly and increased production of our vital
domestic mineral resources. Perhaps, the occurrence of other minerals besides
oil will be the catalyst to help get adequate policy shaped and shale-oil
development started.
RESPONSIBILITY OF GOVERNMENT AND INDUSTRY
To some, the ideal industry is totally invisible, odorless, soundless, with
no waste product, and one hundred percent conserving. As yet, this is neither
feasible nor practical. On the other hand, aside from simple self-preserva
tion, we are morally committed to increasing living standards, fighting
poverty, reducing our financial deficit, defending our nation, and continually
taking care of the general welfare of more and more people. Obviously, this
requires constantly increasing domestic production of everything. Really,
we have very little choice except to do the job as wisely as possible and with
out needless waste and destruction.
Fortunately, ancillary factors for the establishment of a viable major
new basic industry are favorable in the Piceance Basin. These include un
usual compatibility with modern concepts of population and industrial dis
persion, multiple use conflict, conservation, anti-pollution, and reclamation.
Important agricultural potential, including timber, is minimum or nil, as
would also be the effect on existing wildlife, and no exceptional scenic
wonder is involved. The natural basin configuration, with proper added
Impact of Dawsonite and Nacolite 21
safeguards, such as small dams and other minor features, will control anypotential groundwater or stream pollution. Much of the water used would
be recycled. Any potential air pollution certainly can also be effectively
controlled.
Some worry is expressed regarding so called windfall profits. Consideringthe magnitude of capital required, the extreme nature of the risks involved,and the length of time until payout, this is totally unrealistic. If private enter
prise competition is encouraged, then profit will only be proportional to maxi
mum conservation and production efficiency, with market control and the
real benefits going to the ultimate consumer, the public. Naturally the effects
on established industries and on foreign economy and imports must be con
sidered, but so should all the other rapidly changing domestic and interna
tional factors. As a nation we can no longer act entirely unilaterally in any
field.
Much has been said, considerable funds expended, and major new tests
are planned for better ways and means to recover oil from the shale. The
main considerations of mining and refining methods and costs have been
studied and valuable work in this continues. However, by the addition of
soda ash and aluminum into the picture, a new situation exists. If maximum
recovery at least cost of all potential products is to be our objective, then
clearly, open cut mining is most desirable, but some doubt if it is feasible.
To explore this question, let us first look at the things involved besides oil.
NACOLITE AND DAWSONITE CONSIDERATIONS
The principal sodium minerals, near the basin center, begin to appear
above 1800 feet below the surface and extend intermittently to below 2600
feet. The richest zone of these, though not continuous, is about 500 feet
thick and lies between 1850 feet and 2375 feet below the surface. This
zone is included within the much thicker oil shale zone above and below,
and all become shallower and thinner toward the basin margin. For discus
sion and simplicity and correlation with previous reports, we can assume a
maximum overburden thickness of approximately 1000 feet on top of 2000
feet of mixed pay zone, with proportionately less thickness for each as one
approaches the basin edge.
Present value ratio, per vertical column unit, of recoverable material in
the maximum known 2000-foot pay section is $9 oil, $7 soda ash and $2
alumina, or about $3.50 per vertical ton of ore on a weighted average basis.
Recovered and refined equivalent products, expressed also as a ratio, is 1
ton of aluminum metal to 16 tons of soda ash to 30 tons of shale oil with
each of these being worth roughly $500 at today's market. Thus the total

22 Quarterly of the Colorado School of Mines
potential value of the basin reserves is about tripled by adding the sodium
byproducts.
DEVELOPMENT, MINING METHODS AND COSTS
In proposing open cut mining, I do not mean totally to ignore other
methods. Block caving is still a possibility and, of course, nuclear blasting
may be justified for open cut preparation aside from the various in situ
recovery considerations. Several types of very large continuous mining
machines and semi-portable belt conveyors should receive careful scrutiny.
Dr. Tell Ertl covered the idea in his 1965 paper, although his figures now
may be too conservative.
Mining a section of ore to 3,000 feet deep will need a trench or inverted
pyramid no greater than 6,000 feet wide at the surface in the basin
center, and this width would decrease toward the basin edge if
slopes greater than 45 degrees can be tolerated. If controlled,self-
induced open caving methods can be perfected, the width may decrease even
more, with a corresponding reduction in stripping and blasting costs. Once
room is developed at the bottom of the pay section, then overburden and
spent shale can be back-filled into the mined out areas and the surface per
manently reclaimed for other future uses. The fundamental procedure is
somewhat akin to placer dredge mining operations. Minimum unit rate of
mining and stripping for optimum efficiency would probably not be much
less than 100,000 tons per day each from an area of about 5,000 acres per
unit operation. Unitization of land holdings to fit this minimum order of
magnitude scope will be most desirable, although selected portions of the
basin may allow unit operations one-half or even one-quarter this size.
Initial strip ratio on first cut or pass would be in the vicinity of one to
one but from then on would decrease approaching one half to one.
Mining costs for ore and waste will be much less than $0.25 per ton
and waste disposal and reclamation less than $0.10 per ton of material re-
handled. Initial capital investment estimates may approach $250 million,
40 percent for stripping and 60 percent for plant for the average operation,
but this may vary somewhat depending on differing factors over the whole
basin, and especially the relative stripping ratios and costs required to start
production at a given unit.
These elements can only be removed from untenable risk and speculation
by completely and carefully drilling, sampling and testing based on the
statistics of chemistry, distribution, spacing, and representation of tests and
sampling. The next stage may be to confirm these results by sinking shafts
and obtaining bulk samples for pilot plant beneficiation tests. This would
allow also for a more accurate appraisal of production methods and costs,

Impact of Dawsonite and Nacolite 23
water disposal, availability, requirements, and related problems. Such pro
grams often consume 5 years or more before any real production is achieved.
Concurrently, in other areas, other approaches such as underground block-
caving, room and pillar, or in situ nuclear blasting techniques should be un
der way if the need otherwise continues to be indicated.
CONCLUSIONS
Although other electrical power may be available at less cost, conceivably
the shale oil (and some soda ash) might be utilized in aluminum reduction.
Very cheap soda ash might find and develop new markets eventually, but
much will depend on related transportation factors which also will affect the
aluminum economics.
In any event, if most of the sorting out is done on a competitive private
enterprise basis in a climate of reasonable and equal rules for all concerned,
the result will be the earliest establishment of a most important and worth
while new industry for the maximum benefit of all.
Permission for this paper was provided by Mr. Joe Juhan of Tucson,
Arizona and his assistance, together with that of Mr. Irvin Nielson of Wolf
Ridge Minerals, Glenwood Springs. Colorado, and Dr. John Anthony. Haw-
ley & Hawley. assaying chemist? and others of Tucson. Arizona, is acknowl
edged.
REFERENCES
1. Boyd, James 1967, The influence of the minerals industry on general economics:
Jackling (Memorial) Lecture, Am. Inst. Mining Metall. Petroleum Engineers,Los Angeles. Feb.
2. Brant. A. A., 1966, The story of natural resources and their historical impact:
Regents Lecture, Univ. California, Coll. Eng.. Dept. Mineral Technology,Berkeley.
3. Dyni, J. R., and Hite, R. J., 1967, Distribution of extractable aluminum and
sodium facies of the Green River Formation northwest Colorado: Am. Inst.
Mining Metall. Petroleum Engineers Natl. Mtg., Los Angeles, Feb.
4. Ertl, Tell, 1965, Mining Colorado oil shale in Ann. Oil Shale Symposium, 2d:
Colorado School Mines Quart., v. 60, no. 3. p. 83-91.
5. deNevers, Noel. 1966, Tar sands and oil shales: Scientific American, v. 214, no. 2,
p. 21-29.
6. Pecora, W. T., 1967, Address: Am. Soc. Photogrammetry and Am. Cong, on
Surveying and Mapping Joint Mtg., Washington, D.C, March 10.
7. Reistle, C. E., Jr., 1966, Shale oil from potential to production: Address, Inst.
Mining Metall. Petroleum Engineers Ann. Mtg.. 95th, New York.


POTENTIAL RESOURCES OF DAWSONITE AND
NAHCOLITE IN THE PICEANCE CREEK BASIN,
NORTHWEST COLORADO
Robert J. Hite and John R. Dyni
ABSTRACT
Large quantities of dawsonite [NaAl(OHUC03]. nahcolite (NaHC03),
halite, and other sodium minerals were discovered in a saline facies of the
oil shales of the Parachute Creek Member of the Green River Formation
of Eocene age during recent core drilling in the Piceance Creek basin, north
west Colorado. Although the complete distribution of dawsonitic oil shale
is unknown, data from one drill hole indicate that dawsonitic aluminum in
1 square mile exceeds that in the total bauxite reserves of the United States.
In the Joe T. Juhan core hole 4-1 an interval of dawsonite-bearing oil
shale is 628 feet thick and averages 10.7 percent dawsonite. In this interval,
rocks nearly 300 feet thick average 2.3 percent aluminum which is extractable
by dilute acid solutions. The richest zone within this 300-foot-thick interval
is 18 feet thick and averages 3.9 percent acid-extractable aluminum. Data
indicate that part of the extractable aluminum is from amorphous substances.
In the same core hole, the dawnsonite zone is nahcolite-bearing through two
intervals that total 468 feet in thickness and average 15.5 percent nahcolite.
Dawsonite and nahcolite constitute potentially valuable sources of
aluminum and soda ash. respectively. Alumina and soda ash may be re
coverable byproducts of spent shale from oil-shale retorts. A process for re
covering alumina from the spent shale by a water leach may be feasible.
INTRODUCTION
Recently, large quantities of dawsonite, nahcolite, halite, and minor
amounts of other sodium minerals have been discovered in the rich oil shales
of the Eocene Green River Formation in the Piceance Creek basin, northwest
Colorado. This discovery is of economic importance because dawsonite, a
dihydroxy sodium aluminum carbonate, and nahcolite, a sodium bicarbonate,
constitute potentially valuable sources of alumina and soda ash.
This paper discusses the occurrence and distribution of these minerals
U. S. Geological Survey, Denver, Colo.
25

26 Quarterly of the Colorado School of Mines
within the enclosing matrix of oil shale, portrays the geologic and geo
chemical framework in which these minerals were deposited, and briefly sum
marizes the abundance of these minerals in terms of sodium and aluminum.
Particular emphasis is placed on soda ash and alumina extraction processes
which are compatible with recovery of shale oil.
The authors are indebted to Joe T. Juhan, John W. Savage, and Irvin
Nielsen for allowing us to study the core which made this paper possible.
We thank K. E. Stanfield of the U.S. Bureau of Mines for making available
shale oil assays on some of the core.
GEOGRAPHIC SETTING
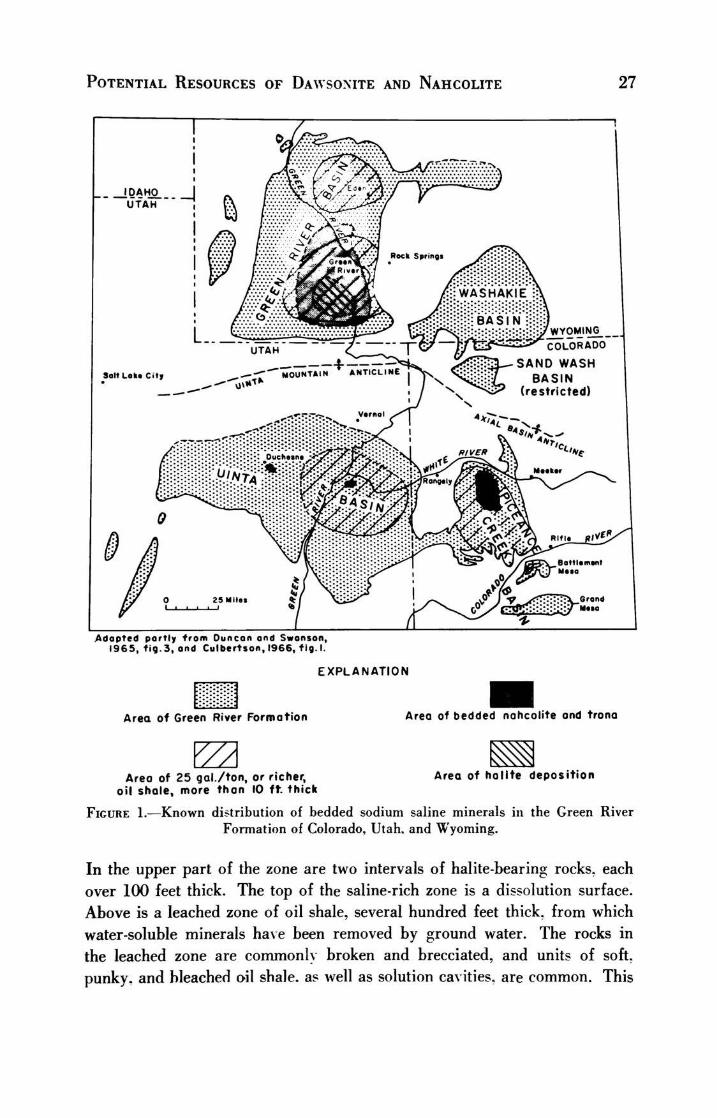
The Green River Formation is distributed through the three-state area
of Wyoming, Utah, and Colorado (fig. 1). The main body of the formation
was deposited in four basins: the Green River and Washakie basins in
Wyoming, the Unita basin in Utah, and the Piceance Creek basin in Colorado.
The Piceance Creek basin is the smallest of the four, occupying about 1,600
square miles. This basin contains the thickest and richest accumulation of
oil shale in the world and the associated dawsonite and nahcolite deposits.
This paper emphasizes the geology of the northern half of the Piceance Creek
basin where the greatest concentration of these resources occurs.
STRATIGRAPHY
The dawsonite and nahcolite deposits of the Piceance Creek basin occur
in the lacustrine Green River Formation. The formation is divided into five
members (fig. 2). Starting at the base these are the Douglas Creek, Garden
Gulch, Anvil Points, Parachute Creek, and Evacuation Creek Members.
The lower three members consist chiefly of fine-grained clastic rocks whose
maximum aggregate thickness is probably more than 1,000 feet. Near the
top of this sequence (fig. 2) is a persistent basin-wide electric log datum
which is informally referred to as the orange marker. It is extremely useful
for subsurface mapping in the Piceance Creek basin.
The Parachute Creek Member contains the rich deposits of oil shale and
associated dawsonite and nahcolite deposits. The member ranges in thickness
from about 850 feet on the margins of the Piceance Creek basin to about
1,800 feet.
Dawsonite, nahcolite, halite, and other sodium minerals are commingled
with oil shale and form a saline-rich zone in the lower half of the member.
Near the basin depocenter the saline-rich zone attains a thickness of at least
900 feet. Near the base of the saline-rich zone are three thin but persistent
nahcolite units (fig. 2) which are easily correctable between numerous wells.
Potential Resources of Dawsonite and Nahcolite 27
Adapted portly from Duncan and Swanson,
1965, fig. 3, and Culbertson, 1966, fig. I.
EXPLANATION
Area of Green River Formation Area of bedded nahcolite ond trona
YZAArea of 25 gal. /ton, or richer,
oil shale, more than IO ft. thick
Area of holite deposition
Figure 1. Known distribution of bedded sodium saline minerals in the Green River
Formation of Colorado, Utah, and Wyoming.
In the upper part of the zone are two intervals of halite-bearing rocks, each
over 100 feet thick. The top of the saline-rich zone is a dissolution surface.
Above is a leached zone of oil shale, several hundred feet thick, from which
water-soluble minerals have been removed by ground water. The rocks in
the leached zone are commonly broken and brecciated, and units of soft,
punky, and bleached oil shale, as well as solution cavities, are common. This

28 Quarterly of the Colorado School of Mines
Figure 2. Diagrammatic southwest-northeast stratigraphic cross section through the
approximate depocenter of the Piceance Creek basin, Colorado. This figure
shows the relationship of the saline-rich zone to the enclosing rocks of
the Green River Formation.
zone is apparently water bearing and active removal of water-soluble minerals
may still be taking place. Other important stratigraphic guides are two oil-
lean tuffaceous units called the A- and B-grooves which mark the top and
base of the Mahogany zone in the upper part of the Parachute Creek Member.
Overlying the Parachute Creek is the Evacuation Creek Member, which
consists chiefly of tuffaceous sandstone, shale, and siltstone. It forms the
top of the Green River Formation and is exposed over most of the Piceance
Creek basin.
STRUCTURE
The Piceance Creek basin is both a sedimentary and structural basin
which is bounded on the south by the Uncompahgre uplift, on the east bythe Elk Mountain-White River uplifts, and on the north by the Uinta Moun
tain-Axial Basin anticlinal trend. The Douglas Creek arch on the west side
of the basin is a gentle north-trending upwarp that separates the Piceance
Creek basin of Colorado from the Uinta basin of Utah.

Potential Resources of Dawsonite and Nahcolite 29
The major structural elements within the Piceance Creek basin involvingthe Green River Formation are three small generally northwest trendingsynclines and the Piceance Creek dome. The dome is a gas-producing struc
ture. Several northwest trending faults, commonly paired to form grabens
and having small displacement, cut the Piceance Creek dome and an east
ward-plunging anticlinal nose just west of the dome.
An unpublished isopach map of part of the Parachute Creek Member
by the junior author shows that trends of thickening coincide with the syn
clines suggesting pre-Parachute Creek folding. Tectonics further modified the
intrabasin structure in post-Parachute Creek time forming Piceance Creek
dome.
DAWSONITE AND NAHCOLITE DEPOSITS
Nahcolite was first reported in the oil shale deposits of the Piceance Creek
basin, Colorado, by Ertl ( 1947 ) and Glass ( 1947 ) . Dawsonite was identified
in cores from the basin by Charles Milton of the U.S. Geological Survey in
1958 (Milton and Eugster. 1959). However, it was only with the recent
discovery of large quantities of nahcolite and dawsonite in the basin that
the potential economic importance of these minerals was realized.
The dawsonite and nahcolite deposits of the Piceance Creek basin are
distributed through a tremendous volume of rich oil shale. The distribution
of these deposits may be controlled by salinity gradients that existed in the
lacustrine environment and caused most of the dawsonite and nahcolite to be
concentrated in the deeper northern half of the Piceance Creek basin.
Dawsonite shows great vertical and areal distribution in the northern
part of the basin. The thickness of oil shale continuously mineralized bydawsonite in 18 drill holes is reported (Smith and Milton, 1966) to range
from zero just south of the Rio Blanco County line to 760 feet toward the
center of the basin (fig. 3). In the Juhan core hole 4-1, located in the
SW14NE14 sec. 4. T. 2 S., R. 98 W.. the authors found dawsonite distri
buted through a continuous zone 628 feet thick. The zone may be thicker
but this could not be confirmed because samples in the upper part of the
core hole have not yet been analyzed. In 1966, D. A. Brobst of the U.S.
Geological Survey discovered that dawsonite is present discontinuouslythrough several hundred feet of oil shale cropping out along the north side
of the basin. Near the center of the basin, the top of the dawsonite zone
ranges in depth from 900 to 1.900 feet below the surface.
The mineral dawsonite occurs as microscopic crystals finely disseminated
through the oil shale and as thin laminae along bedding planes. Smith and
Milton (1966, p. 1034) have found it in fissures and in small vugs. The
mineral is also found in some of the halite and nahcolite units. Because
30 Quarterly of the Colorado School of Mines
RIOOW. R.99W. R.98W. R.97W. R.96W. R.95W. R.94W.
Adapted from Stanfield ond others, I960, tig. 3.
EXPLANATION
U I I *
7)
/A ^^
Areo of Green
River Formation
Area of nahcolite
units 1,2, and 3
Area of halite
deposition
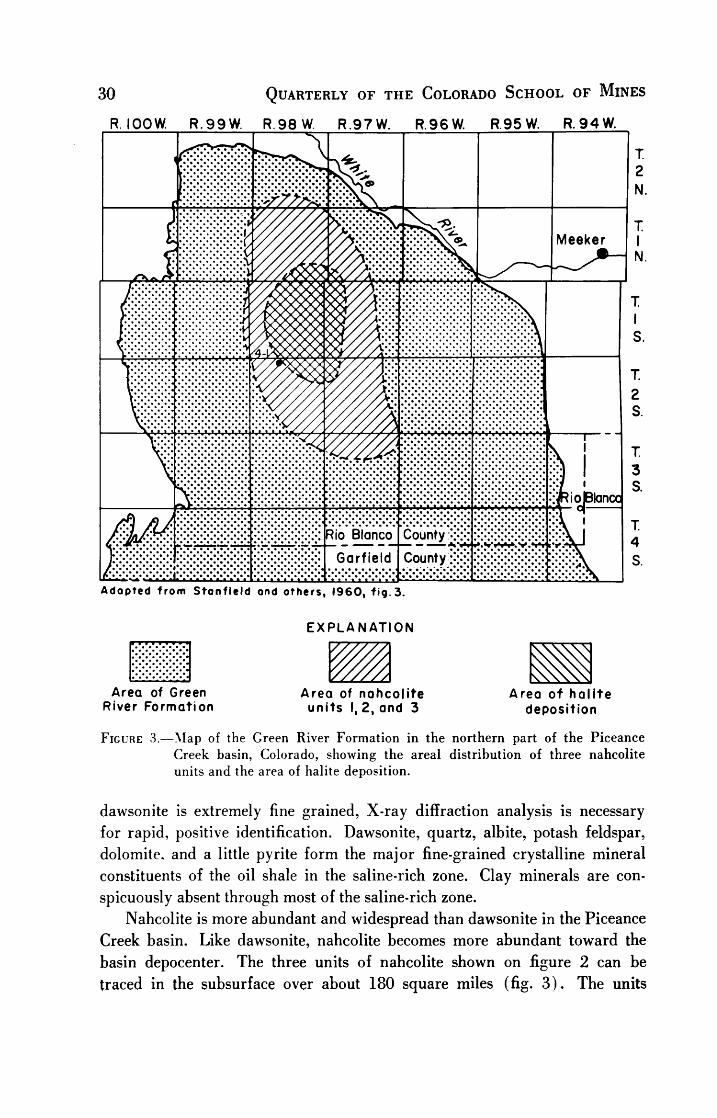
Figure 3. Map of the Green River Formation in the northern part of the Piceance
Creek basin, Colorado, showing the areal distribution of three nahcolite
units and the area of halite deposition.
dawsonite is extremely fine grained, X-ray diffraction analysis is necessary
for rapid, positive identification. Dawsonite, quartz, albite, potash feldspar,
dolomite, and a little pyrite form the major fine-grained crystalline mineral
constituents of the oil shale in the saline-rich zone. Clay minerals are con
spicuously absent through most of the saline-rich zone.
Nahcolite is more abundant and widespread than dawsonite in the Piceance
Creek basin. Like dawsonite, nahcolite becomes more abundant toward the
basin depocenter. The three units of nahcolite shown on figure 2 can be
traced in the subsurface over about 180 square miles (fig. 3). The units
Potential Resources of Dawsonite and Nahcolite 31
range in thickness from about 1 to 9 feet. Disseminated forms of nahcolite
have even greater distribution, but present data are too sparse to show its
extent with any degree of accuracy.
Nahcolite occurs in both nonbedded and bedded forms in oil shale.
Scattered through much of the saline-rich zone of the Parachute Creek
Member are rosettelike and irregular aggregates of coarse-bladed crystals of
brown nahcolite. These aggregates range from a few inches to a few feet
in diameter. Bedded forms of nahcolite include finely crystalline layers and
units of honeycomblike intergrowths of nahcolite and oil shale. Much of
the nahcolite contains a high percentage of organic matter. In the two halite-
bearing units shown in figure 2, thin layers of nahcolite are interbedded in
cyclic fashion with halite. Other minerals associated with the halite units
include wegscheiderite (Na2C03-3NaHC03), shortite (Na2C03'2CaC03),
northupite (Na2C03MgC03NaCl), searlesite (NaBSi206H20), and possi
bly trona (Na2C03 NaHC03 2H20 ) .
GEOCHEMISTRY
The geochemical environment of the Green River Formation in the
Piceance Creek basin is far from being fully understood. A greater under
standing of this environment can be gained, however, by studies of the lateral
and vertical variations in distribution of the clastic, authigenic, and evaporite
minerals. Although many profiles across the basin will be needed to demon
strate lateral facies, a single vertical profile near the depocenter of the basin
shows many interesting relationships.
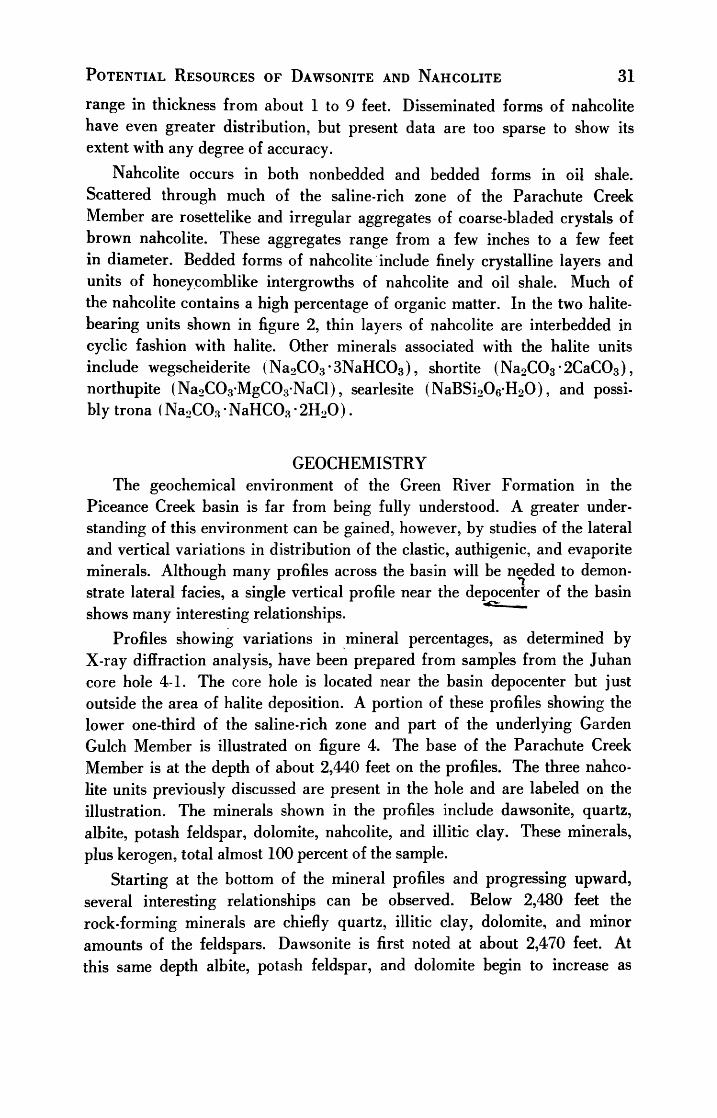
Profiles showing variations in mineral percentages, as determined by
X-ray diffraction analysis, have been prepared from samples from the Juhan
core hole 4-1. The core hole is located near the basin depocenter but just
outside the area of halite deposition. A portion of these profiles showing the
lower one-third of the saline-rich zone and part of the underlying Garden
Gulch Member is illustrated on figure 4. The base of the Parachute Creek
Member is at the depth of about 2,440 feet on the profiles. The three nahco
lite units previously discussed are present in the hole and are labeled on the
illustration. The minerals shown in the profiles include dawsonite, quartz,
albite, potash feldspar, dolomite, nahcolite, and illitic clay. These minerals,
plus kerogen, total almost 100 percent of the sample.
Starting at the bottom of the mineral profiles and progressing upward,
several interesting relationships can be observed. Below 2,480 feet the
rock-forming minerals are chiefly quartz, illitic clay, dolomite, and minor
amounts of the feldspars. Dawsonite is first noted at about 2,470 feet. At
this same depth albite, potash feldspar, and dolomite begin to increase as

32 Quarterly of the Colorado School of Mines
CO
Z
LU
3
CO
Z
oo
< *
UJ
a -=

Potential Resources of Dawsonite and Nahcolite 33
clay begins to decrease. The first trace of nahcolite at 2,420 feet coincides
with the disappearance of clay. Albite reaches its maximum concentration
between the depth of 2,420 to 2,380 feet where several samples contain as
much as 20 percent by weight of the mineral. From this point upward albite
steadily decreases in abundance and is absent or nearly so near the top of
the profile. Although quartz seemingly shows an erratic distribution pattern
from sample to sample, the average amount of quartz in each 100-foot-thick
interval is about the same. Significantly, in single samples, the quartz content
is directly proportional to the amount of dawsonite present. Thus, a sample
containing a high percentage of quartz also contains a high percentage of
dawsonite. The ratio of dawsonite to quartz which is nearly constant through
the saline-rich zone is about 1:2.5. Albite shows an inverse relationship to
quartz and dawsonite ; as albite increases the amount of quartz and dawsonite
decreases.
The changes in mineralogy and the mineral relationships described here
reflect changes in the salinity and alkalinity of the lake waters in which
these minerals formed. Salinity and alkalinity are believed to have increased
steadily during deposition of the interval shown on figure 4. This line of
reasoning is supported by the upward increase of nahcolite. Greater salinity
is also indicated by the presence of halite in rocks in the deeper part of the
basin which are lateral equivalents of the Juhan core but stratigraphically
higher than the interval shown on figure 4. The disappearnce of clay may
be due to its reaction with a carbonate-chloride brine, or the clay minerals
in contact with this brine may have flocculated around basin margins before
reaching the basin center. The correlation of the dawsonite and quartz pro
files, which in turn inversely correlate with albite and clay, suggests a se
quence of diagenetic reactions involving the brine and these minerals. Clayor possibly tuffaceous material may have been the parent material, and
dia-
genesis may have then produced the other minerals.
ECONOMICS
Considerable interest is being expressed by industry in the economic
possibilities of extracting alumina and soda ash from the Green River oil
shale. Dawsonite contains 35 weight-percent alumina, and nahcolite con
tains 65 weight-percent soda ash. Theauthors'
data suggest that both com
modities may be recoverable from retorted oil shale containing these minerals.
Although dawsonite constitutes only a small part of the rock, the alumina
in the mineral may be extractable by dilute acid or base leaches. In the
Juhan core hole about 300 feet of the dawsonite zone averages 2.3 percent
aluminum which is extractable by dilute acid solutions (2.0 percent sulfuric

34 Quarterly of the Colorado School of Mines
acid) . The richest zone within this 300-foot-thick interval is 18 feet thick and
averages 3.9 percent acid-extractable aluminum. Extraction using a 2 percent
sodium hydroxide solution gave slightly lower results.
Of great interest is the possibility of extracting dawsonite alumina with
a water leach. Differential thermal analyses of synthetic and natural samples
of dawsonite show a large endothermic reaction near 400C. f At this tempera
ture dawsonite loses its carbon dioxide and hydroxyl water and forms an
amorphous substance that is not readily soluble in water.
Figure 5 shows X-ray diffraction traces of samples of dawsonite heated
to temperatures ranging from525
to 1,000C. This figure shows the gradual
conversion of dawsonite from an amorphous substance (sample A) to a
water-soluble crystalline compound (samples C and D) that is identified as
sodium aluminate. Alumina can then be precipitated from the sodium alumi
nate solution by conventional methods of carbonation.
AFRICAN DAWSONITE
HEATED TO 1000 C.iii* ^ m\ \m hi
SYNTHETIC DAWSONITE
HEATED TO820 C.
VERTICAL
SCALE
(COUNTS /SEC)
SOO-i
^^v*^ ^w>v
B
SYNTHETIC DAWSONITE
HEATED TO 560C.
x.^ ir_ 1 i
/
SYNTHETIC DAWSONITE
HEATED TO525
C.
60 50 40 30 20
Degrees 2c? (Ni filtered, CuK cr radiation)
io
Figure 5. X-ray powder diffractograms of heated samples of dawsonite.

Potential Resources of Dawsonite and Nahcolite 35
The chemistry involved in heating a dawsonite oil-shale mixture is more
complex. Evidently only part of the dawsonite in the shale converts to a
water-soluble aluminum-bearing compound. However, the remainingwater-
insoluble aluminum may be recoverable by dilute acid or base leaches.
Figure 6 summarizes the results of firing sets of three different samples
of dawsonite-bearing oil shale at temperatures ranging from400
to 1,000C
and using distilled water, 2 percent sulfuric acid, and 2 percent sodium
hydroxide leaches. The total aluminum for each sample was determined bychemical methods, and the dawsonite aluminum was calculated indirectlyfrom X-ray diffraction data. Maximum recovery seems to be achieved in
those samples which were fired to temperatures ranging from400
to700
C.
Significantly, this is in the temperature range of some oil-shale retorts. The
acid leach is the most effective, followed by the base leach, then water. Al
though the recovery of aluminum in the water leach is low, it seems feasible
that with a better understanding of the chemistry involved in firing dawsonitic
oil shale, better yields could be achieved.
One important point suggested by sample D122356 in figure 6 is that
more aluminum is extracted by the acid and base leaches than can be ac
counted for by dawsonite alone. In this sample and others the feldspars ac
count for about 5 to 10 percent of the total aluminum in the rock. Aside
from feldspar and dawsonite no X-ray crystalline aluminum-bearing mineral
was found in the oil shale. Therefore, additional extractable aluminum as
amorphous substances seems to be present in the oil shale.
Nahcolite is water soluble and can be removed by a simple water leach
either before firing or after firing when the nahcolite is converted to soda ash.
Dawsonite and nahcolite are present in rocks that already have great
potential value for their shale oil content. Figure 7 summarizes the depths,
thicknesses, and grades of dawsonite, nahcolite, and oil shale in the saline-
rich zone of the Juhan core hole 4-1. Oil shale above this zone is not evalu
ated here, although it should be pointed out that large amounts of rich oil
shale overlie the saline-rich zone.
In the Juhan core dawsonite averages about 11 weight-percent through a
continuous interval of oil shale 628 feet thick. The rocks containing nahcolite
are divided into an upper zone and a lower zone. The two zones average 15
weight-percent nahcolite.
The interval of oil shale shown in figure 7 starts at the top of the saline-
rich zone and continues to the total depth of the drill hole. Shale oil assays
by the U.S. Bureau of Mines indicate that this 761-foot interval averages
about 31.1 gallons of shale oil per ton.
The amount of each potential resource in the Juhan core hole is calcu
lated on the basis of 1 square mile using the thicknesses and grades shown

36 Quarterly of the Colorado School of Mines
<J<>
1
Oo0001
1o
1006
1o- 008
OOZ
009
00Q
OOfr
8*8 m
U CM
<N crj
oo -p
crj
O
if)
o
5f
a:
UJ-
<
a
UJ
co
o
i
O
1
3oco
cT
CO
OJ
o
CO
X
oo
o
c>
CJ
I
<
I-
o
C\J
I
?
O
\6
O
>vO 0) ctf
m r-l MCO ft 1
CM
CM 1 X
r-I co BQ 0
G J-l
CJ H >4-l
i-l
ft<-l r-l
ICO
< *
rH CU
cd 4J
4J H
o Ci
H oCO
Q
OonOOOl
-
006
008
00Z
H009
009
OOfr
00
U CO
*m %
o CTJ
CM 4J
CTJ
<t T3
CM .. >-tf 0) ctJ
CO r-l rH
CM a 1
CM
r-l i ix:
Q co 60
<u G Mr-l H m
CO
-<-<
(lN30U3d IM) WnNIWfnv 3T8V10VU1X3
OJ
u
l-l
co
CO
i
SrS
o o
crj
0) cd
ii pcO C
J3 C3
a s
CD
^3.ti
G S
3 5
cu .?
CO
bD
.5-3
a .
CO r'
O CO
O
*^^
G O
rt
CO ftCU o<
IPCO ffi
^ as .ti
J*
^
S TJ >
3 rt Xi
G tf ,
'rt J C
CD >*I3
rt CO Ih
ti ^ cd
W rt h
VO
WOS
DOii
fa
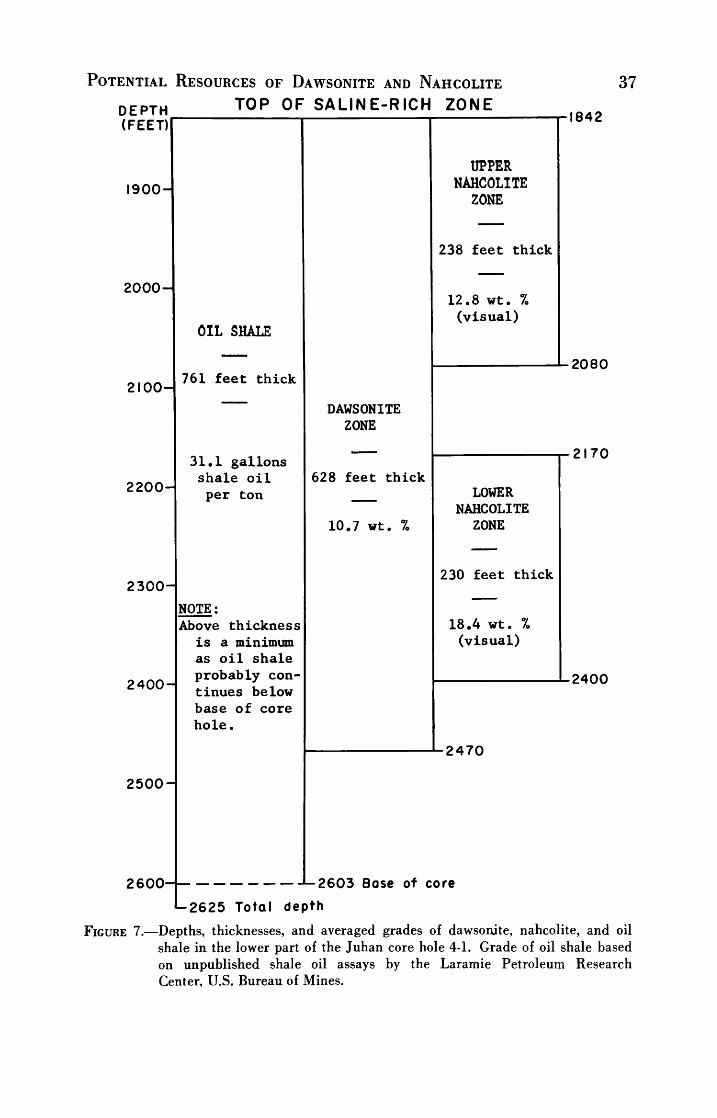
Potential Resources of Dawsonite and Nahcolite
TOP OF SALINE-RICH ZONE
37
DEPTH
(FEET)
1900-
2000-
2100-
OIL SHALE
761 feet thick
2200-
2300-
2400-
2500-
2600-
31.1 gallons
shale oil
per ton
NOTE:
Above thickness
is a minimum
as oil shale
probably con
tinues below
base of core
hole.
UPPER
NAHCOLITE
ZONE
238 feet thick
12.8 wt. %
(visual)
DAWSONITE
ZONE
628 feet thick
10.7 wt. %
842
2080
LOWER
NAHCOLITE
ZONE
230 feet thick
18.4 wt. %
(visual)
2170
2400
2470
1 2603 Base of core
-2625 Total depth
Figure 7. Depths, thicknesses, and averaged grades of dawsonite, nahcolite, and oil
shale in the lower part of the Juhan core hole 4-1. Grade of oil shale based
on unpublished shale oil assays by the Laramie Petroleum Research
Center, U.S. Bureau of Mines.

38 Quarterly of the Colorado School of Mines
in figure 7. The shale oil amounts to nearly 1 billion barrels. About 130
million tons of nahcolite are present, or calculated as soda ash about 82 million
tons.
Potential resources of alumina from dawsonite are enormous. About 42
million tons of dawsonite alumina are present in 1 square mile. The total
known bauxite reserves of the United States contain about 30 million tons
of alumina. Thus, just 1 square mile in the Piceance Creek basin contains
about 1.5 times as much alumina as in the total bauxite reserves of the
United States.
SUMMARY
In the Piceance Creek basin, dawsonite and nahcolite deposits commingled
with rich oil shale form what is potentially the world's largest contiguous
mineral reserve. The dawsonite and nahcolite deposits are potentially valu
able for their alumina and soda ash. Although economically proven extrac
tion processes have not been demonstrated, preliminary laboratory work bythe authors suggests that the recovery of soda ash and alumina is feasible.
Such processes seem compatible with oil-shale retorting. If these commodities
can be recovered along with the shale oil, development of mineral industryin the Piceance Creek basin may be expedited.
REFERENCES
1. Culberston, W. C, 1966, Trona in the Wilkin's Peak Member of the Green River
Formation, southwestern Wyoming, in Geological Survey research 1966: U. S.
Geol. Survey Prof. Paper 550-B, p. B159-B164.2. Duncan, D. C, and Swanson, V. E., 1965, Organic-rich shale of the United States
and world land areas: U.S. Geol. Survey Circ. 523, 30 p.
3. Ertl, Tell, 1947, Sodium bicarbonate (nahcolite) from Colorado oil shale: Am.
Mineralogist, v. 32, nos. 3-4, p. 117-129.
4. Glass, J. J., 1947, Sodium bicarbonate (nahcolite) from Garfield County, Colo
rado, [abs.] : Am. Mineralogist, v. 32, nos. 3-4, p. 201.
5. Milton, Charles, and Eugster, H. P., 1959, Mineral assemblages of the Green
River Formation [Colo.-Utah-Wyo.], in Abelson, P.H., ed., Researches in geo
chemistry: New York, John Wiley and Sons, p. 118-150.6. Smith, John Ward, and Milton, Charles, 1966, Dawsonite in the Green River
Formation of Colorado: Econ. Geology, v. 61, no. 6, p. 1029-1042.7. Stanfield, K. E., and others, 1960, Oil yields of sections of Green River oil shale
in Colorado, 1954-57: U.S. Bur. Mines Rept. Inv. 5614, 186 p.

ALASKAN OIL SHALE
John R.Donnell,1
Irvin L.Tailleur,2
and Harry A.Tourtelot2
Publication authorized by the Director, U.S. Geological Survey.
Deposits of oil shale were first reported in Alaska north of the Arctic
Circle in the latter part of the 19th Century. Before this time, according to
evidence near old camp sites, shale had been used for fuel in interior Alaska,as it is being used now, 1967, by the Eskimos of Anaktuvak Pass in the cen
tral part of the Brooks Range.
Fragments of oil shale were found by early explorers as far north as the
basin bordering the Arctic Ocean, and during early geological investigations
of the area north of the Arctic Circle oil shale was collected and identified
by Collier (1906), and later by Smith and Mertie (1930) in gravel bars
and outcrops in stream cuts. Other deposits, too, were described in several
early reports but were erroneously identified as coal.
Detailed geologic mapping in 1950-51 by U.S. Geological Survey field
parties in connection with the geologic evaluation of Naval Petroleum Reserve
No. 4 delineated additional oil-shale localities. In 1964, Tailleur published
a short article in U.S. Geological Survey Professional Paper 475-D giving
Fischer assay results from oil-shale samples of marine oil shales collected bythese Survey field parties. These samples yielded from 6.7 to 146 gallons of
oil per ton of rock. In the summer of 1964, Tailleur collected oil-shale
samples from 12 localities in the Southern Foothills belt of the Brooks Range,
and also obtained larger samples from some of the localities previously tested.
These samples were routinely assayed for oil content, were examined petro-
graphically and mineralogically, and were analyzed chemically for major
constituents and minor elements. The results of this examination were re
ported in an open-file report by Tourtelot and Tailleur (1965).
As a result of the analytical work of 1964 a reconnaissance project was
initiated, headed by Tailleur, to attempt to determine the thickness, value,
and extent of the oil-shale deposits on the Arctic Slope. This project was
funded by the Office of Naval Petroleum and Oil Shale Reserves, Washington,
D.C, and was logistically supported in great part by the Arctic Research
Laboratory at Point Barrow.
1U.S. Geological Survey, Denver, Colo.
2U.S. Geological Survey, Menlo Park, Calif.
39

40 Quarterly of the Colorado School of Mines
The area north of the Arctic Circle, and more particularly that part
immediately north of the Brooks Range, a west-trending mountain range
that is the northernmost mountain range in Alaska, was of principal interest.
From south to north the area is divided physiographically into the
Brooks Range, a mountainous area with a maximum relief of 5,000 feet;the Southern Foothills belt, an area consisting of hills having a maximum
relief of 1,500 feet; the Northern Foothills belt, consisting of more broadlyrounded hills having possibly as much as 500 feet of relief; and the Arctic
Slope, a flat poorly drained plain with a maximum relief of 150 feet. Most
of the exposed oil shale is in the Southern Foothills belt. This area is north
of timberline and its vegetation consists chiefly of arctic tundra that forms a
very effective cover on the steep slopes of the hills and the adjacent gently
sloping river terraces. Willows with a maximum height of 15 feet and a trunk
diameter of no more than several inches are in and adjacent to the major
drainages.
In the area north of the Brooks Range the weather is cold and dry, and
because of the low mean annual temperature permafrost is present at depths
ranging from a few inches under the tundra-covered slopes to several feet
on many gravel bars.
Much of the Southern Foothills belt is structurally complex and is
characterized by west-trending isoclinal folds, thrust faults, and high-angle
reverse faults. The thrusting, probably post-Cretaceous in age, has resulted
in a maximum horizontal displacement of 75 miles to the north.
Underlying the north slope from the Brooks Range to the Arctic Ocean
are mostly marine sedimentary rocks that range in age from Devonian
through Quaternary. In this sequence only rocks of Pennsylvanian age are
missing. In the Southern Foothills belt, rocks range in age from Mississip-
pian to Early Cretaceous. The Mississippian through Jurassic rocks are
dominantly black shale, chert, and black organic limestone, and the over
lying Cretaceous rocks are dominantly beds of sandstone, grit, and conglom
erate. The oil shales are contained in the Mississippian through Lower Cre
taceous rock sequence.
The Mississippian oil shale submitted for assay by Tailleur in 1964
yielded only 6.7 gallons of oil per ton; therefore, during the 1965 recon
naissance oil-shale field study, no additional Mississippian samples were
taken. In rocks ranging in age from Triassic to Early Cretaceous, however,several different types of oil shale were noted and sampled. These were:
1) Tasmanite. Tasmanite is a woody-appearing oil shale that is a
lustrous dusky brown on fresh fracture and a moderate brown on weathered
surface. Tasmanite is composed almost entirely of a sporelike alga and is
named for its occurrence in Tasmania. Frequently the Alaskan tasmanite

Alaskan Oil Shale 41
contains white bands that, by unaided eye, resemble quartzite but under high
magnification is identified as diagenetic silica, which occurs within each alga.
The Alaskan tasmanite also contains small quantities of barite. The tasmanite
ranges in thickness from a few inches to 4 feet 7 inches and yields up to 160
gallons of oil per ton at the localities sampled. At one locality a sample of
tasmanite that was 4 feet 7 inches thick yielded an average of 130 gallons
of oil; however, the tasmanite at that locality is bounded by claystone
barren of oil. which in turn is enclosed by a thick sequence of thin-bedded
varicolored chert. In comparison, the richest 1-foot bed of the Rocky Moun
tain area oil shale in the Eocene Green River Formation yields about 95
gallons of oil per ton, and a maximum thickness of 2,000 feet of almost pure
oil shale will yield an average of 15 gallons of oil per ton. Specific gravity
of the richer tasmanite is 1.2 or less and it is commonly carried by streams
to places many miles from the outcrop. Tasmanite probably is the material
that has been found strewn along the beach bordering the Arctic Ocean. Tas
manite becomes highly contorted when subjected to high pressures possibly
because of the high percentage of a single type of organic material; at most
localities it occurs as elongate blebs or pods several feet long and a foot or
two thick.
2) A type of black oil shale superficially resembling the Green River
oil shale. This shale is dark brown to black on fresh fracture and locallyweathers bluish gray. Microscopically the organic matter in this black shale
ranges from red to reddish-brown fibrous-appearing material to black opaque
material. Commonly it is interbedded with thin-bedded black organic cherts
and limestones. At one locality thin units of black shale yield more than 50
gallons of oil per ton but at some other localities black shale units up to
20 feet thick yield an average of about 15 gallons of oil per ton. Black
shale at one locality is 20 feet thick, relatively free of chert, yields an average
of 15 gallons of oil per ton, and contains an average of 6,300 ppb Ag and
630 ppb Hg. Another sequence of black shale, 20 feet thick, consists of about
50 percent thin-bedded black limestone and chert, yields an average of 15
gallons of oil per ton and contains 1,500 ppb silver, 120 ppb gold, and ab
normally high amounts of barium, copper and zinc.
3) A type of oil shale locally called whale-blubber rock. This type was
found east of the Naval Oil Reserve and about 20 miles southwest of the
Eskimo village of Anaktuvak Pass. This deposit is greatly valued by the
Eskimos in the area as a source of fuel and the location was shown to the
Survey field party by the chief of the Eskimos of Anaktuvak Pass. The
material is black on both fresh and weathered surface, is extremely flexible,
and closely resembles a piece of hard rubber. The largest pieces of shale were
found along the stream bed, and were about 4 feet by 2 feet by 2 feet

42 Quarterly of the Colorado School of Mines
they probably weighed 200 to 300 pounds. The pieces almost invariably
were covered with thin parallel to subparallel grooves that the Eskimos
claimed were animal tooth marks. An abundance of fragments of this shale
was found in a dominantly black fissile marine shale slope. Trenches were
dug at several likely looking spots on this slope and large pieces of the
shale were unearthed but it could not be determined with any degree of
certainty that any were in place. Upon assay this material yielded 85 gallons
of oil per ton.
Thin slivers of tasmanite and the whale-blubber rock were easily ignited
and burned readily. The other black oil shales also could be ignited but
only with the help of gasoline; however, once started they burned readily
for a long period of time.
Specific gravity of the oil from Alaskan oil shale ranges from 0.70 to
0.97 at 15.6C and most of the oil flows freely at temperatures near 0C.
The specific gravity of the oil from most of the tasmanite sample is less than
0.90.
In addition to the Fischer assays of the shales sampled, six-stepspectro-
graphic analyses were made to determine the elemental composition of the
shale. Content of barium is unusually high in most all samples and is as
high as 7 percent in a few samples. Unusually high concentrations of other
minor elements were found. Some maximum concentrations are:
B 0.05% Mo 0.2%
Cr.1%
Ni 0.07%
Cu.05%
Sr.3%
Co.02% V .15%
Pb.02%
Zn.5%
In addition to six-step spectrographic methods, more precise chemical
analyses were run for gold, silver, and mercury. Maximum quantities found
were:
Gold 350 ppb
Silver 20,000 ppb
Mercury 2,800 ppb
Amounts above 100 ppb for gold and 300 ppb for mercury are considered
anomalous.
In general, an inverse relationship exists between the organic content and
trace-metal content of the shale. However, many samples of tasmanite are
very high in mercury and silver. One example is the sample of 4 feet 7
inches of tasmanite that contains 530 ppb silver and 1,820 ppb mercury.

Alaskan Oil Shale 43
Some of the Alaskan oil shales that are rich in both oil and trace metals
would in another setting ordinarily be attractive industrially. However,
because of adverse weather conditions, remoteness from market, estimated
high cost of mining and processing, and last but certainly not least, the
thinness and limited extent of the presently known deposits, initiation of
any commercial oil-shale operation in Alaska in the foreseeable future is
doubtful.
REFERENCES
1. Collier, A. J., 1906, Geology and coal resources of the Cape Lisburne region.
Alaska : U.S. Geol. Survey Bull. 278, 54 p.
2. Smith, P.S., and Mertie J. B., Jr., 1930, Geology and mineral resources of
northwestern Alaska: U.S. Geol. Survey Bull. 815, 351 p.
3. Tailleur, I. L., 1964, Rich oil shale from northern Alaska, in Short papers in
geology and hydrology: U.S. Geol. Survey Prof. Paper 475-D, p. D131-D133.
4. Tourtelot, H. A., and Tailleur, I. L., 1965, Oil yield and chemical composition of
shale from northern Alaska: U.S. Geol. Survey open-file report, 17 p., 5 tables.


FRACTURING OIL SHALE WITH ELECTRICITY
Noel M.Melton1
and Theodore S.Cross2
ABSTRACT
Laboratory studies to evaluate the use of electricity for fracturing various
grades of Colorado oil shale were started in 1964. Breakdown voltage
requirements ranged up to several thousand volts and varied widely from one
grade of shale to another. With few exceptions, the shale samples were readily
fractured at relatively low current levels.
On the basis of the encouraging results obtained in the laboratory, ex
periments were expanded to a small-scale field project in an abandoned oil-
shale mine tunnel near Green River, Wyo. The purpose of these experiments
was to study electrical characteristics of oil shale when subjected to overburden
pressure. In general, these tests confirmed the laboratory experiments.
Fracturing was accomplished at all electrode spacings used. The spacings
varied from 3 to 129 feet.
Based upon the results obtained in the mine-tunnel experiments, a test
site 7-1/2 miles west of Rock Springs, Wyo., was selected for a larger scale
field experiment. Fracturing tests were conducted in four shallow wells
drilled in the oil-shale formation. Some new permeable zones were created
but, in general, the induced permeability between wells was not up to desired
levels. In an attempt to improve the induced permeability, two conventional
nitroglycerin well bore shots were detonated in one of the wells. Air-injec
tion tests made after the detonations showed appreciable improvement.
INTRODUCTION
Before an in situ retorting process can function, it is necessary to developtechniques to increase the permeability of the oil shale formation. Induced
fracturing is the best method of increasing the effective permeability of oil
shale deposits, and this may be accomplished by hydraulic pressure, high
explosives, high-voltage electricity, or combinations of two or more of these.
This paper covers the laboratory experiments and the preliminary field tests
that are being made to study high-voltage electricity as a method of fractur
ing oil shale. Fracturing is the first phase of the electrocarbonization process
and is the phase with which this investigation is primarily concerned.
1Laramie Petroleum Research Center, Bureau of Mines, Laramie Wyoming.
2Pacific Power and Light Co., Casper, Wyoming.
45

46 Quarterly of the Colorado School of Mines
Several investigators have studied the electrocarbonization process as applied
incoal,12 3
petroleumformations,4 5
and oilshale,67
but none of them has
reported making field tests in Green River oil shale.
LABORATORY EXPERIMENTS
Preliminary Studies
Laboratory studies to evaluate electrical properties of various types of
oil shales were started in 1964. Samples used for the preliminary tests ranged
in size from 2 to 175 pounds and represented a broad spectrum of Colorado
oil shales ranging from 1.5 to 58.6 gallons of oil per ton. The first tests
were made to determine the breakdown voltage required to initiate a current
flow of five milliamperes through the sample. In all cases, 1/4-inch stainless
steel tubes spaced four inches apart were used as the electrodes. Breakdown
voltages varied greatly from one sample to another, ranging from a minimum
of 300 to a maximum of 15,000 volts.
Fracturing Studies
Establishment of Air Communication
After it was definitely established that fracturing could be accomplished,
attention was directed toward other factors related to an in situ retorting
process. The first of these was the establishment of air communication be
tween two or more holes drilled at different locations in the shale block.
Experiments were made on several shale blocks, in which three holes were
drilled in a line and 1/4-inch perforated steel tubes were cemented into the
holes. The holes were spaced two inches apart. The two end tubes (four
inches apart) served as electrodes and one end tube and the center tube
served as air injection and air outlet tubes. In most cases interconnectingfractures that permitted substantial amounts of air to flow between all
three holes were created. In these experiments, the entire length of the steel
tubes served as the electrode, and under these conditions the fractures oc
curred at random along the low resistance paths chosen by the electric cur
rent.
Controlled Fracturing
In order for an in situ retorting operation to be successful, a technique
must be developed to create a system of horizontal fractures vertically spaced
at preselected intervals. Accurate control of positioning the horizontal frac
tures is essential because the combustion process may require that the vertical
spacing between fractures be as little as one or two feet.
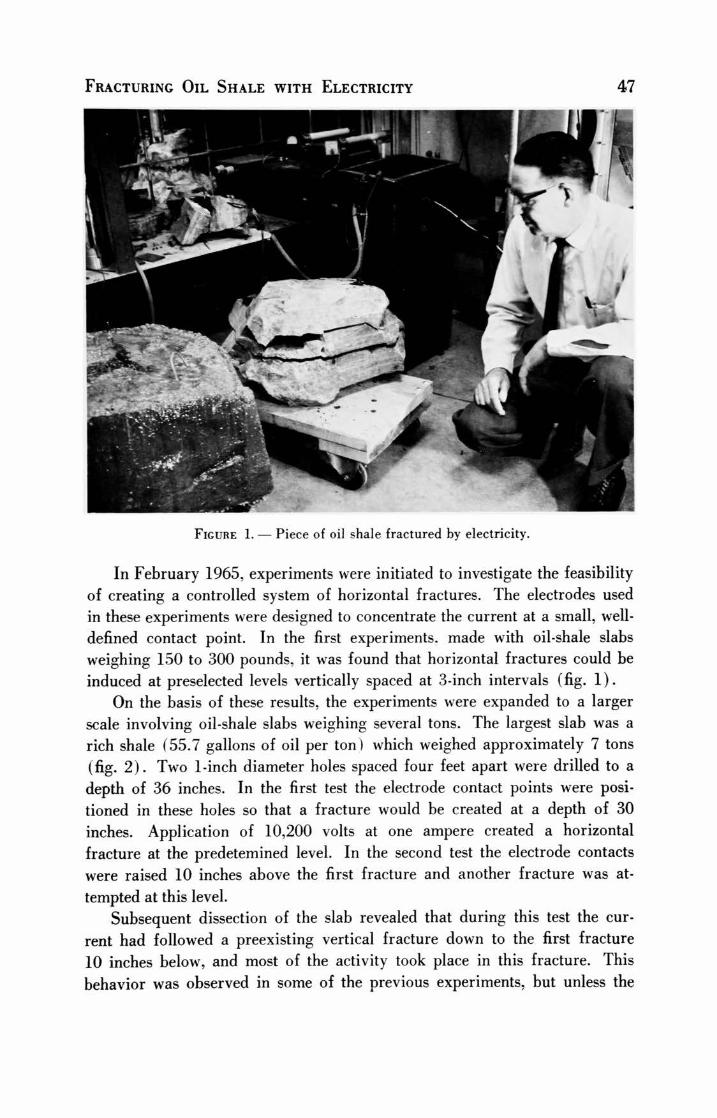
Fracturing Oil Shale with Electricity 47
Figure 1. Piece of oil shale fractured by electricity.
In February 1965, experiments were initiated to investigate the feasibilityof creating a controlled system of horizontal fractures. The electrodes used
in these experiments were designed to concentrate the current at a small,well-
defined contact point. In the first experiments, made with oil-shale slabs
weighing 150 to 300 pounds, it was found that horizontal fractures could be
induced at preselected levels vertically spaced at 3-inch intervals (fig. 1).
On the basis of these results, the experiments were expanded to a larger
scale involving oil-shale slabs weighing several tons. The largest slab was a
rich shale (55.7 gallons of oil per ton) which weighed approximately 7 tons
(fig. 2). Two 1-inch diameter holes spaced four feet apart were drilled to a
depth of 36 inches. In the first test the electrode contact points were posi
tioned in these holes so that a fracture would be created at a depth of 30
inches. Application of 10,200 volts at one ampere created a horizontal
fracture at the predetemined level. In the second test the electrode contacts
were raised 10 inches above the first fracture and another fracture was at
tempted at this level.
Subsequent dissection of the slab revealed that during this test the cur
rent had followed a preexisting vertical fracture down to the first fracture
10 inches below, and most of the activity took place in this fracture. This
behavior was observed in some of the previous experiments, but unless the

48 Quarterly of the Colorado School of Mines
current is diverted by a preexisting vertical fracture, it will usually follow a
serpentine path confined to one horizontal layer (fig. 3) .
In the third test the contact points were raised another three inches and
current was applied at this point. Current flow was started with 3,840 volts
and gradually increased to 1.0 ampere with a potential of 6,480 volts. With
in 20 minutes a fracture occurred at the predetermined level and the potential
suddenly dropped to 660 volts for a current flow of 1.0 ampere.
Figure 2. Placing electrodes in a 7-ton block of shale.
Fracturing Oil Shale with Electricity 49
Figure 3. Large block of shale dissected to show fracture plane and retorted oil
produced by the electric current.
SMALL-SCALE FIELD TESTS
Mine-Tunnel Experiments
Laboratory experiments did not permit adequate spacing of electrodes
or a means of studying the influence of overburden, natural fractures, or
other natural surroundings that would be present in the field. In order to
study these factors, some small-scale field experiments were made in an
abandoned exploratory oil shale tunnel located 1-1/2 miles southwest
of Green River, Wyo. The tunnel was relatively small, having a cross section
of approximately 7 by 7 feet and a length of approximately 90 feet (fig. 4) .
The oil shale in this area is a lean shale (ranging from 11 to 19 gallons
of oil per ton) located in the Wilkins Peak member of the Green River
Formation.
Nine sets of horizontal boreholes were drilled into the sides of the tunnel.
The holes were drilled in pairs in the same bedding plane; spacings between
holes ranged from 3 to 58 feet. Another pair of holes was spaced at 129
feet; one of these holes was drilled in the back of the tunnel and the

50 Quarterly of the Colorado School of Mines
Figure 4. Entrance to Green River mine tunnel with transformers in foreground.
other in the face of the cliff a short distance from the tunnel entrance. The
overburden above the test area ranged from 43 to 53 feet.
Prior to the electrical tests, all of the holes were thoroughly cleaned.
Visual examinations made with a borescope showed the holes to be in good
condition with very few fractures.
The electrical installation (fig. 5) consisted of a 277-volt source with
a safety switch and fuse, a low-voltage autotransformer, metering instru
ments, step-up transformer, output fusing, grounding switches, lines to the
electrodes, and the electrodes themselves. The metering equipment consisted
of appropriate current transformers, ammeter, voltmeter, wattmeter, andwatt-
hour meter on the input to the step-up transformer. Step-up transformers
were available to provide the following nominal voltages: 1,200, 2,400,
4,160, 7,200, 14,400, 20,000, and 34,500 volts. By using taps and varying
the input voltage a rather wide range of voltages was available for the
tests. The electrodes were constructed with small contact areas that made
intimate contact with the sidewalls of the 1-1/2-inch-diameter boreholes.
Current flow was obtained between all sets of holes, but in most cases
electrical behavior differed from that previously observed in the laboratory.

Fracturing Oil Shale with Electricity 51
In the laboratory experiments, when a fracture occurred it was usually ac
companied by a sudden increase in current flow. In the mine-tunnel tests,
the current flow gradually increased, but, with one exception, no sudden
changes occurred. The one case in which a sharp break occurred was in the
boreholes spaced 58 feet apart. In this case, the impedance started to dropimmediately and at the end of four minutes had decreased from 35,000 to
2,000 ohms, at which point the power was shut off.
After the fracturing experiments were completed, all holes were cleaned
and examined with a borescope. This examination revealed new horizontal
and vertical fractures in all of the boreholes, particularly in the areas of the
electrode contact points. The fractures in the two holes spaced 58 feet apart
were created with a very small expenditure of energy and were apparently
signaled by the rapid decrease in impedance values.
At the conclusion of the electrical experiments, air-injection tests were
made to determine whether the induced fractures and carbonized paths
would permit communication of air between the various pairs of holes. In
general, the air-pressure tests were inconclusive because of excessive leakage
through fractures in the tunnel wall. Definite air communication between
holes was established in only three sets of holes.
Most of the experiments were made to accomplish fracturing only, but
a few combination fracturing and carbonization tests were made to provide
electrical paths that could be more easily traced. The area in which the
carbonization experiments were made was mined out to determine the loca
tion and size of the carbonized paths. Most of these were not carbon paths
but were paths of partially burned shale and retorted oil. Only one full-
length carbon path was intercepted. This path was cylindrical in shape, about
1-1/2 inches in diameter and was located in a lean shale layer assaying 11.6
gallons of oil per ton.
Safetyswitch A fuse
240v- 400a
T^T-T^T
SupplyTransformer
lOOkva
277v
m
Metering20/40/80: let
Ammeter
Voltmeter
Wattmeter
Watt hour meter
cfs
4X-
Autotransformer
240 v
224 a
W
Ki
Step-upTransformer
(various)
Electrodes
-0>r-r
1-'Vrr
1Fuses ft
GroundingSwitches
Figure 5. Electrical installation at Green River mine tunnel.

52 Quarterly of the Colorado School of Mines
The experiments in the oil shale tunnel were of value in supplying
information concerning spacing of electrodes, power application, and changes
in electrical resistance of the shale during the fracturing process. For
example, during one fracturing test the equivalent impedance between the
electrodes decreased from 100,000 ohms to 100 ohms. This wide variation
of impedance became the controlling factor for the electrical tests. For
example, when starting a fracturing test using 15,000 volts, with an equiva
lent shale impedance of 100,000 ohms, the current flow would be 0.15
amperes, and the power required would be 2.25 kva. When the equivalent
impedance had dropped to a value of 100 ohms, a 15,000 volt source would
supply 150 amperes, a power of 2,250 kva, which would greatly exceed the
power source available. Therefore, as the shale impedance dropped, the
voltage to the electrodes was lowered as required to stay within the limits
of the capacity available.
At a constant voltage, the impedance of the shale gradually decreased
with time. When the power was interrupted, however, the impedance of
the shale increased somewhat, so that when power was reapplied, the imped
ance was higher than it was immediately before the interruption but lower
than it was originally. It was also noted that a minimum power level was
required to cause the equivalent shale impedance to decrease with time. If
the minimum power requirement was not maintained, the shale impedance
would gradually increase with time.
The steady lowering of impedance from the start of tests along a given
path indicates a permanent change in this path between the electrodes, such
as carbonization of the shale. But the small increase in the impedance from
the end of one test to the start of the next (while the power is off) indicates
that there is also was a temporary change. This could be due to loss of con
ductive materials evolved from the shale during power application.
Shallow-Well Experiment
As a result of the mine-tunnel experiments, the field program was expand
ed to investigate electrical fracturing in shallow wells drilled in the Tipton
member of the Green River Formation. The test site selected for these
experiments is located 7-1/2 miles west of Rock Springs, Wyo. (fig. 6).
Five wells were"spotted"
in a pattern that permitted electrode spacings
ranging from 25 to 112 feet (fig. 7). To avoid water problems experienced
at a previous site, four of these wells were completed at a total depth of
80 feet. Water was encountered in the fifth well which was plugged and
abandoned. Upon completion of the drilling operations, power lines were
extended to the location, and the assortment of transformers previously

Fracturing Oil Shale with Electricity 53
used at the mine tunnel were installed. Air-tight wellhead fittings, an air
compressor, and flow measuring equipment were installed so that air com
munication between wells could be determined before and after the electrical
tests.
A photographic survey of the wells was made with a Laval downhole
camera. Pictures taken at 1-foot intervals showed the wellbores to be in
very good condition with no visible fractures or cavities.
The electrical equipment above ground was very similar to that pre
viously used in the mine tunnel, but several modifications were made in the
downhole equipment. The electrodes were suspended in the hole on a string
of standard 7/8-inch steel sucker rods which served as the conductor for
current to the electrode. The electrodes were designed to provide small
contact areas held in close contact with the wellbore by spring tension.
Fracturing Tests
Air-injection tests made prior to the electrical tests showed the presence
of natural permeable zones that permitted large volumes of air to flow between
wells. Because of this, only major improvements in permeability would be
detectable.
The first series of tests was made on wells No. 1 and 3 which were spaced
90 feet apart. These tests were made to study the electrical characteristics
of the shale in this area, and to determine whether fractures could be created
*~<fcaud*>. '~-\
*';&*'.
m** i**wf***wl*
**
Figure 6. Site of shallow-well electrical tests.

54 Quarterly of the Colorado School of Mines
Figure 7. Well pattern at electrical test site.
with a very small power input. Runs were made at three levels vertically
spaced three feet apart. The tests were started with the electrodes set at
the lowest level of 62 feet in well No. 1. Power application was limited to
30 minutes for each run. These tests revealed that much lower voltages
would be required in this shale than in the shale in the tunnel.
A second series of tests was made on the same wells using the same
electrode settings as the first series, but in this case it was planned to apply
the power for a longer period of time at each electrode setting. At the lowest
setting, 2,800 volts were applied for a period of 2-1/2 hours. Total power
consumption for this run was 144 kwh.

Fracturing Oil Shale with Electricity 55
The electrodes were reset at the next higher level where a much longer
run was planned, but this test was terminated at the end of three hours by a
violent explosion which blew the electrode out of well No. 1.
Air-injection tests following the electrical tests indicated that no major
change had taken place in the amount of air communication between the
two wells.
In order to evaluate the results of the next series of tests more accurately,
all of the wells except No. 4 were plugged back to a depth of 60 feet to seal
off the natural permeable zones. These zones were accurately located bymeans of air-injection tests with inflatable packers. Subsequent air-injection
tests showed that in most cases air flow between the wells was reduced to zero.
After plugging back the wells, the first series of tests was made between
wells No. 1 and No. 2, spaced 50 feet apart. Gas explosions were controlled
by injecting carbon dioxide into the wells prior to each electrical test. The
first test was made with the electrodes set at a depth of 54 feet, and was
continued for a period of 5-1/2 hours. During this time the impedance
dropped from 667 to 29 ohms, and 368 kwh of energy was consumed. The
second test was made with the electrodes set four feet above the first setting.
The initial impedance of this test was only 99 ohms which dropped to 33
ohms in less than an hour. This behavior suggests that the current did not
follow the new path but dropped down and followed the previous path. The
third run was made with the electrodes set at 45 feet. The electric current was
applied for a period of 4-1/2 hours which resulted in a drop of impedance
from 344 to 19.4 ohms. A total of 320 kwh was used for this test.
Following the electrical tests, downhole pictures were taken to observe
changes that had occurred in the wellbores. The pictures revealed extensive
damage and caved-out areas at the levels used for electrode settings. An
electrode which was lost in well No. 2 during the first test appeared to be
completely embedded in a solid mass of carbon which probably blocked any
fractures in this area.
Air-injection tests made at 37 psig showed that both wells were still tight
after the electrical tests. The wells were cleaned with kerosene followed bya detergent and water. This treatment slightly improved injectivity of air
into No. 2 but had no effect on well No. 1. Both wells were then acidized with
15 percent hydrochloric acid followed by a detergent and water. This
treatment had no effect on the injectivity of well No. 1 at injection pressures
as high as 70 psig. When well No. 2 was subjected to a pressure of 70 psig
after acid treatment, its injectivity increased so that a pressure of only 54
psig could be maintained at compressor capacity. The permeable zone in
well No. 2 was isolated with packers and found to be at a depth between 43

56 Quarterly of the Colorado School of Mines
and 45 feet which corresponds to the electrode setting during the last test
made on this well.
The next tests were made on wells No. 1 and No. 4, spaced 112 feet
apart which was the longest spacing available at this test site. All of the
previous electrical tests were made in open holes, but this series of tests was
made with the wellheads in place. After the electrode was in place, the
attached sucker rod string was secured in a fixed position by an oil-saver
packing box. Installation of the wellhead equipment provided a means of
controlling explosions that might occur during the electrical tests (fig. 8) .
Figure 8. Wellhead with electrode in place.
Two runs were made with the electrodes set at a depth of 53 feet. Power
was applied for a period of 3 hours during the first run and 10 hours duringthe second run. Total energy consumed during the two runs was 952 kwh.
Figure 9 shows the electrical characteristics of the shale during these
tests. Note the extremely rapid drop in impedance at the start, from 115 to
37 ohms in only 6 minutes, accompanied by a rise in power from 66 to
194 kilowatts. As this approached the available power limit, an outage was
necessary to lower the voltage. Also note that each time current application

Fracturing Oil Shale with Electricity 57
120-1
100-
Oi
a>
o
g60-
a.
E
*- 40-
>
S 20"
V.
mpedance
1 T2^
-240
-220
-200
-180
-160
-140
-120
-100
-
80
-60
-40
-20
IA
o
$o
So
a.
t | i | . | i|
i|
.r-
18 20 22 24 26 28
Time in hours
so
Figure 9. Power and equivalent impedance versus time.
is interrupted the impedance increases slightly. The right-hand portion of the
curve is typical of any sustained run at a given voltage. As time increases
there is a slow, gradual decrease in the equivalent impedance and a gradual
increase in the power due to increasing current.
The gas produced in well No. 4 was measured with a displacement meter
attached to the wellhead. A total of 51 cubic feet of gas was produced
during both runs, and contained 75.2 percent air, 12.2 percent hydrogen,
9.7 percent carbon dioxide, 2.5 percent methane, 0.3 percent ethane, and
0.1 percent hydrogen sulfide.
Air-injection tests made immediately after the electrical tests showed
both wells to be almost completely sealed off. Both wells were cleaned
with diesel fuel followed by water and a detergent. This treatment did not
improve the air communication from well No. 1 to well No. 4, but when
air was injected into well No. 4 it was found that air communication from it
to well No. 2 was appreciably improved.
A double packer was used to locate the permeable zones in wells 1 and
4. This packer, which consisted of two inflatable sections connected by a sec
tion of perforated pipe, permitted isolation of the individual permeable zones

58 Quarterly of the Colorado School of Mines
through which air left the injection well. The first attempt to run the packer
into well No. 1 was unsuccessful because the packer would not pass the 53-foot
level at which the electrode had been set for the electrical test between wells
1 and 4. Downhole photographs showed the wellbore to be badly damaged at
depths between 52 and 55 feet. The well was reamed and redrilled to a total
depth of 76 feet and packer tests were made to a depth of 70 feet. Increased
permeability was found at all levels corresponding to the electrode settings.
The tests in well No. 4 were not as conclusive because wellbore damage in the
immediate vicinity of the electrode prevented a good packer seal, but a good
permeable zone was found two feet below the electrode setting. The packer
tests indicated that electrical fractures were created at the predetermined
levels in the separate wells, but continuous air communication paths from
one well to another were found to exist only at a depth of 45 feet. The
discontinuity of the paths at the other levels might have been caused either
by partial collapse of the fractures or by plugs of congealed shale oil or
oxidation products.
An attempt was made to reopen the electrically induced fractures with
nitroglycerin. Conventional wellbore shots were made at two levels in well
No. 1. The levels corresponded to those previously used for electrode settings.
The first shot was made with four quarts of nitroglycerin in a 2-foot shell
set at a depth of 61 to 63 feet. The second shot consisted of an 8-quart
charge in a 4-foot shell at a depth of 50 to 54 feet. The first shot was tamped
with water and the second shot with sand. In both cases, the tamps were
blown to atmosphere by the detonations, (fig. 10).
Following these detonations, air flow tests were made from well No. 1 to
each of the other wells. Injection pressure was 37 psig. As shown in the
following table, total air flows from well No. 1 to each of the other wells
were appreciably increased.
Air flow from production well, cfh
Air flow path Before nitro shot After nitro shot
From #1 to #2 3.0 9.0
From #1 to #3 2.4 19.2
From #1 to #4 0 15.0
Packer tests were made to locate the communication channels, but due
to damaged wellbores the tests were limited to wells 3 and 4.
The packer tests in well No. 3, which had been deepened to 76 feet, showed
that the majority of the air was entering the well below 60 feet and the re-

Fracturing Oil Shale with Electricity 59
^ /J
Figure 10. Water tamp blown to atmosphere by nitroglycerin shot.

60 Quarterly of the Colorado School of Mines
mainder of the air was entering between 50 and 60 feet. Following these
tests well No. 1 was plugged back from a depth of 76 feet to a total depth of
61.5 feet, and the air flow tests were repeated. Plugging back well No. 1
reduced the total flow from it to No. 3 from 19.2 to 14.4 cfh, but did not
change the zones at which air was entering No. 3. This indicates that the
flow between the two wells is in the bedding plane just above the top of the
plug in No. 1, the same plane in which the fractures were induced by the
initial fracturing experiment.
Although the width of the electrical fracture between wells 1 and 4 at a
depth of 52 feet is not known, the fracture could have extended over an area
that included well 3, thus explaining the air flow at this level.
CONCLUSIONS AND FUTURE WORK
Work up to the present time has shown that oil shale can be fractured at
selected levels by the application of electrical energy. Fracturing was ac
complished at all electrode spacings used. These ranged from 4 inches to 129
feet. The controlled fracturing was accomplished not only in the laboratorybut also under actual field conditions. The initial electrical fracture can
be further developed by conventional fracturing methods, such as hydro -
fracturing.
The next series of experiments will be conducted at a new test site
where five wells have been drilled in a small, five-spot pattern measuring 25
feet on each side. Several changes will be made in the electrical procedure.
The changes are expected to provide more precise control over the voltage
and power levels in the shale. By having adequate control, the voltage can
be set to just above the minimum level which will continue the reaction but
prevent damage from overpowering, such as melting the shale and electrodes.
This finer control will also assist in impedance evaluation.
Measurements of earth surface voltage gradients will be made to deter
mine possible personnel hazards due to the current flow in the earth between
the electrodes.
ACKNOWLEDGMENTS
Work covered in this paper represents contributions by personnel of
the Bureau of Mines at the Laramie Petroleum Research Center, Laramie,
Wyo., and the Bartlesville Petroleum Research Center, Bartlesville, Okla., and
by personnel of Pacific Power and Light Co., who were assigned to the pro
ject to supply technical assistance for the electrical portion of the tests.
Appreciation is expressed to the Union Pacific Railroad Co. and the Rock
Springs Grazing Association for permission to conduct the tests on their
property.

Fracturing Oil Shale with Electricity 61
REFERENCES
1. Forrester, J. D., and Sarapuu, Erich. 1952, Process of underground electrocarboni
zation: Univ. Missouri, School of Mines Bull. 78.
2. Elder, J. L., Fies, M. H., Graham, H. C., Capp, J. P., and Sarapuu, Erich, 1957,Field-scale experiments in underground gasification of coal at Gorgas, Ala.:
U.S. Bur. Mines Rept. Inv. 5367.
3. Wilson, M. W., Hurst, L. L., Elder, J. L., Capp, J. P., and Gentile, J. J., 1960,Simulated underground gasification of coal and electro-linking-carbonization
method of preparing path in a coalbed: U.S. Bur. Mines Rept. Inv. 5605.
4. Slezak, J. M., and Davis, M. C., 1952, Pyrovolatilization : Producers Monthly, v.
16, no. 7, p. 11-15, May.
5. Bleakley, W. B., 1962, Electrofrac will it solve some of our toughest production
problems? : Oil and Gas Jour., p. 114-118, Feb. 12.
6. Hill, W. W.. 1952, Electro-thermal recovery of petorelum: Producers Monthly, v.
16, no. 11, p. 14-20, Sept.
7. Sarapuu, Erich, 1965, Underground electrocarbonization of oil shale: Colorado
School Mines Quart., v. 60, no. 3, p. 193-200.


EXPLOSIVE FRACTURING TESTED IN OIL SHALE
J. S. Miller and W. D. Howell
ABSTRACT
An explosive-fracturing experiment was performed in Green River oil
shale near Rock Springs, Wyo., as a prelude to research on in situ retorting
oil from the shale. The objective of the test was to determine if a liquid
explosive displaced in a sheet-like layer and detonated in the oil shale would
explode with sufficient force to significantly crack the rock. Although the
evaluation of results from this research is continuing, preshot surveys and
comparable postshot tests indicate that a charge of 190 quarts of desensitized
liquid nitroglycerin, (NG1) was displaced a lateral distance of 22 feet at a
depth of 147 to 149 feet and successfully detonated in the oil shale. Frac
ture-improvement ratios determined from before- and after-flow tests in six
holes averaged 3.5.
INTRODUCTION
The broad purpose of the explosive-fracturing research is to improve the
ultimate recovery from low-permeability oil and gas reservoirs, to improve
the performance of underground natural gas-storage reservoirs and to create
permeability in oil shale. This paper describes the latest development of an
explosive method to obtain rock breakage, increase permeability, and sup
port in situ retorting in oilshale.8
The test method is to introduce and dis
place a liquid explosive into a permeable zone, detonate and propagate an
explosion through the thin zone, and thus create extensive fractures and
breakage for in situ retorting of the shale.
Several papers and relatedpatents23 4 6 7
pertaining to explosive fracturingare available in the literature.
The results of a field application of explosive fracturing were reported
by Dowell Division of the Dow Chemical Company at a meeting of the
American Petroleum Institute in April 1965. The"Stratablast"
process
uses a multiple-component system of hypergolic fluids that explode when com
bined in the formation. Dowell offers two blasting services for the petroleum
and miningindustry.9
One uses rocket-type fuels altered to behave as liquid
U.S. Bureau of Mines, Department of the Interior, Bartlesville, Oklahoma.
63
64 Quarterly of the Colorado School of Mines
explosives and the other employs a heavy slurry of metalized ammonium ni
trate. The slurry has been tested in several oilfield applications.
Apaper5
generally describing the explosive-fracturing research program
and field testing was presented at the Third Conference on Drilling and Rock
Mechanics in January 1967.
Few results and discussions have been reported on work relating to the
theory of rock breakage by explosive forces in a confined environment.
However, it is known that the detonation of an explosive in a densely packed
hole can develop pressures in excess of 100,000 atmospheres. The accompany
ing shock wave may travel in rock at velocities from 3,000 to 5,000 meters
per second. The heterogeneity of the rock may alter the velocity of the shock
wave and create a series of shear stresses which in turn may crack the rock.
Some cracks can be formed by the reflected shock waves changing the princi
pal stress in the rock from compression to tension. A wedging action of the
expanding gases tends to extend fractures simulating the mechanism in
hydraulic fracturing.
The test method involves open hole completion, the placement of drillable
materials near the detonation point and no steel tubular goods near the
explosive zone. Liquid explosives are placed on the bottom of the hole and
displaced from the wellbore in a sheet-like layer into a naturally fractured
or permeable zone by steady hydraulic or pneumatic pressure. Confinement of
the explosion to the zone is obtained by tamping the holes with either a water
column, sand fill, or a cement plug. Detonation is accomplished by firing an
electric cap and primer charge suspended in the wellbore adjacent to the
NGl-impregnated zone.
EXPERIMENTAL PROCEDURES
The explosive-fracturing experiment was performed about 714 miles west
of Rock Springs, Sweetwater County, Wyo. The test site (fig. 1) was pre
pared by leveling an area 180 by 80 feet to remove the weathered shale. The
dip of the formation is generally west at 4 feet per 100 feet.
A 5-spot pattern of holes was air drilled on 50 feet spacing to a depth of
approximately 200 feet near the bottom of the Tipton member of the Green
River oil shale formation. Holes 1 and 5 (fig. 2) were cored to a depth of
about 280 feet to determine the thickness and oil content of the shale. Ap
proximately 30 feet of 7-inch casing was set and cemented to the surface in
the five original holes to exclude surface water.
Although oil shale has low permeability, several thin sandy zones, natural
fractures, and water-bearing zones were encountered by drilling and coring
through the oil shale formation. Water-bearing zones were found at about
Explosive Fracturing Tested in Oil Shale 65
~'
-7
Figure 1. View of exposed oil shale at Test Site 3.
100 feet and 145 feet. Continuity of the permeable zones within the 5-spot
pattern was determined by applying air pressure to the central wellhead and
observing pressure increases in offset holes.
Detailed studies of the open-hole sections were made with Downhole
Camera surveys. Numerous rings or grooves in the formation were observed
in the stereoscopic pictures taken at various depths. Prominent washouts
appeared from 145 to 149 feet. Caliper logs and Gamma Ray-Neutron logs
were run on each hole to detect irregularities in wellbore diameters and to
correlate formation lithology.
Although little work has been reported covering log analyses of oil shale,
astudy1
conducted on Green River formation oil shale discusses the applica
tion of several types of logs to oil shale evaluation. The results of this study
suggest a relationship between shale oil yield and neutron log response. These
investigations note that a comparison of the neutron log trace with the assay
oil yield indicates a definite qualitative response. A low assay oil yield gives
high neutron response and a high assay oil yield gives low neutron response.
An attempt was made to apply this concept to the explosive-fracturing
studythrough a correlation between neutron response and permeability.

66 Quarterly of the Colorado School of Mines
O6
Q5
10'
Figure 2. Location of holes in test pattern.
Explosive Fracturing Tested in Oil Shale 67
The authors reasoned that low oil yield assay could reflect volcanic tuff, sand,
clay, or other mineralized zones.
Neutron logs run on all original holes in the pattern showed a high
neutron response at depths from 145 to 149 feet. Air-flow tests were run at
1-foot intervals by isolating zones with inflatable-stacked packers set on
each hole from the bottom of surface casing to total depth. The results of the
packer tests revealed good correlation with neutron-log response in that the
most permeable zone, found in the 145-149 foot interval, coincided with a
high neutron response on the log trace. Figure 3 presents this correlation.
It was possible to correlate the zone for each hole in the pattern by this
method. Authorities in the field of log interpretation are assisting with the
evaluation of this concept in oil shale.
DEPTH, FT PRESSURE FALL0FF
PSI / 3MIN
100
NEUTRON RESPONSE
150
200
Figure 3. Relationship between pressure falloff and neutron response, hole 5.
The data obtained from the air-flow tests indicated a permeability trend
from southeast to northwest with evidence of increasing permeability in the
northeast quadrant of the 5-spot pattern of holes. Three additional holes 6,
7, and 9 were drilled to 140 feet and cored to a depth of about 165 feet in
this permeabilitytrend as shown in figure 4. Caliper logs, Gamma Ray-
Neutron logs, and air-flow tests were run on the additional holes to confirm
the depth interval of the permeable zone in the original test pattern.
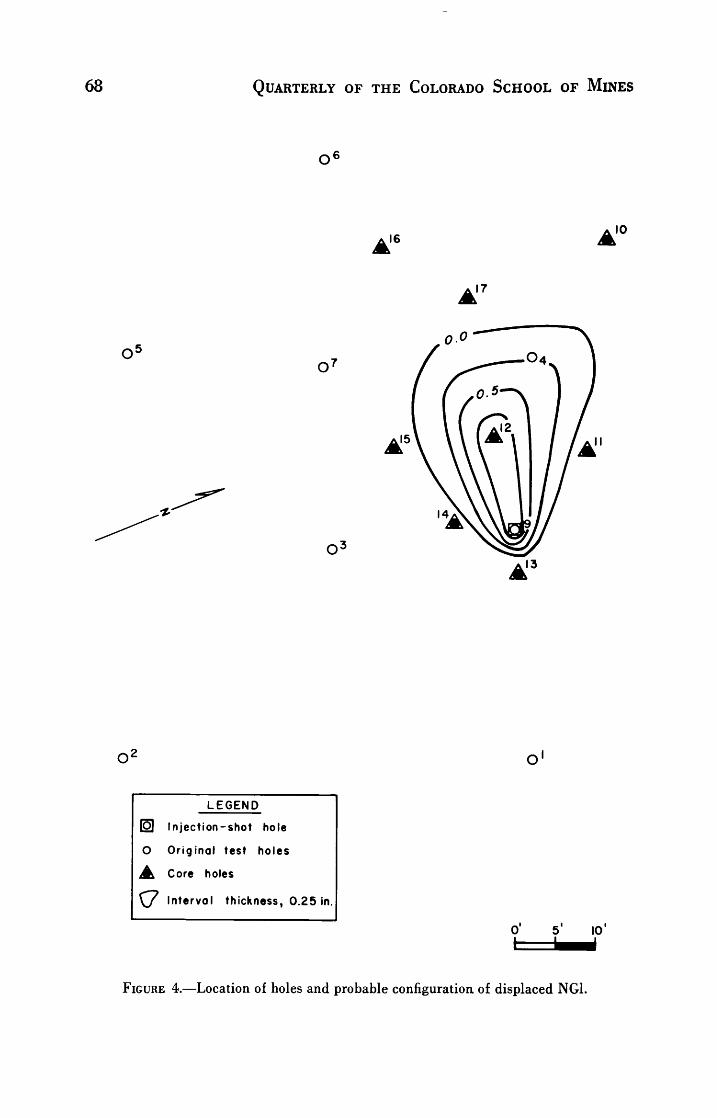
68 Quarterly of the Colorado School of Mines
o
?'16?'10
o
LEGEND
(5J Injection-shot hole
O Original test holes
A Core holes
\j Interval thickness, 0.25 in.
j - 1 10"
Figure 4. Location of holes and probable configuration of displaced NGL
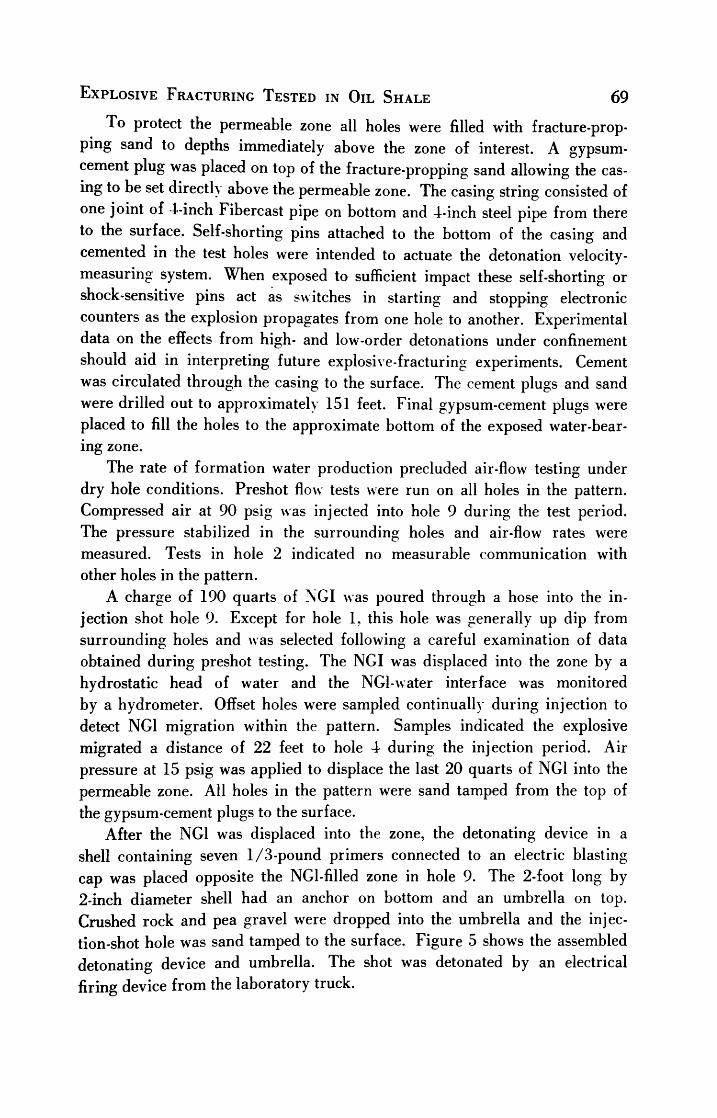
Explosive Fracturing Tested in Oil Shale 69
To protect the permeable zone all holes were filled with fracture-propping sand to depths immediately above the zone of interest. A gypsum-
cement plug was placed on top of the fracture-propping sand allowing the cas
ing to be set directly above the permeable zone. The casing string consisted of
one joint of 4-inch Fibercast pipe on bottom and 4-inch steel pipe from there
to the surface. Self-shorting pins attached to the bottom of the casing and
cemented in the test holes were intended to actuate the detonation velocity-
measuring system. When exposed to sufficient impact these self-shorting or
shock-sensitive pins act as switches in starting and stopping electronic
counters as the explosion propagates from one hole to another. Experimental
data on the effects from high- and low-order detonations under confinement
should aid in interpreting future explosive-fracturing experiments. Cement
was circulated through the casing to the surface. The cement plugs and sand
were drilled out to approximately 151 feet. Final gypsum-cement plugs were
placed to fill the holes to the approximate bottom of the exposed water-bear
ing zone.
The rate of formation water production precluded air-flow testing under
dry hole conditions. Preshot flow tests were run on all holes in the pattern.
Compressed air at 90 psig was injected into hole 9 during the test period.
The pressure stabilized in the surrounding holes and air-flow rates were
measured. Tests in hole 2 indicated no measurable communication with
other holes in the pattern.
A charge of 190 quarts of NGI was poured through a hose into the in
jection shot hole 9. Except for hole 1, this hole was generally up dip from
surrounding holes and was selected following a careful examination of data
obtained during preshot testing. The NGI was displaced into the zone by a
hydrostatic head of water and the NGl-water interface was monitored
by a hydrometer. Offset holes were sampled continually during injection to
detect NGI migration within the pattern. Samples indicated the explosive
migrated a distance of 22 feet to hole 4 during the injection period. Air
pressure at 15 psig was applied to displace the last 20 quarts of NGI into the
permeable zone. All holes in the pattern were sand tamped from the top of
the gypsum-cement plugs to the surface.
After the NGI was displaced into the zone, the detonating device in a
shell containing seven 1/3-pound primers connected to an electric blasting
cap was placed opposite the NGl-filled zone in hole 9. The 2-foot long by
2-inch diameter shell had an anchor on bottom and an umbrella on top.
Crushed rock and pea gravel were dropped into the umbrella and the injec
tion-shot hole was sand tamped to the surface. Figure 5 shows the assembled
detonating device and umbrella. The shot was detonated by an electrical
firing device from the laboratory truck.

70 Quarterly of the Colorado School of Mines
Figure 5. Assembled detonating device and umbrella.
Detonation velocities of this contained shot were not obtained; it was
concluded that the velocity-measuring system failed because of the protection
of the cement sheath around the self-shorting pins and the distance between
the explosive zone and the pin placement. Elevations run on the casing heads
prior to, during, and after the shot indicated no lifting or crowning of the
overburden as was experienced during a previousexperiment.5
Following the shot all holes were cleaned to a depth of 160 feet prior to
testing for fracture improvement. Attempts to perform air-flow tests were
halted when the individual wellhead pressures stabilized below preshot values.
Water produced from all holes following the shot contained a high concen
tration of solid material. The material was analyzed as bentonite containing
approximately equal parts of swellable montmorillonite and a waxy clay.

Explosive Fracturing Tested in Oil Shale 71
Water injected into the holes at rates regulated to not exceed 30 psig was
mixed with formation water to flush the loose bentonite from the explosively
fractured zone. This washing procedure was successful in restoring the
fractured zone to a condition suitable for testing.
EVALUATION OF RESULTS
It was determined impractical to control the movement and static level
of water in the test area before and after the shot. Bailing failed to reduce
the influx of water to permit satisfactory air-flow testing. Consequently,
different static water levels in the holes during air-flow tests could have con
tributed to the high fracture-improvement ration for hole 3, table 1.
After pressure stabilization was achieved, air-flow tests made from the
injection-shot hole to test holes, Qf, as compared to the preshot flow rates,
Qi, showed a fracture-improvement ratio, Qf/Qi, ranging from minus 0.9 to
plus 11.1 and averaged 3.5. Flow rates were corrected to standard conditions
at 14.73 psi and 60F.
Table 1. Fracture-improvement ratio from air-flow tests
Air Flow
Preshot Postshot Improvement
Hole, No. Mscfd at psia Mscfd at psia Ratio Qf/Qi
1 3.514 52.5 3.307 50.5 -0.9
3 1.169 57.0 12.914 86.5 11.1
4 59.249 52.5 59.791 53.5 1.0
5 1.040 38.5 2.707 41.5 2.6
6 3.216 67.5 15.946 59.0 5.0
7 1.348 36.5 2.805 43.0
Av.
2.1
3.5
Data obtained from air-flow tests indicated that the blast effects extended
at least to the peripheral holes at an approximate distance of 52 feet in the
test area. These beneficial effects resulted from the shock waves and sudden
liberation of about one million cu. ft. of gaseous products from detonating
190 quarts of liquid explosive. Cooperative efforts to study the seismic
effects from confined underground explosions are being initiated.
An assumed configuration of the area in which 190 quarts of NGI was
displaced into the porous zone is shown in figure 4. This configuration was
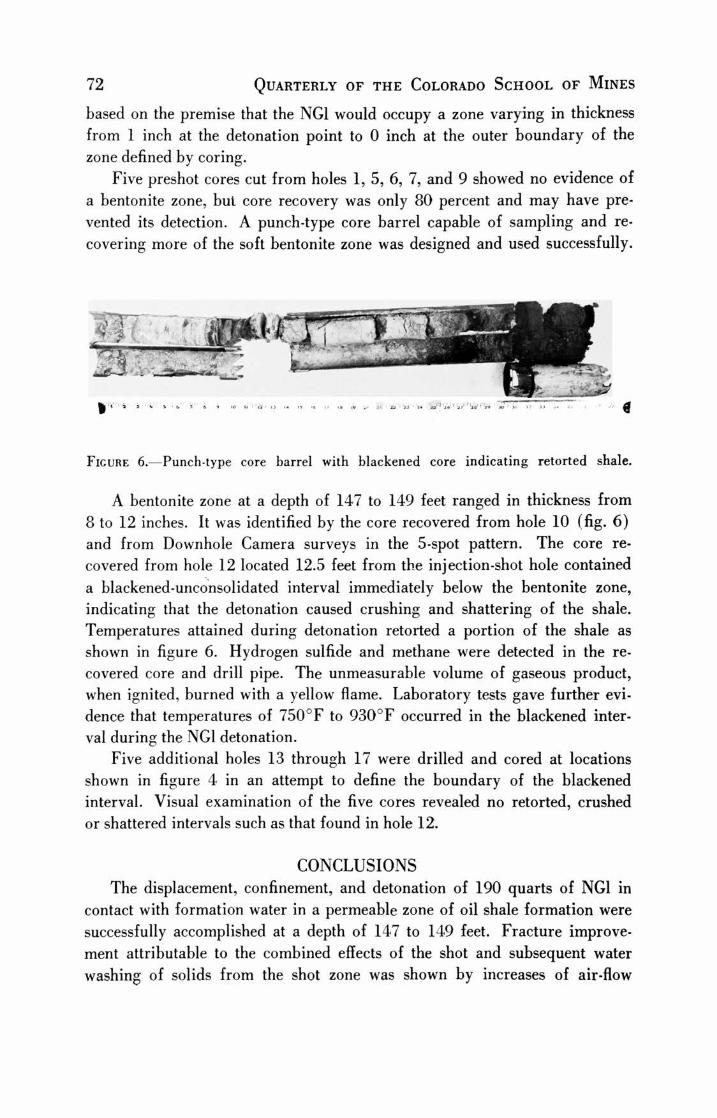
72 Quarterly of the Colorado School of Mines
based on the premise that the NGI would occupy a zone varying in thickness
from 1 inch at the detonation point to 0 inch at the outer boundary of the
zone defined by coring.
Five preshot cores cut from holes 1, 5, 6, 7, and 9 showed no evidence of
a bentonite zone, but core recovery was only 80 percent and may have pre
vented its detection. A punch-type core barrel capable of sampling and re
covering more of the soft bentonite zone was designed and used successfully.
*
Figure 6. Punch-type core barrel with blackened core indicating retorted shale.
A bentonite zone at a depth of 147 to 149 feet ranged in thickness from
8 to 12 inches. It was identified by the core recovered from hole 10 (fig. 6)
and from Downhole Camera surveys in the 5-spot pattern. The core re
covered from hole 12 located 12.5 feet from the injection-shot hole contained
a blackened-unconsolidated interval immediately below the bentonite zone,
indicating that the detonation caused crushing and shattering of the shale.
Temperatures attained during detonation retorted a portion of the shale as
shown in figure 6. Hydrogen sulfide and methane were detected in the re
covered core and drill pipe. The unmeasurable volume of gaseous product,
when ignited, burned with a yellow flame. Laboratory tests gave further evi
dence that temperatures of 750F to 930F occurred in the blackened inter
val during the NGI detonation.
Five additional holes 13 through 17 were drilled and cored at locations
shown in figure 4 in an attempt to define the boundary of the blackened
interval. Visual examination of the five cores revealed no retorted, crushed
or shattered intervals such as that found in hole 12.
CONCLUSIONS
The displacement, confinement, and detonation of 190 quarts of NGI in
contact with formation water in a permeable zone of oil shale formation were
successfully accomplished at a depth of 147 to 149 feet. Fracture improve
ment attributable to the combined effects of the shot and subsequent water
washing of solids from the shot zone was shown by increases of air-flow
Explosive Fracturing Tested in Oil Shale 73
rates across the test pattern. The fracture- improvement ratios averaged 3.5
for the six holes tested.
A relationship between neutron-log response and permeability was used
to identify and select the permeable zone into which NGI was displaced.
Conventional coring techniques proved inadequate in recoveringthin-
porous, soft-unconsolidated bentonite and retorted oil shale zones.
Extensive postshot coring and clean-out operations revealed no evidence
of liquid explosive.
The increased permeability obtained as a result of this experiment is a
step forward toward the goal of fracturing oil shale to create permeability
needed for the application of in situ combustion in underground retorting.
This study revealed a need for further investigations into the areas of loginterpretation, coring techniques, and fracture evaluation in oil shale.
ACKNOWLEDGMENTS
The authors wish to express their appreciation to the American Gas As
sociation, Office of Naval Petroleum and Oil Shale Reserves, Laramie Petro
leum Research Center of the Bureau of Mines, and the Oil Recovery Com
mittee of the IPAA for their cooperation and technical assistance. Further
appreciation is expressed to the Union Pacific Railroad Company for use of
their land for the experiment and to the American Torpedo Company of
Oklahoma, C. L. Jones Drilling Company, and Seismograph Service Corporation for their technical assistance and advice.
REFERENCES
1. Bardsley, S. R., and Algermissen, S. T., 1963, Evaluating oil shale by log analysis:
Am. Inst. Mining, Metall. and Petroleum Engineers Trans. 228, p. 81-84.
2. Bleakley, W. B., 1966, Nitro may lead the way to shale-oil recovery: Oil and Gas
Jour., v. 64, no. 36, p. 184-186, Sept. 5.
3. Brandon, C. W., 1962, Method of explosively fracturing a productive oil and gas for
mation: U.S. Patent 3, 066, 733, Dec. 4.
4. Brewer, B., 1957, Stimulation of oil production by the use of explosives after
hydraulic fracturing: Producers Monthly, v. 21, no. 4, p. 22-23, Feb.
5. Eakin, J. L., and Miller, J. S., 1967, Explosives research to improve flow through
low permeability rock: Drilling and Rock Mechanics Conf., 3d, Univ. Texas,Paper SPE 1715, Jan. 25-26.
6 Hinson F R., 1962, Method and apparatus for treating an earth formation pene
trated by a well : U.S. Patent 3,191,678, April 2.
7. Nicklen, C. 0., 1946, History-making blast set off February 4: Oil Bulletin, Bull.
432, p. 1-2, Calgary, Canada, Feb. 8.
8. Sohns, H. W., and Carpenter, H. C, 1966, In situ oil shale retorting: Chem. Eng.
Prog., v. 62, no. 8, p. 75-78, Aug.
9. Oil and Gas Journal, 1966, Space-age explosives may revive well-shooting: Oil
and Gas Jour., v. 64, no. 38, p. 6, Sept. 19.

THE CHARACTERISTICS OF A LOW TEMPERATURE
IN SITU SHALE OIL
George Richard Hill and Paul Dougan
1967 by American Institute of Mining, Metallurgical & Petroleum Engineers.
ABSTRACT
A40
A.P.L crude shale oil has been produced from the Green River
Formation in the Piceance Creek Basin of Colorado by injection of hot
natural gas at a controlled temperature. The quality of the shale oil differs
very markedly from the customary shale oil from the same formation pro
duced in a high temperature retort. The characteristics of the oil fractions
have now been determined. These include distillation analyses, viscosity, and
pour point determination.
Kinetic data on the production of the shale oil under the conditions
used in the field, but carried out on a small scale in the laboratory, will be
presented. A possible mechanism for the production of this oil, as well as
a mechanism for the production of shale oil by more usual high temperature
methods, is included.
TEXT
Various methods for the production of shale oil by in situ techniques are
being investigated in the United States. The method with which this paper
is concerned involves the use of hot natural gas as the energy conveying
medium to convert the kerogen in the oil shale to a petroleum-like liquid.
The basic concept, which was developed by the late J. L. Dougan of Equity
Oil Company and tested in the Fuels Engineering Department laboratories
at the University of Utah and subsequently field tested in the Piceance Creek
Basin of Colorado, is basically a low temperature conversion and distillation
process.1
Natural gas is heated to a temperature below its thermal decom
position temperature and injected through an insulated pipe into the Green
River Oil Shale formation where it loses its heat rapidly to the oil shale,
gradually raising the temperature of theshale toward that of the injected gas.
The kerogen is converted to bitumen and finally to a low pour point, high
gravity crude oil.
Since the temperature of the natural gas is below that for thermal de
composition of the mineral carbonates in the oil shale, little C02 is produced.
University of Utah, Salt Lake City, Utah.
75

76 Quarterly of the Colorado School of Mines
The natural gas is compatible with the oil, being soluble in it ; this aids in the
penetration of the formation by the natural gas and in the heat transfer.
Since the heating gas is completely free from oxygen, no oxidation induced
polymerization of the oil occurs.
Prior to the field experiment, oil shale cores from the Piceance Creek
Basin were heated in a natural gas stream under two conditions. Some
experiments were run at a gas pressure of 300 lb/sq inch. Experiments were
also run with the gas at atmospheric pressure. In both cases it was demon
strated that the natural gas did, in fact, heat the oil shale to kerogen decom
position temperature and did convey the oil produced out of the retort and
into condenser systems. Because of the large volume of gas used as a heat
ing agent, the light ends of the produced shale oil were present at such low
partial pressures that they were not condensed in the system available in the
laboratory. The product was a waxy crude oil.
Subsequent experiments were carried out in non-flow systems or in sys
tems using minimal amounts of natural gas or helium as a conveying agent.
In these instances, yields of shale oil approaching 80 percent of the Fischer
Assay yield of shale oil from the same cores, were obtained. Typical product
evolution curves are shown in figure 1. In each case a relatively rapid, first
120 1 1 1 1
wjs Volume v. .it
100"~364,C.
80
^m+**~*353*C
-
60
40 331* C.
~
20
i i --
-
100 200 300 400 500
T (hrs.)
Figure 1. Shale Oil Decomposition Isotherms.
order kerogen decomposition occurred followed by a zero order decomposi
tion. Products continued to be evolved at a constant rate until finally almost
all of the kerogen decomposable at that temperature had been evolved. The
total distillate from these experiments had a pour point in the range of 20C
The Characteristics of a Low Temperature 77
and had an A.P.I, gravity of about 40. The nitrogen content of the low
temperature shale oil was less than 0.8 percent. Table 1 gives typical data
on product yield and quality.
Since this shale oil differed so markedly from the shale oil produced byhigh temperature retorting methods, a careful analysis was made of kinetic
studies on the production of bitumen and shale oil and gas recorded in the
literature as well as of our experiments.
Based on these studies it has been concluded that two different mechan
isms are possible for the production of shale oil from kerogen. These are
indicated in equations (1) and (2).
Kerogen - Bitumen > Oil + Gas + Residue (1)T<800F
ki k3 k4Kerogen -> Bitumen > Polymer ->
Oil'
+Gas'
+ Residue (2)T > 800F
Equation (1) involves rate constant kx for the conversion of kerogen to
bitumen and rate constant k2 for the production of oil, gas and residue from
the bitumen, and is the path followed below 800F.
Equation (2) describes the "high temperaturereaction."
This involves
the production of a polymer, rate constant k3, from the bitumen or from the
primary oil from reaction step ki. This polymer then decomposes thermally
by step k4 into a different type of oil plus gas and residue.
In the low temperature process kerogen is converted to an organic soluble
bitumen in a first order reaction with an activation energy of between 40
and 41.7 kilocalories. This step was delineated byZimmerley2
in a
temperature range of525
-690F, and By Hubbard andRobinson3
at
the Bureau of Mines in temperature range 750-890F.
If the temperature remains low, i.e., below 800F, the bitumen decom
poses to give a paraffin-like oil with a rate constant k2 the temperature de
pendence of which gives an activation energy in the range 42.5 to 48.5 kcal.
The data used for evaluating rate contant k2 and the activation energies were
those of Hubbard andRobinson,3
of DiRicco andBarrick,4
and ofCane.5
If the sample of oil shale is heated to temperatures from 84$-1150F
which is a requirement if the oil is to be produced rapidly (as it must be in
a retorting operation), the kerogen and initial oil are produced more rapidly
than they can escape from the pores and matrix elements in which they are
located. During the time of their confinement, they undergo manyinter-
molecular collisions and polymerize to give thermo-dynamically more stable

78 Quarterly of the Colorado School of Mines
products. As the heating is continued the polymer decomposes to give higher
molecular weight products on the average than the primary oil. Typical
high temperature retort oils have pour points of 80F and A.P.I, gravities of
20F.
The reaction with rate constant k.3 has an activation energy slightly
higher than that of the reaction rate constant k2. We estimate this to be in
the range of 48-50 kcal. The activation energy for this step is not deter
minable directly, however, due to the fact that when this path is followed
mechanical diffusion of the oil from the pores in the oil shale becomes rate
determining. The data of Hubbard andRobinson3
at high temperatures and
of Allred andNielsen'1
have been used to evaluate the activation energy for
the diffusion controlled slow step and it ranges, depending upon the experi
mental technique used, between 13 and 25 kcal. These data and other data
from which activation energies in other temperature ranges were calculated
are in table 2.
In the high temperature processes all of the kerogen undergoes decomposi
tion. The nitrogen atoms become an integral part of the polymer and the
thermal decomposition of this polymer gives products containing this nitro
gen well distributed among the final product molecules.
Based on the experimental results we have concluded that the nitrogen
in the kerogen is present in molecules of very high molecular weight which
tend to remain in the shale at the decomposition temperatures below 800F.
To test the polymerization mechanism concept, samples of primary dis
tillate from runs at 750F were heated to930
F in closed vessels for periods
of 0.5 to three hours. In each instance extensive polymerization occurred.
Subsequent to the laboratory experiments in which the high gravity, low
pour point, low nitrogen crude oil was produced, the Equity Oil Companyconducted a field experiment in the Piceance Creek Basin of Colorado. In
this experiment several holes were drilled into the Green River oil shale.
Hot natural gas was injected through a central hole and the gas was returned
through the peripheral holes in the matrix. The natural gas was reheated
and recycled. The observed variations in recycle efficiency are being studied.
Following a period of injection which was sufficient to heat a section of the
formation to the kerogen decomposition temperature, shale oil from the
formation was collected in a separator on the site. Samples were brought to
the Fuels Engineering Department laboratory at the University of Utah for
testing and other samples were submitted to the Atlantic Richfield Companyfor evaluation as a petroleum refinery feed stock. (Data-Table 2-16)
The oil from the field experiment was found to be essentially identical
with that produced in non-flow tests at comparable temperatures in the
laboratory experiments.

The Characteristics of a Low Temperature 79
In figure 2 we have a distillation curve for the field shale oil sample and
for a typical gas combustion retort shale oil sample. Figure 3 is a G. L. C.
temperature programmed chromatogram of the oil. Table 3 gives the pertin
ent information on the fractions collected from the atmospheric pressure dis
tillation of the oil. Additional properties of the distillate are shown in tables
4 and 5.
Tables 6 and 7 give analyses of the light ends from propylene through
the C6 family. Table 8 gives the paraffin hydrocarbon analysis of the frac
tions. In table 9 are tested olefin hydrocarbons. Table 10 gives data on
various alkylbenzenes. indans, and naphthalenes.
In table 11 are listed the product distribution for the furnace oil and
gas oil fraction of the light oil.
In order to determine the suitability of the shale oil as an oil refinery
feed stock, cuts one and two have been blended, debutanized, and hydrotreated
OOO
800
600-
Gos Combustion Retort Oi
TF
400
200
University of Utah Sample
20 40 60
VOL. % DISTILLED
Figure 2. Shale Oil Distillation Curves.
80 IOO

80 Quarterly of the Colorado School of Mines
ii
u
bDO
8Xi
CJ
34-1
COtH
V
a,
a
H
-a
bfi
2
CO

The Characteristics of a Low Temperature 81
for olefin saturation and sulphur and nitrogen removal all by calculation.
In table 12 are given the data for the resulting pretreated reformer stock.
This pretreated reformer stock has been fed into a reforming correlation using
350 lb/sq inch pressure; 7-1 hydrogen to hydrocarbon ratio; weight
space velocity of 2; with Rd 150 catalyst. The results are given in table 13.
Table 14 gives the yield data from intermediate processing as percent of
charge in a fluidized catalytic cracking unit. Table 15 is an evaluation of
finished products from the standard catalytic cracking evaluation test of
Atlantic Richfield. Table 16 completes the data from the laboratory catalytic
cracking of Equity shale oil. Two conditions were used for each oil.
We conclude from these data that this oil should be hydrotreated prior
to being cracked.
The ultimate analyses of three shale oil fractions are given in table 17.
SHALE RESIDUE
Microscopic examination of the shale residue following distillation un
confined and distillation of sample confined at 300 lbs/sq inch pressure
show interesting results.
As the kerogen decomposes and volatilizes, voids appear to be left in
the otherwise unaltered rock. These voids provide an interconnecting net
work and an internal porosity in the previously impermeable shale. The
data in table 18 are new results from oil shale retorted under confining
pressure. The final line in the table gives the data for the oil shale prior to
treatment. These results confirm the important findings ofThomas'
of Sin
clair Oil.
The porosity introduced corresponds very closely to the volume occupied
by the kerogen prior to its conversion to oil. Undoubtedly the porosity and
permeability introduced into the shale will be important in continued pro
duction of oil from the formation.

82 Quarterly of the Colorado School of Mines
Table 1. Effect of temperature on oil, yield and quality
Oil yield Oil gravity Pour point
Temp. F Time (hours) %ofF.A. API F
628 550 33.6 40.7
657 425 40.4 40.5 -49
667 159 39.1 39.4 - 9.4
687 312 52.6 41.6 - 0.4
743 71.0 71.6 37.4 - 4.0
750 88.5 72.8 39.4 - 9.4
788 38.0 72.8 38.6 - 4.0
801 37.5 78.1 27.7 +23
801*14.7 72.9 42.3 - 7.6
lOOOp.s.i.
Table 2. Energies of decomposition of oil shale kerogen
Author R R. D. Step T Range
C
*.
Zimmerley B (kx)275-365
41.7
Hubbard & Robinson (U) B (k^ 400-475 40.0
Hubbard & Robinson (U) O+G (k2) 350-450 (52.6g/t) 46.2
Hubbard & Robinson O+G (k2) 400-450 (26.7g/t) 42.4
DiRicco & Barrick O+G+B (kvk2) 250-465 45.5
Cane O+G+B (k2) 350-400 48.5
Hubbard & Robinson (A)* O+G (k2) 429-477 40.5
Hubbard & Robinson (U) O+G v^2> *g,*^4* 450-525 (52.6g/t) 27.0
Hubbard & Robinson (U) O+G (k3,k4) 475-525 (26.7g/t) 19.0
Allred andNielson* O+G (k3,k4) 477-531 25.8
Allred andNielson*
O+G (k4) 531-616 13.6
This research G 331-427 27.0
Hubbard & Robinson (U) G 400-525 22.0
1-R*Tr, ( \ = V y-
ntViprc arp all In (im = -lrtwi
X
R kerogen
(U) Calculated at Univ. of Utah from data in reference.

The Characteristics of a Low Temperature
Table 3. Equity shale oil distillate cut properties
83
Cut Over-180F 180-360F 360-420F 420-580F 580+F
Crude Range
Volume %
Crude Yield
Volume %
Gravity-0API
Percent
Sulfur
Percent
Nitrogen
Research
Octane 0 cc
o cc
0.5-2.5 2.5-28.9 28.9-42.0 42.0-81.0 81.0-100
2.0 26.4 13.1 39.0 19.0
73.7 52.9 43.8 36.6 30.3
0.13 0.40 0.36 0.70
0.01 0.16
42.5
56.9
0.37
38.9
51.4
J0.5 percent H20 and gas
"'Octane on blends of cuts 1, 2 and 3 = 40.0
0.36
Table 4. Equity shale oil distillate cut properties
0-360F 360-580JF 580-995o.F955
+
Yield on Crude,
Vol. Percent 28.5 52.4 18.4 0.7
API 54.2 38.2 30.9 0.4
Sulfur, Wt. Percent 0.61 0.75 (High)
Nitrogen, Wt. Percent
(Total) 0.36 0.75
CFRR, Oa Tel 40.5
Rams. Carb. Res. 0.13 0.17
[ 299 SSU @ 275F
Viscosity < 1900 SSU @ 210F
65000 SSU @ 122F
RI at 67C Ut7050
RI at 80C 1.4635
Pour, F -15 60
Bromine # 17 10.7

84 Quarterly of the Colorado School of Mines
Table 5. Equity shale oil distillate cut properties
0-360F 360o-580F580
-955F
Distillation atm 10 mm
IBP
5
10
20
30
40
50 265
60
70
80
90 325
95
EP
Rec.
400 290
413 334
420 340
430 352
438 362
448 372
459 382
471 394
486 408
503 428
525 460
541 492
564 530
98 91
Table 6. Equity shale oil analysis
Cut Over-180F
Propylene 0.1
Propane 0.4
AV Butylenes 0.1
i Butane 1.0
n Butane 4.2
Pentanes 2.0
i Pentane 5.7
n Pentane 11.7
Cyclopentane
Light Ends by POD
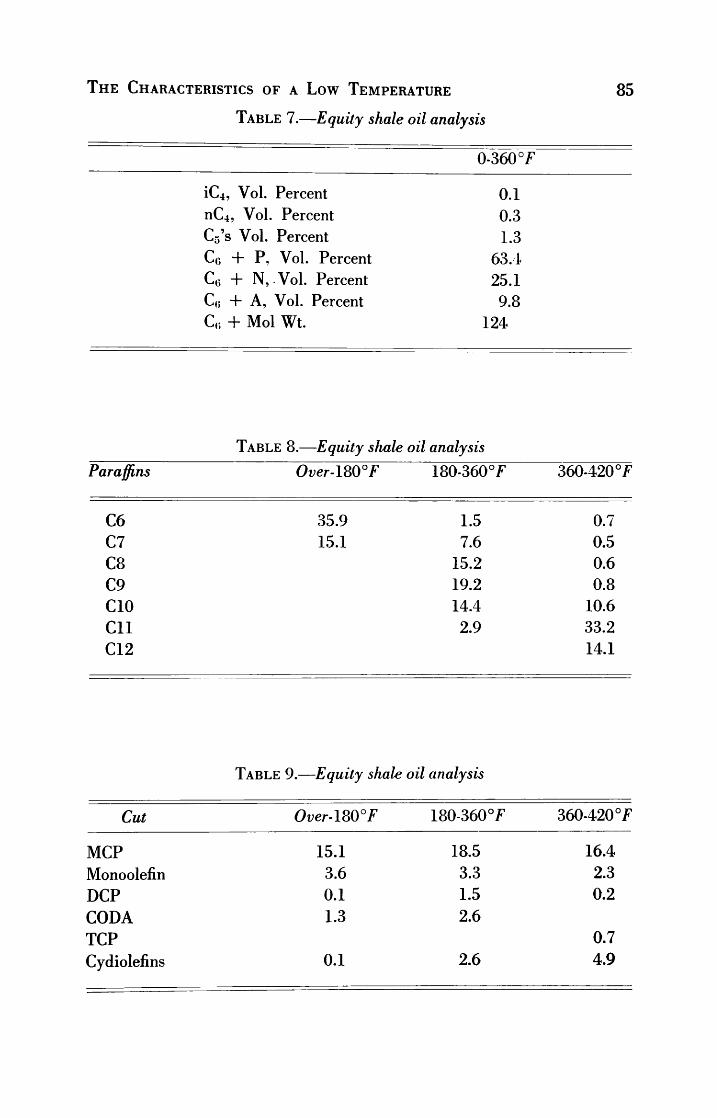
The Characteristics of a Low Temperature
Table 7. Equity shale oil analysis
85
0-360F
iC-i, Vol. Percent 0.1
nC4, Vol. Percent 0.3
C5's Vol. Percent 1.3
CG + P, Vol. Percent 63.4
C6 + N,.Vol. Percent 25.1
C<; + A, Vol. Percent 9.8
CG + Mol Wt. 124
Table 8. Equity sliale oil analysis
Paraffins Over-lS0F 180-360F 360-420F
C6 35.9 1.5 0.7
C7 15.1 7.6 0.5
C8 15.2 0.6
C9 19.2 0.8
CIO 14.4 10.6
Cll 2.9 33.2
C12 14.1
Table 9. Equity shale oil analysis
Cut Over-lS0F 180-360F 360-420F
MCP
Monoolefin
DCP
CODA
TCP
Cydiolefins
15.1 18.5 16.4
3.6 3.3 2.3
0.1 1.5 0.2
1.3 2.6
0.7
0.1 2.6 4.9

86 Quarterly of the Colorado School of Mines
Table 10. Equity shale oil analysis
Cut Over-lS0F 180-360f 360-420F
Alkvlbenzene
C6 3.1 0.3 0.1
C7 0.5 1.8 0.5
C8 3.1 0.9
C9 3.6 2.1
CIO 1.0 3.9
Cll 0.1 2.5
C12 0.5
Indans 0.3 3.6
Napthalene 0.4 0.9
Table 11. Equity shale oil analysis
Furnace Oil Gas Oil
360-580F 580-955F
Volume % Crude 42.1 19.0
Analysis
Normal Paraffin 31.5 0.8
Isoparaffin 13.8 38.3
Mono and non-condensed Cycloparaffin 18.8 15.3
Polycycloparaffins 2.3
Olefins 4.6 5.1
Mono Aromatics 25.0 21.6
Naphthalenes 5.6 8.5
Phenanthrenes 0.7 6.0
Benzanthrenes + 5 ringers 1.0
Chrysenes and Pyrene 1.1
Total Arom. 31.3 38.2
Mono Ar. in total percent 80.0 56.5
NP + IP 49.9 44.2

The Characteristics of a Low Temperature 87
Table 12. Equity shale oil pretreated reformer stock
(Blends of Cuts land 2)
Volume Percent
C5's 1.3
C6 + Paraffin 63.8
Napthalenes 25.1
Aromatics 9.8
54.2
API
50 Percent at 285F
90 Percent at 325F
40.5 Clear Octane
Table 13. Reformer product qualities ( calculated
85 90 95
C5+F-l 0 cc Wt Vol Wt Vol Wt Vol
H2 1.5 1.6 1.7
Cx 1.1 1.5 1.8
c2 1.8 2.4 3.2
c3 2.5 3.7 3.0 4.5 3.6 5.4
c. 2.4 3.2 2.9 3.8 3.4 4.5
c4 9.3 11.4 13.7
C5+ API 47.1=.7923
45.3=:.8003 43.1=.8104
c5+ 90.7 87.2 88.6 84.4 86.3 81.1
C5's in C5+ 5.6 6.9 8.5
C5+RVP 2.5 2.8 3.3
F-l 3 cc 95.5 98.4 101.2(W)
F-2 0 cc 77.4 80.7 84.0
F-2 3 cc 86.8 89.2 91.5
St. Temp. 910 923 938
BBL/ # Lives-
First Cycle 36 20 11
BBL/#Lives-
Ult. 150 85 45

88 Quarterly of the Colorado School of Mines
Table 14. Intermediate processing yields as percent of charge Equity shale
oil
Process Reforming 853 FCCU Cracking (Pace)
Charge stock Reformer stk."Normal"
gas"Long"
gas
oil (taking oil (includes
virgin F.O.M. virgin F.O.M.)
"as such")"
Cut pts. 0-360F 580-955F 360-955F
"
% Crude 28.54 18.55 70.95
Products
Hydrogen (SCF/B) 614.6
Therms/Bbl. 2.21 4.06 1.50
Propane 5.34 3.75 3.45
Propylene 5.00 3.00
n-Butane 2.89 1.50 1.95
i-Butane 1.78 3.15 4.65
Butylene .95 1.60
Gaso. Comp (C5+) 84.85 46.30 43.60
F.O.M. 33.70 41.10
Gaso. Comp. Properties
RON0 85.00 91.91 80.92
RON3 95.23 97.65 87.20
MON0 77.93 82.38 75.07
MON3 88.09 87.48 80.01
RVP 3.26 4.37 4.62

The Characteristics of a Low Temperature 89
Table 15. Standard catalytic crackingevaluation-finished products Equity
shale oil
Virg. FOM Virg. FOM
as FOM to GO
Reg. Gasoline. B/B of Crude .384 .660
FOM,ff
.588 .291
Plant Fuel,//
.030 .029
#6 Fuel.//
-.023 -.023
Propane,/r
.022 .038
n-Butane,//
-.031 -.038
Hydrogen, MCF/B (.25) (.23)
Gas, Therms/B (3.6) (5.0)
Gas and Loss.030 .043
Total 1.000 1.000
Table 16. Laboratory catalytic cracking of Equity shale oil
360-580f Furnace oil 580-955F Gas oil
430F Conversion
Vol. Percent 21.6 29.7 26.6 38.3
Wt. Percent coke 3.4 4.4 5.7 7.7
Wt. Percent C3
and lighter 2.1 3.8 3.5 5.1
Vol. Percent C4's 2.9 5.5 4.6 7.0
Vol. Percent C-,
to 430F 40.4 39.5 16.3 22.5
Table 17. Equity shale oil fractions ultimate analysis
Fraction S O C H N
Carbon
Residue
Gasoline (<354F)
Kerosene (354-473F)
Residue >473F
0.52
0.72
0.67
0.64
0.75
0.55
85.4
83.6
86.2
14.1
13.3
12.8
0.5
0.8
1.1
0.1
1.3
2.0

90 Quarterly of the Colorado School of Mines
Table 18. Retorted oil shale under confining pressure
Time
Above Retort Volume Weight Induced Permeability650F Temp. Change Loss Induced Whole
Hours F % % Porosity PlugMd. CoreMd.
4o 805 +3.2 15.32 28.4 0.3 46
48 799 +1.9 16.28 26.8 0.1 128
40 800 +2.7 15.38 27.6 0.1197*
0 75 0 0 0.8 0.0 0
*
Cleavage parted core completely
REFERENCES
1. Hill, G. R., Johnson, D. J., Miller, L., and Dougan, J. L., 1967, Direct productionof low pour point high gravity shale oil: I.E.C. Product Research and Devel.,.
6, p. 52-59.
2. Zimmerley, S. R., 1923, Chemical dynamics of the transformation of the organic
Matter to bitumen in oil shale: M. S. Thesis, Univ. Utah.3. Hubbard, A. D., and Robinson, W. E., 1950, A thermal decomposition study of
Colorado oil shale: U.S. Bur. Mines Rep. Inv. 47441.
4. DiRicco, L., and Barrick, P. L., 1956,; Ind. Eng. Chem., v. 48, p. 1316.5. Cane, R. F., 1951, Oil shale and cannel coal: Institute of Petroleum, London
v. 2, p. 592.
6. Allred, V. Dean, and Nielson, G. L, 1965, Chem. Eng. Progr., Symposium Ser., v.54, p. 160.
7. Thomas, G. W., 1965, The effects of overburden pressure on oil shale during under
ground retorting: Soc. Petroleum Eng. of AIME, preprint, SPE 1272, Oct.

SHALE OIL DEVELOPMENTS:
KINETICS OF OIL SHALE PYROLYSIS
V. Dean Allred
Reprinted from CHEMICAL ENGINEERING PROGRESS, August 1966.
Colorado oil shale consists of organic matter embodied in an inorganic
matrix. This organic material is a complex mixture with an ultimate analysis
of about 76 percent carbon, 10.5 percent hydrogen, 9.5 percent oxygen, 2.6
percent nitrogen, and 1.4 percentsulfur.12
Although largely insoluble in
common organic solvents, it does have soluble and insoluble fractions. How
ever, the soluble material normally amounts to only about 8 to 10 percent byweight of the total organic matter
present.3
The soluble fraction is often
called natural bitumen while the insoluble fraction is commonly referred to
as kerogen.
Upon heating, the organic materials both the natural bitumen and the
kerogen decompose into water, carbon dioxide, liquid hydrocarbon, and a
carbonaceous residue. A typical oil shale (26.7 gal/ton assay) will yield,
upon heating at about900
F, the products shown in table 1.
Table 1. Pyrolysis products from Colorado oil shale (3)
Material
Solids (ash)
Devolatilized shale
Carbonaceous matter
Subtotal
Vapors (volatile matter)
Water
Gases
Oil
Subtotal 14.3% 87%
Grand total
=
100% 100%
We
Total shale
ight percent
Organic portion
83.5
2.2 13
85.7%
1.4
2.5
10.4
13%
9
15
63
Marathon Oil Co., Littleton, Colorado.
91

92 Quarterly of the Colorado School of Mines
UNRAVELING THE KINETICS
The mechanism and rate by which the pyrolysis of oil shale takes place
has naturally been of considerable interest and has been investigated on oc
casion during the past fiftyyears.34 5 6
However, with the very complex
nature of the organic matter, the unraveling of these kinetics has not been a
straightforward matter. Generally, past investigations have led to the con
clusion that upon heating kerogen decomposes by a consecutive reaction into
bitumen which in turn decomposes to form the final products of oil, gas, and
a carbonaceous residue on the spent shale. This can be represented as
follows:
kx k2Kerogen -> Bitumen -> Oil, gas, and carbon
Further, the reaction rate has generally been treated as though it were first
order with respect to the concentration (weight fraction) of kerogen in the
formation of bitumen and also first order with respect to pyrolysis of bitumen
in the subsequent formation of oil and gas. However, critical examination
of some of the data, particularly that of Hubbard and Robinson, seems to
indicate that this is not the case and that actually a more complex mechanism
is invol)lved.3
COMPONENTS OF PYROLYSIS
With regard to the work of Hubbard and Robinson, it is a particularly
significant investigation and these men are to be complimented on their ex
perimental work. Of particular interest is their data for the formation of the
various components of pyrolysis, e.g., the bitumen, oil, and gas with time
and temperature. However, it is somewhat unfortunate that they did not carry
their evaluation a little further and calculate the amount of kerogen re
maining and the carbonaceous residue formed, since these data can be ob
tained from a simple material balance.
A critical examination of their data yielded the following observations :
(1) The weight fraction of the total kerogen appearing as bitumen plus
oil and gas became constant at the time the bitumen concentration reached
a maximum. This was interpreted to mean that little or no carbonaceous mat
ter was formed after this time. It was also interpreted further to indicate
that at this point all of the kerogen has been converted to bitumen, gas, and
carbonaceous residue.
(2) The weight fraction of oil and gas combined at the point of maximum
bitumen concentration was nearly equal to the weight fraction of bitumen
disappearing. Therefore, about one-half of total product was produced during

Shale Oil Developments 93
this latter time period. This indicated that the kinetics of bitumen pyrolysis
should be directly related to the appearance of volatile matter during the
last half of the reaction.
MATERIAL BALANCE
Based on these observations the amount of kerogen and carbon residue
can be directly calculated from a simple material balance as follows :
WT = WK + WR + WB + W0 +WG (1)
where Wt is the weight of total organic matter, Wk is the weight of kerogen
at time t, Wr is the weight of carbonaceous residue at time t, WB is the
weight of bitumen at time t, Wq is the weight of oil at time t, and Wq is the
weight of gas at time t.
WksJVr
Wt Wt= 1 -
WB W0 W(+ +
WT WT Wt(2)
The right-hand portion of equation 2 was available from the experimental
data, therefore the amount of solid insoluble matter (kerogen and carbon
residue) as a function of time could be readily calculated. With the simple
assumption that the decomposition of kerogen and appearance of the carbon
residue each follows the same type of function, a set of curves representing
them individually was drawn. Figure 1 shows such curves. This readily
lead to the following mechanism for the pyrolysis of Colorado oil shale:
kx Gas
Kerogen >Bitumen
Carbon residue
k2
>Oil and gas
EXPERIMENTAL TECHNIQUES
To check these observations experiments were conducted using a thermo-
gravimetric analysis (TGA) technique. Application of this technique to oil
shale has been previouslyreported.7
For this particular study it was desirable
to bring the sample to temperature as rapidly as possible. This was accom
plished using finely ground samples of (100 to +115 mesh) Colorado oil
shale in an aluminum foil sandwich which were placed in a preheated furnace.
Different sizes of samples, for example, 0.25, 0.50, 1.00, and 2.00 g,
were used to determine the effect of sample size. The rate of devolatilization
would be independent of sample size if the material could instantaneously be

94 Quarterly of the Colorado School of Mines
6 8 10
TIME.MINUTES
Figure 1. Data showing the rate of disappearance of kerogen and formation of
carbon residue on the spent shale.
raised to a given temperature. Since this was not possible, it was believed that
by plotting the observed rate constants as a function of sample weight and
extrapolating the curve to zero the effect of heat transfer time on the rate
constant could be minimized. Some effect was noted due to sample size,
however, in general, it was in the same order of magnitude as experimental
reproducibility of the rate constants between samples of the same weight.
STEADY-STATE CONSIDERATIONS
The TGA technique was used to develop steady-state pyrolysis data as
well as getting kinetic data since it was felt this information was basic to
understanding the mechanism of oil shale pyrolysis. The term steady-state
pyrolysis data may be somewhat misleading since pyrolysis reactions normallygo irreversibly to completion. However, Colorado oil shale does not seem
to completely devolatilize until temperatures of about880
F are reached.
That is, for temperatures below this value the extent of volatile matter re
moved seems to approach a weight loss plateau characteristic of that tem
perature.
Figure 2 schematically shows this behavior. Upon raising the temperature
the shale again lost weight until another pseudo steady-state plateau was
reached. From a series of such determinations, data by which a curve show
ing weight loss as a function of temperature can be determined. Another

Shale Oil Developments 95
CO
CO
o
CD
TIME >-
Figure 2. Schematic of TGA trace for isothermal conditions.
method to obtain these data was to heat a sample at a very slow rate. This
gave a continuous evaluation of weight loss as a function of temperature.
Figure 3 shows such data for a sample of 29 gal/ton Colorado oil shale.
These data were obtained by heating a 4 g (100 to +115 mesh) sample
for a period of over seven hours. The average heating rate was 2.74F/min.
TRUE CONDITIONS FOR DESIGN
Naturally, these data do not represent true chemical equilibrium since,
as pointed out previously, pyrolysis reactions are not normally reversible.
Undoubtedly over very prolonged periods of time, complete devolatilization
would occur even for temperatures of around 750 to 800F; however, the
rate is extremely slow involving many hours oftime.3
From a practical stand
points at which the slope changed could be interpreted in terms of the products
assumed as representing a true condition for design considerations.
An interesting treatment of such data is to plot the weight fraction vola
tilized as a function of reciprocal temperature using the van't Hoff-type rela
tionship as follows :
InWo + WG
WT
AHi
RT+ C
Figure 4 shows such a plot which as expected gave straight lines covering
a considerable temperature range. From the slope of these lines the AHp

96
160
Quarterly of the Colorado School of Mines
CO
CO
o
<
oc
o
Colorado Oil Shale Devolatilization
Heating rate 2.74 F/ Min.
(-100 to 115 Mesh)
Nitrogen Atmosphere
. 29 G/Ton Assay
1200 1400400 600 800 1000
TEMPERATURE F
Figure 3.Typical TGA curve for devolatilization of Colorado oil shale at low heatingrates.
(combined heat of pyrolysis, vaporization, etc.) was calculated. In addition,
points at which the slope changed could be interpreted in terms of the products
being evolved.
From curves such as those given in figure 4 the temperature at which
pyrolysis of the organic matter was completed (880F) could be pinpointed
with considerable accuracy. About 70 percent of the volatile matter was
liberated in the temperature range 765 to 880F. This was predominantlythe shale oil or heavy hydrocarbon fraction. It was assumed that the AHPvalue of about 20.4 kcal/g mole in the region primarily represented the heat
required to break down the bitumen into volatile fragments as well as the
heat of vaporization, although other heat effects were undoubtedly present.

Shale Oil Developments 97
It was also desirable to differentiate between the heat of pyrolysis and the
heat of vaporization. One approach was to determine the heat used in
vaporization of the oily matter from reconstituted shale oil and spent shale.
The oil was then vaporized slowly in the TGA equipment. These data are
also given in figure 4. From this curve a direct comparison with the data
for the combined oil shale pyrolysis and vaporization was obtained. This
latter curve gave a value of 9.4 kcal/g mole for the average heat of vapori
zation. By difference this gave a value of 11.0 kcal/g mole for the average
heat of pyrolysis for bitumen.
TIME-TEMPERATURE CONSIDERATIONS
As previously noted, the data of Hubbard andRobinson3
rather con
clusively demonstrated that the devolatilization of Colorado oil shale pro
ceeds with the kerogen forming bitumen, gas, and the carbonaceous residue.
The bitumen then decomposes to hydrocarbons (gas and oil). With this in
mind, if one considers only that portion of the kerogen going to form
bitumen, the pyrolysis reaction can be simplified by considering it as follows :
CARBONATE 0IL8GAS GAS GAS
DECOMPOSITION C02, HYDROCARBONS C02 8 H20
(II30F) (880F) (765F) (530F)
AH=-8.58KCAL AH=-20.42 KCAL AH=-9.43KCAL AH =-11.29 KCAL
200
100
80
60
40
o
o
tr.
CO
20
10
>*&
i
o OIL SHALE
A SHALE OIL-
- '^-
s, A
k.
-
X***<
X^
-
-
~
A
-
&
-
A-..
1201
) 1100. 1 .
10001 1
900i
TEMPERATURE F800 700 6(l.i.
X) 5001
,400
1 1 1 1 1 1 1 1
10 II 12 13 14 15 16 17 18 19 20 21
(oKr'
Figure 4. Pseudo steady-state devolatilization of Colorado oil shale showing the
effect of temperature on weight loss.

98 Quarterly of the Colorado School of Mines
ki kKerogen >Bitumen >Hydrocarbon
or
ki k2A >B >C (3)
For the case where the reaction proceeds by first order kinetics, the rate of
change of components would give curves typical of those shown in figure 5.
Comparison of these curves with those given in figure 1 show that the shape
of the curves A/A0 and B/A0 are markedly different from those determined
experimentally. This lead to the conclusion that the pyrolysis reaction was
proceeding by a somewhat different mechanism than simple first-order
kinetics. The shape of the various curves in figure 1, suggested that a logistic
or autocatalytic function was involved.
o
cr
o
3 4 5
TIME.MINUTES
Figure 5. Typical curves for the first-order kinetics of consecutive reactions. Rate
constant kx characteristic of that predicted for data of Figure 1.
Additional insight was also gained by the observation that the kerogen
was essentially all decomposed by the time the bitumen curve reached its
maximum. This corresponded to a time when about one-half of the total

Shale Oil Developments 99
oil and gas remained to be produced. Therefore, from the point where
Wc/Wao>0.5 the rate of disappearance of bitumen was equal to the rate of
formation of final products or :
d(WB) d(Wc)- = (4)
dt dt
In which case, the rate constant k^ could be evaluated independent of the
influence of ki. Experimentally, still another advantage was gained by using
data obtained during this period. That was the temperature had time to
stabilize, thus, one was more certain of having isothermal conditions for
the determination.
FIRST-ORDER OR LOGISTIC RATE
If first-order kinetics were being followed, then the rate equation
during this period would have been as follows :
InW(
1 -
WA
= -k2t (5)
or.
In (1- X) =
-k2t
where, Wc/W^o = X. This should give a straight line with a slope equal
to k2 for the experimental data when X >0.5. Typical TGA data plotted in
this manner are given in figure 6. From the shape of this curve it was evi
dent that these data did not fit equation 5 and the decomposition of bitumen
was not a first-order reaction. On the other hand, these data did give a re
markable fit to a straight line when plotted in the logistic function :
In1 - X
-k2t + In I (6)
as is also shown in figure 6.
Further verification of the applicability of equation 6 to the pyrolysis
of Colorado oil shale is given in figure 7, where the data of Hubbard and
Robinson are plotted for a similar grade of shale pyrolyzed at the same tem
perature. Significantly, the same slope is observed as had been determined
for the data used in figure 6.
TEMPERATURE COEFFICIENT
TGA data for the pyrolysis of shale also lends itself readily to the
determination of the temperature coefficient of the reaction rate constants.

100 Quarterly of the Colorado School of Mines
I0o*o-
Pv
m
i.o
0.8
0.6
0.4
0.2
0.1
.08
.06
.04
.02
.01
o
o
CO
o
v
N:
&
N
= 892F_Sample Weight 0.5gm.
-Assay29 gal./ton
V-50% Point
o
te
\
\
N-50% Point-0-
\
_\K2=0.76Minr
\3
100
80
60
40
20
10
8
X
I00II-X)
I 23456789 10
TIME, MINUTES
Figure 6. Comparison between first-order and logistic expressions in fitting oil shale
devolatilization data.

Shale Oil Developments 101
lOO(l-X)
0123456789 10 II 12
TIME, MINUTES
Figure 7. An example of the applicability of the logistic function (Equation 6) to
experimental data of Hubbard and Robinson (3) .

102 Quarterly of the Colorado School of Mines
Such data were determined for several temperatures (890 to 1,140F) and
are given in figures 8 through 11.
These curves also show several other interesting characteristics. First,
there is a distinct break at the 50 percent volatilization point, i.e., where
(1 X)/X equals unity, indicating the validity of the previous assumption
that the kerogen was all converted at this point.
Second, there is a second change in slope at higher temperatures as
shown in figures 10 and 11. In this case these data could be fit either with
the logistic or the first-order kinetic expression, however, this is expected
since they are approximately the same value at this end of the curve, i.e.,
[( 1 X ) /X] approaches ( 1 X) in values as X approaches zero. A signifi
cant observation may be that in the first-order case the slope extrapolates to
the origin at zero time. This may indicate that reaction involved is one that
is normally fast at low temperature, relative to the other reaction, but has a
smaller temperature coefficient so that it becomes rate determining at higher
temperatures. It is suspected that this could be an actual vaporization step
which would probably be diffusion controlled and should have a fairly low
temperature coefficient.
COMPLEX REACTIONS
The third observation is that the data for the initial devolatilization, ca.
5 to 50 percent, also fit a logistic expression. The exact implication of this
is not known since both the decomposition of kerogen and bitumen are
actually taking place. However, it may indicate that the rate of decomposition
of kerogen is dependent upon the amount of bitumen present. If so, this
would be very significant since it would imply that the bitumen has a catalytic
or solvent action on kerogen decomposition.
In any event these data demonstrate that the pyrolysis reactions are
extremely complex and probably cannot be represented by a simple kinetic
expression. On the other hand, they can be broken down into fairly simple
expressions for two or three regions, depending upon the temperature. Figure
12 shows these zones together with equations that can be used to calculate a
devolatilization curve.
The effect of temperature on the rate constants for each of the rate ex
pressions is summarized in table 2. These data are plotted in a typical Arrhen
ius type plot in figure 13. As previously inferred, these data seem to bear
out that the decomposition of bitumen ceases to be rate determining at about
900F, and either the decomposition of kerogen and/or the rate of actual
volatilization of the oily fluids from the inorganic matrix gradually becomes
rate determining.

Shale Oil Developments
Table 2. Effect of temperature on specific rate constants
103
Rate constants
Temperature ki, k^, ks.
Fmin.~ min.~ min.-1
1,140 2.86 5.33 1.11
1,050 1.81 3.35 0.89
990 1.28 2.46
940 0.94 1.40
890 0.65 0.77
850*0.35
800*0.11
750*
0.037
*Obtained data from data given in reference (3)
PYROLYSIS MECHANISM
Thermogravimetric analysis has been applied to a study of the pyrolysis
of Colorado oil shale. Using very slow heating rates, pseudo steady-state
devolatilization data have been obtained. These data show a critical tempera
ture for complete pyrolysis of oil shale to be about 880F. Analysis of the
data in detail also shows a heat of pyrolysis of about 11 kcal/g mole is re
quired to convert the bitumen in oil shale to volatile hydrocarbons. In
addition, a heat of about 9.4 kcal/g mole is required to volatilize the hydro
carbons. This leads to a value of 20.4 kcal/g mole required to separate
shale oil by pyrolysis from the inorganic materials.
A critical examination of published data has led to a conclusion that in
part the mechanism by which Colorado oil shale decomposes is as follows:
kx Gas
Kerogen >Bitumen
Carbon residue
-XOilandgas) Liq.
->(Oilandgas)vaP.
At temperatures below 900F the decomposition of the insoluble organic
matter (kerogen) into the soluble bitumen is a fairly rapid step compared

104 Quarterly of the Colorado School of Mines
to the decomposition of bitumen to the hydrocarbon-like materials. However,
at temperatures above 900F the decomposition of bitumen appears to be
rapid and either the decomposition of kerogen or the physical volatilization,
i.e., boiling out of fluid from the shale as a vapor becomes the slow or rate
determining step.o
10 1
8
()
I
0.8
0.6
0.4
i
0.2
0.1
.08
.06
.04
.02
.01
^:
\
KX=0.65MA
.
\
-\
T=890F
W = 2g
X = Weight Fraction of
Total Volatiles
\Y
\
\9
\
\
\
\
\
5
X
X9
T
.K2
= 0.77 Min-i
V
\
X
\
\\
\
100
80
60
40
20
10
8
6
4
100(1 -X)
I
0.8
0.6
0.4
0.2
2.0 10.0 12.00.
4.0 6.0 8.0
TIME, MINUTES
Figure 8. Evaluation of reaction rate constants for oil shale devolatilization at 890F.
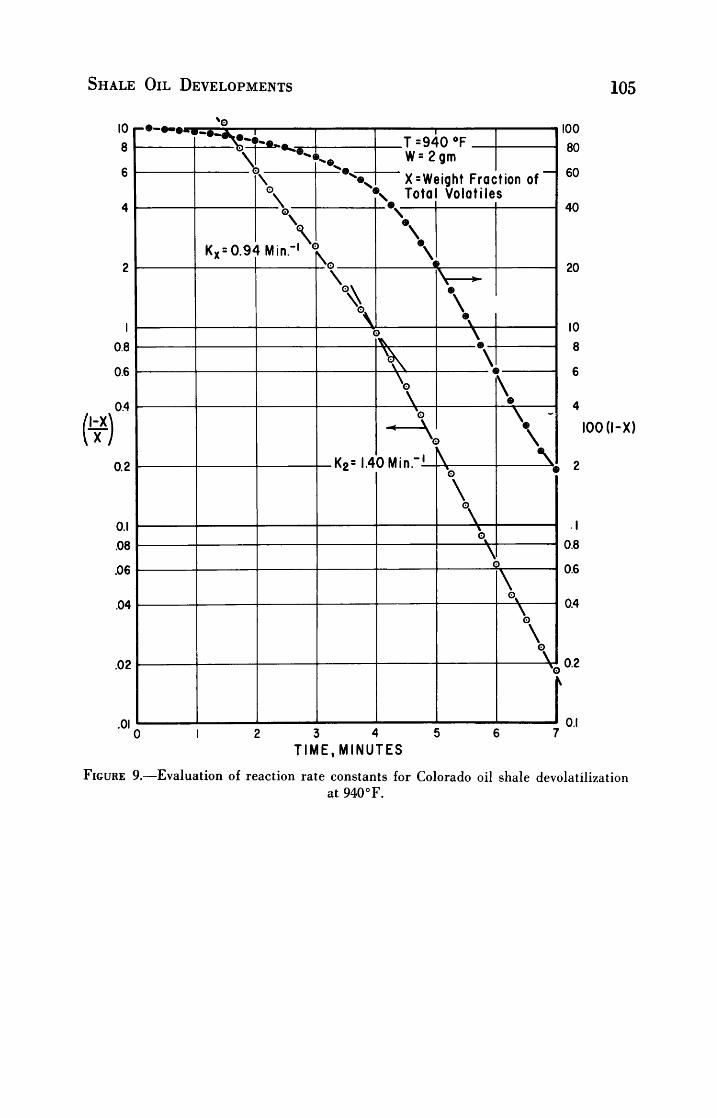
Shale Oil Developments 105
p?)
i
0.8
0.6
0.4
I
0.2
|0!--*g,+,A |
el T^p-
o.i
.08
.06
.04
.02
.01
'-.-5
_\
\
Ky = 0.94Min\
.T=940F_
W=2gm
X=Weight Fraction of
-I \D
K
\
\\
Tota
\
\
Volatiles
\
\v
60
40
\
\
\
K2=l.40Mi
\
X^
X
\^
100
80
20
10
8
6
4
100 (l-X)
V\
it
\
I
0.8
0.6
0.4
0.2
0.1
12 3 4 5 6
TIME, MINUTES
Figure 9. Evaluation of reaction rate constants for Colorado oil shale devolatilization
at 940F.

106 Quarterly of the Colorado School of Mines
2.0 3.0 4.0 5.0
TIME,MINUTES
Figure 10. Reaction rate data for oil shale devolatilization at 1,050F. Note the ap
pearance of a second point of inflection.

Shale Oil Developments 107
100(1 -X)
2.0 3.0
TIME,MINUTES
Figure 11. Reaction rate data for oil shale devolatilization at 1,140F showing three
regions with different rate constants.

108 Quarterly of the Colorado School of Mines
i.o
0.9
08
07
0.6
X 0.5
0.4
0.3
0.2
0.1
0
<-OO
or ujorsi
hot-
ido
<or
|_S2Ul
-
Xm^-e'^tx
or:
ln[l-x]=-k3tx
A
l+e'Mtso'tx)
Infxj^^t^o-tx]
XT=1l+e'Mtso-tx)
or:
ln(x)=-kx[t50-tx]
Region X
800 900 1000 1100
A'
1200
Vt ~ 10050 ...
lnf50 = T.F+460+A
A10050
50 =MeT.F+460
Region X
TIME
TEMPERATURE (F)
Figure 12. Schematic diagram showing regions with different reaction rate expres
sions as a function of weight loss and temperature.
REFERENCES
1. Stanfiield, K. E., 1951, Properties of oil shale: U.S. Bur. Mines Rept. Inv.
4825, Nov.
2. Hubbard, A. B., and others, 1952, Method of concentrating kerogen in Colorado
oil shale: U.S. Bur. Mines Rept. Inv. 4872, April.
3. Hubbard, A. B., and Robinson, W. E., 1950, A thermal decomposition study of
Colorado oil shale: U.S. Bur. Mines Rept. Inv. 4744, Nov.
4. Guthrie, B., 1938, Studies of certain properties of oil shale and shale oil: U.S.
Bur. Mines Bull. 415.
5. Maier, C. G., and S. R. Zimmerley, 1924, Chemical dynamics of the transforma
tion of the organic matter to bitumen in oil shale: Univ. Utah Bull., no. 14.
6. Carlson, A. J., 1936, Inorganic environment in kerogen transformation: Univ.
Calif. (Berkeley) Pubis. Eng., 3, no. 6, p. 295-342.
7. Allred, V. D., and Nielsen, G. I., 1965, Countercurrent combustion; a process for
retorting oil shale: Chem. Eng. Prog. Symp. Ser., no. 54, 61, p. 160-167.

Shale Oil Developments 109
Figure 13. Effect of temperature on the reaction rate constants in the devolatilization
of Colorado oil shales.


CONDUCTION HEATING OF OIL SHALE FORMATIONS
Herbert A. Lesser, George H. Bruce, Herbert L. Stone
ABSTRACT
A mathematical model that represents the conduction heating of a rock
formation of limited permeability is discussed. Heat is introduced by the
injection of a hot condensing gas into horizontal fractures through the forma
tion. The fractures are assumed to be equally spaced; the flow of fluid is
linear. The model may be used to obtain temperature histories for both
fractures and formation. Application of the model in predicting in situ
heating of oil shale is illustrated with four sample cases. Influences of
shale thermal diffusivity. fluid pressure in the fracture and fracture spacing
upon heating rate are demonstrated. In all cases considered, several years
were required to heat all the formation to 700F with 1,000F steam. Less
than 32 percent of the injected heat was utilized for heating the shale.
INTRODUCTION
The hydrocarbons contained in oil shale formations are difficult to re
cover because they are immobile solids and because the rock formations in
which they are found have very limited permeability. These hydrocarbons,
known as kerogen, can be converted through pyrolysis to recoverable liquids
and gases if the formation temperature is elevated to the range600
to
800F. To accomplish this heating, the formation might be artificially frac
tured and a hot fluid injected into the fractures. If the injection and pro
duction wells are vertical and the fractures horizontal, interwell communi
cation will be established and the hot fluid will flow from an injection well
to a production well. In this process, some of the heat in the fluid will be
given up and conducted into the formation. Products of pyrolysis will flow
from the heated rock matrix into the fractures and be produced, commingled
with the injected fluid.
The practicality of such a process is strongly influenced by the rate at
which heat can be transferred from the hot fluids to the formation. An
analysis of this heat conduction problem was the subject of a recent paper
by theseauthors.1
A brief description of the mathematical model presented
in that paper is given here, together with some numerical examples. Linear
flow of a condensing gas through a set of horizontal, equally spaced fractures
is considered. Temperature histories for both fractures and formation are
Esso Production Research Company, Houston, Texas.
Ill

112 Quarterly of the Colorado School of Mines
obtained from numerical procedures. The analysis also applies to formations
containing streaks of natural permeability instead of fractures.
Heat flow problems similar to the one treated here have been studied byother workers.
Thomas2has solved a radial problem in which he considers
the injection of a noncondensing gas into a single, horizontal fracture and
approximates the temperature profile in the fracture by a step function. The
solutions to other problems, which are less similar to the present problem than
the one treated by Thomas, have been reviewed bySpillette.3
In addition to
these mathematical studies, a field test of an in situ shale oil recovery pro
cess using hot natural gas as the injected fluid has beenreported.4
The first part of this paper is concerned with briefly summarizing the
development of the model. Details of the calculational procedure may be
found in reference 1. The second part of the paper presents results computed
for a typical oil shale formation for which steam at 1,000F is the injected
fluid. Fracture spacing, horizontal and vertical thermal diffusivities, and
steam pressure are varied to illustrate their effects on heating rate and heat
utilization.
MODEL DESCRIPTION
Equally spaced horizontal fractures are assumed present in a formation
containing immobile hydrocarbons. Except for fracture permeability or
streaks of natural permeability, the rock matrix is assumed to have essentially
no permeability. In figure 1 a cross-sectional view is shown of a typical
fracture and adjacent formation. A condensing gas is injected uniformly
along one end of each fracture, and the outlet gas (or condensed liquid) is
removed at the opposite end at a lower temperature. Vertical temperature
variations, horizontal pressure changes, and horizontal heat conduction in
the fractures are neglected. In both the fractures and formation, the presence
of oil and gas products is ignored.
In the rock matrix, horizontal and vertical heat conduction occur and
the respective thermal conductivities are different and temperature-dependent.
The formation density-heat capacity product is assumed constant. Absorption of heat by the endothermic cracking of kerogen is not included in the
model. From the work of Sohns, et.al.5
it appears that the neglected heat
(together with other, less important heat sinks) represents less than 25 per
cent of the total heat required to heat the shale to 800F, at which tempera
ture the pyrolysis is near completion. Neglect of this heat sink will lead to
a somewhat faster calculated transport of heat into the formation than actually
occurs in oil shale formations.
Initially, the formation is assumed to have the same temperature every
where. The fractures are assumed to be full of the injected fluid at forma-

Conduction Heating of Oil Shale Formations 113
Y = +h-
FLUID
IN AT
Y = 0
SHALE MATRIX
Y = -h-
s FRACTURE
SHALE MATRIX
X=0 X=L
Figure 1. Cross-section of typical fracture and adjacent shale matrix.
tion temperature. Gas at an elevated temperature is then injected into the
fractures at some specified flow rate. Heat given up by the fluid flowingin a fracture is distributed equally above and below the fracture. No -heat-
flow boundary conditions are imposed at equal distances above and below the
fracture, which are shown in figure 1 as the distance h. With these condi
tions, the problem is equivalent to that of a fracture near the center of a
system containing a large number of equally spaced fractures. Finally, it is
assumed that there is no transfer of heat between either injection or produc
ing well and the formation; i.e., the formation is heated solely by the flow
of condensing gases through the fractures.
Under the above assumptions, the temperature histories of the rock matrix
and fracture may be described by a system of three partial differential equa
tions, two functional relationships, and associated initial and boundary condi
tions. The partial differential equations represent the conservation of energy
at each point in the rock matrix, the conservation of energy at each point
in the fracture, and the conservation of mass at each point in the fracture.
The functional relationships relate fluid density and enthalpy to fluid tem
perature and vapor quality. A formal statement of the equations and the
numerical procedure used to solve them may be found in reference 1.
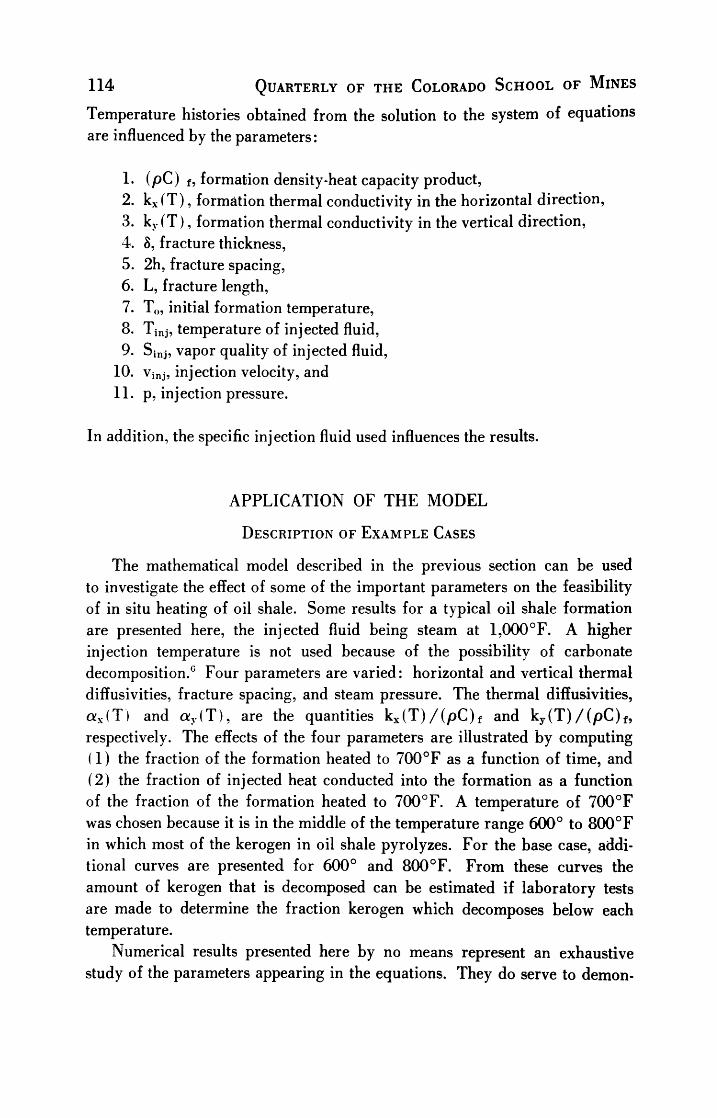
114 Quarterly of the Colorado School of Mines
Temperature histories obtained from the solution to the system of equations
are influenced by the parameters :
1. (pC) f, formation density-heat capacity product,
2. kx(T) , formation thermal conductivity in the horizontal direction,
3. ky(T) , formation thermal conductivity in the vertical direction,
4. 8, fracture thickness,
5. 2h, fracture spacing,
6. L, fracture length,
7. T0, initial formation temperature,
8. Tinj, temperature of injected fluid,
9. Sinj, vapor quality of injected fluid,
10. vinj, injection velocity, and
11. p, injection pressure.
In addition, the specific injection fluid used influences the results.
APPLICATION OF THE MODEL
Description of Example Cases
The mathematical model described in the previous section can be used
to investigate the effect of some of the important parameters on the feasibilityof in situ heating of oil shale. Some results for a typical oil shale formation
are presented here, the injected fluid being steam at 1,000F. A higher
injection temperature is not used because of the possibility of carbonate
decomposition.0Four parameters are varied: horizontal and vertical thermal
diffusivities, fracture spacing, and steam pressure. The thermal diffusivities,
olx(T) and av(T), are the quantities kx(T)/(pC)f and ky(T)/(pC)f,
respectively. The effects of the four parameters are illustrated by computing
( 1 ) the fraction of the formation heated to 700F as a function of time, and
(2) the fraction of injected heat conducted into the formation as a function
of the fraction of the formation heated to700
F. A temperature of 700F
was chosen because it is in the middle of the temperature range600
to 800F
in which most of the kerogen in oil shale pyrolyzes. For the base case, addi
tional curves are presented for600
and 800F. From these curves the
amount of kerogen that is decomposed can be estimated if laboratory tests
are made to determine the fraction kerogen which decomposes below each
temperature.
Numerical results presented here by no means represent an exhaustive
study of the parameters appearing in the equations. They do serve to demon-

Conduction Heating of Oil Shale Formations 115
strate the utility of the model and to establish the order of magnitude of
time required to sufficiently heat a typical formation.
In table 1 are parameter values which were held constant in the four
cases investigated; i.e., the values of initial formation temperature, injection
temperature and flow rate, formation density-heat capacity product, forma
tion length, and fracture width. The values of parameters which were varied
from case to case are shown in table 2. Case 1 is the base case and differs
from each of the other cases by the value of a single parameter. For this
Table 1. Values of constant parameters
T = 100F
T*inj
1000F
(Pv)inj = 1000 lb/sq fthr
(pC)t 41.2Btu/ciiftF
L 500 ft
8 :zz 0.02 ft
Table 2. Values of varied parameters
Case x (sq ft/hr) OLy (sq ft/hr) h(ft) p (psia)
1 0.015 0.010 20 1,000
2 0.015 0.010 20 400
3 0.030 0.020 20 1,000
4 0.015 0.010 10 1,000
case, ay= 0.010 sq ft/hr, the fracture spacing is 40 feet and the steam
pressure is 1,000 psia. (kx and ky are treated as a single parameter with
kx = 1.5ky. This relationship is consistent with the data ofThomas7
for oil
shale at 104F. Although kx and ky are usually temperature-dependent,
there is no general agreement for oil shale as to what this dependency is.
Hence, they are taken to be constant in the examples presented here.) Case
2 is obtained by reducing the steam pressure to 400 psia, Case 3 by doubling
ay to 0.020 sq ft/hr, and Case 4 by halving the fracture spacing to 20 feet.
To obtain the density and enthalpy functions at the two prescribed pressures,
400 and 1,000 psia, second degree equations were fit by the method of least
squares to data from Keenan andKeyes.8
A separate fit was done for each
phase with resulting curves fitting the data very well.
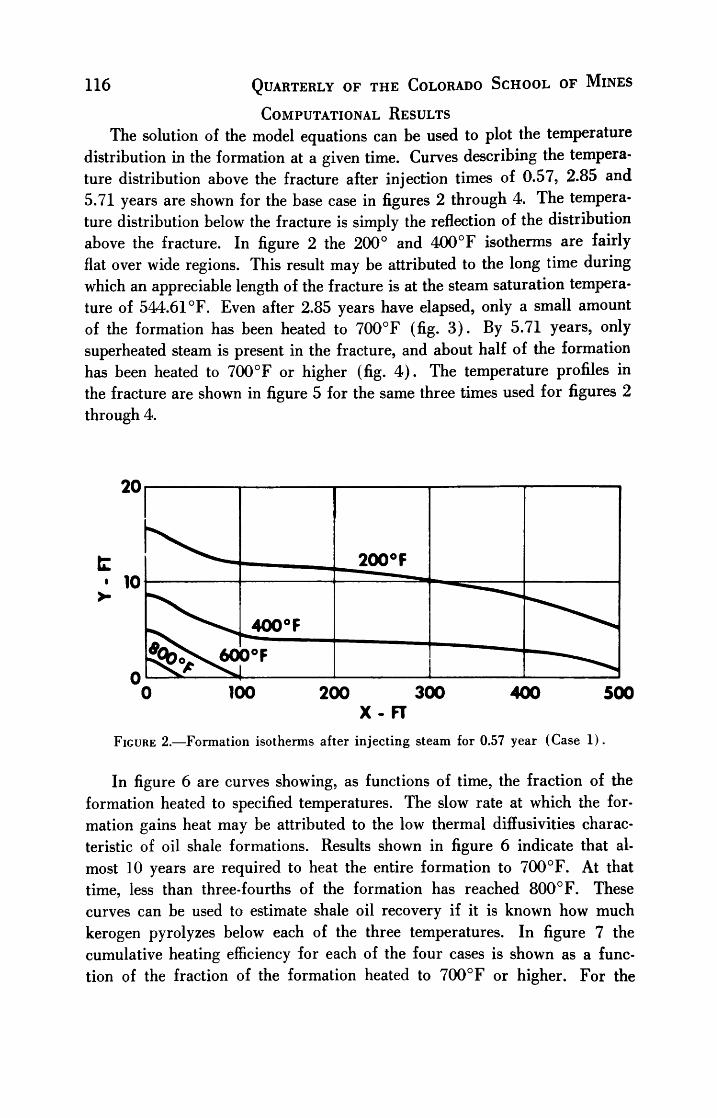
116 Quarterly of the Colorado School of Mines
Computational Results
The solution of the model equations can be used to plot the temperature
distribution in the formation at a given time. Curves describing the tempera
ture distribution above the fracture after injection times of 0.57, 2.85 and
5.71 years are shown for the base case in figures 2 through 4. The tempera
ture distribution below the fracture is simply the reflection of the distribution
above the fracture. In figure 2 the200
and 400F isotherms are fairly
flat over wide regions. This result may be attributed to the long time during
which an appreciable length of the fracture is at the steam saturation tempera
ture of 544.61F. Even after 2.85 years have elapsed, only a small amount
of the formation has been heated to 700F (fig. 3). By 5.71 years, only
superheated steam is present in the fracture, and about half of the formation
has been heated to 700F or higher (fig. 4). The temperature profiles in
the fracture are shown in figure 5 for the same three times used for figures 2
through 4.
20
10
200F
^60
400F
0F
0 100 200 300 400 500
X-FT
Figure 2. Formation isotherms after injecting steam for 0.57 year (Case 1).
In figure 6 are curves showing, as functions of time, the fraction of the
formation heated to specified temperatures. The slow rate at which the for
mation gains heat may be attributed to the low thermal diffusivities charac
teristic of oil shale formations. Results shown in figure 6 indicate that al
most 10 years are required to heat the entire formation to 700F. At that
time, less than three-fourths of the formation has reached800
F. These
curves can be used to estimate shale oil recovery if it is known how much
kerogen pyrolyzes below each of the three temperatures. In figure 7 the
cumulative heating efficiency for each of the four cases is shown as a func
tion of the fraction of the formation heated to700
F or higher. For the

Conduction Heating of Oil Shale Formations 117
200 300
X-FT
Figure 3. Formation isotherms after injecting steam for 2.85 years (Case 1)
20
500
*\600<
F
\800F
0 100 200 300 400 500
X-FT
Figure 4. Formation isotherms after injecting steam for 5.71 years (Case 1) .
y. 1000o
| 800
S 600
S 400
SATURATION TEMPERATURE \
0 100 200 300 400 500
X-FT
Figure 5. Temperature distribution in the fracture ( Case 1) .

118 Quarterly of the Colorado School of Mines
22 0.4
O B1
G"0.2<o
Figure 6. Fraction of formation heated to specified temperature (Case 1).
injection process under study, the heating efficiency is rather low. Once the
outlet temperature reaches the saturation temperature, an appreciable amount
of heat begins to be produced at the production well. Thereafter, the cumu
lative utilization of heat decreases rapidly. For Case 1, only 25.4 percent of
the heat injected is utilized over the 9.8-year period required to heat all the
formation to 700F or higher.
If an injection pressure of 400 psia is used instead of 1,000 psia, the
heating process is slowed (Case 2). This behavior results from the lower
steam saturation temperature which causes a long period of heat transfer
with a smaller temperature gradient at the fracture. In figure 8 the fraction
of formation heated to 700F or higher is depicted as a function of time
for each of the four cases. Comparison of curves 1 and 2 shows that the
lower heating rate at the lower pressure results in more time (ID/2 years)
being required to heat all the formation to 700F or higher. The600
and
800F curves are not shown; however, they are spaced about the 700F
curves like those shown in figure 6. Figure 7 shows that the heating efficiency
for the low pressure case is lower than for Case 1. Pressure changes affect

Conduction Heating of Oil Shale Formations 119
the numerical results by their effect on the density and enthalpy functions. An
ideal heat transport agent (for heating the formation to 700F) would have
a saturation temperature above 700F and a large heat of vaporization at
that pressure. Unfortunately, steam has a low heat of vaporization at a satura
tion temperature of 700F.
Doubling the thermal diffusivities'
of the formation leads to a more
rapid rise in formation temperature. This effect is illustrated by the curves
shown in figure 8 where the curve designated Case 3 was computed for dif
fusivities twice those used in computing the curve designated Case 1. The
time required to heat all the formation to 700F or higher is lowered to 8.1
years from the 9.8 years of Case 1. The curves of figure 7 show that this
diffusivity increase also leads to more efficient utilization of injected heat.
If the distance to the reflection boundaries used in calculating Case 1 is
shortened from 20 to 10 feet, a dramatic improvement in formation heatingrate results. Results of this calculation are shown as Case 4 in figure 8. Only4.1 years are required to heat all the formation to 700F compared to 9.8
years for Case 1. This change in fracture spacing results in nearly the same
heat utilization curve as was obtained for Case 3. An explanation of this
result is given in Appendix C of reference 1.
0.2 0.4 0.6 0.8 1.0
FRACTION FORMATION HEATED TO 700F OR HIGHER
Figure 7. Utilization of injected heat.

120 Quarterly of the Colorado School of Mines
1.0
oUl
5 0.8
g 0.6
<
2 0.4
Z
o
0.2
/CASE 4 ^ A/4
0 2 4 6 3
t YEARS
Figure 8. Fraction of formation heated to 700F or higher.
10
The heating efficiences for all four cases could be improved by reducing
the steam injection rate, but more time would then be required to achieve
the desired amount of heating. Efficiencies could also be increased by the
use of heat exchangers to transfer thermal energy from the production stream
to the boiler feed stream.
These numerical examples serve to demonstrate the general effect on
formation heating of one-at-a-time variations in steam pressure, thermal diffu
sivities, and fracture spacing. Results of the type obtained provide a means
for estimating the recovery of shale oil or other immobile hydrocarbons from
formations that are either fractured or have streaks of high, natural perme
ability. Optimal parameters will be determined by economics cost of drill
ing wells, inducing fractures, generating steam, etc., vs. the value of pro
duced hydrocarbons.
CONCLUSIONS
A mathematical model has beendeveloped1
for computing the tempera
ture history of an impermeable formation heated by the flow of hot, con-
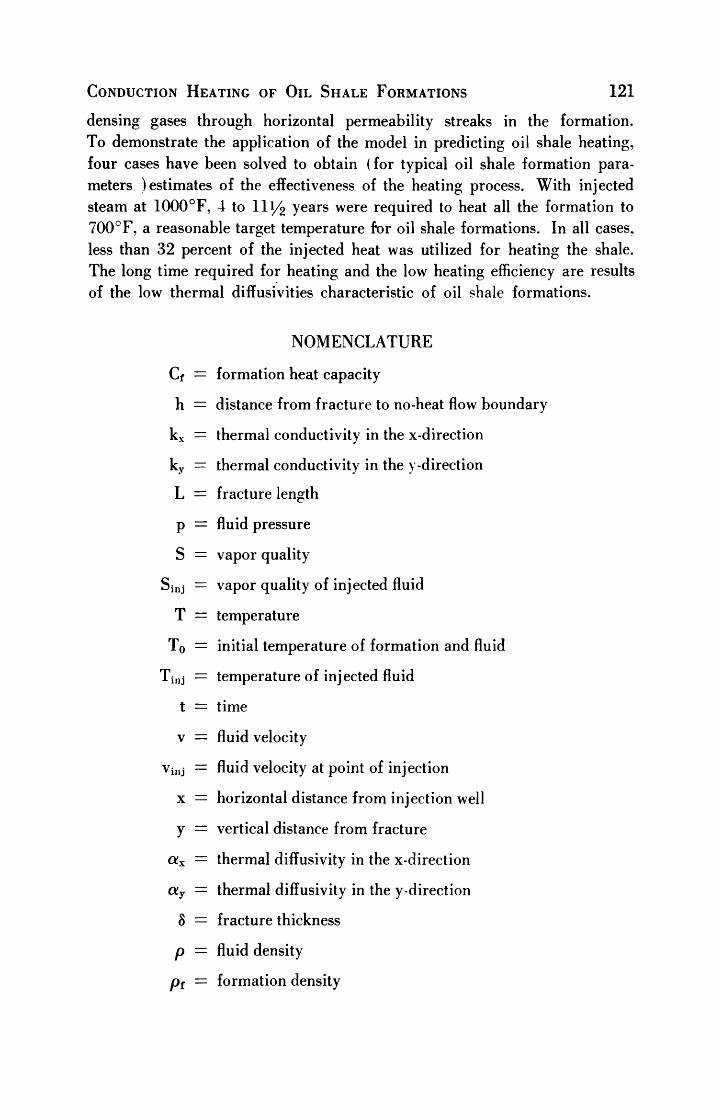
Conduction Heating of Oil Shale Formations 121
densing gases through horizontal permeability streaks in the formation.
To demonstrate the application of the model in predicting oil shale heating,
four cases have been solved to obtain (for typical oil shale formation para
meters ) estimates of the effectiveness of the heating process. With injected
steam at 1000F, 4 to ll1/^ years were required to heat all the formation to
700
F, a reasonable target temperature for oil shale formations. In all cases,
less than 32 percent of the injected heat was utilized for heating the shale.
The long time required for heating and the low heating efficiency are results
of the low thermal diffusivities characteristic of oil shale formations.
NOMENCLATURE
Cf = formation heat capacity
h = distance from fracture to no-heat flow boundary
kx = thermal conductivity in the x-direction
ky = thermal conductivity in the y-direction
L = fracture length
p= fluid pressure
S = vapor quality
Sinj = vapor quality of injected fluid
T = temperature
T0 = initial temperature of formation and fluid
Tij = temperature of injected fluid
t = time
v = fluid velocity
Vij= fluid velocity at point of injection
x = horizontal distance from injection well
y= vertical distance from fracture
ax= thermal diffusivity in the x-direction
a7 thermal diffusivity in the y-direction
8 = fracture thickness
p= fluid density
pf= formation density

122 Quarterly of the Colorado School of Mines
REFERENCES
1. Lesser, H. A., Bruce, G. H., and Stone, H. L., 1966, Conduction heating of forma
tions with limited permeability by condensing gases: Soc. Petroleum Eng. Jour.,p. 372-382, Dec.
2. Thomas, G. W., 1964, A simplified model of conduction heating in systems of
limited permeability: Soc. Petroleum Eng. Jour., p. 335-344, Dec.3. Spillette, A. G., 1965, Heat transfer during hot fluid injection into an oil
reservoir: Canadian Petroleum Tech. Jour., v. 4, p. 213, Oct. -Dec.4. Oil & Gas Jour., 1966, New in situ shale-oil recovery process uses hot natural gas:
v. 64, p. 151, May 16.
5. Sohns, H. W., Mitchell, L. E., Cox, R. J., Barnet, W. I., and Murphy, W. I. R.,1951, Heat requirements for retorting oil shale: Ind. Eng. Chem., v. 43, p.
33, Jan.
6. Jukkola, E. E., Denilauler, A. J., Jensen, H. B., Barnet, W. I., and Murphy, W. I.
R., 1953, Thermal decomposition rates of carbonates in oil shale: Ind. Eng.
Chem., v. 45, p. 2711, Dec.
7. Thomas, G. W., 1966 Some effects of overburden pressure on oil shale duringunderground retorting: Soc. Petroleum Eng. Jour., p. 1-8, Mar.
8. Keenan, J. H., and Keyes, F. G., 1936, Thermodynamic properties of steam: New
York, John Wiley & Sons, Inc.

H-OIL UPGRADING OF SHALE OIL FEEDS
K. C Hellwig, S. Feigelman, and S. B. Alpert
Reprinted from CHEMICAL ENGINEERING PROGRESS, August, 1966.
INTRODUCTION
The estimated recoverablereserve1
of a thousand-billion barrels of oil
from the Green River formation shale in Colorado, Utah, and Wyoming
periodically rekindles interest, particularly on the part of crude-deficient,
domestic oil companies. Recent announcements of a semi-works-scale plant
and future plans for a 30,000 to 60,000 barrels per day unit to obtain oil
from shale have stirred current interest.
Oil shale is a fine-grained, compact, sedimentary rock (marlstone) which
contains an organic substance, kerogen. Kerogen is only slightly soluble in
known petroleum solvents but is converted to shale oil when subjected to
temperatures above 700F.
The conventional method to recover oil from shale involves room and
pillar underground mining and above-ground retorting. Shale oil thus ob
tained must be upgraded prior to processing by conventional petroleum re
finery operations.
SHALE OIL CHARACTERISTICS
Conventional crude shale oil resembles petroleum in that it is composed
of hydrocarbons plus sulfur, nitrogen, and oxygen derivatives of hydro
carbons. Shale oil differs from petroleum in other characteristics. Shale oil
contains larger amounts of non-hydrocarbons, particularlynitrogen- and
oxygen-containing organic compounds, which may be the major constituents
in the higher boiling fractions. Shale oil hydrocarbons are highly unsaturated,
resembling the products of thermal cracking ofpetroleum.2
Crude shale oil
produced by conventional retorts contains about one weight percent sulfur and
two weight percent nitrogen. Inspections of a crude shale oil sample are
compared in table 1 with those for oil from the Athabasca Tar Sands and
vacuum bottoms from West Texas and Kuwait.
Hydrogenation provides one method to upgrade shale oil and to over
come the major refining difficulties caused by nitrogen and sulfur com
pounds. The ability of the H-Oil process to upgrade shale oil by hydrogena
tion has been demonstrated in pilot plant equipment.
Hydrocarbon Research, Inc., Trenton, New Jersey.
123

124 Quarterly of the Colorado School of Mines
H-OIL PROCESS
The H-Oil process was developed jointly by Hydrocarbon Research,
Inc. (HRI) and Cities Service Research and Development Company. The
original application envisioned for the H-Oil process was the upgrading of
hydrogen-deficient petroleum residua, but the ability of the process to up
grade other feedstocks was soon realized. Other heavy hydrocarbon feed
stocks successfully upgraded by the H-Oil process include coal tar. shale
oil. and oil extracted from Athabasca Tar Sands. H-Oil is particularly ap
plicable for upgrading shale oil because the catalyst is not deactivated bynitrogen and sulfur and the process is operable with shale oil feed containing
suspended fine solids.
Since the H-Oil process has been described in detailelsewhere34 5 6
7,
only a brief resume is presented. The H-Oil process features an ebullating
catalytic system in which the upward velocity of the gas and liquid maintains
the expanded bed of catalyst in continuous random motion. This hydrogenat-
ing system can handle any high-boiling liquid that is pumpable. Advantages
of the H-Oil system relative to fixed bed systems are:
1. Extraneous inert solids introduced with the liquid feed pass through
the reaction space and are discharged with the product. In a 30-barrel-per-
day, pilot-plant unit, tar sands oil which contained several percent of fine
sand was handled without any process difficulties.
2. Isothermal conditions are maintained throughout the reaction space in
3. Hydrogen distribution problems are eliminated throughout the reactor
by the random motion of the catalyst.
4. Catalyst can be either intermittently or continuously added and with
drawn to maintain constant catalytic activity within the reaction bed. This
prevents down time and eliminates the necessity for"swing"
reactors to per
mit changing the catalyst.
5. There is no tendency for pressure drop to increase as a result of ac
cumulated foreign materials. Tarry deposits do not accumulate on the
catalyst. Removal of inorganic matter by filtration, as required at times in a
fixed-bed system, is not necessary.
6. Active, rugged catalysts of a relatively small particle size are employed.
Catalytic poisoning effects by porphyrin complexes, nitrogen, sulfur, and
oxygen in the feed have been mitigated and catatyst life is sufficient to make
catalyst regeneration usually uneconomic.
These features make the H-Oil process a versatile system applicable for
upgrading shale oil feed.

H-Oil Upgrading of Shale Oil Feeds 125
EXPERIMENTAL RESULTS
Experimental results discussed below are based on single-stage operation;
however, a two-stage system is shown in the simplified schematic flow diagram
(fig. 1), since there are inherent advantages in a two-stage process.
Inspections for two shale oil feeds are presented in table 2: charge stock
A comprises the entire shale oil feed, charge stock B represents shale oil bot
toms with an IBP of 601F.
In single-stage operation with extinction recycling of 650F+ oil from
charge stock A, the liquid was reduced in pour point from +75 to +10F
while the viscosity was reduced from 153 to 33 SSU at 122F. Results are
presented in table 3 for charge stock A with extinction recycling of 950F+
(Case 1) and 650F+ (Case 2) oil, respectively. Inspections are given
for the total liquid product and for the individual fractions. H-Oil process
yields related to volume percent 650F material converted for single-stage
operation are shown in figure 2. Comparable results for light hydrocarbons
are presented in figure 3.
Shale oil bottoms, charge stock B, was processed to yield 97 percent of the
distillate products boiling below 950F. With a consumption of 2000 std
cu ft of hydrogen per barrel, the pour point was reduced from 110F to 70F
and the viscosity was reduced from 96 SF seconds at 210F to 45 SUS at
122F. Product inspections are presented in table 3. Single-stage operation
resulted in 60 percent nitrogen removal. No operating difficulties were ex
perienced with 0.77 weight percent ash in the feed.
Hydrogen consumption for charge stock A as a function of 650F con
version is shown in figure 4. Hydrogen production from the propane and
lighter hydrocarbons produced during upgrading of whole shale oil is in
sufficient for consumption in the H-Oil process. However, off gases from
shale retorting are expected to be sufficient to balance the hydrogen require
ment. Hydrogen balances for an H-Oil unit processing shale oil for Cases 1,
2, and 3 are presented in table 4.
Nitrogen removal in the 650F+ extinction recycle run (Case 2) was
77.6 percent. The relationship between conversion and nitrogen removal
for both single- and two-stage operations is presented in figure 5. Single-
stage data are based on laboratory results. Two-stage results are predicted
from correlations derived from extensive work on petroleum feedstocks. For
a plant processing 50,000 barrels per day of shale oil, the stoichiometric maxi
mum quantity of ammonia produced from the whole shale oil is 192 tons
per day. Based on 77.6 percent nitrogen removal, the ammonia production
is 149 tons per day. For two-stage operation, the production is predicted to
be 168 tons per day.

126 Quarterly of the Colorado School of Mines
ECONOMICS
Economics for upgrading whole shale oil (Case 2) and shale oil bottoms
(Case 3) are presented in table 5. Compressors are steam driven by steam
produced during cooling of the reactor effluent. Pumps are motor driven.
Cooling water requirements are minimized by using air coolers to condense the
steam from the turbines driving the compressors. Product streams are fuel
gas and "synthetic
Investments are on-site for the H-Oil process and include equipment to
deliver ammonia-free fuel gas and synthetic crude. Costs are incremental
and include only the H-Oil processing step.
These costs can be readily incorporated into an overall shale oil processing
scheme. No credit is taken for co-produced ammonia.
ACKNOWLEDGMENTS
The authors express appreciation to the managements of Hydrocarbon
Research, Inc., and Cities Service Research and Development Company for
permission to publish experimental data on H-Oil treatment of shale oil.
Table 1. Inspection on charge stocks
JWest Texas Kuwait Oil from
vacuum vacuum Athabasca
Source Shale oil bottoms bottoms Tar Sands
Gravity. API 18.9 10.5 7.1 6.4
Sulfur, W % 0.8 3.1 5.2 4.6
Ramsbottom carbon, W % 3.6 15.4 17.5 15.8
Vanadium, ppm 4 38 78 120
Nickel, ppm 2 22 26 70
Nitrogen, W % 1.92 0.38 0.38 0.38
Ash, W % 0.04 0.02 0.03 2.6
Hydrogen /carbon atomic ratio 1.6 1.50 1.45 1.47
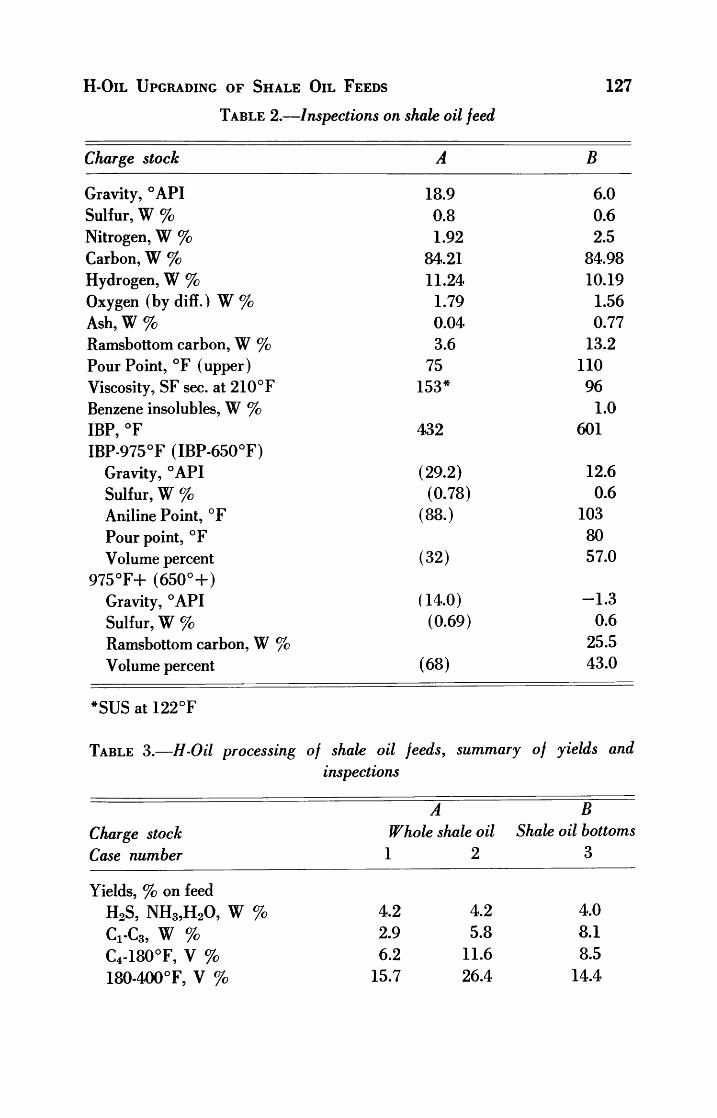
H-Oil Upgrading of Shale Oil Feeds 127
Table 2. Inspections on shale oil feed
Charge stock A B
Gravity, API
Sulfur,W %
Nitrogen, W %
Carbon,W %
Hydrogen,W %
Oxygen (bydiff.) W%
Ash, W %
Ramsbottom carbon,W %
Pour Point, F (upper)
Viscosity, SF sec. at 210F
Benzene insolubles, W %
IBP, F
IBP-975F (IBP-650F)
Gravity, API
Sulfur, W %
Aniline Point, F
Pour point, F
Volume percent
975F+ (650+)
Gravity, API
Sulfur,W %
Ramsbottom carbon, W %
Volume percent
18.9 6.0
0.8 0.6
1.92 2.5
84.21 84.98
11.24 10.19
1.79 1.56
0.04 0.77
3.6 13.2
75 110
153*96
1.0
432 601
(29.2) 12.6
(0.78) 0.6
(88.) 103
80
(32) 57.0
(14.0) -1.3
(0.69) 0.6
25.5
(68) 43.0
*SUS at 122F
Table 3. H-Oil processing of shale oil feeds, summary of yields and
inspections
A B
Charge stock Whole shale oil Shale oil bottoms
Case number 1 2 3
Yields, % on feed
H2S, NH3,H20, W % 4.2 4.2 4.0
Q-C3, W % 2.9 5.8 8.1
C4-180F, V % 6.2 11.6 8.5
180-4O0F, V % 15.7 26.4 14.4

128 Quarterly of the Colorado School of Mines
Table 3.(cont.)
Case number 1 2 3
400-650F, V % 53.8 70.5 33.4
650F+ (650-950F),,V% 30.2 .... (40.7)
950F+, V % 8.6
Total C4+liquids, V % 106.0 108.5 105.6
Hydrogen consumption, SCF/Bbl 1320 1930 2000
Inspections
Collected liquid
C4+gravity, API 36.3 43.7 28.4
Sulfur, W % 0.02 0.02 <0.07
Nitrogen, W % 0.60 0.43 1.08
Pour point, F 60 10 70
Viscosity, SUS at 122F 36 33 45
IBP-400F
Gravity, API 51.6 53.8 52.6
Aniline Point, F 124 124 120
Nitrogen, W % 0.28 0.16 0.24
Paraffins, V % 45 47 44
Olefins, V % 3 2 4
Aromatics, V % 16 15 16
Naphthenes, V % 36 36 36
400-650F
Gravity, API 34.1 34.6 28.7
Diesel Index 45 47 30
Nitrogen, W % 0.46 0.50 0.67
Sulfur, W % 0.02 0.02 <0.07
650F+ (650-950F)
Gravity, API 25.1 (18.1)
Diesel Index 40 (25)
Sulfur, W % 0.02 (<0.07)
Nitrogen, W % 0.56 (1.12)
950F+
Gravity, API 5.9
Sulfur, W % <0.07
Ramsbottom carbon.,w% 11.7
Nitrogen, W % 1.7

H-Oil Upgrading of Shale Oil Feeds
Table 4. Hydrogen balance
129
Case number 1 2 3
Items
H-Oil capacity, barrels/day 50,000 50,000 16,000
Chemical hydrogen consumption,
SCFB 1320 1930 2000
Chemical hydrogen consumption,
MMSCFD 66 97 32
20% allowance for losses, MMSCFD 13 19 7
Total hydrogen consumption,
MMSCFD 79 116 39
Hydrogen production from H-Oil
C3-MMSCFD 43 86 42
Percent hydrogen deficiency 46 26 0
Table 5. Economics for H-Oil upgrading of shale oil
Feedstock Whole shale oil Shale oil bottoms
Case number 2 3
Feed rate, Bbl/SD 50,000 16,000
Investment, $ 12,800,000 5,800,000
Costs Unit cost Req't $/yr.
1,930 9,554,000
Req't
2,000
$/yr.
Hydrogen, SCF/Bbl 30<7MSCF 3,168,000
Catalyst 1,120,000 448,000
Power, KW 0.9</KWH 11,000 784,000 3,700 264,000
Fuel, MM Btu/hr 31</MM Btu 100 246,000 34 83,000
Cooling water, gpm 1.0CVM gal. 5,500 26,000 1,800 9,000
Labor, men/shift 3.35$/hr. 4 119,000 3 89,000
Supervision & overhead 190,000 143,000
Maintenance & supplies 4.3% inv. 552,000 250,000
Insurance & local taxes 2% inv. 256,000 116,000
Depreciation 18-yr. st. line 713,000 322,000
Incremental total cost 13,560,000 4,892,000
Incremental cost, $/Bblfeed*
0.82 0.93
Ammonia Production, tons/day 149 49
*Profits are not included

130 Quarterly of the Colorado School of Mines
WHOLE SHALE OIL
Hg FOR RECYCLE
LT.HYDROCARBONS
NH3,H20,H2S
Figure l.-H-Oil upgrading ofshale oil. Schematic flow
diagram.
o
ui
UJ
o
>
0)
o
-I
UJ
o
O
o
oc
a.
o
i
0 10 20 30 40 50 60 70 80 90 100
650# F CONVERSION, VOL.*/.650* F*
IN FEED
Figure 2.-H-0U upgrading of whole shale oil. Yield distribution vs. conversion.
Single stage data.

H-Oil Upgrading of Shale Oil Feeds 131
LT. HYDROCARBONS YIELD VS. CO N VER S 10 N
SINGLE STAGE DATA
650 F CONVERSION. VOL.%650 F*
IN FEED
Figure 3 H-Oil upgrading of whole shale oil. Lt. hydrocarbons yield vs. conversion.
Single stage data.
HYDROGEN CONSUMPTION VS. C ONVERS I 0 N
SINGLE STAGE DATA
650* F CONVERSION, VOL.%650' F*
IN FEED
Figure 4. H-Oil upgrading of whole shale oil. Hydrogen consumption vs. conversion.
Single stage data.

132 Quarterly of the Colorado School of Mines
90
80
70
60
50
40
10 20 30 40 50 60 70 80 90 100
6 50 F CONVERSION, VOL.% 650F+IN FEED
Figure 5. H-Oil upgrading of whole shale oil. Nitrogen removal vs. conversion.
REFERENCES
1. Anonymous, 1964, Oil and Gas Jour., v. 62, p. 65, March 9.
2. Thorne, H. M., 1956, Pet. Ref., v. 35, no. 7, p. 155.
3. Chervenak, M. C, Johnson, C. A., and Schuman, S. C, 1960, Pet. Ref., v. 39, no.
10, p. 151-156:
4. Schuman, S. C, 1961, Chem. Eng. Prog., v. 57, no. 12, p. 49-54.
5 Hellwig, L. R., Schuman, S. C, Slyngstad, C. E., and Van Driesen, R. P., 1962,Am. Pet. Inst. Pnc, v. 42, no. 3, p. 218-230.
ti Chervenak, M. C, Feiselman, S., Wolk, R. H., Byrd, C. R., Hellwig, L. R., and
Van Driesen, R. P., 1963, Chem Eng. Prog., v. 59, no. 2, p. 53-59.
7. Hellwig, L. R., Van Driesen, R. P., Byrd, C. R., Chervenak, M. C, and Campag-
nolo, J. F., 1963, Paper presented, Am. Pet Inst. Div. Refining, 28th Mid-year
Mtg., Philadelphia, May 16.

HYDROTORTINGuse of hydrogen for
IMPROVED RECOVERY OF SHALE OIL
Warren G. Schlinger and
Dale R. Jesse
INTRODUCTION
The past two to three years have witnessed a renewal of research efforts
directed toward the development of economically attractive methods for
recovering shale oil from the vast oil shale reserves in Colorado, Utah and
Wyoming. The patent and technical literature has disclosed and described
numerous techniques for achieving these goals. Severalinvestigators1 ~ :i
have reported on the advantages of using hot hydrogen-containing gases as
a retorting fluid instead of air. Use of hydrogen permits recovery of shale
oil in yields far in excess of the Modified FischerAssay.4
It has been
demonstrated that yields in excess of 120 to 125 percent of the Fischer Assaycan be realized.
BACKGROUND
The recovery of the shale oil generally consists of three major phases;
(1) mining and transporting the crude oil shale to the primary processing
site, (2) extraction of the shale oil from the large fraction of ash and foreign
material in the raw shale and (3) refining the crude shale oil to marketable
products. Each of these steps is a major operation and contributes signifi
cantly to the cost of obtaining finished products from oil shale.
The following discussion will be directed primarily toward the second
of these phases, however, some discussion as to how the second and third
phases can be combined will be presented.
In nearly all methods for extracting the shale oil, heat is supplied by com
bustion of a portion of the carbonaceous material in the shale to break
down thermally and to distill the organic matter contained in the natural
shale. A number of retorts have been proposed and demonstrated employing
a wide range of flow conditions. However, almost without exception, heated
air has been employed to burn the residual organic material left on the shale
after a major portion of the original organic material or kerogen has been
decomposed and removed by the hot combustion gases.
It is well known that the FischerAssay4
procedure does not measure the
total hydrocarbon content of oil shales. Instead it is intended to be a labora-
Texaco Inc., Montebello Research Laboratory, Montebello, California.
133
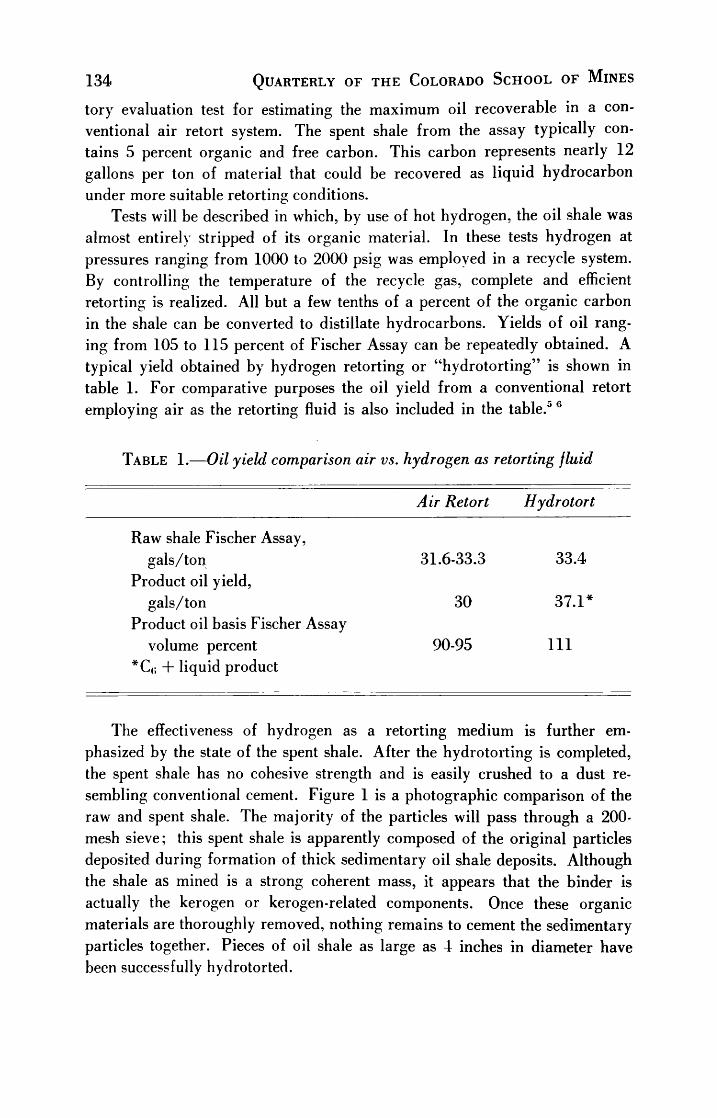
134 Quarterly of the Colorado School of Mines
tory evaluation test for estimating the maximum oil recoverable in a con
ventional air retort system. The spent shale from the assay typically con
tains 5 percent organic and free carbon. This carbon represents nearly 12
gallons per ton of material that could be recovered as liquid hydrocarbon
under more suitable retorting conditions.
Tests will be described in which, by use of hot hydrogen, the oil shale was
almost entirely stripped of its organic material. In these tests hydrogen at
pressures ranging from 1000 to 2000 psig was employed in a recycle system.
By controlling the temperature of the recycle gas, complete and efficient
retorting is realized. All but a few tenths of a percent of the organic carbon
in the shale can be converted to distillate hydrocarbons. Yields of oil rang
ing from 105 to 115 percent of Fischer Assay can be repeatedly obtained. A
typical yield obtained by hydrogen retorting or"hydrotorting"
is shown in
table 1. For comparative purposes the oil yield from a conventional retort
employing air as the retorting fluid is also included in the table/5 6
Table 1. Oil yield comparison air vs. hydrogen as retorting fluid
Air Retort Hydrotort
Raw shale Fischer Assay,
gals/ton 31.6-33.3 33.4
Product oil yield,
gals/ton 3037.1*
Product oil basis Fischer Assayvolume percent 90-95 111
*C(; + liquid product
The effectiveness of hydrogen as a retorting medium is further em
phasized by the state of the spent shale. After the hydrotorting is completed,
the spent shale has no cohesive strength and is easily crushed to a dust re
sembling conventional cement. Figure 1 is a photographic comparison of the
raw and spent shale. The majority of the particles will pass through a 200-
mesh sieve; this spent shale is apparently composed of the original particles
deposited during formation of thick sedimentary oil shale deposits. Although
the shale as mined is a strong coherent mass, it appears that the binder is
actually the kerogen or kerogen-related components. Once these organic
materials are thoroughly removed, nothing remains to cement the sedimentary
particles together. Pieces of oil shale as large as 4 inches in diameter have
been successfully hydrotorted.
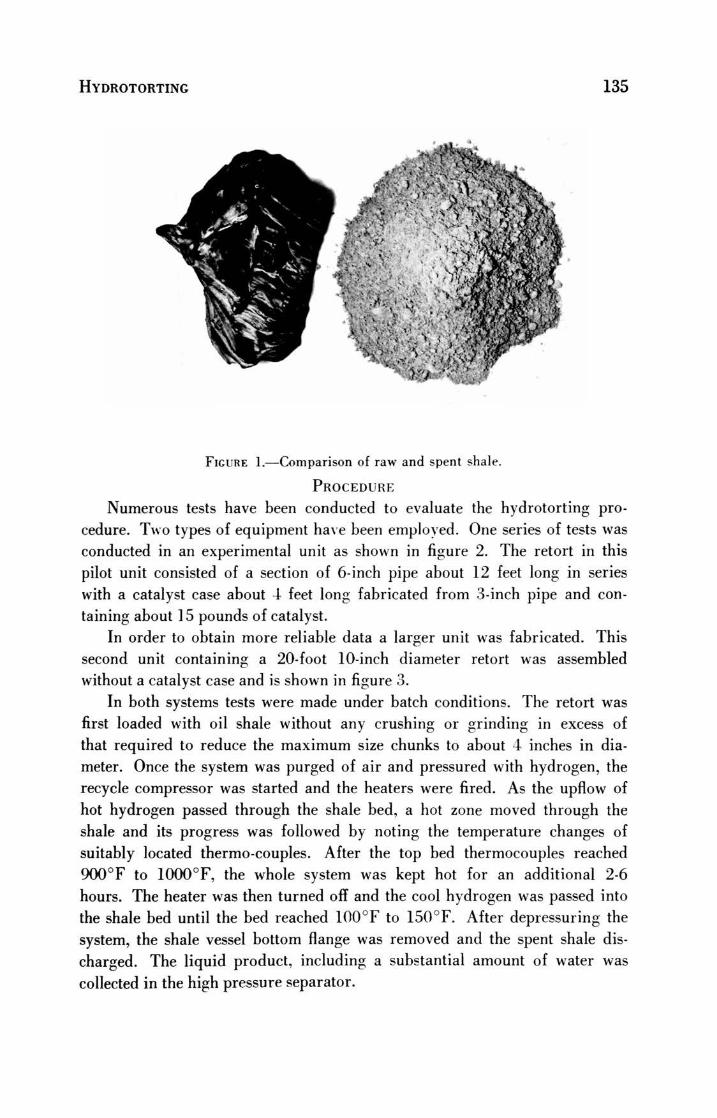
Hydrotorting 135
... >
Figure 1. Comparison of raw and spent shale.
Procedure
Numerous tests have been conducted to evaluate the hydrotorting pro
cedure. Two types of equipment have been employed. One series of tests was
conducted in an experimental unit as shown in figure 2. The retort in this
pilot unit consisted of a section of 6-inch pipe about 12 feet long in series
with a catalyst case about 4 feet long fabricated from 3-inch pipe and con
taining about 1 5 pounds of catalyst.
In order to obtain more reliable data a larger unit was fabricated. This
second unit containing a 20-foot 10-inch diameter retort was assembled
without a catalyst case and is shown in figure 3.
In both systems tests were made under batch conditions. The retort was
first loaded with oil shale without any crushing or grinding in excess of
that required to reduce the maximum size chunks to about 4 inches in dia
meter. Once the system was purged of air and pressured with hydrogen, the
recycle compressor was started and the heaters were fired. As the upflow of
hot hydrogen passed through the shale bed, a hot zone moved through the
shale and its progress was followed by noting the temperature changes of
suitably located thermo-couples. After the top bed thermocouples reached
900F to 1000F, the whole system was kept hot for an additional 2-6
hours. The heater was then turned off and the cool hydrogen was passed into
the shale bed until the bed reached 100F to 150F. After depressuring the
system, the shale vessel bottom flange was removed and the spent shale dis
charged. The liquid product, including a substantial amount of water was
collected in the high pressure separator.

136 Quarterly of the Colorado School of Mines
RECYCLE
1000-eooo psie
ACCUMULATOR
Figure 2. Flow Scheme -Catalytic Hydrotorting.
MAKE-UP
HYDROGEN
BED
TEMP.
POINTS
*900-IOOOF
20,000 SCFM
RECYCLE
tCOOLER
SHALE BED
APPROX. 400LBS
BmDIAM.XBO'LON6
IBO0F^
1000-2000 PSI6
+ 7y
&
ACCUMULATOR
OIL
WATER
Figure 3. Flow Scheme - Non-catalytic Hydrotorting.
During the test period, make-up hydrogen was added to keep the system
at the selected operating pressure. Measurement of the recycle gas com
position before and after the test run provided quantitative information on
the production of non-condensible gases. Hydrogen consumption was esti
mated by using mass spectrographic gas analyses and a material balance
on the argon present in the make-up stream.

Hydrotorting 137
Discussion
A comparison of the quality of oil produced from various retorting pro
cedures is shown in table 2. Oil produced by the Fischer Assay, a conven
tional air retort, and hydrotorting with and without catalyst are included.
As shown in the table, oil shales for the comparisons were obtained from
different areas and had varying assays. However, it is not believed that the
differences in assay values significantly affect the properties of the recovered
shale oil. There are, however, marked differences in the oil quality. As
indicated by the characterizationfactor,7
the non-catalytic hydrotort oil
Table 2. Properties of shale oil Fischer Assay air retort hydrotort
Fischer
Hydrotort
Non-
Assay Air retorf catalytic Catalytic
Gravity, API 24.1 20.7 24.5 34.2
Viscosity, SUS at 100F 73 223 61
Viscosity, SUS at 122F 41.2
Viscosity. SUS at 210F 36 46 34
Sulfur, wt % 0.98 0.77 0.56 0.12
Nitrogen, wt % 1.80 2.01 1.88 0.77
Carbon, wt % 85.23 85.44
Pour point, F 75 90 65 80
Hydrogen, wt % 11.38 11.12
Conradson carbon, wt % 2.33 4.57 4.28 0.03
Characterization factor (K) 11.42 11.45 11.37 11.9
ASTM DISTILLATION
192 402 160IBP 166
10% 336 536 278
20% 430 622 354
30% 518 692 430
40% 600 764 506
50% 655 814 568
60% 685 836 634
70% 705 865 682
80% Crackec1 889 712 710
90% Cracked Cracked
Fischer Assay, Oil shale charge,
gal/ton 33.4 32.5 33.4 42.9

138 Quarterly of the Colorado School of Mines
is more aromatic than the corresponding air retort oil. The increased aroma
ticity of the untreated hydrotort oil probably results from the added liquid
material obtained from components that typically undergo condensation reac
tion to form coke in non-hydrogen atmospheres.
Figure 4 shows the viscosity-temperature relationship of the oils obtained
from oil shale by the various processes.
The catalytically treated oil shows further increases in gravity and
characterization factor and substantial decreases in sulfur, nitrogen, and car
bon residue. In a batch type operation the catalytic treatment is inefficient
since the bulk of the shale oil tends to pass over the catalyst bed in a very
short period of time at a relatively high space velocity. Further decreases in
sulfur and nitrogen would be expected in a more uniform or continuous
operation.
A complete material balance based on the non-catalytic batch operation
is presented in table 3. The hydrogen requirement for this operation is
DUU
300
BOOFISCHERASSAYOIL
OAIR RETORT OILtoo
IOO
AiHYDROTORTOIL
TREATED
HYDROTORT OILI |
ao
60
55
SO
45
N-v.
40
>
D>
35
s
N
33
50 n7 9(0 //0 llw itO 17'0 IS>0 2IO 2.30 et
TEMPERATURE, F
Figure 4. Viscosity-Temperature Relationships for
Several Shale Oils.

Hydrotorting 139
relatively large. A little more than 1600 SCF of hydrogen are required
for each barrel of oil produced, and an additional 500-1000 SCF are required
for the catalytic treatment.
Table 3. Batch hydrotorting of oil shale material balance
Feed Streams Lbs.Gals.** SCF**
RawShale*
2000.000
Hydrogen (as 100%) 8.467 1594
Total 2008.467
Product streams
1659.700Spent shale
Ce + oil product 279.200 37.1
Water 25.000 3.0
Hydrogen sulfide 0.886 10
Ammonia 2.863 64
Methane 19.836 470
Ethane 10.494 132
Propane 7.690 66
Butylenes 0.440 3
Butanes 2.000 13
Pentanes 0.358 2
Total 2008.467
*Fischer Assay : 33.4 gallons per ton oil ; 3.0 gallons per ton water.
**
Basis 1 ton raw shale charge.
The hydrogen required for the hydrotorting phase and catalytic treat
ment of the oil from 1 ton of 33.4 gallons per ton shale could be supplied
by partialoxidation89
of about 4 gallons of the least desirable portion of
the liquid product. In addition it is estimated that the dry gas production
is sufficient to supply the fuel needs of the process.
The dry gas produced consists primarily of methane. During the tests
shown herein, the average bed temperature was 975F; by altering the
hydrotort temperature, and/or introducing components such as CO or C02
into the retorting gas the dry gas production and thus hydrogen consumption
can be changed markedly.
Table 4 presents a comparison of the elemental composition of the raw
and spent shale. The analysis includes both organic and inorganic material

140 Quarterly of the Colorado School of Mines
such as water of hydration and carbonates. The organic carbon content is
typically less than 1 per cent.
Table 4. Raw oil shale and spent shale properties
Raw oil shale Spent shale
Carbon, wt % 19.520 7.230
Hydrogen, wt % 1.965 0.265
Nitrogen, wt % 0.430 0.060
Sulfur, wt % 0.290 0.205
CONCLUSIONS
Hydrogen stripping or hydrotorting presents an effective method for
recovering oil from oil shale. Other recovery schemes fall far short of the oil
yields obtained when employing hydrogen-rich gases at elevated pressures.
This efficiency is in part due to the suppression of coke production by the
hydrogen. In addition, less net thermal energy is needed for extraction since
the endothermic decomposition of inorganic carbonates can be avoided byclose temperature and composition control of the recycle gas.
Acknowledgments
The authors wish to thank their colleagues in Texaco Inc. who assisted in
the work reported in this paper and to thank Texaco Inc. who permitted its
publication.
REFERENCES
1. Smith, L. B., Mason, R. B., Blanding, F. H., and Hemminger ,C. E., 1954, U.S.Patent 2,694,035.
2. Huntington, M. G., 1966, Colorado School Mines Quart., v. 61, no. 3.3. Schlinger, W. G., and Eastman, duB., 1965, U.S. Patent 3,224,954.4. Stanfield, K. E., and Frost, I. C, 1949, Dept. Interior Rept. Inv. 4477.5. Prien, C. H., and Savage, J. W., 1956, Chem. Eng. Prog., v. 52, no. 1, p. 15-J.6. Berg, Clyde, 1956, Chem. Eng. Prog., v. 52, p. 22-J.7. Watson, K. M., Nelson, E. F., and Murphy, G. B., 1935, Ind. and Eng. Chemistry,
v. 27, p. 1460.
8. Marion, C. P., and Slater, W. L., 1963, World Petroleum Conf., 6th. Paper no.
111-22.
9. Eastman, duB., 1956, Ind. and Eng. Chemistry, v. 48, p. 1118-1122.

PRESENT TRENDS IN ESTONIAN-RUSSIAN WORK
ON OIL SHALE
Wladislaw J. Cieslewicz
NATURE OF ESTONIAN OIL-SHALE DEPOSITS AND THEIR
COMMERCIAL EXPLOITATION
Estonian oil-shale industry had a very inauspicious start. The story is
told that at the beginning of the last century an Estonian peasant built a new
house for himself, using blocks of kukersite shale. The first time he lit the
stove, made also of the same material, everything the stove and the house
went up in smoke.
The hapless peasant did not know of course that Estonian oil shale con
tains up to 35-40 percent kerogen, of which more than 80 percent consists of
volatile components. On retorting, this organic matter gives rise to tars
(70 percent) and a vapor-gas mixture. Used as fuel, kukersite yields 2,000-
2,500 kcal/kg (Rostovtsiev, 1965).
Large-scale commercial exploitation of the oil shale started after the
Second World War when Russian Bolsheviks seized and subjugated the
Baltic countries. The Estonian oil-shale basin lies near Leningrad, Russia's
second largest city and a great industrial center. The Baltic region of Russia
has always been deficient in fuel and hydroelectric power, and in the post
war years Russia has used oil shale of occupied Estonia to meet these two
demands.
Kukersite oil shale is found in thick calcareous Late Ordovician beds of
marine origin which lie throughout the basin at depths varying from 0 to
300 m. Shale layers with thicknesses from 0.6 to 0.7 m and up are considered
commercial. Shale beds with an aggregate thickness of 3 m are also com
mon throughout the basin (Baukov, 1958) .
The Russians have developed more than 10 large underground mines
and several open-pit mines whose total annual output in 1966 reached 25
million metric tons. As of 1957 40 percent of all oil shale mined was burned
as raw fuel at industrial plants and power plants throughout the Pre-Baltic
region. The new Pre-Baltic electric power plant at Narva, which has an
annual output of 1.5 million kilowatts, is also run on oil shale. As raw
fuel for needs of the Pre-Baltic region, the kukersite shale costs about 20
percent less per heating unit than coal which must be transported from the
Instructor in Russian and German, Colorado School of Mines.
141

142 Quarterly of the Colorado School of Mines

Estonian-Russian Work on Oil Shale 143
remote Donets or Kuznetsk basins. The remaining 60 percent of oil-shale
output as of 1957 was retorted at gas generating stations and chemical
processing plants (Pravda, July 25, 1958) .
The two largest oil shale processing complexes are located at Kohtla Jarve
and at Kivyili. right in the mining area. Another gas generating combine,
retorting about 1 million tons of oil shale per year, is at Slantsy on the
Russian-Estonian border. Gas generated at these three centers is piped to
Leningrad in Russia, also to Tallin and Narva in Estonia. In 1965 the gas
works of Kohtla Jarve and Slantsy, using in part the reconstructed compart
ment kilns, produced municipal gas at the rate of 3 million cubic meters
every 24 hours. An additional 140 km of pipelines was laid in 1965 to
carry oil shale gas from Kohtla Jarve to Tallin.
Since 1958 the Leningrad area is also being supplied with cheaper fuel
brought in by pipelines from natural gas and oil fields in northern Caucasus.
The construction of another such pipeline, this time from the Second Baku
area, is scheduled for completion by the end of the current five-year plan
( 1970) . These new sources of cheap natural gas and oil pose a serious
threat to Estonian oil shale industry. Moreover, Russia's political commissars,
after 50 years of socialist economy, finally came to the conclusion that, in
the long run, production based on profit and incentive, that is on capitalism,
is the only viable economic system. Consequently, they are reluctant to
continue state subsidy of oil shale industry and are demanding profitable
operations.
CURRENT OIL-SHALE RESEARCH AND DEVELOPMENT
To this end, in the last decade or so, an extensive and continually expand
ing research program has been organized. The reduction of mining and pro
cessing costs, and the finding of new uses for oil shale and for the by-products
of oil shale processing, are the two general objectives. Several research
organizations are involved in this work. The most important among them is
the Oil Shale Institute at Kohtla Jarve. This organization is according to
Russian claims the largest oil shale research center in the world. The Oil
Shale Institute was established 15 years ago and is directed by Professor E.
Pietukhov. Among the scientists working at the Institute areAcademicians*
Hugo Raudsepp and Agu Aarna; Doctors S. I. Feingold, A. S. Fomin, A.
V. Korzhevnikov, and M. la. Gubergrits (Ogoniok, February 2, 1964). An
other prominent name among Russian oil shale scientists is Nicolai Sierie-
briannikov, the chief engineer (manager) of the Kohtla Jarve works where
the Oil Shale Institute maintains many of its laboratories and runs several
pilot plants. Many investigations on oil shale are also conducted at the

144 Quarterly of the Colorado School of Mines
Tallin Polytechnic Institute and in a number of research institutes in Lenin
grad. The above-mentioned organizations are credited with development of
several new methods and many adaptations of processes and technologies used
in petroleum industry, but not directly applicable to oil shale processing.
Several different institutes of the Academy of Science and of the Ministries
of Fuels and of Mining are also working on problems of oil shale industry.
The principal research and development aims are as follows:
MINING
A. Modernization of underground mines
Because of antiquated methods, the costs of mining kukersite shale are
disproportionately high and the progress in reducing these costs is slow. Be
tween 1959 and 1965 (last seven-year plan) the mining cost per ton of shale
went down only 13.7 percent. The Oil Shale Institute and various mining
institutes are carrying out considerable research work to bring about further
improvement. A cursory review of a recent publication describing 14 dif
ferent mining research projects shows concentration of effort on the followingproblems: development of cutters, loaders, and other machinery specially
designed for oil-shale mining to replace coal and ore mining machines used
until now: studies of room and pillar methods; mechnical ore dressing in
cluding separation in heavy media; wet jiggling and screening; improve
ments in blasting techniques; express methods of ore-grade control on con
veyors ; and automation techniques.
A new and fully mechanized mine is now being developed near Kohtla
Jarve. When completed, this mine will cover an area of 50 square miles and
have 30 miles of conveyor belts : it will produce 33,000 metric tons of shale
per day mined by room and pillar method. Surface buildings and installa
tions will be made to constitute self-containing units to facilitate servicing and
repairs. Three more mines of this type are planned (the magazine: Soviet
Union, no. 187. September, 1965). Modernization of older mines is gradu
ally taking place; notably, hand sorting of shale is being replaced by me
chanical separating in heavy medium (magnetite suspension) (Ogoniok,
August 28, 1966). The Russians claim that as a result of improvements al
ready made, the monthly output per miner at Kohtla Jarve reached 117
tons (Ogoniok, February 2, 1964) .
B. Development of open-pit mining
Although large-scale open-pit mining operations started only several years
ago, they already account for about 30 percent of the oil shale mined. The
Memhers of the Russian Academy of Science.

Estonian-Russian Work on Oil Shale 145
largest open-pit mine is located in Kohtla Jarve area. Specially built draglines, the ESh-15/90 with 15 m3 bucket and 90 m boom, are employed. In
1963, which was the first year of ESh-15/90 operation, the dragline workingin the pit Estonslaniets #1 moved 2010 thousand cubic meters of dirt
(Rostovtsiev. 1965; Arumae, 1965) .
PROCESSING
A. Development of large retorts of new design and reconstruction of older
gas retorts
The retort with the new design is the so-called UTT-500. It employs a
solid heat exchanger, has a throughput rate of 500 tons of shale per day, and
is cheaper to build because it uses up only 40 to 50 percent of the metal
required for the older type tunnel and shaft kilns. UTT will be used especially
at the oil-shale chemical processing plants, but will eventually replace older
gas retorts as well.
It was developed by the Kzhizhanovskii Institute of Energetics and
has been extensively tested during the last 6 or 8 years on a semi-commercial
pilot plant at Kiviyli. The UTT-500 is very flexible and can work either
on the tar regime or on the gas regime. Under the tar regime the oil shale
is semi-coked at relatively low temperatures (480C-520C), and tar is
the principal product ( 15-20 percent per dry shale). Under the gas regime,
at retorting temperatures of 650C-750C, fuel gas is the main product
(120 m3/ton of shale). Finally, if high temperatures are maintained duringgas regime, pyrolysis of volatile components may be also achieved, resulting
in still higher gas yields ( Doilov, 1965) .
Russians look upon this new retort as a major breakthrough in their
technology of oil shale processing. This is true if one considers that many
of their older retorts such as the Pinch type GGS-1 and GGS-4 had prior
to their reconstruction in 1961-1963 a shale throughput of only 33 and 37.5
tons per day, respectively (Hailing, 1965) .
The Russians claim that by installing batteries of UTT-500 in large
enough numbers they will be able to cut by half the processing costs of any
given plant. The new UTT design is highly praised by everyone concerned,
and there is a general clamor for its immediate use. Some UTT-500 are
already in commercial operation. However, I have found no information
to date indicating that UTT installation on a large scale has actually begun.
This appears to be caused by bureaucratic delays in alloction of funds and
materials for UTT construction and by technical difficulties in applying the
results of research. It is generally true that Russian research is far ahead
of Russian technology.

146 Quarterly of the Colorado School of Mines
In 1961-63 the older Pinch type compartment retorts at Kohtla Jarve
gas generating stations were reconstructed and converted from vertical to
horizontal-transverse flow of heat carrier (gas). This insured better heat
distribution in the shale charge and made possible an increase of shale
throughput of each retort by 40 percent (Hailing, 1965). Modification of
fluid regimes of these retorts is planned in order to secure further increase
in retorting rates ( to 80 tons per day ) . The condensing systems will also be
improved. Generated gas will go through supplementary cooling to 15C-
20
C, and electrofilters will be installed. This will reduce losses of very light
tars that escape with fuel gas in quantities of 1-2 g/m3 of gas ( Piik andVak-
her, 1965).
Looking to the future, the Russians have also started the development of
a much larger retort than the UTT-500. It will presumably employ solid heat
exchangers and will be able to process 1500 tons of shale per day. Workingon this giant retort are the Teploelektroprojekt of Leningrad (a fuel techno
logy institute) and the Academy of Science (Pravada, December 24, 1964).
The Rusians hope that this retort, when developed, will eventually process
all shale mined. The power plants and industrial plants, which now burn
shale as raw fuel, will be supplied with fuel oil instead. Burning of
fuel oil in place of raw shale will reduce both the cost of operation and the
excessive air pollution. Moreover, shale gas and shale crude, produced at
these throughput rates, will become really competitive with natural gas and
oil.
B. Development of the so-called energy-chemical or power-chemical method
of oil shale processing
This new approach emphasizes production of quality tar and not solely the
generation of gas. The tar obtained is used as raw material for production of
a wide variety of shale-petrochemicals. To this effect the Russians have
begun to change the regimes of their gas generators. The generator gas itself
is now more extensively used in the processes of organic synthesis. In the
last few years the Oil Shale Institute has perfected the technology for utilizing
retort gas in production of ammonia.
Basic to this whole concept of energy-chemical utilization of oil shale is,
of course, the new UTT-500. It was, in fact, designed especially for energy-
chemical processing. The information gathered from several fragmentarydescriptions gives the following general picture of the UTT retorting process.
Oil shale of different grades crushed to small size is fed into the retort,
together with ash of spent shale heated up to 850C. The shale is then
semi-coked at low temperatures. These were variously reported as350C-
500C and 480oC-520C. The gaseous fraction is very high in hydrocarbons

Estonian-Russian Work on Oil Shale 147
(70 percent) of which up to one-half are olefins. The tars, likewise, have
high concentrations of light olefins and aromatic hydrocarbons, especially
benzene. On the other hand, the content of undesirable acidic components
(CO2 and H2S) in the gas is low, thanks to chemical sorbtion of these
components by heated ash used as solid heat exchanger. Plants working
under the chemical (tar) regime make maximum use of both the gaseous and
the liquid fractions for production of oil shale chemicals. The gas is cleaned
and transferred to organic synthesis plants where olefins (ethylene and pro
pylene) are removed from it. The latter are used principally in the produc
tion of detergents, also polyethylene, acetone, phenols, and a few other pro
ducts. The remaining gas is used for the production of ammonia fertilizers
and carbamide.
At several plants at Kohtla Jarve and Kiviyli the oil shale is also retorted
for shale gasoline,'kukersol'
as the main product. The Russians claim that
from high-grade shale oil (30-45 percent kerogen) they get 50 gallons of
shale crude per ton (Baukov, 1958). This is twice the amount which we
expect to obtain from Colorado shale. However, in spite of this high yield,
at this time the kukersite crude is not competitive with natural petroleum and
its production is not emphasized. Light gas oils are used for lubricants,
detergents, and other products. The shale-lubricants allegedly are superior
in quality to those obtained from natural petroleum.
The Oil Shale Institute has developed a new method of preparing medium
tars obtained in semi-coking for their distillation. This method, which is
now employed in the industry, consists of thermal settling and washing off
of chlorides. The distillates are used as fuels or processed to electrode carbon.
The latter was found superior in quality to electrode carbon prepared from
petroleum tars. Heavy tars with high degree of impurity so far have been ex
cluded from processing. They are merely diluted with distillates, decanted,
and used as heavy gas oil. The residuum is used only in part as an admixture
to oil shale burned in gas generators; the bulk is taken to the dump. How
ever, studies are being made on processing of heavy tars and slurries to
electrode coke (Ekonomicheskaia Gazeta, June 25, 1963; Aarna, 1965,
Ioonas, 1965; Pietukhov, 1965; Magazine: Iunost', June, 1966). Consider
able quantities of phenols are obtained from benzene water and from tar water
(Aarna, 1965). Some data showing yields of several specific products ob
tained in processing oil shale in UTT retorts are given elsewhere in this
paper (table 2). Reported yields of products obtained in older tunnel and
compartment ovens working under gas regime are asfollows :
per ton of processd shale : municipal gas 400 m3
benzene 25 kg

148 Quarterly of the Colorado School of Mines
sulfur 3 kgtar 50 kg
the tar contains: phenols lkgnaphthalene 1.5 kganthracene 0.3 kg
Under the new energy-chemical concept of shale utilization, more than
30 different chemicals are now produced from oil-shale gas and tar besides
the municipal gas, gasoline, kerosene, diesel fuel, lubricants, and asphalts.
Among these products are toluene, xylene, butyl alcohol, phenols, phenol
formaldehyde tars, acetone, detergents, ammonia, pesticides and herbicides.
drying oils for the printing industry, tanning agents, aniline dyes, improved
flotation agents, plasticizers, polyesters, fibers, foam plastics, synthetic
rubber, special glues, paints and varnishes, ion exchange resins, and electrode
coke. As methods and technologies are perfected, new plants are being added
to the Kohtla Jarve and Kiviyli complexes. Some of the plants recently put
into operation are those producing pesticides, lubricants, detergents in semi
finished form (paste), electrode coke, and ammonium (Pravda, March 28,
1964) .
SOME RECENT RUSSIAN STUDIES ON PROCESSING OF OIL SHALE
A number of investigations carried out during 1963 and 1964 seem
particularly pertinent to our own studies and therefore deserve special men
tion.
Pietukhov, Aranovich, and Nudel'shtrekher (1965) studied the influence
of temperature on the composition of gas during processing of shale in the
UTT-500 retort. They analyzed 105 representative samples of gas obtained
under temperatures ranging from 457C to 547C. Since nitrogen is not
an inherent component of the gas obtained by semi-coking of oil shale in
the UTT retort, the calculations were based on assumption of a nitrogen-free
gas. The data from about 100 observation-pairs were tabulated, subjected to
mathematical correlation analysis, and the results were plotted in the form
of graphs to show a number of correlations (graph 2. following page).
The results indicate strong influence of temperature on the composition of
gas. Nitrogen content drops off very sharply as temperature increases. This
is in part due to the fact that at higher temperatures the generation of gas
intensifies, thus increasing internal pressure of the retort. This in turn cuts

Estonian-Russian Work on Oil Shale 149
I16O I).80 500 520 5I4.0 560 C
1 - nitrogen
2 -
olefin|^3 - paraffinss
l -
5 - carbon monoxide
6 - acidic components
7 - oxygen
Figure 2. Relationship between content of individual components in gas and tem
perature of semi-coking (in UTT-500) ; % of total gas volume.

150 Quarterly of the Colorado School of Mines
off more effectively the inflow of nitrogen-bearing flue gases which enter the
reactor from the furnace, together with the solid-heat exchanger (heated
shale ash). The gradual decrease of hydrogen content past its peak values
at 500C-510C is due to increased"dilution"
of the gas with hydrocarbons
The latter evolve from the shale at a faster rate than does hydrogen, once
the temperature rises above 500C. The drop in carbon monoxide concentra
tion at higher temperature regimes can be also explained at least in part
by"dilution."
By comparison with gases generated in other retorts, the UTT
gas is very low in acidic components. This is due to chemical sorbtion of these
components by the solid-heat exchanger. The concentration of hydrocarbons
increases from 16 percent of the total gas volume at 460C to about 36
percent at 550C. However, the molecular ratio: olefins/paraffins remain
nearly the same (1.00 0.15) , regardless of temperature.
Tables and graphs also show a strong influence of temperature on the total
gas output. Over the temperature range from 462C to 542C, the yield of
paraffins and olefins, expressed in cubic meters/ton of shale, increases five
to six times. Hydrogen content records a smaller increase, namely from
3.74 m3/ton of shale at 462C to 10.00 m3/ton at 542C. The last figure
amounts to less than half of the molecular output of lower olefins. The fore
going quantitative relationship between paraffins/olefins, as well as total
hydrocarbons/hydrogen, indicates that dehydrogenation of parafins plays
only a minor role in the formation of the corresponding lower gaseous olefins.
Instead, the breaking of C-H bonds of higher hydrocarbons, and the resultant
formation of both paraffins and olefins seems to be the principal reaction.
This corroborates previous findings of Aarna (1956) that solid-heat ex
changers do not cause much dehydrogenation.
The application of pyrolysis to oil-shale processing has several disad
vantages. In the first place, the entire shale charge must be heated to a high
temperature (about 700C) which takes extra time and therefore reduces
throughput rate; secondly, coke yield increases at the expense of tar; and
finally, it subjects the entire apparatus to excessive heating. In an effort to
avoid these disadvantages Doilov and Mil'k (1965) worked out a scheme
for applying thermo-oxidizing pyrolysis to oil-shale processing.
In refining of petroleum this process results moreover in higher yields of
the main product, unsaturated hydrocarbons. However, it is much more
difficult to apply the same process and with comparable results to the pro
cessing of oil shale. For one thing, the composition of the products of oil
shale retorting is much more complex; the boiling ranges are greater; also,
the shale oil tars are unstable and have the tendency to form coke. Doilov
and Mil'k set up an experimental oxidizing pyrolyser to be operated as part
of a single technological unit with the UTT-500 retort. To prevent coke
Estonian-Russian Work on Oil Shale 151
formation, the oil shale, under this scheme, was retorted at normal tar regime
(500C). Generated vapor-gas mixture directly from the standpipe of the
combustion chamber of the retort was run through a condenser, where the
heaviest tar components were eliminated. In this particular series of experi
ments the excluded tars accounted for about 25 percent of the total primary
tar. Only tars with specific gravity of 0.89-0.91 were allowed to go into the
pyrolyser. On entering the pyrolyzer the mixture had a temperature of
350C and was still in the vapor-gas phase without undergoing preliminary
heating. The vapor-gas mixture was then subjected to oxidizing pyrolysis.
The latter took place under optimal conditions of temperature and pressure.
These were determined by Mil'k in earlier studies ( 1963 ) .
Comparison of results obtained by retorting oil shale under tar regime,
gas regime, and'multi-stage*
regime with application of oxidizing pyrolysis,
are shown in table 1.
Doilov and Mil'k tabulated these results also in terms of total yields per
dry shale, and prepared a number of graphs showing different relationships.
Complete reproduction and discussion of these data exceed, however, the
limited scope of this paper. In general, both higher olefin concentrations in
the gas and higher total olefin yields were obtained by thermal pyrolysis
process, rather than by retorting in a'single-stage'
pyrolysis in the retort
(gas regime). Highest total olefin yield calculated per dry shale reached
59 kg/ton. It was obtained under the following conditions:
temperature of pyrolysis 700C
oxygen consumption 80-85 m3/ton of tar
contact time 1-1.5 sec
Above 700C the amount of olefins produced strongly decreases, mainly
because of the decomposition of the lighter members of the series. Over the
same temperature range ( 700C-825C) the decomposition of ethylene is
much more limited its yield decreasing only from 36.7 to 32.9 kg/ton.
Phenols have many industrial applications, and they are therefore con
sidered an important product in energy-chemical processing of oil shale. In
connection with introduction of new retort design (UTT) and improvements
of older retorts, the Oil Shale Institute studied the influence which design and
regimes of retorts have on yield of light tar phenols. In these tests samples
of primary tar were taken from 19 retort units of 7 different types currently
in use at Kohtla Jarve and Kiviyli complexes. Some of the retorts were
sampled at different times in order to detect the effect which changes made
in their operational-industrial regimes have had on the phenol production.
Broad diesel fraction with boiling points up to 325C was used as the phenol

152 Quarterly of the Colorado School of Mines
HO
OCS
cs
CS
w
PQ
<
tH
O ^ CM O m lt. 1 r- CS I rf 1 VC CO l> CS oc CO
0 O1 2 c
CSvc 0
'0CS
CS
CSCS c
1 c UO r
CM rH
rJ
CS
rH CMrH
O c O oc CS UO 1 IT. CO c r
1 *3 l> Tfr ( q co
i
0 1 1i- 3 CC
CSu: 0
1CS
ocCS
CS d d d ^j
CO r-H
o>rH
UO rH
UO c O Tj m ON CO r ^f oc CO 1 ^ ON r-i q CM O
a.On
Or
3CS
VC 0 CS
CS CS
r d 1 d ON "vF
CM rH rH
vd d
tooc>i
UO CS 0 vc CO CO 1 CS ^ LO 1 CM ^ O l> VO I> CO
:s inCM
CO1
03oc r O 1 d d 1
r* O esi cm VO VO rH
0
I CS CS CM CO rH
inO^
s q OC UO CS m r cc CO ^F CO q q CO O I>
"
r> CMvO0c CO u-i 0 o> ^ CS d r-H CSJ rH vd vd i> d
CS
*W0
CS CS CS CO rH rH
UO CO CM oc l> ^ 1 t^; c r-H 0 vO r^ uo q rH 00 On
CS10 OO
CMr
asCS l> r-H
1r ^ d CO d O rH UO CM ^ 00 l>
051
10
CS CO CS CM r-t rH
^ l>r
0CO
0 oc
oc
CO CS
r-H
CO CS
o>
ON
|J
CO
d1 CO
1 d
l> ON
rH CS!
CO
r-H
UO CO
UO rH
CS CO CS CO <i rH
O vq 0 CO CS CO CO r-H 0 UO q 1 UO q on l> CO O
00O
1 ' COCS 0 CM O UO d CO
1 d UO UO CSJ On Cs|CS r-H CO CO CO rH
<u O 1 1CM CO m O
C^ CO ON ON CM CO UO t>
CM CO 1 1 r^ t> ^ 00 d ON d CM d l> l> COl> 1 1 CM CM CO CM
k.
a0 1 1
i> VO i-H rf q UO 00 CO vq cm vO UO l>
O "-H UO | 1 CS t> UO 16 rHl-J CM rH VO On 00 VO CO
VO rH CM CM r-H CO rH
vi 1 UO CO in O CM UO O
fe s ^5 1 1 i-H r-H CO CO CS CO ^f CO CO rH rH CO t>
UO CO v6 CO in UO CM r-H CM d CO CM UOr-H r-H CO 11 CM r-H
k.
CJ0
cjCLa;
04->
s
CO4->
>H
<V
0.l-H
CU
s
"0>
O
CO
^
0 a;
p i
4->
FN
+CI
u
ed
Q
4-
OO
CD
O
r" C5 00
( "
c5 0 s
CM
4-
c
CC4-
C
9>tr
9 e
rT
J. 03 * L
CJ5
=
tf c
IX>! 0
c
.U
c^ C5 +
) 0Pi be 0
CJ CJ CJ CJ Hf CJ) CJ CJ CJ u*
W CE CJ) CJ O
CD C X ed
H CJ O O
Estonian-Russian Work on Oil Shale 153
source. Details of procedure as well as several tables and graphs are given
by Aarna and Efimov (1965) . I shall reproduce here data based on two such
samplings of the UTT-500 retort and some figures taken from different
tables to show comparison of results obtained from seven units, each repre
senting a different retort type.
The study indicated that the concentration of light phenols in the tar
increases under more rigorous regime, that is when retorting temperatures are
high and the contact time of the vapor-gas mixture with the shale bed is long.
However, under such regime the yield of tar is lower, which means of course
that the total phenol yield itself decreases. Most satisfactory results on both
accounts were obtained with UTT retorts and with tunnel ovens. Feeding of
shale crushed to small-size fraction was also helpful, increasing the tar
yield and at the same time preventing excessive semi-coking. Because of
lesser danger of coke formation, the contact time of vapor-gas mixture with
the shale bed could be increased resulting in bigger yield of light phenols.
For similar reasons, retort designs, which favored uniform distribution of
heat exchanger, gave higher yields of light phenols permitting maintenance
of higher throughput rates that otherwise would reduce the yield of these
products. Both UTT and gas generators with transverse flow of heat ex
changer (gas) favor such good distribution. On the otherhand, the yield of
total phenols from UTT-500 was much below that which has been expected
(table 3). This is apparently due to specific nature of thermal decomposition
processes of fine grained oil shale in retorts which use spent shale as heat
exchanger. Light phenols actually form at the expense of heavier phenols
when the latter undergo thermal decomposition (Soo, Orav. and Nurkse,
1965). Studies of condensation systems of gas retorts were also made to
determine losses of light phenols. It was found that the amount of phenols
with low boiling points, which escape with fuel gases without being captured
in the condenser, do not exceed 0.1 percent of the total phenol yield. Con
sequently, their recovery would have little effect on the yield of light phenols.
However, other components of the light tar fraction escape in substantial
quantities (Aarna and Efimov. 1961; Piik and Vakher. 1965).
Increased demands for electrode coke created greater need for heavyoil shale tars essentially free of ash (not over 0.05 percent of ash) . This
requirement is difficult to satisfy especially with employment of new,high-
efficiency retorts (UTT-500). Many different studies have been carried out
in this connection on economic methods of purifying heavy tars. Ioonas,
Leeper and Sieriebriannikov (1965) worked out a method of extracting
maximum impurity-free distillate from heavy tars and residues by means of
coking. In a vat-type retort constructed to a laboratory scale, they coked
heavy impure tar obtained from a gas retort (GGS-4) . In order to determine

154 Quarterly of the Colorado School of Mines
Table 2. Relationship between regime of retorting and yield of light
phenols in using UTT-500
Sampling Date
March April
17 22-25
1964 1964
Working moisture of shale, % 13.6 12.0
Content of organic substance per dry weight of shale, % 32.8 31.0
Oil-shale throughput, ton/24hrs 525 491
Technical yield of tar per dry shale, % 17.6 16.0
Temperature of vapor-gas mixture on leaving retort, C 470 528
Final temperature of cooling of vapor-gas mixture in
condenser, C 28 22
Specific gravity of tar at 20C 0.9670 0.9660
Fractional composition of tar, % of volume :
beginning of boiling, C 69 71
boiling point (boils away by) 200C 20 29
boiling point (boils away by) 250C 29 40
boiling point (boils away by) 300C 40 52
Content of total (undifferentiated) phenols in tar,
% of weight 18.5 13.0
Yield of broad diesel fraction with boiling points upto 325C, % of total weight of primary tar 41.04 47.74
Content of total phenols in broad diesel fraction,
% of weight 10.71 7.68
Fractional composition of phenols, C
10% of volume boils away 247 224
20% of volume boils away 278 253
30% of volume boils away 287 282
40% of volume boils away 294 291
50% of volume boils away 297
boiling away by 300, % of weight 60.9 69.4
Specific gravity of phenols (measured at 20C) with
low boiling points 1.0821 1.0727
Yield of light phenols calculated per tar, % of weight .... 2.68 2.55
Yield of light phenols calculated per organic
substance content of retorted shale, kg/t 14.4 13.2
Content of light phenols in daily tar output of
retort, tons 2.14 1.76

Estonian-Russian Work on Oil Shale 155
Table 3. Yields of total and light phenols from different type retorts
Retort unit and type tar
Tunnel oven #3, at Kiviyli 760
Gas generator GGS-5 I with central feed
of heat exchanger) 487
Gas generator GGS-5 ( with transverse
flow of heat exchanger) 532
Pilot gas generator, enlarged 688
UTT-500 (solid heat exchange) 537
Compartment retort 179
Fraction
Yield per total of light
organic substance in phenols
the shale, kg/ton per total
total light phenols,
phenols phenols %
180
150
11.5
7.5
6.4
5.0
141 10.2 7.2
179 15.1 8.5
99 14.4 14.6
33 6.1 18.5
possible catalytic action of ash in the tar. they also run parallel experiments
on samples of filtered tar.
As the yield of distillate increases, its viscosity, specific gravity and flash
point also increase. The distillates are essentially free of impurities. It was
also found that by using gas or steam in coking, the yield of distillates can
be increased by 10-15 percent. The yields of distillates obtained by coking
of residues ranged from 23 to 47 percent per dry residue, depending on
scheme of condensation of vapor-gas mixture and on the method and place
of collecting the residue. The engineers of the oil shale processing complex
at Slantsy have prepared a design for a semi-commercial plant for processing
heavy tars and residues by coking. Further tests are planned prior to plant
construction.
Oftentimes in processing of oil shale it is necessary to determine the
degree of decomposition of organic matter (called the degree of kerogen de
composition) at any particular time during the retorting process and prior
to its termination. The scientists of the Oil Shale Institute developed a method
which now makes this possible. The method is based on the observed fact
that a relative carbon enrichment and hydrogen impoverishment of the
nonvolatile organic residue take place during the retorting process. A
quantitative study was made of this enrichment-impoverishment process as
it occurs during semi-coking of the kukersite shale. The details of procedures

156 Quarterly of the Colorado School of Mines
Yield of light
phenols per
organic matter
of retorted
shale, kg/t
Duration of
contact of gas-
vapor mixture
with heated
layers of oil
shale in zone
of semi-coking,sec 3
550Approximate
average temp .
^qqof gas-vapor
mixture in zone
of semi-coking,kSO
lj.00
Generator
C D E F G
Sampled
A # 8 with central injection of heat exchanger; Jul. 22-21;, 1960
B"Tsekh"
with central injection of heat exchanger; Apr. 13-16, 1963C
"Tsekh"Sep. 25-30, 1963
D # 7 with transverse stream of heat exchanger; May 12-18, 1960
E # 7 Mar. 22-28, 1962
F # 7 Apr. I8-2I4-, 1962
G # 7 Oct. 3-5 ,1961
Figure 3. Relationship between yield of light phenols and technological parameters
of gas generators.
and methods of calculation are described by Aranovich (1965). As a result,
a relationship has been discovered between the C/H weight ratio and the
degree of kerogen decomposition. This relationship gives a curve of equal
sided hyperbole which can be accurately expressed by the equation:
C/H =
150
100-x+ 6.5
where : x = degree of kerogen decomposition.
In another series of experiments an attempt was made to determine C/H
changes in the solid residue obtained in retorting of oil shale fines with
solid heat exchanger. The new curve had the same general character, but it
was displaced along the axes of both coordinates. This displacement is due

Estonian-Russian Work on Oil Shale 157
Table 4. Character of distillates obtained by coking of heavy tar
No. of s.g. Moisture Viscosity Flash Ash
Fractional composition,
% volume
expt.rf4M
at 50C,vu*
point,
c
content,
%
up to
200C
up to
300C
up to
360C
2 0.954 1.2 2.09 40 0.023 10 44 70
3 0.969 1.5 2.73 51 0.042 8 36 60
9 0.979 1.6 2.28 27 0.043 11 40 67
10 0.978 1.7 2.20 25 0.046 11 43 75
8 0.992 3.0 3.34 58 0.012 5 35 59
7 1.002 18.4 5.17 72 0.016 2 27 54
5 1.008 11.0 7.60 112 0.030 23 53
6 1.006 6.7 8.11 116 0.011 20 50
12 0.999 3.4 5.09 101 0.013 2 32 60
11 0.998 2.9 5.55 100 0.026 1 28 58
Viscosity is given in degrees of"VU"
; I was unable to identify these units.
800 1p
cCD -p
P^-v.
G fcO
OXo t
k erf
U <D E-<
C H-P GJ
-P
aj ra
eH
O t\
H O
Ca5Tj CO
bO 0 H
U -P O
O ?s GO
U -P &0) 0 Ph
ft Jh
iH
TJ <h cd
H O +5
0) o
:H E-i
|H
600
l+OO
200
150
100
0
Tunnel
"OvensGas
GeneratorsUTT
Compartment
Kilns
Retort Numbers
Figure 4. Yield of total phenols from oil shale retorts.

158
C/H
Quarterly of the Colorado School of Mines
17
15
A
13 v\\V\
11
s^i
9'*,>>^ * 2
1
7 aai i i
100 80 60 UO 20 0
Relationship between C/H in semi-coke
and degree of kerogen decomposition
1 - For pure oil shale
2 - For oil shale in presence of ash
Fioi'RE 5. Relationship between C/H in semi-coke and degree of kerogen decomposi
tion. Curve 1-for pure oil shale: curve 2-for oil shale in presence of ash.
to capture of some volatile components by the solid heat exchanger (heated
oil shale ash) and to the presence of some organic carbon and hydrogen in
the ash itself.
Corrosive action of waste waters of oil shale processing often creates
serious problems. In order to facilitate planning of preventive action, a
method was devised for extracting carboxylic acids present in these waters
and determining both qualitatively and quantitatively their composition
(Mietsik, Rokhumagi, and Lisman, 1965) .
In this particular study, average samples of waste waters were taken
from the compartment kilns of Kohtla Jarve and from tunnel kilns of Kiviyli

Estonian-Russian Work on Oil Shale 159
Benzol
6
X
O
Solution of butanol
in chloroform
5 % 10 ?g 30
n-butyric
L
prop
ionic
acetic formic
10 20 30 I|.0 50 60 70 80 90 100
KLuate, ml
Figure 6. Separation of a mixture of carboxylic acids with a known quantity of
KOH used in titration.
Benzol
PS
o
o
1
Solution of butanol
in chloroform
5 % 10 % 30 %
n-butyric
i<
prop
ionic
acetic formic
Figure
10 20 30 i|.0 50 60 70 80 90
ELuate, ml
7.Chromatogram showingseparation of carboxylic acids extracted from tar
water after sprinkling in tar separator"Teizen"
(Retort GG-5) .

160 Quarterly of the Colorado School of Mines
oil shale processing complexes. The new method made it possible for the
first time to extract all four carboxylic acids detected in the waste water. It
has been also found that the amount of volatile carboxylic acids in the tar
water increases when'Teizen'
type sprinklers are employed with tar separator.
Distributive chromatography was used very effectively to obtain separation
of the carboxylic acid mixture into its individual components.
C. Full utilization of by-products and waste materials
This is part of the so-called complex utilization of the kukersite. The Oil
Shale Institute has developed a new method of preparing medium tars for
distillation. These were previously burned as raw fuel. The Institute is now
working on processing heavy tars and even slurries to electrode coke (Ioonas,
1965). The shale ash is rich in calcium carbonate and in micro-elements,
and as such it is a very good fertilizer for Russia's dominantly acidic soils
as well as for soil enrichment in general. Agricultural studies and experi
ments conducted with oil shale ash led to the discovery of a plant growth
stimulator. The Russians claim that its application has doubled the crop of
alfalfa and considerably increased the turnip crop. The first fertilizer
plants, working the smaller size fractions of the ash from the dumps, have
already been established at Kohtla Jarve. Another waste-product processing
plant has been erected at Punai Kunda and is producing 850,000 tons of
Portland cement annually also using ash as raw material (Izvestia, Novem
ber 12, 1965). In planning stages, or already under construction, are other
plants which will manufacture building blocks, rock wool and other insulating
materials from the ash. The clinker from spent shale that has been heated to
2,000
C will be used as special purpose building material.
D. In situ gasification
The Chemical Institute of the Estonian Academy of Science has been work
ing since 1958 on in situ gasification of low-grade kukersite shale left behind
in the mines after removal of high-grade shale by room and pillar method has
been completed. The Institute operates a pilot plant in one of the oil shale
mines at Kiviyli (Pravda, April 11, 1958). I have no information at this
time on the present status of this work.
Absolutely no mention has been made so far of applying nuclear blasts
to in situ retorting.
Future Outlooks ofEstonian-Russian Oil Shale Industry
Any attempt to arrive at true dollars and cents figures for costs of Russian
oil shale products would be an utterly meaningless exercise in arithmetic.
This is true of most state-socialist economic ventures anywhere. It suffices

Estonian-Russian Work on Oil Shale 161
to say that the kukersite shale industry has not been profitable and has had
to be subsidized by the state throughout most of the postwar period. That
much has been admitted post-factum, of course by Russia's present gov
ernor in occupied Estonia. V. Klauson (Pravda, December 24. 1965).
However. Klauson claimed that the oil shale industry is now operating in the
black. In 1964 the Kohtla Jarve mining-processing complex allegedly made
a profit of 6.3 million rubles, and the Kiviyli complex 1.5 millions. Whether
or not this is true, it is indeed hard to say. Other information is available,
however, which indicates that the shale oil industry may now be in fact
on the threshhold of profitable operations. The Economic Institute of the
Estonian Academy of Science conducted, under the direction of economist
professor D. Kuznietsov, a study of the oil shale industry. In a report
published in 1964 the Institute concluded that "under present conditions in
Estonia the oil shale industry from the standpoint of both capital ex
penditure and operating costs is the most economic source of raw materials
for the petrochemical industry."
The study also came out strongly in support
of the new energy-chemical and complex utilization as the only economic ap
proach to oil shale processing ( Ekonomicheskaia Gazieta, June 13. 1964;
see also Kuznietsov, 1959 ) .
The Russians are apparently encouraged by the results of energy-chemical
and complex-utilization, also by their breakthrough in the new retort design
(UTT-500) as well as the success of gas retort improvements. Their confi
dence in the economic future of the oil shale industry is shown by their
willingness to make further large investments in this field. Thus the current
five-year plan ending in 1970 calls for an increase of 30 percent in the oil
shale output over the 1965 levels (22 million metric tons). The oil shale
processing facilities at Maardu. about 100 miles west of the Kivyili Kohtla
Jarve area, are now being greatly expanded. The operations at the only
other Russian oil shale processing center namely that of Syzran on the
Volga in the Kuibys'hev-Saratov area are also increasing and are beingchanged from gas generation to gas and chemical processing (Efimov and
Sieriebriannikov, 1965). It is significant that the oil-shale deposits mined
at Syzran are of much lower grade than the kukersite shale (Baukov. 1958) .
The Russians are also planning to establish a new energy-chemical oil shale
processing complex at the site of Bukhtaminsk Reservoir and Power Plant
now under construction in Kazakhstan, right in the area of kenderlyk oil-
shale deposits (Efimov and Help, 1965). This despite the fact that Kazakh
stan now has abundant supply of gas and oil from newly developed fields.
Also significant is the fact that Russian geologists continue to look for oil
shale deposits. They have made two recent discoveries. One deposit has been
found in southern Ukraine ( at an unspecified location ) . It is estimated at

162 Quarterly of the Colorado School of Mines
600-700 million tons and has allegedly higher grade shale than the Estonian
kukersite (Trud, July 1, 1965). The other deposit, not so large, was located
near the town of Stolin in the region of Pripet Marshes of eastern Poland,now under Russian occupation (Izvestia, August 5, 1965). Both of these
discoveries aroused considerable interest.
PERTINENCE OF RUSSIAN WORK AND EXPERIENCE WITH OIL
SHALE TO OUR STUDIES OF COLORADO OIL SHALE
Any attempt to draw an analogy between economics of the prospective
Colorado oil shale industry and the existing Estonian oil shale industry must
take into account a number of fundamental differences which exist between
them. We can list these differences as relative advantages and disadvantages
of each.
Advantages of the Colorado shale :
1. The fact that Colorado shale industry will develop under free enter
prise rather than the socialist system.
2. Increasing depletion of our natural gas and oil reserves coupled
with increasing costs of finding and producing crude petroleum.
This situation is steadily improving the competitive position of
Colorado oil shale. The very opposite is true of Estonian oil shale
industry. In Russia reserves of natural gas and oil are rapidly
increasing, and the completion of pipelines will soon make cheap
gas and oil available in plentiful supply.
Advantages of the Estonian oil shale :
1. Established industry with vast facilities and considerable opera
tional experience versus one that will have to start from scratch.
2. Kukersite shale is of higher grade than Colorado oil shale.
3. Plentiful water supply versus lack of water as in the case of the
Colorado oil shale.
4. Serious underdevelopment of Russian petrochemical industry, in
suring Estonian shale-chemicals of good markets for years to come.
Admittedly, because of these great differences, the economic lessons
which the Russians have learned in their opperation of the Estonian oil shale
industry do not seem very applicable to our studies of economic prospects of
the Colorado shale. However, we might take a closer look at Russia's new
energy-chemical and complex-utilization of oil shale processing to see if this
approach might not offer us some economic advantage. These two fields
the chemical processing and the waste product utilization, are the areas
where the Russians are doing a lot of research, developing new methods, and
Estonian-Russian Work on Oil Shale 163
adapting many petrochemical technologies to shale-chemical processes. This
information and the Russian experience with the successful new solid-heat
exchanger large-capacity retort should be quite useful to us.
*This paper is based on material actually referred to in the text. The remaining
select bibliography is compiled merely forreaders'
information.
BIBLOGRAPHY*
1. Aarna, A. la., 1955, Dynamics of separation of volatile substances from oil shale
during retorting. Symposium: Chemistry and Chemical Technology, issue 2.
Trans. Tallin Polytechnic Inst., ser. A, no. 63.2. Aarna, A. la, and Efimov, V. M., 1965, Relationship between regime of processing
of oil shale and the yield of light tar phenols: Trans. Scient. Research Inst.
on Mining and Processing of Oil Shale, Leningrad.3. Aarna, A. la, and Melder, L. I., 1958, Thermal cracking of phenols from oil
shale. Symposium: Chemistry and Technology of Oil Shale, issue 5. Trans.
Tallin Polytechnic Inst., ser. A, no. 153.
4. Aarna, A. la., and Pietukhov, Ie. F 1956, Influence of semi-coke, clays and
oil shale ash on the process of thermal decomposition of oil shale. Symposium:
Chemistry and Chemical Technology, issue 3. Trans. Tallin Polytechnic Inst.,ser., A, no. 73.
5. Aranovich, V. V., 1965, Carbon/hydrogen ratio in semi-coke residue as an indi
cator of the degree of oil shale decomposition by thermal method: Trans.
Scient. Research Inst, on Mining and Processing of Oil Shale, Leningrad.6. Arumae, A. T., Lainoia, L. E., Sits, K. I., and Kala, R. Kh., 1965, The experience
in employing dragline Esh-15/90 at open pit Estonslaniets #1. Mining and
processing of oil shale: Oil Shale Institute, Leningrad.
7. Baukov, S. S., Compositional characteristics of oil shale from the pre-Baltic
oil shale basin: Estonian NSV Teaduste Acad., Geol. Inst., v. 2.
8. Bitter, L. A., and Soo, K. M., 1965, Changes in chemical composition of phenols of
oil shale tars upon heating. Mining and processing of oil shale: Oil Shale
Inst., Leningrad.
9. Doilov, S. K., and Mil'k, A. A., 1965, Obtaining lower unsaturated hydrocarbons
by means of oxidizing pyrolysis of the vapor-gas mixture during thermal
decomposition of oil shale. Mining and processing of oil shale: Oil Shale Inst.,Leningrad.
10. Efimov, V. M., 1963, Results of retorting of Estonian oil shale in a small experi
mental gas generator. Symposium: Chemistry and Technology of Oil Shale
and of Oil Shale Products, issue 12, Leningrad, Gostoptekhizdat.
11. 1964, Study of oil shale retorting in gas generators with increased
throughput: Dissertation, Tallin Polytechnic Inst.
12. Efimov, V. M., and Help, K. D., 1965, Results of thermal processing of kenderlyk
oil shale in compartment kilns and in experimental gas generator. Miningand processing of oil shale: Oil Shale Inst., Leningrad.
13. Galynker, I. S., and others, 1963, Test results of an oil shale pilot retorting plant
(at Kiviyli oil shale processing works) employing solid heat exchanger.
Symposium: Energo-technological Utilization of Fuels, issue 4, Academy of
Sci. SSSR, Moscow.
14. Gubergrits, M. la. and others, 1963, Comparative evaluation of different schemes
for obtaining gaseous chemical raw material in retorting oil shale with solid
heat exchanger. Symposium: Energo-technological Utilization of Fuels, issue
4, Academy of Sci. SSSR, Moscow.
15. Hailing, A. 0., and Efimov, V. M., 1965, Semi-coking of oil shale in gas generators
with horizontal-transverse flow of gaseous heat exchanger: Trans. Scient.
Research Inst, on Mining and Processing of Oil Shale, Leningrad.

164 Quarterly of the Colorado School of Mines
16. Ioonas, R. E., Leeper, R. A., and Sieriebriannikov, N .D., 1965, Coking of heavyoil shale tar as a method of its preparation: Trans. Scient. Research Inst, on
Mining and Processing of Oil Shale, Leningrad.
17. Ivanov, B. I., and Sharnova, N. F., 1954, Chemical composition of tar water from
oil shale of pre-Baltic oil shale deposits. Symposium: Chemistry and Tech
nology of Products of Oil Shale Processing, issue 2, Leningrad, Gostoptekhizdat.
18. Kozhievnikov, A. V., 1956, Obtaining sulfacationites (ion exchangers) from
the coke of oil shale tar. Symposium: Chemistry and Technology of Oil Shale
and of Oil Shale Products, issue 5, Leningrad.
19. 1960, Coking of higher fraction of oil shale tar obtained
in semi-coking. Symposium: Chemistry and Technology of Oil Shale and of
Oil Shale Products, issue 8, Leningrad, Gostoptekhizdat.
20. Kozhievnikov, A. V., Pulipchuk, T. C, and Lorina, G. A., 1965, Reducing proper
ties of sulfacationites (ion exchangers). Mining and processing of oil shale:
Oil Shale Inst., Leningrad.
21. Kunakov, N. E., and others, 1957, Experience in using a retort with high through
put rates of oil shale fines employing solid heat exchanger. Symposium:
Technological and Economic Problems in Commercial Semi-coking of Oil
Shale, issue 1, Leningrad.
22. Kundel', Kh. A., and Lille, U. E., 1965, Gas-chromatographic method of deter
mining naphthalene content in oil shale tars: Trans. Scient. Research Inst.
on Mining and Processing of Oil Shale, Leningrad.
23. Kuvimaa, Kh. M., Shieloumov, V. V., Sabbatovskii, V. P., and Svierdlin, U. G.,1965, Filtration studies on oil shale tars. Mining and processing of oil shale:
Oil Shale Inst., Leningrad.
24. Kuznetsov, D. T., and Tiagunov, B. I., 1959, Technological and economic ap
praisal of processing oil shale in retorts using solid heat exchanger: Techno
logical and Economic Problems in Commercial Semi-coking of Oil Shale,issue 2, Leningrad.
25. Kyll', A. T., and Stiepanov, I. I., 1959, Characteristics of gas obtained in proces
sing oil shale fines employing ash as solid heat exchanger: Oil Shale Chemistryand Technology, issue 3.
26. Lapin, V. N., and Nazarova, S. S., 1959, Ways of increasing production of
adsorbent resins from oil shale tar. Symposium: Chemistry and Technologyof Fuels and Products of Fuel Processing, issue 8, Leningrad, Gostoptekhizdat.
27. Lapin, V. N., 1961, New method of obtaining oil deemulsifying sulfasalts and
its industrial implementation at Syzran oil shale processing works. Symposium:
Chemistry and Technology of Fuels and Products of Fuel Processing, issue 10,Leningrad.
28. Metsik, P. E., Rokhumiagi, E. I., and Lisman, R. V., 1965, Study of carboxylic
acids in waste waters of oil shale retorting: Trans. Scient. Research Inst, on
Mining and Processing of Oil Shale, Leningrad.
29. Metsik, P. E., Tomberg, A. I., Nau, Kh. I., and Pebkur, T. A., 1965., Sulfasalts
obtained from liquid products of oil shale as corrosion inhibitors: Trans.
Scient. Research Inst, on Mining and Processing of Oil Shale, Leningrad.
30. Mil'k, A. A., and others, 1961, Oxidizing pyrolysis of products obtained in proces
sing oil shale in retorts employing solid heat exchangers. Slantsy, Bull. Sci.
and Technical Info., no. 3, Tallin.
31. Mil'k, A. A., and others, 1963, Oxidizing pyrolysis of the total vapor-gas mixture
during processing of oil shale in retorts employing solid heat exchangers.
Symposium: Energo-technological Utilization of Fuels, issue 4, Acad. Sci.
SSSR, Moscow.
32. Murd, A. G., Lille, Iu. E and Kundel, Kh. A., 1965, Materials acting as solid
absorbents of organic sulfa-compounds of oil shale gas: Trans. Scient. Research
Inst, on Mining and Processing of Oil Shale, Leningrad.
33. Ozierov, G. V., 1959, Rotary retorts for semi-coking of oil shale. Symposium:
Chemistry and Technology of Oil Shale, issue 6, Trans. Tallin Polytechnic
Inst., ser. A, no. 165.
Estonian-Russian Work on Oil Shale 165
34. Pietukhov, E. F., Aranovich, U. V., and Nudel'shtrekher, N. F., 1965, Temperatureregime and its influence on composition of gas obtained in semi-coking of oil
shale in retorts using solid heat exchanger. Mining and processing of oil
shale: Oil Shale Inst., Leningrad.35. Piik, E. E., and Efimov, V. M., 1964, Increasing the content of phenols in tar
water of gas generating plants: Bull. Oil Shale, no. 3, GNTK, CM Esthon.
SSR, Tallin.
36. Piik, E. E., and Rooks, I. Kh., 1963, New tar separators using'Tieizien'
sprinklers
and their implementation at Gas Generating Station #5 of Kohtla Jarve oil
shale processing works. Symposium: Chemistry and Technology of Oil Shale
and of Oil Shale Products, issue 12, Leningrad, Gostoptekhizdat.37. Piik, E. E., and Vakher, D. Kh., 1965, Study of tar losses with generator gas.
Mining and processing of oil shale: Oil Shale Inst., Leningrad.
38. Rostovtsiev, M. I.. 1965, In the land of amber and oil shale: Prosvieshcheniie,Moscow.
39. Raudsepp, Hh. T.. Khydrieiarv, U. G.. and Virkus, A. Iu., 1960, Phenol content
in light-middle fractions of oil shale tars. Symposium: Chemistry and Chemical
Technology, issue 7, 1961, Trans. Tallin Polytechnic Inst., ser. A, no. 185.
40. Raudsepp, H. T., and Kiestnier, A. I., 1962, Composition of phenols present in
oil shale tars from gas generating retorts. Symposium: Chemistry and Chemi
cal Technology, issue 9. Trans. Tallin Polytechnic Inst., ser. A. no. 198.
41. Siemienov, S. S.. and others, 1961, Potential content of phenols in tars obtained
through semi-coking of oil shale at Slantsy processing works. Symposium:
Chemistry and Technology of Fuels and Products of Fuel Processing, issue 10,Leningrad, Gostoptekhizdat.
42. Shieloumov, V. V., and Kivimma, Kh. M., 1962, Centrifuging of heavy oil shale
tars. Symposium: Chemistry and Technology of Oil Shale and of Oil Shale
Products, issue 11, Leningrad, Gostoptekhizdat.
43. Shievkunov, N. D., 1962. Testing of Dinas brick compartment retorts at high oil
shale throughput regimes. Symposium: Chemistry and Technology of Fuels and
Products of Fuel Processing, issue 11, Leningrad, Gostoptekhizdat.44. Soo, K. M., Orav. Kh. A., and Nurkse, Kh. Kh., 1965, Thermal stability of
phenols from oil shale tar. Mining and processing of oil shale: Oil Shale
Inst., Leningrad.
45. Viezienitsin, Kh. S., Eigi, K. R., Purre, T. A., and Kal'berg, A. 0., Cokingof different oil shale tars on a semi-commercial vat installation: Trans. Scient.
Research Inst, on Mining and Processing of Oil Shale, Leningrad.46. Viezienitsin, Kh. S., Eigi. K. R., Khallik, E. K., and Purre, T. A., 1965,
Composition of distillates obtained in coking of different oil shale tars:
Trans. Scient. Research Inst, on Mining and Processing of Oil Shale, Leningrad.
47. Vol'f, I. V., and others, 1960, Simultaneous softening and deacidifying of water
with an experimental filter under normal industrial conditions. Symposium:
Chemistry and Technology of Oil Shale and of Oil Shale Products, issue 9,Leningrad, Gostoptekhizdat.
48. Volkova, G. A.. Goizman, V. B., and Sieriebriannikov, N. D., 1965, Utilization
of waste products obtained in commercial production of electrono-ion ex
changers El-5. Mining and processing of oil shale: Oil Shale Inst., Leningrad.49. Zhukov, V. A., 1965, Pyrolysis study on volatile components of Brazilian oil
shale for purposes of gas generation: Trans. Scient. Research Inst, on Miningand Processing of Oil Shale, Leningrad.


BIOGRAPHIES
V. DEAN ALLRED
V. Dean Allred received his Ph.D. in Fuel Technology at the Universityof Utah in 1951. Prior to joining Marathon in 1956, he had worked for the
Houdry Process Corporation, Marcus Hook, Pennsylvania; the Catalytic
Construction Company, Philadelphia; and Union Carbide Nuclear Company,
Oak Ridge National Laboratories, Oak Ridge, Tennessee.
At present, Dr. Allred is a Research Associate at Marathon Oil Company's
Denver Research Center.
SEYMOUR B. ALPERT
Mr. Alpert received a B.Ch.E. degree from the Polytechnic Institute
of Brooklyn in 1952 and a Master's degree from Rutgers University in 1955.
He also did graduate work at Columbia University. He was employed byHydrocarbon Research, Inc., in 1952 to carry out development work on
projects for the petroleum and chemical industries. Mr. Alpert is responsible
for the preparation of technical reports and correlation and evaluation of
pilot plant data.
GEORGE H. BRUCE
Mr. Bruce is a research associate with Esso Production Research Com
pany. He has been with Humble's Production Research Division and the
present company since receiving his B.S. degree in physics from the Uni
versity of Texas in 1949.
WLADYSLAW J. CIESLEWICZ
Mr. Cieslewicz came to the United States from Poland in 1949. He
earned a B.A. degree in economics, an M.A. in Russian, and an M.S.
in geology from American universities. He has spent one year in central
Chile studying gold placers. In addition, he has done extensive translation
work and reviews of Russian scientific literature for the U.S. Geological
Survey and various oil companies. He is now a part-time instructor in
Russian and German at the Colorado School of Mines.
167
168 Quarterly of the Colorado School of Mines
THEODORE S. CROSS
Theodore"Ted"
S. Cross, who is presently on leave from Pacific Power
& Light Company for graduate work at the University of Wyoming, started
working on the oil shale project with Noel Melton of the United States
Bureau of Mines in August 1965 in the Green River area.
Mr. Cross graduated with a B.S. degree in electrical engineering from
the Massachusetts Institute of Technology in 1956, and in the same year
received a B.S. degree in mathematics from St. Lawrence University. He
joined Pacific Power & Light Company shortly after graduation as a member
of the engineering department for theWyoming Division.
He has been a member of the Institute of Electrical and Electronics
Engineers since 1956. He is a registered Professional Engineer in Wyoming,
a member of the Wyoming Society of Professional Engineers, and a mem
ber of the National Society of Professional Engineers.
JOHN R. DONNELL
Mr. Donnell was born in Norwood, Massachusetts, in 1919. He has a
B.S. degree in geology from the University of Alabama. He studied further
at Stanford University in the field of geology. Most of his work has been in
investigations of oil shale. He has had experience in mapping areas under
lying coal deposits in Colorado and Kentucky and areas of potential interest
for oil and gas. He is presently with the U. S. Geological Survey in Denver.
JOHN R. DYNI
Mr. Dyni is presently employed as geologist by the Conservation Divi
sion, U. S. Geological Survey in Denver. His academic training includes
a B.S. degree from Wayne State University in 1953, and an M.S. degree in
geology from the University of Illinois in 1955. Mr. Dyni was employed
as engineering geologist by the U.S. Corps of Engineers, Kansas City, Mis
souri, from 1955 to 1958. Since 1958 Mr. Dyni has been associated with
the Geological Survey in Denver, and his work during this period has dealt
primarily with the geology of the leasable minerals on Federal lands in the
RockyMountain area.
NORTHCUTT ELY
Mr. Ely is a senior partner in the law firm of Ely and Duncan, Wash
ington, D.C. He is a member of the bar of the United State Supreme Court,
of the highest courts of California and New York, and of the District of
Columbia.

Biographies 169
Mr. Ely served as assistant to the Secretary of the Interior and chairman
of the Technical and Advisory Committee of the Federal Oil Conservation
Board, 1929-33, and has been in private practice since.
His firm specializes in natural resources law with particular attention to
mining, petroleum, water resources, and electric power. Recently Mr. Elydrafted mining laws for the Kingdom .of Saudi Arabia, the Malagasy Re
public, and Turkey, and has been consulted by a number of other foreign
governments in preparation of petroleum laws.
He drafted the federal regulations for unit operation of oil and gas
fields on the public domain, and was counsel to the Governor of Oklahoma
in the negotiation and drafting of the Interstate Oil Conservation Compact.
Mr. Ely is currently special counsel to the Colorado River Board of
California in interstate negotiations, and chief council for California ( Special
Assistant Attorney General ) in the United States Supreme Court litigation
over the Colorado River. He has been counsel in other Supreme Court litiga
tion involving the Columbia. Sacramento-San Joaquin. St. Lawrence, and
Niagara Rivers.
STANFORD FEIGELMAN
Mr. Feigelman received the degree of B.S. in chemical engineering from
Pennsylvania State University in 1951. He then joined the Atlantic RefiningCompany's Research and Development Department. In 1954 he joined the
U. S. Navy. In 1957. after his tour of duty with the Navy, he rejoined
Atlantic's R&D Department and began work on the development of the
HDA hydrodealkylation process.
In 1961. Mr. Feigelman joined the staff of Hydrocarbon Research at
the laboratory in Trenton. New Jersey. He supervised the development of
the Hy-C hydrocracking process and contributed to the correlation and data
analysis of the H-Oil process.
WALTER E. HEINRICHS. JR.
Walter E. Heinrichs, Jr., graduated from the Colorado School of Mines
in 1940 as a Geological Engineer with a geophysics major. In 1955 he re
ceived the School's first Van Diest Award for outstanding work during the
first fifteen years following graduation.
After graduation from Mines, he worked with National Geophysical
Company and Seismograph Service Corporation for four years. A two-year
term in the U.S. Navy was spent with the Office of Naval Petroleum Reserves
in Alaska and Washington. D. C. as an Assistant Geologist. This service

170 Quarterly of the Colorado School of Mines
included participation in the early Gulf Coast off-shore aerialmagnetometer
experiments.
Following this, he was with the U.S. Bureau of Reclamation as Assistant
Chief Geophysicist and with Newmont Mining Corporation. He was also
Acting Manager of Mining Exploration, United Geophysical Company, and
its affiliate, Pima Mining Company, Tucson, Arizona. From 1954 to 1958
he was Manager of Minerals Exploration Company for Union Oil Companyof California. In 1958 he formed Heinrichs Geoexploration Company, of
which he is President and General Manager serving the minerals industry
as consultant, specializing in geophysical and geological surveys.
KATHERINE C. HELLWIG
Katherine C. Hellwig is a Special Projects Engineer with Hydrocarbon
Research, Inc., in Trenton, New Jersey. Mrs. Hellwig previously was a
staff engineer in the Research Planning Division of the Cities Service
Research and Development Company in New York and a research engineer
with Petroleum Chemicals, Inc., in Lake Charles, Louisiana.
Mrs. Hellwig served as an assistant professor of engineering at McNeese
State College, while engaged in part-time consulting. She joined Ethyl
Corporation in Baton Rouge, Louisiana, as a chemical engineer where her
assignment included process evaluation and commercial plant process de
sign. Later she transferred to process development as a project leader in
charge of bench-scale and pilot plant operations. Mrs. Hellwig holds the
B.S.Ch.E. (1951) and M.S.Ch.E. (1954) from the University of Texas.
GEORGE R. HILL
Dr. Hill is Dean of the College of Mines and Mineral Industries at the
University of Utah. He was appointed an instructor in chemistry at Utah
in 1946, became an assistant professor in 1947, and associate professor
in 1950. He became organizer and head of the Department of Fuels Engineer
ing at the University in 1951.
Following graduation from Brigham Young University with an A.B.
degree in 1942, he earned a Ph.D. degree at Cornell University in 1946.
Dr. Hill's employment history includes an appointment as Project
Director of the Air Force Combustion Research, Light Atom Research and
Surface Chemistry Research sponsored by the ONR and AEC, Project Direc
tor of Air Force Office of Scientific Research High Energy Fuel Research.
Project Director of the Office of Coal Research of the U. S. Department of

Biographies 171
the Interior, and Project Director of Equity Oil Shale Research. He has
published over 30 technical articles.
ROBERT J. HITE
Mr. Hite received his B.A. degree in geology from Wichita State Uni
versity (1954) and completed two years of graduate work at the Universityof New Mexico ( 1954-56) . From 1956 to 1964 he was employed as geologist
with the Conservation Division, U.S. Geological Survey. He is currently
associated with the Geologic Division of the Survey in Denver. Mr. Hite's
professional work includes geologic quadrangle mapping in southeastern
Idaho and northern Utah, studies on the phosphate deposits of the Phos-
phoria Formation, and extensive studies on the evaporite and potash deposits
of the Paradox basin.
WILLIAM D. HOWELL
Howell is a project engineer in the Petroleum Engineering Research
Group, Bartlesville Petroleum Research Center of the Bureau of Mines. He
obtained his B.S. degree in petroleum engineering from Texas A & M in
1958, is a registered professional engineer in the State of Oklahoma, and
has authored several technical papers concerning the application of radio
isotopes in the petroleum industry. His current research efforts are in well
stimulation research.
DALE R. JESSE
Mr. Jesse is currently a Research Chemical Engineer at Texaco Inc's.
Montebello Research Laboratory. Since joining Texaco in 1962 he has
worked on hydrogenation process development, as well as oil processing.
He received his B.S. degree in 1958 and M.S. degree in 1960, both from the
University of Southern California. Prior to 1962 he was associated with
Union Carbide Chemical Company and Rexall Chemical Company.
HERBERT A. LESSER
Dr. Lesser, a senior research engineer with Esso Production Research
Company, is currently in the Reservoir Analysis Section conducting research
in numerical analysis. He received a Ph.D. degree in chemical engineering
from Princeton University in 1964 after receiving his B.S. degree from Rice
University.

172 Quarterly of the Colorado School of Mines
JOHN A. LOVE
John A. Love was elected Governor of the State of Colorado in 1962
and re-elected in 1966. He was named "Colorado Man of theYear"
three
times by the United Press International editors of Colorado.
Graduating from the University of Denver Law School in 1941 with an
LL.B., Governor Love passed the State Bar examinations and then enlisted
in the Naval aviation program where he earned pilot's wings. He served in
the South Pacific where he earned two Distinguished Flying Crosses and the
Air Medal with several clusters for action against the enemy.
Following the war, he returned to Colorado Springs where he practiced
law. He was President of the El Paso County Young Republicans in 1947
and 1948 and has served as a member of the El Paso Republican Executive
Committee and the Republican state central committee.
Governor Love was elected President of the Colorado Springs Chamber
of Commerce in 1954. He is a member of Rotary, the American Legion,
Colorado and American Bar Associations, Colorado Springs Chamber of
Commerce, Omicron Delta Kappa, Sigma Phi Epsilon, and many other pro
fessional and civic organizations.
NOEL M. MELTON
Noel M. Melton graduated from the University of Montana with a B.S.
in chemistry in 1931, and did graduate work at the University of Colorado
in 1933. He was employed by Stanolind Oil and Gas Co. as a research
chemist and assistant petroleum engineer until 1941. He was on extended
active duty as a Major in the U. S. Army from 1941 to 1946.
Mr. Melton has been associated with the U. S. Department of Interior,Bureau of Mines, Laramie Petroleum Research Center since March 1946,
and has worked on various research projects related to processing oil shale
and refining shale oil products. Since 1964 he has been in charge of the
research project to investigate electricity as a method of increasing per
meability in oil shale formations.
J. S. MILLER
Miller is a project engineer with the U. S. Bureau of Mines in Bartles
ville, Oklahoma. He joined the Bureau in 1952 after graduating with a
B.S. degree in petroleum from Marietta College, Marietta, Ohio. Miller has
been involved in research problems in transmission and storage of natural
gas. His research efforts since 1962 have been in well stimulation research.

Biographies 173
WARREN G SCHLINGER
Dr. Schlinger has been Supervisor of Research at Texaco Inc's. Monte
bello Research Laboratory since 1960. Since joining Texaco in 1953, his
research work has included process studies in hydrogen generation by Texaco's
partial oxidation process and development in hydrogenation and hydro-
treating, as well as recovery of shale oil*. Prior to joining Texaco he was a
Research Fellow at the California Institute of Technology where he received
his Ph.D. degree in chemical engineering in 1949. He also received his B.S.
degree in chemistry and M.S. degree in chemical engineering from the Cali
fornia Institute of Technology.
HERBERT L. STONE
Dr. Stone is research supervisor of the Reservoir Analysis Section of
Esso Production Research Company. He received his B.S. and Sc.D. degrees
in chemical engineering from Rice University and MIT. respectively. From
1953 to the present, he has worked on oil recovery methods and reservoir
engineering predictive techniques for both Humble's Production Research
Division and Esso Production Research Company.
IRVIN L. TAILLEUR
Mr. Tailleur was born in Mt. Vernon, Washington, in 1924. He has
A.B. and M.S. degrees, both in geology, from Cornell University. He was
a candidate for the Ph.D. degree at Stanford University in 1951-1953. He
is now with the U.S. Geological Survey in Menlo Park. California. Experi
ence includes aerial mapping and structural and stratigraphic studies in
northern Alaska.
H. A. TOURTELOT
Mr. Tourtelot was born in Lincoln, Nebraska, in 1918. He has an A.B.
degree in geology from the University of Nebraska earned in 1942. His
experience includes stratigraphic studies and geologic mapping in Tertiaryrocks of Mississippi and Alabama and Tertiary and underlying rocks in
Wyoming plus geochemical investigations of sedimentary rocks emphasizing
petrology and composition of fine-grained and organic-rich rocks. He is
with the U. S. Geological Survey in Denver.