GXM107802_005 Page 1 Dec. 31 2027 Round 4
15
GXM107802_005 Page 1 Dec. 31 2027 Round 4 Summary Report The summary report serves as a snapshot of the industry, your company and your competitors. You can quickly review how your company is performing against the competition, scan ratios for areas of threat, and analyze high-level market share breakdowns. Financials ($000) Andrews Baldwin Chester Digby Industry Avg. Sales $124,925 $269,531 $194,332 $113,783 $175,643 EBIT ($1,313) $50,267 $12,770 $14,463 $19,047 Profits ($6,052) $24,861 ($1,032) $2,417 $5,048 Cumulative Profit $12,497 $91,656 $41,428 $17,971 $40,888 SG&A: Sales 29.1% 9.2% 13.3% 18.1% 17.4% Contribution Margin 32.9% 30.1% 26.3% 37.8% 31.8% Emergency Loan $2,248 $0 $0 $0 $562 Ratios Andrews Baldwin Chester Digby Industry Avg. ROA -8.0% 18.0% -0.6% 2.1% 2.9% -22.9% 35.9% -1.3% 4.3% 4.0% ROS -4.8% 9.2% -0.5% 2.1% 1.5% Asset Turnover 1.65 1.95 1.18 1.00 1.45 Leverage 2.85 1.99 2.07 2.01 2.23 Market Share Market Share Andrews Baldwin Chester Digby Americas 18.7% 25.5% 29.8% 26.0% Europe 11.8% 32.3% 31.0% 24.9% Asia Pacific 18.1% 36.5% 45.4% 0% Total 16.1% 30.7% 34.2% 19.0%
-
Upload
khangminh22 -
Category
Documents
-
view
0 -
download
0
Transcript of GXM107802_005 Page 1 Dec. 31 2027 Round 4
GXM107802_005 Page 1Dec. 31 2027 Round 4
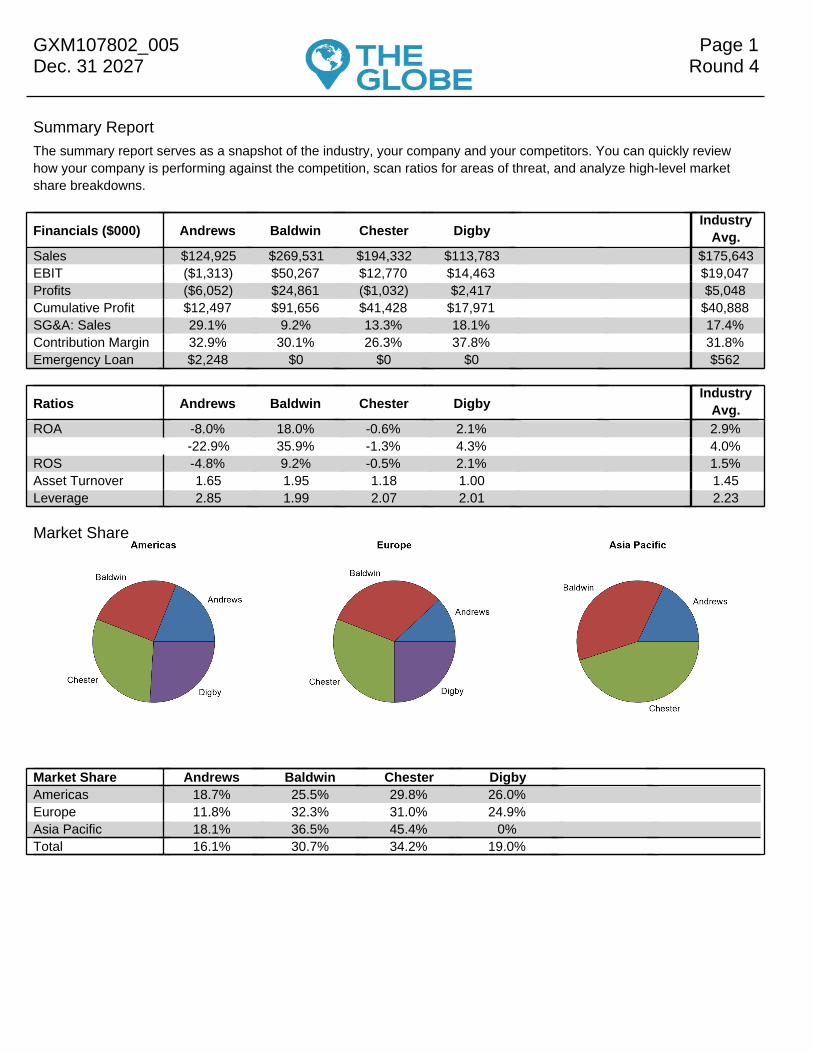
Summary ReportThe summary report serves as a snapshot of the industry, your company and your competitors. You can quickly reviewhow your company is performing against the competition, scan ratios for areas of threat, and analyze high-level marketshare breakdowns.
Financials ($000) Andrews Baldwin Chester DigbyIndustry
Avg.Sales $124,925 $269,531 $194,332 $113,783 $175,643EBIT ($1,313) $50,267 $12,770 $14,463 $19,047Profits ($6,052) $24,861 ($1,032) $2,417 $5,048Cumulative Profit $12,497 $91,656 $41,428 $17,971 $40,888SG&A: Sales 29.1% 9.2% 13.3% 18.1% 17.4%Contribution Margin 32.9% 30.1% 26.3% 37.8% 31.8%Emergency Loan $2,248 $0 $0 $0 $562
Ratios Andrews Baldwin Chester DigbyIndustry
Avg.ROA -8.0% 18.0% -0.6% 2.1% 2.9%
-22.9% 35.9% -1.3% 4.3% 4.0%ROS -4.8% 9.2% -0.5% 2.1% 1.5%Asset Turnover 1.65 1.95 1.18 1.00 1.45Leverage 2.85 1.99 2.07 2.01 2.23
Market Share
Market Share Andrews Baldwin Chester DigbyAmericas 18.7% 25.5% 29.8% 26.0%Europe 11.8% 32.3% 31.0% 24.9%Asia Pacific 18.1% 36.5% 45.4% 0%Total 16.1% 30.7% 34.2% 19.0%
GXM107802_005 Page 2Dec. 31 2027 Round 4
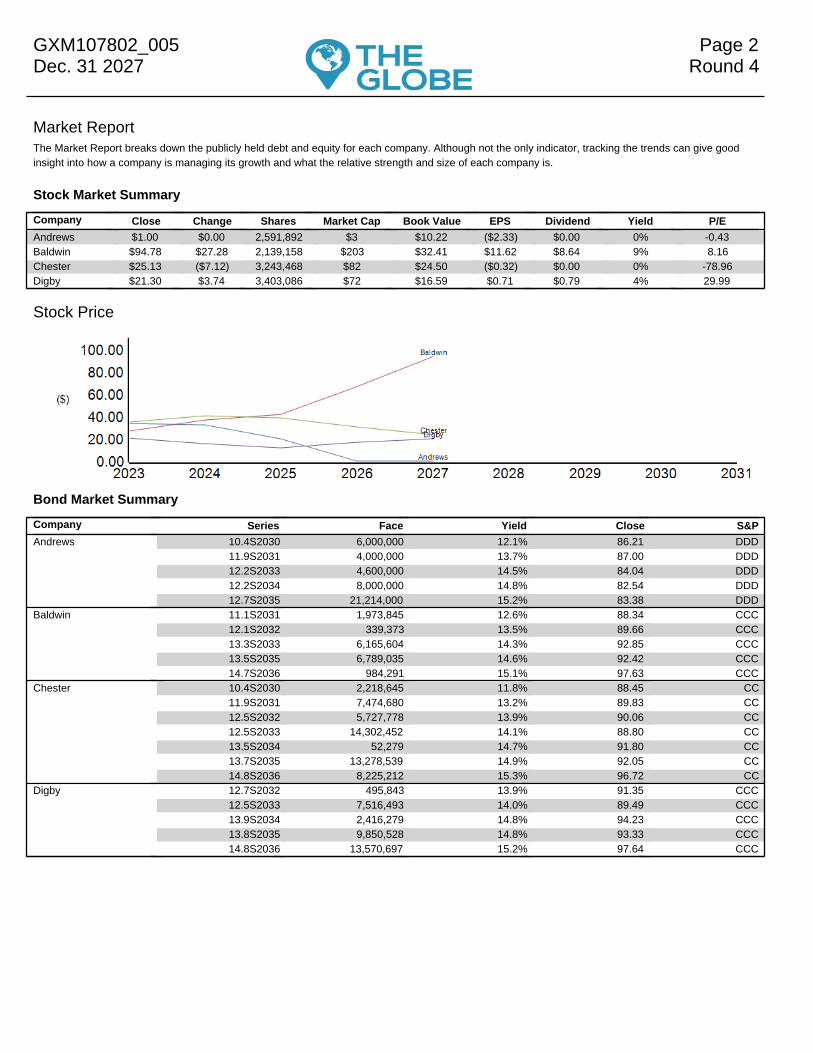
Market ReportThe Market Report breaks down the publicly held debt and equity for each company. Although not the only indicator, tracking the trends can give goodinsight into how a company is managing its growth and what the relative strength and size of each company is.
Stock Market Summary
Company Close Change Shares Market Cap Book Value EPS Dividend Yield P/EAndrews $1.00 $0.00 2,591,892 $3 $10.22 ($2.33) $0.00 0% -0.43Baldwin $94.78 $27.28 2,139,158 $203 $32.41 $11.62 $8.64 9% 8.16Chester $25.13 ($7.12) 3,243,468 $82 $24.50 ($0.32) $0.00 0% -78.96Digby $21.30 $3.74 3,403,086 $72 $16.59 $0.71 $0.79 4% 29.99
Stock Price
Bond Market Summary
Company Series Face Yield Close S&PAndrews 10.4S2030 6,000,000 12.1% 86.21 DDD
11.9S2031 4,000,000 13.7% 87.00 DDD12.2S2033 4,600,000 14.5% 84.04 DDD12.2S2034 8,000,000 14.8% 82.54 DDD12.7S2035 21,214,000 15.2% 83.38 DDD
Baldwin 11.1S2031 1,973,845 12.6% 88.34 CCC12.1S2032 339,373 13.5% 89.66 CCC13.3S2033 6,165,604 14.3% 92.85 CCC13.5S2035 6,789,035 14.6% 92.42 CCC14.7S2036 984,291 15.1% 97.63 CCC
Chester 10.4S2030 2,218,645 11.8% 88.45 CC11.9S2031 7,474,680 13.2% 89.83 CC12.5S2032 5,727,778 13.9% 90.06 CC12.5S2033 14,302,452 14.1% 88.80 CC13.5S2034 52,279 14.7% 91.80 CC13.7S2035 13,278,539 14.9% 92.05 CC14.8S2036 8,225,212 15.3% 96.72 CC
Digby 12.7S2032 495,843 13.9% 91.35 CCC12.5S2033 7,516,493 14.0% 89.49 CCC13.9S2034 2,416,279 14.8% 94.23 CCC13.8S2035 9,850,528 14.8% 93.33 CCC14.8S2036 13,570,697 15.2% 97.64 CCC
GXM107802_005 Page 3Dec. 31 2027 Round 4
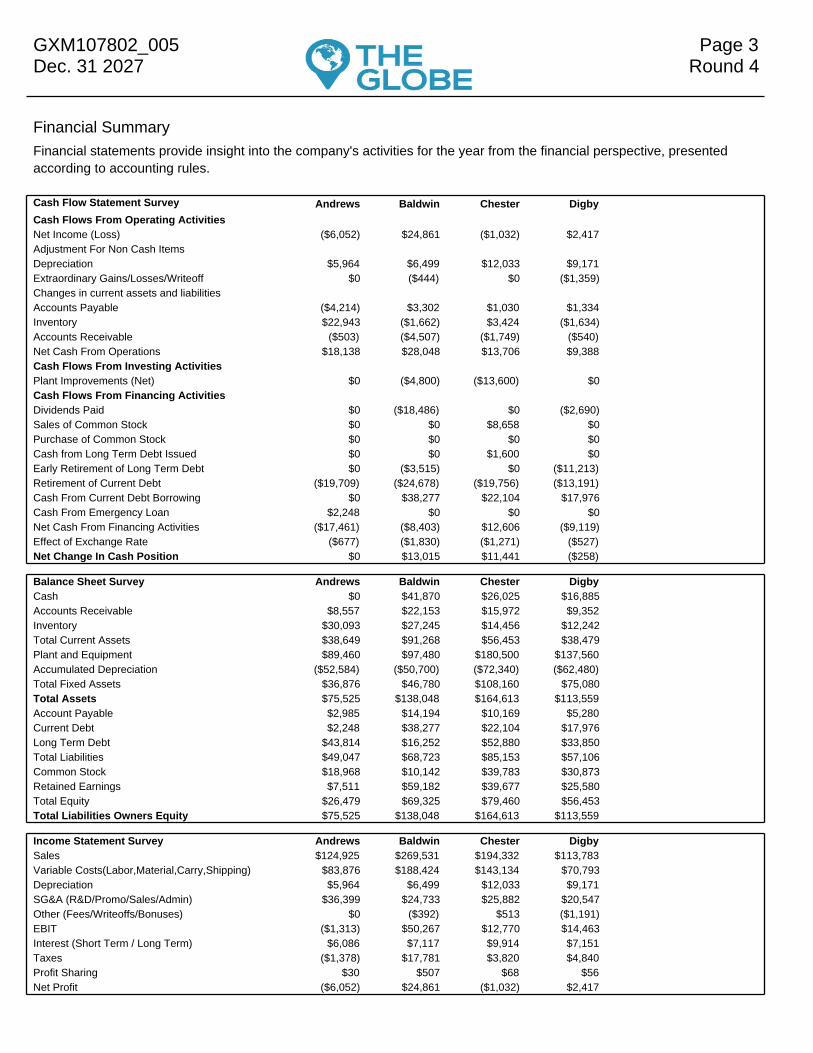
Financial SummaryFinancial statements provide insight into the company's activities for the year from the financial perspective, presentedaccording to accounting rules.
Cash Flow Statement Survey Andrews Baldwin Chester DigbyCash Flows From Operating ActivitiesNet Income (Loss) ($6,052) $24,861 ($1,032) $2,417Adjustment For Non Cash ItemsDepreciation $5,964 $6,499 $12,033 $9,171Extraordinary Gains/Losses/Writeoff $0 ($444) $0 ($1,359)Changes in current assets and liabilitiesAccounts Payable ($4,214) $3,302 $1,030 $1,334Inventory $22,943 ($1,662) $3,424 ($1,634)Accounts Receivable ($503) ($4,507) ($1,749) ($540)Net Cash From Operations $18,138 $28,048 $13,706 $9,388Cash Flows From Investing ActivitiesPlant Improvements (Net) $0 ($4,800) ($13,600) $0Cash Flows From Financing ActivitiesDividends Paid $0 ($18,486) $0 ($2,690)Sales of Common Stock $0 $0 $8,658 $0Purchase of Common Stock $0 $0 $0 $0Cash from Long Term Debt Issued $0 $0 $1,600 $0Early Retirement of Long Term Debt $0 ($3,515) $0 ($11,213)Retirement of Current Debt ($19,709) ($24,678) ($19,756) ($13,191)Cash From Current Debt Borrowing $0 $38,277 $22,104 $17,976Cash From Emergency Loan $2,248 $0 $0 $0Net Cash From Financing Activities ($17,461) ($8,403) $12,606 ($9,119)Effect of Exchange Rate ($677) ($1,830) ($1,271) ($527)Net Change In Cash Position $0 $13,015 $11,441 ($258)
Balance Sheet Survey Andrews Baldwin Chester DigbyCash $0 $41,870 $26,025 $16,885Accounts Receivable $8,557 $22,153 $15,972 $9,352Inventory $30,093 $27,245 $14,456 $12,242Total Current Assets $38,649 $91,268 $56,453 $38,479Plant and Equipment $89,460 $97,480 $180,500 $137,560Accumulated Depreciation ($52,584) ($50,700) ($72,340) ($62,480)Total Fixed Assets $36,876 $46,780 $108,160 $75,080Total Assets $75,525 $138,048 $164,613 $113,559Account Payable $2,985 $14,194 $10,169 $5,280Current Debt $2,248 $38,277 $22,104 $17,976Long Term Debt $43,814 $16,252 $52,880 $33,850Total Liabilities $49,047 $68,723 $85,153 $57,106Common Stock $18,968 $10,142 $39,783 $30,873Retained Earnings $7,511 $59,182 $39,677 $25,580Total Equity $26,479 $69,325 $79,460 $56,453Total Liabilities Owners Equity $75,525 $138,048 $164,613 $113,559
Income Statement Survey Andrews Baldwin Chester DigbySales $124,925 $269,531 $194,332 $113,783Variable Costs(Labor,Material,Carry,Shipping) $83,876 $188,424 $143,134 $70,793Depreciation $5,964 $6,499 $12,033 $9,171SG&A (R&D/Promo/Sales/Admin) $36,399 $24,733 $25,882 $20,547Other (Fees/Writeoffs/Bonuses) $0 ($392) $513 ($1,191)EBIT ($1,313) $50,267 $12,770 $14,463Interest (Short Term / Long Term) $6,086 $7,117 $9,914 $7,151Taxes ($1,378) $17,781 $3,820 $4,840Profit Sharing $30 $507 $68 $56Net Profit ($6,052) $24,861 ($1,032) $2,417
GXM107802_005 Page 4Dec. 31 2027 Round 4
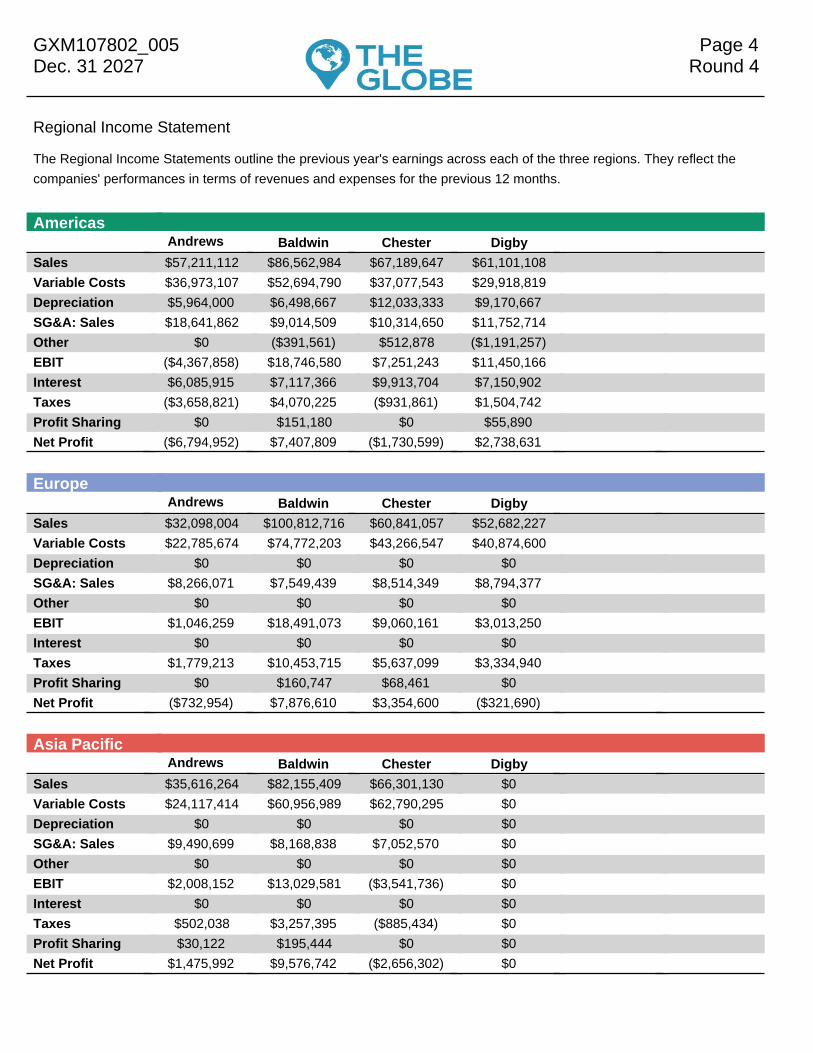
Regional Income Statement
The Regional Income Statements outline the previous year's earnings across each of the three regions. They reflect thecompanies' performances in terms of revenues and expenses for the previous 12 months.
AmericasAndrews Baldwin Chester Digby
Sales $57,211,112 $86,562,984 $67,189,647 $61,101,108Variable Costs $36,973,107 $52,694,790 $37,077,543 $29,918,819Depreciation $5,964,000 $6,498,667 $12,033,333 $9,170,667SG&A: Sales $18,641,862 $9,014,509 $10,314,650 $11,752,714Other $0 ($391,561) $512,878 ($1,191,257)EBIT ($4,367,858) $18,746,580 $7,251,243 $11,450,166Interest $6,085,915 $7,117,366 $9,913,704 $7,150,902Taxes ($3,658,821) $4,070,225 ($931,861) $1,504,742Profit Sharing $0 $151,180 $0 $55,890Net Profit ($6,794,952) $7,407,809 ($1,730,599) $2,738,631
EuropeAndrews Baldwin Chester Digby
Sales $32,098,004 $100,812,716 $60,841,057 $52,682,227Variable Costs $22,785,674 $74,772,203 $43,266,547 $40,874,600Depreciation $0 $0 $0 $0SG&A: Sales $8,266,071 $7,549,439 $8,514,349 $8,794,377Other $0 $0 $0 $0EBIT $1,046,259 $18,491,073 $9,060,161 $3,013,250Interest $0 $0 $0 $0Taxes $1,779,213 $10,453,715 $5,637,099 $3,334,940Profit Sharing $0 $160,747 $68,461 $0Net Profit ($732,954) $7,876,610 $3,354,600 ($321,690)
Asia PacificAndrews Baldwin Chester Digby
Sales $35,616,264 $82,155,409 $66,301,130 $0Variable Costs $24,117,414 $60,956,989 $62,790,295 $0Depreciation $0 $0 $0 $0SG&A: Sales $9,490,699 $8,168,838 $7,052,570 $0Other $0 $0 $0 $0EBIT $2,008,152 $13,029,581 ($3,541,736) $0Interest $0 $0 $0 $0Taxes $502,038 $3,257,395 ($885,434) $0Profit Sharing $30,122 $195,444 $0 $0Net Profit $1,475,992 $9,576,742 ($2,656,302) $0
GXM107802_005 Page 5Dec. 31 2027 Round 4
Production Analysis
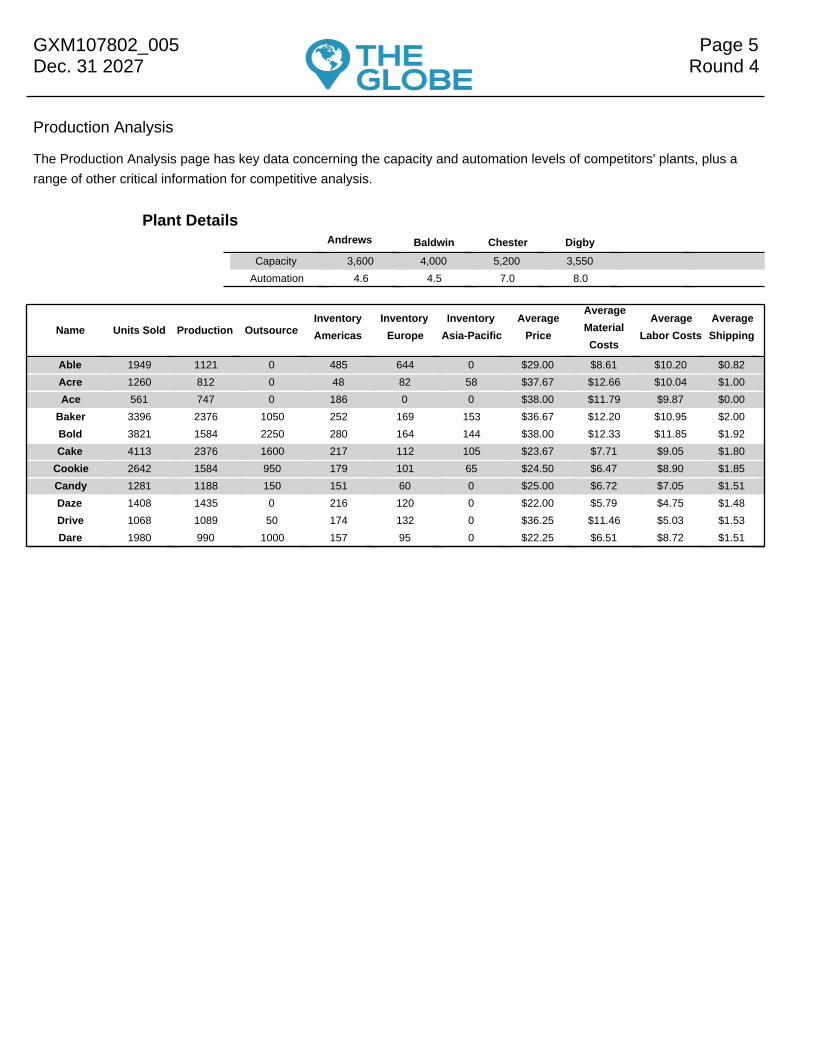
The Production Analysis page has key data concerning the capacity and automation levels of competitors' plants, plus arange of other critical information for competitive analysis.
Plant DetailsAndrews Baldwin Chester Digby
Capacity 3,600 4,000 5,200 3,550Automation 4.6 4.5 7.0 8.0
Name Units Sold Production OutsourceInventoryAmericas
InventoryEurope
InventoryAsia-Pacific
AveragePrice
AverageMaterialCosts
AverageLabor Costs
AverageShipping
Able 1949 1121 0 485 644 0 $29.00 $8.61 $10.20 $0.82Acre 1260 812 0 48 82 58 $37.67 $12.66 $10.04 $1.00Ace 561 747 0 186 0 0 $38.00 $11.79 $9.87 $0.00
Baker 3396 2376 1050 252 169 153 $36.67 $12.20 $10.95 $2.00Bold 3821 1584 2250 280 164 144 $38.00 $12.33 $11.85 $1.92Cake 4113 2376 1600 217 112 105 $23.67 $7.71 $9.05 $1.80
Cookie 2642 1584 950 179 101 65 $24.50 $6.47 $8.90 $1.85Candy 1281 1188 150 151 60 0 $25.00 $6.72 $7.05 $1.51Daze 1408 1435 0 216 120 0 $22.00 $5.79 $4.75 $1.48Drive 1068 1089 50 174 132 0 $36.25 $11.46 $5.03 $1.53Dare 1980 990 1000 157 95 0 $22.25 $6.51 $8.72 $1.51
GXM107802_005 Page 6Dec. 31 2027 Round 4
Product Analysis
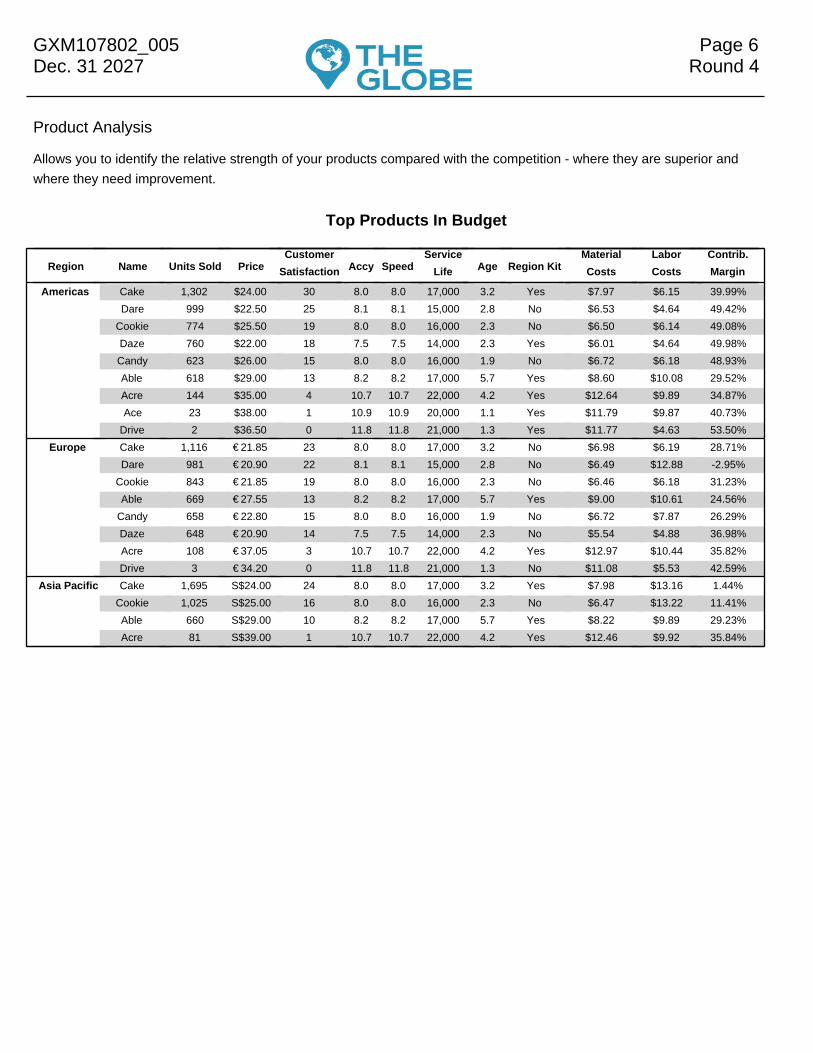
Allows you to identify the relative strength of your products compared with the competition - where they are superior andwhere they need improvement.
Top Products In Budget
Region Name Units Sold PriceCustomer
Satisfaction Accy SpeedService
Life Age Region KitMaterialCosts
LaborCosts
Contrib.Margin
Americas Cake 1,302 $24.00 30 8.0 8.0 17,000 3.2 Yes $7.97 $6.15 39.99%Dare 999 $22.50 25 8.1 8.1 15,000 2.8 No $6.53 $4.64 49.42%
Cookie 774 $25.50 19 8.0 8.0 16,000 2.3 No $6.50 $6.14 49.08%Daze 760 $22.00 18 7.5 7.5 14,000 2.3 Yes $6.01 $4.64 49.98%Candy 623 $26.00 15 8.0 8.0 16,000 1.9 No $6.72 $6.18 48.93%Able 618 $29.00 13 8.2 8.2 17,000 5.7 Yes $8.60 $10.08 29.52%Acre 144 $35.00 4 10.7 10.7 22,000 4.2 Yes $12.64 $9.89 34.87%Ace 23 $38.00 1 10.9 10.9 20,000 1.1 Yes $11.79 $9.87 40.73%
Drive 2 $36.50 0 11.8 11.8 21,000 1.3 Yes $11.77 $4.63 53.50%Europe Cake 1,116 €21.85 23 8.0 8.0 17,000 3.2 No $6.98 $6.19 28.71%
Dare 981 €20.90 22 8.1 8.1 15,000 2.8 No $6.49 $12.88 -2.95%Cookie 843 €21.85 19 8.0 8.0 16,000 2.3 No $6.46 $6.18 31.23%Able 669 €27.55 13 8.2 8.2 17,000 5.7 Yes $9.00 $10.61 24.56%
Candy 658 €22.80 15 8.0 8.0 16,000 1.9 No $6.72 $7.87 26.29%Daze 648 €20.90 14 7.5 7.5 14,000 2.3 No $5.54 $4.88 36.98%Acre 108 €37.05 3 10.7 10.7 22,000 4.2 Yes $12.97 $10.44 35.82%Drive 3 €34.20 0 11.8 11.8 21,000 1.3 No $11.08 $5.53 42.59%
Asia Pacific Cake 1,695 S$24.00 24 8.0 8.0 17,000 3.2 Yes $7.98 $13.16 1.44%Cookie 1,025 S$25.00 16 8.0 8.0 16,000 2.3 No $6.47 $13.22 11.41%Able 660 S$29.00 10 8.2 8.2 17,000 5.7 Yes $8.22 $9.89 29.23%Acre 81 S$39.00 1 10.7 10.7 22,000 4.2 Yes $12.46 $9.92 35.84%
GXM107802_005 Page 7Dec. 31 2027 Round 4
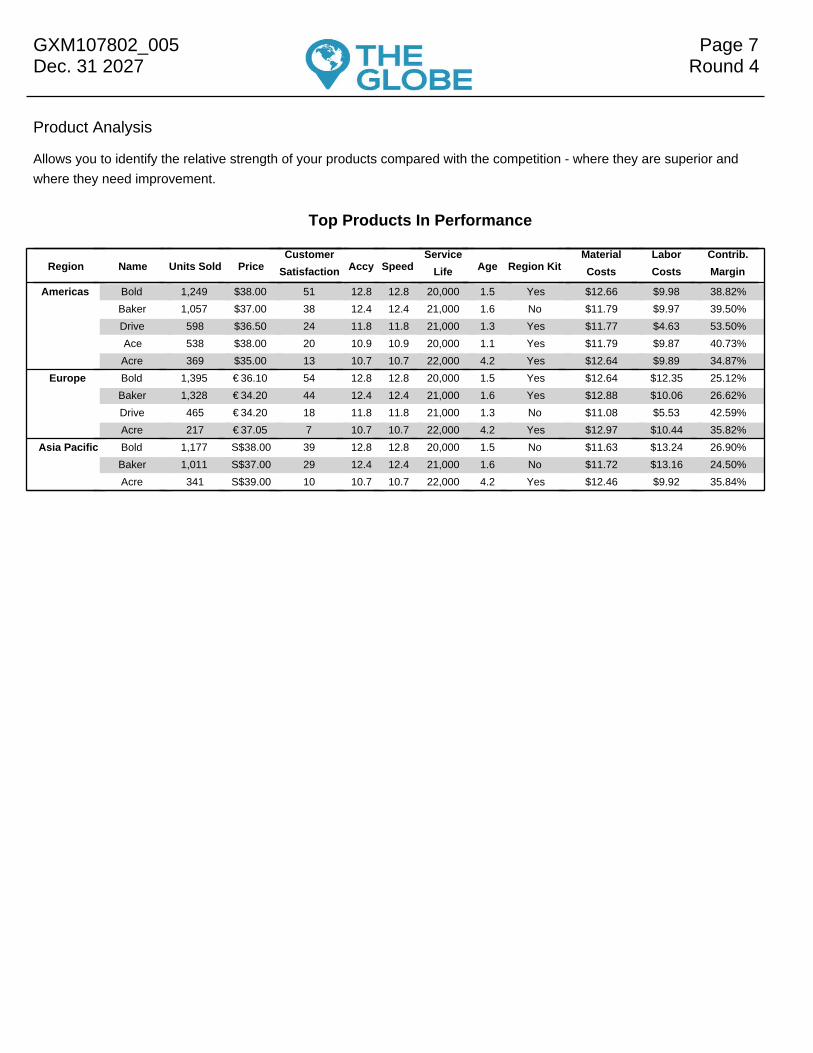
Product Analysis
Allows you to identify the relative strength of your products compared with the competition - where they are superior andwhere they need improvement.
Top Products In Performance
Region Name Units Sold PriceCustomer
Satisfaction Accy SpeedService
Life Age Region KitMaterialCosts
LaborCosts
Contrib.Margin
Americas Bold 1,249 $38.00 51 12.8 12.8 20,000 1.5 Yes $12.66 $9.98 38.82%Baker 1,057 $37.00 38 12.4 12.4 21,000 1.6 No $11.79 $9.97 39.50%Drive 598 $36.50 24 11.8 11.8 21,000 1.3 Yes $11.77 $4.63 53.50%Ace 538 $38.00 20 10.9 10.9 20,000 1.1 Yes $11.79 $9.87 40.73%Acre 369 $35.00 13 10.7 10.7 22,000 4.2 Yes $12.64 $9.89 34.87%
Europe Bold 1,395 €36.10 54 12.8 12.8 20,000 1.5 Yes $12.64 $12.35 25.12%Baker 1,328 €34.20 44 12.4 12.4 21,000 1.6 Yes $12.88 $10.06 26.62%Drive 465 €34.20 18 11.8 11.8 21,000 1.3 No $11.08 $5.53 42.59%Acre 217 €37.05 7 10.7 10.7 22,000 4.2 Yes $12.97 $10.44 35.82%
Asia Pacific Bold 1,177 S$38.00 39 12.8 12.8 20,000 1.5 No $11.63 $13.24 26.90%Baker 1,011 S$37.00 29 12.4 12.4 21,000 1.6 No $11.72 $13.16 24.50%Acre 341 S$39.00 10 10.7 10.7 22,000 4.2 Yes $12.46 $9.92 35.84%
GXM107802_005 Page 8Dec. 31 2027 Round 4
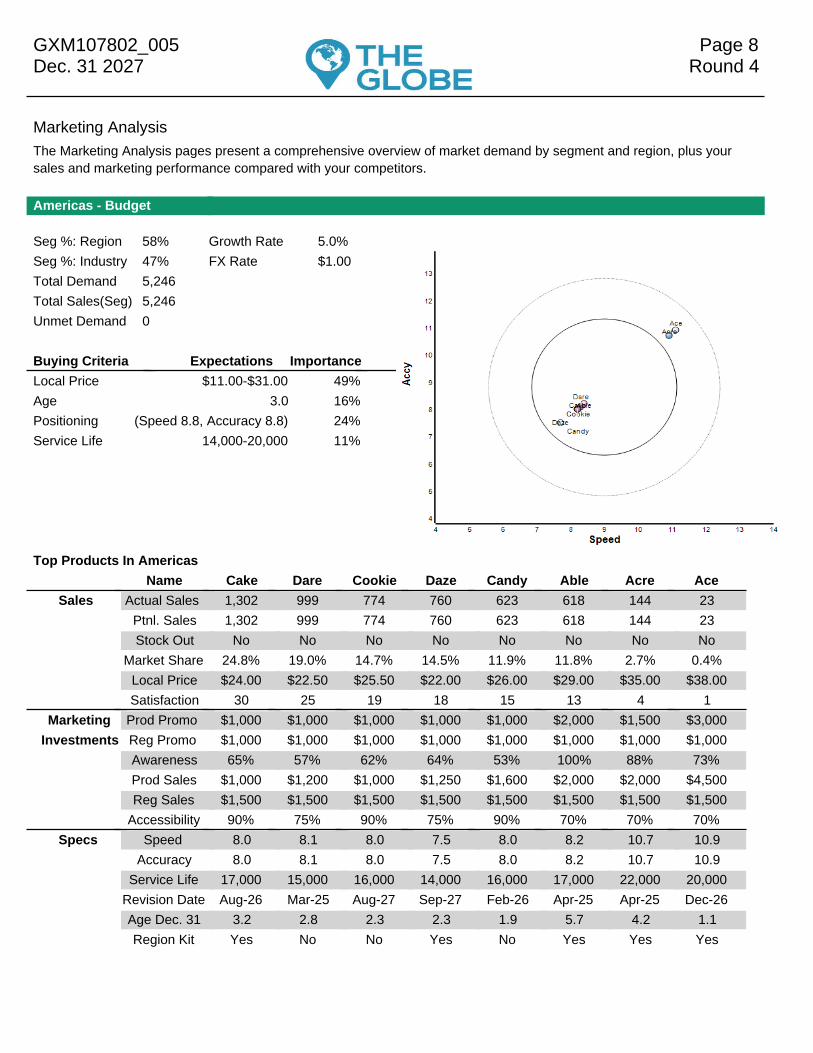
Marketing AnalysisThe Marketing Analysis pages present a comprehensive overview of market demand by segment and region, plus yoursales and marketing performance compared with your competitors.
Americas - Budget
Seg %: Region 58% Growth Rate 5.0%Seg %: Industry 47% FX Rate $1.00Total Demand 5,246Total Sales(Seg) 5,246Unmet Demand 0
Buying Criteria Expectations ImportanceLocal Price $11.00-$31.00 49%Age 3.0 16%Positioning (Speed 8.8, Accuracy 8.8) 24%Service Life 14,000-20,000 11%
Top Products In AmericasName Cake Dare Cookie Daze Candy Able Acre Ace
Sales Actual Sales 1,302 999 774 760 623 618 144 23Ptnl. Sales 1,302 999 774 760 623 618 144 23Stock Out No No No No No No No No
Market Share 24.8% 19.0% 14.7% 14.5% 11.9% 11.8% 2.7% 0.4%Local Price $24.00 $22.50 $25.50 $22.00 $26.00 $29.00 $35.00 $38.00Satisfaction 30 25 19 18 15 13 4 1
Marketing Prod Promo $1,000 $1,000 $1,000 $1,000 $1,000 $2,000 $1,500 $3,000Investments Reg Promo $1,000 $1,000 $1,000 $1,000 $1,000 $1,000 $1,000 $1,000
Awareness 65% 57% 62% 64% 53% 100% 88% 73%Prod Sales $1,000 $1,200 $1,000 $1,250 $1,600 $2,000 $2,000 $4,500Reg Sales $1,500 $1,500 $1,500 $1,500 $1,500 $1,500 $1,500 $1,500
Accessibility 90% 75% 90% 75% 90% 70% 70% 70%Specs Speed 8.0 8.1 8.0 7.5 8.0 8.2 10.7 10.9
Accuracy 8.0 8.1 8.0 7.5 8.0 8.2 10.7 10.9Service Life 17,000 15,000 16,000 14,000 16,000 17,000 22,000 20,000
Revision Date Aug-26 Mar-25 Aug-27 Sep-27 Feb-26 Apr-25 Apr-25 Dec-26Age Dec. 31 3.2 2.8 2.3 2.3 1.9 5.7 4.2 1.1Region Kit Yes No No Yes No Yes Yes Yes
GXM107802_005 Page 9Dec. 31 2027 Round 4
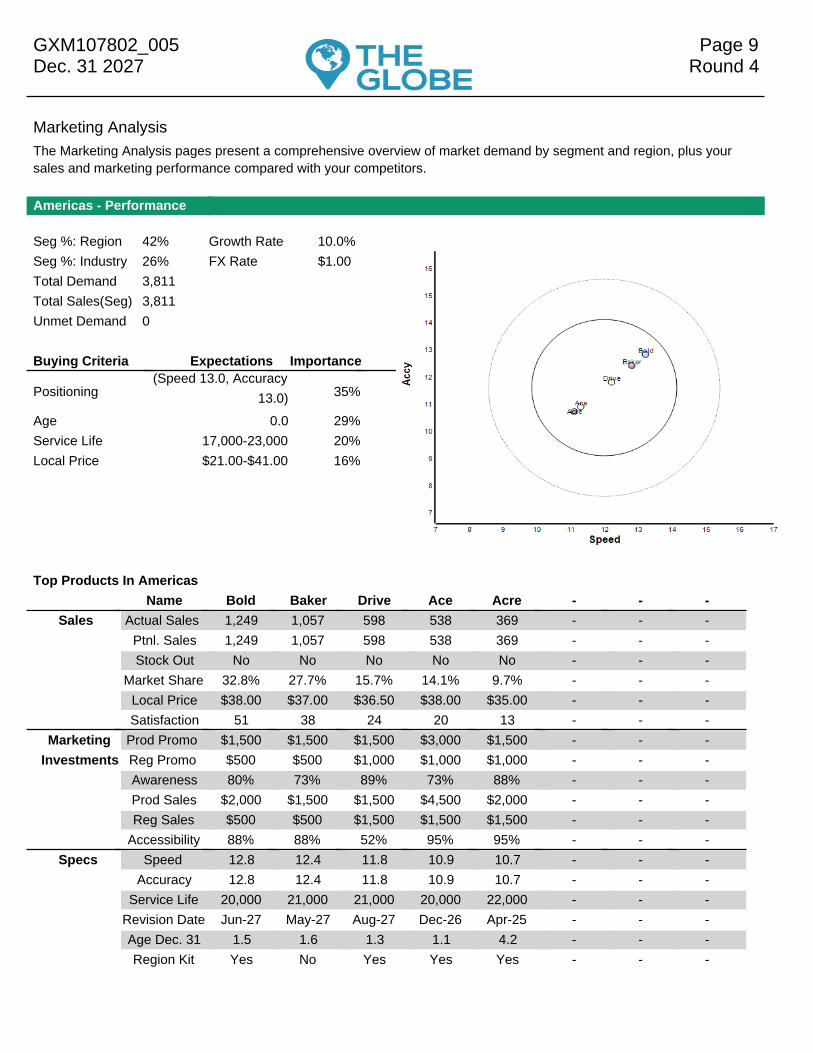
Marketing AnalysisThe Marketing Analysis pages present a comprehensive overview of market demand by segment and region, plus yoursales and marketing performance compared with your competitors.
Americas - Performance
Seg %: Region 42% Growth Rate 10.0%Seg %: Industry 26% FX Rate $1.00Total Demand 3,811Total Sales(Seg) 3,811Unmet Demand 0
Buying Criteria Expectations Importance
Positioning(Speed 13.0, Accuracy
13.0) 35%
Age 0.0 29%Service Life 17,000-23,000 20%Local Price $21.00-$41.00 16%
Top Products In AmericasName Bold Baker Drive Ace Acre - - -
Sales Actual Sales 1,249 1,057 598 538 369 - - -Ptnl. Sales 1,249 1,057 598 538 369 - - -Stock Out No No No No No - - -
Market Share 32.8% 27.7% 15.7% 14.1% 9.7% - - -Local Price $38.00 $37.00 $36.50 $38.00 $35.00 - - -Satisfaction 51 38 24 20 13 - - -
Marketing Prod Promo $1,500 $1,500 $1,500 $3,000 $1,500 - - -Investments Reg Promo $500 $500 $1,000 $1,000 $1,000 - - -
Awareness 80% 73% 89% 73% 88% - - -Prod Sales $2,000 $1,500 $1,500 $4,500 $2,000 - - -Reg Sales $500 $500 $1,500 $1,500 $1,500 - - -
Accessibility 88% 88% 52% 95% 95% - - -Specs Speed 12.8 12.4 11.8 10.9 10.7 - - -
Accuracy 12.8 12.4 11.8 10.9 10.7 - - -Service Life 20,000 21,000 21,000 20,000 22,000 - - -
Revision Date Jun-27 May-27 Aug-27 Dec-26 Apr-25 - - -Age Dec. 31 1.5 1.6 1.3 1.1 4.2 - - -Region Kit Yes No Yes Yes Yes - - -
GXM107802_005 Page 10Dec. 31 2027 Round 4
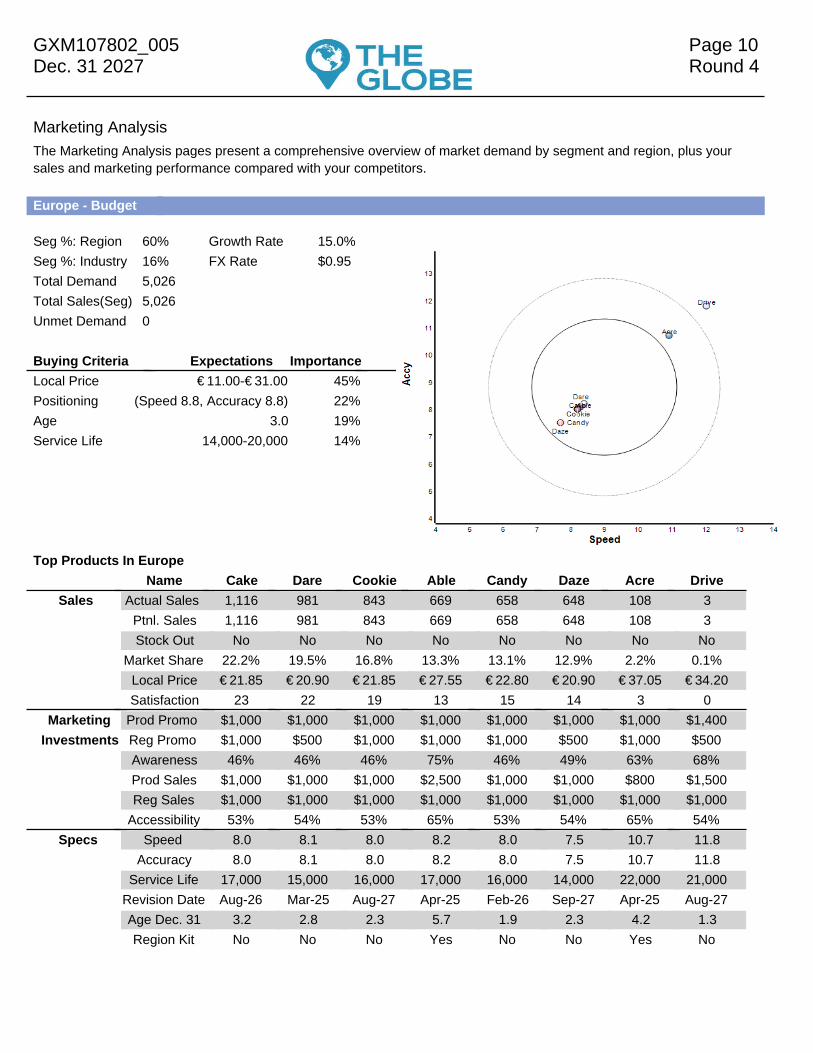
Marketing AnalysisThe Marketing Analysis pages present a comprehensive overview of market demand by segment and region, plus yoursales and marketing performance compared with your competitors.
Europe - Budget
Seg %: Region 60% Growth Rate 15.0%Seg %: Industry 16% FX Rate $0.95Total Demand 5,026Total Sales(Seg) 5,026Unmet Demand 0
Buying Criteria Expectations ImportanceLocal Price €11.00-€31.00 45%Positioning (Speed 8.8, Accuracy 8.8) 22%Age 3.0 19%Service Life 14,000-20,000 14%
Top Products In EuropeName Cake Dare Cookie Able Candy Daze Acre Drive
Sales Actual Sales 1,116 981 843 669 658 648 108 3Ptnl. Sales 1,116 981 843 669 658 648 108 3Stock Out No No No No No No No No
Market Share 22.2% 19.5% 16.8% 13.3% 13.1% 12.9% 2.2% 0.1%Local Price €21.85 €20.90 €21.85 €27.55 €22.80 €20.90 €37.05 €34.20Satisfaction 23 22 19 13 15 14 3 0
Marketing Prod Promo $1,000 $1,000 $1,000 $1,000 $1,000 $1,000 $1,000 $1,400Investments Reg Promo $1,000 $500 $1,000 $1,000 $1,000 $500 $1,000 $500
Awareness 46% 46% 46% 75% 46% 49% 63% 68%Prod Sales $1,000 $1,000 $1,000 $2,500 $1,000 $1,000 $800 $1,500Reg Sales $1,000 $1,000 $1,000 $1,000 $1,000 $1,000 $1,000 $1,000
Accessibility 53% 54% 53% 65% 53% 54% 65% 54%Specs Speed 8.0 8.1 8.0 8.2 8.0 7.5 10.7 11.8
Accuracy 8.0 8.1 8.0 8.2 8.0 7.5 10.7 11.8Service Life 17,000 15,000 16,000 17,000 16,000 14,000 22,000 21,000
Revision Date Aug-26 Mar-25 Aug-27 Apr-25 Feb-26 Sep-27 Apr-25 Aug-27Age Dec. 31 3.2 2.8 2.3 5.7 1.9 2.3 4.2 1.3Region Kit No No No Yes No No Yes No
GXM107802_005 Page 11Dec. 31 2027 Round 4
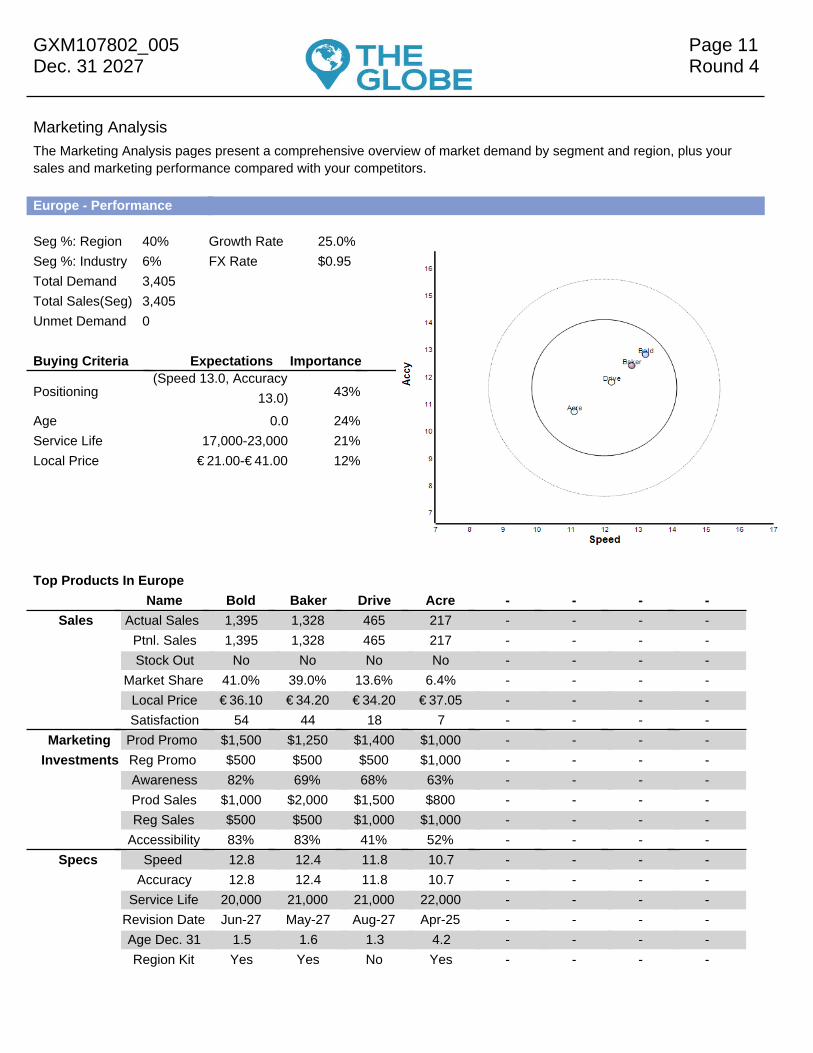
Marketing AnalysisThe Marketing Analysis pages present a comprehensive overview of market demand by segment and region, plus yoursales and marketing performance compared with your competitors.
Europe - Performance
Seg %: Region 40% Growth Rate 25.0%Seg %: Industry 6% FX Rate $0.95Total Demand 3,405Total Sales(Seg) 3,405Unmet Demand 0
Buying Criteria Expectations Importance
Positioning(Speed 13.0, Accuracy
13.0) 43%
Age 0.0 24%Service Life 17,000-23,000 21%Local Price €21.00-€41.00 12%
Top Products In EuropeName Bold Baker Drive Acre - - - -
Sales Actual Sales 1,395 1,328 465 217 - - - -Ptnl. Sales 1,395 1,328 465 217 - - - -Stock Out No No No No - - - -
Market Share 41.0% 39.0% 13.6% 6.4% - - - -Local Price €36.10 €34.20 €34.20 €37.05 - - - -Satisfaction 54 44 18 7 - - - -
Marketing Prod Promo $1,500 $1,250 $1,400 $1,000 - - - -Investments Reg Promo $500 $500 $500 $1,000 - - - -
Awareness 82% 69% 68% 63% - - - -Prod Sales $1,000 $2,000 $1,500 $800 - - - -Reg Sales $500 $500 $1,000 $1,000 - - - -
Accessibility 83% 83% 41% 52% - - - -Specs Speed 12.8 12.4 11.8 10.7 - - - -
Accuracy 12.8 12.4 11.8 10.7 - - - -Service Life 20,000 21,000 21,000 22,000 - - - -
Revision Date Jun-27 May-27 Aug-27 Apr-25 - - - -Age Dec. 31 1.5 1.6 1.3 4.2 - - - -Region Kit Yes Yes No Yes - - - -
GXM107802_005 Page 12Dec. 31 2027 Round 4
Marketing AnalysisThe Marketing Analysis pages present a comprehensive overview of market demand by segment and region, plus yoursales and marketing performance compared with your competitors.
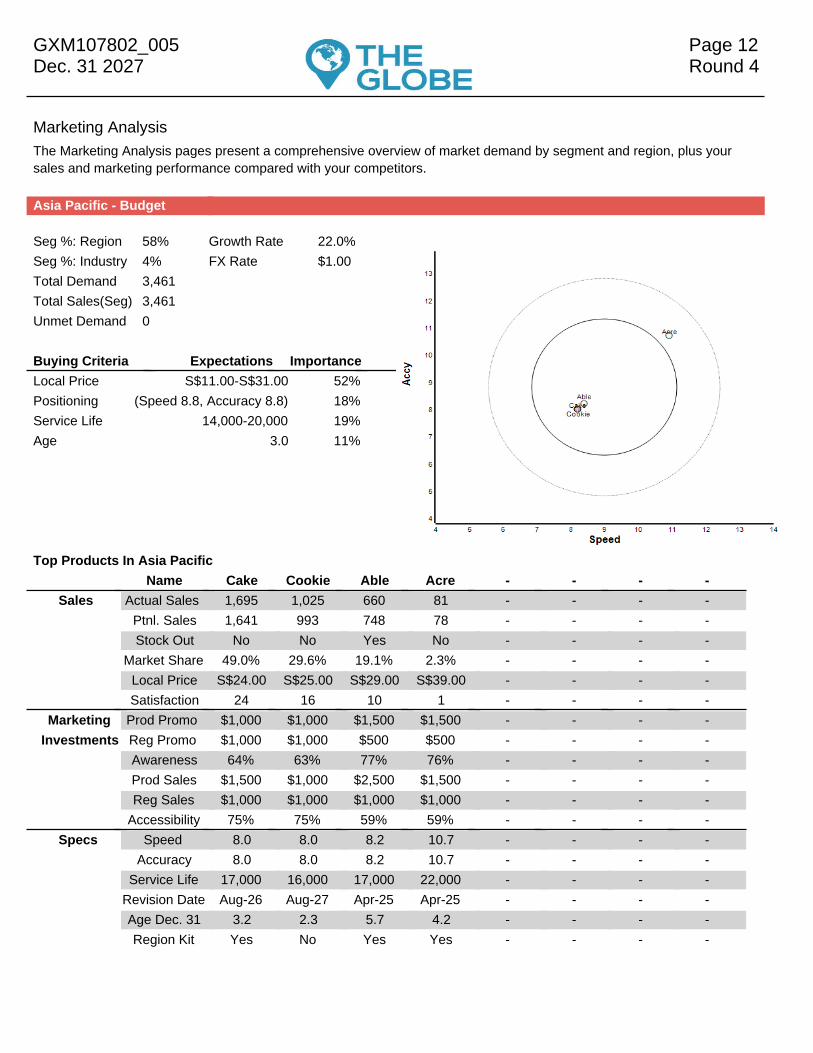
Asia Pacific - Budget
Seg %: Region 58% Growth Rate 22.0%Seg %: Industry 4% FX Rate $1.00Total Demand 3,461Total Sales(Seg) 3,461Unmet Demand 0
Buying Criteria Expectations ImportanceLocal Price S$11.00-S$31.00 52%Positioning (Speed 8.8, Accuracy 8.8) 18%Service Life 14,000-20,000 19%Age 3.0 11%
Top Products In Asia PacificName Cake Cookie Able Acre - - - -
Sales Actual Sales 1,695 1,025 660 81 - - - -Ptnl. Sales 1,641 993 748 78 - - - -Stock Out No No Yes No - - - -
Market Share 49.0% 29.6% 19.1% 2.3% - - - -Local Price S$24.00 S$25.00 S$29.00 S$39.00 - - - -Satisfaction 24 16 10 1 - - - -
Marketing Prod Promo $1,000 $1,000 $1,500 $1,500 - - - -Investments Reg Promo $1,000 $1,000 $500 $500 - - - -
Awareness 64% 63% 77% 76% - - - -Prod Sales $1,500 $1,000 $2,500 $1,500 - - - -Reg Sales $1,000 $1,000 $1,000 $1,000 - - - -
Accessibility 75% 75% 59% 59% - - - -Specs Speed 8.0 8.0 8.2 10.7 - - - -
Accuracy 8.0 8.0 8.2 10.7 - - - -Service Life 17,000 16,000 17,000 22,000 - - - -
Revision Date Aug-26 Aug-27 Apr-25 Apr-25 - - - -Age Dec. 31 3.2 2.3 5.7 4.2 - - - -Region Kit Yes No Yes Yes - - - -
GXM107802_005 Page 13Dec. 31 2027 Round 4
Marketing AnalysisThe Marketing Analysis pages present a comprehensive overview of market demand by segment and region, plus yoursales and marketing performance compared with your competitors.
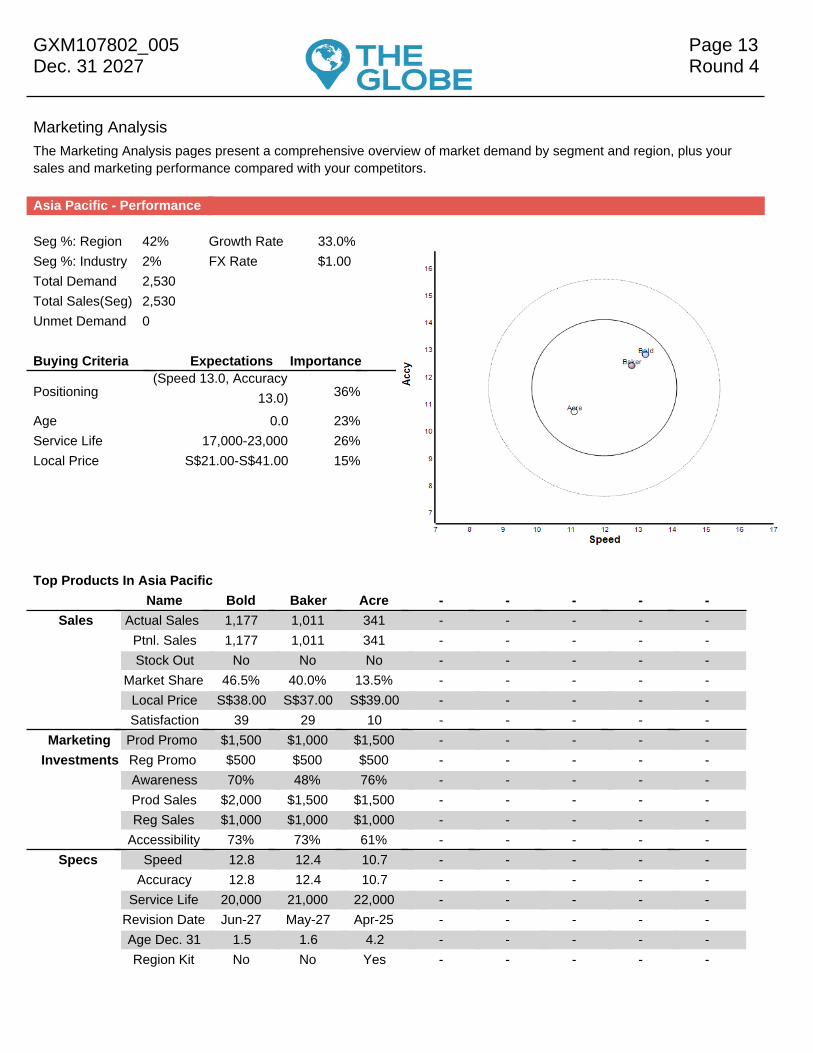
Asia Pacific - Performance
Seg %: Region 42% Growth Rate 33.0%Seg %: Industry 2% FX Rate $1.00Total Demand 2,530Total Sales(Seg) 2,530Unmet Demand 0
Buying Criteria Expectations Importance
Positioning(Speed 13.0, Accuracy
13.0) 36%
Age 0.0 23%Service Life 17,000-23,000 26%Local Price S$21.00-S$41.00 15%
Top Products In Asia PacificName Bold Baker Acre - - - - -
Sales Actual Sales 1,177 1,011 341 - - - - -Ptnl. Sales 1,177 1,011 341 - - - - -Stock Out No No No - - - - -
Market Share 46.5% 40.0% 13.5% - - - - -Local Price S$38.00 S$37.00 S$39.00 - - - - -Satisfaction 39 29 10 - - - - -
Marketing Prod Promo $1,500 $1,000 $1,500 - - - - -Investments Reg Promo $500 $500 $500 - - - - -
Awareness 70% 48% 76% - - - - -Prod Sales $2,000 $1,500 $1,500 - - - - -Reg Sales $1,000 $1,000 $1,000 - - - - -
Accessibility 73% 73% 61% - - - - -Specs Speed 12.8 12.4 10.7 - - - - -
Accuracy 12.8 12.4 10.7 - - - - -Service Life 20,000 21,000 22,000 - - - - -
Revision Date Jun-27 May-27 Apr-25 - - - - -Age Dec. 31 1.5 1.6 4.2 - - - - -Region Kit No No Yes - - - - -
GXM107802_005 Page 14Dec. 31 2027 Round 4
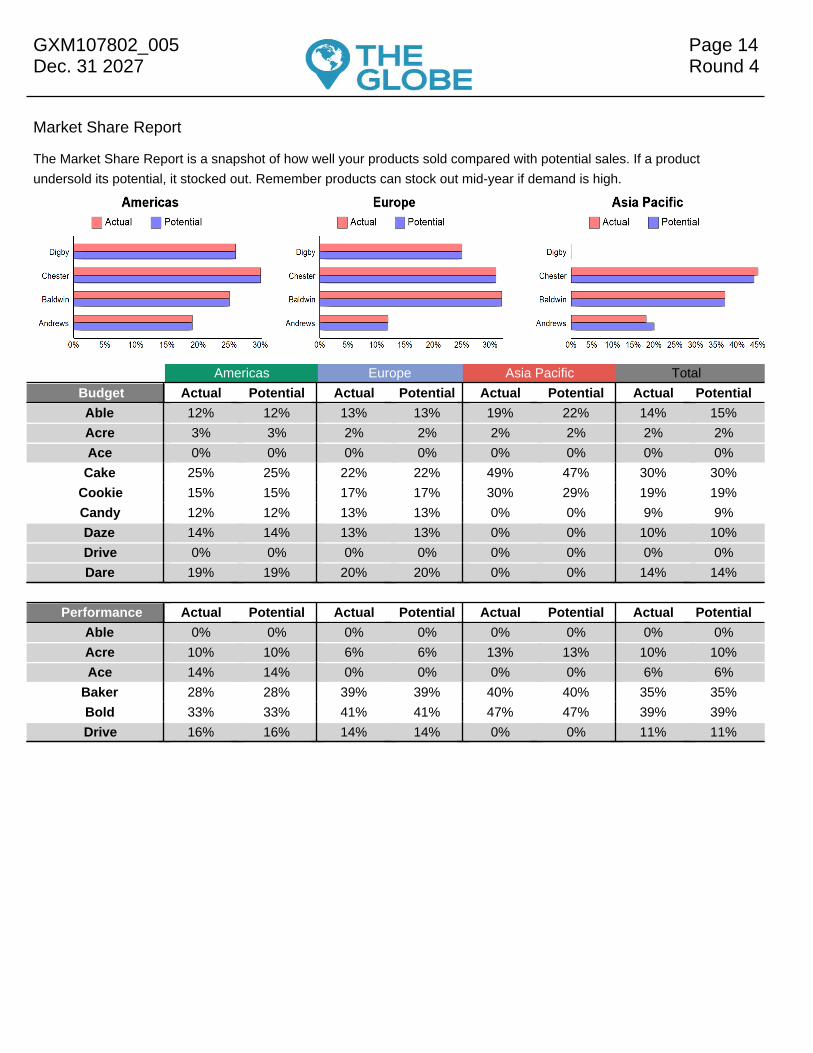
Market Share Report
The Market Share Report is a snapshot of how well your products sold compared with potential sales. If a productundersold its potential, it stocked out. Remember products can stock out mid-year if demand is high.
Americas Europe Asia Pacific TotalBudget Actual Potential Actual Potential Actual Potential Actual PotentialAble 12% 12% 13% 13% 19% 22% 14% 15%Acre 3% 3% 2% 2% 2% 2% 2% 2%Ace 0% 0% 0% 0% 0% 0% 0% 0%
Cake 25% 25% 22% 22% 49% 47% 30% 30%Cookie 15% 15% 17% 17% 30% 29% 19% 19%Candy 12% 12% 13% 13% 0% 0% 9% 9%Daze 14% 14% 13% 13% 0% 0% 10% 10%Drive 0% 0% 0% 0% 0% 0% 0% 0%Dare 19% 19% 20% 20% 0% 0% 14% 14%
Performance Actual Potential Actual Potential Actual Potential Actual PotentialAble 0% 0% 0% 0% 0% 0% 0% 0%Acre 10% 10% 6% 6% 13% 13% 10% 10%Ace 14% 14% 0% 0% 0% 0% 6% 6%
Baker 28% 28% 39% 39% 40% 40% 35% 35%Bold 33% 33% 41% 41% 47% 47% 39% 39%Drive 16% 16% 14% 14% 0% 0% 11% 11%
GXM107802_005 Page 15Dec. 31 2027 Round 4
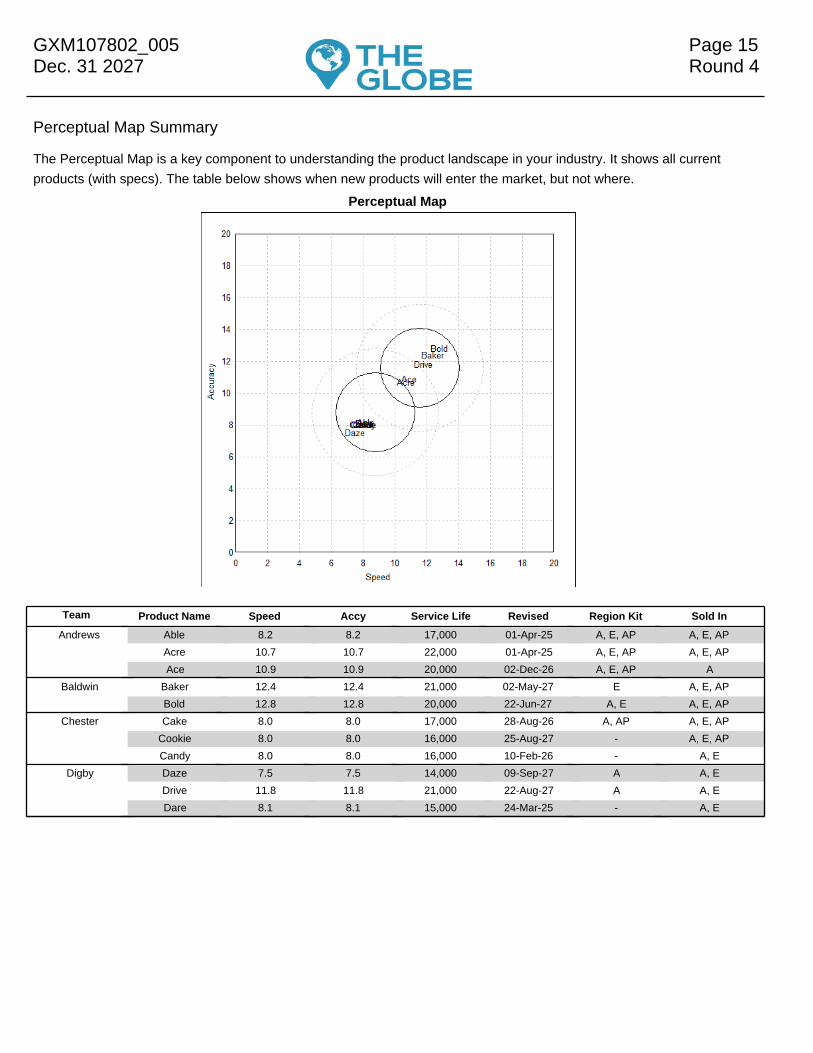
Perceptual Map Summary
The Perceptual Map is a key component to understanding the product landscape in your industry. It shows all currentproducts (with specs). The table below shows when new products will enter the market, but not where.
Perceptual Map
Team Product Name Speed Accy Service Life Revised Region Kit Sold In
Andrews Able 8.2 8.2 17,000 01-Apr-25 A, E, AP A, E, APAcre 10.7 10.7 22,000 01-Apr-25 A, E, AP A, E, APAce 10.9 10.9 20,000 02-Dec-26 A, E, AP A
Baldwin Baker 12.4 12.4 21,000 02-May-27 E A, E, APBold 12.8 12.8 20,000 22-Jun-27 A, E A, E, AP
Chester Cake 8.0 8.0 17,000 28-Aug-26 A, AP A, E, APCookie 8.0 8.0 16,000 25-Aug-27 - A, E, APCandy 8.0 8.0 16,000 10-Feb-26 - A, E
Digby Daze 7.5 7.5 14,000 09-Sep-27 A A, EDrive 11.8 11.8 21,000 22-Aug-27 A A, EDare 8.1 8.1 15,000 24-Mar-25 - A, E