Guano deposition and nutrient enrichment in the vicinity of planktivorous and piscivorous seabird...
10
ORIGINAL PAPER Guano deposition and nutrient enrichment in the vicinity of planktivorous and piscivorous seabird colonies in Spitsbergen Adrian Zwolicki • Katarzyna Malgorzata Zmudczyn ´ ska-Skarbek • Lech Iliszko • Lech Stempniewicz Received: 9 January 2012 / Revised: 6 November 2012 / Accepted: 8 November 2012 Ó The Author(s) 2012. This article is published with open access at Springerlink.com Abstract The crucial role of seabirds in the enrichment of nutrient-poor polar terrestrial ecosystem is well-known. However, no studies have examined the potentially dif- ferent impacts associated with piscivorous and planktivo- rous bird colonies on the surrounding tundra soils. Therefore, we compared guano deposition and physical and chemical parameters of soil near two large seabird colo- nies, one of planktivorous little auks (Alle alle) and the other comprising piscivorous Brunnich’s guillemots (Uria lomvia) and kittiwakes (Rissa tridactyla). The two colonies generated similar levels of guano deposition, with the intensity of deposition decreasing away from the colony. Guano deposition adjacent to both colonies was consider- ably higher than that in control areas. The increased guano supply around colonies significantly enhanced soil con- ductivity, nitrogen (NO 3 - , NH 4 ? ), potassium (K ? ), and phosphate (PO 4 3- ) ion concentrations and led to reduced pH values. Guano deposition explained 84 % (piscivorous colony) and 67 % (planktivorous colony) of the total var- iation in the tested soil parameters. Planktivore and pisci- vore colonies affected adjacent tundra in different ways. The phosphate content and pH value of soil influenced by piscivores were significantly higher than values measured in planktivore-influenced soil. The gradient of guano deposition and associated ion content in the soil decreased more rapidly with distance from the piscivore colony. Climate-induced changes in populations of planktivorous and piscivorous seabirds are expected in the study region and may therefore have substantial consequential effects on Arctic terrestrial ecosystems. Keywords Arctic soil Brunnich’s guillemot Kittiwake Little auk Ornithogenic tundra Introduction Birds that forage at sea and breed on land deposit large amounts of guano, eggshells, feathers, and carcasses near their colonies, thus initiating the formation of ornithogenic soils and thereby facilitating the development of associated tundra communities, with increased primary and secondary production and biodiversity (Mulder et al. 2011; Ellis et al. 2011). This large-scale transport of organic and inorganic matter from sea to land is crucial for many Arctic and Antarctic terrestrial ecosystems, which otherwise are characterized by chronic deficiency of certain nutrients such as nitrogen, phosphorus, potassium, and calcium (Ryan and Watkins 1989; Cocks et al. 1998; Stempniewicz 2005; Bokhorst et al. 2007; Smith and Froneman 2008). The quantity of biogenic nutrients deposited by seabirds on tundra depends on their daily rate of excrement pro- duction, which is a function of the colony size, the length of time birds remain in a colony, the bird species, and their body size. Guano production and its composition are related to the diet, with different proportions of organic and non-organic fractions and particular mineral salts reported in analyses of the guano of plankton-, fish-, and bivalve- A. Zwolicki (&) K. M. Zmudczyn ´ska-Skarbek L. Iliszko L. Stempniewicz Department of Vertebrate Ecology and Zoology, University of Gdan ´sk, Legiono ´w 9, 80-441 Gdan ´sk, Poland e-mail: [email protected] K. M. Zmudczyn ´ska-Skarbek e-mail: [email protected] L. Iliszko e-mail: [email protected] L. Stempniewicz e-mail: [email protected] 123 Polar Biol DOI 10.1007/s00300-012-1265-5
Transcript of Guano deposition and nutrient enrichment in the vicinity of planktivorous and piscivorous seabird...
ORIGINAL PAPER
Guano deposition and nutrient enrichment in the vicinityof planktivorous and piscivorous seabird colonies in Spitsbergen
Adrian Zwolicki • Katarzyna Małgorzata Zmudczynska-Skarbek •
Lech Iliszko • Lech Stempniewicz
Received: 9 January 2012 / Revised: 6 November 2012 / Accepted: 8 November 2012
� The Author(s) 2012. This article is published with open access at Springerlink.com
Abstract The crucial role of seabirds in the enrichment
of nutrient-poor polar terrestrial ecosystem is well-known.
However, no studies have examined the potentially dif-
ferent impacts associated with piscivorous and planktivo-
rous bird colonies on the surrounding tundra soils.
Therefore, we compared guano deposition and physical and
chemical parameters of soil near two large seabird colo-
nies, one of planktivorous little auks (Alle alle) and the
other comprising piscivorous Brunnich’s guillemots (Uria
lomvia) and kittiwakes (Rissa tridactyla). The two colonies
generated similar levels of guano deposition, with the
intensity of deposition decreasing away from the colony.
Guano deposition adjacent to both colonies was consider-
ably higher than that in control areas. The increased guano
supply around colonies significantly enhanced soil con-
ductivity, nitrogen (NO3-, NH4
?), potassium (K?), and
phosphate (PO43-) ion concentrations and led to reduced
pH values. Guano deposition explained 84 % (piscivorous
colony) and 67 % (planktivorous colony) of the total var-
iation in the tested soil parameters. Planktivore and pisci-
vore colonies affected adjacent tundra in different ways.
The phosphate content and pH value of soil influenced by
piscivores were significantly higher than values measured
in planktivore-influenced soil. The gradient of guano
deposition and associated ion content in the soil decreased
more rapidly with distance from the piscivore colony.
Climate-induced changes in populations of planktivorous
and piscivorous seabirds are expected in the study region
and may therefore have substantial consequential effects on
Arctic terrestrial ecosystems.
Keywords Arctic soil � Brunnich’s guillemot �Kittiwake � Little auk � Ornithogenic tundra
Introduction
Birds that forage at sea and breed on land deposit large
amounts of guano, eggshells, feathers, and carcasses near
their colonies, thus initiating the formation of ornithogenic
soils and thereby facilitating the development of associated
tundra communities, with increased primary and secondary
production and biodiversity (Mulder et al. 2011; Ellis et al.
2011). This large-scale transport of organic and inorganic
matter from sea to land is crucial for many Arctic and
Antarctic terrestrial ecosystems, which otherwise are
characterized by chronic deficiency of certain nutrients
such as nitrogen, phosphorus, potassium, and calcium
(Ryan and Watkins 1989; Cocks et al. 1998; Stempniewicz
2005; Bokhorst et al. 2007; Smith and Froneman 2008).
The quantity of biogenic nutrients deposited by seabirds
on tundra depends on their daily rate of excrement pro-
duction, which is a function of the colony size, the length
of time birds remain in a colony, the bird species, and their
body size. Guano production and its composition are
related to the diet, with different proportions of organic and
non-organic fractions and particular mineral salts reported
in analyses of the guano of plankton-, fish-, and bivalve-
A. Zwolicki (&) � K. M. Zmudczynska-Skarbek � L. Iliszko �L. Stempniewicz
Department of Vertebrate Ecology and Zoology,
University of Gdansk, Legionow 9, 80-441 Gdansk, Poland
e-mail: [email protected]
K. M. Zmudczynska-Skarbek
e-mail: [email protected]
L. Iliszko
e-mail: [email protected]
L. Stempniewicz
e-mail: [email protected]
123
Polar Biol
DOI 10.1007/s00300-012-1265-5
eating birds (Hutchison 1950; Galkina 1974; Bedard et al.
1980).
Guano deposition influences various physical and
chemical soil parameters, such as concentration of
ammonium, nitrate, phosphate, magnesium and potassium
ions, as well as soil humidity, conductivity, and respiration
rate (Gilham 1956; Ryan and Watkins 1989; Anderson and
Polis 1999; Garcıa et al. 2002; Wait et al. 2005; Ellis et al.
2006). Although guano itself is typically alkaline, the
process of its decomposition in the soil often results in
increased soil acidity being found near seabird colonies
(Gilham 1956; Garcıa et al. 2002; Ellis 2005; Wait et al.
2005).
The magnitude of guano deposition changes most obvi-
ously with the distance from bird colonies (or other con-
centrations of vertebrate activity). Highest levels are seen
close to the colony, with levels decreasing with distance.
This decreasing gradient is often oriented toward the coast,
where fertilization through sea spray may become an addi-
tional or superimposed factor modifying soil characteristics
(Gilham 1956; Ryan and Watkins 1989; Wainright et al.
1998; Bokhorst et al. 2007). Deposited guano is decomposed
by microorganisms, and the proportion of biogenic nutrients
made available to plants is therefore a balance between
decomposition and leaching or outwash rates (Heal and
French 1974; Stempniewicz 2005). The rate at which nutri-
ents delivered to the colony area return to the sea depends
among other factors on local topography, precipitation and
water runoff, vegetation type and cover (Pulina 1984;
Stempniewicz 1990, 2005). On High Arctic Svalbard, the
two most common seabird colony types differ substantially
in these respects. These are (1) coastal cliffs inhabited by
Brunnich’s guillemots (Uria lomvia) and kittiwakes (Rissa
tridactyla), and (2) little auk (Alle alle) colonies usually
situated on mountain slopes at a greater distance from the
coast. Large and relatively diffuse colonies of planktivorous
little auks are therefore likely to influence a greater area of
tundra than the more defined colonies of piscivorous species
situated on coastal rocky cliffs.
Current regional climate change models suggest that
Arctic terrestrial ecosystems will be subject to both direct
impact by climate warming and indirectly through the
increasing influence of Atlantic waters (Stempniewicz et al.
2007). One outcome of this combination of environmental
drivers will be to favor zooplankton communities based on
smaller species with an increased representation of plank-
tivorous fish and, consequently, piscivorous seabirds.
Planktivorous seabirds, which prefer the larger and more
energy-rich zooplankton associated with retreating cold
Arctic waters, will therefore be at a disadvantage.
The food of little auks is comprised mostly of copepods
(Calanus glacialis and C. hyperboreus in cold Arctic
waters, and C. finmarchicus in warmer Atlantic waters)
(Stempniewicz 2001; Karnovsky et al. 2003; Jakubas et al.
2007). Guillemots and kittiwakes feed mainly on fish, such
as polar cod (Boreogadus saida) and capelin (Mallotus
villosus) (Brekke and Gabrielsen 1994; Mehlum et al.
1998; Mehlum 2001). These seabirds also differ in their
typical behavior while on or over land, with little auks
spending more time circling over and around the colony,
and thereby likely to influence a different area of tundra to
guillemots and kittiwakes (Stempniewicz et al. 2007). The
diet and behavior of colonial seabirds may therefore also
indirectly affect the surrounding Arctic tundra soil char-
acteristics. For instance, the higher phosphate content in
food of piscivorous, if it results in high levels of phosphate
in their guano, may contribute to overcoming nutrient
limitations in the soil developing near their colonies
(Hutchison 1950; Galkina 1974; Breuning-Madsen et al.
2008). To date, no studies have examined the potentially
different impacts associated with piscivorous and plank-
tivorous Arctic bird colonies on surrounding tundra soils.
Therefore, the aims of this study were to test the hypoth-
eses that:
1. Ornithogenic tundra in the vicinity of planktivorous
and piscivorous seabird colonies differs in soil phys-
ical and chemical properties.
2. Tundra fertilization and soil chemical characteristics
change along the colony-sea gradients at different rates
around the two colony types.
Materials and methods
Study area
The research took place in July 2005 and 2006, on the
northern coast of Hornsund fjord (southwest Spitsbergen),
in areas influenced by two large seabird breeding colonies
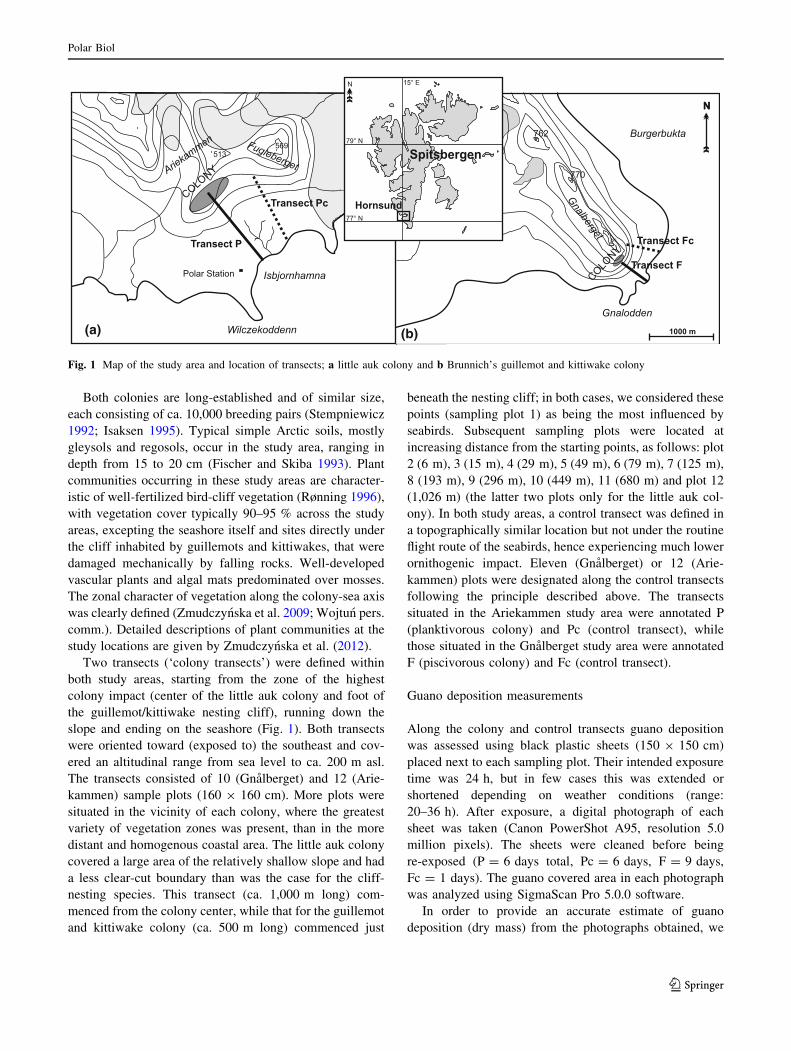
(Fig. 1):
1. A colony of planktivorous little auks situated on
Ariekammen mountain (77�000N 15�310E) (Fig. 1a).
The study area included the mountain slope (inclina-
tion 35–45�) flattening to almost horizontal tundra
reaching the seashore (effectively a ca. 1,000 m
transect).
2. A mixed colony of piscivorous Brunnich’s guillemots
and kittiwakes at the foot of Gnalberget mountain
(77�010N 15�520E) (Fig. 1b). The study area included
the area between the rocky cliff inhabited by the birds
and the ca. 500 m distant seashore. The talus slope
decreased with the distance from the colony, with an
inclination of 40–50� directly under the cliff itself and
almost horizontal ground near the coast.
Polar Biol
123
Both colonies are long-established and of similar size,
each consisting of ca. 10,000 breeding pairs (Stempniewicz
1992; Isaksen 1995). Typical simple Arctic soils, mostly
gleysols and regosols, occur in the study area, ranging in
depth from 15 to 20 cm (Fischer and Skiba 1993). Plant
communities occurring in these study areas are character-
istic of well-fertilized bird-cliff vegetation (Rønning 1996),
with vegetation cover typically 90–95 % across the study
areas, excepting the seashore itself and sites directly under
the cliff inhabited by guillemots and kittiwakes, that were
damaged mechanically by falling rocks. Well-developed
vascular plants and algal mats predominated over mosses.
The zonal character of vegetation along the colony-sea axis
was clearly defined (Zmudczynska et al. 2009; Wojtun pers.
comm.). Detailed descriptions of plant communities at the
study locations are given by Zmudczynska et al. (2012).
Two transects (‘colony transects’) were defined within
both study areas, starting from the zone of the highest
colony impact (center of the little auk colony and foot of
the guillemot/kittiwake nesting cliff), running down the
slope and ending on the seashore (Fig. 1). Both transects
were oriented toward (exposed to) the southeast and cov-
ered an altitudinal range from sea level to ca. 200 m asl.
The transects consisted of 10 (Gnalberget) and 12 (Arie-
kammen) sample plots (160 9 160 cm). More plots were
situated in the vicinity of each colony, where the greatest
variety of vegetation zones was present, than in the more
distant and homogenous coastal area. The little auk colony
covered a large area of the relatively shallow slope and had
a less clear-cut boundary than was the case for the cliff-
nesting species. This transect (ca. 1,000 m long) com-
menced from the colony center, while that for the guillemot
and kittiwake colony (ca. 500 m long) commenced just
beneath the nesting cliff; in both cases, we considered these
points (sampling plot 1) as being the most influenced by
seabirds. Subsequent sampling plots were located at
increasing distance from the starting points, as follows: plot
2 (6 m), 3 (15 m), 4 (29 m), 5 (49 m), 6 (79 m), 7 (125 m),
8 (193 m), 9 (296 m), 10 (449 m), 11 (680 m) and plot 12
(1,026 m) (the latter two plots only for the little auk col-
ony). In both study areas, a control transect was defined in
a topographically similar location but not under the routine
flight route of the seabirds, hence experiencing much lower
ornithogenic impact. Eleven (Gnalberget) or 12 (Arie-
kammen) plots were designated along the control transects
following the principle described above. The transects
situated in the Ariekammen study area were annotated P
(planktivorous colony) and Pc (control transect), while
those situated in the Gnalberget study area were annotated
F (piscivorous colony) and Fc (control transect).
Guano deposition measurements
Along the colony and control transects guano deposition
was assessed using black plastic sheets (150 9 150 cm)
placed next to each sampling plot. Their intended exposure
time was 24 h, but in few cases this was extended or
shortened depending on weather conditions (range:
20–36 h). After exposure, a digital photograph of each
sheet was taken (Canon PowerShot A95, resolution 5.0
million pixels). The sheets were cleaned before being
re-exposed (P = 6 days total, Pc = 6 days, F = 9 days,
Fc = 1 days). The guano covered area in each photograph
was analyzed using SigmaScan Pro 5.0.0 software.
In order to provide an accurate estimate of guano
deposition (dry mass) from the photographs obtained, we
(a) (b)
Fig. 1 Map of the study area and location of transects; a little auk colony and b Brunnich’s guillemot and kittiwake colony
Polar Biol
123
performed an initial calibration. We exposed stiff plastic
sheets covered with very thin plastic film of known mass.
After these sheets were exposed and photographed, the
plastic films were removed, dried, and re-weighed to
obtain dry mass. Regression equations were calculated
for each study area separately (Ariekammen, y = 0.003 x,
R2 = 0.7, N = 31; Gnalberget, y = 0.008 x, R2 = 0.7,
N = 10).
Physical and chemical analyses of soil
Soil samples were collected from three points lying on the
same diagonal of each sampling plot (one from the center
and two from the corners of the plot) (N = 123, 13 samples
were lost during analyses). Samples were taken from the
soil surface layer using a shovel to a depth of 10 cm. Each
sample contained about 500 cm3 of soil. Large stones were
avoided or removed during sampling. Soil samples were
prepared for analysis immediately after collection. Each
sample was divided into three subsamples of 80 cm3 each,
weighed to the nearest 0.1 g and the following were
assessed:
1. Soil dry mass (%) was measured by oven-drying
(60 �C) the sample until constant mass. The % soil
dry mass was calculated from the initial and final
masses.
2. Soil conductivity (lS cm-1) and pH—Soil samples of
80 cm3 were mixed with 160 cm3 of distilled water.
The mixture was shaken for ca. 20 min and then
filtered through a sieve (0.5 mm mesh). The conduc-
tivity and pH were quantified in the filtrate using a pH/
conductivity/salinity meter CPC-401 (Elmetron).
3. Nitrogen (NO3- and NH4
?), potassium (K?), and
phosphate (PO43-) content (mg 1,000 g-1 soil dry
mass)—Soil samples of 80 cm3 were mixed with
200 cm3 0.03 N acetic acid and left for ca. 60 min
while being shaken regularly. The solution was then
filtered through a sieve (0.5 mm mesh) and filter paper
(MN 640 w, Macherey–Nagel U = 125 mm). The
filtrate was analyzed using a photometer LF205
following standard procedures (Cyganski 1994).
Data analyses
Spearman’s rank correlation was used to examine the
relationships between guano deposition and each physical
and chemical variable separately for each colony using
combined data from the colonial and control transects.
Nonparametric analysis was used due to the non-normal
distributions of data obtained and the relatively low num-
ber of sampling plots.
To describe relationship between guano deposition and
distance from the colony, the piecewise regression function
was performed separately for each colonial transect.
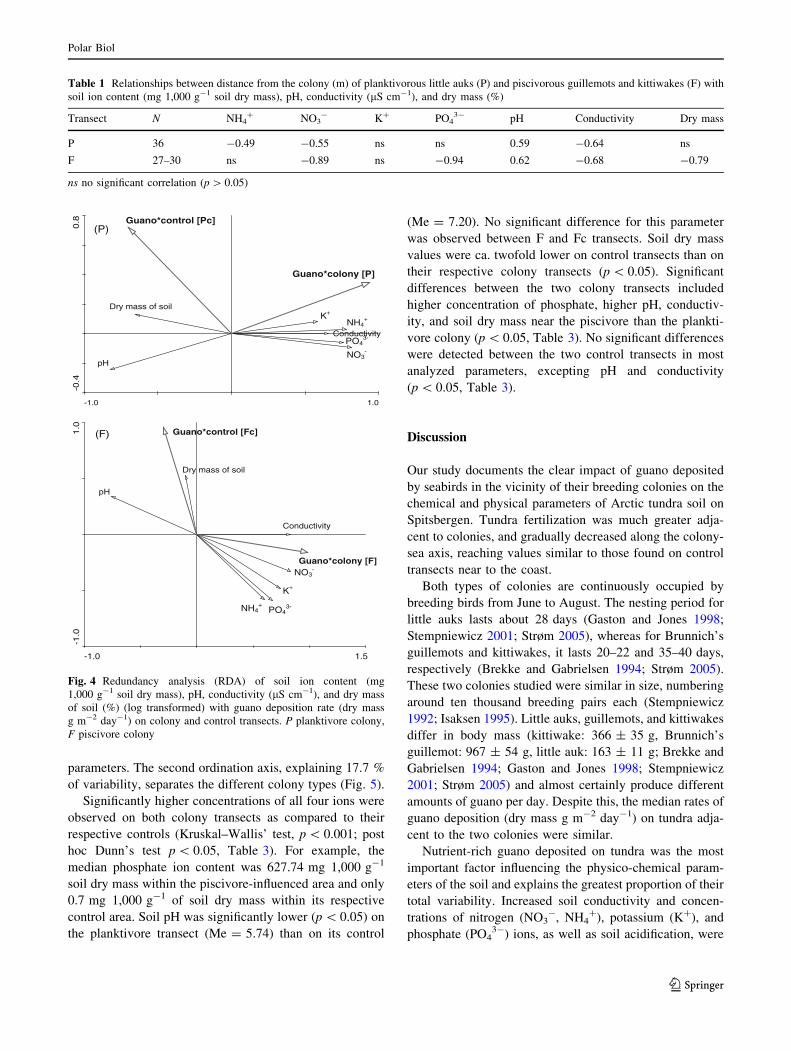
Redundancy analysis (RDA, linear direct gradient
analysis) was performed in order to assess the impact of
guano deposition on multivariate response of physical and
chemical soil parameters. This used two separate models
where each had a defined type of interaction: for the colony
transect (Guano*Colony) and control transect
(Guano*Control). After RDA, a Monte Carlo permutation
test was performed (499 permutations) to identify which
factors significantly influenced the model (ter Braak and
Smilauer 2002). Principal component analysis (PCA, linear
indirect gradient analysis) was used to ordinate the soil
parameters obtained from the four study transects.
Dependent variables were log transformed to normalize
them (ter Braak and Smilauer 2002). The slope inclination
was used as covariable in both ordination techniques.
Larger amounts of guano deposition were found close to
the colonies, with smaller amounts and less differentiation
on transect sectors near to the coast. Therefore, only data
from the first six plots (0–80 m from the colony) of each
transect were used in subsequent comparisons. In order to
test for differences in each soil parameter value (median)
between transects, the nonparametric Kruskal–Wallis and
post hoc Dunn’s tests were performed.
The results were processed using the STATISTICA 8.0
package for the regression, correlation, and variance anal-
yses [StatSoft, Inc. (2008). STATISTICA (data analysis
software system), version 8.0, www.statsoft.com] and the
CANOCO 4.51 package for gradient ordination methods
(ter Braak and Smilauer 2002).
Results
Guano deposition
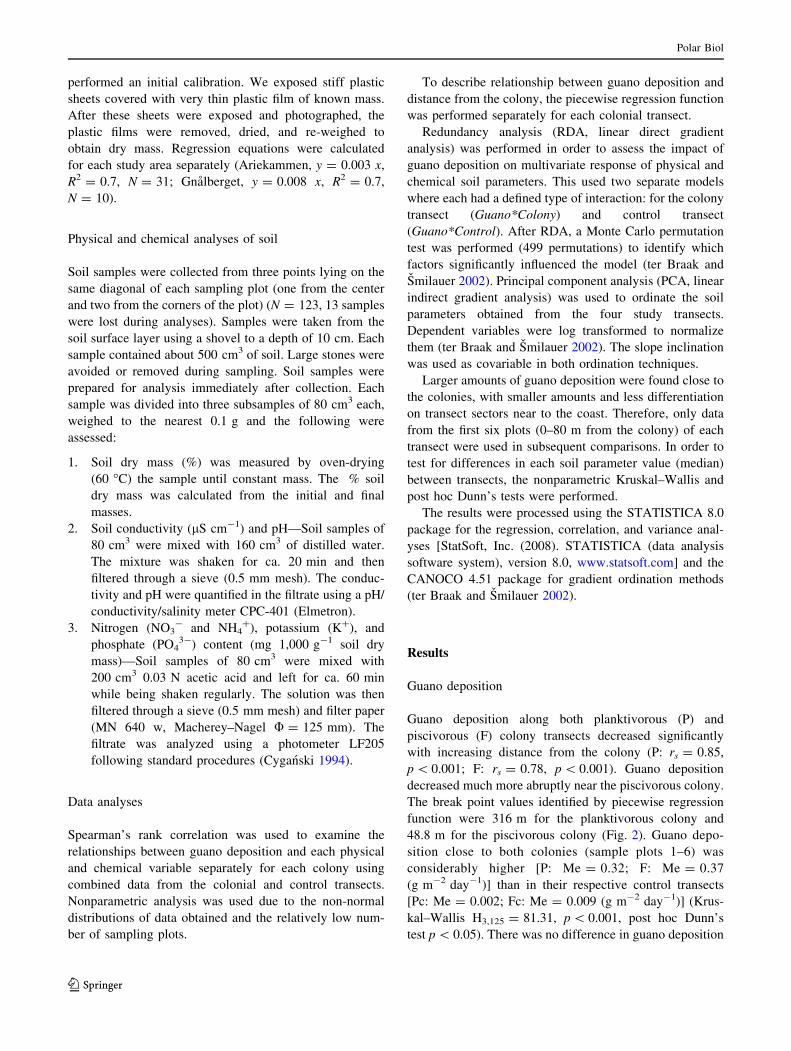
Guano deposition along both planktivorous (P) and
piscivorous (F) colony transects decreased significantly
with increasing distance from the colony (P: rs = 0.85,
p \ 0.001; F: rs = 0.78, p \ 0.001). Guano deposition
decreased much more abruptly near the piscivorous colony.
The break point values identified by piecewise regression
function were 316 m for the planktivorous colony and
48.8 m for the piscivorous colony (Fig. 2). Guano depo-
sition close to both colonies (sample plots 1–6) was
considerably higher [P: Me = 0.32; F: Me = 0.37
(g m-2 day-1)] than in their respective control transects
[Pc: Me = 0.002; Fc: Me = 0.009 (g m-2 day-1)] (Krus-
kal–Wallis H3,125 = 81.31, p \ 0.001, post hoc Dunn’s
test p \ 0.05). There was no difference in guano deposition
Polar Biol
123
per unit time or area between the two colonies transects (P
vs. F, p [ 0.05) or between the two control transects (Pc
vs. Fc, p [ 0.05). However, the maximum value found
(1.6 g m-2 day-1) was higher directly below the piscivo-
rous colony than in the center of the planktivore colony (up
to 1.2 g m-2 day-1).
Physical and chemical soil gradients
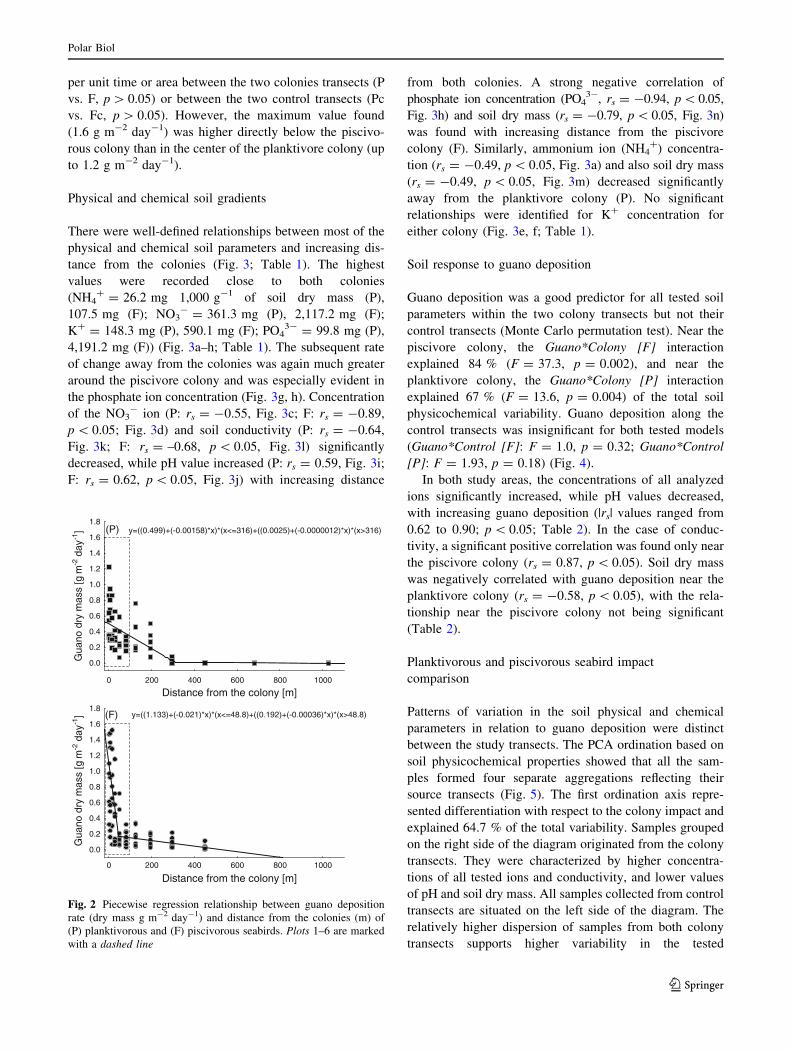
There were well-defined relationships between most of the
physical and chemical soil parameters and increasing dis-
tance from the colonies (Fig. 3; Table 1). The highest
values were recorded close to both colonies
(NH4? = 26.2 mg 1,000 g-1 of soil dry mass (P),
107.5 mg (F); NO3- = 361.3 mg (P), 2,117.2 mg (F);
K? = 148.3 mg (P), 590.1 mg (F); PO43- = 99.8 mg (P),
4,191.2 mg (F)) (Fig. 3a–h; Table 1). The subsequent rate
of change away from the colonies was again much greater
around the piscivore colony and was especially evident in
the phosphate ion concentration (Fig. 3g, h). Concentration
of the NO3- ion (P: rs = -0.55, Fig. 3c; F: rs = -0.89,
p \ 0.05; Fig. 3d) and soil conductivity (P: rs = -0.64,
Fig. 3k; F: rs = –0.68, p \ 0.05, Fig. 3l) significantly
decreased, while pH value increased (P: rs = 0.59, Fig. 3i;
F: rs = 0.62, p \ 0.05, Fig. 3j) with increasing distance
from both colonies. A strong negative correlation of
phosphate ion concentration (PO43-, rs = -0.94, p\0.05,
Fig. 3h) and soil dry mass (rs = -0.79, p\ 0.05, Fig. 3n)
was found with increasing distance from the piscivore
colony (F). Similarly, ammonium ion (NH4?) concentra-
tion (rs = -0.49, p \ 0.05, Fig. 3a) and also soil dry mass
(rs = -0.49, p \ 0.05, Fig. 3m) decreased significantly
away from the planktivore colony (P). No significant
relationships were identified for K? concentration for
either colony (Fig. 3e, f; Table 1).
Soil response to guano deposition
Guano deposition was a good predictor for all tested soil
parameters within the two colony transects but not their
control transects (Monte Carlo permutation test). Near the
piscivore colony, the Guano*Colony [F] interaction
explained 84 % (F = 37.3, p = 0.002), and near the
planktivore colony, the Guano*Colony [P] interaction
explained 67 % (F = 13.6, p = 0.004) of the total soil
physicochemical variability. Guano deposition along the
control transects was insignificant for both tested models
(Guano*Control [F]: F = 1.0, p = 0.32; Guano*Control
[P]: F = 1.93, p = 0.18) (Fig. 4).
In both study areas, the concentrations of all analyzed
ions significantly increased, while pH values decreased,
with increasing guano deposition (|rs| values ranged from
0.62 to 0.90; p \ 0.05; Table 2). In the case of conduc-
tivity, a significant positive correlation was found only near
the piscivore colony (rs = 0.87, p \ 0.05). Soil dry mass
was negatively correlated with guano deposition near the
planktivore colony (rs = -0.58, p \ 0.05), with the rela-
tionship near the piscivore colony not being significant
(Table 2).
Planktivorous and piscivorous seabird impact
comparison
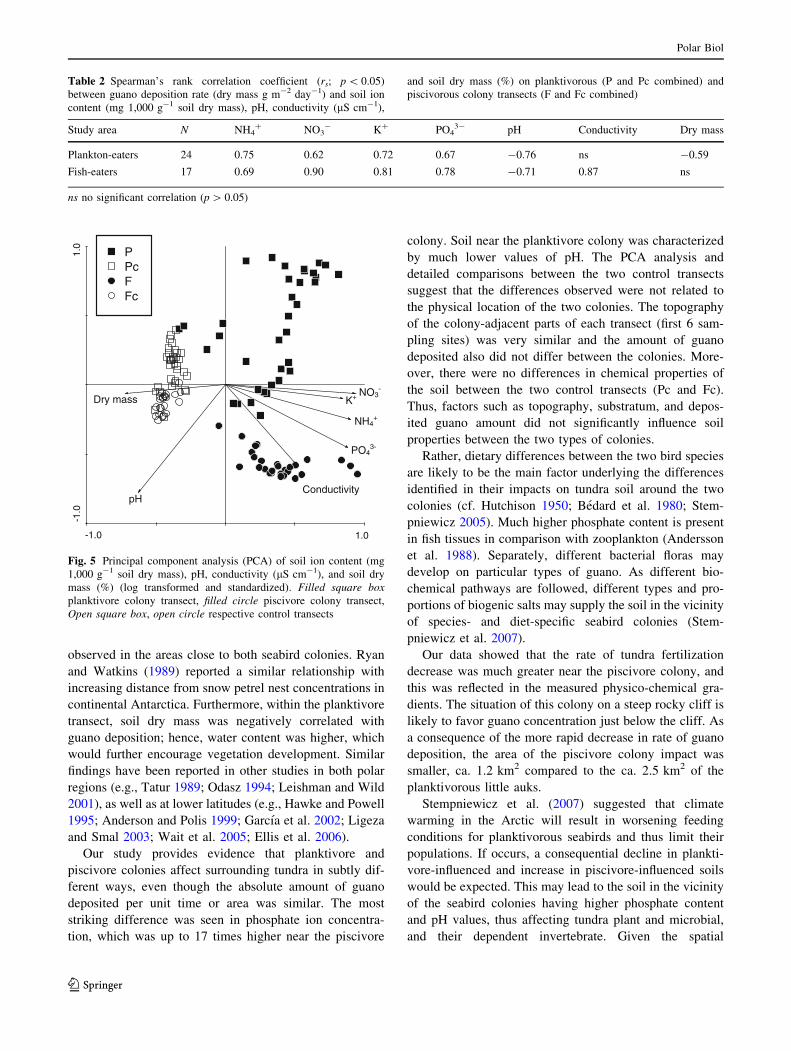
Patterns of variation in the soil physical and chemical
parameters in relation to guano deposition were distinct
between the study transects. The PCA ordination based on
soil physicochemical properties showed that all the sam-
ples formed four separate aggregations reflecting their
source transects (Fig. 5). The first ordination axis repre-
sented differentiation with respect to the colony impact and
explained 64.7 % of the total variability. Samples grouped
on the right side of the diagram originated from the colony
transects. They were characterized by higher concentra-
tions of all tested ions and conductivity, and lower values
of pH and soil dry mass. All samples collected from control
transects are situated on the left side of the diagram. The
relatively higher dispersion of samples from both colony
transects supports higher variability in the tested
0 200 400 600 800 1000
Distance from the colony [m]
0.0
0.2
0.4
0.6
0.8
1.0
1.2
1.4
1.6
1.8
Gua
no d
ry m
ass
[g m
-2da
y-1] y=((0.499)+(-0.00158)*x)*(x<=316)+((0.0025)+(-0.0000012)*x)*(x>316)(P)
0 200 400 600 800 1000
Distance from the colony [m]
0.0
0.2
0.4
0.6
0.8
1.0
1.2
1.4
1.6
1.8
Gua
no d
ry m
ass
[g m
-2da
y-1] y=((1.133)+(-0.021)*x)*(x<=48.8)+((0.192)+(-0.00036)*x)*(x>48.8)(F)
Fig. 2 Piecewise regression relationship between guano deposition
rate (dry mass g m-2 day-1) and distance from the colonies (m) of
(P) planktivorous and (F) piscivorous seabirds. Plots 1–6 are marked
with a dashed line
Polar Biol
123
0 200 400 600 800 1000 1200
Distance from the colony [m]
02468
10121416182022242628
NH
4+[m
g 10
00g
-1 o
f soi
l dry
mas
s]
y = 13.32-0.012*xR2 = 0.30
(a) P
0 200 400 600 800 1000 1200
Distance from the colony [m]
0
20
40
60
80
100
120
NH
4+[m
g 10
00g
-1 o
f soi
l dry
mas
s]
y = -3.76Ln(x) + 37.07R2 = 0.65
(b) F
0 200 400 600 800 1000 1200
Distance from the colony [m]
0
50
100
150
200
250
300
350
400
NO
3- [m
g 10
00g
-1 o
f soi
l dry
mas
s]
y = 182.96e-0.0074x
R2 = 0.51
(c) P
0 200 400 600 800 1000 1200
Distance from the colony [m]
0200400600800
1000120014001600180020002200
NO
3- [m
g 10
00g
-1 o
f soi
l dry
mas
s]
y = 174.09e-0,0089x
R2 = 0.58
(d) F
0 200 400 600 800 1000 1200
Distance from the colony [m]
0
20
40
60
80
100
120
140
160
K+
[mg
1000
g-1
of s
oil d
ry m
ass]
y = 75.67-0.049*xR2 = 0.18
(e) P
0 200 400 600 800 1000 1200
Distance from the colony [m]
0
100
200
300
400
500
600
700
K+
[mg
1000
g-1
of s
oil d
ry m
ass]
y = -17.02Ln(x) + 150.38R2 = 0.47
(f) F
0 200 400 600 800 1000 1200
Distance from the colony [m]
0
20
40
60
80
100
120
PO
43- [m
g 10
00g
-1 o
f soi
l dry
mas
s]
y = 47.73-0.041*xR2 = 0.25
(g) P
0 200 400 600 800 1000 1200
Distance from the colony [m]
0
500
1000
1500
2000
2500
3000
3500
4000
4500
PO
43- [m
g 10
00g
-1 o
f soi
l dry
mas
s]
y = -229.83Ln(x) + 1610.5R2 = 0.92
(h) F
0 200 400 600 800 1000 1200
Distance from the colony [m]
3.5
4.0
4.5
5.0
5.5
6.0
6.5
7.0
7.5
pH
y = 0.43Ln(x) + 3.59R2 = 0.36
(i) P
0 200 400 600 800 1000 1200
Distance from the colony [m]
6.4
6.6
6.8
7.0
7.2
7.4
7.6
7.8
pH
y = 0.061Ln(x) + 7.22R2 = 0.81
(j) F
0 200 400 600 800 1000 1200
Distance from the colony [m]
0
20
40
60
80
100
120
140
160
180
200
Con
duct
ivity
[µS
cm
-1]
y = -13.86Ln(x) + 131.46R2 = 0.41
(k) P
0 200 400 600 800 1000 1200
Distance from the colony [m]
0
200
400
600
800
1000
1200
1400
Con
duct
ivity
[µS
cm
-1]
y = -56.67Ln(x) + 406.34R2 = 0.88
(l) F
0 200 400 600 800 1000 1200
Distance from the colony [m]
0
10
20
30
40
50
60
70
80
90
100
Dry
mas
s of
soi
l [%
] y = 0.29+0.0004*xR2 = 0.37
(m) P
0 200 400 600 800 1000 1200
Distance from the colony [m]
0
10
20
30
40
50
60
70
80
90
100
Dry
mas
s of
soi
l [%
]
y = -0.0009x + 0.59R2 = 0.48
(n) F
Fig. 3 Relationships between distance from the colony (m) and soil ion content NH4? (a, b), NO3
- (c, d), K? (e, f), PO43- (g, h) (mg 1,000 g-1
soil dry mass), pH (i, j), conductivity (lS cm-1, k, l) and soil dry mass (%, m, n) on the planktivorous (P), and piscivorous colony transects (F)
Polar Biol
123
parameters. The second ordination axis, explaining 17.7 %
of variability, separates the different colony types (Fig. 5).
Significantly higher concentrations of all four ions were
observed on both colony transects as compared to their
respective controls (Kruskal–Wallis’ test, p \ 0.001; post
hoc Dunn’s test p \ 0.05, Table 3). For example, the
median phosphate ion content was 627.74 mg 1,000 g-1
soil dry mass within the piscivore-influenced area and only
0.7 mg 1,000 g-1 of soil dry mass within its respective
control area. Soil pH was significantly lower (p \ 0.05) on
the planktivore transect (Me = 5.74) than on its control
(Me = 7.20). No significant difference for this parameter
was observed between F and Fc transects. Soil dry mass
values were ca. twofold lower on control transects than on
their respective colony transects (p \ 0.05). Significant
differences between the two colony transects included
higher concentration of phosphate, higher pH, conductiv-
ity, and soil dry mass near the piscivore than the plankti-
vore colony (p \ 0.05, Table 3). No significant differences
were detected between the two control transects in most
analyzed parameters, excepting pH and conductivity
(p \ 0.05, Table 3).
Discussion
Our study documents the clear impact of guano deposited
by seabirds in the vicinity of their breeding colonies on the
chemical and physical parameters of Arctic tundra soil on
Spitsbergen. Tundra fertilization was much greater adja-
cent to colonies, and gradually decreased along the colony-
sea axis, reaching values similar to those found on control
transects near to the coast.
Both types of colonies are continuously occupied by
breeding birds from June to August. The nesting period for
little auks lasts about 28 days (Gaston and Jones 1998;
Stempniewicz 2001; Strøm 2005), whereas for Brunnich’s
guillemots and kittiwakes, it lasts 20–22 and 35–40 days,
respectively (Brekke and Gabrielsen 1994; Strøm 2005).
These two colonies studied were similar in size, numbering
around ten thousand breeding pairs each (Stempniewicz
1992; Isaksen 1995). Little auks, guillemots, and kittiwakes
differ in body mass (kittiwake: 366 ± 35 g, Brunnich’s
guillemot: 967 ± 54 g, little auk: 163 ± 11 g; Brekke and
Gabrielsen 1994; Gaston and Jones 1998; Stempniewicz
2001; Strøm 2005) and almost certainly produce different
amounts of guano per day. Despite this, the median rates of
guano deposition (dry mass g m-2 day-1) on tundra adja-
cent to the two colonies were similar.
Nutrient-rich guano deposited on tundra was the most
important factor influencing the physico-chemical param-
eters of the soil and explains the greatest proportion of their
total variability. Increased soil conductivity and concen-
trations of nitrogen (NO3-, NH4
?), potassium (K?), and
phosphate (PO43-) ions, as well as soil acidification, were
Table 1 Relationships between distance from the colony (m) of planktivorous little auks (P) and piscivorous guillemots and kittiwakes (F) with
soil ion content (mg 1,000 g-1 soil dry mass), pH, conductivity (lS cm-1), and dry mass (%)
Transect N NH4? NO3
- K? PO43- pH Conductivity Dry mass
P 36 -0.49 -0.55 ns ns 0.59 -0.64 ns
F 27–30 ns -0.89 ns -0.94 0.62 -0.68 -0.79
ns no significant correlation (p [ 0.05)
-1.0 1.5
-1.0
1.0
Guano*colony [F]
Guano*control [Fc]
-1.0 1.0
-0.4
0.8
Guano*colony [P]
Guano*control [Pc]
NO3-
Conductivity
K+
PO43-NH4
+
Dry mass of soil
pH
K+
NH4+
ConductivityPO4
3-
NO3-
Dry mass of soil
pH
(P)
(F)
Fig. 4 Redundancy analysis (RDA) of soil ion content (mg
1,000 g-1 soil dry mass), pH, conductivity (lS cm-1), and dry mass
of soil (%) (log transformed) with guano deposition rate (dry mass
g m-2 day-1) on colony and control transects. P planktivore colony,
F piscivore colony
Polar Biol
123
observed in the areas close to both seabird colonies. Ryan
and Watkins (1989) reported a similar relationship with
increasing distance from snow petrel nest concentrations in
continental Antarctica. Furthermore, within the planktivore
transect, soil dry mass was negatively correlated with
guano deposition; hence, water content was higher, which
would further encourage vegetation development. Similar
findings have been reported in other studies in both polar
regions (e.g., Tatur 1989; Odasz 1994; Leishman and Wild
2001), as well as at lower latitudes (e.g., Hawke and Powell
1995; Anderson and Polis 1999; Garcıa et al. 2002; Ligeza
and Smal 2003; Wait et al. 2005; Ellis et al. 2006).
Our study provides evidence that planktivore and
piscivore colonies affect surrounding tundra in subtly dif-
ferent ways, even though the absolute amount of guano
deposited per unit time or area was similar. The most
striking difference was seen in phosphate ion concentra-
tion, which was up to 17 times higher near the piscivore
colony. Soil near the planktivore colony was characterized
by much lower values of pH. The PCA analysis and
detailed comparisons between the two control transects
suggest that the differences observed were not related to
the physical location of the two colonies. The topography
of the colony-adjacent parts of each transect (first 6 sam-
pling sites) was very similar and the amount of guano
deposited also did not differ between the colonies. More-
over, there were no differences in chemical properties of
the soil between the two control transects (Pc and Fc).
Thus, factors such as topography, substratum, and depos-
ited guano amount did not significantly influence soil
properties between the two types of colonies.
Rather, dietary differences between the two bird species
are likely to be the main factor underlying the differences
identified in their impacts on tundra soil around the two
colonies (cf. Hutchison 1950; Bedard et al. 1980; Stem-
pniewicz 2005). Much higher phosphate content is present
in fish tissues in comparison with zooplankton (Andersson
et al. 1988). Separately, different bacterial floras may
develop on particular types of guano. As different bio-
chemical pathways are followed, different types and pro-
portions of biogenic salts may supply the soil in the vicinity
of species- and diet-specific seabird colonies (Stem-
pniewicz et al. 2007).
Our data showed that the rate of tundra fertilization
decrease was much greater near the piscivore colony, and
this was reflected in the measured physico-chemical gra-
dients. The situation of this colony on a steep rocky cliff is
likely to favor guano concentration just below the cliff. As
a consequence of the more rapid decrease in rate of guano
deposition, the area of the piscivore colony impact was
smaller, ca. 1.2 km2 compared to the ca. 2.5 km2 of the
planktivorous little auks.
Stempniewicz et al. (2007) suggested that climate
warming in the Arctic will result in worsening feeding
conditions for planktivorous seabirds and thus limit their
populations. If occurs, a consequential decline in plankti-
vore-influenced and increase in piscivore-influenced soils
would be expected. This may lead to the soil in the vicinity
of the seabird colonies having higher phosphate content
and pH values, thus affecting tundra plant and microbial,
and their dependent invertebrate. Given the spatial
Table 2 Spearman’s rank correlation coefficient (rs; p \ 0.05)
between guano deposition rate (dry mass g m-2 day-1) and soil ion
content (mg 1,000 g-1 soil dry mass), pH, conductivity (lS cm-1),
and soil dry mass (%) on planktivorous (P and Pc combined) and
piscivorous colony transects (F and Fc combined)
Study area N NH4? NO3
- K? PO43- pH Conductivity Dry mass
Plankton-eaters 24 0.75 0.62 0.72 0.67 -0.76 ns -0.59
Fish-eaters 17 0.69 0.90 0.81 0.78 -0.71 0.87 ns
ns no significant correlation (p [ 0.05)
NO3-
-1.0 1.0
-1.0
1.0
PPcFFc
NH4+
Conductivity
PO43-
Dry mass
pH
K+
Fig. 5 Principal component analysis (PCA) of soil ion content (mg
1,000 g-1 soil dry mass), pH, conductivity (lS cm-1), and soil dry
mass (%) (log transformed and standardized). Filled square boxplanktivore colony transect, filled circle piscivore colony transect,
Open square box, open circle respective control transects
Polar Biol
123
distribution of suitable nesting habitat for different bird
species, such a change may lead to substantial change in the
biodiversity of tundra plant and animal communities.
Smaller area of tundra producing lower plant biomass will
limit soil invertebrate fauna development and decomposition
processes, what may have also feedback effects on plants.
What is more, the area may appear too small to support
populations of large herbivores such as geese and reindeers,
and carnivores like arctic foxes and polar bears (Stem-
pniewicz et al. 2007; Jakubas et al. 2008; Kolb et al. 2011).
Acknowledgments This paper was supported by the Polish Minis-
try of Science and Higher Education (Grants No. 1883/P01/2007/32
and IPY/25/2007) and Polish-Norwegian Research Fund (Grant No.
PNRF-234-AI-1/07, Alkekonge). We would like to thank Dr.
Sławomira Fryderyk and Dr. Mateusz Barcikowski for assistance in
data collection and lab analyses. Special thanks to Dr. Agata Weyd-
mann and Prof. Peter Convey for their help in editing this article.
Open Access This article is distributed under the terms of the
Creative Commons Attribution License which permits any use, dis-
tribution, and reproduction in any medium, provided the original
author(s) and the source are credited.
References
Anderson WB, Polis GA (1999) Nutrient fluxes from water to land:
seabirds affect plant nutrient status on Gulf of California islands.
Oecologia 118:324–332
Andersson G, Granelli W, Stenson J (1988) The influence of animals
on phosphorus cycling in lake ecosystems. Hydrobiologia
170:267–284
Bedard J, Therriault JC, Berube J (1980) Assessment of the
importance of nutrient recycling by seabirds in the St. Lawrence
Estuary. Can J Fish Aquat Sci 37:583–588
Bokhorst S, Huiskes A, Convey P, Aerts R (2007) External nutrient
inputs into terrestrial ecosystems of the Falkland Islands and the
Maritime Antarctic. Polar Biol 30:1315–1321
Brekke B, Gabrielsen GW (1994) Assimilation efficiency of adult
kittiwakes and Brunnich’s guillemots fed capelin and Arctic cod.
Polar Biol 14:279–284
Breuning-Madsen H, Bloch Ehlers C, Borggaard OK (2008) The
impact of perennial cormorant colonies on soil phosphorus
status. Geoderma 148:51–54
Cocks MP, Balfour DA, Stock WD (1998) On the uptake of
ornithogenic products by plants on the inland mountains of
Dronning Maud Land, Antarctica, using stable isotopes. Polar
Biol 20:107–111
Cyganski A (1994) Chemiczne metody analizy ilosciowej. Wydaw-
nictwo Naukowo-Techniczne, Warszawa
Ellis JC (2005) Marine birds on land: a review of plant biomass,
species richness, and community composition in seabird colo-
nies. Plant Ecol 181:227–241
Ellis JC, Farina JM, Witman JD (2006) Nutrient transfer from sea to
land: the case of gulls and cormorants in the Gulf of Maine.
J Anim Ecol 75:565–574
Ellis JC, Bellingham PJ, Cameron DA, Croll D, Kolb GS, Kueffer C,
Mittelhauser GH, Schmidt S, Vidal E, Wait DA (2011) Effects of
seabirds on plant communities. In: Mulder CPH, Anderson WB,
Towns DR, Bellingham PJ (eds) Seabird islands. Ecology,
invasion and restoration. Oxford University Press, New York,
pp 135–176
Fischer Z, Skiba S (1993) Some remarks about bioenergetic aspects of
tundra soil. Pol Polar Res 14:345–354
Galkina VN (1974) Chemical composition of soluble substances of
fish-eating birds. Ekologya 5:23–28
Garcıa LV, Maranon T, Ojeda F, Clemente L, Redondo R (2002)
Seagull influence on soil properties, chenopod shrub distribution,
and leaf nutrient status in semi-arid Mediterranean islands. Oikos
98:75–86
Gaston AJ, Jones IL (1998) The Auks Alcidae. Oxford University
Press, New York
Gilham ME (1956) Ecology of the Pembrokeshire Islands. V. Manur-
ing by the colonial seabirds and mammals, with a note on seed
distribution by gulls. J Ecol 44:429–454
Hawke DJ, Powell HKJ (1995) Soil solution chemistry at a Westland
petrel breeding colony, New Zealand: paleoecological implica-
tions. Aus J Soil Res 33:915–924
Heal OW, French DD (1974) Decomposition of organic matter in
tundra. In: Holding AJ, Heal OW, MacLean SF, Flanagan PW
(eds) Soil organisms and decomposition in tundra. Tundra
Biome Steering Committee, Stockholm, pp 279–309
Hutchison GE (1950) Survey of contemporary knowledge of
biochemistry. 3. The biochemistry of vertebrate excretion. Bull
Am Mus Nat Hist 96:1–554
Isaksen K (1995) Distribution of seabirds at sea in the northern
Barents Sea. In: Isaksen K, Bakken V (eds) Seabird populations
Table 3 Median values (Me) of soil ion content (mg 1,000 g-1 soil dry mass), pH, conductivity (lS cm-1) and dry mass (%), and differences
between individual transects
Parameters Colony versus control Colony versus
colony
Control versus
control
P (Me) $ Pc (Me) F (Me) $ Fc (Me) P $ F Pc $ Fc
NH4? 10.14 [ 0.84 24.35 [ 0.001 ns ns
NO3- 56.07 [ \0.001 59.30 [ 1.48 ns ns
K? 60.03 [ 12.14 84.38 [ 3.00 ns ns
PO43- 37.81 [ 0.001 627.74 [ 0.70 \ ns
pH 5.74 \ 7.20 7.46 ns 7.86 \ \Conductivity 53.35 [ 43.35 169.50 [ 90.35 \ \Dry mass 31.76 \ 78.69 44.72 \ 92.95 [ ns
Kruskal–Wallis test (p \ 0.001), post hoc Dunn’s test (p \ 0.05); ‘\’, ‘[’ directions of significant differences; ns no significant difference,
p [ 0.05). P planktivorous colony transect, F piscivorous colony transect, Pc, Fc controls
Polar Biol
123
in the northern Barents Sea—source data for the impact
assessment of the effects of oil drilling activity. Norsk Polarinst,
Oslo, Medd, vol 135, pp 67–104
Jakubas D, Wojczulanis-Jakubas K, Walkusz W (2007) Response of
Dovekie to changes in food availability. Waterbirds 30:421–428
Jakubas D, Zmudczynska K, Wojczulanis-Jakubas K, Stempniewicz
L (2008) Faeces deposition and numbers of vertebrate herbivores
in the vicinity of planktivorous and piscivorous seabird colonies
in Hornsund, Spitsbergen. Pol Polar Res 29:45–58
Karnovsky NJ, Kwasniewski S, Wesławski JM, Walkusz W, Bes-
zczynska-Moller A (2003) The foraging behaviour of little auks in a
heterogeneous environment. Mar Ecol Prog Ser 253:289–303
Kolb GS, Young HS, Anderson WB (2011) Effects of seabirds on
island consumers. In: Mulder CPH, Anderson WB, Towns DR,
Bellingham PJ (eds) Seabird islands. Ecology, invasion, and
restoration. Oxford University Press, New York, pp 212–241
Leishman MR, Wild C (2001) Vegetation abundance and diversity in
relation to soil nutrients and water content in Vestfold Hills, East
Antarctica. Antarct Sci 13:126–134
Ligeza S, Smal H (2003) Accumulation of nutrients in soil affected by
perennial colonies of piscivorous birds with reference to
biogeochemical cycles of elements. Chemosphere 52:595–602
Mehlum F (2001) Crustaceans in the diet of adult common and
Brunnich’s guillemots Uria aalge and U. lomvia in the Barents
Sea during the breeding period. Mar Ornithol 29:19–22
Mehlum F, Hunt GL, Decker MB, Nordlund N (1998) Hydrographic
features, cetaceans and the foraging of thick-billed murres and
other marine birds in the Northwestern Barents Sea. Arctic
51:243–252
Mulder CPH, Jones H, Kameda K, Palmborg C, Schmidt S, Ellis JC,
Orrock JL, Wait DA, Wardle DA, Yang L, Young H, Croll D,
Vidal E (2011) Impacts of seabirds on plant and soil properties.
In: Mulder CPH, Anderson WB, Towns DR, Bellingham PJ (eds)
Seabird islands. Ecology, invasion and restoration. Oxford
University Press, New York
Odasz AM (1994) Nitrate reductase activity in vegetation below an
arctic bird cliff, Svalbard, Norway. J Veg Sci 5:913–920
Pulina M (1984) The effects of cryochemical processes in the glaciers
and the permafrost in Spitsbergen. Pol Polar Res 5:137–163
Ryan PG, Watkins BP (1989) The influence of physical factors and
ornithogenic products on plant and arthropod abundance at an
Inland Nunatak group in Antarctica. Polar Biol 10:151–160
Rønning OI (1996) The flora of Svalbard. Norwegian Polar Institute,
Tromsø
Smith VR, Froneman PW (2008) Nutrient dynamics in the vicinity of
the Prince Edward Islands. In: Chown SL, Froneman PW (eds)
The prince Edward Islands. Land-sea interactions in a changing
ecosystem. SUN Press, Stellenbosch, pp 165–179
Stempniewicz L (1990) Biomass of Dovekie excreta in the vicinity of
a breeding colony. Colon Waterbirds 13:62–66
Stempniewicz L (1992) Manuring of tundra near a large colony of
seabirds on Svalbard. In: Opalinski KW, Klekowski RZ (eds)
Landscape, life world and man in the High Arctic. IE PAN Press,
Warszawa, pp 255–269
Stempniewicz L (2001) Alle alle little Auk. BWP update. J Birds
West Palearct 3:175–201
Stempniewicz L (2005) Keystone species and ecosystem functioning.
Seabirds in polar ecosystems. Ecol Quest 6:111–115
Stempniewicz L, Błachowiak-Samołyk K, Wesławski JM (2007)
Impact of climate change on zooplankton communities, seabird
populations and arctic terrestrial ecosystem—a scenario. Deep-
Sea Res 54:2934–2945
Strøm H (2005) Brunnich’s guillemot Uria lomvia; Kittiwake Rissatridactyla; little Auk Alle alle. In: Kovacs KM (ed) Birds and
mammals of Svalbard. Norwegian Polar Institute, Tromsø
Tatur A (1989) Ornithogenic soils in the maritime Antarctic. Pol Polar
Res 10:481–532
ter Braak CJF, Smilauer P (2002) CANOCO Reference manual and
user’s guide to Canoco for Windows: software for canonical
community ordination (version 4.5). Microcomputer Power.
Ithaca, New York
Wainright SC, Haney JC, Kerr CA, Golovkin N, Flint MV (1998)
Utilization of nitrogen derived from seabird guano by terrestrial
and marine plants at St. Paul, Pribilof Islands, Bering Sea,
Alaska. Mar Biol 131:63–71
Wait DA, Aubrey DP, Anderson WB (2005) Seabird guano influences
on desert islands: soil chemistry and hernaceous species richness
and productivity. J Arid Environ 60:681–695
Zmudczynska K, Zwolicki A, Barcikowski M, Barcikowski A,
Stempniewicz L (2009) Spectral characteristics of the Arctic
ornithogenic tundra vegetation in Hornsund area, SW Spitsber-
gen. Pol Polar Res 30:249–262
Zmudczynska K, Olejniczak I, Zwolicki A, Iliszko L, Convey P,
Stempniewicz L (2012) Influence of allochtonous nutrients
delivered by colonial seabirds on soil collembolan communities
on Spitsbergen. Polar Biol 35:1233–1245
Polar Biol
123