Long-term bioaccumulation monitoring with transplanted bivalves in the San Francisco Estuary
Upload
independentCategory
view
0download
0
Ecological Applications, 18(8) Supplement, 2008, pp. A213–A226� 2008 by the Ecological Society of America
CHANGES IN FISH DIETS AND FOOD WEB MERCURYBIOACCUMULATION INDUCED BY AN INVASIVE PLANKTIVOROUS FISH
COLLIN A. EAGLES-SMITH,1,4 THOMAS H. SUCHANEK,1,2 ARTHUR E. COLWELL,3 NORMAN L. ANDERSON,3
AND PETER B. MOYLE1
1Department of Wildlife, Fish and Conservation Biology, University of California, Davis, California 95616 USA2U.S. Geological Survey, Western Ecological Research Center, 3020 State University Drive East, Sacramento, California 95819 USA
3Lake County Vector Control District, P.O. Box 310, Lakeport, California 95453 USA
Abstract. The invasion, boom, collapse, and reestablishment of a population of theplanktivorous threadfin shad in Clear Lake, California, USA, were documented over a 20-yearperiod, as were the effects of changing shad populations on diet and mercury (Hg)bioaccumulation in nearshore fishes. Threadfin shad competitively displaced other planktiv-orous fish in the lake, such as inland silversides, young-of-year (YOY) largemouth bass, andYOY bluegill, by reducing zooplankton abundance. As a result, all three species shifted from adiet that was dominated by zooplankton to one that was almost entirely zoobenthos. Stablecarbon isotopes corroborated this pattern with each species becoming enriched in d13C, whichis elevated in benthic vs. pelagic organisms. Concomitant with these changes, Hgconcentrations increased by ;50% in all three species. In contrast, obligate benthivores suchas prickly sculpin showed no relationship between diet or d13C and the presence of threadfinshad, suggesting that effects of the shad were not strongly linked to the benthic fishcommunity. There were also no changes in Hg concentrations of prickly sculpin. Thetemporary extirpation of threadfin shad from the lake resulted in zooplankton densities,foraging patterns, isotope ratios, and Hg concentrations in pelagic fishes returning to pre-shadvalues. These results indicate that even transient perturbations of the structure of freshwaterfood webs can result in significant alterations in the bioaccumulation of Hg and that foodwebs in lakes can be highly resilient.
Key words: bioaccumulation; Clear Lake, California, USA; fish; inland silverside; invasions; invasivespecies; largemouth bass; mercury; nonnative fishes; stable isotopes; Sulphur BankMercuryMine; threadfin shad.
INTRODUCTION
Two major threats to freshwater ecosystems world-
wide are invasions of alien species (Lodge 1993, Moyle
and Light 1996) and contaminants (Colborn and Thayer
2000, Hammerschmidt et al. 2002, Relyea 2003). The
two threats are particularly severe in California, USA,
where freshwater systems are not only heavily invaded
(Moyle and Marchetti 2006) but heavily contaminated,
especially with mercury (Hg) (Macleod et al. 2005).
Mercury is a problem in California because it became
widely distributed in aquatic systems as the result of a
long legacy of gold and Hg mining (Alpers et al. 2005,
Wiener and Suchanek 2008). Widespread Hg contami-
nation of fishes has been documented in the state, with
consumption advisories currently issued for sportfish in
14 waterbodies (OEHHA 2006).
In aquatic environments, inorganic Hg (Hg0, Hg2þ) is
converted to methylmercury (MeHg) by sulfate- and
iron-reducing bacteria (Compeau and Bartha 1985,
Fleming et al. 2006). Methylmercury, a potent neuro-
toxin, is a highly bioavailable form of Hg that readily
passes through biological membranes and can accumu-
late to high concentrations in upper trophic level species
(Mason et al. 2000). In fishes, the risk of exposure to Hg
is directly related to the degree of contamination and
methylating potential of their habitats. For example, the
extent of wetland boundaries and wetting and drying
cycles have been shown to be positively correlated with
fish Hg contamination (Snodgrass et al. 2000, Greenfield
et al. 2001, St. Louis et al. 2004, Hall et al. 2005).
Independent of environmental factors, fish Hg accumu-
lation is also strongly driven by the ecological attributes
and life history of the fish (Wiener and Spry 1996).
Moreover, because dietary exposure primarily dictates
Hg accumulation (Rogers et al. 1987, Harris and
Snodgrass 1993, Watras et al. 1998), upper trophic level
species typically have greater Hg concentrations than
those occupying lower trophic positions (Kidd et al.
1995).
Although both invasive species and Hg contamination
are serious conservation threats to numerous (and often
the same) ecosystems, little work has focused on how
Manuscript received 22 August 2006; revised 15 May 2007;accepted 24 May 2007. Corresponding Editor (ad hoc): A.Fairbrother. For reprints of this Special Issue, see footnote 1, p.A1.
4 Present address: U.S. Geological Survey, Western Eco-logical Research Center, Davis Field Station, One ShieldsAvenue, Davis, California 95616 USA.E-mail: [email protected]
A213

these two conservation threats interact with one another
at population and community scales. This is presumably
due to the shortage of direct measurements of commu-
nity and trophic structure and of Hg concentrations in
the environment before and after an invasion. The
interactions between species invasions and Hg accumu-
lation may become important when the trophic structure
changes in the invaded habitat, resulting in alterations to
dietary Hg exposure as a result of shifts in trophic
position (Kidd et al. 1999), growth rate (Simoneau et al.
2005), or foraging habitat (Power et al. 2002).
This study is one component of a larger ecosystem-
level study that traces the origin and pathways of Hg
from the ore body at an abandoned mine, through the
abiotic (sediment and water) matrices, and into the food
web from primary producers to top predators. It
integrates data from a holistic examination of the Hg
sources and fate in a mine-impacted ecosystem with a
long-term (;20-year) survey of fish and invertebrate
population dynamics from Clear Lake, California, USA.
Here we document the differences in food web structure
associated with the boom, collapse, and reestablishment
of an invading planktivore, the threadfin shad (Do-
rosoma petenense), and the concomitant changes in the
diets and Hg bioaccumulation of some of the resident
fish species. The following questions were asked in this
study: (1) Did shifts in diets and foraging habitats of
pelagic and benthic fishes correspond with shad
abundance during the boom, collapse, and reestablish-
ment of threadfin shad populations? (2) Did the
concentration of Hg in other fishes track the population
fluctuations of the shad?
METHODS
Site description
Clear Lake is a eutrophic, polymictic lake located in
the Coastal Range of northern California, USA
(Suchanek et al. 2008e). At 17 670 ha, it is the largest
lake fully contained within California (Fig. 1) and is a
popular sportfishing location due to its trophy fishery
for largemouth bass (Micropterus salmoides). Prior to
the arrival of Euro-American settlers, it contained an
abundant native fish fauna of 13 species, including
several endemic to the lake (Moyle 2002). A well-
documented history of invasions began in the late 19th
century with the introduction of lake whitefish (Co-
regonus clupeaformis) and common carp (Cyprinus
carpio). Today the fish community is dominated
primarily by largemouth bass, bluegill (Lepomis macro-
chirus), common carp, and inland silverside (Menidia
beryllina), with only four native species remaining
(Moyle 2002).
On the northeastern shore of Clear Lake, in the Oaks
Arm, lies the Sulphur Bank Mercury Mine (Fig. 1), an
abandoned Hg mine that was responsible for ;100 Mg
of Hg being deposited into the sediments between 1872
and 1957 (Suchanek et al. 2003, 2008e). Although the
relative proportion of MeHg to total (primarily inor-
ganic) Hg (TotHg) is low compared to other contam-
inated sites (Suchanek et al. 2008a), top predator fishes
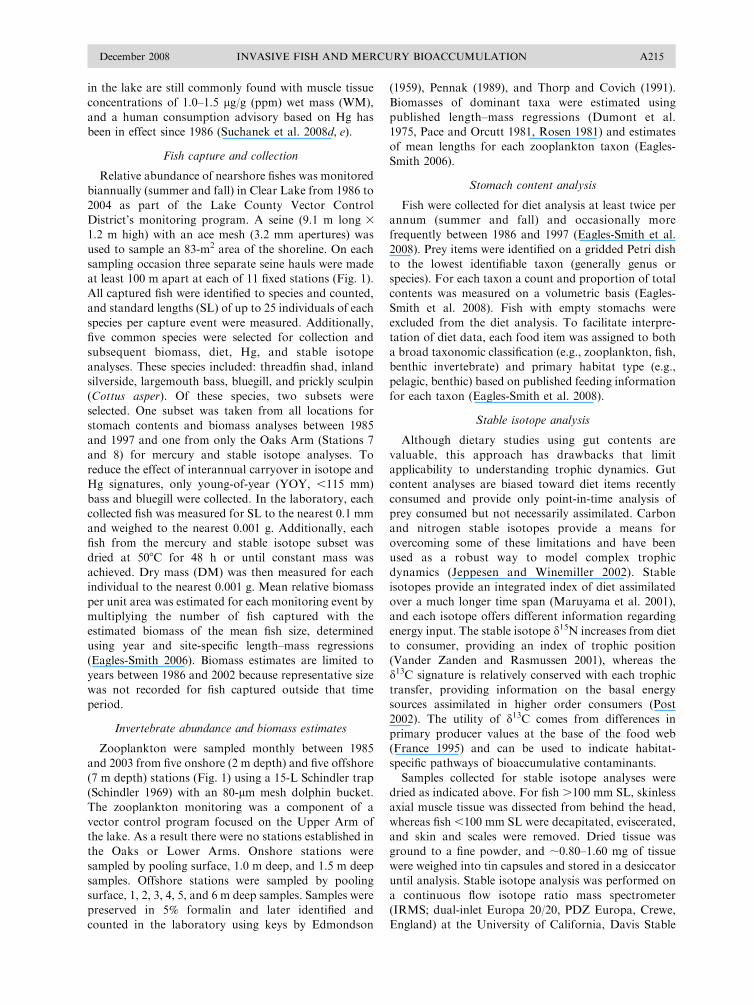
FIG. 1. Map of Clear Lake, California, USA, with fish (circles) and zooplankton (squares) sampling stations.
COLLIN A. EAGLES-SMITH ET AL.A214Ecological Applications
Special Issue
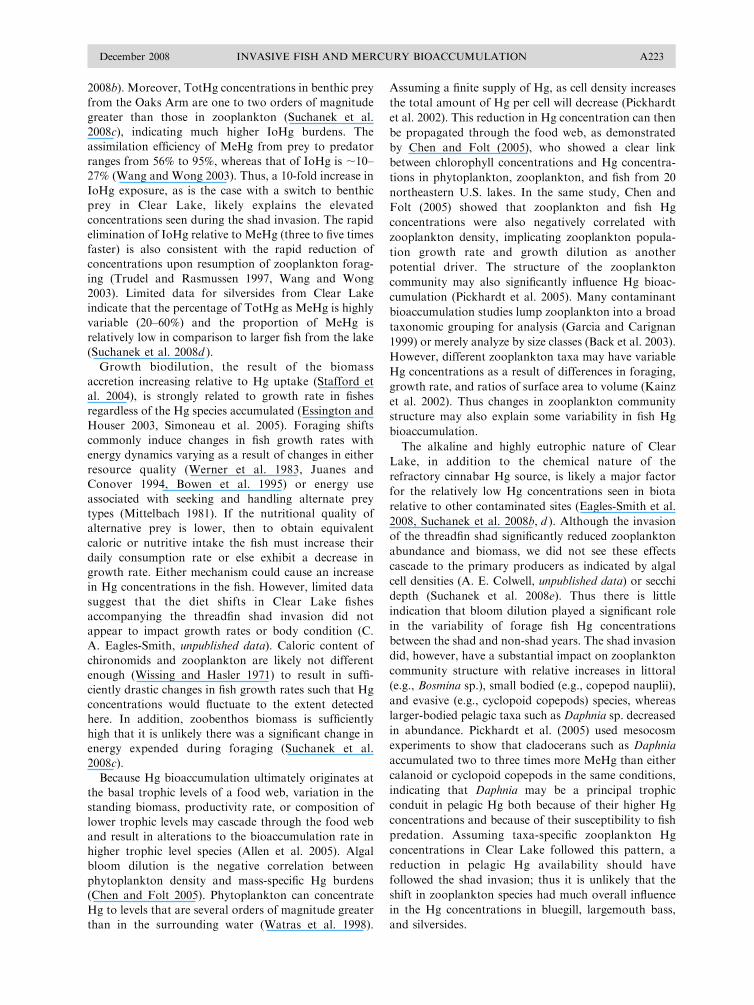
in the lake are still commonly found with muscle tissue
concentrations of 1.0–1.5 lg/g (ppm) wet mass (WM),
and a human consumption advisory based on Hg has
been in effect since 1986 (Suchanek et al. 2008d, e).
Fish capture and collection
Relative abundance of nearshore fishes was monitored
biannually (summer and fall) in Clear Lake from 1986 to
2004 as part of the Lake County Vector Control
District’s monitoring program. A seine (9.1 m long 3
1.2 m high) with an ace mesh (3.2 mm apertures) was
used to sample an 83-m2 area of the shoreline. On each
sampling occasion three separate seine hauls were made
at least 100 m apart at each of 11 fixed stations (Fig. 1).
All captured fish were identified to species and counted,
and standard lengths (SL) of up to 25 individuals of each
species per capture event were measured. Additionally,
five common species were selected for collection and
subsequent biomass, diet, Hg, and stable isotope
analyses. These species included: threadfin shad, inland
silverside, largemouth bass, bluegill, and prickly sculpin
(Cottus asper). Of these species, two subsets were
selected. One subset was taken from all locations for
stomach contents and biomass analyses between 1985
and 1997 and one from only the Oaks Arm (Stations 7
and 8) for mercury and stable isotope analyses. To
reduce the effect of interannual carryover in isotope and
Hg signatures, only young-of-year (YOY, ,115 mm)
bass and bluegill were collected. In the laboratory, each
collected fish was measured for SL to the nearest 0.1 mm
and weighed to the nearest 0.001 g. Additionally, each
fish from the mercury and stable isotope subset was
dried at 508C for 48 h or until constant mass was
achieved. Dry mass (DM) was then measured for each
individual to the nearest 0.001 g. Mean relative biomass
per unit area was estimated for each monitoring event by
multiplying the number of fish captured with the
estimated biomass of the mean fish size, determined
using year and site-specific length–mass regressions
(Eagles-Smith 2006). Biomass estimates are limited to
years between 1986 and 2002 because representative size
was not recorded for fish captured outside that time
period.
Invertebrate abundance and biomass estimates
Zooplankton were sampled monthly between 1985
and 2003 from five onshore (2 m depth) and five offshore
(7 m depth) stations (Fig. 1) using a 15-L Schindler trap
(Schindler 1969) with an 80-lm mesh dolphin bucket.
The zooplankton monitoring was a component of a
vector control program focused on the Upper Arm of
the lake. As a result there were no stations established in
the Oaks or Lower Arms. Onshore stations were
sampled by pooling surface, 1.0 m deep, and 1.5 m deep
samples. Offshore stations were sampled by pooling
surface, 1, 2, 3, 4, 5, and 6 m deep samples. Samples were
preserved in 5% formalin and later identified and
counted in the laboratory using keys by Edmondson
(1959), Pennak (1989), and Thorp and Covich (1991).
Biomasses of dominant taxa were estimated using
published length–mass regressions (Dumont et al.
1975, Pace and Orcutt 1981, Rosen 1981) and estimates
of mean lengths for each zooplankton taxon (Eagles-
Smith 2006).
Stomach content analysis
Fish were collected for diet analysis at least twice per
annum (summer and fall) and occasionally more
frequently between 1986 and 1997 (Eagles-Smith et al.
2008). Prey items were identified on a gridded Petri dish
to the lowest identifiable taxon (generally genus or
species). For each taxon a count and proportion of total
contents was measured on a volumetric basis (Eagles-
Smith et al. 2008). Fish with empty stomachs were
excluded from the diet analysis. To facilitate interpre-
tation of diet data, each food item was assigned to both
a broad taxonomic classification (e.g., zooplankton, fish,
benthic invertebrate) and primary habitat type (e.g.,
pelagic, benthic) based on published feeding information
for each taxon (Eagles-Smith et al. 2008).
Stable isotope analysis
Although dietary studies using gut contents are
valuable, this approach has drawbacks that limit
applicability to understanding trophic dynamics. Gut
content analyses are biased toward diet items recently
consumed and provide only point-in-time analysis of
prey consumed but not necessarily assimilated. Carbon
and nitrogen stable isotopes provide a means for
overcoming some of these limitations and have been
used as a robust way to model complex trophic
dynamics (Jeppesen and Winemiller 2002). Stable
isotopes provide an integrated index of diet assimilated
over a much longer time span (Maruyama et al. 2001),
and each isotope offers different information regarding
energy input. The stable isotope d15N increases from diet
to consumer, providing an index of trophic position
(Vander Zanden and Rasmussen 2001), whereas the
d13C signature is relatively conserved with each trophic
transfer, providing information on the basal energy
sources assimilated in higher order consumers (Post
2002). The utility of d13C comes from differences in
primary producer values at the base of the food web
(France 1995) and can be used to indicate habitat-
specific pathways of bioaccumulative contaminants.
Samples collected for stable isotope analyses were
dried as indicated above. For fish .100 mm SL, skinless
axial muscle tissue was dissected from behind the head,
whereas fish ,100 mm SL were decapitated, eviscerated,
and skin and scales were removed. Dried tissue was
ground to a fine powder, and ;0.80–1.60 mg of tissue
were weighed into tin capsules and stored in a desiccator
until analysis. Stable isotope analysis was performed on
a continuous flow isotope ratio mass spectrometer
(IRMS; dual-inlet Europa 20/20, PDZ Europa, Crewe,
England) at the University of California, Davis Stable
December 2008 A215INVASIVE FISH AND MERCURY BIOACCUMULATION

Isotope Facility. Sample combustion to CO2 and N2
occurred at 10008C in an inline elemental analyzer. A
Carbosieve G column (Varian, Palo Alto, California,
USA) separated the gas before introduction into the
IRMS. Standards (PeeDee Belemnite for d13C and N2
gas for d15N) were injected directly into the IRMS
before and after sample peaks. Isotope ratios are
expressed in per mil (ø) notation. Using d13C as an
example, ratios are defined by the following equation:
d13C ¼ ð13C=12
CÞsample=ð13
C=12CÞstandard
h i� 1
n o3 1000:
Replicates were measured every 10 samples and relative
percentage of difference (RPD) averaged 0.51% for d15Nand 0.24% for d13C (N¼ 52).
Total mercury analysis
Fish samples for TotHg analysis were processed as
described in Stable isotope analysis. Muscle tissue was
chosen for TotHg analysis because it has been identified
as the primary repository of MeHg in fishes and serves
as a strong proxy for whole-body concentrations
(Goldstein et al. 1996, Suchanek et al. 2008d ). All
sampled fish were weighed before and after drying to
determine moisture content. Fish were dried and
powdered as described in the stable isotope analysis
methods. Some archived frozen samples suffered mois-
ture loss, thus all data are reported and analyzed on a
dry-mass basis. Percentage of moisture in fresh samples
averaged 75.7% 6 2.36% (mean 6 SD) and did not
differ among species (Eagles-Smith 2006), thus allowing
for comparison with wet-mass concentrations from the
literature. Fish were analyzed for TotHg on a Milestone
DMA-80 Direct Mercury Analyzer (Milestone, Monroe,
Connecticut, USA) using an integrated sequence of
drying (1608C for 140 s), thermal decomposition (8508C
for 240 s), catalytic conversion, and then amalgamation,
followed by atomic absorption spectroscopy.
Quality assurance methods for mercury included
analysis of at least two certified reference materials
(dogfish muscle [DORM-2, National Research Council
of Canada, Ottawa, Ontario, Canada], dogfish liver
[DOLT-3, National Research Council of Canada], or
lobster hepatopancreas [TORT-2, National Research
Council of Canada]), two method blanks, two dupli-
cates, two matrix spikes, and two matrix spike
duplicates per batch of 20 samples. Reference material
recoveries averaged 99.6% 6 2.4% (N ¼ 67), whereas
recoveries for matrix spikes averaged 103.2% 6 2.4% (N
¼ 61). Absolute RPD averaged 2.9% for duplicates and
5.6% for matrix spike duplicates.
Statistical analyses
Statistical analyses included analysis of variance
(ANOVA) and analysis of covariance (ANCOVA). All
computations were conducted using Statistica 7.1
(StatSoft 2005) and/or JMP 5.0 (SAS Institute 2002).
Residuals were assessed for normality during model
fitting, and data were assessed for homogeneity of
variance. Density, biomass, and TotHg data werenatural log-transformed to stabilize variance, and
proportional diet data were arcsine square-root trans-formed to conform to model assumptions (Zar 1999).
Temporal variation in nearshore fish densities wasassessed with respect to shad population fluctuations.
Data were classified into three categories based uponthreadfin shad abundance: (1) 1986–1989 during theinitial shad invasion, when shad abundance was high
(.10 fish/ha), (2) 1990–2001, when shad populationscrashed and densities never exceeded 10 individuals/ha,
(3) 2002–2004 when shad densities increased again above10 individuals/ha. For each fish species a multiway
nested ANOVA was conducted with either density orbiomass as the dependent variable and shad abundance,
season, station, and [seine haul (station)] as factors.Initially, the interaction term ‘‘shad abundance 3
station’’ was included in all models and dropped if notsignificant (P . 0.05).
To assess the relationship between shad abundanceand both d13C values and TotHg concentrations,
ANCOVA models were used with shad abundance andspecies as categorical factors and standard length as the
covariate. The interaction terms ‘‘species 3 shadabundance’’ and ‘‘species 3 standard length’’ were also
included in the model. Because of the significantinteraction between species and shad abundance in the
initial iteration, separate models were assessed for eachof the four fish species, with shad abundance as thecategorical factor and length as the covariate.
RESULTS
Fish abundance
Although they were only first detected in the lake in1985 (A. E. Colwell, unpublished data), by 1988 threadfin
shad were the dominant inshore fish species of ClearLake, both numerically and on a biomass basis (Fig.
2E). Their population crashed in 1990, and threadfinshad were not detected in the lake again until 1997, when
they made a brief reappearance followed by a major die-off the following winter. They reappeared again in 2001,and their density began to increase appreciably after
2002 (Fig. 2E). The abundance and biomass of fivecommon nearshore fish species in Clear Lake, including
threadfin shad, varied considerably over time (Fig. 2A–E). Changes in the annual abundance of threadfin shad
and prickly sculpin tracked changes in their biomass,indicating that the size spectra of those species did not
vary dramatically over time. However, in 1988 inlandsilverside biomass showed a greater relative decline than
that seen in density (Fig. 2A), indicating a shift towardssmaller individuals, a change concomitant with the peak
of shad abundance. In contrast, YOY largemouth bassand bluegill numbers decreased relative to biomass
during the initial threadfin shad invasion (Fig. 2B, C),suggesting that the average size of both species increased
during the invasion period. During both time periods
COLLIN A. EAGLES-SMITH ET AL.A216Ecological Applications
Special Issue

when shad abundance was elevated (1986–1989 and
2002–2004), inland silverside densities were significantly
greater than when shad abundance was low (ANOVA,
F2,1055¼ 76.64, P , 0.0001; Fig. 3A). Silverside biomass
was also higher during the years of elevated shad
abundance relative to when shad were sparse (ANOVA,
F1, 881 ¼ 106.51, P , 0.0001; Fig. 3B). Although
silverside abundance varied among stations (ANOVA,
F10,1055 ¼ 7.30, P , 0.0001), there was no interaction
between shad abundance and station (P ¼ 0.07).
However, for biomass there was a significant shad
abundance 3 station interaction (P ¼ 0.005). Silverside
biomass was greater in the shad-abundant years at all
stations except 4 and 5, where there were no differences
in silverside biomass between time periods. For large-
mouth bass, density was higher in each successive time
period relative to the preceding one (ANOVA, F2,1035¼46.40, P , 0.0001; Fig. 3A), and biomass was elevated in
the shad-sparse years relative to those when shad first
invaded Clear Lake (ANOVA, F1, 881 ¼ 25.30, P ,
0.0001; Fig. 3B). Bluegill densities also differed among
the shad abundance categories (ANOVA, F2,1035 ¼61.10, P , 0.0001; Fig. 3A); however, only the second
period of elevated shad abundance (2002–2004) was
associated with elevated bluegill densities, whereas there
were no differences between the initial shad invasion and
subsequent decline (Fig. 3). Additionally, there was a
significant interaction in bluegill densities between shad
abundance and station (P , 0.0001). Bluegill densities
were higher in 2002–2004 than during the other two time
periods at sites 1, 2, 7, 8, 10, and 11, whereas there were
no differences among time periods at sites 3, 4, and 5.
Moreover, bluegill densities did not differ between 1986–
1989 and 1990–2001 at any station except 6, where
density during the shad-sparse years was lower than
either shad-abundant time period. Bluegill biomass did
not differ between shad-abundant and shad-sparse years
(ANOVA, F1, 891 ¼ 0.18, P ¼ 0.45; Fig. 3B), and there
were no interactions between station and shad abun-
dance. The main effects of the relationship between
prickly sculpin densities and shad abundance were
difficult to assess because of the interaction between
station and shad abundance (P , 0.0001). Overall,
sculpin densities did not differ among time periods
(ANOVA, F2,1035 ¼ 2.51, P ¼ 0.08; Fig. 3A), and the
interactions indicate that differences only occurred at
stations 2, 9, 10, and 11. Similarly, the interaction was
also significant for sculpin biomass, and biomass did not
differ between time periods (ANOVA, F1, 881¼ 2.23, P¼0.34; Fig. 3B).
Zooplankton abundance
When threadfin shad populations first proliferated in
Clear Lake, zooplankton densities and biomass declined
sharply. Both spiked soon after the shad disappeared,
followed by a long period of low densities in the mid- to
late 1990s (Fig. 4; see Suchanek et al. 2008c). Zooplank-
ton began to increase again between 2000 and 2001, but
FIG. 2. Mean annual density (solid lines) and biomass (dashed lines) of five common nearshore fish species from Clear Lakebetween 1985 and 2004: (A) inland silverside (Menidia beryllina), (B) largemouth bass (Micropterus salmoides), (C) bluegill(Lepomis macrochirus), (D) prickly sculpin (Cottus asper), and (E) threadfin shad (Dorosoma petenense); density¼ (nþ1)/ha where n¼ number of individuals; biomass ¼ g dry mass/ha. The shaded regions represent years when threadfin shad abundance waselevated.
December 2008 A217INVASIVE FISH AND MERCURY BIOACCUMULATION

densities underwent another decline in 2002 as shad
abundance expanded. In addition to changes in overall
abundance and biomass of zooplankton, the composi-
tion of individual taxa within this group varied greatly
and corresponded to the shad dynamics (Fig. 5).
Moreover, the overall composition and proportion of
different zooplankton taxa differed dramatically when
examined on an abundance or biomass basis (Fig. 5).
Abundance and density data indicated that copepod
nauplii and Bosmina sp. together generally composed
the greatest proportion of total zooplankton, accounting
for ;60% or more of the total number of individuals
(Fig. 5A, C). Daphnia pulex and D. galeata also made up
significant proportions of the zooplankton in the 1990s
when shad were absent from the lake (Fig. 5E–F). The
proportion of nearly all taxa changed dramatically
between the initial threadfin shad invasion and disap-
pearance. Smaller and more evasive taxa, such as
Bosmina sp. and copepods (e.g., Diaptomus, cyclopoids,
and nauplii) generally made up a greater proportion of
the zooplankton assemblage when shad densities were
high, whereas the large-bodied and less evasive taxa,
such as Daphnia sp., seemed to dominate when shad
densities were low (Fig. 5A–F). When examined on a
biomass basis it is clear that the numerical trends were
not completely indicative of the energy contribution of
individual zooplankton taxa to food webs. Adult cyclo-
poid copepods are one of the most dominant taxa across
years, and their proportion of the total biomass
increased to around 70% between 1986 and 1990.
During the same time period, biomass contribution of
Daphnia pulex declined dramatically, with a rebound to
roughly 40% of total mass after 1990.
Diet analysis
Stomach content analyses of nearshore fishes indicat-
ed a diet shift after the 1986–1989 threadfin shad
invasion (Table 1). When shad were abundant, inland
silverside, bluegill, and largemouth bass diets all
contained considerably less zooplankton relative to
years when shad were scarce. This difference was driven
primarily by a reduction in the proportion of Daphnia
sp. in the diets of all three species. The dietary
proportion of Daphnia was more than twice as high
during the shad-sparse time than during the years of
high shad abundance (Table 1). The deficit left by the
reduction in zooplankton prey was balanced by an
equally dramatic increase in benthic invertebrates in fish
diets, primarily chironomid larvae and, to a lesser
extent, amphipods and ostracods (Table 1). This
temporal trend in diet shifts was particularly evident
for inland silverside, which underwent a striking reversal
in pelagic vs. benthic foraging between 1985 and 1989
(Fig. 6). However, when examined by size classes, the
effect of shad presence on silverside diets was not
significant in silversides .60 mm (Table 2). Unlike the
FIG. 3. Differences in (A) ln(density) and (B) ln(biomass) offour nearshore fish species (inland silverside [Menidia beryllina],largemouth bass [Micropterus salmoides], bluegill [Lepomismacrochirus], and prickly sculpin [Cottus asper]) from ClearLake when threadfin shad (Dorosoma petenense) were abundant(white bars, 1986–1989; black bars, 2002–2004) vs. sparse orundetected (gray bars, 1990–2001); density¼ (nþ 1)/ha, where n¼ number of individuals and biomass ¼ g dry mass/ha. Theerror bars represent 95% confidence intervals. Differentlowercase letters above bars indicate that values within aspecies are statistically different (P , 0.05).
FIG. 4. Annual density (solid line) and estimated biomass(dotted line) of zooplankton collected from Clear Lake. Theshaded regions indicate times when threadfin shad (Dorosomapetenense) abundance was high.
COLLIN A. EAGLES-SMITH ET AL.A218Ecological Applications
Special Issue

three species discussed above, prickly sculpin did not
undergo a substantial diet shift corresponding with
threadfin shad abundance (Tables 1 and 2).
Habitat-specific energy reliance also differed among
species and shad abundance categories. For all species
combined, d13C, a proxy for benthic vs. pelagic energy
reliance (France 1995), was significantly enriched during
periods of elevated threadfin shad abundance (1986–
1989, 2002–2004) relative to the shad-sparse time period
(1990–2001) (ANCOVA, F2, 585 ¼ 14.79, P , 0.0001).
However, there were significant interactions between
species and both shad abundance (P ¼ 0.001) and
standard length (P , 0.0001). As a result, each species
was assessed individually to better interpret the main
effects. d13C was significantly enriched during both
periods of high shad abundance relative to the shad-
sparse years in inland silversides (ANCOVA, F2, 242 ¼33.83, P , 0.0001; Fig. 7A) and largemouth bass
(ANCOVA, F2, 272 ¼ 53.56, P , 0.0001; Fig. 7A). In
bluegill, d13C also differed among time periods (AN-
COVA, F2,50¼ 5.35, P¼ 0.008); however, only fish from
2002–2004 were enriched over those from the shad-
sparse years, whereas there were no differences in
bluegill d13C from the period 1986–1989 and those from
either 1990–2001 or 2002–2004 (Fig. 7A). Finally, there
were no differences in prickly sculpin d13C among time
periods (ANCOVA, F2,21 ¼ 0.03, P ¼ 0.97), suggesting
that habitat-specific foraging did not differ in relation to
shad abundance (Fig. 7A).
Total mercury also varied among species (ANCOVA,
F3, 566 ¼ 7.45, P , 0.0001), and there was a significant
effect of shad abundance (ANCOVA, F2, 566¼ 5.17, P¼0.006). However, similar to d13C there was also an
interaction between shad abundance and species (P ,
0.0041), thus each species was assessed independently.
On a species-specific basis both silverside (ANCOVA,
F2, 235¼ 8.18, P¼ 0.0004; Fig. 7B) and bass (ANCOVA,
F2, 260 ¼ 27.65, P , 0.0001; Fig. 7B) TotHg concentra-
tions were higher during the time periods when shad
were abundant than when they were sparse. Moreover,
there were no differences in TotHg concentrations
between the two periods of high shad abundance for
either species (Fig. 7B). However, there was a significant
interaction between shad abundance and length for bass,
which indicates that at smaller sizes (,70 mm) Hg
concentrations were higher in 2002–2004 than in 1986–
1989. Conversely, at bass lengths .70 mm Hg concen-
trations were higher in 1986–1989 than in 2002–2004.
Bluegill Hg concentrations also varied among time
periods (ANCOVA, F2,49¼13.01, P , 0.0001); however,
concentrations did not follow the same patterns as those
for silverside and bass. Mercury was highest during the
2002–2004 time period, followed by the shad-sparse
years (1990–2001), and then those during the initial shad
invasion (1986–1989; Fig. 7B). Prickly sculpin Hg data
FIG. 5. Percentage of mean annual abundance (solid line) and biomass (dotted line) for major zooplankton taxa collected fromClear Lake: (A) copepod nauplii, (B) Diaptomus sp., (C) Bosmina sp., (D) cyclopoid copepods, (E) Daphnia pulex, and (F) Daphniagaleata. The shaded regions indicate time of high threadfin shad (Dorosoma petenense) abundance. Note the differences in y-axisscales among panels.
December 2008 A219INVASIVE FISH AND MERCURY BIOACCUMULATION

followed a similar pattern to the diet and d13C results,
whereby TotHg did not vary among time categories
(ANCOVA, F2,23 ¼ 1.58, P ¼ 0.23; Fig. 7B).
DISCUSSION
The threadfin shad invasions of Clear Lake were
associated with considerable yet transient changes to the
structure of the food web, resulting in elevated Hg
concentrations in some small fish species during years of
elevated shad abundance relative to those when shad
were sparse. During times when large numbers of shad
were present in the lake, two resident fish species that
generally depend heavily on pelagic prey, the inland
silverside and juvenile largemouth bass, had dramati-
cally lower dependence upon pelagic resources and
relied more on benthic prey. After shad populations
crashed, the diets of both inland silverside and bass
contained more zooplankton. Parallel to the shift in diet,
Hg concentrations in both silversides and juvenile bass
were significantly higher during both time periods when
shad were abundant relative to when they were scarce.
These results suggest that dietary Hg exposure increased
as a result of the shift to a more benthic foraging habit
for both silversides and bass.
Further support of this interpretation comes from the
prickly sculpin, an obligate benthic feeder (Moyle 2002).
Neither the stomach contents nor their d13C signatures
differed in relation to shad abundance, indicating that
isotopic changes seen in silversides and bass likely
resulted from an increase in benthic reliance and not a
baseline shift in the lake’s isotopic values at the primary
producer level. Moreover, the absence of any change in
TotHg in prickly sculpin further supports the argument
that changes in TotHg in silversides and bass are related
to foraging shifts and not system-wide alterations in Hg
availability or methylation. Interestingly, the bluegill
data are rather equivocal. Diet analysis indicates an
increase in reliance on benthos during periods of high
TABLE 1. Diet contents (percentage of volume, mean with SE in parentheses) of some nearshore fish species when threadfin shadwere abundant vs. sparse in Clear Lake, California, USA.
Prey item
Bluegill Inland silverside Largemouth bass Prickly sculpin
N ¼ 276 N ¼ 34 N ¼ 682 N ¼ 212 N ¼ 416 N ¼ 43 N ¼ 81 N ¼ 79
Shadabundant
(1986–1989)
Shadsparse
(1990–2001)
Shadabundant
(1986–1989)
Shadsparse
(1990–2001)
Shadabundant
(1986–1989)
Shadsparse
(1990–2001)
Shadabundant
(1986–1989)
Shadsparse
(1990–2001)
Fish 0.00 0.00 0.00 0.00 25.80(0.73)
34.14(3.37)
0.00 0.00
Zooplankton
Daphnia sp. 0.31(0.16)
18.39(9.43)
18.26(1.86)
54.11(4.89)
1.14(0.72)
23.80(3.37)
9.87(5.50)
6.10(4.74)
Bosmina sp. 6.63(1.55)
6.02(4.02)
10.62(1.27)
9.43(2.86)
0.00 0.12(0.60)
3.41(2.10)
14.02(5.68)
Chydorus sp. 1.00(0.44)
1.01(2.01)
1.72(0.41)
1.60(0.97)
0.00 0.00 1.40(1.42)
1.46(1.74)
Eurycercus sp. 0.00 9.42(4.51)
0.00 0.18(0.44)
0.00 0.00 0.25(0.38)
0.00
Ceriodaphnia sp. 0.00 0.07(0.40)
0.00 0.12(0.17)
0.00 0.00 0.00 0.00
Cyclops sp. 0.63(0.24)
0.42(1.08)
13.43(1.67)
3.07(1.61)
0.00 1.45(2.97)
0.13(0.24)
0.00
Diaptomus sp. 4.09(0.64)
4.22(3.62)
20.36(2.09)
11.82(2.70)
3.52(1.30)
0.76(1.22)
4.24(2.86)
4.70(3.69)
Benthic invertebrates
Chironomidae 59.14(2.81)
30.21(6.07)
29.59(1.20)
15.08(1.79)
36.02(1.79)
13.92(0.97)
28.10(3.22)
26.04(4.18)
Ephemeroptera 6.40(0.17)
12.30(2.30)
0.56(0.30)
0.22(0.64)
9.66(0.56)
3.32(2.91)
4.13(0.62)
6.54(0.99)
Hemiptera 0.00 2.15(1.03)
0.00 1.06(0.17)
6.56(0.08)
8.80(1.00)
0.19(0.37)
0.85(0.93)
Odonata 0.00 0.28(0.13)
0.00 0.10(0.32)
0.00 4.35(3.05)
3.63(0.65)
2.56(0.99)
Trichoptera 0.00 0.98(0.15)
0.00 0.00 0.00 0.00 2.00(0.58)
0.00
Amphipoda 0.94(0.67)
9.47(2.96)
0.66(0.44)
0.51(0.93)
8.05(0.69)
3.51(3.50)
24.66(1.37)
18.29(1.30)
Ostracoda 18.53(0.70)
2.06(2.80)
2.50(0.41)
0.52(0.78)
0.00 0.23(3.29)
15.96(1.34)
17.01(1.36)
Unknown 2.76 3.57 2.30 2.18 9.26 5.61 2.04 2.43
Note: Species names are: bluegill, Lepomis macrochirus; inland silverside, Menidia beryllina; largemouth bass, Micropterussalmoides; prickly sculpin, Cottus asper; threadfin shad, Dorosoma petenense.
COLLIN A. EAGLES-SMITH ET AL.A220Ecological Applications
Special Issue

shad abundance; however, d13C only differed between
the second shad boom (2002–2004) and the shad-sparse
years (1990–2001). Moreover, TotHg was lower during
the first shad invasion (1986–1989) than the shad-sparse
years, whereas it was higher during the 2002–2004
period. Other than prickly sculpin, bluegill was the most
dependent upon benthic organisms when shad were rare.
Thus the relative change in diet was not as dramatic as
for silverside and bass, resulting in a less distinct change
in both d13C signature and Hg concentrations. Addi-
tionally, the increase in bluegill benthic prey was driven
by both chironomids and ostracods, as opposed to solely
chironomids as noted in silverside and bass. Moreover,
littoral invertebrates such as mayflies, hemipterans, and
amphipods were less common in the bluegill diet during
years of elevated shad densities, indicating that the
greater reliance on profundal invertebrates may have
dampened the benthic carbon isotope signal (Vander
Zanden and Rasumussen 1999).
Threadfin shad are known for their ability to
proliferate rapidly (Johnson 1970, Heidinger and
Imboden 1974) and to reduce zooplankton abundance
in lakes and ponds (DeVries et al. 1991). As shad grow,
their foraging strategies change from visual feeding,
focusing almost exclusively on zooplankton, to a more
variable diet of zooplankton, phytoplankton, and
detritus (Haskell 1959, Gerdes and McConnell 1963,
Baker and Schmitz 1971). When targeting zooplankton,
they particulate-feed on larger taxa and filter-feed on
smaller species (Brooks 1968, Holanov and Tash 1978).
This ability to use gill rakers to filter smaller plankton
species is likely the principal mechanism by which shad
decimate zooplankton communities. Bioenergetic stud-
ies on the ecologically similar gizzard shad Dorosoma
cepedianum suggest that consumption rates of these
clupeid species are more than sufficient to constrict
zooplankton abundance in Clear Lake. Shepherd and
Mills (1996) estimated that during times of high
zooplankton biomass (.100 mg/L DM), age 0 gizzard
shad consumed ;50 mg DM of Daphnia per gram WM
of shad per day. Using these figures, it is estimated that
when threadfin shad biomass ranged from 2.11 3 106 to
6.62 3 107 g WM/ha in Clear Lake between 1987 and
1989, daily zooplankton consumption varied between
1.06 3 105 and 3.31 3 106 g DM/ha. Using a volume
estimate for the entire lake of 1.433 107 m3 (Horne and
Goldman 1972), the lake-wide mean zooplankton
biomass (based on 1985 abundance data) was ;4.00 3
107g. These calculations overwhelmingly indicate that
threadfin shad played a principal role in the change in
zooplankton abundance and biomass in the lake, as well
as the shift to smaller zooplankton species. In fact, at
those consumption rates, the zooplankton resources
alone should be unable to support the threadfin shad
population. The fact that the shad remained in the lake
continuously for at least four years suggests that they
either had a lower consumption rate or that they
subsidized their zooplankton consumption by feeding
on phytoplankton and detritus. There is likely some
validity to both explanations. Eagles-Smith et al. (2008)
showed that shad in Clear Lake rely heavily on resources
other than zooplankton, with both diet and stable
isotope analyses indicating that phytoplankton and
detritus make up a significant portion of their diet,
particularly for larger fish (.70 mm).
Previous research on YOY largemouth bass in Clear
Lake indicated a greater degree of piscivory (50–90%)
than recent estimates of 17–60% (Eagles-Smith et al.
2008). When they examined bass foraging preferences by
size class, Moyle and Holzhauser (1978) identified
zooplankton (mainly Daphnia sp.) as the most important
diet item for YOY largemouth bass. Diet from non-shad
years in this study also indicate that zooplankton are of
primary importance (Eagles-Smith et al. 2008), with
FIG. 6. Percentage of pelagic and benthic organisms in the diet of inland silversides (Menidia beryllina) between 1985 and 1996(mean 6 SE).
December 2008 A221INVASIVE FISH AND MERCURY BIOACCUMULATION

mainly chironomid larvae filling the void when shad
were abundant.
Inland silversides are visual foragers, commonly
preying upon on pelagic zooplankton species in Clear
Lake (Wurtsbaugh and Li 1985). This general foraging
strategy continued during this study, with Bosmina sp.,
Daphnia pulex, and various copepods as the major diet
components (Eagles-Smith et al. 2008). Although
benthic invertebrates such as chironomid midges are
occasionally important prey items of silversides, most
are consumed as emerging adults and not benthic larvae
(Elston and Bachen 1976, Wurtsbaugh and Li 1985). In
this study, when threadfin shad were absent from the
lake 40% of the chironomids found in silverside
stomachs were adults, whereas only 22% were adults
when shad were present.
Although our results clearly show a strong relation-
ship between threadfin shad abundance, benthic-pelagic
energy reliance, and Hg bioaccumulation, it is notable
that benthic chironomids actually had lower MeHg
concentrations (0.044 6 0.011 ppm DM) than zoo-
plankton (0.059 6 0.008 ppm DM) analyzed from the
same times and locations (Suchanek et al. 2008c). It is
intriguing that silverside and bass Hg concentrations
increased in light of their dietary MeHg concentrations
slightly decreasing. This discrepancy is likely the result
of some combination of increased Hg exposure from
sediment consumption and increased inorganic Hg
(IoHg) exposure and assimilation associated with
chironomid prey (Suchanek et al. 2008c). Other poten-
tial causal mechanisms such as reduced growth rate as
well as cascading changes in zooplankton community
structure and primary productivity do not appear to
have occurred to an extent large enough to have driven
these changes (C. A. Eagles-Smith, unpublished data).
Oaks Arm sediment MeHg concentrations range from
;0.002 to 0.020 ppm DM, whereas TotHg concentra-
tions vary between ;10 and 400 ppm (Suchanek et al.
TABLE 2. ANCOVA models by fish species and size class: the effect of threadfin shad (Dorosoma petenense) abundance timeperiods on the pelagic and benthic energy reliance in inland silverside (Menidia beryllina), bluegill (Lepomis macrochirus),largemouth bass (Micropterus salmoides), and prickly sculpin (Cottus asper), using standard length as a covariate.
Species
Pelagic reliance Benthic reliance
Effect of shad presence F df P Effect of shad presence F df P
Silverside
All sizes decrease 25.16 1, 831 ,0.0001 increase 12.41 1, 832 0.001,36 mm decrease 8.78 1, 194 0.003 increase 7.55 1, 198 0.00737–60 mm decrease 16.54 1, 424 ,0.0001 increase 7.55 1, 425 0.007.60 mm no change 1.87 1, 204 0.173 no change 0.04 1, 204 0.85
Bluegill
,75 mm decrease 14.03 1, 212 ,0.0001 increase 12.78 1, 212 ,0.0001
Bass
,115 mm decrease 7.37 1, 346 0.007 no change 3.50 1, 346 0.06
Sculpin
,48 mm no change 0.74 1, 145 0.39 no change 0.32 1, 145 0.57
Notes: Benthic and pelagic reliance are the proportions of total diet classified as benthic or pelagic, derived from diet analyses.See Eagles-Smith et al. (2008) for classification details.
FIG. 7. (A) d13C and (B) total mercury (TotHg; DM, drymass) concentrations in inland silversides (Menidia beryllina),largemouth bass (Micropterus salmoides), bluegill (Lepomismacrochirus), and prickly sculpin (Cottus asper) during periodswhen threadfin shad (Dorosoma petenense) were abundant vs.sparse or undetected. The error bars represent 95% confidenceintervals. The lowercase letters above bars indicate statisticaldifferences (P , 0.05) within species.
COLLIN A. EAGLES-SMITH ET AL.A222Ecological Applications
Special Issue
2008b). Moreover, TotHg concentrations in benthic prey
from the Oaks Arm are one to two orders of magnitude
greater than those in zooplankton (Suchanek et al.
2008c), indicating much higher IoHg burdens. The
assimilation efficiency of MeHg from prey to predator
ranges from 56% to 95%, whereas that of IoHg is ;10–
27% (Wang and Wong 2003). Thus, a 10-fold increase in
IoHg exposure, as is the case with a switch to benthic
prey in Clear Lake, likely explains the elevated
concentrations seen during the shad invasion. The rapid
elimination of IoHg relative to MeHg (three to five times
faster) is also consistent with the rapid reduction of
concentrations upon resumption of zooplankton forag-
ing (Trudel and Rasmussen 1997, Wang and Wong
2003). Limited data for silversides from Clear Lake
indicate that the percentage of TotHg as MeHg is highly
variable (20–60%) and the proportion of MeHg is
relatively low in comparison to larger fish from the lake
(Suchanek et al. 2008d ).
Growth biodilution, the result of the biomass
accretion increasing relative to Hg uptake (Stafford et
al. 2004), is strongly related to growth rate in fishes
regardless of the Hg species accumulated (Essington and
Houser 2003, Simoneau et al. 2005). Foraging shifts
commonly induce changes in fish growth rates with
energy dynamics varying as a result of changes in either
resource quality (Werner et al. 1983, Juanes and
Conover 1994, Bowen et al. 1995) or energy use
associated with seeking and handling alternate prey
types (Mittelbach 1981). If the nutritional quality of
alternative prey is lower, then to obtain equivalent
caloric or nutritive intake the fish must increase their
daily consumption rate or else exhibit a decrease in
growth rate. Either mechanism could cause an increase
in Hg concentrations in the fish. However, limited data
suggest that the diet shifts in Clear Lake fishes
accompanying the threadfin shad invasion did not
appear to impact growth rates or body condition (C.
A. Eagles-Smith, unpublished data). Caloric content of
chironomids and zooplankton are likely not different
enough (Wissing and Hasler 1971) to result in suffi-
ciently drastic changes in fish growth rates such that Hg
concentrations would fluctuate to the extent detected
here. In addition, zoobenthos biomass is sufficiently
high that it is unlikely there was a significant change in
energy expended during foraging (Suchanek et al.
2008c).
Because Hg bioaccumulation ultimately originates at
the basal trophic levels of a food web, variation in the
standing biomass, productivity rate, or composition of
lower trophic levels may cascade through the food web
and result in alterations to the bioaccumulation rate in
higher trophic level species (Allen et al. 2005). Algal
bloom dilution is the negative correlation between
phytoplankton density and mass-specific Hg burdens
(Chen and Folt 2005). Phytoplankton can concentrate
Hg to levels that are several orders of magnitude greater
than in the surrounding water (Watras et al. 1998).
Assuming a finite supply of Hg, as cell density increases
the total amount of Hg per cell will decrease (Pickhardt
et al. 2002). This reduction in Hg concentration can then
be propagated through the food web, as demonstrated
by Chen and Folt (2005), who showed a clear link
between chlorophyll concentrations and Hg concentra-
tions in phytoplankton, zooplankton, and fish from 20
northeastern U.S. lakes. In the same study, Chen and
Folt (2005) showed that zooplankton and fish Hg
concentrations were also negatively correlated with
zooplankton density, implicating zooplankton popula-
tion growth rate and growth dilution as another
potential driver. The structure of the zooplankton
community may also significantly influence Hg bioac-
cumulation (Pickhardt et al. 2005). Many contaminant
bioaccumulation studies lump zooplankton into a broad
taxonomic grouping for analysis (Garcia and Carignan
1999) or merely analyze by size classes (Back et al. 2003).
However, different zooplankton taxa may have variable
Hg concentrations as a result of differences in foraging,
growth rate, and ratios of surface area to volume (Kainz
et al. 2002). Thus changes in zooplankton community
structure may also explain some variability in fish Hg
bioaccumulation.
The alkaline and highly eutrophic nature of Clear
Lake, in addition to the chemical nature of the
refractory cinnabar Hg source, is likely a major factor
for the relatively low Hg concentrations seen in biota
relative to other contaminated sites (Eagles-Smith et al.
2008, Suchanek et al. 2008b, d ). Although the invasion
of the threadfin shad significantly reduced zooplankton
abundance and biomass, we did not see these effects
cascade to the primary producers as indicated by algal
cell densities (A. E. Colwell, unpublished data) or secchi
depth (Suchanek et al. 2008e). Thus there is little
indication that bloom dilution played a significant role
in the variability of forage fish Hg concentrations
between the shad and non-shad years. The shad invasion
did, however, have a substantial impact on zooplankton
community structure with relative increases in littoral
(e.g., Bosmina sp.), small bodied (e.g., copepod nauplii),
and evasive (e.g., cyclopoid copepods) species, whereas
larger-bodied pelagic taxa such as Daphnia sp. decreased
in abundance. Pickhardt et al. (2005) used mesocosm
experiments to show that cladocerans such as Daphnia
accumulated two to three times more MeHg than either
calanoid or cyclopoid copepods in the same conditions,
indicating that Daphnia may be a principal trophic
conduit in pelagic Hg both because of their higher Hg
concentrations and because of their susceptibility to fish
predation. Assuming taxa-specific zooplankton Hg
concentrations in Clear Lake followed this pattern, a
reduction in pelagic Hg availability should have
followed the shad invasion; thus it is unlikely that the
shift in zooplankton species had much overall influence
in the Hg concentrations in bluegill, largemouth bass,
and silversides.
December 2008 A223INVASIVE FISH AND MERCURY BIOACCUMULATION

The effects of food web structure and foraging
ecology on Hg bioaccumulation dynamics have been
examined extensively (Wren and MacCrimmon 1986,Cabana and Rasmussen 1994, Vander Zanden and
Rasmussen 1996, Doyon et al. 1998); however, we are
aware of few instances in which this has been explicitly
tied to food web changes resulting from nonnative
species invasions (Kidd et al. 1999, Johnston et al. 2003,Swanson et al. 2003, 2006). Kidd et al. (1999) studied the
introduction of piscivorous northern pike (Esox lucius)
to two experimental lakes and found that while
organochlorine contaminant concentrations in foragefish did not change between pre- and post-introduction
levels in either lake, one of the lakes showed a significant
decline in Hg concentrations in small fishes while stable
isotope evidence pointed to a shift from pelagic
zooplankton foraging to a heavy reliance on zooben-thos. A thorough treatment has also been given to the
rainbow smelt (Osmerus mordax) invasion of the
Hudson Bay drainage and its effects on Hg bioaccumu-
lation in predatory (Vander Zanden and Rasmussen1996, Johnston et al. 2003) and lower trophic level fish
(Swanson et al. 2003, 2006). These studies found that,
for the most part, the invasion caused very little change
in fish Hg concentrations and suggested that compen-sation via changes in growth rate was the most probable
reason.
Like these studies, our work provides a novel example
of how invasion-induced shifts in food web structure can
influence contaminant dynamics. However, the response
in Clear Lake was notably different from thosepreviously documented. Our data indicate that point
source inorganic Hg loading and accumulation in
benthic invertebrates drove an increase in TotHg
concentrations of nearshore fishes that switched frompelagic to benthic diets, even though MeHg concentra-
tions in zooplankton exceeded those of benthic prey
items. Unlike the rainbow smelt studies, we did not
detect any relationships between the shad invasion andshifts in either trophic position or growth rates of small
fishes, which highlights the importance of understanding
Hg loading and speciation dynamics in a system when
examining bioaccumulation through trophic levels.
This study also provides a good example of resilience
of food webs in lakes. After the shad populationcrashed, the food web structure quickly changed. This
observation has implications for management and
regulation of Hg in water bodies throughout the United
States if the short-term plasticity of fish diets can resultin dramatic fluctuations of fish Hg concentrations.
These results suggest that regulations such as total
maximum daily loads (TMDLs) for Hg should require a
relatively robust characterization of trophic relation-ships of the taxa considered for regulation.
ACKNOWLEDGMENTS
We thank many colleagues for their dedicated field andlaboratory assistance. We are especially grateful to Liz Vignola,Matt Fine, Rebekka Woodruff, Levi Lewis, Amanda Bern,
Patrick Crain, and Katie Small. Peter Green and Doug Nelsongraciously provided access to analytical equipment andlaboratory space. We thank Sudeep Chandra, Josh Ackerman,Dan Anderson, Patrick Crain, and Darell Slotton for manythoughtful discussions. We also thank Julie Yee, Karen Phillips,and two anonymous reviewers for suggestions that substantiallyimproved the quality of the manuscript. This work wassupported by the U.S. EPA-funded (R819658 and R825433)Center for Ecological Health Research at UC–Davis, U.S. EPARegion IX Superfund Program (68-S2-9005) to T. H. Suchanek,and UC Toxic Substances Research and Teaching Program(UC–Davis Lead Campus), UC–Davis block grant, and Jastro-Shields fellowships to C. A. Eagles-Smith. Although portions ofthis work have been funded fully or in part by the U.S.Environmental Protection Agency, it may not necessarily reflectthe views of the Agency, and no official endorsement should beinferred. Any use of trade, product, or firm names in thispublication is for descriptive purposes only and does not implyendorsement by the U.S. government.
LITERATURE CITED
Allen, E. W., E. E. Prepas, S. Gabos, W. M. J. Strachan, andW. Zhang. 2005. Methyl mercury concentrations in macro-invertebrates and fish from burned and undisturbed lakes onthe Boreal Plain. Canadian Journal of Fisheries and AquaticSciences 62:1963–1977.
Alpers, C. N., M. P. Hunnerlach, J. T. May, and R. L. Hothem.2005. Mercury contamination from historic gold mining inCalifornia. U.S. Geological Survey Fact Sheet 2005-3014.hhttp://water.usgs.gov/pubs/fs/2005/3014/i
Back, R. C., P. R. Gorski, L. B. Cleckner, and J. P. Hurley.2003. Mercury content and speciation in the plankton andbenthos of Lake Superior. Science of the Total Environment304:349–354.
Baker, C. D., and E. H. Schmitz. 1971. Food habits of adultgizzard shad and threadfin shad in two Ozark reservoirs.American Fisheries Society Special Publication 8:3–11.
Bowen, S. H., E. V. Lutz, and M. O. Ahlgren. 1995. Dietaryprotein and energy as determinants of food quality: trophicstrategies compared. Ecology 76:899–907.
Brooks, J. L. 1968. The effects of prey size selection by lakeplanktivores. Systematic Zoology 17:273–291.
Cabana, G., and J. B. Rasmussen. 1994. Modeling food-chainstructure and contaminant bioaccumulation using stablenitrogen isotopes. Nature 372:255–257.
Chen, C. Y., and C. L. Folt. 2005. High plankton densitiesreduce mercury biomagnification. Environmental Scienceand Technology 39:115–121.
Colborn, T., and K. Thayer. 2000. Aquatic ecosystems:harbingers of endocrine disruption. Ecological Applications10:949–957.
Compeau, G., and R. Bartha. 1985. Sulfate-reducing bacteria—principal methylators of mercury in anoxic estuarinesediment. Applied Environmental Microbiology 50:498–502.
DeVries, D. R., R. A. Stein, J. G. Miner, and G. G. Mittelbach.1991. Stocking threadfin shad: consequences for young-of-the-year fishes. Transactions of the American FisheriesSociety 120:368–381.
Doyon, J. F., R. Schetagne, and R. Verdon. 1998. Differentmercury bioaccumulation rates between sympatric popula-tions of dwarf and normal lake whitefish (Coregonusclupeaformis) in the La Grande complex watershed, JamesBay, Quebec. Biogeochemistry 40:203–216.
Dumont, H. J., I. Van de Velde, and S. Dumont. 1975. The dryweight estimate of biomass in a selection of Cladocera,Copepoda and Rotifera from the plankton, periphyton andbenthos of continental waters. Oecologia 19:75–97.
Eagles-Smith, C. A. 2006. Mercury in fish: food web structure,trophic transfer, and bioaccumulation in two Californialakes. Dissertation. University of California, Davis, Califor-nia, USA.
COLLIN A. EAGLES-SMITH ET AL.A224Ecological Applications
Special Issue

Eagles-Smith, C. A., T. H. Suchanek, A. E. Colwell, and N. L.Anderson. 2008. Mercury trophic transfer in a eutrophiclake: the importance of habitat specific foraging. EcologicalApplications 18(Supplement):A196–A212.
Edmondson, W. T. 1959. Fresh-water biology. Second edition.John Wiley and Sons, New York, New York, USA.
Elston, R. E., and B. Bachen. 1976. Diel feeding cycle and someeffects of light on feeding intensity of the Mississippisilversides, Menidia audens, in Clear Lake, California.Transactions of the American Fisheries Society 105:84–88.
Essington, T. E., and J. N. Houser. 2003. The effect of whole-lake nutrient enrichment on mercury concentration in age-1yellow perch. Transactions of the American Fisheries Society132:57–68.
Fleming, E. J., E. Mack, P. G. Green, and D. C. Nelson. 2006.Mercury methylation from unexpected sources: molybdate-inhibited freshwater sediments and an iron-reducing bacte-rium. Applied and Environmental Microbiology 72:457–464.
France, R. L. 1995. Differentiation between littoral and pelagicfood webs in lakes using stable carbon isotopes. Limnolgyand Oceanography 40:1310–1313.
Garcia, E., and R. Carignan. 1999. Impact of wildfire and clear-cutting in the boreal forest on methyl mercury in zooplank-ton. Canadian Journal of Fisheries and Aquatic Sciences 56:339–345.
Gerdes, J. H., and W. J. McConnell. 1963. Food habits andspawning of the threadfin shad in a small desert impound-ment. Journal of the Arizona Academy of Science 2:113–116.
Goldstein, R. M., M. E. Brigham, and J. C. Stauffer. 1996.Comparison of mercury concentrations in liver, muscle,whole bodies, and composites of fish from the Red River ofthe North. Canadian Journal of Fisheries and AquaticSciences 53:244–252.
Greenfield, B. K., T. R. Hrabik, C. J. Harvey, and S. R.Carpenter. 2001. Predicting mercury levels in yellow perch:use of water chemistry, trophic ecology, and spatial traits.Canadian Journal of Fisheries and Aquatic Sciences 58:1419–1429.
Hall, B. D., V. L. St. Louis, K. R. Rolfhus, R. A. Bodaly, K. G.Beaty, M. J. Paterson, and K. A. Peech Cherewyk. 2005.Impacts of reservoir creation on the biogeochemical cyclingof methyl mercury and total mercury in boreal uplandforests. Ecosystems 8:248–266.
Hammerschmidt, C. R., M. R. Sandheinrich, J. G. Wiener, andR. G. Rada. 2002. Effects of dietary methylmercury onreproduction of fathead minnows. Environmental Scienceand Technology 36:877–883.
Harris, R. C., and W. J. Snodgrass. 1993. Bioenergeticsimulations of mercury uptake and retention in walleye andyellow perch. Water Pollution Research Journal of Canada28:217–236.
Haskell, W. L. 1959. Diet of the Mississippi threadfin shad,Dorosoma petenense archafalayae, in Arizona. Copeia 4:298–302.
Heidinger, R., and F. Imboden. 1974. Reproductive potentialof young-of-the-year threadfin shad (Dorosoma petenense) insouthern Illinois lakes. Transactions of the Illinois StateAcademy of Science 67:397–401.
Holanov, S. H., and J. C. Tash. 1978. Particulate and filterfeeding in threadfin shad, Dorosoma petenense, at differentlight intensities. Journal of Fish Biology 13:619–625.
Horne, A. J., and C. R. Goldman. 1972. Nitrogen fixation inClear Lake, California. I. Seasonal variation and the role ofheterocysts. Limnology and Oceanography 17:678–692.
Jeppesen, D. B., and K. O. Winemiller. 2002. Structure oftropical food webs revealed by stable isotope ratios. Oikos96:46–55.
Johnson, J. E. 1970. Age, growth, and population dynamics ofthreadfin shad, Dorosoma petenense, in central Arizonareservoirs. Transactions of the American Fisheries Society99:739–753.
Johnston, T. A., W. C. Leggett, R. A. Bodaly, and H. K.Swanson. 2003. Temporal changes in mercury bioaccumula-tion by predatory fishes of boreal lakes following the invasionof an exotic forage fish. Environmental Toxicology andChemistry 22:2057–2062.
Juanes, F., and D. O. Conover. 1994. Rapid growth, highfeeding rates, and early piscivory in young-of-the-yearbluefish (Pomatomus saltatrix). Canadian Journal of Fisher-ies and Aquatic Sciences 51:1752–1761.
Kainz, M., M. Lucotte, and C. C. Parrish. 2002. Methylmercury in zooplankton—the role of size, habitat, and foodquality. Canadian Journal of Fisheries and Aquatic Sciences59:1606–1615.
Kidd, K. A., R. H. Hesslein, R. J. P. Fudge, and K. A. Hallard.1995. The influence of trophic level as measured by delta-15Non mercury concentrations in freshwater organisms. WaterAir and Soil Pollution 80:1011–1015.
Kidd, K. A., M. J. Paterson, R. H. Hesslein, D. C. G. Muir,and R. E. Hecky. 1999. Effects of northern pike (Esox lucius)additions on pollutant accumulation and food web structure,as determined by d13C and d15N, in a eutrophic and anoligotrophic lake. Canadian Journal of Fisheries and AquaticSciences 56:2193–2202.
Lodge, D. M. 1993. Biological invasions: lessons for ecology.Trends in Ecology and Evolution 8:133–137.
Macleod, M., T. E. McKone, and D. Mackay. 2005. Massbalance for mercury in the San Francisco Bay area.Environmental Science and Technology 39:6721–6729.
Maruyama, A., Y. Yamada, B. Rusuwa, and M. Yuma. 2001.Change in stable nitrogen isotope ratio in the muscle tissue ofa migratory goby, Rhinogobius sp., in a natural setting.Canadian Journal of Fisheries and Aquatic Sciences 58:2125–2128.
Mason, R. P., J. M. Laporte, and S. Andres. 2000. Factorscontrolling bioaccumulation of mercury, methylmercury,arsenic, selenium, and cadmium by freshwater invertebratesand fish. Archives of Environmental Contamination andToxicology 38:283–297.
Mittelbach, G. G. 1981. Foraging efficiency and body size: astudy of optimal diet and habitat use by bluegills. Ecology 62:1370–1386.
Moyle, P. B. 2002. Inland fishes of California. University ofCalifornia Press, Berkeley, California, USA.
Moyle, P. B., and N. Holzhauser. 1978. Effects of theintroduction of the Mississippi silverside (Menidia audens)and Florida largemouth bass (Micropterus salmoides flori-danus) on the feeding habits of young-of-year largemouthbass in Clear Lake, California. Transactions of the AmericanFisheries Society 107:574–582.
Moyle, P. B., and T. Light. 1996. Fish invasions in California:Do abiotic factors determine success? Ecology 77:1666–1670.
Moyle, P. B., and M. P. Marchetti. 2006. Predicting invasionsuccess: freshwater fishes in California as a model. BioScience56:515–524.
OEHHA [California Office of Environmental Health HazardAssessment]. 2006. Water bodies with fish consumptionadvisories. hwww.oehha.ca.gov/fish/pdf/Adv_Map_2006.pdf i
Pace, M. L., and J. D. Orcutt. 1981. The relative importance ofprotozoans, rotifers, and crustaceans in a freshwaterzooplankton community. Limnology and Oceanography 26:822–830.
Pennak, R. W. 1989. Fresh-water invertebrates of the UnitedStates. Third edition. John Wiley and Son, New York, NewYork, USA.
Pickhardt, P. C., C. L. Folt, C. L. Chen, B. Klaue, and J. D.Blum. 2002. Algal blooms reduce the uptake of toxicmethylmercury in freshwater food webs. Proceeding of theNational Academy of Sciences 9:4419–4423.
Pickhardt, P. C., C. L. Folt, C. Y. Chen, B. Klaue, and J. D.Blum. 2005. Impacts of zooplankton composition and algalenrichment on the accumulation of mercury in an experi-
December 2008 A225INVASIVE FISH AND MERCURY BIOACCUMULATION

mental freshwater food web. Science of the Total Environ-ment 339:89–101.
Post, D. M. 2002. Using stable isotopes to estimate trophicposition: models, methods, and assumptions. Ecology 83:703–718.
Power, M., G. M. Klein, K. R. R. A. Guiguer, and M. K. H.Kwan. 2002. Mercury accumulation in the fish community ofa sub-Arctic lake in relation to trophic position and carbonsources. Journal of Applied Ecology 39:819–830.
Relyea, R. A. 2003. Predator cues and pesticides: a double doseof danger for amphibians. Ecological Applications 13:1515–1521.
Rogers, D. W., T. A. Watson, J. S. Langan, and T. J. Wheaton.1987. Effects of pH and feeding regime on methylmercuryaccumulation within aquatic microcosms. EnvironmentalPollution 45:261–274.
Rosen, R. A. 1981. Length-dry weight relationships of somefreshwater zooplankton. Journal of Freshwater Ecology 1:225–229.
SAS Institute. 2002. JMP: the statistical discovery software.Version 5.0. SAS Institute, Cary, North Carolina, USA.
Schindler, D. W. 1969. Two useful devices for vertical planktonand water sampling. Journal of the Fisheries Research Boardof Canada 26:1948–1955.
Shepherd, W. C., and E. L. Mills. 1996. Diel feeding, daily foodintake, and Daphnia consumption by age-0 gizzard shad inOneida Lake, New York. Transactions of the AmericanFisheries Society 125:411–421.
Simoneau, M., M. Lucotte, S. Garceau, and D. Laliberte. 2005.Fish growth rates modulate mercury concentrations inwalleye (Sander vitreus) from eastern Canadian lakes.Environmental Research 98:73–82.
Snodgrass, J. W., C. H. Jagoe, A. L. Bryan, Jr., H. A. Brant,and J. Burger. 2000. Effects of trophic status and wetlandmorphology, hydroperiod, and water chemistry on mercuryconcentrations in fish. Canadian Journal of Fisheries andAquatic Sciences 57:171–180.
Stafford, C. P., B. Hanson, and J. A. Stanford. 2004. Mercuryin fishes and their diet items from Flathead Lake, Montana.Transactions of the American Fisheries Society 133:349–357.
StatSoft. 2005. STATISTICA. Version 7.1. StatSoft, Tulsa,Oklahoma, USA.
St. Louis, V. L., J. W. M. Rudd, C. A. Kelly, R. A. Bodaly,M. J. Patterson, K. G. Beaty, R. H. Hesslein, A. Hayes, andA. R. Majewski. 2004. The rise and fall of mercurymethylation in an experimental reservoir. EnvironmentalScience and Technology 38:1348–1358.
Suchanek, T. H., C. A. Eagles-Smith, and E. J. Harner. 2008a. IsClear Lake methylmercury distribution decoupled from bulkmercury loading? Ecological Applications 18(Supplement):A107–A127.
Suchanek, T. H., C. A. Eagles-Smith, D. G. Slotton, E. J.Harner, and D. P. Adam. 2008b. Mercury in abiotic matricesof Clear Lake, California: human health and ecotoxicologicalimplications. Ecological Applications 18(Supplement):A128–A157.
Suchanek, T. H., C. A. Eagles-Smith, D. G. Slotton, E. J.Harner, D. P. Adam, A. E. Colwell, N. L. Anderson, andD. L. Woodward. 2008c. Mine-derived mercury: effects onlower trophic species in Clear Lake, California. EcologicalApplications 18(Supplement):A158–A176.
Suchanek, T. H., C. A. Eagles-Smith, D. G. Slotton, E. J.Harner, A. E. Colwell, N. L. Anderson, L. H. Mullen, J. R.Flanders, D. P. Adam, and K. J. McElroy. 2008d.Spatiotemporal trends in fish mercury from a mine-domi-nated ecosystem: Clear Lake, California. Ecological Appli-cations 18(Supplement):A177–A195.
Suchanek, T. H., et al. 2003. Evaluating and managing amultiply stressed ecosystem at Clear Lake, California: a
holistic ecosystem approach. Pages 1239–1271 in D. J.Rapport, W. L. Lasley, D. E. Rolston, N. O. Nielsen,C. O. Qualset, and A. B. Damania, editors. Managing forhealthy ecosystems. Lewis, Boca Raton, Florida, USA.
Suchanek, T. H., et al. 2008e. The legacy of mercury cyclingfrom mining sources in an aquatic ecosystem: from ore toorganism. Ecological Applications 18(Supplement):A12–A28.
Swanson, H. K., T. A. Johnston, W. C. Leggett, R. A. Bodaly,R. R. Doucett, and R. A. Cunjak. 2003. Trophic positionsand mercury bioaccumulation in rainbow smelt (Osmerusmordax) and native forage fishes in northwestern Ontariolakes. Ecosystems 6:289–299.
Swanson, H. K., T. A. Johnston, D. W. Schindler, R. A.Bodaly, and D. M. Whittle. 2006. Mercury bioaccumulationin forage fish communities invaded by rainbow smelt(Osmerus mordax). Environmental Science and Technology40:1439–1446.
Thorp, J. H., and A. P. Covich. 1991. Ecology and classificationof North American freshwater invertebrates. Academic Press,New York, New York, USA.
Trudel, M., and J. B. Rasmussen. 1997. Modeling theelimination of mercury by fish. Environmental Science andTechnology 31:1716–1722.
Vander Zanden, M. J., and J. B. Rasmussen. 1996. A trophicposition model of pelagic food webs: impact on contaminantbioaccumulation in lake trout. Ecological Monographs 66:451–477.
Vander Zanden, M. J., and J. B. Rasmussen. 1999. Primaryconsumer d13C and d15N and the trophic position of aquaticconsumers. Ecology 80:1395–1404.
Vander Zanden, M. J., and J. B. Rasmussen. 2001. Variation ind15N and d13C trophic fractionation: implications for aquaticfood web studies. Limnology and Oceanography 46:2061–2066.
Wang, W., and R. S. K. Wong. 2003. Bioaccumulation kineticsand exposure pathways of inorganic mercury and methyl-mercury in a marine fish, the sweetlips Plectorhinchusgibbosus. Marine Ecology Progress Series 261:257–268.
Watras, C. J., R. C. Back, S. Halvorsen, R. J. M. Hudson,K. A. Morrison, and S. P. Wente. 1998. Bioaccumulation ofmercury in pelagic freshwater food webs. Science of the TotalEnvironment 219:183–208.
Werner, E. E., J. F. Gilliam, D. J. Hall, and G. G. Mittelbach.1983. An experimental test of the effects of predation risk onhabitat use in fish. Ecology 64:1540–1548.
Wiener, J. G., and D. J. Spry. 1996. Toxicological significanceof mercury in freshwater fish. Pages 297–339 in W. N. Beyer,G. H. Heinz, and A. W. Redmon-Norwood, editors.Environmental contaminants in wildlife: interpreting tissueconcentrations. Lewis, Boca Raton, Florida, USA.
Wiener, J. G., and T. H. Suchanek. 2008. The basis forecotoxicological concern in aquatic ecosystems contaminatedby historical mercury mining. Ecological Applications18(Supplement):A3–A11.
Wissing, T. E., and A. D. Hasler. 1971. Intraseasonal change incaloric content of some freshwater invertebrates. Ecology 52:371–373.
Wren, C. D., and H. R. MacCrimmon. 1986. Comparativebioaccumulation of mercury in two adjacent freshwaterecosystems. Water Research 20:763–769.
Wurtsbaugh, W., and H. Li. 1985. Diel migrations of azooplanktivorous fish (Menidia beryllina) in relation to itsprey in a large eutrophic lake. Limnology and Oceanography30:565–576.
Zar, J. H. 1999. Biostatistical analysis. Prentice-Hall, UpperSaddle River, New Jersey, USA.
COLLIN A. EAGLES-SMITH ET AL.A226Ecological Applications
Special Issue
Copyright © 2022 FDOKUMEN