The Impact of Achievement Goals on Cardiorespiratory Fitness: Does Self-Efficacy Make a Difference?

0
GROWTH AND CHANGE IN A PARADIGMATIC REGION:
IS IT SUSTAINABLE?
DOES PLANNING MAKE A DIFFERENCE?
DISSERTATION
Presented to the Graduate Council of Texas State University-San Marcos
in Partial Fulfillment of the Requirements
for the Degree
Doctor of PHILOSOPHY
by
James Vaughan, M.A.G.
San Marcos, Texas December 2006
1
GROWTH AND CHANGE IN A PARADIGMATIC REGION:
IS IT SUSTAINABLE?
DOES PLANNING MAKE A DIFFERENCE?
Committee Members Approved: ____________________________________ David Stea, Ph.D., Chair ____________________________________ Fred Day, Ph.D. ____________________________________ Richard Earl, Ph.D. ____________________________________ Kent Butler, Ph.D. Approved: __________________________________ J. Michael Willoughby Dean of the Graduate College
iii
ACKNOWLEDGEMENTS
I am very grateful to the members of my dissertation committee. My deep
appreciation goes to Dr. Stea for “taking me on” and to Dr. Day for inspiring me and
helping solidify my ideas. Thanks go to Dr. Earl for being so willing to help and to Dr.
Butler for his planning expertise and friendship.
I would also like to especially thank Emariana Taylor for her help and support in
focusing my thoughts, proof-reading chapter drafts, and putting up with my ups and
downs over the duration of writing this dissertation. And finally I wish to thank Rick
Young for reading the critical chapters and offering many good ideas to improve the
dissertation’s “readability.”
This manuscript was submitted on September 21, 2006.
iv
TABLE OF CONTENTS
Page ACKNOWLEDGEMENTS....................................................................................................... iii LIST OF TABLES..................................................................................................................... vii LIST OF FIGURES .................................................................................................................. viii ABSTRACT..................................................................................................................................x CHAPTER I. INTRODUCTION ................................................................................................1 Statement of the Research Problem Research Goals and Questions The Research Problem in the Context of the Study Area Significance of the Study Definitions – Some Words about “Urb” II. BACKGROUND OF THE STUDY AREA .......................................................14 Notable Physical Characteristics The Balcones Escarpment The Edwards Aquifer A History of Growth and Changer Water, Development, and Political Economy Austin San Antonio Vested Rights III. URBAN GROWTH AND CHANGE.................................................................40 Overview Urban Growth and Change
Approaches to the Study of Urban Growth and Change: Morphology and Complexity Continuity Amidst Change in American Urban Geography Theories and Models Relevant to the Research Urban Ecology Conflict Approaches
v
Other Relevant Models Sprawl Background The Debate – Is Sprawl Good, Bad, or Indifferent? The Costs of Sprawl Measuring Sprawl IV. PLANNING AND SUSTAINABILITY.............................................................67 Planning The Condition of Planning Planning Theories/Models Planning and Sprawl Sustainability The Sustainability Debate – Weak or Strong? Sustainability and Urban Growth and Change Measuring Sustainability Planning for Sustainable Urban Development
V. METHODOLOGY .............................................................................................90 Research Goals and Questions to be Answered The Study Areas Data Acquisition Operational Definitions Measurement and Quantitative/Map Analysis Sprawl Inequality Energy Flows Qualitative Analysis of Planning Policies Possible Conclusions
VI. PLANNING ANALYSIS .................................................................................108 Comprehensive Planning in Austin The Austin Tomorrow Planning Process Comprehensive Planning in San Antonio The Not-so-Comprehensive Comprehensive Plan Plan Analysis The Austin Tomorrow Plan The San Antonio Plan Summary and Comparison
VII. QUANTITATIVE AND MAP ANALYSIS.....................................................138 Sprawl
vi
The Location of Growth by Density Classification Planned vs. Unplanned Inside or Outside the Region’s Cities Socio-Economic Distance/Inequality Wealth: Income, Poverty, and House Value Race/Ethnicity – Segregation Indices Energy Flows Houses with Four or More Bedrooms Commuting Traffic Congestion Available Vehicles Concluding Comments
VIII. DISCUSSION OF RESULTS, AND CONCLUSION....................................172 Summary of Results Summary Discussion Sprawl Socio-Economic Distance/Inequality Energy Flows Framing the Results Overwhelming Forces: The Power of Growth Discussion of Results “New” Approaches/Ideas Reality Check – The Root of the Problem Conclusion
APPENDIX...............................................................................................................................194 REFERENCES .........................................................................................................................196
vii
LIST OF TABLES Table Page 1. Population Growth in the Corridor Region ........................................................................26 2. Operational Matrix .............................................................................................................94 3. Densities for Measuring Sprawl .........................................................................................95 4. Possible Results for Plan Analysis and Growth Outcomes in the Study Areas ...............107 5. Strength and Sustainability Analysis of the Austin Tomorrow Plan................................129 6. Strength and Sustainability Analysis of the San Antonio Land Use Plan........................134 7. Housing Units and Growth Rates by Sub-Region and Tract Classification.....................143 8. Housing Growth in the Region’s Cities and Unincorporated Areas: 1980 - 2000...........145 9. Percentage of Housing Units in City and County: 1970 to 2000 .....................................146 10. Coefficients of Variation for Household Income ...........................................................149 11. Dissimilarity Indices. Top: Black/Non-Hispanic White; Bottom: Hispanic/Non-
Hispanic White ...............................................................................................................156 12. Interaction Indices. Top: Black/NH White; Bottom: Hispanic/NH White ....................158 13. Isolation Indices. Top: Black; Middle: Hispanic; Bottom: NH White...........................159 14. Houses with Four or More Bedrooms ............................................................................163 15. Workers with Commute Times Greater than Forty-five Minutes ..................................165 16. Percentage of Occupied Housing Units with Three or More Cars.................................169
viii
LIST OF FIGURES
Figure Page 1. The Austin/San Antonio Study Region ..............................................................................13 2. Hill Country and Blackland Prairie in the Study Area .......................................................14 3. Left: Hill Country Scene in Hays County; Right: Blackland Prairie in Caldwell
County................................................................................................................................15 4. Left: Residential Development in the Hill Country West of New Braunfels; Right:
Residential Development in the Blackland Prairie East of New Braunfels.......................16 5. The Edwards Aquifer .........................................................................................................17 6. Barton Springs Pool............................................................................................................19 7. Plan of San Antonio: ca. 1777............................................................................................20 8. Plan of Austin: 1839...........................................................................................................21 9. Above: Population Growth Trends in the Corridor Region; Below: Population
Growth Trends in Austin, San Antonio, and the Rest of the Region.................................23 10. The Edwards Aquifer in Bexar County ............................................................................30 11. Encino Ridge ....................................................................................................................38 12. Comal County Housing Unit Density and Housing Unit Growth Rate ...........................95 13. Distribution of Household Income in the USA: 1967 and 2001 ......................................98 14. Travis County Houses with Four or More Bedrooms ....................................................100 15. Travis County Four or More Bedrooms Trend Line: 1970 to 2000...............................101 16. Austin’s Preferred Growth Corridor...............................................................................115 17. Disturbing Dots ..............................................................................................................123
ix
18. SuperPlanner ..................................................................................................................124 19. Housing Unit Density in 1980, 1990, and 2000 .............................................................141 20. Housing Unit Growth Rates by Census Tracts – 1980 to 2000......................................142 21. Regional Share of Total Housing Units for 1980 and 2000 ...........................................142 22. Share of Total Housing Units for Sub-Regions Based on 1980 Tract Classification ....143 23. Incorporated Cites in the Corridor Region .....................................................................144 24. City and County Tracts for Travis and Bexar Counties .................................................145 25. Housing Unit Proportions for Travis and Bexar Counties .............................................146 26. Density Classifications and Growth Rates for Travis and Bexar Counties....................147 27. Mean Household Income................................................................................................150 28. Poverty Level: Person Below the Poverty Level............................................................151 29. Coefficients of Variation for Mean Household Income: Austin and San Antonio ........152 30. Mean Household Income for Austin and San Antonio ..................................................153 31. House Value Ranked by Standard Deviation .................................................................154 32. Isolated Tracts in the Corridor Region ...........................................................................160 33. Isolated Tracts in Travis County (above) and the City of Austin (below) .....................161 34. Isolated Tracts in Bexar County (above) and the City of San Antonio (below) ............162 35. Percentage of Housing Units with Four or More Bedrooms by Census Tract...............164 36. Percentage of Workers with Commute Times Greater than Forty-five Minutes ...........166 37. Annual Delay-per-Traveler ............................................................................................167 38. Occupied Housing Units with Three or More Vehicles Available ................................170
x
ABSTRACT
GROWTH AND CHANGE IN A PARADIGMATIC REGION:
IS IT SUSTAINABLE?
DOES PLANNING MAKE A DIFFERENCE?
by
James W. Vaughan, M.A.G.
Texas State University-San Marcos
December 2006
SUPERVISING PROFESSOR: DAVID STEA
Over the years, geographers and planners have struggled with the patterns,
dynamics, and consequences of urban growth and change. The Austin-San Antonio
corridor in central Texas is, to modify Nijman’s term, a paradigmatic region which
clearly displays the fundamental features and trends of rapidly changing urban systems.
Rural land at and beyond the urban fringe, within this and other urban regions, is
undergoing rapid, sprawling growth. Sprawl impacts the use of resources, the
environment, transportation systems, and the way money is spent and time allocated. This
research examines change, whether the evolving patterns are sustainable, and the effects
xi
that comprehensive planning has on development in the Austin-San Antonio
paradigmatic region. Austin has a long history of promoting sustainable development
and Smart Growth, whereas the policy of San Antonio reflects almost the antithesis of
this philosophy. Do the growth dynamics and the resulting morphology of these two
urban systems reveal that “good” planning is effective, ineffective, or irrelevant? This
research builds upon the literature confirming ecological planning as a way to achieve
sustainable development, but not within the existing property rights regime. Geographers
can lead the way in a restructuring of values which includes personal responsibility and
recognition of the value of all aspects of the natural world, whether they have economic
value or not.
1
CHAPTER I
INTRODUCTION
Statement of the Research Problem
Over the years, geographers and planners have struggled with the patterns,
dynamics, and consequences of urban growth and change over time, and more recently as
it relates to sustainability. Urban growth in America mostly follows a sprawling,
amorphous morphology that is rapidly transforming rural land in the urban fringe into
suburban tracts, big-box-retail roof tops and parking lots, and exurban enclaves. This
form of growth negatively impacts the use of resources, the environment, and the way
money is spent and time allocated. The desire to move out and away, essentially
abandoning places for “greener pastures,” has resulted in an urban spatial geography that
takes the natural environment for granted, and reflects ever increasing socio-economic
distance, or what Platt (2004a, 13) describes as the “social pathology of inequality in
American society.” To help inform theory, make planning and policy more effective, and
improve decision-making, research into the outcomes of growth and change in urban
regions over defined time periods is necessary.
Research Goals and Questions
The goals of this research are to identify aspects and outcomes of growth and
change in an urban region located in central Texas – locally known as the Austin/San
2
Antonio corridor - to help determine whether growth and change in the region is
sustainable, and whether planning policies are reflected in growth outcomes. There are
two primary research questions related to achieving these goals. My first question is: Are
growth trends in the Austin/San Antonio region sustainable? Or, to put the question
another way: Does the evolution of sprawling urban growth in the Austin/San Antonio
region erode the natural and socio-cultural environments? The second question is: Does
comprehensive planning (as historically practiced in the region) promote sustainable
growth patterns? Or, to put the question another way: Do growth outcomes reflect
comprehensive plan policies related to promoting sustainable growth, if any?
The Research Problem in the Context of the Study Area
I have chosen the Austin-San Antonio corridor in central Texas because it is a
paradigmatic region which clearly displays the fundamental features and trends of
rapidly growing and changing urban systems in America (Nijman 2000). Much of the
growth in the region is spreading out into unincorporated and formerly rural areas on
large lots with on-site disposal systems, many located over the Edwards Aquifer recharge
zone. Increased numbers of personal vehicles and time spent in those vehicles has
pushed the region to the brink of air quality non-attainment. Water availability is an
increasingly critical factor for any development. Vast amounts of impervious cover for
parking lots and rooftops threaten water quality and exacerbate flooding problems in an
already flood-prone area.
This research examines change, whether the evolving patterns of urbanizing areas
are sustainable, and whether comprehensive planning has an effect on development in the
Austin-San Antonio paradigmatic region. Austin purportedly promotes so-called
3
sustainable development and Smart Growth, while San Antonio has the reputation of
being a “developer’s town” and grandfathers away efforts to protect trees and the
Edwards Aquifer, the region’s primary source of drinking water. I will relate growth and
change to comprehensive planning policies in the region, paying particular attention to
differences in planning paradigms between Austin and San Antonio to determine whether
either planning approach contributes to sustainable growth patterns. Do the growth
dynamics and resulting morphology of Austin and San Antonio reveal that
comprehensive planning is effective, ineffective, or is it (inadvertently) exacerbating the
problems of sprawl?
Significance of the Study
It is important to notice the trends and outcomes of growth and change in rapidly
growing American urban areas, not only as gauged by the quantity of growth (i.e.
economic and real estate development), but also in terms of the quality of growth and the
urban system’s ability to perpetuate itself over time. Many academicians and
practitioners alike argue that current urban growth trends are not sustainable, and
planning practice is seemingly ineffective at reversing this trend, thus new perspectives
and approaches are needed within the urban landscape to ensure the common future of
both humankind and its environment. Granted, there have been many models and
theories put forward to try and grasp the moving target that is urban growth and change,
and several of these theories inform the analysis in my research. Yet it seems there is still
a lack of either an epistemological framework or simply the wherewithal to understand
the consequences of urban processes - to verify whether urban policies and resultant
interventions actually lead to the intended effect, or whether they instead have

4
inadvertent (or even purposeful) results that degrade the urban web. The relationship
between urban planning goals and urban growth outcomes needs serious investigation in
order that planning policies can simultaneously accommodate economic growth while
improving - or at least not degrading - the socio-cultural and natural environments of
rapidly growing urban areas. Studies of the interrelationships among the environmental
and cultural characteristics of human settlements are crucial if planners, developers, and
policy-makers are to effectively apply an integrated perspective to sustainability while
planning for social, economic, and environmental change.
Of further significance, while this research is a case study of a particular region
and its two major cities, I will be exploring and identifying general (not idiosyncratic)
outcomes of spatial and demographic change across an urban region which is arguably a
paradigmatic urban system in the U.S.A. Calling for more comparative studies on the
urban condition, Nijman (2000) gives us the notion of the “paradigmatic city,” the city
(and/or urban region) that clearly displays the fundamental features and trends of wider
urban systems. Many urban areas are affected by trends that are presently manifested in
the paradigmatic city, such as global orientation of urban economies and a lack of locally
shared place-based identity. Within this context, analyzing social, economic, and
environmental variables over space and time in the Austin/San Antonio region can offer
new insights on the relationship between humans and nature in other urban settings, and
help determine the (in)effectiveness of land use planning policies. In this way, urban
theory, policy and praxis can all be improved.
Finally, there is a long history of studying change at the regional level (Geddes
1911; Mumford 1923; MacKaye 1940; Forman 1995). At this level, the environment,
5
economy and society coalesce. In other words, the region connects the local to the
global, and those seeking sustainable urban environments must think globally, act locally,
but plan regionally. Yet little sustainability literature exists at the regional scale, even
though it is this scale that is most important for effective planning and attaining
sustainability (Forman 1995). My study of the Austin/San Antonio region will add to the
limited literature which addresses sustainability at the regional scale.
Synopsis of the Dissertation Plan
This introductory chapter will conclude with a discussion of terminology
commonly used in urban research. In Chapter 2 Background of the Study Area, I will
look at the history of urban development in Austin and San Antonio, and discuss general
patterns of growth and change in each city and the corridor region, particularly since the
1970s. I will discuss growth over the Edwards aquifer, the dichotomy of the Hill Country
and the blackland prairie, and major development and planning issues.
I have divided the literature review into two chapters (Chapters 3 and 4) due to its
length and scope. For the review, I draw on the disciplines of geography, sociology,
ecology, and planning as they relate to urban morphogenesis, planning, and
sustainability. These three elements are the determining factors which drive my selection
of research variables. In both chapters I point out how urban morphology, sprawl (a
particular type of urban morphology), planning, and sustainability relate to my study,
provide a critical analysis of the relevant research, and discuss the status of current
knowledge.
In Chapter 3 Urban Growth and Change, I discuss approaches to the study of
urban growth and change, and then point out that continuity is a surprisingly significant
6
theme in American urban geography. I also cover urban theories and models relevant to
my research, including urban/human ecology, complexity, conflict theory, and
postmodernism. I conclude Chapter 3 with a discussion of sprawl, a specific pattern of
urban growth and change which has its own literature. I cover this topic in the context of
its socio-economic and environmental costs and the debate over whether it is truly an
undesirable pattern of land development.
In Chapter 4 Planning and Sustainability, I consider the condition and efficacy of
current urban planning practice in America, particularly the relationships between local
government land use planning policies, real estate development activities, and the
political economy. In this way, I set the stage for an analysis of planning effectiveness
within the context of the current political and economic state of America’s communities.
In this chapter, I address sustainability in the context of both modern American urban
development and urban planning as they apply to my study area. Further, I define the
meaning of sustainability and sustainable development, and examine how these terms are
applied to the urban context. I also outline the concept of the ecological footprint and
reveal how it helps inform the measurement of sustainability within my study area.
In the next chapter of this dissertation (Chapter 5 - Methodology) I outline my
research methodology. The chapter includes a review of the research questions to be
answered and a flowchart of the research model. I also define the different study areas,
variables and data acquisition, and how I will measure sprawl, economic distance, and
energy flows.
Chapters 6 and 7 consist of an analysis of comprehensive planning in Austin and
San Antonio, and an analysis of physical growth and change in the two cities and the
7
corridor region. In chapter 6, Planning Analysis, I evaluate the planning processes and
comprehensive plans in Austin and San Antonio, focusing on parallel planning efforts in
the 1970s that led to adopted plans in each city. In Chapter 7, Quantitative and Map
Analysis, I examine selected sustainability indicators to determine whether either city,
their extended Metropolitan Statistical Areas, and the corridor region as a whole are
moving toward or away from sustainable development patterns. In the final chapter,
Discussion and Conclusion, I will bring together my findings in the qualitative and
quantitative chapters and discuss them in light of the literature.
Definitions - Some Words about “Urb”
Some clarification of urban terminology is needed before I discuss the
background of the study area. Various words with the root “urb” are used both in the
literature and in this dissertation. The U.S. Census Bureau (2002) defines urban as “All
territory, population, and housing units located within urbanized areas and urban
clusters.” An urbanized area (UA) generally consists of a large, densely settled (1,000
people per square mile) central place, and adjacent densely settled (500 people per square
mile) census blocks that together have a total population of at least 50,000. An
urbanized cluster needs only a total population of 2,500. By default, rural is defined as
territory, population and housing units not classified as urban. Urban and rural
(farm/non-farm) classifications cut across metropolitan and non-metropolitan areas.
However, my study involves research into a region, which is not specifically defined by
the Census Bureau, but which I define based on the literature and the level of commuting
between census tracts.
8
My study examines the Austin/San Antonio region as well as Austin and San
Antonio – the central cities in the two Metropolitan Statistical Areas (MSAs). The region
includes not only urban areas and clusters but also suburban and exurban areas (fringe
areas) within the urban fields of the two primary cities. Much of the growth analyzed in
this study is occurring in these suburban and exurban areas, some outside city limits and
extraterritorial jurisdictions, and also outside the MSA boundaries.
Suburbs are not a new phenomenon. In 1854 James Cole and Son, promoting the
first commuter suburb Brooklyn Heights, advertised lots “close to the New York stock
exchange but easier to reach thanks to the ferry” (Jackson 1985, 68). Other advertised
advantages included lower taxes and cheaper lots, two factors which still drive sprawling
development. An important aspect of the suburban phenomenon is that globalization
forces related to the transition to a post-industrial economy have accelerated the suburban
transformation of the American city, which Muller (1997) claims has turned inside out
since the 1970s, the beginning of my study period. Today’s intra-metropolitan social
organization is increasingly polycentric and “splitting asunder into a set of increasingly
self-contained realms …the metropolitan ring is becoming a true outer city, whose
increasingly independent realms are decidedly no longer ‘sub’ to the ‘urb’ at the core that
spawned them (Muller 1997, 47).” This “new” urban form promises the kind of living
and working environments people purportedly want, but has the problem of increasing
differentiation among communities, and among socio-economic classes within
communities. While suburbs may be the quintessential physical achievement of the U.S.,
they are also the “quintessential embodiment of Leave it to Beaver values: conspicuous
consumption, reliance upon the private automobile, upward mobility, the separation of
9
the family into nuclear units, the widening division between work and leisure, and a
tendency toward racial and economic exclusiveness” (Jackson 1985, 212). The new ideal
is no longer to be part of a close community, but to have a self-contained unit, a “private
wonderland walled off from the rest of the world” (Schmitt 1969, 182).
A more recent urban geographic phenomenon is growth in exurban areas.
Exurban is a term first coined by Spectorsky (1955, 6) who wrote:
The word ‘exurb’ (and its derivatives ‘exurban’ and ‘exurbanite’) carries no connotation of something that has ceased to be, or something in the past; rather, what is intended is a clarification of something extra that has characterized the journey of the exurbanite, out and away from the city, in a wistful search for roots, for the realization of a dream, for a home.
A characteristic of exurban households is that the inhabitants are typically more highly
educated and earn more income than the MSA average. Nelson and Dueker (1990)
define exurban counties as being within 80 miles of an outer circumferential limited
access highway or within 100 miles of the center of a central city, and either inside or
outside MSAs. Their county-level definition misses the fine scale of exurban
development, but I overcome this problem in my research by using census tracts as the
units of analysis.
Exurban growth is dynamic and occurs at the urban-rural interface, which has
variously been called the fringe, edge, or periphery (Friedmann and Miller 1965; Pryor
1968; Foot 2000). Fringe growth is nothing new, but the scale of it has increased. There
has been a massive extension in the space covered by urban landscapes of various types.
Urbanity is now “a potential quality of all inhabited places and no longer a dimension
based upon the link between buildings and a certain geographic area” (Foot 2000, 18).
The U.S. Census (2002) defines the urban fringe as those areas that have densities of at
10
least 1,000 people per square mile and that are more or less within 1.5 road miles of an
urban core. This census definition has the drawback of presenting a vision of continuous
growth while the reality of fringe growth is one “of a great deal of interpenetration, much
of it rather fine-grained” (Theobald 2001, 549). Thomas (1990, 131) notes that “like the
poor, the rural-urban fringe we have always had with us” since civilization emerged 6000
years ago and settlements gradually began to expand. The first use of the term urban
fringe was T. L. Smith’s (1937) discussion of built-up areas just outside the corporate
limits of cities in Louisiana. According to Pryor (1968), the fringe is the residual zone
between two more readily defined poles, the urban center and its rural hinterland. In an
exhaustive survey of fringe literature, Pryor (1968, 206) developed the following rather
lengthy definition:
It is a residual zone between two more readily defined poles – a continuum. The rural-urban fringe is the zone of transition in land use, social and demographic characteristics, lying between (a) the rural hinterland, characterized by the almost complete absence of nonfarm dwellings, occupations and land use, and of urban and rural social orientation; an incomplete range and penetration of urban utility services; uncoordinated zoning or planning regulations; area extension beyond although contiguous with the political boundary of the central city; and an actual and potential increase in population density, with the current density above that of surrounding rural districts but lower than the central city.
In the Austin/San Antonio corridor region, fringe areas generally have no zoning,
houses are newer, and residents and homebuilders are beyond the control of an
incorporated city. In fact, the only land use planning-related powers in fringe
areas are the weak subdivision platting regulations of Texas counties.
Primary reasons for moving to the fringe are the search for privacy and less traffic
congestion, and the quest for amenity environments, or: “. . . expanded lifestyles
11
associated with post industrial society and the urban field . . . characterized by a number
of singular concurrent attributes such as scenery, historical integrity and rural sentiment”
(Coppack 1988, 356). The reasons for the choice of a particular site are suitability of the
house (big) and desirable lot size (big) (Vogt and Marans 2004). Factors affecting the
development of a particular site are physical characteristics (views, trees and water),
regulatory measures (minimal), characteristics of the original rural landowners (need to
sell), availability of public services, site accessibility, and developer initiative (Lee 1979).
Residents of the fringe commute to work, have an exclusionary social orientation, and are
characterized by a low degree of community participation, all elements that are analyzed
in my research.
But is the term fringe adequate to capture the essence of current growth patterns
in rapidly growing areas? The term (fringe) connotes an edge, but, with apologies to
Garreau (1991), Sunbelt urban growth seems edgeless. In reality, there is no longer a
“simple, uninterrupted march of metropolitanization across a rural landscape” but rather
the existence of a “complex rural-area pattern evolving around corridors and hierarchical
sets of nonmetropolitan cities” (Taffe, Krakover, and Gauthier 1992, 503). As a result,
the term urban field may be more meaningful to understanding the patterns of growth in
the Austin/San Antonio corridor. The urban field has variously been called metropolitan
region, spread-city, megalopolis, and ecumenopolis (Gottman 1961; Doxiadis 1965).
Freidmann and Miller (1965, 313) claim the urban field is “the new ecological unit of
America’s post-industrial society.” The paradigmatic urbanizing area is no longer a
physical entity, but a pattern of point locations and connecting flows of people,
information, money and commodities - a matrix in which living patterns, planning, and
12
growth forces can result in “the desecration of the landscape, in grey formlessness, the
spoliation of resources” (Freidmann and Miller 1965, 320). The urban field concept fits
within the paradigm of complexity and general systems theory accepted in my research.
In actuality, the urban field is MacKaye’s (1940, 350) region: “… something more than
area, it is area or seat of movement; it is what the dictionary calls a sphere (‘a circuit or
range of action or influence’).” A range of action can include the flow of water,
commodities, and/or people. Similarly, the urban field is Geddes’ valley section (i.e.
valley region): characterized by “a strong connection of three major elements – physical
environment, occupations, and settlement types – as each influences the other” (Welter
2002, 61). The delineation of my study area will be based on this notion of the urban
field.
My study area includes the Austin MSA which consists of 5 counties (Travis,
Caldwell, Hays, Williamson and Bastrop), the San Antonio MSA which consists of 4
counties (Bexar, Comal, Guadalupe and Wilson), and certain census tracts in four other
counties (Atascosa, Medina, Bandera, and Kendall). For more historical analysis (pre
1970 or 1980) I will include all of Atascosa, Medina, Bandera and Kendall counties. The
rationale and methodology for the areas included in the study are explained in depth in
Chapter 5. The reader should be aware that there is a defined Austin San Antonio
“Corridor” that includes all nine of the MSA counties plus Bell County to the north.
However, when I refer to the Austin/San Antonio corridor, I am referring to my study
region as illustrated in Figure 1. For purposes of clarification, when I refer to this defined
study area, I will capitalize the term “Corridor Region.”

13
Figure 1. The Austin/San Antonio Study Region.
14
CHAPTER II
BACKGROUND OF THE STUDY AREA
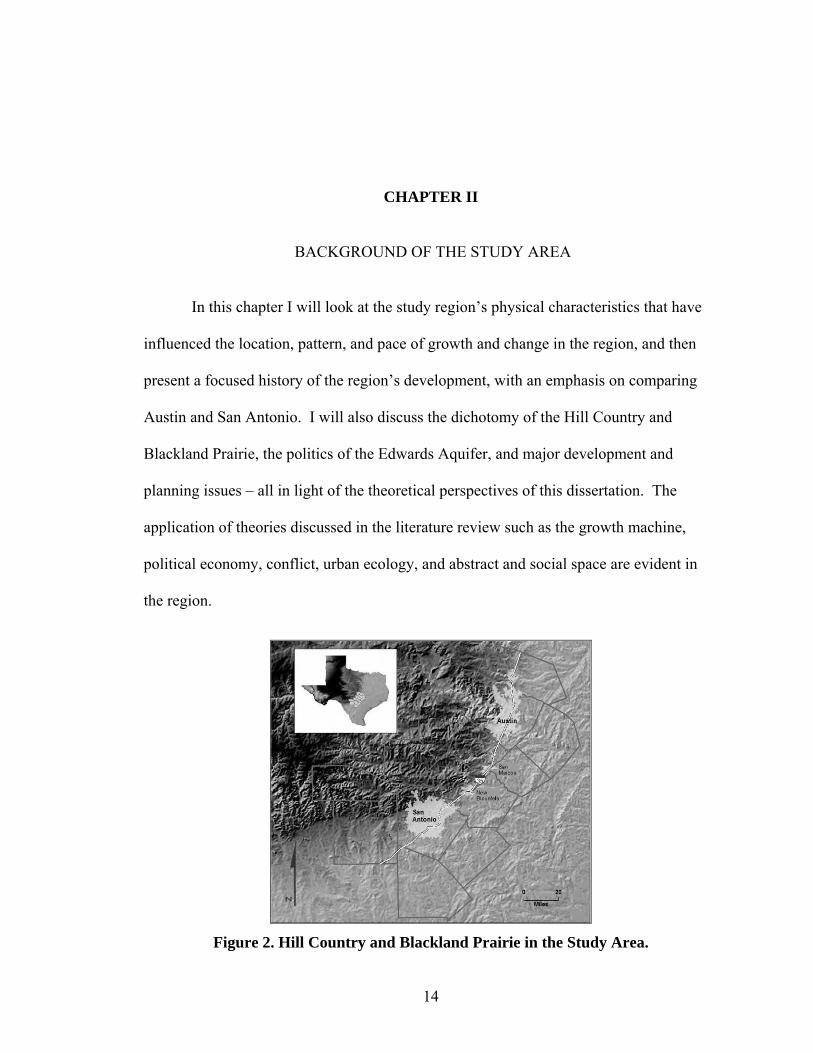
In this chapter I will look at the study region’s physical characteristics that have
influenced the location, pattern, and pace of growth and change in the region, and then
present a focused history of the region’s development, with an emphasis on comparing
Austin and San Antonio. I will also discuss the dichotomy of the Hill Country and
Blackland Prairie, the politics of the Edwards Aquifer, and major development and
planning issues – all in light of the theoretical perspectives of this dissertation. The
application of theories discussed in the literature review such as the growth machine,
political economy, conflict, urban ecology, and abstract and social space are evident in
the region.
Figure 2. Hill Country and Blackland Prairie in the Study Area.
15
Notable Physical Characteristics
The Balcones Escarpment
The most notable physiographic feature of the Corridor Region is the Balcones
Escarpment, the “topographic expression” of a geologic fault zone that extends
northeastward from San Antonio through Austin, separating the area into two distinct
landscapes: the Hill Country/Edwards Plateau to the west and the Blackland Prairie to the
east (Figures 2 and 3). Indeed, the escarpment marks the break between “two grand
physiographic divisions of North America: the Great Plains Province to the West and the
Coastal Plains on the East” (Abbott and Woodruff 1986). Referring to San Antonio (but
applicable to the entire Corridor Region), Petersen (2001, 17) notes that the city is “an
environmental crossroads” lying just east of the climatic transition between the humid
east and the arid west. Annual precipitation ranges from 39 inches in eastern areas of the
region to 22 inches in western parts of the region. The escarpment is the first topographic
break inland from the Gulf of Mexico and thus is a major weather maker acting as an
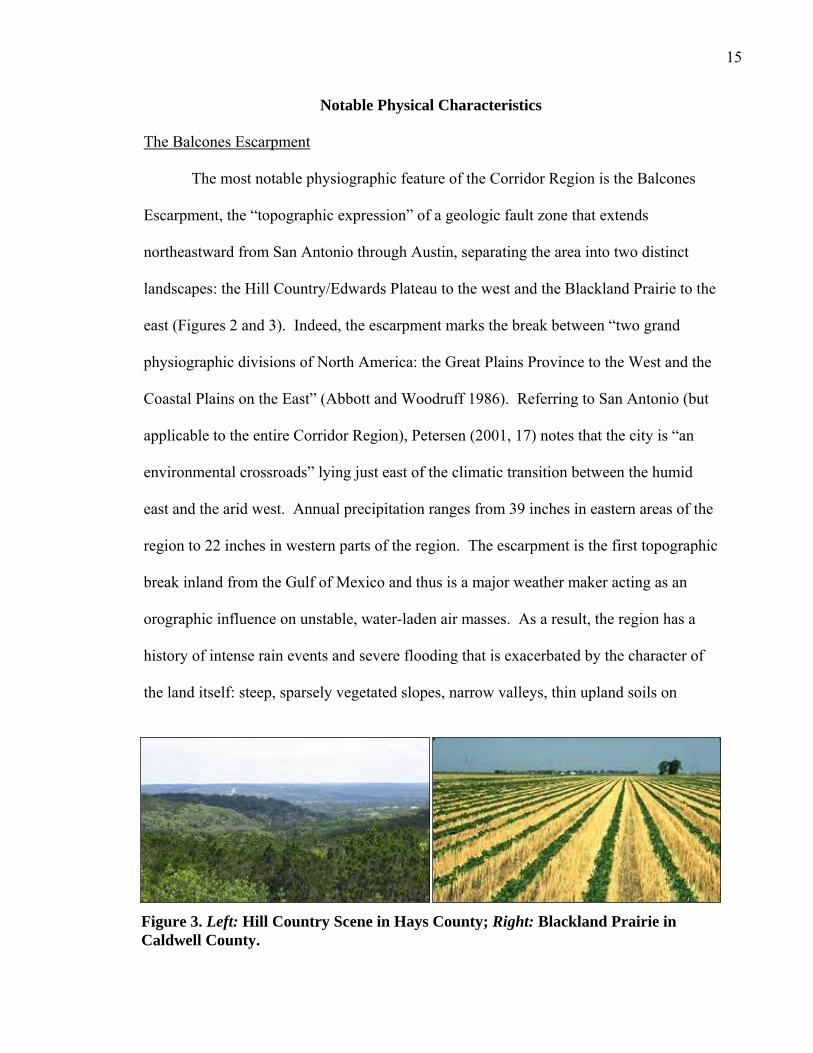
orographic influence on unstable, water-laden air masses. As a result, the region has a
history of intense rain events and severe flooding that is exacerbated by the character of
the land itself: steep, sparsely vegetated slopes, narrow valleys, thin upland soils on
Figure 3. Left: Hill Country Scene in Hays County; Right: Blackland Prairie in Caldwell County.

16
limestone bedrock, and soils with low infiltration capacity; and by man-made changes
related to development: impervious cover, stream channel modification, and development
adjacent to or in the floodplain (Abbott and Woodruff 1986). Some claim that land-use
practices alone can increase central Texas peak flood discharges by as much as three-
hundred percent (Espey, Morgan, and Masch 1966). In fact, stormwater management is a
major planning issue addressed by the region’s cities and counties.
Since the mid 1800’s the Balcones Escarpment has also marked a cultural break
from the cotton economy of the Old South to the ranching and cattle economy of the Old
West (Abbott and Woodruff 1986). It is a line where the American west really begins, an
image that holds today in marketing for large lot subdivisions with names like Kicking
Horse Estates, Laurel Canyon Ranch, Buffalo Crossing, Saddle Ridge, and Stallion
Estates. This east-west dichotomy is perhaps even more evident today in that the Hill
Country is the location of choice for high-dollar residential developments, whereas tract
developments are more prevalent in the prairie lands to the east (Figure 4). Rapid
development and sprawling growth patterns have varied impacts that will be discussed in
Chapter Four, but the rural to urban transformation of the Hill Country is especially
problematic due to another distinctive physical feature in the region, the Edwards
Aquifer.
Figure 4. Left: Residential Development in the Hill Country West of New Braunfels; Right: Residential Development in the Blackland Prairie East of New Braunfels.

17
The Edwards Aquifer The Balcones Escarpment created favorable sites for settlements, not only
because people could draw on two economies, but also because of the dependable water
supply provided by the springs that issued forth along the Balcones fault zone (Abbott
and Woodruff 1986). These springs provided a power source for flour mills, grist mills,
and saw mills, and were influential in the settling of both Austin and San Antonio, as well
as other towns located along the escarpment such as New Braunfels, San Marcos, and
Georgetown (See Figure 1 above). The Comal and San Marcos Springs provide not only
a portion of water for downstream interests in the Guadalupe River basin, but also aquatic
habitat for a number of threatened or endangered species: the San Marcos gambusia,
fountain darter, Texas blind salamander, and Peck’s cave amphipod (Texas Parks and
Wildlife 2005).
The water source for the springs along the escarpment is the Edwards Aquifer
(Figure 5), one of the most permeable and productive aquifers in the United States
Figure 5. The Edwards Aquifer.
18
(Naismith Engineering Inc. 2005). The Edwards is a karst aquifer characterized by
extremely high porosity and permeability, the presence of sinkholes, sinking streams,
caves, and a well-integrated subsurface drainage system. All aquifer recharge occurs at
the surface outcrop of the Edwards formation (the recharge zone), an area under intense
residential and commercial development pressures (Naismith Engineering Inc. 2005).
Because development removes natural vegetation and increases impervious cover, and
because fissures in the limestone provide very little filtration, there is great concern for
pollution of the aquifer from urban runoff. Water quality begins to be significantly
impacted when the amount of impervious cover in a watershed is greater than five to
eighteen percent (Marsh and Hill-Rowley 1989). Human activity, fertilizers, domestic
wastewater collection, treatment and discharge add to the threat. Excessive pumping and
diversion can cause springs and seeps to dry up resulting in loss of habitat, water
intrusion into groundwater, and reduction of streamflow necessary to sustain downriver
interests (Vottler 1998). These threats can be mitigated with comprehensive planning,
low-impact development, open space, the use of Transfers of Development Rights
(TDRs), site planning, pre-development review, location of development, intensity of
development, structural Best Management Practices (BMPs), and other planning tools.
Differences in hydrogeologic characteristics allow division of the aquifer into
three distinct regions: 1) the San Antonio segment, extending 175 miles from
Brackettville in Kinney County to north Hays County and the source of water for over 1.7
million people; 2) the Barton Springs segment-Austin area, extending from Kyle in Hays
County to the Colorado River in downtown Austin; and 3) the northern segment - Austin
area, underlying parts of Travis and Williamson counties and supplying water to the
19
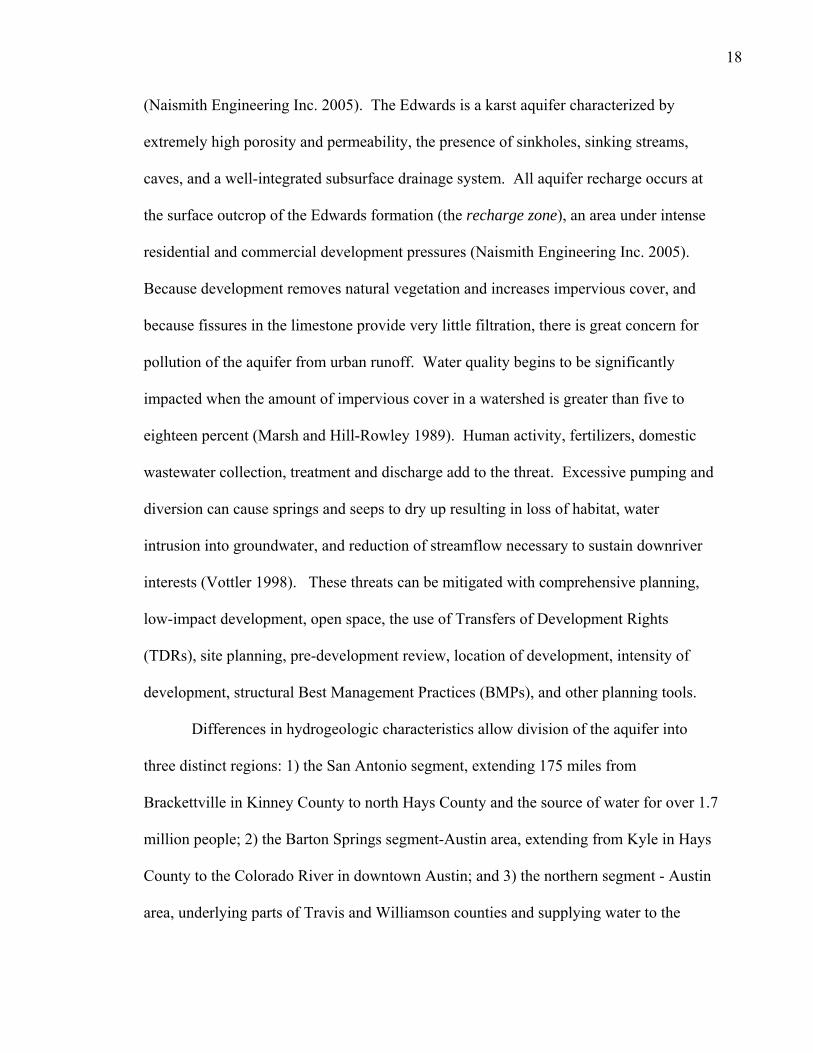
rapidly growing cities of Round Rock and Georgetown. The natural discharge for the
Barton Springs segment occurs mainly in Austin’s Zilker Park at Barton Springs, the
largest natural swimming pool in an urban area in the USA, and highly revered as a
symbol of the city’s sense of place (Figure 6). Indeed, “for many Austinites, there is no
better benchmark of environmental quality than the purity of Barton Springs Pool and its
aquifer” (Butler 1987, 285). The Texas Commission for Environmental Quality named
the Barton Springs segment of the Edwards Aquifer the most pollution-prone aquifer in
the state (Texas Water Commission 1989). Both the quantity and quality of water in the
Edwards Aquifer is critical to the future of the Corridor Region. Struggles over limiting
withdrawals from the aquifer, as well as limiting development over the recharge zone, are
part of the socio-economic and environmental forces at work in the region, and will be
covered later in this chapter. Regardless, these struggles are a result of the region’s rapid
population growth.
Figure 6. Barton Springs Pool.
20
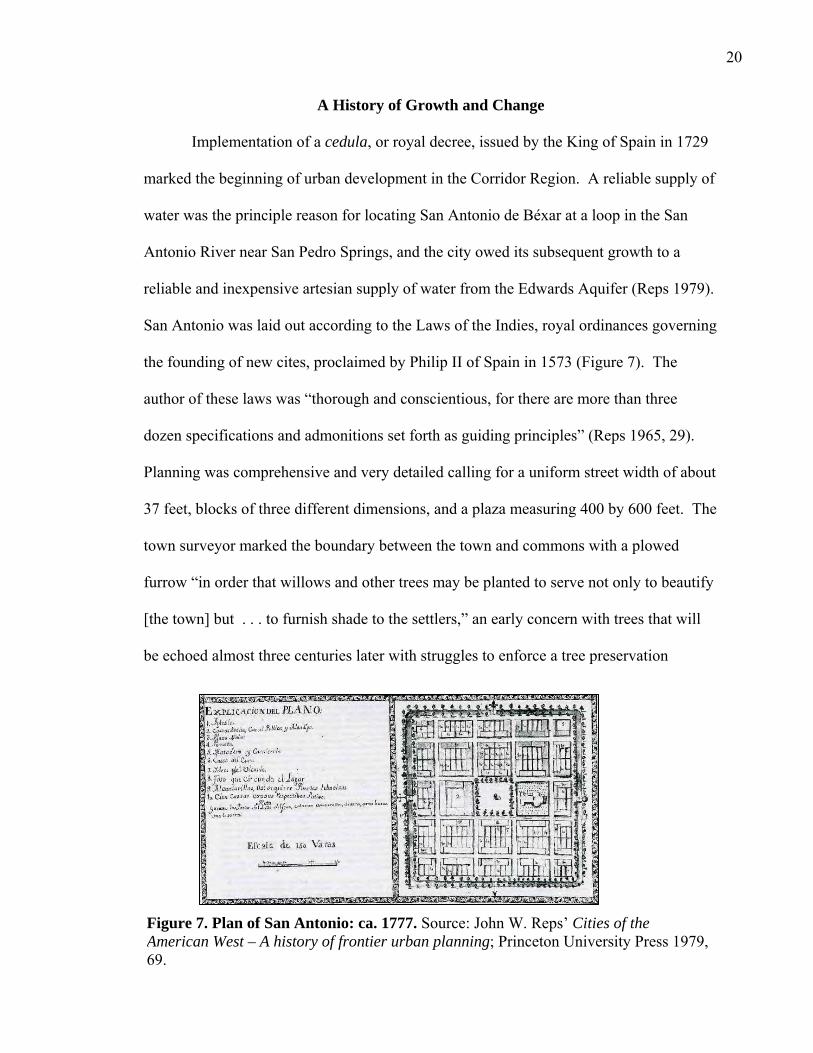
A History of Growth and Change
Implementation of a cedula, or royal decree, issued by the King of Spain in 1729
marked the beginning of urban development in the Corridor Region. A reliable supply of
water was the principle reason for locating San Antonio de Béxar at a loop in the San
Antonio River near San Pedro Springs, and the city owed its subsequent growth to a
reliable and inexpensive artesian supply of water from the Edwards Aquifer (Reps 1979).
San Antonio was laid out according to the Laws of the Indies, royal ordinances governing
the founding of new cites, proclaimed by Philip II of Spain in 1573 (Figure 7). The
author of these laws was “thorough and conscientious, for there are more than three
dozen specifications and admonitions set forth as guiding principles” (Reps 1965, 29).
Planning was comprehensive and very detailed calling for a uniform street width of about
37 feet, blocks of three different dimensions, and a plaza measuring 400 by 600 feet. The
town surveyor marked the boundary between the town and commons with a plowed
furrow “in order that willows and other trees may be planted to serve not only to beautify
[the town] but . . . to furnish shade to the settlers,” an early concern with trees that will
be echoed almost three centuries later with struggles to enforce a tree preservation
Figure 7. Plan of San Antonio: ca. 1777. Source: John W. Reps’ Cities of the American West – A history of frontier urban planning; Princeton University Press 1979, 69.
21
ordinance (Reps 1979, 66).
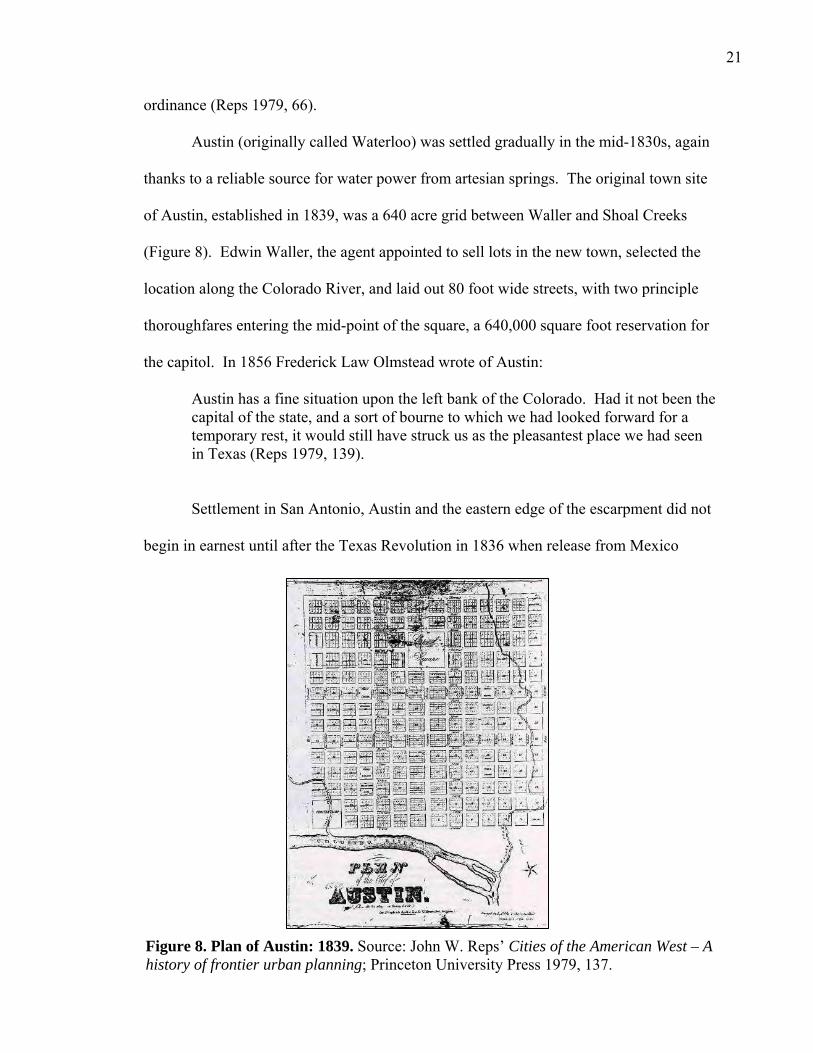
Austin (originally called Waterloo) was settled gradually in the mid-1830s, again
thanks to a reliable source for water power from artesian springs. The original town site
of Austin, established in 1839, was a 640 acre grid between Waller and Shoal Creeks
(Figure 8). Edwin Waller, the agent appointed to sell lots in the new town, selected the
location along the Colorado River, and laid out 80 foot wide streets, with two principle
thoroughfares entering the mid-point of the square, a 640,000 square foot reservation for
the capitol. In 1856 Frederick Law Olmstead wrote of Austin:
Austin has a fine situation upon the left bank of the Colorado. Had it not been the capital of the state, and a sort of bourne to which we had looked forward for a temporary rest, it would still have struck us as the pleasantest place we had seen in Texas (Reps 1979, 139).
Settlement in San Antonio, Austin and the eastern edge of the escarpment did not
begin in earnest until after the Texas Revolution in 1836 when release from Mexico
Figure 8. Plan of Austin: 1839. Source: John W. Reps’ Cities of the American West – A history of frontier urban planning; Princeton University Press 1979, 137.

22
allowed almost “unrestricted individual initiative” (Handbook of Texas Online 2005). At
this time land west of the Balcones Escarpment was free of Anglo influence, but when
Olmstead visited in the mid 1850’s, he noted that the area was dotted with farmsteads –
one of the earliest indicators of the region’s rapid growth and change. By the 1860s land
in farms had increased greatly, from 73,300 to 1,363,500 acres in Travis County alone.
Several ethnic groups settled in the region, but the most influential were Germans who
founded the City of New Braunfels. In New Braunfels each settler was to have one-half
acre in town and ten acres within walking distance, so that these yeoman farmers could
live in town and work their nearby lands (Reps 1979). However, with increasing
population, this nuclear village concept quickly broke down; good lands within
reasonable walking distance were spoken for so new arrivals began looking farther afield
for farmlands, occupying the alluvial valleys in the hills to the west of the escarpment.
Common elements driving urbanization in the region included promotion by land
speculators, favorable transportation (railroads), and political boosterism. By the late
nineteenth century San Antonio had expanded well beyond the limits of the San Antonio
River loop, and developers broke with the tradition of the grid and incorporated curving
streets and irregular blocks into their subdivisions. Austin’s existence and growth was
nourished by politics and higher education; in 1872 the city officially became the state
capital, and in 1881 it was chosen as the site for the University of Texas. The preeminent
civic booster of that time, Alexander Woolridge, promoted construction of a dam on the
Colorado River to generate electricity and stimulate growth. The dam was completed in
1893 but collapsed seven years later due to siltation behind it – an early example of the
consequences of the oft-times disparate goals of economic development and
23
environmental well-being. In the early part of the twentieth century Austin grew slower
than most other Texas cities, becoming a mostly residential city. A second dam was
completed in 1940 creating twenty-one mile long Lake Austin; just upriver to the
northwest, another dam (Mansfield) created Lake Travis. Land along both lakes would
become highly desirable for up-scale residential development.
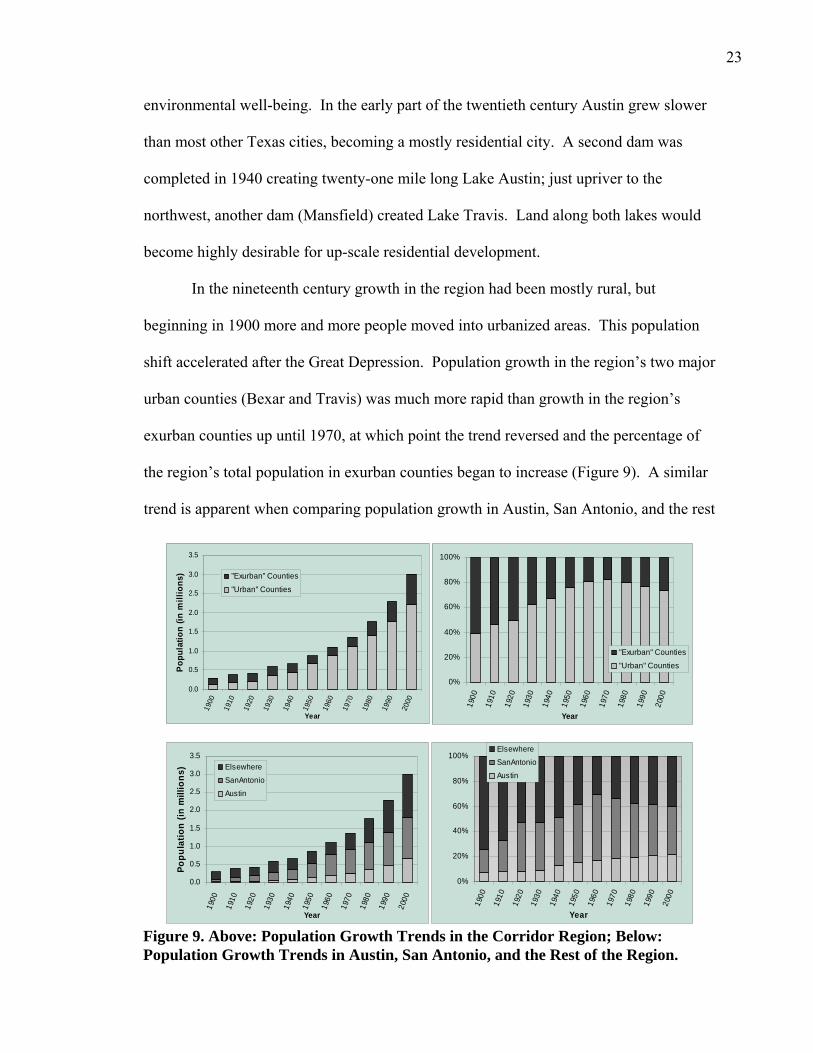
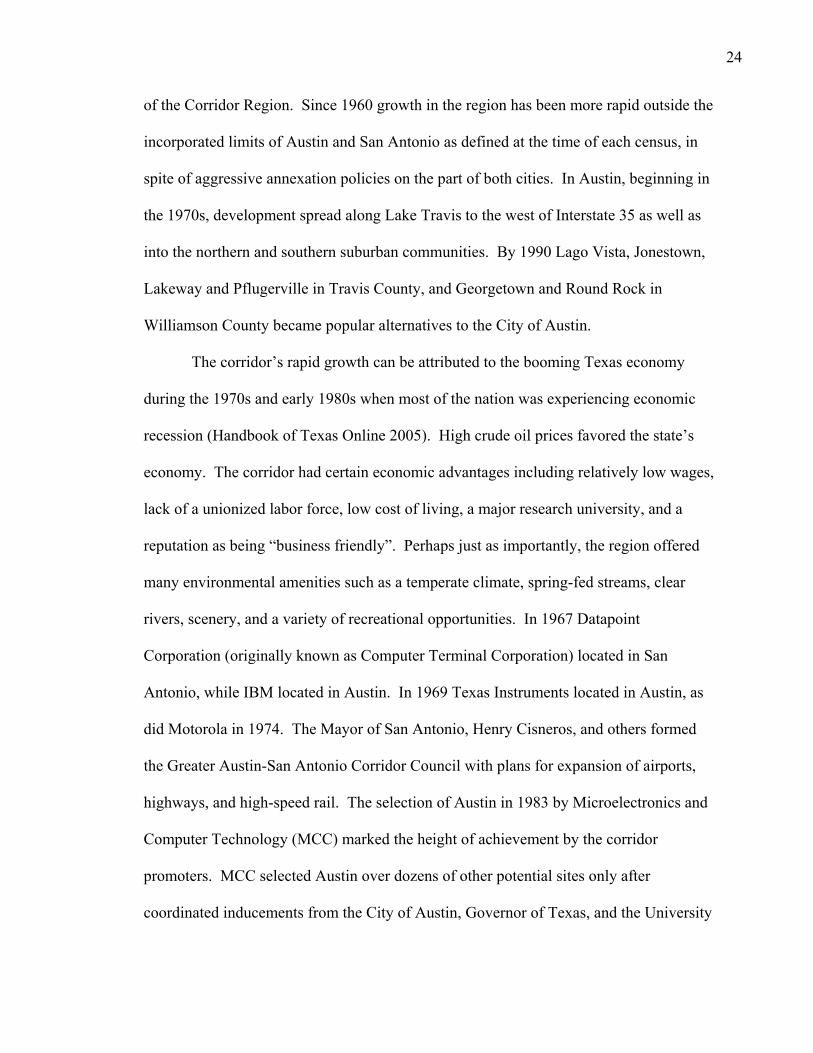
In the nineteenth century growth in the region had been mostly rural, but
beginning in 1900 more and more people moved into urbanized areas. This population
shift accelerated after the Great Depression. Population growth in the region’s two major
urban counties (Bexar and Travis) was much more rapid than growth in the region’s
exurban counties up until 1970, at which point the trend reversed and the percentage of
the region’s total population in exurban counties began to increase (Figure 9). A similar
trend is apparent when comparing population growth in Austin, San Antonio, and the rest
Figure 9. Above: Population Growth Trends in the Corridor Region; Below: Population Growth Trends in Austin, San Antonio, and the Rest of the Region.
0.0
0.5
1.0
1.5
2.0
2.5
3.0
3.5
1900
1910
1920
1930
1940
1950
1960
1970
1980
1990
2000
Year
Popu
latio
n (in
mill
ions
) Elsewhere
SanAntonioAustin
0%
20%
40%
60%
80%
100%
1900
1910
1920
1930
1940
1950
1960
1970
1980
1990
2000
Year
ElsewhereSanAntonioAustin
0.0
0.5
1.0
1.5
2.0
2.5
3.0
3.5
1900
1910
1920
1930
1940
1950
1960
1970
1980
1990
2000
Year
Pop
ulat
ion
(in m
illio
ns) "Exurban" Counties
"Urban" Counties
0%
20%
40%
60%
80%
100%
1900
1910
1920
1930
1940
1950
1960
1970
1980
1990
2000
Year
"Exurban" Counties
"Urban" Counties
24
of the Corridor Region. Since 1960 growth in the region has been more rapid outside the
incorporated limits of Austin and San Antonio as defined at the time of each census, in
spite of aggressive annexation policies on the part of both cities. In Austin, beginning in
the 1970s, development spread along Lake Travis to the west of Interstate 35 as well as
into the northern and southern suburban communities. By 1990 Lago Vista, Jonestown,
Lakeway and Pflugerville in Travis County, and Georgetown and Round Rock in
Williamson County became popular alternatives to the City of Austin.
The corridor’s rapid growth can be attributed to the booming Texas economy
during the 1970s and early 1980s when most of the nation was experiencing economic
recession (Handbook of Texas Online 2005). High crude oil prices favored the state’s
economy. The corridor had certain economic advantages including relatively low wages,
lack of a unionized labor force, low cost of living, a major research university, and a
reputation as being “business friendly”. Perhaps just as importantly, the region offered
many environmental amenities such as a temperate climate, spring-fed streams, clear
rivers, scenery, and a variety of recreational opportunities. In 1967 Datapoint
Corporation (originally known as Computer Terminal Corporation) located in San
Antonio, while IBM located in Austin. In 1969 Texas Instruments located in Austin, as
did Motorola in 1974. The Mayor of San Antonio, Henry Cisneros, and others formed
the Greater Austin-San Antonio Corridor Council with plans for expansion of airports,
highways, and high-speed rail. The selection of Austin in 1983 by Microelectronics and
Computer Technology (MCC) marked the height of achievement by the corridor
promoters. MCC selected Austin over dozens of other potential sites only after
coordinated inducements from the City of Austin, Governor of Texas, and the University
25
of Texas. With the founding of Dell Computer in 1984 forty percent of Austin’s non-
government work-force was employed in high-tech occupations (twice that of Dallas and
seven times that of Houston). In the 1990s there were 400 high-tech manufacturers in the
Austin area. This growth in high tech industry paralleled growth at the University of
Texas which in 2000 employed 21,000 people and had over $300 million in research
grants (Handbook of Texas Online 2005). San Antonio, with less university influence
and a lower wage scale, was more oriented toward traditional assembly-type industry,
tourism, and employment related to five military bases located in the area. Mayor
Cisneros wanted to make the city a center of high-tech manufacturing, as opposed to the
research focus of Austin.
After relocation of MCC to the Hill Country northwest of Austin, land prices in
the immediate area doubled and tripled overnight. A definite change in perception
developed rather quickly toward the Blackland Prairie land on one hand and Hill Country
land on the other. Cities located along the Balcones Escarpment can encourage growth
either in the Hill Country to the west or the Blackland Prairie to the east. Ecological
considerations, conservation of wildlife habitat, and protection of the Edwards Aquifer
are compelling reasons against development in the hills. Attempts by Austin and San
Antonio to discourage urban sprawl into the hills by withholding water have met with
limited success because developers have found that services can be purchased from the
regional river authority, or property owners can provide their own water with individual
wells. Since the 1970s there has been greater demand for non-agricultural land for
weekend retreats, and suburban/exurban lots with a view. As a result, Hill Country land

26
has replaced prairie land as the high-dollar location and prestigious address in central
Texas real estate.
From 1970 to 2000 the Corridor Region’s population increased by 120 percent.
This can be broken down as follows: Austin’s population increased by 162 percent, San
Antonio’s population by 75 percent, and the region’s population outside the Austin and
San Antonio city limits by 162 percent (Table 1). During this period Austin’s
incorporated land area grew more than 258 percent (from 72.1 to 258.4 square miles),
and San Antonio’s incorporated area grew by 124 percent (from 184.0 to 412.1 square
miles). From 1974 to 2003 urban/developed land in the Austin MSA increased by 1.5%
annually (141,222 to 216,306 acres) while agricultural land declined by 1.8% annually
(from 1,180,985 to 706,828 acres) (Sherrouse et al. 2005). Metropolitan Statistical Area
(MSA) density decreased as people spread out to suburban and exurban locations. In the
Austin/Round Rock MSA density decreased from 9.1 persons per acre in 1983 to 4.3
persons per acre in 2000. Between 1990 and 2002 the City of Austin’s road network
increased 32 percent in lane miles. The rural-urban interface (the length of undeveloped
land adjoining urban land) also increased: edge length per urban cluster increased from
1,441 meters in 1983 to 3,095 meters in 2000 (Sherrouse et al. 2005).
Table 1. Population Growth in the Corridor Region. Source: U.S. Census. 1970 2000 % Change Corridor Region Austin San Antonio Outside Austin/San Antonio
1,365,801 251,808 654,153 459,840
3.004,031 656,562
1,144,646 1,202,823
120.0 161.7 75.0 161.6
27
However, beginning in the 1970s, rapid population growth in the region and its
effect on the landscape met with resistance. The stories of how San Antonio and Austin
have dealt with or plan to deal with the impacts of rapid growth on the Edwards Aquifer
illustrate the differences in their attitudes toward planning and growth management. In
the next section I will compare the two city’s approaches and set them within the
theoretical context to be presented in the literature review.
Water, Development and Political Economy
There is a false naiveté overlooking the communality of the Edwards Aquifer and its vulnerability to the collective effects of individual actions. The Edwards region has finally reached the point where the aquifer is unable to provide for the needs of all those who depend upon it during dry years…without a fundamental change in the value the region places on fresh water, a major effort to conserve and reuse aquifer water, and implement plans to import supplemental supplies of water, the region’s quality of life and economic future is imperiled
Sierra Club v. San Antonio, No MO-96-CA-097, slip op. at 1 (W.D. Tex. Aug. 23, 1996) – from the order mandating Federal management of the aquifer
The lines between proponents of rapid, minimally managed growth and advocates
of slower, more managed growth “seem to have been more clearly drawn in Austin than
in San Antonio” (Abbott and Woodruff 1986, 160). San Antonio is known in
construction and development circles as a “good place to do business” (Palmer 1986,
160). Austin has moved in a different direction, earning a reputation with developers as
overly regulated and difficult to deal with. In spite of this, since 1970 Austin’s growth
rate has been more than twice that of San Antonio’s.
Austin
Austin’s rapid population growth in the 1970s and the sprawling pattern of the
accompanying development west, north and south of the city prompted the creation and
adoption in 1979 of the Austin Tomorrow Comprehensive Plan with goals and objectives
28
that called for the development and implementation of a series of innovative (at the time)
watershed protection ordinances (City of Austin 1980). A survey in 1982 revealed
widespread citizen support for aggressive programs to address urban expansion over the
aquifer and to manage potential water quality problems (Butler 1987). The Texas Water
Code enables home-rule cities to adopt area-wide (including the ETJ) water pollution
abatement programs to protect their water supplies from urban runoff. City elections
during these years featured struggles over the management of growth with neighborhood
groups and environmentalists on one side and business and development interests on the
other. A new city council, elected in 1984 after years of business-oriented city
government, promised to manage and direct growth to preserve and enhance Austin’s
quality of life. A popular slogan at the time was Don’t Houstonize Austin. Citizens and
activist groups such as the Save Barton Creek Association and the Zilker Park Posse
worked with the Austin City Council to develop watershed protection ordinances that
utilized a combination of engineering and land use management techniques based on the
philosophy that the best way to protect groundwater was through “proper location,
design, construction, and maintenance of new urban development and its associated
drainage systems” (Butler 1987, 261). Austin also adopted watershed protection
measures in its subdivision ordinances and site development standards. In the plat review
process, special final plat requirements included completion of erosion-sedimentation and
drainage plans, designation of watershed zones and building setbacks, delineation of
critical environmental features such as sinkholes and exposed faults, certification of
plans, and special assessments for water quality monitoring and maintenance. At the
29
time, these Austin ordinances represented an important departure from traditional
structural urban drainage criteria. In summary:
The elected officials of many communities would not have taken such aggressive measures as adopting Austin’s watershed ordinances to protect groundwater quality and the natural environment. But the citizens of Austin are unusually earnest about retaining a high quality of life in face of an expanding metropolitan area (Butler 1987, 284-5). More recently, this proactive attitude has been evident in Austin’s participation in
a regional planning effort, somewhat of a rarity in the State of Texas. In 2002 a group of
citizen leaders “saw the need to respond to the effects of growth” and started Envision
Central Texas (ECT) (Walz 2005, 16). The planning region included the five counties in
the Austin-Round Rock MSA. ECT’s studies indicated the need for regional policies to
address:
• Land Use: how much to be developed and redeveloped, in what style, at what density, and mixed use
• Social Equity: residential and job development in low-income areas
• Environment: development in aquifer recharge or contributing zones, amount
of impervious cover, loss of agricultural land, and urban parks per capita
• Housing: housing mix (diversity), single family, townhouse, and multi-family
• Transportation: Vehicle Miles Traveled (VMT) per capita, travel mode shares, air quality, fuel consumption, and connectivity (number of intersections and intersections per acre)
• Economy: cost of new infrastructure, jobs-housing balance, distribution of
employment space (retail, office, industrial), relative tax burden
In 2004 Austin Mayor Will Wynn proposed that a committee be formed to recommend
open space projects and infrastructure for a bond issue to implement ECT policy
recommendations. New-found regional awareness may have helped pass a transit
initiative for funding a 32-mile commuter rail line in 2005.
30
San Antonio
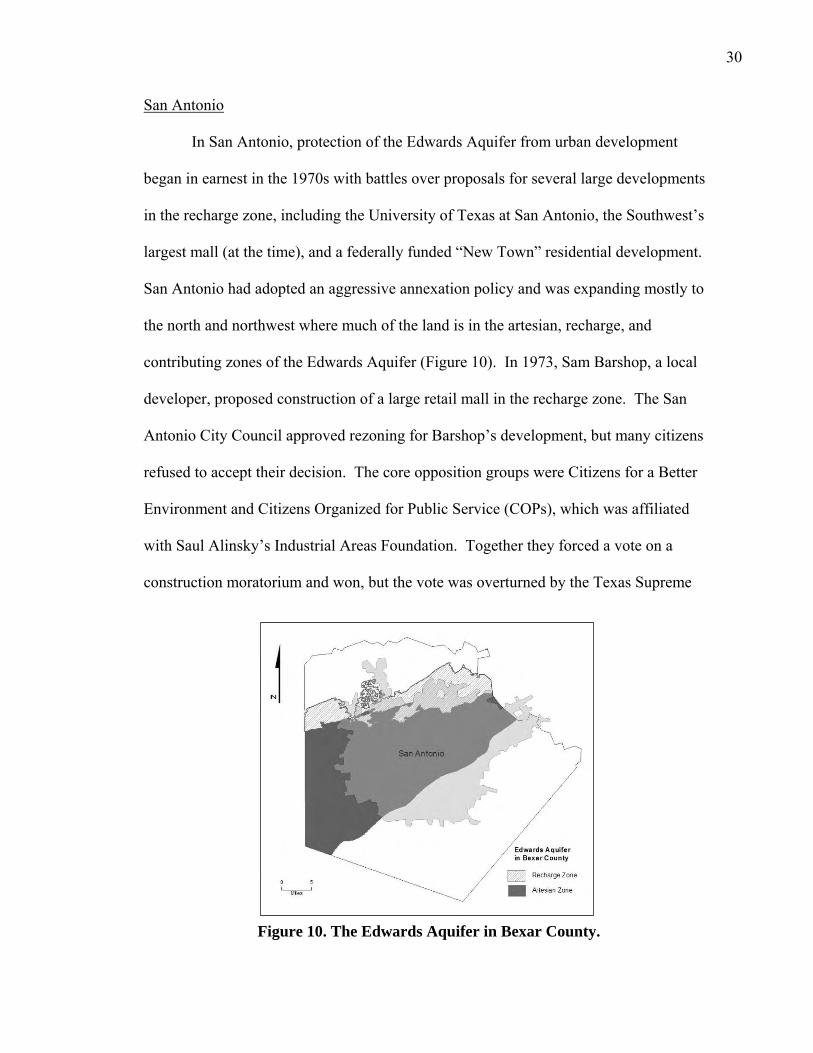
In San Antonio, protection of the Edwards Aquifer from urban development
began in earnest in the 1970s with battles over proposals for several large developments
in the recharge zone, including the University of Texas at San Antonio, the Southwest’s
largest mall (at the time), and a federally funded “New Town” residential development.
San Antonio had adopted an aggressive annexation policy and was expanding mostly to
the north and northwest where much of the land is in the artesian, recharge, and
contributing zones of the Edwards Aquifer (Figure 10). In 1973, Sam Barshop, a local
developer, proposed construction of a large retail mall in the recharge zone. The San
Antonio City Council approved rezoning for Barshop’s development, but many citizens
refused to accept their decision. The core opposition groups were Citizens for a Better
Environment and Citizens Organized for Public Service (COPs), which was affiliated
with Saul Alinsky’s Industrial Areas Foundation. Together they forced a vote on a
construction moratorium and won, but the vote was overturned by the Texas Supreme
Figure 10. The Edwards Aquifer in Bexar County.
31
Court which ruled that the Texas State Constitution disallowed overturning a city council
zoning decision by referendum. A new group, the Aquifer Protection Association,
collected 20,000 signatures calling on the county and city to jointly purchase the land, but
the city council rejected their idea.
In 1974 developers proposed a 9,300 acre federally-funded “New Town” planned
community, the San Antonio Ranch to be located in northern Bexar County over the
aquifer’s recharge zone. Citizen groups such as Aquifer Protection, Citizens for a Better
Environment, and the League of Women Voters wanted the San Antonio Ranch
developers to accept responsibility for treating aquifer water if it became polluted. The
Alamo Area Council of Governments (AACOG) felt that water protection measures in
place at the time could not safeguard the aquifer, and wanted the Texas Water Quality
Board (TWQB) to change its regulations to control density over the aquifer. San Antonio
environmental activist groups opposed approval of the New Town plan, but developers,
City Council and most city officials and planners favored approval as a stimulus for
economic development (Wimberley 2001).
Fortunately for the activist groups, their concern for the Edwards Aquifer
dovetailed with national interest in water quality at the time. Getting nowhere with local
officials (unlike similar groups in Austin), the activists enlisted the aid of U.S.
Representative Henry Gonzalez to stop development of the San Antonio Ranch.
Gonzalez attached a rider to the 1974 Safe Drinking Water Act requiring EPA protection
of aquifers that provide at least fifty percent of a region’s water supply, such as the
Edwards Aquifer. Sole source designation would limit federal contributions “to an often
oblivious public intent on spoiling its own nest” (Wimberley 2001, 181). Business
32
interests and local government were vehemently opposed to Gonzalez’ action. The North
Side Chamber of Commerce claimed the Gonzalez amendment would “adversely affect
the growth and prosperity of our community” (Wimberley 2001, 176). The San Antonio
City Council drafted a resolution urging the U.S. Senate to delay action on the safe
Drinking Water Act until local hearings could be held. Gonzalez responded that
“commercial interests had taken over local politics and that the council had greater
interest in protecting developers’ investments than the city’s water supply” (Wimberley
2001, 176). The amendment was included in the Safe Drinking Water Act approved in
December 1974. In January 1975, the Sierra Club, League of Women Voters, and San
Antonio Citizens for a Better Environment filed a petition for sole source designation for
the Edwards Aquifer. Proponents of local control, including San Antonio Ranch
attorneys, the North San Antonio Chamber of Commerce, and the City Water Board
argued that “citizens would not welcome yet another instance of federal control in their
economy” (Wimberley 2001, 179). Proponents of sole source designation argued that
enforcement of existing aquifer protection orders by the Texas Water Quality Board were
“slipshod” with only a minimal number of inspectors sent out at random times and who
only checked septic tanks.
After all was said and done, the southern San Antonio segment of the Edwards
aquifer did receive sole source designation. The Texas Water Quality Board issued the
first specific orders designed to protect aquifer water quality, marking the beginning of
the Edwards Rules (Title 30, Texas Administrative Code Chapter 213). A major
provision of the Edwards Rules that affected land development patterns in the aquifer’s
recharge and contributing zones addressed wastewater and lot size. The minimum lot
33
size for a house with an on-site wastewater system and connected to a public water
supply was one acre. The minimum lot size for a house with an on-site wastewater
system and its own private water well was five acres. By requiring such large lots, these
rules, designed to protect water quality, actually encouraged a sprawling residential
pattern in much of the Corridor Region. For a more detailed analysis of this
phenomenon, please see my master’s thesis, The Dynamics of Land Development in a
Rapidly Urbanizing Area (Vaughan 1994).
Today the university, expansive shopping centers, big-box retail, and residential
subdivisions cover portions of the recharge zone, but struggles over the pace, pattern and
location of development continue. In January 2006 Bexar County commissioners finally
approved a Professional Golf Association (PGA) golf resort, Cibolo Canyons, in northern
Bexar County, a project that County Judge Nelson Wolff called the “most debated issue
since I’ve been in office” (Allen 2006). It was an anti-climatic finale to a long and
arduous battle over whether and how to build the resort. Not only did the developers
want to build in the recharge zone, they also wanted eminent domain powers of a city and
favorable tax treatment that would repay their investment in infrastructure. This resulted
in a public outcry against “corporate welfare” and environmental irresponsibility, a
referendum drive that collected more than 77,000 signatures, and an election in 2003 that
called for abandonment of the agreement between the city and developers (Allen 2006).
City officials altered the agreement slightly to get around the referendum, but the deal
later collapsed on its own accord.
Not to be denied, city, county, and business interests resurrected negotiations with
the land owner and brokered a twenty-nine year non-annexation agreement with the
34
developer. Judge Wolff spoke of the “delicate tightrope the project's backers had to
endure in the face of fierce public opposition” and “behind-the-scenes machinations that
were required to revive the hyper-controversial golf resort over the Edwards Aquifer
recharge zone” (Allen 2006). Those dealings included going to the Texas Legislature to
pass a bill that lets the Cibolo Canyons Development District levy taxes and issue bonds.
It can be argued that, after these conflicts began in the early stages of the area’s
rapid growth, San Antonio, like most Sunbelt cities, “succumbed to the lure of urban
sprawl,” and that Gonzales’ end-run around city council and the efforts of citizens and
activist groups only temporarily forestalled the process (Wimberley 2001, 181). Indeed
the Sole Source designation does not seem to have had much of an impact on the
location, pattern, and pace of the broader suburban/exurban surge that has fundamentally
altered the city since the early 1970s. Hutton (2001, 238) succinctly summarizes growth
and change in San Antonio:
The combination of its social climate and the surrounding environment, its hopes of attracting commerce and its fear of setting limits or even basic parameters for controlling growth, combine to produce a lasting paradox: an attractive, decentralized city increasingly surrounded by and filled in with monotonous office and shopping blocks, devoid of imagination, bare of the slightest shade, and virtually identical to analogous sites across the country.
Vested Rights
Before concluding this background chapter, I need to address the impact of the
vested rights or grandfather statute that has enabled “development-as-usual” growth
advocates to bypass Austin and San Antonio ordinances addressing land development,
water quality, and tree preservation - ordinances that had widespread and enthusiastic
citizen support. The vesting statute was written for developers who were unhappy with
35
the watershed ordinances in Austin. In 1987 a group of anonymous developers, angered
at the City of Austin’s efforts to protect growth over the Barton Springs watershed,
founded the Texas Real Estate Association which lobbied for House Bill 4 (HB4),
purportedly an economic development bill, in an effort to jump-start the Texas economy
which was suffering from the real estate crash of the mid-1980s. The original focus of
HB4 was to establish the Texas Chamber of Commerce to “alleviate bureaucratic
obstacles to economic development,” and contained no vesting language (Tedesco 2005,
7A). However, the law, touted by its supporters as a way “to protect the ordinary citizen
from overbearing government, has been used by large development companies to trump
efforts by citizens to tame explosive growth…” (Tedesco 2005, 1A).
In 1992, a ballot initiative in Austin to restrict development in the Barton Creek
watershed triggered a debate over vested rights exemptions. The Save Our Springs
ordinance (SOS) limited impervious cover to a maximum of fifteen percent in the Barton
Creek recharge zone, twenty percent in the Barton Creek watershed outside the recharge
zone, and twenty-five percent in the remainder of the contributing zone, all in all a large
area in the southwestern part of the city that was, and is, highly desirable for residential
and commercial development. Existing city rules allowed up to seventy percent
impervious cover. The SOS ordinance included a provision that exemptions under the
vested rights statute would expire after one year. City rules in place at the time allowed a
developer to submit a final plat for a single lot and exempt the entire project permanently
from changes in development regulations. A city study showed that from 1986 through
the end of 1990 more than eighty-six percent of all development projects in the Barton
Springs watershed were exempt from city regulations (Collier 1992). Environmentalists
36
argued that exemptions needed to be eliminated as quickly as possible to ensure that the
springs were protected. Real estate interests and the Chamber of Commerce, led by Karl
Rove who later became President Bush’s advisor, campaigned to defeat the SOS
ordinance, but it was adopted in August 1992 when Austin voters approved the initiative
by a two-to-one margin.
The success of the SOS initiative was not the end of conflicts between vested
rights advocates and citizen-backed efforts to protect the springs. In 2005, thirteen years
after implementation of the SOS ordinance, chip-maker Advanced Micro Devices (AMD)
received approval to locate its 800,000 square foot office/manufacturing complex on a
fifty-seven acre tract within the Barton Springs watershed. City officials said they were
bound by a 2001 agreement that allowed the property owner to develop land under
regulations in place in 1986 when the property was first zoned. Environmentalists argued
that AMD should not locate at this particular location because “for decades Austin had
recognized a scientific, economic and public consensus that major employers do not
belong in the Barton Springs watershed” (Novak 2005). Instead, Austin had been
encouraging development and major employment centers to locate in the “Desired
Development Zone” away from Hill Country watersheds. Indeed, this had been the
central concept of the Austin Tomorrow Comprehensive Plan, the 1992 voter-approved
SOS ordinance, Smart Growth policies approved in the late 1990s, and Envision Central
Texas’ recently recommended policies. The Save Our Springs Alliance argued that
AMD chose “to ignore this long-standing consensus” (Bunch and Clark 2005).
San Antonio has been especially generous in granting exemptions to its
ordinances under vested rights law. In 1995, City Council passed Water Quality Rules to
37
a “thunderous ovation” from citizens present at the meeting. These rules were hailed as
“a hallmark of planning for a city not known for its foresight” (Tedesco 2005, 10/16:
1A). But many plats had been filed months before the ordinance went into effect,
specifically to avoid the aquifer ordinance. It was argued that “the vested rights law has
been a boon to developers while hampering efforts by residents, community groups, and
officials to make San Antonio a better place to live” (Tedesco 2005, 10/16:15A). The
San Antonio Water Department has essentially handed out blanket exemptions from
aquifer rules while the Planning Department has been almost as lenient with exemptions
from city codes. Between 1997 and 2001 San Antonio planners exempted 500 projects
covering 70,000 acres over the recharge zone, about one-fourth of city’s total recharge
acreage (Tedesco 2005).
The Texas Association of Realtors has lobbied successfully to broaden the type of
permits that trigger vesting. Now vesting starts with a plat, master plan, many other types
of permits and agreements, or water contracts used by planners to force developers to
install oversized pipelines to accommodate future growth. The oldest permit used thus
far in San Antonio to trigger a vesting claim was a 1908 hand-drawn plan for a site that
HEB, a grocery chain, wanted to use to expand one of its stores in 2001. HEB did not
own any property or have any stores in San Antonio in 1908, but the Texas statute allows
rights to transfer from owner to owner.
In 2004, in order to avoid the 1995 Water Quality Rules and 2003 Tree
Ordinance, developers of Bulverde Village cited a 1984 water contract between a
previous land owner and the San Antonio Water Department that did not even describe
the type of proposed development. The site for Bulverde Village was clear-cut and
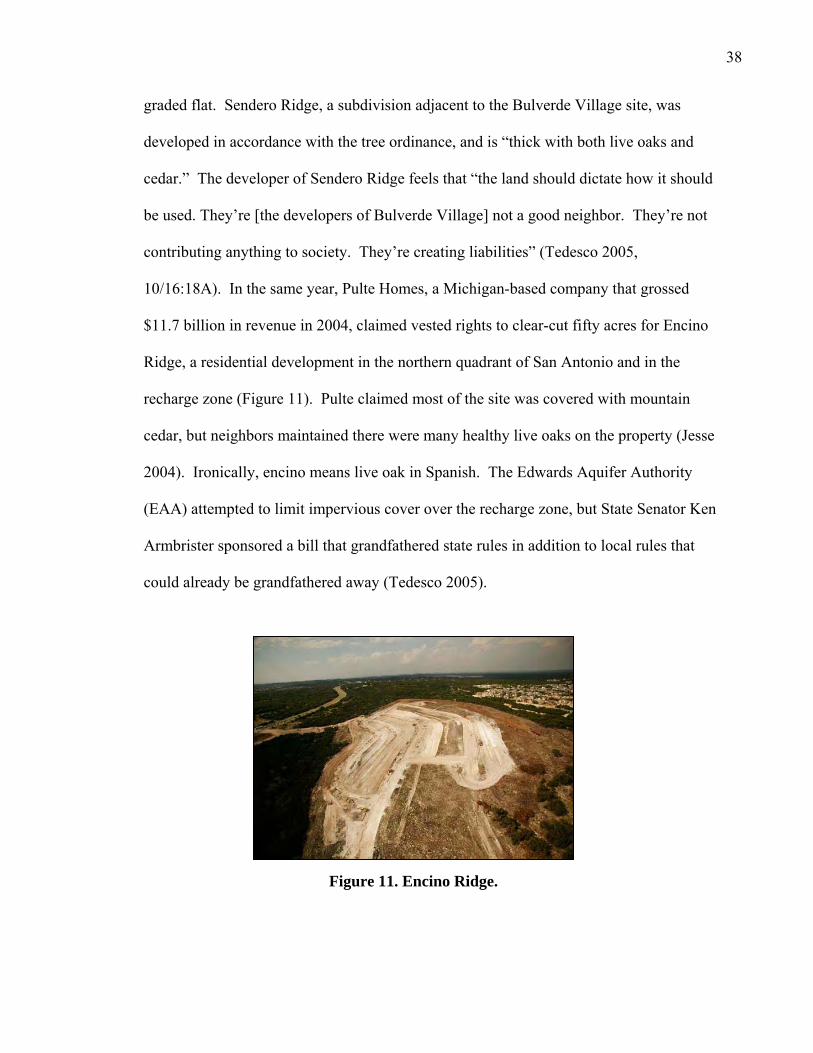
38
graded flat. Sendero Ridge, a subdivision adjacent to the Bulverde Village site, was
developed in accordance with the tree ordinance, and is “thick with both live oaks and
cedar.” The developer of Sendero Ridge feels that “the land should dictate how it should
be used. They’re [the developers of Bulverde Village] not a good neighbor. They’re not
contributing anything to society. They’re creating liabilities” (Tedesco 2005,
10/16:18A). In the same year, Pulte Homes, a Michigan-based company that grossed
$11.7 billion in revenue in 2004, claimed vested rights to clear-cut fifty acres for Encino
Ridge, a residential development in the northern quadrant of San Antonio and in the
recharge zone (Figure 11). Pulte claimed most of the site was covered with mountain
cedar, but neighbors maintained there were many healthy live oaks on the property (Jesse
2004). Ironically, encino means live oak in Spanish. The Edwards Aquifer Authority
(EAA) attempted to limit impervious cover over the recharge zone, but State Senator Ken
Armbrister sponsored a bill that grandfathered state rules in addition to local rules that
could already be grandfathered away (Tedesco 2005).
Figure 11. Encino Ridge.
39
Rapid population growth in the Corridor Region will only intensify the types of
conflicts over land use change described in this chapter. Essentially these are struggles
over abstract versus social space. Ultimately, the vested rights law seems to mean that
the abstract spatial perceptions of urban growth coalitions (bankers, businesspeople,
corporate property owners, developers, politicians, investors and some planners), and not
local citizens or some planners with their perceptions of social space and sense of place,
are the final arbiters of what, where and how land is developed in the Corridor Region.
Regardless, research is needed into the outcomes of growth and change in the Austin/San
Antonio paradigmatic region to help determine whether the resulting pattern of
development is sustainable, and whether citizens’ concerns and planning policies are
reflected in growth outcomes.
40
CHAPTER III
URBAN GROWTH AND CHANGE
Overview
Over the past century, as urbanization has come to dominate the pattern of human
settlement, urban growth and change has received considerable attention in a wide range
of disciplines. In this literature review, I draw upon geography, sociology, ecology, and
planning as they relate to urban morphogenesis, planning, and sustainability. These three
elements are the determining factors which drive my selection of research variables. To
facilitate an understanding of such vast literature, this review is divided into two chapters:
Chapter 3 - Urban Growth and Change, and Chapter 4 - Planning and Sustainability. In
each chapter, I point out how urban morphology, sprawl (a particular type of urban
morphology), planning, and sustainability relate to my study, provide a critical analysis
of the relevant research, and discuss the status of current knowledge.
In this chapter, I discuss approaches to the study of urban growth and change, and
then point out that continuity is a surprisingly significant theme in American urban
geography. I also cover urban theories and models relevant to my research, including
urban/human ecology, complexity theory, conflict theory, and postmodernism. Sprawl is
covered in the context of its costs and the debate over whether it is truly an undesirable
pattern of land development. In the next chapter, I consider the condition and efficacy of
current urban planning practice in America, particularly the relationships between local
41
government land use planning policies, real estate development activities, and the
political economy. In this way I set the stage for my analysis of planning effectiveness
within the context of the current political and economic state of America’s communities.
I address sustainability in the context of both modern American urban development and
as it applies to my study area. Further, I define the meaning of sustainability and
sustainable development, examine how these terms are applied to the urban context, and
outline the concept of the ecological footprint as a measurement of sustainability within
my study area. I conclude by pointing out how the sustainability paradigm can help
planners become more effective and perhaps even revive the idea that planning can be
visionary.
Urban Growth and Change
The urban geographer has taken on the study of change, particularly of process where that evolution is most prevalent, the city.
Vance 1978, 132 City shape, it is suggested, should be thought of as morphology, a logic of
changing and transmission, rather than a static shape. Crang 2000, 303
Approaches to the Study of Urban Growth and Change: Morphology and Complexity
Geographers as well as planners, sociologists, economists, and many others have
been modeling the patterns and dynamics of urban growth for quite a while. Early
geographic research on urban morphology focused on static site and situation developing
out of the man-land philosophical approach espoused by Carl Sauer in his 1925 essay The
Morphology of Landscape (Thornwaite 1930; James 1931; Hartshorne 1932). Later
research embraced the complexity and dynamics of urban systems. Conzen (1949)
contributed three important perspectives to this type of research in urban growth and

42
change: functionalist, evolutionary, and morphological. His morphological approach,
which focused on change and structure within the city, is particularly relevant to my
research because it helped establish a relationship between geography and planning. This
new relationship resulted from the change in the pattern of residential development and
the emerging predominance of suburban growth, which required the broader spatial
perspective of geographers to be integrated with the limited spatial scale in which
planners had traditionally worked (Vance 1978). Today, urban morphologists see the city
as an accumulation and integration of many individual and small group actions, governed
by cultural traditions and shaped by social and economic forces over time (Moudon 2002;
Kropf 2001). Whitehand and Carr (2001) stated that morphological analysis is based on
both scale and time. Urban form can be understood at different levels of resolution, for
example the building/lot, street/block, neighborhood/district, and city/region.
Temporally, urban form can best be understood as continuous replacement and
transformation, or what Park, Burgess and McKenzie (1925) called invasion and
succession.
Complex systems are inherently evolutionary and provide a way of
conceptualizing time that permits a proper understanding of the relationship between the
temporal and the social aspects of urban development. To this end, Salingaros (1998,
2000) outlines fundamental processes behind urban form that are based on rules derived
from connective principles in complexity theory. In a similar vein, Crang (2000, 304)
argues that the city is a dynamic site of flows, movements, and minglings of people,
information, and things. “. . . The city is becoming an all-encompassing infinite space as
cities lose their old structure and identity, giving way to the formlessness that is produced
43
by urbanization. New environments of division and connection, power and inequality
are emerging. Complexity theory can facilitate an understanding of how a city grows and
changes.
At the end of Death and Life of Great American Cities, Jane Jacobs (1961, 433)
reminds the reader that “cities happen to be problems in organized complexity, like the
sciences.” But “because the life sciences and cities happen to pose the same kinds of
problems does not mean they are the same problems” (Jacobs 1961, 439). According to
Montgomery (1998, 271) Jacobs was in tune with the modern city with her “fierce
passion for the complexity of the everyday life she so keenly observed.” Pure science is
discovery, not invention or prediction. Thus, because understanding complex systems “. .
. entails investigating empirical particulars and constructing general abstractions” (Peet,
1998, 3), my research uses the case study approach in which certain variables are
analyzed over time with the goal of seeking understanding within the context of the
literature related to urban growth and change.
Continuity Amidst Change in American Urban Geography
Geographic research provides a reminder of the durability of spatial forms and
processes of American urbanization. Many of the apparently new trends in urban areas
are as much a matter of changes in scale and terminology as they are changes in process.
In other words, plots have been transformed into building areas; neighborhoods into
planning sectors or zones; streets into transportation infrastructure; traditional public
buildings into facilities; open space and parks into lawns and playing fields; and public
squares into shopping malls. Underlying patterns resulting from human actions viewed
over a long period of time have been the quest of urban geographers such as Conzen
44
(1960), Ward (1964), Pred (1977), Borchert (1978) and Vance (1977, 1990). More
recently, and along the same line of research, Ford (1995) and Wyly (1999, 310)
reinforce the idea of the value of underlying patterns, especially “the long term stability
of residential differentiation”, albeit at a larger scale. Residential segregation by race or
income, and suburban/exurban development processes are evidence of continuity in the
American urban landscape. Residential morphology has “gone from having the elite on
one block and the poor on the next or in the alley to discrete neighborhoods for different
classes to distinct, unrelated regions for different types of people and different economic
activities” (Ford 1995, 560). Florida (2002, 8), in his examination of such distinct,
unrelated regions, differentiates between creative class cities and more traditional
corporate centers or old economy cities. Creative cities have “a thriving music scene,
ethnic and cultural diversity, outdoor recreation, great night life, and creative class people
– those in science and engineering, architecture, etc. whose economic function is to create
new ideas.” Examining forty-nine large urban regions of the USA based on the above
criteria, Florida (2002, 246) has created a creativity index in which Austin ranks second
(San Francisco is number one), while San Antonio ranks thirty-fourth. This
differentiation is one of the reasons there may be a difference in the planning paradigms
and growth outcomes between these two communities.
Kevin Lynch (1981, 181), noting that no single theory deals successfully with
continuous change, affirmed that the decisive elements of urban transformation are
“political leaders, families and ethnic groups, major investors, the technicians of
transport, the decision elite, and the revolutionary classes.” Rather than arriving at a
particular model, Lynch developed a set of performance criteria that were mutually
45
independent and included vitality, sense, access, control, efficiency, and justice.
Following Lynch’s philosophy, to a degree, my research will examine the Austin/San
Antonio corridor region in terms of its performance toward sustainability, using variables
based on the literature, but within the context of certain urban theories and models that
can inform the methodology and research results.
Theories/Models Relevant to the Research
A brief explanation of the role of theories and models in geography is needed to
avoid confusion over the use of these terms in my study. A theoretical framework
provides the context for general understanding and making enlightening connections
within a given sphere of science - such as geography. Theory tries to replicate “. . . in the
imagination a certain particular sequence of events or category of real occurrences using
the device of generalization, usually (or conventionally) looking for commonalities
and/or differences . . .” (Peet 1998, 5). Harvey (1969, 145-6) admits that models are
multi-functional and difficult to define, but should be regarded as a “. . . formalised [sic]
expression of a theory . . . the model serves to transfer the theory into realms which are
more familiar, more understandable, more controllable, or more easily manipulated.” A
model may be thought of as a kind of skeletal representation of the theory. My research
relies, to an extent, on certain models and/or theories. Based on the above definitions,
and for the sake of brevity, in this paper I will often combine the two words into
“theories/models.”
For my study, the test of a theory is not its validation against empirical evidence
but, rather, its coherence and its capacity to provide insight into an issue. Societies are
open systems in which the same conditions are rarely reproduced; theories cannot, as
46
positivists contend, predict the future; they can only “illuminate the past and the present,
and provide guidance to an appreciation of the future" (Johnston et al. 1994, 622-623).
For the purposes of my research, the logical positivist approach is too limiting, given the
complexity and multi-scale interactions of the various processes that give rise to urban
form. Rather, as mentioned earlier, I will draw understanding for the current urban
pattern from several classic urban theories/models: it is not the goal of this research to
promote any one particular theory or model. However, there are several that will provide
a general framework necessary for my study of urban growth and change within the
context of sustainability. Earlier I discussed complexity theory. Other theories/models
that will inform my research include urban ecology, conflict theory, and postmodernism
(really more of a paradigm). Urban ecology and conflict theory are used as rationales for
measuring social distance; complexity and general systems theories justify the
methodology used in my study; and conflict theory and postmodernism inform the
research questions related to the efficacy of planning and quality of life.
Urban Ecology
The processes of segregation establish moral distances which make the city a mosaic of little worlds which touch but do not interpenetrate.
Park 1915, 608
A community develops from simple to more complex forms through a sequence of developmental stages known as succession . . . the series culminates in a climax state in which a dominant species appears. The dominant species is related to the environment in such a way that it is able to control and maintain the community.
Lawrence 2003, 31
One of the first urban models to address the internal arrangement of cities, and
one that is relevant to this study, is the zonal model that is rooted in the concept of urban
ecology as developed by Park, Burgess and McKenzie (1925) at the University of
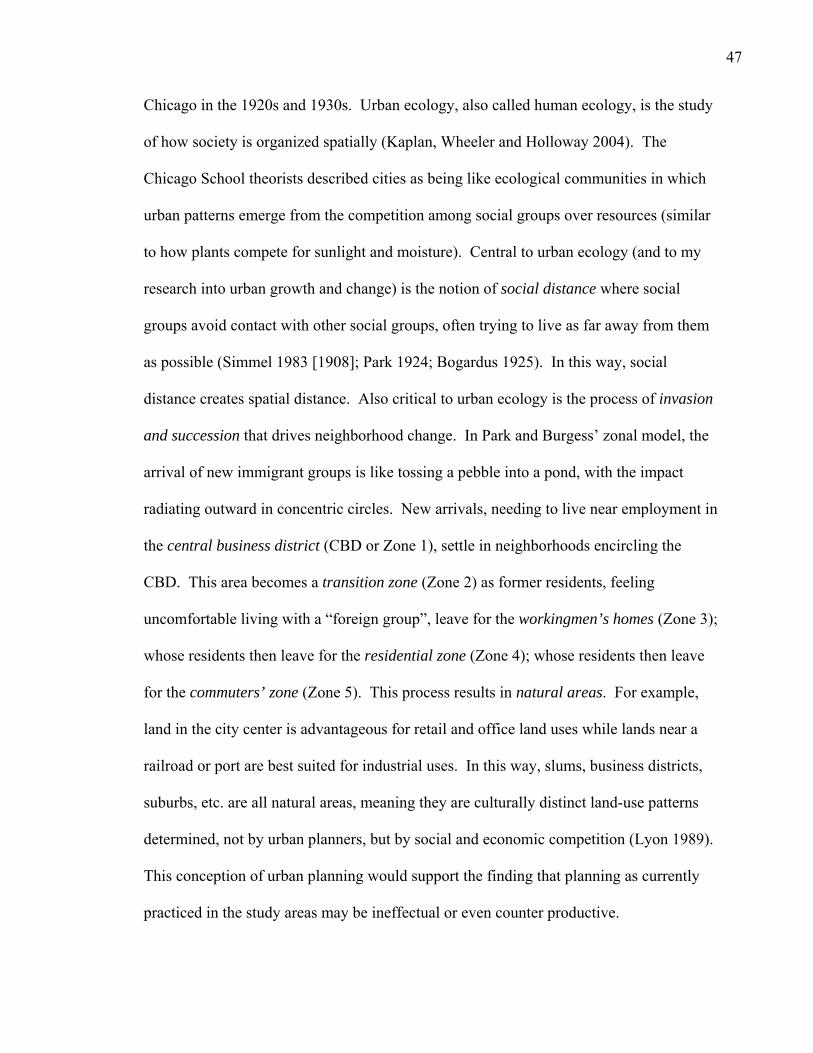
47
Chicago in the 1920s and 1930s. Urban ecology, also called human ecology, is the study
of how society is organized spatially (Kaplan, Wheeler and Holloway 2004). The
Chicago School theorists described cities as being like ecological communities in which
urban patterns emerge from the competition among social groups over resources (similar
to how plants compete for sunlight and moisture). Central to urban ecology (and to my
research into urban growth and change) is the notion of social distance where social
groups avoid contact with other social groups, often trying to live as far away from them
as possible (Simmel 1983 [1908]; Park 1924; Bogardus 1925). In this way, social
distance creates spatial distance. Also critical to urban ecology is the process of invasion
and succession that drives neighborhood change. In Park and Burgess’ zonal model, the
arrival of new immigrant groups is like tossing a pebble into a pond, with the impact
radiating outward in concentric circles. New arrivals, needing to live near employment in
the central business district (CBD or Zone 1), settle in neighborhoods encircling the
CBD. This area becomes a transition zone (Zone 2) as former residents, feeling
uncomfortable living with a “foreign group”, leave for the workingmen’s homes (Zone 3);
whose residents then leave for the residential zone (Zone 4); whose residents then leave
for the commuters’ zone (Zone 5). This process results in natural areas. For example,
land in the city center is advantageous for retail and office land uses while lands near a
railroad or port are best suited for industrial uses. In this way, slums, business districts,
suburbs, etc. are all natural areas, meaning they are culturally distinct land-use patterns
determined, not by urban planners, but by social and economic competition (Lyon 1989).
This conception of urban planning would support the finding that planning as currently
practiced in the study areas may be ineffectual or even counter productive.
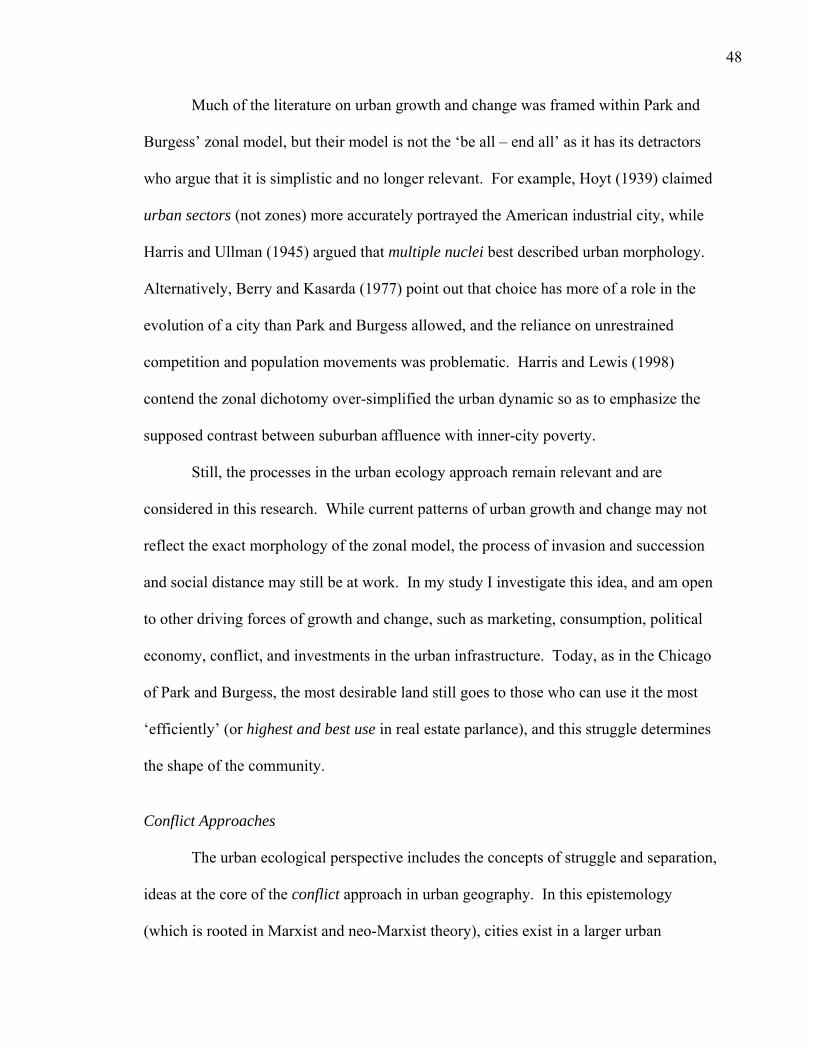
48
Much of the literature on urban growth and change was framed within Park and
Burgess’ zonal model, but their model is not the ‘be all – end all’ as it has its detractors
who argue that it is simplistic and no longer relevant. For example, Hoyt (1939) claimed
urban sectors (not zones) more accurately portrayed the American industrial city, while
Harris and Ullman (1945) argued that multiple nuclei best described urban morphology.
Alternatively, Berry and Kasarda (1977) point out that choice has more of a role in the
evolution of a city than Park and Burgess allowed, and the reliance on unrestrained
competition and population movements was problematic. Harris and Lewis (1998)
contend the zonal dichotomy over-simplified the urban dynamic so as to emphasize the
supposed contrast between suburban affluence with inner-city poverty.
Still, the processes in the urban ecology approach remain relevant and are
considered in this research. While current patterns of urban growth and change may not
reflect the exact morphology of the zonal model, the process of invasion and succession
and social distance may still be at work. In my study I investigate this idea, and am open
to other driving forces of growth and change, such as marketing, consumption, political
economy, conflict, and investments in the urban infrastructure. Today, as in the Chicago
of Park and Burgess, the most desirable land still goes to those who can use it the most
‘efficiently’ (or highest and best use in real estate parlance), and this struggle determines
the shape of the community.
Conflict Approaches
The urban ecological perspective includes the concepts of struggle and separation,
ideas at the core of the conflict approach in urban geography. In this epistemology
(which is rooted in Marxist and neo-Marxist theory), cities exist in a larger urban
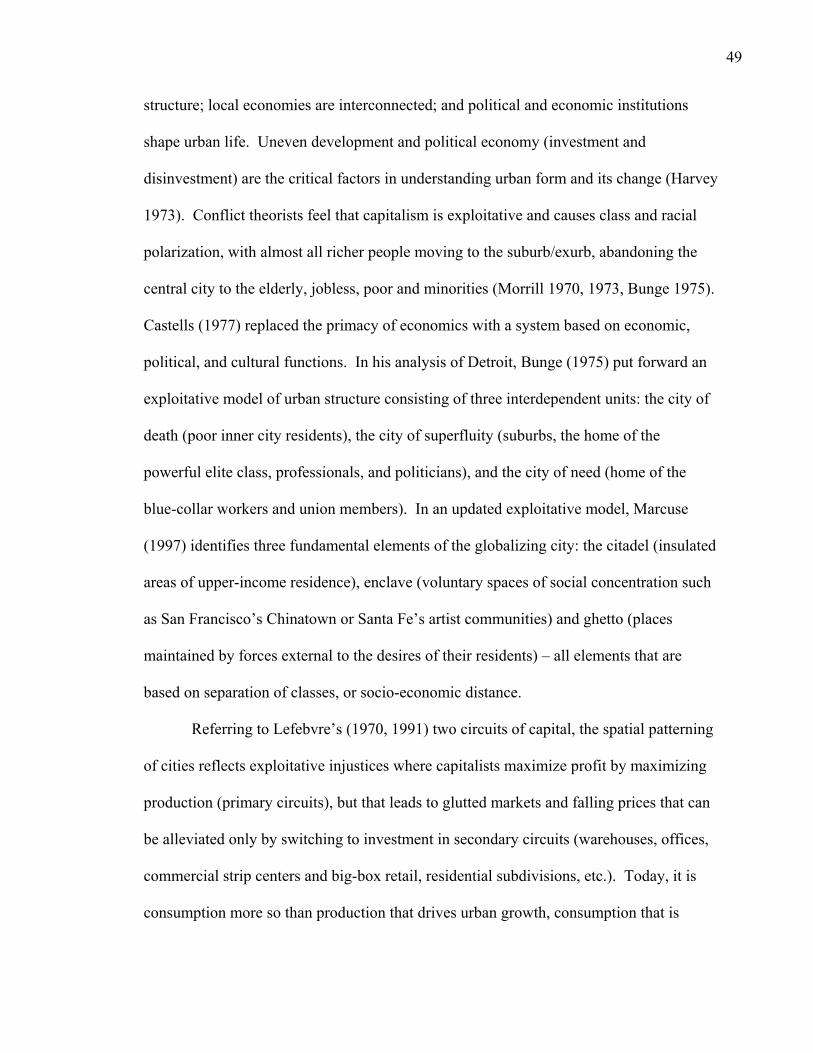
49
structure; local economies are interconnected; and political and economic institutions
shape urban life. Uneven development and political economy (investment and
disinvestment) are the critical factors in understanding urban form and its change (Harvey
1973). Conflict theorists feel that capitalism is exploitative and causes class and racial
polarization, with almost all richer people moving to the suburb/exurb, abandoning the
central city to the elderly, jobless, poor and minorities (Morrill 1970, 1973, Bunge 1975).
Castells (1977) replaced the primacy of economics with a system based on economic,
political, and cultural functions. In his analysis of Detroit, Bunge (1975) put forward an
exploitative model of urban structure consisting of three interdependent units: the city of
death (poor inner city residents), the city of superfluity (suburbs, the home of the
powerful elite class, professionals, and politicians), and the city of need (home of the
blue-collar workers and union members). In an updated exploitative model, Marcuse
(1997) identifies three fundamental elements of the globalizing city: the citadel (insulated
areas of upper-income residence), enclave (voluntary spaces of social concentration such
as San Francisco’s Chinatown or Santa Fe’s artist communities) and ghetto (places
maintained by forces external to the desires of their residents) – all elements that are
based on separation of classes, or socio-economic distance.
Referring to Lefebvre’s (1970, 1991) two circuits of capital, the spatial patterning
of cities reflects exploitative injustices where capitalists maximize profit by maximizing
production (primary circuits), but that leads to glutted markets and falling prices that can
be alleviated only by switching to investment in secondary circuits (warehouses, offices,
commercial strip centers and big-box retail, residential subdivisions, etc.). Today, it is
consumption more so than production that drives urban growth, consumption that is
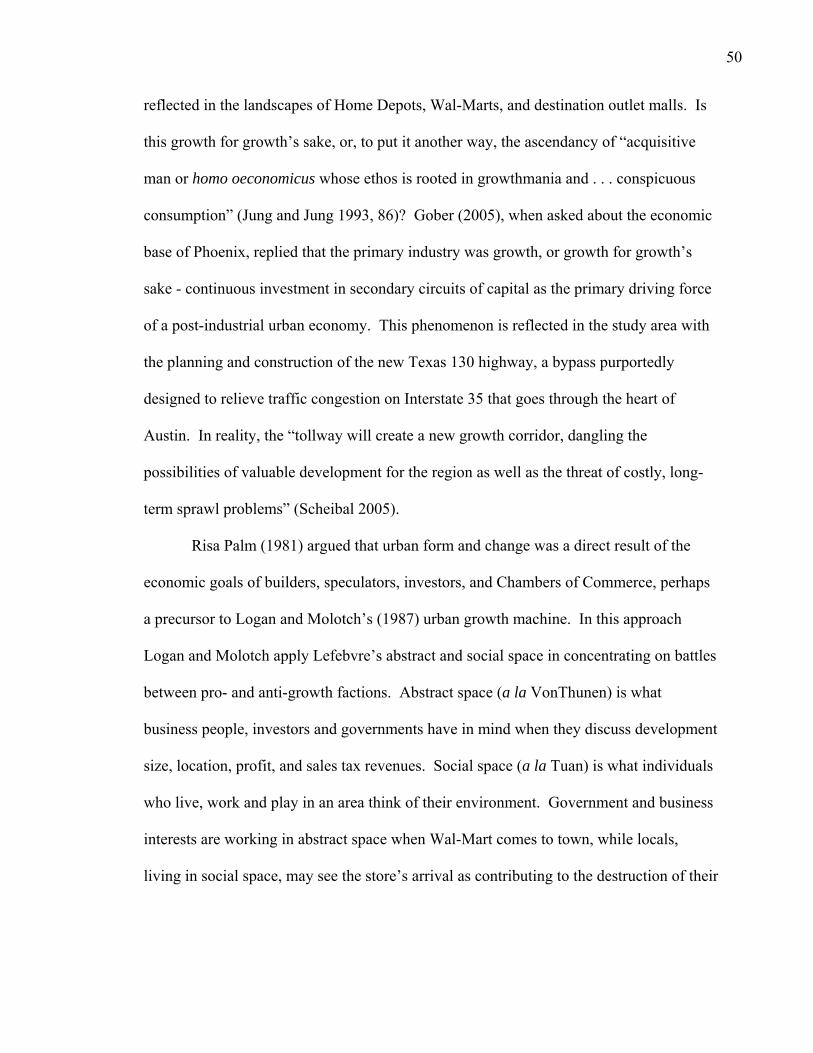
50
reflected in the landscapes of Home Depots, Wal-Marts, and destination outlet malls. Is
this growth for growth’s sake, or, to put it another way, the ascendancy of “acquisitive
man or homo oeconomicus whose ethos is rooted in growthmania and . . . conspicuous
consumption” (Jung and Jung 1993, 86)? Gober (2005), when asked about the economic
base of Phoenix, replied that the primary industry was growth, or growth for growth’s
sake - continuous investment in secondary circuits of capital as the primary driving force
of a post-industrial urban economy. This phenomenon is reflected in the study area with
the planning and construction of the new Texas 130 highway, a bypass purportedly
designed to relieve traffic congestion on Interstate 35 that goes through the heart of
Austin. In reality, the “tollway will create a new growth corridor, dangling the
possibilities of valuable development for the region as well as the threat of costly, long-
term sprawl problems” (Scheibal 2005).
Risa Palm (1981) argued that urban form and change was a direct result of the
economic goals of builders, speculators, investors, and Chambers of Commerce, perhaps
a precursor to Logan and Molotch’s (1987) urban growth machine. In this approach
Logan and Molotch apply Lefebvre’s abstract and social space in concentrating on battles
between pro- and anti-growth factions. Abstract space (a la VonThunen) is what
business people, investors and governments have in mind when they discuss development
size, location, profit, and sales tax revenues. Social space (a la Tuan) is what individuals
who live, work and play in an area think of their environment. Government and business
interests are working in abstract space when Wal-Mart comes to town, while locals,
living in social space, may see the store’s arrival as contributing to the destruction of their
51
sense of place and environmental amenities, critical elements to sustainable communities.
There are numerous examples of these “battles” in the Austin/San Antonio study area.
Other Relevant Models
During the 1950s and 60s, data, more so than fieldwork, became the
preoccupation of most geographers. In urban geography the statistician’s modular space
took the place of the field researcher’s infinitely variable space. One example of this
change in research methodology is social area analysis, the “census-born descendant of
classical [urban] ecology’s natural areas” (Lyon 1989, 43). In social area analysis, census
tracts (or groupings of census tracts) take the place of Park’s natural areas as the unit of
analysis. And growth and change is not only measured spatially, but temporally by
comparing different census dates. For example, Shevky and Williams (1949) developed
socioeconomic, family, and ethnic status indices in their study of Los Angeles’ census
tracts. Socioeconomic indices’ variables include population and housing indicators such
as education, occupation, income, housing quality, rent, and household facilities. Family
(or urbanization) indices’ variables include age of population and housing, family size,
fertility, marital status and type of housing unit. And finally, ethnic indices’ variables
include racial and linguistic groups.
By applying factor analysis to an extended list of census tract variables (including
Shevky and Bell’s variables), factorial ecology was borne in the 1960s (Sweetser 1965;
Janson 1980). Using fifty or more characteristics, the factorial approach replaced strict
deductive social area analysis with an inductive search for common dimensions of
variation within urban areas. According to this method, five factors - socioeconomic
status, family status, ethnicity, residential mobility and population, and functional size -
52
explain the ecological structure of most American cities. The selection and use of
variables in social area analysis and factorial ecology help inform the selection and use of
variables in my research.
While social area analysis and factorial ecology focus on social dimensions of
urban life, edge cities represent a relatively new model for the spatial pattern of urban
development (Garreau 1991). Edge city development, which is evident in the Austin/San
Antonio study area, is driven by the automobile and associated parking requirements, the
communications revolution, and the entry of women in large numbers into the labor
market. While agreeing with Fishman (1987) that new city forms appear chaotic in their
early stages, Garreau (1991, 116) nevertheless manages to identify basic types of edge
cities: uptowns or peripheral pre-automobile settlements that have been absorbed by
urban sprawl; boomers or edge cities located at freeway intersections; and greenfields
occurring at “the intersection of several thousand acres of farmland and one developer’s
monumental ego.” In the edge city model, community occurs not through propinquity,
but via telephone, fax, and private mail service. Privatopia is the term used to describe
the “secession of the successful”, residential edge cities which consist of private housing
or common-interest developments (CIDs), and are administered by homeowner
associations (McKenzie 1994, 196). CIDs have promoted an ideology of “hostile
privatism” that has resulted in a culture of nonparticipation, in which the duties of
citizenship “. . . consist of satisfying one’s obligations to private property” (McKenzie
1994, 19, 196). Then again, Davis (1990) argues that unequal capital concentration,
relentless business and real estate competition, and power struggles among competing
elites make the city a place of ominous struggle. Both McKenzie’s privatism and Davis’s
53
struggle fit within the paradigm of urban ecology and socio-economic distance that is part
if my research.
In the Chicago School, the ominous struggle was invasion and succession at the
local scale driven by immigration at the global scale. Similarly, in the postmodern
perspective (sometimes called the Los Angeles School), the struggle manifests itself at the
local scale, but is based on economic rules set at the global scale (Soja 1989; Davis 1990;
Scott and Soja 1996). Fundamental urban dynamics include a “global-local connection
[scale], a ubiquitous social polarization [social distance], and a reterritorialization of the
urban process in which the hinterland organizes the center,” all dynamics that are
mirrored in the Austin/San Antonio paradigmatic region (Dear and Flusty 1998, 50).
Knox (1991, 191) identifies “new” urban settings “including private master-planned
communities, high-tech corridors, mixed-use developments, festival settings, gentrified
neighborhoods, and preserved historic buildings and neighborhoods.” Three groups are
responsible for this landscape genre: 1) a development industry of large scale, long term
players; 2) civic planners who no longer have any control of the built environment; and
3) the new bourgeoisie, “materialistic and slavish to conservative ideals and fashions”
(Knox 1991, 184). Sorkin (1992) envisions the modern American city as a theme park –
similar to Relph’s (1976) other-directed, disneyfied places such as vacationland and
consumerland - in which prepackaged landscapes are engineered to satisfy the fantasies
of suburban/exurban living and urban wanabees, a perception mirrored in San Antonio’s
River Walk, Austin’s Sixth Street, San Marcos’ Outlet Mall, and Buda’s Cabelas. For
Soja, Smith and Sorkin, modern American cities like Los Angeles and San Antonio are

54
decentered metropolises powered by real estate developers and manufacturers of culture
who define taste and consumption patterns.
Postmodern perspectives amplify the need to examine the “restless urban
landscape” at different scales as I do in this research, and also reinforce the contention
that planning is ineffectual and planners do very little planning. In the postmodern city
(as in Garreau’s edge city), conventional politics is dysfunctional, and local government
land use regulations are anachronistic at best. In the Austin/San Antonio region,
municipalities mostly use zoning, subdivision regulations, and subsequent variances that
seem incapable of dealing with real estate development driven by large scale, long-term
players such as KB Homes and Wal-Mart. Exurban areas don’t even have all these
planning tools. Such development has environmental consequences beyond city limits
and needs to be dealt with at a regional level.
Sprawl
Our property seems to me the most beautiful in the world. It is so close to Babylon that we enjoy all the advantages of the city, and yet when we come home we are away from all the noise and dust.
539 BC cuneiform tablet to King of Persia – Utne Reader 1987, Harold Henderson.
Background
Between 1987 and 1997 urbanized areas (as defined by the U.S. Census)
increased forty-seven percent, while the nation’s population grew by seventeen percent
(Platt 2004a). This pattern of urban development in America has been described,
somewhat pejoratively, as sprawl. Sprawl is auto-dependent, spread out development,
where the activities of daily life are separated by long distances linked only by pavement.
As a result, sprawl entrains the excessive transformation of natural areas to hard surfaces,
55
such as ever-widening roads, parking lots, driveways, and roofs (Otto et al. 2002).
Galster et al. (2001) define sprawl as:
… a pattern of land use in a UA [urban area] that exhibits low levels of some combination of eight distinct dimensions: density, continuity, concentration, clustering, centrality, nuclearity, mixed uses and proximity.
Sprawl is a modern manifestation of the urban theories and models discussed above, and,
as such, is a major theme in my research. I will use the measurement of sprawl as an
indicator of social-economic and environmental sustainability after establishing the
negative consequences of this pattern and process on urban quality of life.
As is evident from the cuneiform tablet quote at the beginning of this section, the
desire to spread out and away from the central city has been a longstanding phenomenon.
In the U.S., during the nineteenth century antipathy for urban living grew as cities
became ugly, uncomfortable places in which to live (So and Getzels 1988). Nineteenth
century romantics reinforced the urge to escape the industrial city by espousing the
Arcadian ideal of a comforting nature and the Jeffersonian ideal of agrarian democracy, a
world of individual freedom, privacy and rurality (Blackwood and Carpenter 1978;
(Jackson 1985; Herbers 1986; Coppack 1988). In his pattern books, Andrew Jackson
Downing presented images of single family, detached villas and cottages on landscaped
lots - the ideal residential morphology for American pastoral democracy (Stilgoe 1988;
Marsh 1990). Nineteenth century essayists glorified “…a proximate, partly mythic
wilderness and inspired a generation of readers to take up ‘county living’ ” (Dubbink
1984, 416). Frederick Law Olmstead and Calvert Vaux designed subdivisions for single
family, detached housing in park-like settings: “..a private world of peace and harmony
set in an imaginary past” (Dubbink 1984, 416); “…a home built along a country road,

56
near hills or water…within one and one-half hours commuting distance from the city”
(Schmitt 1969, 182). Today Jeffersonian and Arcadian ideals continue to affect
perceptions of the ideal living space as developers and homebuyers spread into the urban
field seeking privacy and “the city in nature” (Vance, Jr. 1972, 209). In the study area
the city in nature is sought in the Hill Country west of Interstate 35 and/or near the waters
of the region’s rivers and lakes.
In twentieth century America, transportation and communications networks,
cheap land, inexpensive construction methods, abundant energy, and racial polarization
facilitated outward movement and population deconcentration. Governmental policies,
beginning with the National Housing Act 1934 designed to stimulate the depressed U.S.
economy, subsidized the urban to suburban/exurban movement, increasing sprawl by
underpricing the costs of development in fringe areas (Blackwood and Carpenter 1978;
Blake 1979; Peiser 1989). The Home Owner’s Loan Corporation (HOLC) overtly
promoted segregation in housing with its four color-coded grades of housing quality –
with red giving rise to the term redlining, or refusal to insure loans in mixed, racially
diverse neighborhoods. The 1949 and 1954 Federal Housing Redevelopment Acts and
Federal Housing Administration (FHA) and Veterans Administration (VA) rules for
mortgage insurance promoted single family, detached housing over clustered housing,
new construction over rehabilitation, peripheral development over central city
development, and segregation over integration. Over the past fifty years, the fruits of
these policies have been reflected by the tripling of average floor area and lot size of new
single family homes while at the same time the average family size decreased – all
factors exacerbating sprawl (Platt 2004a).
57
After World War II people could afford larger and larger houses as income grew
faster than housing costs, and the Federal government granted income tax deductions for
mortgage interest payments. The substitution of inexpensive septic systems and
individual water wells for city sewerage and water enabled large-lot, dispersed
development in the urban field (Davis, Nelson and Dueker 1994). The resulting urban
pattern is characterized by mass regional urbanization with everything traditionally
associated with the city now increasingly evident almost everywhere in the post-
metropolis. The urban condition and urbanism, as a way of life, are becoming virtually
ubiquitous (Peet 1998). In such a condition, larger lots for single family dwellings force
a rapid consumption of land at and beyond the urban fringe, and the resulting dispersed
population remains dependent upon the subsidized expressways that resulted from the
Interstate Highway Act of 1956 (Hartshorn 1992). In the study area, many of the larger
houses in the Hill Country region are dependent upon private wells for water, septic
systems for waste disposal, and federally-funded expressways for daily travel needs.
Overall, the Austin/San Antonio paradigmatic region exhibits many of the qualities
associated with sprawl, and thus offers an excellent opportunity to examine the region’s
sustainability based on the degree and evolution of sprawling development. Therefore, I
will next cover the sprawl debate with the intention of establishing the validity of using
sprawl as an indicator of quality of life, i.e. social, economic and environmental well-
being.
58
The Debate – Is Sprawl Good, Bad, or Indifferent?
Sprawl is “… one name for many conditions and has both critics and defenders”
(Galster et al. 2001, 681). According to Bourne (1996, 690):
There are two starkly opposing views on the dispersed North American metropolis. One argues that the decentralized and discontinuous pattern of contemporary urban development is wasteful, inefficient and inequitable, and that it may be unsustainable in social environmental and economic terms in the long run. The extreme image is of a vast, low-density politically fragmented urban region with sprawling isolated suburbs surrounding a dark and decaying inner core. The alternative view sees this dispersed form as the logical outcome of unassailable market forces, rapid structural and technological changes, rising incomes, and explicit consumer preferences. Indeed, some argue that these same forces are leading to a more efficient organization of urban space for both firms and individuals. Each view solicits different policy responses, the former designed to encourage more compact and sustainable forms, the latter less regulation, more choice, and lower investment in older urban cores.
Early in the sprawl debate, it was argued that scatteration is the gradual filling-in of
undeveloped areas within communities and provides flexibility in urban development,
enabling efficient adaptation to change (Wright 1958; Lessinger 1962). Residential
compaction (today’s New Urbanism or Smart Growth?) loads the community with the
fashions of the day, and hence the obsolescences of tomorrow. Sprawl can foster
interdependence by spreading urbanity and creating prospects for a “maze of subcultures
within an amazingly diverse society organized upon a broadly shared cultural base”
(Webber 1964, 29). Lessinger (1962, 159) reasons that “the new ideology of anti-
scatteration carries the danger of every swing of the pendulum in human affairs: it goes
too far and it travels along the identical path taken by the ‘problem’.” He concludes that:
…scatter suits an economy where growth and technological, social, and economic change predominate. Compaction may suit a stabilized economy, without inequalities in the distribution of income, seeking optimization of its resources. Every economy will need to find its most appropriate combination of the two (Lessinger 1962, 168).
59
Over time, other observers of the urban scene have reinforced Wright and
Lessinger’s position that spatial dispersion in cities is the overwhelming choice for
residential living, and the impact of discontinuous urban development is very likely
positive rather than negative (Peiser 1989; Gordon and Richardson 1997, 2000). The
traffic consequences of sprawl are benign; the ‘efficiency’ of compact development has
not been adequately demonstrated; and concentrated settlement is only worthwhile if
transport and communication costs are high, but these have been falling for many years
(Gordon and Richardson 1997). Related to transport costs, Gordon and Richardson
(1997) asserted that the energy costs of sprawl are “overblown” as there is a global
energy glut, a stance that is undermined by rising gas prices in 2005. It is even possible
that growth management policies promoting compact development oversimplify issues
and inadvertently exacerbate environmental problems (Audirac, Shermyen, and Smith
1990).
On the other side of the debate, Guest (1975), and Healy and Rosenburg (1979)
note that sprawl is development that stretches out carelessly along transportation routes
and aimlessly over the countryside leapfrogging over usable space. Sprawling urban
fringe growth is:
…a pattern of urbanization lacking in human scale and interest; stripped of a sense of public life; stratified by social and economic class; destructive of land, energy, and natural resources; inconvenient and wasteful of time; poorly organized and disorienting; and ill-suited to adaptation and change (Southworth and Owens 1993, 285).
Related to the issue of consumerism, Neuman (1991, 346) adds that: “the mass-producing
industrial economy has commodified the American dream of the single family home the
only way it could – into large-scale suburban sprawl.”
60
When discussing sprawl, it is important to keep in mind that it is the impacts of
development that render development patterns undesirable, not the patterns themselves
(Ewing 1997). Impacts can be directly assessed which is one of the goals of this
research. While discussing one state’s (Florida) anti-sprawl rules, Ewing notes that two
primary sprawl indicators are poor accessibility and lack of functional open space, or
open space that is held in private, not public, hands. The ultimate caricature of this
situation is the walled and gated subdivision where no land, including street right-of-way,
is public. There are approximately 355 gated and/or walled subdivisions platted in the
San Antonio area alone (Young 2005). Another criticism of sprawl is diminishing street
connectivity (because of the inward focus of fringe area subdivisions). A weakening
connection between buildings and streets has adversely affected the fringe area sense of
place. A major influence on these street patterns has been the Institute of Transportation
Engineers’ emphasis on vehicular movement (Southworth and Parthasarathy 1996).
Anyone can see that the multi-car garage has come to monopolize the suburban/exurban
streetscape. This emphasis on vehicular movement is reflected in the U.S. where vehicle
miles traveled (VMT) increased by 147.7 percent between 1970 and 2000, almost four
times more than the rate of population growth for the same period, which was 38.4
percent. Also, the number of registered vehicles grew by 103.0 percent between 1970
and 2000. Increased vehicle miles traveled means more time spent in vehicles, usually
alone, as well as increased air pollution and cost of upkeep, variables that are used in my
study to reflect quality of life and the condition of the environment.
61
The Costs of Sprawl
If sprawl in its current form is indeed undesirable, exactly what are its negative
features and impacts? There has been considerable research into the economic, social
and environmental costs of sprawl, primarily using traditional cost-benefit analyses, but
these costs have not been directly related to the economic, equity, and environmental
aspects of sustainability (or the three E’s which are discussed in the next section of this
chapter) (Real Estate Research Corporation 1974; Lamb 1983; Ewing 1997; Burchell et
al. 2002; Johnson 2002). Some of the economic costs examined using the cost-benefit
analysis approach include the high price of public infrastructure, facilities and services;
residential capital costs; and rising property taxes. Nelson and Dueker (1990, 1994) warn
that sprawled types of development will cause scarce resources to be devoted to public
services and a transportation system that will be “…very costly to provide over large
areas at low densities.” Orfield (1997) draws attention to the negative fiscal impacts not
just in areas that are experiencing sprawl but in inner cities and inner suburbs that are
losing population which results in a shrinking tax base. Similarly, social costs
investigated in this way include lack of usable public or open space; segregated land uses
resulting in homogenous populations in terms of race, ethnicity, class and housing status;
impacts on central cities and downtowns; limitation of housing opportunity; increased
traffic and commuting time; isolation, resistance to change, and loss of sense of
community; loss of resource lands and favorable externalities such as scenic landscapes;
and political fragmentation coupled with the inability of local governments to work
together, or the lack of integrated government networks. To a great extent, the social
costs are caused by seclusion in suburbia and dependence on the automobile which

62
devours time and space, increasing peoples’ frustrations and ennui, as well as sense of
community loss (Fromm 1955; Jacobs 1961; Haworth 1963; Packard 1972). Lastly,
environmental impacts of sprawl include excessive energy consumption, air and water
pollution, increased water and energy consumption, increase in the risk of floods and
landslides, fragmented habitat, loss of wildlife and vegetative habitat, and extinction of
indigenous species (Healy and Rosenberg 1979; Ewing 1997; Sierra Club 1999; Johnson
2002).
The Austin/San Antonio corridor region relies on groundwater for much of its
water supply, but “planless and piecemeal development” can reduce the natural recharge
of groundwater aquifers (Platt 1976, 7). Stormwater runoff and septic systems can cause
changes in the hydrologic balance and threaten groundwater quality. Furthermore, not
only is groundwater affected, but surface water as well. For example, VanMetre, Mahler
and Furlong (2000) found a positive relationship between increasing automobile traffic
associated with sprawl and the presence of polycyclic aromatic hydrocarbons (PAHs) in
aquatic sedimentation. In fact, the issue of sprawl and its impact on both surface and
groundwater, in and of itself, has been the subject of considerable research (Terstreip,
Voorhees and Bender 1976; Herbers 1986; Marsh and Hill-Rowley 1989; Otto et al.
2002).
The relationship between the costs or impacts of sprawl and sustainable
development has yet to be firmly established. One way to help establish the relationship
is to connect the local scale to the global scale, which is essential for sustainable
communities and a healthy globe. Within the notion of their “ecological footprint,”
(which will be discussed in the next section), Wackernagel and Rees (1996) assert that
63
the decisions of many individual landowners acting in their own self-interest results in
cumulative impacts that are not restricted to the local area of interest, an evolution of
Hardin’s (1968) Tragedy of the Commons extrapolated to a larger scale. In other words,
land use changes in one area have environmental repercussions in other distant areas. For
instance, Hahn and Simonis (1991) claim that potentially disastrous (global)
environmental changes, such as the greenhouse effect and decrease in biodiversity, are
directly related to sprawling urban development. Thus, what happens in the Austin/San
Antonio region has repercussions at the global scale.
Urbanized areas are places that represent the most materialized form of society’s
interaction with the natural environment, but today’s cities exemplify careless treatment
of environmental resources, in part due to the present approach to city planning that
stands in direct conflict to the “already endangered ecological basis of the earth” (Hahn
and Simonis 1991, 199). The car-oriented city and the separation of urban functions have
led to a staggering increase in the settlement surface per inhabitant, and this exponential
expansion of developed land has grave ecological consequences. Relating sprawl’s social
impacts to environmental impacts, Hahn and Simonis (1991, 200), speaking of societal
problems such as individual malaise, go so far as to note that “the atrophy of the inner
world takes place parallel to the destruction of the outer environment.”
The literature confirms that the sprawling pattern of urban growth and change
results in a multitude of economic, social, and environmental impacts at all scales – the
neighborhood, community, region, and globe. Thus, analysis of past urban growth and
change may be undertaken in terms of certain criteria such as environmental deterioration
(or improvement), economic decline (or growth), and social indicators as previously used
64
in social area analysis and factorial ecology related to quality of life and social distance -
or, more generally, against the criterion of sustainability. Consequently, my research will
measure sprawl in the study region as an index of sustainability.
Measuring Sprawl
There have been many efforts at measuring the characteristics, impacts, and
extent of sprawl in the urban field (Lamb 1983; Alberti 1999; Sierra Club 1999; Downs
1999; Malpezzi 1999; Torrens and Alberti 2000; Galster et al. 2001; El Nasser and
Overberg 2001; Ewing, Pendall, and Chen 2002; Wolman et al. 2002). No single
methodology is necessarily the best way to measure sprawl, but I will discuss methods
that can be operationalized in this study. It must be noted that the measurement of land
use change has proven to be difficult due to the coarseness of much of the data (county-
and state-level) and the blurring of land-use and land-cover categories (Theobald 2001).
For example, the National Resources Inventory (NRI) uses aerial photographic
interpretation and field surveys to measure land use change, but the data is reported at the
county level, and thus of limited use for identifying the dynamics of change in the urban
field. The Land Use and Land Cover data set developed by the U.S. Geological Survey
categorizes land cover into nine major categories, but in so doing misses exurban growth
in which the use is more urban in nature, but the land cover appears rural (Anderson et al.
1976). A ranchette is, in actuality, more urban than rural, but may appear rural in aerial
photographs or satellite imagery. Similarly, the Land Cover Characteristics (LCC)
dataset was created using satellite imagery, but at lower land-use intensities (i.e. sprawl)
the “relationship between land cover and land use degrades rapidly” (Theobald 2001,
547). Thus these efforts at sprawl measurement underestimate large areas of low-density
65
settlement in the urban field. Indeed, there is growing recognition that human-dominated
ecosystems are becoming commonplace in the urban field, but are not recognizable using
land cover categories derived from aerial photography and satellite imagery.
On the other hand, census data has long proven to be useful in estimating sprawl.
For example, Lamb (1983) used population data to develop a concentration index (CI) to
measure three basic components of sprawl: isolated homes, strip development, and
leapfrog development, all of which can be found in the Austin/San Antonio corridor
region. The index measures the proportion of total population growth in a region which
occurs within urban centers with a population of at least one thousand people. Lamb’s
method is appealing in its relative simplicity, but measuring sprawling growth, based on
population, underestimates change due to the presence of second homes and vacation
homes, a feature common in my study region (Theobald 2001). For example, there are
high rates of unoccupied housing that occur in amenity areas such as the Hill Country and
lands around Canyon Lake, Lake Travis, Lake Austin and other highland lakes along the
Colorado River. To overcome this weakness in Lamb’s method, Theobald analyzes
sprawl by classifying housing density (or all housing units on the ground) into urban
(more than one unit per acre), suburban (0.1 to 1.0 units per acre), exurban (0.025 to 0.1
units per acre), and rural (fewer than 0.025 units per acre) categories.
In one of the most comprehensive analyses of sprawl, Ewing, Pendall and Chen
(2002) used a variety of data sources along with principle components analysis to reduce
twenty-two variables to four factors that represent various aspects of sprawl: residential
density; mix of homes, jobs, and services; strength of town centers; and accessibility of
street network. These four factors are summed to yield an index which is then used to
66
rank eighty-three metropolitan areas according to their overall sprawl score. The most
sprawling (number one ranking) metropolitan area is Riverside-San Bernadino in
southern California, and the least sprawling (83rd ranking) is New York City.
Interestingly, both the Austin and San Antonio MSAs ended up with similar rankings:
58th and 53rd respectively, a fact that may prove significant in the event that their
planning paradigms are dissimilar.
I will measure sprawl in the study region based on a combination of these
methods, but with the addition of a “level-of-planning” dimension. My variables will be
limited to census data that can be used to measure change in number of housing units in
particular types (i.e. urban or exurban) of land areas. I will also analyze growth in
incorporated places (planned and generally less spread-out places, or Lamb’s
“concentrated” areas), versus growth in unincorporated areas (less planned and generally
more spread-out areas).
67
CHAPTER IV
PLANNING AND SUSTAINABILITY
Planning
. . . the emergence and growth of planning are to a large extent a reaction to the shortcomings of the private property regime. Planning is a means by which society acts collectively to influence and regulate the way in which individuals use their private property (i.e. land).
Rushman 2000, 261 The Condition of Planning
Ironically, many sprawling developments have been “subject to more planning,
and more . . . controls than developments at any time in history” (Southworth and Owens
1993, 285). If planning can be defined as “the arrangement of possible futures” (Steiner
2002, 28), one must question the role of planning in urban growth and change. What is
the current condition of planning in the U.S.A. and in the study area?
Ideally, planning is like planting a tree. The initial action is critical to laying a
solid foundation from which the tree can grow. The arborist, or planner, then lets go (to
an extent) and lets nature and culture take their course (Steiner 2000b). Planning
involves “foresight in formulating and implementing programs and policies” (Hudson
1979, 387). It should be a process of opening peoples’ eyes and engaging them in their
own development activities (Goodman 1971). However, in reality, urban growth and
change are determined by thousands of private development decisions within a
framework of land use regulations administered by city, county, regional, state, and
68
federal governments. From the viewpoint of real estate development, the urban region is
an enormous playing field on which thousands of competitors struggle to capture value
by buying and selling land or constructing improvements on that land, a perspective that
fits well with Park and Burgess’ model and urban (human) ecology’s survival of the
fittest paradigm.
The purported goal of urban planning is to intervene in this game to promote the
common good, control for harmful externalities, and protect public health, safety, and
welfare. It should be noted that human ecologists question the degree of intervention
possible, or even advisable, given that city growth is a product of natural forces in which
the growth process is “one of organization and disorganization or, of tendency toward
equilibrium and counteracting disequilibrium” (Kligman 1945, 89). Even modern
ecologists reinforce such thinking by stating that interventionist planning may be trying
to “stabilize inherently unstable states” (Alberti and Marzluff 2004, 249).
Still, planning is necessary because, historically, planners have been the only ones
who can look after the city as a whole. However, working within the current regulatory
framework, and with the exception of the comprehensive plan, planners are compelled to
consider only the subdivision or building site, and not the community or region. In
addition to the question of scale, it is fair to ask if planners even plan. Peiser (1990)
argues that planners are reactors to developer’s initiatives, and are no longer (if they ever
were) the dominant influence in shaping American communities. Today, planners may
be no more than the rule enforcers of contemporary urban America, and the rules they
enforce are based on urban conditions such as over-crowding and disease which are no
longer relevant.

69
Since the 1950s planners have become specialists, exercising an “overriding
concern with functional efficiency, objective organization, and manipulative planning” -
or what Relph (1976, 81) calls technique:
Through technique attention is directed to objects and busyness and care for things, to the best way of achieving narrowly defined ends. Inevitably the technician manipulating the world of the public loses sight of the ‘overarching personal structures which give things meaning and ceases to look for meaning in his own existence’ (Wild, 1959, 104).
Planning and public policy have suffered a “sectoralization” with planners carving out
niches, creating jargon and venturing “little past the walls they had erected” (Neuman
1998, 211). Overly mechanical planning becomes the kind of feckless planning which
has contributed to reducing the complex urban landscape “into an asphalt network
stitched together from coast to coast out of a dozen or so crude design ‘templates’ ” (Van
der Ryn and Cowan 1996, 9). Town plans have given way to “developers’ site plans,
highway engineers’ concrete cloverleafs and asphalt ribbons, federal officials’ urban
renewal, environmental regulations and impact reports, and lawyers’ codes” (Neuman
1998, 211). Current development standards protect groups who lack vision and make
errors, as long as one follows the code (Forman 1995, 440). Ultimately, planners are
trapped using standards based on minimum setbacks, lot sizes, and street widths - efforts
focused on only the smallest scales. Suburbia is a case in point. Suburbs are highly
planned at the fine scale and nearly unplanned at the community and regional scales.
Given current land use policies, paradigms, and regulations, planners are ultimately (and
unavoidably) abetting unimaginative, minimalist development proposals which result in
processes and sprawling patterns that may not be sustainable and detract from quality of
life (Pendall 1999).
70
In 1964, Melvin Webber (1964, 6) assembled a prescient collection of essays
authored by Berkeley planners, sociologists, and geographers, the goal of which was to
“get closer to the spatial, processural [sic] procedural aspects of the community’s social
and economic life than do traditional city-planning approaches …”. In one essay,
Wheaton (1964, 195) argues that the direct exercise of public policy upon decisions
which shape metropolitan growth is ineffective for several reasons: including the absence
of regional planning agencies; the unwillingness of local governments to make decisions
based on long-range planning; the powerlessness of urban planners; the diffusion of
public and private power and influence; and the indifference and divided interests of
various publics. Planners seemingly have been relegated to serve the narrow interests of
their clients - governmental authorities and bureaucracies (Marcuse 1976).
Institutionalized city planning is lodged within the existing structures of government, and
constrained by the prevailing alignment of political and economic forces within the city
(Molotch 1976).
More and more, civic planning is reduced to the quest for increased property or
sales tax revenues, or ratables. Such quests were first enabled with the 1981 Poletown
Neighborhood Council v. City of Detroit ruling in which the City of Detroit condemned a
residential neighborhood for the construction of an automobile manufacturing plant.
More recently (June 2005), the U.S. Supreme Court, in Kelo v. New London, ruled a
municipal redevelopment authority could condemn an established “middle-class”
waterfront neighborhood to make room for a private office and apartment development
that would generate more sales and property tax revenue than the existing residences.
The precedent for municipalities to use eminent domain for “for tax-generating private

71
development such as hotels, malls, and marinas” in which “. . . the beneficiaries are likely
to be those citizens with disproportionate influence and power in the political process,
including large corporations and development firms” is now firmly established (San
Antonio Express News 2005).
Given this state of affairs, perhaps planners should acknowledge that private
developers (or Knox’s large-scale, long-term players) are the architects of urban spatial
organization in a capitalist America (Whitehand and Carr 2001). But the big picture is
still being ignored as developers’ mental maps are sketchy and limited in detail to small
localities (Bourne 1996); a scale at which analyses miss the larger issues of the
community and region, and short circuits the possibility of overall urban design. Key
elements in this development paradigm are making money, the essentially random
selection of a development site, and the developer’s eventual site purchase decision, all of
which are only accidentally related to an overall structure of the city or urban region.
The costs and ease of land assembly, not notions of Lynch’s (1981) “good city form” or
of a sustainable human habitat, drive urban transformation.
Planning Theories/Models
Just as urban geography theories/models help shed light on urban growth and
change, so do urban planning theories/models. The rational model, rooted in general
systems theory and the scientific method, has been predominant in America for half a
century (Martin and Banfield 1955; Lichfield 1970; Levy 2004). Rational planning has
four classical elements: goal-setting, identification of policy alternatives, evaluation of
means, and implementation of policy; techniques can include cost-benefit analyses,
operations research, systems analysis, Monte Carlo methods, Markov chains, Delphi
72
techniques, and so forth (Hudson 1979). The rational model calls for the production and
implementation of comprehensive (or master) plans that combine land use policies with a
graphic vision of the future patterns of physical development (Kent 1964; Chapin 1965;
Kaiser et al. 1995). Criticisms of the rational method include its insensitivity to existing
institutional capabilities, reductionism, and failure to appreciate the cognitive limits of
decision-makers who are more likely to “satisfice” rather than optimize (Simon 1955).
The primary criticism of comprehensive plans is that they lack implementation and
political clout, especially in states which don’t require cities to have comprehensive plans
before enacting and enforcing land use ordinances (e.g. Texas) (Levy 2004).
Additionally, Berke (2002) found that most of the rational model’s comprehensive plans
do not take a balanced, holistic approach because their focus is primarily on physical
development, the historic underpinning of the rational planning model. As a result of this
narrow focus, mainstream rational/comprehensive planning may not be able to achieve a
sustainable and livable built environment.
While the rational/comprehensive model has dominated American planning
practice, its deficiencies have given rise to several other schools of thought. Well-known
alternative models include incremental planning, transactive planning, advocacy planning
and radical planning (Hudson 1979). Each model has both its own epistemology for
validating information, and its own perception of the public interest, reflecting a range of
interventions in social, economic, and political processes.
Incremental planning, also known as muddling through, partisan mutual
adjustment, or disjointed incrementalism, emphasizes getting things done through the free
market and democratic political economy (Lindblom 1959). A policy that is an
73
adjustment to a previous policy is more likely to gain acceptance with different
stakeholder groups, and also requires less knowledge, time, and money. However, if a
situation calls for a new direction, the incremental approach probably will not work.
Dependence on precedent and past experience makes incrementalists incapable of taking
on new ideas. As a result, excessive caution leads to missed opportunities, a serious flaw
in this approach, given that planning practitioners and academicians alike are calling for
new directions in planning policy and practice to deal with the serious socio-economic
and environmental problems that result from the current pattern of urban growth and
change.
Theoretically, new directions in urban development can be taken at the behest of a
community’s citizens. Transactive planning emphasizes mutual learning and face-to-face
contact with the people affected by land use regulations and decisions. An updated
version of transactive planning is Randolph’s (2004, 53) collaborative environmental
planning which focuses less on government mandates and more on “... the actions of
people, communities, industries, nonprofit organizations, landowners, and others,
working together, often voluntarily, to protect the environment while achieving other
economic and social objectives.” In the transactive model, planners act as
communicators, facilitators, consensus builders, and mediators between different
stakeholder groups (Susskind and Cruikshank 1987; Godschalk et al. 1994; Susskind et
al. 1999). Over the last two decades, local participation in the planning process has
become more prevalent; however “today participatory design is more likely to be used to
preserve the quality of life for affluent and powerful citizens than to fight poverty and
environmental racism … participation has evolved into a movement that can be
74
characterized as selfish, short sighted, segregated, sophisticated and scared” (Smith,
Smith, and Hester 1996, 46-7). Citizen involvement seems to have moved away from the
idea that individuals collectively act for the common good. Local groups are increasingly
reactive and oppositional (e.g. the NIMBY – “not in my backyard” - syndrome) resulting
in planning decisions that are often narrow in scope and made in favor of parochial
interests or powerful special interest groups.
Advocacy planning evolved in the sixties during the Civil Rights movement, with
the goal of defending the interests of the weak against strong community groups and the
established powers of businesses and governments (Davidoff 1965; Alinsky 1971).
Radical planning stresses the importance of cooperation and freedom from manipulation
by anonymous forces, but insists that collective actions can achieve concrete results
relatively quickly (Goodman 1971; Illich 1973; Katz and Bender 1976). Radical
planners, similar to conflict theorists, view main-stream planners as “agents of the state”
working to “facilitate economic activity and growth” (Levy 2004, 343); and conventional
planning as a form of Mandarinism playing “handmaiden to conservative politics”
(Kravitz 1970). While much planning effort is expended on promoting economic health,
“ecological health and geopolitical security are taken for granted” (Rees 1997, 73). There
have been dramatic benefits for capital while the urban, regional, and global commons
are being degraded (Clark 1995).
Planning and Sprawl
Well-intentioned, but poorly crafted or poorly applied planning policies result in
actions that in actuality have unexpected results (Platt 1976; Herbers 1986; Popper 1988).
For instance, growth management standards designed to restrict the pace and extent of
75
growth into the surrounding countryside often increase growth in this area because many
developers will naturally search for cheaper land and a less constraining regulatory
environment (Esparza and Carruthers 2000; Byan and Esparza 2005). This leap frogging
practice is common in the Austin/San Antonio region because counties in Texas have
little control over land use decisions and real estate development. Thus, areas outside a
city’s limits or extra-territorial-jurisdiction (ETJ) are enticing to many developers and
homebuyers alike.
The use of relatively inexpensive private water wells and easy-to-permit on-site
wastewater disposal systems (OSDS or septic systems) enable urban expansion outside
municipalities with water and sewer infrastructure. In spite of the fact that much of the
Austin/San Antonio region has a fragile ground water hydrology (e.g. the Edwards
aquifer), there are still only minimal restrictions on drilling water wells for single family
residences. Furthermore, the widespread use of septic systems (even if properly installed
and maintained) induces sprawl by allowing previously undevelopable land out of range
of central sewerage to be opened up for subdivision (Popper 1988). And what land-use
rules are in place in fringe areas actually force developers to plat large-lot, dispersed
subdivisions. For much of the Corridor Region, the Edwards Rules require either a one
or five-acre minimum lot-size depending on the type of water supply. Throughout the
state, health policy is being misapplied as land use policy, resulting in inadvertent effects
unrelated to the intent of the law. For example, lot size minimums required by state
health laws for on-site sewerage are one of the few regulatory tools available to Texas
counties, and in the absence of county land use planning policy and regulation, have
become the primary land use regulatory mechanism by default (Vaughan 1994). In this

76
situation, the issue of scale is raised once again, as health regulations focus on individual
building sites and are “…not designed to be concerned with broad planning issues, such
as land use and environmental impacts” (Hanson and Jacobs 1989, 178).
The misapplication of planning tools and the narrowly focused nature of the very
tools themselves reiterate the need for new planning paradigms and policies. Within the
context of the literature, it would appear that new planning theories/models are needed to
address changing political, socio-economic, and environmental conditions. Many
planners argue that the concepts of sustainability and sustainable development offer the
foundation for such a model.
Sustainability Sustainable development is a dynamic process in which communities anticipate and accommodate the needs of current and future generations in ways that reproduce and balance local social, economic and ecological systems, and link local action to global concerns.
Berke and Conroy 2000, 23 The Sustainability Debate – Weak or Strong?
I will measure the evolution of sprawl as one indicator of progress toward (or
away from) sustainability and sustainable development in the study region. As with
sprawl, the word sustainability and the term sustainable development are loaded with
nuance, but there appear to be consistencies among the many definitions, primarily
focusing on the long term ability of a system to reproduce (Campbell 1996).
Reproduction is defined as the rate of change of any (urban) system that “must be
sustained over time without exceeding the innate ability of the surroundings to absorb the
impacts of the process” (Neuman 2000, 3). Surroundings can be defined at local,
regional, and global scales. According to Portney (2003) sustainability has six different
77
dimensions related to sustainable biological resource use, sustainable agriculture,
carrying capacity, sustainable energy use, sustainable society and economy, and
sustainable development.
When used to describe a system of development, sustainability has another set of
varied definitions. In fact, Saunders (2002) found as many as fifty-seven definitions for
sustainable development. However, there is general consensus among most researchers
that sustainable development should include a balance among economic, social and
environmental considerations. In fact, sustainable development is often described as a
three-legged stool, with each leg representing economic, environmental, and social
(equity) impacts, or the three Es (Berke and Cortez 1995; Goodland and Daly 1996).
Some researchers expand their definition to include additional considerations. Berke
(2002), for example, notes two other dimensions of sustainable development: system
reproduction and the need to link the local to the global, adding that the best way to link
local to global is at the regional level. Similarly, Randolph (2004) agrees that
sustainability involves the three Es, but adds engagement and eternity to draw attention to
necessary political participation and a future orientation. In reality, achieving balance
between the three Es is often difficult because there is a greater focus on the economic
leg of the stool (Clark, 1995).
When the World Commission on Environment and Development (1987) adopted
the term “sustainable development” in 1987, it was linked to the idea that economic
development and environmental protection were compatible, suggesting that economic
growth furthered sustainability. The U.S. President’s Commission on Sustainable
Development (1994) promised harmony between environmental protection and economic
78
development. Today, there are definitely opposing viewpoints on how best to achieve
sustainability. On the one hand, cornucopians, believing in an expansionist worldview
associated with neo-classical economics, promote economic development as the way to a
sustainable future (Hotelling 1931; Ricardo 1973 [1817]; Barnett 1974; Simon and Kahn
1984; Sagoff 1990; Panayotou 1993). On the other hand, neo-Malthusians, having a
steady state, ecological worldview, focus more on the natural environment, and they call
for cooperation rather than competition, and for changes in our values, policies, and
personal commitments (Kropotkin 1955 [1902]; Boulding 1966, 1968; Ehrlich 1989;
Daly 1992, 1990, 1974; Etzioni 1994). Attempting to bridge this divide, Blassingame
(1998) and Orr (1992) argue that it is necessary to have changes at both physical
(technological) and ethical (social) levels. As an example, at the technological level,
people can live and consume as they are, but drive more efficient cars; at the social level,
people would change their residential preferences, and live in pedestrian-oriented
communities and have other options for travel.
Owens (1994) classifies these antipodal environmental and economic
development positions as weak and strong sustainable development. The weak definition
states that environmental considerations must be balanced against the benefits of
economic development, and various kinds of capital (human, human-made, natural and
social) are (infinitely) substitutable. Conversely, the strong definition gives
environmental considerations greater weight. Environmental capacities ultimately place
restraints on economic activity, and natural and human-made capital are not perfect
substitutes for each other. From this perspective, when people engage in individualistic
or “rational” economic behavior, they inevitably contribute to the depletion of resources
79
(Portney 2003). In the extreme, mainstream economic development undermines the
earth’s carrying capacity, especially with regard to “commons” resources such as air and
water. Malthus (1999 [1798]) and Mill (1965 [1848]), and more recently Ehrlich and
Ehrlich (1991), Hardin (1968, 1993) and Daly (1990, 1992), contend that the
environment needs to be protected from this kind of unfettered growth using a systematic
ecological filtering of all economic development strategies. However, current patterns of
(urban) growth appear to imply quantitative material increase rather than qualitative
improvement and change. Today, the scale of the human economy is resulting in growth
outcomes that exceed the vast, but finite, capacities of environmental sources and sinks
(Lyle 1999). In summary, the “fundamental question for ecological sustainability is
whether remaining natural capital stocks, including ecosystems and biophysical
processes, are adequate to support the anticipated demand of the human economy into the
next century while simultaneously maintaining the general life-support functions of the
ecosphere” (Rees 1997, 65). This fundamental question is ignored by mainstream
economic development analyses.
Arguing for strong sustainability, Clark (1995) contends that the term “sustainable
development” has been co-opted by the World Bank and corporations such as General
Motors, a company that has “consistently opposed environmental regulation.” He urges
us to:
Look outside! Everywhere you see fields asphalted, top soil flowing into storm sewers or contaminated by chemicals, wetlands drained, seashores developed, air and water polluted, grasslands and forests ravaged…These are common sights in the First World (developed countries). Restraint and careful planning are difficult to discern; uninhibited growth predominates (Clark 1995, 227).

80
An example of Clark’s vision in the study area is the recent clear-cutting of a huge swath
of wooded land over the Edwards recharge zone north of San Antonio for the Encino
Ridge residential subdivision referred to Chapter 2 of this dissertation. Furthermore,
Clark argues that those engaged in economic and real estate development are either
indifferent to or ignorant of the concept of sustainable development. Cornucopians fail to
acknowledge the first and second laws of thermodynamics, and the fact that people live
in a condition of high entropy compared to the past. “Millions of individual decisions,
based on conventional economic understanding of returns on investments, unleash
activity that further degrades the environment,…” (Clark 1995, 227). Likewise Boulding
(1966) and Daly (1974, 1992), calling for steady state economics, note that sustainability
is subordinate to development, and point out the fallacy of conventional market-driven
economics for ignoring humanity’s dependence on the natural world. Similarly,
MacNeill, Cox, and Jackson (1991, 198) ask the question: “How can the social and
cultural role of cities be enhanced to strengthen the economic and other roles of the city?”
In response, Clark would turn this question around to ask how economics can strengthen
the social and cultural roles of cities. After all, a good economy should free people from
economic concerns.
Sustainability and Urban Growth and Change
If some consider sustainable development to be an oxymoron, even more might
argue that the term “sustainable cities” is a malapropism (Blassingame 1998).
Nevertheless, cities, being “nodes of spatial, economic, social, and political geography
networks” are focal points in the debate about sustainable development (Button 2002,
217). Critical environmental thresholds at the global scale are being approached due to
81
actions and policies in urban areas, or at the local scale. For instance, the prospects of
irreversible climate change and ozone depletion are related to sprawling patterns of urban
growth and associated energy consumption (Rees 1997; Alberti and Marzluff 2004).
Clearly, most production, consumption, and transportation activities take place in
metropolitan areas. In the U.S.A., metropolitan area population increased from fifty-five
percent of total population in 1950 to eighty percent of total population in 2000 (Platt
2004a). It is for these very reasons that the challenge for a sustainable future is largely an
urban one (Capello and Nijkamp 2002).
Applying the three “E’s” to the post-industrial, postmodern city, Castells (2000,
119) contends that economic sustainability requires connectivity, or the ability of people
to link up, and a stock of “human resources capable of creating added value in the
information economy.” Social sustainability requires that people avoid social exclusion
and acknowledge the “plural identities that increasingly characterize our cities…”
(Castells 2000, 119). That is to say, neo-tribalism, or retrenchment in walled and gated
communities (CIDs) ends urban life as described by Mumford (1938, 480):
The city … is a geographic plexus, an economic organization, an institutional process, a theater of social action, and an esthetic symbol of collective unity . . . it is the city, the city as theater, that man’s more purposive activities are formulated and worked out, through conflicting and cooperating personalities, events, groups, into more significant culminations.
The key to sustainable communities is the involvement and common interest of its
members in protecting an identifiable, shared environment, and quality of life, similar to
Etzioni’s (1994) communitarianism and Tönnie’s (1963 [1887]) gemeinschaft. Finally,
ecological sustainability is the fight against the “irreversible deterioration of the
environment and quality of life,” a fight that is difficult given the fragmented status of
82
urban governments and resultant piece-meal planning efforts (Castells 2000, 119). For
example, in the Austin/San Antonio corridor region, there are currently eighty-eight
incorporated municipalities and thirteen County Commissioners’ Courts (U.S. Census
2005a).
Much of the ecological output of the planet is required to sustain an increasingly
urban society, but ecologically speaking, cities have become the human equivalent of
cattle feedlots, or, to put it more elegantly, they have become “the entropic black holes of
industrial society” (Rees 1995, 356). Thus, urban areas are appropriate for examining
sustainability initiatives, especially based on the notion of the ecological footprint (EF),
which measures the biologically productive area necessary to support current
consumption patterns, given prevailing technological and economic processes
(Wackernagel 1994; Wackernagel and Rees 1996; Holmberg et al. 1999). For every item
of material or energy consumption, a certain amount of land in different ecosystem
categories is required to provide the consumption-related flows and waste sinks. The
maximum load that can be imposed on the environment is a function not only of the
number of people, but even more so of per capita consumption, which is affected by the
form that human habitats take as well a culture’s lifestyle. To measure sustainability in
the study region, I will use variables related to energy consumption and sprawling urban
form.
A sustainable community is a place that seeks to contain the extent of the
footprint and keep to a minimum the destruction of habitat and the conversion of open
land to urban and developed uses. Along this line of thinking, Grant, Manuel, and
Joudrey (1996) note that many of today’s popular urban design models - e.g. Duany’s
83
(1991) Traditional Neighborhood Development or TND, and Calthorpe’s (1993) Transit
Oriented Development or TOD - do not confront the issue of sustainable development.
There is little consensus on a philosophy to guide the design of residential environments
other than that mandated by conventional urban planners. In fact, conventional urban
planning probably promotes development that is the opposite of sustainable, and will
require infusions of energy and dollars that will come from rising property taxes, sales
taxes, and user fees.
The larger question, which emerges relating to the impacts of urban growth and
change, is: What is the sustainability of development at all spatial scales. The urban
pattern of land use and its change is of central importance in conceptualizing
sustainability as a balance between social, economic, and environmental goals. Negative
environmental and socio-economic impacts of current land use patterns erode both the
environmental and the socio-economic resource base of an area, thus reducing the
environment’s ability to equitably support the needs of its population both in the short
and longer terms. From this point of view, it is important to measure progress toward
sustainability.
Measuring Sustainability
There have been numerous efforts at developing and measuring sustainability
using a variety of indicators. In fact, “dozens of communities throughout the country
have sustainable development programs” (Krizek and Power 1996, 33). At the local
scale, indicators should be used to provide guidelines as to the effects of growth on the
urban environment; they should be few in number and reflect important environmental
and socio-economic trends of interest (Button 2002). However, the use of indicators has,
84
in many cases, arguably been for purposes of economic development, or city promotion,
which actually can be counterproductive for global sustainability if one is an adherent of
the steady-state paradigm. Still, these efforts have given rise to some useful tools and
methods. For example, the City of Seattle, Washington, in a relatively genuine effort at
strong sustainability, published the 1995 Indicators of Sustainable Community in which
forty variables within five categories (environment, resources, economy, education, and
health) were used to ascertain either declining or improving trends towards sustainability.
Variables ranged from number of wild salmon in Puget Sound to water and energy use,
crime, employment concentration, and childhood asthma (Krizek and Power 1996). Yet,
one has to wonder if the interest in salmon is actually a “red herring” – are the presence
of salmon indicative of a healthy ecosystem, or an opportunity to collect tourist dollars,
or both? The City of Santa Monica, California uses sixteen indicators to track progress
toward sustainability, including wastewater flows, public open space, trees in public
spaces, and community gardens. The Urban Ecology Coalition in Minneapolis measures
such variables as percent of residents earning a living wage; percent of residents living
within the community and not commuting to work; travel time to work (which indicates
fossil fuel consumption as well as commitment to community); utility consumption; ratio
of highest annual income earned to lowest annual income earned; and the ecological
footprint of the city. In the Austin area, the Central Texas Sustainability Indicators
Project measures water consumption and water quality trends; energy use; air quality
(highest eight hour concentrations of ozone and nitrogen oxides); density in new
development; and building permits. Indicators can be used for multiple purposes as with
85
travel time to work, which, in the Minneapolis project, denotes energy use as well as
community involvement.
Examining traditional aggregate economic indicators such as local Gross
Domestic Product (GDP) and unemployment misses “important shifts in both the spatial
composition of economic activity (from core to green field, peripheral sites) and shifts
from manufacturing to service activities” (Button 2002, 222). In idealized circumstances,
environmental costs are fully internalized, information is perfect, and economic
indicators are true reflections of environmental costs. However, in the case of
environmental goods, not withstanding the work of Costanza (1996) and others, the
primary failing of using traditional economic indicators is that environmental resources
are outside market mechanisms and hence external to the costing process. This a major
failing of mainstream indicators, as it was in the efforts at measuring the costs of sprawl,
because the most apparent impact of sprawling urban development is its rearrangement of
biophysical attributes which cause a variety of interrelated local and global effects
(Forman 1995). To get to more genuine indicators, Alberti (1999) draws on concepts of
carrying capacity, ecological footprint, environmental space, and appropriated ecosystem
area. Azar et al. (1996) emphasize societal activities that affect nature rather than
environmental quality indicators, which is exactly what I am going to do. Focusing on
societal activities reveals trends which can provide indices of existing unsustainable
patterns.
To both highlight cultural consumption patterns, and to make the local/global
connection, Wackernagel and Rees (1996) developed the ecological footprint (EF). The
ecological footprint is a methodology which informs the selection of sustainability
86
indicators used in my research. The EF builds on earlier attempts to estimate the
dependence of human life on nature (Holdren and Ehrlich 1974; Whittaker 1975;
Martinez-Alier 1987; Meadows et al. 1992; Odum 1994; Duchin and Lange 1994; Cohen
1995; Opschoor and Costanza 1996; Folke et al. 1997). A key concept that underlies the
ecological footprint is the fair Earth share. Given the amount of productive land on
Earth, each person’s fair Earth share is approximately 1.5 hectares (3.7 acres); the
American per capita footprint required to support current consumption levels is 9.7
hectares (24.0 acres) (Wackernagel, Monfreda, and Duemling 2002). Needless to say,
people in developed countries would need to alter their consumption and waste habits to
approach the global average. This could involve building smaller homes and driving less.
Wackernagel and Rees go on to define five major categories of consumption: food,
housing, transportation, consumer goods, and services.
In this research, I will use census data to measure housing and transportation
consumption, as well as variables related to energy use as indicators of sustainable or
unsustainable outcomes. In the Austin-San Antonio corridor study area, people appear to
be building bigger houses and driving more. While it is not the purpose of this research
to measure in detail the ecological footprint of the study region, this theory helps
operationalize the measurement of sustainability in the next chapter. In line with the
sustainability indicators projects (Seattle, Santa Monica, and Minneapolis) and other
similar research efforts, I will include, among other data, house size, commuting time and
distance, and the geography of income to measure both the socio-economic and
environmental aspects of sustainability.
87
Planning for Sustainable Urban Development
If the Austin/San Antonio region exhibits unsustainable development patterns,
what, if anything, can be done to make a change - if change is deemed necessary by
policy-makers? To effectively use comprehensive plans and planning tools such as
zoning ordinances, subdivision regulations, etc., and find new tools appropriate to
modern urban morphology, policy-makers would need to understand the dynamics of
urban fringe sprawl and anticipate the wide-ranging effects of continuous urban
deconcentration (Nelson and Dueker 1990, 1994). In fact, “without planning and
coordination of government services attuned to the special challenges of exurban
development, the result may be exurban sprawl that could make suburban sprawl seem a
highly desirable alternative” (Nelson and Dueker 1994, 45).
Recent literature reveals that the sustainability paradigm(s) can enable planners to
successfully grapple with Nelson and Dueker’s “special challenges.” Embracing
sustainability can help planners focus on big ideas, systems, interrelationships,
connectivity, and multi-scales; it can help make planning proactive, overcoming the lack
of a shared civic vision rooted in a sense of place. The growing interest in sustainability
and the “new” urban ecology of Steiner (2000a), Collins et al. (2000), and others offer
opportunities for a revival of the idea that planning can be visionary, practiced on a large
scale, and involve meaningful and equitable civic involvement. Berke (2002, 34)
contends that sustainable development can enable planners to “shift the practice of local
participation from dominance by narrow special interests to a more holistic and inclusive
view.” In other words, the sustainability paradigm can serve as the much needed
overarching guide planners sorely lack (Beatly and Manning 1998). Within the context
88
of weak sustainability (i.e. the approach that emphasizes mainstream economic growth),
planners must be able to reconcile three conflicting interests: promote economic growth,
equitably distribute growth, and not degrade the ecosystem in the process (Campbell
1996). Within the context of strong sustainability (i.e. the approach that gives ecological
and economic considerations equal weight), planners need to nurture a sound economy,
help create fair and humane places, and promote sound resource management and/or eco-
development (Randolph 2004). [Eco-development is a paradigm in which human society
and nature co-develop, and includes a restructured economic system which goes beyond
giving economic values to environmental resources, but rather considers economic values
in ecological terms (Colby 1991).]
Berke (2002) defines a set of six operational performance principles for
sustainability: 1) harmony with nature, 2) livable built environment, 3) place-based
economy, 4) equity, 5) polluters pay, and 6) responsible regionalism. (In the
methodology chapter, I will use these principles to analyze the comprehensive plans of
Austin and San Antonio.) With these principles in mind, it becomes possible to “consider
local plans and development projects that account for cumulative impacts of actions
beyond the immediate locality as well as ecological and equity implications of local
choices about housing size, accessibility of jobs, quality schools, retail, and daily
transportation” (Berke 2002, 34). Berke’s performance principles help inform my choice
of variables with regard to the measurement of growth and change in the Austin/San
Antonio paradigmatic region. Planners should be focusing on performance rather than
form. In my research, I will be measuring performance more than specific urban
patterns. After all, sprawl takes on many forms (Galster et al. 2001; Talen 2003).
89
Planners have a long history of believing that there are ideal urban forms or ideal cities,
e.g. Howard, LeCorbusier, Wright, Soleri, Duany, and Calthorpe (Audirac 1990). But in
today’s America, urban citizens and planners alike might be best served by letting go of
the notion of the “eco-garden of Eden lost by modern society … our involuntary diaspora
from a pre-industrial, ecotopian Eden” (Campbell 1996, 303). Better places can be
created by focusing on function, process, and performance – that is the underpinning
philosophy of my research and the rationale for the research methods outlined in the next
chapter.
90
CHAPTER V
METHODOLOGY
Research Goals and Questions to be Answered
The goals of this research are: 1) to determine whether growth trends in the
Austin/San Antonio paradigmatic region are sustainable; and 2) to determine whether
planning policies are reflected in growth outcomes. To this end, I will use both
quantitative and qualitative methods as presented in Figure A1 in the Appendix to answer
two sets of questions. The first set of questions relates to sustainability, in particular
whether urban growth trends are eroding the natural and socio-cultural environments.
The second set of questions relate to whether growth outcomes reflect (comprehensive)
planning policies. Sustainability questions include:
Are growth trends in the Austin/San Antonio paradigmatic region, as measured through socio-economic and urban performance indicators, sustainable?
1. Has sprawl increased during the study period of 1970/80 to 2000? (Data availability will determine whether 1970 or 1980 is used as the beginning year).
2. Are social distance and geographic polarization (i.e. inequality)
increasing?
3. How has energy use as measured by footprint variables (e.g. larger and more spread out homes) changed over time?
Based on these indicators, how do the Austin and San Antonio extended MSAs compare to each other and the region; and how do the cities of Austin and San Antonio compare to each other and the region?
91
Based on the answers to the above questions and comparisons, how has quality of life in the region changed over time (if it has changed)?
Planning policy questions are:
How do the comprehensive plans of Austin and San Antonio rate as measured by Berke-Conroy’s sustainability principles? 1. Do the outcomes for sprawl, socio-economic distance and energy
flows for the two cities reflect the sustainability “score” of the comprehensive plans?
2. What policy issues can be identified?
The Study Areas
I will be examining variables over a twenty to thirty year period at the local scale
through my analyses of the major urban centers, Austin and San Antonio; at the macro
scale through my analyses of the two (extended) MSAs or “sub-regions;” and at the
regional scale as defined by the Austin/San Antonio corridor. I will use census tracts as
my basic geographic units for measurement. Census tracts are ideal micro-level units of
analysis over time because they are small, basically permanent statistical subdivisions of
a county that have relatively homogenous populations within each tract.
To delineate the Corridor Region, I will use census tracts within the Austin/Round
Rock and San Antonio MSAs as defined by the 2000 Census, as well as selected tracts in
the adjacent counties of Kendall, Atascosa, Medina, and Bandera. I will include tracts
outside the two MSAs based on their “relationship” with either one or both of the two
MSAs as measured by the Economic Research Service’s (ERS) rural-urban commuting
area (RUCA) codes. These codes are based on measures of urbanization, population
density, and daily commuting, and basically define the level of commuting from a tract to
work centers (Morrill, Cromartie, and Hart 1999). The use of RUCA codes enables me to
92
define the study area in the spirit of MacKaye’s “sphere” and Geddes’ “urban field”. For
the analysis of sprawl, I will further divide the Corridor Region into two sub-regions: the
Austin/Round Rock MSA which includes Bastrop, Caldwell, Hays, Travis, and
Williamson counties; and the San Antonio “extended” MSA which includes additional
tracts in Atascosa, Bandera, Kendall, and Medina counties based on their RUCA codes.
For purposes of comparing growth outcomes and planning policies, the cities of
Austin and San Antonio will be defined based on their city limits as of 1980. Since 1970,
1980 and 1990 census data has been normalized to the year 2000, tract boundaries as of
the year 2000 will be used to determine which tracts are within and without the 1980 city
limits. A tract that straddles a city boundary will be determined to be a “city tract” if it is
more than fifty percent within the boundary line, or if the majority of the tract’s
population appears to live within the city limits.
Data Acquisition
I will acquire data to measure the operational variables sprawl, inequality, and
energy flows from the U.S. Census for the years 1970, 1980, 1990, and 2000, primarily
as presented in the Neighborhood Change Database (NCDB) 1970 – 2000 Tract Data
CD, produced by Geolytics, Incorporated and the Urban Institute. The NCDB has US
Census Long Form data for the years of the study at the census tract level. The data is
accessible by tract per census year or normalized by 2000 tract boundaries.
Unfortunately, in addition to the usual problems of changes in census design and
definitions over time (especially from 1970 to 1980), there are a limited amount of data in
the Geolytics CD from the earlier censuses compared to 1990 and 2000. As a result,
trend analysis and direct comparison over time for certain variables will be problematic
93
or impossible. To supplement the NCDB I will use printed historic censuses, but in most
cases measurements of change will be limited to the twenty years from 1980 to 2000, or
in some cases the ten years from 1990 to 2000. Finally, statistical analyses for separate
tracts using the Geolytics CD are limited to 240 census tracts at a time. The only county
in the study area with more than 240 tracts is Bexar County, which has 278 tracts. The
Geolytics software does allow analyses of tracts as subsets of counties, but in most cases,
I will export the data to more robust programs such as ArcMap or Microsoft Excel.
Operational Definitions
I will use three groups of variables - sprawl, socio-economic distance (inequality), and
energy flows - to operationalize sustainability in the study areas (Table 2). Increases over
time in sprawl, social distance (inequality and separation), and energy use would be
indicative of trends that may not be sustainable as well as a deteriorating quality of life.
Historically, sprawl has been examined through the cost-benefit analysis paradigm, but I
will use sprawl as an indicator of socio-economic and environmental sustainability as
well as quality of life. I will use changes in social-economic distance (or inequality), an
on-going theme in American urban geography as pointed out in the literature review, to
measure progress (or lack of progress) toward sustainability, quality of life, and
community involvement. Measuring changes in inequality can help determine the
effectiveness of policies aimed at affecting equity (such as affordable housing), and
generate data necessary for policy analysis. Finally, while my study does not delve into
ecological footprint analysis in depth, the literature justifies the use of indicators related
to energy flows and consumption to measure trends in sustainability (Rees 1995;
Wackernagel and Rees 1996).
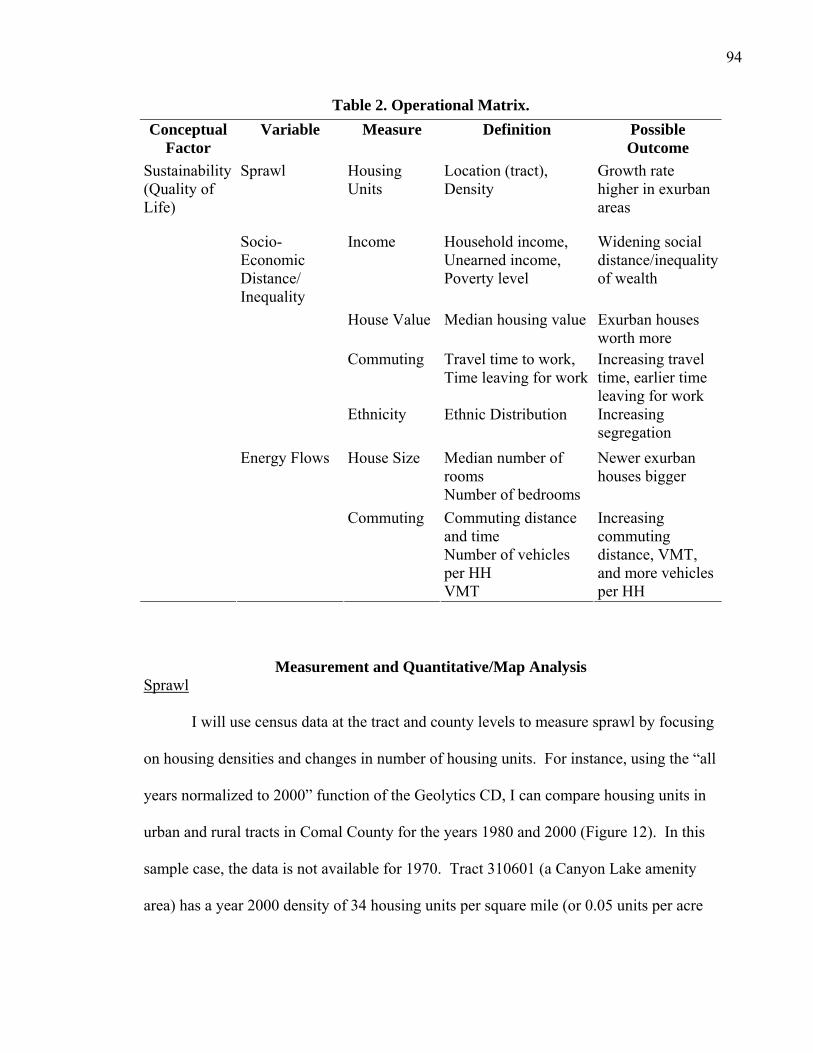
94
Table 2. Operational Matrix. Conceptual
Factor Variable Measure Definition Possible
Outcome Location (tract), Sprawl Housing
Units Density Growth rate higher in exurban areas
Household income, Unearned income, Poverty level
Income
Widening social distance/inequality of wealth
House Value Median housing value Exurban houses worth more
Travel time to work,
Socio-Economic Distance/ Inequality
Commuting Ethnicity
Time leaving for work Ethnic Distribution
Increasing travel time, earlier time leaving for work Increasing segregation
Median number of rooms
House Size
Number of bedrooms
Newer exurban houses bigger
Commuting distance and time Number of vehicles per HH
Sustainability (Quality of Life)
Energy Flows
Commuting
VMT
Increasing commuting distance, VMT, and more vehicles per HH
Measurement and Quantitative/Map Analysis Sprawl
I will use census data at the tract and county levels to measure sprawl by focusing
on housing densities and changes in number of housing units. For instance, using the “all
years normalized to 2000” function of the Geolytics CD, I can compare housing units in
urban and rural tracts in Comal County for the years 1980 and 2000 (Figure 12). In this
sample case, the data is not available for 1970. Tract 310601 (a Canyon Lake amenity
area) has a year 2000 density of 34 housing units per square mile (or 0.05 units per acre
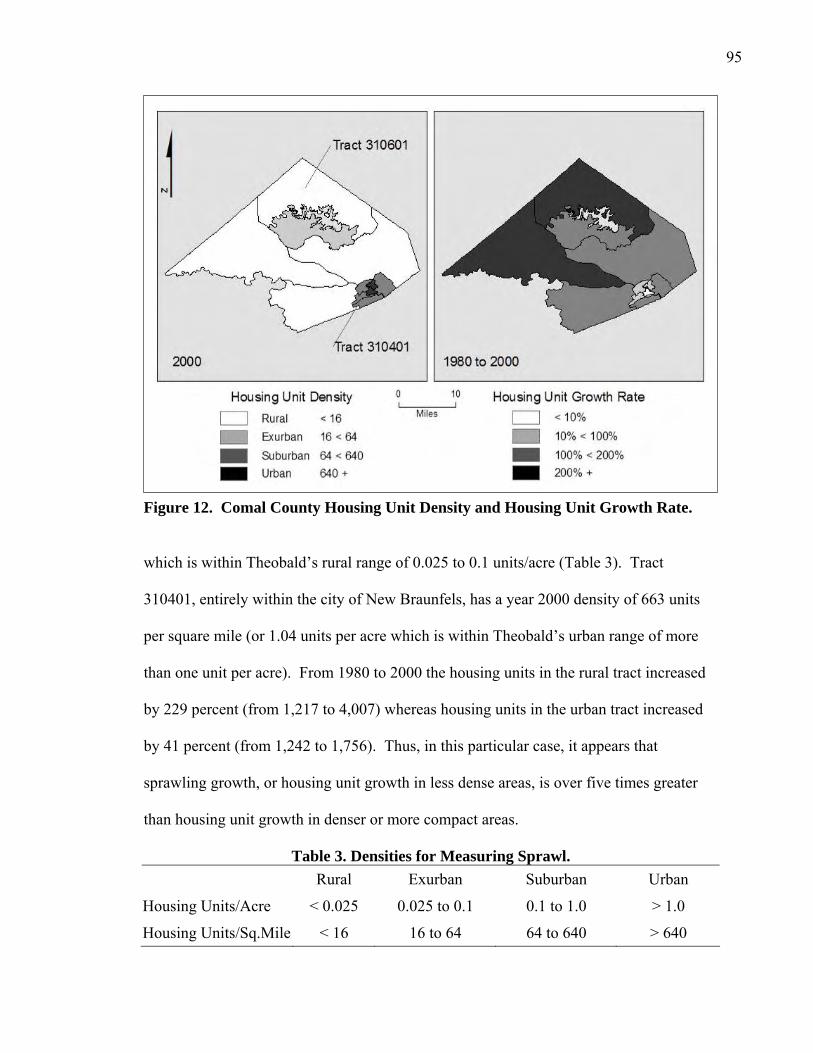
95
which is within Theobald’s rural range of 0.025 to 0.1 units/acre (Table 3). Tract
310401, entirely within the city of New Braunfels, has a year 2000 density of 663 units
per square mile (or 1.04 units per acre which is within Theobald’s urban range of more
than one unit per acre). From 1980 to 2000 the housing units in the rural tract increased
by 229 percent (from 1,217 to 4,007) whereas housing units in the urban tract increased
by 41 percent (from 1,242 to 1,756). Thus, in this particular case, it appears that
sprawling growth, or housing unit growth in less dense areas, is over five times greater
than housing unit growth in denser or more compact areas.
Table 3. Densities for Measuring Sprawl. Rural Exurban Suburban Urban
Housing Units/Acre < 0.025 0.025 to 0.1 0.1 to 1.0 > 1.0
Housing Units/Sq.Mile < 16 16 to 64 64 to 640 > 640
Figure 12. Comal County Housing Unit Density and Housing Unit Growth Rate.
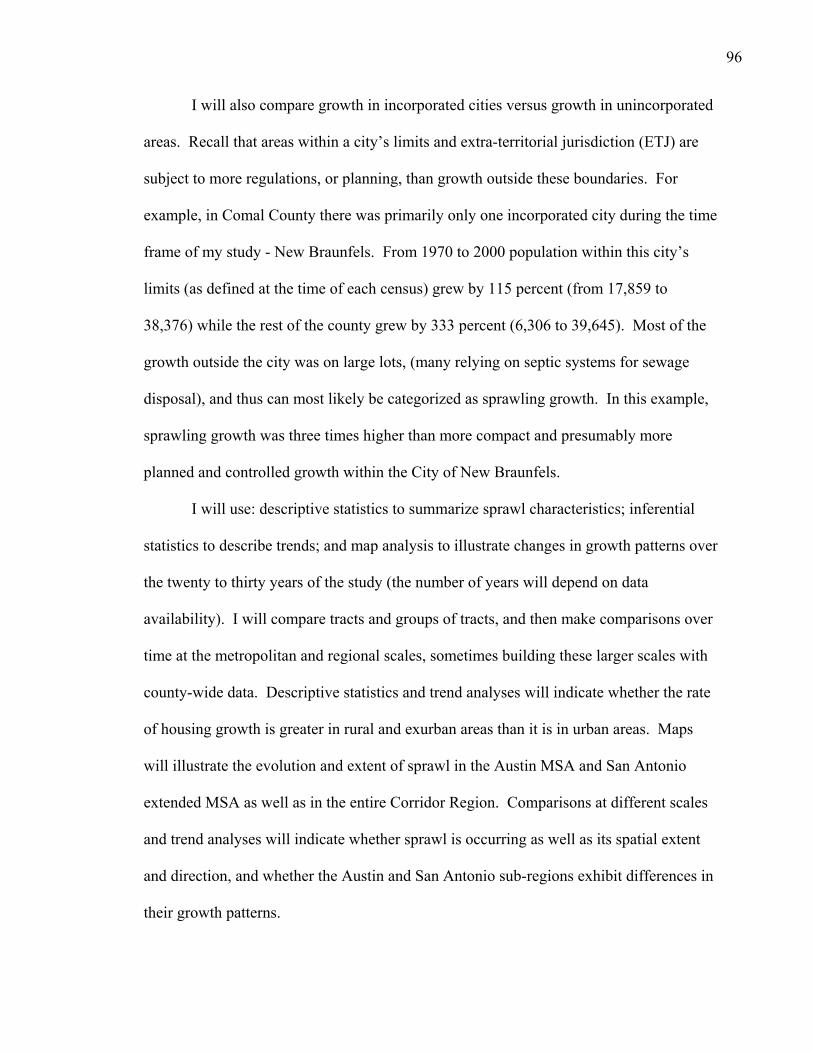
96
I will also compare growth in incorporated cities versus growth in unincorporated
areas. Recall that areas within a city’s limits and extra-territorial jurisdiction (ETJ) are
subject to more regulations, or planning, than growth outside these boundaries. For
example, in Comal County there was primarily only one incorporated city during the time
frame of my study - New Braunfels. From 1970 to 2000 population within this city’s
limits (as defined at the time of each census) grew by 115 percent (from 17,859 to
38,376) while the rest of the county grew by 333 percent (6,306 to 39,645). Most of the
growth outside the city was on large lots, (many relying on septic systems for sewage
disposal), and thus can most likely be categorized as sprawling growth. In this example,
sprawling growth was three times higher than more compact and presumably more
planned and controlled growth within the City of New Braunfels.
I will use: descriptive statistics to summarize sprawl characteristics; inferential
statistics to describe trends; and map analysis to illustrate changes in growth patterns over
the twenty to thirty years of the study (the number of years will depend on data
availability). I will compare tracts and groups of tracts, and then make comparisons over
time at the metropolitan and regional scales, sometimes building these larger scales with
county-wide data. Descriptive statistics and trend analyses will indicate whether the rate
of housing growth is greater in rural and exurban areas than it is in urban areas. Maps
will illustrate the evolution and extent of sprawl in the Austin MSA and San Antonio
extended MSA as well as in the entire Corridor Region. Comparisons at different scales
and trend analyses will indicate whether sprawl is occurring as well as its spatial extent
and direction, and whether the Austin and San Antonio sub-regions exhibit differences in
their growth patterns.
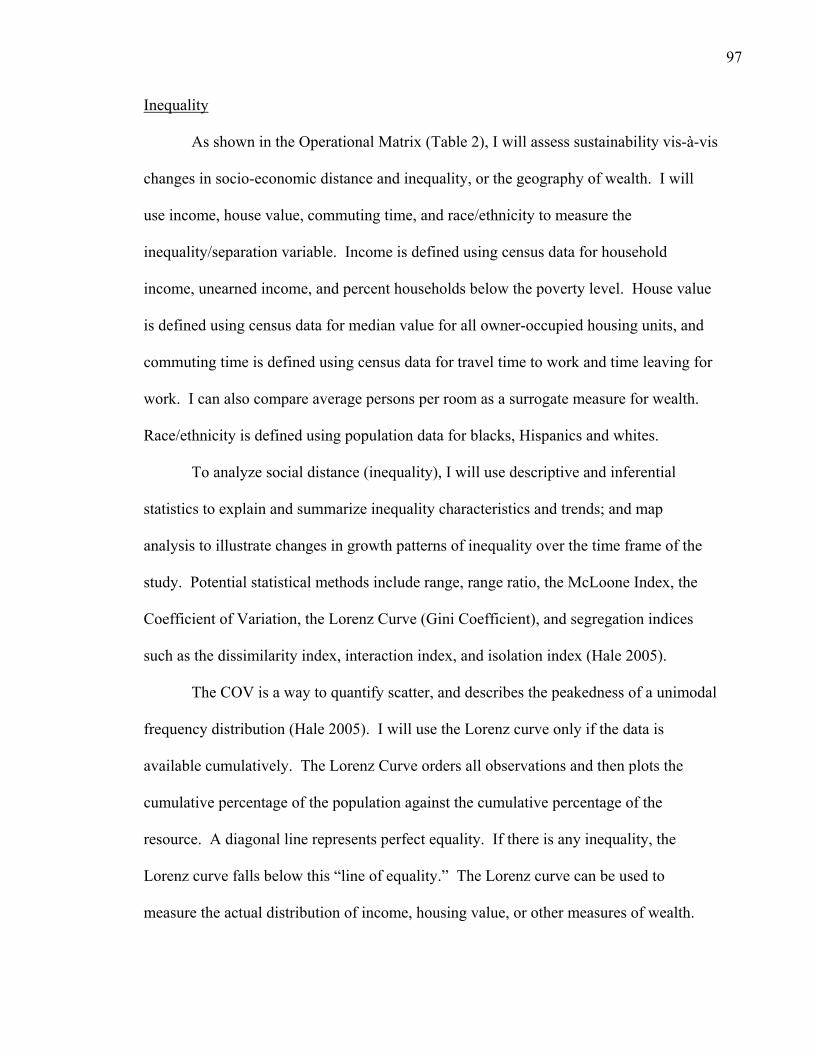
97
Inequality
As shown in the Operational Matrix (Table 2), I will assess sustainability vis-à-vis
changes in socio-economic distance and inequality, or the geography of wealth. I will
use income, house value, commuting time, and race/ethnicity to measure the
inequality/separation variable. Income is defined using census data for household
income, unearned income, and percent households below the poverty level. House value
is defined using census data for median value for all owner-occupied housing units, and
commuting time is defined using census data for travel time to work and time leaving for
work. I can also compare average persons per room as a surrogate measure for wealth.
Race/ethnicity is defined using population data for blacks, Hispanics and whites.
To analyze social distance (inequality), I will use descriptive and inferential
statistics to explain and summarize inequality characteristics and trends; and map
analysis to illustrate changes in growth patterns of inequality over the time frame of the
study. Potential statistical methods include range, range ratio, the McLoone Index, the
Coefficient of Variation, the Lorenz Curve (Gini Coefficient), and segregation indices
such as the dissimilarity index, interaction index, and isolation index (Hale 2005).
The COV is a way to quantify scatter, and describes the peakedness of a unimodal
frequency distribution (Hale 2005). I will use the Lorenz curve only if the data is
available cumulatively. The Lorenz Curve orders all observations and then plots the
cumulative percentage of the population against the cumulative percentage of the
resource. A diagonal line represents perfect equality. If there is any inequality, the
Lorenz curve falls below this “line of equality.” The Lorenz curve can be used to
measure the actual distribution of income, housing value, or other measures of wealth.
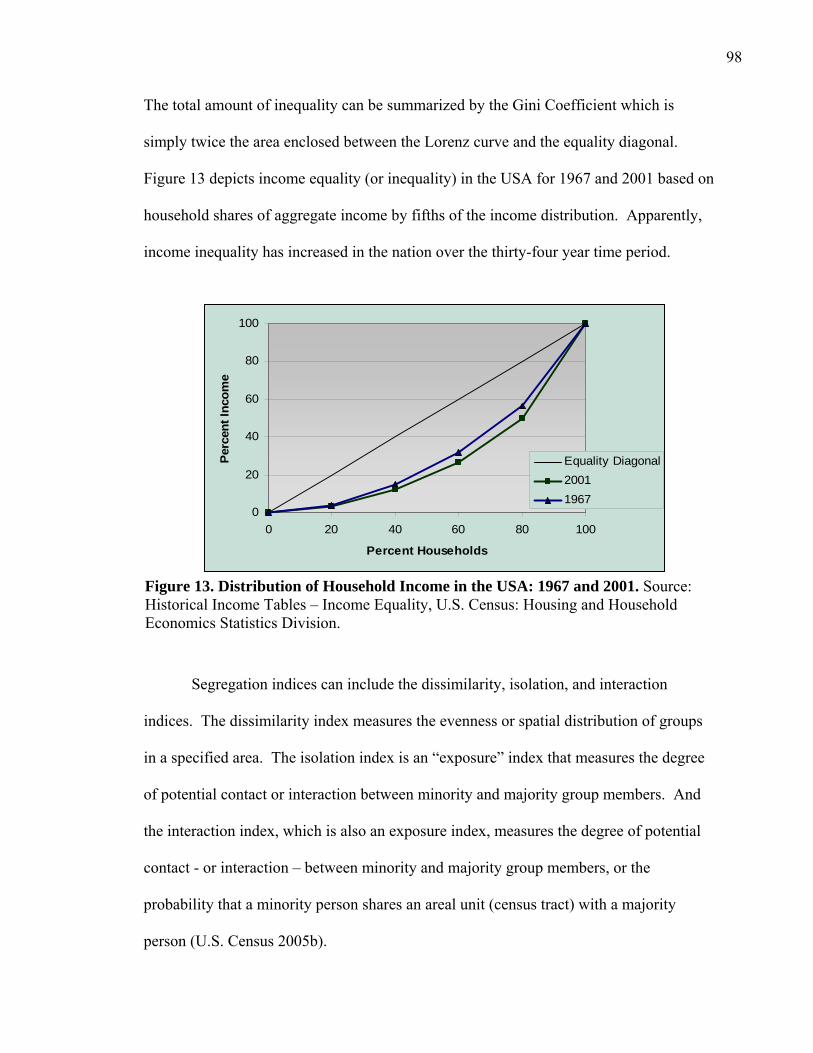
98
The total amount of inequality can be summarized by the Gini Coefficient which is
simply twice the area enclosed between the Lorenz curve and the equality diagonal.
Figure 13 depicts income equality (or inequality) in the USA for 1967 and 2001 based on
household shares of aggregate income by fifths of the income distribution. Apparently,
income inequality has increased in the nation over the thirty-four year time period.
Segregation indices can include the dissimilarity, isolation, and interaction
indices. The dissimilarity index measures the evenness or spatial distribution of groups
in a specified area. The isolation index is an “exposure” index that measures the degree
of potential contact or interaction between minority and majority group members. And
the interaction index, which is also an exposure index, measures the degree of potential
contact - or interaction – between minority and majority group members, or the
probability that a minority person shares an areal unit (census tract) with a majority
person (U.S. Census 2005b).
0
20
40
60
80
100
0 20 40 60 80 100
Percent Households
Perc
ent I
ncom
e
Equality Diagonal20011967
Figure 13. Distribution of Household Income in the USA: 1967 and 2001. Source: Historical Income Tables – Income Equality, U.S. Census: Housing and Household Economics Statistics Division.

99
I will analyze changes in socio-economic distance from 1980 or 1990 to 2000. In
a few cases I can use 1970 data. Analysis at the city scale will reveal trends in
sustainability and enable comparisons between the (extended) MSAs and cities of Austin
and San Antonio. Regional analysis will set the context within which growth and change
in the two major cities is occurring, and help reveal regional trends in socio-economic
distance. I will ask the question: “Why do the spatial patterns in the maps look the way
they do?” and relate the patterns to the comprehensive plan analysis.
Energy Flows
I will measure energy flows using house size and commuting data as surrogates
for energy consumption. House size will be defined using census data for median
number of rooms and number of bedrooms. Commuting will be defined using census
data for commuting distance and number of vehicles per household, as well as vehicle
miles traveled (VMT) derived from the Texas Transportation Institute’s Travel Time
Index. Energy flows can also be measured using mean miles per gallon (if available) and
the outcomes of the sprawl measurements. As pointed out earlier, housing growth in
incorporated areas is more likely to be more compact and “energy efficient” than growth
in exurban or unincorporated areas.
To analyze energy flows I will use descriptive statistics to describe and
summarize measurement results, inferential statistics to describe and summarize trends,
and map analysis to illustrate changes in growth patterns over the twenty to thirty years
of the study. By way of example, Figures 14 and 15 illustrate change from 1970 to 2000
in number of bedrooms in Travis County. In the series of maps, darker shaded census
tracts are those in which houses with more than four bedrooms account for more than

100
Figure 14. Travis County Houses with Four or More Bedrooms. Shaded tracts have more than thirty-three percent of housing units with four or more bedrooms.
thirty-three percent of total housing units in the tract. Almost all darker-shaded tracts are
west of Interstate 35, in the higher amenity Hill Country part of the county. The chart
tracks the changes in total number of housing units in Travis County with four or more
bedrooms. An exponential trend line (solid without markers) was created with Microsoft
Excel, and includes regression equation and R2. The maps and accompanying chart
indicate a dramatic increase from 1970 to 2000 in number of housing units with four or
more bedrooms in Travis County.

101
y = 4961.1e0.5918x
R2 = 0.9906
0
10,000
20,000
30,000
40,000
50,000
60,000
1970 1980 1990 2000
Hou
ses
with
4-P
lus
Bed
room
s
Figure 15. Travis County Four or More Bedroom Trend Line: 1970 to 2000. Total number of housing units in Travis County with four or more bedrooms. Chart includes exponential trend line (solid, without markers) with regression equation and R2. Source: U.S. Census.
Qualitative Analysis of Planning Policies
To determine whether planning policies are reflected in growth outcomes (Goal 2
of my research) I must evaluate the comprehensive plans and planning processes of
Austin and San Antonio. To do this, I will examine the historical processes that led up to
the adoption of two comprehensive plans, one adopted by Austin in 1977 and 1979, and
the other adopted by San Antonio in 1980 and 1983. I will also do a content analysis of
each plan. More recent planning efforts in the late 1980s and in the 1990s will not be
analyzed as there is insufficient time for their outcomes to be reflected in the census data.
For clarification, planners use the terms comprehensive plan, master plan, and
general plan interchangeably. Comprehensive plan is the term most commonly used, and
refers to a long-term (usually twenty years) basic plan designed to guide a community’s
development. In the context of planning, the meaning of the word comprehensive is two-
fold. Physically, a comprehensive plan covers the entire community, usually including

102
its extra-territorial jurisdiction (ETJ), and often includes the surrounding region that the
city is a part of. Conceptually, a comprehensive plan covers all aspects of a community’s
development, typically including chapters or “elements” on land use, services,
transportation, historic preservation, etc. My analysis will focus on the land use element
of the two plans, but will also include other elements such as housing and transportation
that are part of the physical development of a city.
Regardless, I am analyzing comprehensive plans because they are the only
documents that look at the big picture of a community’s development over time. Today,
it seems planners are busy dealing with myriad details of the development process.
Zoning and subdivision ordinances address urban growth at the lot and block scale, one
development at a time. Developers naturally focus on their particular project. Thus, the
comprehensive plan, despite its drawbacks, is the document by default that has the
potential to address the larger scale that sustainable development requires.
First, I will provide a historical review for both the Austin and San Antonio
comprehensive plans, paying particular attention to the issues uncovered in the
background chapter. These issues include battles over abstract space versus social space,
or who or what special interest groups affect the location and pattern of growth in the two
cities and their regions. For this part of the analysis, I will rely heavily on a series of
interviews conducted in the 1980s as part of a compilation of urban-planning history in
Texas conducted by the Texas Chapter of the American Planning Association (1977-
1994). Transcripts of the interviews and relevant documents are available for viewing at
the University of Texas Alexander Architectural Archive located in Austin.
103
To measure how well the two adopted plans support sustainable development, I
will conduct a content analysis of each plan. I will base my analysis on Berke and
Conroy’s (2000) plan evaluation protocol. Berke and Conroy evaluated thirty plans’
policies and/or goals based on how that policy or goal was related to one of six
sustainability principles, and whether the policy or goal was suggested or required. They
defined the six basic principles for sustainable development as follows:
1. Harmony with Nature - land development should support ecosystem functions rather than modify or overwhelm them. Activities should maintain water quality and reduce flooding, two critical issues in the Corridor Region.
2. Livable Built Environments - development should create places adapted to the
desired activities of inhabitants. This principle is best defined by Lynch’s (1981) five dimensions of good city form: vitality, sense, fit, access, and control. Development should promote a sense of place and support community identity and attachment.
3. Place-based Economy – the local economy should work within natural system
limits and not cause a deterioration of the resource base, including air and water quality. The economy should meet locally defined needs and aspirations, doubtless a challenge in today’s global economy, and should enhance community livability.
4. Equity – land use patterns should improve the conditions of low-income
populations and afford equitable access to social and economic resources in the community.
5. Polluters Pay – interests that cause adverse community impacts should bear
the cost of pollution and other harms.
6. Responsible Regionalism – communities should be responsible for the consequences of their actions and not harm other jurisdictions in pursuit of their own objectives.
Berke and Conroy had several findings in their research. First, most plans
strongly advanced the Livable Built Environment principle. Transportation elements
emphasized reducing congestion and creating pedestrian-friendly streets. Land-use
elements emphasized density, proportion, mixed-use, and compatibility. Environmental
104
elements supported livable built environment needs more so than ecological integrity.
The two sustainability principles that received minimal attention were Polluters Pay and
Responsible Regionalism.
I will look closely at the plans adopted by Austin and San Antonio and ask 1)
How do the plan’s policies fit into these six basic principles for sustainable development;
and 2) How strong are the plan’s policies? I will determine the strength of the policy
according to the strength of the terms employed. Strong verbs require action, and include
words such as will, must, assure, develop, and adopt. Weak verbs suggest an action, and
include words such as encourage, recommend, should, would, could, promote, improve,
and investigate. As an example, the policy statement “encourage transportation patterns
that reinforce the image of distinct areas” falls within the Livable Built Environment
principle, but is weak because the word encourage is used. If the word ensure had been
used, the statement would have been considered strong. Another example is a city
designating stream corridors as worthy of protection for water quality and wildlife
habitat. The city intends to establish an overlay zone based on a buffer around streams.
This goal fosters the Harmony with Nature principle, but is considered weak because of
the use of the suggestive word intends. The goal would have been considered strong if
the word will had been used, i.e. “will establish an overlay zone.” Berke and Conroy
used the scoring results to create indices of each sustainable development principle for
each of the plan’s elements - usually housing, transportation, environment, energy, land
use and design, economic development, and public facilities. I will not take this final
step because the San Antonio Master Plan is not a traditional comprehensive plan as were
the plans that Berke and Conroy analyzed. The San Antonio Plan has a very limited

105
number of policies and elements. I will explain this point in more detail in the next
chapter. This type of qualitative analysis is unavoidably subjective, and my
interpretations of the sustainability principles will be broad-based. However, my
academic and professional background qualifies me for this task.
Admittedly, there is a drawback to using comprehensive plans as units of analysis.
The plans’ authors may be using catch phrases with “little meat on the bones”, especially
when discussing “sustainability” or “sustainable development.” In fact, Berke and
Conroy (2000, 30) note “the frequent criticism that the sustainable development concept
is superficial, lacks political commitment, and cannot serve as an influential basis for
policy development.” Indeed, what would make comprehensive plans that claim to deal
with sustainable growth actually deal with it? This is a topic for further research.
However, I must point out that neither the Austin or San Antonio plans have to claim to
promote sustainable development per se, but simply growth patterns and dynamics that
could result in sustainable outcomes.
Possible Conclusions
In the discussion and conclusions phase of the research, I will assess whether
there appear to be differences between Austin and San Antonio in their planning
approaches and growth outcomes, as set within the regional context. I will need to
consider the political economy and environmental “personalities” of the two cities as
affecting each area’s planning approaches and growth outcomes. If indeed there is a
difference in the city’s planning approach to sustainability (as measured by their
comprehensive plans), I will relate that difference back to the findings in the quantitative
106
and map analysis phase of this search (the analysis of sprawl, socio-economic distance
and energy flows).
Based on my understanding of the literature and my insights into the urban
growth dynamics gained from living and working in the region for over thirty years, I
anticipate that the research will indicate that growth and change in the region is not
sustainable. Rather, it is becoming increasingly characterized by fragmentation and
polarization of people living in and moving about the Corridor Region. I expect to find
bigger and more expensive homes demanding more energy inputs being built west of
Interstate 35 on environmentally fragile land. Commute times and distances are likely
increasing which adds to air quality woes and contributes to a loss of community and a
lower quality of life. Maps of the two sub-regions showing trends in sprawl, socio-
economic distance, and energy flows may look the same, even though qualitative analysis
might indicate a difference in planning paradigms between Austin and San Antonio. I
will discuss the research in light of the literature, and anticipate discussing whether
planning can be used to achieve sustainable development. Regardless of the outcome of
the research, the findings should shed light on the patterns and dynamics of contemporary
American urban development and the relationship of planning to sustainable
development. Table 4 summarizes the range of possible outcomes and their conclusions.
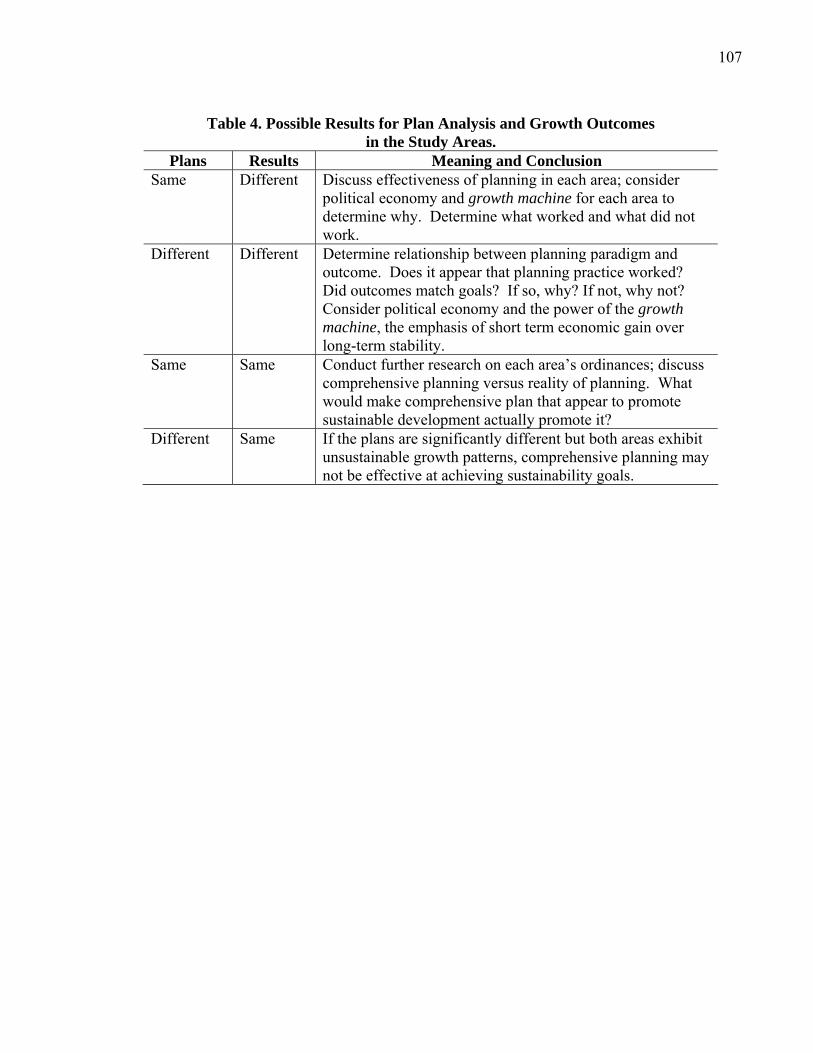
107
Table 4. Possible Results for Plan Analysis and Growth Outcomes
in the Study Areas. Plans Results Meaning and Conclusion
Same Different Discuss effectiveness of planning in each area; consider political economy and growth machine for each area to determine why. Determine what worked and what did not work.
Different Different Determine relationship between planning paradigm and outcome. Does it appear that planning practice worked? Did outcomes match goals? If so, why? If not, why not? Consider political economy and the power of the growth machine, the emphasis of short term economic gain over long-term stability.
Same Same Conduct further research on each area’s ordinances; discuss comprehensive planning versus reality of planning. What would make comprehensive plan that appear to promote sustainable development actually promote it?
Different Same If the plans are significantly different but both areas exhibit unsustainable growth patterns, comprehensive planning may not be effective at achieving sustainability goals.
108
CHAPTER VI
PLANNING ANALYSIS
The 1970s was a decade of intense interest in comprehensive planning in both
Austin and San Antonio. Rapid growth, threats to the environment, citizens’ concerns for
each city’s unique characteristics and sense of place, and the availability of federal
funding all coalesced at that time to produce comprehensive plans adopted in 1977-79 in
Austin and 1980-83 in San Antonio. Sustainable development is dependent upon the
location of urban growth. In the planning processes that produced these comprehensive
plans, each community addressed the issue of where development should go. In both
cases, this element of the plan proved to be the most controversial.
In this chapter, I evaluate Austin and San Antonio’s planning processes and
comprehensive plans, focusing on parallel planning efforts that led to the plans adopted in
the late 1970s and early 1980s. First, I will present a historical analysis of
comprehensive planning in each city, highlighting the evolution of key issues that have
contributed to each community’s planning temperament. Second, I will present a content
analysis of the strength and sustainability principles within each adopted comprehensive
plan. Finally, I conclude this chapter by discussing the similarities and differences
between the Austin and San Antonio plans and how each plan relates to sustainable
development, the location of growth, and battles over land use that will determine the
form and function that the communities will take in the future.
109
Comprehensive Planning in Austin
In 1924, Austin changed from a City Commission to a Council-Manager form of
government, a move that San Antonio would make almost three decades later. The shift
was part of a nationwide movement away from a form of municipal government that was
frequently corrupt toward a more professional and scientific approach to managing
American cities. Part of this progressive movement was the legitimization and rebirth of
urban planning. The idea that city planning could become official city policy was an
outgrowth of the City Beautiful movement, and Austin was no exception. The first City
Manager assessed the condition of Austin as deplorable (Humphrey 1985), a view echoed
in A Social Survey of Austin (Hamilton, 1913). In fact, the Survey could be considered an
Austin version of Jacob Riis’ (1890) pivotal work How the Other Half Lives, which
exposed sordid social conditions in New York City, and initiated housing reforms and
spurred interest in planning across the nation.
As a consequence of this new-found community awareness, the Austin City
Council called for the development of a comprehensive plan. The result was the 1928
plan, written by Dallas consulting firm Koch and Fowler, which called upon Austin to
develop its strengths as a residential, cultural, educational, and recreational center.
Significantly, the 1928 plan emphasized the importance of preserving the city’s natural
beauty and open space, a theme that would prove enduring throughout all of Austin’s
comprehensive planning efforts. In essence, this emphasis on natural beauty and open
space marks the genesis of Austin’s environmentalism. Another important aspect of the
1928 plan was the provision of infrastructure, which would prove critical to the plan’s
realization. Successful implementation of the plan depended upon voter approval of what
110
was at the time the largest bond issue for the provision of public works in the city’s
history. The bond issue was overwhelmingly approved by the citizens, and the plan was
successfully implemented with the provision or roads, parks, and water and sewer
infrastructure.
There were several attempts to update the Koch and Fowler plan in the 1940s, and
in 1953 a new City Charter established the Department of Planning and required that the
City Planning Commission draft and maintain a new master plan. The result was the
1958 Austin Plan which concerned itself with functional issues such as transportation,
streets, open space, and parks. Indeed, following from the 1928 plan’s focus on open
space, the 1958 plan’s land use map indicates a huge amount of parkland and open space.
Looking back at these first two plans, it is notable that both strongly emphasized
environmental amenities, the location of new development, and citizen support.
During this time, the rapid growth in Austin began to take on a new form. In the
1950s land use was relatively contiguous within the city limits, but by 1970 residential,
industrial, and commercial uses had developed on the urban fringe, not necessarily
contiguous to the existing built-up city. Large retail malls were located at the
intersections of expressways and major arterials, an economic response to the shift of
purchasing power to the periphery made possible by the expressway and arterial systems
built in the 1950s and 1960s. The pattern of growth in Austin was following the national
trend toward suburbanization which accelerated after World War II. Soldiers returning
from the war favored the more tranquil suburban neighborhood, and the Baby Boom
accelerated the need for homes where families could raise their children. Government
loan assurances for new single family homes and the application of assembly-line
111
production techniques in the housing industry accommodated and dictated rapid growth
on the urban fringe.
The Austin Tomorrow Planning Process
In 1972, the Planning Department, Planning Commission, and City Council,
concerned with the sprawling pattern of this rapid and seemingly unmanaged growth,
decided a new comprehensive plan was needed (Knickerbocher 1981). The eventual
result was the Austin Tomorrow Plan, adopted by the City Council in 1979. Since the
plan was put together and adopted at the beginning of my study period, it would - or
should - have an impact on the pattern of growth during the 1980s and 1990s. There was
another comprehensive planning effort after the Austin Tomorrow Plan – the Austinplan
– but it was never adopted and thus did not become official city policy. As a result, the
Austin Tomorrow Plan was Austin’s last officially adopted comprehensive plan and thus
critical to understanding the city’s planning paradigm during my study’s time period.
The Austin Planning Director had secured a HUD 701 grant to fund the Austin
Tomorrow Plan, and one of the funding requirements was to involve as many citizens as
possible in the plan’s creation, especially in the goal-setting stage. The Council
appointed 250 members to a Goals Assembly Committee, the planning program was
widely publicized, and over the next year, fifty-six neighborhood meetings were held
involving the participation of approximately 2,800 citizens (City of Austin 1980). This
kind of citizen participation is somewhat unusual and thus a significant aspect of Austin’s
approach to planning that must be recognized. In fact, the assistant planning director at
the time commented that “citizen participation in this city is so deep-rooted that it has
become part of our heritage” (Knickerbocher 1981, 19). The question to keep in mind is
112
whether this exceptional level of civic activism resulted in a plan that promoted
sustainable growth patterns.
These citizen efforts resulted in the Goals Program and included alternative
scenarios to the current sprawling land development trend. One scenario called for more
high density neighborhoods within the city limits, or “Limited Expansion.” Another
looked at “Directed Expansion” where development was to occur in a northerly and
southerly direction, primarily along the Interstate 35 corridor, an area preferred because
of its relatively flat terrain and deep soils that were suitable for intensive urban
development. In this scenario, real estate development was essentially prohibited in the
environmentally sensitive Hill Country to the west. A third scenario promoted residential
living in the downtown area, or “Inner City Development.” At the same time, San
Antonio was also developing alternative growth scenarios or “sketches” for its future
development. Thus, an important phenomenon was taking place. The process of creating
a plan was getting people to think about alternatives to “business-as-usual” land
development. People were calling for alternative, more sustainable patterns of
development.
On May 7, 1975 members of the Austin Tomorrow Goals Assembly presented the
Goals Report to City Council, which unanimously adopted it. These goals were to be the
foundation of the new comprehensive plan. According to the Planning Department, “the
report was not a bland statement of support for the status quo, nor a mere cheerleading
exercise in civic pride. . . . the people . . . called for a shift in priorities in a spirit that was
optimistic” (City of Austin 1980, 7). The approach to growth management included
guidelines for directing growth away from areas of environmental sensitivity and toward

113
those areas which were more suitable for urban development. The report’s city-wide
goals reflected an aggressive attitude toward land use policy and included all six
sustainability principles:
A review of the city-wide goals shows clearly that Austin citizens are concerned with the destructive effects of continued urbanization on the neighborhoods and natural environment of the city and surrounding area. Citizens wish to develop land use patterns which protect neighborhoods, increase open space and protect natural areas, to develop a zoning ordinance which is environmentally protective, to extend land use controls beyond the city limits to environmentally sensitive areas, to control growth in the interest of quality and the environment, to preserve neighborhoods and historic landmarks and to end all forms of environmental pollution . . . (City of Austin 1980, 9) Even the plan’s economic goals reflected five of the six sustainability principles.
I list these initial goals in some detail as later, during the process of adapting the goals to
the comprehensive plan, they were modified to be more congenial to outside business
interests (City of Austin 1975, 37-8):
• A healthy economy …that should be maintained through moderate natural growth rather than indiscriminate solicitation of for new businesses and residents. …Protective environmental policies must be instituted to avert the problems that might result from even a moderate growth rate (Placed-based Economy, Livable Built Environment).
• More equitable property taxes could be achieved if valuations were based on actual
and not potential land uses . . . there should be greater citizen participation in city government, particularly in zoning and development policies. Austin and Travis County should cooperate for the sake of economy, for better land use control in unincorporated areas … (Equity, Responsible Regionalism).
• Job opportunities for unskilled labor should be created for the poor and
elderly…acquisition of new industries should be based on an inventory of job needs in the area. Increase the per capita income of low-income groups by providing training for better jobs (Equity, Place-based Economy).
• Regional planning is necessary in order to coordinate growth and land use outside
the city limits (Responsible Regionalism).

114
After the Council received the Goals Report, they appointed an Ongoing
Committee to work with city boards, commissions, the planning department, and other
groups to translate the goals into the comprehensive plan. The planning department’s
version of the plan still emphasized giving attention to existing businesses, increasing
housing stock for all income levels, and expanding job opportunities, especially for entry-
level positions and at locations accessible to the largest concentrations of unemployed
and underemployed. However, during this “translation” process – from citizen goals to
politically acceptable goals - the tenet of not encouraging outside business in-migration
(or a place-based economy) was weakened by business interests (Blunt, Walker and Frye
2001). It is important to understand the general “softening” of goals, objectives, and
policies as they work their way through the political process on their way to a final
version acceptable to most of the community’s stakeholder groups, including the
community’s power-brokers. This emasculation process is especially common in areas
that revere private enterprise and private individual effort more than group efforts,
planning, and public concern (Smith 1991). Indeed, Texans have a reputation as
prioritizing individualism and individual rights over communal interests.
On March 28, 1977, the Planning Commission submitted a draft of the plan to
City Council, and the plan was approved minus the growth management segment which
was proving to be more controversial than the rest of the plan. Still, even though
Austin’s development community was leery of any growth constraints in the Hill
Country, the Growth Management Chapter was adopted by Council in 1979, completing
the evolution of the citizens’ Goals Report into the Austin Tomorrow Comprehensive
Plan (Watson 1990).

115
In the adopted plan, the desire of the citizens to guide the location of growth had
remained more or less intact, exemplifying Austin’s overarching and enduring themes of
environmentalism and civic activism. The plan called for restricting new development in
the environmentally sensitive watershed on the city’s hilly western fringe, but
complementing these restrictions were policies directing development towards a
preferred growth corridor running north-south through the heart of the city along
Interstate 35 and to the already developing north-west (Figure 16). This preferred growth
area was an outgrowth of the alternative development scenarios from five years earlier.
Figure 16. Austin's Preferred Growth Corridor. The Austin region was divided into priority growth areas, with the CBD and areas north and south along I-35 having the highest priority. The darker shaded areas to the west were environmentally fragile but were experiencing “considerable growth to which the State and City [had] made commitments for the provision of utilities and roads.” The remaining lighter shaded areas were considered least suitable for development. From the Austin Tomorrow Plan, page 151.
CBD
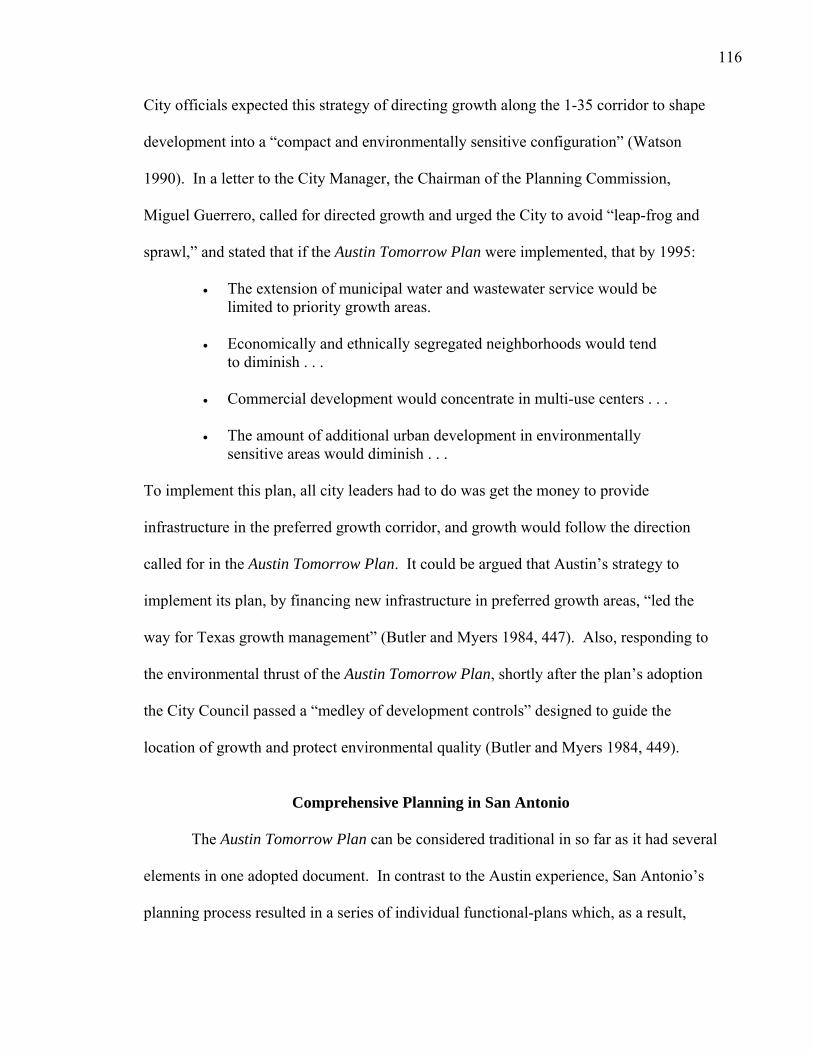
116
City officials expected this strategy of directing growth along the 1-35 corridor to shape
development into a “compact and environmentally sensitive configuration” (Watson
1990). In a letter to the City Manager, the Chairman of the Planning Commission,
Miguel Guerrero, called for directed growth and urged the City to avoid “leap-frog and
sprawl,” and stated that if the Austin Tomorrow Plan were implemented, that by 1995:
• The extension of municipal water and wastewater service would be limited to priority growth areas.
• Economically and ethnically segregated neighborhoods would tend
to diminish . . .
• Commercial development would concentrate in multi-use centers . . .
• The amount of additional urban development in environmentally sensitive areas would diminish . . .
To implement this plan, all city leaders had to do was get the money to provide
infrastructure in the preferred growth corridor, and growth would follow the direction
called for in the Austin Tomorrow Plan. It could be argued that Austin’s strategy to
implement its plan, by financing new infrastructure in preferred growth areas, “led the
way for Texas growth management” (Butler and Myers 1984, 447). Also, responding to
the environmental thrust of the Austin Tomorrow Plan, shortly after the plan’s adoption
the City Council passed a “medley of development controls” designed to guide the
location of growth and protect environmental quality (Butler and Myers 1984, 449).
Comprehensive Planning in San Antonio
The Austin Tomorrow Plan can be considered traditional in so far as it had several
elements in one adopted document. In contrast to the Austin experience, San Antonio’s
planning process resulted in a series of individual functional-plans which, as a result,
117
lacked the coherence that is the hallmark of the traditional comprehensive plan. The San
Antonio City Council adopted the pithy Foreward and Basic Plan segments of a
comprehensive plan in 1980 and in the following years functional plans for parks,
neighborhoods, and land use. The central document, the Basic Plan, at seventeen pages,
was one-tenth the length of the 176-page Austin Tomorrow Plan. San Antonio’s Land
Use Plan, the most important aspect of a comprehensive plan for growth management,
had proven to be so controversial that it was not adopted until 1983, and was
considerably watered-down from its original versions in the mid-1970s.
As in Austin, planning in San Antonio made a “comeback” in the 1920s. Harlan
Bartholomew and Associates began work on the City’s first comprehensive plan for the
modern era in 1928, and the City Commissioners adopted the resulting plan in 1933. The
Bartholomew plan proposed rules for the subdivision of land, a fact which hints at an
early priority for clarifying, or streamlining, the development process. In the spirit of the
City Beautiful Movement, the plan also promoted rehabilitation of the San Antonio
River, parks, open space, civic art, and boulevards connecting places of interest.
However, much of the Bartholomew plan was never implemented due to the national
Depression, and local factors including inadequate legislation, the lack of a Planning
Commission, and perhaps to the corrupt commission form of government (Ashcroft
1985).
In 1951 the city adopted a new charter and replaced the commission form of
government with a council/manager type of government. Article 9 of the charter
established the city’s planning function, stating that, even though the State did not require
a master plan, that San Antonio shall have one. Also during this time, the availability of
118
federal money provided a renewed incentive for comprehensive planning (Ashcroft
1985). As a result, the city hired local consultant Walter H. Lilly to develop the plan - a
plan which was essentially a justification for urban renewal, and, in actuality, the
justification for the provision of infrastructure to promote development on the north and
west sides of San Antonio, well away from ethnic minorities on the south and east sides
of the city (Powell 1984). Lilly’s plan included traditional plan elements such as streets,
transportation, utilities, flood control and drainage, recreation and parks, urban
redevelopment, civic improvement, and capital improvements, but interestingly it lacked
a land use element. Rather, to help facilitate development, Lilly’s plan “clarified” the
City’s subdivision regulations and “improved” its zoning ordinance (Powell 1984). The
Lilly Plan achieved its purpose of fulfilling requirements for receipt of federal funds, but
it provided limited guidance for managing growth, a weakness of the plan perhaps
attributable to a lack of support from an influential mayor (Walter McAllister) who did
not want “planning interfering with certain areas of town” (Ashcroft 1985).
Just as in Austin and other Sunbelt cities, San Antonio was experiencing rapid
suburban development in the 1950s and 1960s. Growth pressures may have been even
more intense than those in Austin because many of the military personnel, who had been
stationed at one of the area’s military bases during World War II, returned to San Antonio
to start their families. At the time, the City seemed to embrace this pattern of growth and
ignore environmental issues such as threats to the Edwards aquifer that supplied the city’s
drinking water. For example, in the mid 1960s, in order to meet requirements for federal
highway dollars, the Planning Department prepared a Development Plan of San Antonio
brochure (City of San Antonio 1965). The brochure’s land use map was amazingly
119
accurate in predicting where most new development actually occurred over the next
twenty years: to the north and northwest. The brochure also dealt with population, the
economy, and transportation. Addressing residential land use, the Plan notes:
With practically unlimited land available for expansion and the progressive attitude of public officials with respect to providing transportation facilities and utilities, developers have found it feasible and profitable to cater to the great demand for suburban living (City of San Antonio 1965).
Such a statement demonstrates San Antonio’s philosophy of civic boosterism and
willingness to provide infrastructure to wherever influential developers owned land.
However, even with such a pro-development statement, the mayor and city council
considered the brochure’s future land use map threatening to private property interests
because it designated specific places for new development. As a result, practically all
copies of it were confiscated and locked in the City Hall basement (Ashcroft 1985).
In the early 1970s the Department of Housing and Urban Development (HUD)
began making funds available for a variety of planning projects. As a result, the San
Antonio Community Renewal Program and the Planning Department published
numerous planning reports and studies (but not a comprehensive plan), including two that
showed an aggressive approach to growth management, regulating the location of new
development, and protecting and enhancing the community’s amenities and sense of
place. The Development of the Central City District indicated that “mixed-land-use is the
kind of development that must take place . . .” (City of San Antonio 1972a, 3). Typical
wording included strong verbs such as provide, develop, plan, reshape, and create. The
San Antonio Urban Design Mechanisms Study touted “San Antonio’s unique natural and
manmade assets,” and set a goal to “preserve the beauty of San Antonio and improve the
120
quality of its environment while encouraging new development in strategic locations”
(City of San Antonio 1972b, i). The study concluded that unless something were done,
problems would result, including overbuilding in amenity areas, traffic congestion, and
elimination of unique architectural, open space, and historic resources.
A technical report, Population and Employment Distribution - San Antonio-Bexar
County 1970-1990, forecast the location of population growth between 1970 and 1990,
and was to be used as a basis for area-wide, comprehensive planning, and, most
importantly, to “provide base data which would allow an investigation of the effects of
alternative development patterns” (City of San Antonio 1973, 2). The study’s conditional
model and stepwise discriminant analysis indicated that the vast majority of development
in Bexar County between 1970 and 1990 could be anticipated along San Antonio’s
northern and western urban fringe, a forecast that proved to be accurate. The report
addressed the issue of who decides where growth goes, albeit in a fait-accompli fashion:
Ultimately what really explains leap-frog development is where developers own land . . . if this assumption is accepted and then coupled with an attitude of providing transportation facilities and utilities “on demand” the phenomena of Bexar County’s development pattern unfolds (City of San Antonio 1973, 46).
The Not-so-Comprehensive Comprehensive Plan
By the mid-1970s incidents such as Ranch Town had elevated the issue of
development location into the public arena. Activists were challenging the unfettered
growth paradigm of the Development of San Antonio brochure. In fact, the City’s
boosterism had proved to exaggerate things to the point where after the 1970 census, all
the city limits signs had to be changed because population figures had been so inflated
(Powell 1984).
121
In 1975, the Planning Department published the Alternative Growth Study, the
most aggressive land-use planning document in the city’s modern planning history (City
of San Antonio 1975). It was supposed to be the basis for the key land use element of a
forthcoming comprehensive plan. The Study looked at alternatives to the expected
growth patterns that had been laid out in 1973 Population and Employment Distribution
report and the 1965 Development of San Antonio brochure. In an introductory letter,
Planning Director Cipriano Guerra, being careful not to rile anti-planning interests,
disclaimed that “This is a study and not a master plan.” However, he went on to say that
the current pattern of growth in San Antonio was one of “substantial leapfrogging,”
mostly due to the pull factors on the northern fringe such as attractive topography, an
extensive transportation network, business and commercial centers, prestigious housing,
and highly regarded school districts” (City of San Antonio 1975, 6). Guerra questioned
the high costs of fringe development, citing the Costs of Sprawl (Real Estate Research
Corporation 1974), and then argued for less-costly, alternative development patterns
based on public service efficiency, contiguous development, and an equitable distribution
of housing. Development control was needed to minimize negative environmental
impacts on the Edwards aquifer recharge zone. Similar to the Austin strategy, the
provision of infrastructure was touted as the tool of choice to direct growth. The study
concluded that the alternative growth patterns all “represent a change from the
unplanned, inefficient and wasteful patterns of the past… they all provide for growth
without environmental damage” (City of San Antonio 1975, 59). Guerra may have
started out with a disclaimer about planning, but he certainly concluded with an
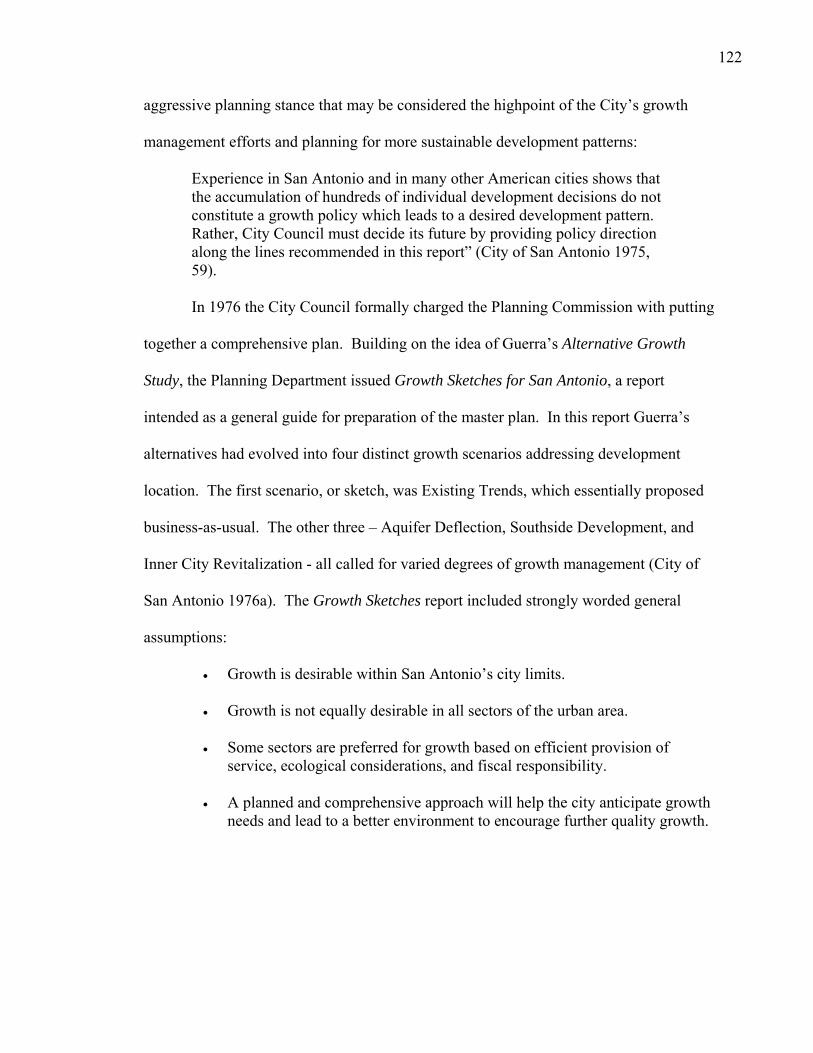
122
aggressive planning stance that may be considered the highpoint of the City’s growth
management efforts and planning for more sustainable development patterns:
Experience in San Antonio and in many other American cities shows that the accumulation of hundreds of individual development decisions do not constitute a growth policy which leads to a desired development pattern. Rather, City Council must decide its future by providing policy direction along the lines recommended in this report” (City of San Antonio 1975, 59). In 1976 the City Council formally charged the Planning Commission with putting
together a comprehensive plan. Building on the idea of Guerra’s Alternative Growth
Study, the Planning Department issued Growth Sketches for San Antonio, a report
intended as a general guide for preparation of the master plan. In this report Guerra’s
alternatives had evolved into four distinct growth scenarios addressing development
location. The first scenario, or sketch, was Existing Trends, which essentially proposed
business-as-usual. The other three – Aquifer Deflection, Southside Development, and
Inner City Revitalization - all called for varied degrees of growth management (City of
San Antonio 1976a). The Growth Sketches report included strongly worded general
assumptions:
• Growth is desirable within San Antonio’s city limits.
• Growth is not equally desirable in all sectors of the urban area.
• Some sectors are preferred for growth based on efficient provision of service, ecological considerations, and fiscal responsibility.
• A planned and comprehensive approach will help the city anticipate growth
needs and lead to a better environment to encourage further quality growth.
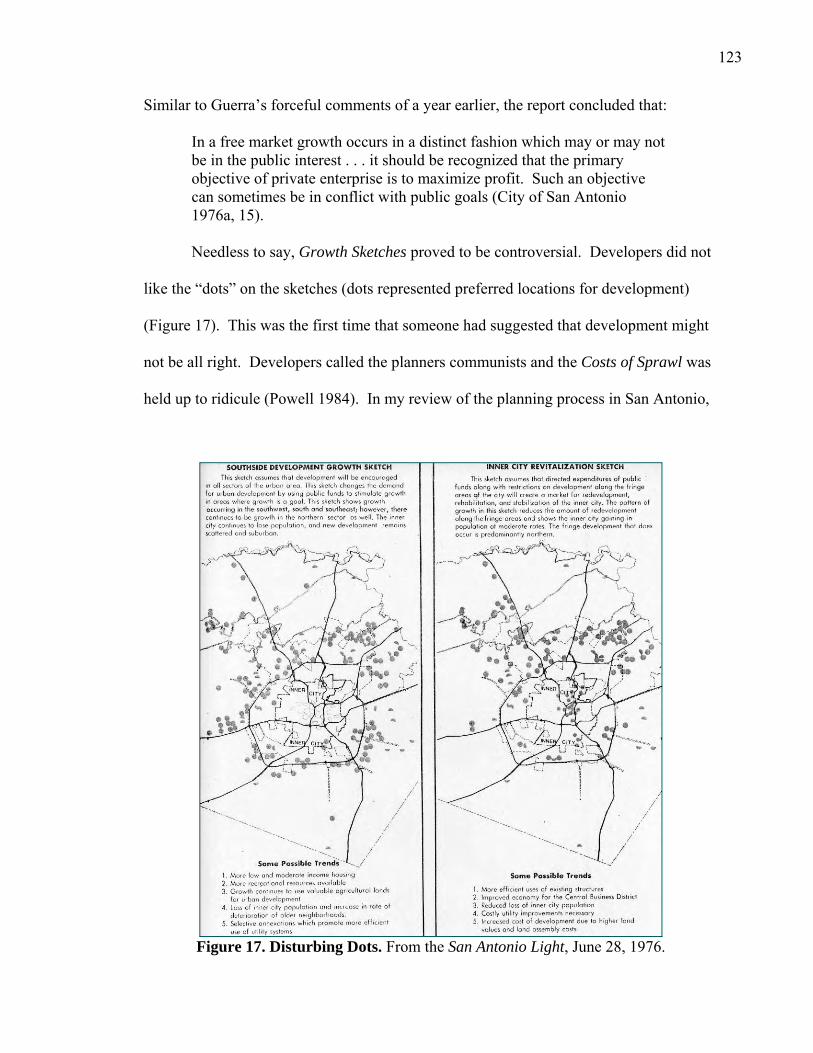
123
Similar to Guerra’s forceful comments of a year earlier, the report concluded that:
In a free market growth occurs in a distinct fashion which may or may not be in the public interest . . . it should be recognized that the primary objective of private enterprise is to maximize profit. Such an objective can sometimes be in conflict with public goals (City of San Antonio 1976a, 15).
Needless to say, Growth Sketches proved to be controversial. Developers did not
like the “dots” on the sketches (dots represented preferred locations for development)
(Figure 17). This was the first time that someone had suggested that development might
not be all right. Developers called the planners communists and the Costs of Sprawl was
held up to ridicule (Powell 1984). In my review of the planning process in San Antonio,
Figure 17. Disturbing Dots. From the San Antonio Light, June 28, 1976.

124
in order to understand the city’s planning paradigm, it is important to realize that during
this decade city staff were producing dynamic and forward-looking land-use studies and
plans. These efforts were intended to ultimately become part of a comprehensive plan.
The land use assumptions from Growth Sketches were synthesized and softened
into the Preferred Growth Sketch (City of San Antonio 1976b), and a public outreach
program was undertaken to interest citizens in discussing the four different growth
scenarios. Part of the outreach program included Super Planner, a pullout section in one
of the two local newspapers describing each sketch (Figure 18). In spite of these efforts,
and unlike Austin, public reaction was either apathetic or negative. After eight public
hearings, the San Antonio Growth Sketch (City of San Antonio 1977), a toned-down
version of the earlier sketches, emerged and was adopted by the City Council on March
24, 1977. The Preferred Growth Sketch’s general goals were weaker and more
Figure 18. SuperPlanner. From the San Antonio Light, June 28, 1976.

125
amorphous than the general goals from the earlier Growth Sketches. For example, this is
illustrated by the use of suggestive words such as promote and encourage, and nebulous
terms such as “quality of life,” “sensible growth,” and “best possible” in the goals from
the Preferred Growth Sketch reprinted below. Interestingly, the strong verb ensure is
reserved for promoting growth:
• Provide the best quality of life through responsible use of limited resources. • Promote sensible growth for the city, reversing and preventing decline and
encouraging steady, contiguous development.
• Identify the best possible distribution of land uses by quantity and type to meet the physical, social, cultural, economic, energy and environmental needs of the present and future population.
• Ensure use of land is managed efficiently and designated equitably in the
best interest of promoting growth which maximizes public assets.
• Encourage growth and development in the following areas: areas already fully serviced with utilities; areas where minor service extensions would be necessary; area of underused existing facilities; areas within reasonable contiguous annexation range.
The Preferred Growth Sketch was to be used to develop the land use goals,
objectives, and policies for Chapter 4 of the forthcoming comprehensive plan. In 1978 a
draft of this critical plan element was presented to the Planning Commission, but it
proved to be controversial among the business community, perhaps due to its detail and
statements such as “the volume of growth is less significant than the distribution of
growth”; or Objective D6: “distribute population growth throughout the planning area;”
or Objective D12: “indicate an optimum pattern and location which can guide future
development of various intensities . . .” (City of San Antonio 1976b). After some
discussion, the Planning Commission sent Chapter 4 to the City Council which quickly
rejected it and asked that the whole idea of what a plan should look like be restructured.

126
At this point, the Planning Commission essentially abandoned much of the work
done over the past decade, and sent two very brief and general planning documents to the
Council. The Foreward and Basic Plan sections of the San Antonio Master Plan were
finally adopted in August, 1980. The Council then adopted a series of functional plans
including the Land Use Plan (City of San Antonio 1983). The brevity and lack of detail
and firm direction of the San Antonio planning documents is in sharp contrast to Austin’s
plan that was adopted around the same time. The Land Use Plan pointedly avoided the
earlier approach of preferred growth scenarios and the need for growth management with
statements such as:
The principles stated herein are not mandates or suggestions that current policies and regulations are in any respect improper or undesirable and therefore must be modified, but rather are general goals which are desirable objectives and philosophies (City of San Antonio 1983, 1).
In this chapter’s next section, I will analyze the Foreward, Basic Plan, and Land Use
Plan in more detail.
Plan Analysis
The Austin Tomorrow Plan
The Austin Tomorrow Plan has eight plan elements as well as chapters on
“Development Suitability” and “Growth Management.” Directed growth,
environmentalism, and the primacy of social space over abstract space are aggressively
promoted throughout the plan. For example, the first element, Urban Design, calls for
development that is compatible with the “the unique natural and constructed features of
the Austin area,” and site planning that is “tolerant of natural topographic conditions”
(City of Austin 1980, 15). A separate element on environmental management addresses
127
the “monitoring and regulation of society’s impacts on natural physical elements,” and
the fundamental premise that “urban and suburban development of land should be
restricted in areas with limited ability to absorb urbanization without severe
environmental degradation” (33). The Economic Development element emphasizes the
“preservation and improvement of the natural and cultural environment,” and the need to
“anticipate and control the environmental impact of economic growth” (26). The element
on Housing and Neighborhoods calls for increasing the availability of housing for low
and moderate income households in “an integrated setting” (69). Transportation system
policy must be coordinated with the overall goals of urban design, neighborhood
protection, environmental protection and urban growth management, and it must
emphasize the need for the increased use of non-motorized travel modes, rather than
continued dependency on the automobile as the primary travel mode. Finally, a key
element of the plan, Government and Utility Services, cites the critical need for using the
provision of utility service “to guide growth into a compact, contiguous and planned
form” (55); basic municipal utilities can be provided within “a framework of preserving
Austin’s natural environment, managing urban growth and reducing urban sprawl” (51).
The “Development Suitability” chapter serves as justification for the preferred
growth corridor mapped out in the plan’s final chapter, “Growth Management.” Using a
process of elimination in the vein of McHarg’s Design with Nature (1969), it maps
environmental constraints to show the location of land not suitable for development.
Comparisons are drawn between the continuation of trends toward sprawling
development and a shift toward a more contained urban form. Controlling development
location by the provision of infrastructure is again emphasized: “utilities and services

128
should be extended on a coordinated basis to those areas where growth is relatively most
suitable” (112). Performance principles and standards for urban development require
“compensation for, or mitigation of, the environmental and social costs incurred by
development in areas with one or more limiting factor[s],” a rare example of the Polluters
Pay sustainability principle (114).
The final chapter recommends a priority growth pattern based on a synthesis of
development constraints and the alternative growth patterns created in the early stages of
the Austin Tomorrow planning process. The resulting “preferred growth corridor would
offer the best opportunity for low and moderate housing, reduced racial segregation, more
amenities and open space, and the reduction of urban sprawl” (148). All in all, the Austin
Tomorrow Plan’s goals, objectives, and policies addressed all six sustainability principles
(Table 5). Almost three out of four (261 out of 356 or 73.3%) of the policies relate to one
or more sustainability principles. Of these 261 policies, 152 are suggested (58.2%), and
109 are required (41.8%).

129
Table 5. Strength and Sustainability Analysis of the Austin Tomorrow Plan. In the column “Plan Element” the numbers in parentheses are the number of policies for each plan element. The numbers in the last row are the percent of plan policies that relate to each sustainability principle. “S” means the policy is suggested, and “R” indicates the policy is required.
Plan Element (no. of Policies)
Stre
ngth
Har
mon
y w
ith N
atur
e
Liva
ble
Bui
lt En
viro
nmen
t
Plac
e-B
ased
Ec
onom
y
Equi
ty
Pollu
ters
Pay
Res
pons
ible
R
egio
nalis
m
Urban Design (34) S R
1 29 2
Economic Development (21)
S R
1 1 5 11 1
Environmental Management (60)
S R
24 5
7 9
2 1
1 1
Utility Services (45) S R
7 5
9 3
3 2
2 2
Neighborhoods & Housing (26)
S R
4 5
11 5
Parks, Open Space (62) S R
3 5
11 11
7 2
1
Transportation (91) S R
2 6
11 31
3
Health & Human Services (17)
S R
4
2
3
Sustainability Policies 59 137 7 48 3 7 Percent of Total Plan Policies
16.6% 38.5% 2.0% 13.5% 0.9% 2.0%
The San Antonio Plan
The San Antonio Master Plan adopted in 1980 consists of the three-page
Foreward and the seventeen-page Basic Plan (City of San Antonio 1980). The Foreward
discusses the “redefinition of the role of public planning in San Antonio . . .” and
contains such general statements as “The San Antonio Master Plan . . . is a guide which
permits individuals in government (as well as private enterprise) to make informed
decisions with some degree of understanding of the potential longer-range effects of a

130
specific decision” (City of San Antonio 1980, I). No goals, objectives, or policies are
stated in the Foreward.
The seventeen-page Basic Plan sets out five general goals and five guidelines for
the community’s land use policy. Since there are only five goals, they are reprinted in
their entirety below:
1. Provide economic opportunity for the people of San Antonio by encouraging economic growth through an active governmental partnership with private enterprise in efforts to strengthen and expand existing industrial and commercial activities and to attract businesses to San Antonio and its environs.
2. Conserve and enhance our natural and cultural resources and reduce natural and
manmade hazards; preserve and protect our historical resources and encourage their productive use.
3. Prudently invest public funds and other resources in area that are deficient in
municipal infrastructure to encourage the investment of private capital in redevelopment activities which will promote the use and reuse of public and private resources; maintain and strengthen stable and growing areas of the City by providing an adequate level of service and maintenance.
4. Accommodate the requirements of an expanding economy and an increasing
population by coordinating the interrelated roles of government and private enterprise in providing residential, commercial and industrial development and redevelopment within the corporate limits of the city and within its extraterritorial jurisdiction.
5. Annex additional territory to the city in an orderly manner giving due
consideration to the effects on the well-being of the citizens of San Antonio. The overall thrust of the five goals is towards accommodating economic growth. The
second goal relates to the Harmony with Nature sustainability principle in a broad but
anthropocentric sense: e.g., the “productive use” of natural resources. Suggestive words
such as encourage, promote, and accommodate are used, and the word environment is no
where to be found.
131
Compare the tenor of the Basic Plan’s adopted goals to some of the earlier
Chapter IV goals that were rejected by the San Antonio City Council in 1977 , and the
“lost-in-translation” phenomenon is evident (City of San Antonio 1977):
• Conserve existing urban resources so as to maximize their use and minimize the demand for expansion of scattered suburban development.
• Achieve urban development in those areas capable of supporting development
in terms of adequate public utilities, community facilities and services, and in terms of positive environmental impacts.
• Indicate an optimum pattern and location which can guide future development
of various intensities and identify areas for the planning and programming of adequate and efficient service for the community.
• Recognize geographic characteristics of and differences between geographic
areas of the planning area which warrant selective policy treatment in order to achieve the goals of the plan.
• Ensure the use of land meets social, economic and physical needs of the
present and future population in an orderly manner that supports efficient and compatible development and respect for the land.
These discarded goals dealt with the location of urban development head-on and used
strong verbs requiring action such as maximize, achieve, and ensure.
The Land Use Plan adopted in 1983 emphasized “a coordinated and mutually
consistent City philosophy to guide the physical development of the San Antonio
Planning Area,” an issue important to real estate and business interest groups (City of San
Antonio 1983, 1). It noted that the “public sector is a partner with the private sector –
developers, builders, and financial interests – in the development, maintenance, and
redevelopment of the community” (10). The plan called for policies that:
. . . for the most part, reflect current practices and procedures. The real estate market, which the Land Use Plan seeks to positively influence, is dynamic and flexible; thus continuous planning will facilitate an appropriate public response to changing market conditions (11).
132
The plan pointedly avoids the planning staffs’ earlier preferred growth sketches and their
call for growth management:
The principles stated herein are not mandates or suggestions that current policies and regulations are in any respect improper or undesirable and therefore must be modified, but rather are general goals which are desirable objectives and philosophies (1).
Indeed, the overarching theme seems to be monetary value-oriented, revolving around the
commodification of social space into abstract – reminiscent of the 1965 brochure’s
growth boosterism. For example, there are statements stressing the instrumental or
consumptive value of the landscape such as: “visual sensitivity can promote economic
development . . . the preservation of natural resources adds to the value and attractiveness
of an area” (City of san Antonio 1983, 7); and finally:
The demand to use or be near these natural amenities [trees, viewscapes, naturally vegetated open spaces and watercourses] can be balanced by construction activities and site designs that enable the use of the land without destroying the value of the natural features, which increased the demand and the value of that land for physical development in the first instance” (14). Land use policies are grouped into six sections. Words such as sensitivity and
flexibility are found in the “Natural Resources” section, intimating that development
should be “sensitive” to the environment but regulations “flexible” so as not to encumber
the prevailing development process. Indeed, in the “Regulatory Measures” section, a
primary objective is to:
. . . increase the effectiveness and objectivity of the City’s land use regulatory system, eliminate counterproductive and inconsistent requirements, and streamline land use regulatory provisions in order to minimize complexity and uncertainty” (32).
133
Referring to growth constraints, the plan makes the somewhat incongruous
statement that “these constraints do not represent prohibitions for development but . . .
development in these areas will be more expensive” (14). As for “Utility Infrastructure”
it notes that “as a growing community, San Antonio requires adequate utility services to
accommodate that growth,” and then follows with an objective to “assure that an
adequate utility infrastructure exists to foster and encourage economic growth in all parts
of the Planning Area” (17). No policy statement included the word environment. The
San Antonio Land Use Plan concludes with a put down of Guerra’s earlier
comprehensive planning efforts stating that “traditional land use plans have often been
regarded not so much as guides to growth but as obstacles to change” (5).
All in all, the Land Use Plan reflects the complete evisceration of the preferred
growth area policies developed and debated in the 1970s. The plan focuses on economic
development and accommodating growth with minimal government influence on its
location or form. Twenty-two of the plan’s fifty-eight policies (37.9%) relate to the
sustainability principles (Table 6). Fourteen of those twenty-two polices relate to the
Livable Built Environment sustainability principle. Only four polices relate to the
Harmony with Nature principle.

134
Table 6. Strength and Sustainability Analysis of the San Antonio Land Use Plan.
Plan Element (# of Policies)
Stre
ngth
Har
mon
y w
ith N
atur
e
Liva
ble
Bui
lt En
viro
nmen
t
Plac
e B
ased
Ec
onom
y
Equi
ty
Pollu
ters
Pay
Res
pons
ible
R
egio
nalis
m
Natural Resources (8) S R
3 2
Utilities (6) S R
1 1
Transportation (15) S R
1 3
Urban Form (12) S R
3 1
1
Regulatory (9) S R
2 2
Annexation, Services (8) S R
2
Sustainability Policies 4 14 0% 3 0% 1 Percent of Total Plan Policies
7.0% 26.3% 0% 5.3% 0% 1.8%
Summary and Comparison
My plan analysis has revealed that, although there are similarities between the
two city’s planning processes, the resulting comprehensive plans were quite different
from each another. As for the similarities, both comprehensive planning efforts began at
a time of increasing conflict over land use brought on by the region’s rapid growth.
Citizens, civic officials, and planners questioned the pace and form of the growth that
was changing the landscape. As a result, both communities turned to comprehensive
planning to consider “different arrangements of possible futures,” and in the process
generated new outlooks on where urban development should take place. Alternative
growth scenarios, or sketches, challenged the predominant trend toward sprawling
development on the urban fringe. Both plans took several years to complete, necessitated
135
by the complexity of urban growth dynamics, the sheer numbers of stakeholder and
neighborhood groups involved, and the need to reach a politically acceptable consensus -
one of the rational planning model’s basic tenets. Finally, both the citizens of Austin and
the planning staff of San Antonio determined that the key tool to managing the location
of development should be the provision of utility and transportation infrastructure.
But the purpose behind the use of the infrastructure tool in the two cities was not
the same. The San Antonio Land Use Plan noted that, “as a growing community, San
Antonio requires adequate utility services to accommodate that growth . . . and the City
should assure that an adequate utility infrastructure exists to foster and encourage
economic growth . . . (City of San Antonio 1983, 17). For Austin, infrastructure was to
be used to guide growth away from the less suitable hills to the west of I-35 to the more
developable lands of the Blackland prairie to the east of the I-35 corridor. The Austin
plan’s capital-improvements policies included (City of Austin 1980, 159):
• Capital improvements should provide incentives for a compact, contiguous, and efficient urban form.
• Municipal utilities, especially water, wastewater and streets, should be
expanded into those areas with the greater environmental suitability for urbanization and withheld from those areas with the greatest environmental limitations.
The Austin Tomorrow Plan prioritizes the environment, sense of place, a
regional perspective, and equity - aspects of a community that contribute to sustainable
development and social space. On the other hand, the San Antonio Master Plan touts
economic development and the instrumental value of environmental and cultural
amenities, and thus prioritizes the abstract space of business groups and developers. The
Austin planning process resulted in a “traditional” comprehensive plan that combined
136
land use policies with a graphic vision of desired future patterns of physical
development. It included geographic specifics – growth should go here, or growth
should not go there. The Austin plan included maps with lines drawn around areas
designated for growth, limited growth, or no growth, whereas the San Antonio plans did
not include a single map. Conflict comes to a head when lines – or dots – on a map are
given the force of official policy. And these defining lines aroused the passion, emotion
and power struggles among those involved in urban development. As stated in the
literature review, the urban region is an enormous playing field on which thousands of
competitors struggle to capture value or build community, and “who wins and who
loses, who sits at the table, and how the game is played are gauged by planners’ lines”
(Neuman 1998, 215). In San Antonio, plans with maps were locked in the City Hall
basement.
The Austin plan was a result of transactive planning, or planning that emphasizes
mutual learning and face-to-face contact with the people affected by land use regulations
and decisions (see page 72). Citizens proactively developed goals and objectives, and
wrestled with the location of new development while the planning staff acted as
facilitators and mediators, and focused on “crossing t’s” and “dotting i’s.” In the case of
San Antonio, the planning staff, more so than the citizens, called for development
alternatives and growth management tools with which to implement them. The growth
management element of the Austin Tomorrow Plan stayed more or less intact from the
plan’s inception in 1973 to its adoption in 1979, whereas this was not the case for San
Antonio. There, planning staff created progressive studies and reports, and put forth a
strongly worded Chapter IV for a comprehensive plan that was not subsequently
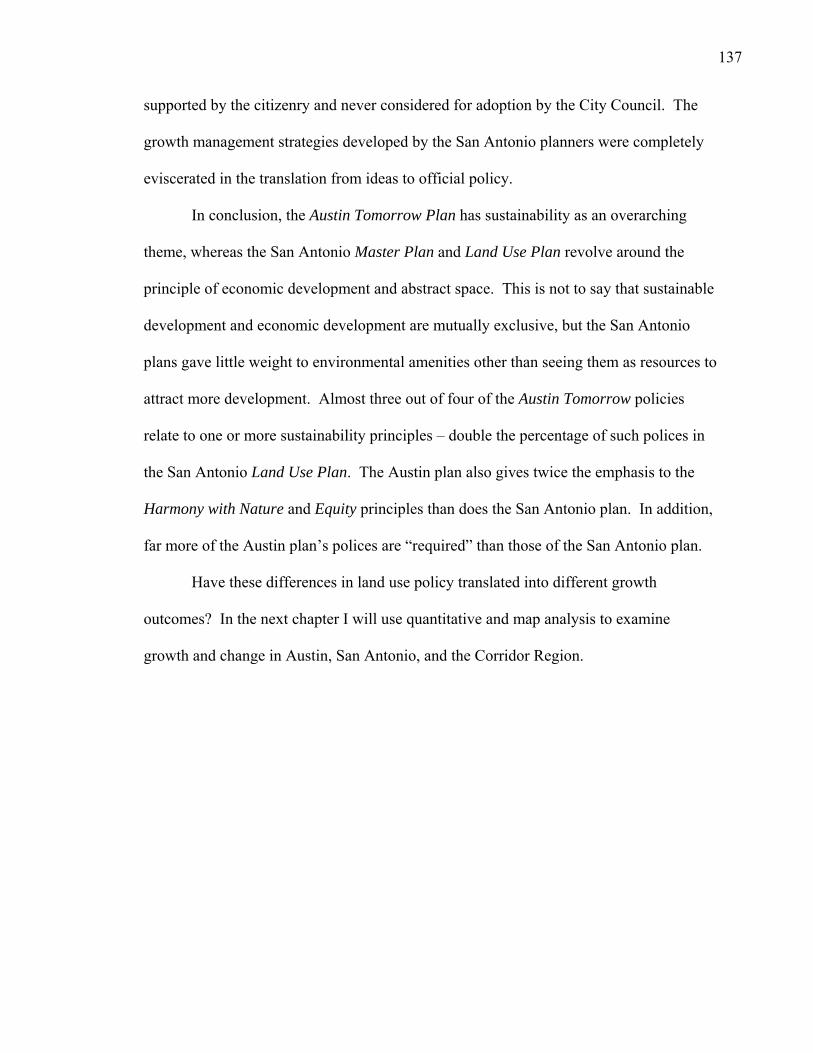
137
supported by the citizenry and never considered for adoption by the City Council. The
growth management strategies developed by the San Antonio planners were completely
eviscerated in the translation from ideas to official policy.
In conclusion, the Austin Tomorrow Plan has sustainability as an overarching
theme, whereas the San Antonio Master Plan and Land Use Plan revolve around the
principle of economic development and abstract space. This is not to say that sustainable
development and economic development are mutually exclusive, but the San Antonio
plans gave little weight to environmental amenities other than seeing them as resources to
attract more development. Almost three out of four of the Austin Tomorrow policies
relate to one or more sustainability principles – double the percentage of such polices in
the San Antonio Land Use Plan. The Austin plan also gives twice the emphasis to the
Harmony with Nature and Equity principles than does the San Antonio plan. In addition,
far more of the Austin plan’s polices are “required” than those of the San Antonio plan.
Have these differences in land use policy translated into different growth
outcomes? In the next chapter I will use quantitative and map analysis to examine
growth and change in Austin, San Antonio, and the Corridor Region.

138
CHAPTER VII
QUANTITATIVE AND MAP ANALYSIS
In this chapter, I will use three groups of variables related to sprawl, socio-
economic distance/inequality, and energy flows to measure the growth patterns and
trends within the Corridor Region. I will use three different scales: the region itself, the
Austin MSA and San Antonio extended MSA or “sub-regions,” and finally the region’s
two primary cities set within the context of their respective counties. The time frame for
most of the analyses is from 1980 to 2000. In the next and final chapter, I will discuss
the patterns and changes over time in the different areas and relate these findings to the
comprehensive plans analyzed in the previous chapter.
Sprawl
I use two methods to determine whether the region’s growth pattern is sprawling.
First, I look at the locations of the highest housing growth rates. Are there significant
differences in housing growth rates depending on whether the location is rural, exurban,
suburban, or urban? Higher growth rates in rural and exurban tracts would indicate a
sprawling growth pattern. Second I compare housing growth occurring within the
region’s incorporated cities to housing growth occurring outside the boundaries of the
region’s incorporated cities. Residential development in unincorporated areas is
generally on larger lots and thus more spread-out than development within incorporated
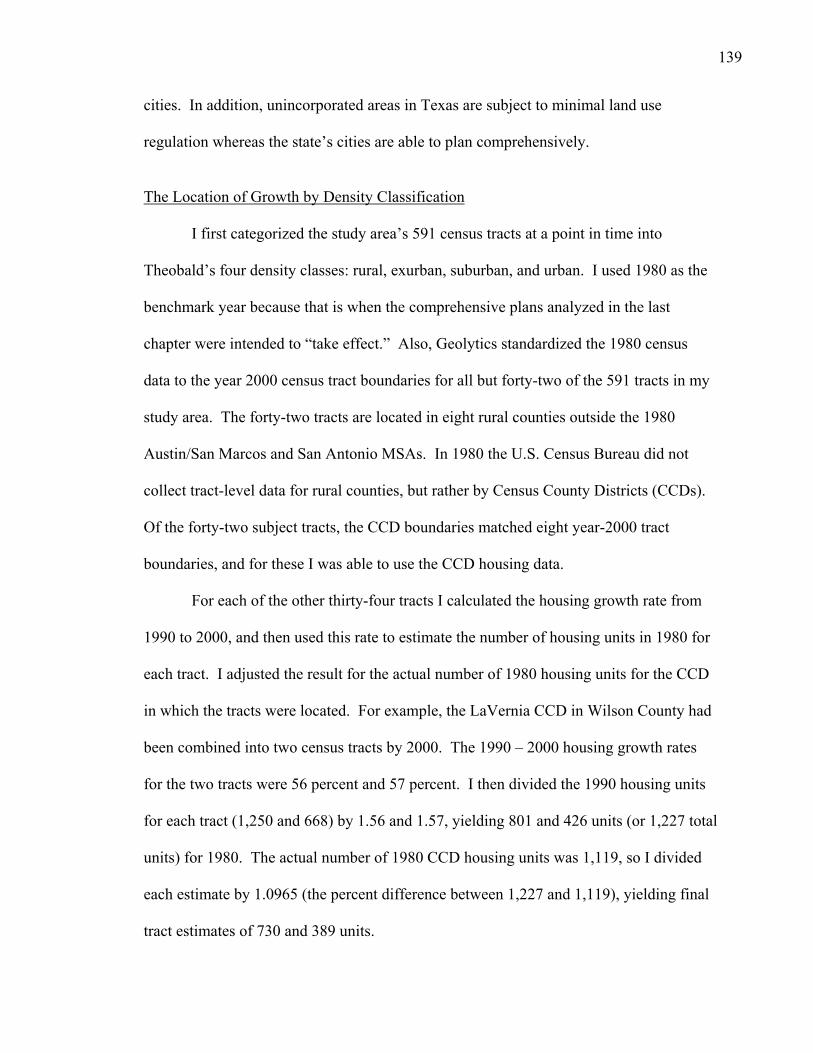
139
cities. In addition, unincorporated areas in Texas are subject to minimal land use
regulation whereas the state’s cities are able to plan comprehensively.
The Location of Growth by Density Classification I first categorized the study area’s 591 census tracts at a point in time into
Theobald’s four density classes: rural, exurban, suburban, and urban. I used 1980 as the
benchmark year because that is when the comprehensive plans analyzed in the last
chapter were intended to “take effect.” Also, Geolytics standardized the 1980 census
data to the year 2000 census tract boundaries for all but forty-two of the 591 tracts in my
study area. The forty-two tracts are located in eight rural counties outside the 1980
Austin/San Marcos and San Antonio MSAs. In 1980 the U.S. Census Bureau did not
collect tract-level data for rural counties, but rather by Census County Districts (CCDs).
Of the forty-two subject tracts, the CCD boundaries matched eight year-2000 tract
boundaries, and for these I was able to use the CCD housing data.
For each of the other thirty-four tracts I calculated the housing growth rate from
1990 to 2000, and then used this rate to estimate the number of housing units in 1980 for
each tract. I adjusted the result for the actual number of 1980 housing units for the CCD
in which the tracts were located. For example, the LaVernia CCD in Wilson County had
been combined into two census tracts by 2000. The 1990 – 2000 housing growth rates
for the two tracts were 56 percent and 57 percent. I then divided the 1990 housing units
for each tract (1,250 and 668) by 1.56 and 1.57, yielding 801 and 426 units (or 1,227 total
units) for 1980. The actual number of 1980 CCD housing units was 1,119, so I divided
each estimate by 1.0965 (the percent difference between 1,227 and 1,119), yielding final
tract estimates of 730 and 389 units.

140
Once my data table was complete, I used ArcMap 9.0 to calculate and map the
1980, 1990, and 2000 housing densities and growth rates from 1980 to 2000 for all 591
tracts based on their four housing density classifications as of the benchmark year
(Figures 19 and 20). In 1980 there were 70 rural tracts, 67 exurban tracts, 200 suburban
tracts, and 254 urban tracts. The housing growth rate for the entire study region was 77.5
percent, or a mean annual growth rate of 3.9 percent. For the same time period, the
growth rate for Texas was 47.0 percent, or 2.4 percent annually. The highest growth
rates occurred in tracts classified as exurban, rural, and suburban, and the lowest growth
rate in the urban tracts. In fact, housing growth in the region’s rural and exurban tracts
was more than ten times that in urban tracts: 197.1 percent and 18.3 percent respectively.
By the year 2000, the percentage of the region’s total housing units located in what were
rural and exurban tracts in 1980 had increased from 14.9 percent in 1980 to 24.9 percent
in 2000 (Figure 21).
Comparing the Austin and San Antonio sub-regions reveals that housing growth
in the Austin MSA was almost twice that of housing growth in the San Antonio extended
MSA: 111.8 percent compared to 57.8 percent (Table 7 and Figure 22). In the Austin
area, housing growth in what were rural and exurban tracts in 1980 was greater than
similar tracts in the San Antonio area: 253.7 percent compared to 153.0 percent.
Between 1980 and 2000 the share of the Austin area’s housing units located in rural and
exurban tracts increased from 17.8 percent to 29.8 percent, compared to from 13.1
percent to 21.1 percent in the San Antonio area. It appears that sprawling growth is more
pronounced in the Austin MSA. Looking more closely at Travis and Bexar County tracts
reveals similar patterns, and I will cover this in the next section.
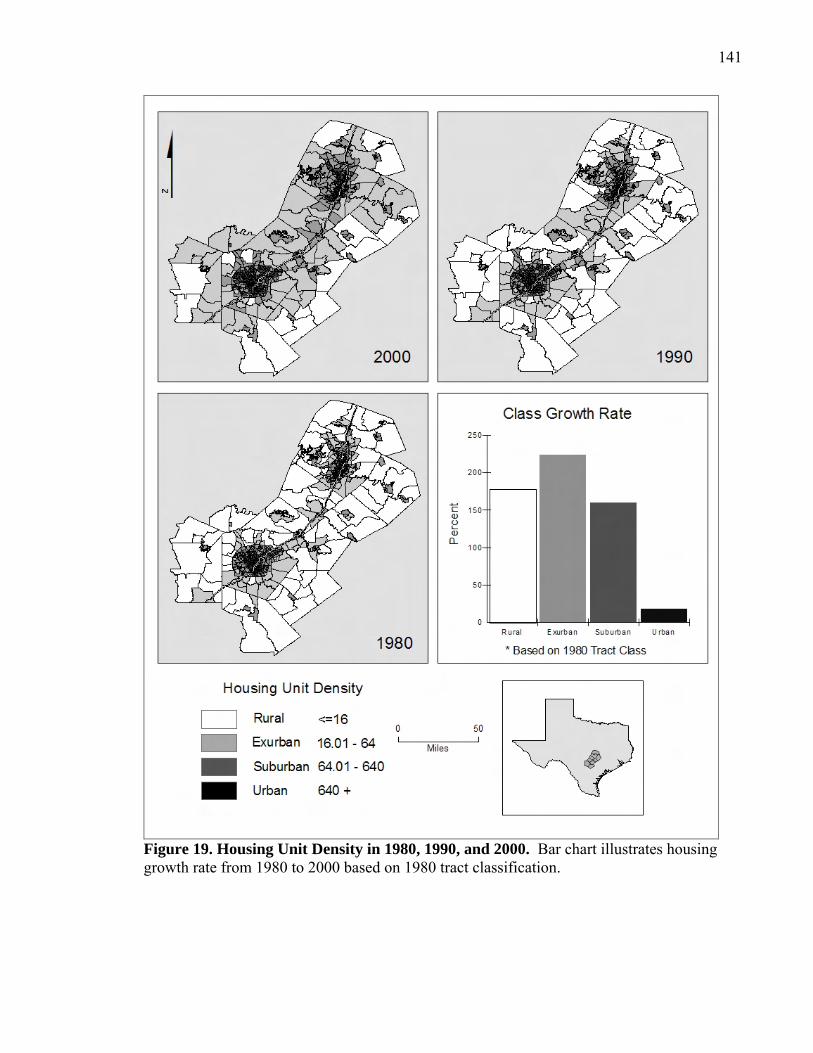
141
Figure 19. Housing Unit Density in 1980, 1990, and 2000. Bar chart illustrates housing growth rate from 1980 to 2000 based on 1980 tract classification.
142
Figure 20. Housing Unit Growth Rates by Census Tract – 1980 to 2000.
Figure 21. Regional Share of Total Housing Units for 1980 and 2000. Based on 1980 tract classification.
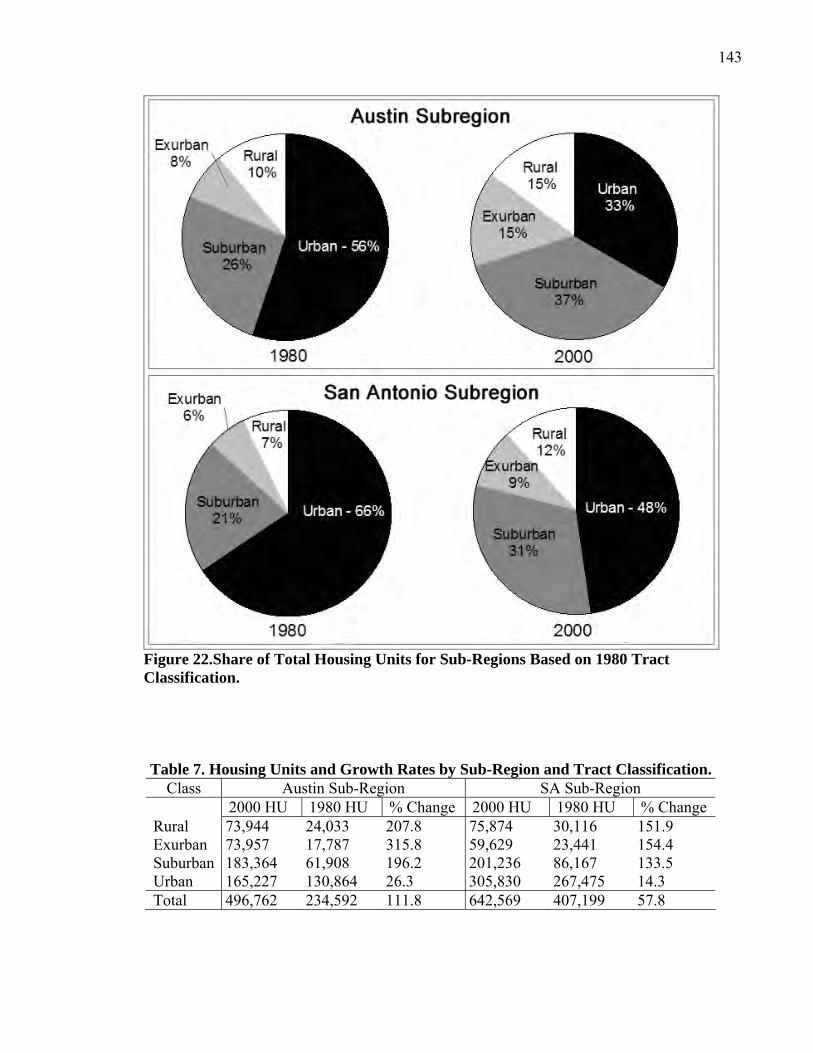
143
Figure 22.Share of Total Housing Units for Sub-Regions Based on 1980 Tract Classification.
Table 7. Housing Units and Growth Rates by Sub-Region and Tract Classification.
Class Austin Sub-Region SA Sub-Region 2000 HU 1980 HU % Change 2000 HU 1980 HU % Change Rural 73,944 24,033 207.8 75,874 30,116 151.9 Exurban 73,957 17,787 315.8 59,629 23,441 154.4 Suburban 183,364 61,908 196.2 201,236 86,167 133.5 Urban 165,227 130,864 26.3 305,830 267,475 14.3 Total 496,762 234,592 111.8 642,569 407,199 57.8
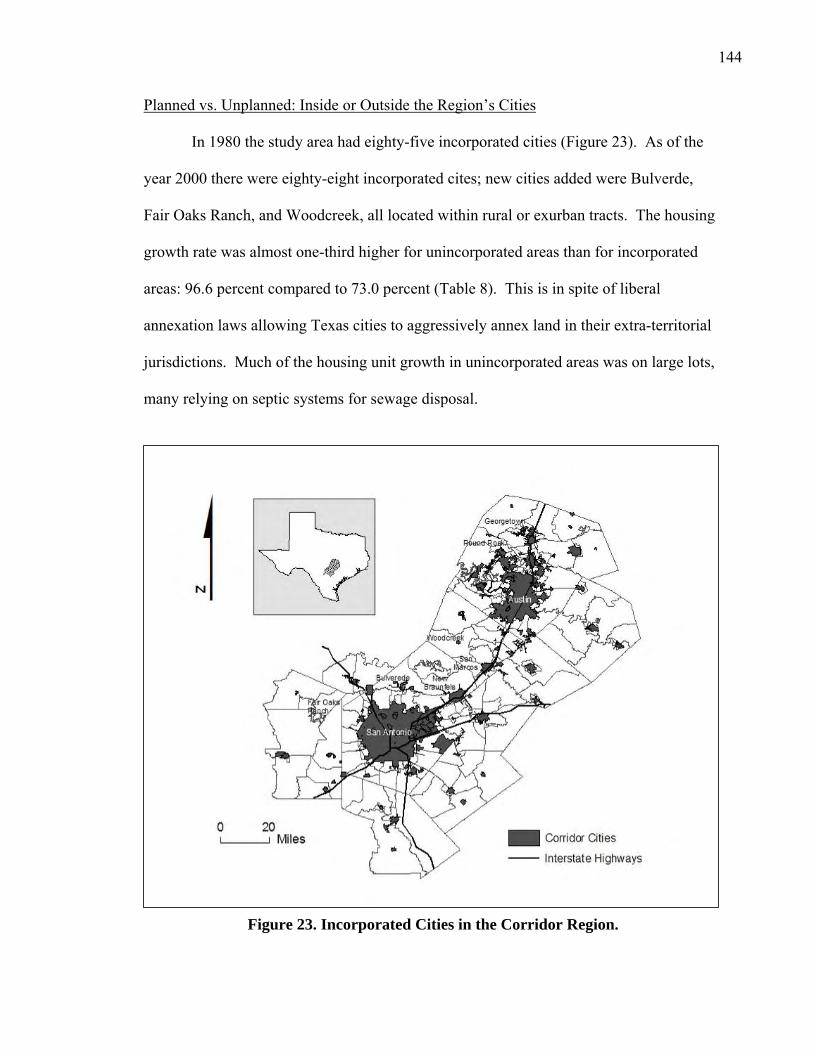
144
Planned vs. Unplanned: Inside or Outside the Region’s Cities In 1980 the study area had eighty-five incorporated cities (Figure 23). As of the
year 2000 there were eighty-eight incorporated cites; new cities added were Bulverde,
Fair Oaks Ranch, and Woodcreek, all located within rural or exurban tracts. The housing
growth rate was almost one-third higher for unincorporated areas than for incorporated
areas: 96.6 percent compared to 73.0 percent (Table 8). This is in spite of liberal
annexation laws allowing Texas cities to aggressively annex land in their extra-territorial
jurisdictions. Much of the housing unit growth in unincorporated areas was on large lots,
many relying on septic systems for sewage disposal.
Figure 23. Incorporated Cities in the Corridor Region.
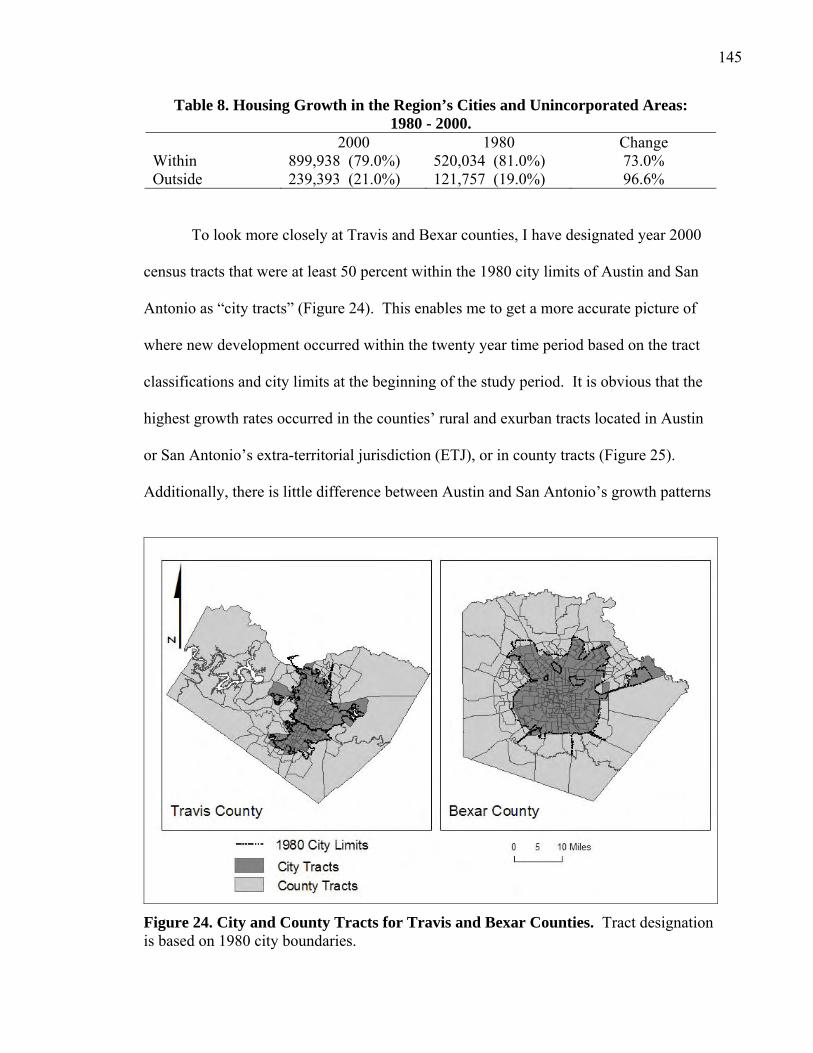
145
Table 8. Housing Growth in the Region’s Cities and Unincorporated Areas: 1980 - 2000.
2000 1980 Change Within 899,938 (79.0%) 520,034 (81.0%) 73.0% Outside 239,393 (21.0%) 121,757 (19.0%) 96.6%
To look more closely at Travis and Bexar counties, I have designated year 2000
census tracts that were at least 50 percent within the 1980 city limits of Austin and San
Antonio as “city tracts” (Figure 24). This enables me to get a more accurate picture of
where new development occurred within the twenty year time period based on the tract
classifications and city limits at the beginning of the study period. It is obvious that the
highest growth rates occurred in the counties’ rural and exurban tracts located in Austin
or San Antonio’s extra-territorial jurisdiction (ETJ), or in county tracts (Figure 25).
Additionally, there is little difference between Austin and San Antonio’s growth patterns
Figure 24. City and County Tracts for Travis and Bexar Counties. Tract designation is based on 1980 city boundaries.
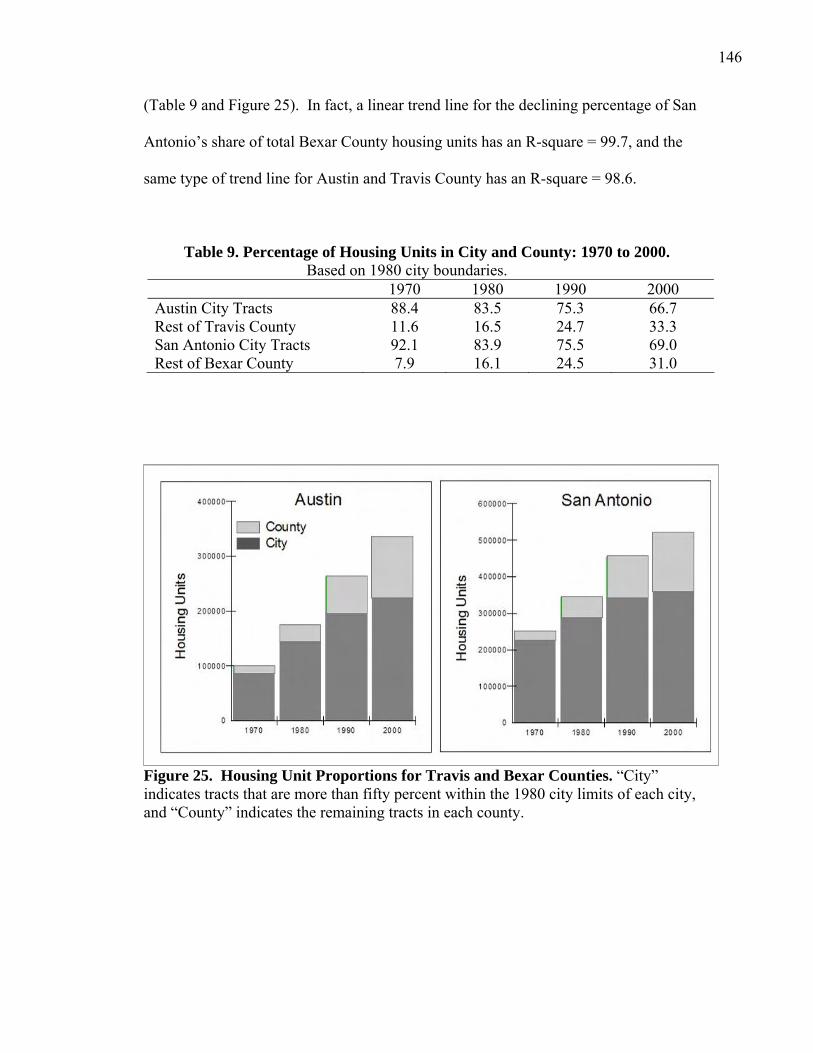
146
(Table 9 and Figure 25). In fact, a linear trend line for the declining percentage of San
Antonio’s share of total Bexar County housing units has an R-square = 99.7, and the
same type of trend line for Austin and Travis County has an R-square = 98.6.
Table 9. Percentage of Housing Units in City and County: 1970 to 2000. Based on 1980 city boundaries.
1970 1980 1990 2000 Austin City Tracts Rest of Travis County
88.4 11.6
83.5 16.5
75.3 24.7
66.7 33.3
San Antonio City Tracts Rest of Bexar County
92.1 7.9
83.9 16.1
75.5 24.5
69.0 31.0
Figure 25. Housing Unit Proportions for Travis and Bexar Counties. “City” indicates tracts that are more than fifty percent within the 1980 city limits of each city, and “County” indicates the remaining tracts in each county.
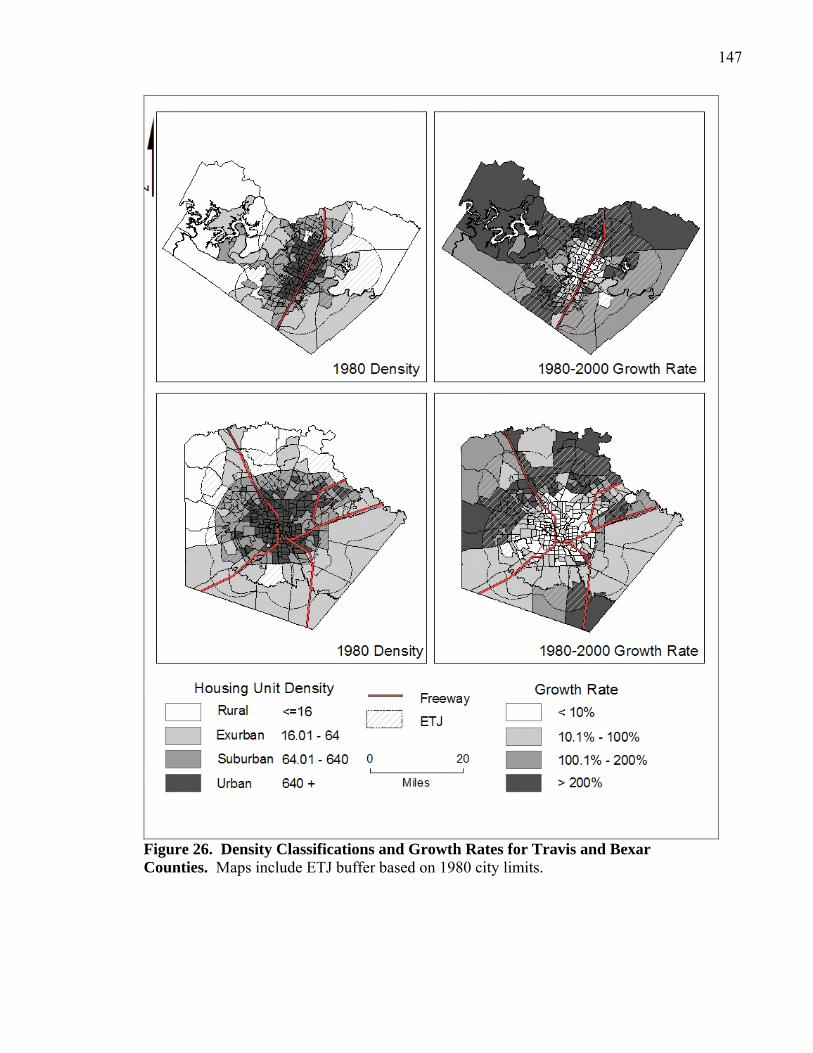
147
Figure 26. Density Classifications and Growth Rates for Travis and Bexar Counties. Maps include ETJ buffer based on 1980 city limits.
148
Socio-Economic Distance/Inequality
In this section I analyze changes in socio-economic distance and inequality
between 1980 and 2000 in the region, extended MSAs, and Austin and San Antonio. I
use census data for mean household income, persons below the poverty rate, house value,
commuting time, and distribution of racial/ethnic groups, to measure the inequality-
separation variable. House value is the median value for all owner-occupied housing
units, and commuting time is based on travel time to work. Since commuting time is
used as an energy flow measure in the next section, I will reserve that analysis for later in
the chapter. I will analyze the distribution of non-Hispanic white, black and Hispanic
racial/ethnic groups. The inequality research will include map analysis, the calculation of
coefficients of variation for income, and the calculation of several “segregation” indices.
Wealth: Income, Poverty, and House Value
An examination of the household-income regional map reveals that above-
average income tracts are practically all west of Interstate 35 for all three census years,
but this pattern has dramatically expanded in geographic area (Figure 27). The number
of tracts that are more than one-half standard deviation below the income mean has
decreased, but all are located east of Interstate 35 or in southern Bexar County. An
examination of regional household poverty rates reveals a similar pattern: an expansion
of tracts that have low poverty rates to the west of Interstate 35 in the Hill Country fringe
areas of each MSA. Higher poverty tracts remain located mostly in the southern part of
the Corridor Region or in more densely populated urban areas.
The increase in household income was more pronounced for the Austin MSA –
161.0 percent for the Austin MSA compared to 131.8 percent for the San Antonio
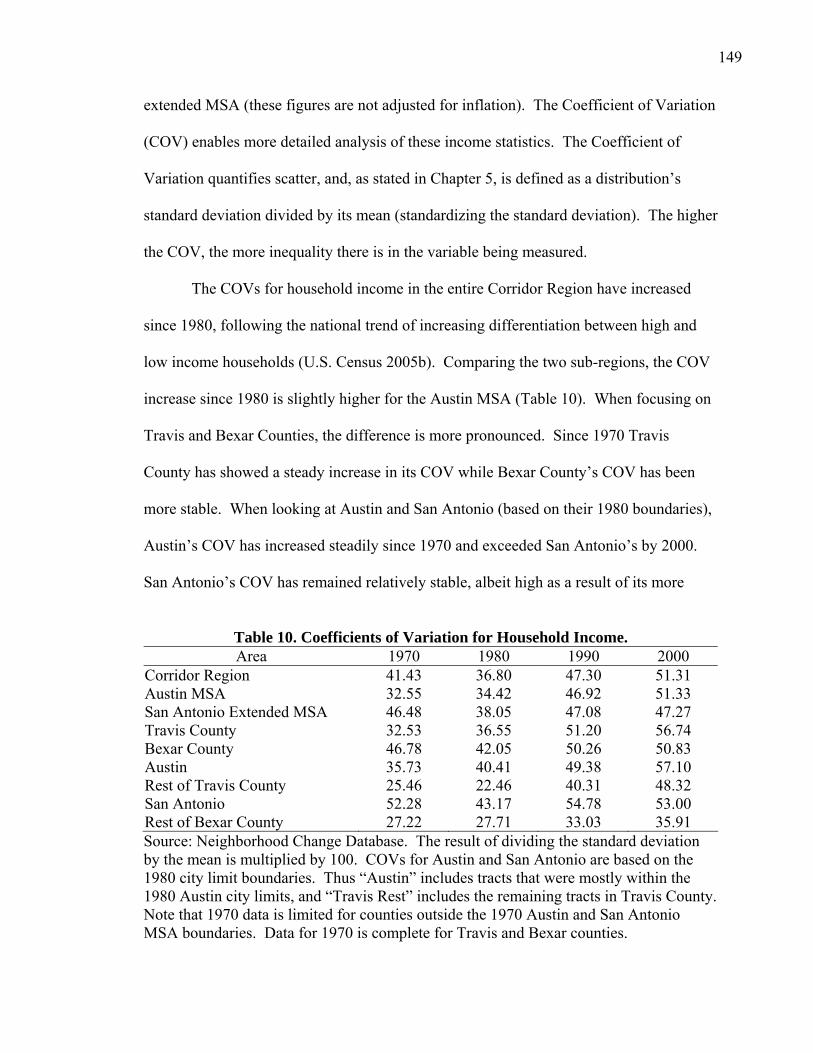
149
extended MSA (these figures are not adjusted for inflation). The Coefficient of Variation
(COV) enables more detailed analysis of these income statistics. The Coefficient of
Variation quantifies scatter, and, as stated in Chapter 5, is defined as a distribution’s
standard deviation divided by its mean (standardizing the standard deviation). The higher
the COV, the more inequality there is in the variable being measured.
The COVs for household income in the entire Corridor Region have increased
since 1980, following the national trend of increasing differentiation between high and
low income households (U.S. Census 2005b). Comparing the two sub-regions, the COV
increase since 1980 is slightly higher for the Austin MSA (Table 10). When focusing on
Travis and Bexar Counties, the difference is more pronounced. Since 1970 Travis
County has showed a steady increase in its COV while Bexar County’s COV has been
more stable. When looking at Austin and San Antonio (based on their 1980 boundaries),
Austin’s COV has increased steadily since 1970 and exceeded San Antonio’s by 2000.
San Antonio’s COV has remained relatively stable, albeit high as a result of its more
Table 10. Coefficients of Variation for Household Income. Area 1970 1980 1990 2000
Corridor Region 41.43 36.80 47.30 51.31 Austin MSA 32.55 34.42 46.92 51.33 San Antonio Extended MSA 46.48 38.05 47.08 47.27 Travis County 32.53 36.55 51.20 56.74 Bexar County 46.78 42.05 50.26 50.83 Austin 35.73 40.41 49.38 57.10 Rest of Travis County 25.46 22.46 40.31 48.32 San Antonio 52.28 43.17 54.78 53.00 Rest of Bexar County 27.22 27.71 33.03 35.91 Source: Neighborhood Change Database. The result of dividing the standard deviation by the mean is multiplied by 100. COVs for Austin and San Antonio are based on the 1980 city limit boundaries. Thus “Austin” includes tracts that were mostly within the 1980 Austin city limits, and “Travis Rest” includes the remaining tracts in Travis County. Note that 1970 data is limited for counties outside the 1970 Austin and San Antonio MSA boundaries. Data for 1970 is complete for Travis and Bexar counties.
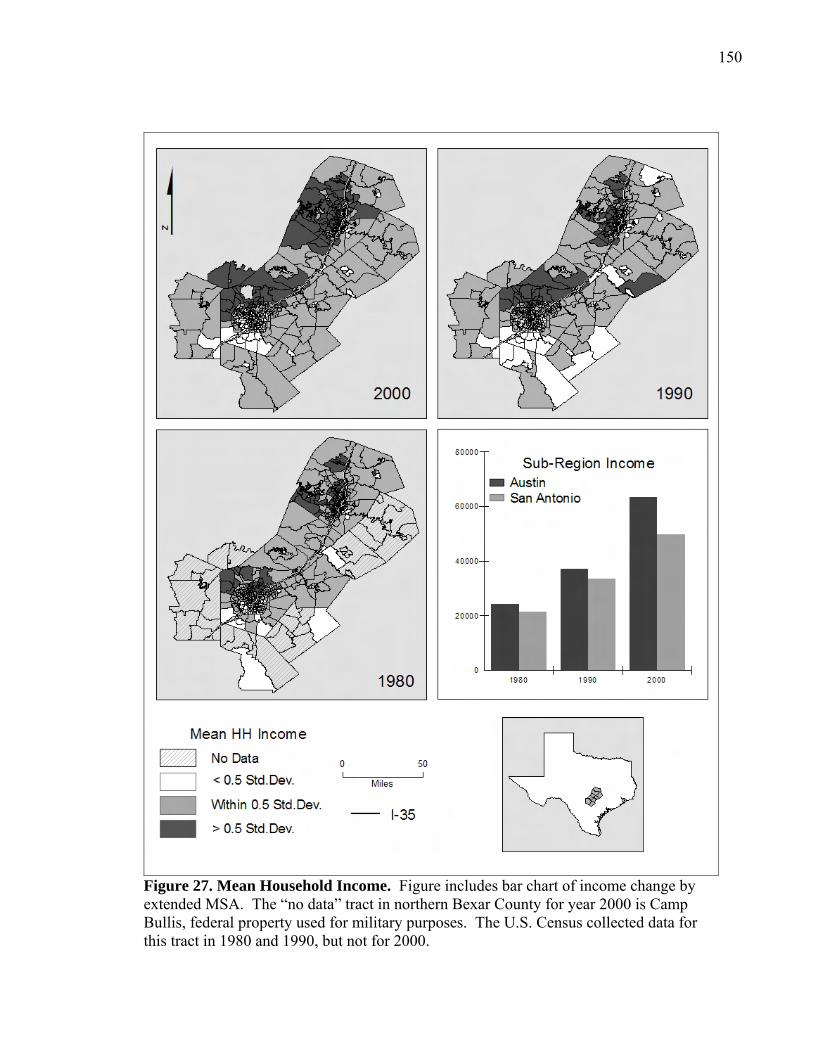
150
Figure 27. Mean Household Income. Figure includes bar chart of income change by extended MSA. The “no data” tract in northern Bexar County for year 2000 is Camp Bullis, federal property used for military purposes. The U.S. Census collected data for this tract in 1980 and 1990, but not for 2000.
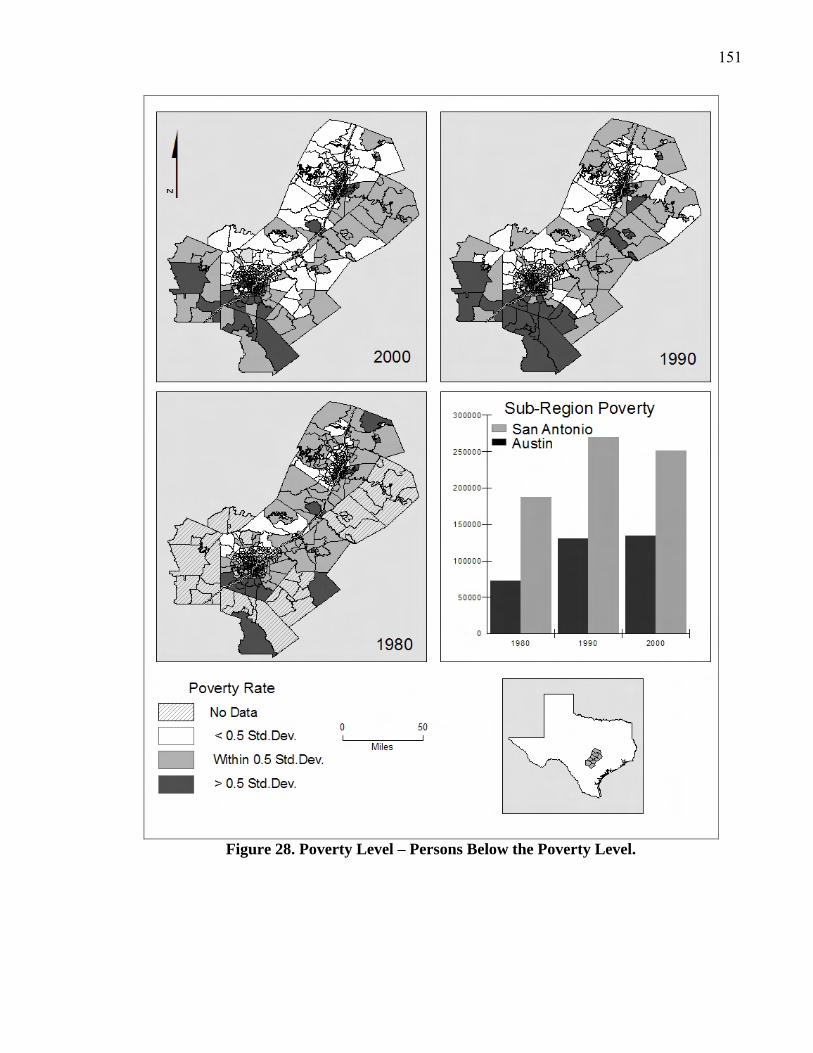
151
Figure 28. Poverty Level – Persons Below the Poverty Level.

152
numerous low-income tracts (Figure 29). The distribution of income in the two cities
reflects the “head-for-the-hills” movement of higher income households evident at the
regional level. In Austin higher income tracts have historically been located west of
Interstate 35, but the number of tracts at least one standard deviation above the mean
household income has decreased from 1980 to 2000, and these tracts appear to be isolated
on the western edge of the 1980 city boundaries (Figure 30). The same phenomenon is
evident in San Antonio as, with the exception of the up-scale enclave of Alamo Heights
located in the northeast quadrant of San Antonio, higher income households have moved
northwest.
Similar patterns are evident when looking at median house value at the regional,
sub-regional, or city scales. Practically all tracts with above-average value are located
west of Interstate 35, and the geographic area has expanded since 1980 (Figure 31). The
increase in house value from 1970 to 2000, similar to household income, is especially
dramatic for the Austin MSA compared to the San Antonio extended MSA: 300.8 percent
compared to 175.2 percent respectively (figures are not adjusted for inflation).
Figure 29. Coefficients of Variation for Household Income: Austin and San Antonio.
Austin
San Antonio
COV
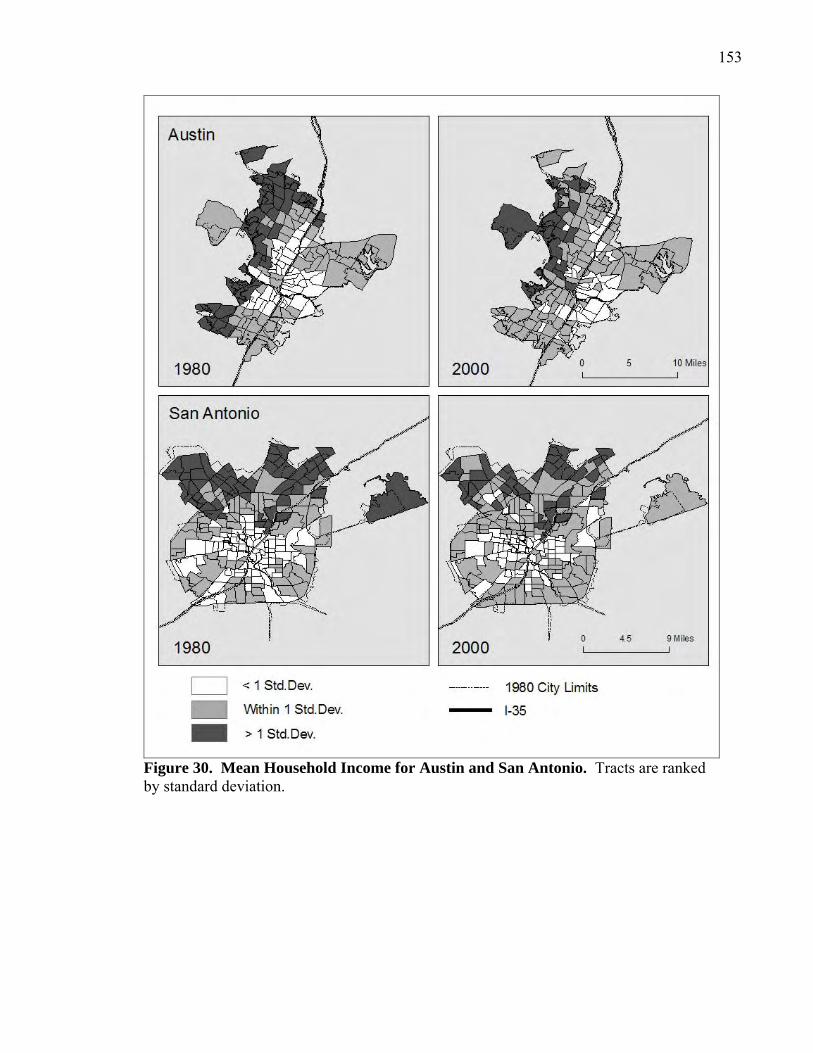
153
Figure 30. Mean Household Income for Austin and San Antonio. Tracts are ranked by standard deviation.
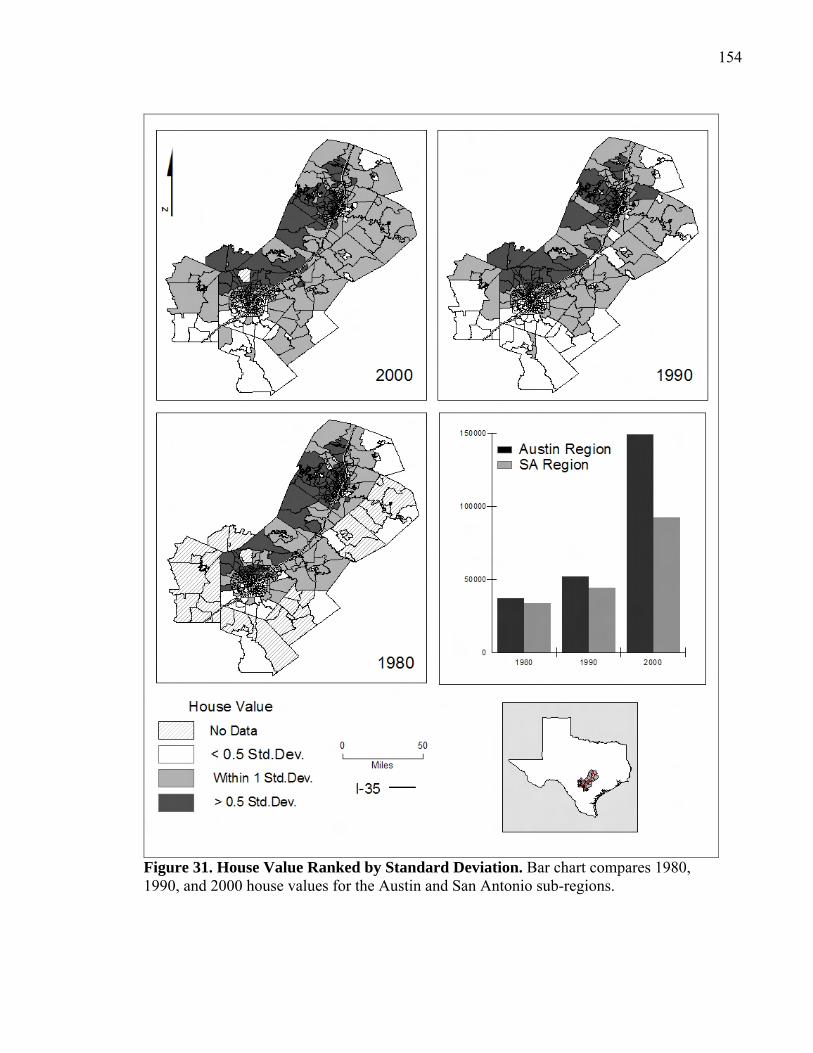
154
Figure 31. House Value Ranked by Standard Deviation. Bar chart compares 1980, 1990, and 2000 house values for the Austin and San Antonio sub-regions.
155
Race/Ethnicity – Segregation Indices
To measure racial/ethnic distance and inequality I will use three segregation
indices: the Index of Dissimilarity, Index of Interaction, and Index of Isolation.
Dissimilarity Index
The index of dissimilarity is the proportion of a group that would have to move
(change tract in my study) to achieve an even distribution of that group in a specified area
(U.S. Census Bureau 2005b). The formula is:
D = ∑ (ti| pi – P|) / 2TP (1 – P) where
• ti is the total population of tract i.
• pi is the minority proportion of tract i’s population.
• P is the minority proportion of the study area’s population; the study area can be the Corridor Region, MSAs, or cities.
• T is the study area’s total population.
The higher the index, the more minority persons would have to move to achieve equality
in the study area. Indices are calculated for blacks/whites and Hispanics/whites where
whites are considered the majority group. The specified areas are the Corridor Region,
the extended MSAs, Travis and Bexar counties, and Austin and San Antonio. The
dissimilarity index has two weaknesses: 1) it measures only two groups at a time, and 2)
it is aspatial – it does not tell you the spatial patterns of segregation, only the relative
degree of segregation. This second weakness is partially overcome by supplementing the
index calculations with a map (Figure 32).
Between 1980 and 2000 there was an overall reduction in residential segregation
for blacks in U.S. metropolitan areas (U.S. Census Bureau 2005b). The index for all U.S.
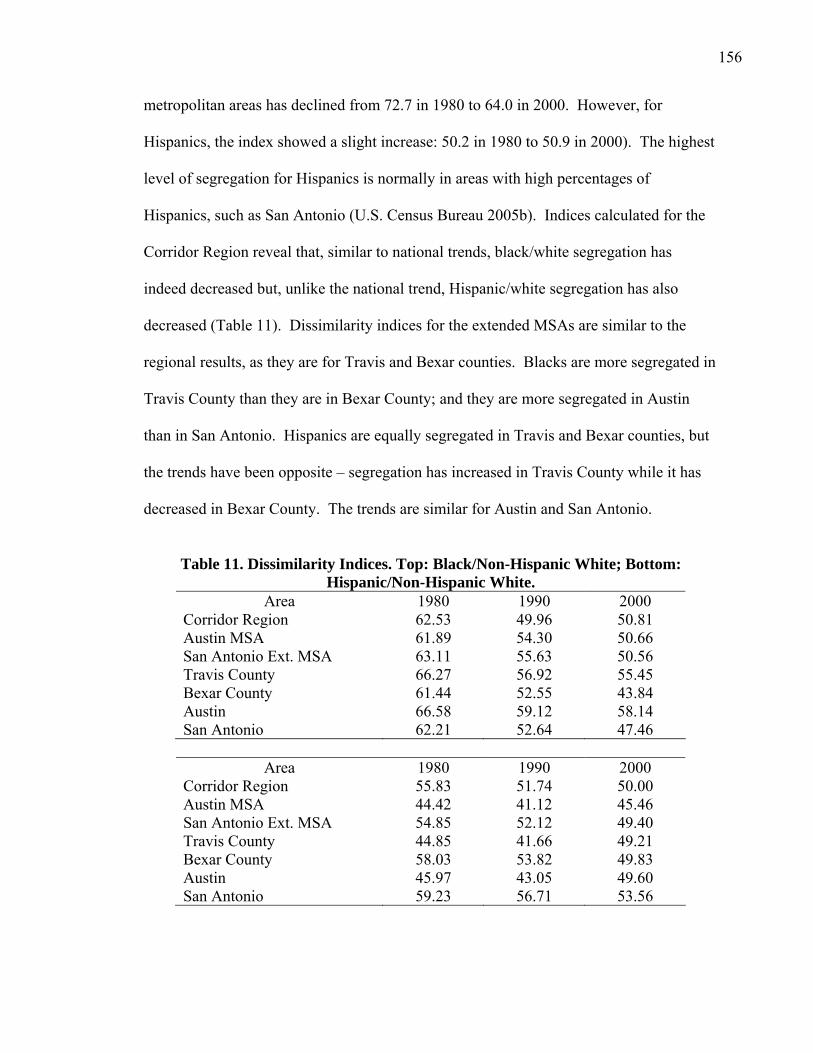
156
metropolitan areas has declined from 72.7 in 1980 to 64.0 in 2000. However, for
Hispanics, the index showed a slight increase: 50.2 in 1980 to 50.9 in 2000). The highest
level of segregation for Hispanics is normally in areas with high percentages of
Hispanics, such as San Antonio (U.S. Census Bureau 2005b). Indices calculated for the
Corridor Region reveal that, similar to national trends, black/white segregation has
indeed decreased but, unlike the national trend, Hispanic/white segregation has also
decreased (Table 11). Dissimilarity indices for the extended MSAs are similar to the
regional results, as they are for Travis and Bexar counties. Blacks are more segregated in
Travis County than they are in Bexar County; and they are more segregated in Austin
than in San Antonio. Hispanics are equally segregated in Travis and Bexar counties, but
the trends have been opposite – segregation has increased in Travis County while it has
decreased in Bexar County. The trends are similar for Austin and San Antonio.
Table 11. Dissimilarity Indices. Top: Black/Non-Hispanic White; Bottom:
Hispanic/Non-Hispanic White. Area 1980 1990 2000
Corridor Region 62.53 49.96 50.81 Austin MSA 61.89 54.30 50.66 San Antonio Ext. MSA 63.11 55.63 50.56 Travis County 66.27 56.92 55.45 Bexar County 61.44 52.55 43.84 Austin 66.58 59.12 58.14 San Antonio 62.21 52.64 47.46
Area 1980 1990 2000
Corridor Region 55.83 51.74 50.00 Austin MSA 44.42 41.12 45.46 San Antonio Ext. MSA 54.85 52.12 49.40 Travis County 44.85 41.66 49.21 Bexar County 58.03 53.82 49.83 Austin 45.97 43.05 49.60 San Antonio 59.23 56.71 53.56
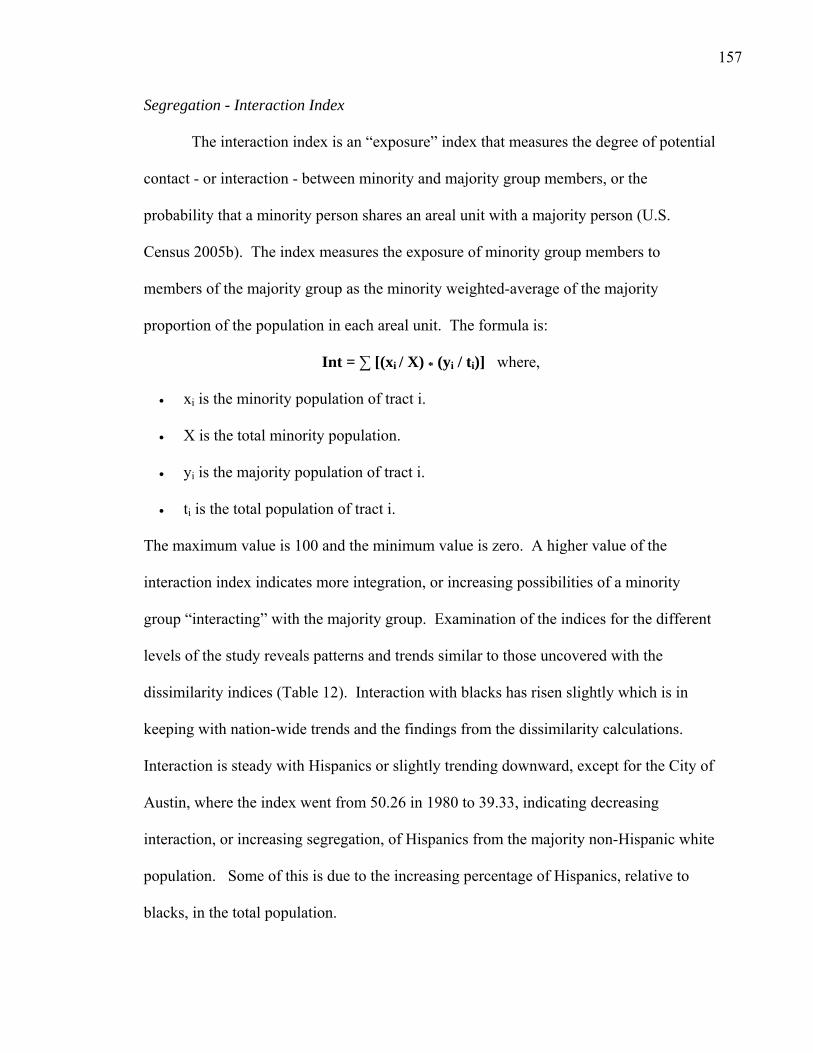
157
Segregation - Interaction Index
The interaction index is an “exposure” index that measures the degree of potential
contact - or interaction - between minority and majority group members, or the
probability that a minority person shares an areal unit with a majority person (U.S.
Census 2005b). The index measures the exposure of minority group members to
members of the majority group as the minority weighted-average of the majority
proportion of the population in each areal unit. The formula is:
Int = ∑ [(xi / X) * (yi / ti)] where,
• xi is the minority population of tract i.
• X is the total minority population.
• yi is the majority population of tract i.
• ti is the total population of tract i.
The maximum value is 100 and the minimum value is zero. A higher value of the
interaction index indicates more integration, or increasing possibilities of a minority
group “interacting” with the majority group. Examination of the indices for the different
levels of the study reveals patterns and trends similar to those uncovered with the
dissimilarity indices (Table 12). Interaction with blacks has risen slightly which is in
keeping with nation-wide trends and the findings from the dissimilarity calculations.
Interaction is steady with Hispanics or slightly trending downward, except for the City of
Austin, where the index went from 50.26 in 1980 to 39.33, indicating decreasing
interaction, or increasing segregation, of Hispanics from the majority non-Hispanic white
population. Some of this is due to the increasing percentage of Hispanics, relative to
blacks, in the total population.
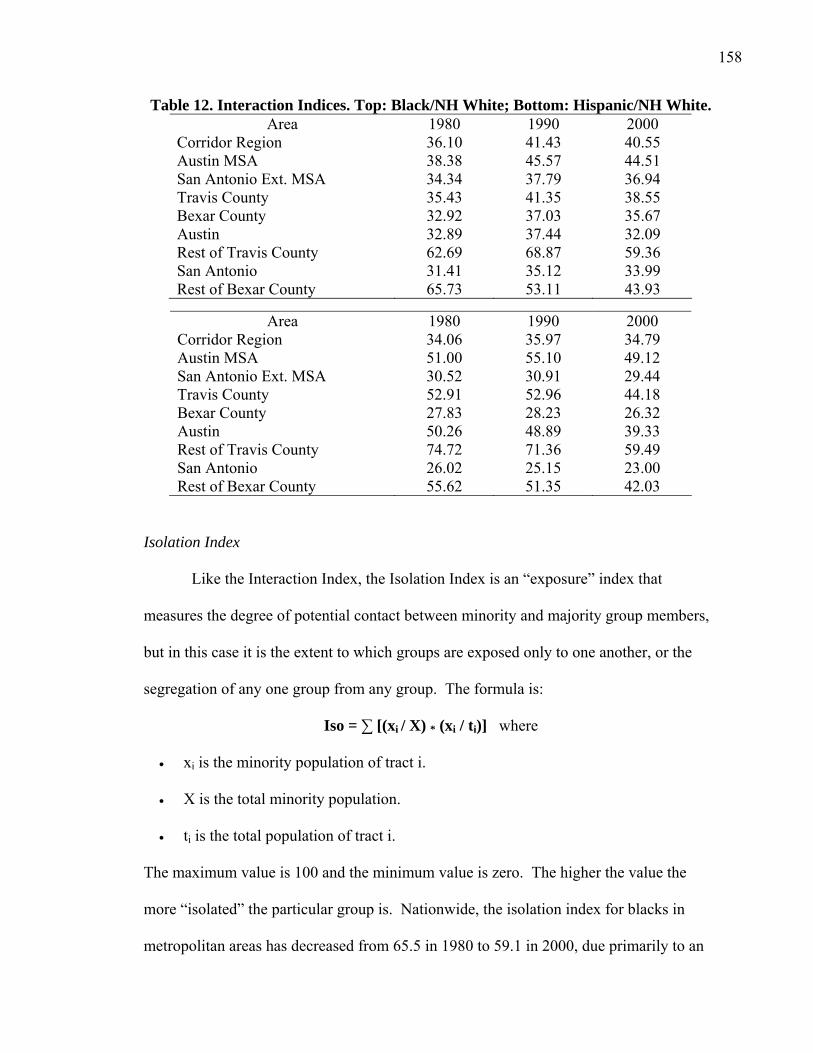
158
Table 12. Interaction Indices. Top: Black/NH White; Bottom: Hispanic/NH White. Area 1980 1990 2000
Corridor Region 36.10 41.43 40.55 Austin MSA 38.38 45.57 44.51 San Antonio Ext. MSA 34.34 37.79 36.94 Travis County 35.43 41.35 38.55 Bexar County 32.92 37.03 35.67 Austin 32.89 37.44 32.09 Rest of Travis County 62.69 68.87 59.36 San Antonio 31.41 35.12 33.99 Rest of Bexar County 65.73 53.11 43.93
Area 1980 1990 2000 Corridor Region 34.06 35.97 34.79 Austin MSA 51.00 55.10 49.12 San Antonio Ext. MSA 30.52 30.91 29.44 Travis County 52.91 52.96 44.18 Bexar County 27.83 28.23 26.32 Austin 50.26 48.89 39.33 Rest of Travis County 74.72 71.36 59.49 San Antonio 26.02 25.15 23.00 Rest of Bexar County 55.62 51.35 42.03
Isolation Index
Like the Interaction Index, the Isolation Index is an “exposure” index that
measures the degree of potential contact between minority and majority group members,
but in this case it is the extent to which groups are exposed only to one another, or the
segregation of any one group from any group. The formula is:
Iso = ∑ [(xi / X) * (xi / ti)] where
• xi is the minority population of tract i.
• X is the total minority population.
• ti is the total population of tract i.
The maximum value is 100 and the minimum value is zero. The higher the value the
more “isolated” the particular group is. Nationwide, the isolation index for blacks in
metropolitan areas has decreased from 65.5 in 1980 to 59.1 in 2000, due primarily to an
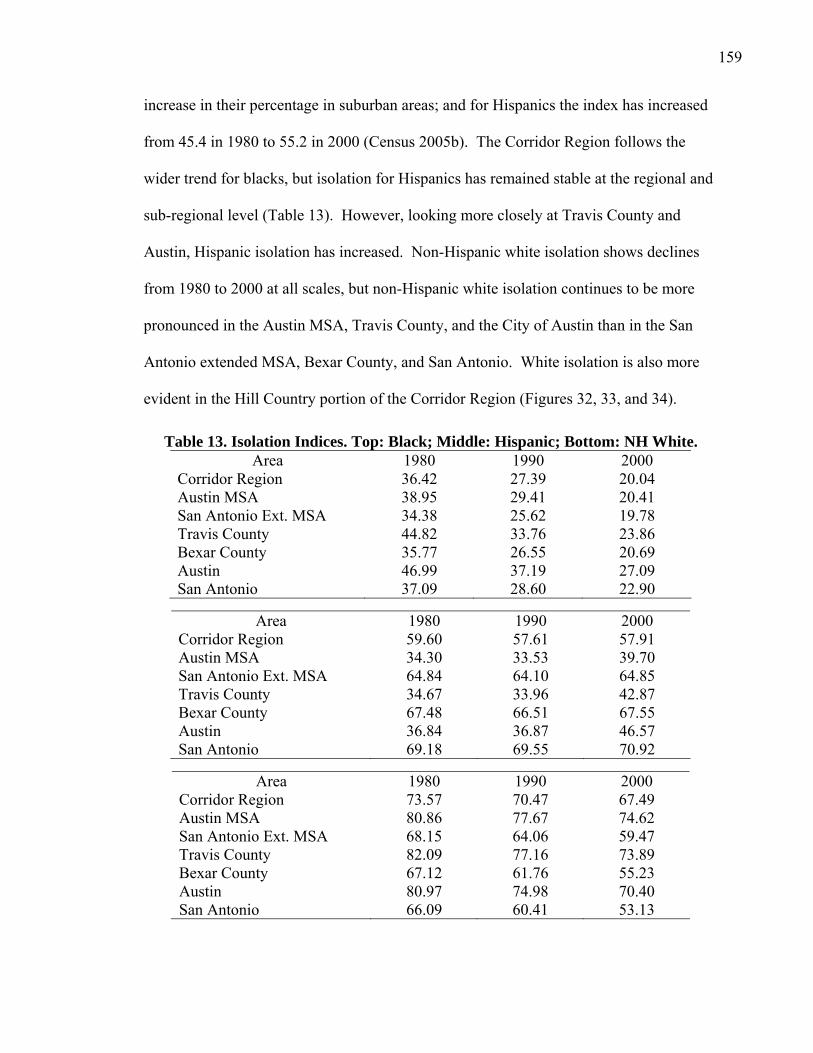
159
increase in their percentage in suburban areas; and for Hispanics the index has increased
from 45.4 in 1980 to 55.2 in 2000 (Census 2005b). The Corridor Region follows the
wider trend for blacks, but isolation for Hispanics has remained stable at the regional and
sub-regional level (Table 13). However, looking more closely at Travis County and
Austin, Hispanic isolation has increased. Non-Hispanic white isolation shows declines
from 1980 to 2000 at all scales, but non-Hispanic white isolation continues to be more
pronounced in the Austin MSA, Travis County, and the City of Austin than in the San
Antonio extended MSA, Bexar County, and San Antonio. White isolation is also more
evident in the Hill Country portion of the Corridor Region (Figures 32, 33, and 34).
Table 13. Isolation Indices. Top: Black; Middle: Hispanic; Bottom: NH White. Area 1980 1990 2000
Corridor Region 36.42 27.39 20.04 Austin MSA 38.95 29.41 20.41 San Antonio Ext. MSA 34.38 25.62 19.78 Travis County 44.82 33.76 23.86 Bexar County 35.77 26.55 20.69 Austin 46.99 37.19 27.09 San Antonio 37.09 28.60 22.90
Area 1980 1990 2000 Corridor Region 59.60 57.61 57.91 Austin MSA 34.30 33.53 39.70 San Antonio Ext. MSA 64.84 64.10 64.85 Travis County 34.67 33.96 42.87 Bexar County 67.48 66.51 67.55 Austin 36.84 36.87 46.57 San Antonio 69.18 69.55 70.92
Area 1980 1990 2000 Corridor Region 73.57 70.47 67.49 Austin MSA 80.86 77.67 74.62 San Antonio Ext. MSA 68.15 64.06 59.47 Travis County 82.09 77.16 73.89 Bexar County 67.12 61.76 55.23 Austin 80.97 74.98 70.40 San Antonio 66.09 60.41 53.13
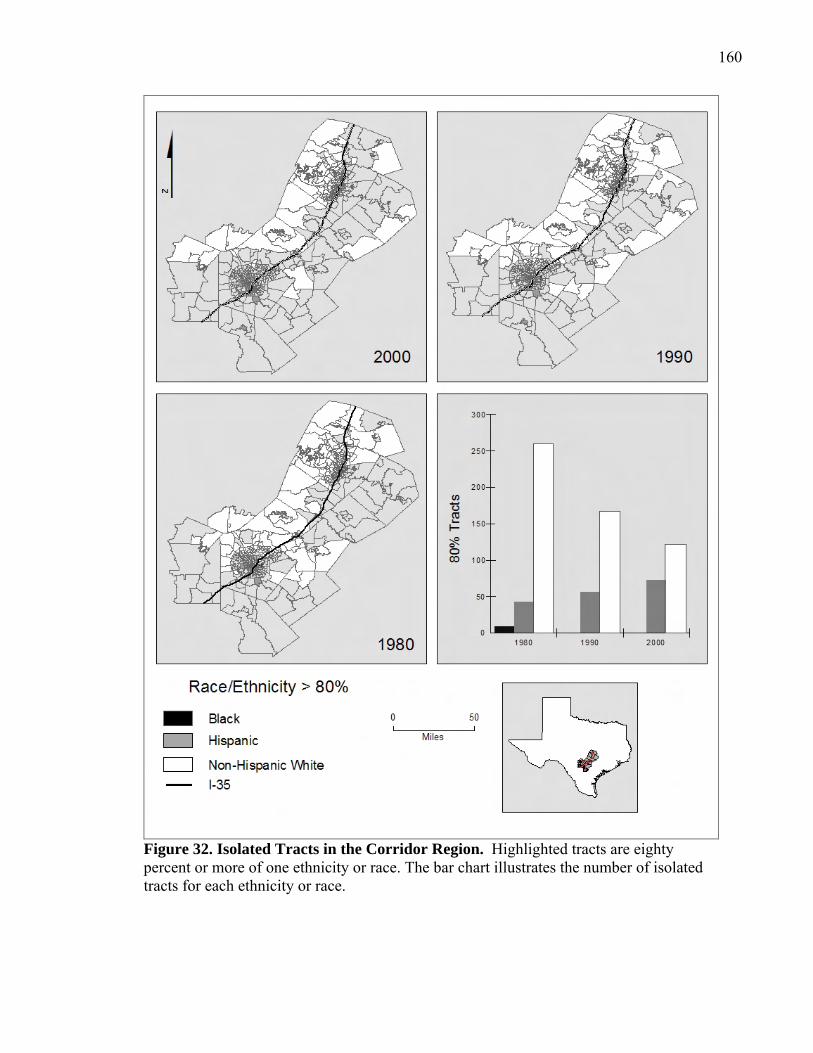
160
Figure 32. Isolated Tracts in the Corridor Region. Highlighted tracts are eighty percent or more of one ethnicity or race. The bar chart illustrates the number of isolated tracts for each ethnicity or race.

161
Figure 33. Isolated Tracts in Travis County (above) and City of Austin (below). Based on 1980 city limits. Highlighted tracts are eighty percent or more of one ethnicity or race.

162
Figure 34. Isolated Tracts in Bexar County (above) and City of San Antonio (below). Based on 1980 city limits. Highlighted tracts are eighty percent or more of one ethnicity or race.
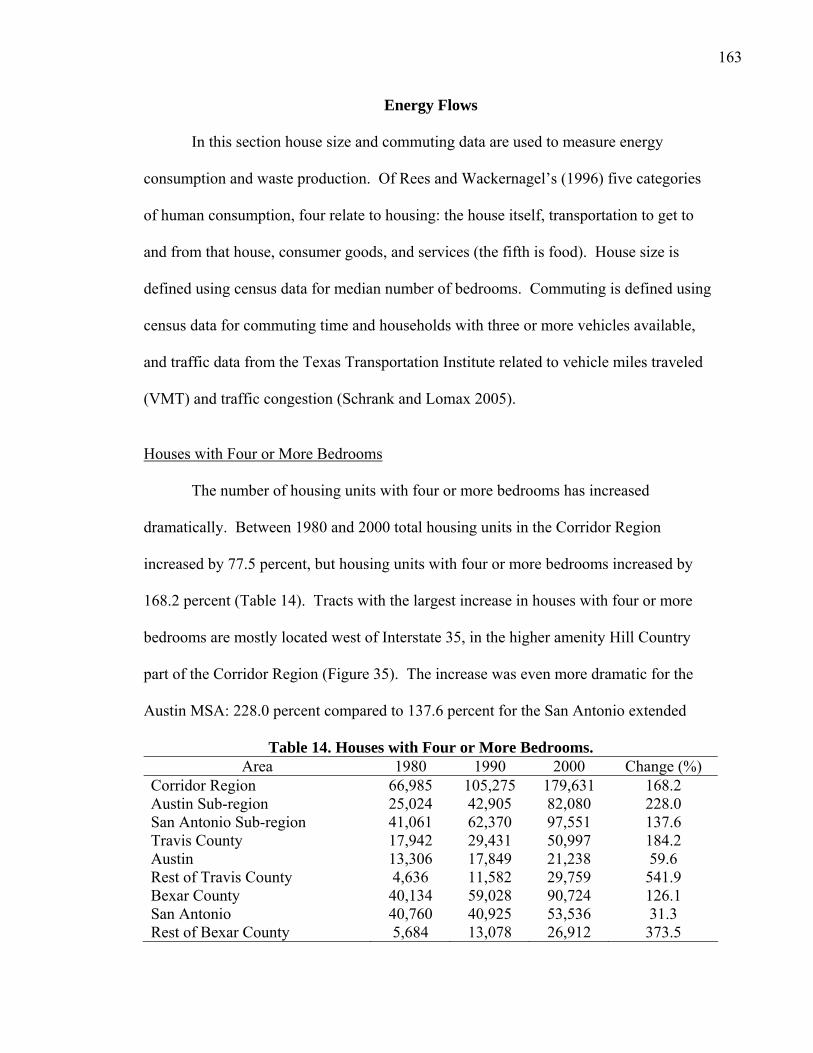
163
Energy Flows
In this section house size and commuting data are used to measure energy
consumption and waste production. Of Rees and Wackernagel’s (1996) five categories
of human consumption, four relate to housing: the house itself, transportation to get to
and from that house, consumer goods, and services (the fifth is food). House size is
defined using census data for median number of bedrooms. Commuting is defined using
census data for commuting time and households with three or more vehicles available,
and traffic data from the Texas Transportation Institute related to vehicle miles traveled
(VMT) and traffic congestion (Schrank and Lomax 2005).
Houses with Four or More Bedrooms
The number of housing units with four or more bedrooms has increased
dramatically. Between 1980 and 2000 total housing units in the Corridor Region
increased by 77.5 percent, but housing units with four or more bedrooms increased by
168.2 percent (Table 14). Tracts with the largest increase in houses with four or more
bedrooms are mostly located west of Interstate 35, in the higher amenity Hill Country
part of the Corridor Region (Figure 35). The increase was even more dramatic for the
Austin MSA: 228.0 percent compared to 137.6 percent for the San Antonio extended
Table 14. Houses with Four or More Bedrooms. Area 1980 1990 2000 Change (%)
Corridor Region 66,985 105,275 179,631 168.2 Austin Sub-region 25,024 42,905 82,080 228.0 San Antonio Sub-region 41,061 62,370 97,551 137.6 Travis County 17,942 29,431 50,997 184.2 Austin 13,306 17,849 21,238 59.6 Rest of Travis County 4,636 11,582 29,759 541.9 Bexar County 40,134 59,028 90,724 126.1 San Antonio 40,760 40,925 53,536 31.3 Rest of Bexar County 5,684 13,078 26,912 373.5
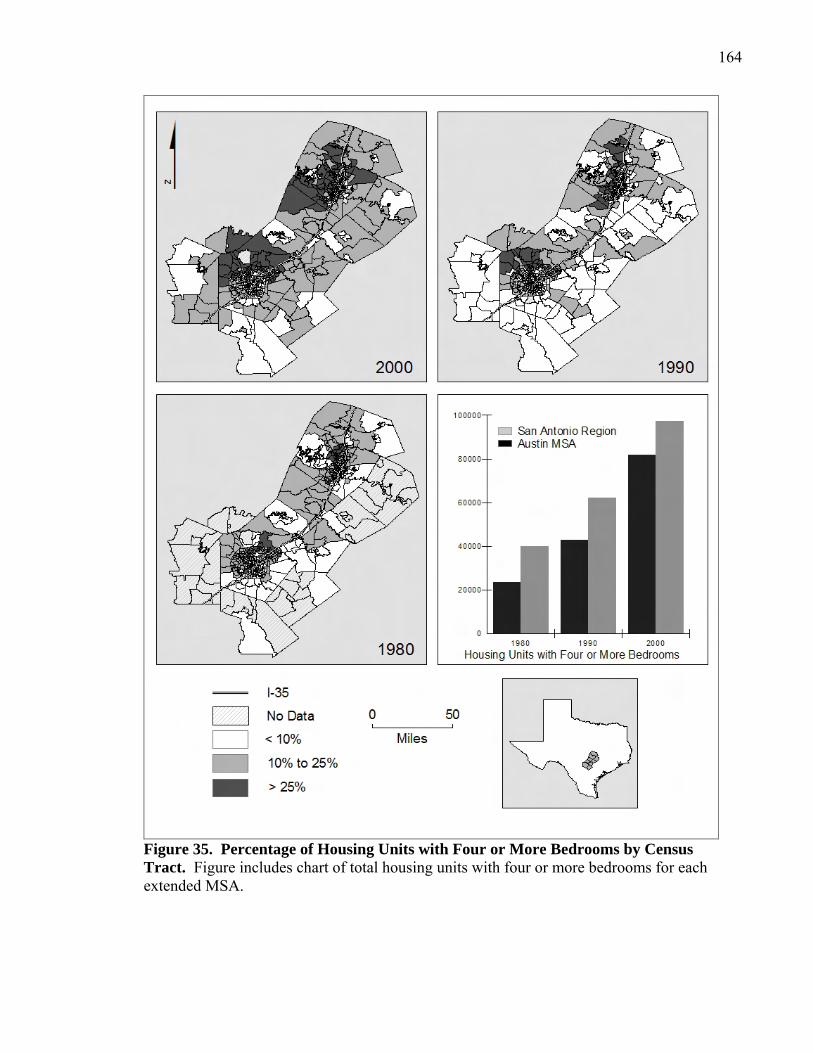
164
Figure 35. Percentage of Housing Units with Four or More Bedrooms by Census Tract. Figure includes chart of total housing units with four or more bedrooms for each extended MSA.
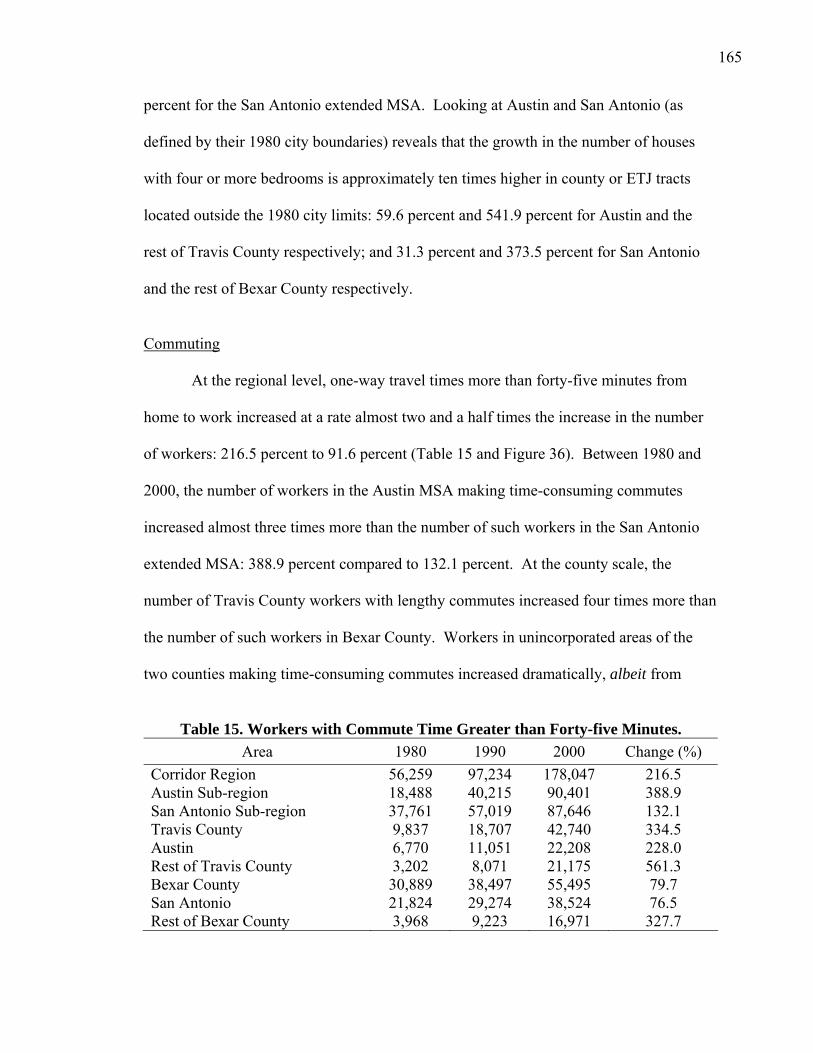
165
percent for the San Antonio extended MSA. Looking at Austin and San Antonio (as
defined by their 1980 city boundaries) reveals that the growth in the number of houses
with four or more bedrooms is approximately ten times higher in county or ETJ tracts
located outside the 1980 city limits: 59.6 percent and 541.9 percent for Austin and the
rest of Travis County respectively; and 31.3 percent and 373.5 percent for San Antonio
and the rest of Bexar County respectively.
Commuting
At the regional level, one-way travel times more than forty-five minutes from
home to work increased at a rate almost two and a half times the increase in the number
of workers: 216.5 percent to 91.6 percent (Table 15 and Figure 36). Between 1980 and
2000, the number of workers in the Austin MSA making time-consuming commutes
increased almost three times more than the number of such workers in the San Antonio
extended MSA: 388.9 percent compared to 132.1 percent. At the county scale, the
number of Travis County workers with lengthy commutes increased four times more than
the number of such workers in Bexar County. Workers in unincorporated areas of the
two counties making time-consuming commutes increased dramatically, albeit from
Table 15. Workers with Commute Time Greater than Forty-five Minutes.
Area 1980 1990 2000 Change (%) Corridor Region 56,259 97,234 178,047 216.5 Austin Sub-region 18,488 40,215 90,401 388.9 San Antonio Sub-region 37,761 57,019 87,646 132.1 Travis County 9,837 18,707 42,740 334.5 Austin 6,770 11,051 22,208 228.0 Rest of Travis County 3,202 8,071 21,175 561.3 Bexar County 30,889 38,497 55,495 79.7 San Antonio 21,824 29,274 38,524 76.5 Rest of Bexar County 3,968 9,223 16,971 327.7
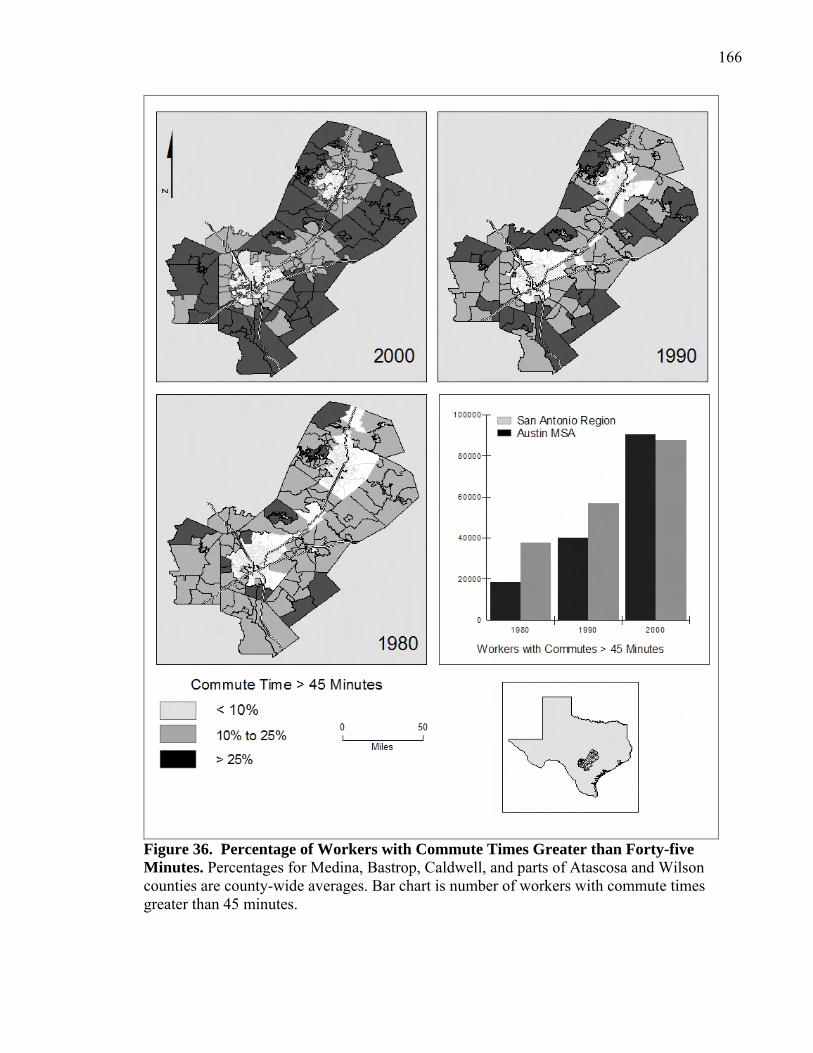
166
Figure 36. Percentage of Workers with Commute Times Greater than Forty-five Minutes. Percentages for Medina, Bastrop, Caldwell, and parts of Atascosa and Wilson counties are county-wide averages. Bar chart is number of workers with commute times greater than 45 minutes.
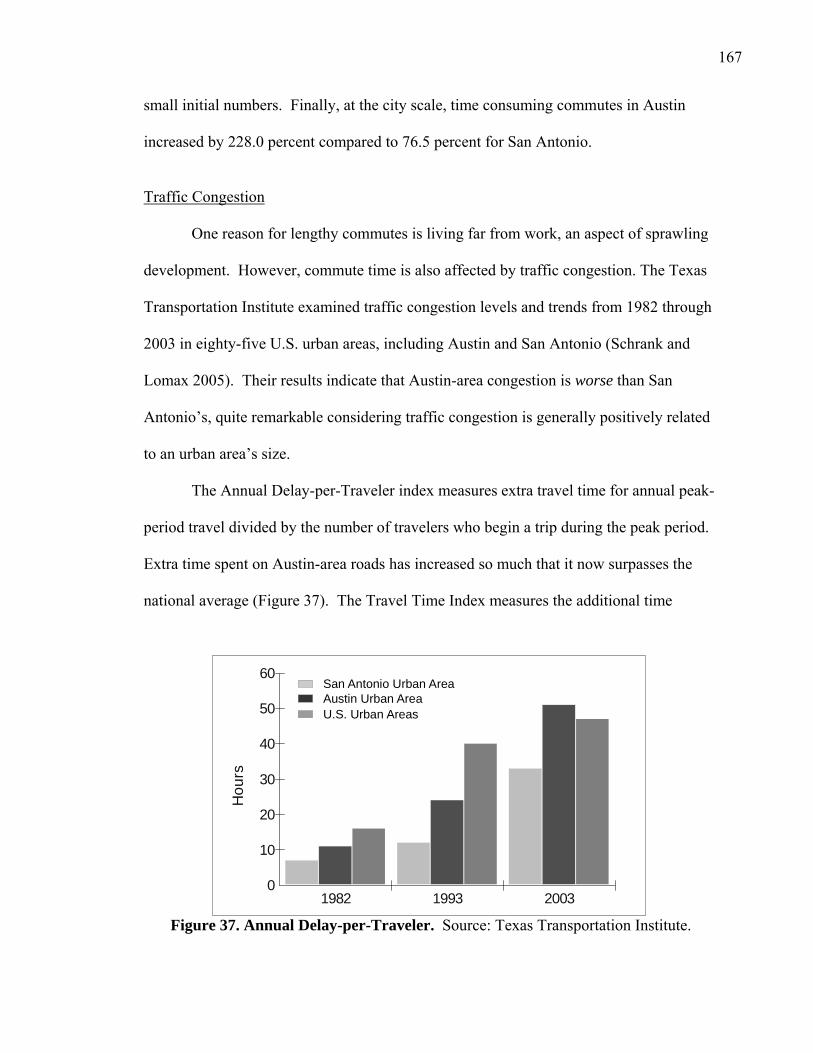
167
small initial numbers. Finally, at the city scale, time consuming commutes in Austin
increased by 228.0 percent compared to 76.5 percent for San Antonio.
Traffic Congestion
One reason for lengthy commutes is living far from work, an aspect of sprawling
development. However, commute time is also affected by traffic congestion. The Texas
Transportation Institute examined traffic congestion levels and trends from 1982 through
2003 in eighty-five U.S. urban areas, including Austin and San Antonio (Schrank and
Lomax 2005). Their results indicate that Austin-area congestion is worse than San
Antonio’s, quite remarkable considering traffic congestion is generally positively related
to an urban area’s size.
The Annual Delay-per-Traveler index measures extra travel time for annual peak-
period travel divided by the number of travelers who begin a trip during the peak period.
Extra time spent on Austin-area roads has increased so much that it now surpasses the
national average (Figure 37). The Travel Time Index measures the additional time
Figure 37. Annual Delay-per-Traveler. Source: Texas Transportation Institute.
Hou
rs
0
10
20
30
40
50
60
1982 1993 2003
San Antonio Urban AreaAustin Urban AreaU.S. Urban Areas
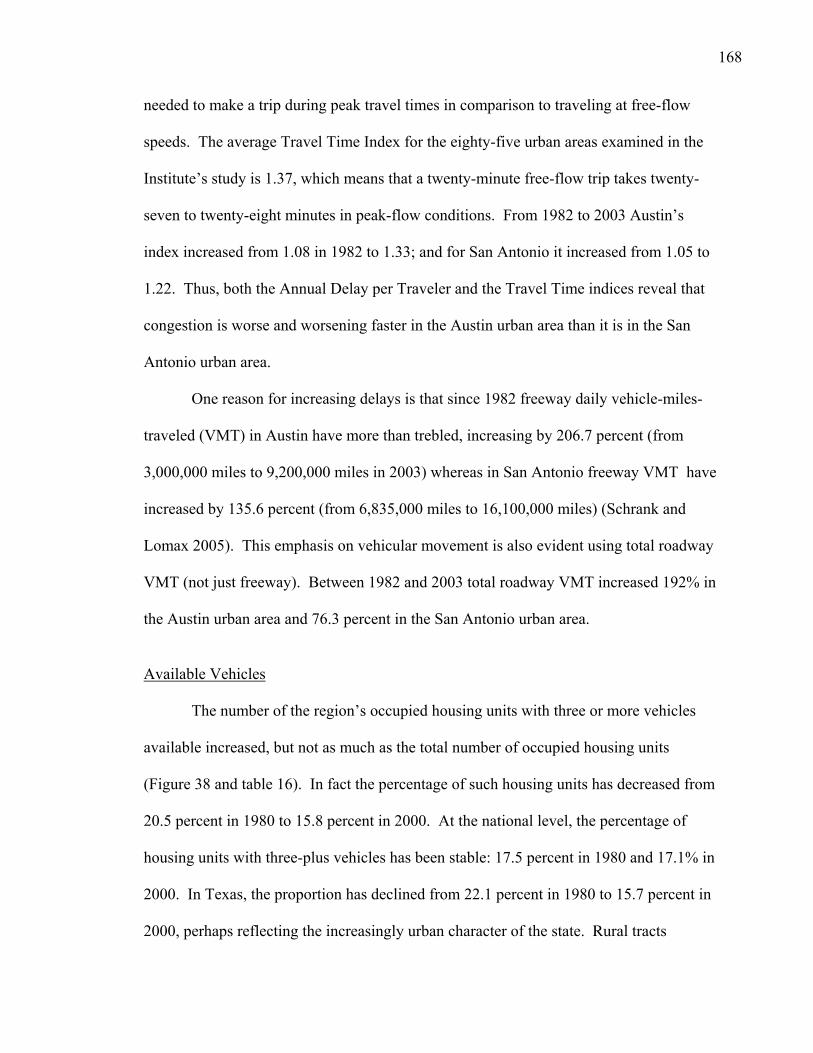
168
needed to make a trip during peak travel times in comparison to traveling at free-flow
speeds. The average Travel Time Index for the eighty-five urban areas examined in the
Institute’s study is 1.37, which means that a twenty-minute free-flow trip takes twenty-
seven to twenty-eight minutes in peak-flow conditions. From 1982 to 2003 Austin’s
index increased from 1.08 in 1982 to 1.33; and for San Antonio it increased from 1.05 to
1.22. Thus, both the Annual Delay per Traveler and the Travel Time indices reveal that
congestion is worse and worsening faster in the Austin urban area than it is in the San
Antonio urban area.
One reason for increasing delays is that since 1982 freeway daily vehicle-miles-
traveled (VMT) in Austin have more than trebled, increasing by 206.7 percent (from
3,000,000 miles to 9,200,000 miles in 2003) whereas in San Antonio freeway VMT have
increased by 135.6 percent (from 6,835,000 miles to 16,100,000 miles) (Schrank and
Lomax 2005). This emphasis on vehicular movement is also evident using total roadway
VMT (not just freeway). Between 1982 and 2003 total roadway VMT increased 192% in
the Austin urban area and 76.3 percent in the San Antonio urban area.
Available Vehicles
The number of the region’s occupied housing units with three or more vehicles
available increased, but not as much as the total number of occupied housing units
(Figure 38 and table 16). In fact the percentage of such housing units has decreased from
20.5 percent in 1980 to 15.8 percent in 2000. At the national level, the percentage of
housing units with three-plus vehicles has been stable: 17.5 percent in 1980 and 17.1% in
2000. In Texas, the proportion has declined from 22.1 percent in 1980 to 15.7 percent in
2000, perhaps reflecting the increasingly urban character of the state. Rural tracts

169
generally have higher rates of multi-vehicle ownership than urban/suburban tracts, most
likely as a result of the need for farm and ranching trucks. As the region has become
more urban, the need for work vehicles has apparently declined. People are still driving
more and spending more time commuting to and from work, but are generally relying on
one or two cars per household. In hindsight, I should have measured the increase in the
number of occupied housing units with two or more vehicles available. This will be a
topic for future research.
Table 16. Percentage of Occupied Housing Units with Three or More Cars.
Area 1980 1990 2000 Corridor Region 20.5 15.4 15.8 Austin MSA 20.9 14.6 15.6 San Antonio Extended MSA 20.0 15.9 15.9 Travis County 18.9 12.6 13.5 Austin 16.5 10.5 11.0 Travis - Remainder 31.7 20.0 19.4 Bexar County 18.8 14.9 14.6 San Antonio 17.9 14.0 13.4 Bexar - Remainder 27.0 19.5 19.0
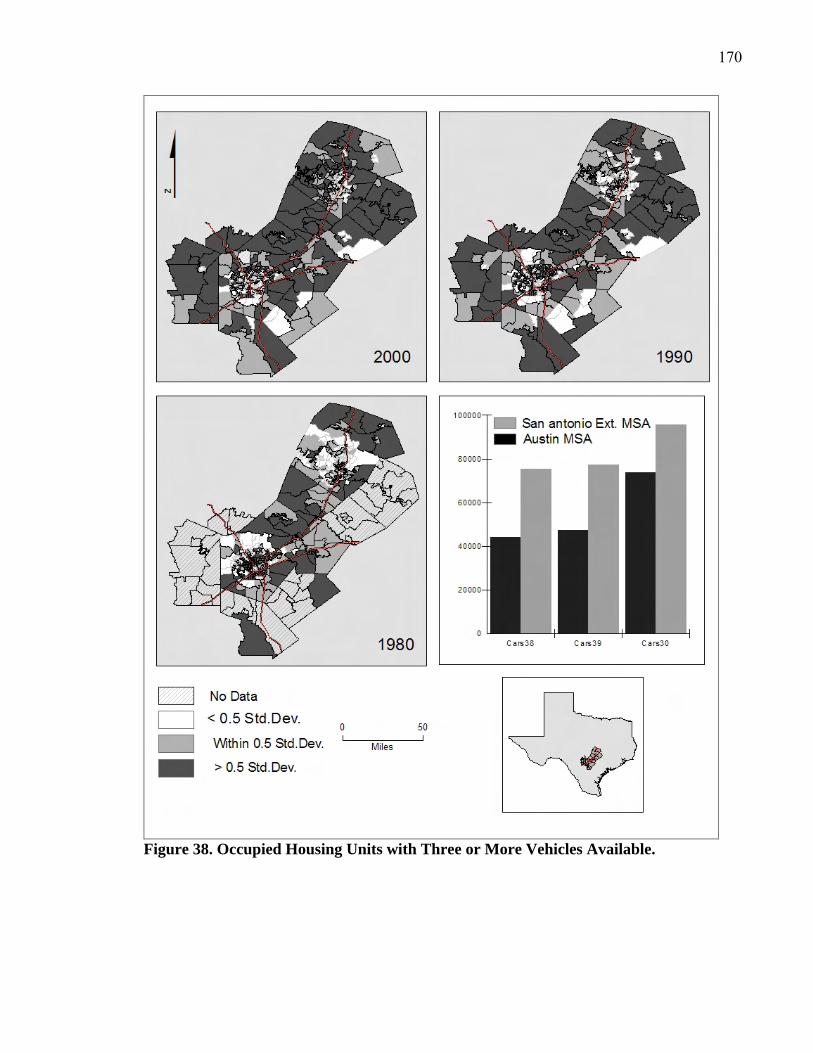
170
Figure 38. Occupied Housing Units with Three or More Vehicles Available.
171
Concluding Comments
This concludes the quantitative and map analysis of sustainability variables in the
Corridor Region. Research results have been presented for all the measures listed in the
“Operational Matrix” from Chapter 5 (Table 2), with the exception of unearned income
and median number of rooms. It seems these data are not comparable from 1980 to 2000,
perhaps due to changes in the wording of the census questionnaire. Still, I purposely
built in some redundancy in the selection of variable measures, and thus have the results
necessary to draw conclusions about the Corridor Region’s development. The next and
final chapter reviews the results of this chapter and the plan analysis chapter, and
discusses whether growth and change at the multiple scales of my study appear to be
sustainable, and whether comprehensive planning made a difference in the type and
location of urban development that has been taking place.
172
CHAPTER VIII
DISCUSSION OF RESULTS, AND CONCLUSION
In the first chapter two basic research questions were posed: 1) Do growth
outcomes reflect comprehensive plan policies? And 2) are growth trends in the
Austin/San Antonio paradigmatic region sustainable? In this final chapter the results of
the plan and quantitative/map analyses will be used to answer these questions. I will
discuss why the spatial patterns in the maps look the way they do, and whether
development patterns and processes reveal that comprehensive planning is effective,
ineffective, or irrelevant. I will revisit the background chapter and literature review to
enlighten and frame the results, and then conclude with some general recommendations
for future action.
Summary of Results
Growth outcomes do not necessarily reflect comprehensive plan policies.
• Plans are different.
• The Austin plan supported sustainable development to a much higher degree than the San Antonio plan.
• Growth outcomes are the same.
• Differences between the two plans in support of sustainable development are not reflected in growth trends in the two cities.
• Sprawl, socio-economic distance, and geographic polarization increased in both cities and their respective MSAs.
• Energy use increased throughout the Corridor Region.
173
Growth trends in the Austin/San Antonio paradigmatic region are not sustainable. • Indicators support unsustainable growth trends at multiple scales.
• Sprawl
• Highest growth is encountered in rural and exurban areas, and outside municipal city limits.
• Socio-economic distance and geographic polarization
• Income and house value differentials have increased. • Non-Hispanic white isolation continues.
• Energy use
• House size, commuting time, and traffic congestion have all increased.
Summary Discussion
In the methodology chapter, four possible outcomes of my plan and growth
outcome analyses were offered (Table 4, page 106). The findings support the fourth
outcome: the plans are different, and the growth outcomes are essentially the same. The
associated “Meaning and Conclusion” for this research outcome was: “If the plans are
significantly different but both areas exhibit unsustainable growth patterns,
comprehensive planning may not be effective at achieving sustainability goals.” The
Austin and San Antonio comprehensive plans certainly were very different. The Austin
Tomorrow Plan reflected a higher sustainability standard than the San Antonio
Foreward, Basic Plan, and Land Use Plan, which focused on economic development and
accommodating growth. The plans reflect the differences in the two community’s
planning paradigms over the years. If comprehensive plans are effective at achieving
their goals, Austin should have exhibited either a more sustainable pattern of urban
growth than San Antonio, or, at minimum, progress toward a “higher sustainability
standard.” Granted, growth pressures were greater in Austin than they were in San
174
Antonio making a direct comparison between the two cities difficult. Arguably, due to its
more rapid growth, things could have “been worse” in Austin if not for the Austin
Tomorrow Plan. Regardless, as will be shown in this review of the research results,
Austin neither exhibits a more sustainable growth pattern than San Antonio, nor does it
seem to be achieving the sustainability goals of its comprehensive plan. This conclusion
is based on my measurements of sprawl, socio-economic distance, and energy flows for
the two cities, their MSA or extended MSA, and the Corridor Region.
Sprawl
The Corridor Region’s sprawling growth pattern – one of the primary reasons for
Austin and San Antonio’s comprehensive planning efforts in the 1970s – continued from
1980 to 2000. When a city grows it can expand outward or upward, or in some cases by
infilling vacant urban land. Outward growth can take different forms, including compact
“villages” (or nodes) and low-density sprawl. Maps reveal that the region’s urban field is
expanding rapidly. There has been a massive expansion in the space covered by new
housing units and associated urban landscapes. The highest housing growth rates were in
what were rural, exurban and suburban tracts at the beginning of the study period.
The City of Austin and its MSA faced the most intense growth pressures: their
overall housing growth rates were approximately twice those of San Antonio and its
extended MSA. The fastest housing growth occurred mostly west of Interstate 35 in
high-amenity Hill Country tracts. Most growth in Bexar County occurred on the favored
north side, and by 2000 new housing had expanded into formerly rural and exurban tracts
in Comal, Kendall, Bandera, Medina, and Guadalupe counties. In the Austin MSA, the
most rapid growth was in the western and northern parts of Travis County and in the

175
rural/exurban tracts of Hays, Williamson, and Bastrop counties, well outside the Austin
Tomorrow Plan’s preferred growth corridor. Finally, growth outside the region’s
incorporated city limits was more rapid than within their limits.
There seems to be little difference - other than the growth rate - between the
housing growth patterns of Austin and San Antonio, or between the Austin MSA and the
San Antonio extended MSA. Other research reinforces this finding, at least for a point-
in-time, if not for the continuing trend. For instance, Ewing, Pendall, and Chen (2002),
in their analysis of eighty-three U.S. metropolitan areas, found that both the Austin and
San Antonio MSAs were more or less equally sprawling. Their “four factor sprawl
index” used not only residential density as a variable, but also neighborhood mix of
homes, jobs, and services, strength of activity centers, and accessibility of the street
network. A higher index meant a higher sprawl level. Both the Austin and San Antonio
MSAs ended up with relatively high indices: fifty-eighth and fifty-third respectively.
Socio-Economic Distance/Inequality
Quantitative and map analyses illustrate increasing differentials in the region’s
mean household income. In 2000 practically all the highest income and lowest poverty-
level tracts were located west of Interstate 35. The Balcones Escarpment has long been a
“cultural divide,” but the total area of high income tracts has expanded in geographic area
further into the Hill Country. Similarly, practically all of the Corridor Region’s high-
value housing has been located west of Interstate 35, but the geographic area has
expanded since 1980. Tracts with lowest incomes and highest poverty rates remain in the
region’s two principle cities or in southern Bexar County. Looking at Austin, higher
incomes appear to be retreating to the west, and extremely low-income tracts were more
176
concentrated east of Interstate 35 in 2000 than they were in 1980. In San Antonio higher
income tracts are thinning out in the northern suburbs and moving further north,
northwest and northeast. The Coefficients of Variation (COV) reinforce the visual
evidence that there is an increasing spatial distance between the highest and lowest
incomes in the area. Between 1970 and 2000, Austin and Travis County had a steady
increase in their COVs. During this time, the COVs for San Antonio and Bexar County
remained relatively stable. Based on these results, there seems to be an increasing spatial
differential in income in the Corridor Region, and the differential appears to be more
extreme in Austin and Travis County in spite of the Austin Tomorrow Plan’s emphasis on
equity, perhaps due to faster growth and more high-tech industries in the area.
Map analysis and segregation indices indicate that Blacks have become less
segregated in the Corridor Region while Hispanic segregation has increased or remained
the same depending upon the area analyzed. The dissimilarity and interaction indices
indicate higher levels of black segregation in Austin than in San Antonio, and higher
levels of Hispanic segregation in San Antonio than in Austin. The higher level of
Hispanic segregation in San Antonio is to be expected with its very high proportion of
Hispanic population.
Non-Hispanic whites have the highest isolation indices in the Corridor Region.
There has been a decline in the number of predominantly non-Hispanic white tracts east
of Interstate 35, and by 2000 most of such tracts were located in the Hill Country. Non-
Hispanic white isolation is more pronounced in the Austin MSA, Travis County, and the
City of Austin than it is in the San Antonio extended MSA, Bexar County, or the City of
San Antonio. Looking more closely at the cities of San Antonio and Austin, the pattern is
similar to the household income pattern. In 2000, predominantly non-Hispanic white
177
tracts were located further to the west in Austin or further to the northwest in San
Antonio than they were in 1980. Formerly non-Hispanic white tracts closer to the center
of each city are becoming more integrated.
Energy Flows
My house size analysis indicates an exponential growth in the region’s number of
houses with four or more bedrooms. In fact, the number of houses with four-plus
bedrooms increased at a rate that was twice that of total housing units. Highest growth
rates are outside the cities of Austin and San Antonio in formerly rural and exurban
tracts. Indeed, most Americans are buying bigger and bigger houses. Average house size
in the U.S.A. has been increasing while the number of persons-per-household has been
decreasing. In the 1950s the average home was only 1,140 square feet. It grew to 1,800
square feet in the 1970s, and by 2004 it was 2,349 square feet (U.S. Census 2005c).
Evidently there has been a change in the perception of what a home should be since the
earliest days of suburbanization. Andrew Jackson Downing’s suburban villas and
Levittown’s eight-hundred square foot “dream homes” have given way to houses with big
family rooms, walk-in closets, spacious bedrooms, and large backyards. This spacious
dream home has prevailed over other housing visions, one based on the efficient
consumption of scare resources, and the other based on the neighborhood (Hayden 1984).
To an extent this housing pattern is due to investment in the secondary circuit of
capital, i.e. houses, streets and other infrastructure, and associated commercial and retail
land uses. Growth as an economic stimulus had its beginnings with Herbert Hoover’s
Commission on Home Building and Home Ownership which “established the private,
single family home as a national goal to promote long-term economic growth and
178
recovery from the Depression.” At the time, both union leaders and manufacturers
agreed that a more spacious, mass-produced house was essential to enable workers and
their families to consume thus stimulating the economy (Hayden 1984).
Looking at commuting and traffic in the Corridor Region, from 1980 to 2000 the
number of workers with time-consuming commutes increased almost three times faster
than population growth. The increase in the number of such workers in the City of
Austin and its MSA was almost three times the increase for the City of San Antonio and
its extended MSA. Given that the rate of population growth in the Austin MSA was
approximately double the rate in the San Antonio extended MSA, the data indicate an
apparent failure to implement the Austin Tomorrow Plan policies of accessible and
walkable neighborhoods, increased public transportation, and a shift away from
development practices centered on the automobile. Furthermore, Austin urban-area
vehicle miles traveled (VMT) increased much more than VMT in the San Antonio urban
area. Annual-delay-per-traveler increased so much in Austin that it surpassed the
national average for eighty-five urban areas, most of them larger than Austin. At the
same time lane miles are increasing. Today toll roads are planned, an approach to
congestion that gives even more space to cars, hastening the removal of uncommodified
space and turning it into profit-generating commodifed space.
In summary I found bigger and more expensive homes demanding more energy
being built west of Interstate 35 on environmentally fragile land. This growth pattern
inevitably results in a rapid consumption of land in the urban field, and the resulting
dispersed population becomes increasingly dependent upon the subsidized expressways
that resulted from the Interstate Highway Act of 1956. Commute times are increasing
179
which not only adds to air quality woes but also contributes to loss of community and a
lower quality of life as people spend more and more time alone in their vehicles.
Framing the Results
Based on this research, I would have to conclude that the pattern of development
in the Austin/San Antonio paradigmatic region raises doubts as to its long-term
regenerative capabilities. Growth trends do not seem sustainable. Peet’s (1998) “urban
condition” is becoming virtually ubiquitous in the region. In the literature review, I
pointed out that there are underlying, continuous patterns at work in American urban
geography, but the geographic scale has changed. Corridor growth patterns are evidence
of process continuity in the American urban landscape, but a change in scale. Residential
morphology has “gone from having the elite on one block and the poor on the next . . . to
distinct, unrelated regions for different types of people and different economic activities”
(Ford 1995, 560). In the Corridor Region, Interstate 35 serves as the dividing line
between “distinct regions.” The urbanized area has expanded, with “elites” moving
further into the Hill Country. The region’s morphology reflects the desire to spread out
and away from the central city. The results are an urban form that promises the kind of
living and working environments people purportedly want, but degrades the environment,
increases differentiation among communities, with lifestyle communities or communities
of interest taking the place of traditional, geographically-defined communities, or
communities of place (Newman 1980; Bellah et al. 1985).
One of the first urban models to address urban growth and change was the zonal
model that is rooted in the concept of urban ecology (Park, Burgess, and McKenzie 1925,
Kaplan, Wheeler, and Holloway 2004). Urban patterns emerge from the competition
180
among groups over the use of space – a competition that manifests itself today at the local
scale, but is based on economic rules set at the global scale (Soja 1989; Davis 1990; Scott
and Soja 1996). The model’s social distance creates spatial distance; e.g. higher income
tracts and predominantly non-Hispanic white tracts move west into the Hill Country,
often into gated residential enclaves. In the model’s 1930s Chicago, invasion and
succession drove neighborhood change; in today’s urban field, invasion and succession
drive regional change. The process of transition continues but at a different scale and
with different dynamics. Transition occurs as residents, feeling uncomfortable living
with a “foreign group”, leave for the workingmen’s homes - the Corridor Region’s inner
suburbs; whose residents then leave for the residential zone - the region’s outer suburbs;
whose residents then leave for the commuters’ zone - the region’s exurban and rural
zones. This process results in land-use patterns determined not necessarily by urban
planning but by social and economic competition, or the pursuit of the highest and best
use of the land. Human ecologists do indeed question the degree of planning intervention
possible, or even advisable, given that urbanization is a product of forces in which the
growth process is “one of organization and disorganization or, of a tendency toward
equilibrium and counteracting disequilibrium” (Kligman 1945, 89). Comprehensive
planning may be trying to “stabilize inherently unstable states” and thus be fighting an
uphill battle (Alberti and Marzluff 2004, 249).
Overwhelming Forces: The Power of Growth
Why did the Austin Tomorrow Plan fail to achieve its sustainability goals, or at
least to direct growth away from areas less suitable for urban development? Was it
overwhelmed by the most intense growth pressures in the Corridor Region? With the
181
plan’s adoption, the Austin planning director had hoped that the extension of municipal
water and wastewater service would be limited to priority growth areas, economically
and ethnically segregated neighborhoods would tend to diminish, and the amount of
additional urban development in environmentally sensitive areas would diminish.
However, neither the City of Austin, Travis County, nor the Austin MSA appeared to
show a development pattern that is more compact, less sprawling, more equitable, more
energy efficient, and thus more sustainable than the City of San Antonio, Bexar County,
or the San Antonio extended MSA. An Austin city planner was dismayed to see that in
the 1980s growth actually accelerated on the fringe, in the higher amenity western edge
of the city farthest from black and Hispanic minority neighborhoods and closest to the
region’s prime scenic and recreational resources. Plan policies were not reflected in
growth outcomes in spite of the fact that Austin seemingly made every effort towards
comprehensive planning (Butler 1987).
The value of a comprehensive plan is derived from the process of preparing the
plan and the use of the plan after its preparation (Hollander et al. 1988). The Austin
comprehensive planning process was citizen-based, however the business community
saw the plan as stifling and no-growth - which threatened its use. Developers felt that it
was too restrictive (especially the preferred growth corridor) and should not be
implemented, or, at a minimum, it should not be followed strictly (Polnau 1986). In other
words it should not be used. Soon after the plan was adopted the Council approved a
Motorola plant at a location that was contrary to the plan’s policies. When the Barton
Creek Mall was developed in the Edwards recharge zone, the tops of hills were scalped

182
and two-to-one slopes put in that destroyed many of the natural scenic features (Wetzel
1981).
One of the keys to implementing the Austin Tomorrow Plan was obtaining bond
funding for the provision of infrastructure in the preferred growth area. Unlike the
successful bond issuance in 1928, municipal bonds to provide the aforesaid infrastructure
were rejected by the voters or watered-down by the Council. At the same time as the
bond election failure, developers discovered how useful Municipal Utility Districts
(MUDs) were at avoiding the city’s supposed control over the provision of infrastructure,
especially water (Watson 1990). As it turned out, the Lower Colorado River Authority
(LCRA) and Municipal Utility Districts had a stronger influence than the city on shaping
the area’s development trends. Developers were able to establish MUDs and purchase
water directly from the LCRA, and thus the city’s most essential growth management
tool was lost. MUDs, established in 1971 by the Municipal Water District Act, had
attractive financing opportunities. The developer could include soft costs in the bond
issue and then pass them on to homebuyers in the form of district taxes or utility
surcharges. Unlike MUD financing, Austin’s city charter required voter approval of bond
issues. MUDs did not need public input or approval (Butler and Myers 1984).
In San Antonio there was no need for MUDs. The San Antonio planning director
pointed out that the City’s policy should lean toward not granting consent for MUDs as
their proliferation would undermine an important growth management tool. But MUDs
never had the impact in San Antonio as in Austin because the City usually provided the
infrastructure anywhere the developers decided to develop, anyway. Recall the 1965
Development Plan of San Antonio brochure statement that:
183
With practically unlimited land available for expansion and the progressive attitude of public officials with respect to providing transportation facilities and utilities, developers have found it feasible and profitable to cater to the great demand for suburban living (City of San Antonio 1965).
By design, San Antonio really did not have a plan that could fail. The city seemed to
embrace the abstract spatial perceptions of urban pro-growth coalitions. Radical planners
and conflict theorists would view planning in San Antonio as working to “facilitate
economic activity and growth” (Levy 2004, 343); or as a form of Mandarinism playing
“handmaiden to conservative politics” (Kravitz 1970).
Politics contributed to both the Austin and San Antonio plans’ lack of use. City
leadership alternated between “sensible” growth proponents and “pro-growth” economic-
development interests, or urban growth coalitions, more so in Austin than in San
Antonio. With inconsistent political support no comprehensive plan can be consistently
implemented. Continuity is impossible. Also, in areas like the Austin/San Antonio
corridor, development spills over myriad jurisdictional boundaries. Fractured
government entities are not able to deal with problems that are regional in scale. Finally,
the vested rights law exacerbated the problem by allowing developers in many cases to
get around the “medley of regulations” passed in the early 1980s. As it turned out, urban
planning in both San Antonio and Austin was lodged within the existing structures of
government, and constrained by the prevailing alignment of political and economic
forces, and therefore ineffective.
Discussion of Results
Urban morphologists see the city as an accumulation and integration of many
individual and special interest group decisions, shaped by social and economic forces
184
over time. Logan and Molotch (1987) employed political economy theory to determine
that these decision-makers are urban growth coalitions that pressure city governments to
create a “good business climate.” These coalitions always seek to boost population
growth, increase the market value of land, and stimulate the city’s economy through
investment and development (Macionis and Parrillo 2004). Given this growth-for-
growth’s sake perspective, the paradigmatic American urban growth pattern yields
dramatic benefits for capital while the urban, regional, and global commons are being
degraded, even with the best efforts at comprehensive planning. Many different theorists
give credence to the growth-for-growth’s sake and/or growth machine idea.
Postmodernists proclaim that real estate developers and manufacturers of culture drive
the new urban frontier. Risa Palm (1981) intimated that urban form is a direct result of
the economic goals of builders, speculators, investors, and chambers of commerce.
Kevin Lynch (1981, 181) felt that decisive elements of urban transformation may indeed
be political leaders, major investors, the technicians of transport, and the “decision elite.”
The global economy influences urban change because local political action is less
effective at influencing decisions made in distant corporate headquarters. Local people
have less power to oppose the corporate agenda, just as corporations have more power to
get their way. These forces overwhelm the comprehensive plan, at least in Texas and
other states that revere private property rights and embrace the growth paradigm. In this
political environment, the focus of decision-makers all too often only extends to
Lefebvre’s abstract space issues involving the high profits that accompany real estate
development. Battles between pro- and anti-growth factions continue in the region.
Several recent conflicts were sparked by the original big-box retail giant Wal-Mart:
185
• In 2003 Wal-Mart dropped plans to build a Supercenter in Austin over the recharge zone after a “maelstrom” of opposition. A Wal-Mart spokeswoman stated that “Wal-Mart has never backed off a site solely because of community opposition,” but that environmental concerns and talks between senior company executives and the Austin mayor were the deciding factors (Scheibal 2003).
• Also in 2003, citizens of Lakeway (in Travis County) threatened a recall election
if the City Council approved a proposed development featuring a Wal-Mart Supercenter. The developer, Larry Stauffer, said the project would be built with pitched roofs and a limestone facade to blend into the Hill Country environs. "We're trying to do something nice and unique and provide some jobs and tax benefits that will allow (the city) to do some other things," Stauffer said. But many residents felt there was nothing unique about a big-box retail development and the attendant traffic and noise. "It's going to change the very nature of our community," said Bill Schweitzer, one of the organizers of the community opposition group, Lakeway First. "The fact is, we don't need it” (Alexander 2003).
• In 2004 Wal-Mart attempted to locate a store in Helotes, a small community (in
2000 the voting age population was 3,285) northwest of San Antonio. Over 1,000 city residents and 3,000 residents from the surrounding area signed a petition asking the Council to oppose the store out of concern over “how the idyllic Hill County land would be affected” (San Antonio Express News 2005). As of this writing the store has not been built.
Others confrontations include:
• In 2006, after environmental advocates and toll road critics halted construction of toll lanes on U.S. Highway 281 north of San Antonio, the Texas Department of Transportation (TxDOT) officials said they would “build toll roads in San Antonio whether local leaders want them or not” (Driscoll 2006).
• In 2004 the Dripping Springs City Council passed a moratorium on new
development as their ordinances had been criticized by environmental and neighborhood groups for their huge loopholes. Dripping Springs is a rapidly growing town in northwestern Hays County within commuting distance to Austin. But the moratorium proved ineffective because of the vested rights statute – any project with a completed application before the moratorium continued to receive review. One pro-growth advocate said the “moratorium could harm economic development in the area.” In an effort to legitimize their opposition, the town began working on an interim comprehensive plan (Price 2004).
At the heart of all these battles is a focus on the profit-bias, or the most profitable use of
land. Because profit-seeking and competition are inherent and incessant, this process of
change is never-ending (Hall 1984). Profit-making and capitalism may be the “natural
186
forces” of the urban ecologists. Illustrative of this perspective, Orum (1987, 308),
writing a history of the City of Austin, concluded that:
…beginning in the late 1970s and lasting through the mid-1980s, …[t]he rush to buy and to sell land…profoundly violated the sense of intimate community as well as the sense of public trust that had taken hold of Austin residents. Spurred on by the infusion of the huge amounts of cash into the Austin real estate market, the land boom made it evident that this physical setting is not public property, that the community is not a public trust, and that in the end, when all is said and done, private property always reigns victorious over the common good.
Ideally, comprehensive planning is the exercise of public policy upon myriad
decisions to shape urban growth into livable, memorable, and sustainable communities.
This does not seem to be the case in the Corridor Region. Mainstream
rational/comprehensive planning has arguably failed to contribute to a sustainable built
environment in the Austin area and elsewhere in America (Berke 2002). It seems
incapable of dealing with the big issues raised in the sustainability debate.
If comprehensive plans lack political clout and are not implemented, what can be
done to make them more effective at reducing sprawl and building sustainable
environments? What is needed: regional planning agencies, local governments willing to
make decisions based on long-range planning, or more power given to urban planners?
Can planning help achieve sustainable development, or have planners lost their way? It
has been a long time since Daniel Burnham urged that we “make no small plans” and
planners laid claim to the “high ground of ideal visions and big plans” (Levy 1992; Hoch
1994; Neuman 1998). The intellectual and moral basis for planning was originally a
positive notion of how to shape society towards some broadly agreed on social ends, but
lately has degenerated into technique – how to enforce the minutia of endless ordinances.
During the times I was a planning director, whenever a land use question arose, I was

187
asked by the mayor or council to study the wording of the zoning, subdivision or relevant
ordinance to clarify what the city could and could not do, mostly on such picayune items
as whether the side setback was five or six feet or how high a privacy fence should be.
Rarely was I asked or expected to refer to the comprehensive plan for a policy
perspective. In some locales, planners seem to have evolved into “mere pragmatists,
perhaps through no fault of their own, either no longer interested in ‘big ideas’ or
convinced that the big idea is that there should be no such idea” (Breheny 1996, 20). Or,
as in San Antonio in the 1970s, planners may have had the ideas, but not the wherewithal
to see them come to fruition. Perhaps it is time to emphasize place-making rather than
place-regulating (Stea and Turan 1993).
“New” Approaches/Ideas
The literature has long offered different directions for planning that would
provide opportunities for a revival of the idea that implemented plans can result in
memorable and sustainable places. A predominant theme is sustainable development
which emphasizes a “multigenerational vision of community building,” and a “more
holistic and integrated vision of community building” (Berke 2002, 21). Sustainable
development can extend new-urbanist principles to embrace urban ecology, place-based
economies, and social equity, as well as broader global and regional concerns. Similar
approaches include Hersperger’s (1994) landscape ecology, and planning for sustainable
landscapes - “residential environments [that] reflect a philosophy of sustainable
development that values landscapes and protects their functions while supporting healthy
communities for residents” (Grant, Manuel, and Joudrey 1996, 331). Along this line of
thinking, Kimmel (1992, 180) proffers the concept of ecological adaptation in which
188
planning techniques are flexible and redefined over time, and allow “environmental
management decisions to be made with sensitivity to the range of both biophysical and
cultural issues.” Add to the mix Van der Ryn’s (1996) ecological design, Lyle’s (1999)
regenerative design, and Rosenzweig’s (2003) reconciliation ecology, all concepts that
call for patterns and forms of urbanization that minimize the need for energy input and
maintain ecosystem functions in tact as much as possible. Finally, Wackernagel (1994)
lists five areas where cities can plan to reduce their ecological footprint: integrated city
planning to reduce energy and land use requirements, increased use of green areas,
integrated open space planning, protecting the integrity of local ecosystems, and
economic development that has zero impact on ecosystems.
Indeed, there is no shortage of ideas and the interest in ecological planning
continues to grow. Frederick Steiner (2002, 2000a) encapsulates these ideas in his “new”
urban ecology, or urban human ecology. For any landscape there exists an optimal
spatial arrangement of ecosystems and land uses to maximize ecological integrity and
achieve human needs. The question then arises as to just what is the optimum
arrangement of residential land uses (the human habitat) in an (urban) landscape. This
arrangement is not based on specific, pre-determined forms or “ideal” communities such
as Howard’s Garden City, Wright’s Broadacres, Corbusier’s Radiant City, or Duany’s
neo-traditional town, but rather more in terms of systems, connections, nodes, and
landscapes. After all, there are multiple possibilities for how and where to live, and these
possibilities change with time. Indeed, spatial solutions to sprawl exist now and have for
quite a while as the mosaics, linkages, and patches of landscape ecology. The ideal
pattern of a development should be determined by what is already there. The challenge is
189
to discover the arrangement. After all, developing a piece of land is really designing an
ecosystem.
Ecological planning enables planners and policy-makers to analyze urban growth
and change as they relate to the local and regional landscapes, and to national and global
political and economic structure. Ecological planning can suggest opportunities and
constraints for the use of the landscape. It is the use of biophysical and sociocultural
information to reveal where specific land uses may best be practiced and is fundamental
for sustainable development. This approach can enable decision-makers to take into
account the unpredictability that is inherent in chaotic systems, or the “organized
complexity” that a changing city is (Jacobs 1961). But isn’t that [ecological planning]
exactly what the citizens of Austin did with the Austin Tomorrow Plan?
Reality Check – The Root of the Problem
How can ecological planning be translated into sustainable urban growth in an
abstract world of isotrophic flat plains inhabited by Homo economicus? Such a world
eliminates all variables other than economic ones and all motivations other than selfish
ones. Nature is taken for granted. Given this world view, rational-comprehensive
planning may never work. Many have proposed sustainability and/or ecology as under-
girding philosophies for a new planning ethic. But planning in the face of power without
power may not work regardless of new ideas and paradigms - unless a new property
regime is developed. Property is a reflection of the values, beliefs and knowledge of a
culture. That is why it is so often the battleground in the struggle between spatial
perspectives. Current land-use laws and regulations disregard the basic cultural and
environmental facets of the very resource they govern. The law does not reflect the
190
principles of biology, ecology, and other natural sciences to anywhere near the extent that
it reflects the economics of “highest and best use.” The Texas vested rights law is an
example of this kind of legislation that favors an individual’s property rights over
communal and environmental interests. The statute, passed at the behest of pro-growth
developers disgruntled with Austin’s watershed ordinances, negated a community’s
efforts at growth management and sustainable development.
The march of auto-dependent, low-density development, loss of natural
landscape, and increasing consumption and waste all indicate the need for a wake-up call.
The right ideas have been around for a long time, but rarely implemented. Over one-
hundred and forty years ago George Perkins Marsh (1864) pointed out that to avoid the
Earth’s destruction mankind must pay attention to the laws of nature. The Austin
Tomorrow Plan did pay attention to those laws of nature. But it was never implemented
because of the laws of man. Perhaps it is time to step back, take a look at the prevailing
property rights regime, and either figure out ways to make it work, or change it. A new
property regime could elevate the status of ecological and cultural communities, and thus
protect and sustain environmental habitats and community life.
In the paradigmatic regions of America, growth is driven by the predominance of
the commodified space paradigm and competition over land use. There seems to be no
coordination, no authority, and no public responsibility. No one seems responsible for
the way the landscape turns out. Sustainable development and ecological planning may
be seen as a fundamental challenge to a market-led economy, but the concept of
sustainable development should be much more than “fashionable language.” Indeed,
sustainable development will not only require an ecological filtering of proposed land
191
uses, but also an alteration of human behavior patterns not just in relation to the
environment, but also in relation to the “broader systems which shape human behavior”
(Haughton 1999). Only then can it work.
Conclusion
In this dissertation I have emphasized societal activities that affect nature.
Focusing on societal activities reveals trends which can provide indices of existing
unsustainable patterns. This approach is not new - it first appeared almost forty years ago
with Ehrlich’s (1968) efforts to quantify the environmental impacts of human activities.
The shorthand expression I = ∫(P,A,T) was used to operationalize the relationship
between environmental impact (I) and its principal determinants: population (P),
affluence (A), and technology (T). Various analysts have used this expression to assess
the global-level impacts of changes in these three factors (Ehrlich 1968; Commoner
1971; Ehrlich and Ehrlich 1991; Harrison 1992). Similarly, the well-known modeling
exercises of the Club of Rome (Meadows et al. 1972) and Forrester’s (1969) world
dynamic models have focused on the interactions between population, production,
pollution, and resources. Environmental impact is land use impact. The PAT expression
offers a guide for exploring the land use implications of changes in population, affluence,
technology and, consequently, resource use.
Why has this approach not been worked into our legal framework? Cities have an
assortment of “impact fees” for traffic, stormwater, sewerage, etc. Why not have a global
or regional impact fee? Techniques used to determine an area’s ecological footprint can
be adapted for this purpose. The fee could help developers broaden their “sketchy mental
maps” and encourage the wider, ecological perspective. Assuredly, there would be
192
resistance to such an idea, but there has always been aversion to change, even when it
was desperately needed. Urban researchers who urge that sustainability be built into land
use law are echoing the sentiments of the social reformers of the late nineteenth century,
but with an awareness that technology will always fall short of a permanent fix for
human-induced problems. The urban reform legislation introduced to relieve the
intolerable living conditions in 1880s New York City tenements were vehemently
resisted by property owners and businessmen who predicted such laws would strangle
enterprise in red tape. What needs to change has long been identified, but taking the hard
steps toward a truly sustainable future has been overwhelmed by incessant growth fueled
by legalized selfishness.
The global/regional impact fee and the questions I have raised in the last chapter
of this dissertation are topics for further research. Ecological planning provides a
synthesis that values both the necessities of rule-making and place-making. Geographers
are positioned to bridge the gap between rule-makers and place-makers and thus to help
induce change. Geographic education can facilitate a value shift toward a property
regime that reflects the complexity and interconnectedness of the natural world and
modern urban systems. Petr Kropotkin saw geography as a powerful tool for
understanding man’s integration with nature. Aldo Leopold (1949) suggests the answer is
a moral one in which there is a restructuring of values which include personal
responsibility and recognition of the aspects of the natural world which have economic
value as well as those that have not been or can not be assigned an economic value. And
geographers, steeped in the “man-land” tradition, are perfectly placed to carry on much of
the education and research on the interaction of the human and natural environments.
193
Platt (2004b) has already linked physical, socio-economic, and legal phenomena in a
model that helps his readers understand the urban scene as a dynamic process where law
affects society, which affects the environment, which affects the law, and so on.
Geographers such as VonHumboldt and Sauer looked at places not just from a
reductionist perspective, but rather from a perspective that assembled the parts into a
whole that enabled them to see “what was there.” The thread that runs through
geographic thinking is the ability to see more than what may be obvious to the
professional steeped in Relph’s technique, or academics with paradigmatic blinders on.
The geographic perspective enables the kind of understanding that is needed to address
the problems of how we build our habitats. Almost two decades ago, Robert Kates
(1987) urged geographers to use their skills, knowledge, and values to take the lead in
facing the three great, enduring scientific challenges of the human environment: the
Malthusian dilemma of population and resources, the human transformation of the Earth,
and sustainable development of the biosphere. At the time, that leadership role was “the
road not taken, the road still beckoning.” Today, the three great questions persist, and the
road still beckons.

194
APPENDIX
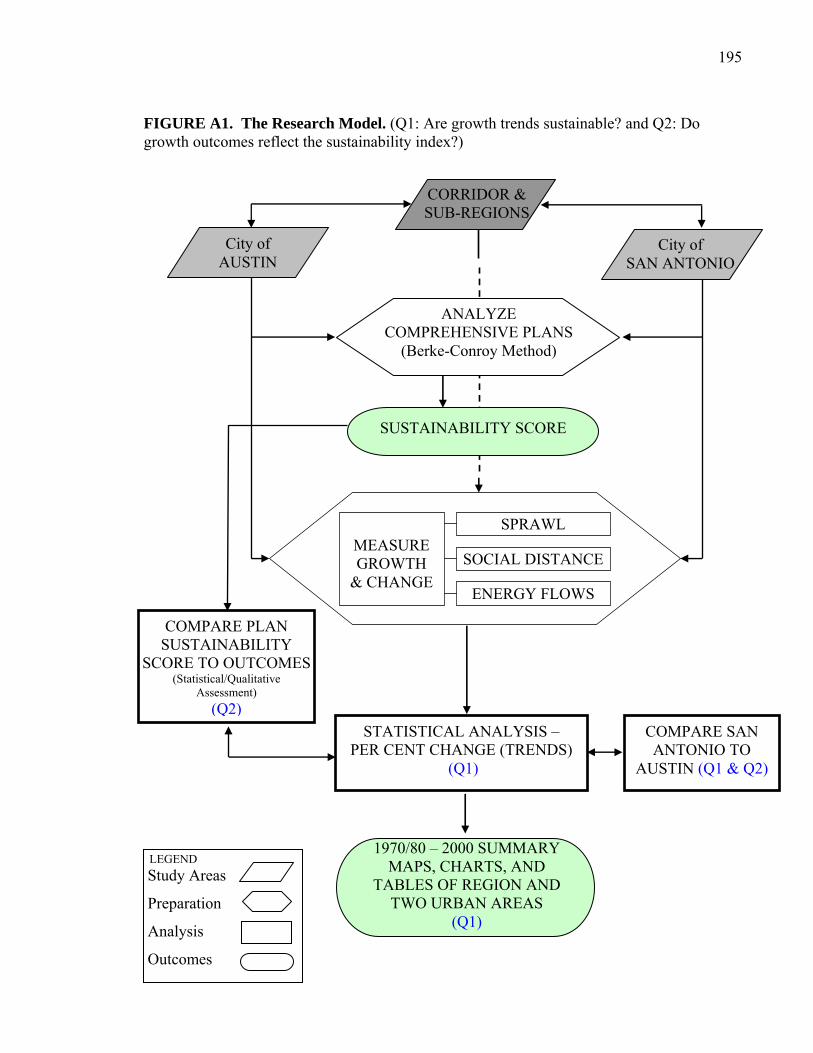
195
FIGURE A1. The Research Model. (Q1: Are growth trends sustainable? and Q2: Do growth outcomes reflect the sustainability index?)
COMPARE PLAN SUSTAINABILITY
SCORE TO OUTCOMES (Statistical/Qualitative
Assessment) (Q2)
1970/80 – 2000 SUMMARY MAPS, CHARTS, AND
TABLES OF REGION AND TWO URBAN AREAS
(Q1)
COMPARE SAN ANTONIO TO
AUSTIN (Q1 & Q2)
City of AUSTIN
City of SAN ANTONIO
STATISTICAL ANALYSIS – PER CENT CHANGE (TRENDS)
(Q1)
SUSTAINABILITY SCORE
SPRAWL MEASURE GROWTH
& CHANGE SOCIAL DISTANCE
ENERGY FLOWS
Study Areas
Preparation
Outcomes
Analysis
CORRIDOR & SUB-REGIONS
LEGEND
ANALYZE COMPREHENSIVE PLANS
(Berke-Conroy Method)
196
REFERENCES Abbott, Patrick, and C. M. Woodruff, Jr., eds. 1986. The Balcones Escarpment, geology,
hydrology, ecology and social development in Central Texas. San Antonio: Geological Society (Annual Meeting, 1986).
Alberti, Marina. 1999. Urban patterns and environmental performance: What do we
know? Journal of Planning Education and Research 19, no. 2: 151-63. Alberti, Marina, and John M. Marzluff. 2004. Ecological resilience in urban ecosystems:
Linking urban patterns to human and ecological functions. Urban Ecosystems 7: 241-65.
Alexander, Kate. 2003. Proposed Wal-Mart in Lakeway has residents threatening recall.
Austin American Statesman, 14 September 2003, B1. Alinsky, Saul. 1971. Rules for radicals: A practical primer for realistic radicals. New
York: Vintage Books. Allen, Elizabeth. 2006. Lengthy PGA battle ends as county OKs resort deal, San Antonio
Express News, 13 January 2006, 3B. American Planning Association – Texas Chapter. 1977 – 1994. The history of planning in
Texas project records, the Alexander Architectural Archive, the General Libraries, the Univeristy of Texas at Austin.
Anderson, James R., Ernest E. Hardy, John T. Roach, and Richard E. Witmer. 1976. A
land use and land cover classification system for use with remote sensor data. Geological Survey Professional Paper 964, Washington, D. C.: United States Government Printing Office.
Ashcroft, Bob. 1985. In American Planning Association – Texas Chapter. 1977 – 1994.
The history of planning in Texas project records, Box 13, the Alexander Architectural Archive, the General Libraries, the Univeristy of Texas at Austin.
Audirac, Ivonne, Anne H. Shermyen, and Marc T. Smith. 1990. Ideal urban form and
visions of the good life. Journal of the American Planning Association 56, no. 4: 370-83.
Azar, Christian, John Homberg, and Kristin Lindgren. 1996. Socio-ecological indicators
for sustainability. Ecological Economics 18: 89-112.
197
Barnett, H. J. 1974. Economic growth and environmental quality are compatible. Policy
Science 5: 137-7. Beatly, Timothy, and Kristi Manning. 1998. The ecology of place: Planning for
environment, economy and community. Washington, D.C.: Island Press. Bellah, Robert N., Richard Madsen, William M. Sullivan, Ann Swidler, and Steven M.
Tipton. 1985. Habits of the heart: Individualism and commitment in American life. Berkeley, Los Angeles, London: University of California Press.
Berke, Philip. 2002. Does sustainable development offer a new direction for planning?
Challenges for the twenty-first century. Journal of Planning Literature 17, no. 1: 22-36.
Berke, Philip, and Jack Cortez. 1995. Sustainable development as a guide to community
land use. Working Paper No. S95-03. Chapel Hill: University of North Carolina, Center for Urban and Regional Studies.
Berke, Philip, and Maria Manta Conroy. 2000. Are we planning for sustainable
development? An evaluation of 30 comprehensive plans. Journal of the American Planning Association 66, no. 1: 21-33.
Berry, Brian J. and John D. Kasarda. 1977. Contemporary urban ecology. New York:
Macmillan. Blackwood, Larry G., and Edwin H. Carpenter. 1978. The importance of anti-urbanism in
determining residential preferences and migration patterns. Rural Sociology 43, no. 1: 31-47.
Blake, Peter. 1979. God’s own junkyard: The planned deterioration of America’s
landscape. New York: Holt, Rinehart and Winston. Blassingame, Lurton. 1998. Sustainable cities: oxymoron, utopia or inevitability? The
Social Science Journal 35, no. 1: 1-13. Blunt, John, Brett Walker, and Christopher Frye. 2001. Austin, Texas planning project.
University of Texas at Austin. Community and Regional Planning; available from http://mather.ar.utexas.edu/courses/parmenter/GIS/spring; Internet; accessed 13 May 2006.
Bogardus, Emory S. 1925. The concept of social distance. Journal of Applied Sociology,
later Sociology and Social Research 9: 299-308.
198
Borchert, John R. 1978. American metropolitan evolution. In Systems of cities, readings on structure, growth, and policy. eds. Larry. S. Bourne and J. W. Simmons. New York: Oxford University Press.
Boulding, Kenneth E. 1966. The economies of the coming spaceship earth. In
Environmental quality in a growing economy: essays from the sixth RFF forum. ed. Henry Jarrett. Baltimore: Johns Hopkins University Press.
________. 1968. Beyond economics: essays on society, religion and ethics. Ann Arbor:
University of Michigan Press. Bourne, Larry S. 1996. Reurbanization, uneven urban development, and the debate on
new urban forms. Urban Geography 17, no. 8: 690-713. Breheny, Michael. 1996. Centrists, decentrists, and compromisers: Views of the future of
urban form. In The compact city: A sustainable urban form? eds. Mike Jenks, Elizabeth Burton, and Katie Williams, 13-35. London: E & FN Spon.
Bunch, Bill, and Colin Clark. 2005. AMD does not belong on a fragile watershed. Austin-
American Statesman, 21 December 2005, A16. Bunge, William. 1975. Detroit, humanly viewed: the American urban present. In Human
geography in a shrinking world, ed. Ronald Abler, 149-81. North Scituate, MA: Duxbury Press.
Burchell, Robert W., George Lowenstein, William Dolphin, Catherine Galley, Anthony
Downs, Samuel Seskin, Katherine Still, and Terry Moore. 2002. Cost of Sprawl – 2000; TCRP Report 74. Transit Coopertive Research Program, Washington, D.C.: National Academy Press.
Butler, Evelyn. 1987. In American Planning Association – Texas Chapter. 1977 – 1994.
The history of planning in Texas project records, Box 13, the Alexander Architectural Archive, the General Libraries, the Univeristy of Texas at Austin.
Butler, Kent. 1987. Urban growth management and groundwater protection: Austin,
Texas. In Planning for Groundwater Protection, ed. G. William Page, 261-87. Orlando: Academic Press Inc.
Butler, Kent, and Dowell Myers. 1984. Boomtime in Austin, Texas. Journal of the
American Planning Association 50, no. 4:447-58. Button, Kenneth. 2002. City management and urban environmental indicators. Ecological
Economics 40: 217-33.
199
Byan, Pillsung, and Adrian Esparza. 2005. A revisionist model of suburbanization and sprawl: the role of political fragmentation, growth control, and spillovers. Journal of Planning Education Research 24: 252-64.
Campbell, Scott. 1996. Green cities, growing cities, just cities, urban planning and the
contradictions of sustainable development. Journal of the American Planning Association 62, no. 3: 296-312.
Calthorpe, Peter. 1993. The next American metropolis, ecology, community, and the
American dream. New York: Princeton Architectural Press. Capello, Roberta, and Peter Nijkamp. 2002. In search of sustainable human settlements –
prefatory remarks. Ecological Economics 40: 151-55. Castells, Manuel. 2000. Urban sustainability in the information age. City: Analysis of
Trends, Culture, Theory, Policy, Action 4, no. 1: 118-22. ________. 1977. The information age: economy, society, and culture, vol. 1: The rise of
the network society, and vol. 2: The power of identity. Cambridge: Blackwell. Chapin, Jr., F. Stuart. 1965. Urban land use planning. Urbana: University of Illinois
Press. City of Austin. 1975. Austin tomorrow goals: community needs and priorities. Austin:
City of Austin Planning Department. ________. 1980. Austin tomorrow comprehensive plan. Austin: City of Austin Planning
Department. City of San Antonio. 1965. Development plan of the city of San Antonio. San Antonio:
City Planning Department. ________. 1972a. Development of the central business district. San Antonio: City
Planning Department, Community Renewal Program. ________. 1972b. Urban design mechanisms study for San Antonio. San Antonio: City
Planning Department, Community Renewal Program. ________. 1973. Population and employment distribution 1970 – 1990, based on a
continuation of present trends. San Antonio: Community Development Office, Comprehensive Planning Division.
________. 1975. Alternative growth study – SAMP 75 - San Antonio master plan. San
Antonio: Planning and Community Development Department.
200
________. 1976a. A report on growth policy issues – Growth sketches for San Antonio. City of San Antonio: Community Planning Division, Planning and Community Development Department.
________. 1976b. The preferred growth sketch. San Antonio: Department of Planning. ________. 1977. The San Antonio growth sketch. San Antonio: Department of Planning. ________. 1980. San Antonio master plan. San Antonio: Department of Planning. ________. 1983. San Antonio land use plan. San Antonio: Department of Planning. Clark, John G. 1995. Economic development vs. sustainable societies: reflections on the
players. Annual Review of Ecology and Sytematics 26: 225-48. Cohen, Joel E. 1995. How many people can the earth support? New York: W. W. Norton
and Company. Colby, Michael. 1991. Environmental management in development: the evolution of
paradigms. Ecological Economics 3, no. 3: 193-213. Collier, Bill. 1992. Developers, SOS ready for battles in the courts. Austin American
Statesman, 15 March 1992, B1. Collins, James P., Ann Kinzing, Nancy Grimm, William Fagin, Diane Hope, Jianguo Wu,
and Elizabeth Borer. 2000. A new urban ecology. American Scientist 88, no. 5: 416-26.
Commoner, Barry. 1971. The closing circle: nature, man, and technology. New York:
Bantam Books. Conzen, M. R. G. 1949. The Scandinavian approach to urban geography. Norst
Geografisk Tidskrift 12, no. 2: 86-91. ________. 1960. Alnwick, Northumberland: A study in town-plan analysis. Institute of
British Geographers Publication No. 27, London: George Philip. Coppack, Philip M. 1988. Reflections on the role of amenity in the evolution of the urban
field. Geografiska Annaler 70 B, no. 3: 353-61. Costanza, Robert. 1996. Ecological economics: Reintegrating the study of humans and
nature. Ecological Applications 6, no. 4: 978-90. Crang, Mike. 2000. City: analysis of trends, culture, theory, policy, action 4, no. 3: 303-
15.
201
Daly, Herman. 1974. The economics of the steady state. American Economics Review May: 15-21.
________. 1990. Toward some operational principles of sustainable development.
Ecological Economics 2, no. 1: 1-6. ________. 1992. Allocation, distribution, and scale: towards an economics that is
efficient, just, and sustainable. Ecological Economics 6, no. 3: 185-93. Davidoff, Paul. 1965. Advocacy and pluralism in planning. Journal of the American
Planning Association 31, no. 4: 331-8. Davis, Judy S., Arthur C. Nelson, and Kenneth J. Dueker. 1994. The exurbs and their
implications for planning policy. Journal of the American Association of Planners 60, no. 1: 45-59.
Davis, Mike. 1990. City of quartz: Excavating the future in Los Angeles. London: Verso. Dear, Michael, and Steven Flusty. 1998. Postmodern urbanism. Annals of the Association
of American Geographers 88, no. 1: 50-72. Downs, Anthony. 1999. Some realities about sprawl and urban decline. Housing Policy
Debate 4, no. 4: 955-974. Doxiadis, Constantinos A. 1965. The final stage in the hierarchy of living spaces. Ekistics
19: 210. Driscoll, Patrick. 2006. 281 toll road hits snag. San Antonio Express News, 13 January
2006, A1. Duany, Andres, Elizabeth Plater-Zyberck, Alex Kriger, and William Lennertz. 1991.
Towns and town-making principles. New York: Rizzoli International Publications. Dubbink, David. 1984. I’ll have my town medium-rural please. Journal of the American
Planning Association 50, no. 4: 402-18. Duchin, Faye, and Gary M. Lange. 1994. The future of the environment: ecological
economics and technological change. Oxford: Oxford University Press. Ehrlich, Paul. 1968. The population bomb. New York: Ballantine Books. ________. 1989. The limits to substitutability: meta-resource depletion and a new
economic-ecological paradigm. Ecological Economics 1: 9-16. Ehrlich, Paul, and Anne Ehrlich. 1991. Healing the planet. Boston: Addison-Wesley.
202
El Nasser, Haya, and Paul Overberg. 2001. A comprehensive look at sprawl in America. USA Today, 22 February 2001; available from http://www.usatoday.com/news/sprawl; Internet; accessed 12 August 2005.
Esparza, Adrian, and John Carruthers. 2000. Land use planning and exurbanization in the
rural mountain west: Evidence from Arizona. Journal of Planning Education and Research 20, no. 1: 23-36.
Espey, W. H. K., C. W. Morgan, and F. D. Masch. 1966. Study of some effects of
urbanization on storm water runoff from a small watershed: Austin, Texas. Austin: Texas Water Development Board Report 23.
Etzioni, Amitai. 1994. The spirit of community: the reinvention of American society. New
York: Simon and Schuster. Ewing, Reid. 1997. Is Los Angeles-style sprawl desirable? Journal of the American
Planning Association 63, no. 1: 107-26. Ewing, Reid, Rolf Pendall, and Don Chen. 2002. Measuring sprawl and its impacts.
Washington, D.C.: Smart Growth America; available from www.smartgrowthamerica.org; Internet; accessed 18 May 2005.
Fishman, Robert. 1987. Bourgeois utopias: the rise and fall of suburbia. New York:
Basic Books, Inc. Florida, Richard L. 2002. The rise of the creative class: and how it is transforming work,
leisure, community and everyday life. New York: Basic Books. Folke, Carl, AnnMari Jansson, Asa Larsson, and Robert Costanza. 1997. Ecosystem
appropriation by cities. Ambio 26, no. 3: 167-72. Foot, John. 2000. The urban periphery, myth and reality. Milan, 1950-1990. City:
analysis of trends, culture, theory, policy, action 4, no. 1: 7-26. Ford, Larry R. 1995. Continuity and change in the American city. Geographical Review
85, no. 4: 552-568. Forman, Richard T. T. 1995. Land mosaics: The ecology of landscapes and regions.
Cambridge, New York: Cambridge University Press. Forrester, Jay W. 1969. Urban dynamics. Cambridge, Mass.: MIT Press. Friedmann, John, and John Miller. 1965. The urban field. Journal of the American
Institute of Certified Planners 30: 312-20. Fromm, Erich. 1955. The sane society. New York: Rinehart.
203
Galster, George, Royce Hanson, Michael Ratcliffe, Harold Wolman, Stephen Coleman,
and Jason Freihage. 2001. Wrestling sprawl to the ground, defining and measuring an elusive concept. Housing Policy Debate 12, no. 4: 681-717.
Garreau, Joel. 1991. Edge city: Life on the new frontier. New York: Doubleday. Geddes, Patrick. 1911. The civic survey of Edinburgh. Edinburgh: Outlook Tower;
Chelsea: Crosby Hall. Gober, Patricia. 2005. Presentation at Texas State University–San Marcos, Department of
Geography, 14 May 2005. Godschalk, David R., David W. Parham, Douglas R. Porter, William R. Potapchuk, and
Steven Schukraft. 1994. Pulling together: A planning and development consensus-building manual. Washington, D.C.: Urban Land Institute in cooperation with the Program for Community Problem Solving.
Goodman, Robert. 1971. After the planners. New York: Simon and Schuster. Goodland, Robert, and Herman Daly. 1996. Environmental sustainability: universal and
non-negotiable. Ecological Applications 6, no. 4: 1002-17. Gordon, Peter, and Harry Richardson. 1997. Are compact cities a desirable planning
goal? Journal of the American Planning Association 63, no. 1: 89-106. ________. 2000. Defending suburban sprawl. Public Interest 139: 65-71. Gottman, Jean. 1961. Megalopolis. New York: The Twentieth Century Fund Inc. Grant, Jill, Patricia Manuel, and Darrell Joudrey. 1996. A framework for planning
sustainable residential landscapes. Journal of the American Planning Association 62, no. 3: 331-44.
Guest, Avery M. 1975. Population suburbanization in American metropolitan areas,
1940-1970. Geographical Analysis VII, no. 3: 267-83. Hahn, Ekhart, and Udo Simonis. 1991. Ecological urban restructuring. Ekistics 348-9:
199-209. Hale, Travis. 2005. The theoretical basics of popular inequality measures. On-line
publication by the University of Texas Inequality Project; available from http://utip.gov.utexas.edu/tutorials.html; Internet; accessed 8 July 2006.
204
Hall, Peter. 1984. Geography. In Cities of the mind: Images and themes of the city in the social sciences, eds. Lloyd Rodwin and Robert Holister, 21-36. New York: Plenum.
Hamilton, William. 1913. A social survey of Austin. Bulletin of the University of Texas
No. 237, Austin, TX: The University of Texas. Handbook of Texas Online, s.v. Austin, Tx; available from
http://www.tsha.utexas.edu/handbook/online/articles/AA/hda3.html; Internet; accessed 6 July 2005.
________. Urbanization; available from
http://www.tsha.utexas.edu/handbook/online/articles/AA/hda3.html.html; Internet; accessed July 6, 2005.
Hanson, Mark E., and Harvey M. Jacobs. 1989. Private sewage system impacts in
Wisconsin: Implications for planning policy. Journal of the American Planning Association 55, 3: 169-80.
Hardin, Garrett. 1968. The tragedy of the commons. Science 162: 1243-48. ________. 1993. Living within limits: Ecology, economics, and population. Oxford:
Oxford University Press. Harris, Chauncy D., and Edward L. Ullman. 1945. The nature of cities. Annals of the
American Academy of Political and Social Sciences CCXLII: 7-17. ________. 1993. Living within limits: ecology, economics and population taboos. New
York: Oxford University Press. Harris, Richard, and Robert Lewis. 1998. Constructing a fault(y) zone: Misrepresentation
of American cities abd suburbs, 1900-1950. Annals of the Association of American Geographers 88, no. 4: 622-39.
Harrison, Paul. 1992. The third revolution: Environment, population, and a sustainable
world. London and New York: I. B. Tauris and Company. Hartshorn, Truman. A. 1992. Interpreting the city: An urban geography. New York: John
Wiley and Sons. Hartshorne, Richard. 1932. The twin city district: a unique form of urban landscape.
Geographical Review 22: 431-42.
Harvey, David. 1969. Explanation in geography. New York: St. Martin’s Press Inc. ________. 1973. Social justice and the city. Baltimore: Johns Hopkins University Press.
205
Haughton, Graham. 1999. Environmental justice and the sustainable city. Journal of
Planning Education and Research 18, no. 2: 233-43. Haworth, Lawrence. 1963. The good city. Bloomington, In.: Indiana University Press. Hayden, Dolores. 1984. Redesigning the American dream: The future of housing, work,
and family life. New York: Norton. Healy, Robert G., and John S. Rosenburg. 1979. Land use and the states. 2d ed.
Baltimore: Resources for the Future, John Hopkins University Press. Herbers, John. 1986. The new heartland, America’s flight beyond the suburbs and how it
is changing our lands. New York: Times Books. Hersperger, Anna. 1994. Landscape ecology and its potential application to planning.
Journal of Planning Literature 9, no. 1: 14-29. Hoch, Charles. 1994. What planners do. Chicago: Planners Press. Holdren, John, and Paul Ehrlich. 1974. Human population and the global environment.
American Scientist 62: 282-92. Hollander, Elizabeth L., Leslie S. Pollack, Jeffry D. Reckinger, and Frank Beal. 1988.
General development plans, in The practice of local government planning, second edition, eds. Frank S. So and Judith Getzels, 60-94. Washington, D.C.: International City Managers Association
Holmberg, John, Ulrika Lundqvist, Karl-Henrik Robert, and Mathis Wackernagel. 1999.
The ecological footprint from a systems perspective of sustainability. International Journal of Sustainable Development and World Ecology 6: 17-33.
Hotelling, H. 1931. The economics of exhaustible resources. Journal of Political
Economy 39: 137-75. Hoyt, Homer. 1939. The structure and growth of residential neighborhoods in American
cities. USGPO: Washington, D.C. Hudson, Barclay M. 1979. Comparison of current planning theories: counterparts and
contradictions. Journal of the American Planning Association 45, no. 4: 387-98. Humphrey, David. 1985. Austin: An illustrated history. Northridge, Calif.: Windsor
Publications.
206
Hutton, John. 2001. Elusive balance: landscape, architecture, and the social matrix. In Miller, Char, On the Border, an environmental history of San Antonio. Pittsburg, Pa.: University of Pittsburg Press, 222-238.
Illich, Ivan. 1973. Tools for conviviality. New York: Harper and Row. Jackson, Kenneth T. 1985. Crabgrass frontier: the suburbanization of America. New
York: Oxford University Press. Jacobs, Jane. 1961. The death and life of great American cities. New York: Random
House. James, P. E. 1931. Vicksburg: a study in urban geography. Geographical Review 21: 234-
243. Janson, Carl-Gunnar. 1980. Factorial social ecology: An attempt at summary and
evaluation. Annual review of Sociology 6: 433-56. Jesse, Laura. 2004. Fans of trees bark about city ordinance. They’re outraged at the
stripping of hill. San Antonio Express News, 12 November 2004, 1A. Johnson, Michael P. 2002. Environmental impacts of urban sprawl: a survey of the
literature and proposed research agenda. Environment and Planning A 33: 717-35. Johnston, R. J., D. Gregory, and D. M. Smith. 1994. The dictionary of human geography,
Third edition. Oxford: Blackwell. Jung, Hwa Yol, and Peter Jung. 1993. Francis Bacon’s philosophy of nature: A
postmodern critique. The Trumpeter 10, no. 3: 86-9. Kaiser, Edward J., David R. Godschalk, and F. Stuart Chapin, Jr. 1995. Urban land use
planning. Urbana, Ill.: University of Illinois Press. Kaplan, David H., James O. Wheeler, and Steven R. Holloway. 2004. Urban geography.
Hoboken, N.J.: John Wiley & Sons, Inc. Kates, Robert W. 1987. The human environment: The road not taken, the road still
beckoning. Annals of the Association of American Geographers 77, no. 4: 525-34. Katz, Alfred, and Eugene Bender. 1976. The strength in us. New York: New Viewpoints. Kent, T. J. 1964. The urban general plan. San Francisco: Chandler Publishing Company. Kimmel, James Ross. 1992. Ecological adaptation as a perspective for environmental
management. Ph.D. Dissertation: University of Texas at Austin.

207
Kligman, Miriam. 1945. Human ecology and the city planning movement. Social forces 24, no. 1: 89-95.
Knickerbocher, Tom. 1981. In American Planning Association – Texas Chapter. 1977 –
1994. The history of planning in Texas project records, Box 3, the Alexander Architectural Archive, the General Libraries, the Univeristy of Texas at Austin.
Knox 1991. The restless urban landscape: economic and sociocultural change and the
transformation of metropolitan Washington, D.C. Annals of the Association of American Geographers 81, no. 2:181-209.
Kravitz, Alan S. 1970. Mandarinism: planning as a handmaiden to conservative politics.
In Planning for politics: uneasy partnership, eds. T. L. Beyle and G. T. Lathrop. New York: Odyssey Press.
Krizek, Kevin J., and Joe Power. 1996. A planner’s guide to sustainable development.
Chicago: American Planning Association. Kropf, Karl S. 2001. Conceptions of change in the build environment. Urban
Morphology 5, no. 1: 29-42. Kropotkin, Petr. 1902 [1955]. Mutual aid: a factor of evolution. Boston: Extending
Horizons Books. Lamb, Richard. 1983. The extent and form of urban sprawl. Growth and Change 14, no.
1: 40-47. Lee, Linda. 1979. Factors affecting land use change at the urban-rural fringe. Growth and
Change 10, no. 4: 25-31. Lefebvre, Henry. 1970 [2003]. The urban revolution, translated by Robert Bonnono.
Minneapolis, Minn.: University of Minnesota Press. ________. 1991. The production of space. Oxford: Blackwell. Leopold, Aldo. 1949 [1968]. A Sand County almanac and sketches here and there.
London, New York: Oxford University Press. Lessinger, Jack. 1962. The case for scatteration: Some reflections on the national capital
region plan for the year 2000. Journal of the Institute of Planners 28, no. 3: 159-69.
Levy, John M. 1992. What has happened to planning? Journal of the American Planning
Association 58, no. 1: 81-4.
208
________. 2004. Contemporary urban planning. Sixth edition. Upper Saddle River, N.J.: Pearson Education Inc.
Lichfield, Nathaniel. 1970. Evaluation methodology of urban and regional plans: A
review. Regional Studies 4: 151-65. Lindblom, Charles E. 1959. The science of muddling through. Public Administration
Review 19: 79-88. Logan, John, and Harvey Molotch. 1987. Urban fortunes: The political economy of
place. Berkeley: University of California Press. Lyle, John T. 1999. Design for human ecosystems: Landscape, land use, and natural
resources. Washington, D.C.: Island Press. Lynch, Kevin. 1981. A theory of good city form. Cambridge, Mass.: The MIT Press. Lyon, Larry. 1987. The community in urban society. Chicago, Ill.: Dorsey Press. Macionis, John J., and Vincent N. Parrillo. 2004. Cities and urban life. 3d ed. Upper
Saddle River, N.J.: Peaerson/Prentice Hall. MacKaye, Benton. 1940. Regional planning and ecology. Ecological Monographs 10, no.
3: 349-53. MacNeill, Jim, John E. Cox, and Ian Jackson. 1991. Sustainable development – the urban
challenge. Ekistics 348: 195-98. Malpezzi, Stephen. 1999. A simple error correction model of house prices. Journal of
Housing Economics 8, no. 1: 27-62. Malthus, Thomas T. 1999 [1798]. An essay on the principle of population, ed. Geoffrey
Gilbert. New York: Oxford University press, Inc. Marcuse, Peter. 1997. The enclave, the citadel, and the ghetto: What has changed in the
post-Fordist U.S. city. Urban Affairs Review 33: 228-64. ________. 1976. Professional ethics and planning: Values in planning. Journal of the
American Institute of Planners 42, no. 3: 264. Marsh, George Perkins. 1864 [1998]. Man and nature; Or, Physical geography as
modified by human action, ed. David Lowenthal. Cambridge, Mass.: The Belknap Press of Harvard University Press.
Marsh, Margaret S. 1990. Suburban lives. Rutgers, N.J.: Rutgers University Press.
209
Marsh, William M., and Richard Hill-Rowley. 1989. Water quality, stormwater management, and development planning on the urban fringe. Journal of Urban and Contemporary Law 35, no. 3: 3-36.
Martin, Myerson, and Edward C. Banfield. 1955. Politics, planning and the public
interest. Glenco, Ill.: The Free Press.
Martinez-Alier, Juan. 1987 Ecological economics: Energy, environment and society. Oxford: Basil Blackwell.
McHarg, Ian. 1969. Design with nature. Garden City, N.Y.: Natural History Press.
McKenzie, Evan. 1994. Privatopia homeowner associations and the rise of residential private government. New Haven, Conn.: Yale University Press.
Meadows, Donella, Dennis Meadows, and Jorgen Randers. 1992. Beyond the limits. Post
Mills, Vt.: Chelsea Green Publishing Company. Meadows, Donella, Dennis Meadows, Jergen Randers, and William H. Behrens III. 1972.
The limits to growth: A report for the Club of Rome’s project on the predicament of mankind. New York: Universe Books.
Mill, John S. 1965 [1848]. Principles of political economy: with some of their
applications to social philosophy. Toronto: University of Toronto Press. Molotch, Harvey. 1976. The city as a growth machine. American Journal of Sociology
82: 309-33. Montgomery, Robert. 1998. Is there still life in the death and life? Journal of the
American Planning Association 643, no. 3: 269-74. Morrill, Richard L. 1973. Fundamental issues concerning future settlement in America.
In Geographical perspectives and urban problems, 81-93. Washington, D.C.: National Academy of Sciences.
________. 1970. The spatial organization of society. Belmont, Calif.: Wadsworth. Morrill, Richard, John Cromartie, and Gary Hart. 1999. Metropolitan, urban, and rural
commuting areas: Toward a better depiction of the Unitied States settlement system. Urban Geography 20: 727-48.
210
Moudon, Anne Vernez. 2002. Urban morphology as an emerging interdisciplinary field: the origins and development of the International Seminar on Urban Form, edited from published writings: President’s report. Urban Morphology 1: 3-10; Assessment and prospect. Urban Morphology 2, no. 1: 8-10; President’s report. Urban Morphology 3, no. 1: 21-25; available from http://odin.let.ong.nl/isuf/isufhist; Internet; accessed 12 November 2002.
Muller, Peter O. 1997. The suburban transformation of the globalizing American city.
Annals of the American Academy of Political and Social Science 551: 44-58. Mumford, Lewis. 1923. Regional planning schemes. American Institute of Architects
Journal XI: 404-5. ________. 1938. The culture of cities. New York: Harcourt, Brace and Company. Naismith Engineering Inc. 2005. Regional water quality protection plan for the Barton
Springs segment of the Edwards Aquifer and its contributing zone. NEI Project No. 7131; available from www.waterqualityplan.org; Internet; accessed 15 August 2006.
Nelson, Arthur C., and Kenneth J. Dueker. 1990. The exurbanization of America and its
planning policy implications. Journal of Planning Education and Research 9, no. 2: 91-100.
________. 1994. The new ‘burbs’, the exurbs and their implications for planning policy.
Journal of the American Planning Association 60, no. 1: 45-59. Neuman, Michael. 1991. Utopia, dystopia, disapora. Journal of the American Planning
Association 57, no. 3: 344-347. ________. 1998. Does planning need the plan? Journal of the American Planning
Association 64, no. 2: 208-17. ________. 2000. Sustainability as a process. College Station, Tex.: Texas A&M
University, Department of Landscape Architecture and Urban Planning. Newman, Oscar. 1980. Community of interest. Garden City, N.Y.: Anchor
Press/Doubleday. Nijman, Jan. 2000. The paradigmatic city. Annals of the Association of American
Geography 90, no. 4, 135-145. Novak, Shonda. 2005. Council to consider legality of AMD site – Environmental
activists challenge builder’s right to follow old standards. Austin-American Statesman, 27 October 2005, B1.
211
Odum, Howard T. 1994. Ecological and general systems, revised edition. Boulder, Colo.: University of Colorado Press.
Opschoor, Johannes B., and Robert Costanza. 1996. Environmental performance
indicators, environmental space and the preservation of ecosystem health. In Global environmental change and economic development in Europe, eds. J. Jager, A. Liberatore, and K. Gundlach, 157-90. Wuppertal Institute: Nordrhein-Westfalen, Germany.
Orfield, Myron. 1997. Metropolitics: A regional agenda for community and stability.
Washington, D.C.: Brookings Institute Press. Orr, David W. 1992. Environmental literacy: education and the transition to the
postmodern world. Albany, N.Y.: State University of New York Press. Orum, Anthony. 1987. Power, money & the people. The making of modern Austin.
Austin, Tex.: Texas Monthly Press. Otto, Betsy, Katherine Ransel, Jason Todd, Deron Lovaas, Hannah Stutzman and John
Bailey. 2002. Paving our way to water shortges: How sprawl aggravates the effects of drought. On-line publication by American Rivers, Natural Resources Defense Council and Smart Growth America; available from www.smartgrowthamerica.com/newsroom/pressrelease082802.html; Internet; accessed 14 July 2005.
Owens, Susan. 1994. Land, limits and sustainability, a conceptual framework and some
dilemmas for the planning system. Transactions of the Institute of British Geographers 19, no. 4: 439-56.
Packard, Vance O. 1972. A nation of strangers. New York: McKay. Palm, Risa. 1981. The geography of American cities. New York: Oxford University
Press. Palmer, E. Charles. 1986. Land use and cultural change along the Balcones Escarpment:
1718-1986. In The Balcones Escarpment, geology, hydrology, ecology and social development in central Texas, 153-161. eds. Patrick L. Abbott and C. M. Woodruff, Jr.; 153-161. San Antonio, Tex.: Geological Society 1986 Annual Meeting in San Antonio.
Panayotou, Theodore. 1993. Green markets: The economics of sustainable development.
San Francisco: International Center for Economic Growth. Park, Robert E. 1915. The city: Suggestions for the investigation of human behavior in
the city environment. American Journal of Sociology 20: 577-612.
212
________. 1924. The Concept of social distance as applied to the study of racial attitudes and racial relations. Journal of Applied Sociology later Sociology and Social Research 8, no. 6: 339-44.
Park, Robert E., Ernest W. Burgess, and Roderick D. McKenzie. 1925. The city. Chicago,
Ill.: University of Chicago Press. Peet, Richard. 1998. Modern geographical thought. Oxford: Blackwell Publishers. Peiser, Richard B. 1989. Density and urban sprawl. Land Economics 65, no. 3: 193-204. ________. 1990. Who plans America? planners or developers? Journal of the American
Planning Association 56, no. 4: 496-503. Pendall, Rolf. 1999. Do land-use controls cause sprawl? Environment and Planning B:
Planning and Design 26: 555-71. Peterson, James F. 2001. San Antonio: An environmental crossroads on the Texas spring
line. In On the border, an environmental history of San Antonio, ed. Char Miller, 17-40. Pittsburg, Pa.: University of Pittsburg Press.
Platt, Rutherford. 1976. Land use control: interface of law and geography. Association of
American Geographers Commission on College Geography, Resource Paper 75-1. ________. 2004a. Toward ecological cities. Adapting to the 21st century metropolis.
Environment 46, no. 5: 10-27. ________. 2004b. Land use and society: geography, law, and public policy. Washington:
Island Press. Polnau, Luther. 1986. In American Planning Association – Texas Chapter. 1977 – 1994.
The history of planning in Texas project records, Box 3, the Alexander Architectural Archive, the General Libraries, the Univeristy of Texas at Austin.
Popper, Frank J. 1988. Understanding American land use regulation since 1970. A
revisionist interpretation. Journal of the American Planning Association 54, no. 3: 291-301.
________. 1981. Unshaping growth. American Land Forum 2, no. 2: 8-14. Portney, Kent E. 2003. Taking sustainable cities seriously, economic development, the
environment, and quality of life in American cities. Cambridge, Mass.: The MIT Press.
213
Powell, Catherine. 1984. In American Planning Association – Texas Chapter. 1977 – 1994. The history of planning in Texas project records, Box 13, the Alexander Architectural Archive, the General Libraries, the Univeristy of Texas at Austin.
Pred, Allan. 1977. City systems in advanced societies. London: Hutchison. Price, Asher. 2004. Dripping Springs may delay building. Austin-American Statesman, 9
March 2004, B1. Pryor, Robin J. 1968. Defining the rural-urban fringe. Social Forces 47, no. 2: 202-15. Randolph, John. 2004. Environmental land use planning and management. Washington,
D.C.: Island Press. Real Estate Research Corporation. 1974. The costs of sprawl - Environmental and
economic costs alternative residential development patterns at the urban fringe; Detailed cost analysis. Council on Environmental Quality, the Department of Housing and Urban Development, and the Environmental Protection Agency, Stock no. 4111-00021. Washington, D.C.: U.S. Government Printing Office.
Rees, William E. 1997. Urban ecosystems: the human dimension. Urban Ecosystems 1:
63-75 ________. 1995. Achieving sustainability: Reform or transformation? Journal of
Planning Literature 9, no. 4: 343-61. Relph, Edward C. 1976. Place and placelessness. London: Pion Limited. Reps, John W. 1965. The making of America: A history of planning in the United States.
Princeton, N.J.: Princeton University Press. ________. 1979. Cities of the American West: A history of frontier urban planning.
Princeton, N.J.: Princeton University Press. Ricardo, David. 1973 [1817]. Principles of political economy and taxation. London:
Dent. Riis, Jacob. 1890. How the other half lives. Studies among the tenements of New York
City. New York: Charles Scribner’s Sons. Rosenzweig, Michael. 2003. Win-win ecology: How earth’s species can survive in the
midst of the human enterprise. New York: Oxford University Press. Sagoff, Mark. 1990. The economy of the earth: philosophy, law and the environment.
New York: Cambridge University Press.
214
Salingaros, Nikos A. 2000. Complexity and urban coherence. Journal of urban design 5: 291-316.
________. 1998. Theory of the urban web. Journal of urban design 3: 53-71. San Antonio Express News. 2005. Government’s power to seize homes grows. Justices
rule property can be taken for private economic development. 24 June 2005, 4A. Saunders, Doug. 2002. Why “sustainable development” is neither. The Globe and Mail,
19 October 2002. Scheibal, Stephen. 2003. Wal-Mart retreats on MoPac plans – Environment cited as
cause, but supercenter has faced heated protest opposition. Austin American Statesman, 2 October 2003, B1.
________. 2005. Area attempts to map 130 boom. Austin American-Statesman, 26 March
2005, A1. Schmitt, Peter J. 1969. Back to nature; the Arcadian myth in urban America. New York:
Oxford University Press. Schrank, David, and Tim Lomax. 2005. The 2005 urban mobility report. Texas
Transportation Institute, The Texas A&M University System; available at http://mobility.tamu.edu; Internet; accessed 14 may 2006.
Scott, Allen J. and Edward Soja, eds. 1996. The city: Los Angeles and urban theory at the
end of the twentieth century. Los Angeles: University of California Press. Sherrouse, Ben, David Hester, Paul Martin, and Mark Feller. 2005. Landscape change
and socioeconomic trends in the Austin, TX region. Geographic Analysis and Monitoring Program, USGS. Denver, Colo.
Shevky, Eshref, and Marilyn Williams. 1949. The social areas of Los Angeles: Analysis
and typology. Berkeley and Los Angeles: The University of California Press. Sierra Club. 1999. The dark side of the American dream. College Park, MD.: Challenge
to Sprawl Campaign. Simmel, Georg. 1983 [1908]. Sociology: Investigations on the forms of sociation. Berlin:
Duncker and Humblot. Simon, Herbert. 1955. Administrative behavior. New York: Macmillan and Company. Simon, Julian, and Herman Kahn. 1984. The resourceful earth: A response to Global
2000. Oxford: Blackwell.
215
Smith, Ali, Frank J. Smith, and Randolph Hester. 1996. Community goal setting 0692. Stroudsburg, Pa.: Hutchison Ross Publishing Company.
Smith, Herbert. 1991. Planning America’s communities: Paradise lost? Paradise found?
Chicago, Ill.: Planners Press, American Planning Association. Smith, Neal. 1992. New city, new frontiers. In Variations on a theme park, ed. Michael
Sorkin, 61-93. New York: Hill and Wang. Smith, T. L. 1937. The population of Louisiana: Its composition and changes. Louisiana
Bulletin no. 293. So, Frank S., and Judith Getzels, Eds. 1988. The practice of local government planning,
Second edition. Washington D.C.: International City Managers Association. Soja, Edward. 1996. Los Angeles 1965-1992: The six geographies of urban restructuring.
In The City: Los Angeles and urban theory at the end of the twentieth century, ed. Allen. J. Scott and Edward Soja, 426-62. Los Angeles: University of California Press.
________. 1989. Postmodern geographies, the reassertion of space in critical social
theory. London: Verso.
Sorkin, Michael. 1992. See you in Disneyland. In Variations on a theme park: The new American city and the end of public space, ed. Michael Sorkin, 205-32. New York: The Noonday Press.
Southworth, Michael, and Peter M Owens. 1993. The evolving metropolis, studies of
community, neighborhood, and street form at the urban edge. Journal of the American Planning Association 59, no. 3: 271-87.
Southworth, Michael, and Balaji Pathasarathy. 1996. The suburban realm: its emergence,
growth and transformation in the American metropolis. Journal of Urban Design 1, no. 3: 245-64.
Spectorsky, Auguste C. 1955. The exurbanites. Philadelphia, Pa.: Lippincott.
Stea, David, and Mete Turan. 1993. Placemaking: Production of built environment in two
cultures. Brookfield, Vt.: Avebury. Steiner, Frederick. 2000a. Urban human ecology. Urban Ecosystems 7: 179-97. ________. 2000b. The living landscape: An ecological approach to landscape planning.
New York: McGraw Hill.
216
________. 2002. Human ecology: following nature’s lead. Washington, Covelo, London: Island Press.
Stilgoe, John R. 1988. Borderland: origins of the American suburb, 1820-1939. New
Haven, Conn.: Yale University Press. Susskind, Lawrence, and Jeffrey Cruikshank. 1987. Breaking the impasse: consensual
approaches to resolving public disputes. New York: Basic Books. Susskind, Lawrence, Sarah McKearnan, and Jennifer Thomas-Larmer. 1999. eds. The
consensus building handbook: A comprehensive guide to reaching agreement. Thousand Oaks, Calif.: Sage Publications.
Sweetser, F. L. 1965. Factorial ecology: Helsinki, 1960. Demographics 2: 372-85. Taffe, Edward J., Shaul Krakover, and Howard L. Gauthier. 1992. Interactions in the
inter-metropolitan periphery. Urban Geography 13, no. 6: 503-33. Talen, Emily. 2003. Measuring urbanism: Issues in Smart Growth research. Journal of
Urban Design 8, no. 3: 195-215. Tedesco, John. 2005. Losing ground. San Antonio Express News, 16-19 October 2005,
A1. Terstreip, Michael L., Michael L. Voorhees, and Michael Bender. 1976. Conventional
urbanization and its effects on storm runoff. Urbana, Ill.: Illinois State Water Survey.
Texas Parks and Wildlife. 2005. TPWD Executive Director order no. 00-005 –
endangered species; available at www.tpwd.state.tx.us/warden/endangerd_species; Internet; accessed 2 July 2006.
Theobald, David M. 2001. Land-use dynamics beyond the urban fringe. The
Geographical Review 91, no. 3: 544-64. Thomas, David. 1990. The edge of the city. Transactions of the Institute of British
Geographers 15: 131-38. Thornwaite, W. 1930. Louisville, Kentucky: a study in urban geography. Ph.D.
Dissertation, University of California, Berkeley. Tonnies, Ferdinand. 1963 [1887]. Community and society. Charles P. Lewis, ed. New
York: Harper and Row. Torrens, Paul M., and Marina Alberti. 2000. Measuring sprawl. Unpublished Paper No.
27. University College, London. Center for Advanced Spatial Analysis.
217
U.S. Census Bureau. 2002. Census 2000 basics. Washington, D.C.: U.S. Government
Printing Office. Available at http://www.census.gov/mso/www/c2000basics/00Basics.pdf; Internet; accessed 11 July 2005.
________. 2005a. Annual estimates of the population for incorporated places in Texas,
Listed April 1, 2000 to July 1, 2004 (SUB-EST 2004-04-48). Washington, D.C.: U.S. Government Printing Office. Available at www.census.gov/popest/cities/tables/SUB-EST2004-04-48.xls; Internet; accessed 22 April 2005.
________. 2005b. Racial and ethnic residential segregation in the United States: 1980-
2000. Washington, D.C.: U.S. Government Printing Office. Available at http://www.census.gov/hhes/www/housing/housing_patterns/pdftoc.html; Internet; accessed 14 May 2006.
________. 2005c. Median and average square feet of floor area in new one-family houses
completed by location. Available at www.census.gov/const/C25Ann/sftotalmedavgsqft.pdf; Internet; accessed 3 May 2005.
U.S. President’s Council on Sustainable Development (PCSD). 1994. A vision for a
sustainable U.S. and principles of sustainable development. Washington, D.C.: PCSD.
Van der Ryn, Sim, and Stuart Cowan. 1996. Ecological Design. Washington, D.C.: Island
Press. Vance, James E., Jr. 1972. California and the search for the ideal. In Regions of the U.S.,
ed. John Fraser Hart, 185-210. New York: Harper and Row. ________. 1977. The scene of man: the role and structure of the city in the geography of
Western Civilization. New York: Harpers College Press. ________. 1978. Geography and the study of cities. American Behaviorial Scientist 22,
no.1: 131-49. ________. 1990. The continuing city, urban morphology in Western civilization.
Baltimore, Md.: The Johns Hopkins University Press. VanMetre, Peter, Barbara Mahler, and Edward Furlong. 2000. Urban sprawl leaves its
PAH signature. Environmental Science and Technology 34, no. 19: 4064-70. Vaughan, James. 1994. The dynamics of land development in a rapidly urbanizing area. Masters Thesis: Texas State University–San Marcos.

218
Vogt, Christine, and Robert W. Marans. 2004. Natural resources and open space in the
residential decision process: a study of recent movers to fringe counties in southeast Michigan. Landscape and Urban Planning 69: 255-69.
Vottler, Todd. 1998. The little fish that roared: The endangered species act, state
groundwater law, and private property rights collide over the Texas Edwards Aquifer. Northwestern School of Law of Lewis and Clarke College. Environmental Law 28, no. 4: 845-79.
Wackernagel, Mathis. 1994. Biological footprint and appropriated carrying capacity: a
tool for planning toward sustainability. Ph.D. Dissertation. The University of British Columbia, Canada.
Wackernagel, Mathis, and William Rees. 1996. Our ecological footprint: Reducing
human impact on the earth. Gabriola Island, British Columbia: New Society Publishing.
Wackernagel, Mathis, Chad Monfreda, and Diana Deumling. 2002. Ecological footprint
of nations, November 2002 update: How much nature do they use? How much nature do they have? Redefining Progress for People, Nature and the Economy; available from www.rprogress.org; Internet; accessed on 14 July 2005.
Walz, Karen. 2005. A sleeper: Regional planning in Texas. Planning 71, no. 5: 16-17. Ward, D. 1964. A comparative historical geography of streetcar suburbs in Boston,
Massachusetts, and Leeds, England: 1850-1902. Annals of the Association of American Geographers 54: 343-59.
Watson, Tracy. 1990. In American Planning Association – Texas Chapter. 1977 – 1994.
The history of planning in Texas project records, Box 3, the Alexander Architectural Archive, the General Libraries, the Univeristy of Texas at Austin.
Webber, Melvin M. ed. 1964. Explorations into urban structure. Philadelphia, Pa.:
University of Pennsylvania Press. Welter, Volker M. 2002. Biopolis, Patrick Geddes and the city of life. Cambridge, Mass.:
The MIT Press. Wetzel, Thomas. 1981. In American Planning Association – Texas Chapter. 1977 – 1994.
The history of planning in Texas project records, Box 13, the Alexander Architectural Archive, the General Libraries, the Univeristy of Texas at Austin.
Wheaton, William. 1964. Public and private agents of urban expansion. In Explorations
into urban structure, ed. Melvin M. Webber, 154-96. Philadelphia, Pa.: University of Pennsylvania Press.

219
Whittaker, Robert H. 1975. Communities and ecosystems. New York: MacMillan
Publishing. Whitehand, J. W. R., and C. M. H. Carr. 2001. Twentieth-century suburbs, A
morphological approach. London and New York: Routledge. Wimberley, Laura. 2001. Establishing “sole source” protection. In On the border, an
environmental history of San Antonio, ed. Char Miller, 169-81. Pittsburg, Pa.: University of Pittsburg Press.
Wolman George, George Galster, Royce Hanson, Michael Ratcliffe, and Kimberly
Furdell. 2002. Measuring sprawl: Problems and solutions. Paper prepared for presentation at the 2002 meeting of the Association of Collegiate Schools of Planning, Baltimore, Md., 23 November 2002.
World Commission on Environment and Development. (The Brundtland Commission).
1987. Our Common Future. Oxford: Oxford University Press. Wright, Frank L. 1958. The living city. New York: Bramhall House. Wyly, Elvin. 1999. Continuity and change in the restless urban landscape. Economic
Geography 75, no. 4: 309-38. Young, Randy. 2005. San Antonio gated PUD list. Available from www.gatedhomes.net;
Internet; accessed 11 November 2005.
220
VITA
James Willis Vaughan was born in Atlanta, Georgia on September 13, 1946. He
received his Bachelor’s degree in Economics from Stanford University and his Masters of
Applied Geography from Texas State University-San Marcos. He is the proud father of
two daughters, Kelly and Jamie, both of whom attended Texas State. James has worked
in the remodeling and real estate businesses, has served as Planning Director for the cities
of New Braunfels and Bulverde, Texas, and, as a planning consultant, has authored
comprehensive plans for Victoria and Bulverde, Texas. In addition, he has served as an
economic consultant with Kavoussi and Associates in San Antonio.
Permanent Address: 583 Lakeview Circle
New Braunfels, Texas 78130
This dissertation was typed by James Willis Vaughan.

221
Copyright © 2022 FDOKUMEN