Refresh the World. Make a Difference. - cloudfront.net
82
Refresh the World. Make a Difference. 2021 Business & ESG Report
-
Upload
khangminh22 -
Category
Documents
-
view
0 -
download
0
Transcript of Refresh the World. Make a Difference. - cloudfront.net
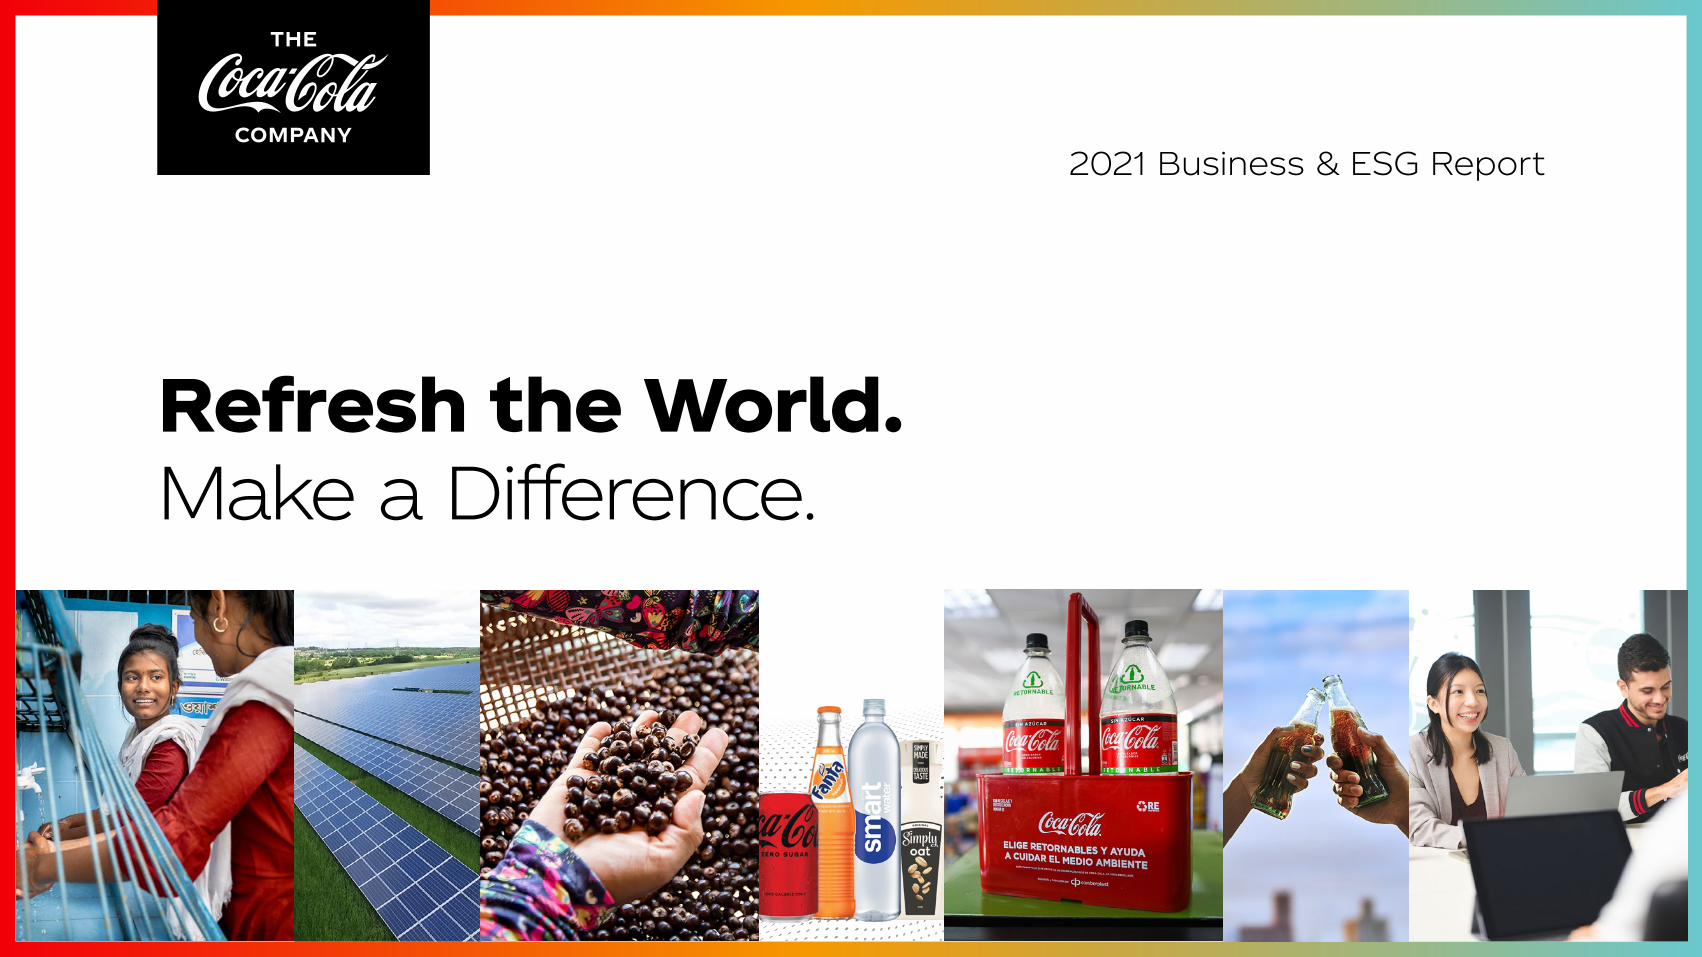
Refresh the World. Make a Difference.
2021 Business & ESG Report

Executive Summary
The Coca-Cola Company 2021 Business & ESG Report 2
CEO Message AgriculturePortfolio Data AppendixOur Company PeoplePackaging FrameworksWater OperationsClimate
Chairman & CEO Message 3Board of Directors 5Executive Summary 6
Our CompanyAt a Glance 10How We Operate 11Financial Highlights 12Building a Total Beverage Company 13Accelerating Innovation Across Our Portfolio 14Encouraging Collective Action 15Governance & Management 16Our Priority Environmental, Social & Governance (ESG) Issues 18Stakeholder Engagement & Partnerships 19Spotlight Story: Driving Change Through Public Policy 20
Water Leadership 21
Spotlight Story: Protecting Water and Building Climate Resilience in Guatemala 27
Our Total Beverage Portfolio 28
Packaging: World Without Waste 32
Climate 38
Sustainable Agriculture 42
People & Communities 46 Respecting Human Rights 47Spotlight Story: Using Technology to Better Manage Risks and Empower Workers 49Economic Empowerment 50Employee Safety & Health 51Diversity, Equity & Inclusion 52Giving Back to Communities 56Spotlight Story: Getting COVID-19 Vaccines to Go the “Last Mile” in Africa and Beyond 57
Operations Highlights 58 Asia Pacific 59Europe, Middle East & Africa 60Latin America 61North America 62Global Ventures/Bottling Investments Group 63
About This Report 64
Data Appendix 65 Financial & Portfolio Data 66Packaging 72Water 73Greenhouse Gas Emissions & Waste 74Workplace, Safety & Giving Back 76Human Rights & Agriculture 79
Assurance Statement 80
Reporting Frameworks & Sustainable Development Goals (SDGs) 81
We make brands and products that people love, while building a more sustainable future for our business and for the planet. We do all of this while staying true to our purpose: to refresh the world and make a difference.
Contents
Executive Summary
The Coca-Cola Company 2021 Business & ESG Report 3
AgriculturePortfolio Data AppendixOur Company PeoplePackaging FrameworksWater OperationsClimateCEO Message
Our people worked with great dedication in 2021 to help our company emerge stronger from the pandemic and position ourselves for continued growth in 2022 and beyond. We made important decisions about streamlining our brand portfolio; changing the way we work as an organization; and tailoring our investments to target the most promising products and priorities. Through all of the challenges, initiatives and successes of 2021, our environmental, social and governance priorities continued to be embedded in our business and the way we work.
An Integrated Business
Our environmental, social and governance (ESG) priorities are integrated into our strategy. We’re focused on areas where we can have a measurable, positive impact on the communities we serve around the world.
Our ESG initiatives are interconnected, and so are the solutions we support. We seek an exponentially greater impact by fostering collective action: partnering across industry, government and society to address shared challenges.
Water is a top business priority. It is the principal ingredient in the products we make and is critical for the agricultural products we use. Through the 2030 Water Security Strategy we announced in 2021, we’re focused on achieving water security where the company operates and sources ingredients, concentrating on water-stressed areas—while maintaining 100% replenishment globally.
In 2021, we returned 167% of the water used in our finished beverages to nature and communities. Since 2010, our water, sanitation and hygiene programs have reached more than 18.5 million people globally.
We also continue to make meaningful progress on our World Without Waste packaging initiative. We’re continuing to invest in partnerships with innovators and NGOs like our PlantBottle™ partners, World Wildlife Fund and The Ocean Cleanup. We’ve also set new targets, including a virgin plastic reduction goal and an industry-leading goal to significantly boost our use of reusable packaging.
By 2030, the company aims to have at least 25% of volume globally across our portfolio of brands sold in refillable/returnable glass or plastic bottles, or in refillable containers through traditional fountain or Coca-Cola Freestyle dispensers. We believe that increasing the Coca-Cola system’s usage of refillable/returnable containers creates value for customers and consumers, drives increased package collection and simultaneously reduces our carbon footprint.
Water risks and packaging waste are closely linked to climate change. We’re reducing our carbon footprint through an intertwined and holistic approach across our ESG priorities. Our vision is for packaging to be reused and recycled as part of a circular economy—which means a world with dramatically lower carbon emissions and climate impacts.
Combating the climate crisis requires a global effort, which is why we worked with experts to set science-based targets. In 2021, we announced that we made solid progress to decarbonize our system by achieving our “drink in your hand” goal. We’ve increased our ambitions through our 2030 greenhouse gas emissions target to reduce absolute emissions by 25%, and our long-term ambition is to be net zero carbon by 2050.
In 2021, we took action to create a better shared future through investments in economic empowerment; diversity, equity and inclusion (DEI); and giving through The Coca-Cola Foundation. We’ve refreshed the company’s global DEI strategy to reflect the need for greater global reach, broader impact and a focus on equity and economic empowerment.
Chairman & CEO Message
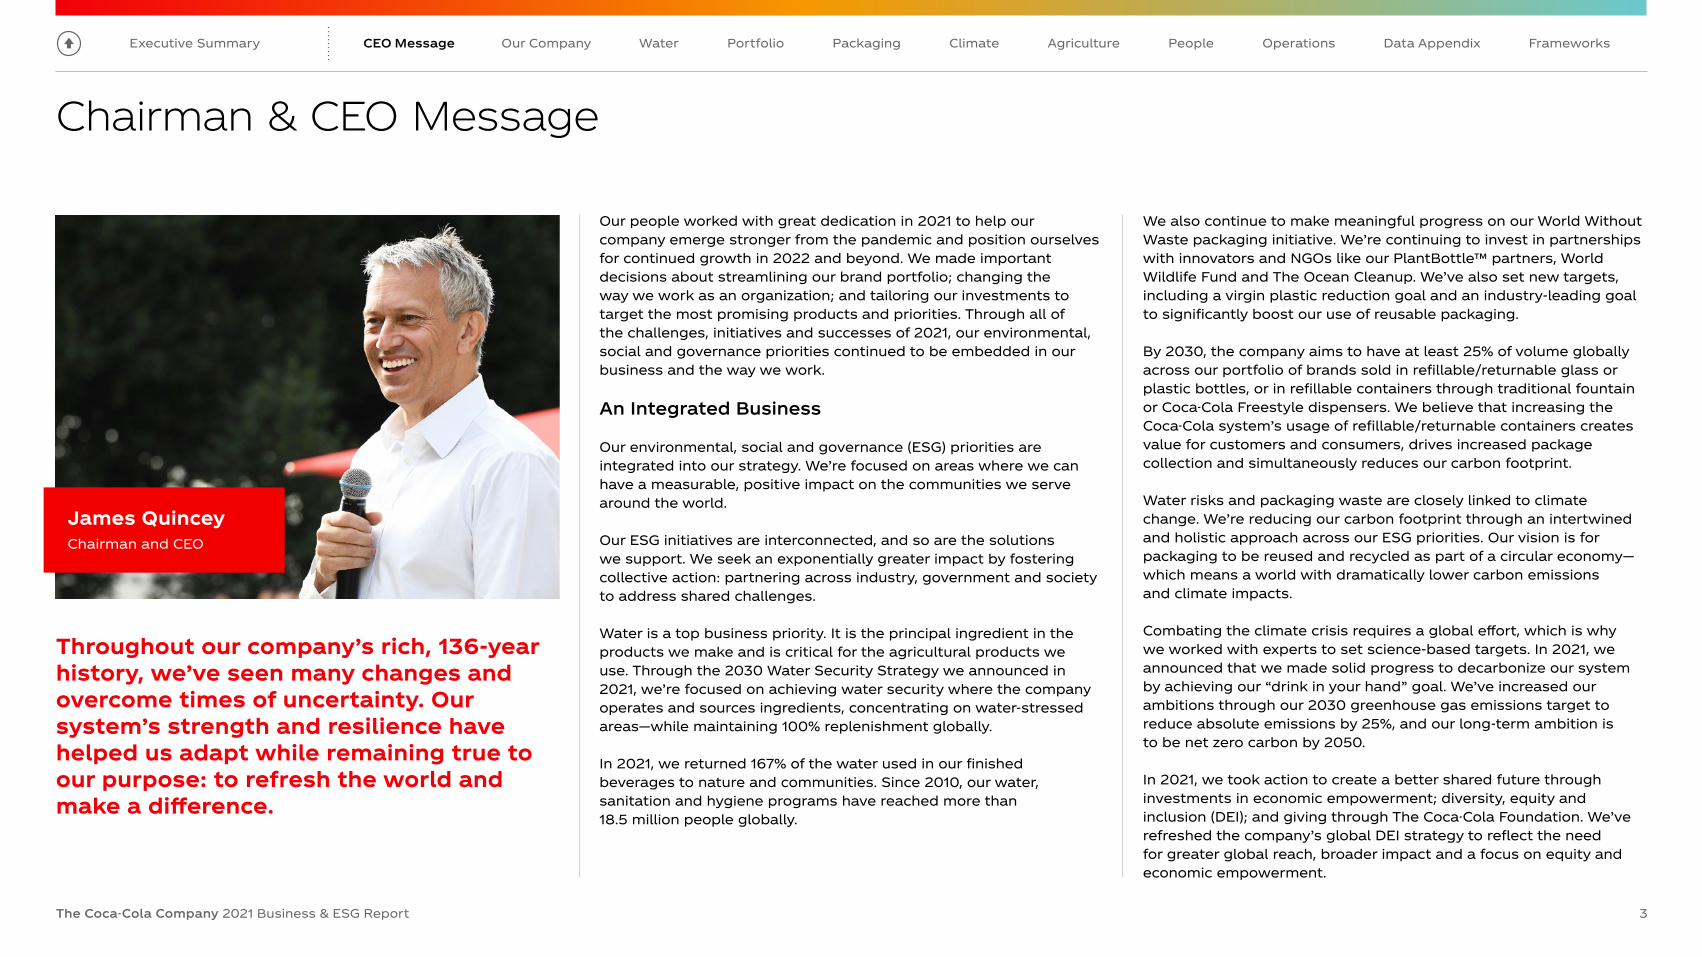
James QuinceyChairman and CEO
Throughout our company’s rich, 136-year history, we’ve seen many changes and overcome times of uncertainty. Our system’s strength and resilience have helped us adapt while remaining true to our purpose: to refresh the world and make a difference.

Executive Summary
The Coca-Cola Company 2021 Business & ESG Report 4
AgriculturePortfolio Data AppendixOur Company PeoplePackaging FrameworksWater OperationsClimateCEO Message
“ Together, we’re using our global presence to build a more sustainable future for our business and the planet while staying laser-focused on growth. In 2021, our networked way of working drove strong results, and I’m proud of what we’ve achieved.”
We aspire for our workforce to mirror the markets we serve. In 2021, we set a 2030 aspiration to mirror U.S. census data for race and ethnicity at all job levels of our company in the United States. We also recommitted to our aspiration to be 50% led by women globally, with a target of 2030.
In 2021, The Coca-Cola Foundation continued to support communities’ response to the pandemic with the creation of a $20 million fund to help stop the spread of COVID-19. Alongside our Project Last Mile partners, we have used our supply chain, distribution and marketing expertise to support vaccine rollout in a number of African markets, as well as leveraging our network of cold-chain partners.
We measure success by the value we create for shareowners while also creating a better shared future for people, communities and the planet. We’re using data to measure and drive this success. Going forward, our ESG goals are a factor in our compensation program for top executives. You can read more details in our Governance & Management section.
Building Brands and Creating Value
We are a total beverage company, and our focus is on creating a portfolio of great-tasting drinks and loved brands with the greatest potential to attract more consumers. During the pandemic, we evaluated our entire portfolio and tailored our investments. Today, we are focusing on approximately 200 master brands.
We’ve increased our innovation efforts, including sparkling and plant-based beverages as well as new entries in flavored alcohol beverages. Our efforts are designed for long-term success—we’re balancing big bets with intelligent experimentation, learning from failures and scaling successes.
Our 2021 successes include:
• We expanded some of our strongest brands to more markets, such as Coke® with Coffee, fairlife®, AHA® and Topo Chico® Hard Seltzer. fairlife® is now a $1 billion brand with seven consecutive years of double-digit volume growth.
• We rolled out a new and improved formulation of Coca-Cola® Zero Sugar, which helped the brand grow volume by double digits in 2021. The new formula has driven accelerated growth in 80% of the markets where it was launched.
• We acquired the remaining 85% ownership interest in BODYARMOR, giving us a line of sports performance and hydration beverages with significant potential for long-term growth.
Our backbone is a global system of strong partnerships with approximately 225 bottlers supported by leading edge technology. In 2021, we worked together to build a networked global organization, combining the power of scale with the deep knowledge
and cross-functional collaboration required to win locally. Together, we’re focusing on what we do best—building brands and products that people love and enjoy, and growing markets for those brands.
A Better Shared Future
Our purpose is to refresh the world and make a difference. Our company and system employees make this possible every day. Together, we’re using our global presence to build a more sustainable future for our business and the planet while staying laser-focused on growth. In 2021, our networked way of working drove strong results, and I’m proud of what we’ve achieved. I’m confident we will accomplish even more in 2022.
James QuinceyChairman and Chief Executive Officer
April 26, 2022

Executive Summary
The Coca-Cola Company 2021 Business & ESG Report 5
CEO Message AgriculturePortfolio Data AppendixOur Company PeoplePackaging FrameworksWater OperationsClimate
Board of Directors
“The Coca-Cola Company is staying focused on what matters most: its people and purpose. Although 2021 brought continued change across the world, our Board of Directors is proud of how the company remained centered on its key priorities and navigated many challenges to emerge stronger. This strong performance heading into 2022 is indicative of the company’s resilience, laying the groundwork for continued success and growth.”Maria Elena Lagomasino Lead Independent Director
Note: Board composition and committee positions reflected as of the completion of the 2022 Annual Meeting of Shareowners.
Alexis M. HermanChair and Chief Executive Officer, New Ventures LLC
Caroline J. TsayChief Executive Officer and Director, Compute Software, Inc.
David B. WeinbergChairman and Chief Executive Officer, Judd Enterprises, Inc.
James QuinceyChairman and Chief Executive Officer, The Coca-Cola Company
Maria Elena LagomasinoLead Independent Director Chief Executive Officer and Managing Partner, WE Family Offices
Herb AllenPresident, Allen & Company LLC
Ana BotínExecutive Chair, Banco Santander, S.A.
Marc BollandChairman, Blackstone Europe
Christopher C. DavisChairman, Davis Selected Advisers-NY, Inc.
Helene D. GayleChief Executive Officer, The Chicago Community Trust
Barry DillerChairman of the Board and Senior Executive, IAC/InterActiveCorp and Expedia Group, Inc.
Audit CommitteeTalent and Compensation CommitteeCommittee on Directors and Corporate GovernanceFinance CommitteeESG & Public Policy Committee
ChairMember
Executive Committee
The Coca-Cola Company 2021 Business & ESG Report 6
CEO Message AgriculturePortfolio Data AppendixOur Company PeoplePackaging FrameworksWater OperationsClimateExecutive Summary
Executive SummaryOur Priorities & Progress
Our publicly reported sustainability goals drive us to continually improve, working in concert with The Coca-Cola Company’s approximately 225 bottling partners in more than 200 countries and territories.
Water LeadershipOur 2030 Water Security Strategy focuses on increasing water security through a context-based approach to water replenishment, advocacy for smart water policies and responsible water use across our operations and supply chain. We’re using the size and scale of our company to improve water security where water risks impact our business, supply chain and communities.
Our strategy is underpinned by global goals and specific context-based targets that will enable us to measure our progress toward reaching our vision. Our global goals for 2030 fall under three pillars—Our Operations, Our Communities and Our Watersheds—with one additional cross-cutting goal: maintaining at least 100% global replenishment of the water used in our finished beverages.
In 2020 and 2021, we analyzed water-related risks to identify priority operating facilities. We are mapping priority ingredient sourcing regions and watersheds according to highest exposure to water stress. We are also mapping priority communities based on local context to identify opportunities for action to strengthen communities’ access to water, sanitation and hygiene (WASH) and their resilience to climate change.
By mapping and overlaying all three of these categories (operations, watersheds and communities), we will identify overlaps and interconnectivity across our action areas to develop a holistic, integrated and context-based approach.
Our Total Beverage PortfolioOffering More Choices and Reducing Added Sugar
167%of the water used in our finished beverages returned to nature and communities in 20211
18.5M+people provided access to safe drinking water, sanitation and hygiene since 20102
Earned a place on CDP’s “A List” for leadership in corporate transparency and action on water security in 2021
Top scorer out of 38 companies on Ceres’ 2021 Feeding Ourselves Thirsty report
RECOGNITION
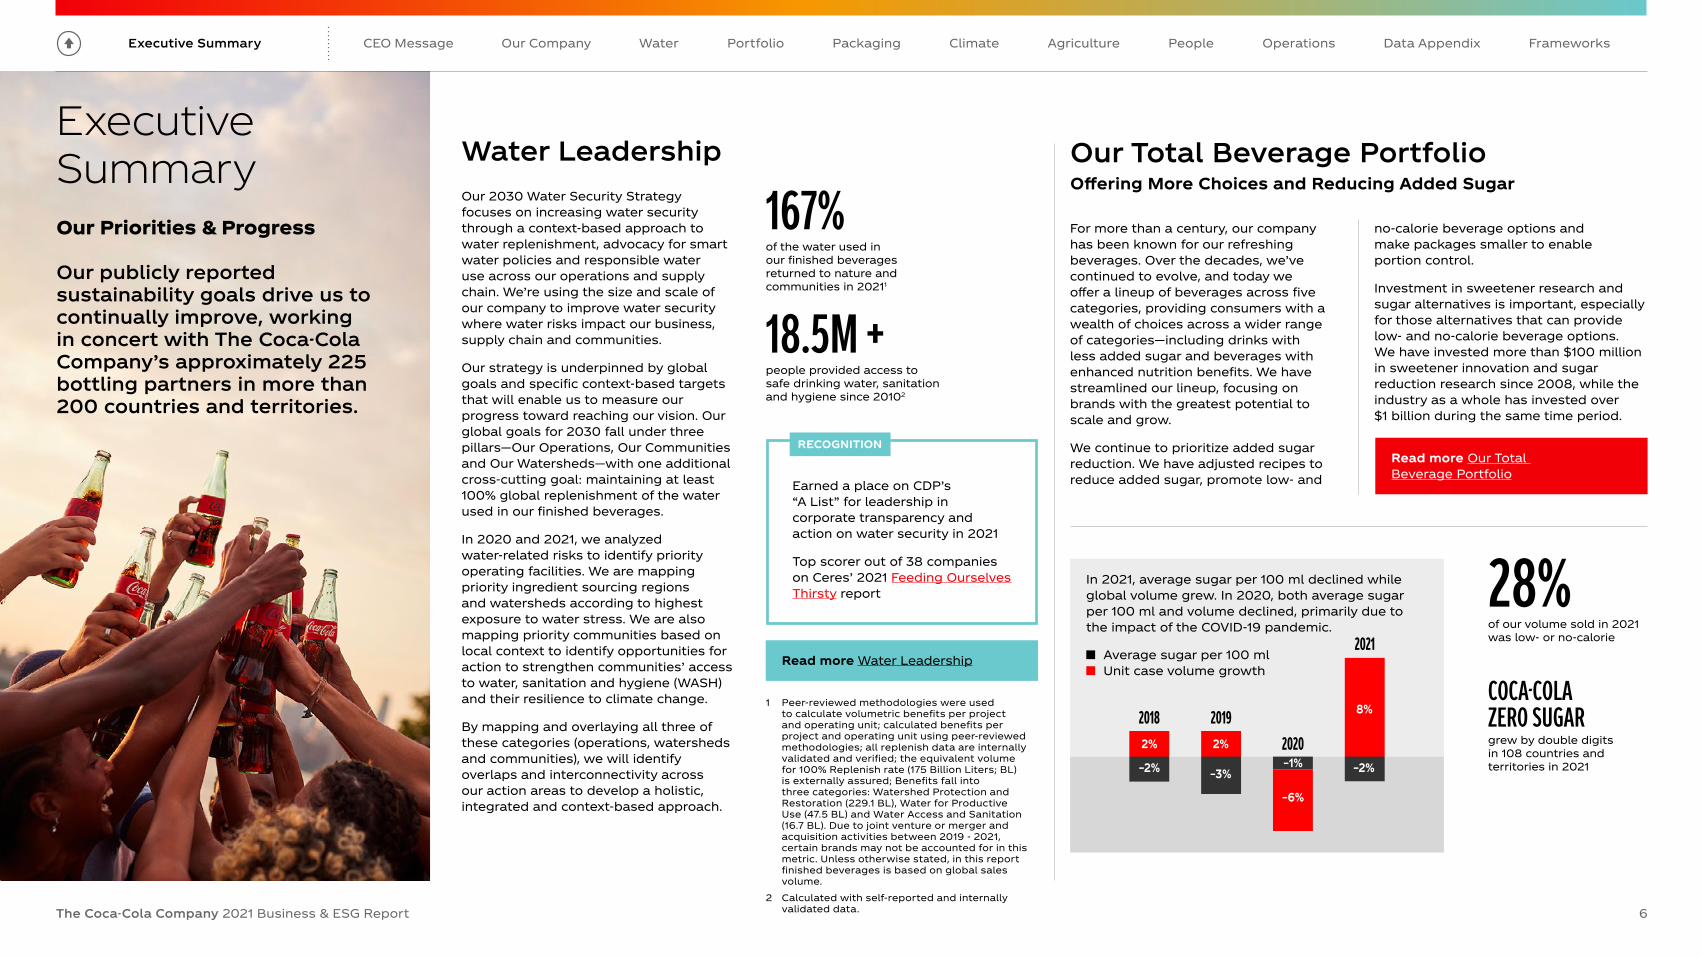
28%of our volume sold in 2021 was low- or no-calorie
COCA-COLA ZERO SUGAR grew by double digits in 108 countries and territories in 2021
2018 20192020
2021
2%
–2%
–6%
–1% –2%
8%
2%
–3%
In 2021, average sugar per 100 ml declined while global volume grew. In 2020, both average sugar per 100 ml and volume declined, primarily due to the impact of the COVID-19 pandemic.
Average sugar per 100 mlUnit case volume growth
Read more Water Leadership
Read more Our Total Beverage Portfolio
1 Peer-reviewed methodologies were used to calculate volumetric benefits per project and operating unit; calculated benefits per project and operating unit using peer-reviewed methodologies; all replenish data are internally validated and verified; the equivalent volume for 100% Replenish rate (175 Billion Liters; BL) is externally assured; Benefits fall into three categories: Watershed Protection and Restoration (229.1 BL), Water for Productive Use (47.5 BL) and Water Access and Sanitation (16.7 BL). Due to joint venture or merger and acquisition activities between 2019 - 2021, certain brands may not be accounted for in this metric. Unless otherwise stated, in this report finished beverages is based on global sales volume.
2 Calculated with self-reported and internally validated data.
For more than a century, our company has been known for our refreshing beverages. Over the decades, we’ve continued to evolve, and today we offer a lineup of beverages across five categories, providing consumers with a wealth of choices across a wider range of categories—including drinks with less added sugar and beverages with enhanced nutrition benefits. We have streamlined our lineup, focusing on brands with the greatest potential to scale and grow.
We continue to prioritize added sugar reduction. We have adjusted recipes to reduce added sugar, promote low- and
no-calorie beverage options and make packages smaller to enable portion control.
Investment in sweetener research and sugar alternatives is important, especially for those alternatives that can provide low- and no-calorie beverage options. We have invested more than $100 million in sweetener innovation and sugar reduction research since 2008, while the industry as a whole has invested over $1 billion during the same time period.
The Coca-Cola Company 2021 Business & ESG Report 7
CEO Message AgriculturePortfolio Data AppendixOur Company PeoplePackaging FrameworksWater OperationsClimateExecutive Summary
PACKAGING
World Without WasteOur World Without Waste initiative is anchored by three fundamental goals: Making 100% of our packaging recyclable globally by 2025—and using at least 50% recycled material in our packaging by 2030 (Design); collecting and recycling a bottle or can for each one we sell by 2030 (Collect); and bringing people together to support a healthy, debris-free environment (Partner).
Tackling the global plastic waste crisis requires cross-sector collaboration and alignment on common principles and targets, and we’re working with a range of stakeholders at a global, regional and local level to achieve our goals.
ClimateWe have a responsibility to reduce the carbon footprint of our value chain; to improve business resilience by managing the short- and long-term risks and impacts of a changing climate; and to foster partnerships that drive positive change.
Our approach to addressing climate change has accelerated in recent years in keeping with the scale and urgency of the issue. Even as we achieved our 2020 “drink in your hand” goal to reduce our relative carbon emissions by 25% against a 2010 baseline, we increased our climate ambition.
We’ve announced both our science-based target to reduce absolute emissions by 25% by 2030 against a 2015 baseline and an ambition to be net zero carbon by 2050. Several of our bottling partners have announced their own science-based targets and net zero pledges, which will help drive even more climate action across the Coca-Cola system.
In line with our net zero ambition, we conducted preliminary modeling in 2021 that will enable us to define the key actions and goals needed for a net zero transition to 2050.
Read more World Without Waste
Read more Climate
In February 2022, we announced an industry-leading reusable packaging goal.
By 2030, we aim to have at least 25% of our beverages worldwide by volume sold in refillable/returnable glass or plastic bottles or in fountain dispensers with reusable packaging
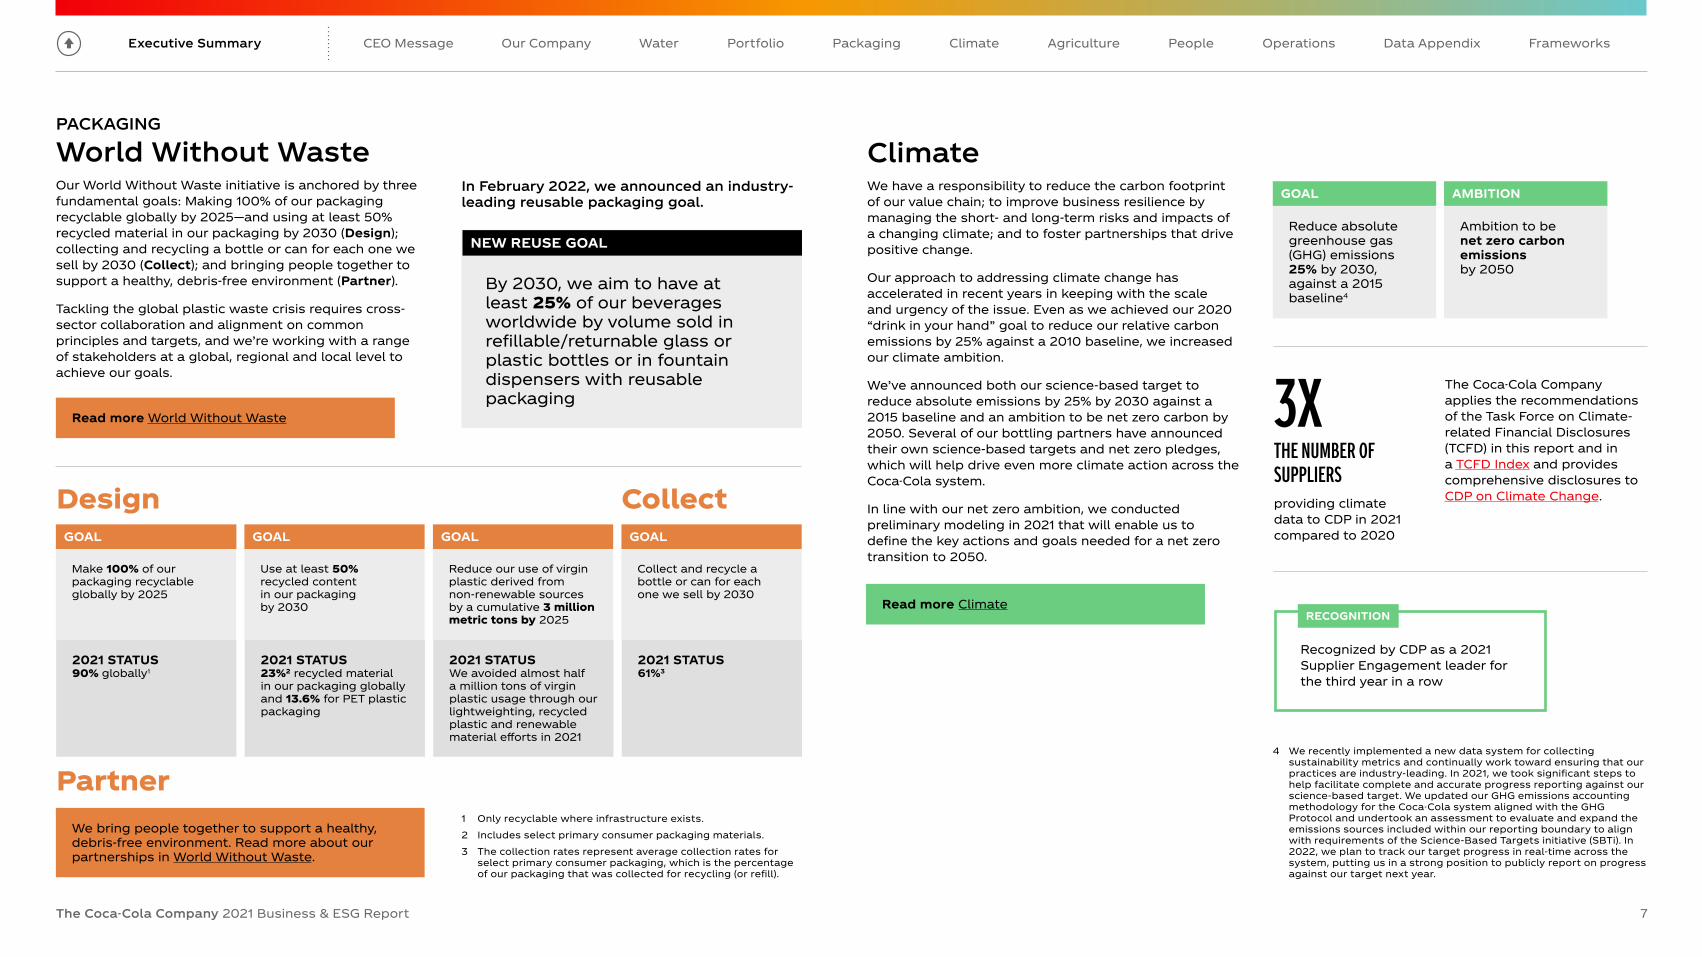
NEW REUSE GOALReduce absolute greenhouse gas (GHG) emissions 25% by 2030, against a 2015 baseline4
GOAL
Ambition to be net zero carbon emissions by 2050
AMBITION
Design
Partner
Make 100% of our packaging recyclable globally by 2025
We bring people together to support a healthy, debris-free environment. Read more about our partnerships in World Without Waste.
GOAL
Use at least 50% recycled content in our packaging by 2030
GOAL
Reduce our use of virgin plastic derived from non-renewable sources by a cumulative 3 million metric tons by 2025
GOAL
Collect and recycle a bottle or can for each one we sell by 2030
2021 STATUS 90% globally1
2021 STATUS 23%2 recycled material in our packaging globally and 13.6% for PET plastic packaging
2021 STATUS We avoided almost half a million tons of virgin plastic usage through our lightweighting, recycled plastic and renewable material efforts in 2021
2021 STATUS 61%3
GOAL
Collect
4 We recently implemented a new data system for collecting sustainability metrics and continually work toward ensuring that our practices are industry-leading. In 2021, we took significant steps to help facilitate complete and accurate progress reporting against our science-based target. We updated our GHG emissions accounting methodology for the Coca-Cola system aligned with the GHG Protocol and undertook an assessment to evaluate and expand the emissions sources included within our reporting boundary to align with requirements of the Science-Based Targets initiative (SBTi). In 2022, we plan to track our target progress in real-time across the system, putting us in a strong position to publicly report on progress against our target next year.
1 Only recyclable where infrastructure exists.2 Includes select primary consumer packaging materials.3 The collection rates represent average collection rates for
select primary consumer packaging, which is the percentage of our packaging that was collected for recycling (or refill).
Recognized by CDP as a 2021 Supplier Engagement leader for the third year in a row
RECOGNITION
The Coca-Cola Company applies the recommendations of the Task Force on Climate-related Financial Disclosures (TCFD) in this report and in a TCFD Index and provides comprehensive disclosures to CDP on Climate Change.providing climate
data to CDP in 2021 compared to 2020
3XTHE NUMBER OF SUPPLIERS

The Coca-Cola Company 2021 Business & ESG Report 8
CEO Message AgriculturePortfolio Data AppendixOur Company PeoplePackaging FrameworksWater OperationsClimateExecutive Summary
Read more Sustainable Agriculture
Sustainable AgricultureWe rely on agricultural ingredients to make and package our beverages. Ensuring these ingredients are sustainably sourced is a key priority for us, essential to our efforts on climate resilience, water security, human rights, sustainable packaging and economic empowerment. As climate change leads to more extreme weather and increased water stress, more sustainable agricultural practices will play a vital role in promoting resilience across our supply chain and in the communities that produce our agricultural ingredients.
We track progress against our sustainable sourcing goal for 12 global priority ingredients: cane sugar, mango, grape, orange, apple, corn, lemon, beet sugar, tea, pulp and paper, coffee and soybean.
Our Principles for Sustainable Agriculture (PSA) advance and standardize our core values at the farm level—from small-scale farmer cooperatives to large commercial operations—supporting livelihoods and helping to ensure continuity of supply. Introduced in 2021 to improve upon our previous Sustainable Agriculture Guiding Principles (SAGP), the PSA aim to strengthen our progress toward sustainable sourcing of agricultural ingredients.
We are currently in the process of mapping the volume of the 12 global priority ingredients we procure against the PSA framework.
Human RightsThe Coca-Cola Company’s policies and practices are aligned with the UN Guiding Principles on Business and Human Rights, which we have supported since their inception in 2011. We work to embed respect for human rights across our system through a comprehensive framework of policies, stakeholder engagement, due diligence and remediation.
We maintain an industry-leading global audit program of our own operations, as well as those of our bottling partners and Tier 1 suppliers, with over 38,000 human rights assessments conducted since 2003. As of the end of 2021, 95% of our own operations, 93% of system bottlers and 92% of our Tier 1 suppliers complied with our rigorous Supplier Guiding Principles (SGP) protocols. These audit results are reviewed by the ESG and Public Policy Committee of our Board of Directors on an annual basis.
Despite falling short of our ambitious goals due to the impact of COVID-19, these results show remarkable improvement across our value chain. We will continue to advance our human rights strategy and work.
1 Data is based on supplier reporting according to our requirements, which is consolidated and internally validated. Results can fluctuate due to changes in volumes and sourcing origins while we get new suppliers on board with our requirements.
2 This bar graph shows progress towards total sustainable sourcing of all 12 global priority ingredients, combined, using third-party validation programs approved under our PSA, effective 2021, alongside progress against our previous SAGP, effective 2013-2020. The company is working to finalize our benchmarking of third-party validation against the PSA standard, including verifications accepted under the SAGP but for which benchmarking continues in 2022.
13
19
20
2158%
61%
56%
54%
8%
Sustainable Agriculture Guiding Principles (SAGP)Principles for Sustainable Agriculture (PSA)
Progress toward our sustainable sourcing goal1, 2
GOAL
100%18
19
20
21 93%
90%
92%
89%
Percentage of bottling partners that achieved compliance with our Supplier Guiding Principles 2021 GOAL
98%
18
19
20
21 92%
87%
91%
89%
Percentage of direct suppliers that achieved compliance with our Supplier Guiding Principles 2021 GOAL
95%
18
19
20
21 95%
93%
93%
96%
Percentage of company operations that achieved compliance with our Supplier Guiding Principles 2021 GOAL
98%
across 115+ countries and territories against the PSA framework
EVALUATED MORE THAN
500 SUPPLIERS Read more Human Rights
See our Human Rights 2022 Overview for comprehensive disclosures of our human rights policies, governance, due diligence, access to remedy and grievance mechanisms.
conducted in 2021
2,848 AUDITS
The Coca-Cola Company 2021 Business & ESG Report 9
CEO Message AgriculturePortfolio Data AppendixOur Company PeoplePackaging FrameworksWater OperationsClimateExecutive Summary
Diversity, Equity & InclusionWe believe that a diverse, equitable and inclusive workplace makes us stronger as a company, enables us to create a better shared future for employees and communities, empowers access to equal opportunity, and builds belonging in our workplaces and in society. In 2021, we refreshed our Diversity, Equity & Inclusion (DEI) strategy to expand the global reach and impact of our programs and policies while driving accountability.
• Included in the Bloomberg 2021 Gender-Equality Index as a company committed to supporting gender equality through policy development, representation and transparency
• Recognized by Disability Equality Index as one of the Best Places to Work for Disability Inclusion
RECOGNITION
Read more Diversity, Equity & Inclusion 2 This percentage was calculated excluding Bottling Investments Group.
1 Data as of December 31, 2021, for salaried and hourly employees. People of color is for U.S. workforce only. This data excludes Bottling Investments Group (BIG), Global Ventures and CHI, as well as newly acquired entities fairlife and BODYARMOR.
Read more Giving Back
STOPPING THE SPREAD OF COVID-19In 2021, our contributions included the creation of a $20 million fund to help stop the spread of COVID-19. Grants included $5 million in funding to Project Last Mile to support vaccine rollouts in eight African countries.
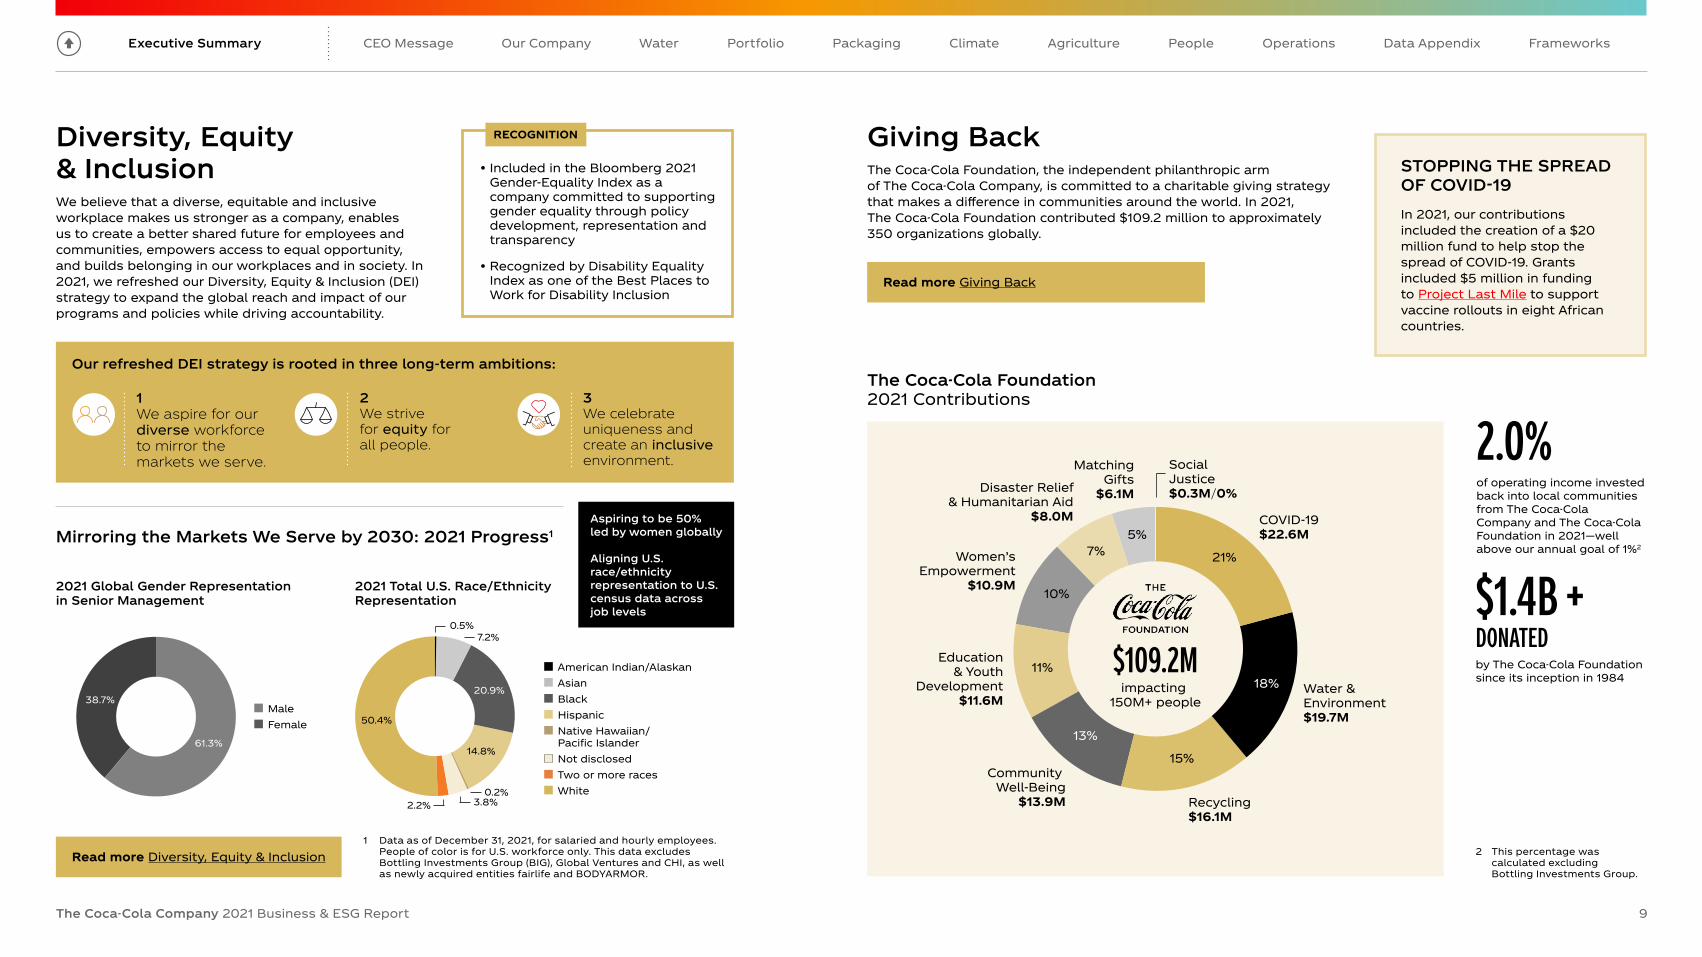
Giving BackThe Coca-Cola Foundation, the independent philanthropic arm of The Coca-Cola Company, is committed to a charitable giving strategy that makes a difference in communities around the world. In 2021, The Coca-Cola Foundation contributed $109.2 million to approximately 350 organizations globally.
21%
15%
11%
10%
7%5%
18%
13%
COVID-19$22.6M
Social Justice$0.3M/0%
Water & Environment$19.7M
Community Well-Being
$13.9M
Education& Youth
Development$11.6M
Women’sEmpowerment
$10.9M
Disaster Relief& Humanitarian Aid
$8.0M
MatchingGifts
$6.1M
Recycling$16.1M
$109.2Mimpacting
150M+ people
$1.4B+DONATEDby The Coca-Cola Foundation since its inception in 1984
2.0%of operating income invested back into local communities from The Coca-Cola Company and The Coca-Cola Foundation in 2021—well above our annual goal of 1%2
The Coca-Cola Foundation2021 Contributions
2021 Global Gender Representation in Senior Management
61.3%
38.7% Male Female
20.9%
50.4%
14.8%
0.2%
7.2%
2.2%
0.5%
3.8%
American Indian/Alaskan Asian Black Hispanic Native Hawaiian/ Pacific Islander
Not disclosed Two or more races White
2021 Total U.S. Race/Ethnicity Representation
Mirroring the Markets We Serve by 2030: 2021 Progress1Aspiring to be 50% led by women globally
Aligning U.S. race/ethnicity representation to U.S. census data across job levels
Our refreshed DEI strategy is rooted in three long-term ambitions:
1We aspire for our diverse workforce to mirror the markets we serve.
2We strive for equity for all people.
3We celebrate uniqueness and create an inclusive environment.

Executive Summary
The Coca-Cola Company 2021 Business & ESG Report 10
CEO Message AgriculturePortfolio Data AppendixPeoplePackaging FrameworksWater OperationsClimateOur Company
At a Glance Innovation Collective Action Governance & Management Priority ESG Issues Stakeholder Engagement & PartnershipsOur BeveragesFinancial HighlightsHow We Operate
At a Glance
23%Asia Pacific
27%Latin America
29%Europe, Middle East & Africa
3%Global Ventures
18%North America
$256.1BMarket Capitalization
(As of 12/31/2021)
$38.7BNet Operating Revenues
(2021, as reported)
Performance Retail Value 2021 Global Unit Case Volume by Operating Segment Volume Growth
136 YEARSof refreshing the world and
making a difference
ATLANTA, GEORGIAGlobal
headquarters
~225Bottling partners
worldwide
~900Bottling plants
~30MRetail customer
outlets
700K+Employed by the company
and bottling partners
~200Master brands
200+Countries and territories where
our products are sold
Company Facts The Coca-Cola System Our Sustainability Business Priorities
World Without Waste
Water Leadership
Reducing Added Sugar
Climate People & Communities
Sustainable Agriculture
Emerging & OtherNutrition, Juice,
Dairy & Plant
Hydration,Sports,
Coffee & Tea
SparklingFlavors
Trademark Coca-Cola
Total Company Unit Cases(in billions)
12
27.7
13
28.2
14
28.6
15
29.2
16
29.3
17
29.2
18
29.6
19
30.3
20
29.0
21
31.3

Executive Summary
The Coca-Cola Company 2021 Business & ESG Report 11
CEO Message AgriculturePortfolio Data AppendixPeoplePackaging FrameworksWater OperationsClimateOur Company
At a Glance
How We OperateThe Coca-Cola Company markets, manufactures and sells:• Beverage concentrates and syrups• Finished beverages (including
sparkling soft drinks; hydration, sports, coffee & tea; nutrition, juice, dairy & plant-based beverages; and emerging beverages).
In our concentrate operations, The Coca-Cola Company typically generates net operating revenues by selling concentrates and syrups to authorized bottling partners.
Our bottling partners combine the concentrates and syrups with still or sparkling water and sweeteners (depending on the product), to prepare, package, sell and distribute finished beverages.
Our finished product operations consist primarily of company-owned bottling, sales and distribution operations.
We also operate retail outlets through Costa Limited, which has nearly 4,000 Costa coffee shops and over 13,000 Costa Express self-serve coffee bars worldwide. Costa's portfolio also includes at-home coffee solutions.
1 The Coca-Cola Company and its bottling partners are collectively known as the Coca-Cola system. The Coca-Cola Company does not own, manage or control most local bottling companies.
The Coca-Cola System1
CUSTOMERS & CONSUMERS
BOTTLERS
DISTRIBUTION
2.1B SERVINGS A DAY
INNOVATION, CREATION & MARKETING
COMPANYTHE
Concentrates and Syrups
Finished Products
~225bottling partners
worldwide
~900bottling plants
worldwide
Innovation Collective Action Governance & Management Priority ESG Issues Stakeholder Engagement & PartnershipsOur BeveragesFinancial HighlightsHow We Operate

Executive Summary
The Coca-Cola Company 2021 Business & ESG Report 12
CEO Message AgriculturePortfolio Data AppendixPeoplePackaging FrameworksWater OperationsClimateOur Company
Financial Highlights For more Financial Data, see the Data Appendix.
Note: See pages 67 and 68 for reconciliations of non-GAAP financial measures to our results as reported under accounting principles generally accepted in the United States (U.S. GAAP).
(in millions except per share data)
1 Reported net operating revenues grew 17%, declined 11% and grew 9% for the years ended December 31, 2021, 2020 and 2019, respectively.
2 Reported operating income grew 15%, declined 11% and grew 10% for the years ended December 31, 2021, 2020 and 2019, respectively.
3 Reported diluted net income per share grew 26%, declined 13% and grew 38% for the years ended December 31, 2021, 2020 and 2019, respectively.
4 Adjusted free cash flow conversion ratio = free cash flow adjusted for pension contributions divided by net income adjusted for noncash items impacting comparability.
Summary of OperationsNet operating revenues $ 38,655 $ 33,014 $ 37,266Operating income 10,308 8,997 10,086Net income attributable to shareowners of The Coca-Cola Company 9,771 7,747 8,920
Per Share DataBasic net income $ 2.26 $ 1.80 $ 2.09Diluted net income 2.25 1.79 2.07Cash dividends 1.68 1.64 1.60
Balance Sheet DataTotal assets $ 94,354 $ 87,296 $ 86,381Long-term debt 38,116 40,125 27,516
201920202021
19
20
21
(9%)
6%
16%
Organic Revenue Growth (Non-GAAP)1
19
20
21
0%
13%
16%16%12%
Comparable Currency Neutral Operating Income Growth (Non-GAAP)2
19
20
21 17%
(2%)
9%
Comparable Currency Neutral Diluted Net Income Per Share Growth (Non-GAAP)3
Adjusted Free Cash Flow Conversion Ratio (Non-GAAP)4
108%
96%19
20
21 116%
Innovation Collective Action Governance & Management Priority ESG Issues Stakeholder Engagement & PartnershipsOur BeveragesFinancial HighlightsHow We OperateAt a Glance

Executive Summary
The Coca-Cola Company 2021 Business & ESG Report 13
Human RightsOverview Diversity, Equity & InclusionEconomic Empowerment Giving BackSafety & Health
CEO Message AgriculturePortfolio Data AppendixPeoplePackaging FrameworksWater OperationsClimateOur Company
Building a Total Beverage CompanyWe’ve established a portfolio of drinks that are best positioned to grow in a fast-changing marketplace. As part of our networked, global organization, we are continuing to curate and innovate a tailored collection of global, regional and local brands that are organized within the following five categories.
Innovation Collective Action Governance & Management Priority ESG Issues Stakeholder Engagement & PartnershipsOur BeveragesFinancial HighlightsHow We OperateAt a Glance
Trademark Coca-Cola
Sparkling Flavors
Emerging Beverages
Nutrition, Juice, Dairy & Plant-Based Beverages
Hydration, Sports, Coffee & Tea

Executive Summary
14
Human RightsOverview Diversity, Equity & InclusionEconomic Empowerment Giving BackSafety & Health
CEO Message AgriculturePortfolio Data AppendixPeoplePackaging FrameworksWater OperationsClimateOur Company
The Coca-Cola Company 2021 Business & ESG Report
Accelerating Innovation Across Our PortfolioThe consumer remains at the heart of everything we do as we provide drinks for every occasion. New innovations, such as the products shown here, are designed with scalability in mind to have staying power across markets and to support our growth.
Sparkling Flavors“What The Fanta” Mystery FlavorIn Europe in 2021, we brought back our “What The Fanta” campaign for a second year, featuring a “mystery” blue, zero-sugar flavor. To find out the flavor, customers could scan the QR code on-pack to unlock a series of online clues. The previous year, a campaign for a "mystery" green flavor drove five times the rate of sales as traditional Fanta Orange during the same period.
Trademark Coca-ColaNew Coca-Cola Zero SugarOur newly reformulated recipe for Coca-Cola Zero Sugar provides a more refreshing and delicious taste with no changes to ingredients or nutritional values. The new recipe hit store shelves in the United States and Canada in the summer of 2021.
Nutrition, Juice, Dairy & Plant-Based Beveragesfairlife Nutrition Plan Shakefairlife Nutrition Plan is an ultra-filtered milk nutrition shake with 30 grams of high-quality protein, 2 grams of sugar and 150 calories. In 2022, fairlife announced that it surpassed $1 billion in annual retail sales.
Emerging BeveragesTopo Chico Hard SeltzerTopo Chico Hard Seltzer blends sparkling water and natural flavors and is inspired by Topo Chico sparkling mineral water’s 125-year heritage and growing popularity as a craft cocktail mixer. Four flavors—Tangy Lemon Lime, Exotic Pineapple, Strawberry Guava and Tropical Mango—are offered in variety packs, and select flavors are offered in single-serve slim cans.
Hydration, Sports, Coffee & TeaBODYARMORIn 2021, we acquired full ownership of BODYARMOR, a line of sports performance and hydration beverages that has significant potential for long-term growth. In 2021, BODYARMOR launched BODYARMOR Edge, which combines the hydration of a sports drink with a boost of natural caffeine.
Innovation Collective Action Governance & Management Priority ESG Issues Stakeholder Engagement & PartnershipsOur BeveragesFinancial HighlightsHow We OperateAt a Glance
Executive Summary
The Coca-Cola Company 2021 Business & ESG Report 15
CEO Message AgriculturePortfolio Data AppendixPeoplePackaging FrameworksWater OperationsClimateOur Company
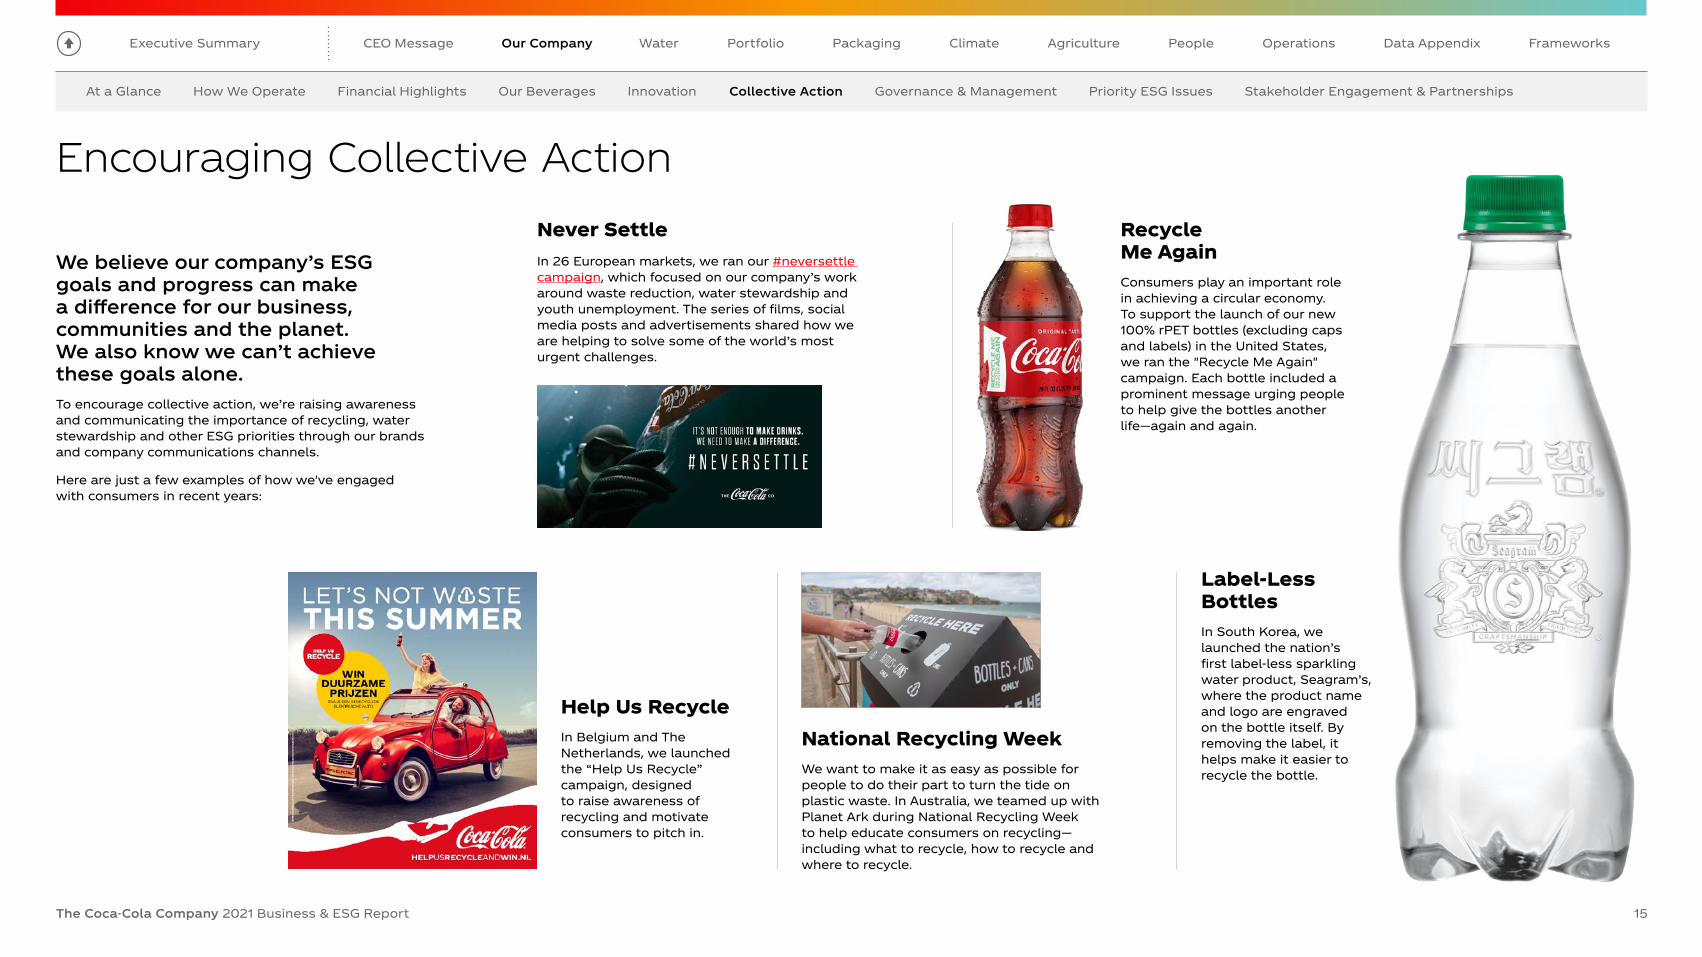
Never SettleIn 26 European markets, we ran our #neversettle campaign, which focused on our company’s work around waste reduction, water stewardship and youth unemployment. The series of films, social media posts and advertisements shared how we are helping to solve some of the world’s most urgent challenges.
Help Us RecycleIn Belgium and The Netherlands, we launched the “Help Us Recycle” campaign, designed to raise awareness of recycling and motivate consumers to pitch in.
Recycle Me AgainConsumers play an important role in achieving a circular economy. To support the launch of our new 100% rPET bottles (excluding caps and labels) in the United States, we ran the "Recycle Me Again" campaign. Each bottle included a prominent message urging people to help give the bottles another life—again and again.
National Recycling WeekWe want to make it as easy as possible for people to do their part to turn the tide on plastic waste. In Australia, we teamed up with Planet Ark during National Recycling Week to help educate consumers on recycling—including what to recycle, how to recycle and where to recycle.
Encouraging Collective Action
We believe our company’s ESG goals and progress can make a difference for our business, communities and the planet. We also know we can’t achieve these goals alone. To encourage collective action, we’re raising awareness and communicating the importance of recycling, water stewardship and other ESG priorities through our brands and company communications channels.
Here are just a few examples of how we've engaged with consumers in recent years:
Label-Less Bottles In South Korea, we launched the nation’s first label-less sparkling water product, Seagram’s, where the product name and logo are engraved on the bottle itself. By removing the label, it helps make it easier to recycle the bottle.
Innovation Collective Action Governance & Management Priority ESG Issues Stakeholder Engagement & PartnershipsOur BeveragesFinancial HighlightsHow We OperateAt a Glance

Executive Summary
The Coca-Cola Company 2021 Business & ESG Report 16
Human RightsOverview Diversity, Equity & InclusionEconomic Empowerment Giving BackSafety & Health
CEO Message AgriculturePortfolio Data AppendixPeoplePackaging FrameworksWater OperationsClimateOur Company
Corporate GovernanceAt The Coca-Cola Company, our business principles and practices are designed to foster an innovative and collaborative culture—a culture that is committed to ethical behavior, accountability and transparency. The company’s Board of Directors has established several committees to assist in discharging its governance duties. These are an Audit Committee, a Talent and Compensation Committee, a Committee on Directors and Corporate Governance, a Finance Committee, an ESG and Public Policy Committee and an Executive Committee. The charter for each committee can be viewed on our website, along with information about the company’s corporate governance, including our Code of Business Conduct, Corporate Governance Guidelines, Certificate of Incorporation and Corporate By-laws. For more information or to contact us, visit our website.
ESG GovernanceThe ESG and Public Policy Committee assists the Board in overseeing the company’s policies and programs—and related risks to the company—that concern environmental, social, legislative, regulatory and public policy matters, including progress against the company’s ESG goals. The Committee’s scope includes public issues of significance that may affect the company’s business, our shareowners, the broader stakeholder community or the general public. This entails evaluating and reviewing information pertaining to social, political and environmental trends, in addition to oversight of the company’s ESG goals and human rights practices.
In addition to its previously stated responsibilities, the ESG and Public Policy Committee of our Board of Directors oversees and reviews, at least annually, the company’s public policy agenda, its position on significant public policy matters, political contributions,
and lobbying activities. The Committee reviews shareowner proposals on issues within its purview and makes recommendations on the proposals to the Board. In addition, the Committee receives updates on priority ESG issues, including information on actions and progress toward goals. Annually, the Committee conducts a self-evaluation, which it presents to the full Board.
The ESG and Public Policy Committee also bears the highest level of direct responsibility for climate-related issues. For a deeper dive into our climate governance, visit the Climate section.
Additionally, the company’s Talent and Compensation Committee oversees human capital management policies and strategies across the company, including talent management, leadership and company culture initiatives such as those promoting diversity, equity and inclusion. This senior-level commitment and alignment drives top-down accountability toward our goals for diversity, equity and inclusion (DEI) and helps support a positive company culture.
Embedding ESG into Executive CompensationIn 2022, the Talent and Compensation Committee approved plans to link ESG performance measures to our annual and long-term incentive programs for executives. In the Annual Incentive program, we are reinforcing our commitment to DEI by incorporating demonstrable commitments by executives to reach goals that reflect our 2030 aspirations to be 50% led by women globally, and, in the United States, to align race and ethnicity representation to U.S. census data. Similarly, in the long-term incentive program, predetermined goals related to the company’s World Without Waste packaging strategy and its 2030 Water Security Strategy have been incorporated into the 2022-2024 incentive awards.
Our Approach to DisclosureWe have a comprehensive reporting process that spans many years, and we aim to provide stakeholders with complete, transparent and candid information in all our public communications. This is our fourth annual Business & ESG Report, which combines financial data and sustainability progress and performance in one publication. We also respond to the CDP climate, water and forests questionnaires and make those disclosures publicly available. For our 2021 report, we continue to expand our disclosure, including on public policy, sweetener research, and DEI issues.
We recognize there is a desire for standardization across reporting frameworks, and we’re continually evaluating reporting options and listening to stakeholder feedback.
This report is prepared in accordance with the Global Reporting Initiative (GRI) Standards, a globally recognized framework; this is the eleventh year that these principles have informed our reporting process. We provide an index for the Sustainability Accounting Standards Board (SASB) and participate in the SASB Advisory Group. We also index to the Task Force on Climate-related Financial Disclosures, the United Nations Sustainable Development Goals (SDGs), the United Nations Global Compact (UNGC) and the United Nations Guiding Principles Reporting Framework (UNGPRF).
Public Policy & Political Engagement In addition to its previously stated responsibilities, the ESG and Public Policy Committee of our Board of Directors oversees and reviews, at least annually, the company’s public policy agenda, its position on significant public policy matters, political contributions and lobbying activities. In the United States, participation
in the political process provides opportunity for meaningful engagement on public policy, regulatory and legislative matters with potential impact on our business.
In 2021, The Coca-Cola Company suspended contributions to U.S. political candidates. During this time, we strengthened our alignment of government engagement with key issues affecting our business, employees, customers, consumers and shareowners. Building upon equality and inclusion factors we formally incorporated in 2020, we further enhanced our political contributions criteria to ensure consistency with the company’s values. We also increased our disclosures and transparently outlined the non-deductible lobbying amount provided by the company to trade associations and organizations based in the United States in which we have membership. Our participation, contributions and disclosures are routinely reviewed against leading industry standards.
Governance & Management
Read about some of our recent public policy initiatives, particularly around waste reduction and climate change.
Learn about our transparent approach to stakeholder engagement and scientific research.
Innovation Collective Action Governance & Management Priority ESG Issues Stakeholder Engagement & PartnershipsOur BeveragesFinancial HighlightsHow We OperateAt a Glance

Executive Summary
The Coca-Cola Company 2021 Business & ESG Report 17
CEO Message AgriculturePortfolio Data AppendixPeoplePackaging FrameworksWater OperationsClimateOur Company
Our ESG ApproachWe pursue our ESG goals through a concerted effort by The Coca-Cola Company and approximately 225 bottling partners in more than 200 countries and territories. We have robust internal processes and an effective internal control environment that facilitate the identification and management of risks and regular communication with the Board, our Chairman and CEO and internal teams such as the Enterprise Risk Management team, the Risk Steering Committee and the Networked Sustainability team, which includes Technical, Innovation and Supply Chain; Public Affairs, Communications and Sustainability; Global Human Rights; Procurement; Legal; and Finance. Beyond this, our networked teams work with operating units, bottling partners, NGOs, governments, investors and people in communities all around the world to identify risks and progress toward our goals. For more about our approach to risk management and priority issues, see Our Priority ESG Issues.
Executive Leadership Team
Chairman and Chief Executive Officer
Chief Communications, Sustainability and Strategic
Partnerships OfficerChief Technical and Innovation Officer
President and Chief Operating Officer Chief Financial Officer
Advisory Role
Compliance
Legal
FinanceGlobal
Environmental Council
Sustainable Sourcing
CommitteePackaging Core Team
Water Core Team
Climate Core Team
Operating Unit Local ESG Teams
Cross-functional Steering Groups
Networked Corporate Sustainability Team
Public Affairs, Communications &
Sustainability
Technical Innovation & Supply Chain
Global Human Rights Procurement
Audit Committee
Talent and Compensation Committee
ESG & Public Policy Committee
Board of Directors
ESG Governance of The Coca-Cola Company
Risk Steering Committee
ESG Steering Committee
Steering Committees
Innovation Collective Action Governance & Management Priority ESG Issues Stakeholder Engagement & PartnershipsOur BeveragesFinancial HighlightsHow We OperateAt a Glance
Executive Summary
The Coca-Cola Company 2021 Business & ESG Report 18
CEO Message AgriculturePortfolio Data AppendixPeoplePackaging FrameworksWater OperationsClimateOur Company
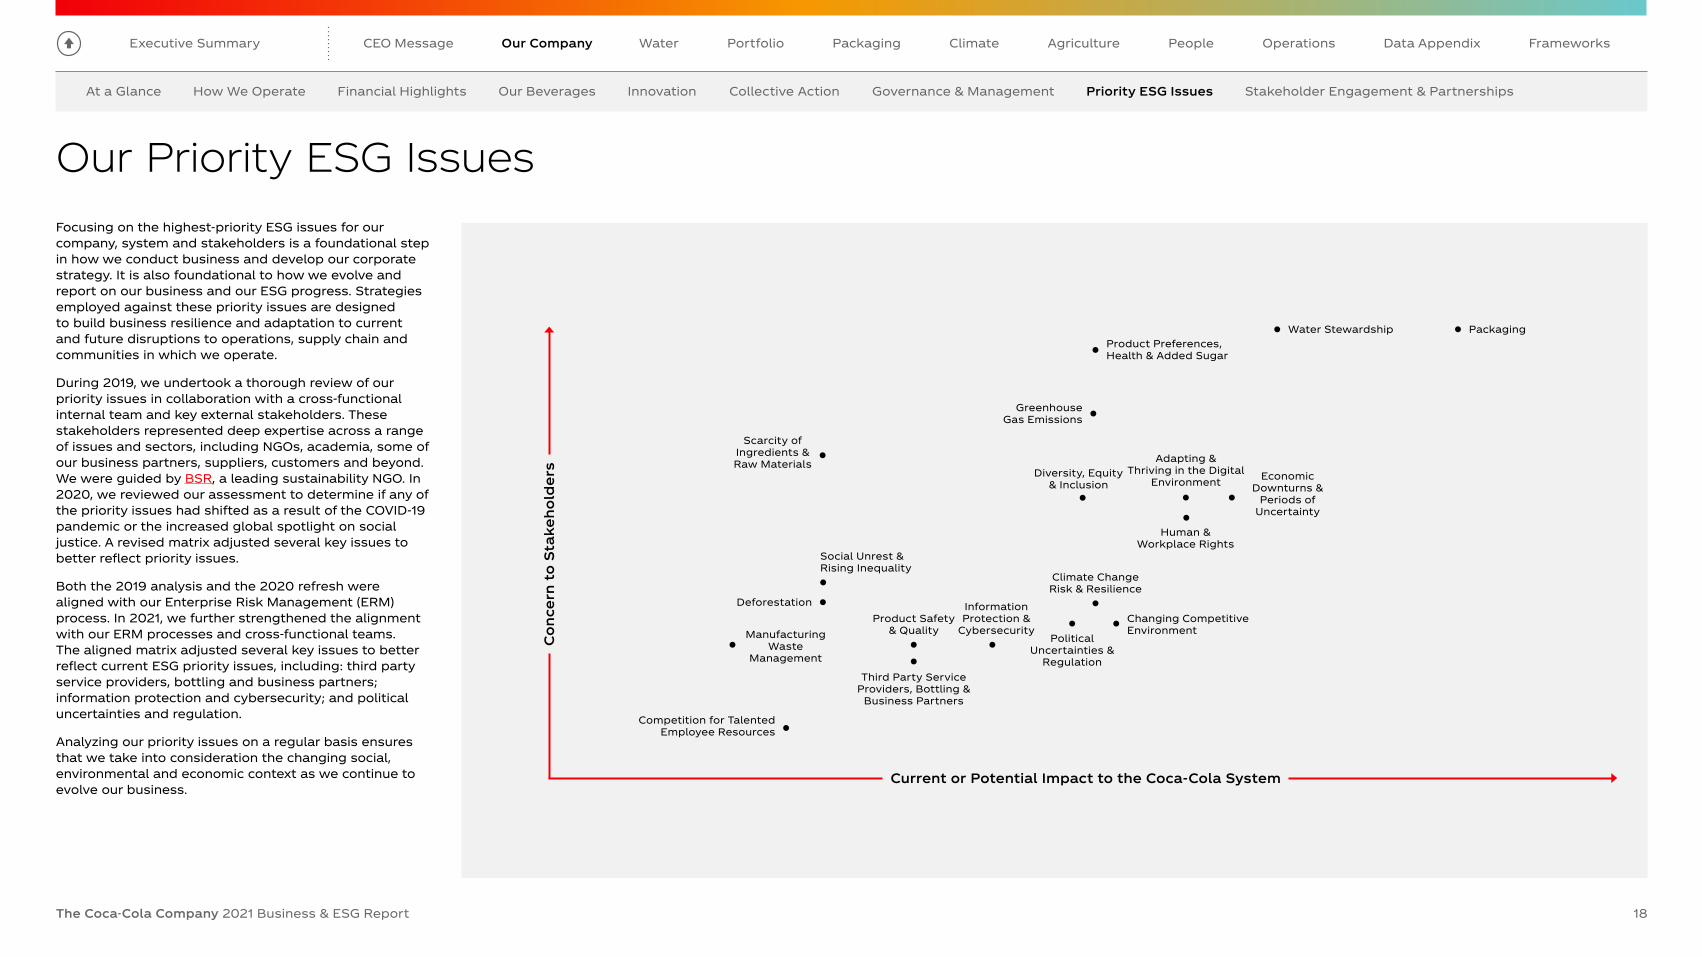
Our Priority ESG IssuesFocusing on the highest-priority ESG issues for our company, system and stakeholders is a foundational step in how we conduct business and develop our corporate strategy. It is also foundational to how we evolve and report on our business and our ESG progress. Strategies employed against these priority issues are designed to build business resilience and adaptation to current and future disruptions to operations, supply chain and communities in which we operate.
During 2019, we undertook a thorough review of our priority issues in collaboration with a cross-functional internal team and key external stakeholders. These stakeholders represented deep expertise across a range of issues and sectors, including NGOs, academia, some of our business partners, suppliers, customers and beyond. We were guided by BSR, a leading sustainability NGO. In 2020, we reviewed our assessment to determine if any of the priority issues had shifted as a result of the COVID-19 pandemic or the increased global spotlight on social justice. A revised matrix adjusted several key issues to better reflect priority issues.
Both the 2019 analysis and the 2020 refresh were aligned with our Enterprise Risk Management (ERM) process. In 2021, we further strengthened the alignment with our ERM processes and cross-functional teams. The aligned matrix adjusted several key issues to better reflect current ESG priority issues, including: third party service providers, bottling and business partners; information protection and cybersecurity; and political uncertainties and regulation.
Analyzing our priority issues on a regular basis ensures that we take into consideration the changing social, environmental and economic context as we continue to evolve our business.
PackagingWater Stewardship
Deforestation
Product Preferences, Health & Added Sugar
Scarcity of Ingredients & Raw Materials
Manufacturing Waste
Management
Competition for TalentedEmployee Resources
Economic Downturns &
Periods of Uncertainty
Climate Change Risk & Resilience
Changing Competitive Environment
Political Uncertainties &
RegulationThird Party Service
Providers, Bottling & Business Partners
Product Safety & Quality
Information Protection &
Cybersecurity
Human & Workplace Rights
Diversity, Equity & Inclusion
Social Unrest & Rising Inequality
Greenhouse Gas Emissions
Con
cern
to
Stak
ehol
der
s
Current or Potential Impact to the Coca-Cola System
Adapting & Thriving in the Digital
Environment
Innovation Collective Action Governance & Management Priority ESG Issues Stakeholder Engagement & PartnershipsOur BeveragesFinancial HighlightsHow We OperateAt a Glance
Executive Summary
The Coca-Cola Company 2021 Business & ESG Report 19
Human RightsOverview Diversity, Equity & InclusionEconomic Empowerment Giving BackSafety & Health
CEO Message AgriculturePortfolio Data AppendixPeoplePackaging FrameworksWater OperationsClimateOur Company
Stakeholder Engagement & Partnerships
Stakeholder EngagementCompanies like ours play an important role in helping to create the systemic change necessary to achieve a healthier planet and a more inclusive and sustainable economy.
Collaboration with a multitude of internal and external stakeholders is essential if we are to achieve our purpose of refreshing the world and making a difference. Meaningful partnerships with governments, business and civil society can drive collective action and build shared opportunities for people and communities around the globe.
As one of the world’s largest and most recognized companies, we have an opportunity to use our size and scale to take on global challenges that require broad collective action, such as fostering excellence in water stewardship, helping eliminate plastic waste and supporting sustainable agriculture. As a global business that operates locally, we can extend our influence and reach because of the strength of the Coca-Cola system, which includes bottling partners in hundreds of communities worldwide.
Transparency and accountability are fundamental elements of our stakeholder engagement approach. We recently added new disclosures on our website to provide an expanded, holistic overview of our stakeholder engagement and scientific research, including details of the journal articles we have authored or funded dating to 2008 in areas such as low- and no-calorie sweetener innovation, hydration, safety and sustainability. Learn more.
We engage with stakeholders through a variety of means. Their insights and feedback are critical to our work and are integrated into our strategy across business and ESG goals.
Learn about our approach to public policy.
PartnershipsPartnerships are an important part of our work to advance ESG goals, in part because many of our goals cannot be achieved on our own. We must join forces with others to address some of the world’s biggest challenges.
We have formed partnerships with a range of incredible organizations that are making a difference in areas such as sustainable agriculture, water replenishment and sustainable packaging. Here are some of them:
• For more than a decade, we have partnered with the World Wildlife Fund to improve the health of freshwater basins. In August 2021, we renewed our partnership for three more years.
• WASH4Work mobilizes business to improve access to water, sanitation and hygiene (WASH) in the workplace, in communities and across supply chains. We are aligning with the WASH4Work framework as part of our 2030 Water Security Strategy.
• The investment management firm Circulate Capital incubates and finances companies and infrastructure that prevent the flow of plastic waste into the world’s oceans and advance the circular economy. In 2021, Circulate Capital announced a $4 million investment in the Inter-American Development Bank (IDB) Group’s innovation lab to support startups in Latin America and the Caribbean.
• We’re partnering with TerraCycle and Burger King® in the United States, the United Kingdom, France and Japan to reduce single-use packaging waste by offering reusable cups and food containers.
• The Sustainable Agriculture Initiative Platform (SAI Platform) promotes widespread adoption of sustainable agriculture practices. In 2021, our partnership with SAI Platform led to a significant jump in the percentage of sustainably sourced oranges from Florida groves.
• The Ocean Cleanup has developed Interceptor™ solutions to stop new plastic from entering the world’s oceans through rivers. We’re partnering with them to place Interceptor solutions in 15 priority rivers.
To showcase our work and partnerships across a variety of ESG areas, the company held an ESG investor event in 2021, where members of our executive leadership shared progress on the company’s ESG strategy and goals, and how they come to life in the regions.
Project Last Mile is a pioneering, cross-sector partnership to help life-saving medicines—including COVID-19 vaccines—go the last mile in Africa.
Innovation Collective Action Governance & Management Priority ESG Issues Stakeholder Engagement & PartnershipsOur BeveragesFinancial HighlightsHow We OperateAt a Glance

Executive Summary
The Coca-Cola Company 2021 Business & ESG Report 20
CEO Message AgriculturePortfolio Data AppendixOur Company PeoplePackaging FrameworksWater OperationsClimate
Addressing climate change and eliminating plastic waste are two of our highest priority ESG issues. Although we are taking action within our own operations and across our value chain, these global challenges are far too great for any single company, industry or government to solve on its own. In response, we are using our influence to drive meaningful policy changes in partnership with peer companies, civil society and all levels of government.
Climate ActionIn April 2021, The Coca-Cola Company supported coalitions led by We Mean Business and Ceres in the United States, and by European Parliamentary Environment Committee Chair Pascal Canfin. These coalitions called on the Biden Administration to set an ambitious science-based greenhouse gas (GHG) emissions reduction target for the United States. The response was to establish a target ahead of the COP26 summit, which brings the United States to a position of global climate leadership.
Recognizing our climate advocacy in the United States, in July 2021, Ceres released its report “Practicing Responsible Policy Engagement: How Large U.S. Companies Lobby on Climate Change.” The report highlighted that The Coca-Cola Company “has disclosed its engagements to evolve the (U.S.) Chamber’s climate change positions and lobbying." The report also noted that we sent a letter encouraging the U.S. Chamber of Commerce to embrace the Business Roundtable’s principles and policies on climate change.
In the European context, in support of the EU’s Green Deal and Farm-to-Fork strategy, in 2021 we signed up to the EU Code of Conduct on Responsible Food Business and Marketing Practices. This advocacy stance complements our climate actions in collaboration with our two major bottling partners in Europe.
Recycling and Reuse of PlasticThe role of government regulation in creating a circular economy for our packaging materials is essential to ensure that societies can move from a linear to a circular operating model—one where materials stay in the economy for reuse and recycling and out of the environment. To support governments in the evolution toward better recycling outcomes, we work with them as well as with trade associations to provide evidence of the safety and quality of recycled materials, which in turn leads to increased take-up of recycled materials.
In 2021, a number of governments around the world established plastic packaging regulations similar to our
World Without Waste strategy, helping address both the waste challenge and the climate challenge. The regions that established food/beverage grade acceptance standards for recycled plastic content use include Bahrain, Bangladesh, Indonesia, Kuwait, Nigeria, Oman, Qatar, Saudi Arabia and Yemen. The state of California also adopted new recyclability standards. We continue to play an active role in driving for progressive policies that help solve environmental challenges, whether that is direct engagement with regulators on recycled PET usage standards or policy advocacy directly or through trade associations.
Additionally, several regions established minimum recycled content guidelines, including Chile, Ecuador, the European Union, Paraguay, Uruguay, and the United States (California, New Jersey and the state of Washington). Our World Without Waste goals aim for 50% recycled material in all our packages by 2030; regulatory guidelines can help create scale in the supply chain that helps with the economics of recycling and a circular economy.
Along with increasing recycled content, plastic collection is essential to achieving a truly circular economy. In 2020, we added our voice to the Business Call for a UN Plastic Pollution Treaty calling for a legally binding United Nations treaty on plastic pollution. We also continued to work in partnership with WWF, the Ellen MacArthur Foundation and the Ocean Plastic Leadership Network to bring diverse stakeholders together to help shape a long-term treaty. In early 2022, the United Nations agreed to start negotiations to draw up a global treaty.
Aligns with these UN Sustainability Goals
Driving Change Through Public Policy
SPOTLIGHT STORY
READ MORE STORIES 1 2 3 4
“When we work together, we can take meaningful steps to advance a circular economy and reduce waste.”
Bea PerezSenior Vice President and Chief Communications, Sustainability and Strategic Partnerships Officer, The Coca-Cola Company

Executive Summary
The Coca-Cola Company 2021 Business & ESG Report
CEO Message AgriculturePortfolio Data AppendixOur Company PeoplePackaging FrameworksOperationsClimateWater
WaterLeadershipWater is essential to every person and every ecosystem in the world; it is also essential to the products we make and the agricultural ingredients we use.
Our 2030 Water Security Strategy focuses on increasing water security through a context-based approach to water replenishment, advocacy for smart water policies and responsible water use across our operations and supply chain. We’re using the size and scale of our company to improve water security where water risks impact our business, supply chain and communities.
21
167%of the water used in our finished beverages returned to nature and communities in 20211
18.5M+people provided access to safe drinking water, sanitation and hygiene since 20102
1 Peer-reviewed methodologies were used to calculate volumetric benefits per project and operating unit; calculated benefits per project and operating unit using peer-reviewed methodologies; all replenish data are internally validated and verified; the equivalent volume for 100% Replenish rate (175 Billion Liters; BL) is externally assured; Benefits fall into three categories: Watershed Protection and Restoration (229.1 BL), Water for Productive Use (47.5 BL) and Water Access and Sanitation (16.7 BL). Due to joint venture or merger and acquisition activities between 2019 - 2021, certain brands may not be accounted for in this metric. Unless otherwise stated, in this report finished beverages is based on global sales volume.
2 Calculated with self-reported and internally validated data.

Executive Summary
The Coca-Cola Company 2021 Business & ESG Report 22
CEO Message AgriculturePortfolio Data AppendixOur Company PeoplePackaging FrameworksOperationsClimateWater
Prioritization Framework: Operations, Communities and Watersheds In 2020 and 2021, we analyzed water-related risks to identify priority operating facilities, which allows us to segment our operations into three categories: Leadership Locations, Advanced Efficiency Locations and Contributing Locations. We catalogued these locations based on the detailed mapping and results from an Enterprise Water Risk Assessment (EWRA) from the World Resources Institute’s Aqueduct 3.0 tool and from Facility Water Vulnerability Assessments (FAWVA), our site-level, internal proprietary tool.
The categories are defined as:
1. LEADERSHIP LOCATIONS: our highest priority system facility locations and their correlated watersheds that have the highest potential water-related risks. Facilities are on a path toward 100% regenerative water use by 2030. See next page for more on regenerative water use.
2. ADVANCED EFFICIENCY LOCATIONS: system facility locations in a water-stressed2 context that will drive advanced water efficiency improvements in operations.
3. CONTRIBUTING LOCATIONS: system facility locations in areas with potential low water-related risks yet will contribute to water security overall by meeting 100% compliance with global Coca-Cola Company water stewardship requirements.
We are mapping priority ingredient sourcing regions and watersheds according to highest exposure to water stress. We also began mapping priority communities based on local context to identify opportunities for action to strengthen communities’ access to water, sanitation and hygiene (WASH) and their resilience to climate change (e.g., floods and droughts). By mapping and overlaying all three of these categories (operations, watersheds and communities), we will identify overlaps and interconnectivity across our action areas to develop a holistic, integrated and context-based approach.
Our Water Security Strategy
Our 2030 Water Security Strategy outlines a vision of increasing water security for our operations, watersheds and communities. Water security is defined as the availability of a sufficient quantity and quality of water, access to safe water services and effective governance of shared water resources. It is underpinned by global goals and specific context-based targets that will enable us to measure our progress toward reaching this vision.
Our global goals for 2030 fall under three pillars with one cross-cutting goal, maintaining at least 100% global replenishment of the water used in our finished beverages:
1 Our Operations2 Our Communities3 Our Watersheds
2030 Water Security Strategy Overview
2030 WATER VISION
Increase water security where we operate, source ingredients and touch people’s lives by improving water availability, quality, access and governance.
OUR OPERATIONS OUR COMMUNITIES OUR WATERSHEDS
Desired Outcome
High-Level Targets
Global Goals
Reduced shared water challenges Enhanced community water resilience Improved watershed health
• 100% regenerative water use in all leadership locations
• Drive advanced water efficiency improvements in water-stressed contexts1
• 100% compliance with global Coca-Cola Company water stewardship requirements
• Promote access to WASH (water, sanitation and hygiene) initiatives in all our priority communities
• Promote access to WASH throughout our bottling system and priority suppliers
• Support community climate adaptation and recovery
• Implement watershed stewardship plans in all of our priority watersheds
• Promote advanced water management practices for our global priority ingredients grown in water-stressed regions
Regenerative water use and advanced efficiency
Access to water and sanitation, and resilience, with a focus on women and girls
Measurable contribution to watershed health
Global Replenishment
Maintain at least 100% global replenishment of the water used in our finished beverages through contextualized interventions for operations, communities and watersheds.
Priority Levers of Change Advocacy and Governance / Collaboration and Collective Action / Transparency and Reporting
1 Subject to context-based validation and target setting
2 Refers to “high” or “extremely high” water stress. Water stress measures the ratio of total water withdrawals to available renewable surface and groundwater supplies.

Executive Summary
The Coca-Cola Company 2021 Business & ESG Report 23
CEO Message AgriculturePortfolio Data AppendixOur Company PeoplePackaging FrameworksOperationsClimateWater
Managing Water Supports Diverse ESG Priorities Water issues intertwine with nearly all of our company’s highest priority ESG issues. Water is the nexus that links individual health and well-being, economic prosperity, environmental health and the empowerment of the most vulnerable in society, including women and girls. Enhanced water management helps our business, supply chain and local communities build resilience to a changing climate. This means improving capacities to withstand, recover from and adapt to the shocks and stressors related to climate change.
Watershed Stewardship
Watershed Stewardship
World Without Waste
CarbonReduction
ClimateResilience
EconomicEmpowerment
HumanRights Total
BeverageCompany
SustainableAgriculture
Health &Safety
Community Crisis
Recovery
Wastewater Treatment
Community WASH Access
& Climate Resilience
Community WASH Access
& Climate Resilience
Community WASH Access
& Climate Resilience
WASH Access in Bottling System & Supply Chain
SustainableAgriculture
SustainableAgriculture
SustainableAgriculture
Replenishment/Nature-based
Solutions
Replenishment/Nature-based
Solutions
Regenerative Water Use
Priority ESG IssuesOuter Circle
Elements of Our 2030 Water Security StrategyInner Circle
Regenerative Water UseFollowing the process to identify and segment our priority operating facilities, we are now setting local, context-based targets1 for these facilities to contribute to the achievement of our 2030 targets for this pillar, which include:
• 100% regenerative water use in all Leadership Locations
• Drive advanced water efficiency improvements in water-stressed contexts.
We will also continue to replenish at least 100% of water used in our finished beverages globally.
All our system production operations around the world will continue to adopt and implement our new Coca-Cola system Water Resource Sustainability Standard, which is aligned with the Alliance for Water Stewardship (AWS) principles.
1 Leadership Locations are to achieve 100% regenerative water use by 2030.
Defining Regenerative Water Use“ Regenerative” is our new integrated metric reflecting the concept of circularity in using water in our operations. By 2030, the Coca-Cola system manufacturing facilities that we designate as high priority (“Leadership Locations”) must reduce, reuse, recycle and replenish the water used in operations in the local correlated watersheds for beneficial social, economic and/or environmental uses by other stakeholders and nature.
Pillar 1 Our Operations
Our Bottling Partner in China Continues to Invest in Water EfficiencyWe have been working with our bottling partner COFCO Coca-Cola Beverages Limited (CBL) to implement water saving initiatives at a manufacturing facility in water-stressed Beijing. CBL has invested in multiple projects including the recovery of water from cleaning and rinsing processes, the redesign of a recovery system for reverse osmosis treatment and using recycled water for the flushing of toilets and cleaning of external areas. These initiatives have resulted in an approximately 2% reduction in water use between December 2020 and December 2021, which is contributing to decreased stress on local freshwater sources and reduced operational costs.
CASE STUDY
1.81 LITERS
20% IMPROVEMENT
We have continued to improve the efficiency of our water use. We now need only
of water used per liter of product produced, a
compared to 2010.

Executive Summary
The Coca-Cola Company 2021 Business & ESG Report 24
CEO Message AgriculturePortfolio Data AppendixOur Company PeoplePackaging FrameworksOperationsClimateWater
Launching a New WASH Program in Latin AmericaIn Latin America, we’re launching a new program, Aliados por el Agua (Allies for Water), across 18 countries that will mobilize collective action to improve critical access to water, sanitation and hygiene in vulnerable and water-stressed communities and key watersheds. The program, which aims to benefit an estimated 2 million people by 2030, will replicate best practices from a program that we have supported for more than a decade in Africa. Aliados is a multi-sector partnership platform bringing together actors from the public and private sectors and civil society, and will be managed by The Global Environment Technology Foundation (GETF).
CASE STUDY
Resilient CommunitiesWe implement a human rights-based approach to water and communities. We recognize the connection between our social license to operate and adequate water infrastructure.
Insufficient access to water, sanitation and hygiene (WASH) infrastructure and poor water quality are key challenges faced in water-stressed communities. Population growth, climate change, political conflict and forced migration are further straining water infrastructure and supply. COVID-19 exacerbated stresses on water systems, highlighting the importance of WASH to enable communities to protect themselves from disease spread.
Over the past decade, The Coca-Cola Company has established strong leadership in community water programs with the support of The Coca-Cola Foundation and many nonprofits, governments, customers and other partners. Together, we have delivered sustainable community water interventions ranging from improving access to WASH to institutional capacity building, benefiting more than 18.5 million people since 2010. In 2021, our WASH projects included:
• Installation of handwashing facilities and water connections for communities in the Philippines to help respond to the ongoing COVID-19 pandemic, benefiting over 200,000 people
• Access to drinking water for more than 130,000 people impacted by flooding and other natural disasters in China in 2021
Our 2030 Water Security Strategy builds on this work, seeking to improve access to water and sanitation and strengthen community resilience. We’re focused on projects that will support and empower women and girls who, in many parts of the world, bear most of the responsibility for fetching water and running households.
As outlined in the Risk Assessments and Prioritization section, we are identifying our priority operational, commercial and sourcing communities. We are using a set of criteria from leading global institutions specializing in water and health. We aim to support all our priority communities in addressing shared water challenges by identifying and implementing interventions focused on three primary action areas:
1. Improving access to safe drinking water, sanitation and hygiene
2. Enabling adaptation to water-related climate change impacts
3. Ensuring rapid recovery from crises.
These actions will contribute to the achievement of our 2030 Water Security Strategy targets:
• Support access to WASH initiatives in all our priority communities
• Promote access to WASH throughout our bottling system and priority suppliers.
WASH Programs Focus on Needs of Women and Girls Clean water is only one piece of the water resilience puzzle. To achieve the greatest health and economic benefits, improvements in sanitation and hygiene must be prioritized alongside access to clean water.
We recognize our business operates in areas with significant challenges to water access and sanitation. This is one reason why sustainable access to water, sanitation and hygiene—particularly for women and girls—is specifically addressed in our 2030 strategy.
We’re collaborating with international organizations and coalitions such as WaterAid and Global Water Challenge to understand and meet the needs of
women and girls and to systemically embed and measure gender-related outcomes of community WASH programs. This work will build on the groundbreaking findings of the 2018 Ripple Effect Study—which quantified the significant impact of WASH improvements on women’s empowerment—and draw on learnings from the successful Replenish Africa Initiative (RAIN) and our 5by20® economic empowerment initiative.
“In communities where water is scarce, women and girls are responsible for the grueling task of collecting water, resulting in missed opportunities for learning, generating income and pursuing a brighter future. We’re proud to work with The Coca-Cola Company to drive change through the power of clean water and to involve women every step of the way to ensure inclusive, long-term solutions to the world’s most pressing problems.”
Kelly ParsonsCEO, WaterAid America
Since 2010, our RAIN initiative has reached more than 6.7 million people in 41 countries and territories in Africa with safe, sustainable access to water, sanitation and hygiene, impacting more than 4,000 communities.
Pillar 2 Our Communities

Executive Summary
The Coca-Cola Company 2021 Business & ESG Report 25
CEO Message AgriculturePortfolio Data AppendixOur Company PeoplePackaging FrameworksOperationsClimateWater
Assessing Watershed Health in CaliforniaA pilot project in the highly water-stressed state of California is just one example of the focus on watershed health in our strategy. Our North American operating unit is partnering with The Nature Conservancy and other nonprofits to establish a watershed health plan for three vulnerable California watersheds that supply water to our system bottling plants and for our agricultural ingredients (particularly almonds and lemons). We developed watershed health scorecards, highlighting the greatest challenges and risks in the prioritized watersheds. The pilot project developed corresponding Watershed Stewardship Plans that identify actions to help improve watershed health and water security for our operations, ingredient sourcing areas and communities. This includes projects such as meadow and forest restoration, invasive species removal, fire management and prevention, and water-use efficiency. These plans will also help us to track improvements in watershed health and co-benefits of projects (e.g. enhanced biodiversity and carbon sequestration).
CASE STUDY
Our Water Footprint Improved agricultural management practices can promote watershed health. Water use within our agriculture supply chain accounts for 92% of our blue water1 footprint. (See the Sustainable Agriculture section for more detail on our work on sustainable sourcing.) Our work to identify priority watersheds and communities includes an assessment of water risks for watersheds where our global priority ingredients are grown.
Healthy WatershedsWatersheds supply water for drinking, agriculture and manufacturing, provide habitat for plants and animals, and offer opportunities for recreation. While watershed protection has been a core element of our work for more than a decade, our new strategy places much greater emphasis on the holistic improvement of watershed health.
As outlined earlier in this section, in 2020, we began analyzing and prioritizing our operational, commercial and ingredient sourcing watersheds.
Over the past year, we have developed a Watershed Health Framework to provide our operations with help to assess watersheds' challenges and risks, and implement context-based Watershed Stewardship Plans. Watershed risks vary from location to location. For some, water availability may be the primary risk; for others, it might be water quality, water access, soil health or forest fires, to name a few. By adopting a context-based approach, we aim to support interventions relevant to our priority watersheds.
This work at the local watershed level will contribute to the achievement of our 2030 high level targets:
• Implement watershed stewardship plans in all of our priority watersheds.
• Promote advanced water management practices for our global priority ingredients grown in water-stressed regions.
DISTRIBUTIONMANUFACTURING COOLING & DISPENSINGPACKAGINGINGREDIENTS
Pillar 3 Our Watersheds
1 Blue water is the volume of surface and groundwater consumed as a result of the production of a good or service (evaporated or embedded in the product). Source: Water Footprint Network.
Sacramento River Basin
Three Priority Watersheds
Central Valley/San Joaquin River
Coca-Cola system bottling facilities
Almond farms
Lemon farms
SouthernCalifornia
CALIFORNIA
NEVADA1
2
3
92% 1% 7%
Blue Water UseSurface and Groundwater

Executive Summary
The Coca-Cola Company 2021 Business & ESG Report 26
CEO Message AgriculturePortfolio Data AppendixOur Company PeoplePackaging FrameworksOperationsClimateWater
RECOGNITION FOR OUR 2030 WATER SECURITY STRATEGYIn 2021, we were proud to earn a place on CDP’s “A List” for the first time for our leadership in corporate transparency and action on water security, joining our bottling partners Swire Coca-Cola Limited, Coca-Cola HBC and Coca-Cola Europacific Partners, which were also recognized with the highest scores. Out of some 13,000 companies, only 118 companies made the 2021 water security “A List.” The vision, ambition and risk-based approach behind our 2030 Water Security Strategy also drew recognition from Ceres in its 2021 Feeding Ourselves Thirsty report that analyzes how large food and beverage companies are managing water risks in their direct operations and supply chains. The Coca-Cola Company was the top scorer out of all 38 companies assessed across four sectors: Agricultural Products, Beverages, Meat and Packaged Foods, with a score of 90 out of 100 possible points.
The Importance of Nature-Based Solutions Infrastructure and construction can help protect vulnerable water systems. But nature itself often offers the best mechanisms for restoring watershed health. We invest in nature-based solutions (NBS), which build on natural processes to manage water systems. To achieve our 2030 vision, we will lean even more heavily into nature-based solutions, such as forest protection and floodplain management.
These types of solutions can provide a wide range of benefits, such as better water quality, carbon sequestration and enhanced biodiversity. Other direct and indirect benefits include water resource improvements, socioeconomic and public health benefits and climate change mitigation.
In 2020 and 2021, we worked to identify and quantify the co-benefits of some of our replenishment projects to help us determine where to support future investments. In Europe, we partnered with denkstatt, an organization that advises businesses on natural and social capital, to develop a methodology to help us quantify the co-benefits of NBS projects. We also worked with The Nature Conservancy to pilot the CEO Water Mandate NBS Tool across more than 10 projects globally to better understand the links between various types of replenishment projects and nature-based solutions, helping to strengthen the business case for investment in these projects.
Collaboration and Collective Action
2030 Water Resources Group, hosted by the World Bank
Alliance for Water Stewardship (AWS)
CEO Water Mandate, a partnership between the UN Global Compact and the Pacific Institute
Global Water Challenge
Science Based Targets Network (SBTN)
The Nature Conservancy
The Water Resilience Coalition, an initiative of the CEO Water Mandate
WASH4Work, an initiative hosted by the CEO Water Mandate
World Wildlife Fund (WWF)
“ The Coca-Cola Company’s ongoing commitment to managing water risks sets an example to the industry on the type of work we need to see more of in corporate America.”Kirsten JamesSenior Program Director, Water, Ceres
Pillar 3 Our Watersheds
WATER GOVERNANCEAddressing water issues is a crucial part of our holistic ESG strategy, which is overseen by the Board of Directors. To reinforce the importance of these issues, certain ESG metrics have been incorporated into executive compensation. See the Governance section for more details.
The shared nature of water resources requires collective action to remediate water challenges. Read more about our approach to stakeholder engagement and partnerships.
Some of our key partnerships are with:
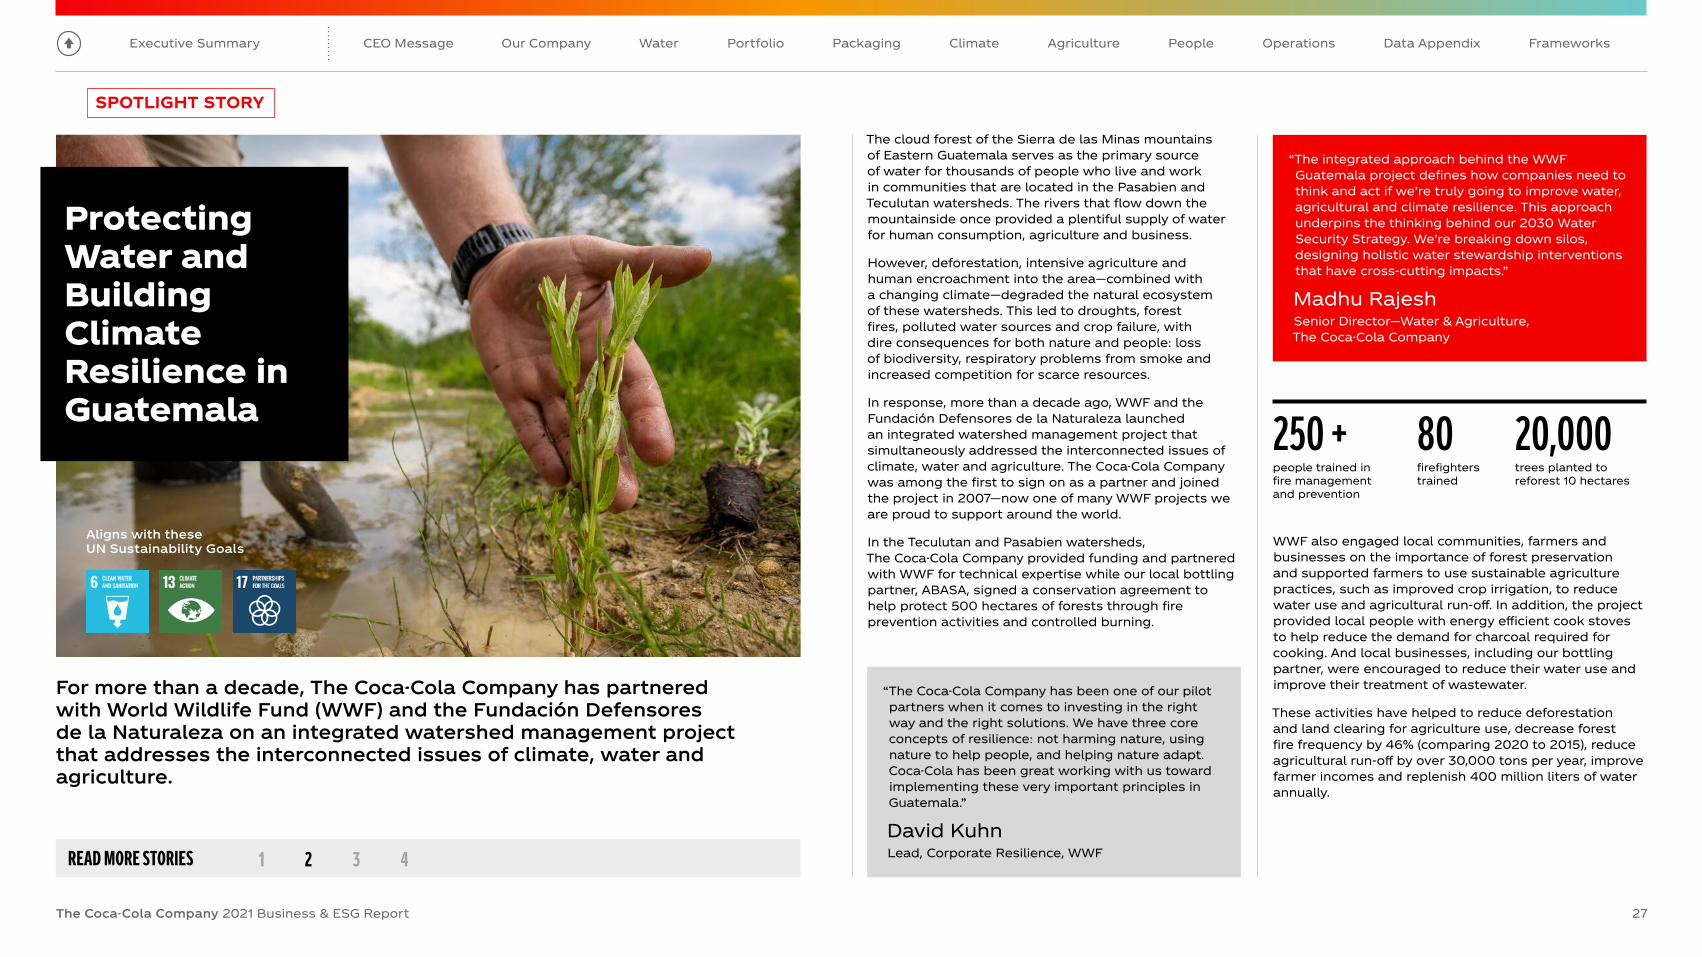
Executive Summary
The Coca-Cola Company 2021 Business & ESG Report 27
CEO Message AgriculturePortfolio Data AppendixOur Company PeoplePackaging FrameworksWater OperationsClimate
“ The integrated approach behind the WWF Guatemala project defines how companies need to think and act if we’re truly going to improve water, agricultural and climate resilience. This approach underpins the thinking behind our 2030 Water Security Strategy. We’re breaking down silos, designing holistic water stewardship interventions that have cross-cutting impacts.”
Madhu RajeshSenior Director—Water & Agriculture, The Coca-Cola Company
For more than a decade, The Coca-Cola Company has partnered with World Wildlife Fund (WWF) and the Fundación Defensores de la Naturaleza on an integrated watershed management project that addresses the interconnected issues of climate, water and agriculture.
The cloud forest of the Sierra de las Minas mountains of Eastern Guatemala serves as the primary source of water for thousands of people who live and work in communities that are located in the Pasabien and Teculutan watersheds. The rivers that flow down the mountainside once provided a plentiful supply of water for human consumption, agriculture and business.
However, deforestation, intensive agriculture and human encroachment into the area—combined with a changing climate—degraded the natural ecosystem of these watersheds. This led to droughts, forest fires, polluted water sources and crop failure, with dire consequences for both nature and people: loss of biodiversity, respiratory problems from smoke and increased competition for scarce resources.
In response, more than a decade ago, WWF and the Fundación Defensores de la Naturaleza launched an integrated watershed management project that simultaneously addressed the interconnected issues of climate, water and agriculture. The Coca-Cola Company was among the first to sign on as a partner and joined the project in 2007—now one of many WWF projects we are proud to support around the world.
In the Teculutan and Pasabien watersheds, The Coca-Cola Company provided funding and partnered with WWF for technical expertise while our local bottling partner, ABASA, signed a conservation agreement to help protect 500 hectares of forests through fire prevention activities and controlled burning.
WWF also engaged local communities, farmers and businesses on the importance of forest preservation and supported farmers to use sustainable agriculture practices, such as improved crop irrigation, to reduce water use and agricultural run-off. In addition, the project provided local people with energy efficient cook stoves to help reduce the demand for charcoal required for cooking. And local businesses, including our bottling partner, were encouraged to reduce their water use and improve their treatment of wastewater.
These activities have helped to reduce deforestation and land clearing for agriculture use, decrease forest fire frequency by 46% (comparing 2020 to 2015), reduce agricultural run-off by over 30,000 tons per year, improve farmer incomes and replenish 400 million liters of water annually.
“ The Coca-Cola Company has been one of our pilot partners when it comes to investing in the right way and the right solutions. We have three core concepts of resilience: not harming nature, using nature to help people, and helping nature adapt. Coca-Cola has been great working with us toward implementing these very important principles in Guatemala.”
David KuhnLead, Corporate Resilience, WWF
Aligns with these UN Sustainability Goals
250+people trained in fire management and prevention
80firefighters trained
20,000trees planted to reforest 10 hectares
Protecting Water and Building Climate Resilience in Guatemala
SPOTLIGHT STORY
READ MORE STORIES 1 2 3 4

Executive Summary
The Coca-Cola Company 2021 Business & ESG Report
CEO Message Agriculture Data AppendixOur Company PeoplePackaging FrameworksWater OperationsClimatePortfolio
28
Our Total Beverage PortfolioOffering More Choices and Reducing Added Sugar
For more than a century, our company has been known for our refreshing beverages—a legacy that began in 1886. Over the decades, we’ve continued to evolve, and today we offer a lineup of beverages across five categories, providing consumers with a wealth of choices—including drinks with less added sugar and beverages with nutrition benefits.
~200 master brands across five categories:
• Trademark Coca-Cola• Sparkling flavors• Hydration, sports,
coffee & tea• Nutrition, juice,
dairy & plant-based beverages
• Emerging beverages
1 This metric is based on the number of products in our beverage portfolio.
2 Low- or no-sugar products have between zero and 5g of added sugar per 100 ml.
Offering a portfolio of drinks for consumers’
beverage needs and preferences throughout
the day, including nutrition and hydration
Giving people the information they need to make informed choices
Continuing to seek opportunities to reduce added sugar across our portfolio, including investments in
sweetener innovation
PROGRESS~38%1 of our
portfolio is low- or no-sugar2
28% of our volume sold in 2021 was low- or no-calorie
Providing smaller package choices so it’s easier for
consumers to control their added sugar intake
PROGRESS~41% of our sparkling
soft drink brands come in smaller packages
Transforming Our Portfolio
Our evolution as a total beverage company
continues as we respond to consumer desires for
more choices across a wider range of categories. We have
streamlined our portfolio, focusing on brands with the
greatest potential to scale and grow.
Keeping the consumer
at the center, responding to
evolving needs and preferences
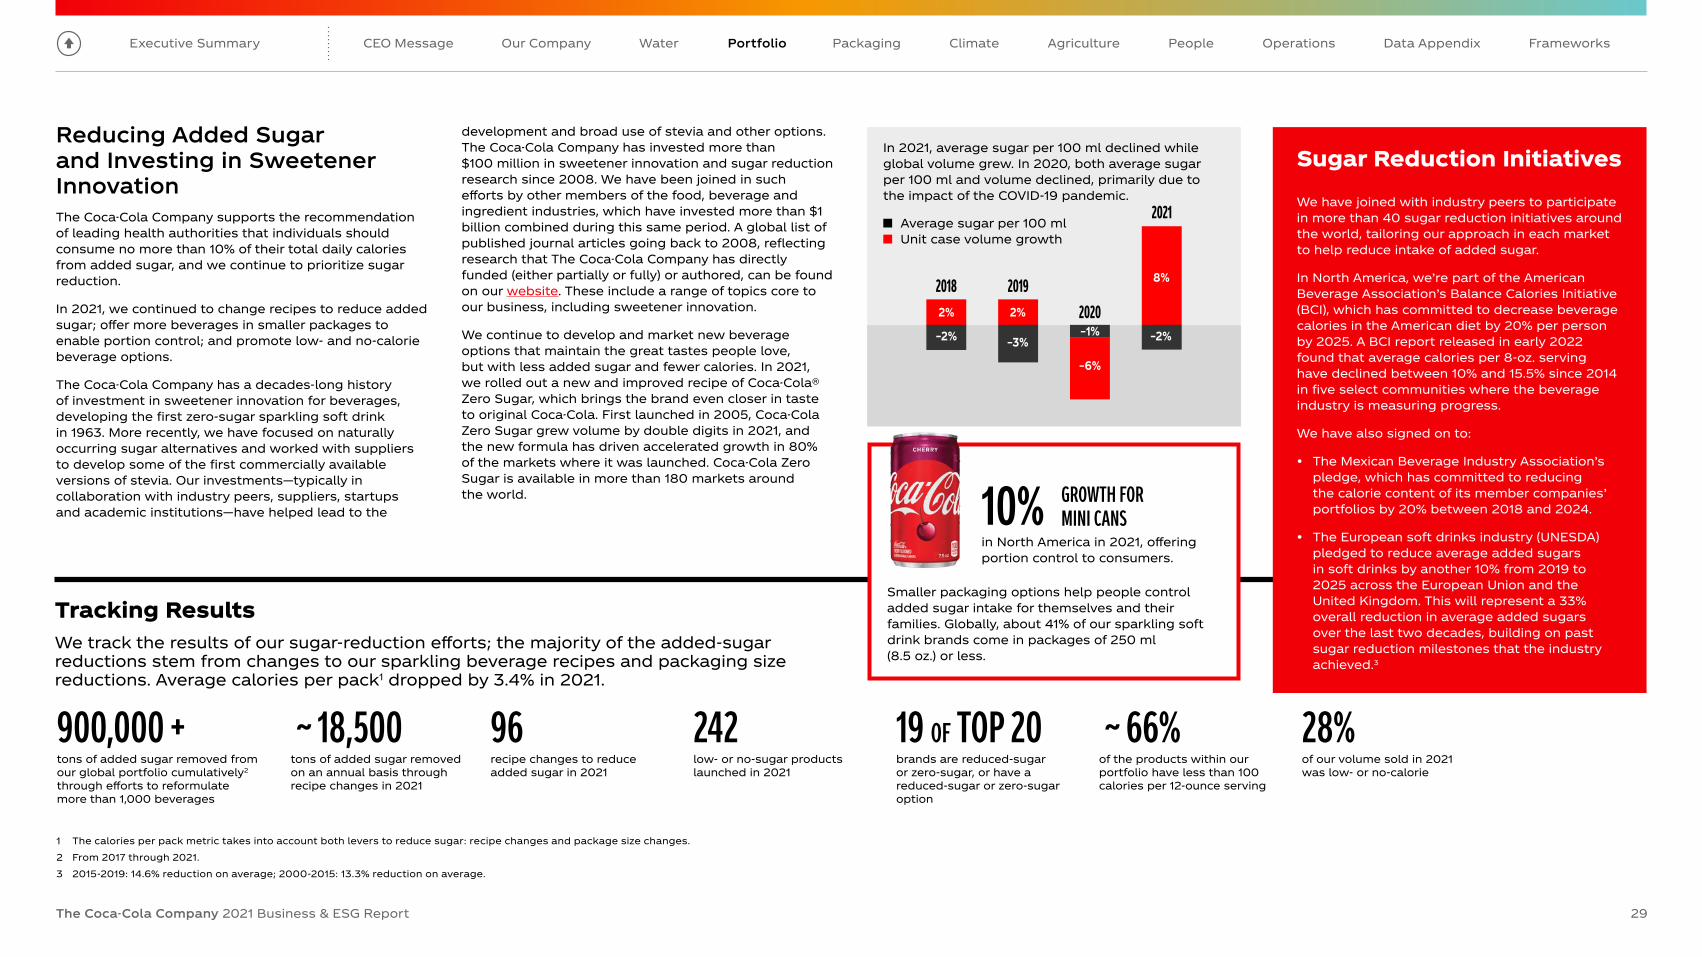
Executive Summary
The Coca-Cola Company 2021 Business & ESG Report 29
CEO Message Agriculture Data AppendixOur Company PeoplePackaging FrameworksWater OperationsClimatePortfolio
Tracking ResultsWe track the results of our sugar-reduction efforts; the majority of the added-sugar reductions stem from changes to our sparkling beverage recipes and packaging size reductions. Average calories per pack1 dropped by 3.4% in 2021.
900,000+tons of added sugar removed from our global portfolio cumulatively2 through efforts to reformulate more than 1,000 beverages
96recipe changes to reduce added sugar in 2021
242low- or no-sugar products launched in 2021
19 OF TOP 20 ~66% 28%brands are reduced-sugar or zero-sugar, or have a reduced-sugar or zero-sugar option
of the products within our portfolio have less than 100 calories per 12-ounce serving
of our volume sold in 2021 was low- or no-calorie
1 The calories per pack metric takes into account both levers to reduce sugar: recipe changes and package size changes. 2 From 2017 through 2021.3 2015-2019: 14.6% reduction on average; 2000-2015: 13.3% reduction on average.
Sugar Reduction Initiatives
We have joined with industry peers to participate in more than 40 sugar reduction initiatives around the world, tailoring our approach in each market to help reduce intake of added sugar.
In North America, we’re part of the American Beverage Association’s Balance Calories Initiative (BCI), which has committed to decrease beverage calories in the American diet by 20% per person by 2025. A BCI report released in early 2022 found that average calories per 8-oz. serving have declined between 10% and 15.5% since 2014 in five select communities where the beverage industry is measuring progress.
We have also signed on to:
• The Mexican Beverage Industry Association’s pledge, which has committed to reducing the calorie content of its member companies’ portfolios by 20% between 2018 and 2024.
• The European soft drinks industry (UNESDA) pledged to reduce average added sugars in soft drinks by another 10% from 2019 to 2025 across the European Union and the United Kingdom. This will represent a 33% overall reduction in average added sugars over the last two decades, building on past sugar reduction milestones that the industry achieved.3
Reducing Added Sugar and Investing in Sweetener InnovationThe Coca-Cola Company supports the recommendation of leading health authorities that individuals should consume no more than 10% of their total daily calories from added sugar, and we continue to prioritize sugar reduction.
In 2021, we continued to change recipes to reduce added sugar; offer more beverages in smaller packages to enable portion control; and promote low- and no-calorie beverage options.
The Coca-Cola Company has a decades-long history of investment in sweetener innovation for beverages, developing the first zero-sugar sparkling soft drink in 1963. More recently, we have focused on naturally occurring sugar alternatives and worked with suppliers to develop some of the first commercially available versions of stevia. Our investments—typically in collaboration with industry peers, suppliers, startups and academic institutions—have helped lead to the
development and broad use of stevia and other options. The Coca-Cola Company has invested more than $100 million in sweetener innovation and sugar reduction research since 2008. We have been joined in such efforts by other members of the food, beverage and ingredient industries, which have invested more than $1 billion combined during this same period. A global list of published journal articles going back to 2008, reflecting research that The Coca-Cola Company has directly funded (either partially or fully) or authored, can be found on our website. These include a range of topics core to our business, including sweetener innovation.
We continue to develop and market new beverage options that maintain the great tastes people love, but with less added sugar and fewer calories. In 2021, we rolled out a new and improved recipe of Coca-Cola® Zero Sugar, which brings the brand even closer in taste to original Coca-Cola. First launched in 2005, Coca-Cola Zero Sugar grew volume by double digits in 2021, and the new formula has driven accelerated growth in 80% of the markets where it was launched. Coca-Cola Zero Sugar is available in more than 180 markets around the world.
2018 20192020
2021
2%
–2%
–6%
–1% –2%
8%
2%
–3%
In 2021, average sugar per 100 ml declined while global volume grew. In 2020, both average sugar per 100 ml and volume declined, primarily due to the impact of the COVID-19 pandemic.
Average sugar per 100 mlUnit case volume growth
Smaller packaging options help people control added sugar intake for themselves and their families. Globally, about 41% of our sparkling soft drink brands come in packages of 250 ml (8.5 oz.) or less.
in North America in 2021, offering portion control to consumers.
10% GROWTH FOR MINI CANS
~18,500tons of added sugar removed on an annual basis through recipe changes in 2021

Executive Summary
The Coca-Cola Company 2021 Business & ESG Report 30
CEO Message Agriculture Data AppendixOur Company PeoplePackaging FrameworksWater OperationsClimatePortfolio
Investing in Products with Added Nutrition and Enhanced BenefitsWe’re bringing drinks such as teas, juices, dairy, plant-based products and purified water to more people in more places. We’re making many of our beverages nutritious by fortifying them with vitamins and minerals, while also introducing more dairy and plant-based beverages. We’re focused on addressing the specific nutritional needs of populations where under-nutrition is an ongoing concern.
For example, our fairlife brand is adding protein to more diets while introducing new and reformulated products that continue to improve taste and nutritional profile. fairlife removed nearly 2 million pounds of sugar from the diets of those who drink fairlife versus other milk.1 For those looking to add even more protein to their diets, fairlife’s Nutrition Plan™ shake offers 30 grams of protein with just 2 grams of sugar.
In 2021, we launched fairlife in China, where milk consumption is on the rise. Beyond protein, fairlife products offer multiple benefits, including high calcium content and zero lactose. The brand uses ultra-filtration technology to retain more nutrients.
1 Calculated by number of products sold multiplied by sugar reduced (50%) for full year 2021. This is based on the volume of fairlife milk having 50% less sugar than other milks, and Good Moo’d milk having 25% less sugar than other milks.
Minute Maid Kids is a low-calorie children's drink with no added sugar, preservatives or artificial sweeteners. The product is an excellent source of vitamin C for children ages 6 to 12.
BodyArmor Lyte is a low-calorie sports drink with no added sugar and no artificial sweeteners, flavors or dyes. Available in nine flavors, the drinks are packed with electrolytes, antioxidants and select B vitamins.
Costa Coffee Latte+ beverages are infused with specially crafted functional ingredients and plant-based milk. Available in three varieties, including Caramel Oat Latte+ (with added vitamin B12 and zinc), Hazelnut Almond Latte+ (with added plant protein), and Vanilla Coconut Latte+ (with added vitamin B12 and zinc).
Nutriboost, available in Asia and Australia, is a boosted milk drink with protein, calcium, fiber and vitamin D.
innocent Super Smoothie Light launched in 2021 in the United Kingdom. Made with 100% fruit, two new smoothie flavors contain 30% less natural sugar than the original Super Smoothie range. The Super Smoothie Light drinks are high in select B vitamins and E vitamins and provide a good source of fiber.
vitaminwater gutsy, which launched in the United States in 2021, is a refreshing watermelon-peach-flavored water beverage with B and C vitamins and zero sugar. At just 10 calories per 20 fluid ounces, it also offers 5 grams of fiber and electrolytes.
AdeZ Barista professional series offers 100% plant-based drinks with no added sugars for sale in Costa stores across a number of European markets. The drinks, which come in coconut, almond, soy and oat, are naturally free of lactose and gluten.
smartwater+ water enhancers are naturally flavored and have been formulated by biomedical engineers with a patented oxygen delivery technology to include vitamin B12 and iron to contribute to the reduction of fatigue.
Mojo is a range of kombucha sodas with added prebiotic fiber to support gut health. Available in Australia, the certified-organic sodas are naturally low in sugar and made with real fruit puree and juice.

Executive Summary
The Coca-Cola Company 2021 Business & ESG Report 31
CEO Message Agriculture Data AppendixOur Company PeoplePackaging FrameworksWater OperationsClimatePortfolio
No Marketing to Children
We’re committed to the responsible marketing of our products and have a history of aligning our commercial practices with our sustainability goals, our business goals and our values.
We do not market any of our products directly to children under 13, regardless of nutritional profile. We respect the role of parents and caregivers as the primary decision-makers for what their children drink.
We hold everyone who is involved in our marketing and communications accountable to our Global Responsible Marketing Policy, from our employees and bottling partners to our agency and media partners. We require annual trainings for all relevant employees as part of our Coca-Cola University. We have created a Global Responsible Marketing Taskforce and local taskforces across all our operating units who monitor compliance, guide our marketers in their daily work and are equipped to address any identified non-compliances. Read our full policy.
Scaling Efforts with Industry Peers
In addition to our own company’s Global Responsible Marketing Policy, we are a founding member of the International Food & Beverage Alliance (IFBA), a group of 11 leading food and beverage companies that self-regulate globally on responsible marketing to children. In 2021, together with our industry peers at IFBA, we strengthened our policy further. Effective January 1, 2022, we increased the age threshold from under 12 to under 13 and we reduced the audience threshold from 35% to 30%. This means we will not place our marketing or advertising in any media, platform or event where more than 30% of the audience is under 13.
We also partner with industry at regional and local levels to scale collective action in responsible marketing pledge programs. These include the EU Pledge in the European Union and The Children’s Food and Beverage Advertising Initiative (CFBAI) in the United States.
Through our voluntary actions we aim to reduce children’s exposure to foods that are high in fat, sugar and salt (HFSS) across all media, including digital. In 2021, an independent study commissioned by the World Federation of Advertisers in 12 markets showed that only 1.45% of online ads served to children are HFSS products.1
Responsible Alcohol Marketing
We recognize that our growth into alcohol brands brings new responsibilities. To ensure accountability, we developed The Coca-Cola Company’s Global Policy on Alcohol Responsibility. As part of our entry into the category, we developed local partnerships and communications programs to help reduce and prevent the harmful use of alcohol in line with goals established by leading health authorities. We worked with Drinkaware in Great Britain; the Social Research Foundation in Mexico (FISAC); the Akatu, CISA and Ekloos organizations in Brazil; and organizations in Japan to support responsible drinking programs or messages. In all our activities, we seek to grow our alcohol brands in a responsible and sustainable manner.
We are committed to providing transparent back- and front-of-package nutrition information, in line with local regulations. We support evidence-based interpretive front-of-package nutrition labeling, which can be a useful tool to help people make informed dietary choices that fit their diets and lifestyles. We’re working with trade associations, governments, civil society and other stakeholders to develop the most appropriate labeling programs aligned with local needs.
Nutrition information can be found on the vast majority of our products, with the exception of certain returnable bottles, fountain beverages and waters (unsweetened, unflavored). For these beverage and packaging types, nutrition information is provided through our company and bottler websites as well as consumer hotlines.
1 The Digital Avatar Project was commissioned by the World Federation of Advertisers (WFA) and was conducted by independent research firm Nielsen using avatars that mimic the real browsing behavior of children online. The study was conducted across 12 major markets; a total of 30,593 ads were analyzed, captured by the child avatar visiting 100 URLs per market over a period of three weeks in October 2021.
Driving Innovation and GrowthWe’re providing consumers with beverages for every moment of the day and responding to consumer preferences with options that contain less sugar and more nutrition and functional benefits. Our total beverage portfolio is driving growth:
• fairlife is now a $1 billion brand with seven years of double-digit volume growth
• AHA has seen triple the retail value growth compared to the sparkling water category as a whole in the United States
• Simply saw 17% volume growth in 2021 versus 2019
• Coca-Cola Zero Sugar grew by double digits in 108 countries and territories in 2021
Read more about our total beverage portfolio and innovative product offerings.
Giving People the Information They Need
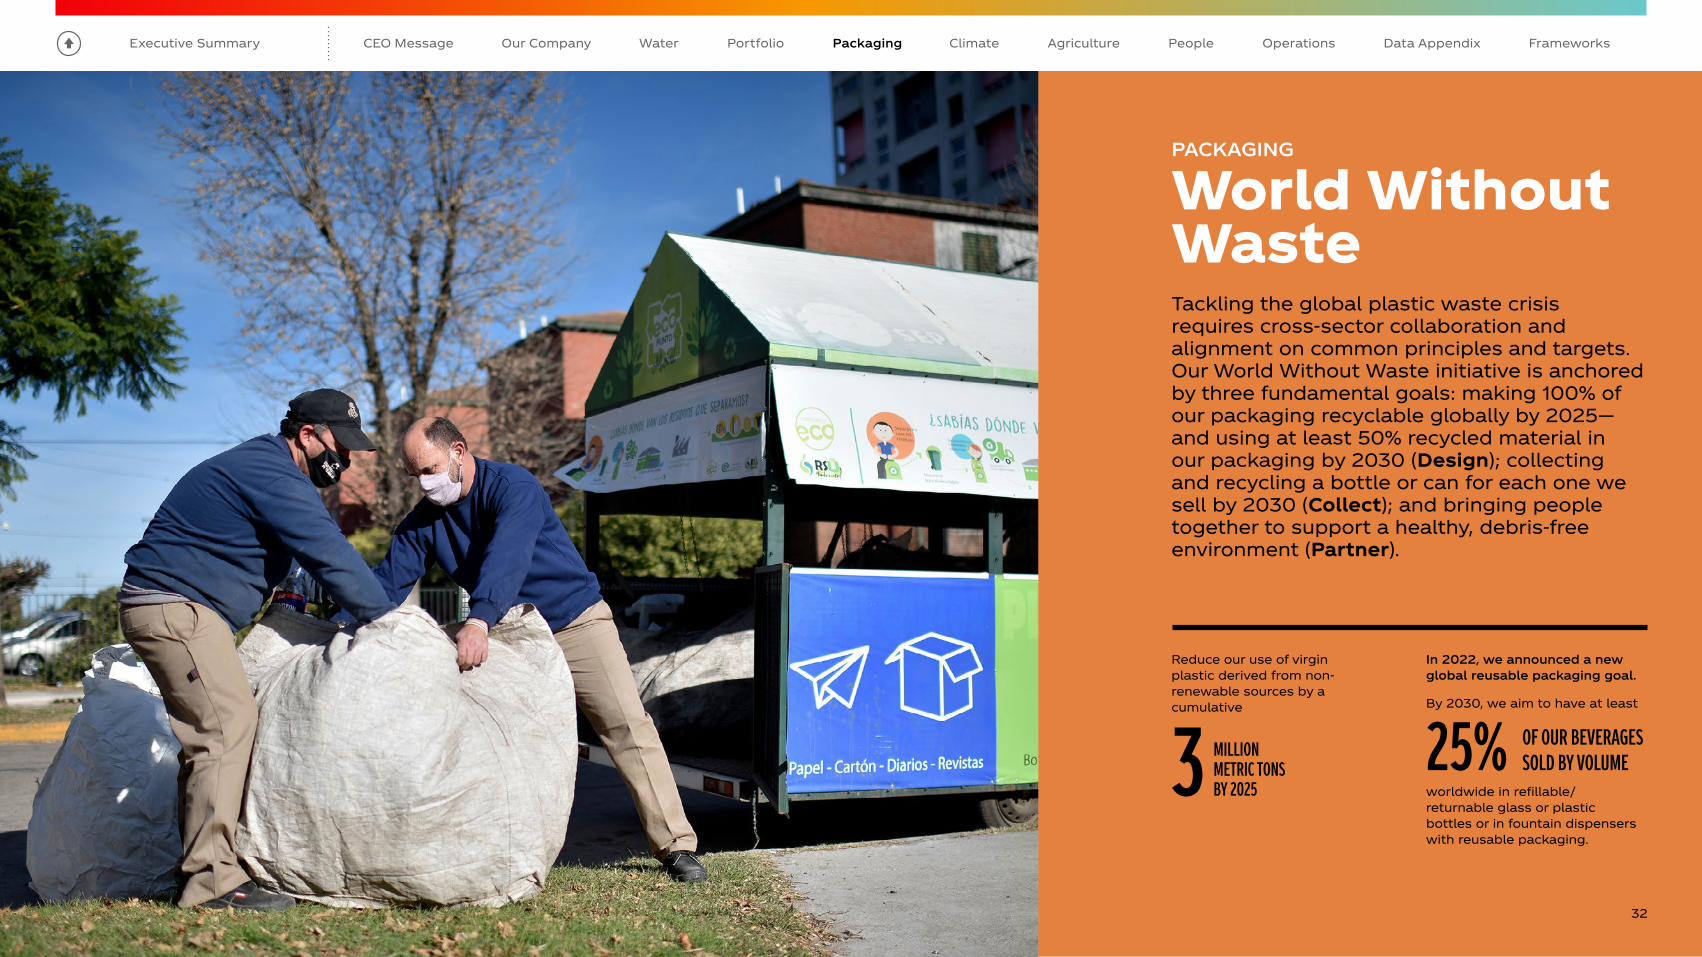
Executive Summary
The Coca-Cola Company 2021 Business & ESG Report
CEO Message AgriculturePortfolio Data AppendixOur Company People FrameworksWater OperationsClimatePackaging
PACKAGING
World Without WasteTackling the global plastic waste crisis requires cross-sector collaboration and alignment on common principles and targets. Our World Without Waste initiative is anchored by three fundamental goals: making 100% of our packaging recyclable globally by 2025—and using at least 50% recycled material in our packaging by 2030 (Design); collecting and recycling a bottle or can for each one we sell by 2030 (Collect); and bringing people together to support a healthy, debris-free environment (Partner).
32
In 2022, we announced a new global reusable packaging goal.
By 2030, we aim to have at least
worldwide in refillable/returnable glass or plastic bottles or in fountain dispensers with reusable packaging.
25% OF OUR BEVERAGES SOLD BY VOLUME
Reduce our use of virgin plastic derived from non-renewable sources by a cumulative
3 MILLION METRIC TONSBY 2025

Executive Summary
The Coca-Cola Company 2021 Business & ESG Report 33
CEO Message AgriculturePortfolio Data AppendixOur Company People FrameworksWater OperationsClimatePackaging
The Importance of Collective Action
Our World Without Waste packaging goals require collective action in partnership with a range of stakeholders at a global, regional and local level.
Together with our bottling partners, we are working with:
• Governments and community organizations to strengthen recycling infrastructures and boost collection rates
• Customers, peers and industry associations to shape public policy and take action that supports a circular economy
• Nonprofits and NGOs to engage civil society in ways that address pollution
• Suppliers, startups and R&D partners to fuel sustainable packaging innovation that reduces waste and minimizes our environmental impact—one bottle at a time.
A World Without Waste, where materials are reused and recycled as part of a circular economy, is a world with dramatically lower carbon emissions and climate impacts, which is why our packaging and climate strategies are intertwined. Because packaging accounts for up to 30% of our overall carbon footprint, our World Without Waste efforts are essential to meeting our science-based target to reduce greenhouse gas (GHG) emissions and our vision to be net zero carbon. We’re reducing our carbon footprint by lightweighting our packaging, incorporating more recycled and renewable material, investing in local recycling programs and increasing our use of reusable packaging.
We continue to rethink our beverage packaging to become more sustainable. Most recently, we announced a global, and industry-leading, reusable packaging goal.
In North America, we eliminated more than 60,000 metric tons of virgin PET from our packaging mix in 2021 by increasing our usage of recycled PET plastic (rPET) to 12% of our portfolio and through regional and national launches of 100% rPET3 packaging on select brands. In Europe, we eliminated more than 130,000 metric tons of virgin PET from our packaging mix in 2021 by increasing our usage of recycled rPET to 31% of our portfolio.
We now offer beverages in 100% rPET bottles (excluding caps and labels) in approximately 30 markets. In 2021, Coca-Cola Japan introduced 100% recycled PET bottles for two brands: Coca-Cola and Georgia - and 40% of the PET plastic used in Japan in 2021 was either from recycled or renewable material.
In countries accounting for approximately 25% of our global PET use, rPET cannot currently be used in food-grade material. We continue to work with industry peers to advocate for government regulations permitting the use of rPET in food and beverage packaging. Over
the last several years, countries as diverse as Bahrain, Bangladesh, Indonesia, Kuwait, Nigeria, Oman, Qatar, Saudi Arabia and South Korea have adopted standards for food- and beverage-grade rPET usage.
1 Only recyclable where infrastructure exists
2 Includes select primary consumer packaging materials.
3 Except where otherwise indicated, where reference is made in this report to 100% Recycled PET or 100% Recycled Plastic Beverage Packaging, we are referring to the material from which the plastic bottle is made, not the cap and label.
Design
See additional performance indicators in the Data Appendix.
~30 MARKETSoffer at least one brand in 100% rPET packaging
4 MARKETS IN EUROPEuse 100% rPET for their entire plastic packaging portfolio
25%+In ~40 markets, refillables account for 25% or more of sales
50%+In ~20 markets, refillables account for 50% or more of sales
93%of refillable/returnable packaging is collected to be reused
Make 100% of our packaging recyclable globally by 2025
GOAL
Use at least 50% recycled content in our packaging by 2030
GOAL
2021 STATUS 90% globally1
2021 STATUS 23%2 recycled material in our packaging globally and 13.6% for PET plastic packaging
2021 STATUS We avoided almost half a million tons of virgin plastic usage through our lightweighting, recycled plastic and renewable material efforts in 2021
Reduce our use of virgin plastic derived from non-renewable sources by a cumulative 3 million metric tons by 2025
GOAL
By 2030, we aim to have at least 25% of our beverages worldwide by volume sold in refillable/returnable glass or plastic bottles or in fountain dispensers with reusable packaging
NEW REUSE GOAL
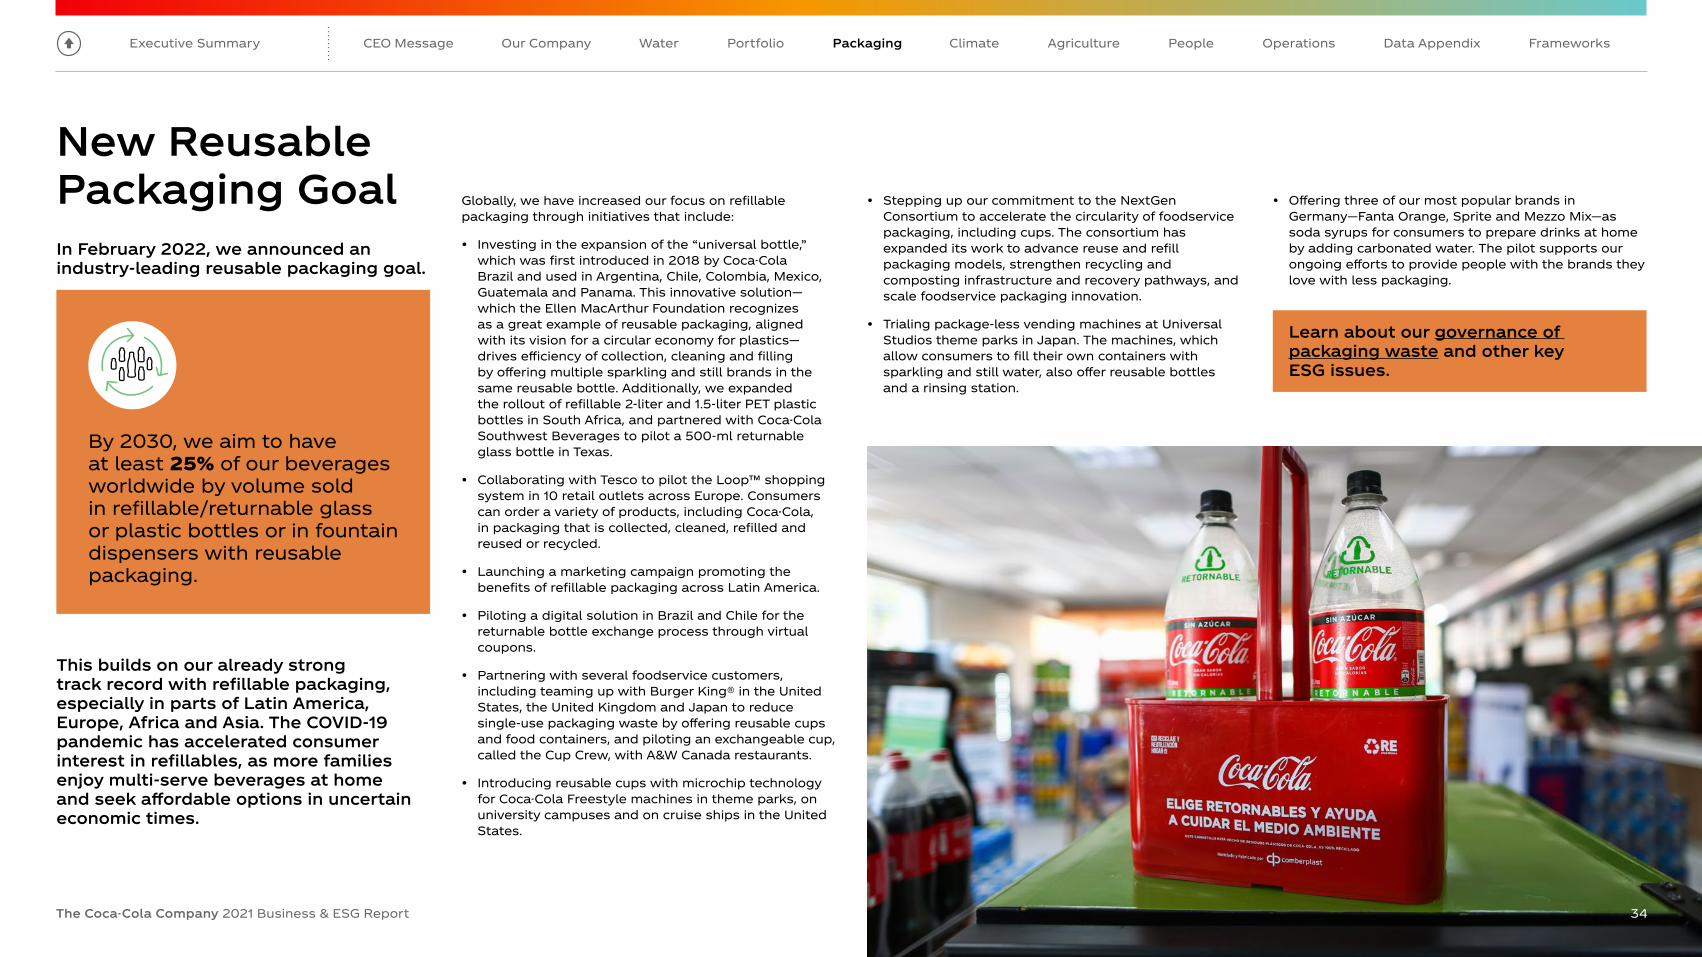
Executive Summary
The Coca-Cola Company 2021 Business & ESG Report 34
CEO Message AgriculturePortfolio Data AppendixOur Company People FrameworksWater OperationsClimatePackaging
New Reusable Packaging GoalIn February 2022, we announced an industry-leading reusable packaging goal.
Globally, we have increased our focus on refillable packaging through initiatives that include:
• Investing in the expansion of the “universal bottle,” which was first introduced in 2018 by Coca-Cola Brazil and used in Argentina, Chile, Colombia, Mexico, Guatemala and Panama. This innovative solution—which the Ellen MacArthur Foundation recognizes as a great example of reusable packaging, aligned with its vision for a circular economy for plastics—drives efficiency of collection, cleaning and filling by offering multiple sparkling and still brands in the same reusable bottle. Additionally, we expanded the rollout of refillable 2-liter and 1.5-liter PET plastic bottles in South Africa, and partnered with Coca-Cola Southwest Beverages to pilot a 500-ml returnable glass bottle in Texas.
• Collaborating with Tesco to pilot the Loop™ shopping system in 10 retail outlets across Europe. Consumers can order a variety of products, including Coca-Cola, in packaging that is collected, cleaned, refilled and reused or recycled.
• Launching a marketing campaign promoting the benefits of refillable packaging across Latin America.
• Piloting a digital solution in Brazil and Chile for the returnable bottle exchange process through virtual coupons.
• Partnering with several foodservice customers, including teaming up with Burger King® in the United States, the United Kingdom and Japan to reduce single-use packaging waste by offering reusable cups and food containers, and piloting an exchangeable cup, called the Cup Crew, with A&W Canada restaurants.
• Introducing reusable cups with microchip technology for Coca-Cola Freestyle machines in theme parks, on university campuses and on cruise ships in the United States.
• Stepping up our commitment to the NextGen Consortium to accelerate the circularity of foodservice packaging, including cups. The consortium has expanded its work to advance reuse and refill packaging models, strengthen recycling and composting infrastructure and recovery pathways, and scale foodservice packaging innovation.
• Trialing package-less vending machines at Universal Studios theme parks in Japan. The machines, which allow consumers to fill their own containers with sparkling and still water, also offer reusable bottles and a rinsing station.
• Offering three of our most popular brands in Germany—Fanta Orange, Sprite and Mezzo Mix—as soda syrups for consumers to prepare drinks at home by adding carbonated water. The pilot supports our ongoing efforts to provide people with the brands they love with less packaging.
This builds on our already strong track record with refillable packaging, especially in parts of Latin America, Europe, Africa and Asia. The COVID-19 pandemic has accelerated consumer interest in refillables, as more families enjoy multi-serve beverages at home and seek affordable options in uncertain economic times.
By 2030, we aim to have at least 25% of our beverages worldwide by volume sold in refillable/returnable glass or plastic bottles or in fountain dispensers with reusable packaging.
34
Learn about our governance of packaging waste and other key ESG issues.

Executive Summary
The Coca-Cola Company 2021 Business & ESG Report 35
CEO Message AgriculturePortfolio Data AppendixOur Company People FrameworksWater OperationsClimatePackaging
100% Plant-Based BottleMore than a decade ago, we introduced the world’s first recyclable PET plastic bottle made with up to 30% plant-based material. In 2021, we unveiled a first-ever prototype bottle made from 100% plant-based plastic, that has been made using technologies that are ready for commercial scale (excluding the cap and label).
The new prototype exclusively uses materials from renewable, plant-based sources, removing all petroleum-based content from the bottle. It represents a significant technological step forward in the reduction of virgin oil-based PET across commercially produced bottles. Learn more.
Plant-based plastics will play a critical role in our overall PET mix in the future, supporting our goals to decrease our carbon footprint, reduce our reliance on virgin fossil fuels and boost collection of PET in support of a circular economy.
“We have been working with technology partners for many years to develop the right technologies to create a bottle with 100% plant-based content—aiming for the lowest possible carbon footprint—and it’s exciting that we have reached a point where these technologies exist and can be scaled by participants in the value chain.”
Nancy Quan Chief Technical and Innovation Officer, The Coca-Cola Company
Label-Less BottlesBuilding on the 2020 launch of our first label-less bottle for I LOHAS in Japan, South Korea launched the first label-less Coca-Cola PET plastic bottle with the iconic contour shape and engraved logo, and Bonaqua launched its first label-less bottle in Hong Kong. Since labels have to be removed prior to recycling in these markets, these innovations make our packaging easier to recycle.
Plant-Based Costa CupsCosta recently introduced cups made from 100% plant-based materials1 in its coffee shops in the United Kingdom. The carbon footprint of these cups, when recycled, is 26% lower than standard to-go cups. The brand also refreshed its reusable cup incentive program, further encouraging consumers to play their part in helping to reduce waste.
Sprite Clear BottlesSprite, one of our largest global sparkling soft drink brands, is transitioning from its iconic green bottles to clear PET to help make them easier to make into new bottles by increasing the supply of high-value recycled plastic in the after-use market. As of the end of 2021, 47 markets had switched from green to clear, and another 70-plus—including the United States and Canada—plan to transition in 2022.
1 Excluding lid.
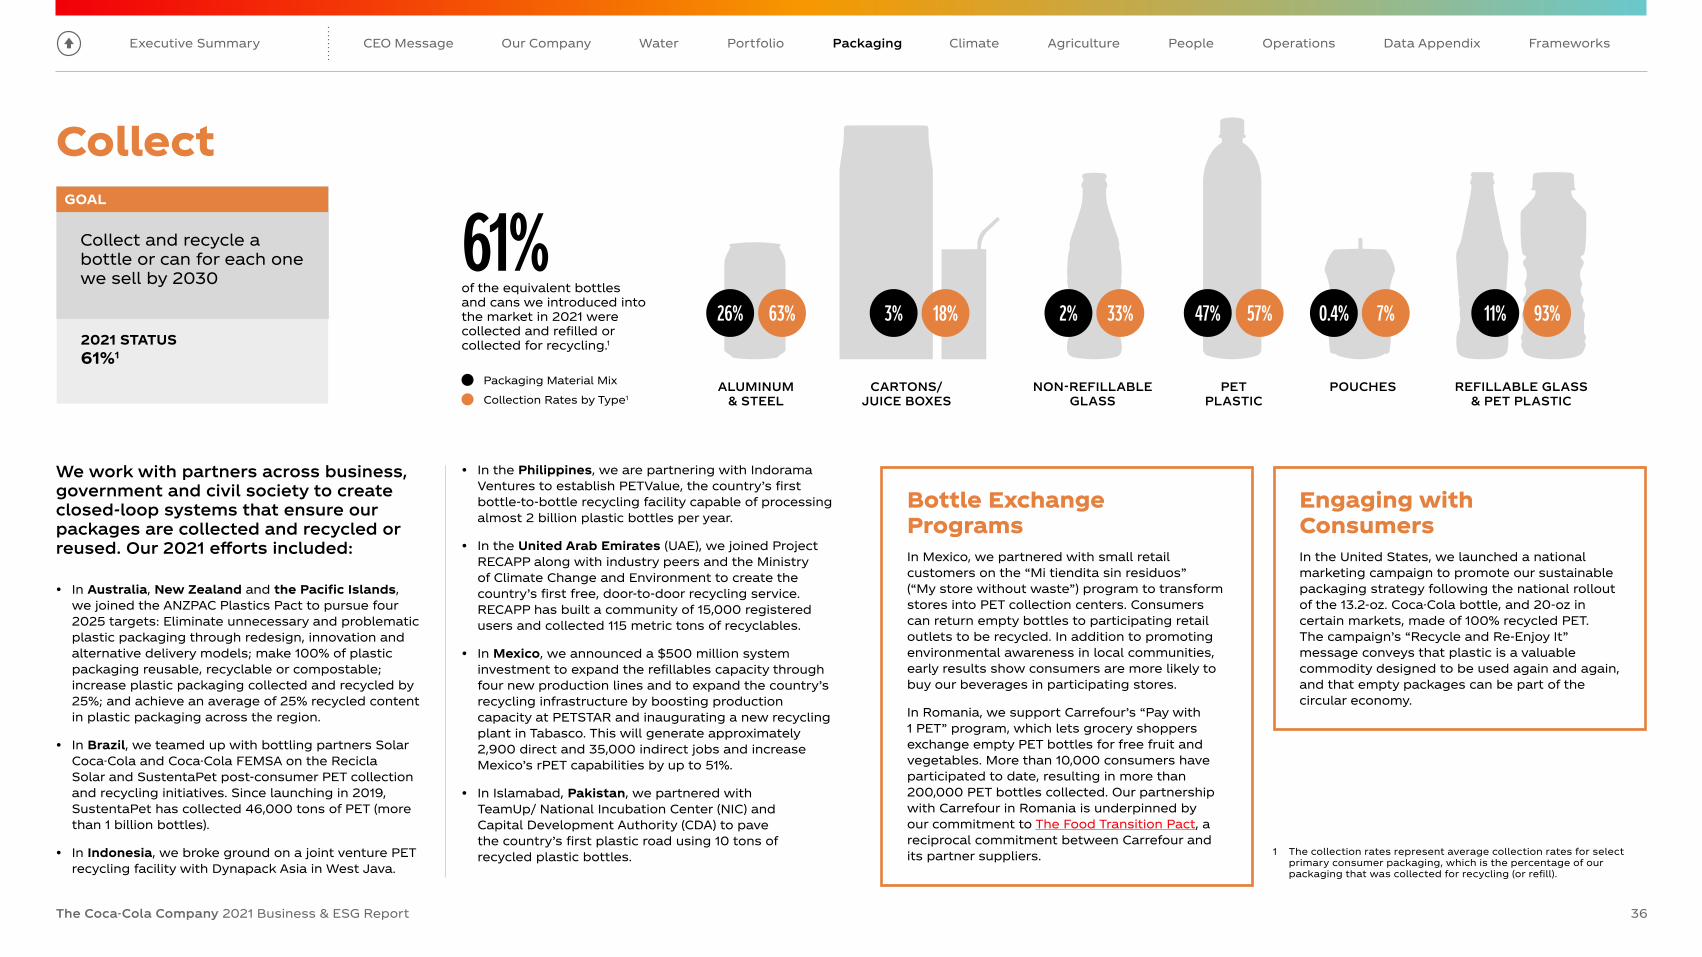
Executive Summary
The Coca-Cola Company 2021 Business & ESG Report 36
CEO Message AgriculturePortfolio Data AppendixOur Company People FrameworksWater OperationsClimatePackaging
of the equivalent bottles and cans we introduced into the market in 2021 were collected and refilled or collected for recycling.1
61% Packaging Material Mix
Collection Rates by Type1
We work with partners across business, government and civil society to create closed-loop systems that ensure our packages are collected and recycled or reused. Our 2021 efforts included:
• In Australia, New Zealand and the Pacific Islands, we joined the ANZPAC Plastics Pact to pursue four 2025 targets: Eliminate unnecessary and problematic plastic packaging through redesign, innovation and alternative delivery models; make 100% of plastic packaging reusable, recyclable or compostable; increase plastic packaging collected and recycled by 25%; and achieve an average of 25% recycled content in plastic packaging across the region.
• In Brazil, we teamed up with bottling partners Solar Coca-Cola and Coca-Cola FEMSA on the Recicla Solar and SustentaPet post-consumer PET collection and recycling initiatives. Since launching in 2019, SustentaPet has collected 46,000 tons of PET (more than 1 billion bottles).
• In Indonesia, we broke ground on a joint venture PET recycling facility with Dynapack Asia in West Java.
• In the Philippines, we are partnering with Indorama Ventures to establish PETValue, the country’s first bottle-to-bottle recycling facility capable of processing almost 2 billion plastic bottles per year.
• In the United Arab Emirates (UAE), we joined Project RECAPP along with industry peers and the Ministry of Climate Change and Environment to create the country’s first free, door-to-door recycling service. RECAPP has built a community of 15,000 registered users and collected 115 metric tons of recyclables.
• In Mexico, we announced a $500 million system investment to expand the refillables capacity through four new production lines and to expand the country’s recycling infrastructure by boosting production capacity at PETSTAR and inaugurating a new recycling plant in Tabasco. This will generate approximately 2,900 direct and 35,000 indirect jobs and increase Mexico’s rPET capabilities by up to 51%.
• In Islamabad, Pakistan, we partnered with TeamUp/ National Incubation Center (NIC) and Capital Development Authority (CDA) to pave the country’s first plastic road using 10 tons of recycled plastic bottles.
Bottle Exchange ProgramsIn Mexico, we partnered with small retail customers on the “Mi tiendita sin residuos” (“My store without waste”) program to transform stores into PET collection centers. Consumers can return empty bottles to participating retail outlets to be recycled. In addition to promoting environmental awareness in local communities, early results show consumers are more likely to buy our beverages in participating stores.
In Romania, we support Carrefour’s “Pay with 1 PET” program, which lets grocery shoppers exchange empty PET bottles for free fruit and vegetables. More than 10,000 consumers have participated to date, resulting in more than 200,000 PET bottles collected. Our partnership with Carrefour in Romania is underpinned by our commitment to The Food Transition Pact, a reciprocal commitment between Carrefour and its partner suppliers.
Engaging with ConsumersIn the United States, we launched a national marketing campaign to promote our sustainable packaging strategy following the national rollout of the 13.2-oz. Coca-Cola bottle, and 20-oz in certain markets, made of 100% recycled PET. The campaign’s “Recycle and Re-Enjoy It” message conveys that plastic is a valuable commodity designed to be used again and again, and that empty packages can be part of the circular economy.
Collect
1 The collection rates represent average collection rates for select primary consumer packaging, which is the percentage of our packaging that was collected for recycling (or refill).
Collect and recycle a bottle or can for each one we sell by 2030
2021 STATUS 61%1
GOAL
26% 63%
ALUMINUM & STEEL
NON-REFILLABLE GLASS
POUCHESCARTONS/ JUICE BOXES
PET PLASTIC
REFILLABLE GLASS & PET PLASTIC
3% 18% 2% 33% 47% 57% 0.4% 7% 11% 93%

Executive Summary
The Coca-Cola Company 2021 Business & ESG Report 37
CEO Message AgriculturePortfolio Data AppendixOur Company People FrameworksWater OperationsClimate
“The Ocean Cleanup’s mission is to rid the oceans of plastic. With 1,000 rivers emitting nearly 80% of river-carried plastic into oceans, this massive problem grows by the day, which is why we are always looking to accelerate our progress. Among the waste we collect with our cleanup systems, we find many plastic bottles, including Coca-Cola packaging, so I applaud them for being the first in the industry to join our mission, as part of their wider actions to make a positive impact on plastic pollution.”
Boyan Slat Founder and CEO, The Ocean Cleanup
Packaging
Accelerating Sustainable InnovationWe sponsor AB InBev’s 100+ Accelerator, an open-innovation program that is committed to crowdsourcing and piloting sustainability-focused startups and solutions. In the most recent cohort, we provided funding, training, mentoring and other hands-on support to seven startups for a pilot program of about nine months, including two startups focused on the circular economy. For example, ReciVeci developed a mobile app to increase the recovery of recyclable and returnable materials in Ecuador and RecyclePoints in Nigeria incentivizes people to recycle PET bottles and other materials through points that can be redeemed for cash and household goods. Learn about BanQu—a 100+ Accelerator alum.
We are an investor in Circulate Capital, a fund focused on ventures, infrastructure and innovations preventing the flow of plastic into oceans. Since 2019, Circulate Capital has raised more than $100 million and invested in six companies in India and Indonesia. In 2021, Circulate Capital announced a $4 million investment in the Inter-American Development Bank Group’s innovation lab to support startups in Latin America and the Caribbean.
“In today’s interconnected world, none of us can solve the biggest social and environmental challenges of our time alone. We believe that partnerships and collective action are needed to deliver both a more sustainable business and a sustainable future, and that we must look outside our company for ideas and solutions.”
Ben Jordan Senior Director of Environmental Policy, The Coca-Cola Company
PartnerWe believe that solutions to the world’s plastic waste challenges can best be unlocked when stakeholders work collaboratively to create systems that enable positive change.We have partnered with The Ocean Cleanup, which has developed solutions and technology to reduce ocean plastic. Its Interceptor™ solutions extract plastic from rivers, preventing it from reaching oceans. Our new Rivers partnership, which pairs our scale and network with The Ocean Cleanup’s technology and data-driven solutions, aims to place cleanup systems in 15 priority rivers around the world so that they can validate the technology and extend to additional critical rivers.
Local teams will partner with waste management coalitions to sort and, where possible, eventually turn PET plastic bottles captured from river waste into new bottles.
Our partnership with The Ocean Cleanup builds on The Coca-Cola Foundation’s support to the Benioff Ocean Institute at the University of California-Santa Barbara, which supports river cleanup efforts in Panama, Vietnam, India, Indonesia, Ecuador, Mexico, Thailand, Jamaica and Kenya. Despite ongoing challenges posed by the COVID-19 pandemic, the coalition collected 425 tons of plastic waste in 2021; hosted its first-annual virtual symposium; and launched a data dashboard highlighting key metrics, including plastic captured by type and number of people reached through education and community outreach.
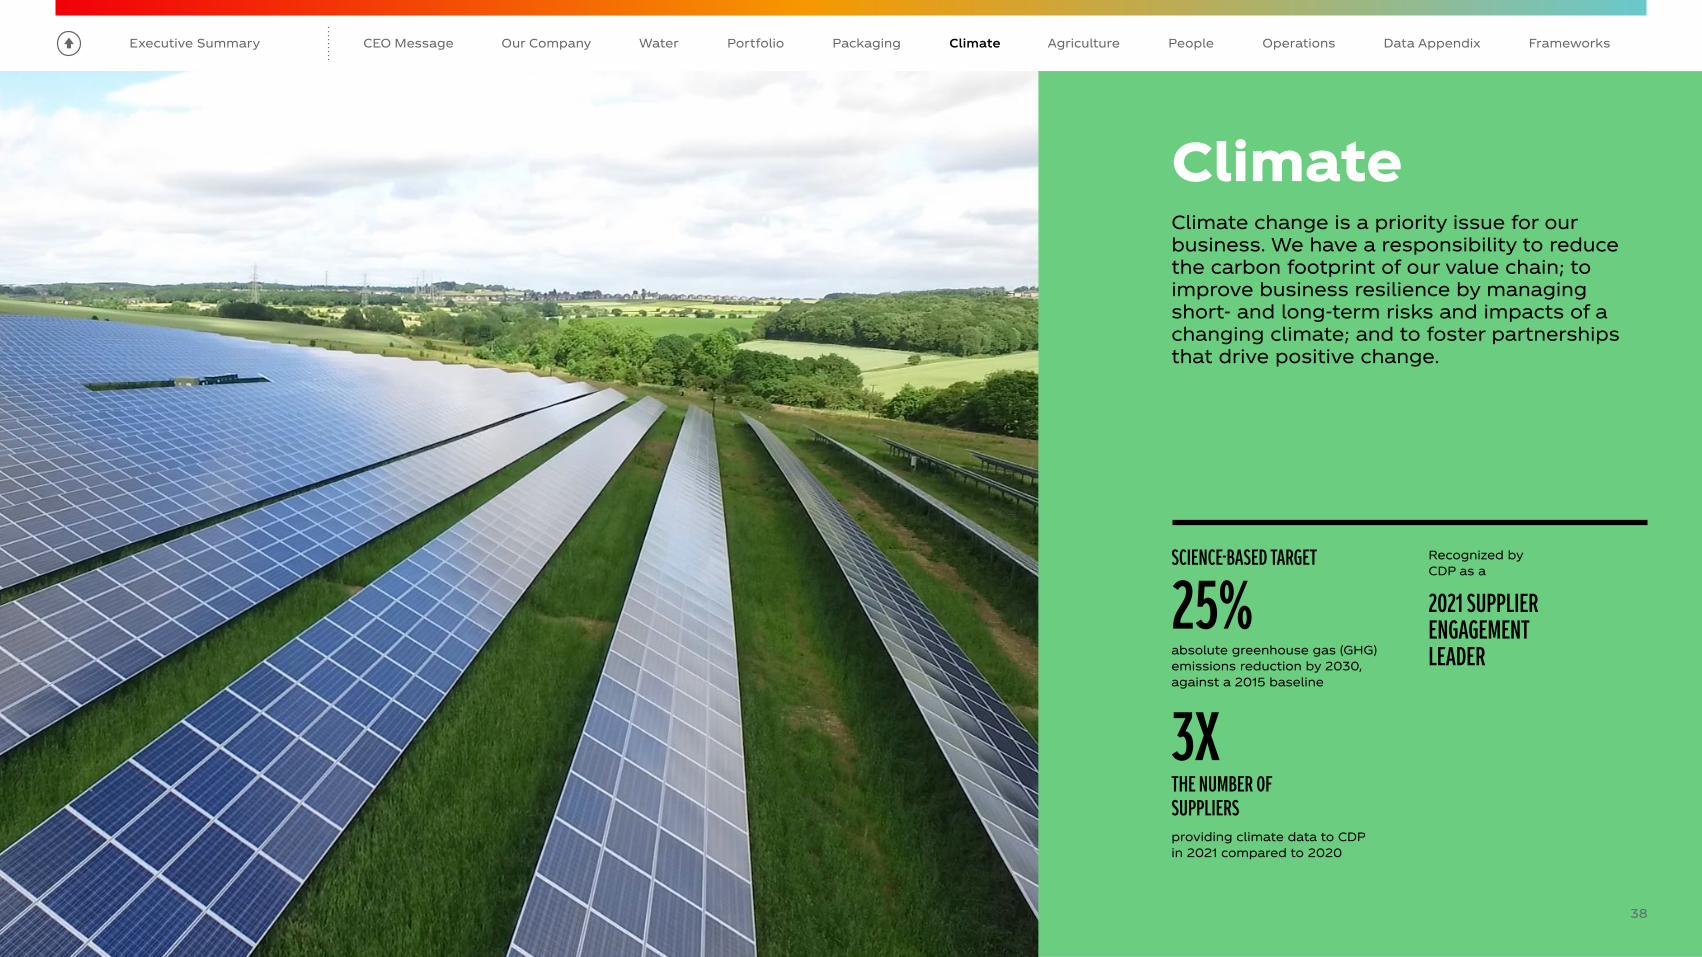
Executive Summary
The Coca-Cola Company 2021 Business & ESG Report
CEO Message AgriculturePortfolio Data AppendixOur Company PeoplePackaging FrameworksWater OperationsClimate
ClimateClimate change is a priority issue for our business. We have a responsibility to reduce the carbon footprint of our value chain; to improve business resilience by managing short- and long-term risks and impacts of a changing climate; and to foster partnerships that drive positive change.
38
2021 SUPPLIER ENGAGEMENT LEADER
Recognized by CDP as a
25%SCIENCE-BASED TARGET
absolute greenhouse gas (GHG) emissions reduction by 2030, against a 2015 baseline
3Xproviding climate data to CDP in 2021 compared to 2020
THE NUMBER OF SUPPLIERS

Executive Summary
The Coca-Cola Company 2021 Business & ESG Report 39
CEO Message AgriculturePortfolio Data AppendixOur Company PeoplePackaging FrameworksWater OperationsClimate
Increasing Our Climate Ambition
Our approach to addressing climate change has accelerated in recent years in keeping with the scale and urgency of the issue. Even as we achieved our 2020 “drink in your hand” goal to reduce our relative carbon emissions by 25% against a 2010 baseline, we increased our climate ambition.
Governance on Climate ChangeThe ESG and Public Policy Committee, established by our Board of Directors, bears the highest level of direct responsibility for climate-related issues. The committee assists the Board in overseeing the company’s environmental, social, legislative, regulatory and public policy matters, including progress against our science-based target. The committee reports regularly to the full Board on matters it oversees, including climate-related issues.
To learn more about our ESG governance structure, see the Governance section. For more on climate-related governance, see our most recent CDP Climate Change response, Section C1.
Embedding Climate Action into Our StrategyBuilding on our first climate risk scenario analysis in 2019, we undertook a far-reaching new study across our company and agricultural supply chain in 2021, looking at three scenarios: Business As Usual1 (warming above 5°C), Middle of the Road2 (warming limited to 2.7°C) and Low Carbon3 (warming kept below 2°C). This process enabled us to identify a refined set of climate-related risks and opportunities—including both physical and transition impacts—in a range of possible futures. This will be a critical tool for strategic planning and implementing resilience plans. We will further analyze the risks and opportunities identified to ensure we have appropriate risk-management strategies in place. We will disclose details in our forthcoming CDP Climate Change response.
Managing Climate RiskWe have established a cross-functional and cross-company Enterprise Risk Management process and Risk Steering Committee to oversee regular system-wide risk assessments, and we work to integrate climate risk planning into this process.
Relevant risks that could materially affect our business, including our financial results, are disclosed in the Annual Report on Form 10-K. These include risks relating to climate change, such as physical risks from changes in weather patterns around the globe and an increase in the frequency and severity of natural disasters which may limit the availability or increase the cost of key agricultural commodities. Climate change may also exacerbate water scarcity and cause a further deterioration of water quality in affected regions, which could limit water availability for the Coca-Cola system’s bottling operations. Increasing concern over climate change also may result in additional legal or regulatory requirements, among others.
We’ve announced both our science-based target to reduce our absolute emissions by 25% by 2030 against a 2015 baseline and an ambition to be net zero carbon by 2050. Several of our bottling partners have announced their own science-based targets and net zero pledges, which will help drive even more positive climate action across the Coca-Cola system.
In line with our net zero ambition, we conducted preliminary modeling in 2021 that will enable us to define the key actions and goals needed for a net zero transition by 2050.
A significant amount of our impact is in our supply chain, so we encourage suppliers—representing approximately 80% of spend across most major procurement categories—to respond to the CDP Supply Chain Climate Change questionnaire. In 2021 we saw a threefold increase in the number of supplier responses compared to the previous year.
We believe that continued progress against our goals—in combination with supporting key stakeholders as they strengthen their own ambitions—will be critical to making meaningful advances on climate. We have also undertaken additional climate scenario risk analysis to better understand the potential near- and longer-term impacts of a changing climate on our business.
1 Physical Scenario: IPCC AR6 SSP5-8.5 “Fossil-fueled Development” and Transition Scenario: IEA World Energy Outlook “Current Policies Scenario.”
2 Physical Scenario: SSP2-4.5 “Middle of the Road” and Transition Scenario: IEA World Energy Outlook “Stated Policies Scenario.”
3 Physical Scenario: SSP1-2.6 “Sustainable” and Transition Scenario: IEA World Energy Outlook “Sustainable Development Scenario.”
already had science-based targets in 2021, and an additional 49 suppliers have committed through the Science-Based Targets initiative (SBTi) to setting science-based targets in the near term.
70 SUPPLIERSThe Coca-Cola Company applies the recommendations of the Task Force on Climate-related Financial Disclosures (TCFD) in this report and in a TCFD Index and provides comprehensive disclosures to CDP on Climate Change.

Executive Summary
The Coca-Cola Company 2021 Business & ESG Report 40
CEO Message AgriculturePortfolio Data AppendixOur Company PeoplePackaging FrameworksWater OperationsClimate
Supplier Reporting on Emissions & Reduction PlansMany of our agricultural suppliers report annually on their performance and progress in reducing emissions, which constitute 20-25% of our total value chain emissions, and on plans to achieve further reductions. Our Principles for Sustainable Agriculture (PSA) include maximizing energy efficiency and use of renewable energy, employing responsible forest management practices that protect biodiversity and restore degraded ecosystems, and maintaining or improving soils by preventing degradation—all of which are important in mitigating climate impacts. To find out more, see Sustainable Agriculture.
Investments in Renewable Energy for ManufacturingApproximately 10-15% of our emissions come from manufacturing. Renewable energy use as a percentage of total electricity for the system was 12% in 2021.1 In February 2022, we released a Renewable Energy Implementation Guidebook, a step-by-step guide for company-owned facilities and bottling partners to build knowledge and increase facilities’ generation and procurement of renewable energy. We also conducted analyses of renewable energy opportunities in six countries where implementation is more complex to support our teams in identifying renewable energy procurement options. In 2022, we will continue to support operating units and bottling partners to further scale their use of renewable energy. In 2021, we also re-joined the Clean Energy Buyers Association (formerly known as the Renewable Energy Buyers Alliance) and are leveraging their resources and networks as we scale up our use of renewable energy.
More HFC-Free & Intelligent Connected CoolersCold drink equipment and dispensing accounts for approximately one-third of our emissions. We are working to place more hydrofluorocarbon (HFC)-free coolers, replace older equipment with newer and more energy efficient coolers, as well as place more “intelligent connected” coolers that transmit data such as product throughput, maintenance status, temperature and energy use, which can improve our placement and management of coolers while reducing emissions.
Innovations in Packaging Design & Increasing Collection RatesBecause packaging accounts for almost one-third of our overall carbon footprint, virtually everything we do toward our World Without Waste initiative also helps to achieve our science-based target. This strategy includes more plant-based packaging that requires less petroleum-based virgin plastic; lightweighting our packaging; using more reusable packaging (both traditional refillables as well as fountain and Coca-Cola Freestyle dispensed solutions), using more recycled material; and recycling more bottles and cans. For more about our packaging efforts, see World Without Waste.
Transitioning to a Low-Carbon EconomyAchieving our science-based target means looking at our full value chain, including bottling partners and suppliers. Our target to reduce absolute scope 1, 2 and 3 GHG emissions by 25% by 2030 includes system partners within our scope 1 and 2 boundary. Following are examples of how we are integrating our climate initiatives across our value chain and in collaboration with system partners.
1 Due to an improvement in our data collection process and rigorous assessment of renewable energy claims throughout the system, this resulted in a drop in renewable energy use as a percentage of total electricity for the system from 17% to 12%.

Executive Summary
The Coca-Cola Company 2021 Business & ESG Report 41
CEO Message AgriculturePortfolio Data AppendixOur Company PeoplePackaging FrameworksWater OperationsClimate
fairlife Facility Reduces GHG EmissionsAs part of its ongoing commitment to reducing its carbon footprint, the fairlife facility in Coopersville, Michigan, partnered in 2021 with Generate, a company that builds, finances, owns and operates sustainable infrastructure such as energy, mobility and waste assets. In the partnership, fairlife sends the liquid waste and organic matter waste produced during manufacturing at the facility to Generate’s anaerobic digester about 30 miles away in Fremont. The waste is broken down in the digester, and the resulting biogas that is produced is used to generate electricity. While there are CO2 emissions associated with this approach, the net GHG emissions are much lower than if the organic waste had been sent to landfill where it would contribute to methane emissions, which have a warming potential 28-34 times that of CO2.1
Between November 2021 and February 2022, the Coopersville plant has diverted 753 tons of organic waste, preventing the release of 461 tons of greenhouse gases. This has produced over 1 million kWh of electricity and more than 175,000 gallons of organic fertilizer.
Supplier Engagement Is Key to Transition Because approximately 85% of our total carbon emissions come from things we buy, and not what we do in our direct operations, engaging with suppliers is critical to achieving our science-based target. Our recent efforts include:
• Each year we encourage key suppliers to disclose to CDP’s supply chain Climate Change questionnaire, which provides us with useful data on the GHG emissions in our supply chain and information on supplier targets and initiatives to reduce their emissions. In 2021, we requested 442 suppliers (up from 149 in 2020) to disclose, and 75% of these suppliers responded.
• We are proud to have been recognized by CDP as a 2021 Supplier Engagement leader for the third year in a row. This is an acknowledgement of our efforts to measure and reduce climate risks within our supply chain. We join the top 8% of companies who disclosed to CDP's full Climate Change questionnaire.
• We have piloted a questionnaire with 12 of our major suppliers across ingredients and packaging to begin moving toward supplier-specific emissions factors for the commodities we procure. This allows us to better understand our supply chain and more accurately track the emissions reductions of specific suppliers in key areas of our supply chain.
• In 2022, we joined the Supplier Leadership on Climate Transition initiative along with Atlantic Packaging, The Estée Lauder Companies, General Mills, PepsiCo, Nestlé, Keurig Dr Pepper, Restaurant Brands International, Mars Incorporated, McCormick & Company, Mondelēz International, and Yum! Brands to mobilize collective climate action by providing suppliers with resources, tools and knowledge to support their climate journey.
Climate ResilienceWe are witnessing the impacts of changing weather patterns, which is why investing in the resilience of our supply chain and the communities where we operate is critical to our long-term success. Our work on resilience helps ensure we can withstand, recover from and adapt to the shocks and stressors of a changing climate. Many of our climate resilience efforts relate to our ingredient supply chain and water stewardship. For more information, see our Sustainable Agriculture and Water sections, as well as our featured story about resilience in action.
We are also sharing the outputs of our work on climate resilience with peer companies. As founding members of the BSR Climate Risk to Resilience platform, we helped shape the development of resilience metrics and risk planning tools as well as the report Rising to Resilience (produced in collaboration with WWF and published in November 2020). This report provides practical application for businesses on how to integrate climate resilience into their water stewardship strategies.
Tracking Progress Toward Ambitious Climate Targets Accurately measuring our impact and tracking reductions is essential to achieving our climate goal. We’ve recently implemented a new data system for collecting sustainability metrics and continually work toward ensuring that our practices are industry-leading. In 2021, we took significant steps to help facilitate complete and accurate progress reporting against our science-based target. We updated our GHG emissions accounting methodology for the Coca-Cola system aligned with the GHG Protocol and undertook an assessment to evaluate and expand the emissions sources included within our reporting boundary to align with requirements of the Science-Based Targets initiative (SBTi). In 2022, we plan to track our target progress in real-time across the system, putting us in a strong position to publicly report on progress against our target next year.
Coca-Cola System Climate TargetsAcross our system, many of our bottling and supplier partners have set their own science-based targets or have goals for net zero carbon emissions by 2050 or sooner.
In December 2021, the Coca-Cola system in Europe announced a goal to reach net zero by 2040 across all European markets, covering the entire European value chain, building on net zero and science-based targets set by The Coca-Cola Company’s two leading bottling partners in Europe, Coca-Cola Europacific Partners and Coca-Cola HBC. This effort seeks a reduction of 2.5 million tons of CO2 equivalent annually in Europe by 2030 compared to 2015—a reduction of 30%.
Complementing these net zero commitments, several of our other bottling partners have also announced their own science-based targets, including Swire Coca-Cola Limited (Asia) and Coca-Cola FEMSA (Mexico).
Additional details on Coca-Cola system emissions can be found in the Data Appendix.
Going Solar in the United KingdomCoca-Cola Europacific Partners completed Phase 1 of a three-phase solar development project at their facility in Wakefield, UK, the largest soft drinks plant in Europe. The early results are promising, already saving £340,000 in 2021 with installation of an 8.2 megawatt solar system that accounts for almost 20% of the facility’s electricity consumption. By the completion of Phase 3, we expect that the project will generate an additional 30 megawatts in solar energy and include up to 40 megawatts of battery storage capacity, ultimately transitioning the facility to be carbon neutral by 2050.
CASE STUDY
1 The Challenge | UNECE.

Executive Summary
The Coca-Cola Company 2021 Business & ESG Report
CEO Message Portfolio Data AppendixOur Company PeoplePackaging FrameworksWater OperationsClimate Agriculture
Sustainable AgricultureWe rely on agricultural ingredients to make and package our beverages. Ensuring these ingredients are sustainably sourced is a key priority for us, and is essential to our efforts on climate resilience, water security, human rights, sustainable packaging and economic empowerment. As climate change leads to more extreme weather and increased water stress, more sustainable agricultural practices will play a vital role in promoting resilience across our supply chain and in the communities that produce our agricultural ingredients.
42
500 SUPPLIERS
Evaluated more than
across 115+ countries and territories against the PSA framework
STRENGTHENED OUR PRINCIPLES FOR SUSTAINABLE AGRICULTURE (PSA)

Executive Summary
The Coca-Cola Company 2021 Business & ESG Report 43
CEO Message Portfolio Data AppendixOur Company PeoplePackaging FrameworksWater OperationsClimate Agriculture
Growing a More Sustainable Supply Chain
The quality and integrity of our products depends on a secure, sustainable supply chain with successful and thriving farming communities. Our Principles for Sustainable Agriculture (PSA) advance and standardize our core values at the farm level—from small-scale farmer cooperatives to large commercial operations—supporting livelihoods and helping to ensure continuity of supply.
Introduced in 2021 to improve upon our previous sustainable agriculture framework, the PSA aim to strengthen our progress toward sustainable sourcing of agricultural ingredients, taking a longer-term perspective that reflects our expanding portfolio, increasingly diverse supply chains and the most recent science. The principles are designed to help farms become more productive, resilient, transparent and compliant. Working with our suppliers, we seek to advance on-farm practices and thereby create long-term, systemic change in our supply chains.
More sustainable farming practices lead to improved farm incomes, through higher crop yields, better management, reduced costs and increased resilience to changing weather patterns—as well as enhanced product quality and a more stable supply.
The PSA are designed to encourage continuous improvement of farming practices. Recognizing the diversity of supply chains, farm structures and risk contexts, the PSA introduced a new framework for evaluating compliance and performance of our supply farm base to reflect the on-the-ground realities in sustainable farming practices.
The PSA’s “Leader/Mover/Improver” framework helps us to catalog our ingredient supply into three performance categories so we can prioritize our actions in line with our company’s highest sustainability priorities, including climate change, water resources, ecosystems and biodiversity, human rights, and animal health and welfare. These categories are:
LEADER LEVEL, which means that the supply volume is verified to a TCCC approved, third-party validation aligned with the PSA.1
MOVER LEVEL, which means that the supply volume is sourced from farms using other agricultural farming standard(s), effectively identifying and addressing key sustainability issues and advancing sustainable practices.
IMPROVER LEVEL, which applies when the supply volume is sourced from smallholder/small-scale producers participating in a support program and continuously improving practices to address their priority sustainability issues over time.
We are currently in the process of mapping the volume of the 12 global priority ingredients we procure against this framework. This mapping will form the basis for how we engage with suppliers to drive continuous improvement in line with our Leader-Mover-Improver framework.
Our long-term ambition is two-fold:
• All of our agricultural-based suppliers will demonstrate continuous improvement and will be categorized by The Coca-Cola Company as either Leaders, Movers or Improvers.
• All of our global priority ingredient suppliers and their farm supply base will achieve “Leader” status over time.
1 These approved standards, which can be found on our website, currently include Bonsucro for sugar; the Sustainable Agriculture Initiative Platform—Farm Sustainability Assessment (FSA) for crops including cane sugar, beet sugar and fruit; the Round Table for Responsible Soy for soybean; the Rainforest Alliance for coffee and tea; the Forest Stewardship Council for pulp and paper; and Field to Market for U.S. corn, among others. Certain third-party validation programs under the Sustainable Agriculture Guiding Principles (SAGP)—our previous framework that was in effect from 2013 to 2020—are still in the process of being evaluated for use under the PSA. Once this benchmarking process has been completed, the list of approved verifications will be updated.
Learn about our Governance of Sustainable Agriculture and other key ESG issues.
Leader
Florida Orange Growers Achieve “Leader” Performance LevelWe source a significant volume of oranges from Florida—but in 2020, none of our supply had been verified by an approved sustainable agriculture program. We approached the Sustainable Agriculture Initiative Platform (SAI Platform) and asked for their support to engage Florida orange growers on the topic of sustainability. The resulting project, known as the Florida Orange Sustainability FSA Accelerator, brought together 14 companies aligned around the same goal: to increase the volume of sustainable oranges grown in Florida. Together, the SAI Platform created consensus across the orange-processing industry, supporting growers in implementing more sustainable practices—and communicating the sustainable practices they were already employing. Our volume of sustainably sourced Florida oranges jumped significantly, from 0% in 2020 to 41% in 2021, and we expect the percentage to continue to grow.
CASE STUDY
Improver
Smallholder Farmers Improve Practices in IndiaIn India, the majority of farmers are smallholders who often lack the ability to verify their production against global standards. We have been driving several initiatives to help small-scale sugar cane and fruit farmers improve productivity, increase profitability and become more resilient. The sustainable agriculture project Meetha Sona Unnati began in 2016 with investments in sugar cane farmers in the state of Uttar Pradesh. It proved so successful that, together with our partners, we expanded it to the state of Karnataka. Under the flagship program Fruit Circular Economy we have extended these projects for growers of mangoes, oranges, apples, lychee and grapes—all crops that are important to our beverage production. To date, these programs have trained a combined total of more than 150,000 farmers in sustainable agricultural practices, including ultra-high-density plantation and drip irrigation.
CASE STUDY

Executive Summary
The Coca-Cola Company 2021 Business & ESG Report 44
CEO Message Portfolio Data AppendixOur Company PeoplePackaging FrameworksWater OperationsClimate Agriculture
Progress Toward Our GoalWe track progress against our sustainable sourcing goal for 12 global priority ingredients (cane sugar, mango, grape, orange, apple, corn, lemon, beet sugar, tea, pulp & paper, coffee and soybean), which represent about 80% of our total annual agricultural ingredient purchases. In 2021, following the launch of our PSA, we benchmarked over 500 suppliers in more than 115 countries and territories to begin mapping our global priority ingredient volumes against this new framework and establish a baseline. 58% of our priority ingredient volumes were sourced sustainably from suppliers using third-party validation programs already approved under the PSA, effective 2021. This means they met the "Leader" level in our PSA framework. We have made significant progress with our suppliers to validate or verify the farms where our ingredients are grown. We recognize, however, that sustainable agriculture is not a fixed destination but a long-term process that requires ongoing engagement between our business and our supply chains.
Planting Cover Crops Improves Soil Health in IndianaIn 2016 and 2017, The Nature Conservancy (TNC) and The Coca-Cola Company partnered with producers in the Big Pine Creek watershed in Indiana to establish cover crops on 2,660 acres of farmland.1 Producers planted a cereal rye cover crop outside the growing season of the main crops of corn and soybean, which are planted in rotation. When planted over several years, cover crops improve the overall health and water-holding capacity of soils,2 sequester carbon and reduce soil erosion and runoff.3 Following this initial investment and support, many farmers have continued to plant cover crops each year using their own funds. In 2021, out of the original 2,660 acres that were supported, a total of 1,264 acres of cover crops were planted.1 The total estimated decrease in runoff associated with the planting of these cover crops is 484 million liters per year.4 The decrease in sediment erosion is estimated at 2,001 metric tons per year.4
CASE STUDY
Improver
Fruto Resiliente in Brazil Smallholder farmers often face major challenges in having their production validated by a third party. So in 2019, we launched the “Fruto Resiliente” project with a goal of improving the farming practices of 480 smallholder orange growers in the Brazilian citrus belt by the end of 2023, with at least 50% of them reaching the equivalent of bronze level of the SAI FSA standard. The project is a collaborative partnership between The Coca-Cola Company, The Coca-Cola Foundation, innocent, Solidaridad, Cutrale (our largest orange juice supplier in Brazil), and Eckes Granini (a leading supplier of fruit juices and beverages). As of December 2021, the project had reached 800 orange growers through the dissemination of information using digital tools such as messaging apps, videos and live streams, and a website where farmers can download training manuals, booklets, etc. The project also included more than 300 visits by agriculture extension workers, who provide advisory services to farms and tailored action plans, and a signed partnership agreement with the Sylvio Moreira Citriculture Center (CCSM) of the Campinas Agronomic Institute (IAC). The project will utilize CCSM/IAC's demonstration farm to showcase and demonstrate sustainable agricultural practices to farmers. The project’s goal for 2022 is to improve the agricultural practices of at least 200 orange farmers.
CASE STUDY
2 The Ohio State University Extension. 2009. Using Cover Crops to Convert to No-till. Fact Sheet Agriculture and Natural Resources. SAG-11-09, AEX-540-09, ohioline.osu.edu/factsheet/SAG-11
3 Iowa State University Extension and Outreach. 2014. Reducing Nutrient Loss: Science Shows What Works. SP 435. September 2014, dr.lib.iastate.edu/entities/publication/dfad8a0c-5e87-427c-8209-d009949d7000
4 Data provided by Limnotech.1 Data provided by The Nature Conservancy.
58% 61%
GOAL: 100%
2020 2021
Sustainable Agriculture Guiding Principles (SAGP)Principles for Sustainable Agriculture (PSA)
56%
Total Sustainable Sourcing of All Priority Ingredients
This bar graph shows progress toward total sustainable sourcing of all 12 global priority ingredients, combined, using third-party validation programs approved under our PSA, effective 2021, alongside progress against our previous SAGP, effective 2013-2020. The company is working to finalize our benchmarking of third-party validation against the PSA standard, including verifications accepted under the SAGP for which benchmarking continues in 2022. We anticipate resumption of data reporting for individual priority ingredients once we have completed our benchmarking exercise.
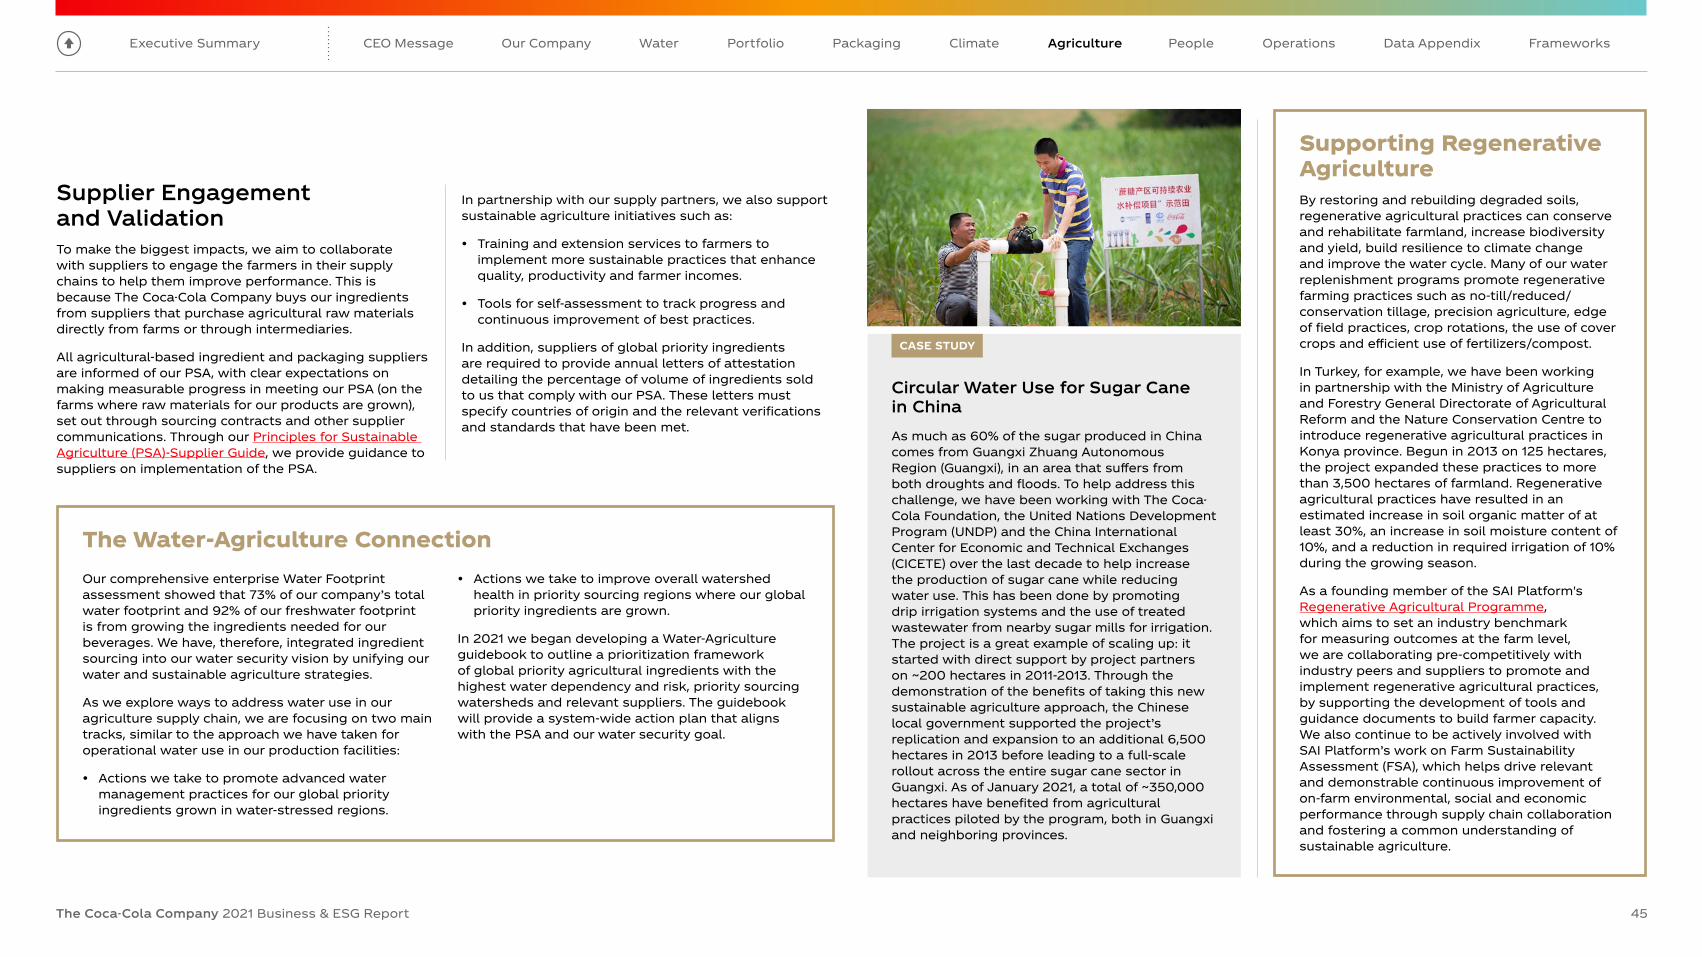
Executive Summary
The Coca-Cola Company 2021 Business & ESG Report 45
CEO Message Portfolio Data AppendixOur Company PeoplePackaging FrameworksWater OperationsClimate Agriculture
Supporting Regenerative AgricultureBy restoring and rebuilding degraded soils, regenerative agricultural practices can conserve and rehabilitate farmland, increase biodiversity and yield, build resilience to climate change and improve the water cycle. Many of our water replenishment programs promote regenerative farming practices such as no-till/reduced/conservation tillage, precision agriculture, edge of field practices, crop rotations, the use of cover crops and efficient use of fertilizers/compost.
In Turkey, for example, we have been working in partnership with the Ministry of Agriculture and Forestry General Directorate of Agricultural Reform and the Nature Conservation Centre to introduce regenerative agricultural practices in Konya province. Begun in 2013 on 125 hectares, the project expanded these practices to more than 3,500 hectares of farmland. Regenerative agricultural practices have resulted in an estimated increase in soil organic matter of at least 30%, an increase in soil moisture content of 10%, and a reduction in required irrigation of 10% during the growing season.
As a founding member of the SAI Platform's Regenerative Agricultural Programme, which aims to set an industry benchmark for measuring outcomes at the farm level, we are collaborating pre-competitively with industry peers and suppliers to promote and implement regenerative agricultural practices, by supporting the development of tools and guidance documents to build farmer capacity. We also continue to be actively involved with SAI Platform’s work on Farm Sustainability Assessment (FSA), which helps drive relevant and demonstrable continuous improvement of on-farm environmental, social and economic performance through supply chain collaboration and fostering a common understanding of sustainable agriculture.
Supplier Engagement and ValidationTo make the biggest impacts, we aim to collaborate with suppliers to engage the farmers in their supply chains to help them improve performance. This is because The Coca-Cola Company buys our ingredients from suppliers that purchase agricultural raw materials directly from farms or through intermediaries.
All agricultural-based ingredient and packaging suppliers are informed of our PSA, with clear expectations on making measurable progress in meeting our PSA (on the farms where raw materials for our products are grown), set out through sourcing contracts and other supplier communications. Through our Principles for Sustainable Agriculture (PSA)-Supplier Guide, we provide guidance to suppliers on implementation of the PSA.
In partnership with our supply partners, we also support sustainable agriculture initiatives such as:
• Training and extension services to farmers to implement more sustainable practices that enhance quality, productivity and farmer incomes.
• Tools for self-assessment to track progress and continuous improvement of best practices.
In addition, suppliers of global priority ingredients are required to provide annual letters of attestation detailing the percentage of volume of ingredients sold to us that comply with our PSA. These letters must specify countries of origin and the relevant verifications and standards that have been met.
Circular Water Use for Sugar Cane in ChinaAs much as 60% of the sugar produced in China comes from Guangxi Zhuang Autonomous Region (Guangxi), in an area that suffers from both droughts and floods. To help address this challenge, we have been working with The Coca-Cola Foundation, the United Nations Development Program (UNDP) and the China International Center for Economic and Technical Exchanges (CICETE) over the last decade to help increase the production of sugar cane while reducing water use. This has been done by promoting drip irrigation systems and the use of treated wastewater from nearby sugar mills for irrigation. The project is a great example of scaling up: it started with direct support by project partners on ~200 hectares in 2011-2013. Through the demonstration of the benefits of taking this new sustainable agriculture approach, the Chinese local government supported the project’s replication and expansion to an additional 6,500 hectares in 2013 before leading to a full-scale rollout across the entire sugar cane sector in Guangxi. As of January 2021, a total of ~350,000 hectares have benefited from agricultural practices piloted by the program, both in Guangxi and neighboring provinces.
CASE STUDY
The Water-Agriculture Connection Our comprehensive enterprise Water Footprint assessment showed that 73% of our company’s total water footprint and 92% of our freshwater footprint is from growing the ingredients needed for our beverages. We have, therefore, integrated ingredient sourcing into our water security vision by unifying our water and sustainable agriculture strategies.
As we explore ways to address water use in our agriculture supply chain, we are focusing on two main tracks, similar to the approach we have taken for operational water use in our production facilities:
• Actions we take to promote advanced water management practices for our global priority ingredients grown in water-stressed regions.
• Actions we take to improve overall watershed health in priority sourcing regions where our global priority ingredients are grown.
In 2021 we began developing a Water-Agriculture guidebook to outline a prioritization framework of global priority agricultural ingredients with the highest water dependency and risk, priority sourcing watersheds and relevant suppliers. The guidebook will provide a system-wide action plan that aligns with the PSA and our water security goal.

Executive Summary
The Coca-Cola Company 2021 Business & ESG Report 46
CEO Message AgriculturePortfolio Data AppendixOur Company Packaging FrameworksWater OperationsClimate
People & CommunitiesWe believe in putting our people first. Our people and culture initiatives are critical business priorities, and we strive to be a global employer of choice that attracts and retains high-performing talent with the passion, skills and mindsets to drive us on our journey to refresh the world and make a difference.
We believe each one of us has the power to make a difference, and our company and The Coca-Cola Foundation have a long history of investing in programs and activities that improve lives.
We value how we work as much as what we achieve, emphasizing inclusivity, empowerment, curiosity and agility. We champion diversity, equity and inclusion by building a workforce as diverse as the consumers we serve. And we use our global scale to be a force for progress and for good.
Our company’s impacts on people extend well beyond our own business. We are committed to caring for those who make our success possible, whether through respecting human rights across our operations and supply chain, empowering access to equal opportunities, supporting more sustainable agriculture practices, or giving back to communities through our philanthropic initiatives.
People
46
See additional performance indicators in the Data Appendix.
~700Kemployed by The Coca-Cola Company and our approximately 225 bottling partners
~79Kemployed by The Coca-Cola Company
Overview Human Rights Economic Empowerment Safety & Health Diversity, Equity & Inclusion Giving Back

Executive Summary
The Coca-Cola Company 2021 Business & ESG Report 47
Overview Diversity, Equity & InclusionEconomic Empowerment Giving BackSafety & Health
CEO Message AgriculturePortfolio Data AppendixOur Company Packaging FrameworksWater OperationsClimate People
Human Rights
Respecting Human RightsThe Coca-Cola Company’s policies and practices are aligned with the UN Guiding Principles on Business and Human Rights, which we have supported since their inception in 2011. We work to embed respect forhuman rights across our system through a comprehensive framework of policies, stakeholder engagement, due diligence and remediation.
Human Rights Due DiligenceIn line with the UN Guiding Principles, we carry out human rights due diligence across our value chain. We regularly assess our key human rights risks and ensure that we are taking steps to identify and address them.
We maintain an industry-leading global audit program of our own operations, as well as those of our bottling partners and Tier 1 suppliers, with over 38,000 human rights assessments conducted since 2003. We audit facilities using the same protocol in every market where our system and suppliers operate. As of the end of 2021, 95% of our own operations, 93% of system bottlers and 92% of our Tier 1 suppliers complied with our rigorous SGP protocols. These audit results are reviewed by the ESG and Public Policy Committee of our Board of Directors on an annual basis. Despite falling short of our ambitious goals due to the impact of COVID-19, these results show remarkable improvement across our value chain. We will continue to advance our human rights strategy and work.
We have also worked to extend our supplier due diligence beyond Tier 1. For instance, we collaborate with our Tier 1 ingredient suppliers to drive respect for human rights within their supply chain at the farm-level through our PSA program. And we have developed a due diligence module specifically tailored to the unique challenges of the informal waste collection sector and our World Without Waste initiative. More information on our due diligence program can be found in our Human Rights 2022 Overview.
See additional performance indicators in the Data Appendix.
PoliciesOur Human Rights Policy captures the company’s overall commitment to human rights. We extend these requirements contractually to suppliers through our Supplier Guiding Principles (SGP) and our Principles for Sustainable Agriculture (PSA), each setting clear and strict requirements for human rights.
Stakeholder EngagementOur approach to stakeholder engagement is an ongoing dialogue that enables us to identify and address potential human rights issues proactively and collaboratively. We partner with a wide range of stakeholders both within the Coca-Cola system and externally across the private, public, civil society and labor sectors, leading to continuous improvement in our work to respect human rights.
Learn more about Stakeholder Engagement & Partnerships
2,848 AUDITSconducted in 2021
Human Rights Training and ResourcesIn addition to compliance audits, our company supports bottling partner and supplier capacity building through in-person training sessions and the provision of human rights resources such as checklists, toolkits and guidelines. In 2021, we conducted bottler and supplier human rights-focused training attended by more than 1,500 participants.
See our Human Rights 2022 Overview for comprehensive disclosures of our human rights policies, governance, due diligence, access to remedy and grievance mechanisms.
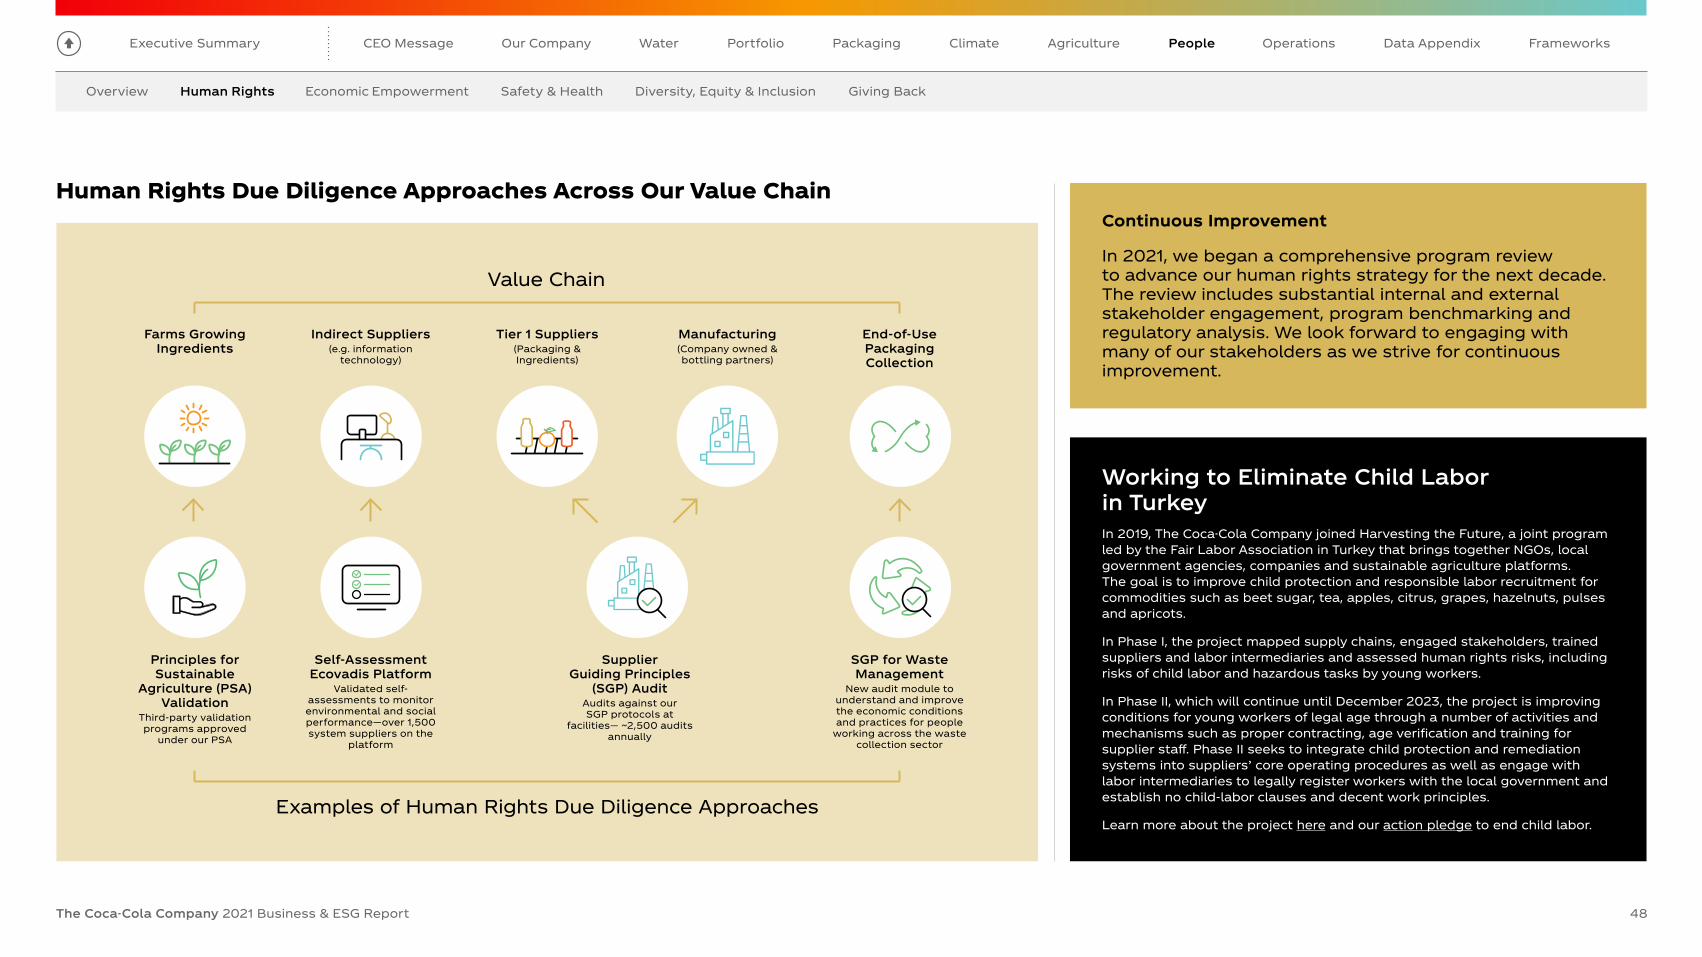
Executive Summary
The Coca-Cola Company 2021 Business & ESG Report 48
Overview Diversity, Equity & InclusionEconomic Empowerment Giving BackSafety & Health
CEO Message AgriculturePortfolio Data AppendixOur Company Packaging FrameworksWater OperationsClimate People
Human Rights
Working to Eliminate Child Labor in TurkeyIn 2019, The Coca-Cola Company joined Harvesting the Future, a joint program led by the Fair Labor Association in Turkey that brings together NGOs, local government agencies, companies and sustainable agriculture platforms. The goal is to improve child protection and responsible labor recruitment for commodities such as beet sugar, tea, apples, citrus, grapes, hazelnuts, pulses and apricots.
In Phase I, the project mapped supply chains, engaged stakeholders, trained suppliers and labor intermediaries and assessed human rights risks, including risks of child labor and hazardous tasks by young workers.
In Phase II, which will continue until December 2023, the project is improving conditions for young workers of legal age through a number of activities and mechanisms such as proper contracting, age verification and training for supplier staff. Phase II seeks to integrate child protection and remediation systems into suppliers’ core operating procedures as well as engage with labor intermediaries to legally register workers with the local government and establish no child-labor clauses and decent work principles.
Learn more about the project here and our action pledge to end child labor.
Continuous Improvement
In 2021, we began a comprehensive program review to advance our human rights strategy for the next decade. The review includes substantial internal and external stakeholder engagement, program benchmarking and regulatory analysis. We look forward to engaging with many of our stakeholders as we strive for continuous improvement.
Human Rights Due Diligence Approaches Across Our Value Chain
Value Chain
Farms Growing Ingredients
Tier 1 Suppliers(Packaging & Ingredients)
Indirect Suppliers (e.g. information
technology)
Manufacturing(Company owned & bottling partners)
End-of-Use Packaging Collection
Examples of Human Rights Due Diligence Approaches
Principles for Sustainable
Agriculture (PSA) Validation
Third-party validation programs approved
under our PSA
SGP for Waste Management
New audit module to understand and improve the economic conditions and practices for people
working across the waste collection sector
Supplier Guiding Principles
(SGP) AuditAudits against our SGP protocols at
facilities— ~2,500 audits annually
Self-AssessmentEcovadis Platform
Validated self-assessments to monitor environmental and social performance—over 1,500 system suppliers on the
platform

Executive Summary
The Coca-Cola Company 2021 Business & ESG Report 49
CEO Message AgriculturePortfolio Data AppendixOur Company PeoplePackaging FrameworksWater OperationsClimate
We’ve recently partnered with two companies to harness their technologies to empower some of the most vulnerable members of society who operate in different areas of our value chain and to better identify and analyze human rights risks in labor recruitment supply chains.
BanQu Improves Transparency and Traceability in the Recycled Material Supply ChainIn South Africa, much of the paper and packaging waste that is collected is sold to small buy-back centers or aggregators before ultimately reaching large recycling companies. Waste pickers involved in this process typically lack access to formal financial services.
Enter our new partnership with BanQu, which uses blockchain technology to track, trace and ensure payment for collected recyclable material. Our Africa operating unit is rolling out the BanQu platform as a service to 100 buy-back centers or aggregators that buy and sell recyclable material. The project is providing these small businesses with free access to the BanQu system, allowing them to record their cashless transactions in a blockchain-based system that works with any smartphone or tablet. Waste pickers also benefit by receiving verification of transactions via text message.
These records, which are similar to a pay slip, can provide waste pickers with the proof of economic activity necessary to access banking and financial services as well as gain integration with the government’s waste picker registry. Waste pickers will be able to receive and make payments on the cashless system at low cost, avoiding the risks inherent in handling cash. We plan to register around 10,000 waste pickers by the end of 2022.
diginexLUMEN Supports Responsible Recruitment PracticesIn the Middle East, we have a project to help support responsible recruitment of migrant workers.
We recently partnered with Diginex to develop diginexLUMEN (LUMEN), a technology-led due diligence and governance tool that can provide greater transparency of the labor recruitment supply chain. LUMEN helps to identify and prioritize human rights and labor risks by collecting, verifying and mapping data on recruitment and employment practices from various sources including workers, suppliers and labor agencies. Risk scoring is used to develop action plans to address risks and ensure continuous improvement in ethical recruitment.
In 2021, we piloted LUMEN at several locations, including two bottling plants, five supplier facilities and three labor agencies in the United Arab Emirates and Qatar. We are looking to expand the use of LUMEN to more facilities in the near future.
Aligns with these UN Sustainability Goals
BETWEEN FEBRUARY 2021 AND FEBRUARY 2022
2,200+waste pickers registered
51,000+transactions recorded
3.2M+kg of packaging recycled
Using Technology to Better Manage Risks and Empower Workers
SPOTLIGHT STORY
READ MORE STORIES 1 2 3 4

Executive Summary
The Coca-Cola Company 2021 Business & ESG Report 50
Human RightsOverview Diversity, Equity & Inclusion Giving BackSafety & Health
CEO Message AgriculturePortfolio Data AppendixOur Company Packaging FrameworksWater OperationsClimate People
Economic Empowerment
Economic EmpowermentThe Coca-Cola system has a long history of enabling the economic empowerment of local communities where we do business. With operations in more than 200 countries and territories and a network of more than 225 bottling partners, we partner with entrepreneurs in markets where we operate around the world.
In 2010, we set out to address the structural inequalities and economic barriers faced by women entrepreneurs in particular. We publicly pledged to enable the economic empowerment of 5 million female entrepreneurs by 2020 through our 5by20® initiative, by providing access to business skills training, mentoring networks, financial services and assets. Together with our public and private sector partners, including our bottling partners and The Coca-Cola Foundation, we exceeded our target, enabling the economic empowerment of more than 6 million women.
Economic Empowerment in 2021We surpassed our economic empowerment goal in 2020, and the Coca-Cola system continued to drive women’s economic empowerment initiatives across our regions in 2021.
In 2021, Coca-Cola Bangladesh partnered with the development organization United Purpose to create 30 Women’s Business Centers where more than 30,000 women received business skills training. Between 2015 and 2020, Coca-Cola and United Purpose built a network of more than 70 such training centers, supporting 100,000 women with business and technology skills and putting them on the path toward economic self-reliance.
The Nigerian Bottling Company kicked off the second phase of “Catalyst for Change,” an economic empowerment program coordinated in partnership with the nonprofit Karis and Eleos Hand of Hope Foundation, with funding from The Coca-Cola Foundation. The project will provide startup capital for 1,000 women and ultimately empower 5,000 women.
In the Philippines, we extended our support of a program that offers interest-free loans to entrepreneurs who operate small variety stores and food stalls. The Rebuilding Sari-Sari Stores Through Access to Resources and Trade (ReSTART) program, which began in 2020 in partnership with government agencies and two leading micro-finance institutions, has supported more than 20,000 micro and small business owners—the majority of them women.

Executive Summary
The Coca-Cola Company 2021 Business & ESG Report 51
Human RightsOverview Diversity, Equity & InclusionEconomic Empowerment Giving Back
CEO Message AgriculturePortfolio Data AppendixOur Company Packaging FrameworksWater OperationsClimate
Maintaining Safety During the PandemicThroughout the evolution of the COVID-19 pandemic, we have been diligent in ensuring employee safety while also maintaining business continuity. We continue to monitor the global landscape and risks as new variants emerge, maintaining rigorous internal controls and following local requirements.
People
Safety & Health
Employee Safety & Health
In 2021, we strengthened our Safety & Health strategy to drive performance across our system and reinforce safety as a key part of our core values. We implemented a comprehensive, preventative program to further identify and mitigate the potential for serious incidents to occur in our facilities. Our safety program includes a set of front-line and management responsibilities and behaviors that must be proactively demonstrated, including guidance tools and indicators to recognize, evaluate and ensure controls are in place to prevent such incidents from occurring.
Management commitment and strong employee engagement play an important role in creating a safe and healthy workplace and supporting a culture of learning and improving, and all employees are our partners in embedding safe habits and strengthening our safety culture. We are also promoting a learning environment by continuing to engage directly with employees to uncover hidden safety risks and challenges and to champion transparency.
While we have been demonstrating year-over-year improvements to our injury rates, we continue to experience preventable incidents within our global system. We believe that one preventable serious injury is too many, and we have processes in place to ensure our employees and contractors report all injuries, regardless of severity.
Our digital Environmental Occupational Health and Safety performance management tools help us identify potential incidents so we can gain insights and establish ways to prevent them. Our knowledge-sharing platform allows our operating units and bottling partners to easily communicate information so we can learn faster, share those learnings across the system and prevent similar incidents from happening elsewhere.
After any preventable incident occurs or had the potential to occur, we conduct thorough learning sessions, develop corrective action plans and share them across our system and with our Global Safety Council.
A safe workplace is fundamental to our success as a company. Our objective is simple: Every day, the people who make and distribute our products should leave work as healthy and as safe as when they arrived. Inspired by our “Zero is Possible” vision, we work to identify and control preventable serious injuries in our system’s facilities.
Internal AuditsWe regularly conduct unannounced on-site audits across our bottling operations to validate workplace safety as well as compliance with our food safety, quality and environmental requirements. In 2021, we reset our safety audit framework to focus on a facility’s holistic approach to risk management and compliance. The audits, which were piloted at eight bottling plants, provided even further understanding for how facilities are driving safe behaviors and engaging with employees. Throughout 2021, due to travel restrictions as a result of the ongoing COVID-19 pandemic, the majority of our audits were conducted virtually.
1 Global Ventures, CHI, fairlife and BODYARMOR employees are currently excluded from our LTIR reporting. For more information, view the criteria statement.
See additional performance indicators in the Data Appendix.
The Coca-Cola Company’s global Lost-Time Incident Rate was 0.28 in 2021.1

Executive Summary
The Coca-Cola Company 2021 Business & ESG Report 52
Human RightsOverview Economic Empowerment Giving BackSafety & Health
CEO Message AgriculturePortfolio Data AppendixOur Company Packaging FrameworksWater OperationsClimate People
Diversity, Equity & Inclusion
We focus our internal and external DEI efforts across five broad dimensions of diversity:
• Gender Balance• Culture & Heritage• Ability & Wellness• Generations & Life Experiences• LGBTIQ+
Our strategy, which incorporates social justice and economic empowerment work, will be woven into how we do business and function as teams—from talent management to supply chain.
Pay EquityAt The Coca-Cola Company, we believe in equal pay for equal work. We define pay equity as compensating employees fairly and equitably, without regard to gender, or race and ethnicity (globally and in the United States, respectively).
For several years, we have conducted pay equity analyses in the United States to ensure base pay structures are fair and to identify and address potential issues or disparities. In 2019, we extended pay equity analysis for gender globally. In 2021, we took a deeper dive on pay equity, hiring an external consultant to conduct a global pay equity audit. Given the company’s significant organizational changes in 2021, we will conduct a follow-up analysis in 2022. We will continue to conduct annual analyses and are motivated by the opportunity to build a more equitable and inclusive culture. Read more about our pay equity philosophy.
Building Accountability and Developing ToolsIn 2022, the Talent and Compensation Committee of our Board of Directors approved plans to link ESG performance measures to our annual and long-term incentive programs for executives. In the annual incentive program, we are reinforcing our commitment to DEI by incorporating demonstrable commitments by executives to reach goals that reflect our 2030 aspirations to be 50% led by women globally, and, in the United States, to align race and ethnicity representation to U.S. census data across all job levels.
In 2021, we developed a global social justice issue evaluation methodology and tool in partnership with BSR, a leading sustainability nonprofit, to help regional public affairs and human resources leaders effectively and consistently evaluate whether and how to engage on social justice issues locally.
Diversity, Equity & InclusionWe believe that a diverse, equitable and inclusive workplace makes us stronger as a company, enables us to create a better shared future for employees and communities, empowers access to equal opportunity, and builds belonging in our workplaces and in society.
In 2021, we refreshed our Diversity, Equity & Inclusion (DEI) strategy to expand the global reach and impact of our programs and policies while driving accountability. The updated strategy also deepens our focus on equity that took center stage in 2020 amidst a climate of widespread civil unrest and global conversations about systemic racism and inequality.
Our refreshed DEI strategy is rooted in three long-term ambitions:
1We aspire for our diverse workforce to mirror the markets we serve.
2We strive for equity for all people.
3We celebrate uniqueness and create an inclusive environment.

Executive Summary
The Coca-Cola Company 2021 Business & ESG Report 53
Human RightsOverview Economic Empowerment Giving BackSafety & Health
CEO Message AgriculturePortfolio Data AppendixOur Company Packaging FrameworksWater OperationsClimate People
Diversity, Equity & Inclusion
10.0%
0.2%
62.7% 8.4%
8.2%
9.4%
0.2%
0.9%
61.3%
38.7%
58.0%
15.4%
8.9%
10.4%
0.2%4.8%
2.0%
0.3%
50.5% 49.5%
20.6%
4.2%
27.4%42.3%
2.1%0.3%
2.5%
0.6%
64.7%
35.3%
20.9%
50.4%
14.8%
0.2%
7.2%
2.2%
0.5%
3.8%
42.9%
57.1%
Mirroring the Markets We Serve by 2030
• Aspiring to be 50% led by women globally
• Aligning U.S. race/ethnicity representation to U.S. census data across all job levels
Transparency and ReportingWe are committed to transparency and disclosure. We share diversity metrics with senior leaders on a quarterly basis and publish representation data by race and gender for our overall workforce and leadership, including data submitted to the U.S. Equal Employment Opportunity Commission (EEO-1 survey results), on our website.
1 Data as of December 31, 2021, for salaried and hourly employees. People of color is for U.S. workforce only. This data excludes Bottling Investments Group (BIG), Global Ventures and CHI, as well as newly acquired entities fairlife and BODYARMOR.
Middle Management Total
2021 Gender Representation by Level (global)1
Professionals
Female Male
Senior Leadership
Middle Management Total
2021 Race/Ethnicity Representation by Level (U.S. only)1
ProfessionalsSenior Leadership
American Indian/Alaskan Asian Black Hispanic Native Hawaiian/Pacific Islander Not disclosed Two or more races White
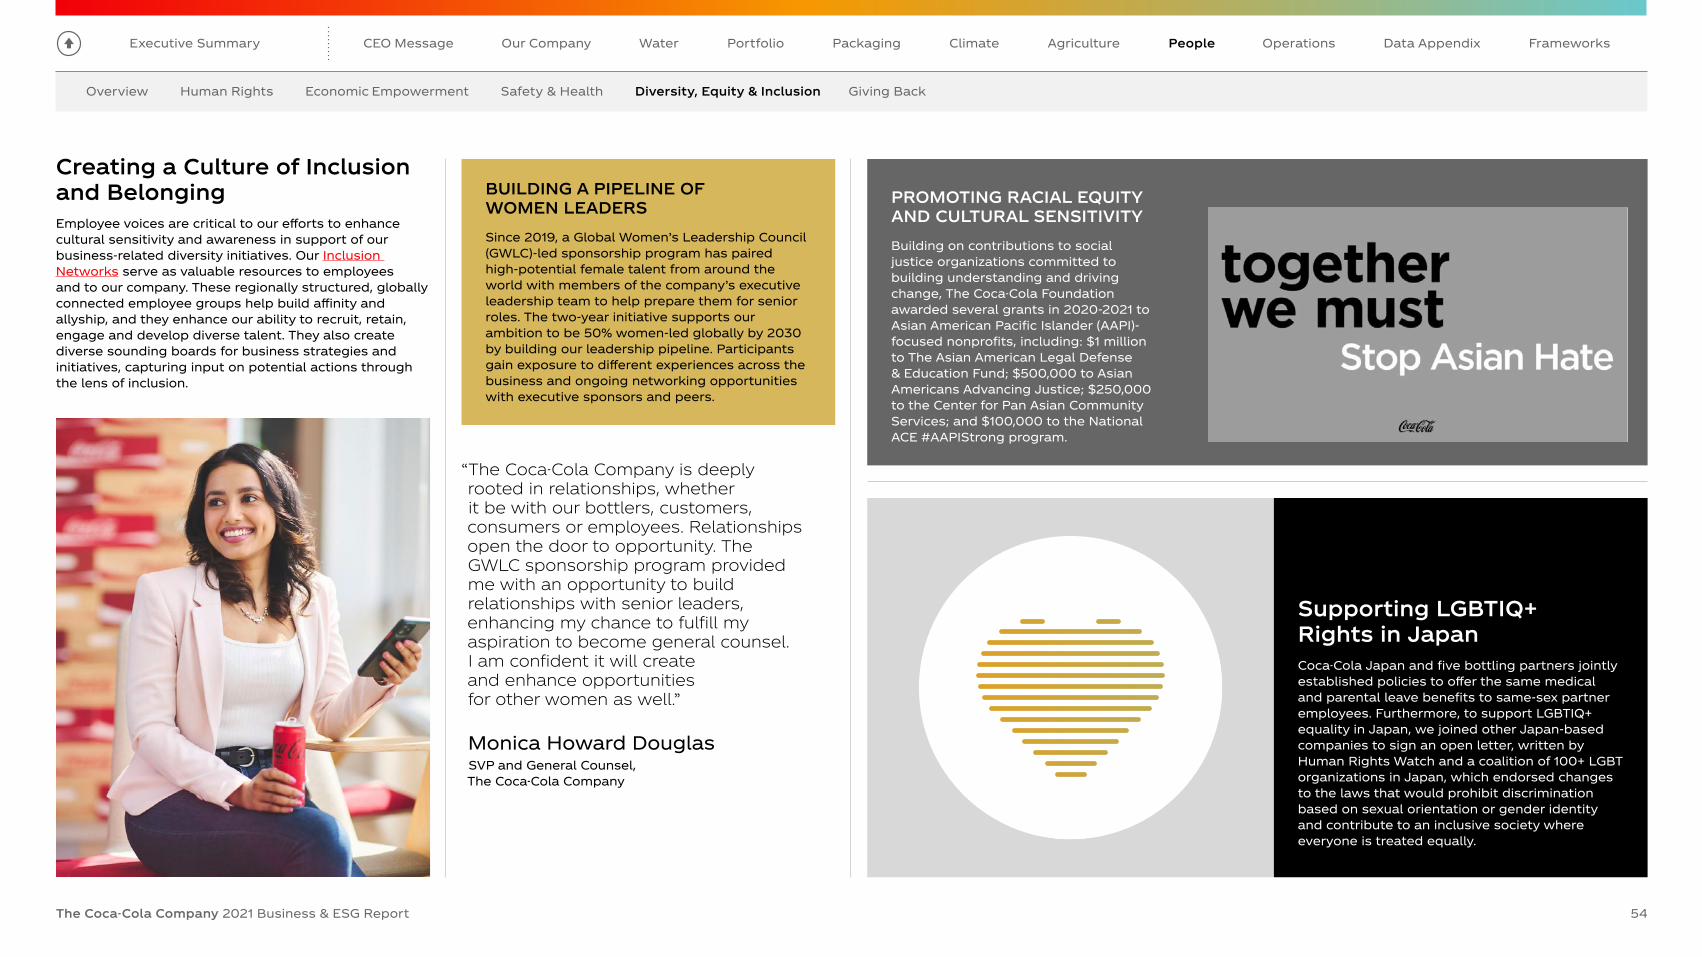
Executive Summary
The Coca-Cola Company 2021 Business & ESG Report 54
Human RightsOverview Economic Empowerment Giving BackSafety & Health
CEO Message AgriculturePortfolio Data AppendixOur Company Packaging FrameworksWater OperationsClimate People
Diversity, Equity & Inclusion
Creating a Culture of Inclusion and BelongingEmployee voices are critical to our efforts to enhance cultural sensitivity and awareness in support of our business-related diversity initiatives. Our Inclusion Networks serve as valuable resources to employees and to our company. These regionally structured, globally connected employee groups help build affinity and allyship, and they enhance our ability to recruit, retain, engage and develop diverse talent. They also create diverse sounding boards for business strategies and initiatives, capturing input on potential actions through the lens of inclusion.
BUILDING A PIPELINE OF WOMEN LEADERSSince 2019, a Global Women’s Leadership Council (GWLC)-led sponsorship program has paired high-potential female talent from around the world with members of the company’s executive leadership team to help prepare them for senior roles. The two-year initiative supports our ambition to be 50% women-led globally by 2030 by building our leadership pipeline. Participants gain exposure to different experiences across the business and ongoing networking opportunities with executive sponsors and peers.
“The Coca-Cola Company is deeply rooted in relationships, whether it be with our bottlers, customers, consumers or employees. Relationships open the door to opportunity. The GWLC sponsorship program provided me with an opportunity to build relationships with senior leaders, enhancing my chance to fulfill my aspiration to become general counsel. I am confident it will create and enhance opportunities for other women as well.”
Monica Howard DouglasSVP and General Counsel, The Coca-Cola Company
Supporting LGBTIQ+ Rights in Japan Coca-Cola Japan and five bottling partners jointly established policies to offer the same medical and parental leave benefits to same-sex partner employees. Furthermore, to support LGBTIQ+ equality in Japan, we joined other Japan-based companies to sign an open letter, written by Human Rights Watch and a coalition of 100+ LGBT organizations in Japan, which endorsed changes to the laws that would prohibit discrimination based on sexual orientation or gender identity and contribute to an inclusive society where everyone is treated equally.
PROMOTING RACIAL EQUITY AND CULTURAL SENSITIVITYBuilding on contributions to social justice organizations committed to building understanding and driving change, The Coca-Cola Foundation awarded several grants in 2020-2021 to Asian American Pacific Islander (AAPI)-focused nonprofits, including: $1 million to The Asian American Legal Defense & Education Fund; $500,000 to Asian Americans Advancing Justice; $250,000 to the Center for Pan Asian Community Services; and $100,000 to the National ACE #AAPIStrong program.

Executive Summary
The Coca-Cola Company 2021 Business & ESG Report 55
Human RightsOverview Economic Empowerment Giving BackSafety & Health
CEO Message AgriculturePortfolio Data AppendixOur Company Packaging FrameworksWater OperationsClimate People
Diversity, Equity & Inclusion
FOSTERING DIVERSITY IN DATA SCIENCESTogether with SAP, we are partnering with the Atlanta University Center Data Science Initiative to establish a virtual computer lab at the Robert W. Woodruff Library and offer internships for students at several local Historically Black Colleges and Universities. The initiative aims to become the largest producer of Black graduates with expertise and credentials in data science.
“We acknowledge the disadvantages that some smaller companies have in competing for business opportunities with large multinational companies. We’re excited about the potential of this program to pioneer a more evolved and inclusive approach to supporting minority-owned media companies and partners.”
Fernando HernandezVice President, Supplier Diversity, The Coca-Cola Company
SUPPORTING MINORITY-OWNED MEDIAIn 2021, we announced plans to nearly double our spending with minority-owned media companies over the next three years in North America. This means that Black, Hispanic and Asian American Pacific Islander (AAPI)-owned and led media companies and partners will increase to account for 8% of our total annual media budget in North America by 2024. We achieved our stated goal of a fivefold increase in spending with minority-owned media companies in 2021 versus 2020, and we are on track to achieve our three-year target by 2024. Across our supply chain, we have committed to step up spending with Black-owned enterprises by at least $500 million cumulatively by 2025.
To help Black, Hispanic and AAPI media partners grow, our global procurement team launched a pilot certification assistance program in partnership with the Georgia Minority Supplier Development Council.
Accelerating Our Supplier Diversity CommitmentsWe are focused on increasing the overall diversity of our suppliers and have committed to spending at least $1 billion annually with diverse suppliers. We aspire to join the Billion Dollar Roundtable—the gold standard of supplier diversity, currently with only 27 member companies.
1 As of 2021, we are aligning our reported spending metrics with the Roundtable’s criteria by only including Tier 1 supplier spending. We previously combined both Tier 1 spending (our direct suppliers) and Tier 2 spending (the amount our suppliers spend with their diverse suppliers).
$800Mspent by the Coca-Cola system with diverse suppliers in the United States in 20211
RECRUITING AND DEVELOPING DIVERSE MARKETING TALENTIn 2021, the North America operating unit (NAOU) marketing team championed greater diversity across all levels of its organization—from the newly minted role of VP of Multicultural Marketing to 19 new brand assistants. By widening the field of candidates through the removal of the MBA requirement, as well as creating a new summer internship program in partnership with Historically Black Colleges and Universities and the National Black MBA Association, recruitment efforts reflect our ambitions for our workforce to mirror the communities in which we live and work.
“Today’s consumers reflect a richly diverse culture—not only of ethnicity, but also of thought and experience. They are looking for brands that are authentic, purpose-driven and relatable. It’s our job to reflect the diversity of the communities we serve and the consumers we’re trying to attract.”
Melanie BouldenChief Marketing Officer, North America Operating Unit The Coca-Cola Company

Executive Summary
The Coca-Cola Company 2021 Business & ESG Report 56
Human RightsOverview Diversity, Equity & InclusionEconomic Empowerment Safety & Health
CEO Message AgriculturePortfolio Data AppendixOur Company Packaging FrameworksWater OperationsClimate People
Giving Back
Giving Back to Communities
Stopping the Spread of COVID-19In 2021, our contributions included the creation of a $20 million fund to help stop the spread of COVID-19, including support for distribution of vaccines and personal protective equipment (PPE), public awareness campaigns and more—bringing the Foundation’s total pandemic-focused funding to more than $75 million over the last two years.
The $20 million “Stop the Spread” Fund awarded 63 grants to 56 nonprofit partners, benefiting 30 million people in 59 countries. Larger grants included $3.6 million to United Way of Mumbai to support vaccine distribution initiatives and public awareness campaigns in 22 districts across India and $5 million in funding to Project Last Mile to support vaccine rollouts in eight African countries.
The Coca-Cola Foundation, the independent philanthropic arm of The Coca-Cola Company, is committed to a charitable giving strategy that makes a difference in communities around the world. In 2021, The Coca-Cola Foundation contributed $109.2 million to approximately 350 organizations globally.
The Coca-Cola Foundation2021 Contributions
21%
15%
11%
10%
7%5%
18%
13%
COVID-19$22.6M
Social Justice$0.3M/0%
Water & Environment$19.7M
Community Well-Being
$13.9M
Education& Youth
Development$11.6M
Women’sEmpowerment
$10.9M
Disaster Relief& Humanitarian Aid
$8.0M
MatchingGifts
$6.1M
Recycling$16.1M
$109.2Mimpacting
150M+ people
LENDING A HAND IN OUR HOMETOWN We continue to invest in the well-being of Atlanta, a city we’ve proudly called home for more than 135 years. In 2021, we awarded several major grants to organizations in our community:
• $5 million to Children’s Healthcare of Atlanta—the largest and only freestanding pediatric healthcare system in Georgia—to create a behavioral and mental health system of care that will leverage early intervention to improve outcomes, reduce stigma and enhance access to prevention, diagnosis and treatment
• $2 million to the Robert W. Woodruff Arts Center for expansion of community access to the performing and visual arts and for support of professional development for diverse artists
• $2 million to the Atlanta BeltLine Partnership in support of green infrastructure projects at two parks
• $1 million to support scholarships at Morehouse College for students who are the first in their families to attend college
• $1.5 million to support the United Way of Metropolitan Atlanta’s Child Well-Being Impact Fund
$1.4B+DONATEDby The Coca-Cola Foundation since its inception in 1984
Responding to Natural Disasters and Humanitarian Crises We remain committed to supporting communities in times of crisis. In 2021, the Foundation provided more than $7 million in funding for natural disaster preparedness and relief—as well as other humanitarian aid efforts. These donations supported 15 countries and included responses to earthquakes in Haiti and Croatia; flooding in Sudan, Canada, Germany, China and Belgium; tornados, winter storms and Hurricane Ida in the United States; wildfires in Turkey; a volcano in the Caribbean; a super typhoon in the Philippines; and the refugee crisis in Afghanistan.
1 This percentage was calculated based on the company’s prior year operating income (excluding the Bottling Investments Group operating segment).
2.0%of operating income invested back into local communities from The Coca-Cola Company and The Coca-Cola Foundation in 2021—well above our annual goal of 1%1
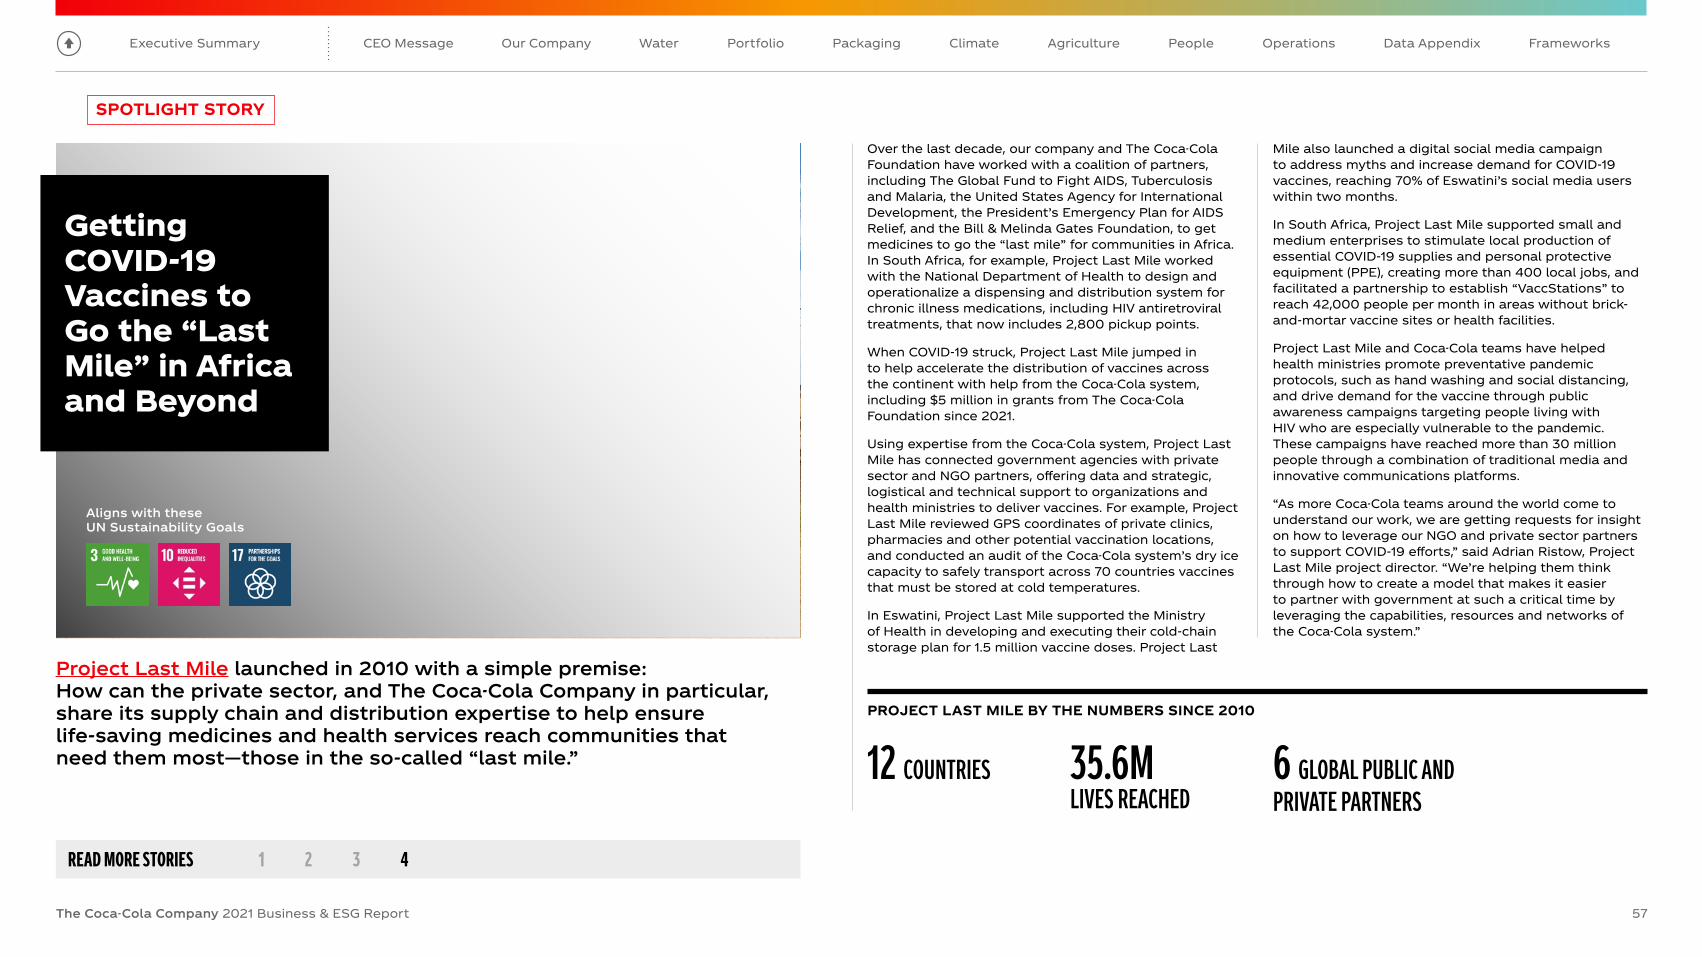
Executive Summary
The Coca-Cola Company 2021 Business & ESG Report 57
CEO Message AgriculturePortfolio Data AppendixOur Company PeoplePackaging FrameworksWater OperationsClimate
Project Last Mile launched in 2010 with a simple premise: How can the private sector, and The Coca-Cola Company in particular, share its supply chain and distribution expertise to help ensure life-saving medicines and health services reach communities that need them most—those in the so-called “last mile.”
Over the last decade, our company and The Coca-Cola Foundation have worked with a coalition of partners, including The Global Fund to Fight AIDS, Tuberculosis and Malaria, the United States Agency for International Development, the President’s Emergency Plan for AIDS Relief, and the Bill & Melinda Gates Foundation, to get medicines to go the “last mile” for communities in Africa. In South Africa, for example, Project Last Mile worked with the National Department of Health to design and operationalize a dispensing and distribution system for chronic illness medications, including HIV antiretroviral treatments, that now includes 2,800 pickup points.
When COVID-19 struck, Project Last Mile jumped in to help accelerate the distribution of vaccines across the continent with help from the Coca-Cola system, including $5 million in grants from The Coca-Cola Foundation since 2021.
Using expertise from the Coca-Cola system, Project Last Mile has connected government agencies with private sector and NGO partners, offering data and strategic, logistical and technical support to organizations and health ministries to deliver vaccines. For example, Project Last Mile reviewed GPS coordinates of private clinics, pharmacies and other potential vaccination locations, and conducted an audit of the Coca-Cola system’s dry ice capacity to safely transport across 70 countries vaccines that must be stored at cold temperatures.
In Eswatini, Project Last Mile supported the Ministry of Health in developing and executing their cold-chain storage plan for 1.5 million vaccine doses. Project Last
Mile also launched a digital social media campaign to address myths and increase demand for COVID-19 vaccines, reaching 70% of Eswatini’s social media users within two months.
In South Africa, Project Last Mile supported small and medium enterprises to stimulate local production of essential COVID-19 supplies and personal protective equipment (PPE), creating more than 400 local jobs, and facilitated a partnership to establish “VaccStations” to reach 42,000 people per month in areas without brick-and-mortar vaccine sites or health facilities.
Project Last Mile and Coca-Cola teams have helped health ministries promote preventative pandemic protocols, such as hand washing and social distancing, and drive demand for the vaccine through public awareness campaigns targeting people living with HIV who are especially vulnerable to the pandemic. These campaigns have reached more than 30 million people through a combination of traditional media and innovative communications platforms.
“As more Coca-Cola teams around the world come to understand our work, we are getting requests for insight on how to leverage our NGO and private sector partners to support COVID-19 efforts,” said Adrian Ristow, Project Last Mile project director. “We’re helping them think through how to create a model that makes it easier to partner with government at such a critical time by leveraging the capabilities, resources and networks of the Coca-Cola system.”
Getting COVID-19 Vaccines to Go the “Last Mile” in Africa and Beyond
Aligns with these UN Sustainability Goals
PROJECT LAST MILE BY THE NUMBERS SINCE 2010
12 COUNTRIES 35.6M LIVES REACHED
6 GLOBAL PUBLIC AND PRIVATE PARTNERS
SPOTLIGHT STORY
READ MORE STORIES 1 2 3 4

Executive Summary
The Coca-Cola Company 2021 Business & ESG Report 58
CEO Message AgriculturePortfolio Data AppendixOur Company PeoplePackaging FrameworksWater Climate Operations
Overview Global Ventures/Bottling Investments GroupNorth AmericaLatin AmericaEurope, Middle East & AfricaAsia Pacific
2021 WORLDWIDE UNIT CASE VOLUME MIX BY OPERATING SEGMENT
23%ASIA PACIFIC
29%EUROPE, MIDDLE EAST & AFRICA
27%LATIN AMERICA
18%NORTH AMERICA
3%GLOBAL VENTURES
58
2.1Bservings each day in more than 200 countries and territories around the world
Operations HighlightsOur networked organization is comprised of nine operating units that are focused on regional and local execution and sit under four geographic operating segments—Asia Pacific; Europe, Middle East & Africa; Latin America; and North America, plus Global Ventures and Bottling Investments Group. This structure is supported by our Platform Services organization and center functions, which collectively provide global services and expertise across a range of critical capabilities.
The following pages offer a look at our operations, their business results and some key activities from 2021.

Executive Summary
The Coca-Cola Company 2021 Business & ESG Report 59
CEO Message AgriculturePortfolio Data AppendixOur Company PeoplePackaging FrameworksWater Climate Operations
Investing in Solar in IndiaIn India, SLMG Beverages Private Limited—our largest franchise bottling partner in India—is working toward maximizing use of solar energy in its operations through investments and installation of solar panels across its facilities. The company, which has seven state-of-the-art plants and a strong network of 1,500+ distributors in the country, met 22% of its electricity requirement in 2021 through solar energy. The company has so far invested $13 million on installation of solar power plants with a combined capacity of 22 megawatts (MW).
Asia Pacific2021 Highlights• In 2021, Coca-Cola Japan introduced 100% recycled
PET bottles for two brands: Coca-Cola and Georgia—and 40% of the PET plastic used in Japan in 2021 was either from recycled or renewable material.
• South Korea launched the first label-less Coca-Cola PET plastic bottle with the iconic contour shape and engraved logo, making the bottle easier to recycle.
• Sparkling flavors in India and Southwest Asia grew, as local favorite brand Thums Up increased its annual retail sales to over $1 billion.
• fairlife debuted in China through KeNiuLe, a joint-venture between The Coca-Cola Company and China Mengniu Dairy, with plans to launch a suite of chilled milk products.
• Coca-Cola Europacific Partners (CCEP) established a joint venture with Pact Group, Cleanaway and Asahi Beverages to build and operate a $45 million rPET recycling facility in Victoria, Australia.
• We collaborated with Bangladesh Petrochemical Private Limited and our bottling partners at Abdul Monem Limited to launch a bottle containing 10% rPET for Kinley, one of the country’s largest bottled water brands. The transition will remove 143 tons of virgin plastic from circulation annually.
42%
26%
16%
16%
2021 Unit Case Volume by Operating Unit
ASEAN and South PacificGreater China and MongoliaIndia and Southwest AsiaJapan and South Korea
31%
28%33%
8%
2021 Unit Case Volume by Category
Trademark Coca-ColaSparkling FlavorsHydration, Sports, Coffee & TeaNutrition, Juice, Dairy & Plant
19
20
21 9%
(12%)
5%
Organic Revenue Growth (Non-GAAP)1
19
20
21
(6%)
3%
4%
Comparable Currency Neutral Operating Income Growth (Non-GAAP)2
2021 Unit Case Volume by Country
China 40% India 14%Japan 13%Philippines 9%Thailand 6%
Australia 4% South Korea 3%Indonesia 2%Vietnam 2%Other 7%
Unit Case Volume Growth
2021 2020 2019Trademark Coca-Cola 11% 2% 9%Sparkling Flavors 11% (11%) 6%Hydration, Sports, Coffee & Tea 6% (14%) 2%Nutrition, Juice, Dairy & Plant 18% (16%) 2%
Overview Global Ventures/Bottling Investments GroupNorth AmericaLatin AmericaEurope, Middle East & AfricaAsia Pacific
1 Reported net operating revenues grew 12%, declined 11% and grew 3% for the years ended December 31, 2021, 2020 and 2019, respectively.
2 Reported operating income grew 9%, declined 7% and was even for the years ended December 31, 2021, 2020 and 2019, respectively.
Note: See pages 69 and 70 for reconciliations of non-GAAP financial measures to our results as reported under U.S. GAAP.

Executive Summary
The Coca-Cola Company 2021 Business & ESG Report 60
CEO Message AgriculturePortfolio Data AppendixOur Company PeoplePackaging FrameworksWater Climate Operations
Europe, Middle East & Africa2021 Highlights• Across Europe, the Coca-Cola system delivered the
highest incremental retail value among Fast-Moving Consumer Goods players, while gaining value share across all categories.
• In the United Arab Emirates, we joined Project RECAPP along with industry peers and the Ministry of Climate Change and Environment to create the country’s first free, door-to-door recycling service. RECAPP has built a community of 15,000 registered users and collected 115 metric tons of recyclables.
• In December 2021, the Coca-Cola system in Europe announced a goal to reach net zero by 2040 across all European markets, covering the entire European value chain, building on net zero and science-based targets set by The Coca-Cola Company’s two leading bottling partners in Europe: Coca-Cola Europacific Partners and Coca-Cola HBC. This will result in a reduction of 2.5 million tons of CO2 equivalent annually in Europe by 2030 compared to 2015—a reduction of 30%.
• Coca-Cola Africa and bottling partners announced the launch of JAMII, a sustainability platform that aims to promote entrepreneurship opportunities through improved access to skills training, networking and financial access.
Nigeria Pilots Recycling Program for Women and Youth EmpowermentIn Nigeria, The Coca-Cola Foundation funded the Recycling Scheme for Women and Youth Empowerment (RESWAYE), an innovative environmental sustainability program focused on tackling the plastic waste challenge, strengthening the recycling infrastructure and economically empowering women in 24 coastal communities. To date, the plastic buy-back initiative has recovered more than 159 tonnes of plastic waste and empowered more than 2,000 women and youth.
19 5%
20
21
(13%)
18%
Organic Revenue Growth (Non-GAAP)1
(1%)
9%19
20
21 13%
Comparable Currency Neutral Operating Income Growth (Non-GAAP)2
27%
24%
49%
2021 Unit Case Volume by Operating Unit
AfricaEurasia and Middle East Europe
26%
14%
55%
5%
2021 Unit Case Volume by Category
Trademark Coca-ColaSparkling FlavorsHydration, Sports, Coffee & TeaNutrition, Juice, Dairy & Plant
2021 Unit Case Volume by Country
South Africa 7% Germany 7%Turkey 6%Great Britain 6%Russia 6%
Spain 5% Nigeria 5%Pakistan 4%Egypt 3%Other 51%
Unit Case Volume Growth
2021 2020 2019Trademark Coca-Cola 9% (2%) 4%Sparkling Flavors 9% (8%) (1%)Hydration, Sports, Coffee & Tea 6% (18%) 3%Nutrition, Juice, Dairy & Plant 17% (9%) (1%)
Overview Global Ventures/Bottling Investments GroupNorth AmericaLatin AmericaEurope, Middle East & AfricaAsia Pacific
1 Reported net operating revenues grew 19%, declined 14% and declined 1% for the years ended December 31, 2021, 2020 and 2019, respectively.
2 Reported operating income grew 13%, declined 7% and declined 4% for the years ended December 31, 2021, 2020 and 2019, respectively.
Note: See pages 69 and 70 for reconciliations of non-GAAP financial measures to our results as reported under U.S. GAAP.

Executive Summary
The Coca-Cola Company 2021 Business & ESG Report 61
CEO Message AgriculturePortfolio Data AppendixOur Company PeoplePackaging FrameworksWater Climate Operations
Latin America2021 Highlights• Continued adoption of refillables throughout the
region across new categories, with juice refillables up over 50% from the prior year. More than one-third of unit case volume was in refillable packages.
• Volume in Latin America was ahead of 2019 levels each quarter of 2021 and sequentially improved throughout the year.
• Coca-Cola Chile and Amulen Foundation created the Innova Agua Fund to facilitate access to water in communities strongly affected by drought. As a result of this collaborative work, more than 500 families have a safe water supply through projects such as the collection and purification of rainwater. With this technology, homes will be able to capture, purify and store more than 36,000 liters per year on average.
• Coca-Cola Brazil announced an investment to improve access to clean water with a focus on vulnerable people and communities and to replenish the water we use to make our products back to nature and communities. From 2017 until 2021, the Água + Acesso (Water & Access) program reached 390 communities in 104 cities of 10 states to positively impact more than 155,000 people. In 2021 alone, we benefited more than 20,000 people (a targeted 15% increased reach over 2020).
Bottle Exchange Programs in MexicoIn Mexico, we partnered with small retail customers, six bottling partners and three local collection organizations on the “Mi tiendita sin residuos” (“My store without waste”) program to transform stores into PET collection centers. Consumers can return empty bottles to participating retail outlets to be recycled. In addition to promoting environmental awareness in local communities, early results show consumers are more likely to buy our beverages in participating stores.
19
20
21
(1%)
13%
19%
Organic Revenue Growth (Non-GAAP)1
12%
17%19
20
21 18%
Comparable Currency Neutral Operating Income Growth (Non-GAAP)2
58%
6%
16%
20%
2021 Unit Case Volume by Category
Trademark Coca-ColaSparkling FlavorsHydration, Sports, Coffee & TeaNutrition, Juice, Dairy & Plant
2021 Unit Case Volume by Country
Mexico 45% Brazil 22%Argentina 6%Chile 5%Colombia 4%
Peru 3% El Salvador 2%Bolivia 2%Ecuador 2%Other 9%
Unit Case Volume Growth
2021 2020 2019Trademark Coca-Cola 5% 1% 1%Sparkling Flavors 6% (9%) (3%)Hydration, Sports, Coffee & Tea 7% (4%) 5%Nutrition, Juice, Dairy & Plant 10% (6%) (1%)
Overview Global Ventures/Bottling Investments GroupNorth AmericaLatin AmericaEurope, Middle East & AfricaAsia Pacific
1 Reported net operating revenues grew 18%, declined 15% and grew 3% for the years ended December 31, 2021, 2020 and 2019, respectively.
2 Reported operating income grew 20%, declined 11% and grew 2% for the years ended December 31, 2021, 2020 and 2019, respectively.
Note: See pages 69 and 70 for reconciliations of non-GAAP financial measures to our results as reported under U.S. GAAP.

Executive Summary
The Coca-Cola Company 2021 Business & ESG Report 62
CEO Message AgriculturePortfolio Data AppendixOur Company PeoplePackaging FrameworksWater Climate Operations
North America2021 Highlights• Diets and zero-sugar sparkling beverages grew in
2021, driven by another year of strong Coca-Cola Zero Sugar growth.
• We saw strong performance from our sparkling water portfolio, with AHA growing volume double digits.
• The North America operating unit is participating in a unique private-public water conservation partnership as a member of the California Water Action Collaborative. A water leak-detection project, which is focused on a 183-unit low-income housing project for seniors in central Los Angeles, is expected to save millions of gallons of water annually.
• The Coca-Cola Foundation donated $1 million to establish a first-generation scholarship program at Morehouse College in Atlanta.
• The Coca-Cola system in Canada supported communities impacted by devastating flooding and mudslides in British Columbia. The Coca-Cola Company’s North America operating unit donated $150,000 (CAD) toward relief efforts, and Coke Canada Bottling distributed water to impacted communities.
Coca-Cola Freestyle Unveils Enhanced Countertop Fountain DispenserCoca-Cola Freestyle has introduced a new countertop fountain drink machine to give smaller-footprint restaurants the ability to offer more than 80 beverage choices with the touch of a button. The Coca-Cola Freestyle 7100 fits on countertops, allowing more accessibility in the food industry. In 2021, we also introduced reusable cups with microchip technology for Coca-Cola Freestyle machines in theme parks, on university campuses and on cruise ships in the United States.
Overview Global Ventures/Bottling Investments GroupNorth AmericaLatin AmericaEurope, Middle East & AfricaAsia Pacific
19
20
21
(5%)
3%
14%
Organic Revenue Growth (Non-GAAP)1
6%
5%19
20
21 19%
Comparable Currency Neutral Operating Income Growth (Non-GAAP)2
45%
13%
23%
19%
2021 Unit Case Volume by Category
Trademark Coca-ColaSparkling FlavorsHydration, Sports, Coffee & TeaNutrition, Juice, Dairy & Plant
Unit Case Volume Growth
2021 2020 2019Trademark Coca-Cola 2% (5%) 0%Sparkling Flavors 9% (13%) (1%)Hydration, Sports, Coffee & Tea 6% (7%) 0%Nutrition, Juice, Dairy & Plant 7% (4%) 0%
2021 Unit Case Volume by Country
United States 95% Canada 5%
1 Reported net operating revenues grew 15%, declined 4% and grew 2% for the years ended December 31, 2021, 2020 and 2019, respectively.
2 Reported operating income grew 35%, declined 5% and grew 12% for the years ended December 31, 2021, 2020 and 2019, respectively.
Note: See pages 69 and 70 for reconciliations of non-GAAP financial measures to our results as reported under U.S. GAAP.

Executive Summary
The Coca-Cola Company 2021 Business & ESG Report 63
CEO Message AgriculturePortfolio Data AppendixOur Company PeoplePackaging FrameworksWater Climate Operations
Bottling Investments GroupIn January 2006, our company-owned bottling operations were brought together to form the Bottling Investments Group, or BIG. BIG ensures these operations receive the appropriate investments and expertise to foster long-term success. Our current footprint of bottlers exists in South East and South West Asia, the Middle East, and parts of Africa. We continue to drive strong performance within BIG while maximizing returns on our investments.
2021 Highlights• Celebrated 50 years of Costa and were
crowned the UK’s favorite coffee shop for the 11th consecutive year. In China, the Costa ready-to-drink expansion continued with availability now in more than 300,000 outlets.
• Successful expansion of innocent into Asia pushed retail sales over $1 billion for the first time.
• Monster continued to perform well, launching new products such as Monster Super Fuel Mean Green, Watermelon and Subzero.
• Doğadan navigated challenging market conditions by pivoting its portfolio strategy, including brand innovation and geographic diversity, using revenue growth management capabilities to offset inflationary and currency pressures.
2021 Highlights• BIG improved operating margin
through category and package mix, discount optimization and intelligent hedging.
• Strong volume growth in sparkling soft drinks for the Philippines and Vietnam was led by Trademark Coca-Cola.
• Favorable price/mix, commodity gains and lower discretionary spend led to impressive operating income growth compared to 2019.
Costa Introduces Plant-Based CupsCosta recently introduced cups made from 100% plant-based materials1 in its coffee shops in the United Kingdom. The carbon footprint of these cups, when recycled, is 26% lower than standard to-go cups. The brand also refreshed its reusable cup incentive program, further encouraging consumers to play their part in helping to reduce waste.
Bangladesh Myanmar
Vietnam Cambodia
Philippines Malaysia Singapore
India
Nepal
Sri Lanka
Oman
BIG BOTTLER
COCA-COLA BEVERAGES AFRICA
Kenya
Tanzania
Namibia
Ethiopia Ghana
Zambia
Uganda
South Africa
Mozambique
Botswana
Global VenturesGlobal Ventures includes Costa coffee, Monster beverages, innocent juices and smoothies, and doğadan tea. The majority of Global Ventures’ revenue consists of Costa coffee and innocent, which together account for approximately 90% of total Global Ventures’ revenue.
innocent Opens Carbon-Neutral Factory in the NetherlandsIn 2021, innocent opened a new factory known as the Blender in Rotterdam. The Blender is one of the world’s first carbon-neutral, all-electric factories, powered by renewable energy and designed and built with technological innovations to mitigate emissions across all aspects of operations—bringing them a step closer to their goal of being carbon neutral by 2025.
1 Excluding lid.
Overview Global Ventures/Bottling Investments GroupNorth AmericaLatin AmericaEurope, Middle East & AfricaAsia Pacific

Executive Summary
The Coca-Cola Company 2021 Business & ESG Report 64
CEO Message AgriculturePortfolio Data AppendixOur Company PeoplePackaging FrameworksWater OperationsClimate
About This ReportScope of the Report
This 2021 Business & ESG Report is The Coca-Cola Company’s fourth report to integrate overall business and sustainability performance, data and context, reflecting our continued journey toward driving sustainable business practices into our core strategy. This report has been prepared in accordance with Global Reporting Initiative (GRI) Standards: core option and includes an index for the standards set by the Sustainability Accounting Standards Board (SASB). We provide indices for GRI, SASB and information relevant to the Task Force on Climate-related Financial Disclosures.
This report also meets the requirements of the United Nations Global Compact Advanced Communication on Progress and aligns with the United Nations Guiding Principles Reporting Framework.
Limited assurance over select sustainability metrics was obtained from Ernst & Young LLP (as indicated in the Report of Independent Accountants).
Except as otherwise noted, this report covers the 2021 performance of The Coca-Cola Company and the Coca-Cola system (our company and our bottling partners), as applicable. Therefore, references to “currently,” “to date” or similar expressions reflect information as of December 31, 2021. Some initiatives that were launched in early 2022 are included to provide the most relevant information to stakeholders.
In this report, any use of the terms “material,” “materiality,” “immaterial,” “substantive,” “significant” and other similar terminology refers to topics that reflect important economic, environmental and social impacts of The Coca-Cola Company or the Coca-Cola system or to topics or standards designated as “material” or “substantive” under the GHG Protocol, GRI or SASB standards. These terms as used in this report are not used, or intended to be construed, as they have been defined by or construed in accordance with the securities laws or any other laws of the United States or any other jurisdiction, or as these terms are used in the context of financial statements and financial reporting.
At times, we may revisit our prior estimates and historical performance data to ensure their accuracy and make any necessary corrections to our public reporting. Although our data has been internally vetted using accepted and relevant scientific and technical methodologies, historical performance data may be revised due to reasons such as new data availability; industry-driven changes to methodologies; improvement in data collection and measuring systems; or activities such as joint ventures, mergers and acquisitions or divestitures. In cases where historical information is revised, we will footnote the change with a clear explanation. Statements about future developments and past occurrences are based on information and assumptions available as of the date of publication. While we are committed to providing timely updates, the company holds no obligation to update information or statements. Certain information in this report regarding the company and the Coca-Cola system comes from third-party sources
and operations outside of our control. We believe such information has been accurately collected and reported, and that the underlying methodology is sound.
Common Stock
The Coca-Cola Company common stock is listed on the New York Stock Exchange, traded under the ticker symbol KO. The company has been one of the 30 companies in the Dow Jones Industrial Average since 1987. As of December 31, 2021, there were 4.33 billion shares outstanding and 192,251 shareowners of record.
Dividends
At its February 2022 meeting, the Board of Directors increased our quarterly dividend 4.8% to $0.44 per share, equivalent to an annual dividend of $1.76 per share, up from $1.68 per share in 2021. The company has increased its dividend per share in each of the last 60 years. Dividends are normally paid four times a year, usually in April, July, October and December. The company has paid 403 consecutive dividends, beginning in 1920.
Direct Stock Purchase and Dividend Reinvestment
Computershare Trust Company, N.A., sponsors and administers a direct stock purchase and dividend reinvestment plan for common stock of The Coca-Cola Company. The Computershare Investment Plan allows investors to directly purchase and sell shares of company common stock and reinvest dividends. To view or request plan materials please log on to www.computershare.com/investor and click on “invest now”.
Shareowner Account Assistance
For information and maintenance on your shareowner of record account, please contact:
Computershare Investor Services P.O. Box 505005 Louisville, KY 40233
Telephone: (888) COKE-SHR (265-3747) or (781) 575-2653 Hearing Impaired: (800) 490-1493 Email: [email protected] Internet: www.computershare.com/coca-cola
Shareowner Internet Account Access
For account access via the internet, please log on to www.computershare.com/investor. Once registered, shareowners can view account history and complete transactions online.
Electronic Delivery
If you are a shareowner of record, you have an opportunity to help the environment by signing up to receive your shareowner communications, including proxy materials, account statements and tax forms, electronically.
To enroll in e-delivery, please log on to your account at www.computershare.com/investor and click on “View and update your profile” and then click on “Communication Preferences.” As a thank you, the company will have a tree planted on your behalf through American Forests.
Forward-Looking Statements
This report may contain statements, estimates or projections that constitute “forward-looking statements” as defined under U.S. federal securities laws. Generally, the words “believe,” “expect,” “intend,” “estimate,” “anticipate,” “project,” “will” and similar expressions identify forward-looking statements, which generally are not historical in nature. Forward-looking statements are subject to certain risks and uncertainties that could cause The Coca-Cola Company’s actual results to differ materially from its historical experience and our present expectations or projections. These risks include, but are not limited to, the COVID-19 pandemic and continuing uncertainties associated with the scope, severity and duration of the pandemic, including, among others, vaccine adoption rates (including boosters) and the effectiveness of vaccines in limiting or stopping the spread of COVID-19, either over the long term or against new, emerging variants of COVID-19, governmental actions, supply chain disruptions, and the substance and pace of the post-pandemic economic recovery; increased competition; an inability to be successful in our innovation activities; changes in the retail landscape or the loss of key retail or foodservice customers; an inability to expand operations in emerging and developing markets; an inability to successfully manage the possible negative consequences of our productivity initiatives; an inability to attract or retain a highly skilled and diverse workforce; increased cost, disruption of supply or shortage of energy or fuel; increased cost, disruption of supply or shortage of ingredients, other raw materials, packaging materials, aluminum cans and other containers; inflationary pressures; an inability to successfully integrate and manage acquired businesses, brands or bottling operations; failure by third-party service providers and business partners to satisfactorily fulfill their commitments and responsibilities; an inability to renew collective bargaining agreements on satisfactory terms, or we or our bottling partners experience strikes, work stoppages, labor shortages or labor unrest; obesity and other health-related concerns; evolving consumer product and shopping preferences; product safety and quality concerns; perceived negative health consequences of certain ingredients, such as non-nutritive sweeteners and biotechnology-derived substances, and of other substances present in our beverage products or packaging materials; failure to digitize the Coca-Cola system; damage to our brand image, corporate reputation and social license to operate
from negative publicity, whether or not warranted, concerning product safety or quality, workplace and human rights, obesity or other issues; unfavorable general economic and political conditions; an inability to successfully manage new product launches; an inability to maintain good relationships with our bottling partners; deterioration in our bottling partners’ financial condition; an inability to successfully manage our refranchising activities or divestitures; increases in income tax rates, changes in income tax laws, regulations or the unfavorable resolution of tax matters, including the outcome of our ongoing tax dispute or any related disputes with the U.S. Internal Revenue Service (“IRS”); the possibility that the assumptions used to calculate our estimated aggregate incremental tax and interest liability related to the potential unfavorable outcome of the ongoing tax dispute with the IRS could significantly change; increased or new indirect taxes; changes in laws and regulations relating to beverage containers and packaging; significant additional labeling or warning requirements or limitations on the marketing or sale of our products; litigation or legal proceedings; conducting business in markets with high-risk legal compliance environments; failure to adequately protect, or disputes relating to, trademarks, formulas and other intellectual property rights; changes in, or failure to comply with, the laws and regulations applicable to our products or our business operations; fluctuations in foreign currency exchange rates; interest rate increases; an inability to achieve our overall long-term growth objectives; default by or failure of one or more of our counterparty financial institutions; impairment charges; failure to realize a significant portion of the anticipated benefits of our strategic relationship with Monster Beverage Corporation; an inability to protect our information systems against service interruption, misappropriation of data or cybersecurity incidents; failure to comply with personal data protection and privacy laws; failure to achieve ESG goals and accurately report our progress due to operational, financial, legal, and other risks, many of which are outside our control, and are dependent on the actions of our bottling partners and other third parties; increasing concerns about the environmental impact of plastic bottles and other packaging materials; water scarcity and poor quality; increased demand for food products and decreased agricultural productivity; climate change and legal or regulatory responses thereto; adverse weather conditions; and other risks discussed in our filings with the Securities and Exchange Commission (the “SEC”), including our Annual Report on Form 10-K for the year ended December 31, 2021, which filing is available from the SEC. You should not place undue reliance on forward-looking statements, which speak only as of the date they are made. We undertake no obligation to publicly update or revise any forward-looking statements.
Design: Ideas On Purpose, NYC. Content: BuzzWord, Inc.
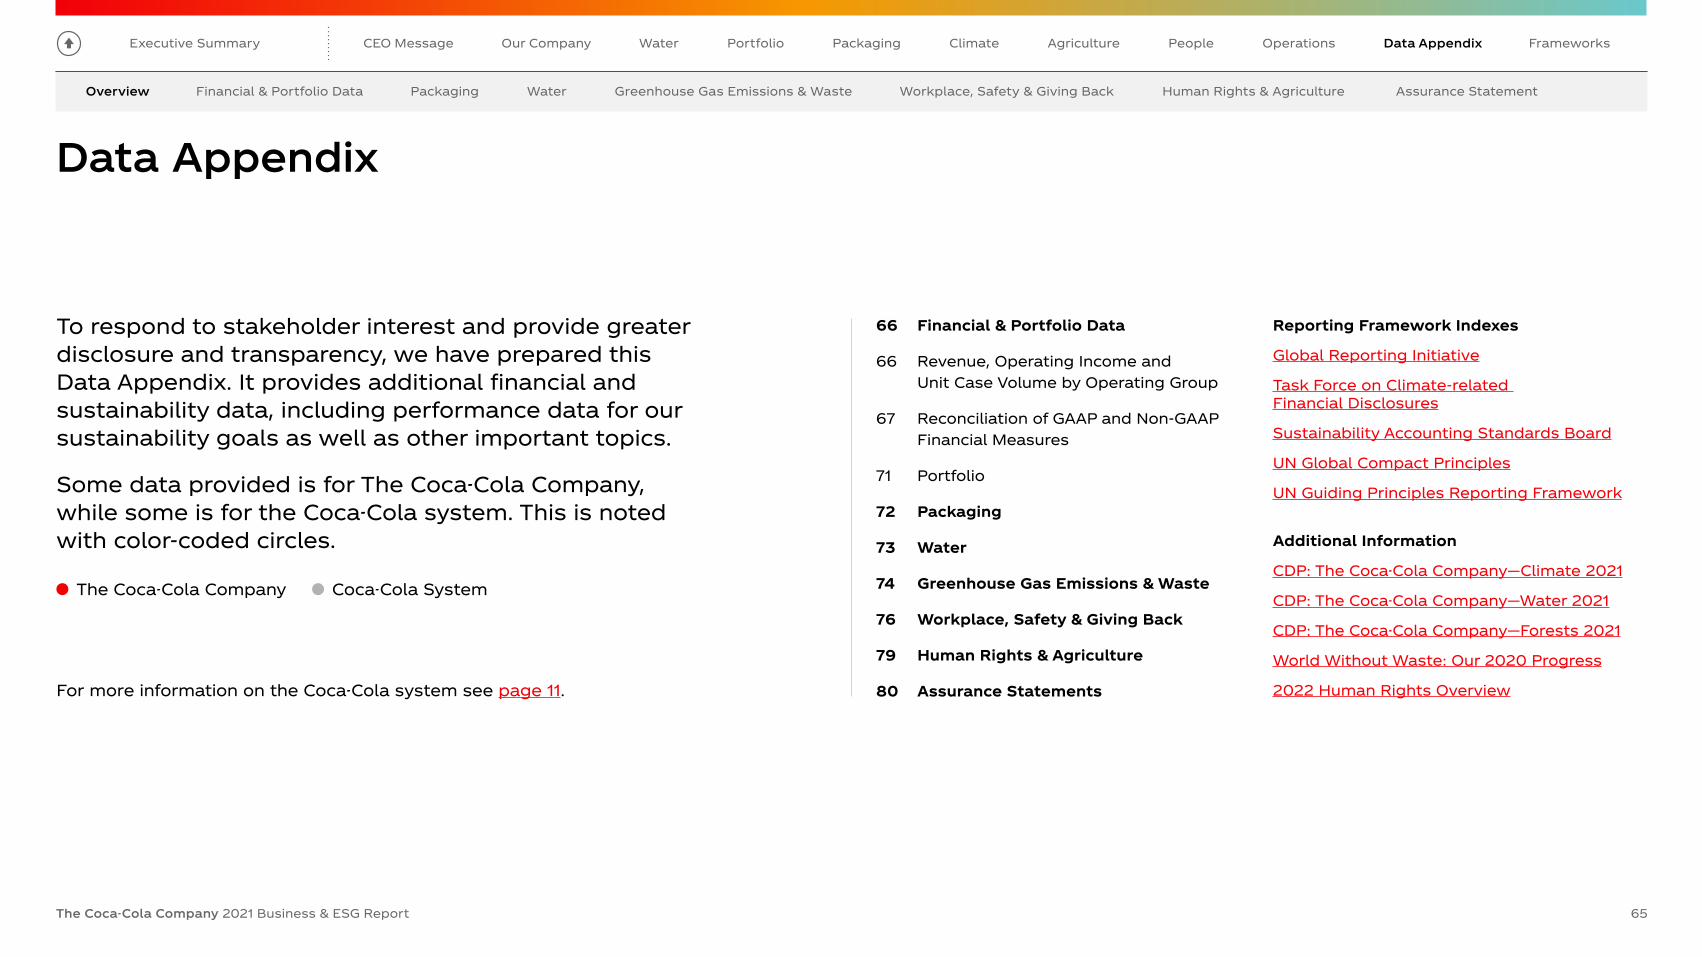
Financial & Portfolio Data Packaging Water Greenhouse Gas Emissions & Waste Workplace, Safety & Giving Back Human Rights & Agriculture Assurance StatementOverview
Data Appendix
To respond to stakeholder interest and provide greater disclosure and transparency, we have prepared this Data Appendix. It provides additional financial and sustainability data, including performance data for our sustainability goals as well as other important topics.
Some data provided is for The Coca-Cola Company, while some is for the Coca-Cola system. This is noted with color-coded circles.
The Coca-Cola Company Coca-Cola System
For more information on the Coca-Cola system see page 11.
66 Financial & Portfolio Data
66 Revenue, Operating Income and Unit Case Volume by Operating Group
67 Reconciliation of GAAP and Non-GAAP Financial Measures
71 Portfolio
72 Packaging
73 Water
74 Greenhouse Gas Emissions & Waste
76 Workplace, Safety & Giving Back
79 Human Rights & Agriculture
80 Assurance Statements
Reporting Framework Indexes
Global Reporting Initiative
Task Force on Climate-related Financial Disclosures
Sustainability Accounting Standards Board
UN Global Compact Principles
UN Guiding Principles Reporting Framework
Additional Information
CDP: The Coca-Cola Company—Climate 2021
CDP: The Coca-Cola Company—Water 2021
CDP: The Coca-Cola Company—Forests 2021
World Without Waste: Our 2020 Progress
2022 Human Rights Overview
Executive Summary
The Coca-Cola Company 2021 Business & ESG Report 65
CEO Message AgriculturePortfolioOur Company PeoplePackaging FrameworksWater OperationsClimate Data Appendix

Overview Packaging Water Greenhouse Gas Emissions & Waste Workplace, Safety & Giving Back Human Rights & Agriculture Assurance StatementFinancial & Portfolio Data
Financial & Portfolio Data2019–2021 Net Operating Revenues, Operating Income and Unit Case Volume by Operating Segment
Year ended December 31, 2019 2020 2021
($ In millions) Net Operating Revenues
Operating Income
Unit Case Volume Growth
Net Operating Revenues
Operating Income
Unit Case Volume Growth
Net Operating Revenues
Operating Income
Unit Case Volume Growth
Europe, Middle East & Africa $ 7,058 $ 3,551 2% $ 6,057 $ 3,313 (6%) $ 7,193 $ 3,735 9%Latin America 4,118 2,375 1% 3,499 2,116 (2%) 4,143 2,534 6%North America 11,915 2,594 0% 11,477 2,471 (7%) 13,190 3,331 5%Asia Pacific 5,327 2,282 5% 4,722 2,133 (9%) 5,291 2,325 10%Global Ventures 2,562 334 7% 1,991 (123) (13%) 2,805 293 17%Bottling Investments 7,440 358 24% 6,265 308 (15%) 7,203 473 11%
Equity Method Investments in Publicly Traded Bottling Companies Percent of Company’s 2020
Worldwide Unit Case Volume
Company’s Ownership
Interest as of Dec. 31, 2020
Percent of Company’s 2021 Worldwide Unit
Case Volume
Company’s Ownership
Interest as of Dec. 31, 2021(Top 5 based on unit case volume)
Coca-Cola FEMSA S.A.B. de C.V. 11% 28% 11% 28%Coca-Cola FEMSA is the largest independent Coca-Cola bottler in the world by volume. Coca-Cola FEMSA operates in Mexico and nine other countries in Central America and South America.
Coca-Cola Europacific Partners 8% 19% 9% 19%Coca-Cola Europacific Partners is the second largest independent Coca-Cola bottler by volume and the largest independent bottler by revenues, operating in 29 countries in Europe and the South Pacific—serving a population of more than 600 million people.
Coca-Cola HBC AG (Coca-Cola Hellenic) 8% 23% 8% 21%Coca-Cola Hellenic is the third largest independent Coca-Cola bottler by volume, operating in 29 countries across three continents—serving a population of more than 715 million people.
Coca-Cola Icecek A.S. 4% 20% 4% 20%Coca-Cola Icecek is one of the largest independent Coca-Cola bottlers, with operations in Azerbaijan, Iraq, Jordan, Kazakhstan, Kyrgyzstan, Pakistan, Syria, Tajikistan, Turkey, Turkmenistan and Uzbekistan.
Coca-Cola Bottlers Japan Holdings Inc. 3% 19% 3% 19%In 2017, Coca-Cola West Co., Ltd. and Coca-Cola East Japan Co., Ltd. integrated their businesses to establish Coca-Cola Bottlers Japan, the largest Coca-Cola bottler in Japan, serving a population of more than 100 million people.
The Coca-Cola Company Coca-Cola System
Executive Summary
The Coca-Cola Company 2021 Business & ESG Report 66
CEO Message AgriculturePortfolioOur Company PeoplePackaging FrameworksWater OperationsClimate Data Appendix
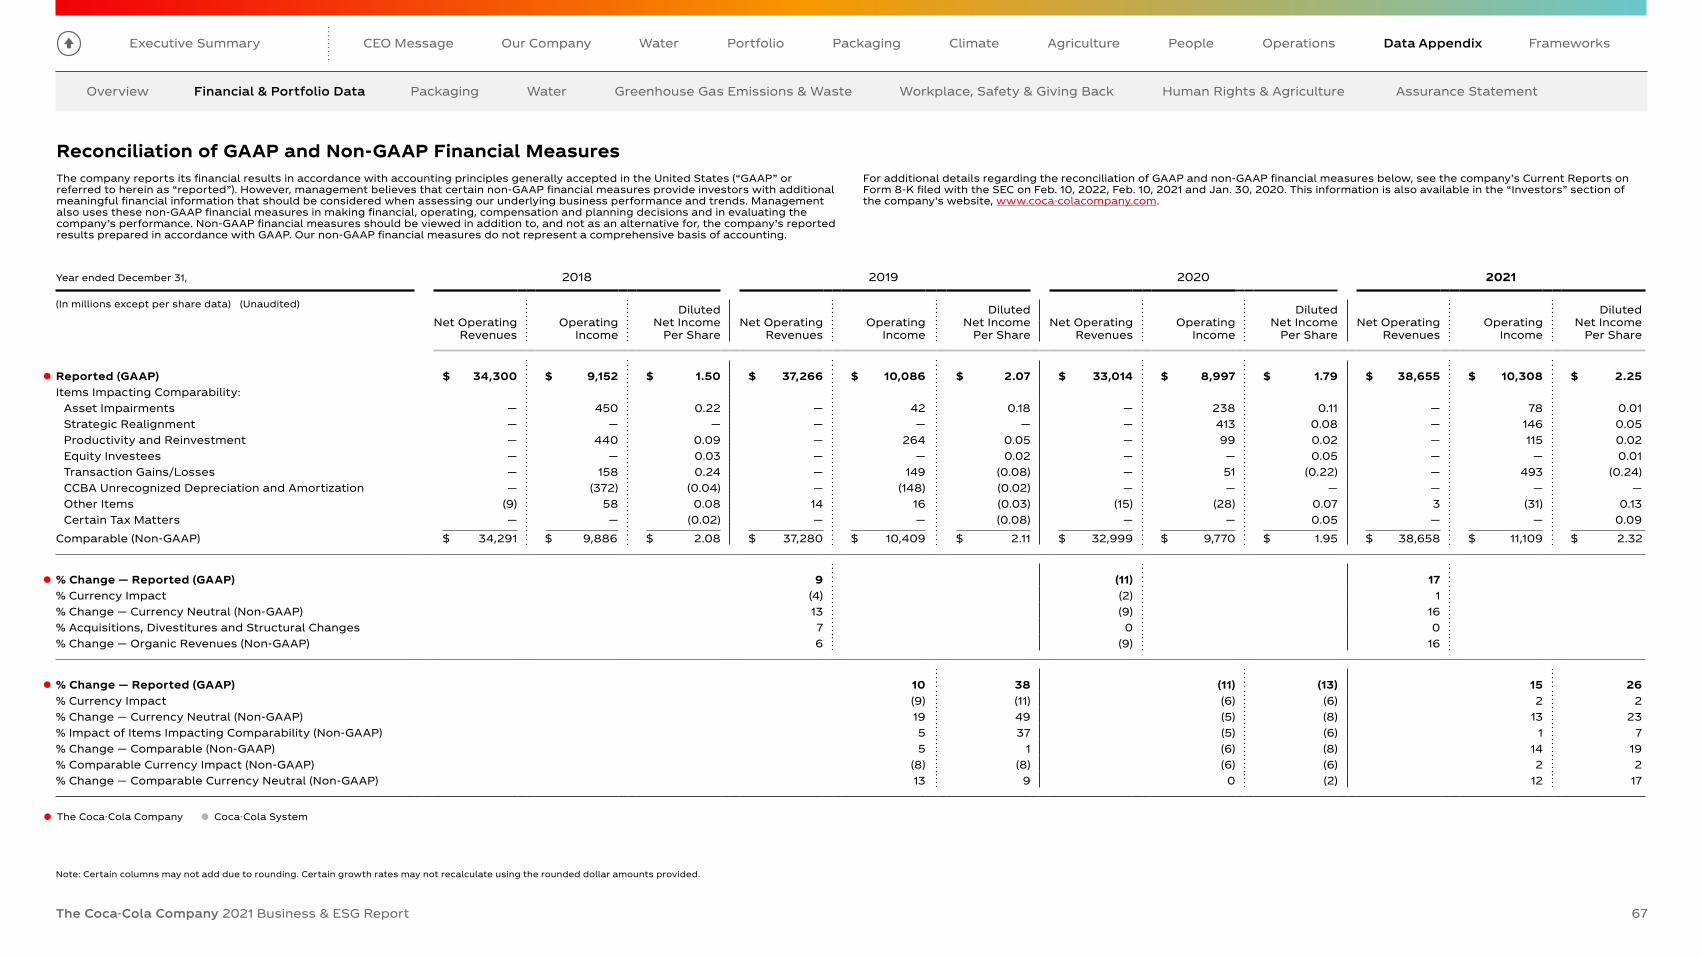
Overview Packaging Water Greenhouse Gas Emissions & Waste Workplace, Safety & Giving Back Human Rights & Agriculture Assurance StatementFinancial & Portfolio Data
The Coca-Cola Company Coca-Cola System
Note: Certain columns may not add due to rounding. Certain growth rates may not recalculate using the rounded dollar amounts provided.
Reconciliation of GAAP and Non-GAAP Financial Measures The company reports its financial results in accordance with accounting principles generally accepted in the United States (“GAAP” or referred to herein as “reported”). However, management believes that certain non-GAAP financial measures provide investors with additional meaningful financial information that should be considered when assessing our underlying business performance and trends. Management also uses these non-GAAP financial measures in making financial, operating, compensation and planning decisions and in evaluating the company’s performance. Non-GAAP financial measures should be viewed in addition to, and not as an alternative for, the company’s reported results prepared in accordance with GAAP. Our non-GAAP financial measures do not represent a comprehensive basis of accounting.
For additional details regarding the reconciliation of GAAP and non-GAAP financial measures below, see the company’s Current Reports on Form 8-K filed with the SEC on Feb. 10, 2022, Feb. 10, 2021 and Jan. 30, 2020. This information is also available in the “Investors” section of the company’s website, www.coca-colacompany.com.
Year ended December 31, 2018 2019 2020 2021
(In millions except per share data) (Unaudited)
Net Operating Revenues
Operating Income
Diluted Net Income
Per ShareNet Operating
RevenuesOperating
Income
Diluted Net Income
Per ShareNet Operating
RevenuesOperating
Income
Diluted Net Income
Per ShareNet Operating
RevenuesOperating
Income
Diluted Net Income
Per Share
Reported (GAAP) $ 34,300 $ 9,152 $ 1.50 $ 37,266 $ 10,086 $ 2.07 $ 33,014 $ 8,997 $ 1.79 $ 38,655 $ 10,308 $ 2.25 Items Impacting Comparability:
Asset Impairments — 450 0.22 — 42 0.18 — 238 0.11 — 78 0.01 Strategic Realignment — — — — — — — 413 0.08 — 146 0.05 Productivity and Reinvestment — 440 0.09 — 264 0.05 — 99 0.02 — 115 0.02 Equity Investees — — 0.03 — — 0.02 — — 0.05 — — 0.01 Transaction Gains/Losses — 158 0.24 — 149 (0.08) — 51 (0.22) — 493 (0.24)CCBA Unrecognized Depreciation and Amortization — (372) (0.04) — (148) (0.02) — — — — — —Other Items (9) 58 0.08 14 16 (0.03) (15) (28) 0.07 3 (31) 0.13 Certain Tax Matters — — (0.02) — — (0.08) — — 0.05 — — 0.09
Comparable (Non-GAAP) $ 34,291 $ 9,886 $ 2.08 $ 37,280 $ 10,409 $ 2.11 $ 32,999 $ 9,770 $ 1.95 $ 38,658 $ 11,109 $ 2.32
% Change — Reported (GAAP) 9 (11) 17 % Currency Impact (4) (2) 1 % Change — Currency Neutral (Non-GAAP) 13 (9) 16 % Acquisitions, Divestitures and Structural Changes 7 0 0 % Change — Organic Revenues (Non-GAAP) 6 (9) 16
% Change — Reported (GAAP) 10 38 (11) (13) 15 26 % Currency Impact (9) (11) (6) (6) 2 2 % Change — Currency Neutral (Non-GAAP) 19 49 (5) (8) 13 23 % Impact of Items Impacting Comparability (Non-GAAP) 5 37 (5) (6) 1 7 % Change — Comparable (Non-GAAP) 5 1 (6) (8) 14 19 % Comparable Currency Impact (Non-GAAP) (8) (8) (6) (6) 2 2 % Change — Comparable Currency Neutral (Non-GAAP) 13 9 0 (2) 12 17
Executive Summary
The Coca-Cola Company 2021 Business & ESG Report 67
CEO Message AgriculturePortfolioOur Company PeoplePackaging FrameworksWater OperationsClimate Data Appendix

Overview Packaging Water Greenhouse Gas Emissions & Waste Workplace, Safety & Giving Back Human Rights & Agriculture Assurance StatementFinancial & Portfolio Data
1 Cash flow conversion ratio is calculated by dividing net cash provided by operating activities by net income attributable to shareowners of The Coca-Cola Company.2 Adjusted free cash flow conversion ratio is calculated by dividing adjusted free cash flow by adjusted net income attributable to shareowners of The Coca-Cola Company.
Reconciliation of GAAP and Non-GAAP Financial Measures
The company reports its financial results in accordance with accounting principles generally accepted in the United States (“GAAP” or referred to herein as “reported”). However, management believes that certain non-GAAP financial measures provide investors with additional meaningful financial information that should be considered when assessing our underlying business performance and trends. Management also uses these non-GAAP financial measures in making financial, operating, compensation and planning decisions and in evaluating the company’s performance. Non-GAAP financial measures should be viewed in addition to, and not as an alternative for, the company’s reported results prepared in accordance with GAAP. Our non-GAAP financial measures do not represent a comprehensive basis of accounting.
For additional details regarding the reconciliation of GAAP and non-GAAP financial measures below, see the company’s Current Reports on Form 8-K filed with the SEC on Feb. 10, 2022, Feb. 10, 2021 and Jan. 30, 2020. This information is also available in the “Investors” section of the company’s website, www.coca-colacompany.com.
The Coca-Cola Company Coca-Cola System
Free Cash Flow and Adjusted Free Cash Flow Conversion Ratio
Year ended December 31, 2019 2020 2021
(In millions)
Net Cash Provided by Operating Activities $ 10,471 $ 9,844 $ 12,625 Purchases of Property, Plant and Equipment (2,054) (1,177) (1,367) Free Cash Flow (Non-GAAP) 8,417 8,667 11,258Plus: Cash Payments for Pension Plan Contributions — — — Adjusted Free Cash Flow (Non-GAAP) $ 8,417 $ 8,667 $ 11,258
Net Income Attributable to Shareowners of The Coca-Cola Company $ 8,920 $ 7,747 $ 9,771Noncash Items Impacting Comparability:
Asset Impairments 773 493 62 Equity Investees 96 216 23 Transaction Gains/Losses (463) (933) (1,109)CCBA Unrecognized Depreciation and Amortization (67) — — Other Items (148) 291 555 Certain Tax Matters (331) 207 410
Adjusted Net Income Attributable to Shareowners of The Coca-Cola Company (Non-GAAP) $ 8,780 $ 8,021 $ 9,712
Cash Flow Conversion Ratio1 117% 127% 129%Adjusted Free Cash Flow Conversion Ratio (Non-GAAP)2 96% 108% 116%
Executive Summary
The Coca-Cola Company 2021 Business & ESG Report 68
CEO Message AgriculturePortfolioOur Company PeoplePackaging FrameworksWater OperationsClimate Data Appendix

Overview Packaging Water Greenhouse Gas Emissions & Waste Workplace, Safety & Giving Back Human Rights & Agriculture Assurance StatementFinancial & Portfolio Data
Reconciliation of GAAP and Non-GAAP Financial Measures
The company reports its financial results in accordance with accounting principles generally accepted in the United States (“GAAP” or referred to herein as “reported”). However, management believes that certain non-GAAP financial measures provide investors with additional meaningful financial information that should be considered when assessing our underlying business performance and trends. Management also uses these non-GAAP financial measures in making financial, operating, compensation and planning decisions and in evaluating the company’s performance. Non-GAAP financial measures should be viewed in addition to, and not as an alternative for, the company’s reported results prepared in accordance with GAAP. Our non-GAAP financial measures do not represent a comprehensive basis of accounting.
For additional details regarding the reconciliation of GAAP and non-GAAP financial measures below, see the company’s Current Reports on Form 8-K filed with the SEC on Feb. 10, 2022, Feb. 10, 2021 and Jan. 30, 2020. This information is also available in the “Investors” section of the company’s website, www.coca-colacompany.com.
Net Operating Revenues by Operating Segment
Year ended December 31, 2019 2020 2021
(In millions) Europe, Middle East &
AfricaLatin
AmericaNorth
AmericaAsia
Pacific
Europe, Middle East &
AfricaLatin
AmericaNorth
AmericaAsia
Pacific
Europe, Middle East &
AfricaLatin
AmericaNorth
AmericaAsia
Pacific
Reported (GAAP) $ 7,058 $ 4,118 $ 11,915 $ 5,327 $ 6,057 $ 3,499 $ 11,477 $ 4,722 $ 7,193 $ 4,143 $ 13,190 $ 5,291 Items Impacting Comparability:
Other Items — — — — (9) 1 1 1 6 — — (3)Comparable (Non-GAAP) $ 7,058 $ 4,118 $ 11,915 $ 5,327 $ 6,048 $ 3,500 $ 11,478 $ 4,723 $ 7,199 $ 4,143 $ 13,190 $ 5,288
2018 2019 2020
Reported (GAAP) $ 7,099 $ 4,010 $ 11,630 $ 5,185 $ 7,058 $ 4,118 $ 11,915 $ 5,327 $ 6,057 $ 3,499 $ 11,477 $ 4,722Items Impacting Comparability:
Other Items — — — — — — — — (9) 1 1 1 Comparable (Non-GAAP) $ 7,099 $ 4,010 $ 11,630 $ 5,185 $ 7,058 $ 4,118 $ 11,915 $ 5,327 $ 6,048 $ 3,500 $ 11,478 $ 4,723
% Change — Reported (GAAP) (1) 3 2 3 (14) (15) (4) (11) 19 18 15 12 % Currency Impact (9) (10) 0 (1) (2) (14) 0 0 1 0 0 3 % Change — Currency Neutral (Non-GAAP) 8 13 3 4 (12) (1) (4) (11) 18 19 15 9 % Acquisitions, Divestitures and Structural Changes 3 0 0 (1) 0 0 2 0 0 0 0 0 % Change — Organic Revenues (Non-GAAP) 5 13 3 5 (13) (1) (5) (12) 18 19 14 9
Note: Certain columns may not add due to rounding. Certain growth rates may not recalculate using the rounded dollar amounts provided.
The Coca-Cola Company Coca-Cola System
Executive Summary
The Coca-Cola Company 2021 Business & ESG Report 69
CEO Message AgriculturePortfolioOur Company PeoplePackaging FrameworksWater OperationsClimate Data Appendix

Overview Packaging Water Greenhouse Gas Emissions & Waste Workplace, Safety & Giving Back Human Rights & Agriculture Assurance StatementFinancial & Portfolio Data
Reconciliation of GAAP and Non-GAAP Financial Measures
The company reports its financial results in accordance with accounting principles generally accepted in the United States (“GAAP” or referred to herein as “reported”). However, management believes that certain non-GAAP financial measures provide investors with additional meaningful financial information that should be considered when assessing our underlying business performance and trends. Management also uses these non-GAAP financial measures in making financial, operating, compensation and planning decisions and in evaluating the company’s performance. Non-GAAP financial measures should be viewed in addition to, and not as an alternative for, the company’s reported results prepared in accordance with GAAP. Our non-GAAP financial measures do not represent a comprehensive basis of accounting.
For additional details regarding the reconciliation of GAAP and non-GAAP financial measures below, see the company’s Current Reports on Form 8-K filed with the SEC on Feb. 10, 2022, Feb. 10, 2021 and Jan. 30, 2020. This information is also available in the “Investors” section of the company’s website, www.coca-colacompany.com.
Operating Income by Operating Segment
Year ended December 31, 2019 2020 2021
(In millions) Europe, Middle East &
AfricaLatin
AmericaNorth
AmericaAsia
Pacific
Europe, Middle East &
AfricaLatin
AmericaNorth
AmericaAsia
Pacific
Europe, Middle East &
AfricaLatin
AmericaNorth
AmericaAsia
Pacific
Reported (GAAP) $ 3,551 $ 2,375 $ 2,594 $ 2,282 $ 3,313 $ 2,116 $ 2,471 $ 2,133 $ 3,735 $ 2,534 $ 3,331 $ 2,325 Items Impacting Comparability:
Asset Impairments — — — 42 — 10 215 — 78 — — —Strategic Realignment — — — — 78 19 115 31 63 11 14 12 Productivity and Reinvestment 2 1 62 — (5) — — — — — — —Transaction Gains/Losses — — — — — — — — — — 21 —Other Items — — (4) — (9) 1 1 1 6 — (35) (3)
Comparable (Non-GAAP) $ 3,553 $ 2,376 $ 2,652 $ 2,324 $ 3,377 $ 2,146 $ 2,802 $ 2,165 $ 3,882 $ 2,545 $ 3,331 $ 2,334
2018 2019 2020
Reported (GAAP) $ 3,693 $ 2,318 $ 2,318 $ 2,271 $ 3,551 $ 2,375 $ 2,594 $ 2,282 $ 3,313 $ 2,116 $ 2,471 $ 2,133 Items Impacting Comparability:
Asset Impairments — — — — — — — 42 — 10 215 —Strategic Realignment — — — — — — — — 78 19 115 31Productivity and Reinvestment (3) 4 175 (4) 2 1 62 — (5) — — —Other Items — — 37 — — — (4) — (9) 1 1 1
Comparable (Non-GAAP) $ 3,690 $ 2,322 $ 2,530 $ 2,267 $ 3,553 $ 2,376 $ 2,652 $ 2,324 $ 3,377 $ 2,146 $ 2,802 $ 2,165
% Change — Reported (GAAP) (4) 2 12 0 (7) (11) (5) (7) 13 20 35 9 % Currency Impact (12) (14) 0 (1) (3) (21) 0 (1) 2 1 0 4 % Change — Currency Neutral (Non-GAAP) 9 17 12 1 (3) 11 (5) (6) 11 19 35 5 % Impact of Items Impacting Comparability (Non-GAAP) 0 0 7 (2) (2) (1) (10) 0 (2) 1 16 1 % Change — Comparable (Non-GAAP) (4) 2 5 3 (5) (10) 6 (7) 15 19 19 8 % Comparable Currency Impact (Non-GAAP) (12) (14) 0 (1) (4) (21) 0 (1) 1 1 0 4 % Change — Comparable Currency Neutral (Non-GAAP) 9 17 5 3 (1) 12 6 (6) 13 18 19 4
Note: Certain columns may not add due to rounding. Certain percentages may not recalculate using the rounded dollar amounts provided. The Coca-Cola Company Coca-Cola System
Executive Summary
The Coca-Cola Company 2021 Business & ESG Report 70
CEO Message AgriculturePortfolioOur Company PeoplePackaging FrameworksWater OperationsClimate Data Appendix
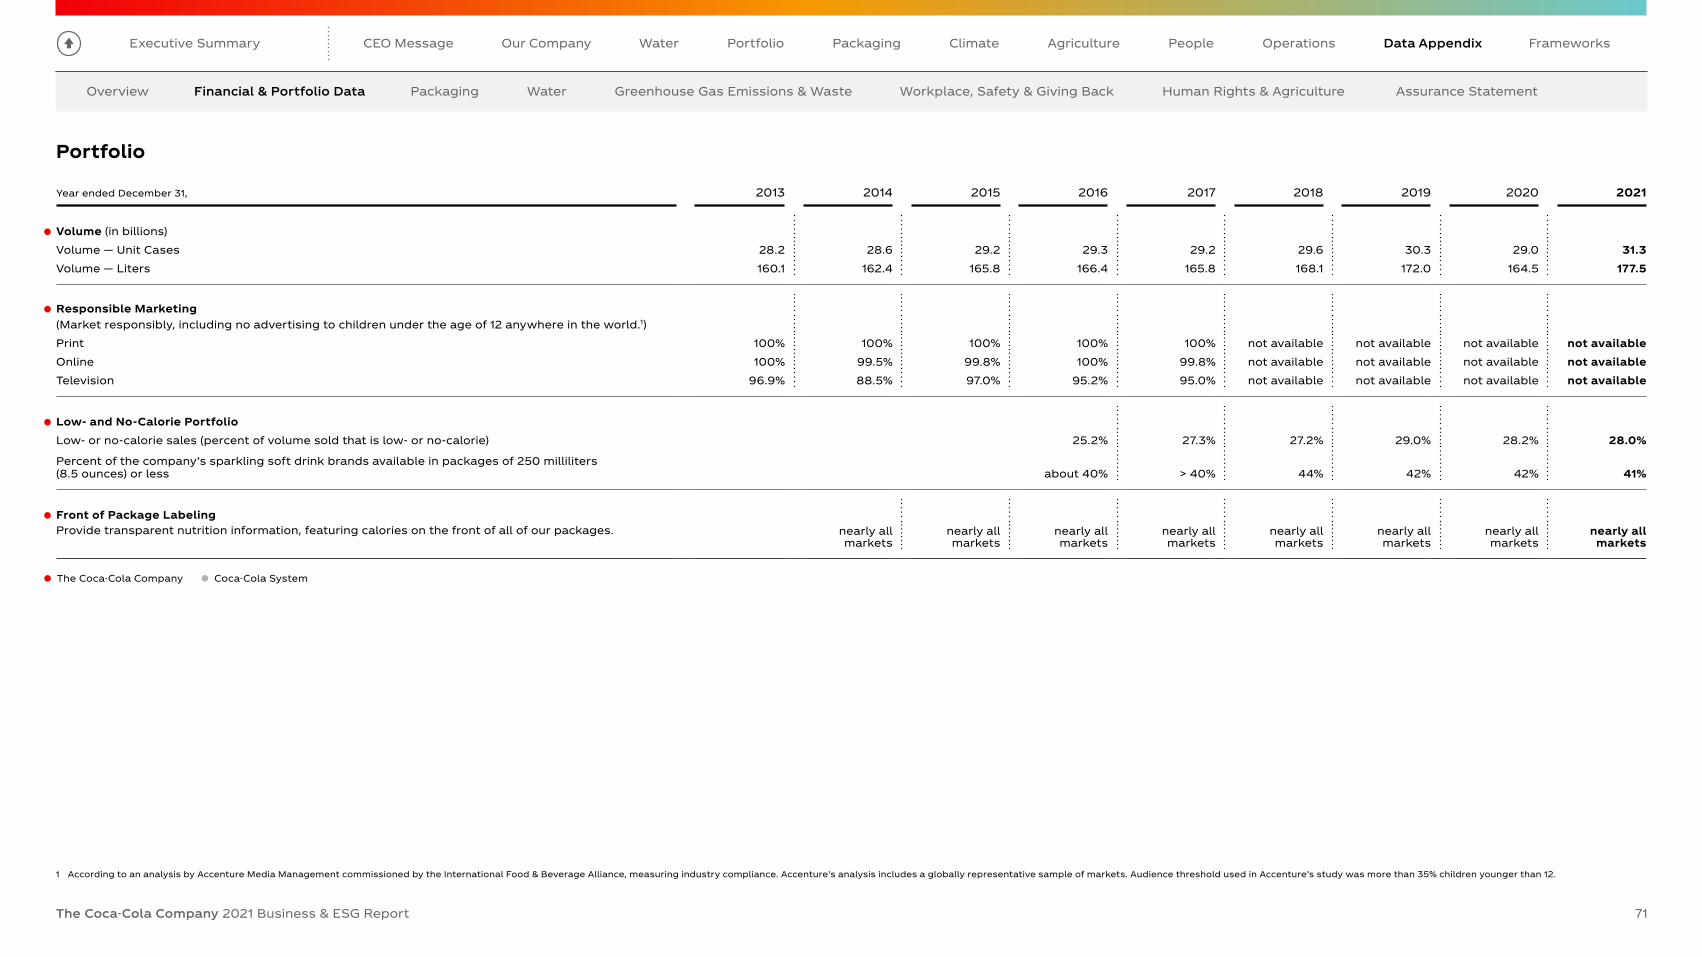
Overview Packaging Water Greenhouse Gas Emissions & Waste Workplace, Safety & Giving Back Human Rights & Agriculture Assurance StatementFinancial & Portfolio Data
Year ended December 31, 2013 2014 2015 2016 2017 2018 2019 2020 2021
Volume (in billions) Volume — Unit Cases 28.2 28.6 29.2 29.3 29.2 29.6 30.3 29.0 31.3Volume — Liters 160.1 162.4 165.8 166.4 165.8 168.1 172.0 164.5 177.5
Responsible Marketing(Market responsibly, including no advertising to children under the age of 12 anywhere in the world.1)Print 100% 100% 100% 100% 100% not available not available not available not availableOnline 100% 99.5% 99.8% 100% 99.8% not available not available not available not availableTelevision 96.9% 88.5% 97.0% 95.2% 95.0% not available not available not available not available
Low- and No-Calorie PortfolioLow- or no-calorie sales (percent of volume sold that is low- or no-calorie) 25.2% 27.3% 27.2% 29.0% 28.2% 28.0%
Percent of the company’s sparkling soft drink brands available in packages of 250 milliliters (8.5 ounces) or less about 40% > 40% 44% 42% 42% 41%
Front of Package LabelingProvide transparent nutrition information, featuring calories on the front of all of our packages. nearly all
marketsnearly all markets
nearly all markets
nearly all markets
nearly all markets
nearly all markets
nearly all markets
nearly all markets
Portfolio
1 According to an analysis by Accenture Media Management commissioned by the International Food & Beverage Alliance, measuring industry compliance. Accenture’s analysis includes a globally representative sample of markets. Audience threshold used in Accenture’s study was more than 35% children younger than 12.
The Coca-Cola Company Coca-Cola System
Executive Summary
The Coca-Cola Company 2021 Business & ESG Report 71
CEO Message AgriculturePortfolioOur Company PeoplePackaging FrameworksWater OperationsClimate Data Appendix

Overview Financial & Portfolio Data Water Greenhouse Gas Emissions & Waste Workplace, Safety & Giving Back Human Rights & Agriculture Assurance StatementPackaging
1 This is the focused scope of Primary Consumer Packaging (PET, Glass, Cans, Cartons).2 This number has been updated following the completed assurance process for the 2020 World Without Waste Report, which was completed post-publication of the 2020 Business & ESG Report.3 Includes select primary consumer packaging materials.4 In 2019, we modified the methodology we use for calculating the amount of recycled material used in our Primary Consumer Packaging. These changes are designed to integrate a more accurate dataset, including primary data
where it is available. Moving forward, we expect that these numbers will continue to evolve as data sources improve, at the same time that we work to increase rates of recycled material use.5 We changed our method to track the packaging collection rate against our World Without Waste goal beginning with 2018 data. With better data available, we expanded the metric to encompass all of our packaging types,
including beverage cartons, juice boxes and pouches, etc.6 Collection rate represents a weighted average of national collection rates, collected for recycling rates or refillable rates by packaging type to TCCS’s sales in units to express the percent of equivalent bottles and cans introduced
into the market that were collected and refilled or collected for recycling for the year. Collection rates are determined by country for each packaging type based on either national studies (approximately 80%), plant standards (approximately 19%), or internal estimates (approximately 1%).
7 Only recyclable where infrastructure exists.
PackagingYear ended December 31, 2014 2015 2016 2017 2018 2019 2020 2021
World Without Waste
Total weight of our packaging (metric tons)1 5.10M2 5.30M
Percentage of recycled material in our packaging3 30% 20%4 22% 23%
Percentage of recycled material used in PET plastic packaging globally 9% 9.4% 11.5% 13.6%
Percentage of bottles and cans we collected and refilled or collected for recycling5 61% 59% 59% 59% 58%
Percentage of bottles and cans we collected and refilled or collected for recycling6 56% 60% 60% 61%
Percentage of packaging recyclable globally 85% 88% 88% 90% 90%7
Packaging Mix (by units)Plastic (primarily PET) bottles 45.5% 45.2% 44.9% 47.3%Aluminum and steel cans 23.5% 23.8% 24.7% 25.7%Other 12.1% 11.8% 13.4% 9.7%Refillable glass bottles 11.7% 11.1% 9.3% 9.4%Non-refillable glass bottles 2.3% 2.0% 1.4% 1.6%Beverage cartons and juice boxes 2.5% 2.8% 2.7% 3.0%Refillable (primarily PET) plastic bottles 1.6% 1.5% 1.6% 1.5%Pouches 0.6% 0.5% 0.4% 0.4%
Number of PackagesPlastic (primarily PET) bottles ~117B ~120B ~112B ~125BAluminum and steel bottles and cans ~60B ~63B ~62B ~68BRefillable glass bottles ~30B ~30B ~23B ~25BNon-refillable glass bottles ~6B ~5B ~4B ~4BRefillable (primarily PET) plastic ~4B ~4B ~4B ~4BBeverage cartons and juice boxes ~6.7B ~7.3B ~6.8B ~7.9BPouches ~1.7B ~1.3B ~0.9B ~1.0B
The Coca-Cola Company Coca-Cola System
Executive Summary
The Coca-Cola Company 2021 Business & ESG Report 72
CEO Message AgriculturePortfolioOur Company PeoplePackaging FrameworksWater OperationsClimate Data Appendix

Overview Financial & Portfolio Data Packaging Greenhouse Gas Emissions & Waste Workplace, Safety & Giving Back Human Rights & Agriculture Assurance StatementWater
Water
1 Peer-reviewed methodologies were used to calculate volumetric benefits per project and operating unit; calculated benefits per project and operating unit using peer-reviewed methodologies; all replenish data are internally validated and verified; the equivalent volume for 100% Replenish rate (175 BL) is externally assured; Benefits fall into three categories: Watershed Health (229.1 BL), Productive Use (47.5 BL) and Community Access projects (16.7 BL).
Note: Due to joint venture or merger and acquisition activities in 2019-2021, certain brands may not be accounted for in The Coca-Cola Company-specific metrics included on pp. 73-75.
Year ended December 31, 2013 2014 2015 2016 2017 2018 2019 2020 2021
Water Use and Water Withdrawn
Water Use Ratio (liters of water used per liter of product produced) 2.08 2.03 1.98 1.96 1.92 1.89 1.85 1.84 1.81 1.88 1.96 1.94
Total Water Withdrawn (megaliters) 299,756 301,068 300,733 294,925 288,990 298,797 295,014 281,991 298,235 40,375 36,946 40,473
Fresh Surface Water Sources (megaliters) 15,058 12,986 12,777 10,554 12,025 3,554 2,152 2,899
Brackish Surface Water (megaliters) 2,681 2,738 4,377 5,654 5,725 1,151 1,046 351
Third-Party Sources (megaliters) 140,588 135,217 147,430 139,581 144,256 20,317 19,475 21,706
Ground Water — Renewable (megaliters) 130,663 147,857 130,430 126,202 136,195 15,352 14,273 15,491
Water Consumption (megaliters) 182,455 186,642 187,132 167,301 170,358 23,889 21,687 24,918
Percentage of Water Consumption in Regions with High or Extremely High Baseline Water Stress 21% 20%
Wastewater 106,534 112,154 107,883 114,690 127,877 Wastewater Discharged (megaliters) 16,486 15,257 15,555
Water Returned to Nature and CommunitiesPercentage1 68% 94% 115% 132.9% 150% 155% 160.7% 170% 167% Amount (billions of liters)1 108.5 153.6 190.9 221.2 248.3 257 273.7 277.8 293.3
The Coca-Cola Company Coca-Cola System
Executive Summary
The Coca-Cola Company 2021 Business & ESG Report 73
CEO Message AgriculturePortfolioOur Company PeoplePackaging FrameworksWater OperationsClimate Data Appendix

Overview Financial & Portfolio Data Packaging Water Workplace, Safety & Giving Back Human Rights & Agriculture Assurance StatementGreenhouse Gas Emissions & Waste
Year ended December 31, 2013 2014 2015 2016 2017 2018 2019 2020 2021
GHG Emissions
Direct, from manufacturing sites (metric tons) (in millions) 1.8 1.7 1.7 1.6 1.78 1.79 1.83 1.49 1.61
Indirect, from electricity purchased and consumed (without energy trading) at manufacturing sites (metric tons) (in millions) 3.7 3.6 3.8 3.8 3.76 3.76 3.73 3.75 3.88
Indirect, from electricity purchased and consumed (without energy trading) at manufacturing sites (using GHG protocol market-based method)1 (metric tons) (in millions) 3.44 3.35 3.88 3.28 3.56
Total, from manufacturing sites (metric tons) (in millions) 5.53 5.55 5.58 5.45 5.54 5.55 5.56 5.24 5.49
Total, from manufacturing sites (using GHG protocol market-based method)1 (in millions) 5.22 5.14 5.71 4.77 5.18
Emissions Ratio (gCO2 /L) 37.10 36.89 36.23 35.29 33.96 34.83 34.74 33.96 33.33
Business & ESG Report and CDP Manufacturing Emissions Reconciliation
Reported Manufacturing Emissions in Business and ESG Report (millions of MT CO2e)–TCCS Reporting Entity2
Scope 1 emissions per B&ESG 1.61Scope 2 emissions per B&ESG 3.88Total manufacturing emissions per B&ESG 5.49
Reported Manufacturing Emissions in CDP (MT CO2e–TCCC Reporting Entity2, 3
Scope 1–Manufacturing per CDP C7.3c 325,833Scope 2 (location-based)–Manufacturing per CDP C6.3 869,832Scope 3–Franchises per CDP C6.5 4,299,247Total manufacturing emissions per CDP 5,494,912
Total manufacturing emissions per CDP (in millions) 5.49
Energy Use4
Total Energy Use (megajoules) (in millions) 61,599.8 61,764.0 61,037.4 61,558.7 59,070.9 61,464.0 62,419.9 58,888.1 63,735.8 11,758.9 10,985.2 12,731.5
Percentage renewable (electricity) 15% 17% 12%
Energy Use Ratio (megajoules per liter of product) 0.43 0.42 0.41 0.40 0.40 0.39 0.39 0.38 0.39 0.54 0.58 0.61
Greenhouse Gas Emissions & Waste
1 This metric accounts for renewable energy usage.2 The GHG emissions reported in the B&ESG report represent the Coca-Cola system’s manufacturing emissions, which include emissions from activities which are
under the Company’s operational control and activities that are related to Coca-Cola brands that are under direct control of franchise bottlers. Our CDP reporting is aligned with an operational control approach as defined by the GHG Protocol, which includes only emissions from activities within The Coca-Cola Company’s operational control as Scope 1 and 2 emissions, while manufacturing emissions from franchise bottlers are categorized as “Scope 3- Franchises”.
3 The below emissions figures will be reported in the Company's forthcoming 2022 CDP Climate Change response.4 Systemwide total based on estimated total use.Note: Due to joint venture or merger and acquisition activities in 2019-2021, certain brands may not be accounted for in The Coca-Cola Company-specific metrics included on pp. 73-75.
The Coca-Cola Company Coca-Cola System
Executive Summary
The Coca-Cola Company 2021 Business & ESG Report 74
CEO Message AgriculturePortfolioOur Company PeoplePackaging FrameworksWater OperationsClimate Data Appendix

Overview Financial & Portfolio Data Packaging Water Workplace, Safety & Giving Back Human Rights & Agriculture Assurance StatementGreenhouse Gas Emissions & Waste
Fleet Fuel ManagementFleet fuel consumed (liters of diesel equiv.) 1.01B1 1.10B
HFC-Free CoolersNumber of pieces of HFC-free refrigeration equipment placed 623,160 730,876 886,693 918,009 571,753 803,602 Percentage of all coolers introduced in year that are HFC-free2 61% 65% 80% 82% 83% 87%
Waste2
Total Waste Generated (kilograms) (in millions) 1,441.3 1,360.5 1,297.4 1,367.8 1,269.9 N/A3 Total Waste Ratio (grams per liter) 9.42 9.42 8.89 9.17 8.82 N/A3 Total Waste Recovered (kilograms) (in millions) 1,264.6 1,181.3 1,134 1,212 1,135 N/A3
Waste Recovered Percentage 87% 86% 87% 89% 89% N/A3
Greenhouse Gas Emissions & Waste (continued)
1 This 2020 figure has been adjusted.2 Systemwide total based on estimated total use.3 Not available as of April 26, 2022. These metrics to be updated upon completion.Note: Due to joint venture or merger and acquisition activities in 2019-2021, certain brands may not be accounted for in The Coca-Cola Company-specific metrics included on pp. 73-75.
The Coca-Cola Company Coca-Cola System
Year ended December 31, 2013 2014 2015 2016 2017 2018 2019 2020 2021
Executive Summary
The Coca-Cola Company 2021 Business & ESG Report 75
CEO Message AgriculturePortfolioOur Company PeoplePackaging FrameworksWater OperationsClimate Data Appendix

Overview Financial & Portfolio Data Packaging Water Greenhouse Gas Emissions & Waste Human Rights & Agriculture Assurance StatementWorkplace, Safety & Giving Back
Workplace, Safety & Giving Back
1 Corporate associates are included in the geographic area in which they work. Bottling Investments is an operating segment with associates located in two of our four geographic operating segments. Numbers are approximate and as of December 31, 2021.
2 Data as of December 31, 2021, for salaried and hourly employees. This data excludes Bottling Investments, Costa, fairlife and BODYARMOR employees.3 Global Ventures, CHI, fairlife and BODYARMOR employees are currently excluded from our LTIR reporting. For more information, view the criteria statement.
Note: Due to joint venture or merger and acquisition activities in 2019-2021, certain brands may not be accounted for in The Coca-Cola Company-specific metrics included on pp. 73-75.
Year ended December 31, 2013 2014 2015 2016 2017 2018 2019 2020 2021
Lost-Time Incident Rate 1.9 1.9 1.6 1.29 0.57 0.38 0.32 0.34 0.283
Number of Employees
Global Workforce1 130,600 129,200 123,200 100,300 61,800 62,600 86,200 80,300 79,000
North America 3,900 7,000 10,000 10,700 11,000 12,100 10,800 10,000 10,000Bottling Investments 69,200 64,700 57,200 46,600 7,700 — — — —
Latin America 2,400 2,500 2,400 2,500 2,500 2,400 2,400 2,200 2,400Bottling Investments 2,200 2,200 2,000 2,000 1,900 — — — —
Europe, Middle East & Africa 5,200 5,100 4,900 4,400 4,100 4,300 5,700 5,300 5,500Bottling Investments 12,000 10,400 10,700 — 15,300 15,400 17,000 17,300 16,300
Asia Pacific 3,000 2,800 2,600 2,600 2,600 2,600 2,900 2,700 2,900Bottling Investments 32,700 34,500 33,400 31,500 16,700 25,800 25,700 23,800 22,900
Global Ventures 21,700 19,000 19,000
Gender Representation by Level (global)2
Female (global) Senior Leadership 34% 38.7% Middle Management 49% 50.5% Professionals 36% 35.3% Total 42% 42.9%
Male (global) Senior Leadership 66% 61.3% Middle Management 51% 49.5% Professionals 64% 64.7% Total 58% 57.1%
The Coca-Cola Company Coca-Cola System
Executive Summary
The Coca-Cola Company 2021 Business & ESG Report 76
CEO Message AgriculturePortfolioOur Company PeoplePackaging FrameworksWater OperationsClimate Data Appendix

Overview Financial & Portfolio Data Packaging Water Greenhouse Gas Emissions & Waste Human Rights & Agriculture Assurance StatementWorkplace, Safety & Giving Back
Workplace, Safety & Giving Back (continued)
Year ended December 31, 2020 2021
Race/Ethnicity Representation by Level (U.S. only)
Senior Leadership 29%* Asian 10.0% Hispanic 9.4% Black 8.2% American Indian/Alaskan 0.2% Native Hawaiian/Pacific Islander 0.2% White 62.7% Two or more races 0.9% Not disclosed 8.4%
Middle Management 35%* Asian 10.4% Hispanic 8.9% Black 15.4% American Indian/Alaskan 0.3% Native Hawaiian/Pacific Islander 0.2% White 58.0% Two or more races 2.0% Not disclosed 4.8%
Professionals 51%* Asian 4.2% Hispanic 20.6% Black 27.4% American Indian/Alaskan 0.6% Native Hawaiian/Pacific Islander 0.3% White 42.3% Two or more races 2.5% Not disclosed 2.1%
Total 43%* Asian 7.2% Hispanic 14.8% Black 20.9% American Indian/Alaskan 0.5% Native Hawaiian/Pacific Islander 0.2% White 50.4% Two or more races 2.2% Not disclosed 3.8%
The Coca-Cola Company Coca-Cola System * This percentage represents People of Color.
Executive Summary
The Coca-Cola Company 2021 Business & ESG Report 77
CEO Message AgriculturePortfolioOur Company PeoplePackaging FrameworksWater OperationsClimate Data Appendix

Overview Financial & Portfolio Data Packaging Water Greenhouse Gas Emissions & Waste Human Rights & Agriculture Assurance StatementWorkplace, Safety & Giving Back
Workplace, Safety & Giving Back (continued)
The Coca-Cola Company Coca-Cola System
1 Includes reports and allegations raised through The Coca-Cola Company’s Human Rights Policy reporting process. 2 In 2019, Employee Relations redefined how cases were captured in the case management tool of record. Therefore, the reported figure includes only those
allegations that required investigations only as opposed to generalized questions raised to Employee Relations. Please note, however, that all questions presented to Employee Relations were answered even if the question did not warrant an investigation. While we previously reported on all cases and questions raised through our case management tool, we no longer capture that data. This helps us to ensure that we have more accurate visibility to annual Human Rights cases. This change accounts for the 2019 variance when compared to previous years.
3 This amount includes charitable grants awarded by The Coca-Cola Foundation and donations made by The Coca-Cola Company.4 This percentage was calculated based on the company’s prior year operating income (excluding the Bottling Investments operating segment).
Year ended December 31, 2013 2014 2015 2016 2017 2018 2019 2020 2021
Human Rights Cases Reported by Category1
Ask a Workplace Rights Question 20 11 8 2 — — —Child Labor 1 — — — — — —Discrimination 88 55 42 59 452 30 42Forced Labor 3 — — — — — —Freedom of Association 3 4 1 1 — — —Retaliation 47 37 23 17 172 17 22Safe and Healthy Workplace 55 33 22 31 52 74 50Work Hours and Wages 64 42 34 36 182 5 7Workplace Security 20 10 13 15 122 9 8Total Cases 300 192 143 161 972 135 129
Investment Back into Local Communities Amount of charitable contributions made by The Coca-Cola Company and The Coca-Cola Foundation (in millions)3 $ 143 $ 126 $ 117 $ 106 $ 138 $ 125 $ 125 $ 186.1 $ 173.5 Percentage of the company’s operating income4 1.4% 1.3% 1.9% 1.2% 1.6% 1.5% 1.3% 1.9% 2.0%
Executive Summary
The Coca-Cola Company 2021 Business & ESG Report 78
CEO Message AgriculturePortfolioOur Company PeoplePackaging FrameworksWater OperationsClimate Data Appendix

Overview Financial & Portfolio Data Packaging Water Greenhouse Gas Emissions & Waste Workplace, Safety & Giving Back Assurance StatementHuman Rights & Agriculture
Human Rights & Agriculture
1 Independent third-party audits.2 Progress toward total sustainable sourcing of all 12 priority ingredients, combined, using third-party validation programs against The Coca-Cola Company’s previous Sustainable Agriculture Guiding Principles (SAGP) effective 2013–2020.3 Progress toward total sustainable sourcing of all 12 priority ingredients, combined, using third-party validation programs approved under the Coca-Cola Company’s Principles of Sustainable Agriculture (PSA) effective 2021.4 We anticipate resumption of data reporting for individual priority ingredients in the 2022 Business & ESG Report.
Year ended December 31, 2013 2014 2015 2016 2017 2018 2019 2020 2021
Human Rights Audits by RegionTotal 2,318 2,789 3,204 2,823 2,778 2,279 2,848 Africa1 120 188 259 236 206 165 297 Eurasia1 116 93 133 109 78 89 124Europe1 218 339 356 280 376 296 385Latin America1 563 705 775 627 698 571 795Middle East & North Africa1 57 77 109 107 95 56 62North America1 171 180 266 208 161 124 156Pacific1 1,073 1,207 1,306 1,256 1,164 978 1,029
Number of Women Economically Enabled (cumulative) 552,164 864,996 1,237,734 1,751,626 2,413,079 3,278,866 4,602,033 6,073,1172020 goal
achieved
AgricultureSustainably source our key agricultural ingredients
% of key ingredients sustainably sourced 8% not available not available 44% 54% 56% 61%2
Principles for Sustainable Agriculture (PSA) 58%3
Apples not available 0–25% 26–50% 50% 60% –4
Coffee 76–100% 76–100% 76–100% 90% 97% –4
Corn 0–25% 0–25% 51–75% 67% 67% –4
Grapes not available 26–50% 26–50% 31% 39% –4
Lemons 51–75% 51–75% 51–75% 79% 82% –4
Mangos not available not available 0–25% 19% 34% –4
Oranges 0–25% 0–25% 26–50% 44% 44% –4
Soybeans not available not available 76–100% 100% 100% –4
Sugar Beets 51–75% 51–75% 51–75% 69% 83% –4
Sugar Cane 0–25% 0–25% 0–25% 32% 31% –4
Tea 76–100% 76–100% 76–100% 82% 84% –4
Pulp & Paper not available not available not available 75% 92% –4
The Coca-Cola Company Coca-Cola System
Executive Summary
The Coca-Cola Company 2021 Business & ESG Report 79
CEO Message AgriculturePortfolioOur Company PeoplePackaging FrameworksWater OperationsClimate Data Appendix

Overview Financial & Portfolio Data Packaging Water Greenhouse Gas Emissions & Waste Workplace, Safety & Giving Back Human Rights & Agriculture Assurance Statement
Executive Summary
The Coca-Cola Company 2021 Business & ESG Report 80
CEO Message AgriculturePortfolioOur Company PeoplePackaging FrameworksWater OperationsClimate Data Appendix
2021 Business & ESG Report Assurance Statement
Assurance Statement

Executive Summary
The Coca-Cola Company 2021 Business & ESG Report 81
CEO Message AgriculturePortfolio Data AppendixOur Company PeoplePackagingWater OperationsClimate Frameworks
Reporting Frameworks & SDGs
In a separate PDF document available soon, we index the contents of this report to several reporting frameworks and standards.
Global Reporting Initiative (GRI)
Task Force on Climate-related Financial Disclosures
The Sustainability Accounting Standards Board (SASB)
The United Nations Global Compact (UNGC)
UN Guiding Principles Reporting Framework (UNGPRF)
The United Nations Sustainable Development Goals (SDGs)
GRI provides a globally recognized framework for companies to measure and communicate their environmental, economic, social and governance performance. We prepared this report in accordance with the GRI Standards: Core option. This is the eleventh consecutive year that these reporting principles have informed our reporting process, and we assess our progress against these guidelines. In this report, the GRI General Disclosures are solely for The Coca-Cola Company. For all other indicators, the scope is identified in the referenced documents. Beyond reporting on performance indicators required by the GRI, we report on additional indicators important to our broad range of stakeholders.
This report also meets the requirements of the UNGC Advanced Communication on Progress and aligns with the UNGPRF, which addresses reporting on human rights.
We review our reporting regularly and aim to be as responsive as possible to our stakeholders’ feedback.