A paradigmatic cross-cultu - Redalyc
14
Psicothema ISSN: 0214-9915 [email protected] Colegio Oficial de Psicólogos del Principado de Asturias España Byrne, Barbara M.; van de Vijve, Fons J. R. The maximum likelihood alignment approach to testing for approximate measurement invariance: A paradigmatic cross-cultural application Psicothema, vol. 29, núm. 4, 2017, pp. 539-551 Colegio Oficial de Psicólogos del Principado de Asturias Oviedo, España Available in: http://www.redalyc.org/articulo.oa?id=72753218017 How to cite Complete issue More information about this article Journal's homepage in redalyc.org Scientific Information System Network of Scientific Journals from Latin America, the Caribbean, Spain and Portugal Non-profit academic project, developed under the open access initiative
-
Upload
khangminh22 -
Category
Documents
-
view
3 -
download
0
Transcript of A paradigmatic cross-cultu - Redalyc

Psicothema
ISSN: 0214-9915
Colegio Oficial de Psicólogos del
Principado de Asturias
España
Byrne, Barbara M.; van de Vijve, Fons J. R.
The maximum likelihood alignment approach to testing for approximate measurement
invariance: A paradigmatic cross-cultural application
Psicothema, vol. 29, núm. 4, 2017, pp. 539-551
Colegio Oficial de Psicólogos del Principado de Asturias
Oviedo, España
Available in: http://www.redalyc.org/articulo.oa?id=72753218017
How to cite
Complete issue
More information about this article
Journal's homepage in redalyc.org
Scientific Information System
Network of Scientific Journals from Latin America, the Caribbean, Spain and Portugal
Non-profit academic project, developed under the open access initiative

539
In substantive research that focuses on multiple-group comparisons, it is typically assumed that the assessment scale is operating equivalently across the groups of interest. That is to say, there is presumed equality of: (a) factorial structure (i.e., same number of factors and pattern of item loadings onto these factors), (b) perceived item content, (c) factor loadings (i.e., similar size of item estimates), and (d) when comparison of latent factor means of interest, the item intercepts (i.e., the item means). Development of a method capable of testing for such multigroup equivalence (i.e.,
invariance) derives from the seminal confi rmatory factor analytic (CFA) work of Jöreskog (1971), which is rooted in the analysis of covariance structures. In a critically important extension of Jöreskog’s CFA work, Sörbom (1974) made possible tests for the invariance of latent factor means (commonly referred to in reverse as latent mean differences), based on the analysis of mean and covariance structures (i.e., the moment matrix). Structural equation modeling (SEM) is the premier analytic strategy capable of testing these assumed measurement equivalencies, in addition to testing for latent mean differences across groups.
A review of the early SEM literature reveals applications of multigroup testing for measurement invariance to be blatantly sparse in its fi rst decade of existence. Indeed, it was not until the mid-1980s and early 1990s that this methodological strategy actually started to take hold, with most researchers focused on construct validation issues related to construct dimensionality
ISSN 0214 - 9915 CODEN PSOTEG
Copyright © 2017 Psicothema
www.psicothema.com
The maximum likelihood alignment approach to testing for approximate measurement invariance: A paradigmatic cross-cultural application
Barbara M. Byrne1 and Fons J.R. van de Vijver2
1 University of Ottawa and 2 University of Tilburg
Abstract Resumen
Background: The impracticality of using the confi rmatory factor analytic (CFA) approach in testing measurement invariance across many groups is now well known. A concertedeffort to addressing these encumbrances over the last decade has resulted in a new generation of alternative methodological procedures that allow for approximate, rather than exact measurement invariance across groups. The purpose of this article is twofold: (a) to describe and illustrate common diffi culties encountered when tests for multigroup invariance are based on traditional CFA procedures and the number of groups is large, and (b) to walk readers through the maximum likelihood (ML) alignment approach in testing for approximate measurement invariance. Methods: Data for this example application derive from an earlier study of family functioning across 30 cultures that include responses to the Family Values Scale for 5,482 university students drawn from 27 of these30 countries. Analyses were based on the Mplus 7.4 program. Results: Whereas CFA tests for invariance revealed 108 misspecifi ed parameters that precluded tests for latent mean differences, noninvariant results were well within the acceptable range for the alignment approach thereby substantiating the trustworthiness of the latent mean estimates and their comparison across groups. Conclusion: The alignment approach in testing for approximate measurement invariance provides an automated procedure that can overcome important limitations of traditional CFA procedures in large-scale comparisons.
Keywords: Alignment optimization, large-scale measurement invariance, cross-cultural comparisons.
El enfoque de alineamiento de máxima verosimilitud para evaluar de forma aproximada la invarianza de medida: una aplicación intercultural paradigmática. Antecedentes: la imposibilidad de utilizar el análisis factorial confi rmatorio (AFC) para evaluar la invarianza de medida para muchos grupos es bien conocida. El objetivo de este artículo es doble: (a) describir e ilustrar las difi cultades que se encuentran cuando las pruebas para evaluar la invarianción multigrupo se basan en los procedimientos tradicionales de AFC y el número de grupos es grande, y (b) mostrar a los lectores el método de alineamiento de máxima verosimilitud para evaluar la invarianza de medida aproximada. Método: los datos provienen de un estudio intercultural previo sobre funcionamiento familiar que incluye 30 culturas. Se aplicó la Escala de Valores Familiares a 5.482 estudiantes universitarios de 27 de estos 30 países. Los análisis se realizaron con el programa Mplus 7.4. Resultados: los métodos basados en el AFC generaron 108 parámetros mal especifi cados, lo cual hace inviable la comparación de las diferencias de medias latentes. Con el método de alineamiento se obtuvieron resultados de invarianza dentro de un rango acceptable, lo cual da solidez a las estimaciones de las medias latentes y su comparación a través de los grupos. Conclusion: el método de alineamiento para la evaluación de la invarianza de medida aproximada proporciona un procedimiento automatizado que puede superar las importantes limitaciones de los métodos tradicionales basados en el AFC.
Palabras clave: método de alineamiento optimizado, invarianza de medida, comparaciones interculturales.
Psicothema 2017, Vol. 29, No. 4, 539-551
doi: 10.7334/psicothema2017.178
Received: April 16, 2017 • Accepted: August 21, 2017Corresponding author: Barbara M. ByrneSchool of PsychologyUniversity of OttawaOtawa, Ontario (Canada)e-mail: [email protected]

Barbara M. Byrne and Fons J.R. van de Vijver
540
equivalence (e.g., Byrne, 1989; Byrne & Shavelson, 1987; Marsh & Hocevar, 1985) and/or assessment scale equivalence (e.g., Byrne, 1988, 1991; Drasgow & Kanfer, 1985) across groups. The next twenty years, however, witnessed rapidly expanding application of this methodological strategy as evidenced from a review of scholarly journals that revealed the publication of 40 articles from 1980 to 1989, 210 articles from 1990 to 1999, and a remarkable 2,545 articles from 2000 to 2009 (Rutkowski & Svetina, 2014), all of which were limited to within-country comparisons.
Despite this increase in tests for measurement invariance per se, a recent study of the frequency of invariance tests in the Journal of Cross-Cultural Psychology, a journal that specializes in cross-cultural comparisons, revealed that only 17% of the studies conducted such tests (Boer, Hanke, & He, in press). Thus, even if invariance tests are becoming more commonly applied within national boundaries, there is still a long way to go before they become routinely applied in cross-cultural studies.
Furthermore, it is important to note that the same pattern of growth has not been evident with respect to tests for latent mean differences. Rather, reports in the literature of such research have been scant. However, in a follow-up review of the literature subsequent to the earlier work of Vandenberg and Lance (2000), Schmitt and Kuljanin (2008) reported a substantial increase in the frequency with which these tests for latent mean differences have been conducted. One possible explanation for this short-term increase could be linked to the publication of pedagogical papers (e.g., Byrne & Stewart, 2006; Little, 1997), as well as book chapters published during this time that focused exclusively on this procedure (e.g., Byrne, 1998, 2001, 2006).
Clearly, the volume of literature addressing the testing of measurement invariance surely refl ects on the current heightened awareness of researchers regarding this critical preliminary step in the conduct of multigroup mean comparisons. Nonetheless, upon closer scrutiny of this literature, it becomes evident that the lion’s share of these tests for invariance has been limited to comparisons across two groups, with only a modicum of studies testing for equivalence across at least three groups (see, e.g., Byrne & Campbell, 1999; Munet-Vilaró, Gregorich, & Folkman, 2002; Robert, Lee, & Chan, 2006; Woehr, Arciniega, & Lim, 2007), and become increasingly scant as the number of groups under test increase. The ultimate question here then, is why this fi nding should be so?
In broad terms, the answer to this query has been shown to lie in the restrictiveness of CFA procedures in testing for measurement invariance. More specifi cally, it stems from the requirement that (a) all non-target factor loadings in multifactor models are constrained to zero across groups, (b) there are zero error covariances among the indicator variables across groups, and (c) when testing latent mean differences is of interest, the indicator variable intercepts are equivalent. Indeed, it has recently become customary to refer to this original CFA approach to testing for measurement invariance as the “exact” approach (see, e.g., Zercher, Schmidt, Cieciuch, & Davidov, 2015). When this CFA approach is used in testing for invariance across a large number of groups, results typically yield poor model fi t underscored by numerous modifi cation indexes, thereby leading Asparouhov and Muthén (2014) to note its impracticality for use in large-scale studies. In addition, Byrne and van de Vijver (2010) detailed two aspects of this CFA methodological procedure that contribute importantly to the impracticality of its use: (a) establishment of
a group-appropriate structure of the confi gural model (Horn & McArdle, 1992), and (b) limited functionality of all SEM software in comparing only one group at a time with each of the other groups. Both of these latter two procedures involve an abundance of time and labor intensity that becomes progressively more demanding as the number of groups increase (Details related to these three issues follow later.)
Taken together, these three aspects of the CFA approach to tests for multigroup invariance make it cumbersome and impractical in large-scale assessment. As a result, these limitations have remained a major impediment to advancing our substantive knowledge of cross-group differences within the context of a wide variety of disciplines and in the conduct of numerous important large scale studies both nationally and cross-nationally. A few examples of such studies are as follows: (a) construct validation studies in which researchers wish to test for the equivalence of an assessment scale, theoretical construct, or nomological network across multiple national, international, or cross-cultural groups; (b) large-scale cross-national and cross-cultural educational surveys of academic achievement in various subject areas such as the Programme for International Student Assessment (PISA) and Trends in International Mathematics and Science Study (TIMSS; see, e.g., Marsh, Abduljabbar, Parker, Morin, Abdelfattah, & Nagengast, 2014); and/or (c) large-scale sociological studies such as the European Social Survey (ESS; see, e.g., Davidov, Cieciuch, Mueleman, Schmidt, Algesheimer, & Hausherr, 2015), the European Value Study (EVS), and the World Value Survey (WVS).
Frustrated and hampered by these limitations of the multigroup CFA approach to tests for measurement invariance, the past 6 to 8 years has seen a growing number of researchers, particularly those interested in cross-national comparisons, actively testing out alternative methodological strategies capable of achieving the same goals, albeit without the same limitations. This progression of new testing strategies began with a procedure that allowed for either the deletion of particular groups due to their failure to meet the constraints of invariance (see, e.g., Davidov, 2008) or for the deletion and replacement of particular items that failed to demonstrate invariance (see, e.g., Thalmayer & Saucier, 2014). This initial path to addressing the CFA limitations was soon followed by the introduction of two methodological strategies that, in contrast to the CFA approach, allowed for tests of approximate, rather than exact measurement invariance: (a) exploratory structural equation modeling (ESEM; Asparouhov & Muthén, 2009; and (b) Bayesian structural equation modeling (BSEM; Muthén & Asparouhov, 2012). Finally, Asparouhov and Muthén (2014) recently introduced the new and unique technique of alignment in testing for measurement invariance when the number of groups is large.
Our primary intent in this article is to walk readers through an example application of the alignment strategy based on data used in reanalysis of a previous study that tested for measurement invariance and latent mean differences across 27 cultural groups (see Byrne & van de Vijver, 2010). More specifi cally, our purpose is twofold: (a) to describe and illustrate the common diffi culties encountered when tests for multigroup invariance are based on traditional CFA procedures and the number of groups is large; and (b) to outline and illustrate the ML alignment approach to multigroup tests for invariance based on the same 27-country data.

The maximum likelihood alignment approach to testing for approximate measurement invariance: A paradigmatic cross-cultural application
541
Given that the CFA approach to measurement invariance is now well known, we begin with only a brief overview of this traditional multigroup testing strategy. Next, we elaborate on, and illustrate the problems noted earlier in using the CFA approach to test for invariance based on a previous attempt to acquire such information for a large scale study comprising 27 countries (see Byrne & van de Vijver, 2010). These problematic issues are followed by a brief description of ESEM and BSEM, the two initially introduced alternate approaches to multigroup CFA that focus on approximate, rather than on exact measurement invariance, and cite a few example applications of each. We then move on to a description of the alignment approach to tests for invariance, explain how it addresses the above-noted CFA limitations, and outline the steps involved in testing for multigroup invariance and latent mean differences based on ML estimation. Finally, based on the same data used in the earlier Byrne and van de Vijver (2010) study, we walk the reader through each of the steps comprising use of the alignment approach in testing for approximate measurement invariance and latent mean differences based on ML estimation. The paper is written in a didactic mode that embraces a nonmathematical, rather than a statistically-oriented approach to the topic and is intended as a guide for researchers interested in applying this methodology but who may be somewhat uncertain of the testing strategy involved.
Traditional CFA approach to tests for multigroup invariance
Testing for multigroup invariance entails a hierarchical set of steps that should always begin with determination of a well-fi tting baseline model for each group separately. Once these baseline models are established, their separate model specifi cations are combined thereby representing a multigroup baseline model. In technical terms, this initial multigroup model is termed the confi gural model (Horn & McArdle, 1992) and is the fi rst and least restrictive one to be tested. With the confi gural model, only the extent to which the same pattern (or confi guration) of fi xed and freely estimated parameters holds across groups is of interest and thus no equality constraints are imposed. It is this multigroup model for which sets of parameters are subsequently put to the test of equality in a logically-ordered and increasingly restrictive fashion. In contrast to the confi gural model, all remaining tests for measurement equivalence involve the specifi cation of increasingly restrictive cross-group equality constraints for particular parameters.
Limitations of CFA approach with large-scale studies In a study designed specifi cally to illustrate the extent to which
the CFA approach to testing for invariance can be problematic when applied to large-scale and widely diverse cultural groups, Byrne and van de Vijver (2010) were unable to structure a well-fi tting confi gural model, despite a precise and systematic attempt to identify sources of noninvariance and misspecifi cation. As a result, they could not test for multigroup equivalence. Consistent with Asparouhov and Muthén (2014) as well as Rutkowski and Svetina (2014), Byrne and van de Vijver (2010) concluded this approach to be completely impractical and attributed the diffi culties to stem from at least three aspects of the CFA procedure as follows:
1. Given that assessment scales are often group-specifi c in
the way they operate, it has been customary to establish a
baseline model before testing for multigroup equivalence. These models should exhibit the best-fi tting, yet most parsimonious model representing data for a particular group. Although typically, these baseline models are the same for each group, they need not be (see Bentler, 2005; Byrne et al., 1989). For example, it may be that the best-fi tting model for one group includes an error covariance or a cross-loading, but not so for other groups under study. Presented with such fi ndings, Byrne et al. (1989) showed that by implementing a condition of partial measurement invariance, multigroup analyses can still continue given that the recommended conditions for some are met. As noted earlier, these fi nal best-fi tting baseline models are then combined to form the multigroup model, commonly termed the confi gural model. This technique however, only works well when the number of groups is small (as illustrated later).
2. Given the somewhat impossible task of determining baseline models for a large number of groups, we then began with a confi gural model for which the same hypothesized factorial structure was specifi ed for all groups simultaneously. However, there are numerous challenges associated with such a multigroup model, some of which might relate to translation issues, sample comparability (the study employed convenience samples of students), and/or differential applicability of item contents (e.g., the sample of countries differed in the importance of the extended family). Not surprisingly, we were unable to attain a well-fi tting model. Goodness-of-fi t results revealed the robust CFI values to be .837 and the RMSEA values to be .066 (based on the EQS 62 program [Bentler, 2005]). A major complicating factor here arises from the CFA analysis itself in that all non-target factor loadings are fi xed to zero, with only the hypothesized specifi ed loadings being freely estimated. In theory, these restricted zero loadings are expected to hold across all groups under test. In practice, however, this is typically not the case, thereby leading to a poorly fi tting model and a substantial number of misspecifi ed parameters as indicated by the modifi cation indexes which, in turn, may result in a totally false model (Muthén & Asparouhov, 2014).
3. Common to all SEM programs is the process of testing for the equality of constrained parameters by comparing two groups at a time. For example, given four groups, the program initially compares Group 1 with Group 2, then with Group 3 and then with Group 4. The researcher must subsequently respecify the input fi le such that on the next run, Group 2 is compared with Group 3 and then, with Group 4. The fi nal respecifi cation and testing of the input fi le compares Group 3 with Group 4. Thus, it is easy to see that conducting a comparison of group pairs across 27 countries is rendered an exceedingly tedious, if not impossible task!
The ESEM and BSEM approaches to testing for approximate measurement invariance
The ESEM approach. Building upon the strengths of both
exploratory factor analyses (EFA) and the more traditional CFA strategy, development of the ESEM approach represents a combined synthesis of both methodologies that enables a less restrictive testing for the equivalence of factorial structures. More specifi cally, in contrast to CFA in which all non-target

Barbara M. Byrne and Fons J.R. van de Vijver
542
factor loadings (i.e., cross-loadings) and error covariances (i.e., residual covariances) are fi xed to, and presumed to be zero, ESEM allows these parameters to be freely estimated. These non-zero loadings of items on non-target factors are a common feature in personality and attitude measurement, where instruments with a high dimensionality are used and it is diffi cult to specify items that tap only into the target factor (e.g., Costa & McCrae, 1995), which is exacerbated in cross-cultural work. Thus, although the factor structure is similarly hypothesized across the ESEM and CFA procedures, model specifi cation of both the factor loadings and error covariances differ. Consistent with other SEM procedures, ESEM provides access to all the usual parameters, standard errors, and fi t indexes, and also allows for rotation of the original measurement model. ESEM is considered to be supported by the data if the target loadings (i.e., factor loadings of items designed specifi cally to measure the latent factors of interest) are substantially higher than the non-target cross-loadings and the model exhibits a satisfactory goodness-of-fi t to the sample data (Davidov, Meueleman, Cieciuch, Schmidt, & Billiet, 2014).
Asparouhov and Muthén (2009) contend that the primary advantage of ESEM over other modeling practices is its seamless incorporation of the EFA and SEM models, including the use of fi t statistics and invariance tests in the case of multigroup analyses. They further note that in most applications involving multiple factors, several steps are involved in the process of determining hypothesized model structure. First, EFA is typically used to discover and formulate the factor structure. Second, the researcher uses an ad hoc procedure to mirror this EFA structure as an SEM model having a CFA measurement specifi cation. However, as Asparouhov and Muthén (2009) importantly note, not only does the ESEM approach accomplish this task in a single step, but it can avoid potential pitfalls pertinent to the EFA to CFA conversion. For an extended list of advantages in using ESEM and/or a detailed statistical explanation of the analytic process, readers are referred to Asparouhov and Muthén (2009).
Although the ESEM approach can be used in testing for approximate measurement invariance across few as well as many groups, it is particularly valuable when the number of groups under test is large and represents diverse cultural samples as evidenced from our review of this relatively new, but rapidly growing literature base. We further found the primary interest of most reported ESEM studies to focus on issues of approximate measurement invariance related to assessment scales; these included personality scales (see, e.g., Bowden, Saklofske, van de Vijver, Sudarshan, & Eysenck, 2016; Ion, Iliescu, Aldhafri, Rana, Ratanadilok, Widyanti, & Nedelcea, 2017; Ispas, Iliescu, Ilie, & Johnson, 2014; Marsh, Lüdtke, Muthén, Asparouhov, Morin, Trautwein, & Nagengast, 2010) and attitude scales (see, e.g., Ozakinci, Boratav, & Mora, 2011).
The BSEM approach. As with ESEM, the BSEM approach focuses on the extent to which the measurement parameters are approximately, rather than exactly invariant across groups. In contrast to ESEM, BSEM is conducted solely within a Bayesian framework. As such, all parameters are considered to be variables, with their distribution described by a prior probability distribution (Davidov, Cieciuch, Meuleman, Schmidt, Algesheimer, & Hausherr, 2015; van de Schoot, Kluytmans, Tummers, Lugtig, Hox, & Muthén, 2013). Referred to more commonly as “informative priors”, these distributions are applicable to any constrained parameter in an SEM model (Muthén & Asparouhov, 2012). Of
particular interest in BSEM, however, is the extent to which these priors allow for slight differences between factor loadings and/or intercepts across groups, thereby going beyond the requirement of strict equivalence in the CFA approach. Indeed, van de Schoot et al. (2013) contend that in testing for invariance, a researcher can assume that differences between these two sets of parameters are approximately equal. Thus, in allowing for some degree of uncertainty, specifi cation of a small amount of variance (e.g., 0.01 or 0.05) around the difference in factor loadings and intercepts could be considered reasonable (Zercher, Schmidt, Cieciuch, & Davidov, 2015). But, to what extent can these differences be considered “reasonable”? To date, there are no established rules or recommendations regarding which variance values of the loadings and intercepts may be considered small, medium or large, or the extent to which factor loadings or intercepts maybe considered suffi ciently diverse as to be interpreted in a different manner. These limitations need to be acknowledged.
In addition to the prior distribution, which is crucial to BSEM, the Bayesian approach to these analyses requires two additional components: (a) the likelihood function of the data, which contains all information pertinent to the parameters, and (b) the posterior distribution which represents a synthesis of both the prior and the likelihood function. The posterior distribution comprises updated information through a balance of prior knowledge and the observed data (van de Schoot et al., 2013). Over and above the major interest in attaining approximate invariance pertinent to factor loadings and intercepts, Muthén and Asparouhov (2012) have outlined and illustrated how the use of informative priors can also be used to study error covariances (i.e., residuals) among the factor indicators.
In our review of the applied BSEM literature, we found most studies to focus on testing for approximate invariance related to an assessment scale (e.g., De Bondt & Van Petegem, 2015), a subset of items from an assessment scale designed to measure the same construct (Zercher, Schmidt, Cieciuch, & Davidov, 2015), and a major international survey instrument (Davidov et al., 2015). In addition, both van de Schoot et al. (2013) and Muthén and Asparouhov (2012) present example applications of BSEM. Finally, for an exceptionally well-written article that clearly explains both the concept of, and reason for approximate measurement invariance, in addition to the appropriate application of BSEM in the attainment of such invariance, we refer readers to van de Schoot et al. (2013).
The alignment approach to testing for multigroup invariance and latent mean differences
In broad terms, the overarching difference between the CFA
approach to tests for the multigroup invariance of an assessment scale and that of the alignment approach lies with the absence of specifi ed equality restrictions of both the factor loadings and observed variable (i.e., item, indicator) intercepts across groups. Consistent with both the ESEM and BSEM strategies, alignment allows for a pattern of approximate measurement invariance in the data (Asparouhov & Muthén, 2014). In contrast to CFA, the alignment method begins with a common confi gural model (i.e., no consideration of group baseline models) and then automates the closeness of the factor loading estimates in the process of establishing the most optimal measurement invariance pattern, all of which substantially simplifi es the test for measurement

The maximum likelihood alignment approach to testing for approximate measurement invariance: A paradigmatic cross-cultural application
543
invariance. It does so by incorporating a simplicity function similar to the rotation criteria used in EFA (Asparouhov & Muthén, 2014). Cieciuch, Davidov, and Schmidt (in press) note that one extremely valuable advantage of the alignment procedure in testing for approximate measurement invariance and latent mean differences is that the optimization process automatically takes the non-invariance of all factor loading and intercept parameters into account in the process of means estimation, thereby yielding mean values that are more trustworthy than those calculated without this strategy. Unquestionably, a major strength of the alignment procedure is that it automates and greatly simplifi es tests for invariance across a large number of groups. It can be particularly advantageous when the groups represent countries wherein noninvariance is expected to be large due to cultural and country differences as “existing methods are simply not practical for handling such complexity” (Muthén & Asparouhov, 2014, p. 10). Recent research has shown that the alignment approach to testing measurement invariance is quite feasible, even when the number of groups is large as 92 (see Munck, Barber, & Torney-Purta, in press).
Although alignment can be based on either ML or Bayes estimation, except for the example applications presented in Asparouhov and Muthén (2014), we were able to locate only one Bayesian application based on real data (as opposed to simulated data; see De Bondt & Van Petegem, 2015). Based on simulated data, only van de Schoot et al. (2013) appear to have tested the use of alignment across groups based on both the ML and Bayesian estimators. This dearth of applications clearly relates to the newness of these methodological strategies (see Davidov et al., 2014). Based on the recommendation of other methodologists, as well as his own work in the fi eld, van de Schoot has advised that the Bayesian approach to alignment is in need of much more simulation work in order to be more explicit about the exact priors to use (R. van de Schoot, personal communication, November 3, 2016). In light of this recommendation, together with a virtual void in the literature of alignment applications based on ML estimation at this time, we considered it most constructive to focus on the ML approach. Our intent is to illustrate and address the ML alignment procedure by walking readers through a cross-cultural application based on 27 countries.
Based on the assumption that the number of noninvariant measurement parameters, as well as the extent of measurement noninvariance can be held to a minimum, the alignment method is capable of estimating the factor loadings, item intercepts, factor means and factor variances. As such, alignment optimization enables the estimation of trustworthy means despite the presence of some measurement noninvariance. This process involves two steps and ultimately leads to a modifi ed confi gural model that exhibits the same model fi t, albeit with substantially less noninvariance. The purpose of Step 1 is to establish a base (or root) confi gural model that represents the best-fi tting model among all multigroup factor analytic models having no cross-group constraints as the factor loadings and indicator intercepts are freely estimated for each group; the factor means and factor variances, on the other hand, are fi xed at 0.00 and 1.00, respectively. In Step 2, the factor means and variances are freely estimated and this confi gural model undergoes an optimization process such that for every group factor mean and variance parameter, there are factor loading and intercept parameters that yield the same likelihood estimation as the confi gural model. The ultimate aim of this process, for
each group, is to choose values of both the factor mean and factor variance that minimize the total amount of measurement noninvariance (i.e., it minimizes the total loss simplicity). Asparouhov and Muthén (2014; p. 497) note that the point at which this minimization process terminates will occur where “there are few large noninvariant measurement parameters and many approximately noninvariant parameters rather than many medium-sized noninvariant measurement parameters”. They compare this result with that of EFA rotation for which the aim is to identify either large or small loadings, rather than midsized loadings (For a more statistical description of these analyses, readers are referred to Asparouhov & Muthén, 2014, pp. 496-497).
Once this minimization point has been reached, alignment analyses then focus on a comparison of factor means and factor variances across groups, albeit allowing for approximate invariance in lieu of the more rigid measurement invariance required in the CFA approach. These invariance results derive from use of a so-called “post-estimation algorithm” capable of identifying for each measurement parameter (i.e., factor loadings and item intercepts), the largest invariant set of groups for which the parameter is not statistically signifi cant from the average value for that parameter across all groups included in the invariant set of groups. In contrast, for each group not included in the invariant set of groups, the same parameter is considered to be statistically different from the average value. To prevent false positive noninvariance results, this algorithm conducts multiple pairwise comparisons across groups based on p values < .05. Once alignment estimation has been completed, additional tests can identify measurement parameters that are approximately invariant and those that are not. Details related to these alignment analyses are now described.
Results of the alignment analyses derive from a series of coordinated steps. First, identifi cation of a starting set of invariant groups must be established. This procedure involves the assessment of every factor loading and item intercept parameter in the model. That is, given P parameters and G Groups, there will be (not considering a few parameters that are constrained for fi xating scales of the latent variables) P × G factor loading and P × G item intercept parameters. Ultimately then, for each of these parameters, a set of groups is identifi ed for which the parameter is noninvariant; this set of groups will be different for every parameter (personal communication, B. Muthén, November, 24, 2015). Based on the conduct of pairwise tests for each pair of groups, two groups are then connected if the p-value obtained by this comparison is larger than .01 (Asparouhov & Muthén, 2014). Second, from these comparisons, the largest connected set for this parameter is determined and then serves as the starting set of groups. Third, the starting set is then modifi ed such that: (a) the average parameter for the current invariance set is computed, and (b) for each group in this set, a test of signifi cance is conducted to compare the parameter value for each group with the average value computed for the current invariance set. A new group is added to the invariant set if the p-value is > .001; if the p-value is < .001, the group is removed from the invariant set. Finally, this process is repeated until the invariant set stabilizes. That is, no groups are either added to, or removed from the invariant set.
Turning now to the example data and statistical analyses, we begin with specifi cation and testing of the confi gural model within the framework of CFA methodology, followed by application of the ML alignment method in testing for multigroup invariance and latent mean differences.

Barbara M. Byrne and Fons J.R. van de Vijver
544
Method
Sample
Data used in this example alignment application derive from a large project designed to measure family functioning across 30 cultures (Georgas, Berry, van de Vijver, Kagitcibasi, & Poortinga, 2006). Our interest in the present study lies with responses to the Family Values Scale (FVS; Georgas, 1999) for 5,482 university students drawn from 27 of these 30 countries (deletions due to technical complexities); sample sizes ranged from n = 65 (Ukraine) to n = 450 (Pakistan). Selection of countries focused on representation of the major geographical and cultural regions of the world so as to maximize eco-cultural variation in known family-related context variables such as economic factors and religion (Georgas et al., 2006). Thus, countries were selected from north, central, and south America; north, east, and south Europe; north, central, and south Africa; the Middle East; west and east Asia; and Oceania.
The FV Scale was administered in university classroom settings and response data collected by the research team trained in each country. All members of each team were indigenous to their home country.
Instrumentation The FV Scale is an 18-item measure having a 7-point Likert
scale that ranges from 1 (strongly disagree) to 7 (strongly agree). Items were derived from an original 64-item pool and selected in such a way that the expected factors (hierarchy and family/kin relationships) would be well represented. Based on EFA fi ndings that revealed near-zero loadings for 4 items (see Byrne & van de Vijver, 2010; van de Vijver, Mylonas, Pavlopoulos & Georgas, 2006) we included only 14 of the 18 items in our application (For additional information related to the data, instrumentation, and/or ethical approval see Georgas et al., 2006.)
Internal consistency coeffi cients were computed by factor for the total sample; Cronbach’s coeffi cient alpha was .87 for the Hierarchy Scale and .80 for the Relationships Scale. Country-wise analyses showed a median alpha coeffi cient of .78 (IQR = .10) for the fi rst scale and .74 (IQR = .11) for the second scale.
The hypothesized model
The CFA model of FV Scale structure is shown schematically in Figure 1. This model hypothesized a priori that, for each cultural group: (a) the FV Scale is most appropriately represented by a 2-factor structure comprising the constructs of Family Hierarchy and Family/Kin Relations, (b) each observed variable (i.e., FV Scale item) has a nonzero loading on the factor it was designed to measure, and zero loadings on the other factor, (c) the two factors are correlated, and (d) measurement error terms are uncorrelated.
Statistical analyses
All analyses were based on the Mplus 7.4 program (Muthén & Muthén, 1998-2015).
Given evidence of non-normality of the data for some countries, the robust MLR estimator was used for both the CFA and
alignment analyses. Although specifi c distributional assumptions such as normality of item parameters is not required in the use of alignment (Muthén & Asparouhov, 2014), we retained the MLR estimator in the interest of consistency. Model goodness-of-fi t related to the CFA application was based on the following robust indexes: the Comparative Fit Index (CFI; Bentler, 1990), the Root Mean Square Error of Approximation (RMSEA; Steiger, 1990), together with its 90% confi dence interval. In addition, the Standardized Root Mean Square Residual (SRMR) is reported.
Results
Confi rmatory factor analytic approach to test for measurement invariance and latent mean differences
For consistency with the Alignment analyses conducted later
in this study, in addition to exemplifying the known diffi culties in
ITEM 1
ITEM 3
ITEM 4
ITEM 6
ITEM 15
ITEM 18
ITEM 2
ITEM 5
ITEM 4
ITEM 9
ITEM 10
ITEM 11
ITEM 12
ITEM 14
FAMILY ROLESHIERARCHY
F1
FAMILY/KINRELATIONS
F2
Figure 1. CFA model of family values scale structure

The maximum likelihood alignment approach to testing for approximate measurement invariance: A paradigmatic cross-cultural application
545
attempts to establish baseline models for multigroup data noted earlier, we began with specifi cation of the postulated confi gural model based on the 27-country database. Goodness-of-fi t statistics were as follows: χ2
(2053) = 4202.223; CFI = 0.869; RMSEA = 0.072,
90% CI = 0.069, 0.075; SRMR = 0.80. As expected, based on our previous study, results revealed 108 misspecifi ed parameters having values > .10 (36 cross-loadings; 72 error covariances). Pakistan exhibited the highest number of misspecifi ed parameters (6 cross-loadings; 17 error covariances), while three countries yielded no evidence of misspecifi cation (Bulgaria, France, Ukraine). The breakdown of these modifi cation indices is summarized in Table 1. Of critical importance is the fact that these misspecifi ed parameters not only vary widely across the 27 countries, but in addition, are minimally replicable across these groups.
These results make it is easy to see why testing for invariance across a large number of groups is fraught with problems when based on the CFA approach. We turn now to alignment factor analysis in testing for invariance, which takes a much less rigid approach to these analyses.
ML alignment approach to tests for measurement invariance and latent mean differences
The alignment approach to these analyses began with the
confi gural model and consistent with the CFA method, was based on robust ML estimation (MLR). However, in contrast to CFA, as
noted earlier (see Step 1; base model), the factor means and factor variances for each group were fi xed to 0.0 and 1.0, respectively, and all factor loading and item intercept parameters were freely estimated. The optimization process comprising the Step 2 analyses subsequently results in a modifi cation of the confi gural model such that the amount of noninvariance has been minimized, without compromising model fi t.
There are two types of alignment optimization that can be specifi ed – free alignment and fi xed alignment. Whereas free alignment optimization estimates the factor mean of Group 1 as an additional parameter, fi xed alignment optimization assumes that this parameter (for Group 1) is fi xed to 0.0 and as such, serves as the reference group. Based on a simulation study comparing these two types of alignment optimization, Asparouhov and Muthén (2014) found that in cases where the number of groups is greater than 2 and given evidence of measurement noninvariance, the free alignment parameters are more accurate than estimates based on fi xed alignment optimization.
Based on these fi ndings, and following Asparouhov and Muthén’s (2014) example application, we initiated the alignment optimization process for the confi gural model based on the free alignment approach. As was the case for the Asparouhov and Muthén, study, the Mplus output yielded the following warning message: “Standard error comparison indicates that the free alignment model may be poorly identifi ed. Using the Fixed
Table 1CFA confi gural model: Summary of modifi cation indices > 0.10 by countrya
Misspecifi ed parameters
Country Factor cross-loadings Error covariances
1. Greece2. Germany3. United Kingdom4. Netherlands5. Cyprus7. Hong Kong8. Brazil10. South Korea11. Mexico12. Nigeria13. Canada14. United States15. Turkey16. Indonesia17. Japan19. France20. Spain21. Algeria22. Georgia23. Ukraine24. Saudi Arabia25. Chile26. Bulgaria27. Pakistan28. Ghana29. Iran30. India
331003102311113000102306001
1321195525121210110071017112
a Although three countries were excluded from the analyses, the originally designated numbers assigned to the original 30 countries were retained, thus accounting for the mismatch between the number of countries in the analyses and their assigned identifi cation numbers
Table 2Factor means by country based on free ML alignment analysis
Factor 1 Factor 2
Country (Group number)Family roles
Hierarchy in family/kin relations
Greece (1) -1.428 -1.213
Germany (2) -1.877 -1.834
United Kingdom (3) -1.658 -1.204
Netherlands (4) -2.342 -1.717
Cyprus (5) -1.263 -0.558
Hong Kong (7) -1.003 -1.357
Brazil (8) -1.232 -0.772
South Korea (10) -0.059 -1.285
Mexico (11) -0.919 -0.945
Nigeria (12) 0.590 -0.151
Canada (13) -1.915 -0.876
United States (14) -1.376 -1.029
Turkey (15) -1.604 -1.118
Indonesia (16) 0.416 -0.298
Japan (17) -1.426 -2.331
France (19) -1.546 -1.139
Spain (20) -2.514 -1.272
Algeria (21) 0.660 0.033
Georgia (22) 0.427 0.535
Ukraine (23) -1.203 -0.764
Saudi Arabia (24) 0.697 -0.223
Chile (25) -1.007 -0.902
Bulgaria (26) -0.898 -0.889
Pakistan (27) 0.610 -0.506
Ghana (28) -0.466 -0.214
Iran (29) 0.003 -0.481
India (30) 0.552 -0.552
Barbara M. Byrne and Fons J.R. van de Vijver
546
alignment option may resolve this problem”. In using the fi xed alignment approach, Asparouhov and Muthén (2014) suggest that the country having the factor mean value closest to 0.0 be specifi ed as the reference group. All factor mean values by country as reported in the free alignment analytic output are shown in Table 2. A review of these values reveals Country 29 (Iran) to have a combination of Factor 1 and Factor 2 means closest to 0.0. Thus, the confi gural model was respecifi ed as a fi xed alignment analysis with the two factor means for Iran constrained to 0.0, and the factor means for the remaining 26 countries freely estimated.
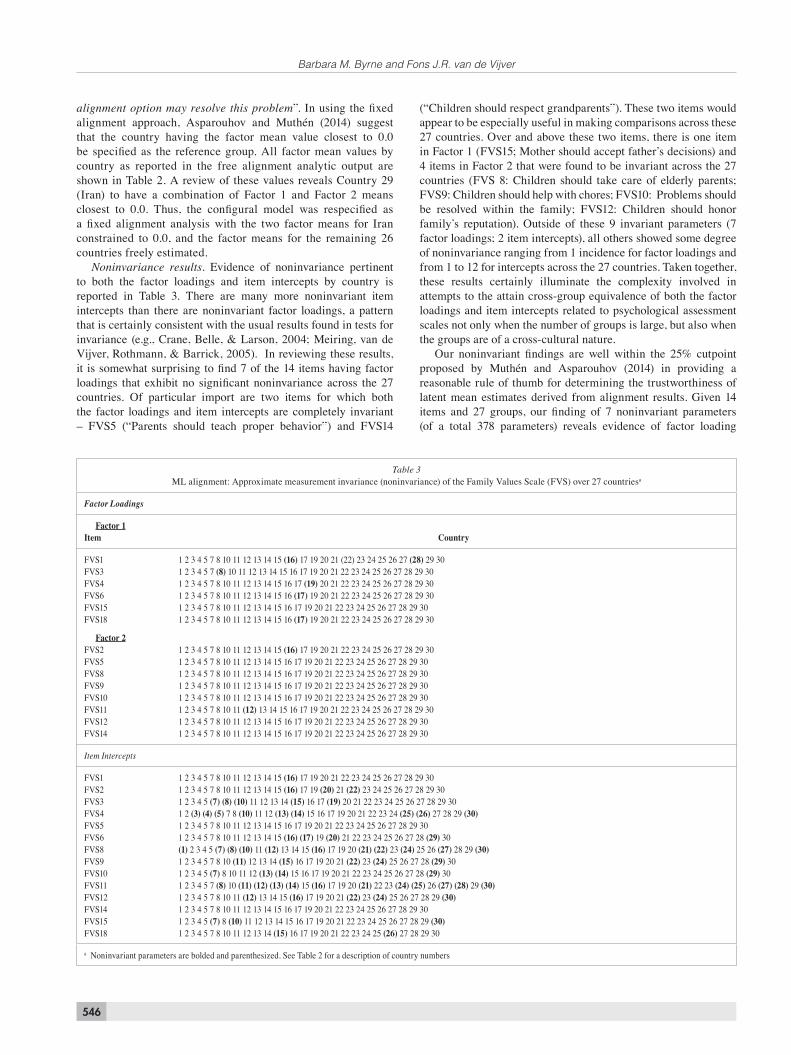
Noninvariance results. Evidence of noninvariance pertinent to both the factor loadings and item intercepts by country is reported in Table 3. There are many more noninvariant item intercepts than there are noninvariant factor loadings, a pattern that is certainly consistent with the usual results found in tests for invariance (e.g., Crane, Belle, & Larson, 2004; Meiring, van de Vijver, Rothmann, & Barrick, 2005). In reviewing these results, it is somewhat surprising to fi nd 7 of the 14 items having factor loadings that exhibit no signifi cant noninvariance across the 27 countries. Of particular import are two items for which both the factor loadings and item intercepts are completely invariant – FVS5 (“Parents should teach proper behavior”) and FVS14
(“Children should respect grandparents”). These two items would appear to be especially useful in making comparisons across these 27 countries. Over and above these two items, there is one item in Factor 1 (FVS15; Mother should accept father’s decisions) and 4 items in Factor 2 that were found to be invariant across the 27 countries (FVS 8: Children should take care of elderly parents; FVS9: Children should help with chores; FVS10: Problems should be resolved within the family; FVS12: Children should honor family’s reputation). Outside of these 9 invariant parameters (7 factor loadings; 2 item intercepts), all others showed some degree of noninvariance ranging from 1 incidence for factor loadings and from 1 to 12 for intercepts across the 27 countries. Taken together, these results certainly illuminate the complexity involved in attempts to the attain cross-group equivalence of both the factor loadings and item intercepts related to psychological assessment scales not only when the number of groups is large, but also when the groups are of a cross-cultural nature.
Our noninvariant fi ndings are well within the 25% cutpoint proposed by Muthén and Asparouhov (2014) in providing a reasonable rule of thumb for determining the trustworthiness of latent mean estimates derived from alignment results. Given 14 items and 27 groups, our fi nding of 7 noninvariant parameters (of a total 378 parameters) reveals evidence of factor loading
Table 3ML alignment: Approximate measurement invariance (noninvariance) of the Family Values Scale (FVS) over 27 countriesa
Factor Loadings
Factor 1Item Country
FVS1FVS3FVS4FVS6FVS15FVS18
1 2 3 4 5 7 8 10 11 12 13 14 15 (16) 17 19 20 21 (22) 23 24 25 26 27 (28) 29 301 2 3 4 5 7 (8) 10 11 12 13 14 15 16 17 19 20 21 22 23 24 25 26 27 28 29 301 2 3 4 5 7 8 10 11 12 13 14 15 16 17 (19) 20 21 22 23 24 25 26 27 28 29 301 2 3 4 5 7 8 10 11 12 13 14 15 16 (17) 19 20 21 22 23 24 25 26 27 28 29 301 2 3 4 5 7 8 10 11 12 13 14 15 16 17 19 20 21 22 23 24 25 26 27 28 29 301 2 3 4 5 7 8 10 11 12 13 14 15 16 (17) 19 20 21 22 23 24 25 26 27 28 29 30
Factor 2FVS2FVS5FVS8FVS9FVS10FVS11FVS12FVS14
1 2 3 4 5 7 8 10 11 12 13 14 15 (16) 17 19 20 21 22 23 24 25 26 27 28 29 301 2 3 4 5 7 8 10 11 12 13 14 15 16 17 19 20 21 22 23 24 25 26 27 28 29 301 2 3 4 5 7 8 10 11 12 13 14 15 16 17 19 20 21 22 23 24 25 26 27 28 29 301 2 3 4 5 7 8 10 11 12 13 14 15 16 17 19 20 21 22 23 24 25 26 27 28 29 301 2 3 4 5 7 8 10 11 12 13 14 15 16 17 19 20 21 22 23 24 25 26 27 28 29 301 2 3 4 5 7 8 10 11 (12) 13 14 15 16 17 19 20 21 22 23 24 25 26 27 28 29 301 2 3 4 5 7 8 10 11 12 13 14 15 16 17 19 20 21 22 23 24 25 26 27 28 29 301 2 3 4 5 7 8 10 11 12 13 14 15 16 17 19 20 21 22 23 24 25 26 27 28 29 30
Item Intercepts
FVS1FVS2FVS3FVS4FVS5FVS6FVS8FVS9FVS10FVS11FVS12FVS14FVS15FVS18
1 2 3 4 5 7 8 10 11 12 13 14 15 (16) 17 19 20 21 22 23 24 25 26 27 28 29 301 2 3 4 5 7 8 10 11 12 13 14 15 (16) 17 19 (20) 21 (22) 23 24 25 26 27 28 29 301 2 3 4 5 (7) (8) (10) 11 12 13 14 (15) 16 17 (19) 20 21 22 23 24 25 26 27 28 29 301 2 (3) (4) (5) 7 8 (10) 11 12 (13) (14) 15 16 17 19 20 21 22 23 24 (25) (26) 27 28 29 (30)1 2 3 4 5 7 8 10 11 12 13 14 15 16 17 19 20 21 22 23 24 25 26 27 28 29 301 2 3 4 5 7 8 10 11 12 13 14 15 (16) (17) 19 (20) 21 22 23 24 25 26 27 28 (29) 30(1) 2 3 4 5 (7) (8) (10) 11 (12) 13 14 15 (16) 17 19 20 (21) (22) 23 (24) 25 26 (27) 28 29 (30)1 2 3 4 5 7 8 10 (11) 12 13 14 (15) 16 17 19 20 21 (22) 23 (24) 25 26 27 28 (29) 301 2 3 4 5 (7) 8 10 11 12 (13) (14) 15 16 17 19 20 21 22 23 24 25 26 27 28 (29) 301 2 3 4 5 7 (8) 10 (11) (12) (13) (14) 15 (16) 17 19 20 (21) 22 23 (24) (25) 26 (27) (28) 29 (30)1 2 3 4 5 7 8 10 11 (12) 13 14 15 (16) 17 19 20 21 (22) 23 (24) 25 26 27 28 29 (30)1 2 3 4 5 7 8 10 11 12 13 14 15 16 17 19 20 21 22 23 24 25 26 27 28 29 301 2 3 4 5 (7) 8 (10) 11 12 13 14 15 16 17 19 20 21 22 23 24 25 26 27 28 29 (30)1 2 3 4 5 7 8 10 11 12 13 14 (15) 16 17 19 20 21 22 23 24 25 (26) 27 28 29 30
a Noninvariant parameters are bolded and parenthesized. See Table 2 for a description of country numbers

The maximum likelihood alignment approach to testing for approximate measurement invariance: A paradigmatic cross-cultural application
547
noninvariance to be exceedingly low at 1.85%. Turning to the intercepts, despite evidence of noninvariance related to 65 of these parameters, their overall percentage of 17.2% is still substantially lower than the recommended 25% cutpoint noted above. In total, then, we feel confi dent in the trustworthiness of the latent mean estimates and their comparisons across 27 countries as reported in Table 5.
Alignment fi t results. In contrast to CFA for which goodness-of-fi t statistics are well known in the determination of well-fi tting models, the alignment method provides no such fi t indexes. Rather, given that this method assumes there is a pattern of only approximate invariance in the data, analyses focus on the fi tting functions in determination of the simplest model having the largest amount of noninvariance. Summarized in Table 4 are the fi tting functions of both the factor loading and intercept for each item in the Family Values Scale. These values are provided when the Technical 8 option is listed on the Output command of the input fi le and represent the contribution made by each of these parameters to the fi nal simplicity function. The far right column represents the total contribution to the fi tting function by each item. In reviewing these values in Table 4, we see that Item FVS14 contributed the least to the fi tting functions of both the factor loadings and intercepts thereby resulting in the lowest overall contribution to the fi tting function (-310.449). This result can be interpreted as an indication that this item exhibited the least amount of noninvariance (For an explanation of negative fi t function values, see Asparouhov & Muthén, 2014, Footnote 2). Indeed, a review of the factor loading and intercept results reported in Table 3, reveals FVS14 to be completely invariant across all 27 countries. However, of substantial interest here is why Item FVS5, for which both the loadings and intercepts were also invariant across the 27 countries, should result in a somewhat larger total fi t function contribution of -411.886? One possible explanation of this discrepancy could be that the largest degree of invariance deviations for Item FVS5 are associated with the smallest groups for which signifi cance is not as easy to achieve (T. Asparouhov, personal communication, December 6, 2016).
The R2 value shown in Table 4 can be found in the computer output following the alignment optimization process. For both the factor loadings and item intercepts, this value represents the explained variance/invariance index. As such, the R2 value indicates the variation of these parameters across groups in the confi gural model that can be explained by variation in the factor means and variances across groups. According to Asparouhov and Muthén (2014), a value close to 1.00 implies a high degree of invariance, whereas a value close to 0.0 suggests a low degree of invariance. Turning to Table 4, we see once again, however, that whereas this fact holds true for Item FVS14, this is not the case for Item FVS5 despite the fact that for both items, both the factor loadings and intercepts were found to be invariant across the 27 countries. Again, this discrepancy within the same factor can be reasonably attributed to the small sample size as noted earlier.
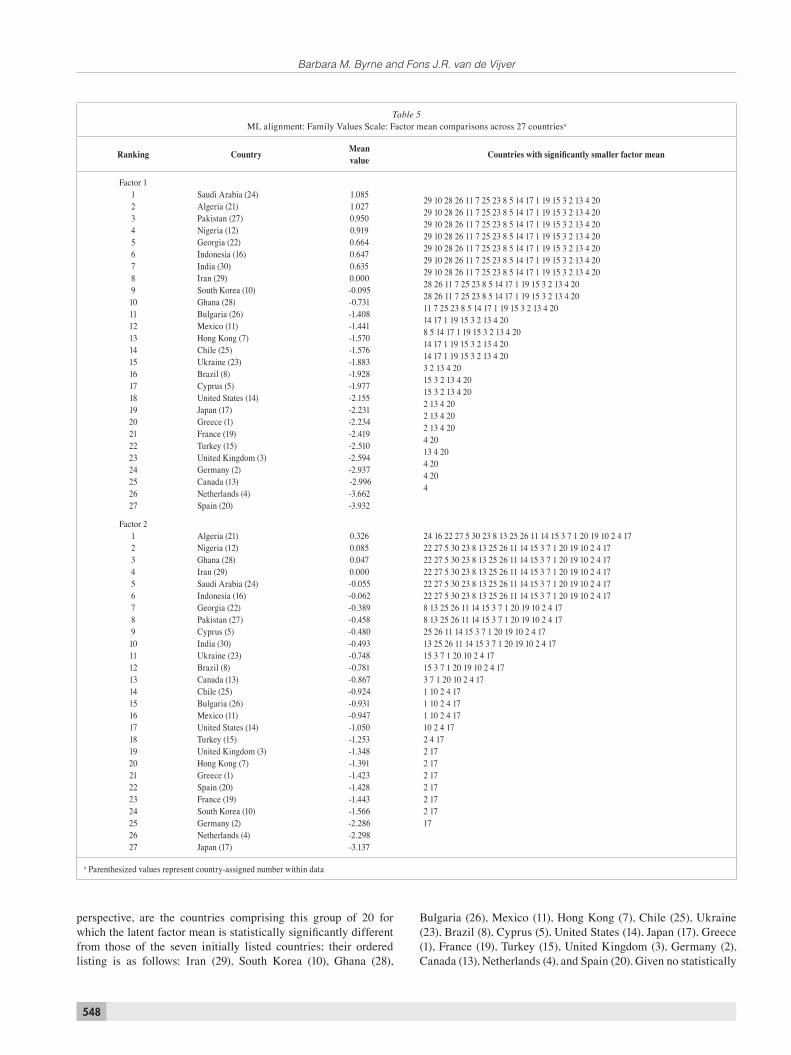
Factor mean results. Factor mean values, as estimated by the fi xed alignment method for each of the 27 countries are presented in Table 5. Arranged in an ordered listing ranging from high to low, the factor mean for each country is accompanied by identifi cation of countries having factor means that are statistically signifi cantly different (p < .05). These results are now detailed separately for each of the two factors.
Factor 1: Family Roles Hierarchy
In examining this fi rst factor, we begin by focusing on only
the fi rst seven countries (Saudi Arabia, Algeria, Pakistan, Nigeria, Georgia, Indonesia, and India) for at least four reasons. First, led by Saudi Arabia with a factor mean of 1.085, these are the countries having the highest mean values pertinent to the Family Roles Hierarchy factor. Second, for each of these initial seven countries, there are 20 other countries that have signifi cantly (p < .05) smaller factor means. Third, these 20 countries remain exactly the same and in the same rank order for each of these fi rst seven countries. Fourth, the initial seven countries precede Country 29 (Iran), which served as the reference country for the fi xed alignment analyses. Of interest from a substantive
Table 4ML alignment: Alignment fi t statistics for the Family Values Scale across 27 countries
Factor loadings Intercepts Loadings + Intercepts
Factor 1 Factor 2
ItemFit function contribution
R2 Fit function contribution
R2 Fit function contribution
R2 Total contribution
FVS1FVS3FVS4FVS6FVS15FVS18
-178.360-183.537-180.733-151.112-182.657-162.471
0.7670.3260.4620.7570.5070.515
-174.779-271.486-319.854-213.937-235.396-215.733
0.9310.7840.7410.9050.8870.900
-353.139-455.023-500.587-365.049-418.053-378.204
FVS2FVS5FVS8FVS9FVS10FVS11FVS12FVS14
-186.008-199.738-178.396-224.957-196.183-168.805-179.279-155.172
0.4620.4140.6580.2790.3100.4760.5530.698
-230.949-212.148-296.795-290.976-215.119-271.925-213.986-155.277
0.6580.5080.6070.4500.6300.6980.7650.907
-416.957-411.886-475.191-515.933-411.302-440.730-393.265-310.449
Barbara M. Byrne and Fons J.R. van de Vijver
548
perspective, are the countries comprising this group of 20 for which the latent factor mean is statistically signifi cantly different from those of the seven initially listed countries; their ordered listing is as follows: Iran (29), South Korea (10), Ghana (28),
Bulgaria (26), Mexico (11), Hong Kong (7), Chile (25), Ukraine (23), Brazil (8), Cyprus (5), United States (14), Japan (17), Greece (1), France (19), Turkey (15), United Kingdom (3), Germany (2), Canada (13), Netherlands (4), and Spain (20). Given no statistically
Table 5ML alignment: Family Values Scale: Factor mean comparisons across 27 countriesa
Ranking CountryMeanvalue
Countries with signifi cantly smaller factor mean
Factor 1123456789101112131415161718192021222324252627
Saudi Arabia (24)Algeria (21)Pakistan (27)Nigeria (12)Georgia (22)Indonesia (16)India (30)Iran (29)South Korea (10)Ghana (28)Bulgaria (26)Mexico (11)Hong Kong (7) Chile (25)Ukraine (23) Brazil (8)Cyprus (5)United States (14)Japan (17)Greece (1)France (19)Turkey (15)United Kingdom (3) Germany (2)Canada (13)Netherlands (4) Spain (20)
1.0851.0270.9500.9190.6640.6470.6350.000-0.095-0.731 -1.408-1.441-1.570-1.576-1.883-1.928-1.977-2.155-2.231-2.234-2.419-2.510-2.594-2.937 -2.996-3.662-3.932
29 10 28 26 11 7 25 23 8 5 14 17 1 19 15 3 2 13 4 2029 10 28 26 11 7 25 23 8 5 14 17 1 19 15 3 2 13 4 2029 10 28 26 11 7 25 23 8 5 14 17 1 19 15 3 2 13 4 2029 10 28 26 11 7 25 23 8 5 14 17 1 19 15 3 2 13 4 2029 10 28 26 11 7 25 23 8 5 14 17 1 19 15 3 2 13 4 2029 10 28 26 11 7 25 23 8 5 14 17 1 19 15 3 2 13 4 2029 10 28 26 11 7 25 23 8 5 14 17 1 19 15 3 2 13 4 2028 26 11 7 25 23 8 5 14 17 1 19 15 3 2 13 4 2028 26 11 7 25 23 8 5 14 17 1 19 15 3 2 13 4 2011 7 25 23 8 5 14 17 1 19 15 3 2 13 4 2014 17 1 19 15 3 2 13 4 208 5 14 17 1 19 15 3 2 13 4 2014 17 1 19 15 3 2 13 4 2014 17 1 19 15 3 2 13 4 203 2 13 4 2015 3 2 13 4 2015 3 2 13 4 202 13 4 202 13 4 202 13 4 204 2013 4 204 204 204
Factor 2123456789101112131415161718192021222324252627
Algeria (21)Nigeria (12)Ghana (28) Iran (29)Saudi Arabia (24)Indonesia (16) Georgia (22)Pakistan (27)Cyprus (5)India (30) Ukraine (23)Brazil (8)Canada (13) Chile (25)Bulgaria (26) Mexico (11) United States (14)Turkey (15)United Kingdom (3)Hong Kong (7)Greece (1)Spain (20)France (19)South Korea (10)Germany (2)Netherlands (4) Japan (17)
0.3260.0850.0470.000-0.055-0.062-0.389-0.458-0.480-0.493-0.748-0.781-0.867-0.924-0.931-0.947-1.050-1.253 -1.348-1.391-1.423-1.428-1.443-1.566-2.286-2.298-3.137
24 16 22 27 5 30 23 8 13 25 26 11 14 15 3 7 1 20 19 10 2 4 1722 27 5 30 23 8 13 25 26 11 14 15 3 7 1 20 19 10 2 4 1722 27 5 30 23 8 13 25 26 11 14 15 3 7 1 20 19 10 2 4 1722 27 5 30 23 8 13 25 26 11 14 15 3 7 1 20 19 10 2 4 1722 27 5 30 23 8 13 25 26 11 14 15 3 7 1 20 19 10 2 4 1722 27 5 30 23 8 13 25 26 11 14 15 3 7 1 20 19 10 2 4 178 13 25 26 11 14 15 3 7 1 20 19 10 2 4 178 13 25 26 11 14 15 3 7 1 20 19 10 2 4 1725 26 11 14 15 3 7 1 20 19 10 2 4 1713 25 26 11 14 15 3 7 1 20 19 10 2 4 1715 3 7 1 20 10 2 4 1715 3 7 1 20 19 10 2 4 173 7 1 20 10 2 4 171 10 2 4 171 10 2 4 171 10 2 4 1710 2 4 172 4 172 172 172 172 172 172 1717
a Parenthesized values represent country-assigned number within data

The maximum likelihood alignment approach to testing for approximate measurement invariance: A paradigmatic cross-cultural application
549
signifi cant difference between the latent means for Iran (29) and South Korea (10), as indicated by the absence of the latter in the list of countries having signifi cantly smaller means than Iran, it is interesting to observe that the same countries ranging from Ghana (28) to Spain (20) listed for the fi rst seven countries, replicate as well for Iran and South Korea. Beginning with Bulgaria (26), the pattern of countries having signifi cantly smaller factor means is more disjointed.
Factor 2: Family/Kin Relations
Although there are the same 21 countries for which their factor
means are signifi cantly lower than those for the fi rst six countries (Algeria, Nigeria, Ghana, Iran, Saudi Arabia, and Indonesia), Algeria, with the highest factor mean value, stands out from the rest in also showing the factor means for Saudi Arabia and Indonesia to have a lower mean value.
The country means of the two factors are strongly correlated, r (27) = .76, p < .001, which means that countries with more traditional family values have closer family and kin relationships. Further validity evidence was gathered from correlating the country means with relevant country-level social indicators. We found that level of affl uence was correlated -.63 with the fi rst factor (hierarchy) and -.65 with the second factor (family/kin relationships), N = 27, both ps < .001. Hofstede’s (2001) Power Distance (N = 22) showed positive and signifi cant correlations of .66 and .61 (p < .001), respectively. Hofstede’s Individualism (N = 22) was also signifi cantly (p < .05) correlated with values -.62 and -.47, respectively. Schwartz’s (2012) embeddedness factor (N = 12) showed a signifi cant correlation of -.62 with the fi rst factor and of .59 with Schwartz’s hierarchy factor (both ps < .05). The second factor was not signifi cantly related to the Schwartz factors. This patterning suggests cross-national differences in both factors that are related to modernity and westernization. Modernization tends to be associated with lower scores on hierarchy and family/kin relationships.
These results are in line with fi ndings based on raw scale scores, reported by van de Vijver et al. (2006). This similarity is not surprising. When we computed the correlations between the aligned country means reported in Table 5 and the scale scores (i.e., average item scores) used by van de Vijver et al. (2006), we found a value of .99 for the fi rst factor and a value of .98 for the second factor (both ps < .001).
Discussion Comparison of latent means across a large number of groups
is challenging and becomes increasingly so when such groups are cross-cultural in nature and represent different countries. A long-standing precondition for meaningful interpretation of these comparisons is that the assessment scale is operating equivalently across all groups. That is, testing of both the item factor loadings and item intercepts have shown them to be measurement-invariant across groups. Save for relying on tests based on partial measurement invariance (Byrne et al., 1989), failure to satisfy this precondition can preclude latent mean comparisons. For at least the past 38 years, researchers have used the traditional CFA approach to these tests for measurement invariance (Jöreskog, 1971) and comparison of latent means (Sörbom, 1974). However, although this methodological strategy works well when the number of groups is small (2 or 3), it has been found to be problematic when
the number of groups is large (Asparouhov & Muthén, 2014; Byrne & van de Vijver, 2010). Introduction of ESEM and the concept of “approximate measurement invariance” in 2009 (Asparouhov & Muthén) provided a new impetus to enabling tests for invariance across a large number of groups. Followed by the introduction of alignment optimization in 2014 (Asparouhov & Muthén), these two methodological strategies in concert have greatly expanded our procedures for testing measurement invariance and subsequent comparison of latent means across a large number of groups. In this article, we described and annotated the steps of this new procedure, with the aim of making the procedure more widely known and explaining its usefulness. We illustrated the approach in a test of the measurement invariance and latent mean differences related to the two-factor (Family Roles Hierarchy and Family Kin Relations) Family Values Scale across 27 countries. This data set was chosen as a previous study found that the traditional CFA approach revealed many problems, such as a poor fi t and diffi culties in identifying subsets of items or countries in which the exact invariance model would hold (Byrne & Van de Vijver, 2010).
The fi ndings of the approximate invariance approach used in the present study were very different. Our fi ndings of noninvariance for both the factor loadings (1.85%) and the intercepts (17.2%) were well within the rule-of-thumb recommended cut-point of 25% proposed by Muthén and Asparouhov (2014) thereby substantiating the trustworthiness of the alignment results. Had the results exceeded the 25% limit, then a Monte Carlo simulation study would have been needed to identify the sources of noninvariance in more detail (Muthén & Asparouhov, 2014). It is important to note that the alignment method revealed that only a very small number of factor loadings challenged the invariance. This fi nding is easier to interpret than the fi nding of a poor fi t of the measurement weights model of the conventional CFA model (with an almost impossible job of fi nding which items in which countries are most challenging to invariance).
Of important interest, substantively, results pertinent to the factor means are in line with earlier fi ndings, which indicate that family values are strongly related to modernity and the accompanying focus on egalitarianism (as opposed to hierarchy) and more individualism (as opposed to collectivism).
In closing out this article, we wish to express our enthusiastic welcome and support of the alignment method in testing for measurement invariance and latent mean differences when the number of groups is large. For researchers whose interests typically involve country comparisons, the automated nature of the alignment analytic process can’t help but be particularly benefi cial. Taken together, we consider the alignment method to have several appealing features. First, and foremost, as mentioned here, it enables tests for measurement invariance and latent mean differences in large scale data, a feat not possible with the CFA approach. Second, alignment allows for the estimation and comparison of latent means despite the measurements not being fully or partially invariant (Cieciuch et al., in press). Third, the alignment method automates and substantially simplifi es these comparative analyses. Fourth, given its capability to handle a large number of groups, alignment can enable tests for invariance in “sub-populations within countries and cohorts” (Munck et al., in press). Fifth, Munck et al. (in press) posit and illustrate how alignment “is capable of producing refi ned scales and unbiased statistical estimation of group means with signifi cance tests

Barbara M. Byrne and Fons J.R. van de Vijver
550
between pairs of group that adjust both for sampling errors and missing data.”
Our focus in this paper was to take a nontechnical approach in describing, explaining, and illustrating the alignment approach to tests for invariance and latent mean differences. Along the way, we cited key articles relevant to readers wishing more detailed and technical information. We based our paradigmatic application on an assessment scale having a two-factor structure. To the best of our knowledge, this multifactorial example represents the fi rst to date reported in the literature. We hope that our selected example
data and walk-through of the steps involved in the application of alignment will not only encourage other researchers to venture forth in their use of this new and relatively sophisticated methodology, but will also provide a springboard that makes their initial venture less arduous.
Acknowledgements
We wish to thank Prof. James Georgas for use of these data based on his Family Values Scale.
References
Asparouhov, T., & Muthén, B. (2009). Exploratory structural equation modeling. Structural Equation Modeling: A Multidisciplinary Journal, 16, 397-438. doi:10.1080/10705510903008204
Asparouhov, T., & Muthén, B. (2014). Multiple-group factor analysis alignment. Structural Equation Modeling: A Multidisciplinary Journal, 21, 495-508. doi:10.1080/10705511.2014.919210
Bentler, P. M. (2005). EQS 6 structural equations program manual. Encino, CA: Multivariate Software.
Bentler, P. M. (1990). Comparative fi t indexes in structural models. Psychological Bulletin, 107, 238-246. doi:10.1037/0033-2909.107.2.238
Boer, D., Hanke, K., & J. He (in press). What is error, what is culture and how can we know? On handling systematic error in cross-cultural research. Journal of Cross-Cultural Psychology.
Bowden, S. C., Saklofske, D. H., van de Vijver, F. J. R., Sudarshan, N. J., & Eysenck, S. B. G. (2016). Cross-cultural measurement invariance of the Eysenck Personality Questionnaire across 33 countries. Personality and Individual Differences, 103, 53-60. doi:10.1016/j.paid.2016.04.028
Byrne, B.M. (1988). The Self Description Questionnaire III; Testing for equivalent factorial validity across ability. Educational and Psychological Measurement, 48, 397-406.doi:10.1177/0013164488482012
Byrne, B. M. (1989). Multigroup comparisons and the assumption of equivalent construct validity across groups: Methodological and substantive issues. Multivariate Behavioral Research, 24, 503-523. doi:10.1207/s15327906mbr2404_7
Byrne, B.M. (1991). The Maslach Burnout Inventory: Validating factorial structure and invariance across intermediate, secondary, and university educators. Multivariate Behavioral Research, 26, 583-605. doi:10.1207/s15327906mbr2604_2
Byrne, B. M. (1998). Structural equation modeling with LISREL, PRELIS, and SIMPLIS: Basic concepts, applications, and programming. Mahwah, NJ: Erlbaum.
Byrne, B. M. (2001). Structural equation modeling with AMOS: Basic concepts, applications, and programming. Mahwah, NJ: Erlbaum.
Byrne, B. M. (2006). Structural equation modeling with EQS: Basic concepts, applications, and programming (2nd ed.). Mahwah, NJ: Erlbaum.
Byrne, B. M., & Campbell, T. L. (1999). Cross-cultural comparisons and the presumption of equivalent measurement and theoretical structure: A look beneath the surface. Journal of Cross-cultural Psychology, 30, 557-576. doi:10.1177/0022022199030005001
Byrne, B. M., & Shavelson, R. J. (1987). Adolescent self-concept: Testing the assumption of equivalent structure across gender. American Educational Research Journal, 24, 365-385. doi:10.3102/00028312024003365
Byrne, B. M., & Stewart, S. M. (2006). The MACS approach to testing for multigroup invariance of a second-order structure: A walk through the process. Structural Equation Modeling: A Multidisciplinary Journal, 13, 287-321. doi:10.1207/s15328007sem1302_7
Byrne, B. M., Shavelson, R. J., & Muthén, B. (1989). Testing for the equivalence of factor covariance and mean structures: The issue of partial measurement equivalence. Psychological Bulletin, 105, 456-466. doi:10.1037/0033-2909.105.3.456
Byrne, B. M., & van de Vijver, F. J. R. (2010). Testing for measurement and structural equivalence in large-scale cross-cultural studies: Addressing the issue of nonequivalence. International Journal of Testing, 10, 107-132. doi:10.1080/15305051003637306
Cieciuch, J., Davidov, E., & Schmidt, P. (in press). Alignment optimization: Estimation of the most trustworthy means in cross-cultural studies even in the presence of noninvariance. In E. Davidov, P. Schmidt, J. Billiet & B. Meuleman (Eds,), Cross-cultural analysis: Methods and applications. New York, NY: Routledge.
Costa Jr, P. T., & McCrae, R. R. (1995). Domains and facets: Hierarchical personality assessment using the Revised NEO Personality Inventory. Journal of Personality Assessment, 64, 21-50. doi:10.1207/s15327752jpa6401_2
Crane, P. K., Belle, G. V., & Larson, E. B. (2004). Test bias in a cognitive test: Differential item functioning in the CASI. Statistics in Medicine, 23, 241-256. doi:10.1002/sim.1713
Davidov, E. (2008). A cross-country and cross-time comparison of human values measurements with the second round of the European Social Survey. Survey Research Methods, 2, 33-46.
Davidov, E., Cieciuch, J., Mueleman, B., Schmidt, P., Algesheimer, R., & Hausherr, M. (2015). The comparability of measurements of attitudes towards immigration in the European Social Survey: Exact versus approximate measurement equivalence. Public Opinion Quarterly, 19, 244-266. doi:10.1093/poq/nfv008
Davidov, E., Meuleman, B., Cieciuch, J., Schmidt, P., & Billiet, J. (2014). Measurement equivalence in cross-national research. Annual Review of Sociology, 40, 55-75. doi:10.1146/annurev-soc-071913-043137
De Bondt, N., & Van Petegem, P. (2015). Psychometric evaluation of the Overexcitability Questionnaire-Two applying Bayesian Structural Equation Modeling (BSEM) and multiple-group BSEM-based alignment with approximate measurement invariance. Frontiers in Psychology, 6. doi:10.3389/fpsyg.2015.01963
Drasgow, F., & Kanfer, R. (1985). Equivalence of psychological measurement in heterogeneous populations. Journal of Applied Psychology, 70, 662-680. doi:10.1037/0021-010.70.4.662
Georgas, J. (1999). Family as a context variable in cross-cultural psychology. In J. Adamopoulos & Y. Kashima (Eds.), Social psychology and cultural context (pp. 163-175). Beverly Hills, CA: Sage. doi:10.4135/9781452220550.n12
Georgas, J., Berry, J. W., van de Vijver, F. J. R., Kagitcibasi, C., & Poortinga, Y. H. (2006). Families across cultures: A 30-nation psychological study. Cambridge, United Kingdom: Cambridge University Press.
Hofstede, G. (2001). Culture’s consequences: Comparing values, behaviors, institutions, and organizations across nations. Thousand Oaks, CA: Sage.
Horn, J. L., & McArdle, J. J. (1992). A practical and theoretical guide to measurement invariance in aging research. Experimental Aging Research, 18, 117-144. doi:10.1080/03610739208253916
Ion, A., Iliescu, D., Aldhafri, S., Rana, N., Ratanadilok, K., Widyanti, A., & Nedelcea, C. (2017). A cross-cultural analysis of personality structure through the lens of the HEXACO model. Journal of Personality Assessment, 99, 25-34. doi:10.1080/00223891.2016.1187155

The maximum likelihood alignment approach to testing for approximate measurement invariance: A paradigmatic cross-cultural application
551
Ispas, D., Iliescu, D., Ilie, A., & Johnson, R.E. (2014). Exploring the cross-cultural generalizability of the Five-Factor Model of Personality: The Romanian NEO PI-R. Journal of Cross-Cultural Psychology, 45, 1074-1088. doi:10.1177/0022022114534769
Jöreskog, K. G. (1971). Simultaneous factor analysis in several populations. Psychometrika, 36, 409-426. doi:10.1007/BF02291366
Little, T. D. (1997). Mean and covariance structures (MACS) analyses of cross-cultural data: Practical and theoretical issues. Multivariate Behavioral Research, 32, 53-76. doi:10.1207/s15327906mbr3201_3
Marsh, H. W., Abduljabbar, A. S., Parker, P. D., Morin, A. J. S., Abdelfattah, F., & Nagengast, B. (2014). The big fi sh-little-pond effect in mathematics: A cross-cultural comparison of U.S. and Saudi Arabian TIMSS responses. Journal of Cross-Cultural Psychology, 45, 777-804. doi:10.1177/0022022113519858
Marsh, H. W., & Hocevar, D. (1985). Application of confi rmatory factor analysis to the study of self-concept: First and higher-order factor models and their invariance across groups. Psychological Bulletin, 97, 562-582. doi:10.1037/0033-2909.97.3.562
Marsh, H. W., Lüdtke, O., Muthén, B., Asparouhov, T., Morin, A. J. S., Trautwein, U., & Nagengast, B. (2010). A new look at the Big Five factor structure through exploratory structural equation modeling. Psychological Assessment, 22, 471-491. doi:10.1037/a0019227
Meiring, D., Van de Vijver, F. J. R., Rothmann, S., & Barrick, M. R. (2005). Construct, item, and method bias of cognitive and personality tests in South Africa. South African Journal of Industrial Psychology, 31, 1-8. doi:10.4102/sajip.v31i1.182
Munet-Vilaró, F., Gregorich, S. E., & Folkman, S. (2002). Factor structure of the Spanish version of the ways of coping questionnaire. Journal of Applied Social Psychology, 32, 1938-1954. doi:10.1111/j.1559-1816.2002.tb00265.x
Munck, I., Barber, C., & Torney-Purta, J. (in press). Measurement invariance in comparing attitudes towards immigrants among youth across Europe in 1999 and 2009: The alignment method applied to IEA, CIVED, and ICCS. Survey Methods Research.
Muthén, B., & Asparouhov, T. (2012). Bayesian structural equation modeling: A more fl exible representation of substantive theory. Psychological Methods, 17, 313-335. doi:10.1037/a0026802
Muthén, B., & Asparouhov, T. (2014). IRT studies of many groups: The alignment method. Frontiers in Psychology, 5. doi:10.3389/fpsyg.2014.00978
Muthén, L.K., & Muthén, B.O. (1998-2012). Mplus User’s Guide. Seventh Edition. Los Angeles, CA: Muthén & Muthén.
Ozakinci, G., Boratav, H. B., & Mora, P. A. (2011). Modern health worries, health care utilization, and symptom reporting: A cross-cultural comparison. Behavioral Medicine, 37, 35-41. doi:10.1080/08964289.2011.552925
Robert C., Lee, W. C., & Chan, K. Y. (2006). An empirical analysis of measurement equivalence with the INDCOL measure of
individualism and collectivism: Implications for valid cross-cultural inference. Personnel Psychology, 59, 65-99. doi:10.1111/j.1744-6570.2006.00804.x
Rutkowski, L., & Svetina, D (2014). Assessing the hypothesis of measurement invariance in the context of large-scale surveys. Educational and Psychological Measurement, 74, 31-57. doi:10.1177/0013164413498257
Schmitt, N., & Kuljanin, G. (2008). Measurement invariance: Review of practice and implications. Human Resources Management Review, 18, 210-222. doi:10.1016/j.hrmr.2008.03.003
Sörbom, D. (1974). A general method for studying differences in factor means and factor structures between groups. British Journal of Mathematical and Statistical Psychology, 27, 229-239. doi:10.1111/j.2044-8317.1974.tb00543.x
Steiger, J. H. (1990). Structural model evaluation and modifi cation: An interval estimation approach. Multivariate Behavioral Research, 25, 173-180. doi:10.1207/s15327906mbr2502_4
Schwartz, S. H. (2012). An overview of the Schwartz theory of basic values. Online Readings in Psychology and Culture, 2, 11. doi:10.9707/2307-0919.1116
Thalmayer, A. G., & Saucier, G. (2014). The Questionnaire Big Six in 26 nations: Developing cross-culturally applicable Big Six, Big Five, and Big Two inventories. European Journal of Personality, 28, 482-496.doi:10.1002/per.1962
van de Schoot, R., Kluytmans, A., Tummers, L., Lugtig, P., Hox, J., & Muthén, B. (2013). Facing off with Scylla and Charybdis: A comparison of scalar, partial, and the novel possibility of approximate measurement invariance. Frontiers in Psychology, 4. doi:10.3389/fpsyg.2013.00770
van de Vijver, F. J. R., Mylonas, K., Pavlopoulos, V., & Georgas, J. (2006). Results: Cross-cultural analyses of the family. In J. Georgas, J. W. Berry, F. J. R. van de Vijver, C. Kagitcibasi & Y. H. Poortinga (Eds.), Families across culture: A 30-nation psychological study (pp. 126-185). Cambridge, United Kingdom: Cambridge University Press. doi:10.1017/CBO9780511489822.008
Vandenberg, R. J., & Lance, C. E. (2000). A review and synthesis of the measurement invariance literature: Suggestions, practices, and recommendations for organizational research. Organizational Research Methods, 3, 4-70. doi:10.1177/109442810031002
Woehr, D. J., Arciniega, L. M., & Lim, D. H. (2007). Examining work ethic across populations: A comparison of the Multidimensional Work Ethic Profi le across three diverse cultures. Educational and PsychologicalMeasurement, 67, 154-168. doi:10.1177/0013164406292036
Zercher, F., Schmidt, P., Cieciuch, J., & Davidov, E. (2015). The comparability of the universalism value over time and across countries in the European Social Survey: Exact vs. approximate measurement invariance. Frontiers of Psychology, 6. doi:10.3389/psyg.2015.00733