Groundwater pollution and subsurface sediment contamination in closed MSW landfill, Henchir El...
14
Solid Waste Landfill and Soil/Sediment Contamination: Case Studies in Tunisia, p.30-43. © 2002, INRST-JICA 30 Groundwater pollution and subsurface sediment contamination in closed MSW landfill, Henchir El Yahoudia Mitsuo Yoshida*, Abdul Nasser Ibrahim* Jamila Tarhouni** and Ahmed Ghrabi* * Laboratoire Eau & Environnement, Institut National de Recherche Scientifique et Technique (INRST) ** Institut National Agronomique de Tunisie (INAT) Abstract Drilling survey of subsurface geology and groundwater sampling were made at a lakeside of the municipal solid waste (MSW) landfill, Henchir El Yahoudia that is closed in 1999. According to the result of perimeter drilling survey, three aquifers could be recognized below the landfill; 2.0-3.2m, 4.0-6.0m, and 8.5-12.0m in depth. These aquifers were isolated each other using open standpipe piezometer sealed by bentonite for systematic groundwater monitoring. Trace element composition of groundwater respectively showed that Cu, Zn, Pb, and Se are above the quality standard. Potentially toxic element (PTEs) composition of subsurface sediments collected by the drilling survey was also examined. The concentration of non-metal (B, As, Se) and metal (Ti, V, Cr, Co, Ni, Cu, Zn, Mo, Ag, Cd, Sb, Ba, La, Hg, Tl, and Pb) pollutants is extremely high in the uppermost landfill cover layers and the Aquifer-1 sediments, which is probably derived from the landfill. Keywords Groundwater pollution, Sediment contamination, Aquifer, Landfill leachate, PTEs I. Introduction Groundwater monitoring programme is indispensable after a closure of solid waste landfill to determine the degree to which the landfill capping and closure system is functioning in accord with the design objectives. Main concern is with the excursion/migration of contaminants off the landfill site as leachate or as landfill gas or both. It is essential that the monitoring programme identify the extent to which any excursions/migrations are occurring. The monitoring activities normally include a groundwater monitoring well for detection of off-site migration of contaminants; perimeter monitoring well system, lysimeters under the liner structure, perimeter storm-water ditching system, etc. (McBean et al., 1995). In this paper we report a preliminary result of monitoring data obtained from perimeter groundwater monitoring wells installed at the Sebkhat Sejoumi lakeside of Henchir El Yahoudia landfill, and discuss about the contamination and pollution of groundwater of the area. II. Borehole HY1 and Monitoring Wells The local geology of the area is composed of two geologic systems, Neogene- Paleogene sedimentary rocks and Quaternary lake sediments. The former is a hydrogeologic basement and the later is basin-filling terrestrial deposits consisting of relatively permeable media within the Sejoumi-Manouba hydrogeologic basin. The Sebkhat Sejoumi, an isolated salt lake, is located in the center of the Sejoumi-Manouba hydrogeologic basin, which is accumulating a pile of lake sediments. The sediments consist of unconsolidated to semiconsolidated gravels, sand, silt, clay, marl, and evaporite which are potentially aquifers. The lake water is available in winter (rainy) season but almost completely evaporated in summer (dry) season.
-
Upload
independent -
Category
Documents
-
view
3 -
download
0
Transcript of Groundwater pollution and subsurface sediment contamination in closed MSW landfill, Henchir El...

Solid Waste Landfill and Soil/Sediment Contamination: Case Studies in Tunisia, p.30-43. © 2002, INRST-JICA
30
Groundwater pollution and subsurface sediment contamination in closed MSW landfill, Henchir El Yahoudia Mitsuo Yoshida*, Abdul Nasser Ibrahim* Jamila Tarhouni** and Ahmed Ghrabi* * Laboratoire Eau & Environnement, Institut National de Recherche Scientifique et Technique (INRST) ** Institut National Agronomique de Tunisie (INAT) Abstract Drilling survey of subsurface geology and groundwater sampling were made at a lakeside of the municipal solid waste (MSW) landfill, Henchir El Yahoudia that is closed in 1999. According to the result of perimeter drilling survey, three aquifers could be recognized below the landfill; 2.0-3.2m, 4.0-6.0m, and 8.5-12.0m in depth. These aquifers were isolated each other using open standpipe piezometer sealed by bentonite for systematic groundwater monitoring. Trace element composition of groundwater respectively showed that Cu, Zn, Pb, and Se are above the quality standard. Potentially toxic element (PTEs) composition of subsurface sediments collected by the drilling survey was also examined. The concentration of non-metal (B, As, Se) and metal (Ti, V, Cr, Co, Ni, Cu, Zn, Mo, Ag, Cd, Sb, Ba, La, Hg, Tl, and Pb) pollutants is extremely high in the uppermost landfill cover layers and the Aquifer-1 sediments, which is probably derived from the landfill. Keywords Groundwater pollution, Sediment contamination, Aquifer, Landfill leachate, PTEs I. Introduction Groundwater monitoring programme is indispensable after a closure of solid waste landfill to determine the degree to which the landfill capping and closure system is functioning in accord with the design objectives. Main concern is with the excursion/migration of contaminants off the landfill site as leachate or as landfill gas or both. It is essential that the monitoring programme identify the extent to which any excursions/migrations are occurring. The monitoring activities normally include a groundwater monitoring well for detection of off-site migration of contaminants; perimeter monitoring well system, lysimeters under the liner structure, perimeter storm-water ditching system, etc. (McBean et al., 1995). In this paper we report a preliminary result of monitoring data obtained from perimeter groundwater monitoring wells installed at the Sebkhat Sejoumi lakeside of Henchir El Yahoudia landfill, and discuss about the contamination and pollution of groundwater of the area. II. Borehole HY1 and Monitoring Wells The local geology of the area is composed of two geologic systems, Neogene-Paleogene sedimentary rocks and Quaternary lake sediments. The former is a hydrogeologic basement and the later is basin-filling terrestrial deposits consisting of relatively permeable media within the Sejoumi-Manouba hydrogeologic basin. The Sebkhat Sejoumi, an isolated salt lake, is located in the center of the Sejoumi-Manouba hydrogeologic basin, which is accumulating a pile of lake sediments. The sediments consist of unconsolidated to semiconsolidated gravels, sand, silt, clay, marl, and evaporite which are potentially aquifers. The lake water is available in winter (rainy) season but almost completely evaporated in summer (dry) season.

Groundwater and sediment pollution
31
The Henchir El Yahoudia landfill was constructed along the lakeside of Sebkhat Sejoumi for disposing various kind of solid wastes, mostly municipal solid wastes (MSW), generated from the greater Tunis region, which was operated from 1960s to 1999. The landfilling activitiy was terminated in 1999 and landfill capping and closure operations have been made since 1999. Four drilling holes were penetrated around the landfill by ANPE in 2000, and we installed three observation wells, HY1-P1, P2, and P3, for monitoring groundwater from three aquifers in 2002 (Figure 1 and Plate 1).
Figure 1: Locality map of the site HY1.
Plate 1: Field photograph of the observation wells HY1-P1, P2, P3, and HY1 test hole (left) and an operation of
graoundwater sampling by hand pumping tool (right). The subsurface geology of the site HY1 is shown as a geologic columnar section of HY1 test hole in Figure 2. The sampling horizons also illustrated in the figure. According to the lithostratigraphic observation of the HY1 test hole cores, we could recognized three aquifers, Aquifer-1, -2, and –3 from top downward, in the unconsolidated/semiconsolidated Quaternary sediments:
Aquifer-1: -2.00m to –3.20m in depth Aquifer-2: -4.00m to –6.00m in depth Aquifer-3: -8.50m to –12.00m in depth
The deposits from surface to –1.50m in depth is recent artificial covers after the closure of the landfill. The basal part of this covering deposits, we could find leachate spill and its contamination zone. Below the deposits, lake sediments of natural geologic unit is exposed (Figure 2). The Aquifer-1 yields strong smell of H2S. Each aquifer is isolated by a screen interval of siliceous granule sand layer limited by top and bottom bentonite seals. The well hole is cased by a PVC pipe.
Lake Sejoumi
300m
HY1 site
Henchir El YahoudiaLandfill
Park N
P1 well P2 well
P3 well HY1 Test hole
Sebkhat Sejoumi
Landfill
Pumping tool

Part I. Solid Waste Landfill
32
Lithostratigraphy of the HY1 bore hole, Henchir El Yahoudia
Figure 2: Geologic columnar section of the HY1 test hole in Henchir El Yahoudia (described by Ibrahim and Yoshida in Ibrahim(2002)).
0m
5m
10
15
landfill cover
brown mixing of sandy material and waste
dark brown to black sandy to silty, leachate contaminated material
white silt material (evaporite) Dense grey clay plotted with black colored matterLight grey clayey material mixed with coarse sand
Dark grey clay plotted with black colored matter, smelly downward
clayey sand (aquifer)
Grey to dark grey silty clay
Light grey clayey to silty sand of variable grain size
Light grey clay dotted with beige noddles of very fine crystals
Light grey sandy clay dotted with black silty material noddles Grey sandy clay containing 2mm sand grain light to dark grey clay plotted with white fine sand noddles greenish brown silty to sandy clay
light brown silty clay dotted with white small sand agregates light brown silty to sandy and gypsy clay
brownish grey silty to sandy clay containing gypsum geods
brownish grey silty and gypsy clay light brown sandy and gypsy clay beige to light brown sand that is medium to fine in size light brown sandy clay containing gypsum
light brownish fine sand, downward clayey
white calcareous material containing calcareous concretions grey granule silty sand
alternance of marl and clay
lenticular granule-coarse sand
beige to yellow dense and highly fractured marl
brownish grey granule -coarse sandy clay
yellowish light grey clayey marl, highly fractured downward (contains lenticular granule-coarse sand between 13 and 13,15m) yellowish grey sandy marl yellowish brown marl, more indurated bottomward beige silty clay
beige clayey marl
beige clayey massive marl
Upper unit
Lower unit
Legend:
cover
waste + sand
silty
(evaporite)
sand
clay
sandy clay
coarse sandy clay
calcareous
marl
sampling locations
Neogene-Paleogene (?)
Quaternary (?) Lake sediments

Groundwater and sediment pollution
33
Figure 3: Structure of the groundwater monitoring wells, HY1-P1, P2, and P3 (designed by Yoshida and
Ibrahim in Ibrahim(2002)). III. Samples The groundwater samples analyzed were collected from three wells, HY1-P1, P2, and P3, at 10th May 2002, two days after the rain fall. Groundwater samples are collected using hand pumping method directly from the well (Plate 1). In order to obtain fresh groundwater sample representing each aquifer, the sampling was made after the complete discharge of groundwater filled in each hole. A total of 33 sediment samples were also collected from the borehole cores of HY1 for examining sediment contamination. Recent lake sediments surrounding the HY1 site, which is contaminated by landfill leachate, also collected from ground surface. The list of samples collected is shown in Table 1.
100
170
50
20 20
50
P1
10
10
2030
50
250
200
50
50
P2
100
600
15
35
180
3020
20
P3
4,5
0 m
5
10
15 m
Legend:
silty (evaporite)
dale
concrete morter
groundwater
land soil filling
bentonite
gravellous sand
clay mud
waste
landfill cover
sandy l
coarse sandy clay
sand
marl
clay
Aquifer 1
Aquifer 2
Aquifer 3
10
Confined beds (Hydrogeological basement)
Aguifer-3
Aguifer-2
Aguifer-1

Part I. Solid Waste Landfill
34
Table 1: List of samples for analysis Sample ID Type Description HY1-P1 water Groundwater samples collected from HY1-P1 well (Aquifer-1) HY1-P2 water Groundwater samples collected from HY1-P2 well (Aquifer-2) HY1-P3 water Groundwater samples collected from HY1-P3 well (Aquifer-3) HY1 cores sediment Borehole core samples: HY1-0.85, HY1-1.20, HY1-1.68, HY1-2.15
HY1-2.80, HY1-3.15, HY1-3.72, HY1-4.20, HY1-4.62, HY1-4.90 HY1-5.45, HY1-5.70, HY1-6.15, HY1-6.60, HY1-7.00, HY1-7.60 HY1-8.00, HY1-8.10, HY1-8.40, HY1-8.70, HY1-9.40, HY1-9.90 HY1-10.00, HY1-10.53, HY1-11.00, HY1-11.75, HY1-12.25, HY1-12.80, HY1-13.00, HY1-13.73, HY1-14.00, HY1-14.90, HY1-15.90 (Each number is the depth (m) ); Total 33 samples
IV. Analytical Methods IV-1. Water Analysis The groundwater samples were at first treated by H2O2 30% solution to consume all organic matters contained. Then the treated samples was prepared for pH<2.0 using HNO3. Analysis was made by an Inductively Coupled Plasma Mass Spectrometry (ICP-MS). Total 74 elements were measured: Li, Be, B, Na, Mg, Al, Si, P, S, Cl, K, Ca, Sc, Ti, V, Cr, Mn, Fe, Co, Ni, Cu, Zn, Ga, Ge, As, Se, Br, Rb, Sr, Y, Zr, Nb, Mo, Ru, Rh, Pd, Ag, Cd, In, Sn, Sb, Te, I, Cs, Ba, La, Ce, Pr, Nd, Sm, Eu, Gd, Tb, Dy, Ho, Er, Tm, Yb, Lu, Hf, Ta, W, Re, Os, Ir, Pt, Au, Hg, Tl, Pb, Bi, Th, and U. IV-2. Sediment Analysis
A 15.0 gm sample split was digested in 90 mL aqua regia (HCl-HNO3-H2O) at 95°C for one hour. The solution is diluted to 300 mL with distilled water. Analysis was made by an Inductively Coupled Plasma-Atomic Emission Spectrometry (ICP-AES) and Mass Spectrometry (ICP-MS). Total 37 elements were measured: B, Na, Mg, Al, P, S, K, Ca, Sc, Ti, V, Cr, Mn, Fe, Co, Ni, Cu, Zn, Ga, As, Se, Sr, Mo, Ag, Cd, Sb, Te, Ba, La, W, Au, Hg, Tl, Pb, Bi, Th, and U. The upper detection limit for Ag, Au, Hg, W, Se, Te, Tl, and Ga is 100 ppm, that for Mo, Co, Cd, Sb, Bi, Th, U, and B is 2 %, and that for Cu, Pb, Zn, Ni, Mn, As, V, La, and Cr is 10 %. The aqua regia digestion of sediment extracts only a fraction of the major elements (pseudo-total analysis) because silicates are not completely dissolved with this method. Owing to this limitation, results are total to near total for trace and base metals and possibly partial for rock-forming elements such as Na, Mg, Al, K, Ca, Mn, and Fe. However, environmentally concerned components like heavy metals or potentially toxic elements (PTEs; Alloways, 1995) not bound to silicates are efficiently dissolved (Ure, 1995), which is indicative for the assessment of toxicity. V. Results and Discussion V-1. Groundwater Contamination The result of groundwater samples collected from three aquifers is shown in Table 2. It indicates that the Aquifer-1 and Aquifer-3 show similar chemical compositions with abundant Na, Mg, K, Ca, Mn, and Cl, while the composition of the Aquifer-2 is relatively poor in most elements except Cd, Ba and Lanthanids. The groundwater collected from the Auifer-1 and Aquifer-3 contains approximately 3% of salt (NaCl) showing a linkage with salt lake water. Potentially toxic elements (PTEs) such as V, Cr, Co, Cu, Zn, As, and Pb are relatively enriched. The concentration of bromine (Br) in Aquifer-1 and 3 is also abnormally high.

Groundwater and sediment pollution
35
Table 2: Results of groundwater analysis
Table 3: Water quality criteria for dissolved PTEs (US EPA, 1999) and wastewater regulation values in Tunisia (N.T.106.002(1989)). Unit micro gram per liter (ug/l)
Freshwater Saltwater HHFC** N.T106.002 Tunisia
CMC* (ug/l)
CCC* (ug/l) CMC (ug/l)
CCC (ug/l)
Water + Organism (ug/l)
Organism only (ug/l)
Wastewater regulation***(ug/l)
Sb 14 4300 100 As 340 150 69 36 0.018 0.14 50 Be 10 Cd 4.3 2.2 42 9.3 5 Cr(III) 570 74 500 Cr(VI) 16 11 1100 50 10 Cu 13 9.0 4.8 3.1 1300 500 Pb 65 2.5 210 8.1 100 Hg 1.4 0.77 1.8 0.94 0.050 0.051 1 Ni 470 52 74 8.2 610 4600 200 Se 5.0 290 71 170 11000 50 Ag 3.4 1.9 50 Tl 1.7 6.3 Zn 120 120 90 81 9100 69000 5000 Al 750 87 5000 Ba 1000 500
* Criteria Maximum Concentration (CMC) is an estimate of the highest concentration of a material in surface water to which an aquatic community can be exposed briefly without resulting in an unacceptable effect. Criterion Continuous Concentration (CCC) is an estimate of the highest concentration of a material in surface water to which an aquatic community can be exposed indefinitely without resulting in an unacceptable effect. The CMC and CCC are just two of the six parts of a aquatic life criterion; the other four parts are the acute averaging period, chronic averaging period, acute frequency of allowed exceedence, and chronic frequency of allowed exceedence (US EPA, 1999) ** Human Health For Consumption (HHFC) of Water+Organism or of Organism Only *** Norme Tunisienne N.T106.002 (1989) 2. Specifications relatives aux rejets dans le domain public maritime, le domaine public hydraulique et les canalisations publiques, Domaine public hydraulique
Atomic # 3 4 5 11 12 13 14 15 16 17 19 20 21 22 23 24 25 26ELEMENT Li Be B Na Mg Al Si P S Cl K Ca Sc Ti V Cr Mn Feunit ppb ppb ppb ppb ppb ppb ppb ppb ppm ppm ppb ppb ppb ppb ppb ppb ppb ppbYH1-P1 776 < .05 2204 27238880 1683652 302 44318 <20 2284 38322 265488 1474426 83.48 26 42 57 1301.3 26YH1-P2 304 < .05 728 2575584 213490 556 5278 58 632 3418 33284 700526 3.52 < 10 6 8 156.9 44YH1-P3 1218 < .05 14234 36768900 2089424 224 14332 <20 3992 50044 190616 2037568 6.4 < 10 68 20 1164.1 76Detection Limit 1 0.05 20 50 50 1 1 20 1 1 50 50 0.05 10 1 0.5 0.05 10
Atomic # 27 28 29 30 31 32 33 34 35 37 38 39 40 41 42 44 45 46ELEMENT Co Ni Cu Zn Ga Ge As Se Br Rb Sr Y Zr Nb Mo Ru Rh Pdunit ppb ppb ppb ppb ppb ppb ppb ppb ppb ppb ppb ppb ppb ppb ppb ppb ppb ppbYH1-P1 17.3 < .2 263.2 302.8 < .05 < .05 104 209.8 98522 91.98 22922.3 < .01 < .5 0.24 75.8 < .05 0.16 < .2YH1-P2 1.76 < .2 42.4 48.4 < .05 < .05 12 < .5 8328 9.64 12925.9 0.5 < .5 0.06 10.4 < .05 < .01 < .2YH1-P3 12.22 < .2 331.4 232.4 < .05 < .05 140 < .5 127822 20.6 25604.4 < .01 < .5 0.16 29.8 < .05 < .01 < .2Detection Limit 0.02 0.2 0.1 0.5 0.05 0.05 1 0.5 5 0.01 0.01 0.01 0.5 0.01 0.1 0.05 0.01 0.2
Atomic # 47 48 49 50 51 52 53 55 56 57 58 59 60 62 63 64 65 66ELEMENT Ag Cd In Sn Sb Te I Cs Ba La Ce Pr Nd Sm Eu Gd Tb Dyunit ppb ppb ppb ppb ppb ppb ppb ppb ppb ppb ppb ppb ppb ppb ppb ppb ppb ppbYH1-P1 2.18 < .05 0.04 < .05 1.6 1.84 3690 2.8 335.1 < .01 < .01 < .01 < .01 < .05 < .01 < .01 < .01 < .01YH1-P2 0.3 1.3 < .01 < .05 0.94 0.18 344 0.12 329.92 0.52 1.5 0.06 1.08 0.12 < .01 0.06 < .01 < .01YH1-P3 1.72 < .05 0.02 < .05 < .05 1.1 3856 0.28 295.5 < .01 < .01 < .01 < .01 < .05 < .01 < .01 < .01 < .01Detection Limit 0.05 0.05 0.01 0.05 0.05 0.05 1 0.01 0.05 0.01 0.01 0.01 0.01 0.05 0.01 0.01 0.01 0.01
Atomic # 67 68 69 70 71 72 73 74 75 76 77 78 79 80 81 82 83 90 92ELEMENT Ho Er Tm Yb Lu Hf Ta W Re Os Ir Pt Au Hg Tl Pb Bi Th Uunit ppb ppb ppb ppb ppb ppb ppb ppb ppb ppb ppb ppb ppb ppb ppb ppb ppb ppb ppbYH1-P1 < .01 < .01 < .01 < .01 < .01 0.06 < .05 17.6 0.24 < .05 < .05 < .01 3.68 < .1 < .01 230.4 < .05 0.2 5.02YH1-P2 < .01 < .01 < .01 < .01 < .01 < .02 < .05 4.2 0.08 < .05 < .05 < .01 < .05 < .1 0.08 251 < .05 0.26 4.94YH1-P3 < .01 < .01 < .01 < .01 < .01 < .02 < .05 0.8 0.14 < .05 0.12 < .01 < .05 < .1 < .01 511.4 < .05 < .05 10.36Detection Limit 0.01 0.01 0.01 0.01 0.01 0.02 0.05 0.1 0.01 0.05 0.05 0.01 0.05 0.1 0.01 0.1 0.05 0.05 0.05

Part I. Solid Waste Landfill
36
The groundwater quality is examined using the water quality criteria (US EPA, 1999) and wastewater regulation standards in Tunisia (N.T106.002) as summarized in Table 3. In general CCC (Criterion Continuous Concentration) is more severe than CMC (Criteria Maximum Concentration), and the wastewater regulation values are larger than these CCC and CMC. The concentration of each PTE is comparatively illustrated in Figure 4.
The concentration of Al, Cu, Zn, Se, and Pb in the groundwater samples is above the CCC, and that of Cu, Zn, Se, and Pb is above the CMC. The concentration of Se and Pb is much higher than CCC and CMC, which is above the wastewater regulation (Figure 4). The high concentrations of Cu, Zn, Se, and Pb are possibly due to a pollution caused by the MSW landfill. According to the results of leachate analysis (Yoshida et al., 2002 in this volume), the metalloid Se is the common pollutant between landfill leachate and groundwater, while other elements, Cu, Zn, and Pb (heavy metals), do not exhibit a clear correlation.
Figure 4: Comparison between observed data and groundwater quality standards (see Table 4). The concentrations of Cu, Zn, Se, and Pb are above the standards.
V-2. Subsurface Sediment Contamination The results of aqua regia extraction (pseudo-total composition) of subsurface sediments sampled from the HY1 hole are summarized in Table 4. The variation of concentrations of non-metal pollutants, B, As, and Se is illustrated in Figure 5, that of other metal pollutants in Figure 6 (Ti, V, Cr, Co, Ni, Cu, and Zn), Figure 7 (Mo, Ag, Cd, and Sb), and Figure 8 (Ba, La, Hg, Tl, and Pb). In general, recent landfill cover materials (HY1-0.85 and -1.20) exhibit extremely high concentration of these non-metal and metal pollutants, which is probably caused by a direct mixing of solid waste during the operation of landfill capping and reclamation. However the surface lake sediment (sand) immediately below the recent cover materials, that is observed as a densely contaminated black-colored zone by landfill leachate spill, shows relatively moderate to low concentrations of the non-metal and metal pollutants.
0.01
0.1
1
10
100
1000
10000
Al Cr Ni Cu Zn As Se Ag Cd Sb Ba Hg Tl Pb
PTEs
Con
cent
ratio
n (u
g/l)
CCCCMCYH1-P1YH1-P2YH1-P3

Groundwater and sediment pollution
37
Table 4: Results of aqua regia extracted pseudo-total composition of elements in the sediment samples collected from the HY1 borehole cores
ELEMENT B Na Mg Al P S K Ca Sc Ti V Cr Mn Fe Co Ni Cu Znunit ppm % % % % % % % ppm % ppm ppm ppm % ppm ppm ppm ppmDetection Limit 1 0.001 0.01 0.01 0.001 0.01 0.01 0.01 0.1 0.001 2 0.5 1 0.01 0.1 0.1 0.01 0.1HY1-0.85 37 0.345 0.40 2.74 0.567 0.28 0.80 9.97 2.0 0.018 35 193.5 413 7.18 12.5 77.0 913.55 2282.0HY1-1.20 36 0.484 0.42 1.34 0.326 0.30 0.66 9.05 1.4 0.015 29 175.6 504 7.32 162.3 188.9 1067.99 1312.0HY1-1.68 26 1.539 0.10 0.43 0.016 0.90 0.18 23.55 1.3 0.011 8 8.3 46 0.16 1.1 2.5 13.23 37.0HY1-2.15 30 0.341 0.55 1.31 0.317 0.42 0.54 12.61 1.8 0.007 25 155.0 391 5.28 37.3 68.2 825.86 932.5HY1-2.80 26 1.468 1.10 2.14 0.070 0.37 0.53 10.42 4.1 < .001 50 48.6 278 2.56 10.4 25.6 25.73 90.3HY1-3.15 38 0.335 0.71 1.35 0.306 0.78 0.48 11.98 1.9 0.01 28 143.3 470 6.10 25.2 60.8 693.66 942.1HY1-3.72 34 1.127 1.22 1.02 0.035 0.21 0.34 7.96 1.8 0.001 25 20.4 192 1.11 5.0 10.8 7.62 31.6HY1-4.20 18 0.664 0.58 0.78 0.057 0.30 0.24 10.84 1.5 0.005 23 29.2 190 1.59 4.8 11.3 55.97 92.6HY1-4.62 23 1.938 0.51 0.92 0.026 1.18 0.33 9.57 1.9 0.003 27 20.4 154 1.05 11.4 15.3 8.52 39.6HY1-4.90 15 0.881 0.42 0.56 0.031 0.20 0.22 7.15 1.6 0.002 15 13.7 156 0.83 2.8 6.4 3.17 26.4HY1-5.45 15 0.931 0.50 0.67 0.028 0.24 0.20 7.67 1.6 0.001 19 14.1 198 1.06 3.1 7.3 2.75 28.1HY1-5.70 17 1.007 0.52 0.64 0.020 1.69 0.21 8.45 1.5 < .001 16 13.3 185 0.80 2.6 6.3 6.45 23.3HY1-6.15 15 0.544 0.49 0.47 0.015 5.79 0.16 12.33 1.0 < .001 12 8.9 133 0.53 1.9 3.4 13.24 13.5HY1-6.60 32 1.459 0.59 1.30 0.029 3.43 0.48 10.74 2.5 < .001 30 24.2 139 1.69 5.2 13.3 7.77 38.0HY1-7.00 24 0.896 1.03 0.98 0.024 3.36 0.32 9.70 1.9 < .001 23 18.4 184 1.22 4.4 9.7 11.23 70.8HY1-7.60 22 0.852 1.31 0.94 0.015 5.69 0.28 9.61 1.8 < .001 22 16.9 182 1.08 5.2 9.0 5.06 27.3HY1-8.00 20 0.577 0.73 0.91 0.037 2.27 0.28 11.24 2.0 < .001 26 22.5 201 1.33 6.6 15.9 17.11 50.0HY1-8.10 32 1.227 1.80 1.34 0.023 2.85 0.42 7.34 2.7 0.008 30 26.5 276 1.65 7.7 15.0 7.34 44.1HY1-8.40 8 0.231 0.26 0.19 0.010 0.14 0.07 7.47 0.7 < .001 17 8.2 98 0.64 2.6 4.0 2.87 16.0HY1-8.70 43 1.947 2.07 1.46 0.025 1.99 0.59 8.38 3.2 < .001 39 35.9 621 1.90 16.0 20.2 9.11 51.0HY1-9.40 12 0.627 0.30 0.32 0.020 2.06 0.13 9.04 1.0 0.004 15 12.8 106 0.67 3.5 5.5 21.07 30.0HY1-9.90 8 1.142 0.31 0.35 0.010 0.41 0.09 26.12 1.1 0.005 17 11.4 90 0.59 3.2 9.7 5.42 12.9HY1-10.00 11 0.988 0.36 0.63 0.020 0.68 0.14 19.44 2.1 0.003 42 18.3 217 1.72 7.3 22.0 11.00 29.0HY1-10.53 11 1.889 0.31 0.92 0.014 0.14 0.14 8.97 4.3 0.002 51 27.2 115 1.82 10.7 27.8 14.80 45.5HY1-11.00 8 1.069 0.27 0.48 0.022 0.17 0.09 23.88 1.9 0.004 29 17.0 184 1.06 5.0 13.8 8.76 22.9HY1-11.75 7 1.239 0.25 0.64 0.033 0.08 0.09 21.48 3.1 0.001 47 27.2 278 1.45 7.7 22.7 16.38 39.6HY1-12.25 17 0.879 0.58 0.86 0.023 0.67 0.24 13.51 2.4 0.005 39 23.3 268 1.66 8.7 15.3 10.51 38.9HY1-12.80 9 1.521 0.25 0.80 0.024 0.09 0.13 12.63 4.9 < .001 74 32.4 302 1.76 15.4 22.7 13.50 41.0HY1-13.00 9 1.095 0.25 0.65 0.021 0.37 0.11 17.24 3.9 0.003 56 23.9 299 1.79 15.4 22.0 14.13 43.9HY1-13.73 6 1.044 0.25 0.70 0.025 0.48 0.10 18.63 3.3 0.004 69 26.9 351 1.86 12.6 17.5 19.26 41.4HY1-14.00 31 1.219 0.69 1.14 0.039 3.29 0.42 11.72 2.5 0.004 32 26.1 180 1.70 6.1 14.2 25.38 51.3HY1-14.90 6 1.233 0.24 0.64 0.034 0.15 0.10 17.35 3.9 0.003 51 28.0 228 1.25 4.8 19.7 12.35 42.4HY1-15.90 5 1.460 0.29 0.64 0.053 0.34 0.10 19.54 3.7 < .001 75 29.6 682 3.69 19.2 26.3 19.99 62.9(meters in depth)
ELEMENT Ga As Se Sr Mo Ag Cd Sb Te Ba La W Au Hg Tl Pb Bi Th Uunit ppm ppm ppm ppm ppm ppb ppm ppm ppm ppm ppm ppm ppb ppb ppm ppm ppm ppm ppmDetection Limit 0.1 0.1 0.1 0.5 0.01 2 0.01 0.02 0.02 0.5 0.5 0.2 0.2 5 0.02 0.01 0.02 0.1 0.1HY1-0.85 7.3 27.3 1.6 427.6 5.70 3928 6.94 8.99 0.10 1012.9 10.9 0.7 276.1 43 0.20 1125.25 0.66 2.5 0.8HY1-1.20 4.0 19.9 2.6 387.1 7.12 1736 5.54 10.39 0.08 462.7 6.9 2.7 32.3 72 0.07 628.10 7.11 1.8 0.6HY1-1.68 0.5 2.5 0.6 136.4 0.54 95 0.07 0.24 0.12 69.1 5.8 < .1 6.7 21 < .02 15.75 2.25 1.1 0.7HY1-2.15 4.0 12.8 1.2 449.6 3.90 1592 3.81 6.19 0.10 347.1 7.2 0.8 54.4 60 0.08 641.35 12.75 2.0 0.7HY1-2.80 6.6 5.7 0.5 362.7 1.43 34 0.29 0.29 0.07 162.1 10.5 < .1 2.8 43 0.12 19.67 0.61 4.2 1.0HY1-3.15 4.5 14.0 1.1 555.3 5.07 1033 4.50 6.43 0.06 329.8 7.1 0.9 54.1 113 0.09 650.66 9.00 2.1 0.8HY1-3.72 3.2 4.5 0.3 2372.5 0.35 27 0.08 0.17 0.17 169.3 6.0 < .1 1.2 10 0.06 7.63 0.09 2.1 0.8HY1-4.20 2.3 5.1 0.5 558.4 0.96 127 0.38 0.51 0.07 107.5 4.9 < .1 3.9 15 0.05 48.17 0.57 1.6 0.6HY1-4.62 2.8 17.5 1.8 668.8 1.85 132 2.42 0.42 0.10 88.3 5.5 < .1 0.6 12 0.73 19.84 0.08 2.1 1.5HY1-4.90 1.8 3.6 0.3 1838.5 0.48 20 0.12 0.26 0.15 148.4 5.0 < .1 0.6 8 0.05 8.37 0.06 1.7 0.6HY1-5.45 1.8 3.4 0.3 591.3 0.64 24 0.11 0.18 0.08 65.5 4.6 < .1 0.3 9 0.05 5.68 0.05 1.6 0.5HY1-5.70 1.8 2.0 0.4 666.3 0.44 46 0.22 0.15 0.09 68.2 4.1 < .1 0.8 < 5 0.05 6.27 0.07 1.4 0.5HY1-6.15 1.3 0.8 0.9 739.7 0.20 32 0.06 0.09 0.08 46.4 2.7 < .1 1.0 7 0.04 6.51 0.06 1.1 0.5HY1-6.60 4.0 5.2 0.6 2181.2 1.13 14 0.11 0.20 0.19 94.7 7.5 < .1 0.6 9 0.09 5.45 0.10 3.4 0.4HY1-7.00 2.9 3.8 0.3 738.1 0.79 57 0.12 0.22 0.06 66.5 5.4 < .1 0.9 5 0.06 12.12 0.13 2.3 0.4HY1-7.60 2.8 3.1 0.4 820.3 0.68 18 0.04 0.17 0.09 60.3 5.2 < .1 0.2 5 0.06 5.01 0.07 2.4 0.3HY1-8.00 2.9 5.7 0.7 678.8 0.90 173 0.21 0.28 0.09 85.0 6.1 < .1 2.0 12 0.07 22.82 1.13 2.3 0.5HY1-8.10 4.1 6.0 0.3 389.3 1.04 37 0.08 0.30 0.06 62.4 8.4 < .1 1.0 16 0.08 9.72 0.11 3.7 0.5HY1-8.40 0.7 4.5 0.5 154.1 0.45 21 0.30 0.15 0.07 40.6 4.1 < .1 1.6 19 0.02 4.03 0.03 0.8 0.2HY1-8.70 5.5 4.8 0.5 208.7 1.13 26 0.11 0.23 0.06 115.1 11.0 < .1 1.4 66 0.11 10.28 0.12 4.8 0.7HY1-9.40 1.3 3.8 0.4 556.4 0.58 39 0.11 0.19 0.08 46.3 3.1 < .1 1.1 39 0.05 8.90 0.06 1.0 0.4HY1-9.90 1.4 3.8 0.3 328.5 0.50 14 0.07 0.14 0.13 46.5 3.5 < .1 1.7 52 0.03 3.79 0.03 1.4 0.3HY1-10.00 2.2 11.6 0.3 440.1 1.10 29 0.11 0.26 0.10 53.8 7.6 < .1 1.1 80 0.04 7.08 0.07 2.7 0.3HY1-10.53 3.4 13.8 0.2 198.7 0.68 5 0.06 0.24 0.06 18.4 5.6 < .1 0.6 20 0.03 7.01 0.15 6.8 0.2HY1-11.00 1.8 6.5 0.2 390.4 0.38 5 0.08 0.13 0.15 69.3 8.0 < .1 0.6 91 0.02 3.93 0.05 2.6 0.3HY1-11.75 2.5 9.4 0.2 531.6 0.39 3 0.10 0.16 0.11 45.7 8.7 < .1 0.5 12 0.02 4.39 0.08 4.0 0.3HY1-12.25 2.9 7.8 0.3 366.3 0.77 27 0.09 0.21 0.06 64.8 7.5 < .1 1.1 130 0.05 11.25 0.09 3.0 0.4HY1-12.80 3.4 6.3 0.2 398.0 0.46 4 0.08 0.17 0.09 34.6 8.8 < .1 0.7 11 0.03 8.51 0.14 6.7 0.3HY1-13.00 2.6 8.5 0.5 418.0 0.58 24 0.11 0.18 0.10 46.6 7.2 < .1 0.6 90 0.03 9.52 0.13 5.0 0.3HY1-13.73 2.6 6.2 0.3 434.3 0.41 10 0.09 0.15 0.10 45.2 7.7 < .1 5.9 53 0.03 6.12 0.09 4.5 0.3HY1-14.00 4.0 4.5 0.5 2924.8 0.94 68 0.15 0.79 0.28 112.1 7.1 < .1 1.5 38 0.08 29.97 0.12 3.5 0.5HY1-14.90 2.5 3.7 0.2 540.4 0.20 5 0.09 0.16 0.09 137.3 9.1 < .1 0.9 25 0.02 5.02 0.13 5.9 0.3HY1-15.90 2.8 9.2 0.8 537.3 1.06 36 0.17 0.32 0.11 129.1 11.0 < .1 1.3 74 0.04 12.51 0.11 4.6 0.8(meters in depth)
Part I. Solid Waste Landfill
38
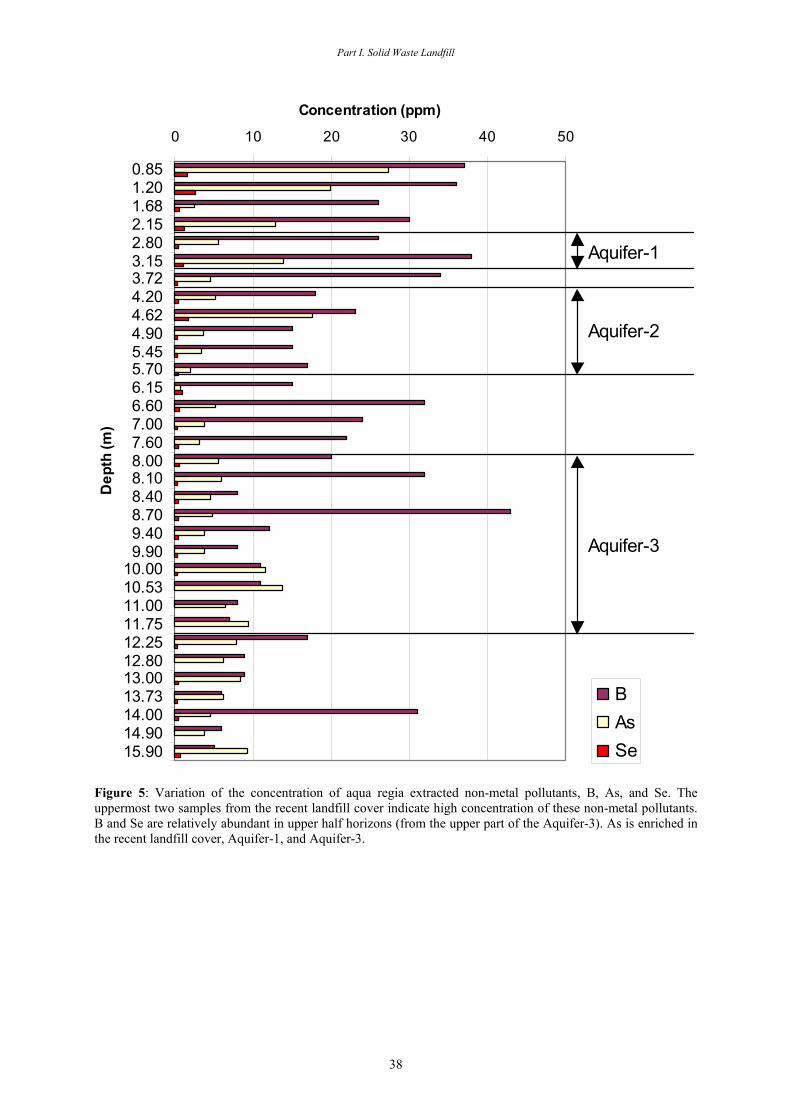
Figure 5: Variation of the concentration of aqua regia extracted non-metal pollutants, B, As, and Se. The uppermost two samples from the recent landfill cover indicate high concentration of these non-metal pollutants. B and Se are relatively abundant in upper half horizons (from the upper part of the Aquifer-3). As is enriched in the recent landfill cover, Aquifer-1, and Aquifer-3.
0 10 20 30 40 50
0.851.201.682.152.803.153.724.204.624.905.455.706.156.607.007.608.008.108.408.709.409.90
10.0010.5311.0011.7512.2512.8013.0013.7314.0014.9015.90
Dep
th (m
)Concentration (ppm)
BAsSe
Aquifer-3
Aquifer-2
Aquifer-1

Groundwater and sediment pollution
39
Figure 6: Variation of the concentrations of aqua regia extracted metal pollutants, Ti, V, Cr, Co, Ni, Cu, and Zn. The recent landfill cover materials and Aquifer-1 sediments show extremely high concentrations (out of scale in this diagram) for given metal pollutants. The metal concentrations of Aquifer-2 and Aquifer-3 sediments are showing around background levels.
0 20 40 60 80 100
0.851.201.682.152.803.153.724.204.624.905.455.706.156.607.007.608.008.108.408.709.409.90
10.0010.5311.0011.7512.2512.8013.0013.7314.0014.9015.90
Dep
th (m
)Concentration (ppm)
TiVCrCoNiCuZn
Aquifer-3
Aquifer-2
Aquifer-1

Part I. Solid Waste Landfill
40
Figure 7: Variation of the concentrations of aqua regia extracted metal pollutants, Mo, Ag, Cd, and Sb. The recent landfill cover materials and Aquifer-1 sediments show extremely high concentrations (out of scale in this diagram) for given metal pollutants. The Aquifer-2 indicate relatively high concentration of Cd. The Aquifer-3 sediments are showing the metal concentrations around background levels.
0.00 1.00 2.00 3.00 4.00
0.851.201.682.152.803.153.724.204.624.905.455.706.156.607.007.608.008.108.408.709.409.90
10.0010.5311.0011.7512.2512.8013.0013.7314.0014.9015.90
Dep
th (m
)
Concentration (ppm)
MoAgCdSb
Aquifer-1
Aquifer-2
Aquifer-3

Groundwater and sediment pollution
41
Figure 8: Variation of the concentrations of aqua regia extracted metal pollutants, Ba, La, Hg, Tl, and Pb. The recent landfill cover materials and Aquifer-1 sediments show extremely high concentrations (out of scale in this diagram) for given metal pollutants. Except in the recent landfill cover and the Aquifer-1, the concentrations of Hg is moderate to high in the lower part of the Aquifer-3 and underlying confined beds, which suggest that Hg contamination in the Aquifer-3 is natural origin.
0 50 100 150 200
0.851.201.682.152.803.153.724.204.624.905.455.706.156.607.007.608.008.108.408.709.409.90
10.0010.5311.0011.7512.2512.8013.0013.7314.0014.9015.90
Dep
th (m
)
Concentration (ppm for Ba, La, Ti, Pb; ppb for Hg)
BaLaHgTlPb
Aquifer-1
Aquifer-2
Aquifer-3

Part I. Solid Waste Landfill
42
In the case of non-metal pollutants, B, As, and Se, the uppermost two samples collected from the recent landfill cover indicate high concentration of these non-metal pollutants. B and Se are relatively abundant in upper half horizons, above the upper part of the Aquifer-3. Except in the recent landfill cover layers and the Aquifer-1, As is relatively enrich in the lower part of Aquifer-3 and confined beds below the aquifer-3, which suggest that the As contamination has been derived from basement sedimentaries.
The metal pollutants, Ti, V, Cr, Co, Ni, Cu, and Zn, exhibit extremely high concentrations in the recent landfill cover layers and the Aquifer-1 sediments. The metal concentrations of Aquifer-2 and Aquifer-3 sediments are showing around background levels represented by the concentrations in the lowermost confined beds.
In the case of metal pollutants, Mo, Ag, Cd, and Sb, the recent landfill cover layers and the Aquifer-1 sediments also show extremely high concentrations. The Aquifer-2 sediments indicate relatively high concentration of Cd. The Aquifer-3 sediments are showing the metal concentrations around background levels.
The other metal pollutants, Ba, La, Hg, Tl, and Pb, also show extremely high concentrations in the horizons of recent landfill cover layers and Aquifer-1. Except in the recent landfill cover layer and the Aquifer-1, the concentrations of Hg is moderate to high in the lower part of the Aquifer-3 and underlying confined beds, which suggest that Hg contamination in the Aquifer-3 is a natural geologic origin.
Consequently, the subsurface sediment contamination is considerable at the horizons of recent landfill cover layers and the Aquifer-1 sediments, of which depth is above -3.20 meter at the site HY1. In particular, metal pollutants are extremely contaminated in these two horizons. VI. Conclusion (1) Groundwater pollution and subsurface sediment contamination are examined using perimeter drilling survey of the Henchir El Yahoudia landfill. (2) According to the drilling survey, three aquifers are recognized in the area, named Aquifer-1, Aquifer-2, and Aquifer-3 in descending order. (3) The concentration of Al, Cu, Zn, Se, and Pb in the groundwater samples is above the regulation CCC, and that of Cu, Zn, Se, and Pb is above the regulation CMC. The concentration of Se and Pb is much higher than CCC and CMC, which is above the wastewater regulation. The high concentrations of Cu, Zn, Se, and Pb are possibly due to a pollution caused by the MSW landfill. (4) The subsurface sediment contamination is considerable at the horizons of recent landfill cover layers and the Aquifer-1 sediments, of which depth is above -3.20 meter at the site HY1. In particular, metal pollutants are extremely contaminated in these two horizons. Acknowledgements We thank ANPE and Administration Office of Henchir El Yahoudia landfill for the permission of our survey. We also thank Mohamed Boulhouni and Fethi Boushila of Laboratoire Eau & Environnement, INRST for their help in sample preparation. This collaborative study was carried out as a part of technical cooperation programme between INRST and JICA. References Alloway, B.J., 1995(ed.), Heavy Metals in Soils, 2nd Edition. Blackie Academic &
Professional, Chapman & Hall, London, 368p.

Groundwater and sediment pollution
43
Drever, J.I., 1997, The Geochemistry of Natural Waters – Surface and Groundwater Environments, 3rd Edition. Prentice Hall, Upper Saddle River, 436p.
Howard, A.G., 1998, Aquatic Environmental Chemistry. Oxford Science Publications, Oxford, 90p.
Ibrahim, A.N., 2002, Environmental pollution assessment of the Henchir El Yahoudia closed landfill. Memoire de Diplome d’Etudes Approfondies, INAT, 81p.
McBean, E.A., Rovers, F.A., and Farquhar, G.J., 1995, Solid Waste Landfill Engineering and Design. Prentice Hall, Engelwood Cliffs, 521p.
Patrick, R., Ford, E. and Quarles J., 1987, Groundwater Contamination in the United States 2nd Edition. University of Pennsylvania Press, Philadelphia, 513p.
Ure, A.M., 1995, Methods of analysis for heavy metals in soils. In Alloway (ed.), Heavy Metals in Soils, 2nd Edition. Blackie Academic & Professional, Chapman & Hall, London, 58-102.
United States Environmental Protection Agency, 1999, National Recommended Water Quality Criteria – Correction. EPA 822-Z-99-001