Characterization of MSW Compost and its Application in ...
48
I l ! CONTROL OF URBAN POLLUTION SERIES: Characterization Of MSW Copost and its Application in Agriculture - -- - - - Central Pollution Control Board MINISTRY OF ENVIRONMENT & FORESTS CUPS/59/2005-06 I I welJsite: www.cpclJ.ic.in e-mail: cpclJ@alpba.nic.in February, 2006
-
Upload
khangminh22 -
Category
Documents
-
view
0 -
download
0
Transcript of Characterization of MSW Compost and its Application in ...

I
l !
CONTROL OF URBAN POLLUTION SERIES:
Characterization Of
MSW Cotnpost
and
its Application
in Agriculture ·- - -- -- - --- -
Central Pollution Control Board MINISTRY OF ENVIRONMENT & FORESTS
CUPS/59/2005-06
I
I
welJsite: www.cpclJ.ttic.in e-mail: [email protected]
February, 2006

I
l !
CONTROL OF URBAN POLLUTION SERIES:
Characterization Of
MSW Cotnpost
and
its Application
in Agriculture ·- - -- -- - --- -
Central Pollution Control Board MINISTRY OF ENVIRONMENT & FORESTS
CUPS/59/2005-06
I
I
welJsite: www.cpclJ.ttic.in e-mail: [email protected]
February, 2006
CUPS/59/2005-06
Characterization of Compost Quality
and
Application of Compost and Sewage
Sludge in Agriculture
CENTRAL POLLUTION CONTROL BOARD (Ministry of Environment & Forests, Govt. of India)
Parivesh Bhawan, East Arjun Nagar Delhi -110 032
Website: www.cpcb.nic.in e-mail: [email protected]
CPCB ENVIS Centre (www.cpcbenvis . n ic . i n )
CPCB 200 Copies, 2005
Published By : Dr. B. Sengupta, Member Secretary, Central Pollution Control Board, Delhi - 32 Printing Supervision & Layout: P.K. Mahendru and Mrs. Anamika Sagar Composing & Laser Typesetting : Mohd. Javed Printed at: National Institute of Science Communication and Information Resources, CSIR,
Dr. K.S. Krishnan Marg, New Delhi - 110 012
CPCB ENVIS Centre (www. cpcbenvis . n ic . i n )

Dr. V. RAJAGOPALAN, IAS CHAIRMAN
FOREWORD
qj.-J)� �C&ttO( f:"l�"?IO( � (1ITTC1 &""cn-R � ftrrG;:r) �ICRUJ r:;ci q.:f �
Central Pollution Control Board (A Govt. of India Organisation)
Ministry of Environment & Forests Phone: 22304948/22307233
According to the Municipal Solid Wastes (Management and Handling) Rules,
2000. 'composting', of bio-degradable waste has been suggested as one of the waste processing options. The rules provide guidance for setting up compost plants and steps to be taken for prevention of pollution problems. In order to ensure safe application of compost, specifications for compost quality are also prescribed.
To assess the quality of compost produced at some of the compost plants,
Central Pollution Control Board (CPCB) through National Environmental Engineering Research Institute (NEER!), Nagpur had carried out detailed studies. Also, to see the
impact of application of compost on agricultural crops, field studies were carried out by Indian Agricultural Research Institute (IARI) at Delhi.
In the present report, findings of the study carried out by NEER! and IARI are
highlighted. It will be useful that the concerned State Pollution Control Boards and municipal authorities periodically check the quality of compost produced. Further, SP6Bs may also interact with State Agricultural Departments and other concerned
institutions to ensure that compost made available for agricultural use is suitable for the crops.
The study has been co-ordinated by Dr. B. Sengupta, Member Secretary, Dr. A.B Akolkar. Additional Director, Sh. S.K. Singh, EE and Sh. A.K. Vidyarathi. AEE The samples for heavy metal analysis were analysed in the laboratory of CPCB and analysis was done under the supervision of Dr. C.S. Sharma, Sr. Scientist assisted by Dr. Somender Singh, Scientist 'B'.
V"ll�'y?� (Dr. V. Rajagopalan)
'Parivesh Bhawan' C B D Off. c · · · .-cum- ice omplex. East Arjun Nagar D e l h i -110 032 Fax: (011) 22304948122307078 e-mail: cpcb@alpha.� ic.in Website : http:/lwww.cpcb.nic.in
() -u () OJ m z < (j) () CD :::J ...+ ...., CD
I (")
"'O (") O'" CD :::J �-CJ) :::J (")
:::J -
I \ I
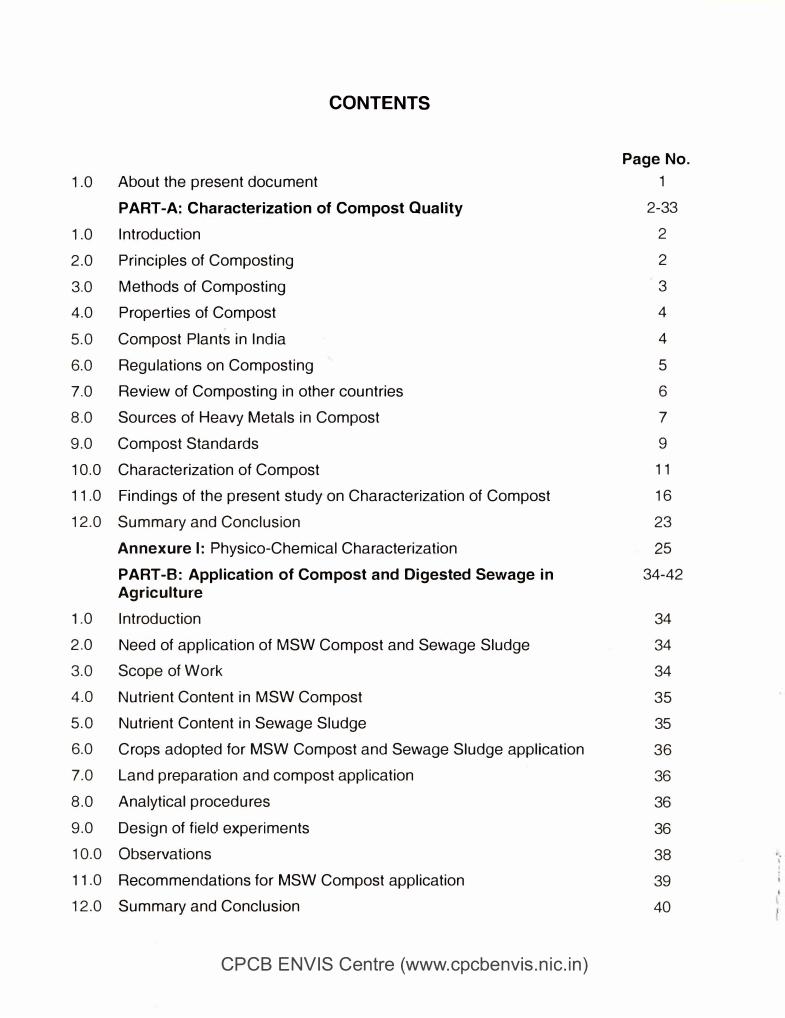
CONTENTS
Page No.
1.0 About the present document 1
PART-A: Characterization of Compost Quality 2-33
1.0 Introduction 2
2.0 Principles of Composting 2
3.0 Methods of Composting 3
4.0 Properties of Compost 4
5.0 Compost Plants in India 4
6.0 Regulations on Composting 5
7.0 Review of Composting in other countries 6
8.0 Sources of Heavy Metals in Compost 7
9.0 Compost Standards 9
10.0 Characterization of Compost 11
11.0 Findings of the present study on Characterization of Compost 16
12.0 Summary and Conclusion 23
Annexure I: Physico-Chemical Characterization 25
PART-B: Application of Compost and Digested Sewage in 34-42 Agriculture
1.0 Introduction 34
2.0 Need of application of MSW Compost and Sewage Sludge 34
3.0 Scope of Work 34
4.0 Nutrient Content in MSW Compost 35
5.0 Nutrient Content in Sewage Sludge 35
6.0 Crops adopted for MSW Compost and Sewage Sludge application 36
7.0 Land preparation and compost application 36
8.0 Analytical procedures 36
9.0 Design of field experiments 36
10.0 Observations 38
11.0 Recommendations for MSW Compost application 39
12.0 Summary and Conclusion 40
CPCB ENVIS Centre (www.cpcbenvis . n ic . i n )

'ABOUT THE PRESENT DOCUMENT'
1.0 The Present Document
The Central Pol luti on Control Board (CPCB) undertook comprehen si ve study on assessment of compost qual i ty and app l i cat ion of mun ic ipal sol i d waste (MSW) compost and di gested sewage s l udge in ag1icul ture. CPCB completed these studies with the assi stance of the National Environmental Engineeri ng Research Insti tute (NEERI) , Nagpur and Di v i s ion of En v i ronmental Sci ences, Indi an Agri cul ture Research Inst i tute (IARI) , Del h i . The present document is di v ided i n to two parts. I n Part A , studies caJTied out b y NEERI on assessment of compost qual i ty has heen descri bed. In Part B of th i s document, a description of three years study on app l i cation of compost and sewage s l udge in agricu l ture caffied out by IARI has been gi ven .
CPCB ENVIS Centre (www.cpcbenvis . n ic . i n ) 1

PART A CHARACTERIZATION OF COMPOST QUALITY
1.0 INTRODUCTION
Mun ic ipal Sol id Waste ( MWS) conta ins a large organ ic fract ion rang ing from 30 to 50%. Thi s organ ic content tends to decompose leading to smel l and odour prob lem. It i s therefore necessary to col lect and transport the waste regularly for i ts disposa l . To ensure a safe di sposal of the MSW and to reduce the requi red capac i ty of the di sposal s i te , it i s necessary that waste i s processed. Several process ing opti on s are avai l able for th i s purpose and these cou ld be attempted as per their app l i cabi l i ty. Amongst the known process ing techno logies, "Composting" is qui te common ly used and i t resu l ts i n product ion of a stab le product that i s , compost, that can be used as a low-grade manure and soi l condit ioner on farms and orchards. The process is i mponant as i t results i n conservation of n atural resources. After t h e waste i s composted, on ly t h e nondecomposable fract ion remain s to be disposed off on l and . Thus, the l and requirement wh ich is a crit ical component and i s in short supp ly in urban centres, i s substan t i al ly reduced lead ing to overa l l economy. In the case of i ndi v idual households, smal l estab l i shments and co lon ies, vermicompost ing which i n volves the stabi l i sation of organ i c sol id waste through earthworm con sumpti on for conversion of the organ i c materi al to worm cast ing, is a l so bei ng prefeJTed.
There are many compost p lants i n the country and their performance has been assessed by the ins t i tutions l i ke NEERI and Mini stry of Urban Deve l opment . However, spec i fi c i n formation re lat ing to the chemical compos i t ion of compost produced by these p lants has not been reported. Further, assessment of app l icat ion of compost in agricu l ture has also not been exten s i ve ly documented. With th i s v iew, Central Pol lut ion Control B oard (CPCB ) wi th the assi stance of NEERI and IARI, NEW Del h i made an attempt to ascertain qua l i ty of compost bei n g produced, by a few compost p lants and the i mpact of compost on agricu l tural crops based on extensi ve fi e ld tri a l s .
2.0 PRINC IPLES OF COMPOSTING
Decomposi t i on of organ i c waste is a n atural phenomenon . 'Composting' is an organ i sed method of produci ng man ure by adopt ing th i s n atural phenomenon . Compost ing refers to a control led process i n vo lv i ng microbial decomposi t ion of organ i c matter.
Compost ing can be ca1Tied out i n two ways namely , aerobica l l y and anaerobical l y . Duri ng aerobic composti ng, aerobic microorgani sms oxidise organ ic compounds to C02, N02, and N03. Carbon from organ i c compounds is used as a source of energy wh i l e n i trogen is recycled. Due to exothermic n ature of the react ion , temperature of the mass 1ises . In anaerob ic process , the anaerobic microorgan i sms, wh i l e metabo l i s ing the nutrients , break down the organ i c compounds through a process of reduct ion . A very smal 1 amount of energy is released duri ng the process and the temperature of compostin g mass does not i ncrease muc h . The gases evol ved are mai n l y methane (CH4) and carbondiox ide (C02) . An anaerobic process i s a reduction process and the fi na l product is subjected to some minor oxi dation when appl ied to l and .
CPCB ENVIS Cent� (www.cpcbenvis . n ic . i n )

3.0 METHODS OF COMPOSTING
Manual composti ng was systematised by Howard and h i s associ ates . I t was further deve l oped by Acharya and Subrahmanyam and the methods are conventi onal l y refetTed as I ndore and Bangalore methods of compost ing .
3. 1 Bangalore Method
Thi s is an anaerobic method conventiona l l y carri ed out in p i t s . In i t i a l l y. a l ayer of coarse MSW i s p laced a t the bottom of a p i t to a depth of 1 5 to 25 cm and i s m ade 7 .5 cm th icker for 2 5 cm width towards both the edges o f the pi t . N ight soi l i s put i n the depressed po1tion t o a th ickness of 5 cm and the e levated edges prevent it from drai n ing to the s ide. A l ayer of sol id waste is put on the top so that the n i ght soi l l ayer is sandwiched between the two l ayers of MSW. So l id waste and night soi I is put in al ternate l ayers ti 11 the fi I led materi a l ri ses to a height of 30 cm above the pit edge. The fi na l l ayer of sol i d waste is at l east 25 to 30 cm th ick . The top of the deposited materi al is rounded off to avoid rai nwater entering i nto the p i t . S ometimes a top l ayer of soi l i s given to prevent f ly breeding , for conservat ion o f the released energy and to prevent entry of rai nwater i n to the pi t . The material after 4 to 6 months of decomposi t ion is stabi l i sed and is taken out and used as compost .
3.2 Indore Method
Th i s method of compost ing i n p i ts i n vol ves fi l l i ng of al ternate l ayers of M S W and n i ght so i l of sim i l ar th i ckness as in B angalore method. However, to ensure aerobic condi t ion the materi al i s turned at speci fi c i n terval s for which a 6 0 cm strip o n the l ongi tudi na l s ide o f the pit i s kept vacant . Four to seven days after fi l l i ng ,the first tum i s manual l y gi ven usi ng long handled rakes . The second tum i s g i ven after 5 to 1 0 more days. Further turn i ng i s normal l y not requi red and the compost i s ready in 2 to 4 weeks .
In the urban areas, due to exten s i ve provis ion of water carri age system of sani tation , n i ght soi I i s not avai l ab l e . Composti ng of MSW a lone i s hence often carried out . Aerobic composti ng of MSW i s common l y catTied out in windrows .
'Windrows'
For aerobic composti ng of Munic ipa l So l id Waste, the material is di rect l y p l aced on the ground which should be paved. The w indrows are norma l l y 2.4 to3.6 m wide, 1 to1 .6 m h igh and of such a l ength as to accommodate a day's quant i ty of waste . The height of the win drow should not be too h igh , as otherwise the material w i l l get compressed under its own weight , reducing pore space and resu l t i ng i n i ncreased cost of turning or i ncreasi n g the composti ng t ime due to development of anaerobic condi tions . Sometimes, the windrow height is governed by the equi pment used for turni ng . Too sha l l ow a windrow is a l so not desi rab le as for the same quan tity the re lat i ve ly l arger surface area w i l l resu l t in l arger heat l oss .
3 CPCB ENVIS Centre (www.cpcbenvis . n ic . i n )

3.3 Comparison of the Methods
The B angal ore method requires l onger time for stab l i sation of the materi al and hence needs l arger l and space, wh ich i s i n sh011 supp ly i n urban areas. The gases generated in the anaerobic process a lso pose smel l and odour prob lems .
The I ndore method on the other hand stabi I i ses the materi al i n shorter t i me and needs lesser l and space. As no odourous gases are generated i n the process, it i s envi ronment friend ly and hence common l y prefeJTed.
The i nput to compost ing process should be carefu l l y chosen to be mai n ly organi c and shou ld not contai n any hazardous materi al .
Whi le the organi c matter i s stabi l i sed duri ng the composti ng process , the moi sture content a l so changes. The non decomposables are al so rejected. Hence the quanti ty of compost i s much lesser than the i nput and is normal l y around 50%, and the exac t va lue depends upon the characteristi cs of the i nput materi a l .
4.0 PROPERTIES OF COMPOST
The compost prepared from MSW should be b l ack brown or at l east b l ack i n co lour . It should be crumbly in nature with an earthy odour. The pH should be neutral though s l i ght ly aci di c or al ka l i ne pH wi thi n the range of 6 . 5 to 7 .5 can be tolerated.
The compost should n ei ther be complete ly dry nor i t be l umpy and water shou ld not come out of the mass when squeezed.
The N i trogen , Phosphorous and Potassi um contents shou ld be more than one percent eac h. The N i trogen shou ld be in the form of N i trates for proper uti l i zati on by the p l ants . The C/N rati o should be between 1 5 to 20.
I t can be seen that i n the standards prepared by the d ifferent countries , the permi ss i b le val ues vary a l ot . It i s hence desirable that the permi ss ib le l im i t s under Indian condi t ion should be based on the val ues contai ned in the raw wastes, as well as i n fin i shed products as obtai ned in Indi an condi t ions . Further, as per the commi ttee appointed by the S upreme Court, source separat i on should be - adopted by the M un ic ipal agencies . The same commi ttee i n thei r report a lso recommended compostin g of the source separated waste .
5.0 COMPOST PLANTS IN INDIA
As per the i nformation avai l ab le , a total of 1 2 mechan i cal compostin g p lants have been constructed in India and 1 5 more are in different stages of i mp lemen tat ion. The i nformati on about the p l ants i s i ndicated i n a Table gi ven be low.
4 CPCB ENVIS Centre (www.cpcbenvis . n ic . i n )
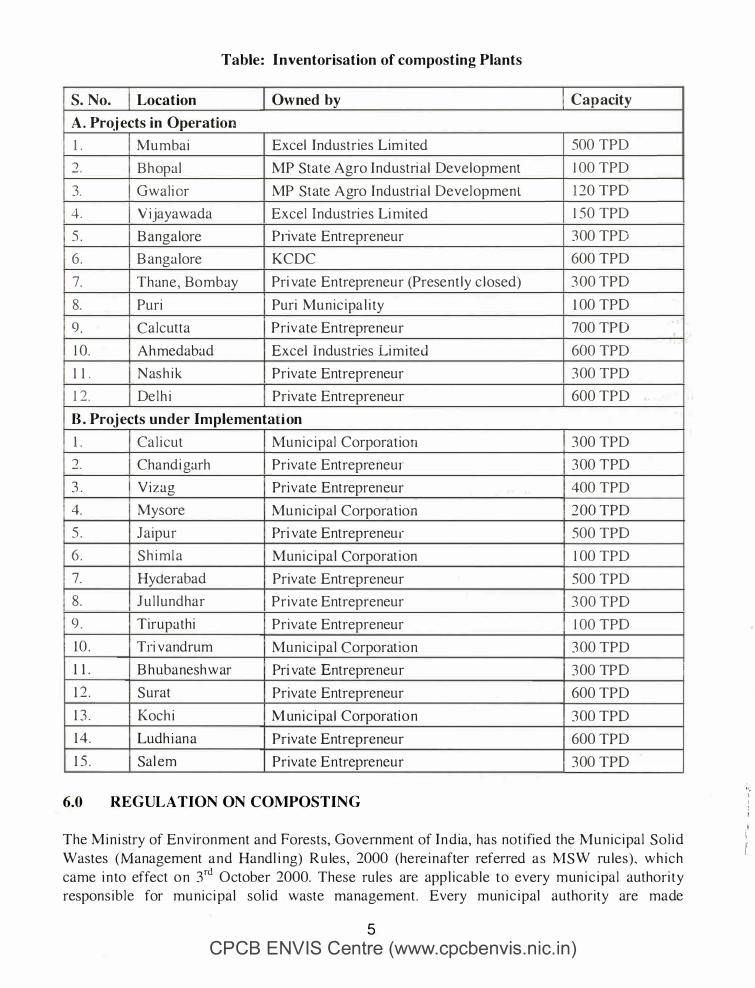
Table: Inventorisation of composting Plants
S.No. Location Owned by
A. Projects in Operation
I. Mumbai Excel Industries Lim i ted I Bhopal MP State Agro Industri a l Deve lopment
3. Gwal ior MP State Agro Industri a l Developmenl
4. Vijayawada Excel Industri es Limited
5 . B angalore P1ivate Entrepreneur
6 . B angalore KCDC
7. Thane , Bombay Pri vate Entrepreneur (Present ly c l osed)
8. Puri Puri Munic ipa l i ty
9. Calcutta Private Entrepreneur
1 0 . Ahmedabad Excel Industries L imi ted
1 1. Nash ik Private Entrepreneur
1 2 . De l h i Private Entrepreneur
B. Projects under Implementation
I. Ca l i cut Munic ipal Corporation I Chandi garh Private Entrepreneur
3 . Yi zag Private Entrepreneur
4. Mysore Mun ic ipal Corporation
5 . Jaipur Private Entrepreneur
6 . S h i mla Mun ic ipal Corporat ion
7. Hyderabad Private Entrepreneur
8 . Ju l l undhar Private Entrepreneur
9. Tirupathi Private Entrepreneur
1 0 . Trivandrum Munic ipal Corporat ion
1 1 . B hubaneshwar Private Entrepreneur
1 2 . Surat Private Entrepreneur
13 . Koc h i M un ic ipal Corporation
1 4 . Ludh i an a Private Entrepreneur
1 5 . Sal em Private Entrepreneur
6.0 REGULATION ON COMPOSTING
Capacity
500 TPD
IOO TPD
120 TPD
1 50 TPD
300 TPD
600 TPD
3 00 TPD
1 00 TPD
700 TPD
600 TPD
300 TPD
600 TPD "
300 TPD
300TPD
400 TPD
2 00 TPD
500 TPD
1 00 TPD
500 TPD
3 00 TPD
IOO TPD
300 TPD
300 TPD
600 TPD
300 TPD
600 TPD
300 TPD
The Min i stry of Env ironment and Forests, Government of In dia, has not ified the Mun ic ipa l So l id Wastes (Management and Handl i ng) R u les , 2000 (here inafter referred as MSW ru les) , wh ich came i n to effect on 3rd October 2000. These rules are app l icable to every mun i c i pa l authori ty respons ib le for munic i pal sol id waste management . Every mun i c ipal authority are made
5 CPCB ENVIS Centre (www. cpcbenvis . n ic . i n )
.I \ f

responsi b le, wi th in the terri torial area of the mun ic ipal i ty, for the imp lementation of the provi s ions of these ru les , and for any i nfrastructure development for co l lect ion , storage, segregat ion , transportation , process ing and disposal of munic ipa l sol i d wastes . Any mun ic ipa l sol i d waste generated i n a c i ty or a town , sha l l be managed and hand led i n accordance wi th the comp l i ance cri teri a and the procedure l aid down i n Schedu le- II of the rules . The waste process ing and di sposal fac i l i t ies to be se t up by the mun ic ipa l authority on thei r own or through an operator of a fac i l i ty, shal l meet the spec ificat ions and standards as specified in Schedule III and IV of the ru les .
As per Schedule II of the MSW rules , for process ing of MSW, mun ic ipal authori t ies sha l l adopt suitab l e techno logy or combin at ion of such technologies to make use of wastes so as to m in im ize burden on l andfi l l . Fo l l owing cri teri a sha l l be adopted, namely;
( i ) The biodegradab le wastes sha l l be processed by composti ng , vermicompost ing, anaerobic di gest ion or any other appropriate b io logical process ing for stab i l i zation of wastes . I t sha l l be ensured that compost or any other end product sha l l comply wi th standards as spec ified i n Schedule-IV;
( i i ) Mixed waste containing recoverable resources shal l fo l low the route of recyc l i ng . Inci neration wi th or wi thout energy recovery i nc l udin g pe l leti sati on can a l so be used for process i ng wastes i n spec i fi c cases. Mun i c ipa l authority or the operator of a fac i l i ty w i sh ing to use other state-of-the-art techno logies sha l l approach the Central Po l l ut ion Control B oard to get the standards l aid down before appl yi ng for gran t of authori sat ion .
7.0 REVIEW OF COMPOSTING IN OTHER COUNTRIES
USEPA in i t s report on MSW using 1999 data has shown that about 229 mi Il i on tonnes of M S W i s generated i n USA w h i c h i ncreases ann ual l y a t 3 % . Per capita generati on va lues c hanged from 2 .7 pound/day i n 1 998 to 4 .62 pound/day i n 1 999 . In 1 999, 64 m i l l i on tonnes were composted and recovered as agains t 62 m i l l i on tonnes in 1 998 . The recovery rate for recyc l i ng i n c l udi ng composting w as 27 .94% in 1 999 whic h i s s l i gh t ly hi gher than 27 .6% in 1 99 8 .
Ten m i l l i on tonnes o f biowaste i s current ly composted each year i n t h e European Uni on countries produci ng 5.5 million tonnes of compost. This value is less than 20% of ex i st ing compostab l e feed stocks . (EU- Austria, Belgium, Denmark, Germany, Netherland, S pain , Fin l and, France, Greece, I re land, I ta ly , Luxembourg, Portuga l , United Kingdom, S weden)
European commi ssion is in the process of preparing a directive on bi ologi cal treatmen t of bi owaste. It is env i saged to have a separate coll ection from residences, restaurants , schoo l s , busi ness etc . I n order to standardise the qual i ty of compost produced from Europian Union and i mprove markets, maximum l imi t values are being set for pathogens , weed seeds, heavy metal s and other contami nants in the compost.
CPCB ENVIS Cenfre (www.cpcbenvis . n ic . i n )

8.0 SOURCES OF HEAVY META LS IN COMPOST
8.1 Presence of heavy metal s and other tox icants cou l d be the cause of concern when it i app l ied on agri cu l tura l crops . The chances of tox icants i n compost are i ncreased when mi xed waste is processed. There are many sources and ways through wh ich heavy meta l s in pai1 icu l ar, may reach i n compost and some of the sources are;
8.1.1 Municipal Solid Waste
Munic ipa l Sol i d Waste Management is a heterogeneous mixture of waste material resu l t ing from vari ous human acti v i t ies such as domestic , commerc ial , i ndustri al etc . The domestic waste mai n ly compri ses of organi c food waste as wel l as i norgan i c waste: such as p lasti c , l eather, rubber, g l ass etc . The waste a l so contai ns ashes from domestic chu l lahs . The commerc ial acti v i t ies generate the waste, wh ich also contai n a maj ority of the above-ment ioned con sti tuents . However, the proport ion of the constituents wi l I vary with the type of commerc ia l act iv i ty . The industri es a l so generate l arge amount of waste depending upon the i ndustria l process in use and may comprise of sol i d waste, discarded s ludge from the effl uent treatment p lant and part of it can a l so come from the air po l l ution control equipment (f ly ash ) . A l arge n umber of smal l -sca le i n dustries l ocated with in the Mun ic ipal l imits common l y observed to di spose off so l i d waste a l ong with the Munic ipal S ol id Waste .
8.1.2 Hospital Solid Waste
In the case of the hospita l s, c l i n i c s and other hea l th care establ ishments , the generated waste has to be di sposed off by them, by fol lowing the B i o- medical Waste (Management and Handl ing ) Ru l es 1 998 . However, the waste from smal l er c l in ics, consul ti ng rooms etc . is often di sposed off along with the Mun ic ipal So l id Waste . B iomedical waste mostly contai n s bandages, swabs , syri nges, di scarded medic i ne and chemical s etc .
In the case of smal ler towns where water carriage system i s not prov ided, the s l udge from the septi c tanks also gets mixed up with mun ic ipa l so l id waste . Sometimes the mun i c ipal wastewater treatment p l ant a l so di sposes of the s l udge which cannot be directly so l d I disposed of at the mun ic ipal di sposal s i tes . These s l udges may contain heavy metal s from the i n dustria l wastewater which is often mi xed wi th mun ic ipa l sewage.
Some gardens , agri cul ture p lots are l ocated wi th in the mun ic ipal l imi t s . The res idue from the appl ication of the fert i l i zers, pesti c ides along with the eros ion of the soi l from such green spaces add to the heavy metal l oad in munic ipal so l id waste.
8 .1.3 Street Waste
The movement of veh ic les on the road resu l ts i n generation of waste from the veh ic le . The wear and tear of the tyres, the so i l sti c king to the tyres of the veh i cl e , the soi l and dust wh ich i s b l own by the wind from the adjoin i ng l and spaces a long w i th the waste contributed by the occupants of the vehic l es adds to the waste . S uch street waste also contai n s heavy meta l s. The present pract ice
CPCB ENVIS Centr� (www.cpcbenvis . n ic . i n )

of addin g street sweepings to the munic ipa l so l i d waste cou l d be one of the reason for increase i n the heavy meta l content .
8.1.4 Construction and Demolition Waste
The construction and demo l i t ion waste from i ndustria l estab l i shment and urban centers may a l so add to the heavy metal content of mun i c ipal so l i d waste.
8.1.5 Deposit from Air borne Pollutants
The effl uent gases from many i ndustries contai n fine panicul ates such as fly ash which deposit on the roads as wel l · as adj o in ing propert ies . Such deposi t i on may contai n a l arge number or heavy meta l s.
The veh ic l e emiss ions a l so contai n various meta l s wh ich may deposite on the adj oi n i ng roads. These are co l l ected a l ong w i th the street sweepi ng .
8.2 Need for Monitoring of Heavy Metal
Food and Water are the main sources of our dai l y requirement of essen t ia l meta l s. However, at h i gher concentration, trace meta l s becomes tox i c . The tox i c effect of heavy meta l s and their compounds i n excessive amount effects h uman and an i mal s hea l t h . Impact of meta l s on hea l th are gi ven be low :
Table Toxic effect of heavy metals
Heavy Possible Toxic Effect Metals
Cd Problems related to kidney, liver and hypertension. carcin ogenic effects.
Cr Erosion of gastric -intestin al tract with kidney lesions.
Cu Vomiting and li ver damage
Pb Gastro-i ntesti nal disturbances, loss of apetite, fatigue, anemia, motor nerve paraiysis an d encephalopathy, chroni c Pb poisonin g may caus e mental retardation .
Ni Nausea, vomiting, blui sh discoloration of skin, chest p ain , headache and gastritis.
Zn Irritation of gastric mucosa and vomiting.
Hg Chronic alkyl mercury poisoning known as mi namata disease is characterized by neurological
symptoms leading to permanent damage or death. Acute Hg poisoning may cause intense pai n ,
vomitin g and death. Chron ic poisoning due to intoxication o f H g from i ndustrial, agriculture wastes causes stomatit is, colit is, renal damages, loss of appetite, an emia, etc.
CPCB ENVIS Cent�e (www.cpcbenvis . n ic . i n )

Composting i n vo l ves stab i l i zation of the organi c matter wh i l e the i n organi c content do not undergo changes . The organics are mostly of the plant orig in and contain h eavy metal s or trace metal s . It is hence necessary to l ook i nto thei r presence i n plants and to assess the. benefi c ial or adverse effects at differen t concentration of meta l s on the p lants .
Normal ly they are present in l ow concentration , as they are essent ial for the p lant growth . The heavy metal contents in p l ants and so i l varies depending upon the orig inal rock formati on are gi ven below:
Table Concentration of Selected Trace E lement Normally Found in Soil & Plant
Element Concentration in Soil mg/kg Concentration in plant mg/kg
Range Typical value Typical range
As 0. 1 -40 6 0 . 1 -5
Cd 0 . 01 - 7 0.06 0.2-0. 8
Cr 5-3000 JOO 0.2- 1 .0
Cu 2- 1 00 20 2- 1 5
Pb 2-200 JO 0. 1 -JO
Mn 1 00-400 850 1 5-JOO
Ni 1 0-JOOO 40 1 - 1 0
Zn 1 0-300 50 1 5-200
[Ref: - Data pub l i shed by Bowen (l 979) , A l l away (l 968) , Li sk ( 1 972) , Page ( 1 974) & Chapman ( 1 965 )]
Leeper G .W . , ( 1 978), (Managing the heavy meta l s on l and, New York, Marce l Dekkar i nc ) reported that some heavy metal s are tox i c even a t concentration as low as a few ppm. The ever i ncreasi ng amounts of househo ld wastes contai n i n g concentration of t hese pol l utants make the hand l i ng and treatment of these materi a l potentia l l y a hazardous process wh ich must be performed with great care.
9.0 COMPOST ST AND ARDS
9.1 Existing Compost Standards in India
As per Schedule IV of the Mun ic ipal So l id Wastes (Management and Handl ing) Ru les , 2000, i n order to prevent pol lution prob lems from compost p lant and other process ing fac i l i t ies , the fo l l owing standards shal l be comp l ied wi th , name l y: -
The i ncoming wastes at s i te shali be mai n ta ined prior to further process ing . To the extent possi b le , the waste storage area sh�u ld be covered. If, such storage is done i n an open area, i t
9 CPCB ENVIS Centre (www. cpcbenvis . n ic . i n )

shall be provided with i mpermeable base with fac ili ty for co l l ect ion of leachate and surface water run-off i n to l i ned dra ins leading to a leach ate treatment and di sposal fac i l i ty;
Necessary precautions shall be taken to m in imi se nu i sance of odour, flies , rodents , bird menace and fi re hazard;
In case of breakdown or mai n tenance of plant, waste i ntake sha l l be stopped and an-angements be worked out for di vers ion of wastes to the landfi I I si te;
Pre-process and post-process rejects shall be removed from the process ing fac i l i ty on regu lar basi s and shall not be a l l owed to pile at the s i te . Recyc l ables sha ll be routed through appropriate vendors. The non-recyclab les sha l l be sent for well designed l andfill s i te(s) .
In case of compost p l ant , the windrow area sha l l be provided with impermeabl e base . Such a
base shall be made of concrete or compacted clay, 50 cm th ick , havi ng permeabi l i ty coeffic ient l ess than 10-7 cm/sec . The base shall be provi ded wi th l to 2 per cent s l ope and c irc led by l i ned drai ns for co l lect i on of leachate or surface run-off;
Ambient a ir qua l i ty monitori ng shall be regularly carried out particularly for check ing odour nu i sance at down -wind direction on the boundary of process ing plan t .
In order to en sure safe appli cat ion of compost, the following specifi cations for compost qua l i ty shall be met, name ly : -
Parameters Concentration not to exceed * (mg/kg dry basis ,
except pH value and C/N ratio)
Arsenic 1 0.00
Cadmium 5.00
Chromium 50.00
Copper 300.00
Lead 1 00 .00
Mercury 0. 1 5
Nickel 50.00
Zinc 1 000. 00
C/N ratio 20-40
pH 5 .5- 8 .5
* Compost (fi nal product) exceeding the above stated concentration lim i ts shall not be used for food crops. However, i t may be utilized for purposes other than growing food crops.
CPCB ENVIS Centre 1{Qvww.cpcbenvis . n ic . i n )
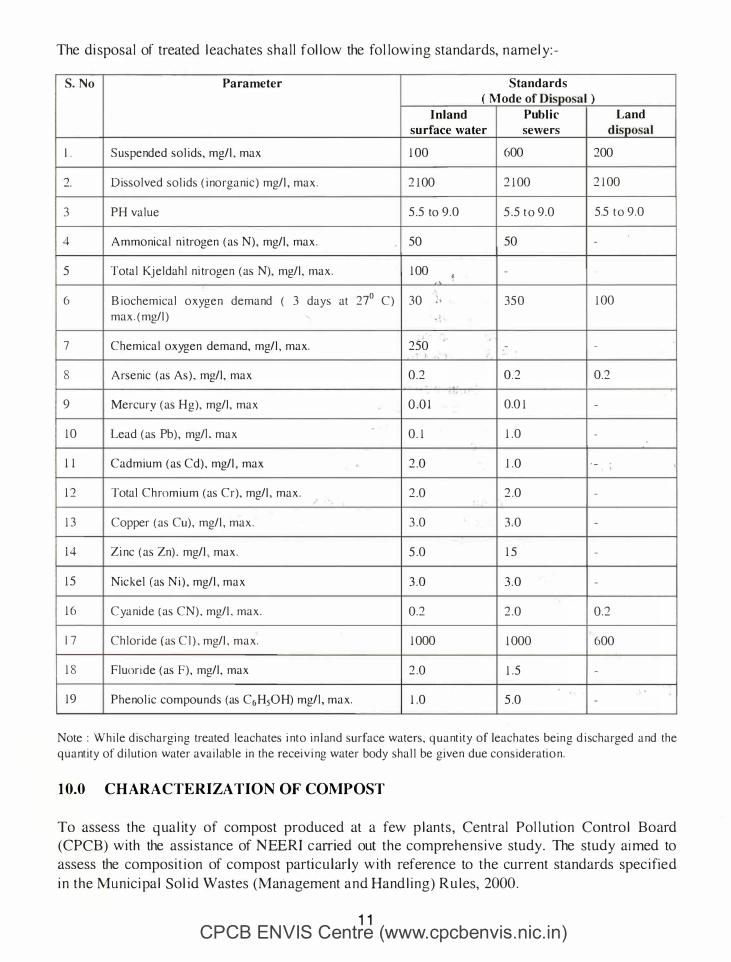
The di sposal of treated l eachates sha l l fol l ow the fo l low ing standards, n amel y :-
S.No Parameter Standards
( Mode of Disposal )
Inland Public Land
surface water sewers disposal
1. Suspended solids, mg/I. max 1 00 600 200
2. Dissolved solids (inorganic) mg/I, max. 2 1 00 2 1 00 2 1 00
3 PH value 5.5 to 9 . 0 5.5 t o 9.0 5.5 to 9.0
4 Ammonical nitrogen (as N), mg/I, max. 50 50 -
5 Total Kjeldahl nitrogen (as N), mg/I, max. 1 00 � -
6 Biochemical oxygen demand ( 3 days at no C) 30 !• 350 1 00 max.(mg/I) l
7 Chemical oxygen demand, mg/I, max. 250 - -
• I
8 Arsenic (as As), mg/I, max 0.2 0 . 2 0.2 .
9 Mercury (as H g), mg/I, max om 0.0 1 -
1 0 Lead (as Pb), mg/L max 0 . 1 1 .0 -
1 1 Cadmium (as Cd). mg/I, max 2.0 1 .0 ·- '
1 2 Total Chromium (as Cr), mg/I, max. 2.0 2 .0 -
1 3 Copper (as Cu), mg/I, max. 3 .0 3 . 0 -
14 Zinc (as Zn). mg/I, max. 5.0 1 5 -
1 5 Nickel (as Ni), mg/I, max 3 .0 3 . 0 -
1 6 Cyanide (as CN). mg/I, max. 0.2 2 .0 0 .2
17 Chloride (as Cl). mg/I, max. 1 000 1 000 600
1 8 Fluoride (as F), mg/I, max 2.0 1 .5 -
·. ·
1 9 Phenolic compounds (as C6H50H) mg/I, max. 1 .0 5.0 -
Note : While dischargin g treated leachates into in land surface waters, quantity of leachates bein g discharged and the
quantity of dilution water available in the receiving water body shall be given due con sideration.
10.0 CHARACTERIZATION OF COMPOST
To assess the qua l ity of compost produced at a few p l ants , Central Pol l ut ion Contro l Board (CPCB) with the assi stance of NEERI carried out the comprehensive study . The study aimed to assess the composi t ion of compost particu larly w i th reference to the current standards spec ified i n the Munic i pa l So l id Wastes (Management and Hand l ing) R u l es, 2000.
11 CPCB ENVIS Centre (www.cpcbenvis . n ic . i n )
Further, the studies carried out mainly focussed on the assessment of heavy metals, particularly to see their presence i n the raw waste that i s fed to the compost plants, and the concentration of the heavy metals i n the final product . To take care of the variation i n the raw waste characteri st ics , food habits , climatic conditions etc . , field v i s i ts were made to various mechan ical composti ng plants set up at different geograph ical locations. V is i ts to these plants were made at different t imes of the year for ascertain ing that the results obtained could help in drawing proper conclusions.
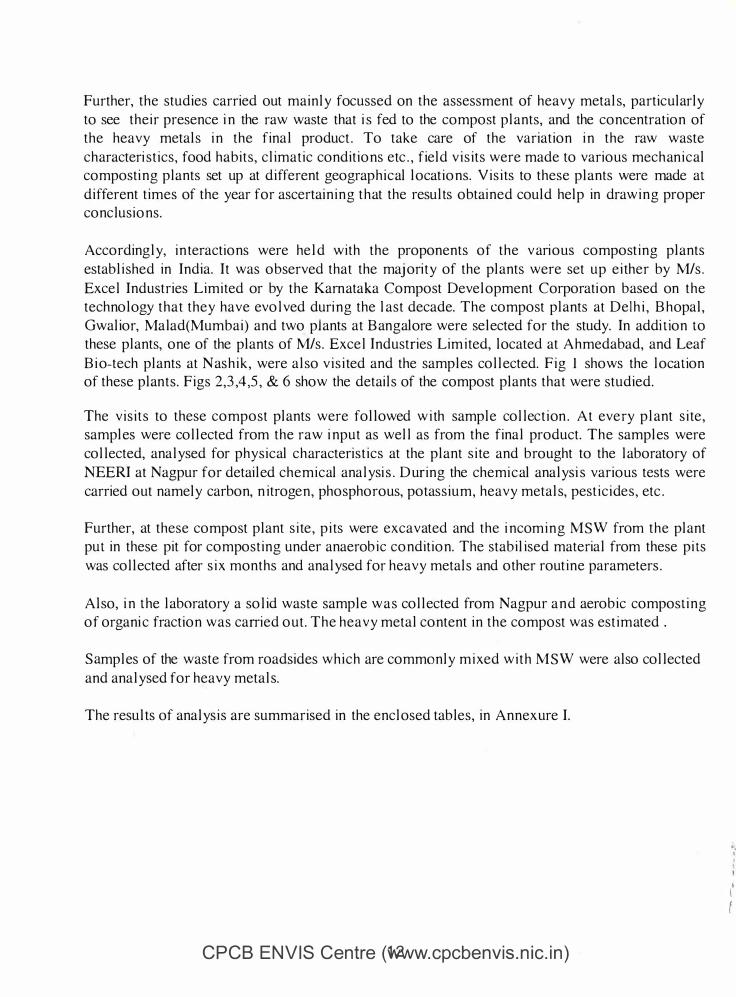
Accordingly, in teractions were held with the proponents of the v arious compost ing plants establi shed in India. It was observed that the majori ty of the plants were set up e i ther by Mis . Excel Industries Limited or by the Kamataka Compost Development Corporation based on the technology that they have evolved during the last decade. The compost plants at Del h i , B hopal, Gwalior, Malad(Mumbai) and two piants at B angalore were selected for the study. In addition to these plants, one of the plants of Mis . Excel Industries Lim i ted, located at Ahmedabad, and Leaf B io-tech plants at Nash ik , were also v i s i ted and the samples collected. F ig l shows the location of these plants . Figs 2 ,3 ,4,5, & 6 show the details of the compost plants that were studied.
The v is i t s to these compost plants were followed w i th sample collect ion . At every plant s i te , samples were collected from the raw i nput as well as from the final product. The samples were collected, analysed for physical characterist ics at the plant s i te and brought to the laboratory of NEERI at Nagpur for detailed chemical analysi s . D uring the chemical analysi s various tests were carried out namely carbon, n itrogen, phosphorous, potass ium, heavy metals, pest ic ides , etc .
Further, at these compost plant s i te , p i ts were excavated and the i ncoming MSW from the plant put in these pit for composting under anaerob ic condition. The stab ilised material from these pits was collected after s i x months and analysed for heavy metals and other rout ine parameters .
Also, i n the laboratory a solid waste sample was collected from Nagpur and aerob ic composting of organi c fraction was carried out . The heavy metal content in the compost was est imated .
Samples of the waste from roadsides wh ich are commonly mixed wi th MSW were also collected and analysed for heavy metals.
The results of analys i s are summarised in the enclosed tables , in Annexure I.
CPCB ENVIS Centre (WWw.cpcbenvis . n ic . i n )
. I l f

Andaman &
Figure 1: Locations of Compost Plants Studied
CPCB ENVIS CentrtS(www. cpcbenvis . n ic . i n )
a ' r-.·.� ..
. " . �' . � - "" ., .
•
'

Figure 2 : Front end loader feeding the fermented waste on the conveyor
Figure 3 : Rotary Screen
CPCB ENVIS Centre1(�ww.cpcbenvis . n ic . i n )
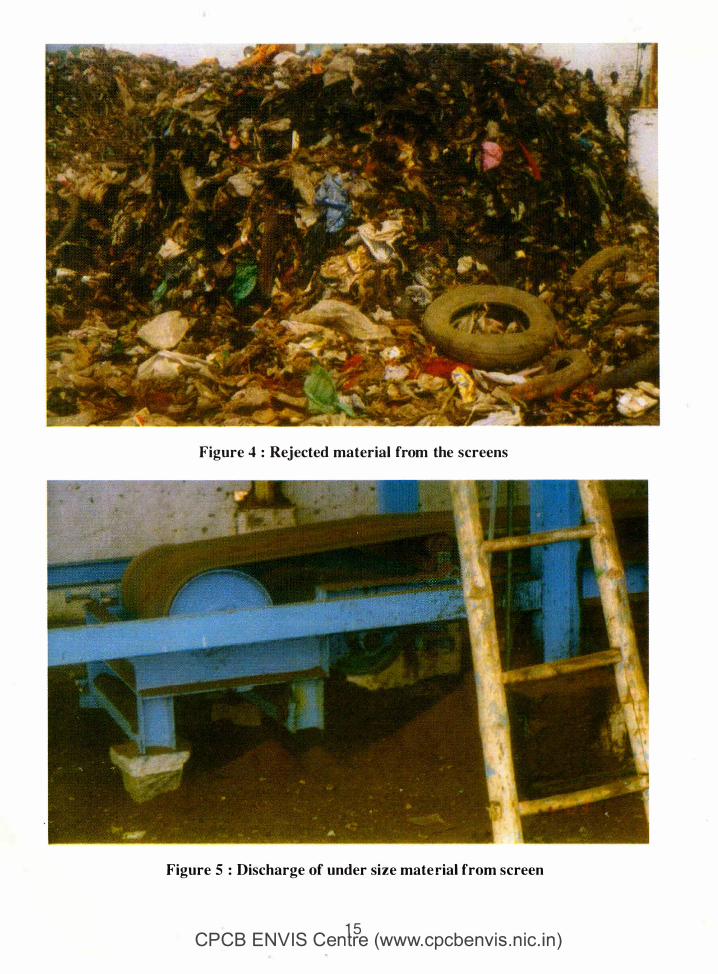
Figure 4 : Rejected material from the screens
Figure 5: Discharge of under size material from screen
CPCB ENVIS Cenlre (www.cpcbenvis . n ic . i n )
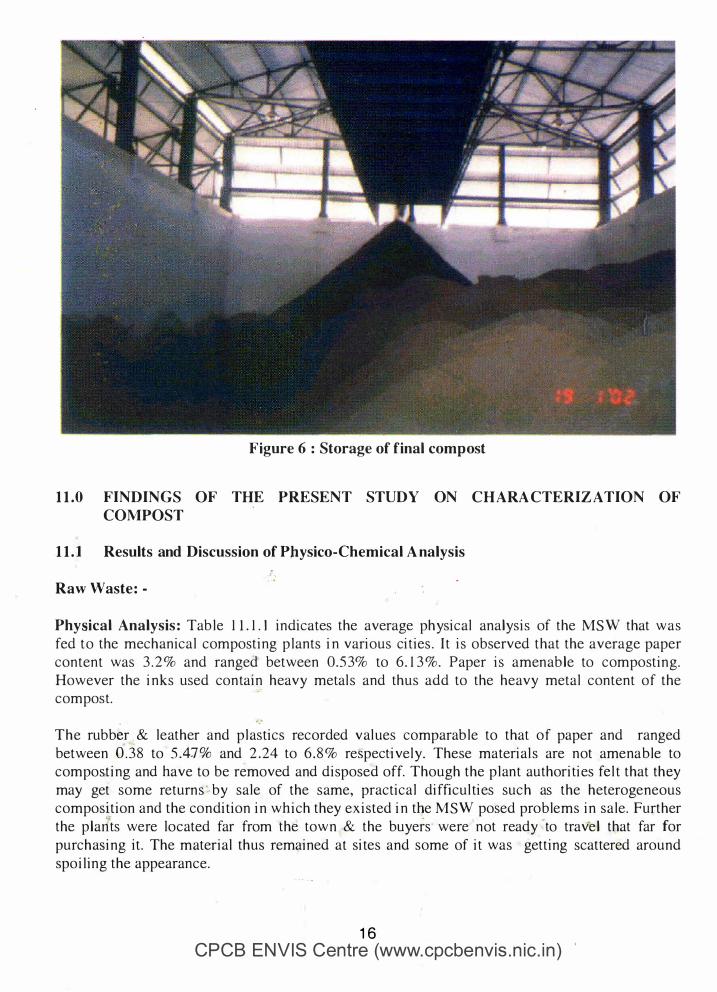
Figure 6 : Storage of final compost
11.0 FINDINGS OF THE PRESENT STUDY ON CHARA CTERIZATION OF COMPOST
11.1 Results and Discussion of P}lysico-Chemical A nalysis
Raw Waste : -
Physical Analysis : Table 1 1 . 1 . I indicates the average physical analysis of the MSW that was fed to the mechanical composting p lants in various cities . It is observed that the average paper content was 3 . 2 % and ranged between 0.5 3% to 6. 1 3 %. Paper is amenable to composting. However the inks used contain heavy metal s and thus add to the heavy metal content of the compost.
The rubber.& leather and p lastics recorded val ues comparable to that of paper and ranged between 0 .38 to 5.47% and 2.24 to 6. 8 % respectively. These material s are not amenable to composting and have to be removed and disposed off. Though the p lant authorities fel t that they may get some returns'-by sale of the same, practica l difficu lties such as the heterogeneous composition and the condition in which they existed in the MSW posed problems in sa le . Further
� - .
the plants were located far from the town & the buyers were not ready to trav·e1 that far for purchasing it. The material thus remained at sites and some of it was getting scattered around spoiling the appearance.
16 CPCB ENVIS Centre (www.cpcbenvis . n ic . i n )

The rags:- Cotton rags can be decomposed but presently the rags are observed to contain a l arge proportion of synthetics , which do not degrade easily and al so tended to j am the moving parts of machines causing various problems.
The average metal content of the waste was only 0.22% and ranged between 0.03% to 0 .75%. Thi s c l early indicated that the meta l s were being extensively recovered and recycled.
The stones , crockery, earthenwares constitute nearly 1 0% of the input waste and since they do not degrade duri ng composting and since they do not add to quality of the final product, they can be easi ly removed and disposed off.
The fines represent an average of 8 .77 and ranged from 2% to 30.79%. These mostly contain ash, earth and fine organic. However, it is difficult to separate these material and heavy rr,etal content of the fines wil l add to the heavy metal content of the compost. The total compostable matter ranged between 44% to 82% which on decomposition yields the final product as humus .
Chemical analysis : Table 1 1 . 1 . 2 contains the average chemical analy?is of the input waste i n various cities .
The table shows that the average pH val ue is 7 . 1 2 and values range between 6.57 to 7 ;64%. The neutral pH indicates that the waste received in the p lants was fresh.
The organic matter on an average was 52 .37% and ranged between 30 .65 to 73 .74%. The organ ic content i n Malad, B angalore and Nashik was more than 50% while that of Bhopal and Ahmedabad was s lightly more than 40% while that of Delhi was very low i .e. 30%.
The average nitrogen content was 0 . 85% and the MSW at Malad, B angalore , Bhopal , Nashik recorded val ues higher than this % while that at Delhi contained 0 .5% only .
The Bhopal waste has a low C/N ratio (i.e .26 .04) while the C/N ratio in al l other p lants is more than 30.
The average values of potash and phosphorus were 0 .64 and 0.8 1 % and ranged betwe.ei;i 0 .42 to 0.76 and 0 .61 to 0.93 respectively.
' ... ';: . .
·.i::
The average moisture content was 50 .79% and ranged between 44.53 to 56. 1 1 %
\ : .·, � >t '
Heavy Metal : Table No. 1 1. 1 . 3 gives the average values of heavy metal in the M�W fed to the various mechanical composting p l ants . The Pb contents ranged from 4 7 to 1 85 mg/kg, wh i l e the n ickel content ranged between 36 to 63 mg/kg and Cd content ranged betwee
.n LS to 6.5 mg/kg.
The Cr content ranged between 7.5 to 1 1 3.5 mg/kg. The Cu.,Zn and Mn recorded comparatively high val ues and the respective ranges are 1 75 to 350, 340 to'
63'0, 30-540 .
·
The Fe content was very high and ranged from 1 0 ,000 to 28 ,000 mg/kg. The Hg content was very l ow and ranged from 0 .0 1 to 0 .23 mg/kg
CPCB ENVIS Centf� (www.cpcbenvis . n ic . i n )
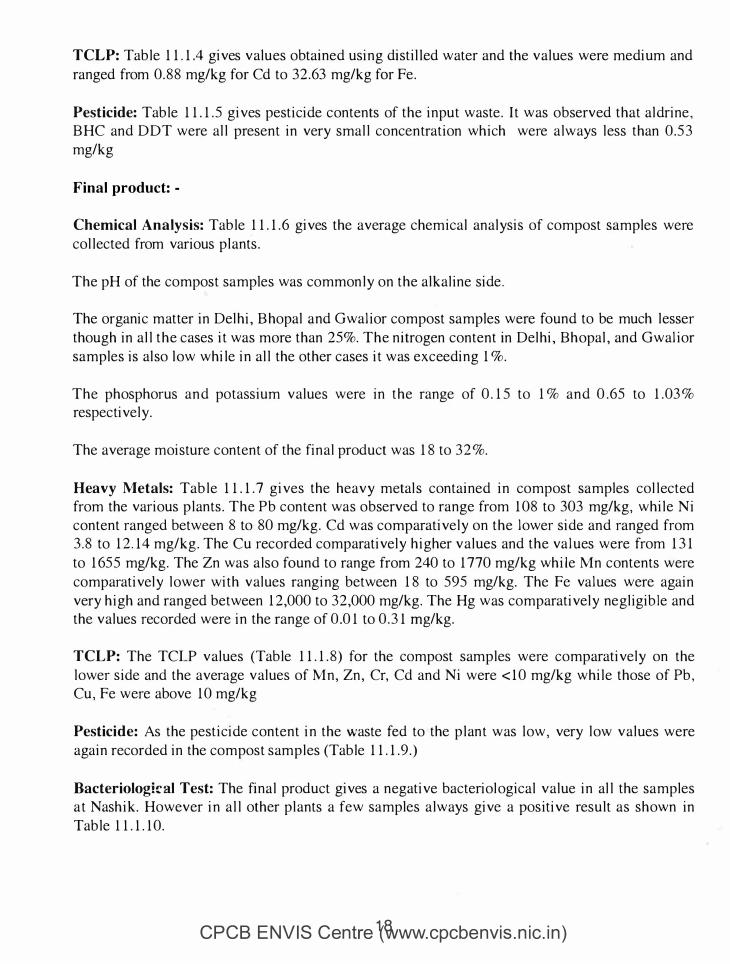
TCLP: Table 1 1 . 1 .4 gives values obtained using distil l ed water and the values were medium and ranged from 0. 88 mg/kg for Cd to 32.63 mg/kg for Fe.
Pesticide: Table 1 1 . 1 .5 gives pesticide contents of the input waste. It was observed that aldrine , B HC and DDT were al l present in very smal l concentration which were always less than 0.53 mg/kg
Final product: -
Chemical Analysis: Table 1 1 . 1 . 6 gives the average chemical analysis of compost samples were col lected from various pl ants.
The pH of the compost samples was common ly on the alkaline side .
The organic matter in Delhi, Bhopal and Gwalior compost samples were found to be much lesser though in al l the cases it was more than 25%. The nitrogen content in Delhi, Bhopal , and Gwalior samples is al so l ow while in al l the other cases it was exceeding 1 %.
The phosphorus an d potassium values were in the range of 0. 1 5 to 1 % and 0 .65 to 1 .03 % respectively.
The average moisture content of the final product was 1 8 to 32%.
Heavy Metals: Table 1 1 . 1 . 7 gives the heavy metal s contained in compost samples col lected from the various p lants . The Pb content was observed to range from 1 08 to 303 mg/kg, while Ni content ranged between 8 to 80 mg/kg. Cd was comparatively on the lower side and ranged from 3.8 to 1 2. 14 mg/kg. The Cu recorded comparatively higher values and the values were from 1 3 1 to 1 655 mg/kg. The Zn was also found to range from 240 to 1 770 mg/kg while Mn contents were comparatively lower with values ranging between 1 8 to 595 mg/kg. The Fe values were again very high and ranged between 1 2,000 to 32,000 mg/kg. The Hg was comparatively negligible and the values recorded were in the range of 0.0 1 to 0.3 1 mg/kg.
TCLP: The TCLP values (Table 1 1 . 1 . 8) for the compost samples were comparatively on the lower side and the average values of Mn, Zn , Cr, Cd and Ni were < 1 0 mg/kg while those of Pb, Cu, Fe were above 1 0 mg/kg
Pesticide: As the pesticide content in the waste fed to the p lant was low, very low values were again recorded in the compost samples (Table 1 1 . 1 .9.)
Bacteriologkal Test: The final product gives a negative bacteriol ogical value in al l the samples at Nashik. However in a l l other p lants a few samples always give a positive result as shown in Table 1 1 . 1 . 1 0.
CPCB ENVIS Centre '�ww.cpcbenvis . n ic . i n )
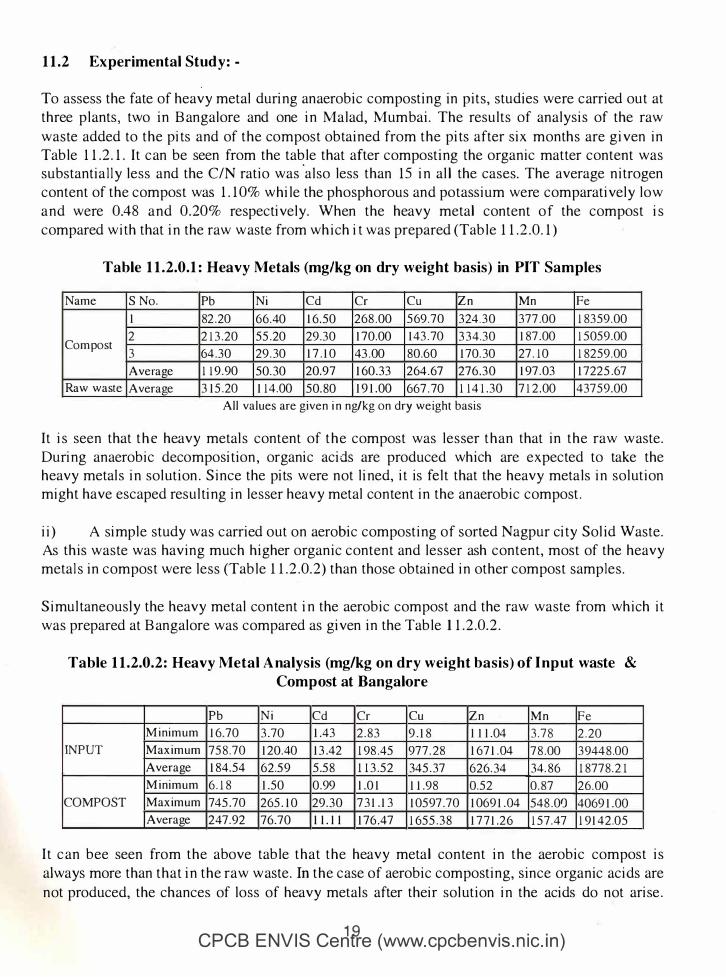
11.2 Experimental Study: -
To assess the fate of heavy metal during anaerobic composting in pits, studies were carried out at three p lants, two in B angalore and one in Malad, Mumbai. The results of analysis of the raw waste added to the pits and of the compost obtained from the pits after six months are given in Table 1 1 .2. 1 . It can be seen from the table that after composting the organic matter content was substantia l l y less and the C/N ratio was
'al so less than 15 in all the cases. The average nitrogen
content of the compost was 1 . 1 0% while the phosphorous and potassium were comparatively low and were 0.48 and 0 .20% respectively. When the heavy metal content of the compost is compared with that in the raw waste from which it was prepared (Table 1 1 .2 .0 . 1 )
Table 11.2.0.1: Heavy Metals (mg/kg on dry weight basis) in PIT Samples
Name S No. Pb Ni Cd Cr Cu Zn Mn Fe
1 82.20 66.40 1 6 .50 268 .00 569 . 7 0 324 . 3 0 377 .00 1 8359 . 00
Compost 2 2 1 3.20 55.20 29.30 1 70.00 1 43.70 3 3 4 .30 1 87 .00 1 5059.00
3 64.30 29.30 1 7.1 0 43 .00 80.60 1 70.30 27 . 1 0 1 8259.00
Average 1 1 9.90 50.30 20.97 1 60.33 264.67 276 . 3 0 1 97.03 1 7225.67
Raw waste Average 3 1 5.20 1 1 4.00 50.80 1 9 1 .00 667.70 1 1 4 1 . 30 7 1 2. 00 43759 . 00
All values are given i n ng/kg on dry weight basis
It is seen that the heavy metal s content of the compost was lesser than that in the raw waste . During anaerobic decomposition , organic acids are produced which are expected to take the heavy metal s in sol ution . Since the pits were not lined, it is felt that the heavy meta ls in solution might have escaped resulting in lesser heavy metal content in the anaerobic compost.
ii) A simple study was carried out on aerobic composting of sorted Nagpur city Sol id Waste . As this waste was having much higher organic content and lesser ash content, most of the heavy metal s in compost were less (Table 1 1 .2 .0 .2) than those obtained in other compost samples .
Simultaneously the heavy metal content in the aerobic compost and the raw waste from which it was prepared at B angalore was compared as given in the Table 1 1 .2.0.2.
Table 11.2.0.2: Heavy Metal A nalysis (mg/kg on dry weight basis) of I nput waste &
Compost at Bangalore
Pb Ni Cd Cr Cu Zn Mn Fe
Minimum 1 6.70 3 .70 1 .43 2.8 3 9 . 1 8 1 1 1 .04 3.7 8 2.20
INPUT Maximum 758 .70 I 20.40 I 3 .42 I98.45 977.28 I 67 1 .04 7 8.00 3 944 8 .00
Average I 84.54 62.59 5.58 l I 3.52 345.37 626.34 34.86 I877 8.2I
Minimum 6 . 1 8 1 .50 0.99 l . O I I 1 .98 0.52 0.87 26 . 00
COMPOST Maximum 745.70 265. I O 29. 3 0 7 3 1 .l 3 1 0597 .70 1 069 1 . 04 548.0fJ 4069 1 .00
Average 247.92 76.70 I I .I I I 76 .47 1 655.3 8 I 7 7 1 .26 1 57.47 1 9 I 42.05
It c an bee seen from the above table that the heavy metal content in the aerobic compost is always more than that in the raw waste . In the case of aerobic composting, since organic acids are not produced, the chances of loss of heavy metal s after their sol ution in the acids do not arise.
CPCB ENVIS Cerltte (www. cpcbenvis . n ic . i n )
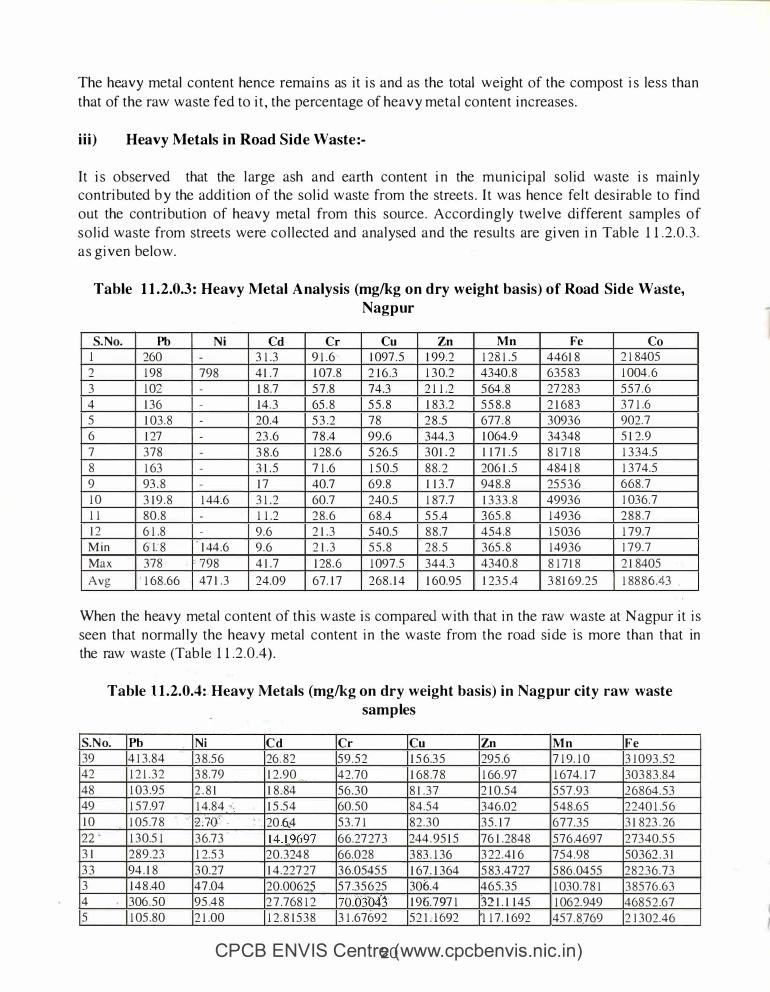
The heavy metal content hence remains as it is and as the total weight of the compost i s less than that of the raw waste fed to it , the percentage of heavy metal content increases .
i i i ) Heavy Metals in Road Side Waste :-
It is observed that the l arge ash and earth content in the municipal solid waste is main ly contributed by the addition of the solid waste from the streets . It was hence felt desirable to find out the contribution of heavy metal from this source. Accordingly twelve different samples of so l id waste from streets were co l l ected and analysed and the results are given in Table 1 1 . 2 .0 . 3 . a s given below.
Table 11.2.0.3: Heavy Metal A nalysis (mg/kg on dry weight basis) of Road Side Waste,
Nagpur
S.No. Pb Ni Cd Cr Cu Zn Mn Fe Co l 260 - 3 1 .3 9 1 . 6 1 097 . 5 1 99.2 1 2 8 1 .5 4461 8 2 1 8405
2 1 98 798 4 1 .7 1 07 . 8 2 1 6 .3 1 3 0.2 4340 . 8 635 83 1 004 . 6 3 1 02 - 1 8 .7 5 7 .8 74.3 2 1 1 .2 5 64 . 8 27 2 8 3 5 5 7 . 6 4 1 36 - 1 4 . 3 65 . 8 5 5 . 8 1 8 3 .2 5 5 8 . 8 2 1 68 3 3 7 1 .6 5 1 03 . 8 - 20.4 5 3 .2 7 8 2 8 .5 677 . 8 3 093 6 902 .7 6 1 27 - 23 .6 7 8 .4 9 9 . 6 344 . 3 1 064.9 34348 5 1 2 . 9 7 3 7 8 - 3 8 .6 1 28 . 6 5 26.5 3 0 1 . 2 1 1 7 1 . 5 8 1 7 1 8 1 3 3 4.5 8 1 63 - 3 1 . 5 7 1 .6 1 5 0.5 8 8 . 2 206 1 . 5 4 84 1 8 1 3 74.5 9 93 . 8 - 1 7 40.7 69 .8 1 1 3 .7 94 8 . 8 25 5 3 6 6 6 8 . 7 1 0 3 1 9 . 8 1 44.6 3 1 . 2 60.7 240.5 1 8 7 .7 1 3 3 3 . 8 4993 6 1 036 .7 1 1 8 0 . 8 - 1 1 .2 2 8 . 6 6 8 .4 5 5 .4 3 65 . 8 1 4936 2 8 8 .7 1 2 6 1 .8 - 9 . 6 2 1 .3 5 40.5 8 8 .7 454 .8 1 5 03 6 1 7 9.7 Min 6 1. 8 1 44.6 9 . 6 2 1 . 3 5 5 . 8 2 8 . 5 3 65 . 8 1 4936 1 7 9 . 7 Max 378 . . 798 4 1 .7 1 28 . 6 1 097 .5 344.3 4340.8 8 1 7 1 8 2 1 8405
Avg ' 1 68 .66 47 1 . 3 24.09 67 . 1 7 268 . 1 4 1 60.95 1 23 5 .4 3 8 1 69.25 1 88 86 .43 .
When the heavy metal content of this waste is compareu with that i n the raw waste at Nagpur it i s seen that normal ly the heavy metal content i n the waste from the road side is more than that in the raw waste (Table 1 1 .2 .0 .4) .
Table 1 1.2.0.4:. Heavy Metals (mg/kg on dry weight basis) in Nagpur city raw waste
samples
S.No. Pb Ni Cd Cr Cu Zn Mn Fe 39 4 1 3 . 8 4 3 8 .5 6 26 . 82 5 9 . 5 2 1 5 6.3 5 295 .6 7 1 9. 1 0 3 1 093 .52 42 1 2 1 . 3 2 3 8 .79 1 2 .90 42.70 1 68 .7 8 1 66 . 97 1 674. 1 7 303 8 3 .84 48 1 03 .95 2 . 8 1 1 8 :84 56 .30 8 1 . 3 7 2 1 0 .54 5 5 7 .93 2 6 8 64 . 5 3 49 1 5 7 .97 1 4.84 . 1 5 .5 4 60. 50 84.54 346.02 5 4 8 .65 2240 1 .5 6 1 0 1 05 .7 8 z ;7o· . 20 6.4 5 3 . 7 1 8 2 . 3 0 3 5 . 1 7 6 7 7 . 3 5 3 1 823 . 26 22 . 1 3 0.5 1 3 6.7 3 1 4 . l.9697 6 6 .27 27 3 244 . 95 1 5 76 1 .2848 5 7 6 .4697 273 40.5 5 3 1 2 8 9 .23 1 2 .5 3 2 0 . 324 8 66.028 3 83 . 1 36 3 22 . 4 1 6 754 .98 50362 . 3 1 3 3 94 . 1 8 3 0.27 1 4 .227 27 3 6.0545 5 1 67 . 1 364 5 83 .4727 5 86 . 0455 2 8 2 3 6 . 7 3 3 1 4 8 .40 47 .04 20.00625 5 7 .3 5 6 25 306.4 4 6 5 . 3 5 1 030.7 8 1 3 8576 .63 4 306 . 5 0 95 .4 8 2 7 .768 1 2 70.CY3'043· 1 96.7 97 1
'32 1 . 1 1 45 1 062.949 468 5 2 .67 5 1 05 .80 2 1 .00 1 2 . 8 1 5 3 8 3 1 .67692 5 2 1 . 1 692 '1 1 7 . 1 692 45 7 . 8,769 2 1 3 02.46
CPCB ENVIS CentrfJqwww.cpcbenvis . n ic . i n )
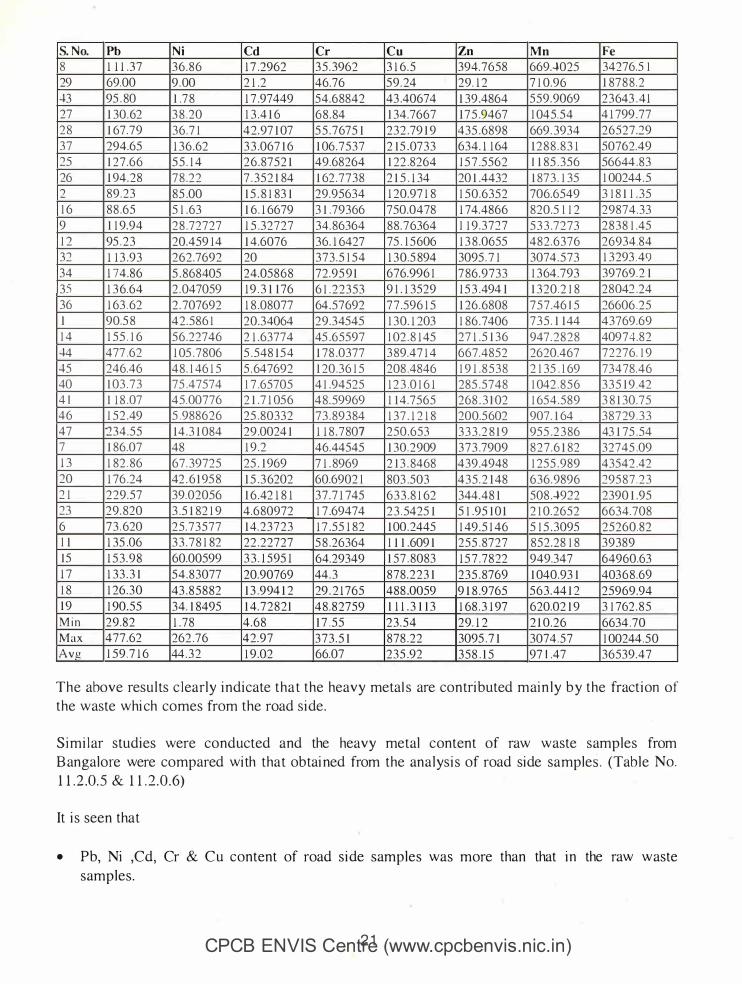
S.No. Pb Ni Cd Cr Cu Zn Mn Fe 8 1 1 1 . 3 7 3 6 . 8 6 1 7 .2962 3 S . 3962 3 1 6 . S 394. 76S8 669...l02S 34276.S l 29 69.00 9 . 00 2 1 .2 46.76 S 9 . 24 29 . 1 2 7 1 0 .96 1 87 8 8 . 2 -l3 9S . 80 1 .7 8 1 7 .97449 S4 .6 8842 43 .40674 1 39 .4864 S S 9 .9069 2 3 643 . 4 1 27 1 30 . 62 3 8 .20 1 3 .4 1 6 6 8 . 84 1 34.7667 1 7 S .9467 1 04 S . S 4 4 1 799 .77 2 8 1 67 . 7 9 3 6 . 7 1 42 .97 1 07 S S . 7 67S I 2 3 2 .79 1 9 43S .6898 669 . 3934 26S27 .29 3 7 294.6S 1 3 6 . 62 3 3 .067 1 6 1 06 . 7 S 3 7 2 I S .07 3 3 634. 1 1 64 1 2 8 8 . 8 3 1 S0762.49 2S 1 2 7 . 6 6 S S . 1 4 2 6 . 87 S 2 1 49.68264 1 22 .8264 I S 7 .SS62 l l 8S . 3 S 6 S6644 . 8 3 26 1 94 . 2 8 7 8 .22 7 . 3S 2 1 84 1 62 . 7 7 3 8 2 1 S . 1 34 20 1 .4432 1 87 3 . 1 3S 1 00244 . S 2 89 .23 8S .OO I S . 8 1 83 1 29.9S634 1 20.97 1 8 I S 0 .63S2 706.6S49 3 1 8 1 1 . 3S 1 6 8 8 .6S s 1 .63 1 6 . 1 6679 3 1 .79366 7S0.0478 1 74.4866 820.S 1 1 2 29874 .33 9 1 1 9.94 2 8 .72727 I S .32727 34. 86364 8 8 . 7 6364 1 1 9 . 3 7 2 7 S 3 3 .7 2 7 3 2 8 3 8 I AS 1 2 9S . 2 3 20.4S9 l 4 1 4 .6076 36 . 1 6427 7S . I S 606 1 3 8 .06SS 482 .6376 26934.84 32 1 1 3 .93 262 .7692 20 3 7 3 . S I S 4 1 3 0 .S 894 309S . 7 I 3074 . S 7 3 1 3 293 .49 34 1 74 .86 S . 86840S 24.0S 8 6 8 72 .9S 9 l 676.996 1 7 86 . 9 7 3 3 1 3 64 .793 39769 . 2 1 35 1 3 6 .64 2 . 0470S9 1 9 . 3 1 1 76 6 1 . 2 2 3 S 3 9 l . 1 3S29 I S 3 .494 1 1 3 20 .2 1 8 2 8 042 .24 36 1 63 . 62 2 . 707692 1 8 .08077 64 .S7692 7 7 .S96 1 S 1 26 . 6808 7 S 7 .46 1 S 26606 .2S I 90.5 8 4 2 . S 8 6 1 20 .34064 29 .34S4S 1 3 0. 1 203 1 86 . 7406 7 3 S . I 1 44 43769.69 1 4 l S S . 1 6 S 6 .22746 2 1 .63774 4S .6SS97 1 02 . 8 1 4S 27 1 . S 1 3 6 947 . 2 8 2 8 40974 .82 -l4 477 .62 I OS . 7 806 S . S48 1 S 4 1 7 8 .0377 3 89.47 1 4 667.48S2 2620.467 72276. 1 9 -is 246.46 4 8 . l 46 1 S S . 647692 1 20 . 3 6 1 S 208 .4846 l 9 I . 8 S 3 8 2 l 3S . 1 69 734 78 .46 40 1 03 . 7 3 7S .47S74 I 7 .6S70S 4 1 .94S2S 1 2 3 .0 1 6 1 28S .S748 1 042 . 8 S 6 3 3 S l 9 .42 4 1 1 1 8 .07 4S .00776 2 1 .7 1 0S 6 4 8 . S9969 I 1 4 .7S6S 268 . 3 1 02 1 6S 4 . S 8 9 3 8 1 30 .7S 4 6 I S 2 .49 S . 988626 2S .80332 7 3 . 89 3 84 1 3 7 . 1 2 1 8 200.S 602 907 . 1 64 3 8 7 29 . 3 3 47 234 .SS 1 4 . 3 1 084 29 .0024 1 1 1 8 . 7 807 2S0.6S3 3 3 3 .2 8 1 9 9S S .2 3 86 43 I 7S .S4 7 1 86.07 48 1 9 .2 46.44S4S 1 30 .2909 3 7 3 .7909 8 2 7 . 6 1 82 3274S .09 1 3 1 82 . 86 67 . 3972S 2S . 1 969 7 1 . 8969 2 1 3 . 8468 439 .4948 1 2S S .989 43S42 .42 20 1 76 .24 42 . 6 1 9S 8 I S . 3 6202 60.6902 1 803 .S03 4 3 S . 2 1 48 636 . 9896 29S 8 7 . 2 3 2 1 229 .S7 39.020S6 1 6 .42 1 8 1 3 7 . 7 1 74S 6 3 3 . 8 1 62 344.48 1 S08 ...l922 2390 1 .9S 23 29 . 820 3 .S l 82 1 9 4 .6 80972 1 7 .69474 2 3 . S42S I S l .9S l 0 1 2 1 0 .26S2 6634.708 6 7 3 . 620 2 S . 7 3 S 7 7 1 4 . 2 3 7 2 3 1 7 .SS 1 82 I 00 .244S l 49 . S l 46 s I S . 3095 2S260.82 1 1 1 35 .06 3 3 . 7 8 1 82 22 .22727 S 8 .26364 1 1 1 .609 1 2SS . 8727 8S2 .28 l 8 39389 IS I S 3 . 9 8 60.00S99 3 3 . I S 9S I 64.29349 I S 7 . 8083 1 S 7 . 7 8 22 949.347 64960.63 1 7 1 3 3 . 3 1 S 4 . 8 3077 20.90769 44 . 3 8 7 8 . 2 2 3 1 2 3 S . 8769 1 040.93 1 403 6 8 .69 1 8 1 26 . 3 0 43 . 8 S 8 82 1 3 .994 1 2 29 . 2 1 76S 488 .00S9 9 1 8 .976S S 6 3 . 44 l 2 2S969.94 1 9 1 90 .SS 34 . 1 849S 1 4. 7 2 8 2 1 4 8 . 8 27S9 1 1 1 . 3 1 1 3 1 68 . 3 1 97 620.02 1 9 3 I 762 . 8 S M i n 2 9 . 8 2 1 . 7 8 4 . 6 8 1 7 . S S 2 3 . S 4 29. 1 2 2 1 0 .26 6634 .70 Max 477 .62 262 .76 42 .97 3 7 3 . S I 8 7 8 .22 309S . 7 1 3074 . S 7 1 00244 . S O Av_g I S 9 . 7 1 6 44 . 3 2 1 9 .02 66.07 2 3 S .92 3 S 8 . I S 97 1 .47 36S39.47
The above results c learly indicate that the heavy metal s are contributed main ly by the fraction of the waste which comes from the road side .
Si mil ar studies were conducted and the heavy metal content of raw waste samples from B angalore were compared with that obtained from the analysis of road side samples . (Table No. 1 1 .2.0.5 & 1 1 .2 .0 .6)
It is seen that
• Pb, Ni ,Cd, Cr & Cu content of road side samples was more than that m the raw waste samples .
CPCB ENVIS Centfe (www.cpcbenvis . n ic . i n )

• Zn, Mn & Fe content of raw waste samples is more than that in the road side samples .
• Thus, it is seen that the road s ide waste samples contained a much higher concentration of Pb, N i , Cd, Cr & Cu .
Table 1 1.2.0. 5 : Road side waste samples (mg/kg on d ry weight basis) from Bangalore
Pb Ni Cd Cr Cu Zn M n Fe B l 304.5 74.6 9 . 8 67 1 47 . 2 5 34 1 . 6 1 5 2 . 2 5 1 96 7 . 3 8 2 345 . 2 1 84.66 1 0 .22 89 .65 544 . 2 8 505 .45 6 8 . 3 2 2 22 1 1 8 3 245 . 2 1 93 . 2 1 5 . 6 3 7 8 .54 487 . 3 2 648 . 69 54.63 1 8 8 9 8 8 4 320. 7 1 54.4 1 4 .25 59 .22 446.25 5 8 9 . 5 8 2 1 . 7 8 1 5963 8 5 476 .33 1 20.25 1 7 . 8 1 59 .26 3 1 2 .25 5 5 8 . 2 44.69 2 2 8 8 8 8 6 506.89 49.25 1 5 .2 1 8 8 . 2 8 24 1 . 85 545 . 7 6 3 9 . 2 5 24877
Average 366.47 79 .39 1 0.48 7 3 .65 363 .20 5 3 1 . 5 4 6 3 .4 8 1 7 800.72
Range 245-506 49- 1 20 4- 1 7 . 8 1 59-89 1 4-544 34 1 -648 2 1 - 1 52 1 967-2 2 8 8 8
Table 11.2.0.6: Raw waste samples (mg/kg on d ry weight basis) from Bangalore
S . No. Pb Ni Cd Cr C u
I 460.70 40. 1 0 6 .45 2 1 .5 3 3 6 8 . 2 8
2 677 .70 1 1 5 . 1 0 1 2 .4 1 1 84 . 3 3 7 3 6 . 2 8
3 1 25 . 70 2 7 . 1 0 7 . 05 2 8 .43 40. 1 8
4 1 2 1 . 70 24. 1 0 5 .05 2 3 . 3 7 4 1 . 1 3
Average 346.45 5 1 .6 7 . 74 64.4 1 5 296.4675
Range 1 22-678 24- 1 1 5 5 - 1 2 2 1 - 1 84 40-736
1 1.3 Operation & Maintenance of Compost Plants
Zn Mn Fe
1 3 3 1 .04 1 60 .87 429 1
1 34 1 .04 1 00. 2 1 2229 1
2 8 5 .04 34 .25 630 1
275 .04 9 8 . 3 2 599 1
808 .04 9 8 . 4 1 97 1 8 . 5
275- 1 34 1 34- 1 6 1 429 1 -2229 1
Munici pal solid waste has a l arge organic and moisture content. At the higher ambient temperatures, the organics in the presence of high moisture content stai1 decomposing at a rapid rate and whenever the maintenance of the mechanical equipment is not regul arly canied out , the mechanical parts are observed to get corroded quickly. The mechanical compost p lant are normal ly l ocated outside the city and the experienced manpower is not readily avai l able and i s often reluctant to work i n waste processing p lant. On ly un skil l ed persons were observed to be employed which resulted in poor maintenance and corrosion was observed to be a common problem .
It was common ly observed that the waste that was received at the compost p lant was not on ly from the identified areas generating organic waste but, the plant had to process "as received" waste . Thi s resulted in production of compost, which did not contain the nutrients as much as envi saged while setting up of the p lant. Consequently the farmers were not ready to pay the high price which was desired by compost p lant operators . However, the plant operators had to fi x a higher sale pri ce partly because a l arge proportion of input material was being rejected and al so pa11ly due to the high capital and operating cost of the p l ant. It may be mentioned that maj ori ty of the p l ants were provided with a sophisticated mechanism for the packi ng of compost i nvo l ving l arge capita l and running expenses .
CPCB ENVIS Centre (Ja,w.cpcbenvis . n ic . i n )

It was a l so observed that the p lant authorities in order to reduce the cost were not turning the windrows at the desi red frequency to save on diesel and operating cost. Since the windrows were not regul arly turned some of them became anaerobi c reducing the qual i ty of the compost.
The openings of the l arge rotating trommel screen were observed to get quick ly c logged main ly because of the tendency of the wet input materi al to stick to the screen . The rotating screens had to be frequently stopped and the c logging manua l ly removed by a l abour working inside the trommel . Thus the efficiency of the units was reduced.
In al l the p l ants that were visited, it was observed that the required quantity of the organi c i nput material was not avai lable and the quantity processed was l esser than the design capacity . Thi s resulted in production of l esser quantity of the compost . It was a l so noticed that due to the improper quality of input material the quality of the compost produced was not as desi red . The i nferior qual i ty of the compost resulted in l esser sale of the produced compost.
In a majority of the compost p l ants, the produced compost is being marketed by the some outside agencies. As the p lants do not have their own marketing arrangement they tend to depend on the agencies which are responsible for marketing of the compost. Hence the amount sold depends on the decision of the marketing agencies . A lso, the sale price fi xed in consultati on with the marketing agencies, seems to be on the higher side.
The farmers are habi tuated to use farm-yard manure but need to be convinced the benefits of using compost prepared from Municipal solid waste . As no effort is being made to convince the farmers through demonstration farms and explanatory l ectures, the compost was not being readily purchased by the farmers. It was hence common ly observed that l arge stocks of compost remai ned unso ld .
The subsidy provided by the Government for the transport of compost by rail requi res fi l l i ng of various proformae, which appears to be time consuming process . It is fel t that a simpler procedure may be evolved as in the c ase of subsi dy to chemical ferti lizers .
12.0 SUMMA RY & CONCLUSIONS
A total of seven p lants located al l over the country and represented van at1ons in the factors affecting the various waste characteristics were studied. During several vi sits to these p lants, a number of samples of the raw waste that was fed to the p lant as wel l as the compost that was produced in the p lants were col l ected and after processing analysed for the various physi ca l , chemical characteri stics and heavy metal s .
The average val ues of heavy metal s in the raw waste that was fed to the various composti ng plants indi cated that the Pb ranged from 47 to 1 85 mg/kg, Ni between 36 and 63 mg/kg and Cd between 1 .5 and 6.5 mg/kg. The Cr w as observed to range between 7.5 and 1 1 3 .5 mg/kg . The Cu,
.Zn , Fe & Mn recorded comparatively higher val ues, which ranged between 1 75 and 350, 340 and 630 , 1 0000 and 28000 & 30 and 540 respectively . The Hg content was very low and ranged between 0.0 1 and 0 .23 mg/kg.
CPCB ENVIS Centr�3(www.cpcbenvis . n ic . i n )
The heavy metal content in the compost samples co l lected from various p lants indicated Pb to range between 1 0 8 and 303 mg/kg while Ni & Cd ranged between 8 and 80 mg/kg and 3 . 8 and 1 2. 1 4 mg/kg respectively. The Cu recorded comparatively higher values and ranged between 1 3 1 and 1 655 mg/kg. The Zn & Mn val ues ranged between 240 and 1 770 and 1 8 and 595 mg/kg respectively. The Fe content was agai n very high and ranged between 1 2000 and 32000 mg/kg . The Hg content was very low and ranged between 0 .0 l and 0 . 3 1 mg/kg.
When these values are compared with the permissible values of different heavy metal s spec ified in the MSW rules, it is observed that the heavy metal s in samples from some cities were within l imits whi le some samples exceeded the limits .
The organic content of municipal solid waste i s main ly of p lant origin and since the heavy metal content in p lants common ly consumed as foods is normal ly within limits it was felt that the heavy metal content in the compost can be kept within l imits when only organic waste materi a l of p l ant origin is fed to the p lant. In · such a case the waste from the road sweeping can be separately col l ected and disposed off. Accordingly the samples of roadside waste were co l lected both from Nagpur and B angalore and analysed for the various heavy metal s . The results indicated that the heavy metal content in the roadside waste is much higher than the heavy metal content in the raw waste . It is therefore , suggested that the compost p l ants be fed on ly source separated organic waste to ensure· that heavy metal s in the compost are within l imi ts .
'
The studies were al so conducted to find out the heavy metal contents of aerobic and anaerobic compost. It was observed that the heavy metal content of aerobic compost was a lways higher than that of anaerobic compost. It is felt that during anaerobic composti ng, the organ i c ac i ds that are produced might be taking the heavy metal s in sol ution and since the compost pits were unlined it was escaping to the ground.
CPCB ENVIS Centre (w�w.cpcbenvis . n ic . i n )

Amz exure - I
Table No. 1 1 . 1 . 1 Average Values of Physical A nalysis (Input waste)
Parameters
Paper Rubber Plastic Rag Wood Metals Coconut Crockery Earthen Total Fines Name o f & shell Wares, compost
City Leather Stones able '-
and matter Bricks
Bangalore 6 . 1 3 0 . 3 8 2 . 24 2 . 67 0 . 5 8 0.03 0.48 0.0 1 0 .97 8 2. 1 1 4 . 3 9
Malad 5 . 48 0.95 2 .92 2 . 93 1 . 89 0.07 0.9 1 0.05 1 . 1 6 80 .76 2 . 89 I Delhi 2 . 8 8 2 .22 6 . 8 1 6 . 0 1 3 .42 0 .75 0 .39 0 .63 1 . 74 44 . 3 6 30.79
Bhopal 2 .99 0.63 4.92 2 .4 1 1 . 9 1 0.07 0 . 06 0.00 5 . 5 7 7 6 . 8 7 4 . 5 6
Nashik 0 . 5 3 2 . 7 7 3 . 30 0.60 0.00 0. 1 3 5 .2 8 0 . 3 8 9 . 08 7 5 . 9 3 2 .00
Ahmedabad 1 . 1 9 5 .47 5 . 2 8 5 . 5 8 I.OJ 0.24 5 .48 1 . 1 2 3 .29 6 3 . 3 6 8 .00
Min imum 0 . 5 3 0 . 3 8 2 . 24 0.60 0.00 0.03 0.06 0.00 0.97 44 . 3 6 2 . 00
Maxi mum 6 . 1 3 5 .47 6 . 8 1 6 . 0 1 3 .42 0 .75 5 .48 1 . 1 2 9 . 08 8 2 . 1 1 30 .79
Average 3 .20 2 . 07 4 . 25 3 . 3 7 1 .47 0 .22 2 . 1 0 0 .37 3 . 64 70 .57 8 .77
The values are in percentage on wet weight basi s .
Table No. 1 1 . 1 .2 Average Values of Chemical A nalysis (Input Waste)
Name of Parameters
City pH 0 . M . % Co/o N o/o C/N K10o/o P20s % Moistur e %
B angalore 7 . 07 5 9 . 3 5 3 2 . 97 0.9 1 3 7 . 04 0 . 64 0. 8 1 44 . 5 3
Malad 6 . 5 7 65 .69 3 6 . 9 3 1 .06 3 5 . 47 0.67 0 . 8 8 5 3 .63
D e l h i 7 . 27 30.65 1 7 .02 0.50 36.03 0 . 64 0 .93 5 1 . 74
B hopal 7 . 64 4 1 .07 22. 8 1 0 . 8 9 26.04 0.42 0 . 6 1 56 . l l
Nashik 7 . 20 7 3 . 74 40.97 0 . 9 1 45 .07 0.70 0 . 8 2 48 .00
Ahmedabad 6.94 4 3 . 70 24.28 0. 8 1 30. 3 3 0 . 76 0 .78 50 .75
Minimum 6.57 30.65 1 7 .02 0 .50 26.04 0.42 0 .6 1 44 . 5 3
Maximum 7 . 64 73 . 74 40 .97 1 .06 45 . 07 0 . 7 6 0 . 9 3 5 6 . l l
Average 7 . 1 2 5 2 . 3 7 29. 1 6 0 .85 3 5 .00 0 . 64 0 . 8 1 50 .79
A l l values are given in percentage on dry weight basis except pH(as unit) & moi sture (percer.tage on wet weight basis) and C/N (as ratio)
25 CPCB ENVIS Centre (www.cpcbenvis . n ic . i n )

Table No. 1 1 . 1 .3 Average Values of Heavy Metals (input waste)
Name of Heavy Metal s
C i ty Pb Ni Cd Cr Cu Zn M n Fe Hg
Bangalore 1 84 .54 62 .59 5 .58 ' 1 1 3 . 5 2 3 4 5 . 3 7 626.34 3 4 . 8 6 1 8 7 7 8 . 2 1 0 . 0 l
M a l ad 1 0 0 . 3 8 3 6 . 5 8 2 .63 3 7 . 06 2 1 9 . 04 3 4 1 . 8 0 1 0 1 . 78 1 3 9 1 2 . 6 5 0 . 2 3
De l h i 5 6 .09 5 7 .4 1 3 . 34 1 10 .94 1 76 . 6 1 479. 88 5 3 9. 1 1 23909. 1 1 ( l . 0 5
B hopal 79. 5 5 3 5 . 8 3 6 . 49 3 0. 7 1 2 8 8 .49 I 547 . 1 0 493 . 1 1 27602 . 8 9 0 . 07
Nash i k 1 . 5 0 7 . 5 0 2 2 2 . 20 1 0 669 . 00 0 . 02
A h medabad 47.05 38 .47 3 . 9 8 48 .4 1 2 8 8 . 29 36 1 .00 263 . 5 0 1 9396 . ()()' 0. 03 . .
M i n i mu m 47 .05 3 5 . 8 3 1 . 5 0 7 . 50 1 7 6 . 6 1 34 1 .80 34 86 1 0669 . 00 0 . 0 1
M ax i m u m 1 84 . 5 4 6 2 . 5 9 6 . 4 9 1 1 3 . 5 2 3 45 . 3 7 626.34 539 . 1 1 27602 . 8 9 0 . 2 3
A verage 9 3 . 5 2 46. 1 8 3 . 92 5 8 .02 263 . 5 6 47 1 . 2 2 275 .76 1 9044.64 0 . 07
A l l val ues are gi ven in mg/kg on dry weight basi s .
Table No. 1 1 . 1 .4 Average Values o f Heavy Metal (TCLP)(lnput Waste)
Name of Heavy Meta l s
C i ty Pb N i C d Cr Cu Zn Mn Fe Hg
B angalore 4 . 8 2 1 .04 0 . 37 0 . 60 4 . 2 5 4 . 8 3 5 .2 7 I l . 1 5 O .O I Malad 6 . 5 5 0 . 7 9 0 . 26 - 0 . 69 2 . 66 4 . 93 3 . 60 ,6 . 8 7 0 . 03
Delh i 0 . 95 8 . 5 0 0 . 46 1 . 1 1 1 . 36 2 . 7 1 7 . 3 5 5 9 . 97 0 . 0 1
B hopal 1 2 . 90 4 . 1 9 0 . 5 1 3 . 5 6 6 . 9 8 7 . 40 7 . 7 6 7 6 .09 . 0 . 0 1
Nash i k 7 . 89 5 .08 l .2 3 5 . 87 5 . 86 9 . 7 2 1 0 . 1 0 ' 9 . 47
Ahmedabad 3 . 50 3 . 24 2 . 46 1 . 99 5 . 68 7 . 64 5 . 5 9 3 2 . 27 O .O I
Min imum 0 . 95 0 . 7 9 0 . 26 0 . 60 1 . 36 2 . 7 1 3 . 60 6 . 87 0 . 0 1 Max imum I 2 . 90 8 . 50 2 . 46 5 . 8 7 6 . 9 8 9 . 7 2 I O . I O 7 6 . 09 0 .03
Average 6. 1 0 3 . 8 I 0 . 8 8 2 . 30 4 .47 6 . 2 1 6 . 6 I 3 2 . 64 O .O I
Al l va l ues are gi ven i n mg/kg on dry weight bas i s us ing dist i l l ed water as sol vent.
CPCB ENVIS Centre (w�.cpcbenvis . n ic . i n )

Table.No. 11.1.5 Average Values of Pesticide (Input Waste)
Name of Pesticides
City Aldrine B .H.C . D .D .T .
B angal ore 0 .03 0.07 0 . 5 3
Malad 0 . 0 8 0 . 2 1 0 . 3 1
Del hi 0. 1 1 0 .06 0 .08
B h opal 0 . 0 8 0 . 0 5 0 . 1 4
Nash i k 0.02 0 .02 0 .02
Ahmedabad 0.02 0 . 0 1 0 . 02
Minimum 0 . 02 0 . 0 1 0 .02 Maxi mum 0 . 1 1 0 . 2 1 0 . 5 3
Average 0.06 0 . 07 0 . 1 8
A l l val ues are given i n mg/kg on dry weight basis.
Table No. 1 1 .1 .6 Average Values of Chemical A nalysis (Compost)
Name of Parameters
City pH O . M . % C % N% C/N K20% P20s % Moisture %
Bangalore 7 . 09 2 7 . 7 9 1 5 . 3 9 1 . 0 2 1 5 . 1 9 0 . 6 5 0 . 8 9 25 . 24
Mal ad 6 . 8 9 3 5 . 60 1 9 . 9 1 1 . 26 1 7 .93 1 .03 0 . 66 24 . 5 0
Delhi 7 . 2 7 2 2 . 1 0 1 2 . 2 8 0 . 64 1 9 . 3 8 0 . 70 0 . 3 5 2 3 . 2 9
B h opal 7 . 7 9 1 8 . 0 1 1 0 . 00 0 . 56 1 9 . 26 0 . 7 9 0 . 4 2 2 8 . 22
Gwal i or 7 . 1 8 1 7 . 2 1 9 . 5 6 0 .40 24. 1 4 0 . 7 8 0 . 1 5 1 8 . 6 8
N ashik 7 . 20 40 . 50 2 2 .49 1 . 1 9 1 8 . 53 l .00 l .00 2 3 . 5 0
Ahmedabad 7 . 2 8 34.20 1 9 .00 I. IO 1 7 .38 0 . 8 6 1 .00 3 1 .67
Minimum 6 . 8 9 1 7 . 2 1 9 . 56 0 .40 1 5 . 1 9 0 . 6 5 0 . 1 5 1 8 . 6 8 Maxi mum 7 . 79 40 . 50 2 2 .49 1 . 26 24. 1 4 l .03 1 .00 3 1 .67
Average 7 . 24 2 7 . 9 2 1 5 . 5 2 0 . 8 8 1 8 . 8 3 0 . 8 3 0 . 64 2 5 . 0 1
A l l val ues are given in percentage on dry weight basis except pH(as unit) & moi sture (percentage on wet weight basis) and C/N (as ratio)
CPCB ENVIS Centre2(www.cpcbenvis . n ic . i n )
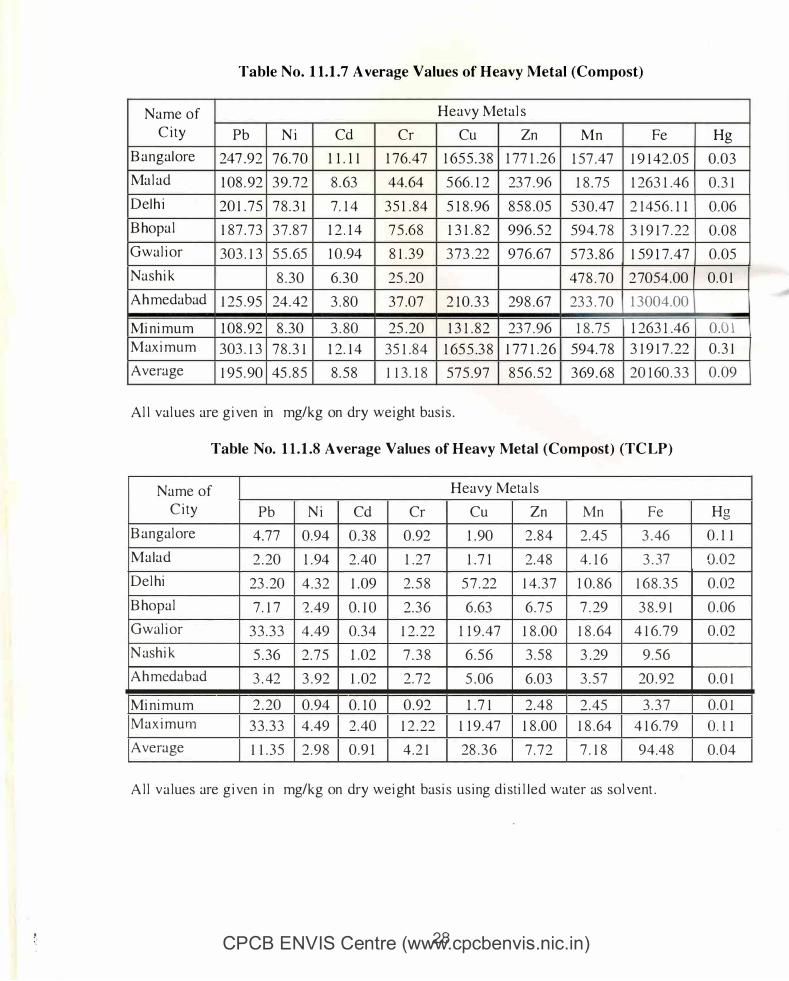
Table No. 1 1 .1.7 A verage Values of Heavy Metal (Compost)
Name of Heavy Meta l s
C i ty Pb N i Cd Cr Cu Zn Mn Fe Hg
B angalore 247 .92 7 6 . 7 0 1 1 . 1 1 1 76 . 47 1 65 5 . 3 8 1 77 1 . 2 6 1 57 . 47 1 9 1 42 . 0 5 0 . 0 3
Mal ad 1 08 . 92 3 9 . 7 2 8 . 63 44. 64 5 66 . 1 2 23 7 . 96 1 8 . 7 5 1 263 1 .46 0 . 3 1
Delhi 20 1 . 7 5 7 8 . 3 1 7 . 1 4 3 5 1 . 84 5 1 8 . 96 8 5 8 .05 5 3 0 . 47 2 1 45 6 . 1 1 0 .06
Bhopa l 1 8 7 . 73 3 7 . 8 7 1 2 . 1 4 7 5 .6 8 1 3 1 . 8 2 996 . 5 2 594. 7 8 3 1 9 1 7 . 22 0 . 0 8
Gwal i or 303 . 1 3 5 5 . 65 1 0 . 94 8 1 . 3 9 3 7 3 . 22 9 7 6 . 67 5 7 3 . 86 1 59 1 7 . 47 0 . 05
Nashi k 8 . 30 6 . 3 0 25 . 20 47 8 . 70 2 7054.00 0 . 0 1
Ahmedabad 1 25 . 95 24 . 42 3 . 80 37 .07 2 1 0 . 3 3 29 8 . 67 23 3 . 70 1 3004.00
Mi ni mum 1 08 . 92 8 . 30 3 . 80 25 . 20 1 3 1 . 8 2 23 7 . 96 1 8 . 7 5 1 263 1 .46 0 .0 1 Maxi mum 303 . 1 3 7 8 . 3 1 1 2 . 1 4 35 1 . 8 4 1 65 5 .3 8 1 11 1 . 2 6 1 594. 7 8 3 1 9 1 7 . 22 0 . 3 1
Average 1 95 . 90 45 . 8 5 8 . 5 8 1 1 3 . 1 8 5 7 5 .97 8 5 6 . 5 2 I 3 69 . 68 20 1 60 . 3 3 0 . 09
Al l val ues are gi ven in mg/kg on dry weight basi s.
Table No. 1 1 .1.8 Average Values of Heavy Metal (Compost) (TC LP)
Name of Heavy Meta l s
C i ty Pb N i Cd Cr Cu Zn Mn Fe Hg
B angal ore 4.77 0 . 94 0 . 3 8 0 . 92 1 . 90 2 . 8 4 2 . 45 3 . 46 0 . 1 1
Malad 2 . 20 1 . 94 2 . 40 1 . 27 1 . 7 1 2 . 4 8 4 . 1 6 3 . 37 0 . 0 2
Delhi 23 . 20 4 . 3 2 1 .09 2 . 5 8 5 7 . 22 1 4 . 3 7 1 0 . 86 1 6 8 . 3 5 0 .02
Bhopal 7 . 1 7 ! . 49 0. 1 0 2 . 3 6 6 . 63 6 . 7 5 7 . 29 3 8 . 9 1 0 .06
Gwal i or 3 3 . 3 3 4 . 49 0 .34 1 2 . 22 1 1 9 . 47 1 8 .00 1 8 . 64 4 1 6 . 7 9 0 . 02
N ashi k 5 . 36 2 . 7 5 1 .02 7 . 3 8 6 . 5 6 3 . 5 8 3 . 29 9 . 5 6
Ahmedabad 3 . 42 3 . 92 1 . 02 2 . 7 2 5 . 06 6 .03 3 . 5 7 20 . 92 0 .0 1
Mi ni mum 2 . 20 0 . 94 0 . 1 0 0 . 92 1 . 7 1 2 . 4 8 2 . 45 3 . 3 7 0 .0 1 Max i mum 3 3 . 3 3 4 . 49 2 . 40 1 2 . 22 1 1 9 . 47 1 8 .00 1 8 . 64 4 1 6 . 7 9 O . l l
Average 1 1 . 3 5 2 . 9 8 0 . 9 1 4 . 2 1 28 . 3 6 7 . 7 2 7 . 1 8 94.48 0 . 04
A l l va lues are gi ven i n mg/kg on dry weight basi s us ing di sti l l ed water as sol vent.
CPCB ENVIS Centre (w�.cpcbenvis . n ic . i n )

Table No. 11.1.9 Average Values of Pesticide (Compost)
Name of Pesticides
City A ldrine B .H.C. D . D .T .
B angal ore 0.05 0.03 0 . 05
Malad 0 . 22 0 . 63 0 . 58
Delhi 0 . 0 8 0 .03 0 . 1 1
Bhopal 0.07 0 .03 0 . 30
Gwalior 0 . 1 1 0 . 02 0 . 4 1
Nashi k 0 . 0 1 0 .02 0 . 0 1
Ahmedabad 0.02 0 . 0 1
Minimum 0 . 0 1 0 . 02 0 . 0 1 Maximum 0 . 22 0 . 63 0 . 58
Average 0.08 0 . 1 3 0 . 2 1
Al l values are gi ven in mg/kg on dry weight basis
CPCB ENVIS Cent?e> (www. cpcbenvis . n ic . i n )
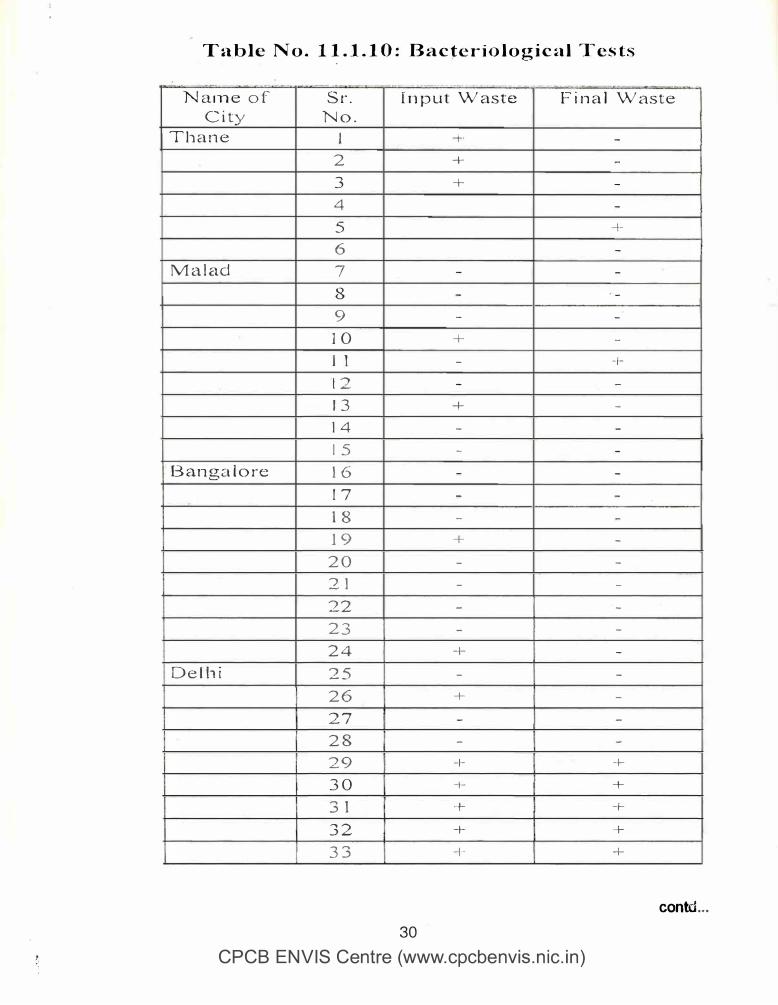
'I' a b l c N o . 1 1 . .1 . 1 0 : B a c �c r i o l o g i c a l l� cs t s
. - - - -- --
N a 1n e o f S r . C i ty N o .
T h a n e I
2 3 4
5
6
M a l a d 7
8
9
J O
l 1
1 2
1 3
1 4
1 5
· B an g a l o r·e 1 6
1 7
l 8
1 9
2 0 2 1
2 2
2 3 2 4
D e l h i 2 5
2 6 2 7
2 8 2 9
3 0 3 1
3 2
3 3
--· .. . . . - - - � - - - --- - · -
I n p u t W a s t e
+
+
+
-
-
-
+
-
-
+
-
-
-
-
-
+
-
-
-
-
+
-
+
-
-
+
+
+
+
-+-
30
. -· . .
-
F i n a l
CPCB ENVIS Centre (www.cpcbenvis . n ic . i n )
W a s t e
-
-
-
-
+
-
-
-
I -
-
+
-
-
-
-
-
-
-
-
-
-
-
-
-
-
-
-
-
+
+
+
+
+
contd . . .

N an1 e o f S r . I n p u t W a ste F i n a l W as t e i
C i t y N o . ; i
3 4 I
- + I 3 5 + +
3 6 + - I I
3 7 I
' + -' '
3 8 + -! : B h o p a l 3 9 - -
4 0 -= -
4 1 - - I I
42 - + 1 ; I
4 3 I
+ +
I l ! 4 4 +- + i i 4 5 - -I ' ' + -: . 4 6 1 I
I
!
4 7 - +
G w a l i o r 4 8 +
4 9 +
5 0 +
5 1 +
5 2 + I 5 3 + J
!
N as h i k 5 4 I - - ·I 5 5 + -
56 - - I
: A h m e d abad 5 7 - -
5 8 + +
[ 5 9 + 1! ];-------+---�-�--+----+---+-----+-----ti f Total 24(52) 2 1 (6 1 ) �
( +) V alue indicates pre s e nce'.) ( -) V al ue . ind icates absence
CPCB ENVIS Ce��e (www. cpcbenvis . n ic . i n )
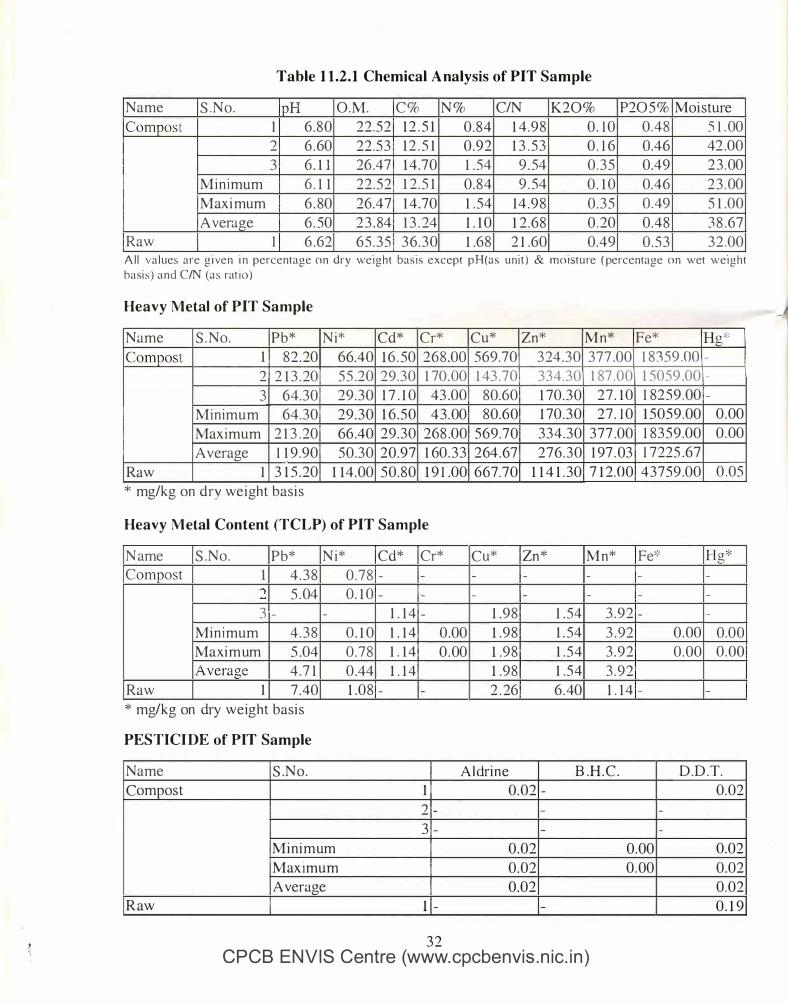
Table 11.2.1 Chemical A nalysis of PIT Sample
Name S .No . pH O.M. Co/o N o/o C/N K 2 0 % P20 5 % Moisture Compost 1 6 . 8 0 2 2 . 5 2 1 2 . 5 1 0 . 8 4 1 4 . 9 8 0 . 1 0 0 . 4 8 5 1 . 00
2 6 . 60 2 2 . 5 3 1 2 . 5 1 0 . 9 2 1 3 . 5 3 0 . 1 6 0.46 42 .00
3 6 . 1 1 26 .47 1 4 .70 1 . 54 9 . 54 0 . 3 5 0.49 2 3 . 00
Min imum 6 . 1 1 2 2 . 5 2 1 2 . 5 1 0 . 8 4 9 . 54 0 . 1 0 0.46 2 3 . 00
Maximum 6 . 80 26.47 1 4 .70 1 . 54 1 4 . 9 8 0 . 3 5 0 . 49 5 1 .00
Average 6 . 50 2 3 . 84 1 3 . 24 1 . 1 0 1 2 . 6 8 0 . 20 0 .48 3 8 . 67 Raw I 6 . 62 6 5 . 3 5 3 6 . 3 0 1 .6 8 2 1 .60 0 .49 0 . 5 3 3 2 .00 Al l v a l ues are g i ven i n percentage on dry weight bas is except pH(as unit ) & moisture ( percentage on wet w e i g h t
has is ) a n d C/N (as rat io )
Heavy M etal of PIT Sample
Name S . No . Pb* Compost 1 8 2 . 20
2 2 1 3 . 20
3 64.30
Minimum 64.30
Maximum 2 1 3 . 20
Average 1 1 9 .90
Raw 1 3 1 5 . 20
* mo/ko on drv weioht basis b b • b
Ni* Cd* Cr* 66.40 1 6 . 50 2 6 8 .00
5 5 .20 29 .30 1 70 . 00
2 9 . 3 0 1 7 . 1 0 43 .00
2 9 . 3 0 1 6 . 5 0 4 3 . 00
66 .40 29 .30 268 .00
50 .30 20 .97 1 60 . 3 3
1 1 4 .00 5 0 . 8 0 1 9 1 .00
Heavy M etal Content (TCLP) of PIT Sample
N ame S .No. Pb* Ni* Cd* Cr* Compost 1 4 . 3 8 0 . 7 8 - -
,., 5 . 04 0 . 1 0 - --
3 · - - 1 . 1 4 -
Min imum 4 . 3 8 0 . 1 0 1 . 1 4 0 . 00
Maxim um 5 .04 0 . 7 8 1 . 1 4 0 . 00
Average 4 . 7 1 0 .44 1 . 1 4
Raw 1 7 .40 1 .0 8 - -
* mg/kg on dry weight basis
PESTICI DE of PIT Sample
Cu* Zn* Mn* Fe* Hg* 569.70 3 24 . 3 0 3 7 7 .00 I 8 � 5 9 .00 -
1 43 .70 334.30 1 87 .00 1 5059 .00 -
80.60 1 70 . 3 0 2 7 . 1 0 1 82 5 9 . 00 -
80 .60 1 70 . 3 0 2 7 . 1 0 1 50 5 9 . 00 0 . 00
5 6 9 . 7 0 334 .30 3 7 7 .00 1 83 5 9 .00 0 . 00
264 . 67 2 7 6 . 3 0 1 97 . 03 1 7 225 .67
667 .70 1 1 4 1 . 30 7 1 2 .00 43759 .00 0 .05
Cu* Zn * Mn* Fe* Hg*
- - - - -
- - - - -
1 . 9 8 1 . 54 3 . 9 2 - -
1 . 9 8 1 . 54 3 . 92 0 . 00 0 .00
1 .9 8 1 . 5 4 3 . 9 2 0 . 00 0 . 00
1 .9 8 1 . 5 4 3 . 9 2
2 . 26 6 . 40 1 . 1 4 - -
Name S .No . A l drine B .H .C . D .D .T. Compost 1 0 . 0 2 - 0 .02
2 - - -3 - - -
Minimum 0 . 0 2 0 .00 0.02
Maximum 0 . 0 2 0 . 00 0 .02 Average 0.02 0 .02
Raw l - - 0 . 1 9
3 2 CPCB ENVIS Centre (www.cpcbenvis . n ic . i n )
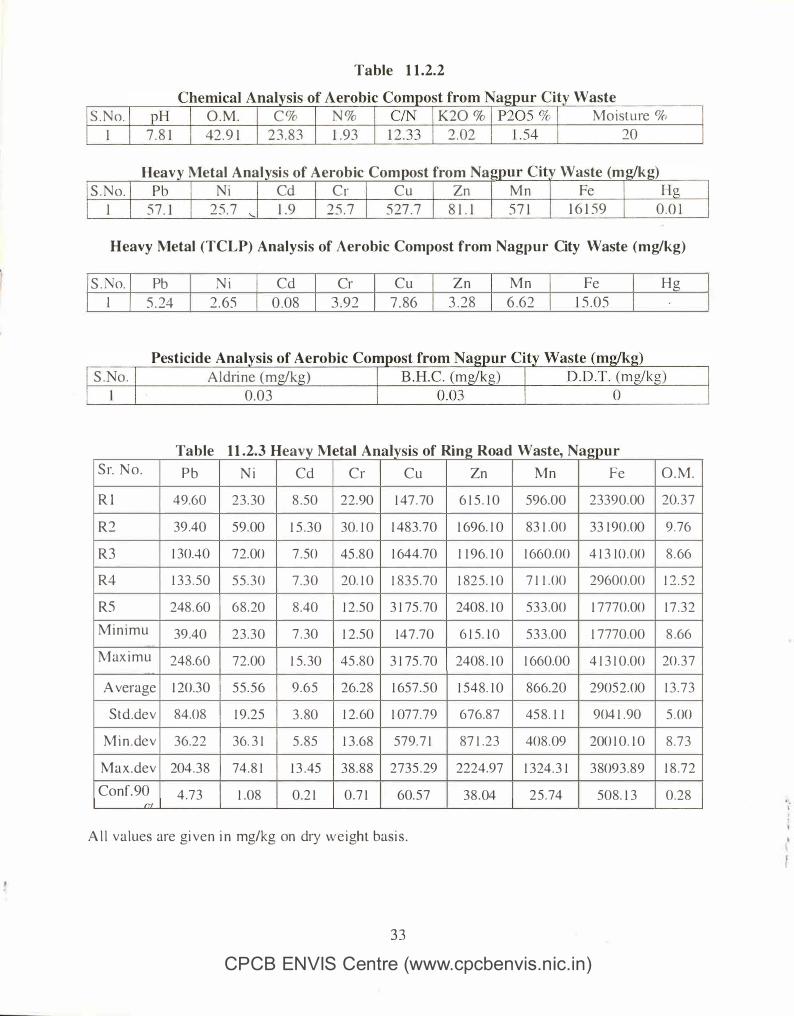
Table 1 1 .2.2
Waste
S . No. H O . M . C o/o N o/o K20 % Moisture <l(, l 7 . 8 1 42 . 9 1 23 . 83 1 .93 2 . 02 20
Heav Metal Anal sis of Aerobic Com ost from Na Waste (m k ) S . N o . Pb Ni Cd C r C u Zn Mn Fe H a
l 5 7 . 1 2 5 . 7 '- 1 .9 2 5 . 7 5 27 . 7 8 1 . l 5 7 1 1 6 1 59 0 . 0 1
Heavy Metal (TCLP) Analysis of Aerobic Compost from Nagpur City Waste (mg/kg)
S . o. Pb
l 5 . 24
N i
2 . 65
Cd Cr
0 . 08 3 .92
Pesticide Anal sis of Aerobic Com
S . o . Ald1ine ( m a/k )
J 0 . 0 3
C u Z n M n Fe
7 . 86 3 . 2 8 6 .62 1 5 . 0 5
T bl 1 1 2 3 H a e . . eavy M I A I . f R. R d W t N eta na1ys1s o mg oa as e, agpur
S r. N o . P b N i Cd Cr C u Zn Mn Fe
R I 49.60 2 3 . 30 8 . 50 22 .90 1 47 . 70 6 1 5 . 1 0 596.00 23390.00
R2 39 .40 5 9 . 00 1 5 . 3 0 30. 1 0 1 483 .70 1 696. 1 0 83 1 .00 3 3 1 90 . 00
R3 1 30.40 72 .00 7 . 50 45 . 8 0 1 644.70 1 1 96. 1 0 1 660.00 4 1 3 1 0 . 00
R4 1 3 3 . 50 5 5 . 3 0 7 . 3 0 20. 1 0 1 8 3 5 . 70 1 82 5 . 1 0 7 1 1 . 00 29600.00
R5 248 . 60 6 8 . 20 8 .40 1 2 . 5 0 3 1 75 . 70 2408 . 1 0 5 3 3 .00 1 7 770.00
M i n i m u 39 .40 2 3 . 3 0 7 . 30 1 2 .50 1 4 7 .70 6 1 5 . 1 0 5 3 3 .00 1 7 770.00
Max i m u 248.60 72 .00 1 5 . 30 45 . 8 0 3 1 75 . 70 2408 . 1 0 1 660.00 4 1 3 1 0 .00
A verage 1 20 .30 5 5 . 5 6 9 . 6 5 26 .28 1 65 7 . 5 0 1 5 4 8 . 1 0 866.20 2905 2 . 00
Std .dev 84.08 1 9 .25 3 . 80 1 2 . 60 1 07 7 . 7 9 6 7 6 . 8 7 45 8 . 1 1 904 1 . 90
M i n . de v 36.22 36. 3 1 5 . 85 1 3 .68 579 . 7 1 87 1 . 2 3 408 . 09 200 1 0 . 1 0
M a x . dev 204 . 3 8 74 . 8 1 1 3 . 45 3 8 . 8 8 2735 . 29 2224.97 1 3 24 . 3 1 3 809 3 . 8 9
Conf. 90 4 . 7 3 1 . 08 0 . 2 1 0 . 7 1 60. 5 7 3 8 . 04 2 5 . 74 508 . 1 3 ,.,.,
A l l v a l ues are gi ven i n mg/kg on dry w e i ght basi s .
3 3
CPCB ENVIS Centre (www.cpcbenvis . n ic . i n )
H g
O . M .
20. 3 7
9 . 76
8 . 66
1 2 . 5 2
1 7 . 3 2
8 . 66
20 . 3 7
1 3 . 7 3
5 . 00
8 . 7 3
1 8 . 7 2
0 . 2 8

PART-B APPLICATION OF COMPOST AND DIGESTED SEWAGE IN
AGRICULTURE
1 .0 INTRODUCTION
The i ssue of so l id waste can no l onger be treated l ight l y in view of many i nherent advantages being tapped i ncreas ing ly even by the deve loped nati ons of the wor ld . One of the most i mportant advantages is the uti l i zat ion of the bi odegradab le so l id waste on agri cu l ture l and through composti ng . The i mportance of organ i c manure as a source of humus and p l ant nutrients to increase the ferti l i ty level of tropi cal soi l s has been wel l recognized. The organ i c matter content i n cu l t i vated soi l s of the tropics and subtropics i s comparat ive ly low due to h i gh temperature and in tense m icrobia l acti v i ty . Therefore, soi l humus h as to be rep len i shed through periodic addi t ions of organ ic m an ure for maintai n i ng soi l heal th and i ts product iv i ty . Wi th the ri s i ng cost of foss i l fue l s , prob lems in the areas of energy and product ion of chemica l ferti l i zers are bei ng faced. Consequent ly , avai l abi l i t y of chemica l ferti l i zers at a reasonable rates to the farmers is an important i ssue . There i s , thus, a need for uti l i z ing organ i c man ures l i ke s l udge and compost for supplementi ng chemica l fe11i l i zers i n the present context .
The preparati on of organ i c manures from rural and urban w astes wi l l not onl y provide the p l an t nutri ents and h umus mate1ials bu t a l so resu l t i n h ygien ic di sposal of the organ i c wastes wh ich otherwise may cause pol l ut ion problems . Moreover, durin g recent years the concept of i n tegrated nutri ent supp l i es for h igh y ie ld ing variet ies under condi t ions of i n tensi ve agri cu l ture has been found to be qui te demanding . The use of adequate doses of organ i c man ure coupled wi th chemica l ferti l i zers wi l l ensure opti mum condi t ions for p l ant growth under i n tensi ve pattern of fann ing usi ng h i gh yi e ld ing variet ies . B es ides NPK, organ i c manure is a poten t ia l source of micronutrients to mainta in better soi l heal th for a sustai nab le agricu l ture.
2.0 NEED OF A PPLICATION OF MSW COMPOST/ SEWAGE S LUDGE
The indiscri mi n ate use of chemical ferti l i zer, most ly n i trogenous , has created many complex problems in the soi l v iz . l and degradat ion and env ironmen tal po l l ut ion . Moreover, due to i n creas ing pri ces of chemica l ferti l i zers the government i tse lf has l aunched an In tegrated P lant Nutri ent Management System (IPNS) . Thi s system is based on the usage of l ocal l y avai lab le organ i c n i trogen sources of i nputs l i ke organ i c manure, b io-ferti l i zers, FYM and chemica l fe11 i l i zers that can be used rational l y to meet the to ta l requirement of p l an t n utrients in a ba lanced manner to mainta in soi l fert i l i ty for a sustainable ag1icu l ture. Among various organ i c inputs of IPN S , the new l y emerged source of organ i c i nput l i ke M un ic ipa l So l id Waste (MSW) Compost and Sewage S l udge can be promis ing in urban and pe1iurban areas.
3.0 SCOPE OF WORK
Indi a has a good potent ia l for the production and use of MSW based compost and sewage s l udge generated i n various metros and mun ic ipa l i t ies . The research h as been l argel y restricted to i ts product ion , composi t ion etc . Re lati ve ly few studies have been conducted on i ts safe and
CPCB ENVIS Centre (w�w.cpcbenvis . n ic . i n )

economic di sposal and i ts appl ication on agricul tural l and i n different croppin g system . An anal ys i s of m an uria l potenti a l of MSW compost and the sewage-s l udge i s very much needed.
The project taken up by Central Pol l ut ion Contro l Board wi th IARI attempts to cover the safe and benefi c i al use of MSW compost and sewage s l udge i n agri cu l ture v i s a v i s i t s env ironmenta l i mpacts based on exten s ive experimentat ions and a review of the sc ient ifi c l i terature.
4.0 N UTRIENT CONTENT IN MSW COMPOST
The compost prepared from MSW from Del h i i s bu lky and low in p l an t nutrients . It contai ns about 0 .5 to 1 . 5 percent N , 0 . 1 to 0 .65 percent P as P205 and 0 .3 to 1 .7 8 percent K as K:�O with a C/N rat io of about 20 : I . Hot a ir treatment also destroys pathogen i c organ i sms and weed seeds that may be present . The pH and moi sture content of these compost and sewage s l udge are 7 .44 & 36 .65% and 7 .70 & 3 3 .4 respect ive ly . The detai l ed anal ysi s i nc luding heavy metal contents i s presented i n Table- I .
Table 1 . Chemical characteristics of MSW Compost and Sewage S l udge
Parameters MSW Compost Moi sture (%) 36 .65 pH ( l : 2 . 5 ) 7 .44 E .C . ds/m ( I : 2 . 5 ) 1 .60 Organic Carbon (%) 1 0 .08 Total Ni trogen ( i n %) 1 . 35 Avai lab le P as P205 (mg/kg) 1 . 30 A vai lab le K as K20 (mg/kg) 1 0 .4 CIN rat io 7 .4 : 1 Su lphur (mg/kg) 798 .75 Chromi um ( mg/kg) 2 . 347 Cadmium (mg/kg) NT Copper (mg/kg) 0 .387 Iron (mg/kg) 1 0 1 .90 n icke l ( mg/kg) 0 .437 Lead (mg/kg) 1 . 1 1 3 Zinc (mg/kg) 0 .464
5.0 NUTRI ENT CONTENT IN SEWA GE S LUDGE
Sewage S I udge 3 3 .4 7 . 70 1 . 8 5 1 6 . 1 5 1 . 20 2 .40 1 5 . 2 1 3 .4 : I 63 1 . 25 0 . 1 4 NT 0 .08 1 36 .3 NT 0.26 0 .07
Sewage s l udge contains appreciable amounts of N and P and can be cons idered to have s ign i fi cant ferti l i zer replacement va lue for these major p l ant n utri ents . S l udge on an average contai ns 1 . 2 to 3 . 5 per cent N, 0 . 75 to 4 per cent P205 and 0 .3 to 0 .6 per cent K20 .The detai led analysis report i nc ludin g heavy metal contents is l i sted in Table- I . One of the reports from UK ment ions that approx imate ly 20,000 t of N and 1 1 ,000 t of P are recyc led to farmland each year based on average N and P contents of 3 . 8 % and 2 . 2 % respecti ve ly in s l udge dry so l ids . For the European Un ions as a whole, the quant i t ies are about 9 1 ,000 t of N and 53 ,000 t of P . In rel at ion to equivalent amounts of i norgan ic ferti l i zers, th is represents a potent ial sav ing of approx imate ly
CPCB ENVIS Centr-M> (www.cpcbenvis . n ic . i n )
' " '

1 5 m i l l ion pounds, wh ich benefits both the farming communi ty and the n at iona l econ omy as a whole , however, t h i s i s on l y equi va lent to l ess than 5 % of U K fert i l i zer consumpt ion .
The K content of a l l s l udge i s l ow and not suffic ient to make an y s ign i ficant d ifferences to the recommended doses of K necessary for most cropping system. Sewage s l udge i s a l so a potent ia l source of su lphur for crop growth providi ng addi t ional benefits to agri cu l tural areas where atmospheric deposi t ion of S has dec l ined and crop defi c i enc ies have been rep011ed. S l udge can supp ly a number of other n utri ents (e .g . Mg, Ca, Zn, Cu etc . ) but their i mportance wi l l depend on whether these are defi c ient i n the soi I .
6.0 CROPS ADOPTED FOR MSW COMPOST AND SEWA GE S LUDGE
APPLICATION
In the present study, Maize and B h i ndi crops in Kh arif season whi le Wheat and Pea in Rahi seasons have been chosen for experimen tation .
7.0 LAND PREPARATION AND COMPOST APPLICATION
One plough i ng with a soi l turning p lough fo l l owed by h aJTowing and leve l i ng i s suffi c ient for wheat crop. Then compost i s app l i ed. Amount of compost app l i ed for each p lot was ca l cu lated based on the percentage of n i trogen content .
Sowing Condit ions
Temperature duri n g the growin g seasons and at grain fi l l i n g i s the one amongst several i mportant factors in dec id ing sowing t ime . W heat p l ants are sens i t ive to very co ld or frost i nj ury at any stage of growth parti cu l ar ly at reproducti ve growth i f temperature i s be low 1 5°C .
8.0 ANALYTI CAL PROCEDURES
Standard procedures were fo l lowed for determ in ing N ( Kje ldah l ' s Method), P (Calori metri c spectrophotometer), K (F lame photometer), total organ ic carbon (Wa lk ley and B l ack) and heavy meta ls (DTPA-CaCl2 -TEA method ) present in compost , s l udge, i JTi gat i on water, p l an t and experi mental soi I .
9.0 DESIGN OF FIELD EXPERIMENTS
The fie ld l ay out of the experiment was based on Randomized B l ock Design (RBD) taken i n three rep l i cat ions for both compost and s l udge The total l and area used for the experi ment was 5905 sq . m leav ing 10 % for the management pract ices . Thus, the net cu l t i vated area taken was 53 1 5 sq. m which was div i ded i n to 48 p lots of s ize 90 sq m each (9x 10 m) in the year 2000-0 l . Duri n g 200 1 -04, the treatments were reduced up to 6 and p lot s izes were 20sq m (4x5m) .
Compost/Sewage S l udge Treatments :
T 1 and T 2 are addit i ve experi ments of N nutrient taken on l y i n duri ng 2000-0 1
CPCB ENVIS Centre (�ww.cpcbenvis . n ic . i n )
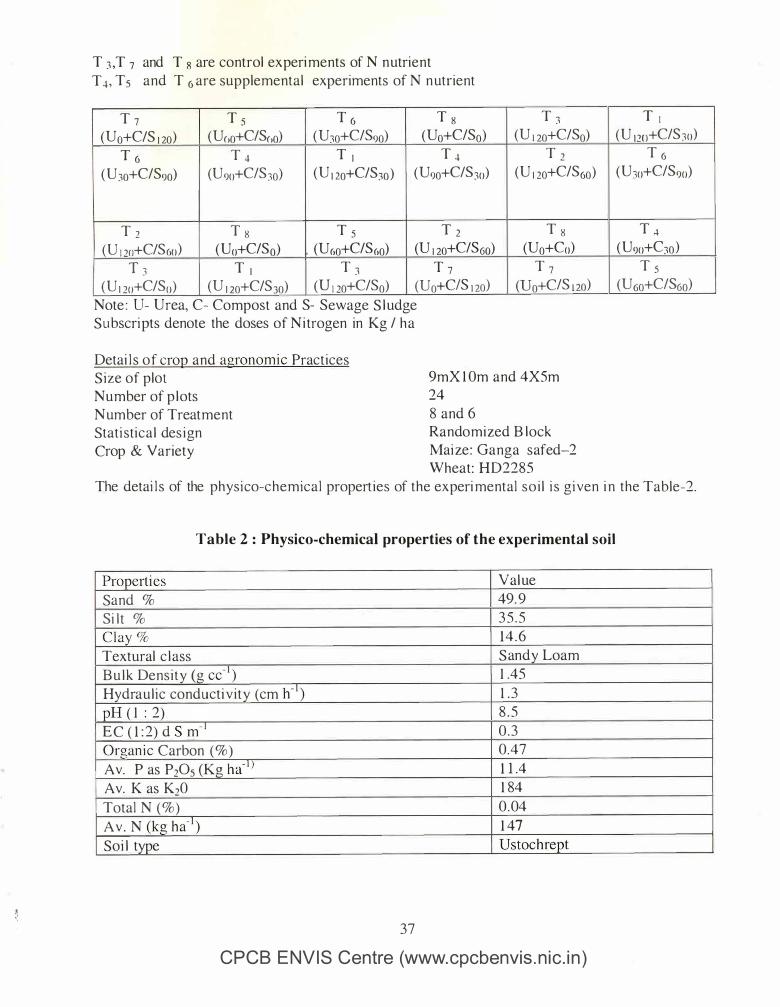
T :i ,T 7 and T 8 are control experi ments of N n utrient T 4, T 5 and T 6 are supplemental experiments of N n utrient
T 1 T s T 6 T 8 T :i
(U o+C/S 1 20) (U<,o+C/S<,o) ( U:io+C/S90) (Uo+C/So) (U 1 20+C/So) T 6 T 4 T 1 T 4 T 2
( U:io+C/S90) (U9o+C/S:io) ( U 1 2o+C/S:io ) (U9o+C/S:io) ( U 1 2o+C/S60)
T 2 T 8 T s T 2 T 8 ( U 1 2o+C/Sw) ( Uo+C/So) (U<,o+C/S<,o) (U 1 20+C/S60) (Uo+Co)
T 3 T 1 T , ·' T 1 T 1 ( U 1 :w+C/So) (U 1 20+C/S30) (U 1 2o+C/So) (Uo+C/S 1 20) (Uo+C/S 120)
Note : U- Urea, C- Compost and S- Sewage S l udge Subscri pts denote the doses of Ni trogen in Kg I ha
Detai l s of crop and agronomic Practices S ize of plot Number of p l ots Number of Treatment Stati stica l des ign Crop & Variety
9mX l Om and 4X5m 24 8 and 6 Randomized B lock Mai ze : Ganga safed-2 Wheat: HD2285
T 1 ( U 12o+C/S :io)
T 6 ( U3o+C/S90)
T 4 ( U<Jo+C:io )
T s (U6o+C/S6o)
The detai l s of the physi co-chemica l propert ies of the experi mental so i l i s g i ven i n the Table-2 .
Table 2 : Physico-chemical properties of the experimental soi l
Propert ies Val ue Sand % 49. 9 Si l t % 3 5 . 5
C l ay % 1 4 . 6 Textural c l ass Sandy Loam B u l k Dens i ty (g cc- ' ) l .45 Hydrau l i c conducti v i ty (cm h - 1 ) l . 3 pH ( I : 2) 8 . 5 E C ( 1 : 2) d S m· ' 0 .3 Organ ic Carbon (%) 0.47 Av. P as P205 (Kg ha· 1 J 1 1 .4 Av. K as K20 1 84 Total N (%) 0 .04 Av . N (kg ha-
1) 1 47
Soi l type Ustochrept
37
CPCB ENVIS Centre (www.cpcbenvis . n ic . i n )

10.0 OBSERVATIONS
Study fi nds that sewage s l udge an d MSW c ompost are good sources of avai l able nitrogen and also have other nutrients . These can be effecti vely appl ied in the agri cul tural fie l d as s ign ifican t & benefici al ferti l izer repl acement for these m ajor plant n utrients. Various treatments for fie l d crops were designed o n t h e bas i s o f t h e ni trogen content i n t h e MSW compost, sewage s l udge and chemic al ferti l izer urea. Keeping these in view 5 treatmen ts (three supplemental and two additi ve) out of total of 8 treatments ( includin g 3 controls) in three repl i cates were designed. B u t from 200 l to 2004, treatments were reduced t o 6 because additive treatmen ts were of n o t much sign i fican ce . The maj or obj ective of experiments was to observe the crop yield due to the appl ication of these biosolids. There is a question to answer : the effect of s l udge and compost on the micro fl ora status of the soil and the supp l y of readi l y avai l abil ity of the nutrients in these biosol ids on the in creased mi crobial activity thereby effectin g the crop productivity .
B y supplemen tin g the i norganic nutrient requirement of crop plants, the agri cu l tural use of MSW compost an d sewage s l udge may h e l p to mai ntain soi l health for sustainab l e agricul ture an d also save energy which may arise during the manufacturi n g of in organic ferti l i zers .
It has been observed that the growth attributes of wheat/ maize and vegetable crops viz. , p l ant height, number of cobs/ti l lers/m2, dry matter producti on and leaf area inde x , were increased due to supp l y of ni trogen through combination of different doses of urea with compost/ sewage s l udge . Though al l the comb i n ation s showed increased yield over con trol , the two combin ation s viz, 90 Kg N (urea) + 3 0 Kg N (compost/ sewage s l udge) and 60 K g N (urea) + 60 Kg N (compost/ sewage s l udge) were found to be better and performed wel l i n al l the above growth attri butes alon g with 1 20 Kg N (urea) + 0 Kg N (compost/ sewage s l udge). Specifi c al l y the above said two combi n ation s performed wel l over al l other combin ation s and urea or compost/ sewage s l udge alone.
S i mi l arly, yield attributin g characters of wheat such as len gth of spike, n umber of spi kelets/spike, n umber of grains/ spike and 1 000-grain weight were also found to be great ly infl uenced by the appl icati on of MSW compost/ Sewage S l udge in combin ati on with ch emical ferti l izer urea. The treatment with 0 K g N (urea) + 1 20 Kg N (Compost/ Sewage S l udge) has infl uenced as compared to treatment with 60 Kg N (urea) + 60 Kg N (compost/ sewage s l udge) and 90 Kg N (urea) + 30 Kg N (compost/ sewage s l udge). Although the treatment with 1 20 Kg N (urea) + 0 Kg N (compost/ sewage s l udge) performed wel l during the earl y stages of crop growth , the two treatments viz. 90 Kg N (urea) + 30 Kg N (compost/ sewage s l udge) and 60 Kg N (urea) + 60 Kg N (compost/ sewage s l udge) performed better in al l the growth and yie l d attributes towards t h e l ater stage o f the crop.
The maize grain yie l d from T-3 ( 5 0 % N substituti on of urea) i s found to be hi ghest over al l the treatments i .e . , 3 8. 3 1 q/ha in compost treated field and that from the s ludge treated field was found to be 3 7 .44 q/ha.
The wei ght of biomass of maize from compost fie l d varied from 5 0 . 83 to 7 7 . 9 1 q /ha and the T-3 experiment represents the maximum bi omass yield 7 7 .9 l q /ha. Simi l arl y the average bi omass yie l d from the s l udge fie l d from the same experimen t was found out to be 74.47 q /ha (3 1 .7 7 %
3 8 CPCB ENVIS Centre (www.cpcbenvis . n i c . i n )
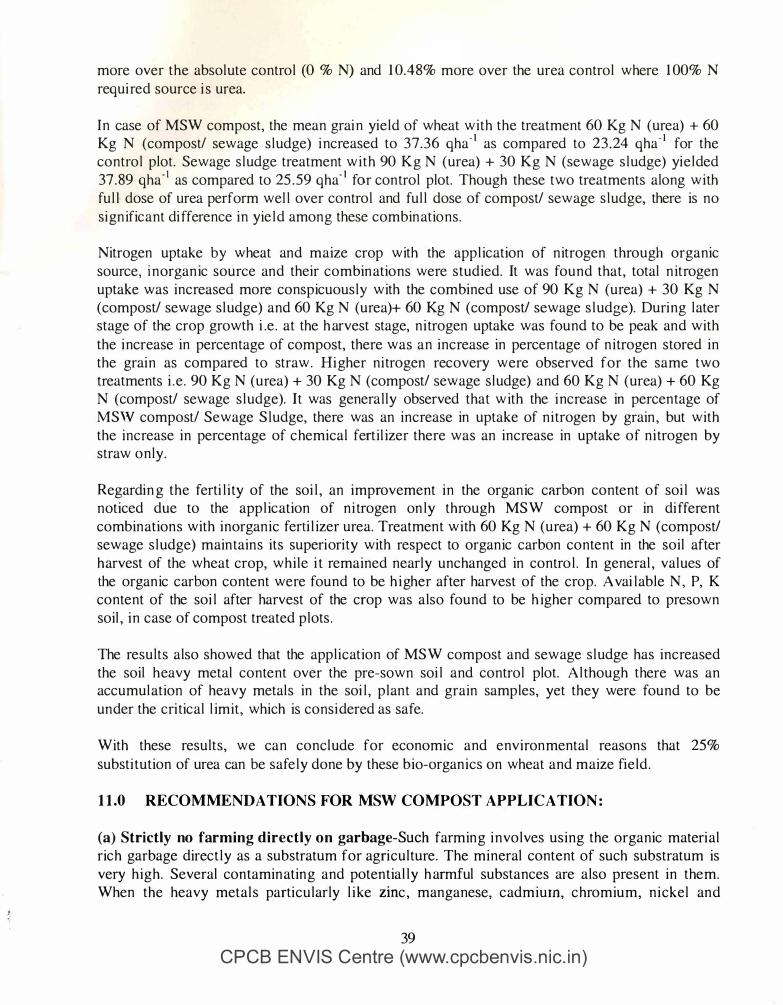
more over the absol ute control (0 % N) and 1 0.48% more over the urea control where 1 00% N requi red source i s urea.
In case of MSW compost, the mean grai n yie ld of wheat with the treatment 60 Kg N (urea) + 60 Kg N (compost/ sewage s l udge) i ncreased to 37.36 qha- 1 as compared to 23 .24 qha- 1 for the control plot. Sewage s l udge treatment w i t h 90 K g N (urea) + 30 Kg N (sewage s l udge) yi e lded 37.89 qha- 1 as compared to 25.59 qha- 1 for control plot. Though these two treatments along with ful l dose of urea perform wel l over control and ful l dose of compost/ sewage s l udge, there is no si gn ificant di fference in yie l d amon g these combin ations .
Nitrogen uptake by wheat and m aize crop with the appl ication of nitrogen through organic source, i n organ ic source and their combin ations were studied. It was found that, total n itrogen uptake was increased more conspicuousl y with the combined use of 90 Kg N (urea) + 30 Kg N (compost/ sewage s l udge) and 60 Kg N (urea)+ 60 Kg N (compost/ sewage s l udge). During l ater stage of the crop growth i .e . at the h arvest stage, ni trogen uptake was found to be peak and with the i ncrease in percentage of compost, there was an increase in percentage of n i trogen stored in the grain as compared to straw . Hi gher ni trogen recovery were observed for the same two treatments i . e . 90 Kg N (urea) + 30 Kg N (compost/ sewage sl udge) and 60 Kg N (urea) + 60 Kg N (compost/ sewage s l udge). It was general ly observed that w ith the i ncrease in percentage of MSW compost/ Sewage S l udge, there was an increase in uptake of ni trogen by grain , but with the increase in percentage of c hemical ferti l izer there was an increase in uptake of ni trogen by straw only .
Regardin g the ferti l i ty of the soi l , an improvement in the organic carbon content of soi l was noticed due to the app l ic ation of ni trogen on ly through MS W compost or in di fferent combin ation s with inorganic ferti l izer urea. Treatment with 60 Kg N (urea) + 60 Kg N (compost/ sewage s l udge) main tain s its superi ori ty with respect to organic carbon content in the soil after h arvest of the wheat crop, whi le i t remained nearly unchanged in contro l . In general , val ues of the organic carbon content were found to be h i gher after harvest of the crop. A vai I able N , P, K content of the soi l after harvest of the crop was also found to be h igher compared to presown soil , i n case of compost treated plots .
The results also showed that the appl ication of MS W compost and sewage s l udge has increased the soil h eavy metal content over the pre-sown soi l and control plot. A l though there was an accumul ation of heavy metal s in the soi l , p l ant and grain samples, yet they were found to be under the cri tical l imit , which is consi dered as safe.
With these results , we can concl ude for economic and environ mental reasons that 25% substi tution of urea can be safe l y done by these bio-organics on wheat and m aize fie ld .
11.0 RECOMMENDATIONS FOR MSW COMPOST APPLICATION :
(a) Strictly no farming directly on garbage-Such farmin g i n vo l ves using the organic materi al ric h garbage direct l y as a substratum for agricul ture . The mineral content of such substratum is very h i g h . Several contamin atin g and potential l y h armful substances are also present in the m . When the heavy metal s particularly l i ke zinc , manganese, c admium, c hromiu m , n i ckel an d
39 CPCB ENVIS Centre (www.cpcbenvis . n ic . i n )
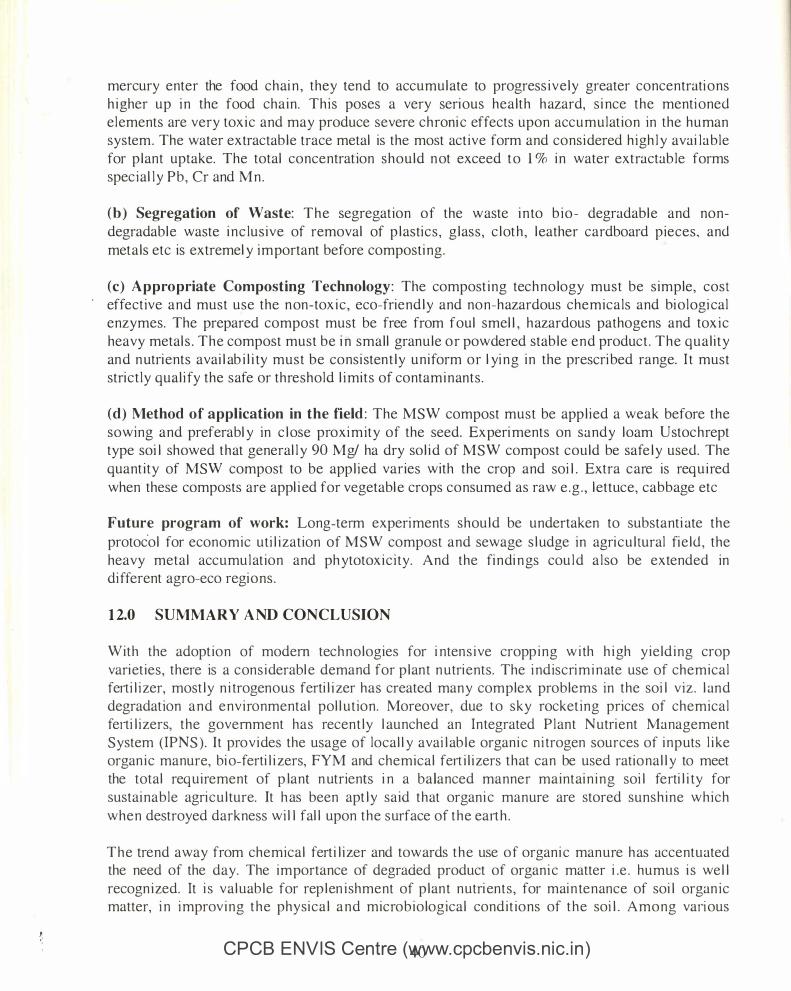
mercury enter the food chai n , they tend to accumul ate to progress ive ly greater concentrati ons h igher up i n the food chain . Th i s poses a very serious hea l th hazard, s i nce the menti oned e l ements are very tox i c and may produce severe chroni c effects upon accumulat ion in the human system . The water extractab l e trace metal is the most act ive form and cons idered h igh l y avai lab le for p l ant uptake. The total concentrat ion shou ld n ot exceed to l % in water extractab le forms spec i al l y Pb , Cr and Mn .
( b ) Segregation of Waste: The segregation of the waste i n to b i o - degradabl e and nondegradabl e waste i n c lus ive of removal of p l asti c s , g l ass , c l oth , l eather cardboard pieces , and meta ls etc is extremel y important before composti ng .
(c) Appropriate Composting Technology : The compost ing techno logy must be s imple , cost effective and must use the n on-tox i c , eco-friend l y and non-hazardous chemica ls and bi o logi cal enzymes. The prepared compost must be free from foul smel l , hazardous pathogens and tox i c heavy metal s . The compost must be i n smal l granu le o r powdered stab l e end product . The qua l i ty and n utri ents avai l ab i l i ty must be consi sten t l y un iform or l yi n g in the prescri bed range. I t must stric t ly qual i fy the safe or thresho ld l i mi ts of contaminants .
(d) Method of application in the field : The MSW compost must be app l i ed a weak before the sowing and preferabl y in c l ose proxi m ity of the seed. Experi ments on sandy loam Ustochrept type soi l showed that general l y 90 Mg/ ha dry so l i d of MSW compost cou ld be safe l y used. The quant i ty of MSW compost to be app l i ed varies with the crop and soi l . Extra care is requ ired when these composts are appl i ed for vegetabl e crops consumed as raw e .g . , l ettuce , cabbage etc
Future program of work: Long-term experiments shou ld be undertaken to substanti ate the protoc.o l for economic uti l i zation of MSW compost and sewage s l udge in agri cu l tural fi e ld , the heavy metal accumu lat ion and ph ytotox ic i ty . And the fi ndi n gs cou l d a l so be extended in di fferent agro-eco regions .
12.0 SUMMARY A ND CONCLUSION
With the adopt ion of modem techno logies for i nten s i ve cropp ing w i th h i gh y ie ld ing crop vari et ies , there is a cons iderabl e demand for p l an t n utri ents . The i ndiscrim inate use of chemica l fe11i l i zer, most l y n i trogenous ferti l i zer has created man y complex problems in the soi l v iz . l and degradation and env ironmental pol l ut ion . Moreover, due to sky rocket ing prices of chemica l fe11i l i zers, the government has recen t ly l aunched an In tegrated P lant Nutri ent Management System (IPNS ) . It prov ides the usage of local l y avai l ab l e organ i c n i trogen sources of i nputs l i ke organ i c manure, bi o-ferti l i zers, FYM and chemica l fe11 i l i zers that can be used rationa l l y to meet the total requirement of p lant n utrients i n a balanced manner maintai n i ng soi l ferti l i ty for sustai nab le agri cu l ture. It h as been apt l y said that organ i c manure are stored sunsh ine wh ich when destroyed darkness wi l I fal l upon the surface of the ea11h .
The trend away from chemica l ferti l i zer and towards t he use of organ i c man ure has accentuated the need of the day. The importance of degraded product of organ i c matter i .e . humus i s we l l recogn ized. It i s va l uab l e for rep l en i shment of p l an t nutri ents , for main tenance of soi l organ ic matter, i n i mprov ing t he physi ca l and microb io logica l condi t ions of t he soi l . Among vaii ous
CPCB ENVIS Centre ('l.WJW.Cpcbenvis . n i c . i n )

organ i c i nputs of IPN S , a new l y emerged source of organi c i n put i s Mun ic ipal So l id Waste (MSW) Compost and Sewage S ludge i n urban and periurban agricu l ture.
Indi a has a good potent ia l for the production and use of MSW based compost and sewage s l udge in v arious cropp ing system. There have been i so lated efforts for the treatment of MSW through compost ing, inc ineration , b io-methanation etc , i nc l udi ng power generat ion . B ut it is thought that concerted efforts should be made to use organ ic port ion of these waste in an env ironment friendl y manner l i ke compost ing rather than di spos ing i t otherwi se. This may a lso m i ti gate scenario l i ke i mproper uti l ization of prime l and near c i t ies as l andfi l l s/ dumpsi tes, green house gas emiss ion, offen s ive odour and h ygiene problems besides loss of energy and nutri ents avai l able in MSW and sewage s l udge. In view of the above facts and constrai ns ,
·central
Pol l ution Contrn.1 Board sponsored a study on Appl i cation of MSW compost and Sewage S l udge in Agri cu l ture to Indi an Agri c u ltural Research Inst i tute ( IARI ) , De lh i wi th the fol l owing objecti ves :
Characterizati on of m anuri a l and hazard potent ial (part icu lar ly in terms of heavy metal s) of so l id waste compost.
Assessment of impact of MSW Compost I D igested Sewage S l udge uti l i zati on in Agri cu l ture and to suggest their safe l i mits of appl ication .
The sal ient fi ndi ngs emerged from the fieldwork and l aboratory studies are summaii zed be low. Growth attributes of wheat and maize crops viz. , p lan t hei ght , n umber of cobs/ti l l ers/m
2, dry
matter production and leaf area i ndex (LAI) , i ncreased due to supp ly of n i trogen through combinat ion of different doses of urea wi th compost/ sewage s l udge. Though a l l the combinat ions showed i ncreased yield over contro l , the two combinat ions havi ng 25% and 50% substitution of urea-N by compost/ sewage s ludge were found to be better and performed wel l i n a l l the above growth attributes a long with 1 00% N (urea) or compost/ sewage s l udge alone ( 1 00%) .
The maize grain y i e ld from the p lot wi th 50% N subst i tut ion of urea i s found to be h i ghest over al l the treatments i .e . , 3 8 . 3 1 q/ha in compost treated fie ld and that from the s l udge treated fi e ld was found to be 37 .44 q/ha.
The weight of b iomass of maize from compost fie ld varied from 50.83 to 77 .9 1 q /ha (max i m um biomass yie ld) . S i m i l arly, the average biomass y ie ld from the s l udge fie ld from the same experi ment were found out to be 7 4.4 7 q /h a (3 1 . 77% more over the absol ute control (0% N) and 1 0 .48% more over the urea control where I 00% N required source i s urea.
Yie ld attributi ng characters of wheat such as length of sp ike , number of spi ke lets per spi ke, number of grai ns per spike and 1 000-grain weight were also found to be great l y i n fl uenced by the appl icat ion of MSW compost/ Sewage S ludge i n comb ination wi th chemica l fert i l i zer urea. The treatment with 1 00% N (compost/ sewage s l udge) h as l ess i n fl uence as compared to treatment wi th 50% N (urea) and 50% N (compost/ sewage s l udge) and 75% N (urea) and 25% N (compost/ sewage s l udge ) . A l though t h e treatment w i t h I 00% N (urea) performed wel l duri ng the ear i y stages of crop growth , t he two treatments v i z . 75% N (urea) and 2 5 % N (compost/
CPCB ENVIS Centrel�www. cpcbenvis . n ic . i n )

sewage s l udge) and 50% N (urea) and 50% N (compost/ sewage s l udge) performed better i n a l l the growth and yi e ld attri butes towards the l ater stage o f the crop.
The mean grai n y ie ld of wheat wi th the treatment 50% N (urea) and 50% N (compost/ sewage sl udge) i ncreased to 37 .36 qha· 1 as compared to 23 . 24 qha· 1 for the control p lo t in case of M S W compost. But , i n case of sewage s l udge treatment with 75% N ( urea) and 25% N (compost/ sewage s l udge) y ie lded 3 7 . 89 qha· 1 as compared to 25 .59 qha· 1 for control p l ot . Though these two treatments along with f ul I dose of urea perform wel I over control and fu l I dose of compost, there is no s ign i fi cant di fference in yi e ld among these combinati on s .
Ni trogen uptake b y wheat and maize crop w i th t he appl i cation of n i trogen through organ i c source, i norgani c source and their combinat ions were a l so studied. I t was found that , total n i trogen uptake i ncreased more conspicuous I y with the combined use of 75% N ( urea) and 25% N (compost/ sewage s l udge) and 50% N (urea) and 50% N (compost/ sewage s l udge) . D uri n g l ater stage o f the crop growth i .e . a t the h arvest stage, n i trogen uptake was found t o b e at peak and wi th the i ncrease in percentage of compost, there was an i ncrease in percentage of n i trogen stored in the grain as compared to straw . Higher n i trogen recoveries were observed for the same two treatments i .e . 75% N (urea) and 25% N (compost/ sewage s ludge) and 50% N (urea) and 50% N (compost/ sewage s l udge) . I t was general l y observed that with the i ncrease in percentage of MSW compost/ Sewage S ludge, there was an i ncrease i n uptake of n i trogen by grain , but wi th the i n crease i n percentage of chemica l ferti l i zer t here was an i ncrease i n uptake of n i trogen by straw on l y .
Regarding ferti l i ty of the soi l , an i mprovement i n the organi c carbon content of soi I was not iced due to the app l icat ion of n i trogen onl y through MSW compost or in differen t combinations with i norgan i c ferti l i zer urea. Treatment with 50% N (urea) and 50% N (compost/ sewage s l udge) maintai n s its superiority with respect to organic carbon content in the soi l after harvest of the wheat crop, wh i l e it remained nearly unchan ged in contro l . In genera l , va l ues of the organ i c carbon content were found to be h i gher after harvest of the crop. Ava i l ab le N , P, K content of the soi l after harvest of the crop was a l so found to be h igher compared to pre-sown soi l , i n case of compost treated p lots .
Trace metal contents of compost can ex i st in a variety of forms as observed for MSW Compost, sewage-sl udge and soi l s . These forms i nc l ude w ater sol ub le , exchan geab le , prec i pi tated as discrete phases, co-prec ip i tated in metal ox ides, and adsorbed or complexed by organ i c compounds. Trace meta l s i n different forms h ave di fferent nobi l i ti es and b io-avai l abi l i t i es and, consequen t ly , have di fferent potent ia l for env ironmental contaminat ions . Water extractab le trace metal i s the most act ive fonn and cons idered h igh l y avai l ab l e for p l an t uptake. Fortunate l y , on l y a sma l l fract ion about < I % of trace metal s i n compost occur i n w ater extractable forms .
The resu l ts a l so showed that t he appl ication of MSW compost and sewage s l udge has i ncreased the soi l heavy metal content parti cu larl y Fe, Pb, Zn, Mn and Cu over the pre-sown soi l and control p lot . A l th ough, there was an accumu lat ion of heavy meta ls in the soi l , p l an t and grain samples , yet they were found to be under the cri t ica l l im i t duri ng four years of experi ments , which i s consi dered as safe.
CPCB ENVIS Centre �.cpcbenvis . n ic . i n )