Extracting Complex Structural Geological Data from Outcrops ...
Upload
khangminh22Category
view
5download
0
land
Article
Groundwater-Extracting Rice Production in the RejosoWatershed (Indonesia) Reducing Urban Water Availability:Characterisation and Intervention Priorities
Ni’matul Khasanah 1,*, Lisa Tanika 1,2, Lalu Deden Yuda Pratama 1 , Beria Leimona 1,Endro Prasetiyo 1, Fitri Marulani 1, Adis Hendriatna 1, Mukhammad Thoha Zulkarnain 1 ,Alix Toulier 3,4,5 and Meine van Noordwijk 1,6,7
�����������������
Citation: Khasanah, N.; Tanika, L.;
Pratama, L.D.Y.; Leimona, B.;
Prasetiyo, E.; Marulani, F.;
Hendriatna, A.; Zulkarnain, M.T.;
Toulier, A.; van Noordwijk, M.
Groundwater-Extracting Rice
Production in the Rejoso Watershed
(Indonesia) Reducing Urban Water
Availability: Characterisation and
Intervention Priorities. Land 2021, 10,
586. https://doi.org/10.3390/
land10060586
Academic Editor: Krish Jayachandran
Received: 8 April 2021
Accepted: 26 May 2021
Published: 1 June 2021
Publisher’s Note: MDPI stays neutral
with regard to jurisdictional claims in
published maps and institutional affil-
iations.
Copyright: © 2021 by the authors.
Licensee MDPI, Basel, Switzerland.
This article is an open access article
distributed under the terms and
conditions of the Creative Commons
Attribution (CC BY) license (https://
creativecommons.org/licenses/by/
4.0/).
1 World Agroforestry (ICRAF), Bogor 16001, Indonesia; [email protected] (L.T.);[email protected] (L.D.Y.P.); [email protected] (B.L.); [email protected] (E.P.);[email protected] (F.M.); [email protected] (A.H.); [email protected] (M.T.Z.);[email protected] (M.v.N.)
2 Forest Ecology and Forest Management Group, Wageningen University & Research,6708 PB Wageningen, The Netherlands
3 Institut de physique du globe de Paris, Université de Paris, CNRS, 75005 Paris, France;[email protected]
4 Laboratoire GéoSciences Réunion, Université de La Réunion, 97744 Saint Denis, France5 HydroSciences Montpellier (HSM), Université Montpellier, IRD, CNR, 34090 Montpellier, France6 Plant Production Systems, Wageningen University & Research, 6700 AK Wageningen, The Netherlands7 Study Group Agroforestry, Faculty of Agriculture, Brawijaya University, Malang 65145, Indonesia* Correspondence: [email protected]
Abstract: Production landscapes depend on, but also affect, ecosystem services. In the Rejosowatershed (East Java, Indonesia), uncontrolled groundwater use for paddies reduces flow of lowlandpressure-driven artesian springs that supply drinking water to urban stakeholders. Analysis of thewater balance suggested that the decline by about 30% in spring discharge in the past decades isattributed for 47 and 53%, respectively, to upland degradation and lowland groundwater abstraction.Consequently, current spring restoration efforts support upland agroforestry development whileaiming to reduce lowland groundwater wasting. To clarify spatial and social targeting of lowlandinterventions five clusters (replicable patterns) of lowland paddy farming were distinguished fromspatial data on, among other factors, reliance on river versus artesian wells delivering groundwater,use of crop rotation, rice yield, fertiliser rates and intensity of rodent control. A survey of farminghouseholds (461 respondents), complemented and verified through in-depth interviews and groupdiscussions, identified opportunities for interventions and associated risks. Changes in artesian welldesign, allowing outflow control, can support water-saving, sustainable paddy cultivation methods.With rodents as a major yield-reducing factor, solutions likely depend on more synchronized plantingcalendars and thus on collective action for effectiveness at scale. Interventions based on this designare currently tested.
Keywords: artesian wells; ecosystem services; landscape approach; Oryza; paddy cultivation;restoration; rodents; sustainable intensification; water balance; Mount Bromo-Tengger
1. Introduction
Ecosystem services are defined as benefits people obtain from ecosystems [1], directlyas goods or indirectly as regulating, cultural, and supporting services dependent on well-functioning ecosystems [2]. There is growing evidence of significant adverse impactsfrom landscape degradation due to land use/cover changes, population growth, andanthropogenic pressures, aggravated by the impacts of global climate change, for exampleincreasing variability of rainfall [3]. These issues deserve attention at the global, regional,
Land 2021, 10, 586. https://doi.org/10.3390/land10060586 https://www.mdpi.com/journal/land
Land 2021, 10, 586 2 of 26
and national levels; sustainable landscape management is needed, encompassing bothupland and lowland issues, to combat landscape degradation and strengthen the resilienceof communities to climate change.
Sustainable landscape management typically implies the application of a landscape-scale approach, which has increasingly been recognised as an opportunity to minimize neg-ative trade-offs and reconcile conservation, agriculture, and rural-to-urban livelihoods [4,5].A ‘landscape(-scale) approach’ emphasises stakeholder engagement, including smallholderperspectives on the achievement of multiple objectives: maintaining ecosystem servicesand goods while improving livelihoods and addressing ‘development deficits’. It alsoimplies integrated assessment of upland–lowland relations and flexible implementation [6].Several landscape management schemes have been introduced to combat landscape degra-dation and to strengthen the resilience of communities, such as through ecosystem servicesco-investment schemes [7]. However, such schemes are still in the pilot stage and usuallyend when external support is withdrawn. Thus, ‘upscaling’ technologies and sustainabilityof interventions is indispensable. Internalization of externalities has to include the estab-lishment of new norms of behaviour, beyond economic incentives in the initial phase. Buildingon the mixed success of ‘scaling up’ technologies that were successful in the locations wherethey were developed, but not as good elsewhere, Sinclair and Coe [8] identified the need for an‘option by context’ approach to addressing the variability of social, economic, and ecologicalissues across geographies for research and development which involves smallholder farmers.Representing the context to characterize variability of farmer’s practices in managing the landthat is needed to operationalise the evaluation of options.
In the context of production landscapes, agriculture both depends on ‘upstream’ecosystem services and influences (often negatively) services for stakeholders further‘downstream’ [9]. For water-related services, the up- and downstream terminology canbe taken literally [10] (i.e., as a spatial geographical location), in other services, it is usedas a metaphor (i.e., upland as the supplier of ecosystem services, while lowland as thebeneficiaries of such services). Land cover type and land use management, includingthe status of property rights [11] in the upland and lowland determine the quantity andquality of the ecosystem services generated and utilized in the landscape. Water availabilitythat is naturally based on a flow from the uplands to adjacent lowlands, is influenced bythe capacity of the watershed to filter and buffer the flows [12,13] in different parts of alandscape. Landscape managers have both legal and perceived rights to modify theseflows, such as by abstracting water that may reduce extractable surface and groundwaterflows. This activity may affect the water supply further down in the landscape, whichat the end will raise complex issues of legal and perceived water rights of the lowlandcommunities. Thus, the understanding of the hydrological relations, is fundamental todisentangle the social interactions and find solutions that manage conflicts and adversetrade-offs. The interactions between farmer practices and ecological subsystems need to bequantitatively understood to manage the overall resource in a fair and efficient way [14].The scale of the overall resource availability and use needs to be connected to that of farmerdecisions, i.e., access rights and appropriation, and that of collective action, essential forreliable solutions and interventions.
The Rejoso watershed in the Pasuruan District, East Java Province (Indonesia) hasexperienced progressive deforestation on the higher slopes of Mount Bromo-Tengger,land use/cover changes across all elevations, and unsustainable farming practices due torapid population growth and anthropogenic pressures [15]. In combination, these changeshave affected the watershed’s function of maintaining ecosystem goods and services,including impact on the quality and quantity of water resources, i.e., depleting the waterflows, increasing risks of droughts and floods, soil erosion, and landslides according tolocal stakeholders [15]. In addition, the government is implementing a national projectto pipe the water from the Rejoso watershed, i.e., from the Umbulan artesian spring tosupply the adjacent districts and cities, including the metropole of Surabaya, the 2ndlargest city of Indonesia and East Java capital. Artesian conditions develop where the
Land 2021, 10, 586 3 of 26
hydraulic head (pressure) from a confined aquifer is higher than the topographic surface,allowing the free flow of groundwater through artesian springs (and/or wells) [16]. Thereare both similarities and differences with the well-documented agricultural over-use ofgroundwater in India, where a reduction of the energy subsidy for pumps provides at leastsome incentives for farmers to only use pumps when needed [17]. The simplest forms orartesian wells flow 24 hours per day and 365 days per year.
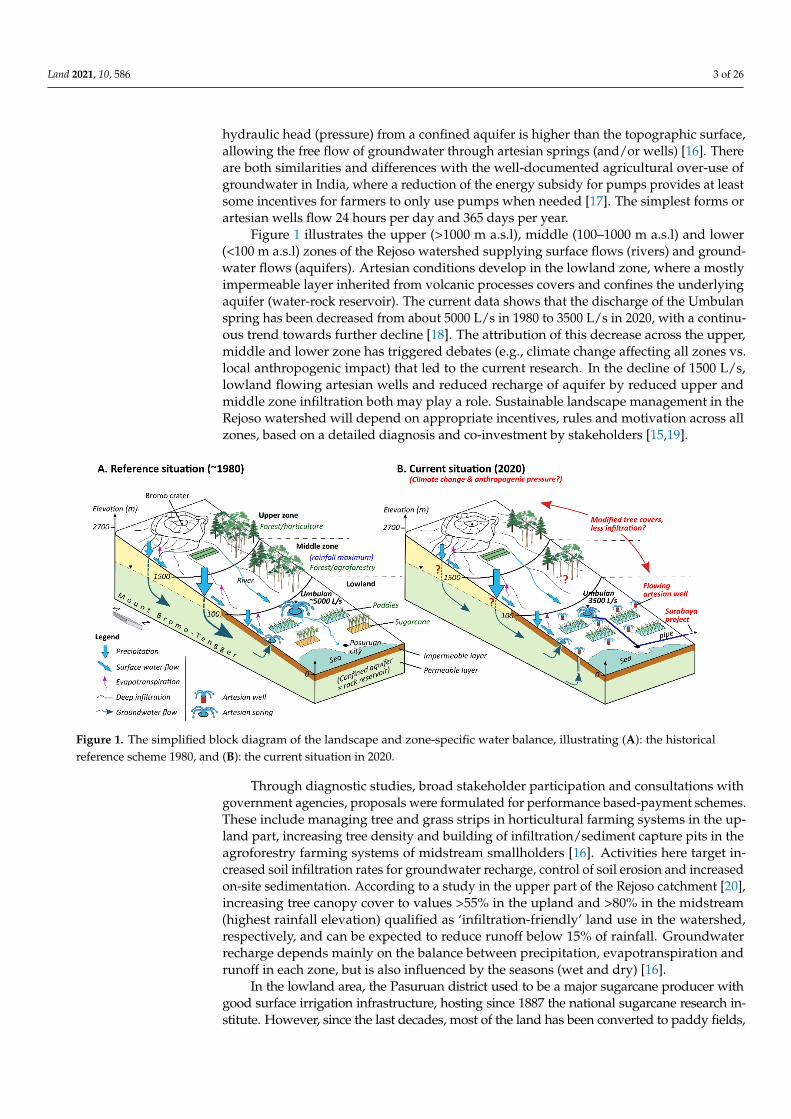
Figure 1 illustrates the upper (>1000 m a.s.l), middle (100–1000 m a.s.l) and lower(<100 m a.s.l) zones of the Rejoso watershed supplying surface flows (rivers) and ground-water flows (aquifers). Artesian conditions develop in the lowland zone, where a mostlyimpermeable layer inherited from volcanic processes covers and confines the underlyingaquifer (water-rock reservoir). The current data shows that the discharge of the Umbulanspring has been decreased from about 5000 L/s in 1980 to 3500 L/s in 2020, with a continu-ous trend towards further decline [18]. The attribution of this decrease across the upper,middle and lower zone has triggered debates (e.g., climate change affecting all zones vs.local anthropogenic impact) that led to the current research. In the decline of 1500 L/s,lowland flowing artesian wells and reduced recharge of aquifer by reduced upper andmiddle zone infiltration both may play a role. Sustainable landscape management in theRejoso watershed will depend on appropriate incentives, rules and motivation across allzones, based on a detailed diagnosis and co-investment by stakeholders [15,19].
Figure 1. The simplified block diagram of the landscape and zone-specific water balance, illustrating (A): the historicalreference scheme 1980, and (B): the current situation in 2020.
Through diagnostic studies, broad stakeholder participation and consultations withgovernment agencies, proposals were formulated for performance based-payment schemes.These include managing tree and grass strips in horticultural farming systems in the up-land part, increasing tree density and building of infiltration/sediment capture pits in theagroforestry farming systems of midstream smallholders [16]. Activities here target in-creased soil infiltration rates for groundwater recharge, control of soil erosion and increasedon-site sedimentation. According to a study in the upper part of the Rejoso catchment [20],increasing tree canopy cover to values >55% in the upland and >80% in the midstream(highest rainfall elevation) qualified as ‘infiltration-friendly’ land use in the watershed,respectively, and can be expected to reduce runoff below 15% of rainfall. Groundwaterrecharge depends mainly on the balance between precipitation, evapotranspiration andrunoff in each zone, but is also influenced by the seasons (wet and dry) [16].
In the lowland area, the Pasuruan district used to be a major sugarcane producer withgood surface irrigation infrastructure, hosting since 1887 the national sugarcane research in-stitute. However, since the last decades, most of the land has been converted to paddy fields,
Land 2021, 10, 586 4 of 26
using additional groundwater resources mostly from flowing artesian wells (Figure 1B). In thiszone, reported problems include diminishing areas of fertile soil for farming (rather thanfor urban expansion), high intensity of pest and diseases, and low paddy productivityindicate unsustainable agricultural practices. Furthermore, intensive use of groundwaterto irrigate the paddy fields decreases the aquifer pressure and then the water productivityof artesian wells and springs as the sources of agriculture and domestic water for localcommunities [16]. Hence, better water management in irrigated areas is one of the targetsfor improved landscape-wide ecosystem services from a lowland, urban water user per-spective. Five crucial root causes of unsustainable agricultural in Rejoso watershed havebeen identified [17] as unsynchronised planting calendars, inefficient use of groundwater,high chemical inputs, imbalanced fertiliser application, and conventional, suboptimal plantingpatterns. The average rice yield at the district and province level is about 5.8 ton per ha [21],which is lower than in other provinces, i.e., Bali and Central Java. East Java Province is thesecond largest (with about 19%) contributor to national paddy production, with 3% of nationallevel produced in Pasuruan District [22]. Therefore, addressing the issues by introducingsustainable paddy cultivation (i.e., optimal use of chemical fertiliser, application of biopes-ticide, improved water management regimes and planting pattern) to increase productivitywhile reducing environmental impacts is essential. Current agricultural practices lead tohigh methane (CH4) and nitrous oxide (N2O) emissions, high intensity of pest and diseasesand low agricultural yield. Water-saving techniques are expected to be financially andenvironmentally beneficial to smallholders by enhancing their resilience to shocks andimproving the capacity of the production landscape to generate ecosystem services [23].Nevertheless, introducing sustainable paddy cultivation beyond the current, conventionalpractices is a challenge, as behavioural changes and biophysical conditions vary.
Understanding the variability of farmer’s practices in managing the land and cultivat-ing paddy is, therefore, considered as an initial step towards pilot actions for the lowlandzone with the potential to scale up sustainable paddy cultivation. To contextualize currentpractices and propose ‘options by context’ as restoration solutions, we thus needed a de-tailed characterisation of paddy farming and possible spatial patterns in cropping intensityand use of river versus groundwater for irrigation. By triangulation of quantitative spatialdata analysis, qualitative insights from the participation of local farmers, communities,and government agencies, and a targeted, quantitative household survey, we hoped tounderstand the rationale(s) of farmers for considering and choosing specific practices.Scenarios for improved resource management at landscape scale require identification ofthe main sustainability risks and local perspectives, at the scale required for impacts to benoticeable. Our analysis of catchment-level water balance, patterns of land and water use,and specific practices used in paddy farming tried to answer questions at three levels:
1. Is there quantitative evidence that the lowland practices are co-responsible for thedecrease of the Umbulan spring’s discharge?
2. Is there relevant geographic variation between villages and hamlets in the farmers’practices in managing land and water in cultivating paddy?
3. Can a participatory survey of paddy cultivation and spatial data analysis for thedevelopment of characteristics identify options by context for upscaling sustainablepaddy cultivation?
We expected that the combined use of quantitative and qualitative methods, togetherwith the participatory approach used in this study, would enable a subsequent scaling-upphase that is salient, credible, and legitimate for all segments of the community at villageand district levels.
2. Site Description and Methodology2.1. The Rejoso Watershed
The Rejoso watershed has an area of 62,773 ha based on the boundaries set by theWatershed Management Agency (BPDAS). It covers 17 sub-districts: Bugul Kidul, GadingRejo, Gondang Wetan, Grati, Kejayan, Kraton, Lekok, Lumbang, Nguling, Pasrepan, Po-
Land 2021, 10, 586 5 of 26
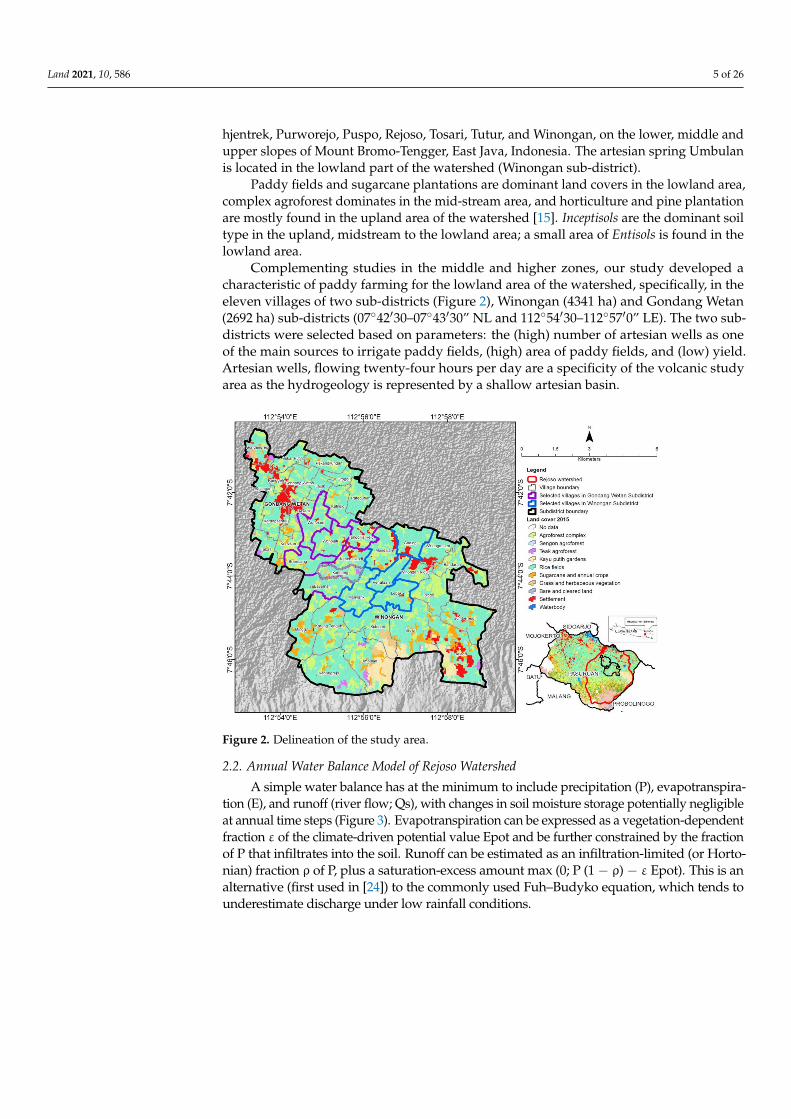
hjentrek, Purworejo, Puspo, Rejoso, Tosari, Tutur, and Winongan, on the lower, middle andupper slopes of Mount Bromo-Tengger, East Java, Indonesia. The artesian spring Umbulanis located in the lowland part of the watershed (Winongan sub-district).
Paddy fields and sugarcane plantations are dominant land covers in the lowland area,complex agroforest dominates in the mid-stream area, and horticulture and pine plantationare mostly found in the upland area of the watershed [15]. Inceptisols are the dominant soiltype in the upland, midstream to the lowland area; a small area of Entisols is found in thelowland area.
Complementing studies in the middle and higher zones, our study developed acharacteristic of paddy farming for the lowland area of the watershed, specifically, in theeleven villages of two sub-districts (Figure 2), Winongan (4341 ha) and Gondang Wetan(2692 ha) sub-districts (07◦42′30–07◦43′30” NL and 112◦54′30–112◦57′0” LE). The two sub-districts were selected based on parameters: the (high) number of artesian wells as oneof the main sources to irrigate paddy fields, (high) area of paddy fields, and (low) yield.Artesian wells, flowing twenty-four hours per day are a specificity of the volcanic studyarea as the hydrogeology is represented by a shallow artesian basin.
Figure 2. Delineation of the study area.
2.2. Annual Water Balance Model of Rejoso Watershed
A simple water balance has at the minimum to include precipitation (P), evapotranspira-tion (E), and runoff (river flow; Qs), with changes in soil moisture storage potentially negligibleat annual time steps (Figure 3). Evapotranspiration can be expressed as a vegetation-dependentfraction ε of the climate-driven potential value Epot and be further constrained by the fractionof P that infiltrates into the soil. Runoff can be estimated as an infiltration-limited (or Horto-nian) fraction ρ of P, plus a saturation-excess amount max (0; P (1 − ρ) − ε Epot). This is analternative (first used in [24]) to the commonly used Fuh–Budyko equation, which tends tounderestimate discharge under low rainfall conditions.

Land 2021, 10, 586 6 of 26
Figure 3. Simplified schema of the water balance components.
For the current analysis, a distinction is needed between surface flows (QS) and ground-water flows (QG) based on three possible transfers between surface and groundwater: deepinfiltration (as fraction of water infiltrated, and reducing the saturation-excess river flow),seepage of water already on the river, and the resurfacing of groundwater in springs andwells. The annual water balance model (assuming no change in storage terms, expressedper unit area) linked four zones i (n = 1 to 4), respectively, labelled Upper, Middle, Lower,and Umbulan spring zone (with areas A[i] in (km2)), and computed as follows:
QSoutflow[i] + QGoutflow[i] = P[i] − E[i] + Qsinflow [i] + QGinflow [i] (1)
with as inputs for each zone i,
P[i] = precipitation (mm/y),
Qsinflow [i] = incoming surface flow (river) corrected for the relative areas of adjacentzones, defined as (A[i − 1]/A[i]) × QS[i − 1]) (mm/y),
QGinflow [i] = incoming groundwater flow corrected for the relative areas of adjacentzones, defined as (A[i − 1]/A[i]) × QG[i − 1]) (mm/y),
and as outputs:E[i] = evapotranspiration defined as ε[i] × Epot[i] with the Eact/Epot ratio ε[i] depen-
dent on tree cover and crop type (mm/y),
QSoutflow[i] = outgoing surface flow (river) (mm/y),
QGoutflow[i] = outgoing groundwater flow (mm/y),
and as internal transfers from groundwater to surface water or vice versa:
QG[i] = A[i − 1]/A[i]) × QG[i − 1] − QG→S[i] + QS→G[i]
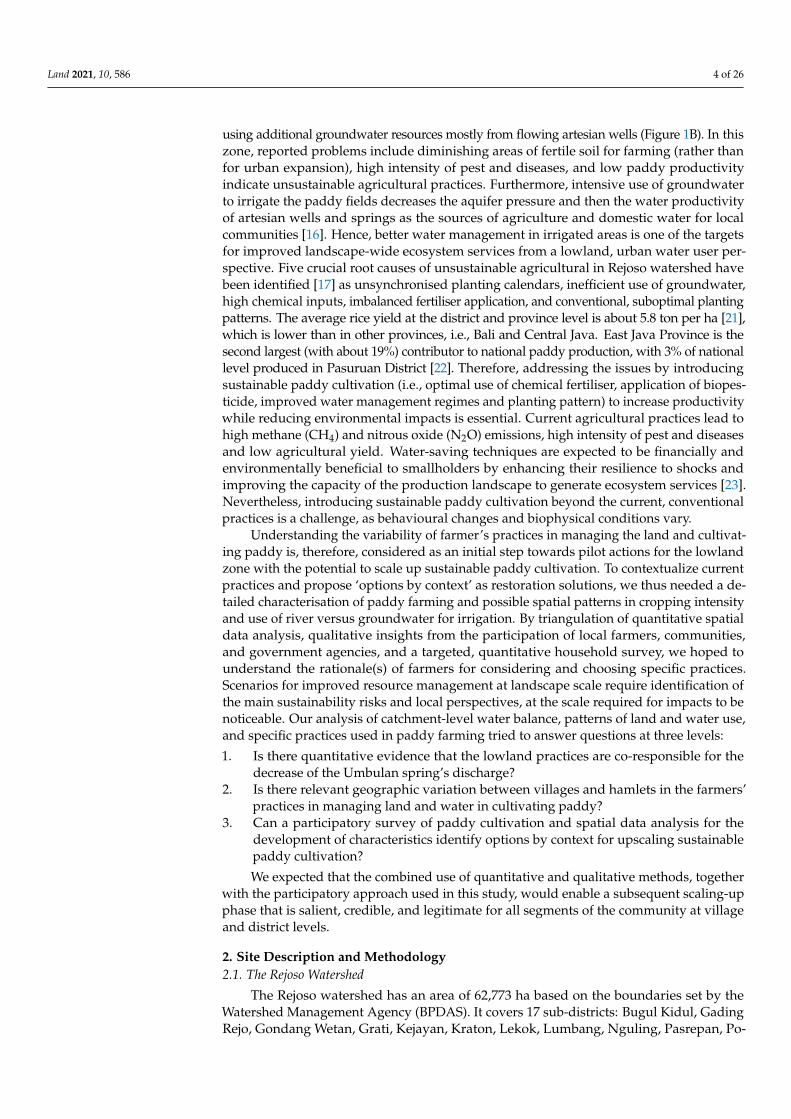
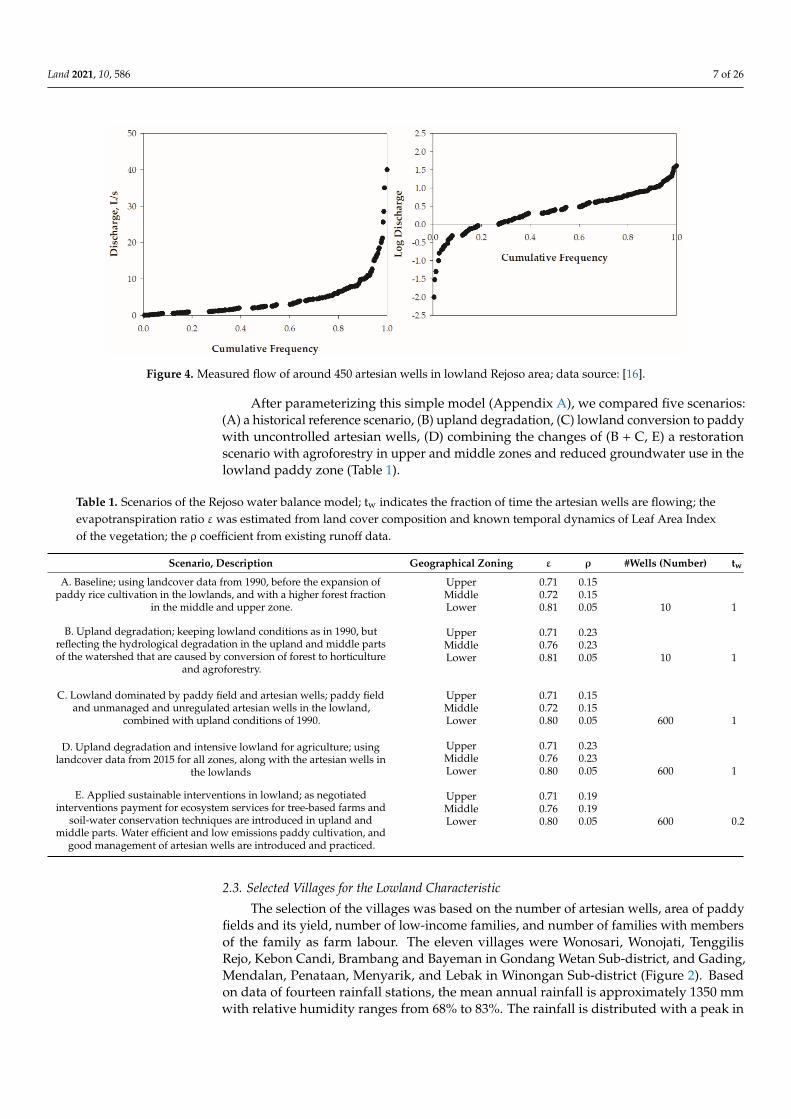
In such a framework, we can represent “upland deforestation” as a decrease in ε and“upland degradation” as an increase in ρ. The shift from upland crops to paddy in thelowland as an increase in ε, plus wells that transfer ground to surface water. Estimatesof the net transfers from surface to groundwater flows Qs→g[i] in the Upper and Middlezone were based on measured river discharge at the transition from Middle to Lower zone.Estimates of the net transfers from groundwater to surface flows Qg→s[i] in the Lowerzone was derived from measured artesian well distribution and flow rates (Figure 4).
Land 2021, 10, 586 7 of 26
Figure 4. Measured flow of around 450 artesian wells in lowland Rejoso area; data source: [16].
After parameterizing this simple model (Appendix A), we compared five scenarios:(A) a historical reference scenario, (B) upland degradation, (C) lowland conversion to paddywith uncontrolled artesian wells, (D) combining the changes of (B + C, E) a restorationscenario with agroforestry in upper and middle zones and reduced groundwater use in thelowland paddy zone (Table 1).
Table 1. Scenarios of the Rejoso water balance model; tw indicates the fraction of time the artesian wells are flowing; theevapotranspiration ratio ε was estimated from land cover composition and known temporal dynamics of Leaf Area Indexof the vegetation; the ρ coefficient from existing runoff data.
Scenario, Description Geographical Zoning ε ρ #Wells (Number) tw
A. Baseline; using landcover data from 1990, before the expansion ofpaddy rice cultivation in the lowlands, and with a higher forest fraction
in the middle and upper zone.
Upper 0.71 0.15Middle 0.72 0.15Lower 0.81 0.05 10 1
B. Upland degradation; keeping lowland conditions as in 1990, butreflecting the hydrological degradation in the upland and middle partsof the watershed that are caused by conversion of forest to horticulture
and agroforestry.
Upper 0.71 0.23Middle 0.76 0.23Lower 0.81 0.05 10 1
C. Lowland dominated by paddy field and artesian wells; paddy fieldand unmanaged and unregulated artesian wells in the lowland,
combined with upland conditions of 1990.
Upper 0.71 0.15Middle 0.72 0.15Lower 0.80 0.05 600 1
D. Upland degradation and intensive lowland for agriculture; usinglandcover data from 2015 for all zones, along with the artesian wells in
the lowlands
Upper 0.71 0.23Middle 0.76 0.23Lower 0.80 0.05 600 1
E. Applied sustainable interventions in lowland; as negotiatedinterventions payment for ecosystem services for tree-based farms and
soil-water conservation techniques are introduced in upland andmiddle parts. Water efficient and low emissions paddy cultivation, and
good management of artesian wells are introduced and practiced.
Upper 0.71 0.19Middle 0.76 0.19Lower 0.80 0.05 600 0.2
2.3. Selected Villages for the Lowland Characteristic
The selection of the villages was based on the number of artesian wells, area of paddyfields and its yield, number of low-income families, and number of families with membersof the family as farm labour. The eleven villages were Wonosari, Wonojati, TenggilisRejo, Kebon Candi, Brambang and Bayeman in Gondang Wetan Sub-district, and Gading,Mendalan, Penataan, Menyarik, and Lebak in Winongan Sub-district (Figure 2). Basedon data of fourteen rainfall stations, the mean annual rainfall is approximately 1350 mmwith relative humidity ranges from 68% to 83%. The rainfall is distributed with a peak in

Land 2021, 10, 586 8 of 26
January and a dry season in August, and the annual mean of maximum and minimum airtemperatures are 20 ◦C and 34 ◦C, respectively.
2.4. Development of Paddy Farming Characteristic
Figure 5 presents the flow of development of paddy farming characteristic. Thedevelopment of paddy farming characteristic used the cluster analysis approach. A clusteranalysis is a process of grouping a set of parameters in such a way that parameters in thesame group (a cluster) are more similar to each other than to those in other groups. Twelveparameters were collected through spatial data analysis and survey of paddy cultivationthat both were verified through a participatory process reflecting the variability of thepaddy field, farmers characteristics and their cultivation practices in the lowland area ofthe Rejoso watershed. These parameters were (1) area of paddy fields, (2) density of thechannel network, (3) fraction of area with crop rotation, (4) intensity of pest (rodents),(5) rice yield, (6) dose of urea (46% N) fertiliser, (7) dose of compound fertiliser (15%of N, 15% of P, and 15% of K), (8) number of pesticide types applied, (9) existence of awater regulatory officer (ulu-ulu), (10) number of artesian wells, (11) river as the mainwater source, and (12) number of water sources. The development of paddy farmingcharacteristic emphasises on the landscape-approach as the methods applied in this studyengage the direct stakeholders, i.e., smallholders with multiple objectives of positiveenvironmental impacts with substantial livelihood improvement reflecting by the selectionsof identified and analysed parameters, as part of the more comprehensive picture of theRejoso watershed.
Figure 5. Flow diagram of cluster analysis to develop paddy farming characteristic.
2.4.1. Spatial Data Analysis
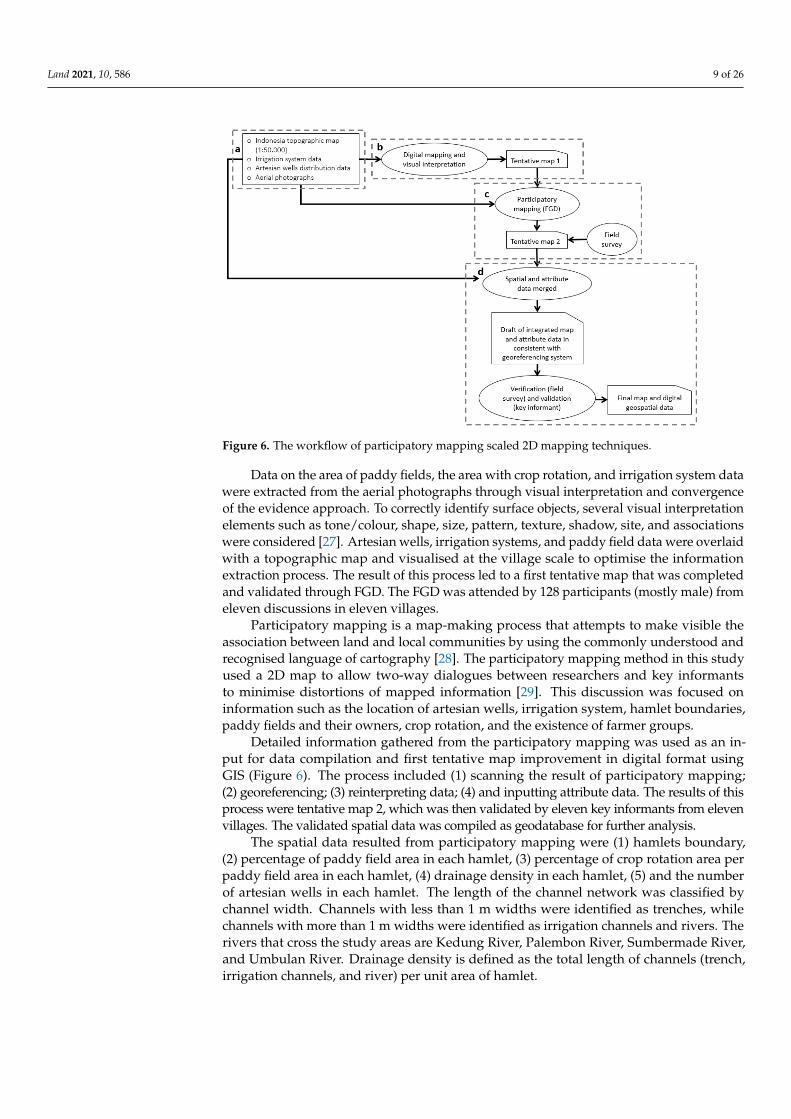
Figure 6 presents the workflow of paddy field and irrigation system mapping thatconsists of four main steps: (a) data gathering, (b) visual interpretation, (c) participatorymapping, (d) data analysis, and visualisation.
Primary data collected through a survey and participatory approach and secondarydata were two main data used for the mapping. A drone survey was conducted to obtainaerial photographs of paddy field, while focus group discussions (FGD) and key informantinterviews were the approaches to obtain locations of artesian wells and detailed infor-mation of paddy fields. The secondary data were topographic maps at 1:50.000 scale [25],irrigation systems data [26], and artesian well distribution [16].
Land 2021, 10, 586 9 of 26
Figure 6. The workflow of participatory mapping scaled 2D mapping techniques.
Data on the area of paddy fields, the area with crop rotation, and irrigation system datawere extracted from the aerial photographs through visual interpretation and convergenceof the evidence approach. To correctly identify surface objects, several visual interpretationelements such as tone/colour, shape, size, pattern, texture, shadow, site, and associationswere considered [27]. Artesian wells, irrigation systems, and paddy field data were overlaidwith a topographic map and visualised at the village scale to optimise the informationextraction process. The result of this process led to a first tentative map that was completedand validated through FGD. The FGD was attended by 128 participants (mostly male) fromeleven discussions in eleven villages.
Participatory mapping is a map-making process that attempts to make visible theassociation between land and local communities by using the commonly understood andrecognised language of cartography [28]. The participatory mapping method in this studyused a 2D map to allow two-way dialogues between researchers and key informantsto minimise distortions of mapped information [29]. This discussion was focused oninformation such as the location of artesian wells, irrigation system, hamlet boundaries,paddy fields and their owners, crop rotation, and the existence of farmer groups.
Detailed information gathered from the participatory mapping was used as an in-put for data compilation and first tentative map improvement in digital format usingGIS (Figure 6). The process included (1) scanning the result of participatory mapping;(2) georeferencing; (3) reinterpreting data; (4) and inputting attribute data. The results of thisprocess were tentative map 2, which was then validated by eleven key informants from elevenvillages. The validated spatial data was compiled as geodatabase for further analysis.
The spatial data resulted from participatory mapping were (1) hamlets boundary,(2) percentage of paddy field area in each hamlet, (3) percentage of crop rotation area perpaddy field area in each hamlet, (4) drainage density in each hamlet, (5) and the numberof artesian wells in each hamlet. The length of the channel network was classified bychannel width. Channels with less than 1 m widths were identified as trenches, whilechannels with more than 1 m widths were identified as irrigation channels and rivers. Therivers that cross the study areas are Kedung River, Palembon River, Sumbermade River,and Umbulan River. Drainage density is defined as the total length of channels (trench,irrigation channels, and river) per unit area of hamlet.

Land 2021, 10, 586 10 of 26
2.4.2. Survey of Paddy Cultivation
The survey of paddy cultivation aimed to gather information about paddy cultivationpractices and related issues in the eleven villages of the two sub-districts, Gondang Wetanand Winongan. The survey was conducted from August to October 2019. The surveyconsisted of (1) survey preparation including the development of survey questionnaireand training on interview technique, (2) respondent selection and interview process, and(3) data cleaning and analysis.
The questionnaire was designed to survey five main parameters related to paddycultivation practices and its issues: (1) yield, (2) dose of fertiliser, (3) number of pesticidetypes, (4) water sources, and (5) intensity of pest (rodents). For further analysis, the dose offertiliser was divided into (a) urea fertiliser (46% of nitrogen) and (b) compound fertiliser(15% of nitrogen, 15% of phosphate and 15% of potassium), while water source parameterwas divided into (a) river as the main water source, (b) number of water resources, and(c) existence of a water regulatory officer (ulu-ulu).
Table 2 presents the distribution and characteristics of respondents by village, age, andnumber and size of plots/fields owned/managed. In total, there were 461 respondents, therespondent’s information gathered from chairs of farmer groups, and applying a snowballtechnique. The age of respondents varied from 22 to 83 years old and was 56 years old onaverage. The respondents of this study at least owned/managed one plot. The maximumnumber of plots owned/managed was 25. The average area owned/managed by therespondents was 0.25 ha. The smallest was 0.05 ha, and the largest was 2.25 ha.
Table 2. Respondent distribution and characteristic of paddy cultivation survey.
Sub-Districts Villages Number ofRespondents
Age DistributionNumber of Plots
Owned/Managed perRespondent
Owned/ManagedArea per Plot (ha)
Max Min Avg Max Min Avg Max Min Avg
Gondang Wetan
Bayeman 34 80 31 59 6 1 3 0.80 0.10 0.26Brambang 32 70 26 51 8 1 4 2.25 0.10 0.27
Tengglis Rejo 38 79 35 60 10 1 5 0.60 0.10 0.23Kebon candi 67 74 33 55 8 1 3 0.50 0.06 0.22
Wonojati 93 83 22 54 17 1 18 2.00 0.05 0.27Wonosari 31 80 28 57 12 1 4 0.85 0.07 0.28
Winongan
Gading 31 70 33 55 25 1 8 0.50 0.05 0.18Lebak 33 73 25 51 6 1 3 1.10 0.09 0.35
Mendalan 34 70 40 56 13 1 3 0.60 0.07 0.24Menyarik 32 70 29 57 6 1 2 1.33 0.08 0.20Penataan 36 83 32 56 5 1 2 0.60 0.10 0.26
2.5. Data Analysis
For paddy cultivation data, data analysis was performed after data cleaning is com-pleted. The cleaning included filtering location of paddy field and domicile of farm-ers/respondents. We only considered respondents who stay and manage the farm in theeleven villages. In the data analysis process, the basic statistical analysis was used toanalyse and explore the variation of the data at sub-district, village and hamlet scale. Thebasic statistical analysis included an average of yield, dose of fertiliser and number of typesof pesticide; percent of respondents with perception on high intensity of rodent and useof artesian wells. Once the analysis completed, the result was interpreted by sub-district,village, and hamlet. Then, we used hamlet as the unit of cluster analysis considering thesocial characteristic of paddy cultivation management, the existence of farmer group andwater regulatory officer in each hamlet. The information on hamlet was described on thespatial maps under the Results section.
As we worked with extensive data set, for the cluster analysis, we applied the K-meansapproach to cluster the data and used the elbow method to find the optimum number ofclusters [30]. Before we clustered the data, we conducted a correlation analysis of the twelve

Land 2021, 10, 586 11 of 26
parameters that were extracted at the hamlet level to verify the statistical independence ofthe twelve parameters used (Figure 5).
3. Results3.1. Water Balance
Parameters for the water balance model were adjusted to account for the approx-imately 5000 L/s Umbulan spring flow in reference scenario A (see results in Table 3).Upland degradation alone (Scenario B) would likely lead to increased river flow (due toincreased runoff triggered by lower evapotranspiration in the uplands) and some decreaseof the Umbulan spring flow (due to lower infiltration, i.e., lower recharge on the mountainslope). Lowland conversion to paddy with current artesian wells (Scenario C) woulddecrease both river flow and Umbulan spring flow.
Table 3. Predicted discharge of the Umbulan spring, river and groundwater flow for five land use scenarios: A) a historicalreference scenario, B) upland degradation, C) lowland conversion to paddy with uncontrolled artesian wells, D) combiningthe changes of B + C, and E) a restoration scenario with agroforestry in upper and middle zones and reduced groundwateruse in the lowland paddy zone.
ScenarioPredicted
Umbulan (L/s)Predicted Mean River Flow, (m3/s) Predicted Groundwater Flow, (m3/s)
Upper Middle Lower Upper Middle Lower
A 5087 2.5 6.7 12.4 1.5 5.3 0.05B 4310 2.7 7.3 12.1 1.3 4.4 0.04C 4206 2.5 6.7 12.5 1.5 5.3 0.04D 3496 2.7 7.3 12.1 1.3 4.4 0.03E 4468 2.6 6.9 12.1 1.4 4.7 0.04
Combining the changes of scenario B and C (Scenario D), river flow would approx-imate that of scenario B, but the Umbulan flow would be reduced to approximately thelevel currently observed (31% reduction). Attribution of this reduction (A–D), with 1.3%interaction, would be for about 15% to the middle and upper zone, and 17% to the lowland.The restoration potential in Scenario E is estimated to nearly 4500 L/s, at which the plannedofftake of 4000 L/s still leaves sufficient discharge for local use.
3.2. Area of Paddy Field and Crop Rotation
The paddy fields in eleven villages reached 980.2 ha in both targeted sub-districts,with 536.1 ha (54.7%) in Winongan Sub-district. The villages Gading, Mendalan, andMenyarik in Winongan Sub-district had the largest area of paddy fields, with 119.6 (12.2%),118.7 (12.1%), and 118.6 (12.1%) ha, respectively. On the other hand, Kebon Candi Villagein Gondang Wetan Sub-district had 56.4 ha of paddy fields, the smallest among all othervillages (Table 4). At the hamlet level, Kemong Hamlet in Lebak Village (Winongan Sub-district) had the largest percentage of paddy fields reaching 91%, which meant that only9% of the area was used for non-agricultural activities. Areas with smaller percentages ofpaddy fields were in Gondang Wetan Sub-districts, starting from 0 to 30.9% (Figure 7A).

Land 2021, 10, 586 12 of 26
Table 4. Distribution of area of paddy field (ha), the area with crop rotation (ha), number of artesian wells, and drainagedensity (km/km2) in each village in two sub-districts.
Sub-Dis-Tricts
Villages Area ofPaddy (ha)
ArtesianWells perHa Paddy
Artesian WellWater #,mm/Day
Lengthof Chan-
nels(km)
DrainageDensity
(km/km2)
Main Water Sources (%Respondents)
River ArtesianWells
GondangWetan
Bayeman 97.5 0.73 17.6 13.7 7.4 58 42Tenggilis Rejo 80.1 0.45 10.9 11.2 7.9 46 54
Wonosari 74.3 0.35 8.5 8.4 5.9 99 1Brambang 60.5 0.41 10.0 8.3 5.6 38 62
Kebon Candi 56.4 0.41 9.9 7.3 6.1 54 46Wonojati 75.3 0.25 6.1 9.6 5.9 70 30
Winongan
Lebak 91.4 0.33 7.9 11.2 6.5 90 10Penataan 87.8 0.33 8.0 10.1 7.9 91 9Gading 119.6 0.18 4.2 18.5 10.4 100 0
Menyarik 118.6 0.18 4.3 16.6 8.1 94 6Mendalan 118.7 0.14 3.5 20.3 10.0 67 33
# Assuming a constant (24/365) median well flow rate of 2.8 L/s.
Figure 7. Spatial distribution of the percentage of paddy field area (A) and area with crop rotation (B) at hamlet level.

Land 2021, 10, 586 13 of 26
Crop rotation is a vital paddy farming practice to reduce the intensity of pests anddiseases, and to improve soil fertility. Different crops rotated with paddy included corn,beans, taro, chilli, and other crops. Villages in Gondang Wetan Sub-district tended towardcrop rotating more often compared to those in Winongan Sub-district. The area of croprotation reached 30.1 ha, and 26.6 ha of it (88.5%) was found in Gondang Wetan Sub-district. Brambang Village in Gondang Wetan Sub-district was the village with the largestarea of crop rotation with 10.9 ha, while Penataan Village in Winongan Sub-district hadonly 0.34 ha, the smallest area compared to other villages (Table 5). At the hamlet level,Brambang Barat Hamlet in the village of Brambang had the largest area of crop rotation,reaching 34.6% of the total paddy field area (Figure 7B). Hamlets in Gondang Wetan Sub-district had a percentage of area with crop rotation between 4.3–11%. Other hamlets wereclassified as having a low rotation area, which was less than or the same as 4.2% and it wasrelatively common in Winongan Sub-district.
Table 5. Distribution of rice yield (ton/ha), fertiliser application (kg/ha), number of type of pesticides applied, watersources (% respondent), and intensity of rodents (% respondent) in each village in two sub-districts.
Sub-Districts VillagesRice Yield
(Ton/ha/CroppingSeason)
Fertilizer Application(kg/ha)
Area withCrop Rotation
(ha)
Number of Typeof Pesticides
Applied
Intensity ofRodents (%
Respondents)Urea Compound
Gondang Wetan
Bayeman 6.7 354 308 4.7 4 61Tenggilis Rejo 4.1 601 370 2.5 5 96
Wonosari 5.1 375 299 2.5 5 37Brambang 5.1 425 315 10.9 6 27
Kebon Candi 4.2 461 348 2.3 6 55Wonojati 4.5 408 293 3.9 6 36
Winongan
Lebak 4.5 257 231 1.0 5 52Penataan 5.0 318 252 0.3 5 71Gading 6.2 411 268 0.9 4 92
Menyarik 4.7 396 309 0.4 5 70Mendalan 4.3 332 268 0.7 4 94
3.3. Water Sources and Irrigation Systems
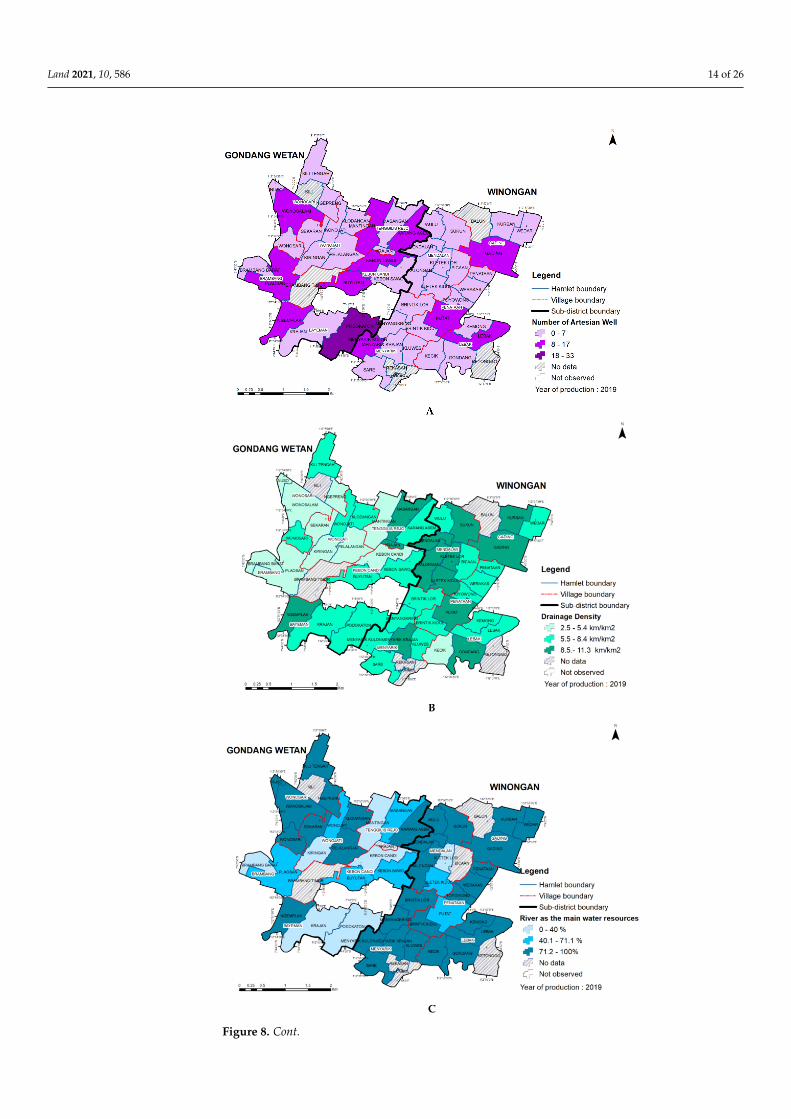
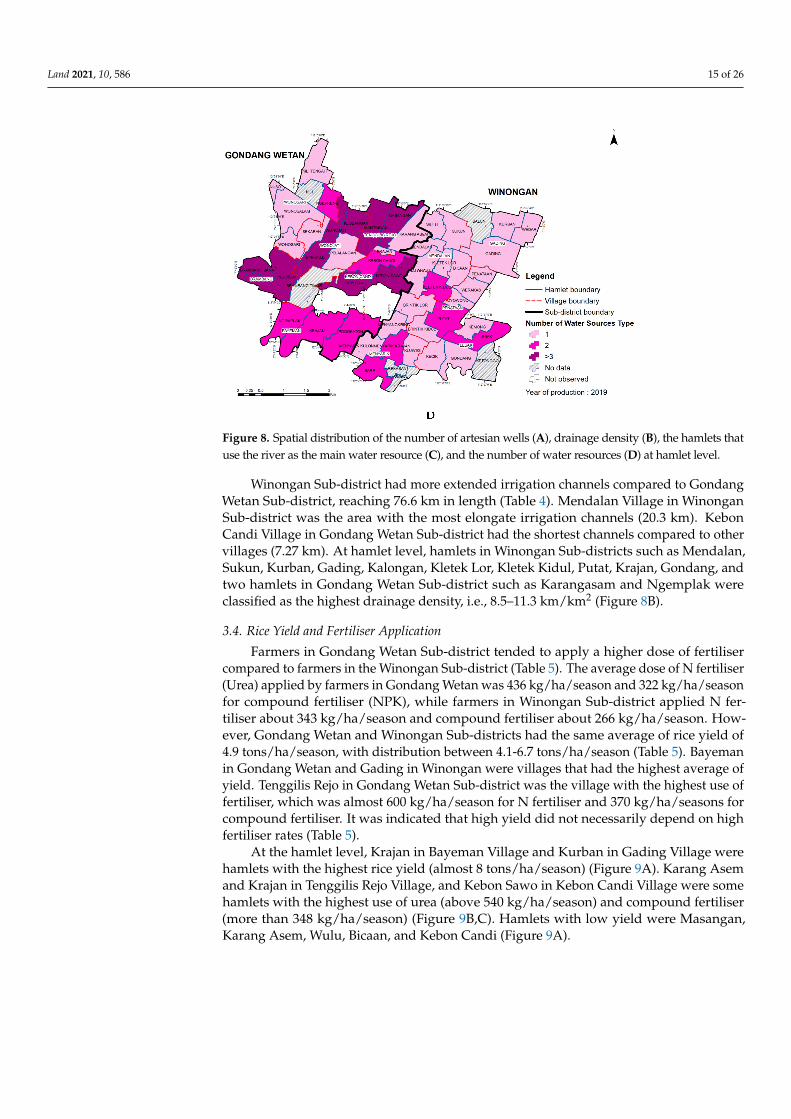
Rivers and artesian wells were two primary water sources to irrigate paddy fields inGondang Wetan and Winongan Sub-districts. Water from those two sources flowed into theirrigation channel, but in some cases, the artesian wells were located inside the paddy fieldsitself. The total number of artesian wells reached 318 points spread across 11 villages, and63% of it was found in Gondang Wetan Sub-district (Table 4). In line with this distribution,89% of respondents in Winongan Sub-district mentioned that the river was more dominantthan artesian wells as a water source to irrigate their paddy fields, while in Gondang WetanSub-district, they were only 61% of respondents (Table 4). Brambang Village was the villagewith the lowest percentage of respondents that mentioned river water as the primary source.Therefore, one paddy field could use river water and more than two artesian wells (shared withother farmers) (Figure 8D). At the hamlet level, most artesian wells were found in PodokatonHamlet of Bayeman Village of Gondang Wetan Sub-district. Some hamlets were identifiedto have artesian wells between 8 to 17 wells. Other hamlets had less than eight wells. NusoHamlet at Wonosari Village was the only hamlet without artesian wells for irrigation, relyingalmost 100% on river water to irrigate paddy fields (Figure 8A,C).
Land 2021, 10, 586 14 of 26
Figure 8. Cont.
Land 2021, 10, 586 15 of 26
Figure 8. Spatial distribution of the number of artesian wells (A), drainage density (B), the hamlets thatuse the river as the main water resource (C), and the number of water resources (D) at hamlet level.
Winongan Sub-district had more extended irrigation channels compared to GondangWetan Sub-district, reaching 76.6 km in length (Table 4). Mendalan Village in WinonganSub-district was the area with the most elongate irrigation channels (20.3 km). KebonCandi Village in Gondang Wetan Sub-district had the shortest channels compared to othervillages (7.27 km). At hamlet level, hamlets in Winongan Sub-districts such as Mendalan,Sukun, Kurban, Gading, Kalongan, Kletek Lor, Kletek Kidul, Putat, Krajan, Gondang, andtwo hamlets in Gondang Wetan Sub-district such as Karangasam and Ngemplak wereclassified as the highest drainage density, i.e., 8.5–11.3 km/km2 (Figure 8B).
3.4. Rice Yield and Fertiliser Application
Farmers in Gondang Wetan Sub-district tended to apply a higher dose of fertilisercompared to farmers in the Winongan Sub-district (Table 5). The average dose of N fertiliser(Urea) applied by farmers in Gondang Wetan was 436 kg/ha/season and 322 kg/ha/seasonfor compound fertiliser (NPK), while farmers in Winongan Sub-district applied N fer-tiliser about 343 kg/ha/season and compound fertiliser about 266 kg/ha/season. How-ever, Gondang Wetan and Winongan Sub-districts had the same average of rice yield of4.9 tons/ha/season, with distribution between 4.1-6.7 tons/ha/season (Table 5). Bayemanin Gondang Wetan and Gading in Winongan were villages that had the highest average ofyield. Tenggilis Rejo in Gondang Wetan Sub-district was the village with the highest use offertiliser, which was almost 600 kg/ha/season for N fertiliser and 370 kg/ha/seasons forcompound fertiliser. It was indicated that high yield did not necessarily depend on highfertiliser rates (Table 5).
At the hamlet level, Krajan in Bayeman Village and Kurban in Gading Village werehamlets with the highest rice yield (almost 8 tons/ha/season) (Figure 9A). Karang Asemand Krajan in Tenggilis Rejo Village, and Kebon Sawo in Kebon Candi Village were somehamlets with the highest use of urea (above 540 kg/ha/season) and compound fertiliser(more than 348 kg/ha/season) (Figure 9B,C). Hamlets with low yield were Masangan,Karang Asem, Wulu, Bicaan, and Kebon Candi (Figure 9A).

Land 2021, 10, 586 16 of 26
Figure 9. Spatial distribution of rice yield (A), urea application (B), and compound fertiliser (C) athamlet level.

Land 2021, 10, 586 17 of 26
3.5. Intensity of Pest/Rodents and Number of Type of Pesticides Applied
Regarding the main problem of paddy cultivation, farmers in both Gondang Wetanand Winongan Sub-districts agreed that the high intensity of rodent attacks was the majorproblem in need of immediate attention. However, the respondents in Winongan Sub-district mentioned that rodents were the main problem, and their condition was worse thanin Gondang Wetan (Table 5). Figure 10A shows that most paddy fields in Winongan Sub-district suffered from rodents. In Gondang Wetan Sub-district, only paddy fields in hamletsor villages next to Winongan Sub-district had a high intensity of rodent attacks, especiallyduring rainy season. Until this study was undertaken, farmers were still struggling withhow to deal with rodents. In terms of pests and disease control, there were more than 100brands of pesticides used by farmers. Farmers in Gondang Wetan and Winongan Sub-districts used at least three brands, but some applied more than seven brands of pesticidesin one season. In general, farmers in Gondang Wetan Sub-district applied more brands ofpesticides compared to farmers in Winongan Sub-district (Figure 10B).
Figure 10. Spatial distribution of the intensity of pest/rodents (A) and number of types of pesticideapplied (B) at hamlet level.

Land 2021, 10, 586 18 of 26
3.6. Characteristic of Paddy Farming
The twelve parameters (paddy field area, drainage density, number of artesian wells, thedose of N fertiliser, the dose of compound fertiliser, number of pesticide types, yield, the areawith crop rotation, the intensity of rodents attack, number of water sources, river as the primarywater source and presence of water regulatory officer) are independent to each other. Thecluster analysis of the twelve parameters and the elbow method (Figure 11) allows us to havefive clusters of paddy fields in eleven villages of Gondang Wetan and Winongan Sub-districts.Figure 12 presents the map of the resulting characteristic of paddy farms in eleven villages, andTables 6 and 7 describe the characteristics of each cluster. Cluster 1 was in Gondang WetanSub-district, cluster 2 was mostly in Winongan Sub-district, and cluster 5 was spread evenly inboth sub-districts (Figure 12). Meanwhile, clusters 3 and 4 consisted of only 1 hamlet, whichwas located in Gondang Wetan Sub-district.
Figure 11. Dependence of distance level on the number of clusters as basis for elbow method ofoptimal cluster number to be used for the characteristic of paddy farming.
Figure 12. Characteristic of paddy farming in Gondang Wetan and Winongan Sub-districts.

Land 2021, 10, 586 19 of 26
Table 6. The result of cluster analysis and characteristic results for the 12 parameters.
No Parameters UnitClusters
1 2 3 4 5
1 Area of paddy field % High(218 ha)
High(407 ha)
Low(9 ha)
Low(29 ha)
Medium(230 ha)
2 Flow density (irrigation, river andtrench) km/km2 Medium High Low Medium Low
3 Area with crop rotation % Medium Low High High Low4 Intensity of pest (rodents) % respondents Medium High Low High Low5 Rice yield Ton/ha Low Low Medium High Medium6 Dose of urea fertiliser (46% of N) kg/ha High Low Medium High Low
7 Dose of compound fertiliser (15% of N,15% of P, and 15% of K) kg/ha Medium Low High High Low
8 Types of applied pesticide Number Medium Low Medium Medium Medium
9 The presence of ‘Ulu-ulu’ as a waterregulatory officer
Existing/notexisting Exist Not exist Exist Not exist Exist
10 Artesian wells Number High Medium Low High Medium11 River as the main water source % of respondents Medium High Low Low High12 Types of water sources Number High Low High Medium Low
Table 7. Description of each paddy field type.
Clusters Description
1
High paddy field fraction, medium drainage density, and a high number of artesian wells. The dose of application of Nfertiliser is high, and use of compound fertiliser is medium, but rice yield is low. The number of pesticide types is medium.
The area with crop rotation and intensity of pests (rodents) is medium. The paddy field area with rivers as the main sources ofwater is medium, but still have a high number of water resources. There is an ‘Ulu-ulu’ as the water regulatory officer.
2
High paddy field fraction and drainage density, with a medium number of artesian wells. Doses of application N andcompound fertiliser are low and rice yield is relatively low. The number of pesticide types is low. The area with croprotation is low, hence the intensity of pests (rodents) is high. The rivers have a very important role as the main water
source so that the number of other water sources is low. There is no ‘Ulu-ulu’ as the water regulatory officer.
3
Low paddy field fraction, low drainage density, and few artesian wells. Doses of application of N fertiliser are mediumand those of compound fertiliser high while yield is at a medium level. The number of pesticide types is medium. Thearea with crop rotation area is high, and the intensity of pests (rodents) is low. The rivers have a small role as a source of
water so that the number of other water sources is high. There is an ‘Ulu-ulu’ as the water regulatory officer.
4
Low paddy field fraction, with medium drainage density and a high number of artesian wells. The rate of application ofN and compound fertiliser is high and followed by high yield. The number of pesticide types is medium. The area withcrop rotation is high, but the intensity of pests (rodents) is still high. Rivers have a small role as a source of water, but
the number of other water sources is medium. There is no ‘Ulu-ulu’ as the water regulatory officer.
5
Medium paddy field fraction, with low drainage density and a medium number of artesian wells. The dose ofapplication of N and compound fertiliser is low, but yield is medium. The number of pesticide types is medium. Thearea with crop rotation is low, hence the intensity of pests (rodents) is low. The rivers have a critical role as the main
water source so that the number of other water sources is low. There is an ‘Ulu-ulu’ as a water regulatory officer.
4. Discussion4.1. Relevance of Reducing Groundwater Use in Lowland Zone
Our first question was seeking quantitative evidence that the lowland practices areco-responsible for the decrease of the Umbulan spring’s discharge. The estimated totaloutflow of the artesian wells (over 2400 L/s in 450 measured wells; currently there maybe 600 wells) does not fully account for the observed decline in the Umbulan springflow record (from 5000 to 3500 L/s with a declining trend). The water balance results ofTable 3 suggest that the lowland paddy production through its reliance on unconstrainedartesian wells has been the major contributor to the observed decline of the Umbulanspring, but changes in the upper and middle zone also contribute. The water balancemodel includes some interactions between surface and groundwater flows, but modelsat a higher temporal resolution that include seasonal patterns of rainfall could refine theresults in future. The attribution of effects as 55% lowlands, 49% upland and 4% interactionis, at the current level of detail in the analysis, only indicative; however, it is consistent

Land 2021, 10, 586 20 of 26
with process understanding. Models that operate on a daily time step and at higher spatialresolution will be needed [31,32], but tend to require parametrization efforts that challengecurrent data availability.
4.2. Groundwater-Wasting Irrigation Methods: Understanding Farmer Decisions
The second question sought relevant geographic variation between villages andhamlets in the farmer’s practices in managing land and water in cultivating paddy. Theshift from rainfed sugarcane to irrigation-based paddies in Pasuruan district got a boostwhen relatively cheap groundwater drilling with bore holes of 10–100 m (or more) providedadditional water, year-round. Without any control valve to manage the well’s flow, excessgroundwater was channelled back to the river and then lost to the sea. Agronomically,the water supply is considerably in excess of crop demand, with the average 10 mm/dayof well supply per unit paddy area, two to three times the potential evapotranspirationrate, even without accounting for rainfall and river-based irrigation water. The highcrop frequency, approaching three crops per year and currently reaching five crops pertwo years leaves short time for a break between crops. As the landscape as a whole ispermanently saturated, the rice crop does not ripen off well and the harvested productis only of medium quality. Crop rotations with other crops are applied to only a smallpart of the area. Despite abundant water availability and intensive fertilization, however,rice yields of around 5 ton per ha in the survey were below the 5.8 ton per ha reportedfor the district [19] and representing a nearly 50% yield gap relative to the potential yieldfor irrigated rice in Indonesia of around 9.5 ton per ha [33]. Within our data, there wasno indication that variation in yields were related to variation in fertilizer level (eitherUrea or compound fertilizer, the two were strongly correlated). Rodents were widely seenby farmers as the main yield-reducing factor, and despite ample use of pesticides, couldnot be controlled at farmer level. It appears that the current intensification pathway isreaching a dead end, where they produce large volumes of a medium quality productat considerable environmental costs and, even if these externalities are ignored, modestfarmgate profitability.
Investment in closing the existing wells and replacing them by wells with improveddesign that can be turned off when not needed appears to be a cost-effective way forexternal stakeholders to recover the flow at the Umbulan spring (and the millions ofhouseholds that can thus be supported). In addition, the irrigation from artesian wellsonly during the night can avoid water wasting from evaporation process during the day.A substantial reduction of groundwater wasting seems to be feasible without risking watershortages in critical periods for the crop. However, for a free flowing well the only decisionis in its construction, whereas a controlled well requires agreements among farmers aboutwhen it will be opened.
4.3. Collective Action Aspects of Solutions
The third question was whether a participatory survey of paddy cultivation andspatial data analysis for the development of characteristic can identify options by contextfor upscaling sustainable paddy cultivation. Sustainable agriculture within a sustainablelandscape context is beyond food production, it safeguards the increasing capacity ofrural people to be self-reliant and resilient when facing changes and shocks and buildingstrong rural institutions, including landscape governance, and their economies [34]. A well-known analysis of the Bali water temples in Indonesia, or ‘subak’ in the local language,highlights the importance of local institutions that secured synchronous rice planting [35].Synchronous rice planting ensured landscape-wide breaks between cropping seasons inthe traditional system, that effectively controlled rodents. When the water temples wereabandoned and technical irrigation allowed for an increased cropping frequency, rodentproblems came to the fore in Bali. It appears that with the unconstrained artesian wells inRejoso, an even easier year-round availability of habitat and food supports rat populationsbeyond control.

Land 2021, 10, 586 21 of 26
Following this line of interpretation, we suggest that in the Rejoso watershed context,the lack of strong farmer institutions imply an inability to synchronise planting calendarsand that this has become one of the principal causes of aggravating rodent pest attack.When farmers can collectively dry their paddy field, this cycle of fallow can reduce therodent pressures. Thus, the management of rodent pest problems (which directly link toyield and income) can be considered as a collective driver to strengthen local institutions,which at the end leads to better water management and may allow win–win solutions ofwater-saving and yield increase to be feasible.
4.4. Sustainable Paddy Cultivation and Its Relevance to Global Agenda and Practices
Our efforts to understand existing constraints to a sustainable production landscapein the Rejoso watershed showed that among the eleven villages in the Gondang Wetanand Winongan Sub-districts, a substantial variation in farmer’s practices in managingthe land could already be found. Given this variation, a one-size-fits-all solution is notlikely to work. Our current understanding of such variations of the paddy field enablesthe landscape managers and decision-makers to identify the potential area for upscalingspecific solutions and to ensure that the adoptions of interventions run smoothly becausethe process has embraced potential constraints and solutions according to the perspectivesof smallholders and local communities.
Our approach aligns with a global agenda. The innovations of sustainable productionlandscape management consider the dual goals of reducing environmental impacts whileincreasing productivity. Discussion of the interconnected dimensions of sustainable produc-tion landscape is not new, while understandings and solutions towards actions to transformthe environmentally sustainable food production systems are still unresolved [36].
The research by Pretty et al. [37] on the adoption of practices and technologies forenvironmentally sustainable with substantial benefits for the rural poor hold promisingadvances. The 208 projects were derived from 52 countries of the South resulted in approxi-mately 8.98 million household farming 28.92 million ha representing 3.0% of the 960 millionha of arable and permanent crops in Africa, Asia and Latin America, adopted and practisedsustainable agriculture. Knowledge from the literature confirms that increasing paddyproductivity while reducing environmental impacts is doable. Likewise, it is attainablethat farmers practice more efficient water use [38] and emit less CH4 and N2O [39,40].
4.5. Potential of Development of Paddy Farming Characteristic for Intervention Scenario and Upscaling
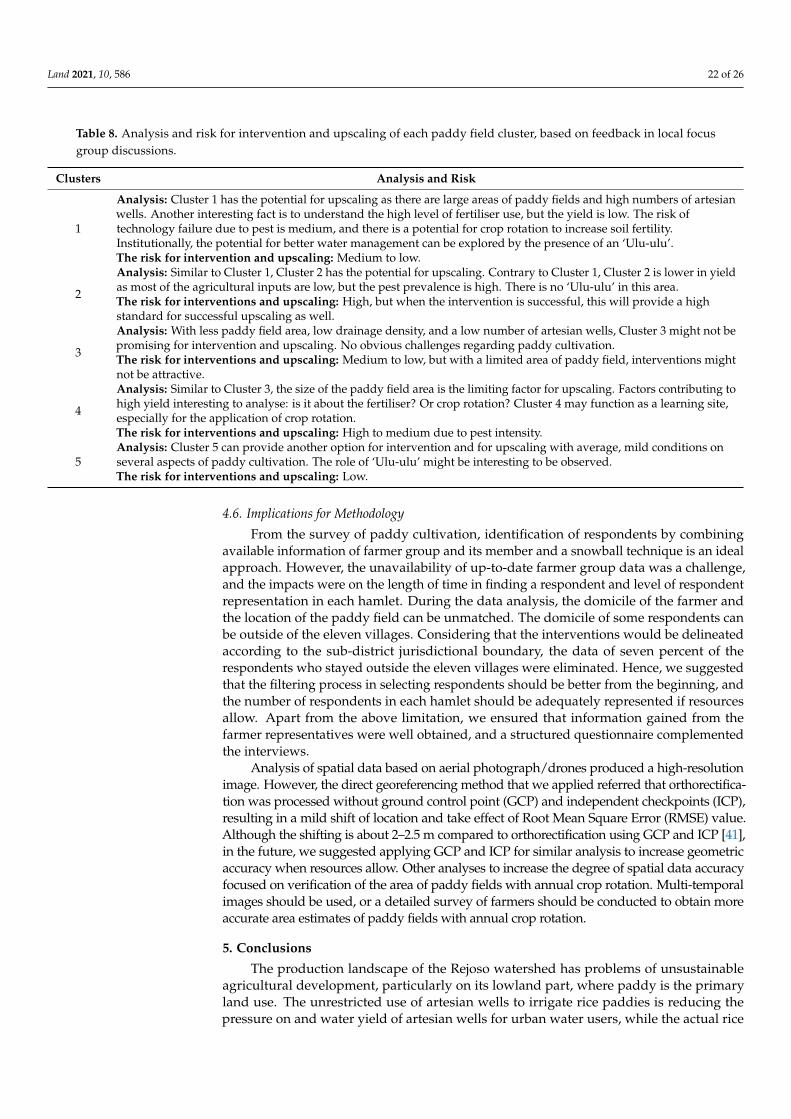
The five clusters identified here represent variation of farmer’s practices in managingthe land and cultivating paddy. Each cluster provides unique information with differentdegrees of the constituent parameters, yet still presenting the whole targeted landscape. In-tervention scenarios might include incentives for sustainable cultivation, such as insuranceof stable agricultural inputs, microcredit, agricultural insurance, market transparency, andcapacity strengthening in farmer group management. Table 8 presents the analysis and therisks for intervention and upscaling in each paddy field cluster. Clusters with high risk,when targeted for conducting innovative interventions, will provide ‘gold standards’ ofsuccess, compared to the ones with low risks.
The proposed characteristic of paddy farming that considers the variation of farmer’spractices in managing the land and cultivating paddy corresponds to the requirement toimplement an ‘options by context’ approach [8]. Rather than selections based on proximityto the central power, or ‘low-hanging fruit’ ones, we expect that through the ‘options bycontext’, a more robust selection of locations and intervention scenarios allow for higheradoption rates with expected results and calculated risks of the innovations at each cluster.However, ongoing implementation efforts will have to provide the test of effectiveness. Weidentified some limitations in the methods applied.
Land 2021, 10, 586 22 of 26
Table 8. Analysis and risk for intervention and upscaling of each paddy field cluster, based on feedback in local focusgroup discussions.
Clusters Analysis and Risk
1
Analysis: Cluster 1 has the potential for upscaling as there are large areas of paddy fields and high numbers of artesianwells. Another interesting fact is to understand the high level of fertiliser use, but the yield is low. The risk oftechnology failure due to pest is medium, and there is a potential for crop rotation to increase soil fertility.Institutionally, the potential for better water management can be explored by the presence of an ‘Ulu-ulu’.The risk for intervention and upscaling: Medium to low.
2
Analysis: Similar to Cluster 1, Cluster 2 has the potential for upscaling. Contrary to Cluster 1, Cluster 2 is lower in yieldas most of the agricultural inputs are low, but the pest prevalence is high. There is no ‘Ulu-ulu’ in this area.The risk for interventions and upscaling: High, but when the intervention is successful, this will provide a highstandard for successful upscaling as well.
3
Analysis: With less paddy field area, low drainage density, and a low number of artesian wells, Cluster 3 might not bepromising for intervention and upscaling. No obvious challenges regarding paddy cultivation.The risk for interventions and upscaling: Medium to low, but with a limited area of paddy field, interventions mightnot be attractive.
4
Analysis: Similar to Cluster 3, the size of the paddy field area is the limiting factor for upscaling. Factors contributing tohigh yield interesting to analyse: is it about the fertiliser? Or crop rotation? Cluster 4 may function as a learning site,especially for the application of crop rotation.The risk for interventions and upscaling: High to medium due to pest intensity.
5Analysis: Cluster 5 can provide another option for intervention and for upscaling with average, mild conditions onseveral aspects of paddy cultivation. The role of ‘Ulu-ulu’ might be interesting to be observed.The risk for interventions and upscaling: Low.
4.6. Implications for Methodology
From the survey of paddy cultivation, identification of respondents by combiningavailable information of farmer group and its member and a snowball technique is an idealapproach. However, the unavailability of up-to-date farmer group data was a challenge,and the impacts were on the length of time in finding a respondent and level of respondentrepresentation in each hamlet. During the data analysis, the domicile of the farmer andthe location of the paddy field can be unmatched. The domicile of some respondents canbe outside of the eleven villages. Considering that the interventions would be delineatedaccording to the sub-district jurisdictional boundary, the data of seven percent of therespondents who stayed outside the eleven villages were eliminated. Hence, we suggestedthat the filtering process in selecting respondents should be better from the beginning, andthe number of respondents in each hamlet should be adequately represented if resourcesallow. Apart from the above limitation, we ensured that information gained from thefarmer representatives were well obtained, and a structured questionnaire complementedthe interviews.
Analysis of spatial data based on aerial photograph/drones produced a high-resolutionimage. However, the direct georeferencing method that we applied referred that orthorectifica-tion was processed without ground control point (GCP) and independent checkpoints (ICP),resulting in a mild shift of location and take effect of Root Mean Square Error (RMSE) value.Although the shifting is about 2–2.5 m compared to orthorectification using GCP and ICP [41],in the future, we suggested applying GCP and ICP for similar analysis to increase geometricaccuracy when resources allow. Other analyses to increase the degree of spatial data accuracyfocused on verification of the area of paddy fields with annual crop rotation. Multi-temporalimages should be used, or a detailed survey of farmers should be conducted to obtain moreaccurate area estimates of paddy fields with annual crop rotation.
5. Conclusions
The production landscape of the Rejoso watershed has problems of unsustainableagricultural development, particularly on its lowland part, where paddy is the primaryland use. The unrestricted use of artesian wells to irrigate rice paddies is reducing thepressure on and water yield of artesian wells for urban water users, while the actual rice

Land 2021, 10, 586 23 of 26
yields achieved are below potentials achieved elsewhere. The introduction of water-savingtechnology, with modification of conventional paddy cultivation, and better design andmanagement of artesian wells more control over the wells, can target yield improvement aswell as positive environmental impacts. Considerable variation was found to exist withinthis paddy-dominant production landscape. Our analysis of the variation of farmer’spractices in managing the land and cultivating paddy was based on a survey of paddy culti-vation and spatial data analysis complemented and verified by the participatory approachindicating the application of landscape-approach in its development. The characteristics ofpaddy farming as the results reflect the requirement to implement an ‘option by context’ ap-proach within a landscape for targeting effective, yet efficient, interventions and upscalingtechnological improvement. The characteristic of paddy farming encompassed five clustersof paddy farms. Clusters were characterised based on the relative area of paddy fields,the density of irrigation networks, area with crop rotation, rice yield, the dose of fertiliser,number of pesticide types, water sources, and the intensity of pests/rodents. Hamletswithin a cluster are similar in characteristics of farmer’s practices and have unique, contex-tual conditions. We discussed the potentials and risks of such characteristics for furtherimplementation and upscaling. Clusters with high risk, when targeted for conductinginnovative interventions, will provide ‘gold standards’ of success, compared to the oneswith low risks. The information is expected to be useful for the landscape managers anddecision-makers in targeting, considering, and budgeting the interventions that are relevantfor sustainable landscape management. Future applications of a spatially differentiatedintervention approach to innovate in the direction of sustainable paddy cultivation basedon water saving is expected to reduce environmental impacts while increasing productivity.On-the-ground empirical action research activities engaging research organisations, privatesectors and financing institutions are ongoing.
Author Contributions: N.K., L.T. and B.L. designed the study. L.D.Y.P. collected and analysed spatialdata and was supervised by A.H. and M.T.Z. F.M. and E.P. collected paddy cultivation data andwere supervised by L.T. L.T. analysed paddy cultivation data. N.K., L.T., L.D.Y.P., A.H., M.T.Z.writing the original draft. N.K., B.L., L.T. and M.v.N. shaped the original draft into the manuscript,which was approved by all co-authors, A.T. provided the ecohydrological backgrounds of the Rejosowatershed to improve the manuscript. All authors have read and agreed to the published version ofthe manuscript.
Funding: The research was funded by the Danone Ecosystem Fund through “Sustainable, LowCarbon Emissions and Water-Efficient Agriculture of Rejoso Watershed” project.
Conflicts of Interest: The authors declare no conflict of interest.
Appendix A. Calibrating the Annual Water Balance Model
Data for mean of annual precipitation (P) were obtained from 13 rainfall stations inlower zone (7 stations), middle zone (5 stations) and upper zone (1 station) (Table A1).Precipitation for each zone (lower zone < 100 m a.s.l., middle zone 100–1000 m a.s.l. andupper zone m a.s.l.) was then generated based on correlation of elevation and annualmean of rainfall (Figure A1). Potential evapotranspiration Epot were generated usingThornthwaite equation using temperature data of Accu weather (Table A2).

Land 2021, 10, 586 24 of 26
Table A1. Mean of annual rainfall for 13 rainfall stations.
Stations Zone Elevation (m a.s.l.) Mean of AnnualRainfall (mm/year) *)
P3GI Lower 5 1143.49Kedawung Lower 7 1041.40
Gondang wetan Lower 8 1000.30Kawis rejo-Rejoso Lower 8 1138.33
Winongan Lower 10 1259.06Gading-Winongan Lower 12 1307.53
Ranu Grati Lower 14 1242.07Sidepan-Umbulan-Winongan Lower 25 652.33
Wonorejo-Lumbang Middle 100 1590.71Lumbang Middle 137 1485.71
Panditan-Rejoso Middle 600 2255.14Puspo Middle 640 2243.86Tosari Upper 1045 1539.27
*) 1990–2015.
Figure A1. Correlation between mean of annual rainfall and elevation of 13 rainfall stations.
Table A2. Potential evapotranspiration of three zones.
ZonesMean of Annual Temperature (◦C) Total Potential Evapotranspiration
(mm year−1)1990 2015 2020 1990 2015 2020
Upper 17 17 17 770.4 770.4 770.4Middle 25 25 25 1367.8 1367.8 1367.8Lower 27 27 27 1726.8 1726.8 1726.8
Parameter estimates for actual/potential evapotranspiration (ε) and runoff coefficient(ρ) were derived as area-weighted average from estimate for the specific land use types inthe GenRiver model, calibrated for a number of Indonesian watersheds [29].
References1. Millennium Ecosystem Assessment. A Report of the Millennium Ecosystem Assessment. Ecosystems and Human Well-Being;
Island Press: Washington, DC, USA, 2005.2. Costanza, R.; d’Arge, R.; deGroot, R.; Farber, S.; Grasso, M.; Hannon, B.; Limburg, K.; Naeem, S.; Oneill, R.V.; Paruelo, J.; et al.
The value of the world’s ecosystem services and natural capital. Nature 1997, 387, 253–260. [CrossRef]
Land 2021, 10, 586 25 of 26
3. Olsson, L.; Barbosa, H.; Bhadwal, S.; Cowie, A.; Delusca, K.; Flores-Renteria, D.; Hermans, K.; Jobbagy, E.; Kurz, W.; Li, D.; et al. LandDegradation. In Climate Change and Land an IPCC Special Report on Climate Change, Desertification, Land Degradation, SustainableLand Management, Food Security, and Greenhouse Gas Fluxes in Terrestrial Ecosystems; Shukla, P.R., Skea, J., Buendia, E.C., Masson-Delmotte, V., Pörtner, H.-O., Roberts, D.C., Zhai, P., Slade, R., Connors, S., van Diemen, R., et al., Eds.; IPCC: Geneva, Switzerland,2019; in press.
4. Minang, P.A.; van Noordwijk, M.; Freeman, O.E.; Mbow, C.; de Leeuw, J.; Catacutan, D. (Eds.) Climate-Smart Landscapes:Multifunctionality in Practice; World Agroforestry Centre (ICRAF): Nairobi, Kenya, 2015; p. 405. Available online: http://www.worldagroforestry.org/publication/climate-smart-landscapes-multifunctionality-practice (accessed on 12 November 2020).
5. Estrada-Carmona, N.; Hart, A.K.; Declerck, F.A.J.; Harvey, C.A.; Milder, J.C. Integrated landscape management for agriculture,rural livelihoods, and ecosystem conservation: An assessment of experience from Latin America and the Caribbean. Landsc.Urban Plan. 2014, 129, 1–11. [CrossRef]
6. Wu, J. Landscape sustainability science: Ecosystem services and human well-being in changing landscapes. Landsc. Ecol. 2013, 28,999–1023. [CrossRef]
7. Van Noordwijk, M.; Leimona, B.; Jindal, R.; Villamor, G.B.; Vardhan, M.; Namirembe, S.; Catacutan, D.; Kerr, J.; Minang, P.A.;Tomich, T.P. Payments for environmental services: Evolution toward efficient and fair incentives for multifunctional landscapes.Annu. Rev. Environ. Resour. 2012, 37, 389–420. [CrossRef]
8. Sinclair, F.; Coe, R. The options by context approach: A paradigm shift in agronomy. Exp. Agric. 2019, 55, 1–13. [CrossRef]9. Díaz, S.; Settele, J.; Brondízio, E.; Ngo, H.; Guèze, M.; Agard, J.; Arneth, A.; Balvanera, P.; Brauman, K.; Butchart, S.; et al. Summary
for Policy Makers of the Global Assessment Report on Biodiversity and Ecosystem Services of the Intergovernmental Science-Policy Platformon Biodiversity and Ecosystem Services; IPBES: Bonn, Germany, 2020.
10. Van Noordwijk, M.; Speelman, E.; Hofstede, G.J.; Farida, A.; Abdurrahim, A.Y.; Miccolis, A.; Hakim, A.L.; Wamucii, C.N.;Lagneaux, E.; Andreotti, F.; et al. Sustainable agroforestry landscape management: Changing the game. Land 2020, 9, 243.[CrossRef]
11. Swallow, B.M.; Garrity, D.P.; van Noordwijk, M. The effects of scales, flows and filters on property rights and collective action inwatershed management. Water Policy 2002, 3, 457–474. [CrossRef]
12. Van Noordwijk, M.; Van Roode, M.; McCallie, E.L.; Lusiana, B. Erosion and sedimentation as multiscale, fractal processes:Implications for models, experiments and the real world. In Soil Erosion at Multiple Scales; CAB International: Wallingford, UK,1998; pp. 223–253.
13. van Noordwijk, M.; Poulsen, J.G.; Ericksen, P.J. Quantifying off-site effects of land use change: Filters, flows and fallacies.Agric. Ecosyst. Environ. 2004, 104, 19–34. [CrossRef]
14. van Noordwijk, M. Integrated natural resource management as pathway to poverty reduction: Innovating practices, institutionsand policies. Agric. Syst. 2019, 172, 60–71. [CrossRef]
15. Amaruzaman, S.; Khasanah, N.; Tanika, L.; Dwiyanti, E.; Lusiana, B.; Leimona, B.; Janudianto, N. Landscape Characteristics ofRejoso Watershed: Assessment of Land Use—Land Cover Dynamic, Farming System and Community Resilience; World AgroforestryCentre (ICRAF) Southeast Asia Regional Program: Bogor, Indonesia, 2018.
16. Toulier, A.; Baud, B.; de Montety, V.; Lachassagne, P.; Leonardi, V.; Pistre, S.; Dautria, J.; Hendrayana, H.; Fajar, M.; Muhammad, A.; et al.Multidisciplinary study with quantitative analysis of isotopic data for the assessment of recharge and functioning of volcanicaquifers: Case of Bromo-Tengger volcano, Indonesia. J. Hydrolol. Reg. Stud. 2019, 26, 100634. [CrossRef]
17. Scott, C.A.; Shah, T. Groundwater overdraft reduction through agricultural energy policy: Insights from India and Mexico. Int. J.Water Resour. Dev. 2004, 20, 149–164. [CrossRef]
18. Toulier, A. Multidisciplinary Study for the Characterization of Volcanic Aquifers Hydrogeological Functioning: Case of Bromo-Tengger Volcano (East Java, Indonesia). Ph.D. Thesis, Montpellier University, Montpellier, France, 2019.
19. Leimona, B.; Khasanah, N.; Lusiana, B.; Amaruzaman, S.; Tanika, L.; Hairiah, K.; Suprayogo, D.; Pambudi, S.; Negoro, F.S.A Business Case: Co-Investing for Ecosystem Service Provisions and Local Livelihoods in Rejoso Watershed; World Agroforestry Centre:Bogor, Indonesia, 2018.
20. Suprayogo, D.; van Noordwijk, M.; Hairiah, K.; Meilasari, N.; Rabbani, A.L.; Ishaq, R.M.; Widianto, W. Infiltration-friendlyagroforestry land uses on volcanic slopes in the Rejoso Watershed, East Java, Indonesia. Land 2020, 9, 240. [CrossRef]
21. The Central Statistics Agency. Provinsi Jawa Timur Dalam Angka; BPS Jawa Timur: Surabaya, Indonesia, 2020.22. The Central Statistics Agency. Luas Panen dan Produksi Padi di Indonesia 2019 No. 16/02/Th. XXIII; BPS—Statistics Indonesia:
Jakarta Pusat, Indonesia, 2020.23. Khumairoh, U. On Complex Rice Systems. Ph.D. Thesis, Wageningen University, Wageningen, The Netherlands, 2019.24. Creed, I.F.; van Noordwijk, M. Forest and Water on a Changing Planet: Vulnerability, Adaptation and Governance Opportunities.
A Global Assessment Report; IUFRO World Series 38; IUFRO: Vienna, Austria, 2018.25. Geospatial Information Agency. Peta Digital Rupa Bumi Indonesia Skala 1:50,000; Geospatial Information Agency: Bogor, Indonesia, 2014.26. Pasuruan District Water-Related Public-Works Agency. Irrigation network of Pasuruan District; Pasuruan District Water-Related
Public-Works Agency: Pasuruan, Indonesia, 2019.27. Lillesand, T.M.; Kiefer, R.W. Remote Sensing and Image Interpretation, 6th ed.; Wiley India Pvt: New Delhi, India, 2011.28. IFAD. Good Practices in Participatory Mapping: A Review Prepared for the International Fund for Agricultural Development (IFAD);
IFAD: Rome, Italy, 2009.
Land 2021, 10, 586 26 of 26
29. Cadag, J.R.; Gaillard, J.C. Integrating knowledge and actions in disaster risk reduction: The contributiin of participatory mapping.R. Geogr. Soc. Area 2011, 44, 100–109. [CrossRef]
30. Kassambara, A. Practical Guide to Cluster Analysis in R: Unsupervised Machine Learning. Available online: http://www.sthda.com/english/2017 (accessed on 30 December 2020).
31. Van Noordwijk, M.; Tanika, L.; Lusiana, B. Flood risk reduction and flow buffering as ecosystem services-Part 2: Land use andrainfall intensity effects in Southeast Asia. Hydrol. Earth Syst. Sci. 2017, 21, 2341–2360. [CrossRef]
32. Arnold, J.G.; Moriasi, D.N.; Gassman, P.W.; Abbaspour, K.C.; White, M.J.; Srinivasan, R.; Santhi, C.; Harmel, R.D.; van Griensven, A.;Van Liew, M.W.; et al. SWAT: Model use, calibration, and validation. Am. Soc. Agric. Biol. Eng. 2012, 55, 1491–1508.
33. Agus, F.; Andrade, J.F.; Edreira, J.I.R.; Deng, N.; Purwantomo, D.K.; Agustiani, N.; Aristya, V.E.; Batubara, S.F.; Hosang, E.Y.;Krisnadi, L.Y.; et al. Yield gaps in intensive rice-maize cropping sequences in the humid tropics of Indonesia. Field Crops Res.2019, 237, 12–22. [CrossRef]
34. Van Mansvelt, J.D.; van der Lubbe, M.J. Checklist for Sustainable Landscape Management: Final Report of the EU Concerted ActionAIR3-CT93-1210: The Landscape and Nature Production Capacity of Organic/Sustainable Types of Agriculture; Elsevier: Amsterdam,The Netherlands, 1999. [CrossRef]
35. Lansing, J.S.; Thérèse, A. The functional role of Balinese water temples: A response to critics. Hum. Ecol. 2012, 40, 453–467.[CrossRef]
36. Beddington, J.; Asaduzzaman, M.; Clark, M.; Fernández, A.; Guillou, M.; Jahn, M.; Erda, L.; Mamo, T.; Van Bo, N.; Nobre, C.A.;et al. Achieving Food Security in the Face of Climate Change: Final Report from the Commission on Sustainable Agriculture and ClimateChange; CGIAR Research Program on Climate Change, Agriculture and Food Security (CCAFS): Copenhagen, Denmark, 2012.
37. Pretty, J.N.; Morison, J.I.L.; Hine, R.E. Reducing food poverty by increasing agricultural sustainability in developing countries.Agric. Ecosyst. Environ. 2003, 95, 217–223. [CrossRef]
38. Subari, S.; Joubert, M.D.; Sofiyuddin, H.A.; Triyono, J. Pengaruh Perlakuan Pemberian Air Irigasi pada Budidaya SRI, PTT danKonvensional terhadap Produktivitas Air. J. Irig. 2012, 7, 28–42. [CrossRef]
39. Cai, Z.; Xing, G.; Yan, X.; Xu, H.; Tsuruta, H.; Yagi, K.; Minami, K. Methane and nitrous oxide emissions from rice paddy fields asaffected by nitrogen fertilizers and water management. Plant Soil 1997, 196, 7–14. [CrossRef]
40. Wang, C.; Lai, D.Y.F.; Sardans, J.; Wang, W.; Zeng, C.; Peñuelas, J. Factors Related with CH4 and N2O Emissions from a PaddyField: Clues for Management implications. PLoS ONE 2017, 12, e0169254. [CrossRef]
41. Widyaningrum, E.; Fajari, M.; Octariady, J. Accuracy Comparison of VHR Systematic ortho Satellite Imageries Against VHROrthorectified Imageries Using GCP. Int. Arch. Photogramm. Remote Sens. Spat. Inf. Sci. ISPRS Arch. 2016, 41, 305–309. [CrossRef]
Copyright © 2022 FDOKUMEN