
Neuro-fuzzy synthesis of flight control electrohydraulic servo
Upload
khangminh22Category
view
0download
0
The University of MaineDigitalCommons@UMaine
Electronic Theses and Dissertations Fogler Library
2003
Extracting Movement Patterns Using Fuzzy andNeuro-fuzzy ApproachesHaci Mustafa Palancioglu
Follow this and additional works at: http://digitalcommons.library.umaine.edu/etd
Part of the Physics Commons, and the Set Theory Commons
This Open-Access Dissertation is brought to you for free and open access by DigitalCommons@UMaine. It has been accepted for inclusion inElectronic Theses and Dissertations by an authorized administrator of DigitalCommons@UMaine.
Recommended CitationPalancioglu, Haci Mustafa, "Extracting Movement Patterns Using Fuzzy and Neuro-fuzzy Approaches" (2003). Electronic Theses andDissertations. 319.http://digitalcommons.library.umaine.edu/etd/319

EXTRACTING MOVEMENT PATTERNS
USING FUZZY AND NEURO-FUZZY APPROACHES
BY
Haci Mustafa Palancioglu
B.S. The Yildiz Technical University, Turkey, 1992
M.S. The Yildiz Technical University, Turkey, 1995
A THESIS
Submitted in Partial Fulfillment of the
Requirements for the Degree of
Doctor of Philosophy
(in Spatial Infonnation Science and Engineering)
The Graduate School
The University of Maine
May, 2003
Advisory Committee:
M. Kate Beard, Professor of Spatial Infonnation Science and Engineering, Advisor
Peggy Agouris, Associate Professor of Spatial Infonnation Science and Engineering
Alfred Leick, Professor of Spatial Information Science and Engineering
Ali E. ~z l i i k , Associate Professor of Mathematics and Statistics
Thomas Wheeler, Assistant Professor of Computer Science

EXTRACTING MOVEMENT PATTERNS
USING FUZZY AND NEURO-FUZZY APPROACHES
By Haci Mustafa Palancioglu
Thesis Advisor: Dr. M. Kate Beard
An Abstract of the Thesis Presented in Partial Fulfillment of the Requirements for the
Degree of Doctor of Philosophy (in Spatial Information Science and Engineering)
May, 2003
Several applications generate large volumes of data on movements including
vehicle navigation, fleet management, wildlife tracking and in the near future cell phone
tracking. Such applications require support to manage the growing volumes of movement
data.
Understanding how an object moves in space and time is fundamental to the
development of an appropriate movement model of the object. Many objects are dynamic
and their positions change with time. The ability to reason about the changing positions
of moving objects over time thus becomes crucial. Explanations on movements of an
object require descriptions of the patterns they exhibit over space and time. Every moving
object exhibits a wide range of patterns some of which repeat but not exactly over space
and time such as an animal foraging or a delivery truck moving about a city. Even
though movement patterns are not exactly the same, they are not completely different.
Moving objects may move on the same or nearly similar paths and visit the same
locations over time.

This thesis addresses the identification of repeat movement patterns from large
volumes of data. These are represented as higher-level movement structures referred to as
movement signatures. Movement signatures are defined as collections of patterns that
objects demonstrate in their sequences of movements. Signatures have a spatial structure
that includes dominant or frequently visited locations and paths and a spatio-temporal
structure that associates a temporal pattern with the spatial patterns. This thesis
demonstrates the extraction of movement signatures from sets of movement observations
using fuzzy and Neuro-fuzzy methodologies. Identification of movement signatures and
definition of their attributes provides summary level information for modeling and
reasoning about moving objects.

ACKNOWLEDGMENTS
I would like to express my sincere gratitude towards my thesis advisor Dr. M.
Kate Beard for her support, guidance, and encouragement, and the members of my thesis
advisory committee; Dr. Peggy Agouris, Dr. Alfred Leick, Dr. Thomas Wheeler, and Dr.
Ali E. Ozliik for their guidance and cooperation during this thesis.
I thank Dr. Anthony Stefanidis, Dr. Max Egenhofer, Dr. Kathleen Hornsby and
Georgios Mountrakis for many enlightening discussions on the modeling of moving
object and contributing their valuable comments.
I would also like to gratefully acknowledge the support and funding given for this
research from NIMA under grant number NMA202-98-1-1113 and The Erciyes
University, Kayseri, Turkey.
I would like to thank all my friends in the Department of Spatial Information
Science and Engineering for creating a pleasant environment for work. I am thankful to
all friends for their support and help during my studies at Orono, Maine.
I would also like to thank to all my family members for their moral support over
the years. Special thanks are due to my parents, Fatma and N. Mehmet Palancio~lu, and
my sisters Nurhan and Ikbal for their love, encouragement and complete support during
my studies and throughout my life. Despite all the 'when are you submitting?' type
questions, this would not have been possible without you. My sons Mehmed Furkan and
Abdullah Omer made my life and home enjoyable. My heartfelt thanks go to my wife
Emel for her patience and the moral support that gave me strength to carry this dream to
reality. It's been a privilege holding your hopes! This thesis is for them.
. . 11

TABLE OF CONTENTS
. . .................................................................................................. ACKNOWLEDGMENTS 11
............................................................................................................. LIST OF TABLES vi
. . LIST OF FIGURES ......................................................................................................... vii
Chapter 1 . INTRODUCTION ........................................................................................... 1
1.1 Motivation ............................................................................................................... 3
................................................ 1.1.1 Fuzziness and Uncertainty in Moving Objects 4
1.1.2 Why Use a Fuzzy Set Approach? .................................................................... 5
Problem Statement .................................................................................................. 8
. . Objectives and Hypothesis ................................................................................... 10
............................................................................................... Research Questions 12
................................................................................................. Scope of Research 13
. . ......................................................................................... Proposed Contributions 13
................................................................................................ Intended Audience 14
.......................................................................................... Organization of Thesis 14
Chapter2 . BACKGROUND ........................................................................................... 16
2.1 Spatio-temporal Modeling .................................................................................... 18
.................................................................................... 2.2 Modeling Moving Objects 22
2.2.1 Analyzing and Summarizing Movements ...................................................... 24
2.2.2 Reasoning About Moving Objects ................................................................. 27
........................................................................................... 2.3 Modeling Uncertainty 29

2.4 Fundamentals of the Fuzzy Set Approach ............................................................ 33
2.4.1 Fuzzy Membership Functions ........................................................................ 36
2.4.2 Fuzzy Inference Systems .............................................................................. 37
......................................................................................... 2.5 Neuro-Fuzzy Modeling 42
2.6 Adaptive Neuro-Fuzzy Inference System ........................................................... 43
.......................................................................................................... 2.7 Data Mining 46
2.7.1 The Iterative Self-organizing Data Analysis Technique ............................... 47
............................................................................ 2.7.2 Fuzzy C-Means Clustering 49
Chapter 3 . MODELING MOVING OBJECTS ............................................................. 53
....................................................... 3.1 Model Framework for Movement Behaviors 54
3.1.1 Movement Profiles ......................................................................................... 57
3.1.2 Observations ................................................................................................. 59
........................................................ 3.2 Movement Signatures: What is a Signature? 64
.................................................................................... 3.2.1 Describing Signatures 66
........................ 3.2.2 Approaches to Extract and Represent Movement Signatures 68
........................................................................................ 3.2.3 Types of Signatures 71
..................... 3.2.4 A Fuzzy Logic Approach to Represent Movement Signatures 72
Chapter 4 . APPROACHES TO EXTRACT SPATIAL LOCATION
SIGNATURES BY CLUSTER ANALYSIS ................................................................... 78
4.1 The Proposed Method .......................................................................................... 79
.......................................................................................... 4.2 Experimental Data Set 79
....................... 4.3 The Approach: FCM Clustering to Obtain Movement Signatures 81

Chapter 5 . APPROACHES TO EXTRACT SPATIO-TEMPORAL
................................................ MOVEMENT SIGNATURES BY SUMMARIZATION 91
........................................................................................... 5.1 The Proposed Method 92
5.2 Experimental Data Set .......................................................................................... 94
5.3 Spatio-temporal Location Signatures .................................................................... 96
...................................................................... 5.3.1 Movement Surface Generation 97
.............................................. 5.3.2 Movement Volume Generation and Analysis 105
5.3.3 Designing a Fuzzy Reasoning Algorithm to Establish Hierarchies ............. 109
5.4 Generating Spatio-temporal Path Signatures ...................................................... 111
5.4.1 Computing Spatio-temporal Path Signatures ............................................... 112
............................................................................... 5.4.2 Fuzzy Rule Verification 118
Chapter 6 . CONCLUSIONS ......................................................................................... 120
6.1 Summary of the Thesis ....................................................................................... 120
. . ...................................................................................................... 6.2 Contributions. 122
6.3 Future Research .................................................................................................. 124
.................................................... 6.3.1 Using Signatures for Prediction Purposes 124
6.3.2 Reasoning ................................................................................................... 125
6.3.3 Dynamic Fuzzy Sets .................................................................................... 127
............................................................ 6.3.4 Fuzzy Cartesian Coordinate System 127
........................................................................................................... BIBLIOGRAPHY 129
. ......................................................... APPENDIX DELAUNAY TRIANGULATION 144
................................................................................. BIOGRAPHY OF THE AUTHOR 146

LIST OF TABLES
Table 3.1 : Quantitative and qualitative descriptions of movements ............................... 67
.............................................................................. Table 4.1 : The Observation Data Set 79
Table 4.2. Fuzzy cluster center coordinates .................................................................... 82
Table 4.3 : Fuzzy Clusters and their MF values .............................................................. 84
Table 4.4. MBR of the clustered locations ..................................................................... 85
Table 5.1 : Observation data organized by number of visits per month to
10 different fuzzy locations ........................................................................... 94
Table 5.2: The computed cluster centers for Anfis interpolant using
(a) Isodata (b) FCM ..................................................................................... 1 14
Table 5.3: The computed cluster centers for Cubic interpolant using
(a) Isodata (b) FCM ..................................................................................... 1 16

LIST OF FIGURES
Figure 2.1 :
Figure 2.2:
Figure 2.3:
Figure 2.4:
Figure 2.5:
Figure 2.6:
Figure 2.7:
Figure 2.8:
Figure 2.9:
The snapshot model ...................................................................................... 19
Discrete representations for moving points and moving regions ................. 24
A sample set of fuzzy membership functions .............................................. 36
Basic fizzy inference system ....................................................................... 37
Mamdani type fuzzy inference system ......................................................... 39
Sugeno type fuzzy inference system ............................................................ 40
Tsukomato type fuzzy inference system ...................................................... 40
.......................................... Defuzzification strategies (Jang and Sun, 1995) 41
........................ A two-input first-order Sugeno fuzzy model with two rules 44
Figure 2.10. The equivalent ANFIS structure ................................................................... 44
Figure 3.1 : The fian~ework of the proposed approach .................................................... 56
Figure 3.2: Axes used to describe the directional axis movement
constraints of objects ..................................................................................... 58
Figure 3.3 : Conceptual model of integrated spatio-temporal gazetteer and
. . ........................................................................ multimedia information store 61
Figure 3.4. A set of position observations ...................................................................... 63
Figure 3.5. Fuzzy c-means clustering of the position observations ................................ 70
................................................................................... Figure 3.6. Movement signatures 71
Figure 3.7. MBR of linguistic location "Orono" ............................................................ 73
Figure 3.8. X and Y fuzzy membership functions of MBR of Orono ............................ 73
<< Figure 3.9. Fuzzy set Orono" ........................................................................................ 74
vii

Figure 3.10. Fuzzy path "Boston to Orono" .................................................................... 75
Figure 3.1 1 : Visit frequency of a path connecting location 3 to 2 ................................... 77
Figure 4.1 : Approaches to extract spatial location signatures ....................................... 79
Figure 4.2. The study area and observed positions ......................................................... 80
Figure 4.3 : Original and simplified Delaunay network .................................................. 81
Figure 4.4. Fuzzy c-means classifier results of simulated data ...................................... 82
Figure 4.5: Number of iterations to be carried out during
the fuzzy c-mean clustering ......................................................................... 82
Figure 4.6. MF of each fuzzy cluster based on the Delaunay triangle borders ............. 86
Figure 4.7: (a) MF for the cluster and the location number 10
(b) Transparently illustrated MF hills for all the clusters and locations
(spatial location signatures for each location) ......................................... 87
........................ Figure 4.8. The top view of MFs hills for all the clusters and locations 88
...................................................................................... Figure 4.9. Fuzzy cluster zones 89
............................................................ Figure 4.10. Voronoi decision zones of locations 89
Figure 5.1 : The proposed approach to extract spatio-temporal
movement signatures ................................................................................... 93
Figure 5.2: (a) The location signatures (fuzzy locations) and (b) The Delaunay
............................ triangles connecting the signature locations to each other 95
Figure 5.3: Changes in the density of number of visits for each t, computed using
................................................ (a) Anfis interpolant (b) Cubic interpolant 100
Figure 5.4: Spatio-temporal location signatures of the moving object
............................................................................................ where ~ , ~ < 1 0 0 104
... Vll l
Figure 5.5: Spatio-temporal location signatures of the moving object
where 1 0 1 < zli<300 .................................................................................... 104
Figure 5.6: Spatio-temporal location signatures of the moving object
where zli>300 .............................................................................................. 104
Figure 5.7: Spatio-temporal location signatures of the moving object
where zti = 5 ............................................................................................... 107
Figure 5.8: Spatio-temporal location signatures of the moving object
where zti = 30-40 ........................................................................................ 107
Figure 5.9: Spatio-temporal location signatures of the moving object
where zti = 60.70 ......................................................................................... 107
Figure 5.10: The membership functions of fuzzy sets NVL. NVM. NVH
for a year .................................................................................................... 110
Figure 5.1 1 : The membership functions of fuzzy sets NVL. NVM. NVH
for a month ................................................................................................. 110
Figure 5.12. The membership functions of the fuzzy sets "PO. " "SO. " and "TO" ........ 110
..................... Figure 5.13. Analysis of changes of visit in a chosen path based on time 111
Figure 5.14: Changes in the density of number of visits computed using
(a) Anfis interpolant (b) Cubic interpolant ................................................ 112
Figure 5.15 : Number of visits in x direction and t domain
................................ (a) Anfis interpolant (b) Cubic interpolant for path P 112
Figure 5.16: The five classes and their linguistic equals for Anfis interpolant
.......................................................................... using (a) Isodata (b) FCM 114

Figure 5.17: The membership functions for each cluster for Anfis interpolant
................................................................................................ using FCM. 1 15
Figure 5.18: The five classes and their linguistic equals for Cubic interpolant
using (a) Isodata (b) FCM. ......................................................................... 1 16
Figure 5.19: The membership functions for each cluster for Cubic interpolant
using FCM. .............................................................................................. 1 17
Figure 5.20: Fuzzy rule extraction/verification from Isodata classifier
conversation of Anfis interpolant computations. ....................................... 1 18
Figure 6.1 : Fuzzy Cartesian coordinate system. ........................................................... 128
............................................ Figure A. 1 : Delaunay triangulation over the author face. 145

Chapter 1
INTRODUCTION
Most real world phenomena are dynamic and the positions of many objects
change with time. The ability to reason about the changing positions of moving objects
thus becomes crucial. The phenomenon of movement arises whenever the same object
occupies different positions in space at different times (Galton, 1995). Movements are
complex types of spatio-temporal change. Although movements occur continuously,
people often perceive them discretely. Movement is the key to contemporary life. People,
animals, objects and ideas move in space and time, always interacting with each other
and with their environment, creating a highly dynamic system.
We define movement as comprising a change in the location (i.e., a translation) or
in the orientation (i.e., a rotation) of a point object over time. We categorize change to an
object's boundary as shape change (Agouris et al., 2000a) and distinguish it from
movement. This separation distinguishes important behavioral differences between
objects, for example lakes and cars. Lakes frequently shrink and expand, but are not
subject to rotation or translation and hence do not change position (except in a possible
catastrophic event). Cars, on the other hand, frequently change their position, but do not
change their boundary configuration or shape. Objects may exhibit both types of change:
n~oven~ent (Beard and Palancioglu, 2000) and boundary reconfiguration (Agouris et al.,
2000a).
Real world phenomena are capable of voluntary and involuntary movement.
Some objects move continuously and some intermittently, and some in regular time
1

dependent patterns (Yuan, 1998). For example some objects are frequently at rest such as
people and animals, some objects move in discontinuous steps (periods of continuous
movement followed by no movement) such as cars and ships, and some objects exhibit
continuous movement such as oil spills, wind, floods, glaciers, and desert erosion.
Modeling moving objects has become a topic of recent interest, but it is still in its
infancy. Modeling of moving objects has turned out to be a multi-disciplinary research
issue involving disciplines like linguistics, cognitive science, physics, robotics,
geography, computer science, and mathematics. Research activities during recent years
have addressed representation and modeling of moving objects within GIs environments.
Most research in this area focuses on tracking the movement of a single object, i.e., the
trajectory of an object over a period of time. There is an increasing need to represent the
paths of moving objects over extended time periods and the relative spatio-temporal
relations among multiple moving objects (Partsinevelos et al., 2000; Stefanidis et al.,
2000). Models of moving objects should be capable of expressing a set of spatio-temporal
topological and orientation (direction and distance) relations among them. The
representation of these relationships may be expressed qualitatively as well as
quantitatively (using the coordinates) both to save space and to simplifl reasoning.
The research presented in this thesis focuses on analytical methods suited for the
exploration of movement of discrete objects. The term 'point objects' is used in this
research as a generalization of very different phenomena, such as trucks, airplanes,
animals or human beings.

1.1 Motivation
Understanding how an object moves in space and time is fundamental to the
development of an appropriate movement model of the object. Without including
movements of objects, it is difficult to model and reason about the dynamics of the real
world. There are many types of moving objects such as taxis, ships, packages, and
individuals and their positions change with time. Moving objects are frequently modeled
as discretely moving points (i.e., point objects at rest at a certain location for a time
interval and then moving instantaneously). The ability to model, analyze, and reason
about the changing positions of moving objects over time thus becomes crucial. The
increasing demand for models that are capable of dealing with the movements of objects
highlights the need for research in this particular area. A system with the ability to model,
analyze, and reason about movements of objects is an important asset and requirement in
several applications. Such applications include vehicle navigation, fleet management,
wildlife tracking, emergency dispatch, disease monitoring, and military applications to
name a few. In all these applications there is a need to efficiently answer questions about
moving objects such as where they are at a specific time, where they have been in the
past, where they will be in the future.
However, we need observations on the movements of objects to model, analyze,
and reason about them. Observations refer to any measurements that capture the position
of objects at particular times. Unless we have observations that are almost continuous
(i.e., video stream, GPS observations) we cannot account for every instant of a
movement. Knowledge of movement is limited by the ability to observe it. Complete
knowledge of any particular movement is impossible, but movements can be detected,

stored, modeled and analyzed with some degree of accuracy. Enhanced data collection
technologies such as high resolution satellite imagery, videogrammetry, and GPS in
combination with wireless communications are rapidly increasing the feasibility of
obtaining information on moving objects and fueling new research and development in
this area. In addition, development of new and more powerful techniques and tools in
computer animation, three-dimensional modeling, visualization, database systems, and
query languages provide efficient use of the observation data in modeling and reasoning
about moving objects.
Typically, observations obtained on the movements of an object from various
sources have a similar fomlat that includes the coordinates of a set of positions visited by
an object and a time. Given a large number of observations, one might want to identify
particular meaning or structure in the spatial and spatio-temporal extent that reveals
movement patterns of the corresponding object such as the locations frequently visited or
paths frequently taken by the object over time. Explanations on movements of objects
require descriptions of the patterns they exhibit over space and time.
1.1.1 Fuzziness and Uncertainty in Moving Objects
Many spatio-temporal applications need to model real world phenomena not
simply by crisply defined objects but rather through vague concepts that accomadate
indeterminate positions andor boundaries that change and/or move over time (Burrough,
1996; Frank, 1996). This thesis emphasizes a special kind of vagueness called fuzziness.
Fuzziness captures the characteristic of many spatio-temporal phenomena, which do not
have sharp boundaries or exact positions or whose boundaries or positions cannot be
precisely determined such as oil spills and moving vehicles.

Many moving object applications need support to handle uncertainty, subjectivity,
imprecision, and ambiguity related to movements of objects in the context of spatio-
temporal modeling and reasoning. Spatio-temporal queries related to moving objects
need to deal with the uncertainties embedded in the object's movements. Human
decision-making and reasoning in general and in movement modeling in particular use
qualitative knowledge or linguistic information on a daily basis when reasoning about
movements of objects. In many situations humans use linguistic information more easily
than numerical information. However it is very difficult to formulate a suitable
mathematical model of this reasoning process. Therefore, one needs to use methods that
are capable of handling these uncertainties.
Currently, there have been efforts to incorporate uncertainties related with spatio-
temporal data in modeling and decision support by using fuzzy logic approaches
(Altman, 1994; Stefanakis et al., 1999; Vazirgiannis, 2000; Wang et al., 1990; Wang and
Adelson , 1994). This thesis proposes the use of fuzzy methods to enhance modeling and
hence reasoning about movements of objects. Fuzzy methods are incorporated in the
approach to address the presence of incomplete and imprecise information to represent a
degree of impression in the summary description of movement patterns.
1.1.2 Why Use a Fuzzy Set Approach?
A key motivation for the use of fuzzy sets is the ability to handle uncertainty.
Traditionally, uncertainty is considered undesirable and one tries to reduce it as much as
possible in order to come to precise conclusions. However, all perceptions of the real
world are imprecise and uncertain, and our natural language has evolved to represent and

communicate this imprecision. Despite the vagueness in linguistic descriptions, valuable
information can be conveyed linguistically provided one can deal with the imprecision.
The benefits of the fizzy approach stem from the following aspects:
Fuzzy systems are able to capture and deal with meanings of linguistic
expressions and conceptually such systems are easy to understand.
Fuzzy systems are able to blend different types of quantitative and qualitative
information.
Because of the ability of fizzy logic to incorporate qualitative information, fuzzy
systems are able to adequately model processes where human reasoning and
decision-making are involved.
Fuzzy systems can be built on top of the experience of experts.
Cognitive science has shown that humans often use fizzy logic methods to reason
about events in their daily life. In many real world situations, humans have the ability to
reason about movements of objects using vague variables and linking different
objectives. In many problems, fuzzy set theory is an approach that is much closer to real
human observation, reasoning and decision making than traditional statistical approaches,
such as probability theory (Hoogendoorn et al., 1998). For humans, navigation in space
can be handled by using approximate values and constraints (i.e., weather and road
conditions). People draw on previous experience to decide on the most appropriate path
to choose among different options to travel between two locations. For example, a person
who travels between home and work can predict certain information related to the path
such as how long this path might take according to the time of day and weather.

Computers are especially incompetent in dealing with the vagueness and
imprecision that is part of everyday life. People, however, can handle most of these
problems, dealing with the imprecision, to the extent that is sufficient in most cases.
Humans can reason in an appropriate way and accommodate the imprecision in a manner
that allows solving complex problems. According to one of the major principles in fuzzy
set theory, the ability of humans to deal with uncertainty is ultimately connected to their
ability to solve complex problems within a reasonable amount of time (Dutta, 1990). That
is, allowing more uncertainty tends to reduce complexity, increase credibility in the
resulting model and allow a computationally feasible solution. The main area of
application of fuzzy systems is the vast majority of complex systems where relatively few
data exist, where only imprecise, uncertain or ambiguous information is available, or
where expert knowledge is expressed vaguely in natural language.
Fuzzy logic methodologies (Zadeh, 1979) provide a framework for the modeling
and handling of the uncertainties that are related to the positions and paths of moving
objects. Instead of numerical descriptions for the representation of positions and paths of
moving objects, fuzzy values can be assigned. For example, assume the statement that
"the package was picked up from location A and delivered to location B". There is
uncertainty in this statement related to the perception of the pick up and delivery
locations and the path connecting them. The perceived locations and the path can be
represented with fuzzy values based on movement observations.
Several factors have encouraged the consideration of fuzzy methodologies for
movement modeling including but not limited to the followings:

Imprecise and Uncertain Data
Complete and accurate description of movements is impossible. Many reasons
including cost, time and difficulty in collecting precise data about movements of
objects necessitates the use of fuzzy reasoning.
Complexity
Movements of objects can be enormously complex.
Representation Expressivity
Certain situations, in particular movements, are more conveniently described by
linguistic variables than by numerical variables.
Reasoning Methodologies
Limited reasoning methods with uncertain and imprecise data on movements of
objects are also among the reasons for the use of fuzzy methodologies.
Along with these, the use of fuzzy sets is beneficial to a number of applications
in movement modeling including:
Identifying moving objects (i.e., vehicle, animal),
Predicting movement patterns of objects (i.e., frequently visited locations and
used paths by objects),
Reasoning and decision-making (i.e., estimating the locations of a moving object
over time).
1.2 Problem Statement
Current information systems have been documented as lacking (Al-Taha, 1992;
Fischer, 1994; Laurini and Thompson, 1992; Leung and Leung, 1993; Stefanakis and
Sellis, 1996; Stefanakis and Sellis, 1997; Stefanakis et al., 1999):

Appropriate logical foundations for handling the uncertainty of data
Modeling and reasoning hctionalities
Support for the temporal dimension
Techniques for indexing and querying dynamic data
Intelligence and ability to make predictions under uncertain situations
This thesis focuses on the first two limitations mentioned above in the specific
context of moving objects. Several of these deficiencies have been and continue to be
addressed in (Al-Taha, 1992; Armstrong, 1988; Egenhofer and Golledge, 1997; Langran,
1988; Peuquet, 1994; Saltenis et al., 2000; Wolfson et al., 1998; Worboys, 2001; Yuan,
1998).
The problems related to modeling movements of objects are identified in this
thesis as follows:
Many objects are dynamic and their positions change with time.
Modeling the movements of an object requires at least the integration of changes
in spatial and temporal dimensions. Similarly changes in the environment through
which the objects are moving adds to the complexity.
Every moving object exhibits a wide range of patterns some of which repeat but
not exactly over space and time.
Even though movement patterns are not exactly the same, they are also not
completely different. Moving objects may move on the same or nearly similar
paths and visit the same locations over time such a home and work locations
visited by an individual.

Explanations on movements of an object require the description of the patterns it
exhibits over space and time.
Availability of observation data, which may be sparse, makes it difficult to model
and reason about an object's movement patterns such as locations visited and
paths used by the object.
Due to the volun~e of data, there is an increasing need to provide data
summarization, identify important patterns, and reason upon the findings.
It is difficult to store exact knowledge on the movement of objects. As the volume
of data collected and stored in databases grows, especially in moving object
applications, there is an increasing need to provide data summarization, identify
important patterns, and reason upon the findings.
1.3 Objectives and Hypothesis
Approximate modeling and reasoning methods have been used with demonstrably
good results in human perception and cognition. How the human mind performs such
complex modeling and reasoning tasks easily is an important research area (Dutta, 1988;
Gaines, 1976; Stefanakis et al., 1996). The proposed fuzzy and neuro-fuzzy approaches in
the thesis are a step to incorporate the similar modeling and reasoning methodologies that
are used by humans.
This thesis develops a methodology for modeling movements of objects and
handling uncertainties embedded in these movenlents using both numeric and linguistic
movement information. The focus is on devising a suitable computational framework for
representing general movement behaviors of objects given imprecise and incomplete
numeric and linguistic information about their movement in space over time.

The proposed approach addresses the ability of information systems to answer
questions about moving objects such as where they have been in the past, where they are
now, or where they may be at a specific time by using their expected movement patterns.
The methodology incorporates three pieces of information: movement profiles,
observations, and movement signatures among which the development of movement
signature is the specific focus.
Movement profiles provide information on general constraints on movements of
objects. They identify constraints on the movement of a class of objects. Observations
provide essential information for the computation of a moving object's position.
Observations are defined as sightings of a particular object at specific locations and
times. Observations refer to any measurements that capture the location of objects at
particular times. General knowledge about movement patterns of objects can be acquired
by analyzing a set of movement observations. Movements of objects over space and time
can be modeled based on a set of observations. A movement signature is a summary of
a set of movement observations on an object over some period of time. Movement
signatures are higher-level abstractions of observations that capture dominant patterns of
a moving object over time.
The hypothesis of this thesis is:
"A set of position observations on a moving object reveal high-level movement
, patterns over space and time. "

The main objectives of this thesis are to:
identify and formalize elements of movement,
investigate movement patterns of an individual object,
define and represent movement patterns at higher levels of abstraction through
movement signatures,
extract, and formalize spatial and spatio-temporal movement signatures,
develop methodologies to extract movement signatures,
classify and order movement signatures.
1.4 Research Questions
The major questions addressed by this thesis include:
how to define movement signatures?
Patterns of an individual (i.e., a car) such as possible locations and paths can be
obtained from a set of movement observations. These movement patterns are
summarized in the form of signatures.
how to obtain and represent movement signatures?
Both numeric and linguistic observation can be employed in obtaining movement
signatures of an object. Representation methods need to reflect the more abstract
(less precise) form of signature.
how to summarize movement observations?
Due to the volume of movement data, there is a need to provide data
summarization to identify important movement patterns. Implementation of data
mining methods needs to be considered.
how to employ fuzzy and neuro-fuzzy methods to extract signatures?

Methods of implementing fuzzy and neuro-fuzzy methods in extracting
movement signatures from a set of movement observations need to be developed
and evaluated.
1.5 Scope of Research
This thesis does not address:
modeling motion of objects, which describes continuous movements of objects
usually obtained as video sequences.
modeling movements of all types of objects,
detecting, storing, and indexing movements of an objects,
developing precise models of movements,
modeling physical characteristics of moving objects such as speed and mobility,
modeling the constraints on objects,
developing movement signatures of an object using all its movement parameters
(i.e., locations, directions, distances, speeds), but a set of movement parameters
that are locations that they occupy, time of occupying each location, and number
of visits to each locations.
1.6 Proposed Contributions
Proposed contributions of this thesis can be outlined as follow:
Introducing the concept of "movement signatures",
The concept of "movement signatures" is introduced as a component for use in
modeling moving objects. Methods to identify and formalize elements of
movement signatures of an object will be the main contribution of this thesis.

Demonstrating an approach to define and extract movement signatures,
Meaningful movement patterns of an object can be summarized in the form of
movement signatures in both spatially and temporally. Methods to define and
extract movement signatures from a set of observations are vital for modeling and
reasoning about moving objects.
Implementing fuzzy and neuro-fuzzy methods in extracting movement signatures.
Fuzzy and neuro-fuzzy methodologies can be implemented as a novel way of
extracting movement signatures and handling uncertainties related to movements
of objects. The implementation of fuzzy and neuro-fuzzy methods in modeling
movements will be another major contribution of this thesis.
1.7 Intended Audience
This thesis is intended for researchers interested in exploring new approaches in
geographic information systems in particular to model moving objects and uncertainties
related to them. Its intended audience includes researchers concerned with alternative
methods to handle uncertainties in real world scenarios, geographers trying to model the
movements of objects, cognitive scientists interested in reasoning using imprecise and
uncertain data, database specialists looking for ways to assess the importance and use of
fuzzy methodologies, and researchers concerned with spatio-temporal modeling.
1.8 Organization of Thesis
The remainder is this thesis is organized as follows.
Chapter 2 reviews existing spatio-temporal modeling approaches and presents
modeling and reasoning issues related with moving objects. In addition, it reviews the
concepts of fuzzy logic and uncertainty.

Chapter 3 discusses the proposed approach to model moving objects and the
concept of movement signatures.
Chapter 4 explains how to model locations of moving objects to obtain spatial
location signatures.
Chapter 5 demonstrates an approach to extract spatio-temporal location and path
signatures of moving objects.
Chapter 6 summarizes the thesis, identifies contributions, and highlights possible
further research based on the findings of this thesis.

Chapter 2
BACKGROUND
Modeling the dynamics of the world requires at least the integration of space,
time, and movement (Galton, 1993). Today's Geographic Information System (GIs) data
models have not fulfilled the requirements for integrating space and time. Until now,
space has been the focus of models of geographic phenomena. The GIs data models
focus on modeling and reasoning about space. Although time in GIs has been a research
topic over the last ten years (Egenhofer and Golledge, 1997; Langran, 1988; Peuquet,
1994), models for GISs still treat space and time separately and support only a world that
exists in the present or as a collection of temporal snapshots. Incorporation of the
dynamics of geographic phenomena within a GIs is only available in the most
rudimentary fashion.
GIs should be able to represent and reason about dynamic geographic phenomena
in both space and time. Integration of space and time for spatio-temporal analysis and
reasoning has gained significant attention (Langran, 1992b; Peuquet, 1999; Worboys,
1998). There has been considerable research in modeling, representing, and reasoning
about space and time resulting in different forms of temporal (Allen, 1984) and spatial
logic (Egenhofer and Franzosa, 1991; Randell et al., 1992). An integrated logic of space,
time, and motion was presented by (Galton, 1993).
As space and time dimensions interact with each other, changes occur on
geographic phenomena. Explanations of geographic phenomena often require the
description of these changes. Without including changes, especially movements of
16

geographic phenomena, it is impossible to model and reason about the dynamics of the
real world. Understanding how geographic objects change over time is fimdamental to
the development of appropriate models of the real world (Homsby, 1999). We identify
spatio-temporal changes as the differences between the states of dynamic geographic
phenomena over time. Examples of spatio-temporal changes include changes in the
boundary of a country, in the position of a car, and in the path of a wild fire. People are
good at detecting changes through visual observations from such sources as satellite
images, photographs, and videos. Collectively, these heterogeneous observations form a
rich source for identifying changes. People observe various types of changes in their daily
lives such as movements and they have no difficulty in understanding and reasoning
about them. However, the implementation of models of spatio-temporal change within
information systems has yet to be realized. Currently, data stored in a GIs can be
updated, but records of changes are not explicitly maintained.
The increasing demand for information systems that are capable of dealing with
scenarios of change emphasizes the need for research in this particular area (Homsby and
Egenhofer, 1997). The concept of change must be formalized in order to create spatio-
temporal models for the dynamic world. Spatio-temporal models have been developed
(Erwig et al., 1997; Homsby, 1999; Langran, 1989; Langran, 1992a; Peuquet and Wentz,
1994; Sistla et al., 1997), however, they do not deal with all aspects of dynamic
geographic phenomena effectively. In order to develop a meaningful model of change, it
is paramount to analyze its ontological foundations.
Spatio-temporal systems must be designed to deal with changes of spatial and
temporal properties. Beard and Palancioglu (2000) identified three components of

change: boundary redefinition (Agouris et al., 2000a), thematic state change, and
movement. The main focus of this research is on the third component: movement and
uncertainties related to it. We seek to improve the understanding of the concept of
movement for geographic phenomena and its representation in information systems. As
one of the crucial components of dynamic geographic phenomena and change, the
concept of movement has been studied under various names, such as migration, motion,
and transportation in different scientific fields. In this thesis, we use the term movement.
2.1 Spatio-temporal Modeling
An object that occupies a position in a space is referred to as a 'spatial object'. An
object whose position may change over time is called a 'spatio-temporal object'
(Renolen, 1998). In addition, an object that is able to move over time and change its
position is referred to as a moving object.
A data model has been defined as the structure that describes types of data objects
and a framework for organizing and managing them. It has three major components
(Yuan, 1997): a set of object types, a set of operations, and a set of integrity rules. A
spatio-temporal data model can be defined as a data model that is designed for modeling
the real world where objects change their positions and shapes over time (Susumu and
Makinouchi, 1999). Currently, spatio-temporal models assume that objects have crisp
boundaries, precisely defined relationships with other objects, and accurately measured
positions in space with error-free representation. However, in the real world, objects have
vague boundaries, relationships, and positions. In addition, moving objects have changing
relationships and positions that might not be exactly known at all times (i.e., due to lack
of observations and knowledge). In other words moving objects have uncertainties and

vagueness related with their boundaries, relationships, and positions (Pfoser and Tryfona,
2000). Several spatio-temporal data models have been presented that record spatial and
temporal changes (Hazelton, 1992; Kelmelis, 199 1 ; Langran, l992b; Peuquet and Duan,
1995). Peuquet (1999) identified spatio-temporal data models in four categories a)
Location-based b) Entity-based c) Time-based and d) combined approaches.
The following categorization was presented in (Renolen, 1995):
One of the basic spatio-temporal models is the snapshot model (Figure 2.1). The
disadvantage of this model is that it supports a world that exists in the present or
as a collection of temporal snapshots. The snapshot model is unable to identify
changes explicitly (Armstrong, 1 988; Langran, 1 988; Peuquet and Duan, 1995).
1989 1993 1995 1999 Time
Figure 2.1 : The snapshot model.
Another simple approach is the data model based on time-stamping, that is,
assigning time stamps for the creation and cessation time of every object (Galetto
and Viola, 1994; Hunter and Williamson, 1990). This approach tracks different
versions of the same object over several non-related tuples within the same table.
This makes it difficult to determine the history of one single object (Montgomery,
1995). There have been different approaches proposed to solve this problem
including implementing an object-oriented model called a "temporal change
19

object (Ranlachandran et al., 1994)", which assigns references to the past, future
and current versions of the same object, organizing the versions of an object into
time sequences (Segev and Shoshani, 1993).
The space-time composite model, a vector model, was proposed by Langran and
Chrisman (1988). However, this approach also has some redundancy since two
objects may have full or partial common histories assigned to them. Although,
this approach is promising, its indexing method and structure of the data needs to
be tested in order to deal with large data sets.
As an alternative to the snapshot models, event-oriented or time-based models
such as "amendment vector approach" and "event-oriented spatio-temporal data
model-ESTDM" have been suggested (Langran and Chrisman, 1988); (Peuquet
and Duan, 1995); (Claramunt and ThCriault, 1995) in order to identify individual
changes or events to the data set in between the snapshots. Despite some of the
advantages of these approaches, they need to be investigated and tested further.
In addition, object-oriented data models have been implemented (Egenhofer and
Frank, 1992; Worboys, 1992). In these models, all versions of the same object are
embedded into one single entity and time is usually represented as one of the
dimensions in 3D or 4D space.
A challenge in spatio-temporal modeling comes from incorporating "space" and
"time" dimensions in the same database. Spatial databases (Guting, 1994; Shekar et al.,
1999) contain records on space varying phenomena. Temporal databases (Jensen and
Snodgrass, 1999; Snodgrass and Ahn, 1985) are characterized as managing records of
time varying information. The management of infornlation on phenomena that have both

time and space varying patterns are handled by spatio-temporal databases. Research in
spatio-temporal databases has taken the form of both temporal extensions to spatial
databases and spatial extensions to temporal databases.
Modeling, indexing, and query languages for spatio-temporal data have all
received attention. Langran (1992b) addressed a set of practical issues concerned with
data representation, incremental updates, and system longevity. Langran (1 988) examined
the concept of combined spatial and temporal dimensions and suggested that dimensional
dominance must be determined for the optimization of data and the algorithms.
Snodgrass and Ahn (1985) described the need to consider the evolution of spatial objects
in addition to retroactive or post active changes.
Temporal indexing often includes two aspects of time, valid time and transaction
time. When both times are included this is referred to as a bitemporal database (Jensen
and Snodgrass, 1999). Full spatio-temporal support is assumed to include these two
temporal aspects as well as two or three spatial dimensions. Spatio-temporal indexing
raises significant challenges. Spatio-temporal indexing has typically used one of two
approaches (Saltenis and Jensen, 1999): 1) overlapping index structures that index spatial
objects at different times or 2) the addition of time as another dimension to an existing
spatial index.
Query languages have been the subjects of related research. Spatial query
languages (Egenhofer, 1994; Shekar et al., 1999) supporting various spatial operations
have been developed. Likewise temporal query languages have been evolving
(Snodgrass, 1987). Spatio-temporal query language extensions need to develop in parallel
with these independent spatial and temporal query language developments.

2.2 Modeling Moving Objects
Management of information about moving objects requires database support and
there has been substantial research activity in this area recently. Relevant research covers
spatio-temporal databases, moving object databases (Erwig et al., 1997; Wolfson et al.,
1999; Wolfson et al., 1998), spatio-temporal indexing (Saltenis and Jensen, 1999),
indexes for moving objects (Kollios et al., 1999; Saltenis et al., 2000), representations of
the uncertainty of moving objects (Moreira et al., 1999; Pfoser and Jensen, 1999), and
ontological considerations for movement and moving objects (Galton, 1995).
Existing databases are incapable of handling continuously changing data, such as
the position of moving objects. Sistla et al. (1997) proposed a model to solve this
problem by representing the position of moving objects as a function of time. In this
model, a higher level of data abstraction that treats an object's motion vector as an
attribute of the object is considered. Moving objects fall directly within the purview of
spatio-temporal databases. Moving object databases are a specialization of spatio-
temporal databases for discrete and continuously varying spatial and temporal
information. A continuous model for continuous movement may be desirable but not
practical in the near term. Data observation streams are not fully continuous and there are
difficulties in storing and indexing continuous movements.
Wolfson et al. (1999) identified a set of capabilities for managing moving objects
that are not provided by current databases. These deficiencies include location modeling,
query support, indexing, and uncertainty issues. Within a conventional relational
database, the position of a moving object may be recorded and periodically updated. The
assumption however is that the position of the object is constant between updates.

Updates to an object's position can be made at frequent intervals but continuous updates
of locations are not feasible. Additionally frequent updates create perfomlance problems
if they require frequent updates of the index in response to the updated positions. In terms
of query languages, traditional query languages such as SQL are not satisfactory for
spatio-temporal range and spatio-temporal join queries and can be particularly
problematic for moving object queries. Moving object queries also need to accommodate
semantics for uncertainty. Since frequent updates to an object's location can be costly
and because position is assumed to be constant between periodic updates, query
responses from the database will not accurately reflect a moving object's position.
Moreira et al. (1999) have proposed superset and subset semantics as one approach to
address the uncertainty in queries regarding moving object trajectories.
Several current research activities (Saltenis et al., 2000; Wolfson et al., 1999)
address enhancements for support of moving object infomation. Wolfson et al. (1999)
incorporated the notion of a dynamic attribute, one whose value is updated continuously
as time passes along with incorporating a higher level data abstraction referred to as an
object's motion plan. The dynamic attribute is only explicitly updated in response to
changes in the motion plan. Saltenis et al. (2000) proposed a time parameterized R-tree
which indexes the current and anticipated future positions of moving objects.
Erwig et al. (1999) proposed a model for moving objects based on the abstract
data types, which are namely moving points and regions (Figure 2.2), along with a set of
operations on such entities. A value of type moving point representing a position as a
function of time can be described as a curve in the 3-D space (x, y, t). In addition, a value
of type moving region can be represented as a set of volumes in 3-D space (x, y, t). Erwig

et al. (1999) also introduced an algebra for the types: moving points and moving regions,
which uses operations namely mdistance, visits, trajectory, length, minvalue, maxvalue,
attime, mintime, and maxtime. He suggested that these data types and operations could be
integrated into Database Management Systems (DBMS) or query languages to provide a
complete data model and query language.
Figure 2.2: Discrete representations for moving points and moving regions.
Recently, a model for moving objects in a multimedia scene has been proposed by
Nabil et al. (1997). In this approach, moving objects are represented with their
trajectories, as snapshots. In addition, there have been approaches that employ Voronoi
diagrams to model continuously moving objects (Albers and Roos, 1992; Fu and Lee,
1991; Guibas et al., 1991).
2.2.1 Analyzing and Summarizing Movements
Hagerstrand (1970) introduced the concept of a "space-time path" to illustrate
how a person navigates his or her way through the spatial-temporal environment. Later,
Miller (Miller, 1991) discussed using the concept of a space-time path for modeling
accessibility within a GIs framework. In addition, recently the notion of "geospatial
lifeline" as a special class of spatiotemporal data has been introduced in (Mark and
Egenhofer, 1998). The notion of geospatial lifelines can be seen as a natural operational
extension from the concept of space-time path. A geospatial lifeline is a continuous set of

positions occupied by an object in geographic space over some time period (Mark and
Egenhofer, 1998). Geospatial lifelines that capture an individual's movement over space
and time is a powerful concept in dealing with a wide range of practical problems across
in many disciplines. The geospatial lifelines were used to model movements of objects
(Ramaswamy, 2000). "Lifeline beads", which are a particular form of a geospatial lifeline
that model the set of all possible locations an object could visit while moving between
locations is developed in (Ramaswamy, 2001). Intersections of lifeline beads reveal more
detailed information about the properties of objects' movenlents and provide more
powerful support for query processing. These intersections can be used in analyzing
movement patterns of multiple objects.
A framework for modeling the movement of objects or individuals over multiple
granularities is introduced in (Hornsby, 2000b; Hornsby and Egenhofer, 2002). A set of
operations is developed in (Hornsby, 2000a) to summarize spatio-temporal data related to
objects into views at a coarser temporal detail. This paper discussed methods for creating
summaries of spatio-temporal data, assisting users to retrieve information and make
queries in a more effective way.
Imfeld (2000) has proposed a technique in order to analyze spatio-temporal
behaviors in the movements of animals by extending the radial distance functions, which
can also be used to model human movement behavior. A number of generic operations
such as identification of attribute values at specific times/locations, max/min and
stadstop times for spatio-temporal analysis were presented recently in (Erwig et al.,
1999) that can be used to assist in making sunlmaries of movement data.
In addition Forer (1998) suggested plotting various spatial entities as solid cubic
cells occupying spatial and temporal dimensions. The model shows the individual as a
consumer of time space. Individuals will form a single wandering line that will be
constant in size but move spatially through time.
Unless we have observations that are almost continuous (i.e., video stream, GPS
observations) we cannot account for every instant of a movement. We know that
movements in the real world have duration. Descriptions of movement are often limited
to the actual observations that we use to detect them and the interpolation methods
(Chiyokura, 1986; Franke and Nielson, 1990; Mountain and Raper, 2001 b), which are
available. By accumulating observations about moving objects we can describe their
trajectory. Analysis of the trajectory parameters provides us with tools for understanding
behaviors of moving objects.
Behaviors of moving objects can be obtained by summarizing video datasets
(Adelson and Wang, 1994; Li et al., 1997; Vasconcelos and' Lippman, 1998). An
approach to summarize video datasets by analyzing the trajectories of objects within them
is introduced by Stefanidis et al. (2000). They obtained movements by tracing objects in
this 3-D (x, y, t) space. These trajectories are the basic elements upon which the proposed
summarization scheme is based.
Detection and generalization of spatio-temporal trajectories from video datasets or
motion imagery (Li et al., 1997; Partsinevelos, 2002; Vasconcelos and Lippman, 1998) is
an important research topic in movement modeling. The concept of a spatiotemporal
helix as a concise representation of spatiotemporal events, modeling their path in space
and the variations of their outline is introduced in (Partsinevelos, 2002). A set of

algorithms was developed to support the automated generation of spatiotemporal helixes.
These spatiotemporal helixes can be used in spatio-temporal analysis of movements of
objects.
Movements of objects and their movement behaviors repeat periodically in space
(x, y ) and time ( t) . Identifying repeated movements and behaviors of an object is a
strong cue for object and movement recognition (Boyd and Little, 1997; Goddard, 1997).
In addition, periodic movement can also aid in tracking objects (Cutler and Davis, 1998).
Furthermore, the periodic movement of people can be used to recognize individuals
(Little and Boyd, 1998). Signatures obtained from periodic movements are referred to as
the systematic signatures of moving objects.
2.2.2 Reasoning About Moving Objects
Spatio-temporal reasoning is a part of humans' daily lives and yet people rarely
notice it. Spatio-temporal reasoning is a new research area and current methods to infer
spatio-temporal information are limited (Altman, 1994; Dragicevic and Marceau, 1999;
Stefanakis et al., 1996). Cognitive theory assumes that humans' mundane activities and
experiences in space over time are integrated and further used metaphorically to reason in
other circumstances (Anderson, 1983; Eisenkolb et al., 1997; Hirtle and MacEachren,
1998; Mark, 1999). Human perception and experience should be explored to guide the
construction of reasoning methodologies in spatio-temporal systems. ( ~ ~ e n h o f e r and
Golledge, 1997). Existing spatio-temporal systems suffer from several limitations that
render them inefficient tools for spatial reasoning and decision-making (Dutta, 1988;
O'Neill and Foo, 1998; Stefanakis et al., 1996). Current Spatio-Temporal systems are
mostly based on Boolean (Formal) logic, a two-valued mathematical system. Because of

its limited nature, it leads to fundamental problems in the modeling and reasoning about
spatio-temporal data. It has limitations in modeling and reasoning about the real world.
Spatio-temporal reasoning refers in general to reasoning about problems dealing with
entities occupying space over time such as cars, animals, people, oil spills, and wild fires.
Spatio-temporal reasoning could be presented in three domains: qualitative, quantitative,
and visual (Peuquet, 1999).
Qualitative reasoning methodologies are important, as most human reasoning is
approximate in nature. For example, humans can reason in approximate tenns easily to
decide which path to take to reach their destination and what to do in the case of an
emergency or they can predict how long it may take to travel between two locations and
how a wild fire may spread. For several reasons, experts in most engineering fields
routinely make inferences with much less information than detailed quantitative analysis
would require. First, precise quantitative data might not be available or might be too
costly to obtain. For example, at an early device-design stage, precise numerical values of
the design parameters tend to be unavailable. Second, only qualitative predictions might
be needed. Finally, even when engineers plan to perform detailed quantitative analysis to
obtain precise results, qualitative reasoning is the crucial initial step that lets them quickly
identify potential problems that warrant more detailed analysis. Qualitative-reasoning
approaches offer several advantages over conventional numerical approaches including:
Coping with incomplete data: There are situations where insufficient quantitative
data is available to perform reasoning. Qualitative modeling lets us build a
reasoning model and perform prediction even with inconlplete knowledge.

Imprecise but correct prediction: With qualitative methods, reasoning can proceed
even when a precise numerical model is unavailable. Although, numerical
methods will produce precise predictions, it is often more desirable to achieve
accurate but less precise predictions.
Easy and understandable interpretation: Numerical approaches produce numerical
outputs that may be difficult to understand and interpret. However, qualitative
approaches produce outputs that are easy to understand and interpret.
Qualitative reasoning can be important especially to reason about moving objects
in uncertain, unknown or dynamic environments (Dutta, 1990). Qualitative reasoning
attracted interest from scientists to address issues related to spatial reasoning. Forbus
(Forbus, 1980) addressed issues of qualitative reasoning about space and motion. Most
research on spatial reasoning has assumed well defined and crisp spatial information
represented in spatial models as skeletons, generalized cones, convex polygons, Voronoi
diagrams and configuration space outta, 1988). In addition, visual reasoning methods
that employ the power of the human visual system to detect patterns have been proposed
(Dorling, 1992; Kraak and MacEachren, 1994; Monmonier, 1990).
2.3 Modeling Uncertainty
In reality, most real world events are imprecise and uncertain. However, they are
represented usually with precise and crisp models, which are simplifications of the real
world. The difference between reality and models is expressed by uncertainty.
There are two basic types of uncertainty that may be present in real-world situations
(Kosanovic, 1995):
Stochastic uncertainty
Due to a lack of information the future state of the system may not be known
completely. This type of uncertainty has stochastic character. It has been handled
by probability theory and statistics (Papoulis, 1984; Parzen, 1962).
Fuzziness
Vagueness concerning the description of the semantic meaning of the events,
phenomena or statements themselves (Kosko, 1993; Zimrnermann, 1991).
The outcome of a stochastic event is either true or false with some associated
probability. However, in the situation where an event itself is not well defined, the
outcome may be given by a quantity other than true (one) or false (zero). That is, the
outcome in the presence of fuzziness may be quantified by a degree of belief. The events
are modeled as fuzzy sets because the characteristic h c t i o n of such sets may take the
values other than zero or one. Hence, we may talk about the probability of a fuzzy event,
i.e. the likelihood that something vaguely defined would happen. Other types of
uncertainty are discussed in (Klir and Folger, 1988).
Geometrical and physical models in Geodesy and GIs are more or less adequate
approximations of reality. In many geographical applications there is a need to model
moving objects not strictly by absolute positions but rather through vague (concepts)
positions. Spatial database systems and geographic information systems are currently not
able to deal with this kind of data. It is a challenge for data analysis in geographic
information systems to combine the different approaches of uncertainty assessment.
Commonalities and differences between the statistical and non-statistical approaches
need to be understood.

There have been many efforts to handle spatial and temporal uncertainty in the
past (Dyreson and Snodgrass, 1993; Shibasaki, 1994). Previous work has highlighted that
standard logical approaches (i.e., Boolean logic, and random sets), classical adjustment
methods (i.e., least squares adjustment), and statistics (i.e., Bayesian statistics, robust
statistics, time series, Dempster-Shafer evidence theory (Lorup, 1999), possibility theory,
and probability theory) are well-known mathematical methods for the analysis of
uncertain data, but they are not always appropriate for modeling and reasoning about real
world phenomena, which are inherently imprecise, vague, incomplete, and fuzzy in
nature. Many real world phenomena including moving objects may not be represented
using conventional modeling approaches due to the lack of precise knowledge about the
phenomena, the strongly nonlinear behavior, the high degree of uncertainty, or the time
varying patterns. There can also be situations, which encourage use of other techniques,
such as lack of numeric data or having linguistic data along with the numeric data. There
exist other theories that are more suitable for a number of problems. Fuzzy sets and
neural network techniques are among these various techniques (Klir, 1991). Despite the
fact that there is much work done on modeling spatio-temporal concepts with Boolean
logic, not much has been done regarding modeling spatio-temporal concepts with Fuzzy
logic (Dutta, 1990; Stefanakis, 2001 ; Worboys, 1996).
Uncertainty can be modeled by using Probability theory when the distributional
knowledge is available which is not the case in most moving object applications (Demirli
et al., 1999). The randomness assumed by probability theory describes only a restricted
class of uncertainty in a system, while the majority of complex systems and real-life
problems are non-random in nature. Fuzzy set theory has found its place among other

theories including Probability theory (Babuska, 1996; Hoogendoorn et al., 1998) as a new
tool for representing uncertainty. Fuzzy set theory supports a large number of
applications and has become one of the methods for dealing with complexity, uncertainty
and imprecision in various systems. Fuzzy sets arise from an extension of the classical
(Boolean) sets for representing concepts that exhibit a gradual transition fiom
membership to non-membership. Mathematically, a set is a collection of elements that
share a common property. However, there are a large number of concepts in which an
element can have partial membership in a set. Fuzzy sets may be represented by a
mathematical formulation known as the membership function. This function gives a
degree or grade of membership within a fuzzy set. We can point out the distinction
between k z y systems and probability as follows:
Fuzziness is different fiom probability; it is the perceived uncertainty, which may
be caused by randomness in the behavior of the subject.
Fuzzy values are commonly misunderstood to be probabilities, or fuzzy logic is
interpreted as some new way of handling probabilities (Bezdek, 1993). But this is
not the case. A minimum requirement of probabilities is "additivity", that is that
they must sum to one, or the integral of their density curves must be one. But this
does not hold in general with membership grades (Klir, 1989).
Probability statements are about the likelihood of outcomes: an event either
occurs or does not. But with fuzziness, one cannot say whether an event occurred
or not (Kosko, 1990). Both operate over the same numeric range, and at first
glance both have similar values: 0.0 representing "false" (or non-membership),
and 1.0 representing "true" (or membership).

Probability theory assigns the membership grade of an entity in a set by a
statistically defined probability function. It deals with the expectation of a future
event, based on the available data. On the other hand, Fuzzy set theory describes
the admission of the possibility using membership functions that an individual is a
member of a set or that a given statement is true (Schneider, 1999).
Consider the following statements:
The probabilistic approach:
"There is an 90% chance that M. Jordan is tall."
The fuzzy approach corresponds to:
"M. Jordan's degree of membership within the set of tall people is 0.90."
The semantic difference is significant: the probabilistic approach supposes that
M. Jordan is or is not tall; it is just that we only have a 90% chance of knowing
which set he is in. By contrast, fuzzy approach supposes that he is "more or less"
tall, or some other tern1 corresponding to the value of 0.90.
In Fuzzy set theory, the possibility that an individual belongs to a set depends on
subjective factors such as expert knowledge whereas in the probability theory,
probability can be computed formally or determined empirically.
In addition, Fuzzy set theory enables vague statements about one concrete object
whereas Probability theory makes statements about a collection of objects fiom
which one is selected.
2.4 Fundamentals of the Fuzzy Set Approach
In 1965 Lotfi A. Zadeh (1965) published the first paper "Fuzzy Sets" as a novel
way of characterizing non-probabilistic uncertainties by formally defining multi-valued

or fuzzy, set theory. He extended traditional set theory by changing the two-valued
indicator function to a multi-valued membership function. Fuzzy set theory (or F u z y
logic) starts with and builds on a set of user-supplied human language rules. The fuzzy
systems convert these rules to mathematical equivalents. This simplifies the job of the
system designer and the con~puter, and results in much more accurate representations of
the way systems behave in the real world. The consequences of the theory, however, have
not been limited to set theory only. Almost immediately, the connection between fuzzy
set theory and a form of logic was recognized, leading to the introduction of fuzzy logic:
a logic based on fuzzy set theory. This relation is similar to the relation between the
conventional set theory and binary logic. Fuzzy logic starts with the concept of a fuzzy
set. A fuzzy set is a set without a crisp, clearly defined boundary (Klir and Folger, 1988).
A fuzzy set admits the possibility of partial membership such as Friday is sort of a
weekend day and the weather is rather hot. A classical set might be expressed as
1, if and only if x is member of A
0, if and only if x is not member of A
A fuzzy set is an extension of this classical set. If X is the universe of discourse
and its elements are denoted by x, then a fuzzy set A in X is defined as a set of ordered
pairs:
A = fx, p,(x)lx E X t (2-2)
where pA(x) is called the membership function ( MF) of x in A.
Fuzzy logic models, called fuzzy inference systems (FISs), consist of a number of
conditional "if-then" rules. For the designer who understands the system, these rules are
easy to write, and as many rules as necessary can be supplied to describe the system

adequately. Not only do the rule-based approach and flexible membership function
scheme make fuzzy systems straightforward to create, but they also simplify the design of
systems and ensure that one can easily update and maintain the system over time.
Gradual transitions (i.e., from "belongs to a set" to "does not belong to a set")
characterized by membership functions give fuzzy sets flexibility in modeling commonly
used linguistic expressions, such as "the travel time is high."
Since the mid-1970s, fuzzy logic has become integrated within various fields and
methodologies such as fuzzy graphs, calculus of fuzzy if-then rules, fuzzy interpolation,
fuzzy topology, fuzzy inference system, fuzzy modeling, and fuzzy reasoning. The
earliest applications, and perhaps still the most prevalent today, were led by the research
of Mamdani (1 974). Multi-disciplinary applications of fuzzy logic include automatic
control, electronics, pattern recognition, approximate reasoning, robotics, time-series
prediction, information retrieval, database management and querying, data classification,
natural language and image understanding, decision-making and machine learning
(Zimmernlann, 1 99 1).
Fuzzy set theory provides a formal system to make inferences about vague rules
describing the relation between imprecise, qualitative linguistic expressions of the inputs
and outputs of a system (Klir and Folger, 1988). The control rules usually correspond to
the knowledge of an expert and provide an easily comprehended pattern of knowledge
representation. The major advantage of this approach is being able to introduce and use
rules from experience, heuristics, intuition, and in addition, a model of the process is not
required.

2.4.1 Fuzzy Membership Functions
Designing membership functions is a key issue in fuzzy sets (Zadeh 1965). They
should be suitable for the problem at hand and easy to calculate. The outcomes of fuzzy
systems may yield different results by changing the parameters of the membership
functions. The selection of appropriate membership functions is an important issue. A
membership function (MF) is a curve that defines how each point in the input space is
' mapped to a membership value. The only condition a membership function must really
satisfy is that it must vary between 0 and 1. Membership functions are built from several
basic functions: piecewise linear function, Gaussian distribution function, sigmoid curve,
and quadratic and cubic polynomial curves (McNeill and Freiberger, 1993). Samples of
fuzzy membership functions (Jang and Sun, 1995) can be seen in Figure 2.3.
Triangular
Gaussian Bell
Figure 2.3: A sample set of fuzzy membership functions.
Conclusions about a certain phenomenon characterized by fizziness are
determined largely by the shape of its membership finction. By using membership
functions, membership grade or truth-value of a member in a particular fizzy set is
determined. The simplest membership functions are formed using straight lines. Of these,

the simplest is the triangular membership function. The trapezoidal membership function
has a flat top and really is just a truncated triangle. These straight-line membership
functions have the advantage of simplicity.
2.4.2 Fuzzy Inference Systems
Fuzzy inference systems (FISs) (Jang and Sun, 1995; Wang, 1994) are popular
computing frameworks based on the concepts of fuzzy set theory, fuzzy if-then rules, and
fuzzy reasoning. It is the process of deriving conclusions from a given set of fuzzy rules
acting on fuzzified data. Basically, a FIS is composed of four functional blocks as shown
in Figure 2.4.
Fuzzy Rule r-LJ
Engine
Figure 2.4: Basic fuzzy inference system.
Fuzzification maps crisp inputs into fuzzy sets, which are subsequently used as
inputs to the inference engine. A fuzzy set U is characterized by a membership function
(MF) p: U+ (0,l). Membership functions are labeled by linguistic terms such as "small"
or "large" (Mendel and Mouzouris, 1997). Several classes of parameterized functions
widely used to define membership functions such as Gaussian, Generalized bell, and
Trapezoidal functions are given in equations (2.3), (2.4), and (2.5) respectively
input(s)
-b
output(s)
Fuzzification Defhification
v
b
b
A
Fuzzy Inference

gaussian(x;a,b,c) = e x p [ - ( x i a r ] -
a x - c + - + - , x l c I ( 3 where x is an input variable, and a, b, and c are membership function parameters.
A Fuzzy rule base is a set of fuzzy rules in the form of if-then clauses. For a
multi input single output case, the ith rule can be expressed by
R' :if x is A' and y is B' then z is C' (2-6)
where x and y are the input variables, z is the output variable, and A' and B' are
the labels of membership functions associated to the input variables and C' is the label of
the membership function associated with the output variable, z, in the rule i.
Human experts are usually able to provide certain linguistic information about
real world situations. However, they are usually not able to give their knowledge,
experience, and intuition in terms of linguistic rules alone. In addition, certain numerical
information can also be obtained based on measurements, observation, or statistical
analysis of a particular phenomenon. Therefore, it is of interest to consider both
numerical and linguistic information in the design process of fuzzy rules (Wang and
Mendel, 1992).

A Fuzzy inference engine is a decision-making logic, which performs the
inference operations on the rules and a given condition to derive a reasonable output or
conclusion. In a fuzzy inference system, basically there are three types of input space
partitioning: grid, tree, and scattering partitioning (Mathworks, 1995). Three types of
FISs (Jang and Sun, 1995): Mamdani fuzzy model, Sugeno fuzzy model, and Tsukamoto
k z y model, have been widely employed in various applications. The differences
between these three FISs lie in the consequents of their fuzzy rules, and thus their
aggregation and defuzzification procedures differ accordingly.
The Mamdani fuzzy model (Mamdani and Assilian, 1975) was proposed as a first
attempt to control a steam engine and boiler combination using a set of linguistic control
rules obtained from experienced human operators. Figure 2.5 shows how a two-rule fuzzy
inference system of the Mamdani type works to calculate the overall output z when
subjected to two crisp inputs x and y.
Figure 2.5: Mamdani type fiuzy inference system.
The Sugeno fuzzy model was proposed in an effort to develop a systematic
approach to generating fuzzy rules from a given input-output data set. Figure 2.6 shows
how a two-rule fuzzy inference system of the Sugeno type works to calculate the overall
output z when subjected to two crisp inputs x and y.
3 9

Figure 2.6: Sugeno type fuzzy inference system.
A typical fuzzy rule in a Sugeno fuzzy model has the form
Ri:if x i s A' and y is B' then z= f ' ( ~ , ~ ) (2-7)
where A' and B' are fuzzy sets and z = f (x; y) is a crisp fict ion. Usually f (x; y)
is a polynomial of the input variables x and y and the fuzzy inference system that uses a
first-order polynomial f (x; y) is called a first-order Sugeno fuzzy model (Sugeno and
Kang, 1988; Takagi and Sugeno, 1985).
.............................
X X Y Y Min
Figure 2.7: Tsukomato type fuzzy inference system.
In the Tsukamoto fuzzy models (Tsukamoto, 1979) the result of each fuzzy if-
then rule is represented by a fuzzy set with a monotonical MF. The overall output is taken
as the weighted average of each rule's output. The whole reasoning procedure for a two-

input two-rule system can be seen in Figure 2.7. Since each rule infers a crisp output, the
Tsukamoto fuzzy model aggregates each rule's output by the method of weighted average
and thus also avoids the time-consuming process of defuzzification.
Defuzzification transforms the fuzzy results of the inference into a crisp output.
The most popular defuzzification method is the centroid of area as given in equation
where ~ ( z ) is the aggregated output MF. Other defuzzification strategies arise for
specific applications, which include bisector of area, mean of maximum, largest of
maximum, and smallest of maximum, and so on. These defuzzification strategies (Jang
and Sun, 1995) are shown in Figure 2.8.
Smallest of max. / I \ Largest of max. Mean Bisector Centroid of max. of area of area
Figure 2.8: Defuzzification strategies (Jang and Sun, 1995).
The essential part of a typical fuzzy system is formed by a knowledge base in
which the process of the fuzzy system is explained as a set of fuzzy if-then rules. An
inference mechanism compares the inputs of the system against the knowledge stored in
the knowledge base and generates a system's output by using the given inputs and the
available knowledge in the knowledge base. Conventional f i z z y systems are static; rules
4 1

are acquired off-line and the system components do not change once operation begins.
Adaptive fuzzy systems are capable of modifying their behavior to follow changes in the
operating environment. This adaptive capability is crucial in complex problem domains
such as in many military applications, where it is desirable to have the system react to
newly acquired or dynamically changing knowledge. In this thesis, the implementations
of both conventional and adaptive neuro-fuzzy systems are demonstrated.
2.5 Neuro-Fuzzy Modeling
The term neuro-fuzzy modeling refers to the way of applying various learning
rules developed in the artificial neural network (ANN) literature to fuzzy systems.
Compared to black-box techniques like neural networks where the internal structure of
the network (the functioning of the ANN) is hardly transparent to the user, fuzzy systems
are to a certain degree transparent to interpretation and analysis. In the 1 9 9 0 ~ ~ several
transportation applications used Artificial Neural Networks (ANN) (Dougherty and
Kirby, 1993). In this work, driver behaviors under changing conditions were analyzed.
ANN was used in the prediction of rates created by traffic flow according to the possible
traffic compositions (Kikuchi et al., 1993; Ritchie and Cheu, 1993).
Although the fuzzy inference system has a structured knowledge representation in
the form of fuzzy if-then rules, it lacks the capabilities of learning and has no memory. In
the classical development of fuzzy systen~s, fuzzy rules have been obtained by
knowledge acquisition from experts. Recently, algorithms have been developed to learn
fuzzy rules from numerical training data. Among them, the back-propagation learning
rule, which is actually a universal learning paradigm for any smooth parameterized
models including fuzzy inference systen~s, was introduced. The ability to generate fuzzy
rules from training samples has distinct advantages in many applications. That is why
hybrid systems particularly neuro-fuzzy systems are becoming popular. As a result, a
fuzzy inference system can now not only take linguistic information (linguistic rules)
from human experts, but also numerical data (inputloutput pairs) to achieve better
performance. This gives fuzzy inference systems an edge over neural networks, which
cannot take linguistic information directly (Kosko, 1992).
Fuzzy sets, neural networks, and neuro-fuzzy methods are among the methods
used to model uncertain and imprecise information (Altman, 1994; Dragicevic and
Marceau, 1999; Klir and Folger, 1988; Schneider, 1999; Studer and Masulli, 1996) by
many fields including modeling moving objects. In this research, fuzzy and neuro-fuzzy
techniques are adopted to develop models of moving objects and to capture the
imprecision, uncertainty, and vagueness related to their movements.
2.6 Adaptive Neuro-Fuzzy Inference System
An Adaptive-Network-based Fuzzy Inference System (ANFIS), is a fuzzy
inference system implemented in the framework of adaptive networks (Jang, 1993). An
adaptive network is a superset of all kinds of feed-forward neural networks with
supervised learning capability. ANFIS serves as a basis for constructing a set of fuzzy if-
then rules with appropriate membership functions to generate the stipulated input-output
pairs. Modeling and control techniques of ANFIS are explained in (Jang and Sun, 1995)
and a number of various applications are demonstrated in (Jang et al., 1996). The
remaining paragraphs explain the ANFIS architecture and its learning algorithm for the
Sugeno fuzzy models (Jang, 1993; Studer and Masulli, 1996).

We assume that the fuzzy system under consideration has two inputs x and y and
one output z. Consider a first-order Sugeno type fuzzy system (Sugeno and Kang, 1988;
Takagi and Sugeno, 1985) having a typical rule base as follows:
RuIe2:IfxisA2 andyisB, then f 2 = p 2 x + q 2 y + r 2 (2-1 0)
Figure 2.9 illustrates the reasoning mechanism for this Sugeno model (Takagi and
Sugeno, 1983) and the equivalent ANFIS architecture is shown in Figure 2.1 0.
I
Min
Figure 2.9: A two-input first-order Sugeno fuzzy model with two rules.
Layer 1 Layer 2 Layer 3 Layer 4
x Y
Figure 2.10: The equivalent ANFIS structure.

Every node i in Layer 1 is an adaptive node with a membership function
pAj (x) of k z y set Ai and p, (y) of fuzzy set Bi (i = 1'2). Here, x is an input value and
Ai is the linguistic label (close, far, etc.) associated with the membership functions.
Parameters used in this layer are referred to as 'premise parameters'.
Every node in Layer 2 is a fixed node labeled ll which multiples the incoming
signals and outputs a product.
Evaluating the rule premises results in
wi = PA; ('1 p& (Y)? =
Evaluating the implication and the rule consequences gives
Or leaving the arguments out
Every node in Layer 3 is a fixed node labeled N. The i-th node calculates the ratio
of the i-th rule's firing strength to the sum of all rules' firing strengths:
Every node i in Layer 4 is an adaptive node with a node function
where Ci is the output of layer 3, and (p,x+ q,y +r,) is the parameter set.
Parameters used in this layer are referred to as 'consequent parameters'.

The single node in Layer 5 is a fixed node labeled that computes the overall
output as the sununation of all incoming signals and is written as
f = p ; ~ ='%A + &f2 (2- 16)
In the context of this thesis, this approach is used to interpolate the movement
data to obtain movement signatures.
2.7 Data Mining
Data Mining is the process of identifying new patterns and insights in data. As the
volume of data collected and stored in databases grows, especially in moving object
applications, there is an increasing need to provide data summarization, identify
important patterns, and reason upon the findings.
There are currently few geographical analysis methods able to explore large
databases for detecting and sunlmarizing movement patterns. As a result many important
datasets are not being analyzed to the fullest extent. For example, data about movements
of animals, city busses, and criminals are collected and analyzed, if indeed at all, using
inadequate methods. Here, the essential task of data mining, which employs forms of
cluster analysis, is to find clusters and patterns in space andlor time in movement data.
The purpose of clustering, which is also called unsupervised learning, is to identify
natural groupings of data from a large data set to produce a concise representation of a
system's behavior (Krishnapuram and Keller, 1993). Clustering of numerical data forms
the basis of many classification and system modeling algorithms. There are several
clustering models and algorithms that are developed based on crisp (Duda and Hart,
1973), fuzzy (Bezdek, 198 I), probabilistic (Titterington et al., l985), and possibilistic
methods (Krishnapuram and Keller, 1993).
46

Assigning each data point to exactly one cluster often causes problems, because in
real world applications a crisp separation of clusters is rarely possible due to overlapping
classes. Also there are usually exceptions, which cannot be suitably assigned to any one
cluster. Fuzzy clustering methods that specify a membership degree between 0 and 1 for
the assignment of each data sample to multiple clusters instead of crisp assignments of
the data to a single cluster are better suited for several applications. Most fuzzy cluster
analysis methods optimize a subjective function that evaluates a given fuzzy assignment
of data to clusters. By suitable selection of parameters of the subjective function it is
possible to search for clusters of different forms. From the result of a fuzzy cluster
analysis, a set of fuzzy membership functions can be obtained to describe the underlying
data. These fuzzy membership fimctions can be used to build fuzzy movement signatures
of objects. Classification of movement observations into signatures may also be handled
by using clustering methods. We can cluster different types of movement observations in
regard to the distances, directions, speeds, and temporal behaviors they exhibit. In this
thesis, an approach is introduced for the analysis of movement data to produce rules to as
where to look for patterns, when to look, and what to look for. In order to carry out our
proposed approach different clustering methods including the iterative self-organizing
data analysis technique (Isodata) and fuzzy c-means are used.
2.7.1 The Iterative Self-organizing Data Analysis Technique
The iterative self-organizing data analysis technique (Isodata) is a widely used
technique in unsupervised data clustering (Bezdek, 1980; Dunn, 1973; Takahashi et al.,
1995). The Isodata clustering method (Tou and Gonzalez, 1974) iteratively classifies
data, redefines the criteria for each class, and classifies again, so that the Euclidian
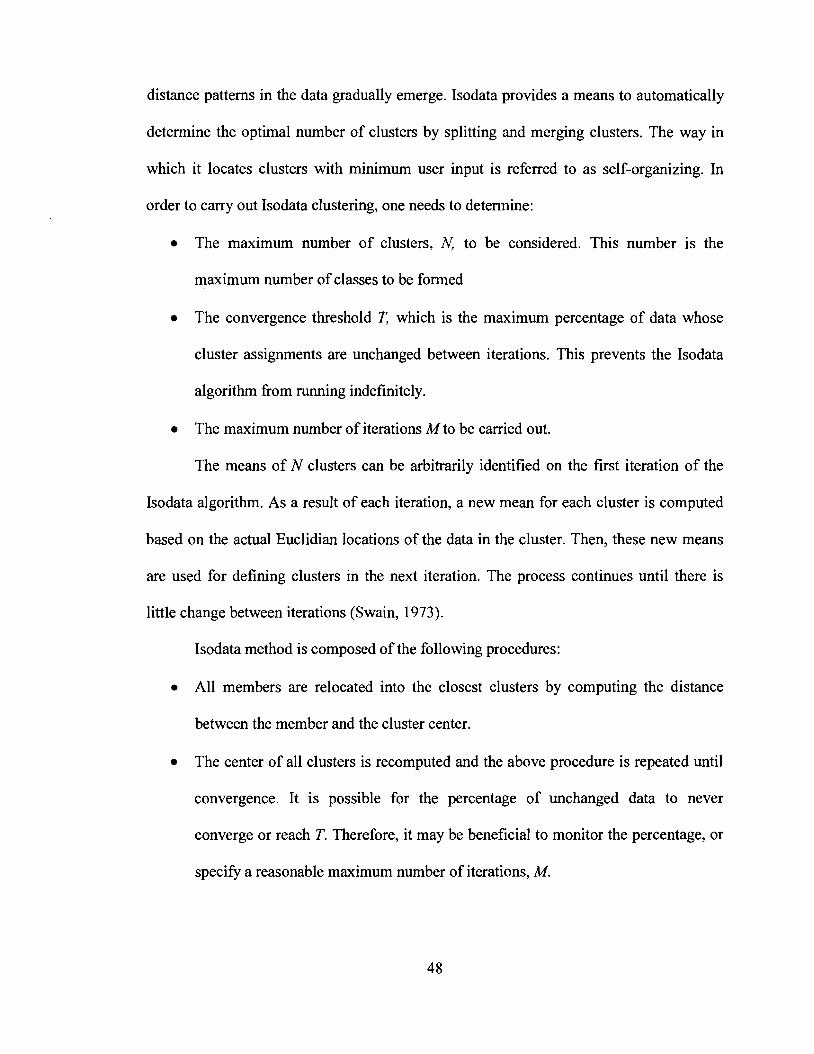
distance patterns in the data gradually emerge. Isodata provides a means to automatically
determine the optimal number of clusters by splitting and merging clusters. The way in
which it locates clusters with minimum user input is referred to as self-organizing. In
order to carry out Isodata clustering, one needs to determine:
The maximum number of clusters, N, to be considered. This number is the
maximum number of classes to be formed
The convergence threshold T, which is the maximum percentage of data whose
cluster assignments are unchanged between iterations. This prevents the Isodata
algorithm from running indefinitely.
The maximum number of iterations M to be carried out.
The means of N clusters can be arbitrarily identified on the first iteration of the
Isodata algorithm. As a result of each iteration, a new mean for each cluster is computed
based on the actual Euclidian locations of the data in the cluster. Then, these new means
are used for defining clusters in the next iteration. The process continues until there is
little change between iterations (Swain, 1973).
Isodata method is composed of the following procedures:
All members are relocated into the closest clusters by computing the distance
between the member and the cluster center.
The center of all clusters is recomputed and the above procedure is repeated until
convergence. It is possible for the percentage of unchanged data to never
converge or reach T. Therefore, it may be beneficial to monitor the percentage, or
specify a reasonable maximum number of iterations, M.
If the number of clusters is within a specified number, and the distances between
the clusters meets a prescribed threshold, the clustering is considered complete.
Please refer to (Schalkoff, 1992; Therrien, 1989) for more information about
Isodata clustering method.
2.7.2 Fuzzy C-Means Clustering
Fuzzy c-means (FCM) (Xie and Beni, 1991) is a data clustering method wherein
each data point belongs to a cluster to some degree that is specified by a membership
grade. FCM technique was originally introduced by Bezdek (198 1) as an improvement on
earlier clustering methods. It provides a method for grouping data points that populate
some multidimensional space into a specific number of different clusters. The cluster
information can be used to generate a Sugeno-type fuzzy inference system that best
models the data behavior using a minimum number of rules. The rules partition
themselves according to the fuzzy qualities associated with each of the data clusters.
In moving objects applications often there are no sharp boundaries between
clusters so that fuzzy clustering is better suited for the movement data. Membership
degrees between zero and one are used in fuzzy clustering instead of crisp assignments of
the data to clusters. Fuzzy clustering can be applied as an unsupervised learning strategy
in order to group data. But fuzzy clustering is also very useful for constructing fuzzy if-
then rules from data. The structure of the rules depends on the considered application.
Identifying the structure of a fuzzy system requires designing the appropriate input and
output membership functions and enough rules, which is achieved by rule generation and
input selection steps.

In this thesis, rule generation is carried out using the approach of Emanli et al.
(1996) based on clustering of input-output data. The fuzzy partition of the input space is
specified by generating the projection of the output clustered space on each input variable
separately. Using this method, the rule generation step could be separated from the input
selection step. The idea of fuzzy clustering is to divide the output data into fuzzy
partitions that overlap each other. Therefore, the containment of each data within a
cluster is defined by a membership grade, which takes values in the interval of [0, 11. The
clustering of the unlabeled data X = {x,,x, ,...., x,) c 91h is the assignment of labels to
the vectors in X and to the objects generating X Here, N is the number of data vectors and
h is the dimension of each data vector. The problem of fuzzy clustering is to find the
optimum membership matrix U. The most widely used objective function for fuzzy
clustering in X is the weighted within-groups sum of squared errors objective function J,,
which is used to define the following constrained optimization problem (Bezdek, 198 1):
where
I lo < u, < 1 Vi, k & Vk, u, > 0 3i)
Here, V = {v, ,v ,,...., v,) is a vector of (unknown) cluster centers, and
IIxlI, = A T ~ x is any inner product norm. A is a h x h positive definite matrix which
specifies the shape of the clusters. The common selection for the matrix A is the identity
matrix, leading to the definition of Euclidean distance, and consequently to clusters.
5 0

Fuzzy partitions are carried out using the fuzzy c-means algorithm through an iterative
optimization of J, (Pal and Bezdek, 1995). The procedure can be summarized in the
equation (2.21) (Pal and Bezdek, 1995).
Store unlabeled object data X = {x , ,x2 ,...., x, } c 91h
Pick number of clusters (c),
weighting exponent (m),
iteration limit (T), termination criterion ( E > O),
Norm for J , (Ilxk - v, 11,). and Norm for E, = /IV, - V,-, 11.
Guess initialposition of cluster centers: V, = {v,,, ,v,,, ,...., v,,} c 91ch.
Iterate For t = 1 to T;
Calculate u,,,
Calculate v,,
If El I E , Then stop, and put (Uf , V, ) = (U, , V, )
Next t
Use protowpes V, andlor fuzzy Labels U,
Cluster validity index is an important issue in the fuzzy clustering. In this study,
the Emami index (Emami et al., 1996), which is an appropriate generalization of
scattering criteria (Duda and Hart, 1973) for the assignment of number of clusters, is
performed.
Another parameter whose value should be decided in fuzzy clustering is the
weighting exponent m , shown in the equations (2.19) and (2.20). Weighting exponent
controls the extent of membership sharing between fuzzy clusters in the data set.
Therefore, in the range of ( l , ~ ) , the larger m is, the "fuzzier" are the membership
assignments to each data point. A guideline for the selection of m is introduced by
Emami et al. (1996). In this study, the value of the weighting exponent m=2 is used in
order to obtain fuzzy cluster centers.
The input selection in fuzzy system identification is to find the most dominant
input variables among a finite number of input candidates. In this study, the input
selection is carried out using the proposed method of Emami et al. (1 996). In this method,
input selection is directly related to the way input membership functions are constructed.
The membership functions for each input candidate were constructed through fuzzy
clustering such that, for each cluster, those points which have output membership grade
close or equal to one obtain the same input membership grades.
Chapter 3
MODELING MOVING OBJECTS
We consider moving objects to be real world objects capable of voluntary or
involuntary movement. For instance, cars, trains, ships, airplanes, insects, birds, animals,
humans are moving objects. Moving objects may include those that are frequently at rest
to those that exhibit continuous movement. Erwig et al. (1999) characterizes all
geometric change as movement including changes in shape (growing or shrinking).
Galton (1995) describes movement as occurring whenever the same object occupies
different positions in space at different times. He describes the position of an object as the
total region of space that it occupies at a time. We separate change in an object's
boundary and expansion or contraction of size as a shape change and distinguish it f ion~
movement. We define movement specifically as a translation or rotation about an axis
(similar to the definition used by (Moreira et al., 1999)). This distinction captures
important behavioral differences between real world objects for example lakes and cars.
Lakes frequently shrink and expand but are not subject to rotation or translation and
hence we would say are not subject to movement (except possibly in a catastrophic
event). Cars on the other hand frequently change their positions but do not change their
shape. Both rigid and non-rigid objects may exhibit both types of change: movement and
boundary reconfiguration and there can be reason and need to treat these as separate
dimensions of change.

3.1 Model Framework for Movement Behaviors
Rarely are movements completely random and rarely are they completely
unconstrained. They are organized by spatial and temporal structures and the physical
properties of an object itself. To characterize the spatial aspect of a moving object, the
position of the object should be captured. To characterize the spatio-temporal aspect of a
moving object, which gives us its path, the orientation, direction, distance, travel time,
and speed of the object should be captured. Complete knowledge of any particular
movement is impossible, but movements can be detected, modeled and predicted with
some degree of accuracy and reliability. A model for moving objects should be able to
support several types of questions about moving objects. Some questions may deal
strictly with spatial patterns, others may deal with only temporal aspects while others
address combined spatial-temporal patterns. Useful spatio-temporal information on a
single moving object at time t may be addressed with the following questions:
What is the position of a moving object at time t?
What is the orientation of a moving object at time t?
What is the direction of the movement of a moving object at time t?
What is the distance of a moving object at time t from certain locations?
What is the speed of a moving object at time t?
What is the path of a moving object during time interval I (ti-], ti)?
In order to effectively model moving objects we need a representational
framework for movement behaviors. Most previous approaches to estimating moving
object positions rely on a time ordered sequence of observations. Observations refer to
any measurements that capture the location of one or more real world objects at specific
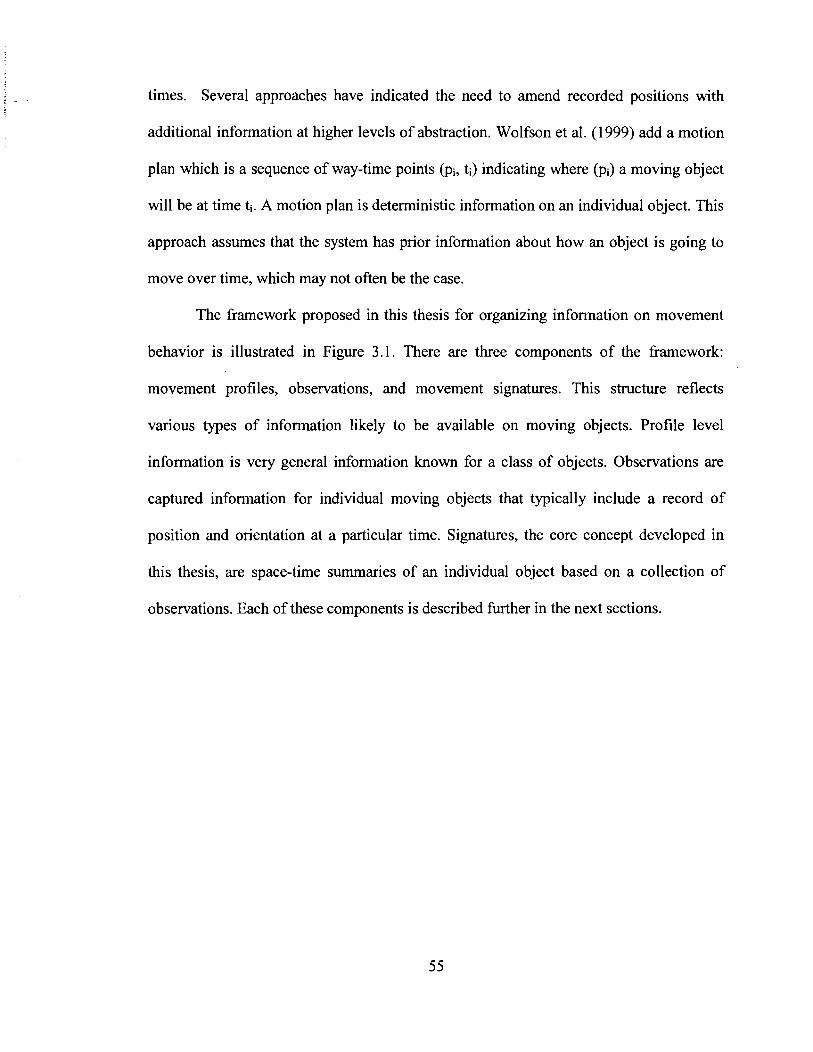
times. Several approaches have indicated the need to amend recorded positions with
additional infonnation at higher levels of abstraction. Wolfson et al. (1 999) add a motion
plan which is a sequence of way-time points (pi, ti) indicating where (pi) a moving object
will be at time ti. A motion plan is deterministic information on an individual object. This
approach assumes that the system has prior information about how an object is going to
move over time, which may not often be the case.
The framework proposed in this thesis for organizing infonnation on movement
behavior is illustrated in Figure 3.1. There are three components of the framework:
movement profiles, observations, and movement signatures. This structure reflects
various types of information likely to be available on moving objects. Profile level
information is very general inforn~ation known for a class of objects. Observations are
captured information for individual moving objects that typically include a record of
position and orientation at a particular time. Signatures, the core concept developed in
this thesis, are space-time summaries of an individual object based on a collection of
observations. Each of these components is described further in the next sections.

Framework of
Constraints extemalhnternal
(i.e., transportation networks1 maximum speed)
1 1 1
Quantitative I.e., x, Y, z, t)
Movement Profiles (class level)
Spatial Signature
and rules
Observations (instance level)
Surface
Movement Signatures (instance level) (i.e., for a car)
Mathematical expressions
Figure 3.1 : The framework of the proposed approach.

3.1.1 Movement Profiles
Profile information describes general knowledge on the movement behaviors of
classes of objects such as cars, planes, boats, and various types of animals. We know that
moving objects have general constraints on their movements (i.e., boats are constrained
to water). We refer to the general class level behaviors and constraints as movement
profiles. The range of movement behaviors belonging to a set of objects such as a car, a
truck, and a bus forms the general movement behaviors of a class of object such as the
class "vehicle". Most objects move within constrained environments such as roads and
many classes of objects is subject to similar sets of constraints. Thus profile level
information can be specified in the form of constraints applied to a class. Movements of
objects are subject to various spatial and temporal constraints and movement profiles
identify these constraints. We identify two types of physical constraints on movements of
objects:
Internal Constraints: These are related to the physical characteristics of a class of
moving objects that define the objects' ability to move. Such constraints bound
speed, agility, and ability to move in different media or along different axes.
External Constraints: These are constraints that exist in the environment external
to an object. A class of moving objects usually shares sets of external constraints
including spatial and temporal constraints such as moving on the same type of
media.
A movement profile for a class of objects identifies directional axis constraints on
movement, medium constraints on movement, general size, shape and weight
characteristics that constrain movement, as well as prototypical average or maximum

speed for a class of object. These sets of constraints can be associated with class
hierarchies. As an example, classes of vehicles, classes of animals or classes of storms
can be globally assigned average or maximum speeds. Subsets of classes with different
behaviors can be assigned to subclasses distinguished by different directional movement
constraints or different media constraints. Directional axis movement constraints describe
the ability of an object to move in the X, Y or Z-axis where these are aligned with respect
to the object itself as shown in Figure 3.2.
Back
Figure 3.2: Axes used to describe the directional axis movement constraints of objects.
We assume an object has a fixed orientation: a front and back aligned with the Y-
axis and a left and right aligned with the X-axis. Z is the vertical axis aligned with the
gravitational field. Some objects are capable of movement along all three axes, but to
different degrees. For example, humans' primary axes of movement is Y. However, they
can engage in X movements by sidestepping, but are significantly constrained in Z. In
addition, helicopters are capable of Y movement, Z movement, and X movement, a
submarine has Z and Y movement, an elevator only Z movement, and a car just Y
movement. Media constraints are external constraints referring to the surface or
volumetric media on or within which an object is capable of moving. Very few objects
are unconstrained with respect to media. Obvious examples of media constraints include
roads for automobiles, tracks for trains, and water for ships. Animals, people, and all
terrain vehicles are examples of less media constrained moving objects.
Constraints on class level movements can take the form of either spatial or
temporal constraints. An animal's spatial constraints can include inability to move up
steep gradients, through thick underbrush, or over water. Its temporal constraints may be
that it routinely moves only during the day or only during the night. Media may have
their own constraints that a moving object may inherit. For example all classes of moving
objects have a prototypical speed. Cars constrained to the road media inherit the speed
limits assigned to the roads, which in turn may override their prototypical speed.
Knowledge of an object's movement constraints in the form of profiles in combination
with observations can improve the ability to more reliably estimate a moving object's
location or path. Profiles are introduced as an essential component of the overall
framework and to indicate that they place bounds on signature level movement behavior.
This thesis however does not focus on movement profile development.
3.1.2 Observations
While movement profiles provide general information on how classes of objects
may or may not move, observations are the important information component for
determining specific positions occupied by moving objects and the associated time of
occupation. Observations refer to any measurements that capture the location of one or
more real world objects. We identify two types of observation: qualitative (linguistic)
such as the speed of the car was slow and it was heading north-east and quantitative
(numeric) such as the speed of the car was 45.73 milehour and it was heading 62.56
degree north-east.

Qualitative observations are usually acquired from the knowledge or perception of
experts in specific applications. Human decision-making and reasoning in movement
modeling uses qualitative observations and knowledge on a daily basis when reasoning
about movements of objects. In many situations humans use linguistic information more
easily than numerical information. We need to combine quantitative knowledge
(formulas and equations, i.e., direction of moving object is 63.16') and qualitative
knowledge (linguistic information, i.e., direction of moving object is Northeast) when
solving real-life problems related to movements of objects. Therefore, qualitative
observations are used to build the fuzzy membership functions and fuzzy rules base of the
ANFIS structure developed in this thesis along with the quantitative observations.
The sources of quantitative observation include satellite images, aerial
photographs, video sequences, GPS observations, or telemetry observations. Moreira et
al. (1999) refer to observation-based systems as sensor systems that capture location data
in an ordered sequence at regular time intervals. In comparison with GPS observations,
images are less effective observation sources for identifying and tracking specific moving
objects. In certain contexts, however, imagery including that from video cameras may be
useful sources for obtaining moving object positions.
We assume that observations may be regularly or irregularly spaced in time from
different sources. Representations of these observations are stored in a database. For each
observation we assume a recorded spatial footprint that describes a 2D projection of the
observation into a spatial reference frame (Beard and Smith, 1997). Such projections or
footprints may take the form of points, lines, or regions. A GPS observation has a point
footprint while a satellite image or the extract of an object from an image will have a

region footprint. A video clip may have a point, linear, or regional footprint.
Observations additionally have time stamps that may be points or intervals.
The proposed spatio-temporal model for organizing observational data (Figure
3.3) (Beard and Agouris, 1997) includes a multimedia information store, which is the
repository of information sources that may include imagery, maps, video, text documents,
and scientific data sets such as meteorological observations, and a spatio-temporal
gazetteer. The spatio-temporal gazetteer (Figure 3.3) is an indexing structure over the
multimedia information store and is the key mechanism for converting latent information
contained in the multimedia information store into explicit observations on individual
objects.
Spatio-temporal Gazetteer Shape Register
Thematic State Register
Multimedia ,+
Geographic Information Store Entity Register
Position Register
Movement Register
Figure 3.3: Conceptual model of integrated spatio-temporal gazetteer and multimedia
information store.
The gazetteer consists of several subcomponents including:
a geographic entity register, a position register,
a spatial representation register, a movement register.
a thematic state register,

The geographic object register maintains a record of identified spatio-temporal
objects. When an object is identified and registered it receives a unique identifier, a
register entry date, a name and a generalized spatial location or footprint. The shape
register is a collection of relations between geographic objects and the boundary
representations of individual objects. It tracks boundary representations of geographic
objects. In a similar manner, the thematic state register tracks thematic states of
geographic objects. The position register tracks positions of objects. And finally, the
movement register tracks movements of objects (Beard and Agouris, 1997).
A GPS observation is typically associated with a single real world object (i.e. a
ship). Satellite or other imagery, however, contains representations of multiple real
world objects and their positions. Objects and their positions are extracted fiom images
using various feature extraction methods (Agouris et al., 2000b; Mountrakis, 2000). The
position register maintains the association between an observed position and an object.
o bject-id, o bsewation-id, o bsewation-time - stamp, x-y coordinates
This association is important for accuracy assessment, as the accuracy of the
position is a function of characteristics of the observation and the applied feature
extraction method. A similar approach has been introduced by Pfoser et al. (2000).
If an object is extracted fiom an image we describe its position as a point or center
of the object's minimum bounding rectangle (MBR). B:position: ( X , Y , Z , ~ ) ~ ~ ~ describes
B's location according to the observation Oti with time stamp ti; x, y, and z are
coordinates describing the MBR center, and 0 is an initial azimuth for the object if a
record of azimuth is pertinent. Plotted a set of position observations for an individual
object on an individual day might look like those illustrated in Figure 3.4.

Movement of an object cannot be detected from a single observation (i-e., a single
GPS observation) since a single observation is assumed to represent an instant of time.
Detection of movement requires at least two observations with different time stamps
defining a time interval. A record in the movement register contains the unique ID of a
geographic object, a distance and direction vector indicating movement of the geographic
entity, the IDS of the two information objects from which the vector was extracted, and
the time interval computed as the difference between the two observation time stamps.
Two different observations a short time interval apart can indicate a movement. We say
movement has occurred if for At (the difference in time stamps between two
observations), there is a AX, AY, AZ, or A 8 greater than zero, and a unit movement is
defined as given in equation (3.1).
B : = (AX, AY, AZ, A8) (3-1)
A unit movement has the properties of duration (At), path (AX, AY, AZ, or A8)
and velocity (AX, AY, AZ)/At, or ABlAt. The unit movement vectors may be maintained
in the movement register or computed as needed.
Figure 3.4: A set of position observations.
63

3.2 Movement Signatures: What is a Signature?
In a sense, the profiles and the observations are information at the extremes. The
profiles offer general infonnation that identifies the capabilities of an object to move,
while the observations provide relatively high frequency information on the positions of
individual objects at particular times. What is not addressed by either but may be of
some interest for a number of applications is infonnation on the general movement
patterns of an individual object. For example we might want to ask about the general
movement of a soccer mom on Monday mornings, the weekly pattern of a tugboat in
Portland harbor, the patterns of bear # 105 in the spring, the annual pattern of a migrant
laborer or the annual pattern of a long haul trucker. In each example, the interest is in
same likely patterns for same time intervals. The implication from the examples is that
every moving object in the real world exhibits a wide range of behaviors some of which
repeat but not exactly over space and time. Even though movement behaviors are not
exactly the same, they are also not completely different. Moving objects may move on
the same or nearly similar paths and visit the same locations over time. There is a thread
of continuity, similarity, and predictability that allows us to generalize from past
behaviors to future behaviors.
This thesis seeks to represent the patterns of moving objects with movement
signatures. Detecting a movement signature and defining its attributes is a significant
piece of information in modeling and reasoning about moving objects. One can see
where, when, and how strongly a movement pattern reoccurs. Describing and recognizing
such movement signatures contributes to knowledge building and knowledge reuse in the
modeling of moving objects. Signatures can be used to capture the temporal changes in

an object's movements (e.g., a summer versus winter pattern). They can be used for
comparative analysis of dominant patterns among different individual of the same class
of moving objects. And they can also help to identify significant behavioral differences
between different moving objects such as movement of a city bus versus movement of an
ambulance.
A movement signature is a summary of movement observations on an object over
some period of time (Beard and Palancioglu, 2000). We define a movement signature as a
significant, high-level structure present in the data. A movement signature condenses and
summarizes large amounts of observations in numeric, graphic, or linguistic formats. Any
movement that cannot be represented by a simple movement signature is defined as
random movement.
This thesis develops a model of signatures for moving objects that is learned from
observations and bounded by profile level information. Movement signatures are higher-
level abstractions of observations that capture dominant patterns of a moving object over
time. Assume a set of position observations belonging to an object as given in (3.2) and
illustrated in Figure 3.4:
A = { ( x l , ~ l ) , (x2,~2),......, ( ~ n , ~ n ) ) ( 3 4
This thesis defines a position as an x-y coordinate pair representing a point
observation of a moving object. On the other hand, a set of observed positions associated
with a specified fuzzy boundary is referred to as a location such as set of observed
positions representing the "city of Orono" as shown in Figure 3.9.

Our approach analyses and summarizes observations of moving objects to allow
learning of movement signatures such that future behaviors can be predicted. The
objective of the movement signature development is to arrive at these dominant
movement patterns of an individual for different spatial (i.e., city, downtown, shopping
mall) and temporal resolutions (i.e., day, week, month, and season). Movement signatures
may vary based on spatial and temporal resolution. The encoding of movement signatures
must include an adequate representation of the temporal dimension. Very fine spatial
scale nlovenlents such as regular visits to the neighborhood pizza shop may be lost in a
"home" signature without high-resolution spatial and temporal observations.
Large and relatively high frequency subsets of observations can begin to reveal
movement signatures such as an animal tracing a similar path at similar times of the day.
With large collections of unit observations, we can build summaries that describe
movement patterns in the collection such as whether the movements are systematic,
organized, regular, or periodic (Yuan, 1998). We identify two types of movement
signatures of objects broadly: spatial and spatio-temporal signatures. Within each of
these, we have also identified two further signature types location and path signatures as
explained in the following sections.
3.2.1 Describing Signatures
A pattern is approximate in the sense that its instances may occur several times
and they are usually similar but not identical. If you look at it another way, a movement
signature is not black and white; it is present in a graded way (described as a fuzzy
degree of truth by a number between 0 and 1) as will be shown in Chapters 4 and 5.

A movement signature can be qualitative in that it typically does not specify
actual numeric values such as x-y position coordinates, distances, directions, time
instants (or intervals) but deals with approximate (or abstract) linguistic values.
Linguistic descriptors like downtown, short distance, northeast, afternoon, about 3 hours
and so on replace numeric values.
In addition, a movement signature can be quantitative in that it typically does
specify moving objects' positions, directions, and distances along with the travel time
(duration) and periodicity of the movement using actual numeric values such as x-y
position coordinates, and time instants (or intervals) that are obtained fiom a set of
observations. A movement signature is derived fiom a combination of both qualitative
and quantitative observations that specify moving objects' positions, directions, and
distances along with the travel time (duration) using both actual numeric values that are
obtained from a set of observations or the approximate linguistic values that are obtained
from expert knowledge. A movement signature of an object may include both
quantitative and qualitative descriptions of a movement as shown in Table 3.1 (Schlieder
et al., 2001).
Table 3.1 : Quantitative and qualitative descriptions of movements.
Position (x, y) I Position (home) I
Quantitative description of a movement
Qualitative description of a movement
Orientation (63')
Distance (1 00 meters)
Orientation (northeast)
Distance (nearby)
Direction (87')
Duration (22 hours)
Direction (north)
Duration (day)

Position and orientation describe the outcome of movement, that is, the current
location of the moving object and the direction it is moving. The other parameters give
some information about the movement itself. Direction, distance, and duration of the
movement are measured with respect to the previous unit movement. A relational algebra
defined over {east, northeast, north, northwest, west, south, southwest, and southeast)
allows expressing qualitative directions, whereas a relational algebra defined over {near,
medium, far) describes qualitative description of a distance of the moving object from a
certain reference location.
In this thesis, a movement signature is defined using the following attributes:
Object ID: since it is associated with a particular object,
Signature ID: since there can be more than one per object,
Type: location signature or path signature,
Order: primary, secondary, tertiary, and so on which changes based on the
application and user requirements,
Time descriptor (nurneric-12.15 pm or linguistic-noon).
Remaining attributes are assigned depending on the application type (i.e.,
modeling the movements of couriers) and how a signature is derived (i.e., fuzzy c-
means).
3.2.2 Approaches to Extract and Represent Movement Signatures
General or meaningful movement patterns of objects can be extracted by
analyzing a set of movement observations. Detection of movement signatures of objects
requires analysis of long-sequences of movement observations on an object. Frequently
occurring patterns in the movement data can be summarized to identify repeated

movements (i.e., movements to and from work). Certain movements appear to have
specific signatures based on spatial and temporal range, speed and other movement
properties. These may be revealed through analysis of the observation data. This thesis
proposes two different approaches to summarize observation data sets to extract
movement signatures of objects.
The first approach described in detail in Chapter 4 proposes the use of clustering
algorithms to summarize observation data sets in extracting spatial location signatures of
an object. It assumes that if a spatial location signature is a group of data sharing similar
values then data mining approaches such as clustering algorithms are generally well
equipped to detect them. This approach proposes extracting spatial location signatures of
an object from a set of position observations with no time information given. The
approach uses clustering of position observations on an object. In order to carry out the
proposed approach for obtaining spatial location signatures of objects, Fuzzy c-means
(section 2.8.2) method is employed. By clustering the observed positions of a moving
object, a set of fuzzy locations frequently visited by the object is identified. Each fuzzy
location consists of a set of positions and their degree of memberships to the location. As
an example, the fuzzy c-means clustering method was employed for the position
observations given in Figure 3.4 and four fuzzy clusters were identified as shown in
Figure 3.5. These four fuzzy clusters (fuzzy locations) on a movement surface are used
for defining spatial location signatures of an object. Using this approach in Chapter 4,
spatial location signatures are represented with fuzzy clusters (Table 4.2, Figure 4.4) and
their corresponding fuzzy membership functions (Figure 4.6, Figure 4.7).

Figure 3.5: Fuzzy c-means clustering of the position observations.
The second approach described in detail in Chapter 5 is proposed to summarize
large observation data sets in order to obtain spatio-temporal movement signatures of an
object. Two additional movement parameters namely number of visits ( zi ) and the time
of the visits (ti ) to each fuzzy location are provided and used in the computation process
of obtaining spatio-temporal movement signatures of an object. In this approach,
movement surfaces are used to establish the locations that an individual moving object
has visited over a time interval. These locations may be obvious through expert
knowledge and visualization of the data but must be automated to offer real benefit.
Using this approach, spatio-temporal movement signatures are defined as matrices and
represented as surfaces (Figure 5.3) or volumes (Figure 5.9).
The approaches proposed in this thesis for the development of movement
signatures of objects can be distinguished primarily as:
Quantitative Approaches (Signatures obtained using specifically fuzzy (i.e., fuzzy
c-means) and neuro fuzzy methods (i.e., Anfis)).
Qualitative Approaches (Signatures obtained using specifically fUzzy membership
functions and rules).

3.2.3 Types of Signatures
As indicated, two types of movement signatures of objects are identified broadly:
Spatial signature: the signature that has no time information related to the
movement behavior of the object that it is assigned to.
Spatio-temporal signature: the signature that has both space and time infornlation
related to the movement behavior of the object that it is assigned to.
Within each of these, two hrther signatures are also identified:
Location Signature: a location that a moving object frequently or typically visits
such as home, work, and shopping location.
Path Signature: a path that an object usually moves on specifically the connected
set of location signatures such as the path to work or the path of a city bus.
By summarizing movement observations of an object, we can describe the
locations they usually visit, the paths they usually move in, and potentially the general
time frames in which these general movement patterns occur. As an example, the
identified four locations shown in Figure 3.6 are referred to as the location signatures and
the paths that connect these four locations to each other are referred to as the path
signatures of the moving object.
A /A Primary bca tbn
0 Secondary bcation
- Primary path
---- Secondary path
Figure 3.6: Movement signatures.

3.2.4 A Fuzzy Logic Approach to Represent Movement Signatures
Reasoning in geographic space typically deals with incomplete and imprecise
information, but people can frequently draw sufficiently precise conclusions based on
common sense. A number of cognitive studies provide evidence that people may employ
hierarchi6ally organized schemes to reason in geographic space and to compensate for
missing information (Egenhofer and Mark, 1995; Hirtle and Jonides , 1985; McNamara et
al., 1989). Therefore, it is very important to find out how people conceive and describe
movements of objects.
Many parameters and variables in movement modeling are characterized by
uncertainty, subjectivity, and imprecision. Human experts are usually able to provide
certain linguistic information about movements of objects. However, they are usually not
able to give their knowledge, experience, and intuition in terms of linguistic information
alone. Linguistic information is supplemented by certain numerical information obtained
fiom measurements, observation, or statistical analysis of movements of an object. Both
numerical and linguistic information in the design process of fuzzy membership functions
related to the movement signatures of objects is considered in this thesis.
Fuzzy sets are used to associate quantitative information with qualitative
information. A linguistic location (i.e, Orono) can be defined by the coordinates of its
minimum bounding rectangle MBR = {(x,, y,), (x,, y,)) . For example, a set of positions
be associated with the linguistic value "Orono".

Figure 3.7: MBR of linguistic location "Orono".
The linguistic location "Orono" can be represented with associated fuzzy
membership functions that bound its MBR as shown in Figure 3.8.
Fuzzy set X Fuzzy set Y
. . . . . . . . . . . . . . . .
Figure 3.8: X and Y fuzzy membership functions of MBR of Orono.
In addition, any position that is within this MBR is represented with an associated
value of degree of membership to the fuzzy set. Therefore the set of positions
(equation (3.3)) such that each coordinate pair represents a position in "Orono" with an
associated fuzzy value as shown in Figure 3.9. For example, position E is represented
with an associated fuzzy membership value of E = 0.8 within the fuzzy set "Orono". The
fuzzy set "Orono" that represents a set of positions is referred to as the "fuzzy location"
and represented with the fuzzy set porno as given in equation (3.3).

Figure 3.9: Fuzzy set "Orono".
...... Similarly, a connected set of locations A={4(x,,Y,,1,),L2(x2,y,,12)
visited by a moving object over time is referred to as a "path" of the moving object
(Beard and Palancioglu, 2000; Dorst et al., 1991; Jan et al., 2000). As we demonstrated
above, each of these visited locations can be represented with an associated fuzzy
location (i.e., pBos, and pornno ). Therefore, we can say a path connects a set of fuzzy
locations to each other. Such a path taken by the moving object over time is referred to as
the fuzzy path, and associated with an appropriate fuzzy value such as "1-95" or
"Boston-Orono". A fuzzy path can be represented with a set of fuzzy locations as given
in equation (3.4).
P W 1 h = &L, 9 P& ,.-... 9 PL,, } (3-4)
For example, the fuzzy path that connects Boston, MA to Orono, ME can be
represented as a collection of fuzzy locations as given in equation (3.5).
~ ~ o s t o n - o m n o - - G B o s , 9 P P O ~ I O ~ ~ 9 P ~ a t e r v ~ / / e ....... ~ o r n n o I (3-5)

Figure 3.10: Fuzzy path "Boston to Orono".
By clustering the observed positions of a moving object, a set of fuzzy locations
frequently visited by the object can be identified. This set of fuzzy locations is referred to
as the location signature of the moving object. Each obtained cluster is composed of the
observed positions of a moving object and represents a hzzy location. Cluster centers for
each fuzzy location are represented with a degree of membership of 1.00 to its
corresponding cluster. For each position in a cluster, a membership degree (fuzzy value)
to this cluster is assigned (i.e., for the position (x,, y, ) the fuzzy value = 0.9 is assigned
for cluster # 1). For example, a position (x,, y,) that is in the downtown Bangor has a
degree of membership of 0.95 to the fuzzy set Bangor whereas a position (x,, y,) that is
in the Bangor Mall has a degree of membership of 0.65.
Similarly, a set of fuzzy paths used frequently by a moving object over time and
connecting a set of fuzzy locations to each other is defined as a path signature of the
moving object.

This thesis compares locations and paths visited and taken respectively by a
moving object over time primarily based on number of visits (2,) to each location or path
by a moving object. Number of visits to locations or paths by a moving object is
important information in extracting movement signatures of the object. The total number
of visits to each location or path over time is the basic parameter that influences the
strength of the hierarchy in determining the dominant locations and paths used by a
moving object.
Location and path signatures can be represented in a hieratical order as shown in
Figure 3.6 based on how frequently locations and paths are visited by a moving object as
shown in Figure 3.1 1. Location signatures can be represented in a hieratical order that
includes primary locations: locations a moving object visits most frequently (i.e., home
and work locations), secondary locations: locations a moving object visits less frequently
(i.e., shopping locations), and so on. Similarly, path signatures can also be represented in
a hieratical order that includes primary paths: connections between primary locations
(i.e., a path between home and work), secondary paths: connections between secondary
locations or primarylsecondary locations (i.e., shopping paths).
A fuzzy reasoning algorithm that uses membership functions of number of visits
and order index was developed in Chapter 5 to determine a hierarchical structure for the
signature embedded in the spatio-temporal signature definition matrix of an object. Using
the fuzzy reasoning algorithm, all zi values corresponding to each location in the
signature definition matrix are characterized by a corresponding order index value, which
varies from 0 to 1 (see section 5.3.3).

Figure 3.1 1 : Visit frequency of a path connecting location 3 to 2.

Chapter 4
APPROACHES TO EXTRACT SPATIAL LOCATION SIGNATURES
BY CLUSTER ANALYSIS
Larger and larger volumes of raw position observations are being collected and
methods are needed to manage and analyze these in ternls of movement patterns. There
are currently few geographical analysis methods capable of exploring large databases for
detecting and summarizing movement patterns. As a result many important datasets are
not being analyzed to the fullest extent. For example, data about movements of animals,
city buses, and criminals are collected and analyzed, if indeed at all, using inadequate
methods and this implies need for data mining techniques.
This chapter describes approaches for deriving spatial location signatures for an
object. The objective is to capture the locations that are frequently visited by a moving
object using a set of observations. A set of movement observations, which consists of a
set of positions (x , ,y , ) , is analyzed to derive spatial location signatures. In this chapter,
temporal information related to the observations is ignored.
In the analysis of the observations, a data mining method to find clusters and
patterns in observations is employed. Classification of movement observations into
signatures can be handled by using clustering methods. In this thesis, fuzzy c-means
clustering (FCM) is used to derive the spatial location signatures of objects fiom
movement observations. From the results of FCM, a set of locations and their
corresponding fuzzy membership functions are obtained to represent spatial location
signatures of objects.
7 8

4.1 The Proposed Method
The proposed method to derive spatial location signatures of an object is
structured as shown in Figure 4.1. More detail on the method is provided through out the
remainder of the chapter.
Figure 4.1 : Approaches to extract spatial location signatures.
Experimental data set (K Y)
Obtain f u y rules
4.2 Experimental Data Set
Delaunay triangulation and simplification
Define the limits of the movement
A synthetic data set is used as the observation data set in the extraction of spatial
location signatures for a moving object 8. The observation data set consists of a set of
approximately 2000 positions ( x i , y, ) as shown in Table 4.1. Figure 4.2 illustrates the
study area and the set of synthetic position observations used in this study.
4-
Table 4.1 : The Observation Data Set.
' Obtain clusters using Fuzzy omeans dustering
Obtain fuzzy zones and Voronoi decision borders
Observation ID
&
X
Obtain fuzzy membership functions for each duster
(location signatures)
Y
t-

Figure 4.2: The study area and observed positions.
Figure 4.2 demonstrates that observed positions ' are spread over a wider
geographic area than the data that belong to certain paths such as highways linking two
different locations to each other. Each location can be represented with its boundary such
as MBR= {(Xmin, Ymin) and (X,,, Y,)) and an identifling label such as Bangor. In
other words, a location is an area that has a boundary (i.e., its cluster boundary or MBR)
and may or may not contain a set of positions.
In order to define the limits of the observed movements of an object in the study
area a Delaunay triangulation is constructed. The Delaunay triangulation network
consisted of 2575 triangles and was simplified to 2246 triangles as shown in Figure 4.3.
The Delaunay triangulation network and corresponding Voronoi polygons are used in the
clustering and classification of movement data as explained in the following sections.

Figure 4.3: Original and simplified Delaunay network.
4 3 The Approach: FCM Clustering to Obtain Movement Signatures
This approach assumes that if a movement signature is a group of data sharing
similar values related to locations and paths of a moving object then a clustering
algorithm can detect them. In other words, classification of movement observations into
signatures can be handled by using a clustering method. In order to carry out our
proposed approach for obtaining movement signatures of objects, the Fuzzy c-means
clustering method is employed. Please refer to section 2.7.2 of this thesis for detailed
information about the method. Using this approach, movement signatures are represented
with fuzzy clusters and their corresponding fuzzy membership functions.
By clustering the observed positions of a moving object, a set of fuzzy locations
frequently visited by the object can be identified. This set of fuzzy locations is referred to
as the spatial location signature of the moving object. Here, the observation data in the
study area are clustered to 10 clusters using fuzzy c-means algorithm. The corresponding
cluster centers (Table 4.2) and clusters (Figure 4.4) are obtained.

Table 4.2: Fuzzy cluster center coordinates.
Figure 4.4: Fuzzy c-means classifier results of simulated data.
Iterations
Figure 4.5: Number of iterations to be carried out during the fuzzy c-mean clustering.
82

In the FCM clustering process, the maximum number of iterations to be carried
out is taken as 100 iterations. However, the distances between the clusters met the
threshold after 6 1 iterations (Figure 4.5).
Another parameter whose value needs to be determined in fuzzy clustering is the
weighting exponent m . The weighting exponent controls the extent of membership
sharing between fuzzy clusters in the data set. In this study, the value of the weighting
exponent was m=2. For the computation procedure of the FCM clustering method please
refer to (Emami et al., 1996).
This thesis defines a fuzzy location as a location in which a degree of
membership (fuzzy value) for each position within the location has been computed and
assigned. The obtained 10 clusters are therefore referred to as fuzzy locations visited by
the moving object 8. The obtained 10 fuzzy locations and their degree of menlbership
values along with their center coordinates are given in Table 4.3. As can be seen from
Table 4.3, each cluster is composed of a number of positions visited by a moving object.
As we mentioned before, each location is represented with its fuzzy boundary. In
this case fuzzy cluster boundaries are used as the boundary of each cluster (location) and
their corresponding cluster numbers are assigned an identifying label such as cluster # 10
(the city of Kayseri). The center of a location can be represented with either its fuzzy
cluster center coordinates as shown in Table 4.2 or its MBR center coordinates given in
Table 4.4 as explained in section (3.2.4) of this thesis.

Table 4.3: Fuzzy Clusters and their MF values.

Table 4.4: MBR of the clustered locations.
Location IDS
1
2
3
4
The cluster centers for each fuzzy location are represented with a degree of
membership of 1.00. And for each position in a cluster, a membership degree (fuzzy
value) to the cluster is assigned as given in Table 4.3. For example, the position # 1345
with the coordinates ~ , ~ ~ ~ = 2 4 3 . 2 9 7 6 and ~ , ~ ~ ~ = 1 7 3 . 3 2 8 3 is assigned to cluster # 1 and
assigned label "city of Kayseri" with the fuzzy membership value of p,,,, = 0.93.
5
6
7
8
9
10
Using fuzzy c-means clustering method over the observation data, spatial location
signatures are represented with fuzzy clusters (Figure 4.4, Table 4.3) and their
corresponding fuzzy membership functions. The corresponding membership functions of
each fuzzy cluster, which are also the spatial location signatures, are computed (Table
4.3) and illustrated in Figure 4.6i-j. The membership function for the cluster and the
location # 10 is illustrated in Figure 4.7a. Similarly, the membership functions for all the
clusters and locations are transparently illustrated in Figure 4.7b.
85
Location Labels
Urgup
Kodul dagi
Yesilhisar
Incesu
Derinkuyu
Golucuk
Nevsehir
Nigde
Konakli
Kayseri
Xmin
130
180
160
185
95
110
80
80
110
235
Ymin
200
255
275
215
Xmax
140
190
185
205
270
295
215
375
345
180
115
115
110
90
120
270

(a) MF of the lSt fuzzy cluster (b) MF of the 2nd fuzzy cluster
(c) MF of the 3rd fuzzy cluster (d)MF of the 4' f k zy cluster
(e) MF of the 5h fuzzy cluster ( f ) MF of the 6' fuzzy cluster
Figure 4.6: MF of each fuzzy cluster based on the Delaunay triangle borders.

(g) MF of the 7" fuzzy cluster (h) MF of the 8" fuzzy cluster
n n
(i) MF of the 9" fuzzy cluster (j) MF of the 10" fuzzy cluster
Figure 4.6: Continued.
Figure 4.7: (a) MF for the cluster and the location number 10 (b) Transparently illustrated
MF hills for all the clusters and locations (spatial location signatures for each location).
87

Figure 4.8: The top view of MFs hills for all the clusters and locations.
In addition, the top view of MFs hills for all the clusters and locations is shown in
Figure 4.8. In Figure 4.9, the fuzzy zones of each cluster are obtained by imposing the
MF values given in Figure 4.6. The fuzzy zones are computed according to the distance
coordinate values of FCM clusters. The evaluation of the membership bc t ion values
needs to be done jointly in the FCM. Therefore, all the membership functions given in
Figure 4.6 are evaluated jointly and the fuzzy cluster zones are computed via FCM as
illustrated in Figure 4.9.
For each cluster, a Voronoi polygon is computed and named as the decision zone
for the corresponding cluster. A decision zone defines the bounds of each location such
as borders of a city. The decision zones shown in Figure 4.10 are generated if the
observation data are classified to 10 clusters using the cluster center coordinates of the
fuzzy c-means clusters. These zones provide the ability to make decisions about locations
in which the moving object is present based on fuzzy rules.

5Q l m 1 ~ 2 a l 2 5 o m 3 5 0 4 # 3
Figure 4.9: Fuzzy cluster zones.
50 100 150 200 250 300 350 400
Figure 4.10: Voronoi decision zones of locations.

The truth-value of a fuzzy rule created by the structure given in equations (4.1)
and (4.2) can be assessed using the decision zones based on x and y coordinate
parameters. The obtained results can be used in computing the weight of the fuzzy rule.
Fuzzy Rule # 1 "If the object B is observed in a xi - yi position, then the object B is in
the ith decision zone (location signature rule)." (4- 1)
Fuzzy Rule #2 "If the object B is observed on the path defined with a set of xi and yi
positions, then the object B is in the decision zone defined with the largest membership
value of the ,up,, which is given in equation (4.3) (path signature rule)." (4-2)
The truth-value of a fuzzy rule created by the structure given below can be
assessed using the decision zones based on x-y parameters and obtained results can be
used in computing the weight of the fuzzy rule. Therefore, decision zones can be used in
analyzing the truth-values of fuzzy rules and in computing the weights of these rules.
And the fuzzy rules can be examined for path and location signatures. If a path goes
through more than one decision zone, lengths of each path section in each zone can be
used in computing the weight of the fuzzy rule. As an example, if the path signature
structure is defined using the membership function, ,upathi, for the object B that is
moving from location A to location B, the equations (4.3) and (4.4) can be given.
p = s , + S , + ...... +St, (4-4)
where n is the number of decision zones, S is the sum of path length, and S, is
the length of the path inside the ith decision zone.
90

Chapter 5
APPROACHES TO EXTRACT SPATIO-TEMPORAL MOVEMENT
SIGNATURES BY SUMMARIZATION
Moving objects have changing and repeating patterns due to their movement in
space over time (Mountain and Raper, 2001b; Schlieder et al., 2001). A set of
observations on a moving object can be used to derive the movement patterns of an
object by summarizing frequently visited locations and frequently used paths over time
by the object. These space and time dependent movement patterns of an object are
referred to as spatio-temporal movement signatures in this thesis. There is a need to
understand and identify the spatio-temporal movement signatures of a moving object.
Analysis of the spatio-temporal movement signatures of an object can help improve
modeling, querying, and reasoning capabilities of the movements of the object. A spatio-
temporal movement signature should characterize the predominant patterns with respect
to time of a moving object such that it can be distinguished from other moving objects.
Chapter 4 developed an approach to derive spatial location signatures of an object
from a set of position observations with out consideration of the time information. The
fuzzy c-means clustering was applied to the observations. By clustering the observed
positions of a moving object, a set of fuzzy locations frequently visited by the object was
identified. Each fuzzy location consists of a set of positions and their degree of
memberships to the location.
This chapter describes an approach to extract spatio-temporal movement
signatures of the moving object such as frequently visited locations (i.e., Boston, home,
91
and downtown) and frequently used paths (i.e., roads, railways, and lakes) over time by
the object using the fuzzy locations obtained as explained in Chapter 4. Two additional
movement parameters namely number of visits ( z l i ) and the time of the visits (ti) to
each fuzzy location are provided and used in the computation process of obtaining spatio-
temporal movement signatures of an object. The number of visits per time interval (i.e., a
month) can be obtained explicitly by computing the number of positions in each fuzzy
location such as 36 positions in the fuzzy location "Kayseri" refers to the 36 visits to the
location "Kayseri" (see Chapter 4).
In the proposed approach, spatio-temporal movement signatures of the object are
treated as a surface, as a volume, or as a fuzzy membership function. A series of methods
including conventional, fuzzy, and neuro-fuzzy methods to generate movement surfaces,
volumes, and fuzzy membership functions from spatio-temporal movement observations
to extract spatio-temporal movement signatures of an object are developed.
5.1 The Proposed Method
The proposed method of this chapter to define movement signatures of an object
is structured as shown in Figure 5.1. More detail related to the methodology is provided
through out the remainder of the chapter.

(') movement parameters Obtain observation data x,,, y, : coordinates of the location of an object
(x, Y. tIi ti: time at which an object occupies a location and build the database 1 zi: number of visits to a location by an object
i v: total number of visits to a location by an object 1
movement surface or Delaunay triangulation volume
Process observation data to obtain data used to model
movements (x,, y,, z,, ti, v ,..... )'
Specify time interval of interest and assign position observations
Space-time Surface Generation
r--,
Interpolate data to obtain - Anfis Interpolant movement surface and +-b
volume I
4
Fuzzy m e a n s clustering to obtain
spatial location signatures
Space-time
Create movement signature definition matrix
(movement signatures)
- Isodata Clustering - Fuzzy Gmeans
Obtain fuzzy membership functions and signatures
Classification
Obtain fuzzy rules by interpreting movement signatures
Make queries r-+-l
4
--,
Jolurne Generation and Analysis
- FUZZY - Statistical
Figure 5.1 : The proposed approach to extract spatio-temporal movement signatures.
93

5.2 Experimental Data Set
The approach to movement behavior modeling of a moving object starts with
obtaining movement observations and related movement parameters (Figure 5.1). To
illustrate the theoretical approach to obtaining spatio-temporal signatures of moving
objects, we use an experimental data set that consists of a set of observation data
representing positions collected on an object that visited 10 different locations (assigned
using methods of Chapter 4). The number of visits (zg ) by the object to each location
(i.e., city of Kayseri or cluster # 10) is determined through out the t time domain as shown
in Table 5.1. For this example, observations are organized according to 12 different time
intervals t i in this case corresponding to months.
Table 5.1: Observation data organized by number of visits per month to 10 different
fuzzy locations.
Monthly Observations (zti ; i =1,2,3,..,12)
Total number of visits I
Total number
l2 of visits

The set of locations (Table 5.1) used in this experimental study in the computation
of spatio-temporal location and path signatures forms a surface D(x,y,z)q , which is the
movement surface, as shown in Figure 5.2a. The limits (x, y) of the movement surface
D ( x , ~ , z ) t , in which computations are made is bound by the extent of the observation
values.
Figure 5.2: (a) The location signatures (fuzzy locations) and (b) The Delaunay triangles
connecting the signature locations to each other.
If we assume a uniform space-time surface or volume and no constraints on an
object's movements, a set of observed positions can be used to compute an object's
probable path between observations or a position at any unmeasured space-time
coordinate. As noted in the model hnework of the proposed approach (Figure 3.1),
movement signatures of objects can be represented using surfaces, volumes,
mathematical expressions, and fizzy membership functions and rules.
Before smarization of the movement data, we can gain an understanding of the
movement data using visualization. Visualization is a useful tool for providing insight
into geographic data sets (i.e., movements of objects) and can be used to explore the
movement observations of an object over time and space. Volumetric visualization
95

techniques can be used in the analysis of movement behaviors of the objects. The
perception of changes in the observed movement parameters is facilitated with a data
visualization approach. Visualization supports the extraction of meaningful features from
large data sets by summarizing the data points into meaningful groups and exposing
regions of interest by data reduction and compaction.
Delaunay triangulation is commonly used for generation of surfaces from
scattered points (Chiyokura, 1986). The Delaunay triangulation is used to create a
structure for the interpolation of movement observations at unobserved locations on the
movement surface as shown in Figure 5.2b.
5.3 Spatio-temporal Location Signatures
The spatio-temporal location signatures of an object are computed based on the
number of visits to identified locations throughout the t domain and represented with a
%?Y 4fi surface or a v(x,y,z)ti volume. To compute spatio-temporal location signatures
of an object 8 moving on a D(x,y,z)ti surface or in a V(x,y,z)ti volume the following
steps are addressed.
Classification of the D(x,y,z)ti surface based on number of visits to each location
by a moving object 8.
Finding the probable location of a moving object 8 on a D(x,y,z)tj surface or in a
vx,v.zti volume at any ti time interval, in this case at the resolution of months,
using a neuro-fuzzy method.
5.3.1 Movement Surface Generation
Surface generation techniques (Barnhill, 1983; Farin, 1990) employ a variety of
estimatiodinterpolation methods (Chiyokura, 1986), which may be classified according
to the type of data used, the form of the 'interpolant' or fitting function, and the form of
the average weighting used (Franke and Nielson, 1990; Okade et al., 1992). There are
various approaches developed for surface description using scattered data sets (Barnhill,
1983; Farin, 1990; Franke, 1982). In this thesis, the visited locations are used to develop
D ( x , ~ , z h , surfaces for the 12 month-intervals as shown in Figure 5.3.
The development of the spatio-temporal signatures considers changes in the
behaviors of an object 8 over time (at different levels of temporal resolution). From a set
of observations we know that the object 8 has visited a set of fuzzy locations. The
number of visits (zti ) to each fuzzy location by the object 8 forms the basis for
determining the expected number of visits to an unknown location for the object 8 by
interpolating the observed zt, .
Because movement data cannot be obtained continuously, one needs to interpolate
the observation data that are obtained in discrete form. When dealing with sets of
observed positions, one can apply interpolation between observations to estimate the
movement. This thesis uses two different interpolation methods, namely Cubic and Anfis
interpolant, for estimating movement surfaces and volumes based on the observation
data.
The primary concern of this thesis in choosing an interpolation method was
construction of valid surfaces. The Cubic interpolant is a triangular interpolant that uses
the piecewise cubic Hermite interpolation to interpolate positions, normals, and surface
97

curvature at the vertices of a triangle. Extensive literature regarding how the cubic
interpolant can be used to approximate known functions, including algebraic surfaces and
offset surfaces is available (Crain, 1970; Elvins, 1992; Gallagher, 1995).
Interpolation plays a central role in both fuzzy logic and neural network theory.
Interpolation and learning from examples involve the construction of a model of a system
from a collection of input-output pairs. In a fuzzy logic system, we assume the input-
output pairs have the structure of fuzzy if-then rules that relate fuzzy variables whose
values are fuzzy sets instead of numbers. Fuzzy variables facilitate interpolation by
allowing an approximate match between the input and the antecedents of the rules.
Generally, fuzzy systems work well when we can use experience. When we cannot do
this, we use neural-fuzzy modeling to generate the rules (Kosko, 1992).
Anfis (Jang, 1993; Jang et al., 1996), a neuro-fuzzy modeling method, is also
employed in the interpolation of movement data on the movement surface. Anfis, which
uses fuzzy membership functions, provides a flexible structure in the interpolation
process. Anfis has the advantage of learning capability. It is also a suitable method for
interpolation of scattered data. Due to its hybrid structure, Anfis generates continuous
movement surfaces by interpolating the number of visits (zti ). In the training of the
Anfis structure, fuzzy locations and z,. values to corresponding locations are used as the
input and output parameters of the Anfis respectively. For each Delaunay triangle an
Anfis structure is designed using the coordinate parameters of that triangle. In the
computation of the z,, value at any location within a Delaunay triangle on the D(,,y,i),i
surface, the trained Anfis structures serves as an interpolant. The results are then
compared with the results of the traditional cubic interpolation.
9 8

Analysis of changes of visits to the locations on the D(x,y,zbi surface based on
time are required to obtain the spatio-temporal movement signatures of the object 6.
~ ~ e s e D(X,~,Z)~; surfaces are computed using the Anfis and Cubic interpolation methods
as can be seen in Figure 5.3. Observations are taken for 12 different time intervals in this
case corresponding to months.
For each time interval, a D(x,y,z)tj surface is constructed and the shape of the
D(x,~,z)ti surface changes based on the corresponding number of visits (z,.) to each
location. The computed D(x,y,r),i surfaces represent movement behavior of the object 6
through out the ti time intervals. Therefore, each of these surfaces is referred to as the
"spatio-temporal movement surface" of the object 6 for the corresponding ti time
interval.
Number of visits to a fuzzy location is important information in extracting the
spatio-temporal signatures of moving objects. The number of visits to each hzzy location
is not known with precision, it is based on fuzzy membership assignment of number of
visits to hzzy locations. The total number of visits to each location or path over time
influences the strength of hierarchy in determining the spatio-temporal location and path
signatures of a moving object. A d ~ s supports queries on the interpolated movement
surfaces to obtain specific spatio-temporal movement signatures of objects. The Figure
5.4, Figure 5.5, and Figure 5.6 show the computed spatio-temporal location signatures of
the moving object for the year where z,; (number of visits) is zt, 4 0 0 , 1 O R z,, ~ 3 0 0 ,
and zti >300 respectively.

1" t interval
2"' t interval
31d t interval
Figure 5.3: Changes in the density of number of visits for each ti computed using
(a) Anfis interpolant (b) Cubic interpolant.
100

Figure 5.3 : Continued.

7' t interval
8fh t interval
Figure 5.3: Continued.

10' t interval
1 1' t interval
12' t interval
Figure 5.3: Continued.

Yearly number of risils [Response of Anfis Mefpolmt UlW) Yearlv number ofwsits (ResDonse dCubic Yernolant Ulm)
Figure 5.4: Spatio-temporal location signatures of the moving object where zti<lOO.
Yearly number ofwsits [Response r f M s Irhrpolard 101-300 i m ? . . . . a o L r
Yearly lumber of*sis (Rasponsa dOubic Mnrpolanl 101-XI i m p , . . . a ,
Figure 5.5: Spatio-temporal location signatures of the moving object where 101< ~ ~ $ 3 0 0 .
Yemiy number ofwsils (Response of Cubic Yerpolenl >m) im
90 4iu
m
m un
8D 380
a
Y] 360
30 340
a0 310
10
10 iu a m ' a @I m m 90 la,
Figure 5.6: Spatio-temporal location signatures of the moving object where 2,2300.
104

5.3.2 Movement Volume Generation and Analysis
Spatio-temporal location signatures in the form of movement surfaces as
described above indicate locations where a moving object might be at a specific time
point or interval. Volunles can be created and volumetric data analysis can be carried out
by assembling n such surfaces for n t-intervals. In this study, the number of t-intervals (n)
is chosen as n=12 corresponding to months, and V volumes are defined using these n
surfaces. In this case, the object 6 is described as moving in the volume V . The volume
V can be computed by the t (time), x and y (location) coordinates.
Volumetric visualization offers various advantages for data analysis such as
increased understanding of complex data and easier analysis. In many of the volumetric
visualization applications, iso-surfaces are computed and used for visualization purposes.
It is possible to understand and interpret the specified structure in a V volume using an
isovalue, represented as an iso-surface. An iso-surface is the surface that passes through
all points in the volume where the scalar value is equal to a specified isovalue. An iso-
surface shows a 3-D volume bounded by a particular isovalue. The iso-surface has the
specified iso-level, the remainder of volume contains values greater (or less) than the
isovalue. Iso-surface extraction is one of the most commonly used methods for the
visualization of scalar-valued volume data.
In this thesis, the iso-surfaces computed based on the observation data represent
various spatio-temporal movement signatures. For example; Figure 5.7, Figure 5.8, and
Figure 5.9 illustrate three different spatio-temporal signatures corresponding to monthly
movement behavior of the object.

A 2D or 3D matrix forms the basis of a surface or a volume respectively, and
these are referred to as signature definition matrices. To support interpretation of these
signature definition matrices, scientific visualization methods are used to isolate and
highlight various isovalues and iso-surfaces. For example, isovalue = 60-70 gives us the
most visited locations for any time in a year by the moving object 8. Such an extracted
iso-surface is considered a specific instance of a "spatio-temporal location signature" of
the object 8. In our experimental study, we have used iso-surface algorithms described in
(Mathworks, 1995).
Figure 5.7, Figure 5.8, and Figure 5.9 illustrate various iso-surfaces using various
iso-values and D(x,Y,z)ti surfaces. In Figure 5.7a-b, Figure 5.8a-b, and Figure 5.9a, the
extracted regions illustrate the spatio-temporal location signatures for a maximum of 5
10, and 70 visits in a year respectively.
Results from the computed V volumes can be used in the analysis of movement
behavior of the object 8 moving on the D(x,Y,z)s surface through out the t domain.
These movement behaviors in the form of specific iso-surfaces belonging to the object 8
illustrate spatio-temporal location signatures of the object.


In this thesis, Anfis and Cubic interpolant are utilized in the computations of the
spatio-temporal location signatures described above. The steps listed in equation (5.2) are
followed to compute the v volumes using the Anfis interpolant.
1. Define the Delaunay triangles using the computedfizzy locations, 1 2. Compute an Anfis for each Delaunay triangle,
3. Create a mesh-grid through out the x andy axises,
4. For each Delaunay triangle define a trained Anfis, I 5. For each mesh gridpoint within a triangle interpolate zti values using the
defined Anfis,
6. Choose an isovalue for volumetric visualization,
7. Compute the iso-surface value.
In order to compare the results obtained from Anfis interpolant, the cubic
interpolant is employed similarly as outlined in equation (5.3) to compute the v volumes.
1. Define the Delaunay triangles using the computed fuzzy locations,
2. Compute cubic interpolant parameters for each corresponding Delaunay
triangle,
3. Create a mesh-grid through out the x andy axises,
4. Determine the Delaunay triangle containing a mesh-grid,
5. For each mesh grid point within a triangle interpolate zti values using
cubic interpolant.
6. Choose an isovalue for volumetric visualization,
7 . Compute the iso-surface value.

5.3.3 Designing a Fuzzy Reasoning Algorithm to Establish Hierarchies
A fuzzy reasoning algorithm was developed to determine a hierarchical order of
the signatures embedded in the spatio-temporal signature definition matrix. The fuzzy
reasoning algorithm that determines the hierarchical order consists of the following rules:
Rule I : If number of visits is NVH then order index is PO,
Rule 2: If number of visits is NVM then order index is SO,
Rule 3: If number of visits is NVL then order index is TO,
where NVL, NVM, and NVH denote fuzzy sets "number of visits low," "number
of visits medium," and "number of visits high," respectively, and PO, SO, and TO denote
fuzzy sets "primary order," "secondary order," and "tertiary order" respectively.
The membership functions of h z y sets NVL, NVM, and NVH for a year and for
a month are shown in Figure 5.10 and Figure 5.1 1 respectively. Figure 5.12 shows the
membership functions of fuzzy sets PO, SO, and TO.
Using the fuzzy reasoning algorithm, all zi values corresponding to each location
in the signature definition matrix are characterized by a corresponding order index value,
which varies fiom 0 to 1. For example, the order index values of 0.9,0.6, and 0.2 refer to
PO, SO, and TO locations respectively in the signature definition matrix where zi (see
Figure 5.10) is z,, >300 (Figure 5.6), 101< ztj <300 (Figure 5 .9 , and ztj <I00 (Figure
5.4) respectively. Similarly, the order index values of 0.85, 0.25, and 0.15 refer to PO,
SO, and TO locations respectively in the signature definition matrix where zq (see
Figure 5.1 1) is z,, =60-70 (Figure 5.9), z, =10 (Figure 5.8), and 2,; =5 (Figure 5.7)
respectively.

t NVL NVM NVH
0 50 100 150 200 250 300 350 Numberofvisits Yearly (zi)
Figure 5.10: The membership functions of fuzzy sets NVL, NVM, NVH for a year.
NVL NVM NVH
0 10 20 30 40 50 60 70 Number of Visits Monthly (zi)
Figure 5.1 1 : The membership functions of fuzzy sets NVL, NVM, NVH for a month.
0 0.5 1.0 Order
Figure 5.12: The membership functions of the fuzzy sets "PO," "SO," and "TO".
110

5.4 Generating Spatio-temporal Path Signatures
Other uses of the visualization tools are for analysis of changes in a specific path
with time based on the number of visits. Figure 5.13 shows a potential path p through
the signature definition matrix.
Ths II-%Q Path ....- ............---.-...
...... ...... ..---
......
a,
x h a i o n
Figure 5.13: Analysis of changes of visit in a chosen path based on time.
Predicted visits of the object 0 along a path p based on time are visualized in
Figure 5.14 and Figure 5.15 using the computed surfaces and volumes as described in
sections (5.3.1.) and (5.3.2.) respectively. The computed visits based on Anfis interpolant
are shown in Figure 5.14a and those based on Cubic interpolant are shown in Figure
The extract from the signature definition matrix for the path is a matrix that
includes all the parameters created in the volume V for the t time domain. In this case, the
resolution of the created path matrix will increase as the density of the coordinates
defining the path increases.

X Direction
(a)
Figure 5.14: Changes in the density of number of visits computed using (a) Anfis
interpolant (b) Cubic interpolant.
Figure 5.15: Number of visits in x direction and t domain (a) interpolant (b) Cubic
interpolant for path P.
5.4.1 Computing Spatio-temporal Path Signatures
Estimated number of visits are divided into five intuitive fuzzy classes using the
fuzzy linguistic terms "least", "less", "normal", "more", and "most". The method to
convert the number of visits of the object 8 on pathp during t domain to linguistic equals
using Isodata or Fuzzy c-means classifiers is given in the equation (5.4).

Using the steps of (5.4), cluster centers for the corresponding five classes and
their membership functions are c'omputed. In the process of assigning a member to any
class, the class with the highest membership function value or the class that has the
shortest Euclidian distance to the corresponding member is chosen. The five classes and
corresponding cluster centers for the numbers of visits are computed for Anfis interpolant
using Isodata classification as shown in Figure 5.16a and Table 5.2a respectively.
Similarly, the five classes and corresponding cluster centers for numbers of visits are
computed for the Anfis interpolant using Fuzzy c-means classification as shown in Figure
5.16b and Table 5.2b respectively. The corresponding membership functions for the five
classes are shown in Figure 5.17.
The five classes and corresponding cluster centers for numbers of visits are
computed for Cubic interpolant using Isodata classification as shown in Figure 5.18a and
Table 5.3a respectively. Similarly, the five classes and corresponding cluster centers for
numbers of visits are computed for Cubic interpolant using Fuzzy c-means classification
as shown in Figure 5.18b and Table 5.3b respectively. The corresponding membership
functions for each five classes are shown in Figure 5.1 9. One can make interpretations
based on the computed five classes related to the usage of the path during a year such as
the path is "least" traveled in the winter months and most traveled during the summer
months.
I . Extract the estimated visits on path p for time t.
2. Assign number of visits to 5 classes using Isodata or Fuzzy C-means.
3. Label these obtained classes.
(5-3)

Table 5.2: The computed cluster centers for Anfis interpolant using (a) Isodata (b) FCM.
Cluster Center
im
Y Direction X Direction
rm
Y Direction
Cluster Centers Anfis-FCM
66.80 1
most
more
normal
less
least
least
normal
more
less
most
Figure 5.16: The five classes and their linguistic equals for Anfis interpolant using
(a) Isodata (b) FCM.

(a) MF of fuzzy class "most"
X Direction
(c) MF of fuzzy class "more"
(b) MF of fuzzy class "less"
(d) MF of fuzzy class "normal"
(e) MF of fuzzy class "least"
Figure 5.17: The membership functions for each cluster for Anfis interpolant using FCM.

Table 5.3: The computed cluster centers for Cubic interpolant using (a) Isodata (b) FCM.
Cluster Center Numbers
1
2
3
4
1 t more
Cluster Centers Cubic-Isodata
8.7845
17.043
28.747
42.388
Cluster Center Numbers
1
2
3
4
I normal
Cluster Centers Cubic-FCM
70.704
27.068
55.941
40.423
Figure 5.18: The five classes and their linguistic equals for Cubic interpolant using
(a) Isodata (b) FCM.

(a) MF of fuzzy class "most"
(c) MF of fuzzy class "more"
(b) MF of f k z y class "less"
-. . . . . . . . X Diction
(d) MF of fizzy class "normal"
(e) MF of fbzzy class "least"
Figure 5.19: The membership functions for each cluster for Cubic interpolant using FCM.
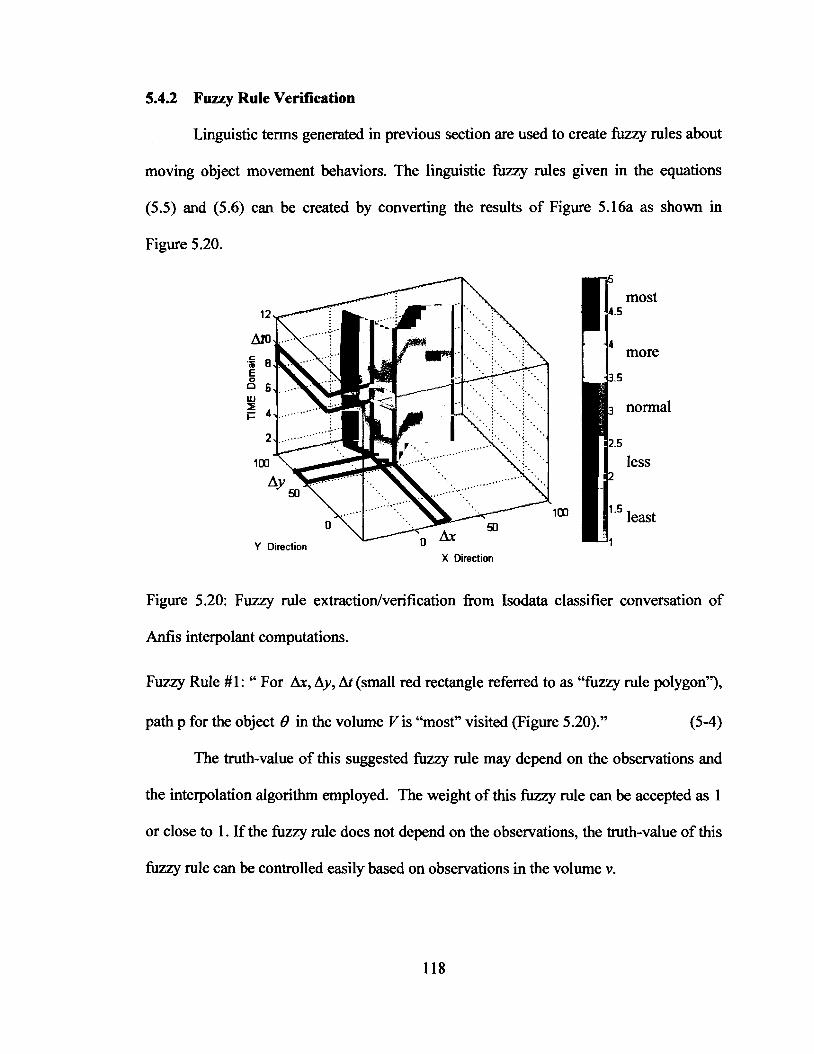
5.4.2 Fuzzy Rule Verification
Linguistic terms generated in previous section are used to create fuzzy rules about
moving object movement behaviors. The linguistic fUzzy rules given in the equations
(5.5) and (5.6) can be created by converting the results of Figure 5.16a as shown in
Figure 5.20.
Y Direction u
more f15 normal
5
less
X Direction
Figure 5.20: Fuzzy rule extraction/verification fiom Isodata classifier conversation of
Anfis interpolant computations.
Fuzzy Rule #1: " For Ax, Ay, At (small red rectangle referred to as " f k q rule polygon"),
path p for the object 8 in the volume V is "most" visited (Figure 5.20)." (5-4)
The truth-value of this suggested f izzy rule may depend on the observations and
the interpolation algorithm employed. The weight of this f izzy rule can be accepted as 1
or close to 1. If the fuzzy rule does not depend on the observations, the truth-value of this
fuzzy rule can be controlled easily based on observations in the volume v.

Fuzzy Rule #2:"For Ax, Ay, At (fuzzy rule polygon), path p for the object 6 in the
volume V is "least" visited (Figure 5.20)." (5-5)
The truth-value of this suggested fuzzy rule can be controlled easily based on
observations in the volume v. In this case, it is clear that the truth-value of this suggested
fuzzy rule is small. Therefore, the weight of this fuzzy rule can be expressed as 0 or close
to 0. In choosing the optimum weights, the suggested fuzzy rule polygon formed by
intersection of Ax, Ay and At can be compared with the fuzzy rule polygon (linguistic
class "most") computed based on observation data using the above-mentioned various
mathematical approaches of the volume V and its interpretations. The degree of the
agreement between fuzzy rule #1 and fuzzy rule obtained based on observation can be
compared as a fuzzy rule truth-value weight.

Chapter 6
CONCLUSIONS
This thesis concentrated on modeling movements of objects in spatial and spatio-
temporal extents through movement signatures. Spatial signatures, which include
dominant or frequently visited locations and paths, and spatio-temporal signatures, which
associate a temporal pattern with the spatial signatures, of a moving object were
identified and extracted from large volumes of data.
In this thesis, fuzzy and neuro-fbzq methodologies were implemented in the
extraction of movement signatures. The proposed methodologies are a step to incorporate
the similar modeling methodologies that are used by humans into information systems.
Identification of movement signatures and definition of their attributes provides summary
level information for modeling and reasoning about moving objects. This chapter,
summarizes the thesis (Section 6.1), describes results and major findings (Section 6.2),
and highlights future work made possible by this research (Section 6.3).
6.1 Summary of the Thesis
In this thesis, we introduced the use of fuzzy and neuro-fuzzy methodologies for
modeling movements of objects based on the properties and the patterns they exhibit in
the real world. We specified the basics for building fuzzy and neuro fuzzy models for the
representation of moving objects. General knowledge about patterns of moving objects
can be acquired by analyzing a set of movement observations. Because it is not possible
to store exact knowledge about the movement of objects and their environment, we .
proposed to use movement signatures of objects and the approximate knowledge related
120

to them to cope with related estimations such as the possible locations and approxin~ate
paths of a moving object. Methods to extract movement signatures from a set of
movement observations were developed. We also discussed certain aspects of the
implementation of the fuzzy and neuro-fuzzy models to obtain movement signatures.
Chapter 4 demonstrated an approach to derive spatial location signatures of an
object from a set of position observations with no time information given. The fuzzy c-
means clustering was employed over the observations. By clustering the observed
positions of a moving object, a set of fuzzy locations frequently visited by the object was
identified. The fuzzy membership functions related to the fuzzy locations were
developed. Each fuzzy location consists of a set of positions and their degree of
membership to the location.
Chapter 5 described an approach to extract spatio-temporal movement signatures
of the moving object using the fuzzy locations obtained as explained in Chapter 4. Two
additional movement parameters namely number of visits (z;) and the time of the visits
( t i ) to each fuzzy location are provided and used in the computation process of obtaining
spatio-temporal movement signatures of an object. Number of visits to a location is
important information in extracting spatio-temporal signatures of moving objects. The
total number of visits to each location or path over time is used as the basic parameter
that influences the strength of hierarchy in determining the spatio-temporal location and
path signatures of a moving object.
In the proposed approach, spatio-temporal movement signatures of the object are
extracted fiom surfaces or volumes described by a signature definition matrix. A series of
methods including conventional, fuzzy, and neuro-fuzzy methods were used to generate

signature definition matrices. Anfis interpolant the neuro-fuzzy method used to generate
signature definition matrices. Queries to these matrices are used to obtain the spatio-
temporal movement signatures of objects. The Figure 5.4, Figure 5.5, and Figure 5.6
show extracts of the spatio-temporal signature matrix of a moving object for the year
where zi (number of visits) is 2, <loo, 101< z, -GOO, and z, >3OO respectively. A Cubic
interpolation method was similarly applied to generate the spatio-temporal signature
definition matrix. The results indicate that the Anfis interpolant as an alternative
approach gives comparable results to the Cubic interpolant.
A fuzzy reasoning algorithm was developed to determine a hierarchical structure
for the signatures embedded in the spatio-temporal signature definition matrices. Using
the fuzzy reasoning algorithm, all z, values corresponding to the each location in the
signature definition matrix are characterized by a corresponding order index value, which
varies fiom 0 to 1 (see section 5.3.3).
6.2 Contributions
The major contributions of this thesis can be outlined as follows:
The concept of "movement signatures" is introduced.
The concept of "movement signatures" is introduced as a concept that can be used
in modeling moving objects. This new model makes more effective use of
movement observations, and imprecise and uncertain information related to
movements of objects in obtaining meaningful movement patterns. The proposed
methods to identify and fonnalize elements of movement signatures for individual
objects are the main contribution of this thesis.
An approach to define and extract movement signatures is demonstrated.
Movement patterns of an object are summarized in the form of movement
signatures in both spatially and temporally. Defining and extracting movement
signatures from a set of observations are demonstrated.
Fuzzy and neuro-fuzzy methods are implemented with success in extracting
movement signatures.
The implementation of fuzzy and neuro-fuzzy methods in modeling movements is
another major contribution of this thesis. The proposed methods support queries
regarding the movements of objects and provide higher-level structures for
subsequent analysis and reasoning about movements.
The hypothesis of this thesis was:
"A set of position observations on a moving object reveal high-level movement
patterns over space and time. "
The following findings of this thesis support the hypothesis:
Large numbers of unstructured observations were transformed by cluster analysis
to fuzzy locations that define location signatures.
Aggregated observations now associated with location signature were
summarized as number of visits providing the basis to establish hierarchical order
among location signatures.
Ordered location signatures could then be connected to identify path signatures
(higher-level concept that does not indicate specific path but connections between
frequently visited locations).

Results demonstrated the validity of the hypothesis by highlighting:
Explanations on movements of an object require the description of its movement
patterns.
A moving object exhibits a wide range of movement patterns over space and time.
Movement patterns can be acquired by analyzing a set of movement observations.
Movement patterns extracted from a set of observations improve modeling and
reasoning about unobserved movements of an object.
6.3 Future Research
This thesis presents new methods of modeling moving objects and handles related
uncertainties, but the full utility of these methods remains for further investigation.
Although this thesis has demonstrated significant results in the field of movement
modeling by the development of novel models and methodologies, this research also
discovered new issues and problems that need further research.
6.3.1 Using Signatures for Prediction Purposes
The components of the proposed model of this thesis: observations, profiles, and
movement signatures provide a foundation for making estimations and predictions related
to the movement of objects. The addition of movement signatures will enhance the
ability to more reliably estimate moving object positions and paths. The development of
estimation and prediction methods needs to be considered in future research.
Designing summary operations over movements of objects is area of ongoing
research. Additional methods for summarizing movements of objects need to be
identified. We are interested in further summarization methods using fuzzy and neuro-
fuzzy methodologies.

One area of particular interest is to more fonnally investigate the uncertainties
associated with the estimation of positions and paths of a moving object. The
computation of either a location or an expected path cannot be exact and thus the reported
result and presentation should provide some indication of the degree of uncertainty.
The selection of different membership functions leads to differences in the
accuracy of the obtained results. Therefore different scenarios containing different sets of
fuzzy membership functions need to be analyzed for refining the characterization of
signatures. Therefore, there is a need to develop methods to further evaluate designed
fuzzy models and membership functions.
6.3.2 Reasoning
Boolean logic based models of reasoning have the attractiveness of completeness
and mathematical rigor, but often they have limited applicability to the imprecise
situations of real life (Gaines, 1976). They conventionally attempt to be precise and
refuse the fuzziness and imprecision of concepts in real life and replace them with precise
simplifications (Dutta, 1990). Zadeh (Zadeh, 1975) suggested that the essence and the
power of human reasoning lie in the ability to grasp and use inexact concepts directly. He
further argues that efforts to model human reasoning processes via fonnal systems of
increasing precision shall lead to decreasing validity and relevance (Zadeh, 1979).
Zadeh (Zadeh, 1974) formally used the term approxin~ate (fuzzy) reasoning to
describe much of human reasoning. He (Zadeh, 1979) defined approximate reasoning or
equivalently fuzzy reasoning as the process or processes by which an imprecise
conclusion is deduced from a collection of imprecise premises. Fuzzy reasoning is
appropriate to solve a variety of problems in the real world. As mentioned before, much

of human reasoning is approximate and imprecise but produces relevant outcomes.
Humans often convert precise quantitative information into qualitative values (or
categories) to gain insight into the true meaning of the data (Booth, 1989). Consider for
example, the case of walking through a building. We may only approximate distances
and locations to various objects (humans, tables, doors), however we nevertheless
manage to find our way easily many times in a day. One can think of many other real
world examples including parking a car, moving between home and work locations,
playing soccer, and landing an airplane. There are many other real world scenarios where
various factors encourage the use of fuzzy reasoning methods for moving objects. One
should keep in mind that no standard method exists for transforming human knowledge
or experience into the rule base and database of a fuzzy inference system. In addition,
there is need for effective methods for tuning the membership functions (MFs) so to as
minimize the output error measure or maximize performance index.
In many instances, reasoning about moving objects is based on the concept of
similarity. Fuzzy and neuro-fuzzy methods are well suited for modeling, reasoning, and
similarity analysis purposes since geographic phenomena are not always well defined
with crisp boundaries (Yuan, 1997). Fuzzy and neuro-fuzzy modeling and reasoning
methodologies have started to be implemented in various GIs and remote sensing
applications such as change detection, classification of geographical data, improving
image analysis, and analyzing uncertainty (Dragicevic and Marceau, 1999; Papadias et
al., 1999; Stefanakis et al., 1999). Future research should include developing
methodologies to reason about spatio-temporal information expressed in the form of
linguistic descriptions, similar to the kind of information processed by humans.

6.3.3 Dynamic Fuzzy Sets
The concept of dynamic fuzzy sets for which membership values are allowed to
change is introduced (Kosanovic, 1995). The concept of a dynamic fuzzy set (Buller,
2001) is a way of fuzzy inferencing that allows for the resulting judgment to change with
time. The method of judgment generation employs the concept of fuzzy set and adds a
temporal aspect to the classic fuzzy logic. The concept of dynamic membership functions
offers new ways of understanding and modeling movements of objects.
6.3.4 Fuzzy Cartesian Coordinate System
In many moving object applications the objective is to deal with modeling
problems in environments that are uncertain, unpredictable, and possibly unstructured
and dynamic. Modeling movements of objects in such real world environments requires
access to information about locations of obstructions and/or landmarks. This type of
spatial information is typically represented in the form of a map. Traditional approaches
to map representation have attempted to capture explicit metric information about the
environment. However, as an alternative, a map representation based on fuzzy relations is
proposed in (Tunstel, 1995) that can be used to model movements of objects as shown in
Figure 6.1.
In this proposed approach, spatial information can be represented in a map that
reveals an approximate distribution of objects in some region of interest. The uncertainty
of this distribution is represented as a fuzzy relation, which can be thought of in this case
as a "Fuzzy Cartesian Coordinate System" where coordinates are approximate locations
of objects in the map (Tunstel, 1995). In the Figure 6.1, two-dimensional "Fuzzy
Cartesian Coordinate Systems" can be seen.

WEST N MID E FEAST
Figure 6.1 : Fuzzy Cartesian coordinate system.
This proposed approach offers ways of modeling movements of objects and
related uncertainties. The two-dimensional "Fuzzy Cartesian Coordinate System", which
represents locations of objects and obstructions using the fuzzy direction membership
functions such as FNorth and FWest as shown in Figure 6.1 could be used to create the
fuzzy rules base. This provides an approximate representation of the movements of
objects. The use of the "Fuzzy Cartesian Coordinate System" to model movements
should be further investigated.

BIBLIOGRAPHY
Adelson, E.H. and Wang, J.Y.A., 1994. Spatio-Temporal Segmentation of Video Data, Image and Video Processing 11. SPIE, San Jose, pp. 120- 13 1.
Agouris, P., Beard, K., Mountrakis, G. and Stefanidis, A., 2000a. Capturing and Modeling Geographic Object Change: A Spatio-Temporal Gazeteer Framework, Photogrammetric Engineering and Remote Sensing. SPIE, San Jose, pp. 1224- 1250.
Agouris, P., Mountrakis, G. and Stefanidis, A., 2000b. Automated Spatiotemporal Change Detection in Digital Aerial Imagery, SPIE Proceedings, Aerosense 2000, Orlando, FL, pp. 2-12.
Albers, G. and Roos, T., 1992. Voronoi Diagranls of Moving Points in Higher Dimensional Spaces, 3rd Scandinavian Workshop on Algorithm Theory (SWAT192), pp. 399-409.
Allen, J.F., 1984. Towards a general theory of action and time. Artificial Intelligence, 23: 123-154.
Al-Taha, K.K., 1992. Temporal Reasoning in Cadastral Systems. Ph.D. Thesis, University of Maine, Orono.
Altman, D., 1994. Fuzzy Set Theoretic Approaches for Handling Imprecision in Spatial Analysis. International Journal of Geographical Infornlation Systems, 8(3): 271 -289.
Anderson, J.A., 1983. Cognitive and psychological computation with neural models. IEEE Trans. on Systems, Man, and Cybernetics, 13(5): 799-8 15.
Armstrong, M.P., 1988. Temporality in spatial databases, GISILIS. American Congress on Surveying and Mapping, Church, Virginia, pp. 880-889.
Aurenhammer, F., 1991. Voronoi Diagrams: A Survey of a Fundamental Geometric Data Structure. ACM Computing Surveys, 23(3): 345-405.
Babuska, R., 1996. Fuzzy Modelling and Identification. PhD. Thesis, Delft University of Technology, Delft.
Barnhill, R., 1983. Computer aided surface representation and design. In: R. Barnhill and R. Boehm (Editors), Surfaces in computer aided geometric design, North-Holland, pp. 1 - 24.
Beard, K. and Agouris, P., 1997. A Spatio-Temporal Model for Integrated Information Management. NURI grant number NMA202-98-1-1113, Project Proposal for National Imagery and Mapping Agency (NIMA).

Beard, K. and Palancioglu, H.M., 2000. Estimating Positions and Paths of Moving Objects, Seventh International Workshop on Temporal Representation and Reasoning. The IEEE Computer Society Press, Cape Breton, Nova Scotia, CANADA, pp. 155- 162.
Beard, K.T. and Smith, L.H., 1997. Meta-information Models for Georeferenced Digital Library Collections, IEEE 2nd International Conference on Metadata, Silver Spring, MD.
Bezdek, J.C., 1980. A convergence theorem for the fuzzy ISODATA clustering algorithms. IEEE Trans. on PAMI, 2(1): 1-8.
Bezdek, J.C., 198 1. Pattern Recognition with Fuzzy Objective Function Algorithms. Plenum Press, New York.
Bezdek, J.C., 1993. Fuzzy Models --- What Are They, and Why? IEEE Transactions on Fuzzy Systenls, l(1): 1-6.
Booth, L.C ., 1 989. Qualitative Reasoning. Morgan Kaufinann, San Mateo, California.
Boyd, J. and Little, J., 1997. Global versus structured interpretation of motion: moving light displays., In Proceedings of the Computer Vision and Pattern Recognition, pp. 15-1 6.
Buller, A., 2001. Dynamic Fuzzy Sets for Cognitive Modeling, The Sixth International Symposium on Artificial Life and Robotics (AROB 6th 'Ol), Tokyo, Japan, pp. 150- 15 1.
Burrough, P.A., 1996. Natural Objects with Indeterminate Boundaries. In: a.A.U.F. Peter A. Burrough (Editor), Geographic Objects with Indeterminate Boundaries. Taylor & Francis Inc., Bristol, PA, pp. 3-28.
Chiyokura, H., 1986. Localized surface interpolation method for irregular meshes. In: L.K. Tosiyasu (Editor), Advanced Computer Graphics. Springer-Verlag, pp. 3-1 9.
Claramunt, C. and Theriault, M., 1995. Managing Time in GIs: An Event-Oriented Approach, Recent Advances in Temporal Databases. Springer-Verlag, pp. 23-42.
Crain, I.K., 1970. Computer interpolation and contouring of two-dimensional data: a review. Geoexploration, 8: 7 1-86.
Cutler, R. and Davis, L., 1998. View-based Detection and Analysis of Periodic Motion, 14th International Conference on Pattern Recognition, Brisbane, Australia.
Demirli, K., Molhim, M. and Bulgak, A., 1999. Possibilistic Sonar Modeling for Mobile Robots. International Journal of Uncertainty, Fuzziness and Knowledge Based Systems: 173-1 99.

Dorling, D., 1992. Visualizing People in Time and Space. Environment and Planning B: Planning and Design, 6: 61 3-637.
Dorst, L., Mandhyan, I. and Trovato, K.I., 1991. The geometrical representation of path planning problems. Robotics and Autonomous Systems, 7: 18 1 - 195.
Dougherty, M.S. and Kirby, H.R., 1993. The use of neural networks to recognize and predict traffic congestion. Traffic Engineering and Control, 34(2): 33 1-4.
Dragicevic, S. and Marceau, D.J., 1999. Spatio-Temporal Interpolation and Fuzzy Logic for GIs Simulation of Rural-to-Urban Transition. Cartography and Geographic Information Science, 26(2): 125- 137.
Duda, R.O. and Hart, P.E., 1973. Pattern Classification and Scene Analysis. Wiley Interscience, New York.
Dunn, J.C., 1973. A Fuzzy Relative of the ISODATA Process and Its Use in Detecting Compact Well-Separated Clusters. Journal of Cybernetics, 3(3): 32-57.
Dutta, S ., 1 988. Approximate spatial reasoning, The first international .conference on Industrial & engineering applications of artificial intelligence & expert systems, Tullahoma, TN USA, pp. 126-140.
Dutta, S., 1990. Approximate reasoning with temporal and spatial concepts (Temporal Concepts, Reasoning), University of California, Berkeley, 273 pp.
Dyreson, C.E. and Snodgrass, R.T., 1993. Valid-Time Indeterrninancy, 9th International Conference on Data Engineering, pp. 33 5-343.
Egenhofer, M., 1994. Spatial SQL: A Query and Presentation Language. IEEE Transactions on Knowledge and Data Engineering, 6(1): 86-95.
Egenhofer, M. and Frank, A., 1992. Object Oriented Modeling for GIs. Journal of the URISA, 4: 3-19.
Egenhofer, M. and Franzosa, R., 1991. Point Set Topological Relations. International Journal of Geographic Information Systems, 5 : 1 6 1 - 1 74.
Egenhofer, M.J. and Golledge, R.G., 1997. Time in Geographic Space: Report on the Specialist Meeting of Research Initiative 10. 949, National Center for Geographic Information and Analysis.
Egenhofer, M.J. and Mark, D.M., 1995. Naive Geography., 95-8, National Center for Geographic Information and Analysis.

Eisenkolb, A., Musto, A., Schill, K., Hernandez, D. and Brauer, W., 1997. Qualitative Representation of the Course of Motion: Cognitive and Psychophysical Foundations. FKI-225-97, Technische Universitat Munchen.
Elvins, T.T., 1992. A survey of algorithms for volume visualization. Computer Graphics, 26(3): 194-20 1.
Emarni, M., Turksen, I. and Goldenberg, A., 1996. An Improved Fuzzy Modeling Algorithm, Part 11: System Identification, Proceedings NAFIPS '96, University of California, Berkeley, California, pp. 294-298.
Erwig, M., Guting, R.H., Schneider, M. and Vazirgiannis, M., 1997. Spatio-temporal Data Types: An Approach to Modeling and Querying Moving Objects in Databases, Chorochronos Technical Paper Series.
Erwig, M., Guting, R.H., Schneider, M. and Vazirgiannis, M., 1999. Spatio-Temporal Data Types: An Approach to Modeling and Querying Moving Objects in Databases. GeoInformatica, 3.
Farin, G., 1990. Curves and Surfaces for Computer Aided Geometric Design. Academic Press, San Diego.
Fischer, M.M., 1994. Expert systems and artificial neural networks for spatial analysis and modelling. Geographical Systems, 1 : 22 1-235.
Forbus, K.D., 1980. Spatial and Qualitative Aspects of Reasoning about Motion, AAAI. Morgan Kaufmann, Palo Alto, pp. 170- 173.
Forer, P., 1998. Geometric approaches to the nexus of time, space and microprocess: Implementing a practical model for mundane socio-spatial systems. In: M.J. Egenhofer and R. Golledge (Editors), Spatial and temporal reasoning in geographic information systems. OUP, Oxford, pp. 17 1 - 190.
Frank, A.U., 1996. The Prevalence of Objects with Sharp Boundaries in GIs, Geographic Objects with Indeterminate Boundaries. Taylor & Francis Inc., Bristol, PA, pp. 29-40.
Franke, R., 1982. Scattered data interpolation: tests of some methods. Mathematics of Computation, 38(157): 18 1-200.
Franke, R. and Nielson, G., 1990. Scattered data interpolation: A tutorial and survey. In: H. Hagen (Editor), Geometric Modeling: Methods and Applications. Springer-Verlag.
Fu, J.-J. and Lee, R.C.T., 1991. Voronoi Diagrams of Moving Points in the Plane. ~ntemational' Journal of Computational Geometry and Applications, l(1): 23-32.

Gaines, B.R., 1976. Foundations of fuzzy reasoning. International Journal of Man-Machine Studies, 8: 623-668.
Galetto, R. and Viola, F., 1994. Time as the fourth dimension of the topographic databases. Mapping and Geographic Information Systems, International Society for Photogrammetry and Remote Sensing.
Gallagher, R.S., 1995. Computer Visualization- Graphics Techniques for Scientific and Engineering Analysis. CRC Press.
Galton, A., 1993. Towards an Integrated Logic of Space, Time, and Motion, Proceedings of the 13th International Joint Conference on Artificial Intelligence (IJCAI'93), Chambery, France, pp. 15 50- 15 5 5.
Galton, A., 1995. Towards a Qualitative Theory of Movement. In: A.U.F.a.W. Kuhn (Editor), Proceedings of International Conference COSIT'95. Spatial Information Theory: A Theoretical Basis for GIs. Springer-Verlag, Semmering, Austria, pp. 377- 396.
Glover, F. and Laguna, M., 1993. Tabu Search. In: C.R. Reeves (Editor), Modern Heuristic Techniques for Combinatorial Problems. Blackwell Scientific, Oxford, pp. 70-1 50.
Goddard, N.H., 1997. Human activity recognition. In: M.S.a.R. Jain (Editor), Motion-Based Recognition. Kluwer Academic Publishers, pp. 147-170.
Gold, C.M., 1979. Triangulation-based terrain modelling - where are we now?, Proceedings, AUTO-CARTO IV, Washington D.C, pp. 104-1 1 1.
Goldberg, D., 1989. Genetic Algorithms in Search, Optimization and Machine Learning. Addison-Wesley, Reading, MA.
Guibas, L., Mitchell, J.S.B. and Roos, T., 1991. Voronoi Diagrams of Moving Points in the Plane, 17th Workshop on Graph-Theoretic Concepts in Computer Science, LNCS 570, pp. 113-125.
Guting, R.H., 1994. An Introduction to Spatial Database Systems. VLDB, 4: 357-399.
Hagerstrand, T., 1970. What about People in Regional Science? Papers of the Regional Science Association(24): 1-2 1.
Hazelton, N.W.J., 1992. Integrating Time, Dynamic Modelling and Geographical Inforn~ation Systems: Development of Four-Dimensional GIs. Ph.D. Thesis, University of Melbourne, Melbourne.
Hirtle, S. and Jonides , J., 1985. Evidence of Hierarchies in Cognitive Maps. Memory and Cognition, 13(3): 208-2 17.

Hirtle, S. and MacEachren, A., 1998. Cognitive Models of Dynamic Geographic Phenomena and Their Representations, NCGIA, Pittsburgh, PA.
Hoogendoorn, S.P., Copinga, G. and Kayrnak, U., 1998. Perspectives of Fuzzy Logic in Traffic Engineering, TRAIL Research School, Delft.
Hornsby, K., 1999. Identity-Based Reasoning About Spatio-Temporal Change. Ph.D. Thesis Thesis, University of Maine, Orono, 164 pp.
Hornsby, K., 2000a. Creating summaries of spatio-temporal data, First International Conference on Geographic Information Science, GIScience 2000, Savannah, GA, pp. p. 170-171.
Hornsby, K., 2000b. Shifting granularity over geospatial lifelines, The AAAI Workshop on Spatial and Temporal Granularity. AAAI Press, Menlo Park, California, pp. 33-36.
Hornsby, K. and Egenhofer, M., 2002. Modeling moving objects over multiple granularities. Annals of Mathematics and Artificial Intelligence, Kluwer Academic Press(Specia1 issue on Spatial and Temporal Granularity,).
Hornsby, K. and Egenhofer, M.J., 1997. Qualitative Representation of Change. In: S.C.H.a.A.U. Frank (Editor), Proceedings of International Conference COSIT'97. Spatial Information Theory: A Theoretical Basis for GIs. Springer-Verlag, Laurel Highlands, Pennsylvania, USA, pp. 15-33.
Hunter, G.J. and Williamson, I.P., 1990. The development of a historical digital caclastral database. International Journal of Geographic Information Systems, 4(2): 169- 179.
Imfeld, S., 2000. Time, points and space - towards a better analysis of wildlife data in GIs. Ph.D Thesis, University of Zurich, Zurich, Switzerland.
Jan, O., Horowitz, A.J. and Peng, Z.-R., 2000. Using GPS Data to Understand Variations in Path Choice. Transportation Research Record Joumal(1725): 37-44.
Jang, J.S.R., 1993. ANFIS: Adaptive-Network-based Fuzzy Inference Systems. IEEE Trans. on Systems, Man, and Cybernetics, 23: 665-685.
Jang, J.S.R. and Sun, C.T., 1995. Neuro-Fuzzy Modeling and Control. Proceedings of the IEEE, 83: 378-406.
Jang, J.S.R., Sun, C.T. and Mizutani, E., 1996. Neuro-Fuzzy and Soft Computing: a computational approach to learning and machine intelligence. Prentice-Hall, Upper Saddle River, New Jersey.
Jensen, C.S. and Snodgrass, R.T., 1999. Temporal Data Management. IEEE Transactions on Knowledge and Data Engineering, 1 l(1): 36-43.

Kelmelis, J., 1991. Time and Space in Geographic Infonnation: Toward a Four-Dimensional Spatio-Temporal Data Model. Ph.D. Thesis, Pennsylvania State University, Pennsylvania.
Kikuchi, S., Nanda, R. and Perincherry, V., 1993. A Method to Estimate Trip 0-D Patterns Using A Neural Network Approach. Transportation Planning and Technology, 17: 51 -65.
Klir, G., 1989. Is There More to Uncertainty than Some Probability Theorists Would Have Us Believe? International Journal of General Systems, 15(4): 347-378.
Klir, G., 199 1. Generalized Information Theory. Fuzzy Sets and Systems, 40: 127- 142.
Klir, G.J. and Folger, T.A., 1988. Fuzzy Sets, Uncertainty, and Information. PrenticeHall, Englewood Cliffs, NJ.
Kollios, G., Gunopulos, D. and Tsotras, V., 1999. On Indexing Mobile Objects, Proceedings of the PODS Conference, pp. 261 -272.
Kosanovic, B.R., 1995. Signal and System Analysis in Fuzzy Information Space. Ph.D. Thesis, University of Pittsburgh, Pittsburgh.
Kosko, B., 1990. Fuzziness vs. Probability. International Journal of General Systems, 17(2- 3): 21 1-240.
Kosko, B., 1992. Neural networks and fuzzy systems: a dynamical systems approach to machine intelligence. PrenticeHall, Englewood Cliffs, New Jersey.
Kosko, B., 1993. Fuzzy thinking: the new science of fuzzy logic, Hyperion, New York.
Kraak, M.J. and MacEachren, A.M., 1994. Visualisation of the temporal component of spatial data. In: T.C. Waugh and R.G. Healey (Editors), Proceedings of the 6th International Symposium on Spatial Data Handling. International Geographical Union, Edinburgh, Scotland, pp. 39 1-409.
Krishnapuranl, R. and Keller, J., 1993. A possibilistic approach to clustering. IEEE Trans. Fuzzy Systems, l(2): 98-1 10.
Langran, G., 1988. Temporal GIs Design Tradeoffs, GISLIS, pp. 890-899.
Langran, G., 1989. A Review of Temporal Database Research and its Use in GIs Applications. International Journal of Geographic Information Systems, 3(3): 2 15- 232.
Langran, G., 1992a. States, Events, and Evidence: The Principle Entities of a Temporal GIs, GIS&IS, pp. 4 16-425.

Langran, G., 1992b. Time in Geographic Information Systems. London: Taylor & Francis.
Langran, G. and Chrisman, N.R., 1988. A framework for temporal geographic information systems. Cartographica, 25(3): 1 - 14.
Laurini, R. and Thompson, D., 1992. Fundamentals of Spatial Infonnation Systems. A.P.I.C. Series. Academic Press,, New York, NY.
Lee, D.T. and Schacter, B.J., 1980. Two Algorithms for Constructing a Delaunay Triangulation. International Journal of Computer and Infornlation Sciences, 9(3).
Leung, Y. and Leung, K.S., 1993. An intelligent expert system shell for knowledge-based GIs: 1. The tools, 2. Some applications. International Journal of Geographical Information Systems(7): 189-2 13.
Li, J.Z., ~ z s u , M.T. and Szafion, D., 1997. Modeling of Moving Objects in a Video Database, Proceedings of IEEE International Conference on Multimedia Computing and Systems, Ottawa, Canada, pp. 336-343.
Little, J. and Boyd, J., 1998. Recognizing people by their gate: the shape of motion. Journal Videre, l(2): 1-32.
Lorup, E.J., 1999. Belief Modeling with ArcView GIs, ESRI User Conference Proceedings, San Diego, California.
Mamdani, E.H., 1974. Applications of fuzzy algorithms for simple dynamic plant. Proceedings of IEEE, 12 l(12): 1585- 1588.
Mamdani, E.H. and Assilian, S., 1975. An experiment in linguistic synthesis with a hzzy logic controller. International Journal of Man-Machine Studies, 7(1): 1-13.
Mark, D.M., 1999. Spatial representation: a cognitive view. In: P.A. Longley, M.F. Goodchild, D.J. Maguire and D.W. Rhind (Editors), Geographic Infonnation Systems. John Wiley & Sons, Inc., pp. 8 1-89.
Mark, D.M. and Egenhofer, M.J., 1998. Geospatial Lifelines. In: 0. Guenther, T. Sellis and B. Theodoulidis (~ditors), Integrating Spatial and Temporal Database. Dagstuhl Seminar Report.
Mathworks, 1995. MATLAB: The Language of Technical Conlputing - Using MATLAB (Ver 5,6).
McNamara, T., Hardy, J. and Hirtle, S., 1989. Subjective Hierarchies in Spatial Memory. Journal of Environmental Psychology: Learning, Memory, and Cognition, 15(2): 2 1 1 - 227.

McNeill, D. and Freiberger, P., 1993. Fuzzy Logic: The Discovery of a Revolutionary Computer Technology-and How it is Changing Our World. Simon & Schuster, New York, 3 19 pp.
Mendel, J.M. and Mouzouris, G.C., 1997. Designing fuzzy logic systems. IEEE Trans. Circuit and Systems-11: Analog and Digital Signal Processing, 44: 885-895.
Metropolis, N., Rosenbluth, M., Rosenbluth, M., Teller, A. and Teller, E., 1953. Equation of state calculations for fast computing machines. Journal of Chemical Physics, 21: 1087-1 092.
Miller, H.J., 1991. Modelling accessibility using space-time prism concepts within geographical information systems. International Journal of Geographic Information Systems, 5: 287-30 1.
Monmonier, M., 1990. Strategies for the visualisation of geographic time-series data. Cartographica, 27: 30-45.
Montgomery, J.L.D., 1995. Temporal Geographic Information Systems Technology and Requirements: Where We are Today. Master Thesis, The Ohio State University, Columbus.
Moreira, J., Ribeiro, C. and Saglio, J.-M., 1999. Representation and Manipulation of Moving Points: An Extended Data Model for Location Estimation. Cartography and Geographic Mornlation Science, 26(2): 109-1 23.
Mountain, D. and Raper, J., 2001a. Modelling human spatio-temporal behaviour: A challenge for location-based services, Geocomputation 2001, 6th International Conference on Geocomputation, University of Queensland, Brisbane, Australia.
Mountain, D. and Raper, J., 2001b. Spatio-temporal representations of individual human movement for personalising Location Based Services, GISRUK 2001.
Mountrakis, G., 2000. Image-Based Change Detection Using an Integrated Spatiotemporal Gazetteer. Master Thesis Thesis, University of Maine, Orono, ME.
Nabil, M., Ngu, A. and Shepherd, J., 1997. Modeling Moving Objects in Multimedia Database, The 5th Conf. on Database Systems for Advanced Applications, Melbourne, Australia.
Okade, A., Boots, B. and Sugihara, K., 1992. Spatial Tessellations: Concepts and Application of Voronoi Diagrams. John Wiley and Sons, Chichester.
O'Neill, T. and Foo, N., 1998. Reasoning about Continuous Change. In: H. Lee and H. Motoda (Editors), Proceedings of the Fifth Pacific Rim International Conference on Artificial Intelligence, PRICAI'98. Springer-Verlag LNAI, pp. 294-304.

Owen, S.J., 1998. A Survey of Unstructured Mesh Generation Technology, Proceedings, 7th International Meshing Roundtable, Sandia National Lab, pp. 239-267.
Pal, N.R. and Bezdek, J.C., 1995. On cluster validity for the fuzzy c-means model. IEEE Trans. Fuzzy Systems( 3): 370-379.
Papadias, D., Karacapilidis, N. and Arkoumanis, D., 1999. Processing Fuzzy Spatial Queries: A Configuration Similarity Approach. International Journal of Geographical Information Science, l3(2): 93- 1 1 8.
Papoulis, A., 1984. Probability, Random Variables and Stochastic Processes. McGraw-Hill, Singapore.
Partsinevelos, P., 2002. Detection and generalization of spatio-temporal trajectories for motion imagery. Ph.D. Thesis Thesis, University of Maine, Orono, 162 pp.
Partsinevelos, P., Agouris, P. and Stefanidis, A., 2000. Modeling Movement Relations in Dynamic Urban Scenes., International Archives of Photogrammetry & Remote Sensing, Amsterdam, Netherlands, pp. 8 18-825.
Parzen, E., 1962. Stochastic Processes. Holden Day, Oakland, California.
Peuquet, D.J., 1994. It's about time: a conceptual fian~ework for the representation of temporal dynamics in geographic information systems. Annals of the Association of American Geographers, 84(3): 44 1-462.
Peuquet, D.J., 1999. Time in GIs and geographical databases. In: P.A. Longley, M.F. Goodchild, D.J. Maguire and D.W. Rhind (Editors), Geographic Information Systems. John Wiley & Sons, Inc., pp. 91-103.
Peuquet, D.J. and Duan, M., 1995. An event-based spatiotemporal data model (ESTDM) for temporal analysis of geographical data. International Journal of Geographical Infonnation Systems, 9(1): 7-24.
Peuquet, D.J. and Wentz, E.A., 1994. An Approach for Time-based Analysis of Spatiotemporal Data, Advances in GIs Research Proceedings, pp. 489-504.
Pfoser, D. and Jensen, C.S., 1999. Capturing the Uncertainty of Moving-Object Representations, Advances in Spatial Databases, 6th Inten~ational Symposium, SSD'99, Hong Kong, China.
Pfoser, D. and Theodoridis , Y., 2000. Generating Semantics-Based Trajectories of Moving Objects, Proceedings of the Int'l Workshop on Emerging Technologies for Geo-Based Applications, Ascona, Switzerland, pp. 59-76.
Pfoser, D. and Tryfona, N., 2000. Fuzziness and Uncertainty in Spatiotemporal Applications. CH-00-4, Chorochronos.
Ramachandran, B., MacLoad, F. and Dowers, S., 1994. Modelling temporal changes in a GIs using an object-oriented approach, In Advances in GIs research, Sixth International Symposium on Spatial Data Handling, London, pp. 5 18-537.
Ramaswamy, H., 2000. Modeling Intersections of Geospatial Lifelines, First International Conference on Geographic Infonnation Science, GeoScience 2000, Savannah, Georgia, USA.
Ramaswamy, H., 2001. Modeling Intersections of Geospatial Lifelines. MS Thesis Thesis, University of Maine, Orono, pp.80 pp.
Randell, D.A., Cui, Z. and Cohn, A.G., 1992. A Spatial Logic based on Regions and Connection, Principles of Knowledge Representation and Reasoning: Proceedings of the 3rd International Conference. Morgan Kaufmann, San Mateo, pp. 165- 176.
Renolen, A., 1995. Temporal Maps and Temporal Geographical Infonnation Systems (Review of Research), The Norwegian Institute of Tecnology.
Renolen, A., 1998. On the Design of an Object-Oriented Temporal GIs., Norwegian University of Science and Technology.
Ritchie, S.G. and Cheu, R.L., 1993. Simulation of freeway incident detection using artificial neural networks. Transportation Research C, l(3): 203-2 17.
Saltenis, S. and Jensen, C.S., 1999. R-Tree Indexing of General Spatio-Temporal Data. CH- 99- 18, Chorochronos Technical Report Series.
Saltenis, S., Jensen, C.S., Leutenegger, S.T. and A. Lopez, M., 2000. Indexing the Positions of Continuously Moving Objects, Proceedings of SIGMOD12000 conference. ACM, Dallas, Texas, pp. 331-342.
Schalkoff, R.J., 1992. Pattern Recognition: Statistical, Structural and Neural Approaches. John Wiley & Sons, New York.
Schlieder, C., Vogele, T. and Werner, A., 2001. Location Modeling for Intentional Behavior in Spatial Partonomies, Location Modeling for Ubiquitous Computing Workshop at Ubicomp 200 1, Atlanta.
Schneider, M., 1999. Uncertainty Management for Spatial Data in Databases: Fuzzy Spatial Data Types, 6th Int. Symp. on Advances in Spatial Databases (SSD), LNCS 1651. Springer-Verlag, pp. 330-35 1.

Segev, A. and Shoshani, A., 1993. A temporal data model based on time sequences, Temporal Databases: Theory, design, and implementation. The Benjamin/Cummings Publishing Company Inc, pp. 248-269.
Shekar, S. et al., 1999. Spatial Databases- Accomplishments and Research Needs. IEEE Transactions on Knowledge and Data Engineering, 1 l(1): 45-54.
Shibasaki, R., 1994. Handling Spatiotemporal Uncertainties of Geo-Objects for Dynamic Update of GIs Databases from Multi-Source Data. Advanced Geographic Data Modeling, 40. Netherlands Geodetic Commission, Netherlands, 228-243 pp.
Sistla, P., Wolfson, O., Chamberlain, S. and Dao, V., 1997. Modeling and Querying Moving Objects, Proceedings of the 13th International Conf. on Data Engineering, Birmingham, UK, pp. 422-432.
Snodgrass, R., 1987. The Temporal Query Language TQuel. TODS, 12(2): 247-298.
Snodgrass, R. and A h , I., 1985. A Taxonomy of Time in Databases, ACM SIGMOD, Austin, TX, pp. 236-246.
Stefanakis, E., 2001. A Unified Framework for Fuzzy Spatio-Temporal Representation and Reasoning, Proceedings of the 20th International Cartographic Conference, Beijing, China, pp. 2678-2687.
Stefanakis, E., M. Vazirgiannis and T., S., 1996. Spatial Decision Making Based on Fuzzy Set Methodologies, International Society for Photogrammetry and Remote Sensing (ISPRS), XVIII Congress, Vienna.
Stefanakis, E. and Sellis, T., 1996. A DBMS repository for the application domain of GIs, The 7th International Symposium on Spatial Data Handling, Delft, The Netherlands, pp. 3B19-3B29.
Stefanakis, E. and Sellis, T., 1997. Towards the design of a DBMS repository for temporal GIs, Department of Electrical and Computer Engineering, National Technical University of Athens, Greece.
Stefanakis, E., Vazirgiannis, M. and Sellis, T., 1999. Incorporating fuzzy set methodologies in a DBMS repository for the application domain of GIs. International Journal of Geographical Information Science, 13(7): 657-677.
Stefanidis, A., Partsinevelos, P., Agouris, P. and Doucette, P., 2000. Summarizing Video Datasets in the Spatiotemporal Domain, Advanced Spatial Data Management Workshop (ASDM 2000) in conjuction with DEXA 2000. IEEE Press, London, UK, pp. 906-912.

Studer, L. and Masulli, F., 1996. On the structure of a neuro-fuzzy system to forecast chaotic time series, Proceeding of the 1 st International Symposium on Neuro-Fuzzy Systems, AT'96, pp. 103-1 10.
Sugeno, M. and Kang, G.T., 1988. Structure identification of fuzzy model. Fuzzy Sets and Systems, 28: 15-33.
Susumu, K. and Makinouchi, A., 1999. Representation of Spatial, Temporal, and Spatio- temporal Data in the Topological Space Data Model Universe. IPSJ JOURNAL Abstract, 40(5): 49.
Swain, P.H., 1973. Pattern Recognition: A Basis for Remote Sensing Data Analysis. The Laboratory for Applications of Remote Sensing, Purdue University, West Lafayette, Indiana.
Takagi, T. and Sugeno, M., 1983. Derivation of fuzzy control rules from human operator's control actions, Proceedings of the IFAC Symp. on Fuzzy Information, Knowledge Representation and Decision Analysis, pp. 55-60.
Takagi, T. and Sugeno, M., 1985. Fuzzy identication of systems and its applications to modeling and control. IEEE Trans. on Systems, Man, and Cybernetics, 15: 116-132.
Takahashi, K., Nakatani, H. and Abe, K., 1995. Color image segmentation using ISODATA clustering method, 2nd Asian Conf. on Computer Vision, Singapore, pp. 523--527.
Therrien, C.W., 1989. Decision, Estimation and Classification - An introduction to Pattern Recognition and Related Topics. Wiley, New York.
Titterington, D., Smith, A. and Makov, U., 1985. Statistical Analysis of Finite Mixture Distributions. Wiley, New York.
Tou, J.T. and Gonzalez, R.C., 1974. Pattern Recognition Principles. Addison-Wesley Publishing Co., Reading, Massachusetts.
Tsukarnoto, Y., 1979. An approach to fuzzy reasoning method, Advances in Fuzzy Set Theory and Applications, North-Holland, Amsterdam, pp. 137-149.
Tunstel, E., 1995. Fuzzy spatial map representation for mobile robot navigation, ACM 10th Annual Symposium on Applied Computing, Nashville, TN, pp. 586-589.
Vasconcelos, N. and Lippman, A., 1998. A Spatiotemporal Motion Model for Video Summarization, CVPR, Santa Barbara, CA.
Vazirgiannis, M., 2000. Uncertainty handling in spatial relationships, ACM-SAC 2000 Conference, Como, Italy.

Walsum, T.v., Post, F.H., Silver, D. and Post, F.J., 1996. Feature Extraction and Iconic Visualization. IEEE Transactions on Visualization and Computer Graphics, 2(2): 111-119.
Wang, F., Hall, G.B. and Subaryono., 1990. Fuzzy Information Representation and Processing in Conventional GIs Software: Database Design and Application. Int. Journal of Geographical Information Systems, 4(3): 26 1-283.
Wang, J.Y.A. and Adelson , E.H., 1994. Spatio-Temporal Segmentation of Video Data, SPIE: Image and Video Processing 11, San Jose.
Wang, L.X., 1994. Adaptive fuzzy systems and control. Prentice-Hall, Englewood-Cliffs, New Jersey.
Wang, L.-X. and Mendel, J.M., 1992. Generating fuzzy rules by learning from examples. IEEE Transactions on Systems, Man and Cybernetics, 22(6): 14 14- 1427.
Wolfson, 0 . et al., 1999. Tracking Moving Objects Using Database Technology in DOMINO, Lecture Notes in Computer Science, No: 1649, Proceedings of NGITS'99. Springer-Verlag, pp. 112-1 19.
Wolfson, O., Xu, B., Chamberlain, S. and Jiang, L., 1998. Moving Objects Databases: Issues and Solutions, Proceedings of the 10th International Conference on Scientific and Statistical Database Management (SSDBM98), Capri, Italy, pp. 11 1-122.
Worboys, M.F., 1992. A model for spatio-temporal information, The 5th International Symposium on Spatial Data Handling, pp. 602-6 1 1.
Worboys, M.F., 1996. Metrics and topologies for geographic space, Proceedings of 7th Intl. Symposium Spatial Data Handling, Delft, Netherlands, pp. 365-376.
Worboys, M.F., 1998. A generic model for spatio-bitemporal geographic information. In: M. Egenhofer and R.G. Golledge (Editors), Spatial and Temporal Reasoning in Geographic Information Systems. Oxford University Press, pp. 25-39.
Worboys, M.F., 2001. Modelling changes and events in dynamic spatial systems with reference to socio-economic units. In: A. Frank, J. Raper and J.P. Cheylan (Editors), Life and Motion of Socio-Economic Units. ESF GISDATA series. Taylor and Francis, pp. 129-1 38.
Xie, X.L. and Beni, G., 1991. A validity measure for fuzzy clustering. IEEE Trans. Pattern Anal. Machine Intelligence., 13(8): 84 1-847.
Yuan, M., 1997. Modelling Semantical, Spatial and Temporal Information in a GIs. In: M.C.a.H. Couclelis (Editor), Geographic Information Research: Bridging the Atlantic. Taylor and Francis, London, pp. 334-347.

Yuan, M., 1998. Representing Spatiotemporal Processes to Support Knowledge Discovery in GIs Databases. In: T.K. Poiker and N. Chrisman (Editors), Spatial Data Handling. International Geographical Union, Geographic Information Science Study Group, pp. 43 1-440.
Zadeh, L., 1975. Fuzzy logic and approximate reasoning. Synthese, 30: 407-428.
Zadeh, L.A., 1965. Fuzzy Sets. Information Control, 8: 338-353.
Zadeh, L.A., 1974. Fuzzy Logic and its application to approximate reasoning, Information Processing. North-Holland Publishing Co., Amsterdam, pp. 591-594.
Zadeh, L.A., 1979. A theory of approximate reasoning. Machine Intelligence, 9: 149-194.
Zimmermann, H.J., 1991. Fuzzy Sets Theory and Its Applications. Kluwer Academic Publishers, Boston.

APPENDIX
DELAUNAY TRIANGULATION
A triangulation is a subdivision of an area (volume) into triangles (tetrahedrons).
The Delaunay triangulation is the dual structure of the Voronoi diagram. A Voronoi
diagram is the partitioning of the plane into polygonal regions where each region is the
set of points in the plane that are closer to some input point than to any other input point.
Voronoi diagrams were first discussed by Peter Lejeune-Dirichlet in 1850. However, the
first paper about Voronoi diagrams was written by Voronoi in 1908. If the Voronoi
diagram is computed using cluster centers, neighborhood borders of a surface can be
obtained.
Delaunay triangulation named for the Russian mathematician, Boris Delaunay is
among the most popular techniques used for generation of surfaces. Delaunay
triangulation (Aurenhammer, 1991; Gold, 1979) is a triangulation of a set of points with
the condition that no point in the point set falls in the circumcircle of any triangle in the
triangulation. There are two stages in the Delaunay triangulation method: placement of
the surface vertices and triangulation. There are several Delaunay triangulation methods
(Lee and Schacter, 1980; Owen, 1998). One of the methods used in Delaunay
triangulation consists of inserting a point to the triangulation shown in Figure A.la,
finding all existing triangles whose circurncircle contains the new point and deleting
them, which creates a convex cavity as shown in Figure A. lb. The final version in which
the new point is inserted and connected to all the vertices on the boundary of the cavity is
shown in Figure A. 1 c.

Figure A. 1 : Delaunay triangulation over the author face.
In the context of this thesis triangulation, is used for surface construction of the
movement behaviors of objects described further in chapter 4. The perception of changes
in the observed movement parameters is facilitated with a data visualization approach. In
(Walsum et al., 1996) the objective of visualization is stated as "the extraction of
meaningful features fiom large data sets" where one of the feature sets of interest might
be surface connectivity. Examples of such considerations consistent with the problem of
this research are summarizing the data points into meaningful groups and examining
regions of interest by data reduction and compaction.

BIOGRAPHY OF THE AUTHOR
H. Mustafa Palancioglu was born in Kayseri, Turkey in 1970. He received his
Bachelor of Engineering (Surveying Engineering) degree from The Yildiz Technical
University, Istanbul, Turkey in 1992. He then joined the Department of Civil
Engineering, Erciyes University, Kayseri in 1993 where he worked as a research
associate. He received his Master of Engineering degree in 1995 from The Yildiz
Technical University, Istanbul, Turkey. He is a member of the Surveying Engineers
Association of Turkey.
He enrolled for graduate studies in Spatial Information Science and Engineering
at the University of Maine in the fall of 1997, and then joined the National Center for
Geographic Information and Analysis (NCGIA) in 1998 and worked as a research
assistant until 2001. H. Mustafa is married and has two sons.
H. Mustafa is a candidate for the Doctor of Philosophy degree in Spatial
Information Science and Engineering from The University of Maine in May, 2003.
Copyright © 2022 FDOKUMEN