Multiple Adaptive Neuro-Fuzzy Inference System with Automatic Features Extraction Algorithm for...
12
Research Article Multiple Adaptive Neuro-Fuzzy Inference System with Automatic Features Extraction Algorithm for Cervical Cancer Recognition Mohammad Subhi Al-batah, 1 Nor Ashidi Mat Isa, 2 Mohammad Fadel Klaib, 3 and Mohammed Azmi Al-Betar 4,5 1 Department of Computer Science and Soſtware Engineering, Faculty of Science and Information Technology, Jadara University, P.O. Box 733, Irbid, Jordan 2 Imaging and Computational Intelligence (ICI) Group, School of Electrical & Electronic Engineering, Universiti Sains Malaysia, Engineering Campus, 14300 Nibong Tebal, Penang, Malaysia 3 Soſtware Engineering Department, College of Computer Science & Engineering, Taibah University P.O. Box 344, Madinah 30001, Saudi Arabia 4 Department of Information Technology, Al-Huson University College, Al-Balqa Applied University, P.O. Box 50, Jordan 5 School of Computer Sciences, Universiti Sains Malaysia, 11800 Penang, Malaysia Correspondence should be addressed to Mohammad Subhi Al-batah; [email protected] Received 18 September 2013; Revised 13 December 2013; Accepted 17 December 2013; Published 23 February 2014 Academic Editor: Chris Bauch Copyright © 2014 Mohammad Subhi Al-batah et al. is is an open access article distributed under the Creative Commons Attribution License, which permits unrestricted use, distribution, and reproduction in any medium, provided the original work is properly cited. To date, cancer of uterine cervix is still a leading cause of cancer-related deaths in women worldwide. e current methods (i.e., Pap smear and liquid-based cytology (LBC)) to screen for cervical cancer are time-consuming and dependent on the skill of the cytopathologist and thus are rather subjective. erefore, this paper presents an intelligent computer vision system to assist pathologists in overcoming these problems and, consequently, produce more accurate results. e developed system consists of two stages. In the first stage, the automatic features extraction (AFE) algorithm is performed. In the second stage, a neuro-fuzzy model called multiple adaptive neuro-fuzzy inference system (MANFIS) is proposed for recognition process. e MANFIS contains a set of ANFIS models which are arranged in parallel combination to produce a model with multi-input-multioutput structure. e system is capable of classifying cervical cell image into three groups, namely, normal, low-grade squamous intraepithelial lesion (LSIL) and high-grade squamous intraepithelial lesion (HSIL). e experimental results prove the capability of the AFE algorithm to be as effective as the manual extraction by human experts, while the proposed MANFIS produces a good classification performance with 94.2% accuracy. 1. Introduction Cervical cancer is a malignant disease that develops in the cells of the cervix or the neck of the uterus [1]. It is considered as the second most common form of cancer in women worldwide, ranked aſter breast cancer [2]. It causes loss of productive life in women both due to early death as well as prolonged disability. e primary reason is lack of awareness of the disease and access to screening and health services [3]. According to survey, one woman dies every seven minutes of cervical cancer and by the year 2025, it is estimated to be one death in every five minutes [4]. However, in most cases, cervical cancer takes many years to develop from normal to advanced stage [5, 6]. Hence, the incidence and mortality related to this disease can be significantly reduced through early detection and proper treatment [7, 8]. ere are wide varieties of screening techniques for cer- vical cancer [9–13]. Papanicolau smear test is a well-known screening method for detecting abnormalities of the cer- vix cells [14]. Due to scarce number of skilled and experienced Hindawi Publishing Corporation Computational and Mathematical Methods in Medicine Volume 2014, Article ID 181245, 12 pages http://dx.doi.org/10.1155/2014/181245
Transcript of Multiple Adaptive Neuro-Fuzzy Inference System with Automatic Features Extraction Algorithm for...

Research ArticleMultiple Adaptive Neuro-Fuzzy Inference Systemwith Automatic Features Extraction Algorithm forCervical Cancer Recognition
Mohammad Subhi Al-batah,1 Nor Ashidi Mat Isa,2
Mohammad Fadel Klaib,3 and Mohammed Azmi Al-Betar4,5
1 Department of Computer Science and Software Engineering, Faculty of Science and Information Technology, Jadara University,P.O. Box 733, Irbid, Jordan
2 Imaging and Computational Intelligence (ICI) Group, School of Electrical & Electronic Engineering, Universiti Sains Malaysia,Engineering Campus, 14300 Nibong Tebal, Penang, Malaysia
3 Software Engineering Department, College of Computer Science & Engineering, Taibah University P.O. Box 344,Madinah 30001, Saudi Arabia
4Department of Information Technology, Al-Huson University College, Al-Balqa Applied University, P.O. Box 50, Jordan5 School of Computer Sciences, Universiti Sains Malaysia, 11800 Penang, Malaysia
Correspondence should be addressed to Mohammad Subhi Al-batah; [email protected]
Received 18 September 2013; Revised 13 December 2013; Accepted 17 December 2013; Published 23 February 2014
Academic Editor: Chris Bauch
Copyright © 2014 Mohammad Subhi Al-batah et al. This is an open access article distributed under the Creative CommonsAttribution License, which permits unrestricted use, distribution, and reproduction in any medium, provided the original work isproperly cited.
To date, cancer of uterine cervix is still a leading cause of cancer-related deaths in women worldwide. The current methods (i.e.,Pap smear and liquid-based cytology (LBC)) to screen for cervical cancer are time-consuming and dependent on the skill ofthe cytopathologist and thus are rather subjective. Therefore, this paper presents an intelligent computer vision system to assistpathologists in overcoming these problems and, consequently, produce more accurate results. The developed system consists oftwo stages. In the first stage, the automatic features extraction (AFE) algorithm is performed. In the second stage, a neuro-fuzzymodel calledmultiple adaptive neuro-fuzzy inference system (MANFIS) is proposed for recognition process.TheMANFIS containsa set of ANFISmodels which are arranged in parallel combination to produce a model with multi-input-multioutput structure.Thesystem is capable of classifying cervical cell image into three groups, namely, normal, low-grade squamous intraepithelial lesion(LSIL) and high-grade squamous intraepithelial lesion (HSIL).The experimental results prove the capability of theAFE algorithm tobe as effective as themanual extraction by human experts, while the proposedMANFIS produces a good classification performancewith 94.2% accuracy.
1. Introduction
Cervical cancer is a malignant disease that develops in thecells of the cervix or the neck of the uterus [1]. It is consideredas the second most common form of cancer in womenworldwide, ranked after breast cancer [2]. It causes loss ofproductive life in women both due to early death as well asprolonged disability. The primary reason is lack of awarenessof the disease and access to screening and health services [3].According to survey, one woman dies every seven minutes
of cervical cancer and by the year 2025, it is estimated to beone death in every five minutes [4]. However, in most cases,cervical cancer takes many years to develop from normal toadvanced stage [5, 6]. Hence, the incidence and mortalityrelated to this disease can be significantly reduced throughearly detection and proper treatment [7, 8].
There are wide varieties of screening techniques for cer-vical cancer [9–13]. Papanicolau smear test is a well-knownscreening method for detecting abnormalities of the cer-vix cells [14]. Due to scarce number of skilled and experienced
Hindawi Publishing CorporationComputational and Mathematical Methods in MedicineVolume 2014, Article ID 181245, 12 pageshttp://dx.doi.org/10.1155/2014/181245
2 Computational and Mathematical Methods in Medicine
AFE algorithm
Classification(MANFIS)
Cervical cancerimage
Threshold value finding
(clustering technique)
Centroid location finding (invariant
moment technique)
Segmentation andfeatures extraction
(region growing technique)
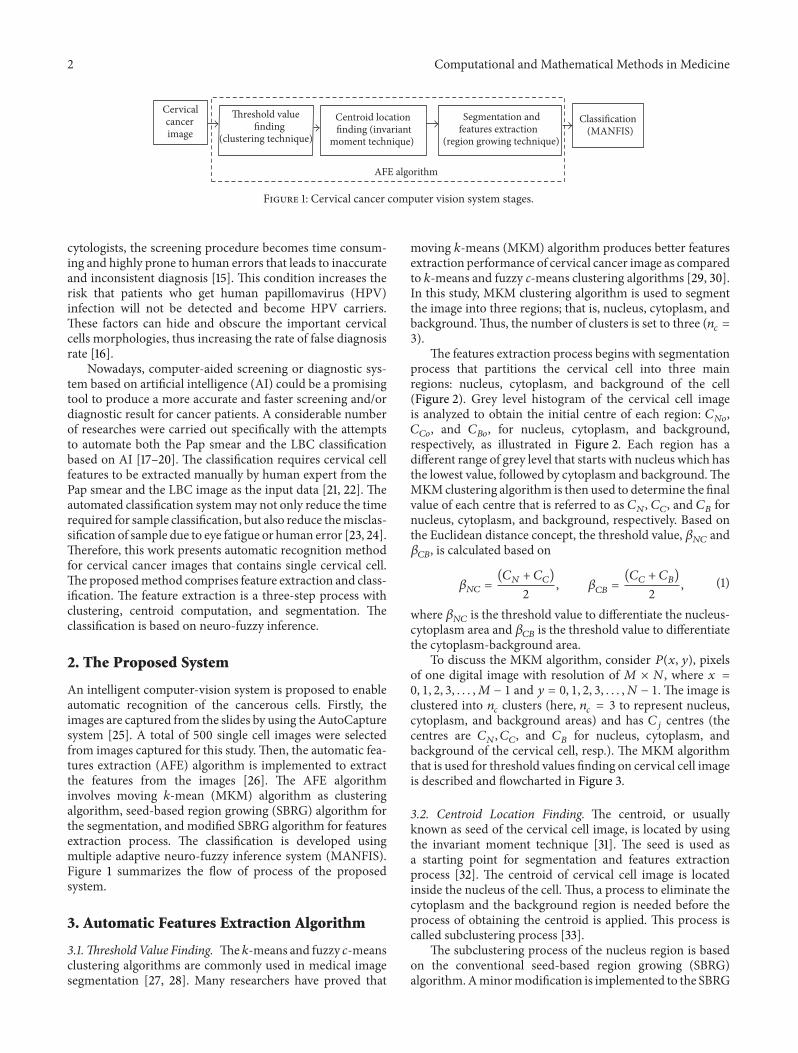
Figure 1: Cervical cancer computer vision system stages.
cytologists, the screening procedure becomes time consum-ing and highly prone to human errors that leads to inaccurateand inconsistent diagnosis [15]. This condition increases therisk that patients who get human papillomavirus (HPV)infection will not be detected and become HPV carriers.These factors can hide and obscure the important cervicalcells morphologies, thus increasing the rate of false diagnosisrate [16].
Nowadays, computer-aided screening or diagnostic sys-tem based on artificial intelligence (AI) could be a promisingtool to produce a more accurate and faster screening and/ordiagnostic result for cancer patients. A considerable numberof researches were carried out specifically with the attemptsto automate both the Pap smear and the LBC classificationbased on AI [17–20]. The classification requires cervical cellfeatures to be extracted manually by human expert from thePap smear and the LBC image as the input data [21, 22]. Theautomated classification systemmay not only reduce the timerequired for sample classification, but also reduce themisclas-sification of sample due to eye fatigue or human error [23, 24].Therefore, this work presents automatic recognition methodfor cervical cancer images that contains single cervical cell.The proposedmethod comprises feature extraction and class-ification. The feature extraction is a three-step process withclustering, centroid computation, and segmentation. Theclassification is based on neuro-fuzzy inference.
2. The Proposed System
An intelligent computer-vision system is proposed to enableautomatic recognition of the cancerous cells. Firstly, theimages are captured from the slides by using the AutoCapturesystem [25]. A total of 500 single cell images were selectedfrom images captured for this study.Then, the automatic fea-tures extraction (AFE) algorithm is implemented to extractthe features from the images [26]. The AFE algorithminvolves moving 𝑘-mean (MKM) algorithm as clusteringalgorithm, seed-based region growing (SBRG) algorithm forthe segmentation, and modified SBRG algorithm for featuresextraction process. The classification is developed usingmultiple adaptive neuro-fuzzy inference system (MANFIS).Figure 1 summarizes the flow of process of the proposedsystem.
3. Automatic Features Extraction Algorithm
3.1.Threshold Value Finding. The 𝑘-means and fuzzy 𝑐-meansclustering algorithms are commonly used in medical imagesegmentation [27, 28]. Many researchers have proved that
moving 𝑘-means (MKM) algorithm produces better featuresextraction performance of cervical cancer image as comparedto 𝑘-means and fuzzy c-means clustering algorithms [29, 30].In this study, MKM clustering algorithm is used to segmentthe image into three regions; that is, nucleus, cytoplasm, andbackground.Thus, the number of clusters is set to three (𝑛
𝑐=
3).The features extraction process begins with segmentation
process that partitions the cervical cell into three mainregions: nucleus, cytoplasm, and background of the cell(Figure 2). Grey level histogram of the cervical cell imageis analyzed to obtain the initial centre of each region: 𝐶
𝑁𝑜,
𝐶𝐶𝑜, and 𝐶
𝐵𝑜, for nucleus, cytoplasm, and background,
respectively, as illustrated in Figure 2. Each region has adifferent range of grey level that starts with nucleus which hasthe lowest value, followed by cytoplasm and background.TheMKMclustering algorithm is then used to determine the finalvalue of each centre that is referred to as 𝐶
𝑁, 𝐶𝐶, and 𝐶
𝐵for
nucleus, cytoplasm, and background, respectively. Based onthe Euclidean distance concept, the threshold value, 𝛽
𝑁𝐶and
𝛽𝐶𝐵, is calculated based on
𝛽𝑁𝐶
=(𝐶𝑁+ 𝐶𝐶)
2, 𝛽
𝐶𝐵=(𝐶𝐶+ 𝐶𝐵)
2, (1)
where 𝛽𝑁𝐶
is the threshold value to differentiate the nucleus-cytoplasm area and 𝛽
𝐶𝐵is the threshold value to differentiate
the cytoplasm-background area.To discuss the MKM algorithm, consider 𝑃(𝑥, 𝑦), pixels
of one digital image with resolution of 𝑀 × 𝑁, where 𝑥 =
0, 1, 2, 3, . . . ,𝑀 − 1 and 𝑦 = 0, 1, 2, 3, . . . , 𝑁 − 1. The image isclustered into 𝑛
𝑐clusters (here, 𝑛
𝑐= 3 to represent nucleus,
cytoplasm, and background areas) and has 𝐶𝑗centres (the
centres are 𝐶𝑁, 𝐶𝐶, and 𝐶
𝐵for nucleus, cytoplasm, and
background of the cervical cell, resp.). The MKM algorithmthat is used for threshold values finding on cervical cell imageis described and flowcharted in Figure 3.
3.2. Centroid Location Finding. The centroid, or usuallyknown as seed of the cervical cell image, is located by usingthe invariant moment technique [31]. The seed is used asa starting point for segmentation and features extractionprocess [32]. The centroid of cervical cell image is locatedinside the nucleus of the cell. Thus, a process to eliminate thecytoplasm and the background region is needed before theprocess of obtaining the centroid is applied. This process iscalled subclustering process [33].
The subclustering process of the nucleus region is basedon the conventional seed-based region growing (SBRG)algorithm.Aminormodification is implemented to the SBRG

Computational and Mathematical Methods in Medicine 3
Background
Nucleus
Cytoplasm
(a)
Num
ber o
f pix
els
CBo
CNo
CCo
100
200
300
400
500
600
700
800
900
0
139
144
149
154
159
164
169
174
179
184
194
199
204
209
214
219
224
229
234
239
244
249
254
189
Intensity (grey level)
Thre
shol
d1
CytoplasmNucleus
Thre
shol
d2
Background
(b)
Figure 2: An example of image histogram; divided into 3 regions, nucleus, cytoplasm, and cell background.
algorithm, as compared to the original SBRG algorithmwhere the seed location for the region growing processis located at the background of the cervical cell, that is,at coordinate (0, 0). The flowchart of subclustering processusing SBRG algorithm is shown in Figure 4.
3.3. Segmentation and Features Extraction. There are severalapproaches that can be used to perform segmentation byusing the region growing method. In this study, the modifiedSBRG algorithm is adopted [30].The algorithm is used to seg-ment the cervical cell image into three main regions: nucleus,cytoplasm, and background. Simultaneously, all the featuresneeded from the image are extracted. The features are size,average grey level value, and perimeter for both the nucleusand cytoplasm, respectively. These features are usually usedby pathologist for screening cervix cancer disease. The mod-ified SBRG algorithm can be implemented as follows.
(1) Obtain the nucleus-cytoplasm threshold value, 𝛽𝑁𝐶
,cytoplasm-background threshold value,𝛽
𝐶𝐵, and cen-
troid location, (𝑥, 𝑦), from the techniques discussedin Sections 3.1 and 3.2. The centroid is used as astarting point for the algorithm to execute.
(2) Set the following variables:
(a) 𝑛𝑢𝑐𝑙𝑒𝑢𝑠 𝑠𝑖𝑧𝑒 = 1, 𝑐𝑦𝑡𝑜𝑝𝑙𝑎𝑠𝑚 𝑠𝑖𝑧𝑒 = 1,(b) total grey level nucleus = grey level value for seed
pixel, 𝐺𝐿𝑁(𝑥, 𝑦),
total grey level cytoplasm = grey level value forseed pixel, 𝐺𝐿
𝐶(𝑥, 𝑦).
(3) Apply median filter and histogram equalization pro-cess on the image.
(4) Select 𝑁 × 𝑁 array of pixels, where 𝑁 is an oddnumber.
(5) Establish initial seed pixel location at coordinate(𝑥, 𝑦).
(6) Calculate average grey level value, 𝑥, and standarddeviation, 𝜎, of the seed pixel(s) grown so far using
𝑥 =∑𝑛
𝑖=1𝑥𝑖
𝑛,
𝜎 = √∑𝑛
𝑖=1(𝑥𝑖− 𝑥)2
𝑛 − 1.
(2)
(7) Compare the seed pixel with one of the neighbourpixels. The neighbour pixel is selected to becomemember of the growing area if one of the followingconditions is fulfilled:
(a) if the gradient between the original grey levelvalue and the grey level value after histogramequalization process is less than 95% AND theoriginal grey level value is equal or greater thanthe 𝛽𝑁𝐶
value (𝛽𝐶𝐵
value for Step 12);(b) if the gradient between the original grey level
value and the grey level value after histogramequalization process is same or larger than 95%AND the original grey level value is same orlarger than the difference between the 𝑥 and the𝜎; that is, (𝑥 − 𝜎).If one of the conditions is fulfilled,(i) increase the variable nucleus size by 1 (for
Step 12, increase the variable cytoplasm sizeby 1),
(ii) perform summation of grey level value ofthe selected pixel with grey level value ofprevious selected pixels, ∑
𝑥∑𝑦𝐺𝐿𝑁(𝑥, 𝑦).
Assign the result to variable total grey levelnucleus (for Step 12, perform summationof grey level value of the selected pixelwith grey level value of previous selectedpixels, ∑
𝑥∑𝑦𝐺𝐿𝐶(𝑥, 𝑦). Assign the result
to variable total grey level cytoplasm).
(8) Choose the neighbour pixel that has fulfilled thegrowing conditions as the new seed pixel.

4 Computational and Mathematical Methods in Medicine
Choose an image with a single cervical cell
Calculate the centre (Cj)
Check the fitness f(Cj) of each centre
Find smallest CS andlargest CL of f(Cj)
Recalculate CS and CL
𝛼a = 𝛼a − 𝛼a/nC
f(CS) ≥ 𝛼af(CL)
Stop
f(CS) < 𝛼af(CL)
Sort the centres in ascending order
P(x, y) < CL
Calculate the centre
𝛼a =
𝛼b = 𝛼b − 𝛼b/nC
No
No
No
No
Yes
Yes
Yes
Yes
Step 1
Step 2
Step 3
Step 4
Step 5
Step 6.1
Step 6.2
Step 6
Step 7
Step 8
Step 9
Step 10
Step 11
Set 𝛼a = 𝛼b = 𝛼o
𝛼o
f(CS) ≥ 𝛼bf(CL)
Initialize CNo, CCo , and CBo
𝛽NC =(CN + CC)/2
𝛽CB=(CC + CB)/2
CL =1
nL∑y𝜖C𝐿
∑x𝜖C𝐿
P(x, y)
Cj =1
nj∑y∈C𝑗
∑x∈C𝑗
P(x, y)
f(Cj) = ∑y∈C𝑗
∑x∈C𝑗
(‖P(x, y) − (Cj)‖)2
Cj =1
nj∑y∈C𝑗
∑x∈C𝑗
P(x, y)
CS = CL
CS =1
nS∑y∈C𝑆
∑x∈C𝑆
P(x, y)
Calculate 𝛽NCand 𝛽CB
Figure 3: Flowchart summarising the method used by moving 𝑘-means clustering.
(9) Mark the pixel as Checked.
(10) Assign the pixel with value 0 (black).
(11) Repeat Steps 5 to 9 by taking the neighbour pixelthat has fulfilled the growing conditions as the newseed pixel until the entire image has been checked orcannot be grown. Mark the border pixel as nucleusborder.
(12) Take 𝛽𝐶𝐵, and repeat Steps 5 to 7 for cytoplasm region
by using the same centroid pixel, (𝑥, 𝑦) as seed pixel.(13) Assign the pixel that fulfilled the growing conditions
and has not yet being marked as Checked with value127 (grey).
(14) Repeat Steps 12 and 13 until the entire image has beenexamined or cannot be grown. Mark the border pixelas cytoplasm border.

Computational and Mathematical Methods in Medicine 5
m00 = ∑x∑yaxy
m10 = ∑x∑yxaxy
m01 = ∑x∑yyaxy
Obtain 𝛽NC
Establishcoordinateat
locationseedtheP(0, 0)
Apply median filter andhistogram equalization process
Stop
Choose the neighbour pixelwith value 255 (white)
Whole imagechecked?
Yes
No
Apply median filter algorithm
on the resulting image
(nucleus region)
Compare the seed pixel withone of the neighbour pixels
Neighbour pixel isa member of growing area
No
Yes
Implement the following equations
Select N× N array of pixels
where N is an odd number
√𝜎 =∑ n
=1(xi − x)2i
n − 1
No
x =m10
m00
y =m01
m00
Gradient (originalhistogram) ≥ 95%
and original≥ (x − 𝜎)
Gradient (originalhistogram) < 95%and original ≥ 𝛽NC
x =∑ n
i=1xin
Figure 4: Flowchart summarising the steps of SBRG algorithm.
(15) Mark all other pixels that are not involved in thegrowing process with value 255 (white).
(16) Count the pixel that has been marked as nucleus bor-der and cytoplasm border. The perimeter of nucleus,𝑃𝑁, is equal to total amount of pixel marked with
nucleus border, and the perimeter of cytoplasm, 𝑃𝐶, is
equal to total amount of pixel marked with cytoplasmborder.
(17) The size of nucleus, 𝑛, is equal to value of nucleus size.For cytoplasm, the actual size, 𝑐, is equal to
𝑐 = cytoplasm size − 𝑛. (3)
(18) Calculate the average grey level value for the nucleus,𝐺𝐿𝑁, using
𝐺𝐿𝑁=∑𝑥∑𝑦𝐺𝐿𝑁(𝑥, 𝑦)
𝑛. (4)

6 Computational and Mathematical Methods in Medicine
Calculate the average grey level value for the cytoplasm,𝐺𝐿𝐶,
using
𝐺𝐿𝐶=∑𝑥∑𝑦𝐺𝐿𝐶(𝑥, 𝑦) − ∑
𝑥∑𝑦𝐺𝐿𝑁(𝑥, 𝑦)
𝐶. (5)
A few modifications have been applied on the conven-tional SBRG algorithm so that the modified SBRG algorithmis capable of automatically extract the features from thecervical cell image. Processes to obtain the threshold valuesand the initial seed location are carried out automatically.The threshold values, 𝛽
𝑁𝐶and 𝛽
𝐶𝐵, are obtained fromMKM
clustering algorithm whereas the initial seed location isacquired from the invariant moment technique.
The modified SBRG algorithm is simultaneously usedfor segmentation and features extraction. Steps 10, 13, and15 segment the image so that the nucleus, cytoplasm, andbackground region will be marked as black, grey, and white,respectively.Thus, the background region will be easily elimi-nated from the image.
The extraction process begins at Step 2 where the centroidis automatically accepted as nucleus region member. This isbecause the determination process for the centroid location isbasically done using clustering technique in nucleus region.The neighbour pixels will then be examined and will beaccepted as nucleus region member if the growing conditionis fulfilled. It will then increase the number of pixels grown byone, according to Step 7. At the same time, the grey level valueof the new member will be extracted and summed with totalof grey level value of acceptedmembers. After completing thegrowing process, the total number of nucleus regionmemberswill represent the size of nucleus, 𝑛, as shown in Step 17.Pixels that formed the border of nucleus will be calculatedas perimeter of the nucleus, 𝑃
𝑁. The average grey level value
for nucleus region is given by (4).Region growing process for extracting cytoplasm features
started at Step 12. By using the same methods, only pixelsthat fulfilled the conditions are accepted to become cytoplasmregion members. The region growing process for the cyto-plasm starts at the same seed location of the nucleus. Thus,the features extracted will contain the same features obtainedfrom the extraction process of nucleus region, except forperimeter. Therefore, after completing the region growingprocess for the cytoplasm region, the number of pixels grownwill be deductedwith size of nucleus,𝑛, to get the actual size ofcytoplasm, 𝑐, as shown in (3). For the average grey level value,the summation of grey level for cytoplasm will be deductedwith the summation of grey level for nucleus before dividingthe result with the actual size of cytoplasm, 𝑐, as shown in(5).The flowchart of modified SBRG algorithm is presentedin Figure 5.
4. Discussion of AFE Algorithm
TheAFE algorithm is used to perform the extraction processof the cervical cell images. From 500 single cell images, 3images (normal, LSIL, and HSIL) were selected arbitrarily foranalysis in this section. For fair comparison, the resolution ofevery single image is saved as 160×120. Figures 6(a), 6(b), and
Table 1: Final centres and threshold values for normal, LSIL, andHSIL.
Image Final centres Threshold values𝐶𝑁
𝐶𝐶
𝐶𝐵
𝛽𝑁𝐶
𝛽𝐶𝐵
Normal 153 190 227 171 208LSIL 161 194 234 177 214HSIL 152 187 235 169 211
6(c) represent the normal, LSIL, and HSIL images with theirgrey level histogram, respectively. In the grey level histogramfigure, the 𝑥-axis represents the grey level value, and the 𝑦-axis represents the number of pixels.
4.1. Threshold Values, 𝛽𝑁𝐶
, and 𝛽𝐶𝐵. The first process that
needs to be carried out is clustering process. The clusteringprocess starts with histogram analysis to obtain the initialcentres, 𝐶
𝑁𝑜, 𝐶𝐶𝑜, and 𝐶
𝐵𝑜for nucleus, cytoplasm, and back-
ground region, respectively. The MKM clustering algorithmis then used to determine the final value of each centre thatis referred to as 𝐶
𝑁, 𝐶𝐶, and 𝐶
𝐵. The final centres values for
each cervical cell image as tabulated in Table 1 are locatedat the correct location according to the grey level histogramin Figures 6(a), 6(b), and 6(c). The 𝐶
𝑁, 𝐶𝐶, and 𝐶
𝐵final
centres are located at the centre of nucleus, cytoplasm, andbackground of their grey level histogram region, respectively.The final centre values were used to calculate the thresholdvalues for nucleus-cytoplasm and cytoplasm-backgroundregion. To find all themembers for each centre, the Euclideandistance concept was adopted. From the concept, to find thethreshold value between nucleus and cytoplasm, 𝛽
𝑁𝐶, and
the threshold value between cytoplasm and background, 𝛽𝐶𝐵,
the average value between 𝐶𝑁and 𝐶
𝐶and the average value
between 𝐶𝐶and 𝐶
𝐵have been calculated, respectively. The
results of final centre and threshold values for normal, LSIL,and HSIL image are presented in Table 1. From the table andits corresponding grey level histogram, the 𝛽
𝑁𝐶and 𝛽
𝐶𝐵are
the grey level values which limit the group of pixels inside thenucleus and cytoplasm clusters, respectively. From the results,the threshold values have been successfully determined byusing the MKM clustering algorithm.
4.2. Centroid Location, (𝑥, 𝑦). Centroid location finding isthe second process after obtaining the threshold values, forthe segmentation and features extraction process could start.The centroid is located inside the nucleus of the cervical celland needs to be determined automatically. Thus, a processcalled subclustering is needed to distinguish the cytoplasmand background region of the cell. The 𝛽
𝐶𝐵values from the
clustering process are used to subcluster the images. Thenucleus area is used to find the centroid location by usingthe invariant moment technique. As shown in Figure 7, thecentroid location is 𝑥 = 72, 𝑦 = 51 for normal cell, 𝑥 = 71,𝑦 = 65 for LSIL, and 𝑥 = 68, 𝑦 = 56 for HSIL. From theobservation, it can be noted that the centroid location foreach image is located at the centre of the nucleus area. Fromthe results, it can be stated that the process of finding the

Computational and Mathematical Methods in Medicine 7
Obtain , , and centroid location
Nucleus size = 1
Stop
Apply median filter andhistogram equalization process
Yes Yes
Yes
Yes
No
No
No
No
No
Cytoplasm size = 1
Establish initial seed pixel locationat coordinate (x, y)
x =∑ n
i=1xin
one of the neighbour pixels
Whole imagechecked?
Compare the seed pixel with
Whole imagechecked?
Pc = cytoplasm borderPN = nucleus border
Flag == 1
Select N× N array of pixels
Gradient (originalhistogram) < 95%
𝛽NC
√𝜎 =∑ n
=1(xi − x)2i
n − 1
Gradient (originalhistogram) ≥ 95%
and original≥ (x − 𝜎)
𝛽 𝛽
Total grey level cytoplasm =
=n
∑ x∑ y∑ x∑ y
=GLC(x, y) − GLN(x, y)
C
(x, y)NC CB
GLC(x, y)Total grey level nucleus = GLN(x, y)
where N is an odd number
Flag 𝛽NC = 1
Flag 𝛽NC = 0
and original ≥ 𝛽NC
Find summation of GLN(x, y)
c = cytoplasm − nn = nucleussize
Flag 𝛽CB = 0
Neighbour pixel = 0 Neighbour pixel = 127
Neighbour pixel = 255
Flag 𝛽CB = 1
Nucleus size+ = 1
∑ x∑ yGLN(x, y)
GLC
GLN
Figure 5: Flowchart summarising the steps of modified SBRG algorithm.

8 Computational and Mathematical Methods in Medicine
100
100
200
0 50 150 200 250
700600500400300
(a)
1,200
1,000
200
400
600
800
00 50 150 200100 250
(b)
0200
800
0 50
600
400
150
200
250100
1400
1000
12000
(c)
Figure 6: Cervical cancer image and grey level histogram.
centroid location has been successfully achieved by using thesubclustering and the invariant moment technique.
4.3. Segmentation. After getting the threshold values and thecentroid location of the cervical cell image, segmentationprocess is executed.The algorithm involved ismodified SBRGalgorithm that starts at centroid location determined earlierand grows towards the image border. Pixels values that areequal to or smaller than the 𝛽
𝑁𝐶value (and some other
conditions described in growing condition, Section 3.3) aremarked with value 0 indicating the nucleus region. For thecytoplasm region, pixels values that are equal to or smallerthan the 𝛽
𝐶𝐵value (and some other conditions described
in growing condition, Section 3.3) are marked with value127. The remaining pixels values are assigned with value 255for the background of the cervical cells. The results shownin Figure 8 proved that the modified SBRG algorithm hassuccessfully segmented the cervical cell images.
4.4. Features Extraction. The final step in order to extract thefeatures of the cervical cells is features extraction process.Theprocess is executed simultaneously with the segmentationprocess presented in the previous section.Thus, the algorithminvolved is modified SBRG algorithm that read the pixelsvalue at the same time when the segmentation process isexecuted. The size and grey level value for nucleus andcytoplasm were updated each time a new pixel that belongsto nucleus and cytoplasm clusters was examined. Pixels thatform a border between nucleus-cytoplasm and cytoplasm-background were marked and updated during the extractionprocess. The details about features extraction process werediscussed in Section 3.3. The features that were extractedare shown in Table 2. The results showed that the normal
Table 2: Features extracted from normal, LSIL, and HSIL.
Image Cells’Features
Size Perimeter Gray level(pixels2) (pixels) (0–255)
Normal Nucleus 337 89 145.875Cytoplasm 8859 1282 187.512
LSIL Nucleus 1155 307 160.565Cytoplasm 6239 550 186.131
HSIL Nucleus 1327 320 151.455Cytoplasm 3675 373 173.084
cell has smaller nucleus area and a very large cytoplasmicarea, whereas abnormal cell has increased nucleus area butshrinking cytoplasmic area.
5. Classification
The artificial neural network (ANN), fuzzy inference system(FIS), and neuro-fuzzy [34–47] are promising techniqueswhich have proven to be very reliable in recent years.Neuro-fuzzy hybrid systems integrate the advantages of fuzzysystems for dealing with explicit knowledge which can beexplained and understood and neural networks for dealingwith implicit knowledge which can be acquired by learning.Therefore, combination of fuzzy system and neural networkshandles limitations of both methods and offers an excellentdata-mining opportunity to solve the critical and complexproblem in pattern recognition [48]. One of most commontools is ANFIS which combined both fuzzy logic and neuralnetwork [49, 50].

Computational and Mathematical Methods in Medicine 9
(a) (b) (c)
Figure 7: (a) Centroid location for normal, (b) LSIL, and (c) HSIL.
(a) (b) (c)
Figure 8: (a) Segmentation result for normal, (b) LSIL, and (c) HSIL.
Table 3: The original number of the cervical cell images classes forthe fivefold method.
Training samples (80%) Testing samples (20%)Normal LSIL HSIL Normal LSIL HSIL
Fold 1 300 64 36 76 15 9Fold 2 310 62 28 66 17 17Fold 3 308 58 34 68 21 11Fold 4 317 52 31 59 27 14Fold 5 309 62 29 67 17 16
The acronym ANFIS stands for adaptive neuro-fuzzyinference system which is a multi-input, single-output model[51]. However, A multioutput model can be designed byconnecting few single output models. Thus, a multiple adap-tive neuro-fuzzy inference system (MANFIS) is proposedin the presented study. The MANFIS contains a number ofANFIS models which are arranged in parallel combinationto produce a model with multiple outputs. Figure 9 showsan example of MANFIS with six inputs, 𝑥
1, 𝑥2, 𝑥3, 𝑥4,
𝑥5, and 𝑥
6, and three outputs, 𝑓
1, 𝑓2, and 𝑓
3. A hybrid
learning algorithm which combines least squares estimationand back propagation is used for membership functionparameter estimation. The advantage of hybrid method isthat it uses back propagation for parameter associated withinput membership function and least square estimation forparameters associated with output membership.
A total of 500 single cell images have been used in theclassification process (376 normal, 79 LSIL, and 45 HSIL),
ANFIS
ANFIS
ANFIS
x1
x2
x3
x4
x5
x6
f2
f3
f1
Figure 9: The architecture of the MANFIS with 6 inputs and 3outputs.
where 80% of the cells (400 images) have been used fortraining and 20% of the cells (100 images) have been usedfor theMANFIS testing. Based on the analysis method whichis proposed by Hoang [52], the fivefold analysis method ischosen. The accuracy percentage of each class is calculatedby dividing the summation of the predicted number of cellsover the summation of the original number of samples in each
10 Computational and Mathematical Methods in Medicine
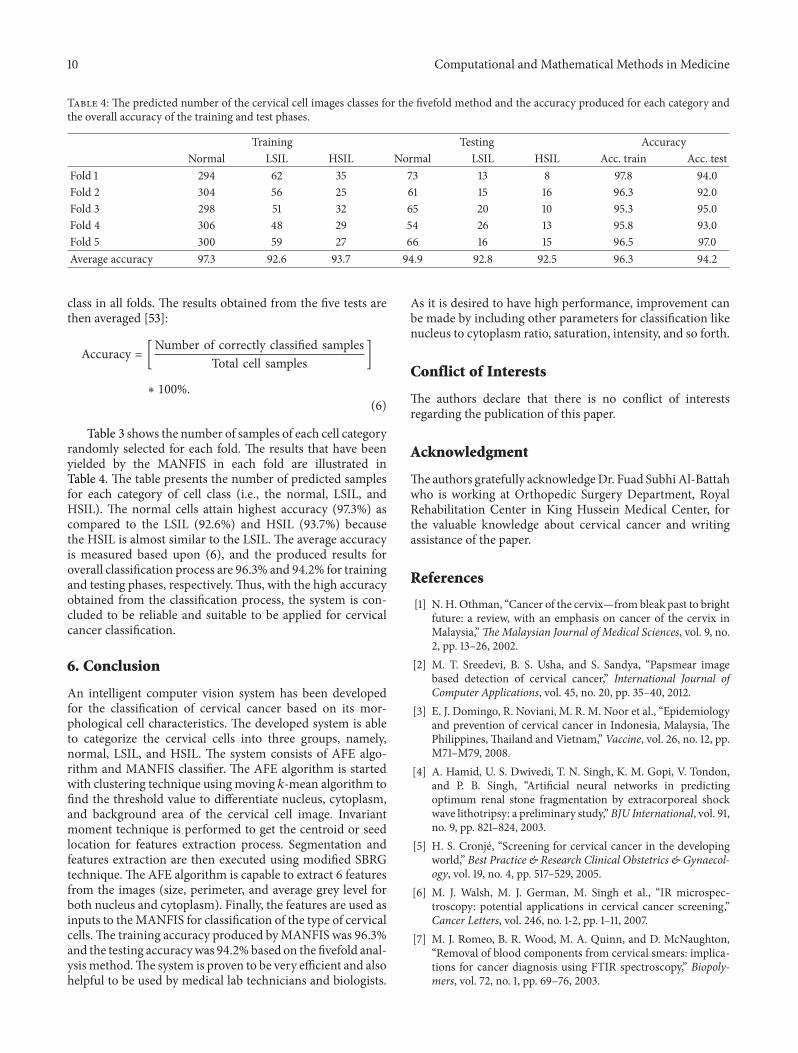
Table 4: The predicted number of the cervical cell images classes for the fivefold method and the accuracy produced for each category andthe overall accuracy of the training and test phases.
Training Testing AccuracyNormal LSIL HSIL Normal LSIL HSIL Acc. train Acc. test
Fold 1 294 62 35 73 13 8 97.8 94.0Fold 2 304 56 25 61 15 16 96.3 92.0Fold 3 298 51 32 65 20 10 95.3 95.0Fold 4 306 48 29 54 26 13 95.8 93.0Fold 5 300 59 27 66 16 15 96.5 97.0Average accuracy 97.3 92.6 93.7 94.9 92.8 92.5 96.3 94.2
class in all folds. The results obtained from the five tests arethen averaged [53]:
Accuracy = [Number of correctly classified samples
Total cell samples]
∗ 100%.(6)
Table 3 shows the number of samples of each cell categoryrandomly selected for each fold. The results that have beenyielded by the MANFIS in each fold are illustrated inTable 4. The table presents the number of predicted samplesfor each category of cell class (i.e., the normal, LSIL, andHSIL). The normal cells attain highest accuracy (97.3%) ascompared to the LSIL (92.6%) and HSIL (93.7%) becausethe HSIL is almost similar to the LSIL. The average accuracyis measured based upon (6), and the produced results foroverall classification process are 96.3% and 94.2% for trainingand testing phases, respectively.Thus, with the high accuracyobtained from the classification process, the system is con-cluded to be reliable and suitable to be applied for cervicalcancer classification.
6. Conclusion
An intelligent computer vision system has been developedfor the classification of cervical cancer based on its mor-phological cell characteristics. The developed system is ableto categorize the cervical cells into three groups, namely,normal, LSIL, and HSIL. The system consists of AFE algo-rithm and MANFIS classifier. The AFE algorithm is startedwith clustering technique using moving 𝑘-mean algorithm tofind the threshold value to differentiate nucleus, cytoplasm,and background area of the cervical cell image. Invariantmoment technique is performed to get the centroid or seedlocation for features extraction process. Segmentation andfeatures extraction are then executed using modified SBRGtechnique.The AFE algorithm is capable to extract 6 featuresfrom the images (size, perimeter, and average grey level forboth nucleus and cytoplasm). Finally, the features are used asinputs to theMANFIS for classification of the type of cervicalcells.The training accuracy produced byMANFIS was 96.3%and the testing accuracywas 94.2%based on the fivefold anal-ysismethod.The system is proven to be very efficient and alsohelpful to be used by medical lab technicians and biologists.
As it is desired to have high performance, improvement canbe made by including other parameters for classification likenucleus to cytoplasm ratio, saturation, intensity, and so forth.
Conflict of Interests
The authors declare that there is no conflict of interestsregarding the publication of this paper.
Acknowledgment
Theauthors gratefully acknowledgeDr. Fuad Subhi Al-Battahwho is working at Orthopedic Surgery Department, RoyalRehabilitation Center in King Hussein Medical Center, forthe valuable knowledge about cervical cancer and writingassistance of the paper.
References
[1] N. H. Othman, “Cancer of the cervix—from bleak past to brightfuture: a review, with an emphasis on cancer of the cervix inMalaysia,”TheMalaysian Journal of Medical Sciences, vol. 9, no.2, pp. 13–26, 2002.
[2] M. T. Sreedevi, B. S. Usha, and S. Sandya, “Papsmear imagebased detection of cervical cancer,” International Journal ofComputer Applications, vol. 45, no. 20, pp. 35–40, 2012.
[3] E. J. Domingo, R. Noviani, M. R. M. Noor et al., “Epidemiologyand prevention of cervical cancer in Indonesia, Malaysia, ThePhilippines, Thailand and Vietnam,” Vaccine, vol. 26, no. 12, pp.M71–M79, 2008.
[4] A. Hamid, U. S. Dwivedi, T. N. Singh, K. M. Gopi, V. Tondon,and P. B. Singh, “Artificial neural networks in predictingoptimum renal stone fragmentation by extracorporeal shockwave lithotripsy: a preliminary study,” BJU International, vol. 91,no. 9, pp. 821–824, 2003.
[5] H. S. Cronje, “Screening for cervical cancer in the developingworld,” Best Practice & Research Clinical Obstetrics & Gynaecol-ogy, vol. 19, no. 4, pp. 517–529, 2005.
[6] M. J. Walsh, M. J. German, M. Singh et al., “IR microspec-troscopy: potential applications in cervical cancer screening,”Cancer Letters, vol. 246, no. 1-2, pp. 1–11, 2007.
[7] M. J. Romeo, B. R. Wood, M. A. Quinn, and D. McNaughton,“Removal of blood components from cervical smears: implica-tions for cancer diagnosis using FTIR spectroscopy,” Biopoly-mers, vol. 72, no. 1, pp. 69–76, 2003.

Computational and Mathematical Methods in Medicine 11
[8] R. Lozano, “Comparison of computer-assisted and manualscreening of cervical cytology,” Gynecologic Oncology, vol. 104,no. 1, pp. 134–138, 2007.
[9] N. H. Othman, M. C. Ayub, W. A. A. Aziz, M. Muda, R. Wahid,and S. Selvarajan, “Is it an effective screening methods forcervical cancer neoplasia? An experience with 2289 cases,”TheMalaysian Journal of Medical Science, vol. 4, no. 1, pp. 45–50,1997.
[10] D. V. Coleman, “Evaluation of automated systems for the pri-mary screening of cervical smears,” Current Diagnostic Pathol-ogy, vol. 5, no. 2, pp. 57–64, 1998.
[11] J. Karnon, J. Peters, J. Platt, J. Chilcott, E. McGoogan, andN. Brewer, “Liquid-based cytology in cervical screening: anupdated rapid and systematic review and economic anlysis,”Health Technology Assessment, vol. 8, no. 20, pp. 1–78, 2004.
[12] E. Lerma, L. Colomo, A. Carreras, E. Esteva, M. Quilez, andJ. Prat, “Rescreening of atypical cervicovaginal smears usingPAPNET,” Cancer Cytopathology, vol. 84, no. 6, pp. 361–365,1998.
[13] R. Ashfaq, B. Solares, andM. H. Saboorian, “Detection of endo-cervical component by PAPNET system on negative cervicalsmears,” Diagnostic Cytopathololgy, vol. 15, no. 2, pp. 121–123,1996.
[14] N. A. Mat-Isa, M. Y. Mashor, K. Z. Zamli, N. R. Mat-Noor, andN. H. Othman, “Supplementary and alternative techniques tointerpret Pap smear: a review,” International Journal of FactoryAutomation, Robotics and Soft Computing, vol. 2, pp. 27–34,2006.
[15] B. K. Ane and D. Roller, “Adaptive intelligent systems forrecognition of cancerous cervical cells based on 2D cervicalcytological digital images,” in Machine Learning Algorithmsfor Problem Solving in Computational Applications: IntelligentTechniques, chapter 18, pp. 292–331, IGI Global, 2012.
[16] N. Mustafa, N. A. Mat-Isa, U. K. Ngah, M. Y. Mashor, and K. Z.Zamli, “Linear contrast enhancement processing on preselectedcervical cell of Pap smear images,” Technical Journal School ofElectrical & Electronic Engineering, vol. 10, pp. 30–34, 2004.
[17] N.K.Goyal, A.Kumar, S. Trivedi,U. S.Dwivedi, T.N. Singh, andP. B. Singh, “A comparative study of artificial neural network andmultivariate regression analysis to analyze optimum renal stonefragmentation by extracorporeal shock wave lithotripsy,” SaudiJournal of KidneyDiseases and Transplantation, vol. 21, no. 6, pp.1073–1080, 2010.
[18] K. Turner, N. Ramanujam, J. Ghosh, and R. Richards-Kortum,“Ensembles of radial basis function networks for spectroscopicdetection of cervical precancer,” IEEE Transactions on Biomed-ical Engineering, vol. 45, no. 8, pp. 953–961, 1998.
[19] L. Zhong and K. Najarian, “Automated classification of Papsmear tests using neural networks,” in Proceedings of theInternational Joint Conference on Neural Networks (IJCNN ’01),vol. 4, pp. 2899–2901, Washington, DC, USA, July 2001.
[20] Y. Jusman, N. A.Mat-Isa, R. Adnan, andN.H.Othman, “Intelli-gent classification of cervical pre-cancerous cells based on theFTIR spectra,” Ain Shams Engineering Journal, vol. 3, no. 1, pp.61–70, 2012.
[21] N. Mustafa, N. A. Mat-Isa, M. Y. Mashor, and N. H. Othman,“New features of cervical cells for cervical cancer diagnosticsystem using neural network,” in Proceedings of the Malaysia-Japan International SymposiumonAdvancedTechnology, pp. 12–15, Kuala Lumpur, Malaysia, 2007.
[22] N. Mustafa, N. A. Mat-Isa, M. Y. Mashor, and N. H. Othman,“Capability of new features of cervical cells for cervical cancer
diagnostic system using hierarchical neural network,” Interna-tional Journal of Simulation Systems, Science & Security, vol. 9,no. 2, pp. 56–64, 2008.
[23] N. A.Mat-Isa,M. Y.Mashor, andN.H. Othman, “An automatedcervical pre-cancerous diagnostic system,” Artificial Intelligencein Medicine, vol. 42, no. 1, pp. 1–11, 2008.
[24] N. A.Mat-Isa, M. Y. Mashor, and N. H. Othman, “Classificationof cervical cancer cells using HMLP network with confidencepercentage and confidence level analysis,” International Journalof the Computer, vol. 11, no. 1, pp. 17–29, 2003.
[25] N. R.Mat-Noor, N. A.Mat-Isa, M. Y.Mashor, N. H. Othman, K.Z. Zamli, and M. S. Al-Batah, “Automatic glass-slide capturingsystem for cervical cancer pre-screening program,” AmericanJournal of Applied Sciences, vol. 5, no. 5, pp. 461–467, 2008.
[26] N. Mustafa, Features extraction of cervical cell based on Thin-Prep images for cervical cancer diagnostic system [M.S. thesis],School of Electrical and Electronic Engineering, UniversitiSains Malaysia, Penang, Malaysia, 2007.
[27] W.-L. Hung, M.-S. Yang, and D.-H. Chen, “Parameter selectionfor suppressed fuzzy c-means with an application to MRIsegmentation,” Pattern Recognition Letters, vol. 27, no. 5, pp.424–438, 2006.
[28] J. K. Sing,D.K. Basu,M.Nasipuri, andM.Kundu, “Self-adaptiveRBF neural network-based segmentation of medical images ofthe brain,” in Proceedings of the IEEE International Conferenceon Intelligent Sensing and Information, pp. 447–452, Calcutta,India, January 2005.
[29] M. Y. Mashor, “Hybrid training algorithm for RBF network,”International Journal of the Computer, the Internet and Manage-ment, vol. 8, no. 2, pp. 50–65, 2000.
[30] N. Mustafa, N. A. Mat-Isa, and M. Y. Mashor, “Automatedmulticells segmentation of thinprep image using modified seedbased region growing algorithm,” Biomedical Soft Computingand Human Sciences, vol. 14, no. 2, pp. 41–47, 2009.
[31] G. J. Awcock and R. Thomas, Applied Image Processing,McGraw-Hill, New York, NY, USA, 1996.
[32] S. Paschalakis and M. Bober, “Real-time face detection andtracking formobile videoconferencing,”Real-Time Imaging, vol.10, no. 2, pp. 81–94, 2004.
[33] S. Ibrahim, N. E. A. Khalid, and M. Manaf, “Seed-BasedRegion Growing (SBRG) vs Adaptive Network-Based InferenceSystem (ANFIS) vs Fuzzy c-Means (FCM): brain abnormalitiessegmentation,” World Academy of Science, Engineering andTechnology, vol. 68, pp. 425–435, 2010.
[34] T. N. Singh, V. K. Singh, and S. Sinha, “Prediction of cadmiumremoval using an artificial neural network and a neuro-fuzzytechnique,”Mine Water and the Environment, vol. 25, no. 4, pp.214–219, 2006.
[35] S. Sinha, T. N. Singh, V. K. Singh, and A. K. Verma, “Epochdetermination for neural network by self-organized map(SOM),” Computational Geosciences, vol. 14, no. 1, pp. 199–206,2010.
[36] N. A. Mat-Isa, Z. M. Sani, and M. S. Al-Batah, “AutomatedIntelligent real-time system for aggregate classification,” Inter-national Journal of Mineral Processing, vol. 100, no. 1-2, pp. 41–50, 2011.
[37] M. S. Al-Batah, N. A. Mat-Isa, K. Z. Zamli, and K. A. Azizli,“Modified recursive least squares algorithm to train the HybridMultilayered Perceptron (HMLP) network,” Applied Soft Com-puting Journal, vol. 10, no. 1, pp. 236–244, 2010.
12 Computational and Mathematical Methods in Medicine
[38] M. S. Al-Batah, N. A. Mat-Isa, K. Z. Zamli, Z. M. Sani,and K. A. Azizli, “A novel aggregate classification techniqueusingmoment invariants and cascadedmultilayered perceptronnetwork,” International Journal ofMineral Processing, vol. 92, no.1-2, pp. 92–102, 2009.
[39] N. A.Mat-Isa, M. S. Al-Batah, K. Z. Zamli, K. A. Azizli, A. Joret,and N. R. M. Noor, “Suitable features selection for the HMLPand MLP networks to identify the shape of aggregate,” Con-struction and Building Materials, vol. 22, no. 3, pp. 402–410,2008.
[40] B. Tasdelen, S. Helvaci, H. Kaleagasi, and A. Ozge, “Artificialneural network analysis for prediction of headache prognosisin elderly patients,” Turkish Journal of Medical Sciences, vol. 39,no. 1, pp. 5–12, 2009.
[41] Z. M. Sani, N. A. Mat-Isa, S. A. Suandi, M. S. Al-Batah, K.Z. Zamli, and K. A. Azizli, “Intelligent rock vertical shaftimpact crusher local database system,” International Journal ofComputer Science and Network Security, vol. 7, no. 6, pp. 57–62,2007.
[42] N. A. Mat-Isa, A. Joret, M. S. Al-Batah, A. N. Ali, K. Z. Zamli,and K. A. Azizli, “Microcontroller based HMLP realization foraggregate classification system,” International Journal of FactoryAutomation, Robotics and Soft Computing, vol. 2, pp. 19–26,2006.
[43] O. M. Alia, M. A. Al-Betar, M. Rajeswari, and A. T. Khader,“Data clustering using harmony search algorithm,” in Swarm,Evolutionary, and Memetic Computing, vol. 7077 of LectureNotes in Computer Science, pp. 79–88, 2011.
[44] N. Sut and Y. Celik, “Prediction of mortality in stroke patientsusing multilayer perceptron neural networks,” Turkish Journalof Medical Sciences, vol. 42, no. 5, pp. 886–893, 2012.
[45] M. S. Al-Batah, A. Zabian, and M. Abdel-Wahed, “Suitablefeatures selection for the HMLP network using circle segmentsmethod,” European Journal of Scientific Research, vol. 67, no. 1,pp. 52–65, 2011.
[46] Y. A. Z. A. Alkareem, I. Venkat, M. A. Al-Betar, and A. T.Khader, “Edge preserving image enhancement via harmonysearch algorithm,” in Proceedings of the 4th Conference on DataMining and Optimization (DMO ’12), pp. 47–52, Langkawi,Malaysia, 2012.
[47] A. K. Baareh, A. F. Sheta, and M. S. Al-Batah, “Feature based3D object recognition using artificial neural networks,” Inter-national Journal of Computer Applications, vol. 44, no. 5, pp. 1–7, 2012.
[48] Y. Oguz and I. Guney, “Adaptive neuro-fuzzy inference systemto improve the power quality of variable-speedwind power gen-eration system,” Turkish Journal of Electrical Engineering &Computer Sciences, vol. 18, pp. 625–646, 2010.
[49] R. Singh, A. Kainthola, and T. N. Singh, “Estimation of elasticconstant of rocks using an ANFIS approach,” Applied SoftComputing Journal, vol. 12, no. 1, pp. 40–45, 2012.
[50] T. E. Dalkilic, B. Y. Hanci, and A. Apaydin, “Fuzzy adaptiveneural network approach to path loss prediction in urban areasat GSM-900 band,” Turkish Journal of Electrical Engineering andComputer Sciences, vol. 18, no. 6, pp. 1077–1094, 2010.
[51] J.-S. R. Jang, “ANFIS: adaptive-network-based fuzzy inferencesystem,” IEEE Transactions on Systems, Man and Cybernetics,vol. 23, no. 3, pp. 665–685, 1993.
[52] A.Hoang, Supervised classifier performance on theUCI database[M.S. thesis], Department of Computer Science, University ofAdelaide, South Australia, Australia, 1997.
[53] P. Eklund and A. Hoang, “A comparative study of public super-vised classifier performance on the UCI database,” AustralianJournal of Intelligent Information Processing Systems, vol. 9, no.1, pp. 1–39, 2006.