Groundfish - Long-term ecological change in the Northern Gulf of Alaska
160
Long-Term Ecological Change in the Northern Gulf of Alaska Robert B. Spies (Editor) © 2006 Elsevier B.V. All rights reserved. Chapter 4 Long-term Change 4.1. Introduction Bob Spies and Tom Weingartner After surviving a harsh winter of long nights, cold, and severe storms, organisms in the Gulf of Alaska (GOA) would have depleted their energy reserves as they enter the growing season and, for most, the reproductive season. Yet, they are a part of an ecosystem poised to capture and distribute the increasing solar energy warming the upper layers of the subarctic ocean. Every year is different in the Gulf of Alaska, and the seeds of longer-term variabil- ity lie in how each year differs from the last in climate, in other natural factors, and man’s effects. To be sure, the major ecological phenomena each year are similar: late winter stratification of the upper layers of the ocean; a spring phytoplankton bloom in April–May followed by a zooplankton bloom; and predation on the bloom by larger zooplankton and forage fish, which in turn are consumed by sea birds and marine mammals. Each year is a fresh start and change, irregularly expressed over the periods of years, comes from the press of climate, disease, contaminants, predators, and competitors on populations of organisms with unique adaptations. Foraging strategies, energy storage, reproductive strategies, size, and life span provide an array of “choices” made by each species in the course of its evolution that involves multiple trade-offs. It is the play of a changing ecosystem against these “choices” minus the effects of man that ultimately determine the success and, therefore, the population trajectory and long-term change in a species. That ecological change occurs over different timescales is a truism of ecology. In this book, we devote considerable resources to changes that occur over several years to decades rather than longer periods simply because this is where we have the most data. Even on this scale, we must recognize that ecological data in the Gulf as with most other regions is particularly sparse pre-1975. The first barrier to understanding change is that we do not have the long-term data sets, and those that we have seldom encompass the scales and include the variables that are required to quantify changes, much less understand their causes. For example, the instru- mental record of physical data spans barely more than a century in the North Pacific Ocean. The longest term physical data records consist of easily measured variables, such as sea surface temperature, salinity, air pressure, temperature, and sea level. Ch04-N52960 8/22/06 11:14 AM Page 253
-
Upload
independent -
Category
Documents
-
view
3 -
download
0
Transcript of Groundfish - Long-term ecological change in the Northern Gulf of Alaska
Long-Term Ecological Change in the Northern Gulf of AlaskaRobert B. Spies (Editor)
© 2006 Elsevier B.V. All rights reserved.
Chapter 4
Long-term Change
4.1. IntroductionBob Spies and Tom Weingartner
After surviving a harsh winter of long nights, cold, and severe storms, organisms in theGulf of Alaska (GOA) would have depleted their energy reserves as they enter thegrowing season and, for most, the reproductive season. Yet, they are a part of anecosystem poised to capture and distribute the increasing solar energy warming theupper layers of the subarctic ocean.
Every year is different in the Gulf of Alaska, and the seeds of longer-term variabil-ity lie in how each year differs from the last in climate, in other natural factors, andman’s effects. To be sure, the major ecological phenomena each year are similar: latewinter stratification of the upper layers of the ocean; a spring phytoplankton bloom inApril–May followed by a zooplankton bloom; and predation on the bloom by largerzooplankton and forage fish, which in turn are consumed by sea birds and marinemammals. Each year is a fresh start and change, irregularly expressed over the periods ofyears, comes from the press of climate, disease, contaminants, predators, and competitorson populations of organisms with unique adaptations. Foraging strategies, energystorage, reproductive strategies, size, and life span provide an array of “choices” madeby each species in the course of its evolution that involves multiple trade-offs. It is the play of a changing ecosystem against these “choices” minus the effects of man that ultimately determine the success and, therefore, the population trajectory andlong-term change in a species.
That ecological change occurs over different timescales is a truism of ecology. In this book, we devote considerable resources to changes that occur over several yearsto decades rather than longer periods simply because this is where we have the mostdata. Even on this scale, we must recognize that ecological data in the Gulf as withmost other regions is particularly sparse pre-1975.
The first barrier to understanding change is that we do not have the long-term data sets,and those that we have seldom encompass the scales and include the variables that arerequired to quantify changes, much less understand their causes. For example, the instru-mental record of physical data spans barely more than a century in the North PacificOcean. The longest term physical data records consist of easily measured variables, such as sea surface temperature, salinity, air pressure, temperature, and sea level.
Ch04-N52960 8/22/06 11:14 AM Page 253
Long-term measures of other physically important variables (i.e. salinity, precipitation,nutrients, stratification, currents, and coastal wind fields) are however relatively rare.
For the biological data needed to track and understand long-term change, the situ-ation is even worse. Typically, our records consist only of catch data of commerciallyimportant species or, more rarely, population estimates, which are sometimes neededby managers. Noncommercial populations are less well studied, particularly pre-1970.The uneven treatment of biological populations in this book is to a large extent theresult of the lack of data for many populations. For example, virtually nothing is knownabout long-term changes in two of the most important components of the ecosystem,phytoplankton and benthic communities.
However, with regard to climate, the paleoecological record is replete with evidenceof changes in ecosystems coincident with climate variations. Indeed, when viewedfrom the perspective of geological time, climate, and ecosystem changes appear to bethe rule rather than the exception. Nevertheless, climate change, whether of natural or anthropogenic origin, brings with it uncertainty and the potential to upset existingeconomic and social structures. It is precisely this uncertainty that provides the impetusfor current research efforts directed at understanding how marine ecosystems functionand respond to climate variability.
The second barrier to understanding long-term changes in the Gulf of Alaska is thecomplex nonlinear structures that characterize these systems. Perturbations to these systems often yield unexpected behaviors that can affect not only the mean state of the system but, perhaps more importantly to organisms, the variance of the system (see Box 1). Examples of this abound in both the paleoclimate record and model predic-tions of the evolution of present-day climate when perturbed by the increases in green-house gases. Among the many predicted effects are increases in the frequency andmagnitude of extreme or episodic events and alterations in the annual cycle of precipita-tion and runoff. Conceivably these changes have a much greater influence on ecosystemprocesses than mean conditions might suggest. In addition, climate responses might not be uniform over the globe but may instead be accelerated (or delayed) or amplified(or damped) in one region relative to another. Another potential example is the effect thatwhaling may have had on gulf megafuana for decades (Springer et al., 2003).
Given these difficulties, scientists have often tried to establish a statistical correlationbetween physical and biological variables. Although occasionally successful, thisapproach has potential pitfalls. In particular, the space and timescales of physical andbiological variables are different from one another and the relation between a physicalchange and a biological response might be indirect, nonlinear, and involve severalother (unmeasured and also varying) system components. An additional problem isthat the limited observations do not allow unequivocal conclusions to be made withrespect to physically induced causes of biological change, especially when consideringdecadal (10–50 years) and longer timescales. In such cases, there are too few representations of the covariability to permit statistically discriminating real causal
254 Long-Term Ecological Change in the Northern Gulf of Alaska
Ch04-N52960 8/22/06 11:14 AM Page 254
Long-term Change 255
BOX 1: NONLINEAR AND CHAOTIC RELATIONSHIPS by Robert Spies
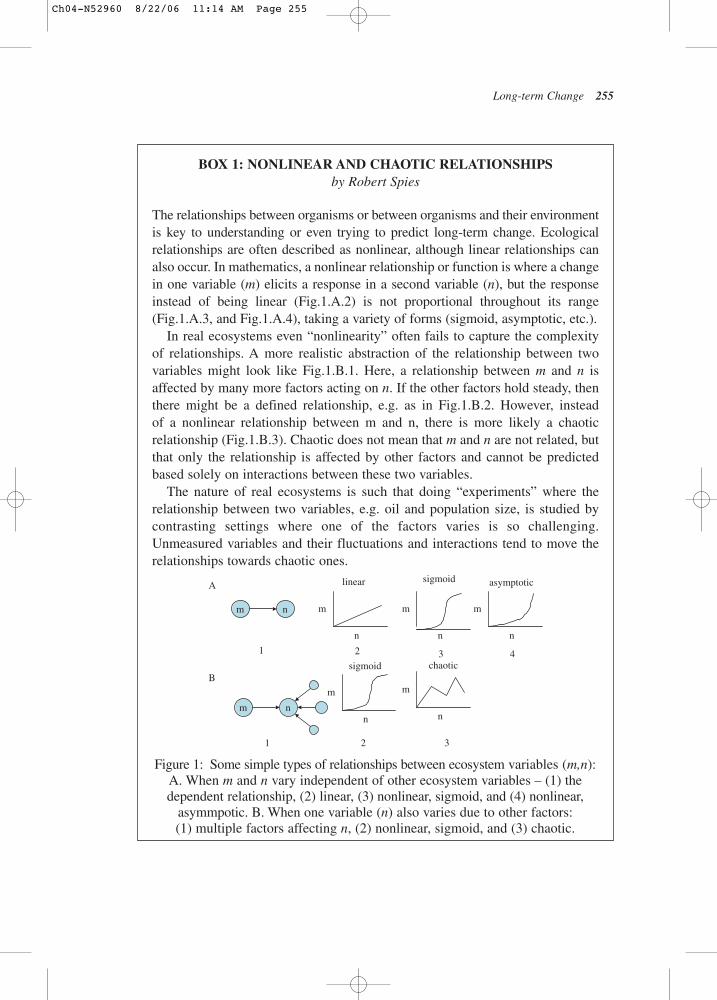
The relationships between organisms or between organisms and their environmentis key to understanding or even trying to predict long-term change. Ecologicalrelationships are often described as nonlinear, although linear relationships canalso occur. In mathematics, a nonlinear relationship or function is where a changein one variable (m) elicits a response in a second variable (n), but the responseinstead of being linear (Fig.1.A.2) is not proportional throughout its range (Fig.1.A.3, and Fig.1.A.4), taking a variety of forms (sigmoid, asymptotic, etc.).
In real ecosystems even “nonlinearity” often fails to capture the complexity of relationships. A more realistic abstraction of the relationship between twovariables might look like Fig.1.B.1. Here, a relationship between m and n isaffected by many more factors acting on n. If the other factors hold steady, thenthere might be a defined relationship, e.g. as in Fig.1.B.2. However, instead of a nonlinear relationship between m and n, there is more likely a chaotic relationship (Fig.1.B.3). Chaotic does not mean that m and n are not related, butthat only the relationship is affected by other factors and cannot be predictedbased solely on interactions between these two variables.
The nature of real ecosystems is such that doing “experiments” where the relationship between two variables, e.g. oil and population size, is studied bycontrasting settings where one of the factors varies is so challenging.Unmeasured variables and their fluctuations and interactions tend to move therelationships towards chaotic ones.
Figure 1: Some simple types of relationships between ecosystem variables (m,n):A. When m and n vary independent of other ecosystem variables – (1) thedependent relationship, (2) linear, (3) nonlinear, sigmoid, and (4) nonlinear,
asymmpotic. B. When one variable (n) also varies due to other factors: (1) multiple factors affecting n, (2) nonlinear, sigmoid, and (3) chaotic.
m n
m n
m
n
m
n
m
n
m
n
m
n
A
B
1 2 43
1 2 3
linear sigmoid asymptotic
sigmoid chaotic
Ch04-N52960 8/22/06 11:14 AM Page 255
relationships from apparent correlations, trends, or “state” shifts that can emergebetween two random time series (e.g. Wunsch, 1999). Indeed, long-period climatefluctuations represent the “gray area of climate variability” (Karl, 1988), which arepoorly described by short instrumental records.
In addition, factors that correlate under some state conditions may not correlate inanother state when the controlling factors may shift (see Box 2).
There are, however, alternative approaches to the constraints imposed by the shortobservational record. One technique is to examine proxy data, such as obtained frompaleoenvironmental studies. In some cases, these provide a reasonable extension of theinstrumental record for many hundreds of years into the past. An alternate approach isto use numerical models based upon realistic approximations to the physics and biology.The observations are then used in conjunction with models to evaluate model per-formance and/or to constrain model predictions and hindcasts. While both approaches
256 Long-Term Ecological Change in the Northern Gulf of Alaska
BOX 2: CORRELATION OR CAUSE AND EFFECT? by Robert Spies
The history of fisheries science abounds in correlations between various environ-mental factors and fish populations. Almost inevitably the correlations work for awhile but then dissolve, leaving scientists to conclude that the link was either notcausative or that there are new factors that have become the determinants of thepopulation trajectory.There are several examples in the Gulf of Alaska where there have been obser-vations supporting hypothesized causes of ecological changes that appeared tohave changed as the ecosystem entered a new phase or state. We present two here:1. Upwelling and pink salmon production
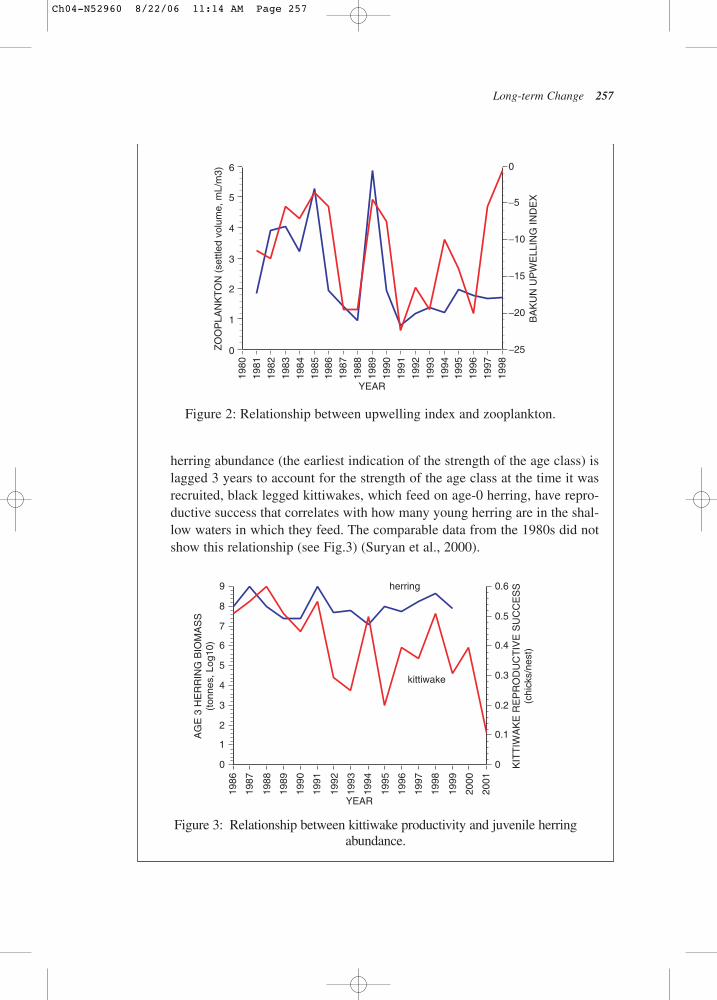
There was a relationship between strength of the Bakkun upwelling indexreported near the Hinchinbrook Entrance to Prince William Sound (a proxymeasure for onshore flow) and the springtime standing stock of zooplanktonmeasured by PWSAC at the AFK hatchery each spring (April–May average)as settled volume of zooplankton (Fig.1.A.2). This relationship held in the1980s but “dissolved” in the 1990s, despite the fact that the range inupwelling indices for April–May did not change in the 1990s. What did changewas the zooplankton – only about half the volume in comparable samples from1991–1998. The number of pink salmon adults coming back to spawn was inturn correlated with the AFK zooplankton (r2 > 0.5)(Cooney et al., 2001).
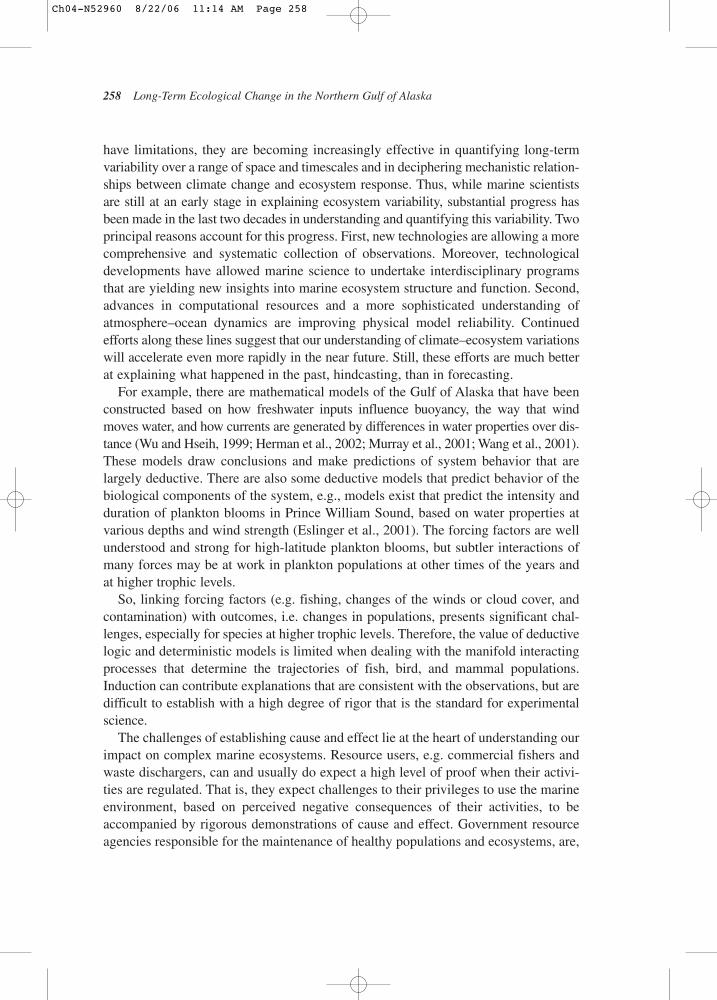
2. A relationship between young-of-the-year Pacific herring abundance and kittiwake productivityThere was a strong relationship in the 1990s (kittiwake reproductive success(lagged 2 year) vs. log of age-3 herring abundance. That is, if age-3 Pacifc
Ch04-N52960 8/22/06 11:14 AM Page 256
Long-term Change 257
herring abundance (the earliest indication of the strength of the age class) islagged 3 years to account for the strength of the age class at the time it wasrecruited, black legged kittiwakes, which feed on age-0 herring, have repro-ductive success that correlates with how many young herring are in the shal-low waters in which they feed. The comparable data from the 1980s did notshow this relationship (see Fig.3) (Suryan et al., 2000).
Figure 2: Relationship between upwelling index and zooplankton.
0
1
2
3
4
5
6
−25
−20
−15
−10
−5
0
1980
1981
1982
1983
1984
1985
1986
1987
1988
1989
1990
1991
1992
1993
1994
1995
1996
1997
1998
ZO
OP
LAN
KT
ON
(se
ttled
vol
ume,
mL/
m3)
BA
KU
N U
PW
ELL
ING
IND
EX
YEAR
Figure 3: Relationship between kittiwake productivity and juvenile herringabundance.
0
1
2
3
4
5
6
7
8
9
0
0.1
0.2
0.3
0.4
0.5
0.6
1986
1987
1988
1989
1990
1991
1992
1993
1994
1995
1996
1997
1998
1999
2000
2001
AG
E 3
HE
RR
ING
BIO
MA
SS
(ton
nes,
Log
10)
KIT
TIW
AK
E R
EP
RO
DU
CT
IVE
SU
CC
ES
S(c
hick
s/ne
st)
YEAR
herring
kittiwake
Ch04-N52960 8/22/06 11:14 AM Page 257
have limitations, they are becoming increasingly effective in quantifying long-termvariability over a range of space and timescales and in deciphering mechanistic relation-ships between climate change and ecosystem response. Thus, while marine scientistsare still at an early stage in explaining ecosystem variability, substantial progress hasbeen made in the last two decades in understanding and quantifying this variability. Twoprincipal reasons account for this progress. First, new technologies are allowing a morecomprehensive and systematic collection of observations. Moreover, technologicaldevelopments have allowed marine science to undertake interdisciplinary programsthat are yielding new insights into marine ecosystem structure and function. Second,advances in computational resources and a more sophisticated understanding ofatmosphere–ocean dynamics are improving physical model reliability. Continuedefforts along these lines suggest that our understanding of climate–ecosystem variationswill accelerate even more rapidly in the near future. Still, these efforts are much betterat explaining what happened in the past, hindcasting, than in forecasting.
For example, there are mathematical models of the Gulf of Alaska that have beenconstructed based on how freshwater inputs influence buoyancy, the way that windmoves water, and how currents are generated by differences in water properties over dis-tance (Wu and Hseih, 1999; Herman et al., 2002; Murray et al., 2001; Wang et al., 2001).These models draw conclusions and make predictions of system behavior that arelargely deductive. There are also some deductive models that predict behavior of thebiological components of the system, e.g., models exist that predict the intensity andduration of plankton blooms in Prince William Sound, based on water properties atvarious depths and wind strength (Eslinger et al., 2001). The forcing factors are wellunderstood and strong for high-latitude plankton blooms, but subtler interactions ofmany forces may be at work in plankton populations at other times of the years andat higher trophic levels.
So, linking forcing factors (e.g. fishing, changes of the winds or cloud cover, andcontamination) with outcomes, i.e. changes in populations, presents significant chal-lenges, especially for species at higher trophic levels. Therefore, the value of deductivelogic and deterministic models is limited when dealing with the manifold interactingprocesses that determine the trajectories of fish, bird, and mammal populations.Induction can contribute explanations that are consistent with the observations, but aredifficult to establish with a high degree of rigor that is the standard for experimentalscience.
The challenges of establishing cause and effect lie at the heart of understanding ourimpact on complex marine ecosystems. Resource users, e.g. commercial fishers andwaste dischargers, can and usually do expect a high level of proof when their activi-ties are regulated. That is, they expect challenges to their privileges to use the marineenvironment, based on perceived negative consequences of their activities, to beaccompanied by rigorous demonstrations of cause and effect. Government resourceagencies responsible for the maintenance of healthy populations and ecosystems, are,
258 Long-Term Ecological Change in the Northern Gulf of Alaska
Ch04-N52960 8/22/06 11:14 AM Page 258

by contrast, usually much more conservative in protecting the ecosystem in the faceof uncertainty and prefer an approach that considers the weight of evidence, the precautionary approach. The tension revolving around cause and effect is crucialbackground for understanding the conflicting claims about the effects of the ExxonValdez oil spill chapter 5 and other resource management issues in the Gulf of Alaska.
Change is a fundamental ecological reality in the Gulf of Alaska that is neither constantin its rate nor predictable with our present understanding. Here, in Chapter 4 we examineecosystem changes longer than 1 year. In Chapter 2, a foundation for longer-termchanges was laid by exploring strongly interrelated seasonal physical, chemical, and bio-logical cycles and survival strategies for some major vertebrate species. Chapter 2described root forcing mechanisms of long-term change, both natural and anthropogenic.This leads us to consider here what the long-term changes have been in the Gulf ofAlaska and what may have caused them.
In the first part of Chapter 4 records of long-term physical, chemical, and planktonfluctuations are presented, and the potential causes for change are discussed. This isfollowed by a series of case histories of the species first introduced in Chapter 2. Thepossible causes for their population changes are then discussed. This section providesthe foundation for Chapter 5, which synthesizes the studies on the Exxon Valdez oilspill, and Chapter 6 that discusses long-term ecosystem change holistically.
4.2. Atmosphere and OceanTom Weingartner
4.2.1. Introduction
This section outlines some of the substantial variability observed over recent decades inthe physical environment of the Gulf of Alaska. Variations have been detected in winds,surface heat fluxes and runoff, water temperature and salinity, mixed-layer depth, nutrientsupply, and circulation properties. Most of the data forming the basis of this presen-tation have been collected on the northwest Gulf of Alaska shelf and along “Line P,”which extends westward from the British Columbian shelf to 50°N, 145°W in thesouthern Gulf of Alaska. Line P, which has been sampled by Canadian oceanogra-phers since the mid-1950s, spans the bifurcation zone of the North Pacific Current asit approaches the west coast of North America (see Section 2.2.1). The physics of thebifurcation region and the shelf differ considerably from each another, however, so the spatial extent over which observed changes along Line P are representative ofchanges in the central basin is not readily apparent. We, therefore, discuss each regionseparately. Nevertheless, there are a number of consistent trends observed in both
Long-term Change 259
Ch04-N52960 8/22/06 11:14 AM Page 259
areas, suggesting that these changes might be spatially extensive, although the magnitudeof the changes might vary in different portions of the shelf and basin.
4.2.2. Gulf of Alaska Shelf
WindsStabeno et al. (2004) analyzed interannual variability in shelf winds, produced by theNational Oceanic and Atmospheric Administration–National Center for EnvironmentalPrediction (NOAA–NCEP) weather forecast models. Although the modeled winds arelikely biased because of the influence of the coastal mountain ranges (Section 2.2.1),they are the primary source of long-term wind variations for this shelf. Stabeno et al.(2004) find that most of the variability is on the interannual timescale (rather than theinterdecadal or intradecadal scales discussed in Section 3.2). They do suggest,however, that both anomalously low winter wind speeds (important for vertical mixing)and along-shore wind stress (important for coastal downwelling and along-shore shelftransport) prevailed from the mid-1960s to mid-1970s and above average values fromthe late 1970s through the 1980s. Although these differences appear to coincide withthe mid-1970s regime shift, there is no significant correlation between wind variationsin the northern Gulf and the Pacific Decadal Oscillation (PDO) index (Royer, 2005).They did find a weak (but significant) correlation between eastern Gulf winds and thePDO, however, with a positive PDO index (warm-phase) associated with strongerthan normal downwelling-favorable wind stress. Stronger downwelling in the easternGulf would tend to strengthen flow in the Alaska Coastal Current (ACC) in the northernGulf, because the coastal flow at a particular location responds to the integrated responseto both the local and the upstream along-shelf wind field.
Stabeno et al. (2004) also found substantial year-to-year variability in the frequencyand strength of summer wind-mixing events and upwelling-favorable winds, withthese variations being largest over the shelves in the southwest and southeast Gulf ofAlaska. This is a potentially important finding because upwelling or wind-mixingevents entrain nutrient-rich subsurface waters into the nutrient-depleted surface layer.Upwelling events are intermittent so year-to-year variations in event frequency, duration, and strength would likely yield similar variations in the total summer primaryproduction.
Variability in Surface Heating and Cooling and Shelf TemperaturesThe temperature of the ocean at a given location is controlled by heat exchange withthe atmosphere, mixing with waters of different temperatures, and the advection ofheat into or out of a region by ocean currents. In most regions of the ocean, includingthe Gulf of Alaska shelf, air–sea heat exchange exerts the primary control over upper
260 Long-Term Ecological Change in the Northern Gulf of Alaska
Ch04-N52960 8/22/06 11:14 AM Page 260
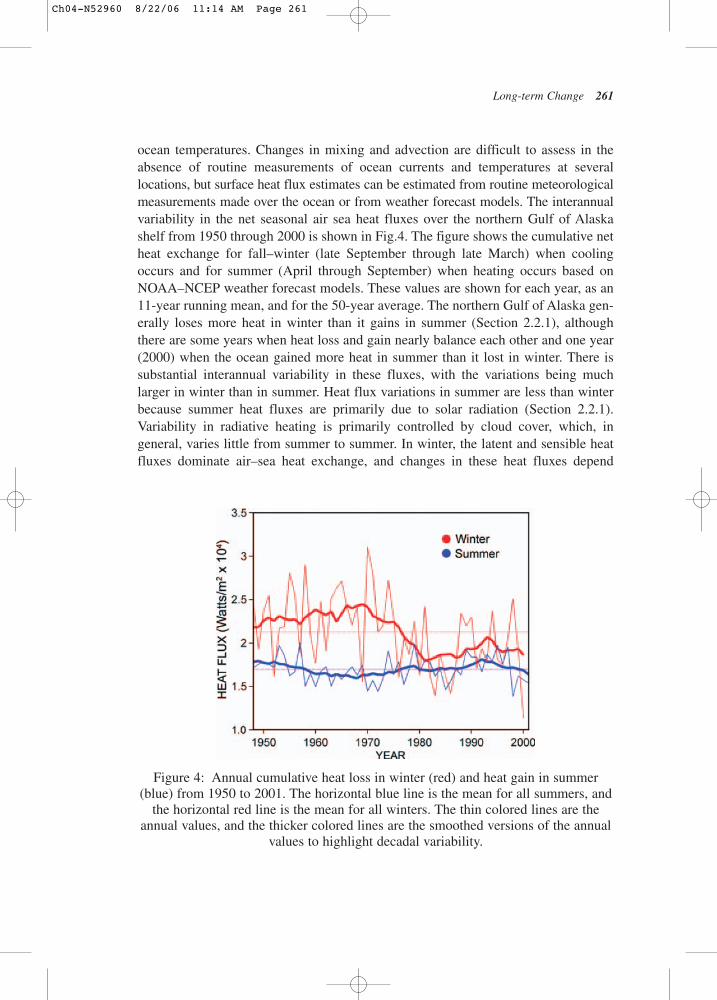
ocean temperatures. Changes in mixing and advection are difficult to assess in theabsence of routine measurements of ocean currents and temperatures at several locations, but surface heat flux estimates can be estimated from routine meteorologicalmeasurements made over the ocean or from weather forecast models. The interannualvariability in the net seasonal air sea heat fluxes over the northern Gulf of Alaska shelf from 1950 through 2000 is shown in Fig.4. The figure shows the cumulative netheat exchange for fall–winter (late September through late March) when coolingoccurs and for summer (April through September) when heating occurs based onNOAA–NCEP weather forecast models. These values are shown for each year, as an11-year running mean, and for the 50-year average. The northern Gulf of Alaska gen-erally loses more heat in winter than it gains in summer (Section 2.2.1), althoughthere are some years when heat loss and gain nearly balance each other and one year(2000) when the ocean gained more heat in summer than it lost in winter. There issubstantial interannual variability in these fluxes, with the variations being muchlarger in winter than in summer. Heat flux variations in summer are less than winterbecause summer heat fluxes are primarily due to solar radiation (Section 2.2.1).Variability in radiative heating is primarily controlled by cloud cover, which, in general, varies little from summer to summer. In winter, the latent and sensible heatfluxes dominate air–sea heat exchange, and changes in these heat fluxes depend
Long-term Change 261
Figure 4: Annual cumulative heat loss in winter (red) and heat gain in summer(blue) from 1950 to 2001. The horizontal blue line is the mean for all summers, and
the horizontal red line is the mean for all winters. The thin colored lines are theannual values, and the thicker colored lines are the smoothed versions of the annual
values to highlight decadal variability.
Ch04-N52960 8/22/06 11:14 AM Page 261
on wind speed and the air–sea temperature difference. Consequently, winter heat loss primarily determines upper ocean water temperatures in spring and is likely to affectthe metabolic rates of many marine organisms, including zooplankton and immaturefish at a critical phase in their life history. For illustrative purposes, the winter cool-ing rates in Fig.4 can be expressed in terms of a corresponding temperature changeover the upper 100 m of the shelf water column during the cooling season. On average,this results in a temperature change of −4.4°C, with the range being −6.5°C (1970) to−2.5°C (2000). For summer, the mean temperature increase is 3.8oC, with the rangebeing 4.2°C (1958) and 2.8°C (1998).
Winter cooling rates decreased substantially (~20%) in the mid-1970s coincidentwith the shift of the PDO from the cold to the warm phase and the intensification of the Aleutian Low. Prior to the regime shift winter cooling rates would have induceda 5°C decrease over the upper 100 m of the ocean versus a 3.8°C decrease since then.These changes are consistent with a warming of nearly 1.0°C in the upper 100 m ofthe water column since 1970 based on temperature observations made at hydro-graphic station GAK 1 near Seward (Royer, 2005). He found a temperature increase ofsimilar magnitude between 100–200 m over this same period. Hence, the warmingover the whole water column exceeds that due to air–sea heat exchange alone and suggests that oceanic transport processes have also contributed to the warming trend.The most likely source of this oceanic warming is the alongshore transport of heat fromsoutherly latitudes by the ACC on the shelf and by the Alaska Current along the continental slope. Indeed this is consistent with the findings of Freeland and Whitney(2000) of a similar increase in upper ocean temperatures over the British Columbianshelf during this period. The warming trend, along with suggestions of increasedalong-shelf transport due to the winds and changes in runoff (discussed next) suggestthat there has been an increase in along-shore mass transport over the shelf.
Royer’s (2005) analysis of the GAK 1 record also shows that there are substantialENSO-induced temperature variations on the northern Gulf of Alaska shelf. ObservedENSO-induced temperature changes at GAK 1 range between 0.5 and 1.7°C andoccur in winter some 7–10 months after the equatorial onset of ENSO. However,ENSO-associated temperature perturbations are generally short-lived on the Gulf ofAlaska shelf, usually appearing in early winter and disappearing by late spring.Although brief in duration, the timing of these perturbations could be of biologicalsignificance because they occur in spring when during the early life history of manyinvertebrates and fish. Interestingly, Royer (2005) finds that the ENSO response is statistically significant at depths between 50 and 150 m, but not at shallower depths.Conceivably the lack of a significant relationship between the equatorial ENSO signaland upper ocean temperatures on the Gulf of Alaska shelf occurs because randomlocal variability in air–sea heat fluxes blur the ENSO signal in the upper ocean. The presence of the ENSO-temperature signal at depth does suggest that oceanadvection is important, however. Indeed, Royer (2005) argues that ENSO warming in
262 Long-Term Ecological Change in the Northern Gulf of Alaska
Ch04-N52960 8/22/06 11:14 AM Page 262
the Gulf of Alaska is primarily associated with oceanic processes that displace thelarge-scale coastal temperature gradient northward into the Gulf of Alaska. This inter-pretation is consistent with observations made during the 1997–1998 ENSO event,which showed anomalously large increases in the flow along the Alaskan continentalslope (Strub and James, 2002), within the ACC (Weingartner et al., 2005), and in thenorthward flux of heat along the British Columbian continental slope (Freeland,2002).
Royer (2005) also finds that the PDO (positive or warm phase is associated withabove normal temperatures) is significantly and uniformly correlated with monthlywater temperature anomalies over the entire shelf water column, although the PDOsignal accounts for only about 25% of the temperature variability. Nevertheless, hisresult indicates that the PDO is a useful indicator of long-period, deep temperaturevariations for the northern shelf. Given the uniform response of the shelf watercolumn to the PDO, it seems probable that both the atmosphere and the ocean influencethe thermal structure on the shelf. Since the PDO index reflects winter, sea-surface temperature variations over the winter mixed layer, which is typically 150 m throughoutthe northern North Pacific, these anomalies could be advected onto the shelf by oceancirculation processes. Air–sea heat exchange is also important however, because wintercooling tends to decrease during the warm phase of the PDO and increase during thecold phase.
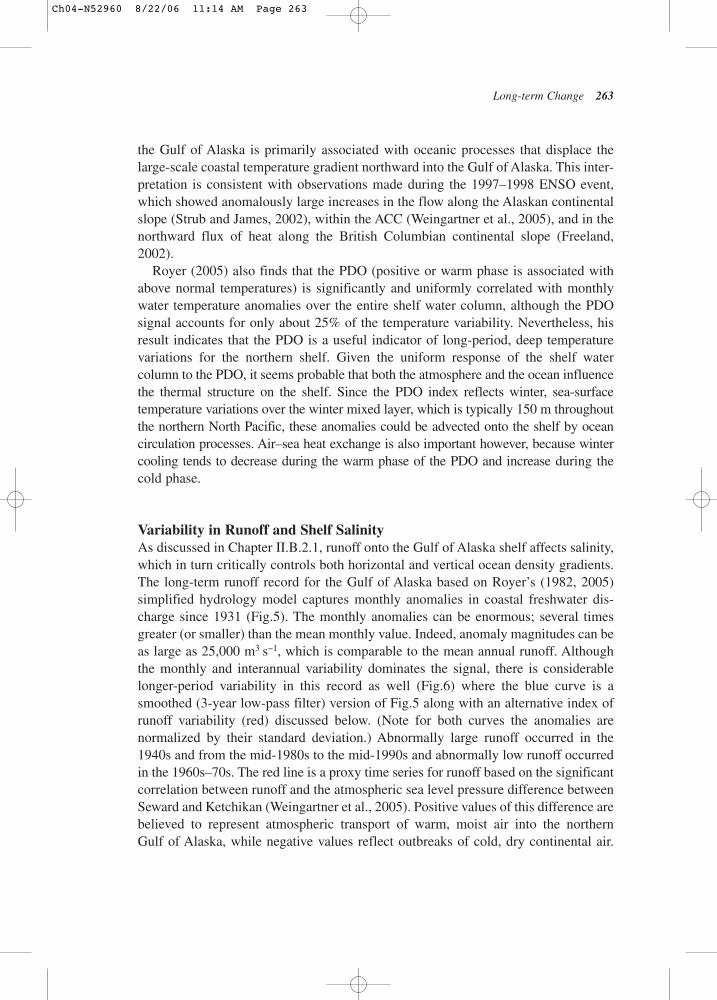
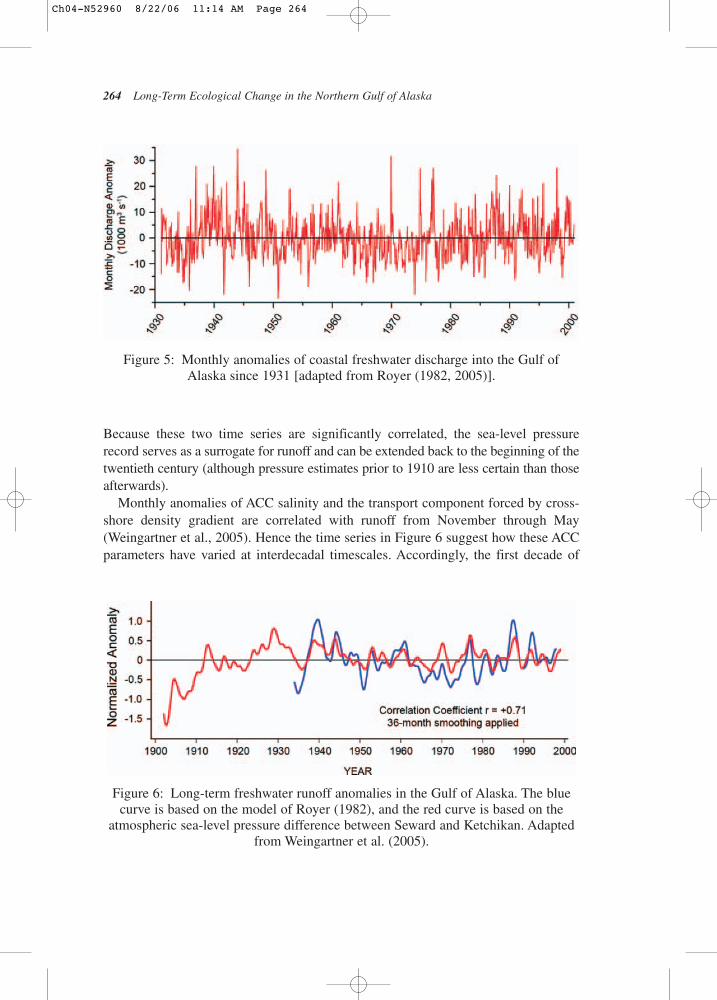
Variability in Runoff and Shelf SalinityAs discussed in Chapter II.B.2.1, runoff onto the Gulf of Alaska shelf affects salinity,which in turn critically controls both horizontal and vertical ocean density gradients.The long-term runoff record for the Gulf of Alaska based on Royer’s (1982, 2005)simplified hydrology model captures monthly anomalies in coastal freshwater dis-charge since 1931 (Fig.5). The monthly anomalies can be enormous; several timesgreater (or smaller) than the mean monthly value. Indeed, anomaly magnitudes can beas large as 25,000 m3 s−1, which is comparable to the mean annual runoff. Althoughthe monthly and interannual variability dominates the signal, there is considerablelonger-period variability in this record as well (Fig.6) where the blue curve is asmoothed (3-year low-pass filter) version of Fig.5 along with an alternative index ofrunoff variability (red) discussed below. (Note for both curves the anomalies are normalized by their standard deviation.) Abnormally large runoff occurred in the1940s and from the mid-1980s to the mid-1990s and abnormally low runoff occurredin the 1960s–70s. The red line is a proxy time series for runoff based on the significantcorrelation between runoff and the atmospheric sea level pressure difference betweenSeward and Ketchikan (Weingartner et al., 2005). Positive values of this difference arebelieved to represent atmospheric transport of warm, moist air into the northernGulf of Alaska, while negative values reflect outbreaks of cold, dry continental air.
Long-term Change 263
Ch04-N52960 8/22/06 11:14 AM Page 263
Because these two time series are significantly correlated, the sea-level pressurerecord serves as a surrogate for runoff and can be extended back to the beginning of thetwentieth century (although pressure estimates prior to 1910 are less certain than thoseafterwards).
Monthly anomalies of ACC salinity and the transport component forced by cross-shore density gradient are correlated with runoff from November through May(Weingartner et al., 2005). Hence the time series in Figure 6 suggest how these ACCparameters have varied at interdecadal timescales. Accordingly, the first decade of
264 Long-Term Ecological Change in the Northern Gulf of Alaska
Figure 6: Long-term freshwater runoff anomalies in the Gulf of Alaska. The bluecurve is based on the model of Royer (1982), and the red curve is based on the
atmospheric sea-level pressure difference between Seward and Ketchikan. Adaptedfrom Weingartner et al. (2005).
Figure 5: Monthly anomalies of coastal freshwater discharge into the Gulf ofAlaska since 1931 [adapted from Royer (1982, 2005)].
Ch04-N52960 8/22/06 11:14 AM Page 264
the twentieth century and the period from 1960 to mid-1975 were more saline and hadweaker ACC transport than the period from 1920 through 1945 and the 1980s. TheGAK 1 record indicates a salinity decrease of about.07 in the upper 100 m since 1970,which is consistent with the increase in runoff over the same time period (Royer,2005). The implied increase in ACC transport from 1970 through the mid-1990s is alsoconsistent with the previous discussion that the warming trend observed at GAK 1since 1970 must have involved an increase in along-shelf transport of heat into thenorthern Gulf of Alaska. Although direct measurements of mixed-layer depth varia-tions are not available for the northern Gulf of Alaska shelf, the warming and fresh-ening trend in the upper ocean reported by Royer (2005) also imply that winter shelfstratification is strengthening. This tendency appears to be Gulfwide as similar trendshave been reported for the British Columbian shelf and over the southern portion ofthe basin by Freeland and Whitney (2000).
Although changes in runoff, upper ocean salinities, and transport of the ACC seemconsistent with the “regime shift” change in the PDO from the cold to the warm phasein the mid-1970s, these variables are only weakly correlated with the PDO index(Weingartner et al., 2005; Royer, 2005) as is the correlation between ENSO and salinity(Royer, 2005). It is not entirely clear why this is the case, although Dettinger et al.(2001) find that, while precipitation and river discharge increase during the PDOwarm phase and El-Niños over south central Alaska, these variables tend to decreaseover the Pacific Northwest and British Columbia. Since the salinity and ACC transportin the northern Gulf are a consequence of runoff along the entire coast, the spatiallyout-of-phase patterns in runoff between the northern Gulf of Alaska and the PacificNorthwest would tend to degrade the correlation between salinity and the PDO andENSO climate indices.
There are occasions, however, when ENSO-related salinity affects can be substantial.The best-documented example of this in the northern Gulf of Alaska is the compari-son between the El Nino winter of 1997–1998 and the La Nino winter of 1998–1999(Weingartner et al., 2002, 2005). March and April shelf temperatures over the upper100 m of the water column were nearly 2.0°C greater and salinities were about 0.3lower in 1998 than for the comparable period in 1999. These changes were consistentwith a 30% reduction in atmosphere–ocean heat loss during the winter of 1997–1998compared to 1998–1999 and anomalously large late summer–early fall discharges in the Fraser River (British Columbia) and Columbia River (Oregon) and winterfreshwater discharge into the Gulf of Alaska. The effects of the increased runoff in 1997–1998 were further enhanced by unusually strong downwelling-favorablewind stress in the northeastern Gulf of Alaska. In aggregate these anomalies resultedin the density-driven component of ACC transport in 1998 being double that of 1999.The increased transport and the above normal temperatures over the British Columbianshelf in 1997–1998 imply that oceanic heat advection was also greater in 1997–1998than in 1998–1999 and contributed to the ocean temperature differences between
Long-term Change 265
Ch04-N52960 8/22/06 11:14 AM Page 265
these two winters. However, the contribution of ocean heating to the observed warm-ing has not been evaluated yet.
The runoff differences between these years were also accompanied by an earlieronset of stratification in spring (Weingartner et al., 2005) and lower nitrate concentra-tions over the upper ocean (Childers et al., 2005) in 1998 compared to 1999. The largecoastal freshwater influx was the primary cause of the early onset of stratification in 1998,which occurred nearly a month earlier than in 1999. The low surface nutrient concen-trations are consistent with the increased runoff, although larger-scale affects mightalso have been operating since surface nitrate concentrations were also diminishedover the northern North Pacific (Goes et al., 2001) and the southern Gulf of Alaska(Freeland and Whitney, 2000).
The difference in the timing of early spring stratification between these two yearsprovides a hint of the complexities in the development of stratification and the springbloom on the inner portion of the Gulf of Alaska shelf. Springtime phytoplanktonblooms can begin in the sheltered waters of Prince William Sound in late March orApril and shortly thereafter in the ACC. In contrast, the spring bloom on the outershelf develops about mid-May. As discussed by Weingartner et al. (2005), stratifica-tion does not develop uniformly in space or time over the Gulf of Alaska shelf becausestratification mechanisms on the outer shelf are different from those within the ACC(and Prince William Sound). Seaward of the ACC, upper-ocean warming is primarilyresponsible for initiating stratification in spring and this is governed by wind-mixingand solar heating. In contrast, stratification inshore depends upon three-dimensionalcirculation and mixing processes associated with freshwater dispersal and winds.Many variables contribute to inner-shelf stratification including the fraction of winterprecipitation delivered as snow and rain, the timing and rate of spring snowmelt, and the wind velocity. The relevant timescales range from a few days (storm events)to the seasonal or longer, with the longer scales associated with advection of freshwaterby the ACC from distant upstream regions. Given the number of parameters involved,large interannual variations in the onset of stratification on the inner shelf areexpected. This also implies that the application of Gargett’s (1997) optimal stabilitywindow hypothesis to the ACC is far more complicated than in regions where verticalheat fluxes primarily control upper-ocean stability.
The stratification differences between 1998 and 1999 also suggest how climatewarming might affect the Gulf of Alaska ecosystem. Projections of future climateresponse to increased greenhouse gas concentrations (IPCC, 2001) indicate anincrease in atmospheric warming and moisture over much of the globe, including theGulf of Alaska. This implies greater winter rainfall and runoff but less snow accumu-lation in the coastal mountain ranges. Consequently, an earlier onset in spring melt isto be expected. If wind mixing does not increase proportionately, then stratificationand the spring bloom may occur earlier on the inner shelf than it does presently.Conceivably, these changes might lengthen the time lag between bloom development
266 Long-Term Ecological Change in the Northern Gulf of Alaska
Ch04-N52960 8/22/06 11:14 AM Page 266
on the inner shelf and the outer shelf, which could affect the community structure andrecruitment success of zooplankton and fish over these different portions of the shelf.The IPCC (2001) projections also indicate larger year-to-year variations in precipita-tion so that interannual variability in the timing of the spring bloom on the inner shelfmight also increase.
4.2.3. Gulf of Alaska Basin
Based upon data collected from 1968 to 1990, Lagerloef (1995) and Hunt (1996) con-cluded that the Alaska gyre underwent a large transition coincident with the regimeshift when the PDO switched from the cold phase to the warm phase. They show thatduring the cold phase (prior to the mid-1970s), the center of the Alaska gyre was shiftednortheastward, the gyre circulation was stronger, and cooler sea surface temperaturesprevailed over the central Gulf compared to after the transition. The transition to thewarm-phase PDO mode led to a west-southwest displacement of the gyre center anda reduction in upwelling and gyre transport in the central and eastern gulf. There aresome indications that on ENSO timescales the Alaska gyre and the California Currentvary out-of-phase (Chelton and Davis, 1982; Tabata, 1991; Kelly et al., 1993) suchthat more water from the North Pacific Current enters the Gulf of Alaska when thegyre strengthens, while more of it is deflected southward when the gyre weakens.Under such conditions, Van Scoy and Druffel (1993) find that subpolar waters carriedby the North Pacific Current leak into the California Current.
As previously noted, Polovina et al. (1995) concluded that the regime shift wasaccompanied by changes in mixed-layer depth. Freeland et al. (1997), Freeland andWhitney (2000), and Whitney and Freeland (1997) expanded on Polovina et al.’s workby closely examining changes in mixed-layer depth and properties along Line P. Theyfind that the winter mixed-layer depth has decreased since 1956 at a rate of about 47 m/century and suggested that there was a possible step-change to a decrease inwinter mixed-layer depth coincident with the regime shift. However, they found thatthe shallowing of the winter mixed-layer was related to an increase in upper oceanstratification brought about by both a freshening and warming of the surface layers.Superposed on this long-term trend, are ENSO-related variations that corroborate themodel results of Alexander et al. (2002). These workers find that shallower, wintermixed-layers are associated with El Niños, while deeper mixed layers occur during La Niñas. The shoaling mixed-layer observed along Line P decreases the winter re-supply of nitrate and silicate to the euphotic zone (Whitney et al., 1998; Whitney andFreeland, 1999). Although the decrease does not appear to affect the magnitude of thespring bloom presently, it increases the likelihood of nutrient exhaustion throughsummer. Indeed, this decrease was so severe during the 1998 El Niño event that it led tothe first ever report of nitrate depletion in the surface waters if the Gulf of Alaska basin.
Long-term Change 267
Ch04-N52960 8/22/06 11:14 AM Page 267
4.3. ZooplanktonTed Cooney
Records from the Canadian Weather Ship program at Ocean Station P(OSP)(1956–1980; Fulton, 1983) located at the southern margin of the Gulf of Alaska provide a starting point for documenting and analyzing long-term patterns of changein zooplankton stocks in the Gulf of Alaska. Frost (1983) analyzed these records(approximately 2500 samples; vertical tows in the upper 150 m) and discovered aweak, positive statistical relationship between the annual average (February to August)standing stock of zooplankton and surface water salinity. A similar relationship hadbeen reported previously by Wickett (1967), who hypothesized that increased salinityshould accompany nutrient upwelling, higher primary productivity, and greater zoo-plankton growth. Frost was able to examine that possibility by looking for coherencebetween zooplankton growth (extracted from a portion of the OSP time series) and estimates of primary production provided by Parslow (1981). Oddly, Frost found no relationship between these data sets, suggesting something other than bottom-upforcing of the production cycle was responsible for driving the interannual patterns inzooplankton abundance recorded at OSP. Because there were no comparable observa-tions for other locations in the Gulf of Alaska, there is no way to determine just how rep-resentative the OSP observations were of the broader Gulf between 1956 and 1980.
Brodeur and Ware (1992) used data collected from the Joint U.S.–Canadian HighSeas survey, 1956–1962, and from later Japanese surveys (R/V Oshoro maru ofHokkaido University; 1981–1986, 1988–1990) of the Gulf of Alaska to reconstructthe spatial distribution and stock size of net zooplankton caught in vertical tows from150 m to the surface during these two different decades. The results of this analysisare dramatic; zooplankton was distributed more broadly and was more than twice asabundant than in the 1980s. Also in the 1980s, the biomass of zooplankton was foundto be greatest around the “edge” of the Gulf – a kind of bathtub ring – rather than in theinterior of the region as was the case in the 1950s and early 60s (Fig.7). The authorssuggested two reasons for these patterns: (1) increased center gyre wind-forcedupwelling (demonstrated for the 1980s) generated more nutrients (including iron) fromdeep water and thus increased the overall productivity of plankton and (2) predationon primary producers by zooplankton was enhanced by deeper vertical mixing duringthe 1980s when the Aleutian Low was stronger, enabling greater production of graz-ers (Parsons, 1988). In addition, Miller et al. (1992) reported that the size of individ-ual species tended to be smaller in the interior of the oceanic realm rather than at theedges of the system. Neocalanus plumchrus and N. flemingeri were often 25–80%less massive at OSP than when encountered along the shelf edge, presumably a responseto enhanced feeding opportunities nearer the continental margin.
Brodeur and Ware (1992) also looked at the OSP zooplankton time series and plot-ted the average biomass between June 15 and July 31 each year from 1957 to 1980;
268 Long-Term Ecological Change in the Northern Gulf of Alaska
Ch04-N52960 8/22/06 11:14 AM Page 268
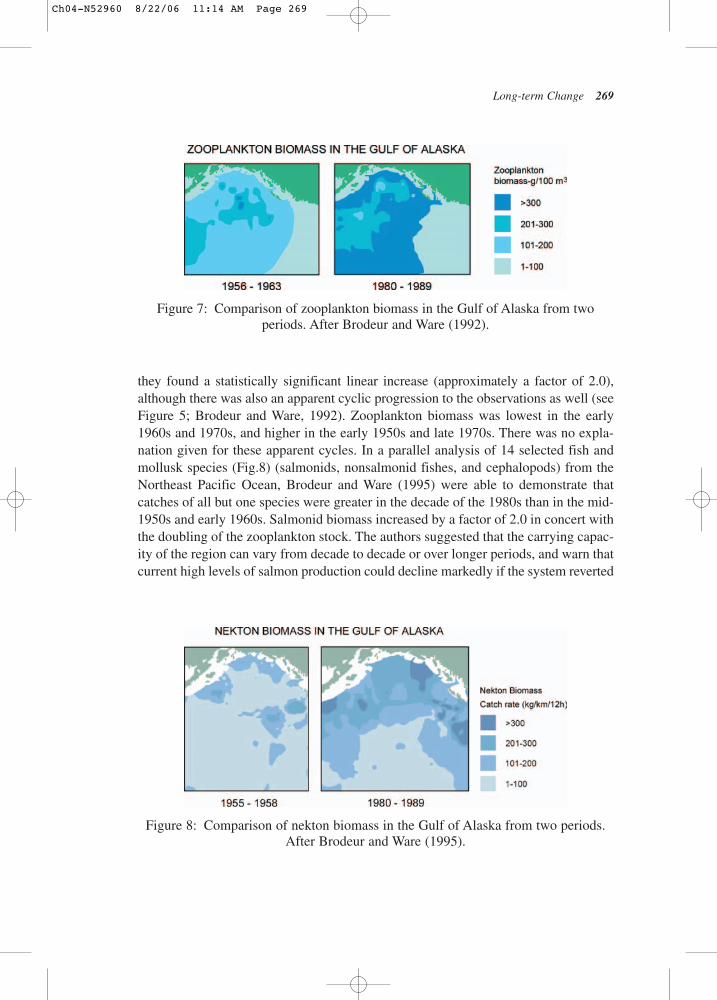
they found a statistically significant linear increase (approximately a factor of 2.0),although there was also an apparent cyclic progression to the observations as well (seeFigure 5; Brodeur and Ware, 1992). Zooplankton biomass was lowest in the early1960s and 1970s, and higher in the early 1950s and late 1970s. There was no expla-nation given for these apparent cycles. In a parallel analysis of 14 selected fish andmollusk species (Fig.8) (salmonids, nonsalmonid fishes, and cephalopods) from theNortheast Pacific Ocean, Brodeur and Ware (1995) were able to demonstrate thatcatches of all but one species were greater in the decade of the 1980s than in the mid-1950s and early 1960s. Salmonid biomass increased by a factor of 2.0 in concert withthe doubling of the zooplankton stock. The authors suggested that the carrying capac-ity of the region can vary from decade to decade or over longer periods, and warn thatcurrent high levels of salmon production could decline markedly if the system reverted
Long-term Change 269
Figure 7: Comparison of zooplankton biomass in the Gulf of Alaska from twoperiods. After Brodeur and Ware (1992).
Figure 8: Comparison of nekton biomass in the Gulf of Alaska from two periods.After Brodeur and Ware (1995).
Ch04-N52960 8/22/06 11:14 AM Page 269
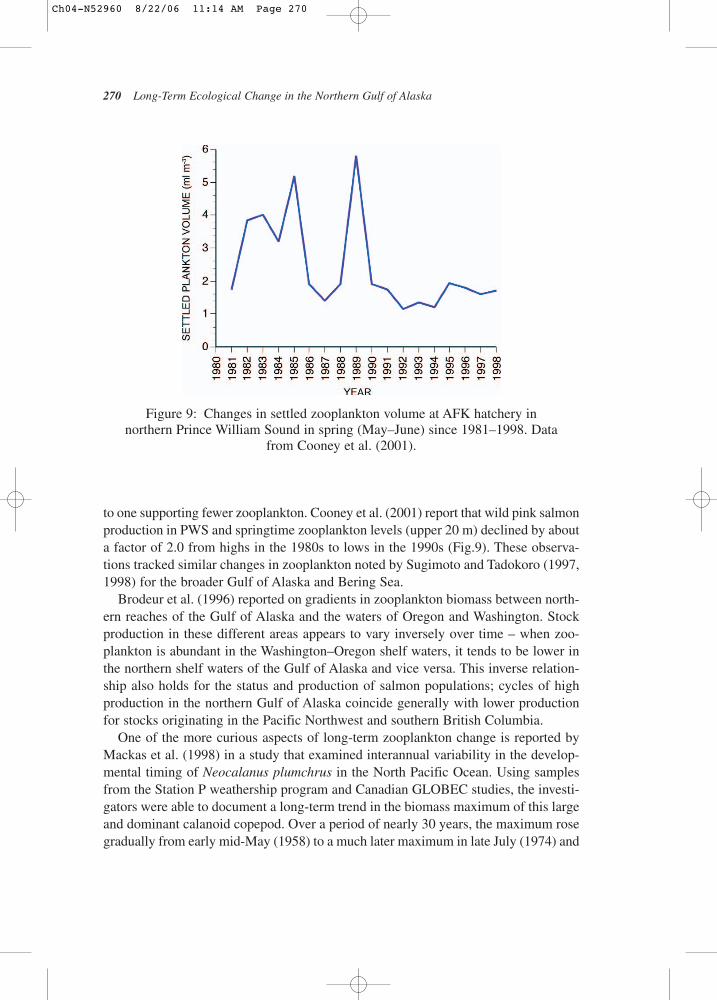
to one supporting fewer zooplankton. Cooney et al. (2001) report that wild pink salmonproduction in PWS and springtime zooplankton levels (upper 20 m) declined by abouta factor of 2.0 from highs in the 1980s to lows in the 1990s (Fig.9). These observa-tions tracked similar changes in zooplankton noted by Sugimoto and Tadokoro (1997,1998) for the broader Gulf of Alaska and Bering Sea.
Brodeur et al. (1996) reported on gradients in zooplankton biomass between north-ern reaches of the Gulf of Alaska and the waters of Oregon and Washington. Stockproduction in these different areas appears to vary inversely over time – when zoo-plankton is abundant in the Washington–Oregon shelf waters, it tends to be lower inthe northern shelf waters of the Gulf of Alaska and vice versa. This inverse relation-ship also holds for the status and production of salmon populations; cycles of highproduction in the northern Gulf of Alaska coincide generally with lower productionfor stocks originating in the Pacific Northwest and southern British Columbia.
One of the more curious aspects of long-term zooplankton change is reported byMackas et al. (1998) in a study that examined interannual variability in the develop-mental timing of Neocalanus plumchrus in the North Pacific Ocean. Using samplesfrom the Station P weathership program and Canadian GLOBEC studies, the investi-gators were able to document a long-term trend in the biomass maximum of this largeand dominant calanoid copepod. Over a period of nearly 30 years, the maximum rosegradually from early mid-May (1958) to a much later maximum in late July (1974) and
270 Long-Term Ecological Change in the Northern Gulf of Alaska
Figure 9: Changes in settled zooplankton volume at AFK hatchery in northern Prince William Sound in spring (May–June) since 1981–1998. Data
from Cooney et al. (2001).
Ch04-N52960 8/22/06 11:14 AM Page 270
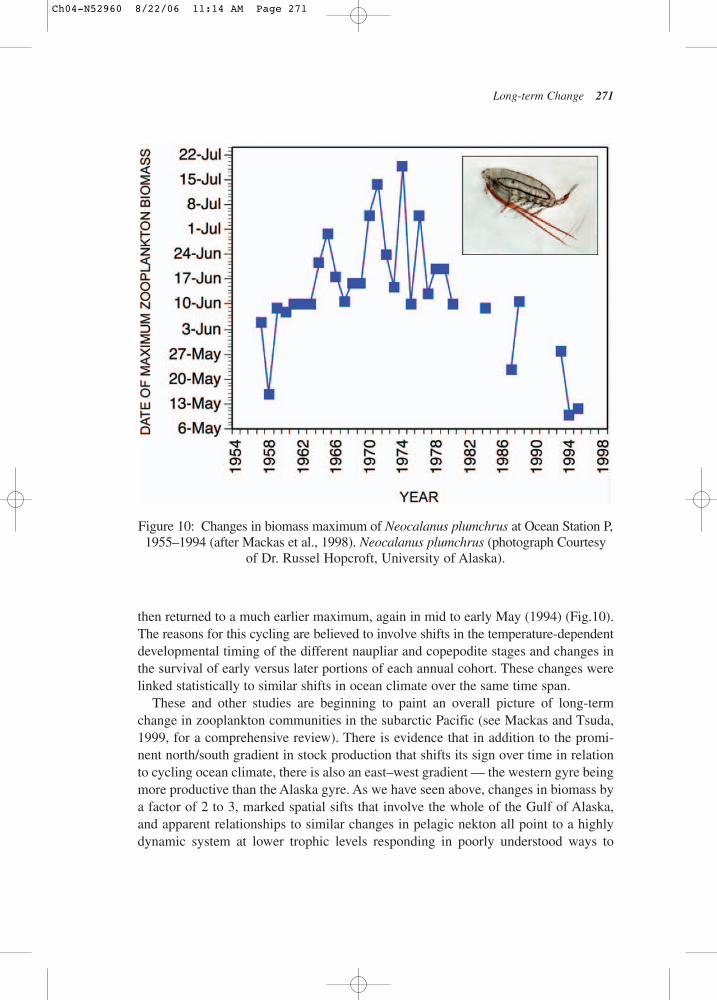
then returned to a much earlier maximum, again in mid to early May (1994) (Fig.10).The reasons for this cycling are believed to involve shifts in the temperature-dependentdevelopmental timing of the different naupliar and copepodite stages and changes inthe survival of early versus later portions of each annual cohort. These changes werelinked statistically to similar shifts in ocean climate over the same time span.
These and other studies are beginning to paint an overall picture of long-termchange in zooplankton communities in the subarctic Pacific (see Mackas and Tsuda,1999, for a comprehensive review). There is evidence that in addition to the promi-nent north/south gradient in stock production that shifts its sign over time in relationto cycling ocean climate, there is also an east–west gradient — the western gyre beingmore productive than the Alaska gyre. As we have seen above, changes in biomass bya factor of 2 to 3, marked spatial sifts that involve the whole of the Gulf of Alaska,and apparent relationships to similar changes in pelagic nekton all point to a highlydynamic system at lower trophic levels responding in poorly understood ways to
Long-term Change 271
Figure 10: Changes in biomass maximum of Neocalanus plumchrus at Ocean Station P,1955–1994 (after Mackas et al., 1998). Neocalanus plumchrus (photograph Courtesy
of Dr. Russel Hopcroft, University of Alaska).
Ch04-N52960 8/22/06 11:14 AM Page 271
climate forcing. Presently missing, but now under intensive study, is how open oceanchanges on a variety of time and space scales influence the more productive shelf and coastal areas in the Gulf of Alaska – regions where almost all of the reproductiveecology of apex consumers occurs. In addition to the intrusion of oceanic-derivedzooplankters into the shelf and coastal zones of the Gulf (as noted in an earlier chapter),the propensity for these intruders to grow to larger absolute size likely has importanttrophic consequences for consumers (see Section 2.4).
4.4. History and Production Trends in Salmon Ted Cooney
4.4.1. Introduction
The long-term record of salmon abundance comes from two sources – the historicalrecord of the fisheries and geochemical records in sockeye salmon lake sediments(Finney et al., 2002). This chapter begins with a record of the exploitation of thesalmon populations, examines the longer-term historical record extracted from lakesediments in the northern Gulf of Alaska sediments, and then discusses the role of climateand other factors in salmon population fluctuations.
4.4.2. Resource Use and Management
Since early times, Pacific salmon populations have supported human kind in the coastaland inland waters of the Gulf of Alaska. Archeological studies of Prince William Soundand other nearby regions indicate man’s presence dates back at least 3000 to 4000 years(Lethcoe and Lethcoe, 1994). When the Europeans arrived in the middle of the eighteenthcentury, there were eight groups of Chugach (Alutig) natives living around the sound.These ancient peoples subsisted primarily on sea mammals, fishes, shellfish, and birds.Salmon was immensely significant in their culture, as it is today among their survivors.
Commercial exploitation of Gulfwide salmon stocks began in the late 1800s primarilypursued by companies operating in San Francisco and Seattle. The full-scale commercialexploitation of salmon in Prince William Sound began with the incorporation of theAlaska Packers Association (APA) in San Francisco in 1892 (Lethcoe and Lethcoe,1994). By 1900, the APA owned two-thirds of the canneries in Alaska, and accountedfor 72% of the annual pack.
During the early days of commercial harvest, fishing practices were ruthless, and waste was condoned in the absence of any substantial regulation of the industry.When Alaska was made a territory in 1918, Alaska fishermen demanded the territorial
272 Long-Term Ecological Change in the Northern Gulf of Alaska
Ch04-N52960 8/22/06 11:14 AM Page 272
government abandon the use of ecologically damaging fish traps owned by the industryto catch salmon. However, the salmon industry lobby was so strong that fish trapswere still being used at some locations until statehood in 1959.
Alaska Department of Fish and Game assumed responsibility for managing salmonresources in 1960. The State mandated that harvests be regulated to sustain salmonstocks at levels that would both conserve the resource and provide a reasonable livelihoodfor fishers and the industry. To this end, policies and regulations were put in place toassure that sufficient numbers of spawning adults would be permitted to escape thefishery each year to sustain a strong reproductive stock.
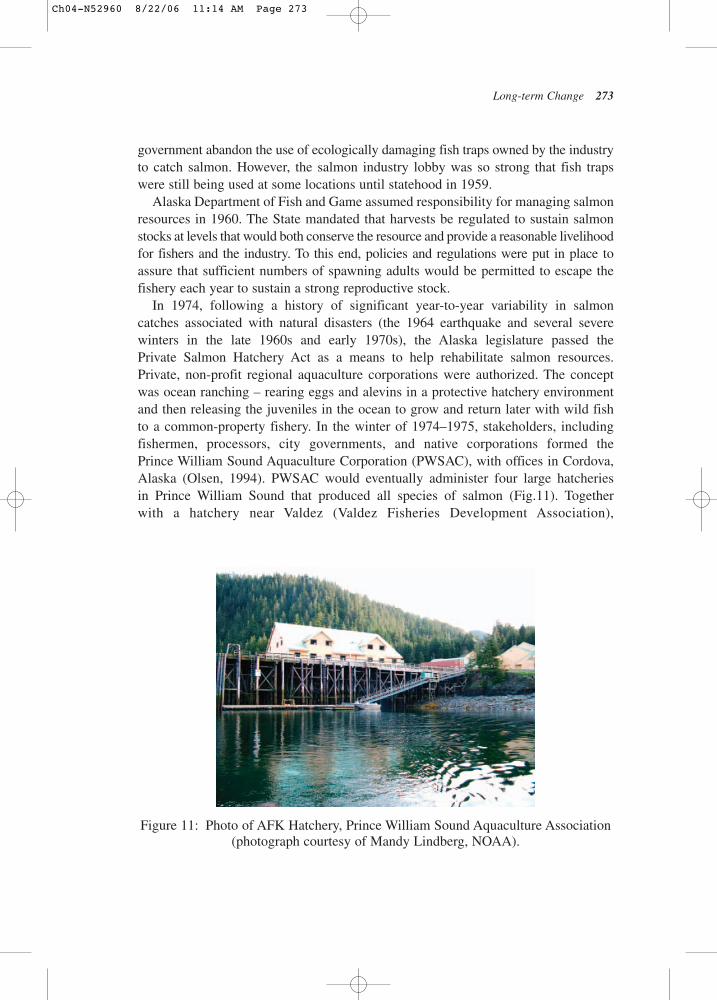
In 1974, following a history of significant year-to-year variability in salmoncatches associated with natural disasters (the 1964 earthquake and several severe winters in the late 1960s and early 1970s), the Alaska legislature passed the Private Salmon Hatchery Act as a means to help rehabilitate salmon resources.Private, non-profit regional aquaculture corporations were authorized. The conceptwas ocean ranching – rearing eggs and alevins in a protective hatchery environmentand then releasing the juveniles in the ocean to grow and return later with wild fish to a common-property fishery. In the winter of 1974–1975, stakeholders, includingfishermen, processors, city governments, and native corporations formed the Prince William Sound Aquaculture Corporation (PWSAC), with offices in Cordova,Alaska (Olsen, 1994). PWSAC would eventually administer four large hatcheries in Prince William Sound that produced all species of salmon (Fig.11). Together with a hatchery near Valdez (Valdez Fisheries Development Association),
Long-term Change 273
Figure 11: Photo of AFK Hatchery, Prince William Sound Aquaculture Association(photograph courtesy of Mandy Lindberg, NOAA).
Ch04-N52960 8/22/06 11:14 AM Page 273
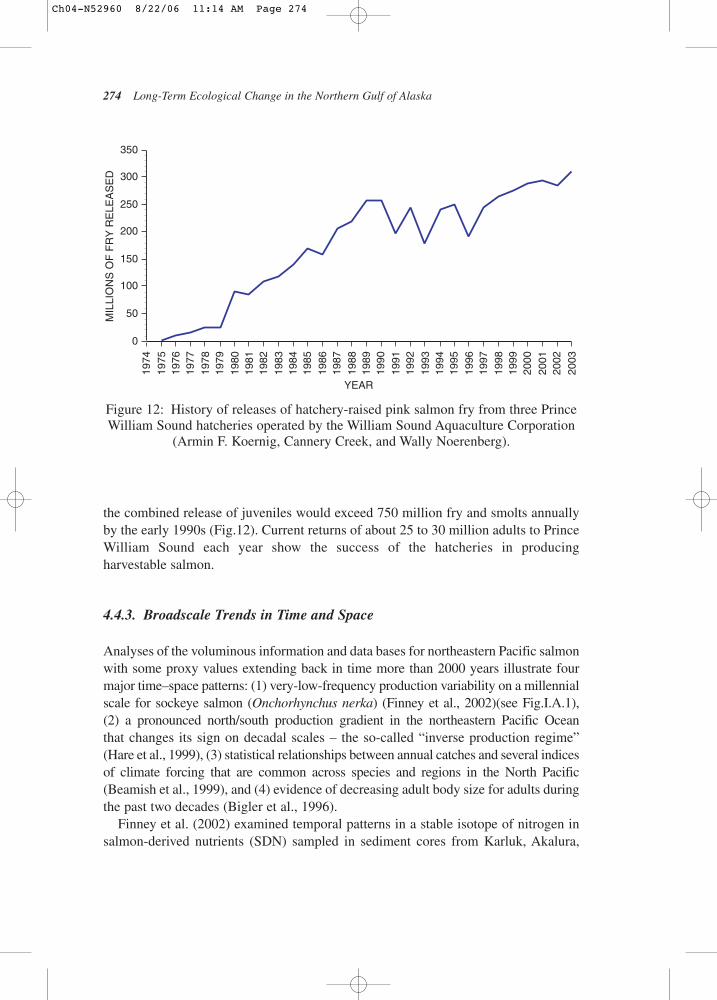
the combined release of juveniles would exceed 750 million fry and smolts annually by the early 1990s (Fig.12). Current returns of about 25 to 30 million adults to PrinceWilliam Sound each year show the success of the hatcheries in producing harvestable salmon.
4.4.3. Broadscale Trends in Time and Space
Analyses of the voluminous information and data bases for northeastern Pacific salmonwith some proxy values extending back in time more than 2000 years illustrate fourmajor time–space patterns: (1) very-low-frequency production variability on a millennialscale for sockeye salmon (Onchorhynchus nerka) (Finney et al., 2002)(see Fig.I.A.1),(2) a pronounced north/south production gradient in the northeastern Pacific Oceanthat changes its sign on decadal scales – the so-called “inverse production regime”(Hare et al., 1999), (3) statistical relationships between annual catches and several indicesof climate forcing that are common across species and regions in the North Pacific(Beamish et al., 1999), and (4) evidence of decreasing adult body size for adults duringthe past two decades (Bigler et al., 1996).
Finney et al. (2002) examined temporal patterns in a stable isotope of nitrogen insalmon-derived nutrients (SDN) sampled in sediment cores from Karluk, Akalura,
274 Long-Term Ecological Change in the Northern Gulf of Alaska
0
50
100
150
200
250
300
35019
7419
7519
7619
7719
7819
7919
8019
8119
8219
8319
8419
8519
8619
8719
8819
8919
9019
9119
9219
9319
9419
9519
9619
9719
9819
9920
0020
0120
0220
03
MIL
LIO
NS
OF
FR
Y R
ELE
AS
ED
YEAR
Figure 12: History of releases of hatchery-raised pink salmon fry from three PrinceWilliam Sound hatcheries operated by the William Sound Aquaculture Corporation
(Armin F. Koernig, Cannery Creek, and Wally Noerenberg).
Ch04-N52960 8/22/06 11:14 AM Page 274
and Frazer lakes on Kodiak Island, Alaska. From this information, they reconstructeda millennial-scale record of adult sockeye salmon returning to spawn in theselakes that extends back to about 200 BC (see Fig.I.A.1). Over roughly 2200 years, therecord depicts declining escapements from a high at the beginning of the record to alow around AD 100, followed by mostly steady increases to high values again inAD 1200 and beyond. The last 100 years (or so) of the time-series document rapid declines, which are probably associated with the development of the modernred-salmon fishery. Since contemporary records illustrate a general tracking of popu-lation change among most salmonid stocks in the northern Gulf of Alaska, the verylong-term reconstructed production history for sockeye salmon may also apply topink (O. gorbusca), chum (O. nerka), silver (O. kisutch), and king salmon (O. tshawytscha).
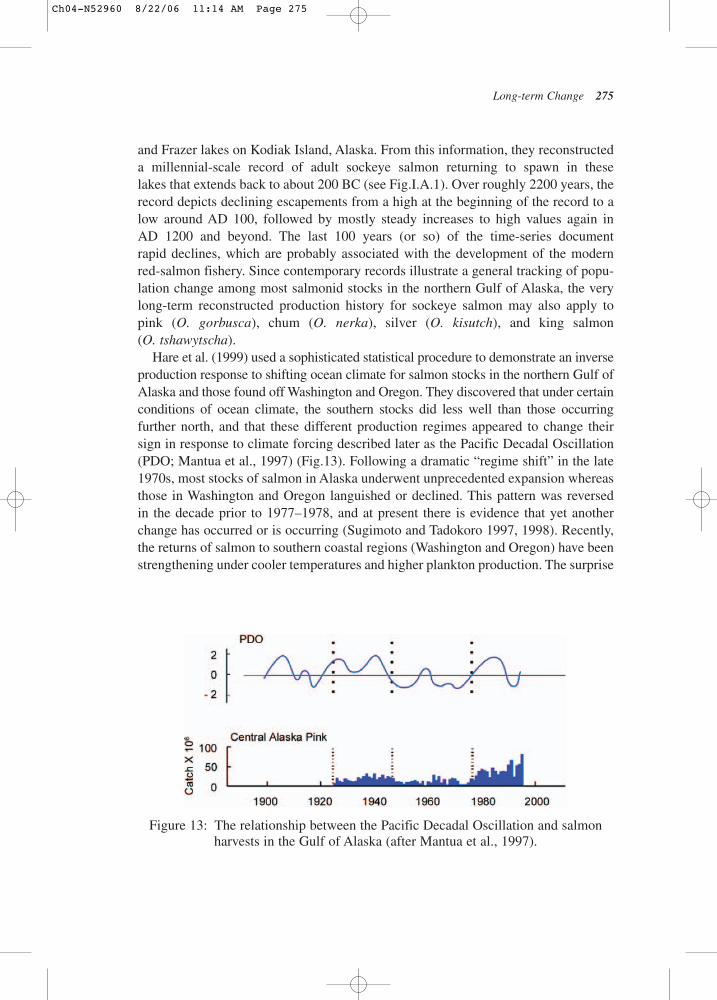
Hare et al. (1999) used a sophisticated statistical procedure to demonstrate an inverseproduction response to shifting ocean climate for salmon stocks in the northern Gulf ofAlaska and those found off Washington and Oregon. They discovered that under certainconditions of ocean climate, the southern stocks did less well than those occurringfurther north, and that these different production regimes appeared to change theirsign in response to climate forcing described later as the Pacific Decadal Oscillation(PDO; Mantua et al., 1997) (Fig.13). Following a dramatic “regime shift” in the late1970s, most stocks of salmon in Alaska underwent unprecedented expansion whereasthose in Washington and Oregon languished or declined. This pattern was reversedin the decade prior to 1977–1978, and at present there is evidence that yet anotherchange has occurred or is occurring (Sugimoto and Tadokoro 1997, 1998). Recently,the returns of salmon to southern coastal regions (Washington and Oregon) have beenstrengthening under cooler temperatures and higher plankton production. The surprise
Long-term Change 275
Figure 13: The relationship between the Pacific Decadal Oscillation and salmonharvests in the Gulf of Alaska (after Mantua et al., 1997).
Ch04-N52960 8/22/06 11:14 AM Page 275
has been that northern Gulf stocks have generally continued to produce at highlevels during this same period rather than reverting to significantly lower levels as ourunderstanding of the inverse production regime would predict. Obviously, there aresome general conditions that favor elevated levels of production in both the southern andnorthern reaches of the Gulf that need to be investigated further.
Hare and Francis (1995) used intervention analyses to determine the dates of tem-poral shifts in ecosystem state associated with long-term records of pink and sock-eye salmon originating in three different regions of Alaska – western, central, andsoutheast. For records of catch extending back to the 1920s, these analyses demon-strated a remarkable concurrence between shifts in production from high to low andback to high across both species and the three different regions. The shifts occurredin the late 1940s and in the late 1970s, the latter associated with a well-documentedchange in ocean climate. Records for air temperature at Kodiak, Alaska, and thetime-series of the North Pacific Index (NPI) demonstrated similar dates for changesin state.
Rogers (1984) hypothesized that increased catches of sockeye salmon during warmocean periods reflected better marine survivals caused by an altered (shortened)migratory pathway for returning adults that lessened their vulnerability to predationby marine mammals. Brodeur and Ware (1992) suggested that increased salmon production during this same period was caused by much improved foraging opportu-nities for juveniles. Their work demonstrated that during the late 1950s and early1960s, oceanic zooplankton was much less abundant and dramatically more patchy in its distribution than in the 1980s. The warm period of the 1980s was one of moreintense Aleutian low pressure and greater center gyre upwelling that presumablyimproved nutrient supply and increased primary productivity supporting higher zooplankton stocks. Although different mechanistically, both ideas linked salmon survival to meteorological forcing of ocean climate.
Concern over the possibility that growth-limited adult size may be occurring wasarticulated by Helle and Hoffman (1995) and Bigler et al. (1996), who demonstrateda trend toward smaller adults for all five species of Pacific salmon since the late1970s. This phenomenon occurred during the same time that Alaskan stocks wereundergoing unprecedented increases. It was believed that density-dependent growthwas forced by competition for limiting forage during the annual feeding migrationsof these fish. Cooney and Brodeur (1998) reviewed the problem and used a simplebioenergetics model to demonstrate that most of the consumption of forage occurs inthe oceanic rather than coastal feeding areas. This does not mean that density-dependentgrowth does not occur in the abundant younger stages, but that, in an absolute sense,the daily ration and overall forage demand is much greater for the larger, older fishesfeeding in the oceanic environment. Smaller adult size is associated with fewer andsmaller eggs per female and a general reduction in reproductive fitness on the spawn-ing grounds. Some have speculated that the growing contribution of hatchery-reared
276 Long-Term Ecological Change in the Northern Gulf of Alaska
Ch04-N52960 8/22/06 11:14 AM Page 276
salmon to an overall Gulf population is stressing present levels of oceanic carryingcapacity for salmonids (and other consumers) in the northern Gulf of Alaska, despiteevidence of significant increases in salmon forage after the late 1970s.
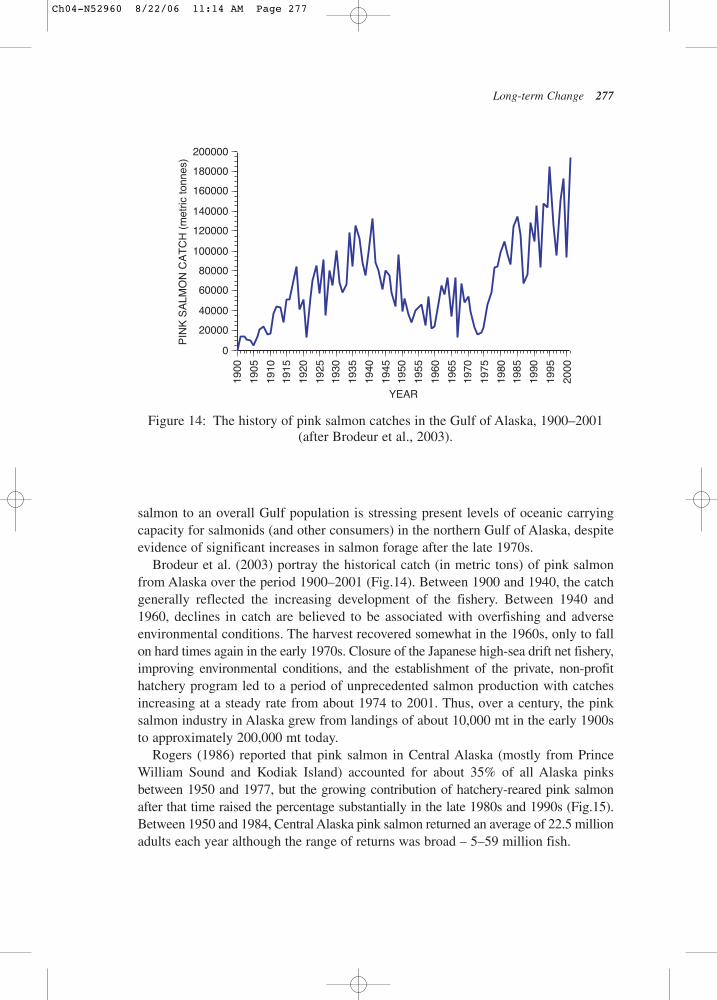
Brodeur et al. (2003) portray the historical catch (in metric tons) of pink salmonfrom Alaska over the period 1900–2001 (Fig.14). Between 1900 and 1940, the catchgenerally reflected the increasing development of the fishery. Between 1940 and1960, declines in catch are believed to be associated with overfishing and adverseenvironmental conditions. The harvest recovered somewhat in the 1960s, only to fallon hard times again in the early 1970s. Closure of the Japanese high-sea drift net fishery,improving environmental conditions, and the establishment of the private, non-profithatchery program led to a period of unprecedented salmon production with catchesincreasing at a steady rate from about 1974 to 2001. Thus, over a century, the pinksalmon industry in Alaska grew from landings of about 10,000 mt in the early 1900sto approximately 200,000 mt today.
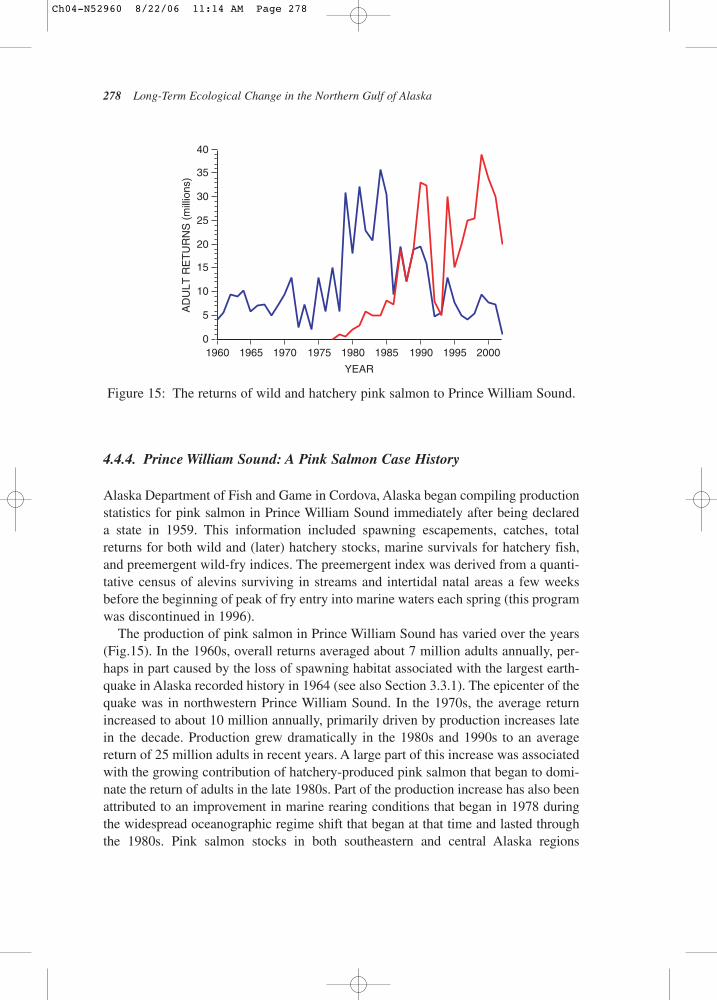
Rogers (1986) reported that pink salmon in Central Alaska (mostly from PrinceWilliam Sound and Kodiak Island) accounted for about 35% of all Alaska pinksbetween 1950 and 1977, but the growing contribution of hatchery-reared pink salmonafter that time raised the percentage substantially in the late 1980s and 1990s (Fig.15).Between 1950 and 1984, Central Alaska pink salmon returned an average of 22.5 millionadults each year although the range of returns was broad – 5–59 million fish.
Long-term Change 277
0
20000
40000
60000
80000
100000
120000
140000
160000
180000
200000
1900
1905
1910
1915
1920
1925
1930
1935
1940
1945
1950
1955
1960
1965
1970
1975
1980
1985
1990
1995
2000
PIN
K S
ALM
ON
CA
TC
H (
met
ric to
nnes
)
YEAR
Figure 14: The history of pink salmon catches in the Gulf of Alaska, 1900–2001(after Brodeur et al., 2003).
Ch04-N52960 8/22/06 11:14 AM Page 277
4.4.4. Prince William Sound: A Pink Salmon Case History
Alaska Department of Fish and Game in Cordova, Alaska began compiling productionstatistics for pink salmon in Prince William Sound immediately after being declared a state in 1959. This information included spawning escapements, catches, totalreturns for both wild and (later) hatchery stocks, marine survivals for hatchery fish,and preemergent wild-fry indices. The preemergent index was derived from a quanti-tative census of alevins surviving in streams and intertidal natal areas a few weeksbefore the beginning of peak of fry entry into marine waters each spring (this programwas discontinued in 1996).
The production of pink salmon in Prince William Sound has varied over the years(Fig.15). In the 1960s, overall returns averaged about 7 million adults annually, per-haps in part caused by the loss of spawning habitat associated with the largest earth-quake in Alaska recorded history in 1964 (see also Section 3.3.1). The epicenter of thequake was in northwestern Prince William Sound. In the 1970s, the average returnincreased to about 10 million annually, primarily driven by production increases latein the decade. Production grew dramatically in the 1980s and 1990s to an averagereturn of 25 million adults in recent years. A large part of this increase was associatedwith the growing contribution of hatchery-produced pink salmon that began to domi-nate the return of adults in the late 1980s. Part of the production increase has also beenattributed to an improvement in marine rearing conditions that began in 1978 duringthe widespread oceanographic regime shift that began at that time and lasted throughthe 1980s. Pink salmon stocks in both southeastern and central Alaska regions
278 Long-Term Ecological Change in the Northern Gulf of Alaska
0
5
10
15
20
25
30
35
40
1960 1965 1970 1975 1980 1985 1990 1995 2000
AD
ULT
RE
TU
RN
S (
mill
ions
)
YEAR
Figure 15: The returns of wild and hatchery pink salmon to Prince William Sound.
Ch04-N52960 8/22/06 11:14 AM Page 278
responded positively to a generally warmer and wetter ocean climate following the shift(Hare and Francis, 1995).
The time series of wild and hatchery pink salmon stock production in PrinceWilliam Sound has been interpreted differently by those who believe hatchery prac-tices eventually lead to the demise of natural stocks (Hilborn and Eggers, 2000), andthose who contend that these different populations can exist together without undulyinfluencing each other (Wertheimer et al., 2001). Those who see hatchery stocks asdetrimental to the sustainability of wild populations point to Prince William Sound as a prime example of hatchery pink salmon displacing the wild population. This displacement allegedly began in the mid to late 1980s and continues to this day. As evidence, opponents of hatcheries point to the increasing proportion of hatcheryfish to the overall returns from 1985 to the present. The opposing view uses the sametime series to demonstrate that declines in wild production following the elevated production years in the 1980s merely represent a return of wild populations to pre-regime-shift levels after a period of elevated escapements and unusually goodocean survival conditions. Sugimoto and Tadokoro (1997) provide evidence foranother shift in ocean climate in the north Pacific that occurred in the early 1990s.After the salmon hatcheries reached their permitted levels of production in the late 1980s,they have been consistently placing about three times more fry into Prince WilliamSound than do the wild stocks each year.
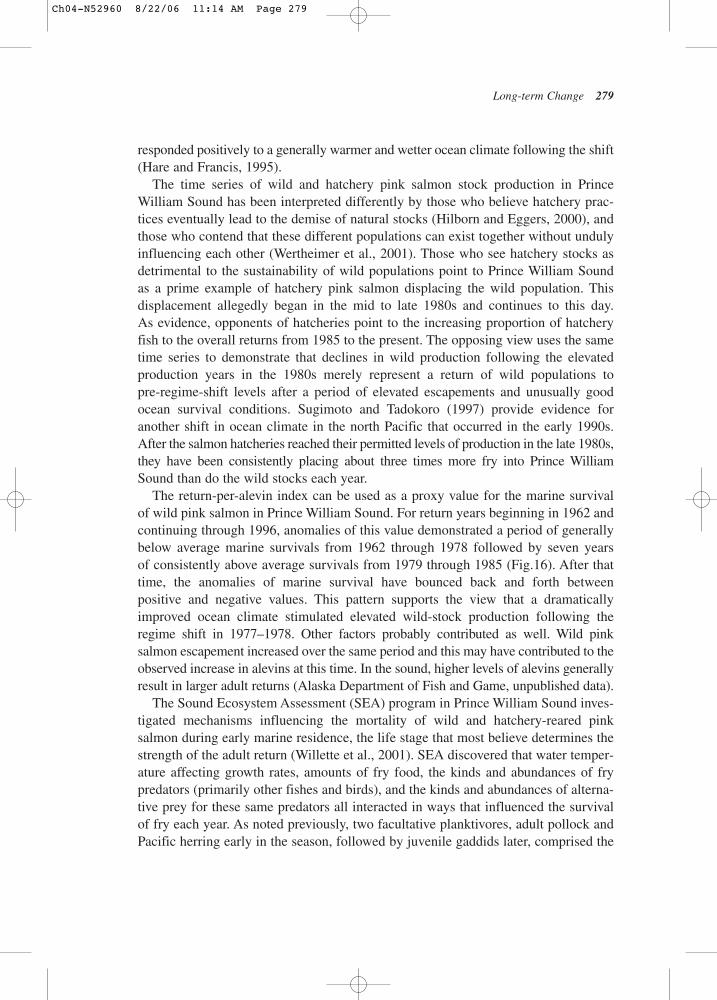
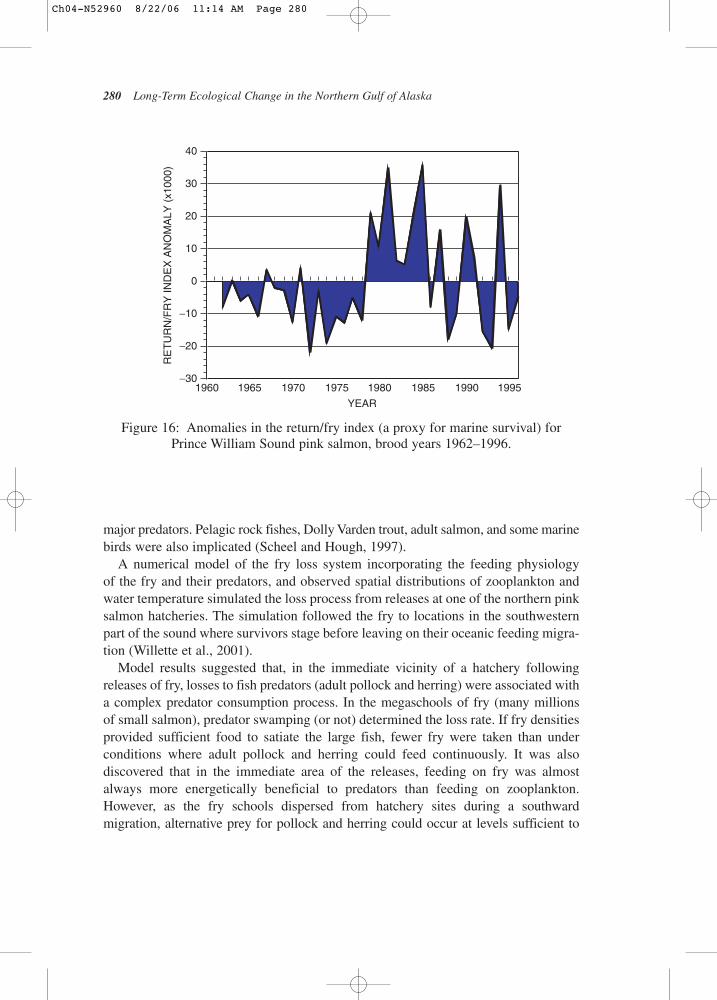
The return-per-alevin index can be used as a proxy value for the marine survival of wild pink salmon in Prince William Sound. For return years beginning in 1962 andcontinuing through 1996, anomalies of this value demonstrated a period of generallybelow average marine survivals from 1962 through 1978 followed by seven years of consistently above average survivals from 1979 through 1985 (Fig.16). After thattime, the anomalies of marine survival have bounced back and forth between positive and negative values. This pattern supports the view that a dramaticallyimproved ocean climate stimulated elevated wild-stock production following theregime shift in 1977–1978. Other factors probably contributed as well. Wild pinksalmon escapement increased over the same period and this may have contributed to theobserved increase in alevins at this time. In the sound, higher levels of alevins generallyresult in larger adult returns (Alaska Department of Fish and Game, unpublished data).
The Sound Ecosystem Assessment (SEA) program in Prince William Sound inves-tigated mechanisms influencing the mortality of wild and hatchery-reared pinksalmon during early marine residence, the life stage that most believe determines thestrength of the adult return (Willette et al., 2001). SEA discovered that water temper-ature affecting growth rates, amounts of fry food, the kinds and abundances of frypredators (primarily other fishes and birds), and the kinds and abundances of alterna-tive prey for these same predators all interacted in ways that influenced the survivalof fry each year. As noted previously, two facultative planktivores, adult pollock andPacific herring early in the season, followed by juvenile gaddids later, comprised the
Long-term Change 279
Ch04-N52960 8/22/06 11:14 AM Page 279
major predators. Pelagic rock fishes, Dolly Varden trout, adult salmon, and some marinebirds were also implicated (Scheel and Hough, 1997).
A numerical model of the fry loss system incorporating the feeding physiology of the fry and their predators, and observed spatial distributions of zooplankton andwater temperature simulated the loss process from releases at one of the northern pinksalmon hatcheries. The simulation followed the fry to locations in the southwesternpart of the sound where survivors stage before leaving on their oceanic feeding migra-tion (Willette et al., 2001).
Model results suggested that, in the immediate vicinity of a hatchery followingreleases of fry, losses to fish predators (adult pollock and herring) were associated witha complex predator consumption process. In the megaschools of fry (many millionsof small salmon), predator swamping (or not) determined the loss rate. If fry densitiesprovided sufficient food to satiate the large fish, fewer fry were taken than under conditions where adult pollock and herring could feed continuously. It was also discovered that in the immediate area of the releases, feeding on fry was almostalways more energetically beneficial to predators than feeding on zooplankton.However, as the fry schools dispersed from hatchery sites during a southward migration, alternative prey for pollock and herring could occur at levels sufficient to
280 Long-Term Ecological Change in the Northern Gulf of Alaska
1960 1965 1970 1975 1980 1985 1990 1995−30
−20
−10
0
10
20
30
40
RE
TU
RN
/FR
Y IN
DE
X A
NO
MA
LY (
x100
0)
YEAR
Figure 16: Anomalies in the return/fry index (a proxy for marine survival) forPrince William Sound pink salmon, brood years 1962–1996.
Ch04-N52960 8/22/06 11:14 AM Page 280
“switch” the predator consumptive process to euphausiids, large calanoids and/orpteropods (Willette et al., 1999).
In contrast, it seems unlikely that the entry of wild fry over a 60-day period eachspring (from 800 or so small streams and rivers) would ever approach the densities of juveniles found in megaschools around hatcheries, so “zooplankton sheltering”may be a key factor influencing the losses of wild stocks during early marine residence in most years. Cooney et al. (2001) noted that, during the 1980s, zooplanktonstocks and adult returns of wild pink salmon in Prince William Sound (PWS) wereapproximately twice those occurring later in the 1990s.
Given what is presently understood about pink salmon in Prince William Sound andthe interacting factors that account for high mortalities during early ocean residence(perhaps as many as 75% of the total fry entry), the historical pattern of wild stock pro-duction suggests the following: (1) a period from 1960 through the middle 1970swhere marine and freshwater survivals sustained the stocks at levels of 5–10 millionper year (2) a period of approximately 10 years of elevated production – 20–30 millionwild and hatchery adults per year during the 1980s when annual marine survivals wereoften well above average – and when overescapement may have been partly the causeof increased alevin densities in the spring, and (3) a diminishment of elevated wildstock production in the early 1990s back to pre-1980 levels while hatchery stocksremain high. The cause of the wild production decline continues to be debated.
4.4.5. What’s Behind the Large-Scale Patterns in Salmon Catch and Production?
It seems obvious from the above that salmon production is influenced by periodic if not strictly cyclic shifts in ocean climate on several different time and space scales(Francis and Sibley, 1991) and by management and harvest strategies that includestock enhancement (hatcheries). Most agree that run-strength is established early in the marine life history in near-shore waters. Most also agree that predation, ratherthan starvation is the most important factor. In this regard, there is evidence that mor-tality during the early marine stages is size-dependent, the smaller fishes being at muchgreater risk to predation than the larger. As a consequence, growth rates apparentlymediate these early losses; both water temperature and food have been shown to affectjuvenile growth. Fry growing slowly remain in the smallest, most vulnerable sizesproportionally longer than do fry that encounter optimal growth conditions. This par-adigm has been challenged recently by Beamish and Mahnken (2001) who providedevidence that at least for coho (silver) salmon (Oncorhynchus kisutch) there is reasonto believe that unless the smolting juveniles are sufficiently prepared (physiologically)for their year in the ocean, they may not survive. Physiological preparation seems
Long-term Change 281
Ch04-N52960 8/22/06 11:14 AM Page 281
to be associated with achieving a certain minimal size. Juveniles failing to reach this“critical size” apparently do not survive a winter at sea. It has not been demonstratedconvincingly that other salmonids in the system are affected in a similar way.
Shifts in ocean state in the northeastern Pacific seemingly affect salmon productionaccording to where a particular stock resides on the north/south production gradientbetween Oregon/Washington and Alaska. An ocean state that exhibits warmer andgenerally wetter than average conditions in the north apparently favors productionthere (Mueter et al., 2002; Hare et al., 1999). Under the “northern warm regime” (positive PDO) increased center gyre upwelling and a deeper upper mixed layer in theGulf responding to an intensified Aleutian low may improve growing conditions for plankton (juvenile salmon forage) by increasing nutrient supplies and plankton produc-tion, and through increased runoff, creating a more stable photic zone (Gargett, 1997).Also, an open ocean distribution of zooplankton that strengthens population levels atthe continental margins (Brodeur and Ware, 1992) may “leak” more ocean-derivedzooplankton landward, reinforcing shelf and coastal stocks that serve as food for juve-niles and alternative forage for salmon predators. Further, when (for whatever reason)zooplankton stocks are elevated, the overall trophic status of the ecosystem probablyshifts toward planktivory, the result being that generalists derive more of their energyby feeding on zooplankton rather than eating small fishes (such as juvenile salmon)(see Section 4.4.5).
Conversely, when zooplankton stocks collapse, generalists that rely heavily onplankton must supplement their diets by feeding more on small fishes and squids, andthe ecosystem will reflect a more piscvorous status. These feeding mode shifts havebeen observed and described (Willette et al., 1999). Finally, a warmer and wetter-than-average northern system probably favors greater freshwater survivals of earlylife stages. Heavy snowfall tends to insulate salmon eggs and alevins from freezingconditions, and periods of melting maintain stream flows necessary to provide suffi-cient oxygen for respiring embryos. Warm spring conditions promote rapid runoff andthe flushing of juveniles into shallow coastal waters in relatively high numbers. Theselarge outmigration events may create local predator swamping and enhanced overallsurvival (Cooney et al., 1995).
At the same time, a warmer ocean climate in southern waters probably meansgreater stratification and reduced coastal upwelling resulting in less plankton production perhaps leading to an ecosystem adjustment toward piscivory andgreater losses to populations of small fishes, including juvenile salmon. Warmerconditions in the south may also allow warm-water predators (such as Pacific hake)to invade a region from more southerly locations. Hare et al. (1999) suggest thatconditions off Washington and Oregon over the last two decades (detrimentalto salmon production) may have in some measure been responsible for the lackluster performance of hatchery stocks of coho salmon rearing in coastal waters. If this was the case, a “return” to a higher production regime in southern
282 Long-Term Ecological Change in the Northern Gulf of Alaska
Ch04-N52960 8/22/06 11:14 AM Page 282
waters – believed by some to be underway now – could improve the contribution ofsouthern hatchery stocks to local fisheries, a largely unrealized regional strategyfor many years.
The strength of wild salmon populations in the northern Gulf of Alaska has beenattributed in part to management activities designed to protect the reproductive poten-tial of stocks. In an odd twist of fortune, the economic value of this immense andhealthy resource has recently been strongly and negatively impacted by globallyavailable farmed salmon. The devaluation of wild stocks and ocean-ranched salmonis affecting the harvest sector and thus one of the major “tools” that managers use tocreate effective spawning escapements each year. When the price per pound offeredto fishermen declines substantially, harvesters may decline to fish, or may demandthat the hatcheries produce more fish to increase the fishable stock size. Taken toextremes, the result may be many more low value fish competing for forage resourceson the high sea, maturing at a later age and returning as smaller adults with compromisedreproductive potential (Cooney and Brodeur, 1998). Aggressive marketing programs arepresently underway to restore the economic value of non-armed salmon populations in the Gulf of Alaska. Only time will tell whether these actions will succeed.
Long-term Change 283
THE ROLE OF SPAWNING HABITAT by Ted Cooney
Natural limitations are placed on the production of wild salmon stocks by thedistribution and amounts of spawning habitat available to adults each year.Clear-water rivers and streams with suitably porous, gravelly sediments providesubstrates that can successfully incubate the eggs and host the developing larvalsalmon. The strict dependence on these “spawning habitats” places upper boundson the numbers of spawning adults that can be successfully accommodated eachyear. Fully utilized spawning habitats under ideal conditions will produce agiven number of juveniles whose survival to adulthood is determined primarily(but perhaps not always) by losses to predation during the ocean feeding andmaturation phase of the life history. When the adult returns are particularly large,natal habitats may be overrun by adults and the capacity of a region to producejuveniles seriously degraded. Because of this, resource managers attempt to regulate the harvest so that an optimal number of adults are allowed to “escape”the fishery each year. The sustained productivity of wild salmon in the northernGulf of Alaska has been attributed, in large measure, to the success of this management strategy.
Ch04-N52960 8/22/06 11:14 AM Page 283
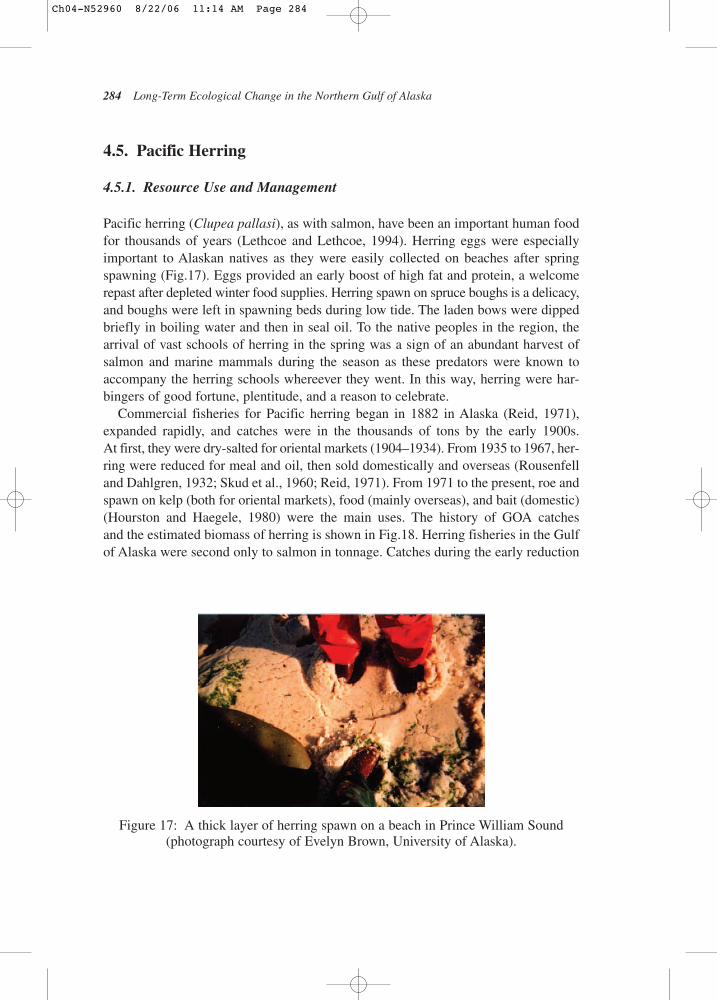
4.5. Pacific Herring
4.5.1. Resource Use and Management
Pacific herring (Clupea pallasi), as with salmon, have been an important human foodfor thousands of years (Lethcoe and Lethcoe, 1994). Herring eggs were especiallyimportant to Alaskan natives as they were easily collected on beaches after springspawning (Fig.17). Eggs provided an early boost of high fat and protein, a welcomerepast after depleted winter food supplies. Herring spawn on spruce boughs is a delicacy,and boughs were left in spawning beds during low tide. The laden bows were dippedbriefly in boiling water and then in seal oil. To the native peoples in the region, thearrival of vast schools of herring in the spring was a sign of an abundant harvest ofsalmon and marine mammals during the season as these predators were known toaccompany the herring schools whereever they went. In this way, herring were har-bingers of good fortune, plentitude, and a reason to celebrate.
Commercial fisheries for Pacific herring began in 1882 in Alaska (Reid, 1971),expanded rapidly, and catches were in the thousands of tons by the early 1900s. At first, they were dry-salted for oriental markets (1904–1934). From 1935 to 1967, her-ring were reduced for meal and oil, then sold domestically and overseas (Rousenfelland Dahlgren, 1932; Skud et al., 1960; Reid, 1971). From 1971 to the present, roe andspawn on kelp (both for oriental markets), food (mainly overseas), and bait (domestic)(Hourston and Haegele, 1980) were the main uses. The history of GOA catches and the estimated biomass of herring is shown in Fig.18. Herring fisheries in the Gulfof Alaska were second only to salmon in tonnage. Catches during the early reduction
284 Long-Term Ecological Change in the Northern Gulf of Alaska
Figure 17: A thick layer of herring spawn on a beach in Prince William Sound(photograph courtesy of Evelyn Brown, University of Alaska).
Ch04-N52960 8/22/06 11:14 AM Page 284
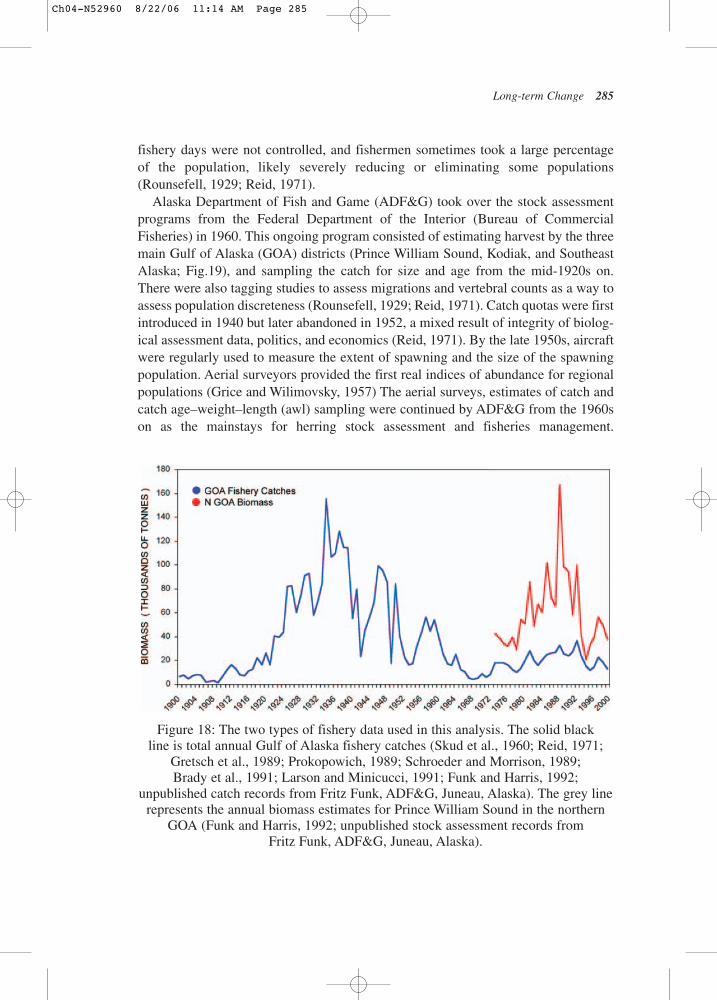
fishery days were not controlled, and fishermen sometimes took a large percentage of the population, likely severely reducing or eliminating some populations(Rounsefell, 1929; Reid, 1971).
Alaska Department of Fish and Game (ADF&G) took over the stock assessmentprograms from the Federal Department of the Interior (Bureau of CommercialFisheries) in 1960. This ongoing program consisted of estimating harvest by the threemain Gulf of Alaska (GOA) districts (Prince William Sound, Kodiak, and SoutheastAlaska; Fig.19), and sampling the catch for size and age from the mid-1920s on.There were also tagging studies to assess migrations and vertebral counts as a way toassess population discreteness (Rounsefell, 1929; Reid, 1971). Catch quotas were firstintroduced in 1940 but later abandoned in 1952, a mixed result of integrity of biolog-ical assessment data, politics, and economics (Reid, 1971). By the late 1950s, aircraftwere regularly used to measure the extent of spawning and the size of the spawningpopulation. Aerial surveyors provided the first real indices of abundance for regionalpopulations (Grice and Wilimovsky, 1957) The aerial surveys, estimates of catch andcatch age–weight–length (awl) sampling were continued by ADF&G from the 1960son as the mainstays for herring stock assessment and fisheries management.
Long-term Change 285
Figure 18: The two types of fishery data used in this analysis. The solid black line is total annual Gulf of Alaska fishery catches (Skud et al., 1960; Reid, 1971;
Gretsch et al., 1989; Prokopowich, 1989; Schroeder and Morrison, 1989; Brady et al., 1991; Larson and Minicucci, 1991; Funk and Harris, 1992;
unpublished catch records from Fritz Funk, ADF&G, Juneau, Alaska). The grey linerepresents the annual biomass estimates for Prince William Sound in the northern
GOA (Funk and Harris, 1992; unpublished stock assessment records from Fritz Funk, ADF&G, Juneau, Alaska).
Ch04-N52960 8/22/06 11:14 AM Page 285
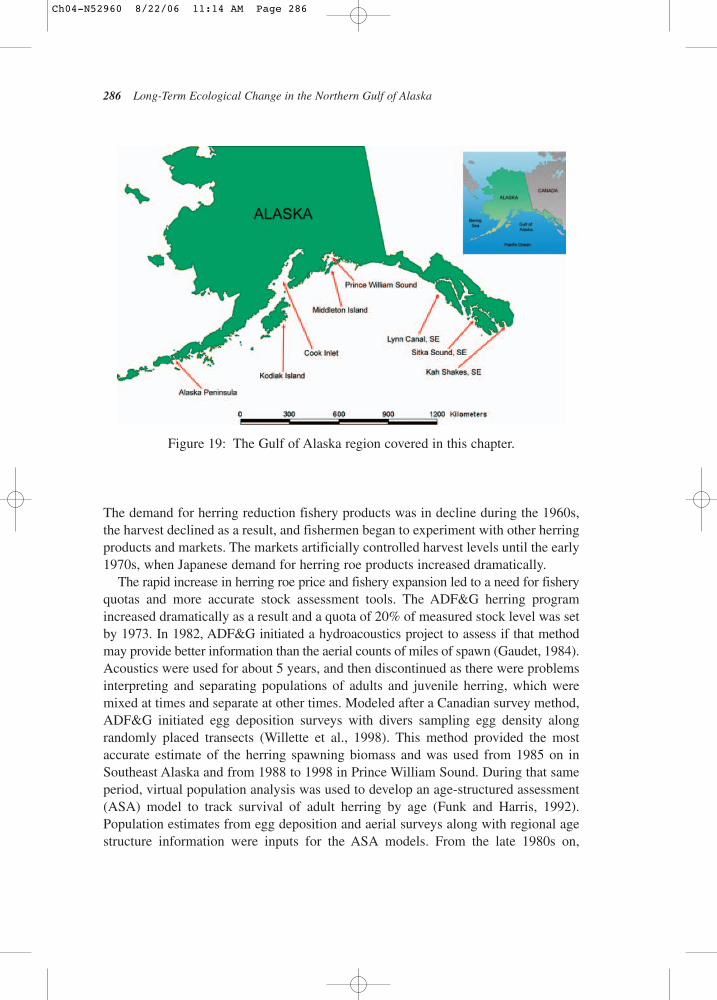
The demand for herring reduction fishery products was in decline during the 1960s,the harvest declined as a result, and fishermen began to experiment with other herringproducts and markets. The markets artificially controlled harvest levels until the early1970s, when Japanese demand for herring roe products increased dramatically.
The rapid increase in herring roe price and fishery expansion led to a need for fisheryquotas and more accurate stock assessment tools. The ADF&G herring programincreased dramatically as a result and a quota of 20% of measured stock level was setby 1973. In 1982, ADF&G initiated a hydroacoustics project to assess if that methodmay provide better information than the aerial counts of miles of spawn (Gaudet, 1984).Acoustics were used for about 5 years, and then discontinued as there were problemsinterpreting and separating populations of adults and juvenile herring, which weremixed at times and separate at other times. Modeled after a Canadian survey method,ADF&G initiated egg deposition surveys with divers sampling egg density along randomly placed transects (Willette et al., 1998). This method provided the mostaccurate estimate of the herring spawning biomass and was used from 1985 on inSoutheast Alaska and from 1988 to 1998 in Prince William Sound. During that sameperiod, virtual population analysis was used to develop an age-structured assessment(ASA) model to track survival of adult herring by age (Funk and Harris, 1992).Population estimates from egg deposition and aerial surveys along with regional agestructure information were inputs for the ASA models. From the late 1980s on,
286 Long-Term Ecological Change in the Northern Gulf of Alaska
Figure 19: The Gulf of Alaska region covered in this chapter.
Ch04-N52960 8/22/06 11:14 AM Page 286
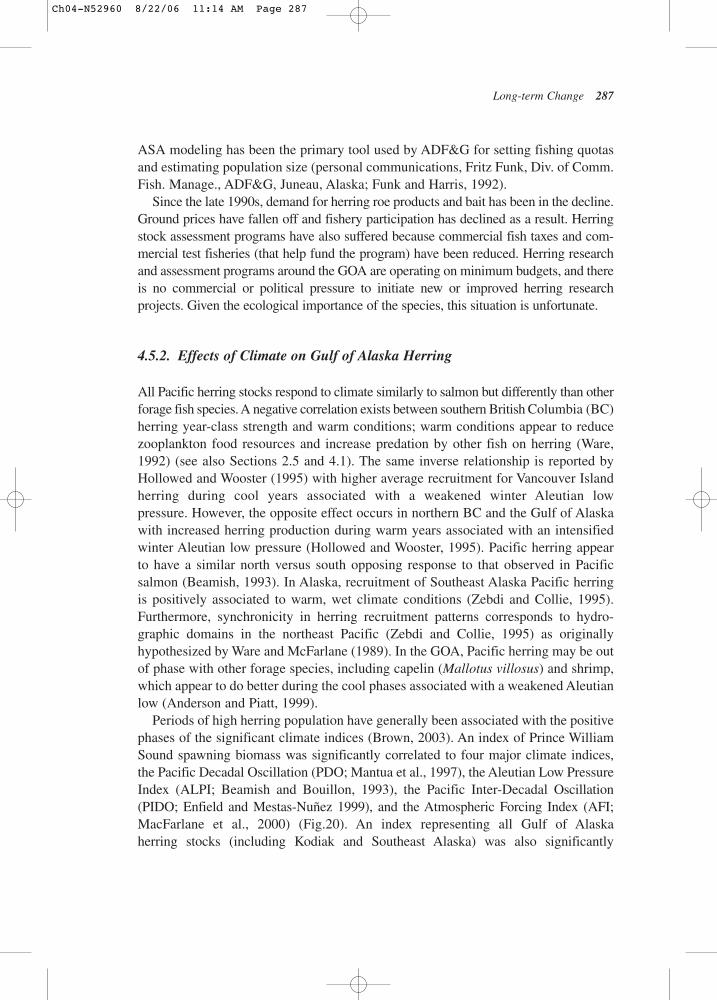
ASA modeling has been the primary tool used by ADF&G for setting fishing quotasand estimating population size (personal communications, Fritz Funk, Div. of Comm.Fish. Manage., ADF&G, Juneau, Alaska; Funk and Harris, 1992).
Since the late 1990s, demand for herring roe products and bait has been in the decline.Ground prices have fallen off and fishery participation has declined as a result. Herringstock assessment programs have also suffered because commercial fish taxes and com-mercial test fisheries (that help fund the program) have been reduced. Herring researchand assessment programs around the GOA are operating on minimum budgets, and thereis no commercial or political pressure to initiate new or improved herring research projects. Given the ecological importance of the species, this situation is unfortunate.
4.5.2. Effects of Climate on Gulf of Alaska Herring
All Pacific herring stocks respond to climate similarly to salmon but differently than otherforage fish species. A negative correlation exists between southern British Columbia (BC)herring year-class strength and warm conditions; warm conditions appear to reducezooplankton food resources and increase predation by other fish on herring (Ware,1992) (see also Sections 2.5 and 4.1). The same inverse relationship is reported byHollowed and Wooster (1995) with higher average recruitment for Vancouver Islandherring during cool years associated with a weakened winter Aleutian low pressure. However, the opposite effect occurs in northern BC and the Gulf of Alaskawith increased herring production during warm years associated with an intensifiedwinter Aleutian low pressure (Hollowed and Wooster, 1995). Pacific herring appearto have a similar north versus south opposing response to that observed in Pacificsalmon (Beamish, 1993). In Alaska, recruitment of Southeast Alaska Pacific herringis positively associated to warm, wet climate conditions (Zebdi and Collie, 1995).Furthermore, synchronicity in herring recruitment patterns corresponds to hydro-graphic domains in the northeast Pacific (Zebdi and Collie, 1995) as originallyhypothesized by Ware and McFarlane (1989). In the GOA, Pacific herring may be outof phase with other forage species, including capelin (Mallotus villosus) and shrimp,which appear to do better during the cool phases associated with a weakened Aleutianlow (Anderson and Piatt, 1999).
Periods of high herring population have generally been associated with the positivephases of the significant climate indices (Brown, 2003). An index of Prince WilliamSound spawning biomass was significantly correlated to four major climate indices,the Pacific Decadal Oscillation (PDO; Mantua et al., 1997), the Aleutian Low PressureIndex (ALPI; Beamish and Bouillon, 1993), the Pacific Inter-Decadal Oscillation(PIDO; Enfield and Mestas-Nuñez 1999), and the Atmospheric Forcing Index (AFI;MacFarlane et al., 2000) (Fig.20). An index representing all Gulf of Alaskaherring stocks (including Kodiak and Southeast Alaska) was also significantly
Long-term Change 287
Ch04-N52960 8/22/06 11:14 AM Page 287
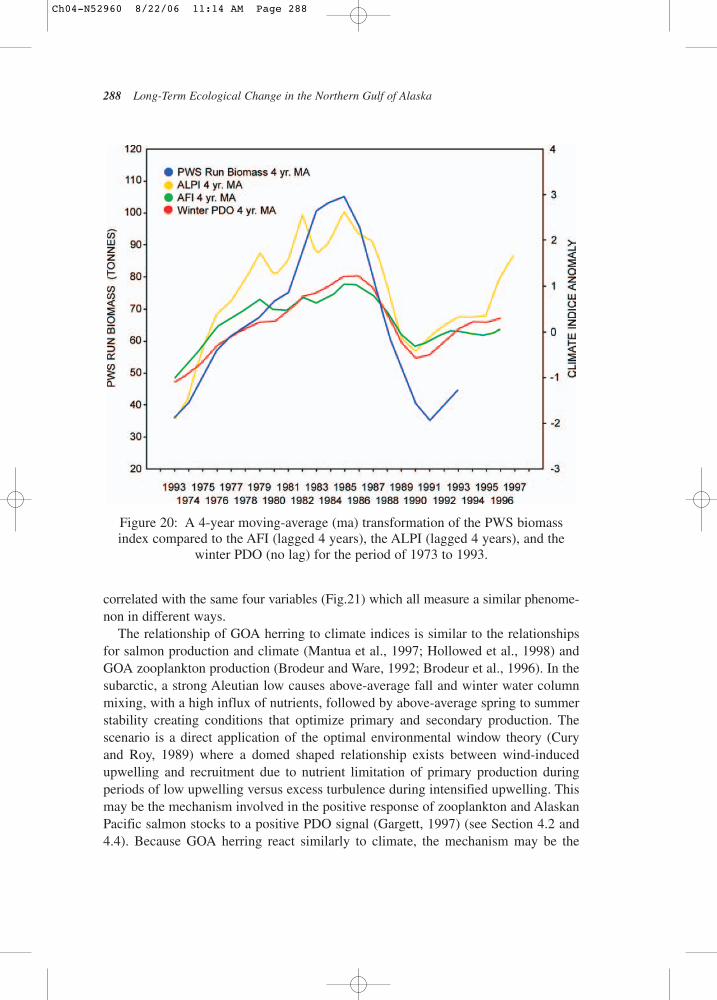
correlated with the same four variables (Fig.21) which all measure a similar phenome-non in different ways.
The relationship of GOA herring to climate indices is similar to the relationshipsfor salmon production and climate (Mantua et al., 1997; Hollowed et al., 1998) andGOA zooplankton production (Brodeur and Ware, 1992; Brodeur et al., 1996). In thesubarctic, a strong Aleutian low causes above-average fall and winter water columnmixing, with a high influx of nutrients, followed by above-average spring to summerstability creating conditions that optimize primary and secondary production. Thescenario is a direct application of the optimal environmental window theory (Curyand Roy, 1989) where a domed shaped relationship exists between wind-inducedupwelling and recruitment due to nutrient limitation of primary production duringperiods of low upwelling versus excess turbulence during intensified upwelling. Thismay be the mechanism involved in the positive response of zooplankton and AlaskanPacific salmon stocks to a positive PDO signal (Gargett, 1997) (see Section 4.2 and4.4). Because GOA herring react similarly to climate, the mechanism may be the
288 Long-Term Ecological Change in the Northern Gulf of Alaska
Figure 20: A 4-year moving-average (ma) transformation of the PWS biomassindex compared to the AFI (lagged 4 years), the ALPI (lagged 4 years), and the
winter PDO (no lag) for the period of 1973 to 1993.
Ch04-N52960 8/22/06 11:14 AM Page 288
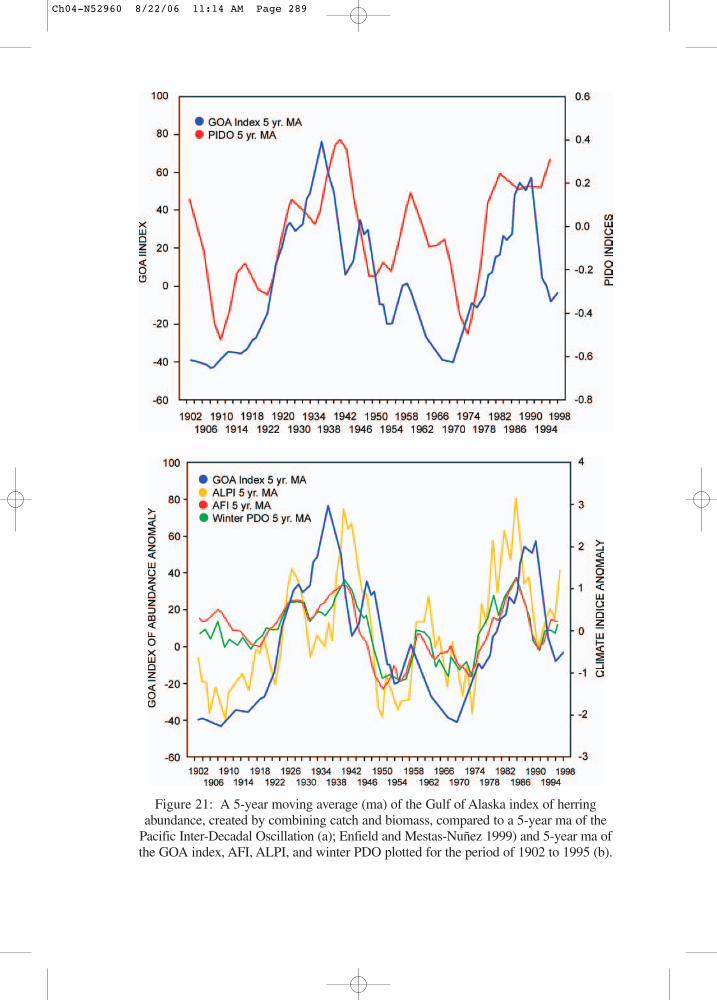
Figure 21: A 5-year moving average (ma) of the Gulf of Alaska index of herringabundance, created by combining catch and biomass, compared to a 5-year ma of the
Pacific Inter-Decadal Oscillation (a); Enfield and Mestas-Nuñez 1999) and 5-year ma ofthe GOA index, AFI, ALPI, and winter PDO plotted for the period of 1902 to 1995 (b).
Ch04-N52960 8/22/06 11:14 AM Page 289

same for herring. Enhanced zooplankton resources will likely result in higher growthand possibly better survival for early life stages of herring.
Periods of high herring production in the GOA, during the 1930s and 1980s, correspond with periods of positive PDO and AFI index values but not in the 1960s(Fig. 20 and Fig.21). The two peaks in abundance in. However, This may be due topoorly documented overall stock size information during the 1960s rather than a lackof relationship. Fishery catches were low due to weak herring markets (Reid, 1971).It is possible that herring were more abundant in the Gulf than indicated, as they wereabundant in the Bering Sea during this period (Wespestad, 1991). If so, the overallcorrelation between population abundance and climate could have been even stronger.
Changes in climate also have a dramatic effect on herring body size at age. Withinthe GOA region, PWS herring size-at-age trends oscillated with a maximum in spectraldensity at a period of 13 years for all ages, but strongest in 3–5 year-old herring(Brown, 2003) (Fig.22) Size-at-age trends were also significantly correlated with peakzooplankton density lagged 1 year, corresponding to the food available to herring
290 Long-Term Ecological Change in the Northern Gulf of Alaska
Figure 22: Size-at-age by weight (g) of age 3–8 Pacific herring from PWS aresignificantly correlated with peak zooplankton density anomalies (from
southwestern PWS) for the period of 1973 to 1999 of the size-at-age data plottedwith a 4-year moving- average transformation of peak zooplankton anomaly.
Ch04-N52960 8/22/06 11:14 AM Page 290
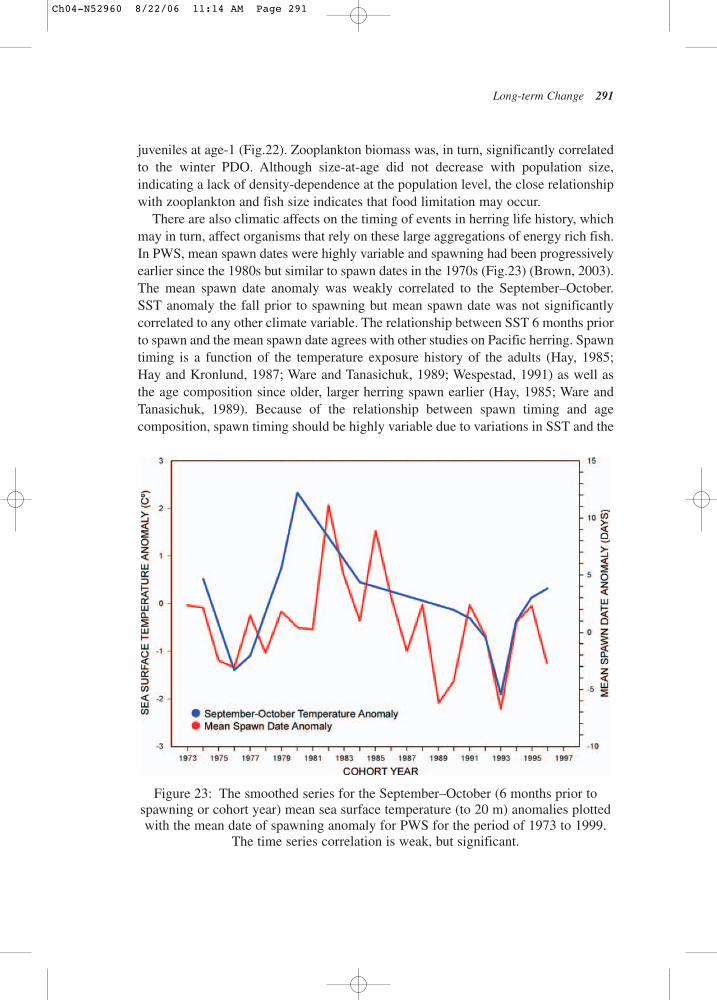
juveniles at age-1 (Fig.22). Zooplankton biomass was, in turn, significantly correlatedto the winter PDO. Although size-at-age did not decrease with population size, indicating a lack of density-dependence at the population level, the close relationshipwith zooplankton and fish size indicates that food limitation may occur.
There are also climatic affects on the timing of events in herring life history, whichmay in turn, affect organisms that rely on these large aggregations of energy rich fish.In PWS, mean spawn dates were highly variable and spawning had been progressivelyearlier since the 1980s but similar to spawn dates in the 1970s (Fig.23) (Brown, 2003).The mean spawn date anomaly was weakly correlated to the September–October. SST anomaly the fall prior to spawning but mean spawn date was not significantlycorrelated to any other climate variable. The relationship between SST 6 months priorto spawn and the mean spawn date agrees with other studies on Pacific herring. Spawntiming is a function of the temperature exposure history of the adults (Hay, 1985; Hay and Kronlund, 1987; Ware and Tanasichuk, 1989; Wespestad, 1991) as well asthe age composition since older, larger herring spawn earlier (Hay, 1985; Ware andTanasichuk, 1989). Because of the relationship between spawn timing and age composition, spawn timing should be highly variable due to variations in SST and the
Long-term Change 291
Figure 23: The smoothed series for the September–October (6 months prior tospawning or cohort year) mean sea surface temperature (to 20 m) anomalies plottedwith the mean date of spawning anomaly for PWS for the period of 1973 to 1999.
The time series correlation is weak, but significant.
Ch04-N52960 8/22/06 11:14 AM Page 291
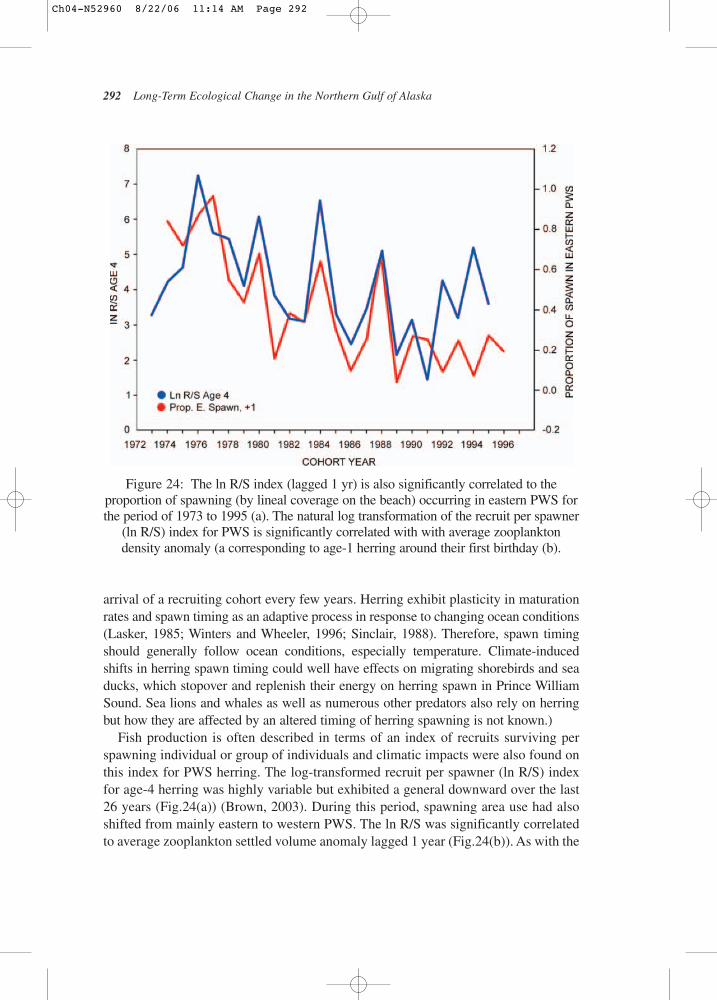
arrival of a recruiting cohort every few years. Herring exhibit plasticity in maturationrates and spawn timing as an adaptive process in response to changing ocean conditions(Lasker, 1985; Winters and Wheeler, 1996; Sinclair, 1988). Therefore, spawn timingshould generally follow ocean conditions, especially temperature. Climate-inducedshifts in herring spawn timing could well have effects on migrating shorebirds and seaducks, which stopover and replenish their energy on herring spawn in Prince WilliamSound. Sea lions and whales as well as numerous other predators also rely on herringbut how they are affected by an altered timing of herring spawning is not known.)
Fish production is often described in terms of an index of recruits surviving perspawning individual or group of individuals and climatic impacts were also found onthis index for PWS herring. The log-transformed recruit per spawner (ln R/S) indexfor age-4 herring was highly variable but exhibited a general downward over the last26 years (Fig.24(a)) (Brown, 2003). During this period, spawning area use had alsoshifted from mainly eastern to western PWS. The ln R/S was significantly correlatedto average zooplankton settled volume anomaly lagged 1 year (Fig.24(b)). As with the
292 Long-Term Ecological Change in the Northern Gulf of Alaska
Figure 24: The ln R/S index (lagged 1 yr) is also significantly correlated to theproportion of spawning (by lineal coverage on the beach) occurring in eastern PWS forthe period of 1973 to 1995 (a). The natural log transformation of the recruit per spawner
(ln R/S) index for PWS is significantly correlated with with average zooplanktondensity anomaly (a corresponding to age-1 herring around their first birthday (b).
Ch04-N52960 8/22/06 11:14 AM Page 292
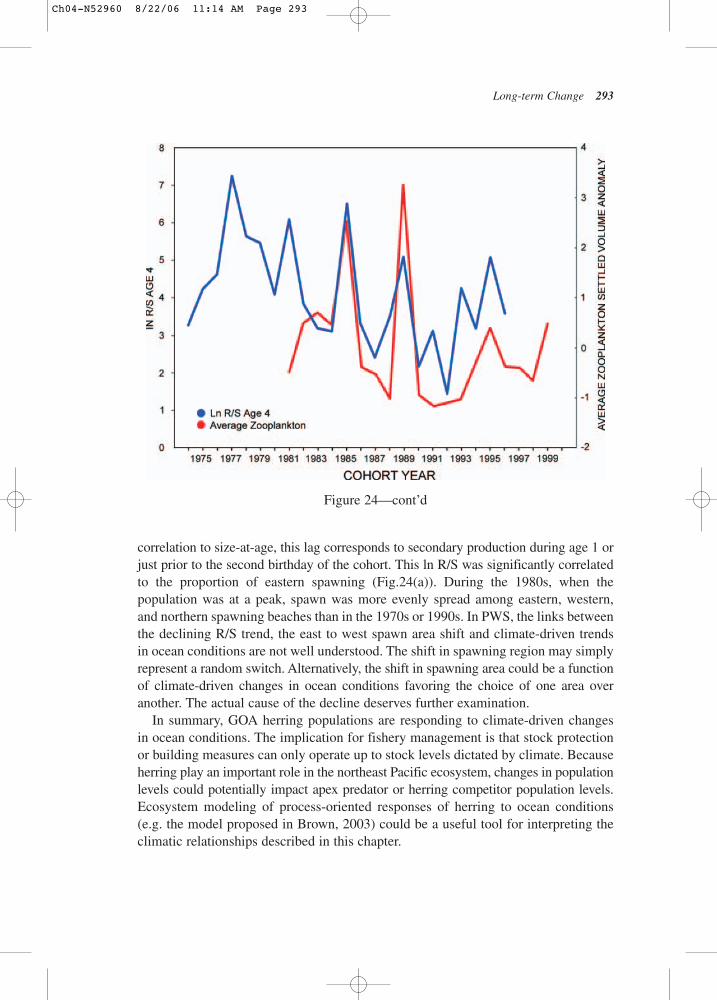
Long-term Change 293
correlation to size-at-age, this lag corresponds to secondary production during age 1 orjust prior to the second birthday of the cohort. This ln R/S was significantly correlatedto the proportion of eastern spawning (Fig.24(a)). During the 1980s, when the population was at a peak, spawn was more evenly spread among eastern, western, and northern spawning beaches than in the 1970s or 1990s. In PWS, the links betweenthe declining R/S trend, the east to west spawn area shift and climate-driven trends in ocean conditions are not well understood. The shift in spawning region may simplyrepresent a random switch. Alternatively, the shift in spawning area could be a functionof climate-driven changes in ocean conditions favoring the choice of one area overanother. The actual cause of the decline deserves further examination.
In summary, GOA herring populations are responding to climate-driven changes in ocean conditions. The implication for fishery management is that stock protectionor building measures can only operate up to stock levels dictated by climate. Becauseherring play an important role in the northeast Pacific ecosystem, changes in populationlevels could potentially impact apex predator or herring competitor population levels.Ecosystem modeling of process-oriented responses of herring to ocean conditions(e.g. the model proposed in Brown, 2003) could be a useful tool for interpreting theclimatic relationships described in this chapter.
Figure 24—cont’d
Ch04-N52960 8/22/06 11:14 AM Page 293
4.6. Groundfish Wiebke Boeing, Michael H. Martin, and Janet T. Duffy-Anderson
4.6.1. Introduction
In this chapter, long-term changes are presented for several ecologically and econom-ically important groundfish species in the Gulf of Alaska: walleye pollock (Theragrachalcogramma), Pacific cod (Gadus macrocephalus), arrowtooth flounder(Atheresthes stomias), and Pacific ocean perch (Sebastes alutus). Walleye pollock andPacific cod are in the family gadidae; arrowthooth flounder, pleuronectidae, andPacific ocean perch, scorpaenidae. Various factors that might have impacted each of these populations and caused the observed changes are discussed. These species aregenerally representative of major fish species complexes of the GOA, and historical(20+ years) estimates of adult and larval abundances are used to examine populationchanges.
Total biomass of each groundfish species over the last 42 years (25 years for Pacificcod) has been estimated with species-specific age-based or length-based models(A’mar et al., 2003). Briefly, for walleye pollock, data integrated by the model includefishery catch and age composition, National Marine Fisheries Service (NMFS)bottom trawl and Echo-Integration Trawl survey estimates of age composition andbiomass, and egg production estimates of spawning biomass (among other factors).The model for Pacific cod utilizes a length-structured model and includes commercialcatch-data (biomass, size composition), NMFS survey data (size composition andabundance), and length–weight relationships to estimate total biomass (among otherparameters). The model used for arrowtooth flounder includes survey estimates fromthe International Pacific Halibut Commission in addition to the NMFS groundfishtrawl survey data, and size composition estimates for selected years. Fishery catch andsize data are also incorporated. Finally, for Pacific ocean perch, the model used is ageneric rockfish model that integrates information on age structure, size composition,fishery catch data, and survey biomass estimates (when available) to estimate totalbiomass. For all species, modeled results have been used instead of actual biomassestimates, because annual estimates are limited to survey data and some applied correction factors, whereas the models provide longer, more complete time series withretrospective analyses to estimate population biomass. The NMFS survey, conductedby the Resource Assessment and Conservation Engineering Division (RACE) of the Alaska Fisheries Science Center (AFSC), has been collecting data on a triennialbasis since 1984 and biennially since 1999. The survey uses a high-opening Poly-Nor’eastern bottom trawl (127 mm mesh) with rubber bobbin roller gear.Surveys average 800 tows (range: 489–929 tows) and span the entire GOA (133–170°W).The GOA is divided into the Eastern (133–147°W), Central (147–159°W),
294 Long-Term Ecological Change in the Northern Gulf of Alaska
Ch04-N52960 8/22/06 11:14 AM Page 294
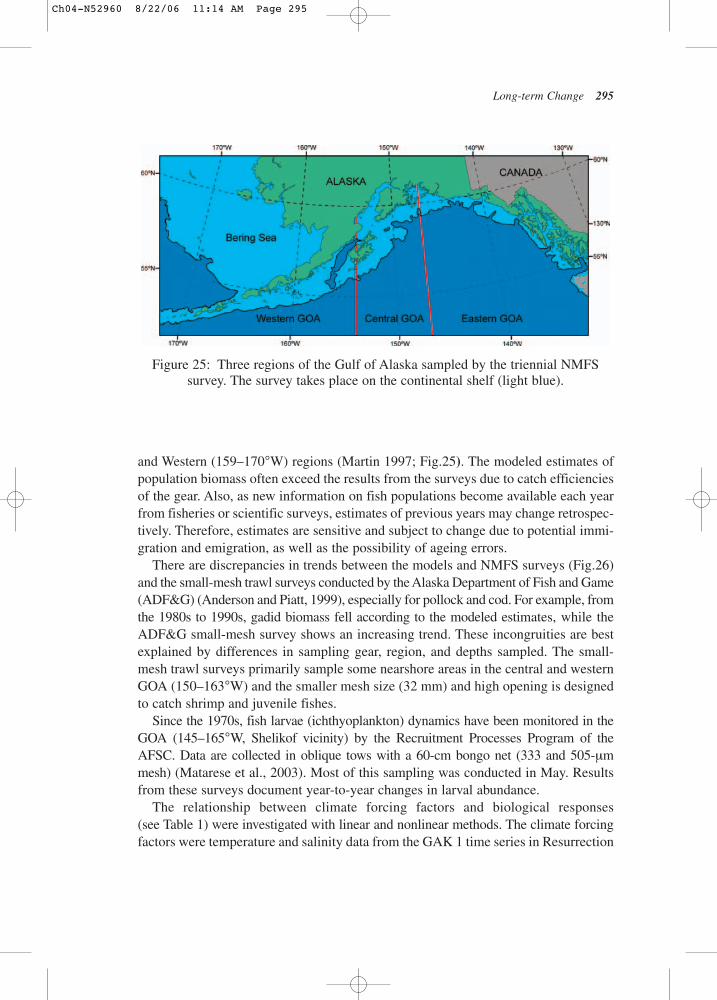
and Western (159–170°W) regions (Martin 1997; Fig.25). The modeled estimates ofpopulation biomass often exceed the results from the surveys due to catch efficienciesof the gear. Also, as new information on fish populations become available each yearfrom fisheries or scientific surveys, estimates of previous years may change retrospec-tively. Therefore, estimates are sensitive and subject to change due to potential immi-gration and emigration, as well as the possibility of ageing errors.
There are discrepancies in trends between the models and NMFS surveys (Fig.26)and the small-mesh trawl surveys conducted by the Alaska Department of Fish and Game(ADF&G) (Anderson and Piatt, 1999), especially for pollock and cod. For example, fromthe 1980s to 1990s, gadid biomass fell according to the modeled estimates, while theADF&G small-mesh survey shows an increasing trend. These incongruities are bestexplained by differences in sampling gear, region, and depths sampled. The small-mesh trawl surveys primarily sample some nearshore areas in the central and westernGOA (150–163°W) and the smaller mesh size (32 mm) and high opening is designedto catch shrimp and juvenile fishes.
Since the 1970s, fish larvae (ichthyoplankton) dynamics have been monitored in theGOA (145–165°W, Shelikof vicinity) by the Recruitment Processes Program of theAFSC. Data are collected in oblique tows with a 60-cm bongo net (333 and 505-µmmesh) (Matarese et al., 2003). Most of this sampling was conducted in May. Resultsfrom these surveys document year-to-year changes in larval abundance.
The relationship between climate forcing factors and biological responses (see Table 1) were investigated with linear and nonlinear methods. The climate forcingfactors were temperature and salinity data from the GAK 1 time series in Resurrection
Long-term Change 295
Figure 25: Three regions of the Gulf of Alaska sampled by the triennial NMFSsurvey. The survey takes place on the continental shelf (light blue).
Ch04-N52960 8/22/06 11:14 AM Page 295
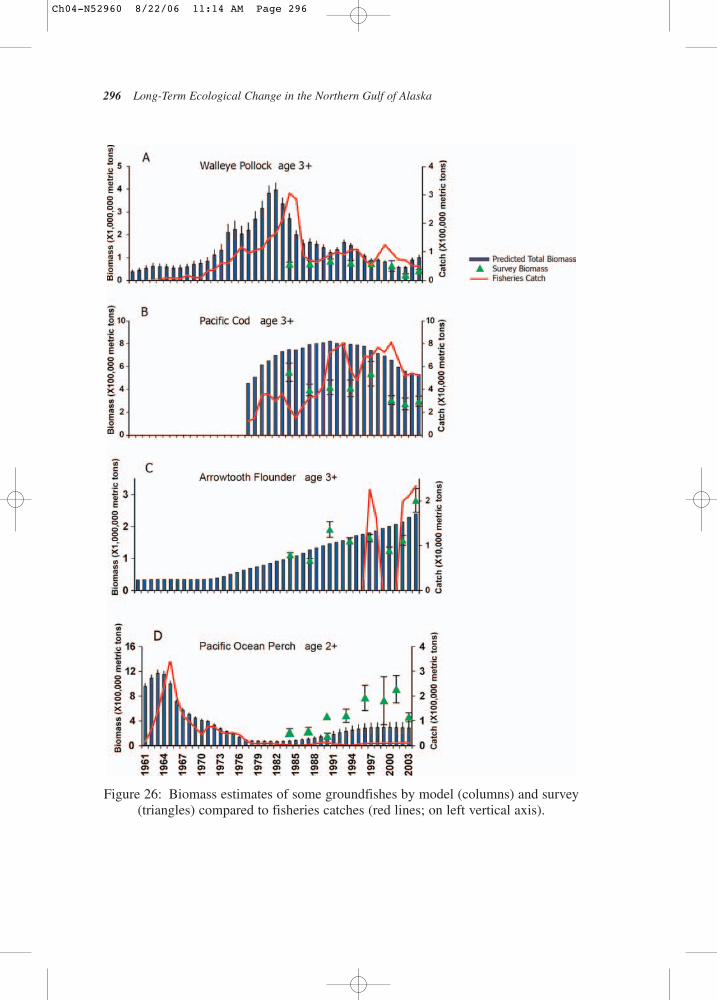
296 Long-Term Ecological Change in the Northern Gulf of Alaska
Figure 26: Biomass estimates of some groundfishes by model (columns) and survey(triangles) compared to fisheries catches (red lines; on left vertical axis).
Ch04-N52960 8/22/06 11:14 AM Page 296
Bay (http://www.ims.uaf.edu/gak1/), National Centers for Environmental Predictionreanalysis of surface temperature and the Pacific Decadal Oscillation (ftp://ftp.atmos.washington.edu/mantua/pnw_impacts/INDICES/PDO.latest). Wind-mixing datawere provided by Nick Bond (personal communication; http://www.pfeg.noaa.gov:16080/products/las/docs/), and the retention index was estimated by Mick Spillane(personal communication) from a semispectral primitive equation model (SPEM) ofShelikof Strait (http://www.pmel.noaa.gov/foci/spem-ibm.html).
4.6.2. Walleye Pollock
Walleye pollock (Theragra chalcogramma) are widely distributed in the PacificOcean north of California. Adult pollock form schools in the open ocean and are closeto the bottom over the continental ocean shelf. They reach maturity at around 4 yearsand live up to 15 years. For the last two decades, it has been one of the most abundantgroundfish in the GOA and supported a large commercial fishery since the early1970s (Megrey, 1989). The GOA biomass of adults (3+ years) was estimated to be500,000 metric tons (t) during the 1960s and early 1970s, and the model shows asteady, strong increase until the population peaked in 1982 at just below 4 million t(Fig.26(A)). The rapid decrease following 1982 was interrupted in the early 1990sbefore it continued downward to a minimum value of 570,000 t in 2000–2001. Thisis comparable to the values recorded in the 1960s. Since 2001, the biomass hasincreased again due to a strong recruitment in the 1999 year-class (Livingston, 2003),and the current estimate is just below 1 million t. Although triennial survey data indi-cate that walleye pollock were fairly steady from 1984 to 1999 at around 750,000 t,they exhibited a significant decrease over time (r2 = 0.54) due to the low estimates ofthe last two surveys. Traditionally pollock were most abundant around Kodiak Island,but survey catches in recent years have increased west of the Shumagin Islands alongthe Alaska Peninsula (Fig.25).
In the GOA, pollock spawn in Shelikof Strait mainly in late March and early April,with females producing up to 1.2 million eggs (Matarese et al., 2003), and their larvaeare more abundant than any other species in the spring (Matarese et al., 2003). Larvalabundance is highly variable from year to year, although average catches in May stayedtypically below 1000 larvae per 10 m2, except for the extremely high abundancesobserved in 1981 (coinciding with maximum adult pollock biomass) and 1996 (Fig.27).
4.6.3. Pacific Cod
Pacific cod (Gadus macrocephalus) is a benthic gadid living along the continental shelf.This species matures at 2–3 yrs and lives as long as 13 years. Cod show significant
Long-term Change 297
Ch04-N52960 8/22/06 11:14 AM Page 297
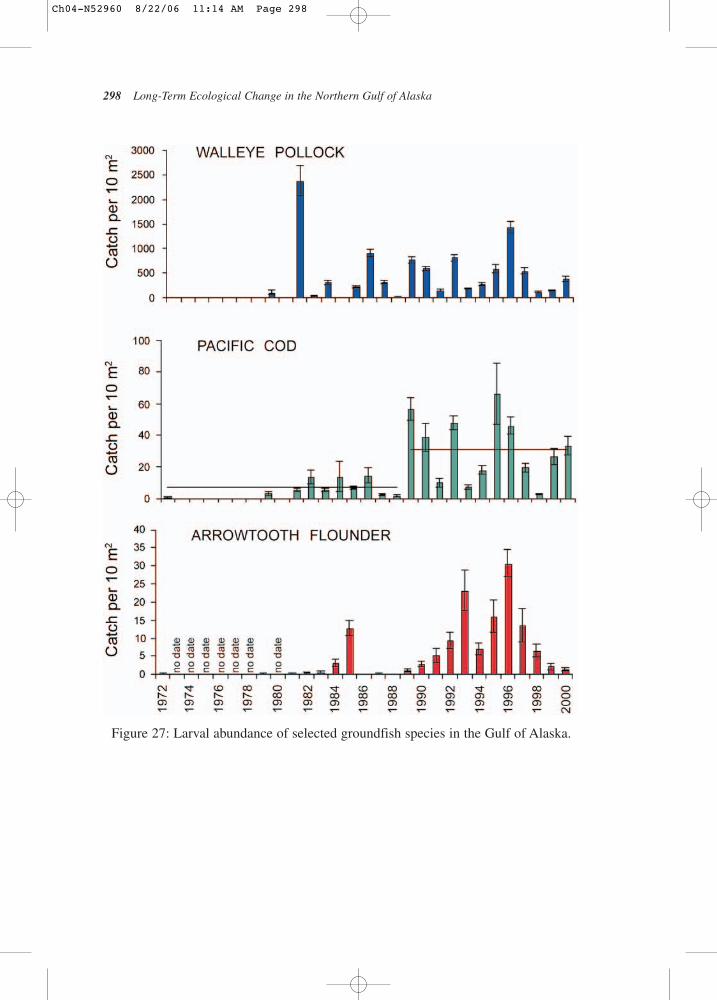
298 Long-Term Ecological Change in the Northern Gulf of Alaska
Figure 27: Larval abundance of selected groundfish species in the Gulf of Alaska.
Ch04-N52960 8/22/06 11:14 AM Page 298
migration between the GOA and Bering Sea (Shimada and Kimura, 1994), and geneticstudies have been unable to separate them into distinct stocks (Grant et al., 1987).According to model estimates, biomass of Pacific cod showed a slight increasethrough the early 1990s (from 500,000 t in 1978 to 860,000 t), followed by a gradualdecline (540,000 t in 2003) (Fig.26(B)). Similar to walleye pollock, the survey bio-mass estimates have been consistently below the modeled estimates, but they alsoshow a decreasing trend since 1984 (r2 = 0.52). Between 1984 and 1996, biomassvalues were above 400,000 t and below 300,000 t since 1999.
Pacific cod are winter–spring spawners, and their larvae are most abundant in Apriland May. Females produce up to 3 million demersal eggs. Highest larval abundance isfound west of Kodiak Island along the Alaska Peninsula in spring (Matarese et al.,2003). There was a stepwise increase of larval abundance from the 1980s (7 larvae per 10 m2) to the values after 1989 (31 larvae per 10 m2) (Runs test, p = 0.001; Fig.27)despite the decreasing trend of adult biomass.
4.6.4. Arrowtooth Flounder
Arrowtooth flounder (Atheresthes stomias) range from the Bering Sea to centralCalifornia. They are commonly found along the continental shelf and slope and prefersoft muddy bottoms. They mature at approximately 3 to 5 years of age (Zimmermannand Goddard, 1996; Zimmermann, 1997) and may live as long as 23 years (Eschmeyeret al., 1983). Adult biomass was estimated to be around 335,000 t between 1961 and1971. Subsequently, the population in the GOA steadily increased to 2,400,000 t in2003 (Fig.26(c). It is currently the most abundant groundfish in the GOA. Survey esti-mates of arrowtooth flounder biomass show an increasing trend over time, which issignificant for the eastern (r2 = 0.70) and western (r2 = 0.51) but not the central GOA.
Spawning takes place after September in the GOA, and larvae are found fromJanuary until June with highest abundance along the shelf edge (Matarese et al.,2003). Larval abundance is also clearly higher in the 1990s as compared to the 1980s(Fig.27), although recent years have shown a decrease.
4.6.5. Pacific Ocean Perch
Pacific ocean perch (Sebastes alutus) is the most abundant rockfish along the conti-nental slope from California to the Bering Sea. They are very slow-growing, matureat approximately 7 or 8 yrs of age, and may live more than 90 years (Leaman, 1991).Biomass estimates were high in the early 1960s with a peak of 1,150,000 t in 1963.Afterwards, biomass dramatically declined to about 70,000 t in the late 1970s andearly 1980s. Since the mid-1980s, the population biomass has slowly recovered and
Long-term Change 299
Ch04-N52960 8/22/06 11:14 AM Page 299
is currently estimated at around 290,000 t (Fig.26(D)). Estimates from the triennialsurvey reflect the recovery since the mid-1980s (r2 = 0.52), and are above the mod-eled estimates. Unusually large survey catches, especially of the 1996–2001 surveys,have made these estimates highly uncertain and may indicate that the annual biomass estimates from the model are imprecise (Hanselman et al., 2003).
Spawning occurs in early winter, and species of the genus Sebastes are live-bearers. Larvae are released in April–May, but can rarely be identified to speciesexcept by molecular analysis (Gharrett et al., 2001), so species-specific larval abundanceestimates are not available.
4.6.6. Explaining Population Change
There have been three major shifts in population biomasses among key species in theGOA: Pacific ocean perch reached their peak biomass in the mid-1960s and declinedrapidly thereafter; gadids (walleye pollock and Pacific cod) were the dominant biomass in the GOA throughout most of the 1980s; and the biomass of arrowtoothflounder, and to a lesser extent of other flatfishes has continually increased since themid-1970s, recently (early 1990s) surpassing walleye pollock as the dominant fishbiomass in the region. Changes in population biomass in the GOA may be due tophysical factors, such as climate forcing, biological factors (such as density-depend-ent competition and predation), fishing mortality, or, more likely, to some combina-tion of these effects, influencing each species at particular life history stages.
Climate forcingThe North Pacific Ocean appears to oscillate between warm and cold regimes on amultidecadal timescale (Hare and Mantua, 2000). The shift in 1976–1977 from a coldto a warm regime is believed to be the cause for the extensive restructuring of themarine community in the GOA, and in particular, to the rise of groundfish and flatfishstocks over forage fishes and shrimps (Anderson and Piatt, 1999). Temperature coulddirectly affect adult or larval mortality. It is also possible that the dramatic changes inthe marine community of the northern GOA in the mid-1970s are caused by interac-tion of increased precipitation, stronger wind, and higher temperatures that are mani-fested through changes in the distribution and abundance of planktonic productionand mediated through the food web. The data presented here suggest little relationbetween immediate shifts in adult groundfish biomass and climate indices. Such aresult was not entirely unexpected, and it seems unlikely that mortality of adult fisheswould be directly impacted by shifts in the abiotic environment, given that adult fishare able to compensate for suboptimal climate conditions by altering their metabolismand/or behavior (Bryan et al., 1990; and Thurston and Gehrke, 1993). Populations of
300 Long-Term Ecological Change in the Northern Gulf of Alaska
Ch04-N52960 8/22/06 11:14 AM Page 300
long-lived organisms are buffered from or can lag dramatic climatic changes to theextent their populations integrate over longer periods of time than short-lived animals.Shifts in biomass of adult fishes may be more closely tied to shifts in distributionalabundance since adult fish are highly mobile and able to follow optimal clines in tem-perature, salinity, or food availability. Juvenile mortality is also less likely to bedirectly impacted by abiotic stresses for many of the same reasons that adult mortal-ity is largely unaffected. Larval stages, however, are far more responsive to shifts inthe physical environment and, in fact, increases in recruitment in several groundfisheswere observed after the regime shift (Hollowed et al., 2001). Larvae are underdevel-oped at hatching; they are weak swimmers that depend on favorable water currents totransport and retain them in suitable nursery areas. Furthermore, larvae have very highenergy needs for their size and no energy reserves (Brett and Groves, 1979), so theyare at increased risk of starvation compared to adult and juvenile stages, making theirsurvival particularly vulnerable to even subtle physical changes (i.e. water tempera-ture; Houde and Zastrow, 1993), salinity (Ottesen and Bolla, 1998), turbulence(Bailey and Macklin, 1994), or advection to unsuitable nursery areas (Bailey andPicquelle, 2002). Therefore, larvae are probably the most vulnerable life stage to directimpacts of climate variations, while mortality among juvenile and adult stages are prob-ablly modulated more by indirect biotic effects (see the following text). However, thereare many climate factors (Table 1) that may confound discovering simple relationships(see the section titled “Biological controls”). Of the examined species, walleye pol-lock larval abundance was positively correlated with higher retention (years of higheddy occurrence on the continental shelf). Temperature and wind mixing negativelyaffected abundance of Pacific cod larvae; however, recruitment had a positive rela-tionship to temperature. Similarly, arrowtooth flounder had increased larvae abun-dances in years of high retention, although recruitment was negatively affected by thatrelationship (Table 1). These examples demonstrate that total larval abundance is not
Long-term Change 301
Table 1: Impact of environmental variables on larval abundance and recruitment.Values represent significant correlation coefficients.
Walleye pollock Pacific cod Arrowtooth flounder
Larvae Recruitment Larvae Recruitment Larvae Recruitment
Temperature n.s. n.s. −0.77 0.68 −0.44 n.s.Salinity n.s. 0.62 0.76 n.s. n.s. −0.46Wind mixing n.s. n.s. −0.67 n.s. n.s. n.s.Retention 0.64 n.s. n.s. −0.70 0.82 −0.55
index
Ch04-N52960 8/22/06 11:14 AM Page 301
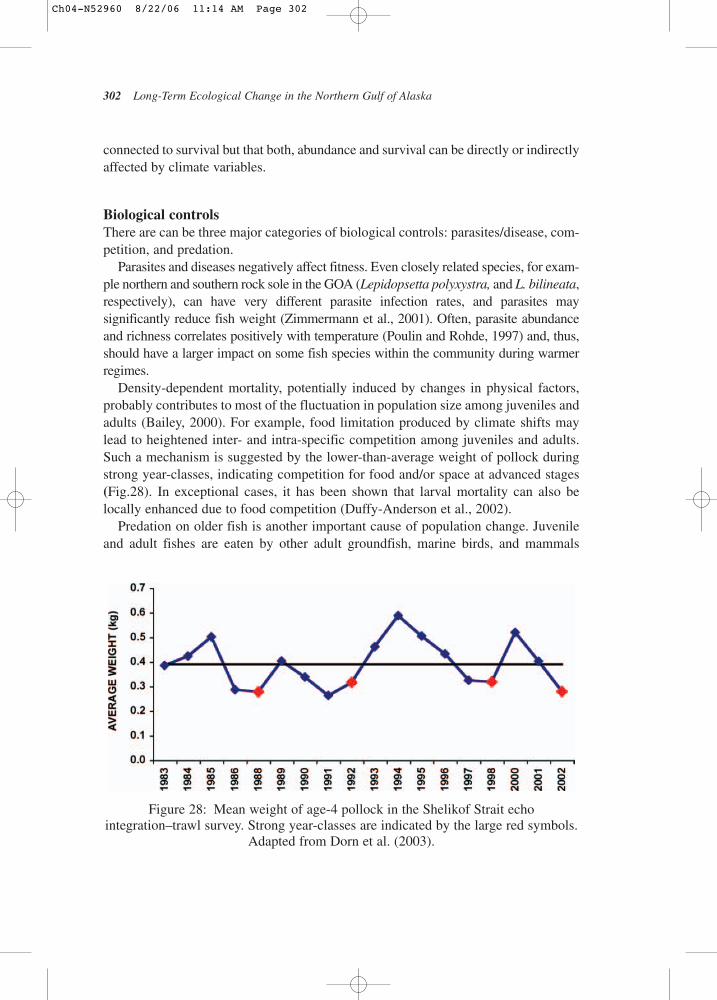
connected to survival but that both, abundance and survival can be directly or indirectlyaffected by climate variables.
Biological controlsThere are can be three major categories of biological controls: parasites/disease, com-petition, and predation.
Parasites and diseases negatively affect fitness. Even closely related species, for exam-ple northern and southern rock sole in the GOA (Lepidopsetta polyxystra, and L. bilineata,respectively), can have very different parasite infection rates, and parasites maysignificantly reduce fish weight (Zimmermann et al., 2001). Often, parasite abundanceand richness correlates positively with temperature (Poulin and Rohde, 1997) and, thus,should have a larger impact on some fish species within the community during warmerregimes.
Density-dependent mortality, potentially induced by changes in physical factors,probably contributes to most of the fluctuation in population size among juveniles andadults (Bailey, 2000). For example, food limitation produced by climate shifts maylead to heightened inter- and intra-specific competition among juveniles and adults.Such a mechanism is suggested by the lower-than-average weight of pollock duringstrong year-classes, indicating competition for food and/or space at advanced stages(Fig.28). In exceptional cases, it has been shown that larval mortality can also belocally enhanced due to food competition (Duffy-Anderson et al., 2002).
Predation on older fish is another important cause of population change. Juvenileand adult fishes are eaten by other adult groundfish, marine birds, and mammals
302 Long-Term Ecological Change in the Northern Gulf of Alaska
Figure 28: Mean weight of age-4 pollock in the Shelikof Strait echointegration–trawl survey. Strong year-classes are indicated by the large red symbols.
Adapted from Dorn et al. (2003).
Ch04-N52960 8/22/06 11:14 AM Page 302
(Brodeur and Wilson, 1996). The control of pollock recruitment to the adult populationchanged from the larval to the juvenile stage after the 1976–1977 regime change(Bailey, 2000), an excellent example of the effects of predation. This shift in controlof recruitment from the larval to the juvenile stage is presumably due to increasedpredation by large numbers of predatory fishes on juvenile pollock (see section VI. fora discussion of top-down controls of fish recruitment). Predators also eat large num-bers of eggs (Brodeur et al., 1996) and larvae (Fancett and Jenkins, 1988; and Baileyand Houde, 1989), though it is generally believed that survival among larvae is pri-marily controlled by density-independent factors (Bailey et al., 1996).
According to the oscillating control hypothesis (OCH) (Hunt et al., 2002), a closeconnection between climate and biological controls exists in the North Pacific. A warm regime is believed to favor high zooplankton production, providing a plenti-ful food source for larvae and juvenile fishes. Such a scenario would support strongrecruitment to the adult population of predatory fishes (e.g. walleye pollock andarrowtooth flounder), which in turn exerts a strong top-down regulation (predation)on smaller fish (e.g. forage species and their own juveniles). Further, the OCH predicts that a cold regime will lead to bottom-up regulation. Low temperatureswill limit zooplankton production, enhancing competition and reducing larval andjuvenile fish survival. The hypothesis predicts that the adult piscivorous fish commu-nity would decline, releasing small fish species from predation pressure. Adult pisciv-orous fish are also hypothesized to more susceptible to fishing pressure during coldclimate regimes. (Also see the discussion on OCH in Chapter 6).
Fisheries effectsClimate shifts and their indirect repercussions in the food web certainly have con-tributed to observed changes in fish biomass in the GOA due to shifts in recruitment(Hollowed et al., 2001), but the effects of fishing should not be overlooked. In con-trast to climate forcing, fisheries have little or no direct effect on larvae or juvenile mor-tality. Also species of low commercial value such as arrowtooth flounder (Greene andBabbitt, 1990; and Porter et al., 1993) are only minimally impacted by fishing efforts(i.e. bycatch). However, fisheries can significantly contribute to mortality of adult fishpopulations, especially species with low growth rates and an advanced age at matu-rity (sexual reproduction). The fishery for Pacific ocean perch provides a prime exam-ple. In the 1960s, up to 35% of the Pacific ocean perch biomass was caught on anannual basis, and it is largely believed that this overfishing was responsible for theprecipitous crash of the Pacific ocean perch population in the GOA in the late 1960sand early 1970s (Kramer and O’Connell, 1995; and Hanselman et al., 2003). Quotasregulating fisheries activity started in 1986, and management efforts seem to be suc-cessful in aiding species recovery (Fig.26(D)). It is interesting to speculate that therise in gadid populations in the 1980s may have been precipitated not by climate
Long-term Change 303
Ch04-N52960 8/22/06 11:14 AM Page 303
shifts alone, but also by a release from competition for food due to the diminishednumbers of Pacific ocean perch. We caution, however, that the effects of fisheries onpopulation biomass in general are somewhat obscure due to the confounding effectsof directed fishing effort, and to the superimposed effects of climate variation.
Summary
Modeled long-term dynamics and sampling data of several groundfish species in theGulf of Alaska were analyzed. Pacific ocean perch (Sebastes alutus) dominated in the1960s, the gadid walleye pollock (Theragra chalcogramma) in the 1980s, and arrow-tooth flounder (Atheresthes stomias) is presently the most abundant species in the fishcommunity.
Although inter-decadal changes in the groundfish community in the Gulf of Alaskaare well documented, the exact causes remain elusive. Simultaneously varying forc-ing factors obscure the relationship between forces of change (climate, competition,predation, fishery, and parasites or disease) and groundfish population dynamics.Most likely, the major driving force for fish larvae and its food supply are climaticfactors; for juvenile fishes, biological factors, and for the adult populations; biologi-cal factors and fishing pressure.
Climate change, indirect biological controls, and fishing mortality exert consider-able influence. Disease and parasities can also contribute to population fluctuation. It seems most likely that these and other factors act in concert over all life historystages to affect population abundance of groundfishes in the GOA. We found evidencethat fishing in the 1960s and 1970s caused the decline of Pacific ocean perch.Biological and climate forcings combined with a high population doubling time probably delayed the recovery of the population. The population dynamics of gadidsare complex, and top-down and bottom-up factors seem to alternate as the drivingforce. Favorable climate possibly contributed to the increase in biomass of walleyepollock in the 1980s, and biological top-down factors may have led to the decline.Arrowtooth flounder is only minimally impacted by fisheries, and we expect that biological forcings – such as release from competition and predation by gadids- andclimate forcings dominate population dynamics. The GOA is an enormously complexand dynamic ecosystem, and continued effort directed toward long-term monitoringis essential to credibly forecast future population trends.
AcknowledgementsWe would like to thank Sandra Lowe, Martin Dorn, Dana Hanselman, GrantThompson, Jack Turnock, Jeff Napp, Kevin Bailey, and Mark Wilkins for providingdata and constructive comments. This contribution is partially funded by the Joint
304 Long-Term Ecological Change in the Northern Gulf of Alaska
Ch04-N52960 8/22/06 11:14 AM Page 304
Institute for the Study of the Atmosphere and Ocean under NOAA CooperativeAgreement No. NA178RG1232.
4.7. Sea birds in the Gulf of Alaska Alan M. Springer
4.7.1. Introduction
Approximately 8 million seabirds of 26 species nest at some 800 colonies around therim of the GOA, and an additional 10 million birds and 2 species nest in the AleutianIslands (Table 2 and Fig.29). Clearly, it is not possible to monitor population trendsof all species or of any individual species at all locations where they are found. Manynest underground, are nocturnal, or both, and are especially difficult to study. Othersnest away from the coast or in forests and are similarly inaccessible.
Species about which we know the most in the GOA are those that are abundant,widespread, and conspicuous. These are common murres (Uria aalge) and black-legged kittiwakes (Rissa tridactyla), and, to a lesser extent, tufted puffins (Fraterculacirrhata). (Fig.30). On the order of 600,000 murres and 700,000 kittiwakes are foundin the northern Gulf of Alaska, with nesting colonies located on exposed cliff faces andbluffs in numerous locations. As a result, more is known about these two species,and their closely related congeners, thick-billed murres (Uria lomvia) and red-leggedkittiwakes (Rissa brevirostris), in the Aleutians and elsewhere than about any otherspecies of seabirds in Alaska. Tufted puffins score highly on the first two criteria –about 1,000,000 birds are widely distributed among many colonies in the GOA, butthey nest in burrows and crevices and thus are more difficult to study than murres andkittiwakes. Still, some things are known about them, and because their strategies forsurvival differ from murres and kittiwakes in several important ways, they are includedhere as focal species for what they may tell us about ecosystem change in the GOA.
Although less is known overall about most other species, we can learn fromthen about the nature of change in the GOA. Among these other species are Leach’sand fork-tailed storm petrels (Oceanodroma furcata and O. leucorhoa), marbled andKittlitz’s murrelets (Brachyramphus marmoratus and B. brevirostris), and pelagic andred-faced cormorants (Phalacrocorax pelagicus and P. urile) (Fig.31).
Murres and kittiwakes are conspicuous and comparatively easy to count, yet caremust be taken to count in ways that allow comparisons between years and locations(Hatch and Hatch, 1988, 1989; Byrd, 1989). This is especially important for murres,which have attendance patterns at colonies that vary throughout the day, between days, and between stages of the nesting cycle, and which often nest in such hugeaggregations that counting all of them is not feasible. Therefore, monitoring protocols
Long-term Change 305
Ch04-N52960 8/22/06 11:14 AM Page 305
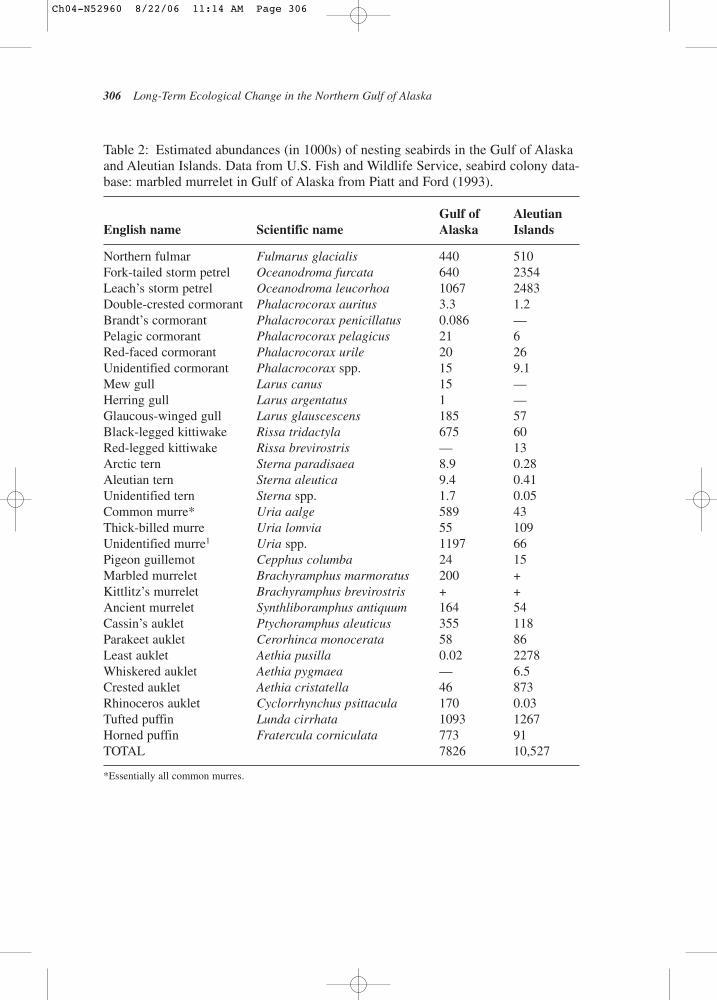
306 Long-Term Ecological Change in the Northern Gulf of Alaska
Table 2: Estimated abundances (in 1000s) of nesting seabirds in the Gulf of Alaskaand Aleutian Islands. Data from U.S. Fish and Wildlife Service, seabird colony data-base: marbled murrelet in Gulf of Alaska from Piatt and Ford (1993).
Gulf of Aleutian English name Scientific name Alaska Islands
Northern fulmar Fulmarus glacialis 440 510Fork-tailed storm petrel Oceanodroma furcata 640 2354Leach’s storm petrel Oceanodroma leucorhoa 1067 2483Double-crested cormorant Phalacrocorax auritus 3.3 1.2Brandt’s cormorant Phalacrocorax penicillatus 0.086 —Pelagic cormorant Phalacrocorax pelagicus 21 6Red-faced cormorant Phalacrocorax urile 20 26Unidentified cormorant Phalacrocorax spp. 15 9.1Mew gull Larus canus 15 —Herring gull Larus argentatus 1 —Glaucous-winged gull Larus glauscescens 185 57Black-legged kittiwake Rissa tridactyla 675 60Red-legged kittiwake Rissa brevirostris — 13Arctic tern Sterna paradisaea 8.9 0.28Aleutian tern Sterna aleutica 9.4 0.41Unidentified tern Sterna spp. 1.7 0.05Common murre* Uria aalge 589 43Thick-billed murre Uria lomvia 55 109Unidentified murre1 Uria spp. 1197 66Pigeon guillemot Cepphus columba 24 15Marbled murrelet Brachyramphus marmoratus 200 +Kittlitz’s murrelet Brachyramphus brevirostris + +Ancient murrelet Synthliboramphus antiquum 164 54Cassin’s auklet Ptychoramphus aleuticus 355 118Parakeet auklet Cerorhinca monocerata 58 86Least auklet Aethia pusilla 0.02 2278Whiskered auklet Aethia pygmaea — 6.5Crested auklet Aethia cristatella 46 873Rhinoceros auklet Cyclorrhynchus psittacula 170 0.03Tufted puffin Lunda cirrhata 1093 1267Horned puffin Fratercula corniculata 773 91TOTAL 7826 10,527
*Essentially all common murres.
Ch04-N52960 8/22/06 11:14 AM Page 306
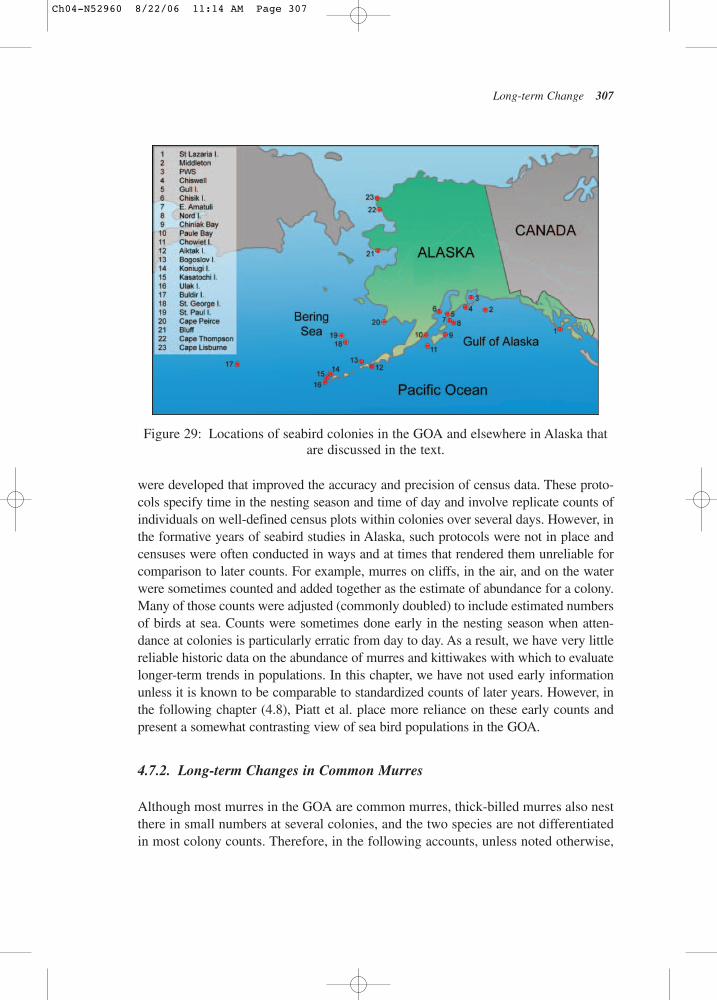
were developed that improved the accuracy and precision of census data. These proto-cols specify time in the nesting season and time of day and involve replicate counts ofindividuals on well-defined census plots within colonies over several days. However, inthe formative years of seabird studies in Alaska, such protocols were not in place andcensuses were often conducted in ways and at times that rendered them unreliable forcomparison to later counts. For example, murres on cliffs, in the air, and on the waterwere sometimes counted and added together as the estimate of abundance for a colony.Many of those counts were adjusted (commonly doubled) to include estimated numbersof birds at sea. Counts were sometimes done early in the nesting season when atten-dance at colonies is particularly erratic from day to day. As a result, we have very littlereliable historic data on the abundance of murres and kittiwakes with which to evaluatelonger-term trends in populations. In this chapter, we have not used early informationunless it is known to be comparable to standardized counts of later years. However, inthe following chapter (4.8), Piatt et al. place more reliance on these early counts andpresent a somewhat contrasting view of sea bird populations in the GOA.
4.7.2. Long-term Changes in Common Murres
Although most murres in the GOA are common murres, thick-billed murres also nestthere in small numbers at several colonies, and the two species are not differentiatedin most colony counts. Therefore, in the following accounts, unless noted otherwise,
Long-term Change 307
Figure 29: Locations of seabird colonies in the GOA and elsewhere in Alaska thatare discussed in the text.
Ch04-N52960 8/22/06 11:14 AM Page 307
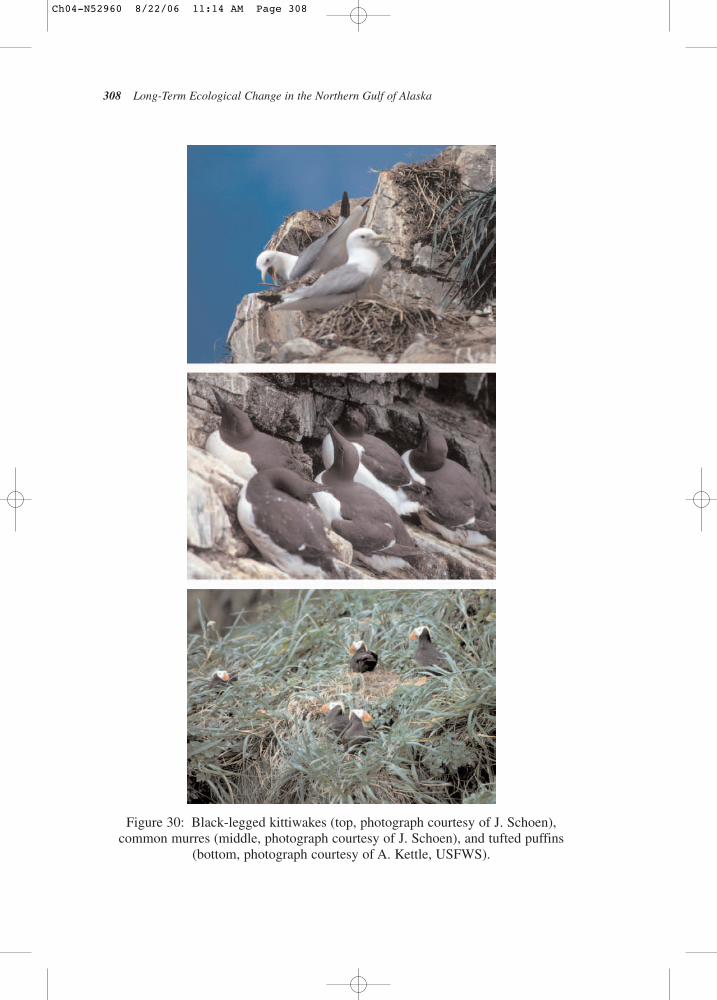
308 Long-Term Ecological Change in the Northern Gulf of Alaska
Figure 30: Black-legged kittiwakes (top, photograph courtesy of J. Schoen),common murres (middle, photograph courtesy of J. Schoen), and tufted puffins
(bottom, photograph courtesy of A. Kettle, USFWS).
Ch04-N52960 8/22/06 11:14 AM Page 308

Long-term Change 309
Figure 31: Leach’s storm petrel (upper left, photograph courtesy of N. Konyukhov),forked-tail storm petrel (upper right, photograph courtesy of G. Konyukhov),
marbled murrelet (middle left, photograph courtesy of the Exxon Valdez TrusteeCouncil), Kittlitz’s murrelet (photograph courtesy of Exxon Valdez Trustee
Council), common commorant (lower left, photograph courtesy of N. Konyukhov),and red-faced comorant (lower right, photograph courtesy of N. Konyukhov).
Ch04-N52960 8/22/06 11:14 AM Page 309
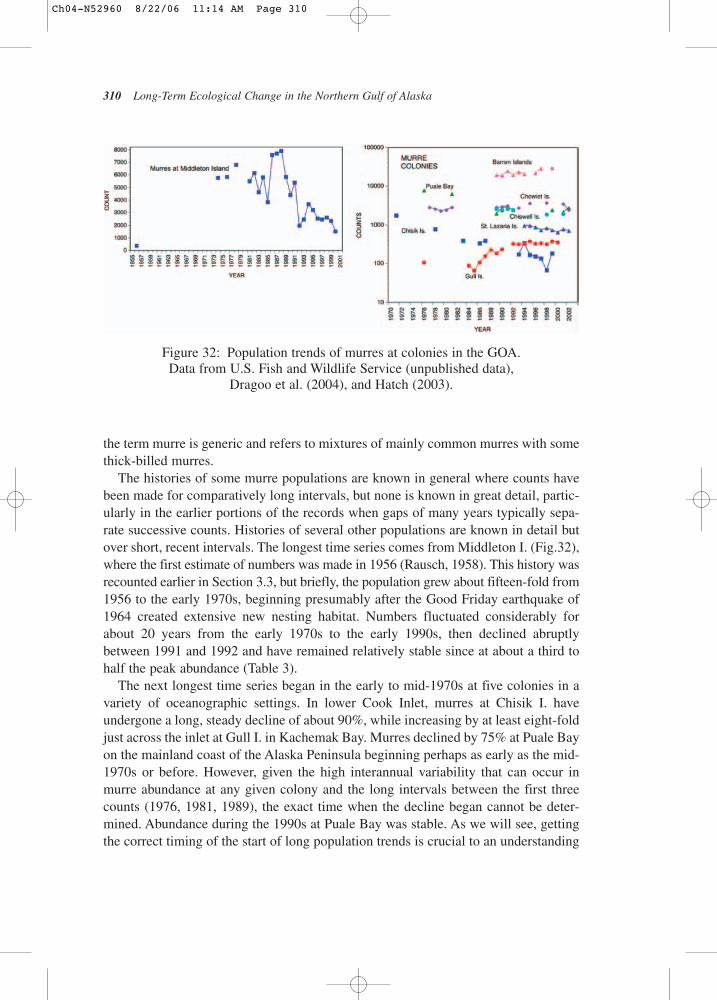
the term murre is generic and refers to mixtures of mainly common murres with somethick-billed murres.
The histories of some murre populations are known in general where counts havebeen made for comparatively long intervals, but none is known in great detail, partic-ularly in the earlier portions of the records when gaps of many years typically sepa-rate successive counts. Histories of several other populations are known in detail butover short, recent intervals. The longest time series comes from Middleton I. (Fig.32),where the first estimate of numbers was made in 1956 (Rausch, 1958). This history wasrecounted earlier in Section 3.3, but briefly, the population grew about fifteen-fold from1956 to the early 1970s, beginning presumably after the Good Friday earthquake of1964 created extensive new nesting habitat. Numbers fluctuated considerably forabout 20 years from the early 1970s to the early 1990s, then declined abruptlybetween 1991 and 1992 and have remained relatively stable since at about a third tohalf the peak abundance (Table 3).
The next longest time series began in the early to mid-1970s at five colonies in avariety of oceanographic settings. In lower Cook Inlet, murres at Chisik I. haveundergone a long, steady decline of about 90%, while increasing by at least eight-foldjust across the inlet at Gull I. in Kachemak Bay. Murres declined by 75% at Puale Bayon the mainland coast of the Alaska Peninsula beginning perhaps as early as the mid-1970s or before. However, given the high interannual variability that can occur inmurre abundance at any given colony and the long intervals between the first threecounts (1976, 1981, 1989), the exact time when the decline began cannot be deter-mined. Abundance during the 1990s at Puale Bay was stable. As we will see, gettingthe correct timing of the start of long population trends is crucial to an understanding
310 Long-Term Ecological Change in the Northern Gulf of Alaska
Figure 32: Population trends of murres at colonies in the GOA. Data from U.S. Fish and Wildlife Service (unpublished data),
Dragoo et al. (2004), and Hatch (2003).
Ch04-N52960 8/22/06 11:14 AM Page 310
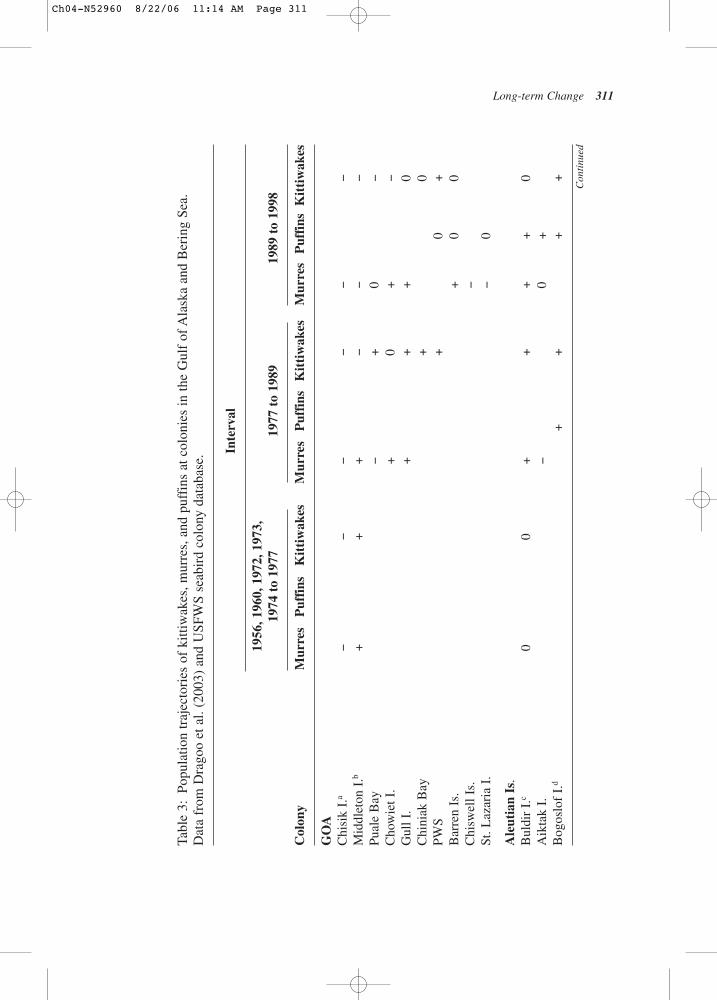
Long-term Change 311
Tabl
e 3:
Popu
latio
n tr
ajec
tori
es o
f ki
ttiw
akes
, mur
res,
and
puf
fins
at c
olon
ies
in th
e G
ulf
of A
lask
a an
d B
erin
g Se
a.
Dat
a fr
om D
rago
o et
al.
(200
3) a
nd U
SFW
S se
abir
d co
lony
dat
abas
e.
Inte
rval
1956
, 196
0, 1
972,
197
3,
1974
to
1977
1977
to
1989
1989
to
1998
Col
ony
Mur
res
Puf
fins
Kit
tiw
akes
Mur
res
Puf
fins
Kit
tiw
akes
Mur
res
Puf
fins
Kit
tiw
akes
GO
AC
hisi
k I.
a−
−−
−−
−M
iddl
eton
I.b
++
+−
−−
Pual
e B
ay−
+0
−C
how
iet I
.+
0+
−G
ull I
.+
++
0C
hini
ak B
ay+
0PW
S+
0+
Bar
ren
Is.
+0
0C
hisw
ell I
s.−
St. L
azar
ia I
.−
0
Ale
utia
n Is
.B
uldi
r I.
c0
0+
++
+0
Aik
tak
I.−
0+
Bog
oslo
f I.
d+
++
+
Con
tinu
ed
Ch04-N52960 8/22/06 11:14 AM Page 311
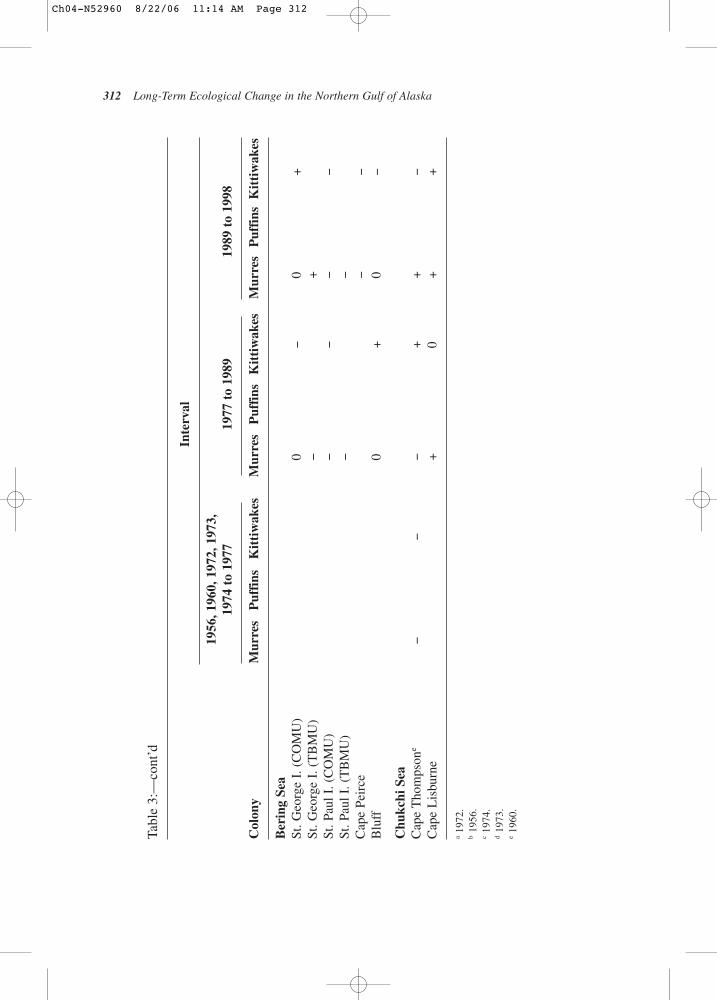
312 Long-Term Ecological Change in the Northern Gulf of Alaska
Tabl
e 3:
—co
nt’d
Inte
rval
1956
, 196
0, 1
972,
197
3,
1974
to
1977
1977
to
1989
1989
to
1998
Col
ony
Mur
res
Puf
fins
Kit
tiw
akes
Mur
res
Puf
fins
Kit
tiw
akes
Mur
res
Puf
fins
Kit
tiw
akes
Ber
ing
Sea
St. G
eorg
e I.
(C
OM
U)
0−
0+
St. G
eorg
e I.
(T
BM
U)
−+
St. P
aul I
. (C
OM
U)
−−
−−
St. P
aul I
. (T
BM
U)
−−
Cap
e Pe
irce
−−
Blu
ff0
+0
−
Chu
kchi
Sea
Cap
e T
hom
pson
e−
−−
++
−C
ape
Lis
burn
e+
0+
+
a19
72.
b19
56.
c19
74.
d19
73.
e19
60.
Ch04-N52960 8/22/06 11:14 AM Page 312
of cause and effect. At Chowiet I., in the Semidi Is. group, the number of murres wasvariable but mostly stable in the mid-1970s to early 1980s but increased by about 40%from then through the late 1990s.
Over more recent intervals, murre numbers at the Barren Is. (east. Amatuli I.,Nord I., and Light Rock) increased during the 1990s. Numbers at the Chiswell Is. nearthe mouth of Resurrection Bay were stable in 1989–1992 and declined sometimebetween then and the next count in 1998. At St. Lazaria I. in southeast Alaska, murresdeclined somewhat from 1995 through at least 2000.
Thus, no overall, broadscale trends in murre abundance in the GOA can be identi-fied from the reliable information at hand. No regional patterns are apparent either,although the sample size is small and not sufficient for a rigorous analysis. Rather,murres have increased, decreased, and remained stable over various intervals at thecolonies that have been monitored.
With this said, it must be pointed out that a previous analysis of change in murreabundance in the GOA reached a different conclusion by using counts at these andmany additional colonies over the years, regardless of when and how systematicallythe counts were made (Piatt and Anderson, 1996). In their analysis, Piatt andAnderson found evidence of decline at 15 of 16 colonies counted at least twice frombefore the Exxon Valdez oil spill and at least once afterward through 1994. The over-all decline was greater at colonies outside the spill path than in the path, suggestingthat factors other than the oil spill were responsible for the apparent declines.
Elsewhere to the west in the Aleutian Islands and Bering Sea, there are similarmixed trends. In the Aleutians, murres have increased conspicuously at Buldir I. in thewestern Aleutians since the early 1970s, and they increased by a factor of about fourat Koniuji I. in the central Aleutians since the early 1990s (Dragoo et al., 2004). At nearby Kasatochi I., there was no trend from 1980 to 1997, although numbersvaried by a factor of up to two between years. However, murres disappeared fromKasatochi I. in a matter of just 4 years, falling from over 2000 in 1997 to 50 in 1998and 0 in 2001. At a third nearby colony, Ulak I., numbers were variable between yearsbut without trend from 1997–2004. In the eastern Aleutians at Aiktak I., abundancehas been extremely variable since 1980, but also without a convincing long-termtrend. Numbers have apparently declined since the mid-1990s.
On the Pribilof Islands, both species of murres declined steadily on St. Paul I. after themid-1970s, whereas only thick-billed murres declined on St. George I., only until themid-1980s, after which time they returned to their former abundance. Numbers ofcommon murres at St. George I. have not changed and have exhibited little interannualvariability as well. At coastal colonies in the eastern Bering Sea, murres at Bluff declinedduring the late 1970s (the first count was in 1975) but increased slightly since then, andhave fluctuated and declined somewhat in Bristol Bay since 1990, when the first countwas made there. Even to the north in the Chukchi Sea there is no overall trend, withmurres at Cape Thompson declining from the mid-1970s through the mid-1980s and then
Long-term Change 313
Ch04-N52960 8/22/06 11:14 AM Page 313
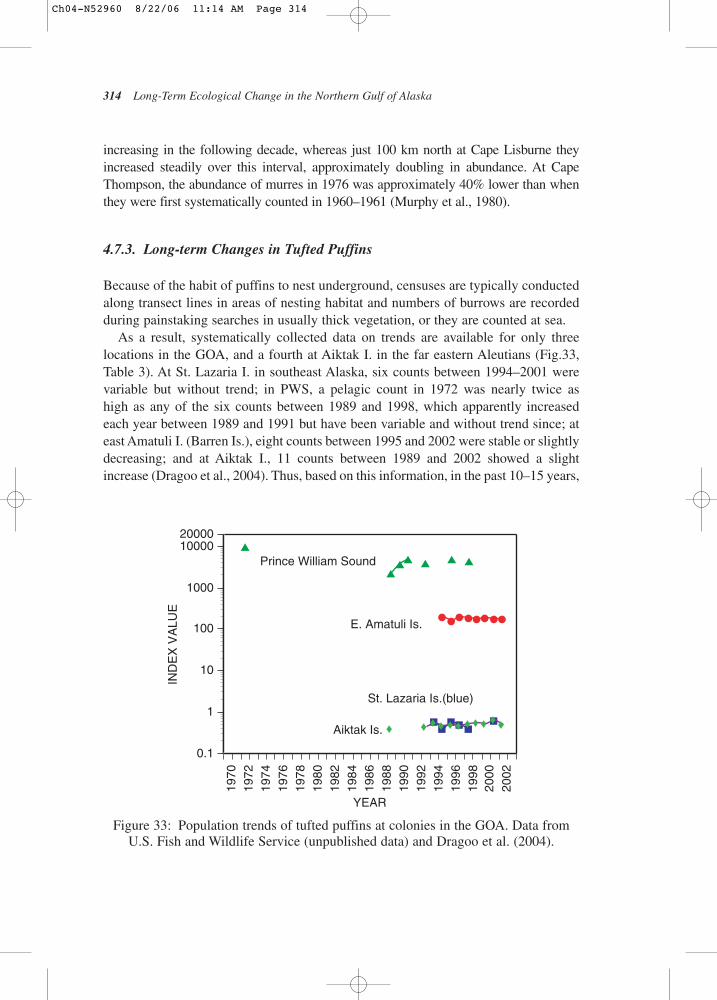
314 Long-Term Ecological Change in the Northern Gulf of Alaska
increasing in the following decade, whereas just 100 km north at Cape Lisburne theyincreased steadily over this interval, approximately doubling in abundance. At CapeThompson, the abundance of murres in 1976 was approximately 40% lower than whenthey were first systematically counted in 1960–1961 (Murphy et al., 1980).
4.7.3. Long-term Changes in Tufted Puffins
Because of the habit of puffins to nest underground, censuses are typically conductedalong transect lines in areas of nesting habitat and numbers of burrows are recordedduring painstaking searches in usually thick vegetation, or they are counted at sea.
As a result, systematically collected data on trends are available for only threelocations in the GOA, and a fourth at Aiktak I. in the far eastern Aleutians (Fig.33,Table 3). At St. Lazaria I. in southeast Alaska, six counts between 1994–2001 werevariable but without trend; in PWS, a pelagic count in 1972 was nearly twice as high as any of the six counts between 1989 and 1998, which apparently increasedeach year between 1989 and 1991 but have been variable and without trend since; ateast Amatuli I. (Barren Is.), eight counts between 1995 and 2002 were stable or slightlydecreasing; and at Aiktak I., 11 counts between 1989 and 2002 showed a slightincrease (Dragoo et al., 2004). Thus, based on this information, in the past 10–15 years,
1970
1972
1974
1976
1978
1980
1982
1984
1986
1988
1990
1992
1994
1996
1998
2000
2002
0.1
1
10
100
1000
1000020000
IND
EX
VA
LUE
YEAR
St. Lazaria Is.(blue)
E. Amatuli Is.
Prince William Sound
Aiktak Is.
Figure 33: Population trends of tufted puffins at colonies in the GOA. Data fromU.S. Fish and Wildlife Service (unpublished data) and Dragoo et al. (2004).
Ch04-N52960 8/22/06 11:14 AM Page 314
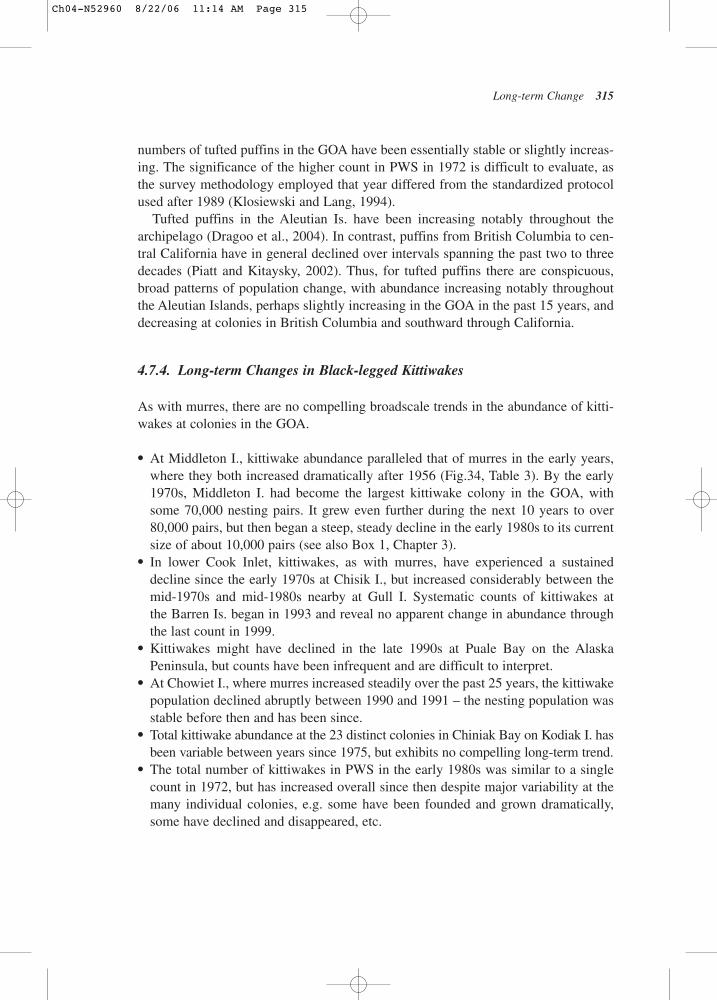
Long-term Change 315
numbers of tufted puffins in the GOA have been essentially stable or slightly increas-ing. The significance of the higher count in PWS in 1972 is difficult to evaluate, asthe survey methodology employed that year differed from the standardized protocolused after 1989 (Klosiewski and Lang, 1994).
Tufted puffins in the Aleutian Is. have been increasing notably throughout thearchipelago (Dragoo et al., 2004). In contrast, puffins from British Columbia to cen-tral California have in general declined over intervals spanning the past two to threedecades (Piatt and Kitaysky, 2002). Thus, for tufted puffins there are conspicuous,broad patterns of population change, with abundance increasing notably throughoutthe Aleutian Islands, perhaps slightly increasing in the GOA in the past 15 years, anddecreasing at colonies in British Columbia and southward through California.
4.7.4. Long-term Changes in Black-legged Kittiwakes
As with murres, there are no compelling broadscale trends in the abundance of kitti-wakes at colonies in the GOA.
● At Middleton I., kittiwake abundance paralleled that of murres in the early years,where they both increased dramatically after 1956 (Fig.34, Table 3). By the early1970s, Middleton I. had become the largest kittiwake colony in the GOA, withsome 70,000 nesting pairs. It grew even further during the next 10 years to over80,000 pairs, but then began a steep, steady decline in the early 1980s to its currentsize of about 10,000 pairs (see also Box 1, Chapter 3).
● In lower Cook Inlet, kittiwakes, as with murres, have experienced a sustaineddecline since the early 1970s at Chisik I., but increased considerably between themid-1970s and mid-1980s nearby at Gull I. Systematic counts of kittiwakes atthe Barren Is. began in 1993 and reveal no apparent change in abundance throughthe last count in 1999.
● Kittiwakes might have declined in the late 1990s at Puale Bay on the AlaskaPeninsula, but counts have been infrequent and are difficult to interpret.
● At Chowiet I., where murres increased steadily over the past 25 years, the kittiwakepopulation declined abruptly between 1990 and 1991 – the nesting population wasstable before then and has been since.
● Total kittiwake abundance at the 23 distinct colonies in Chiniak Bay on Kodiak I. hasbeen variable between years since 1975, but exhibits no compelling long-term trend.
● The total number of kittiwakes in PWS in the early 1980s was similar to a singlecount in 1972, but has increased overall since then despite major variability at themany individual colonies, e.g. some have been founded and grown dramatically,some have declined and disappeared, etc.
Ch04-N52960 8/22/06 11:14 AM Page 315
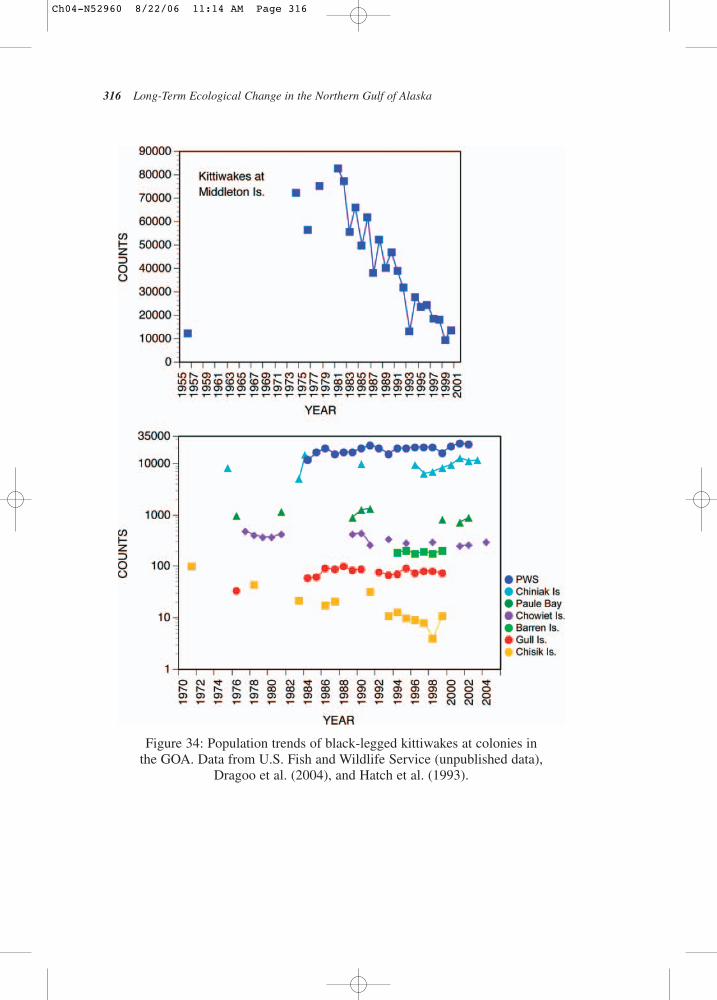
316 Long-Term Ecological Change in the Northern Gulf of Alaska
Figure 34: Population trends of black-legged kittiwakes at colonies in the GOA. Data from U.S. Fish and Wildlife Service (unpublished data),
Dragoo et al. (2004), and Hatch et al. (1993).
Ch04-N52960 8/22/06 11:14 AM Page 316
Black-legged kittiwakes in the Aleutian Is. have increased notably since the early1970s at the two colonies with the longest-term records, Bogoslof I. and Buldir I. ateither end of the chain (Dragoo et al., 2004). The increase was dramatic at Buldir I.between the mid-1970s and late 1980s and has been stable since. At Koniuji I., kitti-wakes were stable from the early 1980s through the late 1990s and then might havedeclined sometime between 1998 and 2001: however, with only one count indicatinga decline (2001) this is not certain.
Trends in numbers of kittiwakes generally parallel those of murres on the Pribilofsalso, with a large, steady decline at St. Paul from the mid-1970s through the late 1990s,and a similar decline through the late 1980s followed by recovery at St. George.Patterns of change in abundance of red-legged kittiwakes in the Aleutians andPribilofs have mirrored those of black-legged kittiwakes. Red-legged kittiwakes nestonly in the Aleutians and Pribilofs.
Black-legged kittiwake abundances at coastal colonies in the eastern Bering Seahave been similar to those of murres – slight increase in Norton Sound in the 1980sand significant decline during the 1990s at Cape Peirce in Bristol Bay. In the ChukchiSea, they increased at both Cape Thompson and Cape Lisburne since the mid-1970s.
Thus, in terms of larger-scale pattern, the Aleutian Islands stand out as the onlyregion where all three species, murres, puffins, and kittiwakes, show generally con-sistent change.
4.7.5. Long-term Changes in Other Species
Trends in abundance of several other species have been monitored in the GOA andelsewhere over various intervals and together further inform us about the nature ofchange in seabird populations and in the ecosystem.
Storm PetrelsStorm petrels are difficult to count because they nest underground and are nocturnal.They have been monitored at just four colonies in Alaska, and the two species(Leach’s and fork-tailed) have generally not been differentiated in the counts. Stormpetrels have been increasing sharply at Aiktak I. (extreme eastern Aleutians) since1990, St. Lazaria I. (southeast Alaska) since 1994, and east Amatuli I. (Barren Is.)since 1998, the years they were first counted at those sites. There has been no trendsince 1975 at Buldir I. in the western Aleutians (Dragoo et al., 2004).
CormorantsCormorants also are difficult to monitor because they commonly move nesting siteswithin colonies, such that numbers on specific census plots can vary without real
Long-term Change 317
Ch04-N52960 8/22/06 11:14 AM Page 317
change in the colony as a whole. And, as is the case for the other species, interannualvariability can be high and there are occasional long gaps between successive popu-lation counts. With this in mind, there still appears to have been a pervasive declinein the abundance of both pelagic and red-faced cormorants (Dragoo et al., 2004). Thepattern and timing of declines vary substantially from one colony to another, however.For example, at Middleton I. pelagic cormorants increased from the early 1970sthrough 1990, but then collapsed by about 80% by 1992: they have recovered some-what since. At Chowiet I., pelagic cormorants apparently collapsed by 90% between1979 and 1986 and have remained low since.
MurreletsMarbled and Kittlitz’s murrelets do not aggregate in conspicuous colonies in summerbut nest solitarily or in loose associations and in situations that make counting nestingpairs impossible. Marbled murrelets typically nest high in the boughs of mature conifersin old growth forests, although, in parts of their range where there are no trees, they willalso nest on the ground. Kittlitz’s murrelets nest on the ground, typically in scree fieldsin high alpine areas. Both species often nest many kilometers from the coast, and pop-ulation trends are thus based on counts of birds on the water where they forage.
Numbers of both species have been monitored in three locations in the GOA overvarious intervals. The longest time series exists for PWS, where murrelets and othermarine birds were first censused by pelagic surveys spring and summer of 1972 andspring of 1973 (Haddock et al., unpublished data, Agler et al., 1999; Stephensen et al.,2001; Kuletz, 2005). Those counts were not repeated until 1989, but have been under-taken in 8 years since. Although survey designs differed between the 1970s and latersurveys, modeling exercises indicated that numbers of marbled murrelets declined62% since 1989, when surveys were standardized, and 85% since 1972. Kittlitz’s mur-relets have declined even more drastically – by 92% since 1989 and 99% since 1972.
The trend for Kittlitz’s murrelets in PWS characterizes trends elsewhere – theyhave declined by over 80% since 1976 in the Kenai Fjords area and by over 60% inGlacier Bay between 1991 and 2000 (Robards et al., 2003; Van Pelt and Piatt, 2003).Gulfwide trends for marbled murrelets are not so uniform – they declined by about75% in Glacier Bay in the 1990s, but increased dramatically in that decade in theKenai Fjords after declining during the previous 15 years. It should be noted, how-ever, that the total abundance of marbled murrelets in Kenai Fjords is an order ofmagnitude smaller than in either PWS or Glacier Bay.
Miscellaneous Species: PWSIn addition to counting tufted puffins and murrelets at sea in PWS during the pelagicsurveys mentioned above, all other species of seabirds and marine birds (e.g. sea ducks,
318 Long-Term Ecological Change in the Northern Gulf of Alaska
Ch04-N52960 8/22/06 11:14 AM Page 318
mergansers, loons, and grebes) were also counted. Several species, notably piscivores(species that prey primarily on fishes), such as red-throated and Pacific loons (Gaviastellata and G. pacifica), cormorants, Bonaparte’s and glaucous-winged gulls (Larusphiladelphia and L. glaucescens), black-legged kittiwakes, arctic terns (Sternaparadesaea), pigeon guillemots (Cepphus columba), parakeet auklets (Cyclorhynchuspsittacula), and horned puffins (Fratercula corniculata), were apparently less numer-ous, in some cases much less numerous, in 1989 than they were when first counted in1972 (Agler et al., 1999; Stephensen et al., 2001). Overall, of the 17 taxa classified aspiscivorous by Agler et al., 14 declined between 1972 and 1989. Moreover, somespecies continued to decline through the 1990s. In contrast, several species that feedprimarily on benthic invertebrates, such as harlequin ducks (Histrionicus histrionicus)and Barrow’s goldeneyes (Bucephala islandica), did not decline or increased. Overall,five out of eight species classified as nonpiscivores increased. The declines of pisci-vores between 1972 and 1989 have been cited as additional evidence of the effect ofthe mid-1970s regime shift on forage fishes and their predators. The continuingdeclines through the 1990s have been explained as effects of the oil spill, as well aspossible continuing food limitation caused by climate change.
Interpreting the significance of these pelagic data is not easy. One confoundingfactor is that the survey methods in 1972 differed substantially from those in subse-quent years. Also, of particular note is that for kittiwakes, the decline in abundanceestimated from the surveys of birds at sea is opposite to the increase determined fromthe much more precise counts of birds at the nesting colonies. The pelagic data suggestthat kittiwakes declined from nearly 107,000 in 1972 to about 60,000 in 1989–1993 (−45%), and from there they continued to fall to about 28,000 by 2000 (−53%), for anoverall change of –76%. In contrast, the colony counts indicate that kittiwake abun-dance changed little from 1972 to the early 1990s (~16,000 in 1972 and 1989–1993)and increased during the ensuing decade to about 23,000 in the early 2000s (+44%).
4.7.6. Causes of Long-term Change in SeaBirds
Clearly, seabirds are sensitive to food supply, as demonstrated through aspects of theirbreeding biology and natural histories, and summer observations at their nestingcolonies (see Section 2.5.3). The various species have a range of survival strategies toaccommodate fluctuations in prey and maintain robust populations. These strategiesare not always up to the challenges of life in the northern Gulf of Alaska, however, asin the case of murres and kittiwakes at Chisik I. in western Cook Inlet, where bothspecies have declined steadily and considerably in the past three decades in associa-tion with food limitation (Piatt and Harding, Section 4.8).
Food limitation is not the only factor causing population change in seabirds, aspredation can be a strong influence on population size. Seabirds have adaptations to
Long-term Change 319
Ch04-N52960 8/22/06 11:14 AM Page 319
thwart predators, but they are not always successful, as in the case at Middleton I. andelsewhere, as we shall see.
In order to correctly identify causes of change in ecosystems, one must carefullyconsider matters of scale in time and space. That is, we must be mindful of whenchange began and where it is occurring. In the GOA and elsewhere in Alaska, we havevery little information on seabird biology prior to 1976 and the beginning of the OuterContinental Shelf Environmental Assessment Program (OSCEAP). OCSEAP fundednumerous studies of marine ecosystems in Alaska, including seabirds. Thus, substan-tial long-term records of seabird population abundance and productivity began atmost colonies in the mid-1970s. It is sometimes easy to forget that trends in seabirdpopulations may have begun even before then.
As it happened, a potent change in climate also occurred in the mid-1970s that hadlarge effects on the physical environment and the biota across the North Pacific(Ebbesmeyer et al., 1991; Francis and Hare, 1994; Mantua et al., 1997; Francis et al.,1998). Subsequent events occurred in 1989 and 1998 that also led to conspicuouschanges in the ocean (Springer, 1998; Hare and Mantua, 2000; Bond et al., 2003). By extension, these “regime shifts” have often been invoked to explain much, or most,of the significant change at high trophic levels in marine ecosystems of the GOA andelsewhere in the North Pacific (Agler et al., 1999; Anderson and Piatt, 1999; Tritesand Donnelly, 2003). In the majority of cases, a particular emphasis has been placedon perceived Gulf-wide declines of pelagic forage fishes, and of species that preyupon them, that were precipitated by the regime shift of the mid-1970s. Moreover, theExxon Valdez oil spill, which occurred in 1989 as well, killed an estimated 250,000seabirds, primarily murres.
But do these regime shifts and the oil spill really explain all change, or just somechange? And if just some, which? And what changes really occurred? In the case ofseabirds, the roles of climate regime shifts, oil, and predation in causing change inpopulations must be carefully considered.
Changing AbundanceAs noted earlier, getting the timing right of just when change began is critical to anunderstanding of why it began. For seabirds, there are only two colonies in the GOAwhere we have reliable information on abundance from well before the regime shiftof the mid-1970s. At Middleton I., the nesting murre population grew by nearly 15-fold between 1956 and 1974, and an additional 30% between 1974 and 1988.Kittiwakes increased by five- to six-fold in the first interval and by an additional 13%by the early 1980s. The initial increases, at least, occurred apparently in responseto new nesting habitat created by the earthquake in 1964 (see Section 3.3). At Chisik I., both species were in rather steep decline through the early to mid-1970s,apparently in response to food shortage that reduced productivity and recruitment and
320 Long-Term Ecological Change in the Northern Gulf of Alaska
Ch04-N52960 8/22/06 11:14 AM Page 320
increased emigration (see Piatt and Harding, Section 4.8). We do not know when thedeclines at Chisik I. actually began – all we know with reasonable certainty is that theywere well underway prior to the mid-1970s regime shift. By way of comparison, in theChukchi Sea, murres at Cape Thompson declined some 40% from 1960 to 1976.
At colonies where counts did not begin until the mid-1970s, at about the time ofthe regime shift, and continued through the duration of that regime (officially1977–1989), the following changes were seen:
● Puale Bay kittiwakes increased, but murres declined;● Chowiet I. kittiwakes did not change, but murres increased slightly;● Gull I. kittiwakes and murres both increased;● Chiniak Bay kittiwakes increased; murres are not present;● Prince William Sound kittiwake abundance in 1984 was similar to a single earlier
count in 1972 and numbers increased through the remainder of the regime; murresare not present.
Thus, if there was an effect of the mid-1970s regime shift on abundance of seabirdsat these colonies with reliable census data from the mid-1970s and before, the effectwas generally positive, opposite to the prevailing paradigm. But, still we do not knowwhen the trends began, and it seems ill advised to assume that they began with thefirst counts.
The next regime shift occurred in 1989, and evidence for a possible effect onseabird abundance comes from:
● Middleton I., where murres declined abruptly, although kittiwakes continued a longsteady decline from the early 1980s;
● Chowiet I., where kittiwakes declined abruptly, but murres continued to increasefrom the early 1980s.
At two additional colonies with much less resolution:
● Puale Bay kittiwakes, but not murres, were fewer in the late 1990s than in the late1980s and early 1990s; murre abundance was stable after 1989;
● Chiswell Is. murres were fewer in the late 1990s than in the late 1980s and early 1990s.
In both these cases, however, long stretches between successive counts in thisinterval (1991–1999 at Puale Bay and 1992 to 1997 at the Chiswell Is.) complicateinterpretations of change. Elsewhere:
● Gull I. kittiwakes did not change, owing to saturated nesting habitat for them, andmurres continued to increase from the early 1980s;
Long-term Change 321
Ch04-N52960 8/22/06 11:14 AM Page 321
● Chiniak Bay kittiwakes continued to increase from the earlier period;● Barren Is. kittiwakes did not change between the first count in 1994 and the last
count in 1999, whereas murres increased markedly after counts began in 1989;● Prince William Sound (PWS) kittiwakes continued to increase from the earlier
period (1972–1989).
Thus, there is some evidence that the 1989 shift might have had an effect on abun-dance (two abrupt declines, two other declines that might have been associated withthe shift, and one possible inflection point). There has not been sufficient time since1998 to know if this most recent event was consequential. Contrasting trends in pop-ulations of kittiwakes and murres at some colonies, e.g. Puale Bay and Chowiet I.,further confuse simple explanations.
Although Puale Bay and the Chiswell Is. were in the path of spilled oil, Piatt andAnderson (1996) concluded that data were insufficient to separate possible effects ofclimate change and oil mortality on murre abundance. Whatever effects oil might havehad on murres were localized and ephemeral. Trends prior to the oil spill and otherchanges in the GOA ecosystem in general, however, supported climate change as themore important factor. Effects of oiling on the abundance of other species were muchless, including kittiwakes, which were hardly affected at all. Moreover, there is noevidence that oil had broadscale negative effects on the abundance of forage fishes.Local, temporary effects in PWS might have occurred, especially in the case of sandlance, and these might have been of significance to seabirds (Golet et al., 2002).
Tufted puffins have been monitored only since the early to mid-1990s. In that time,there have been no substantial changes. Increases of tufted puffins in the Aleutian Is.are attributable to the reduction of introduced foxes on many of the islands, a ban onsalmon driftnets in the North Pacific, and possibly other reasons such as climatechange (Byrd et al., 1992). At one of the best-known colonies in the PacificNorthwest, Tatoosh I., Washington, the decline of tufted puffins is thought to havebeen caused by the loss of nesting habitat rather than a change in prey abundance(R. Paine, pers. comm.).
Trends in abundance of other species in the GOA are mixed, further confusing ourunderstanding about population change relative to climate change or other causes.Storm petrels have been increasing dramatically in the past 15 years at three widelyspaced colonies from Southeast Alaska to the Aleutians. Cormorants declined precip-itously in the late 1970s and 1980s at several colonies, but increased at Middleton I.from the early 1970s through the 1980s before collapsing by approximately 80%between 1990 and 1992. Marbled murrelets have declined steadily since the early1970s in PWS and during the 1990s in Glacier Bay, but apparently increased dramat-ically in the Kenai Fjords in the 1990s after declining in the previous 15 years.Kittlitz’s murrelets have collapsed by 60%–99% in Glacier Bay, PWS, and the KenaiFjords. The trends in marine birds in PWS, based on pelagic surveys that indicate
322 Long-Term Ecological Change in the Northern Gulf of Alaska
Ch04-N52960 8/22/06 11:14 AM Page 322
declining numbers of most piscivorous species, are imprecise and equally confusingfor three reasons – the very long interval between the first count in 1972 and thesecond count in 1989, the fact that survey methods differed in the 1972 count from allsubsequent counts, and the apparent decline in kittiwake abundance indicated by thepelagic counts is opposite to the increases revealed by the much more precise countsat colonies.
Despite the paucity of evidence that regime shifts have precipitated widespreadtrends in abundance of kittiwakes, murres, or other species in the GOA, change has cer-tainly occurred on smaller scales. And, changes in prey abundance appear to have beeninvolved in some of it. For example, overall kittiwake abundance in PWS has gradu-ally increased since the early 1980s, and there has been a conspicuous change in dis-tribution within the sound, with colonies in the northern, more inner regions increasingat the expense of colonies in more southern, outer regions (Suryan and Irons, 2001).This redistribution is attributed primarily to movements of birds from poorer to betterforaging areas – kittiwakes at the better colonies feed mainly on juvenile herring thathave increased, whereas kittiwakes at the poorer colonies feed mainly on sand lanceand capelin, which may have declined there as did capelin in the Kodiak I. area andAlaska Peninsula in the late 1970s to 1980s (Anderson and Piatt, 1999). Likewise, thelong-term decline of kittiwakes and murres at Chisik I. and corresponding increasesacross Cook Inlet at Gull I. appear to have been driven in large measure by movementsof birds in response to contrasting foraging conditions in the two regions, as well as todifferential productivity and recruitment (Piatt and Harding, Section 4.8).
But not all movements of seabirds and changes in abundance are driven by changesin prey. We have already examined the case of Middleton I. and the major effect ter-restrial habitat quality and gull predation appear to have had on numbers of kittiwakesand murres. At Kodiak I., kittiwakes in Chiniak Bay have been relocating from oldercolonies generally on larger, more exposed cliffs to smaller, more secure sites as theabundance of bald eagles (Haliaeetus leucocephalus) is an important detriment toproductivity of kittiwakes and pigeon guillemots in PWS that might have colony-scaleeffects (Oakley and Kuletz, 1996; D. Irons, pers. comm.)
And, declines of Kittlitz’s murrelets have been attributed to the recession of tidewater glaciers in the GOA (Kuletz et al., 2003). In this case, the mechanism is not cer-tain, although it is suspected that a major factor is the loss of critical foraging habitat,rather than a loss of prey per se, as glaciers shrink with continued global warming.
4.7.7. Changing Productivity
As we have seen, productivity of kittiwakes is particularly sensitive to food supply,and variability in productivity can reveal variability in prey at numerous spatial scales.At a regional scale, such as PWS, productivity at colonies that have increased in
Long-term Change 323
Ch04-N52960 8/22/06 11:14 AM Page 323

324 Long-Term Ecological Change in the Northern Gulf of Alaska
abundance in the past 20 years has been markedly higher than at colonies that havedeclined: 0.24 chicks per nest (SE = 0.018, n = 152 colony-years) versus 0.054 chicksper nest (SE = 0.0075, n = 279 colony-years). The difference, as noted above whenexplaining changes in abundance, is likely due primarily to prey availability, althoughpredation can be a major factor as well (Suryan and Irons, 2001; D. Irons, pers. comm.).
On a broader scale, the data can be pooled in ways which indicate that productiv-ity of kittiwakes in the GOA, and an even larger region of the North Pacific, haschanged in the last three decades. Hatch et al. (1993) lumped all productivity data forkittiwakes from Alaska for all years through 1989 (162 estimates of productivity from28 colonies). They found that productivity declined steadily during the 1970s and1980s, from about 0.5 chicks fledged per nesting attempt in the early 1970s to fewerthan 0.2 chicks per nest in the late 1980s. At the same time, total nesting failuresincreased. Piatt and Harding (Section 4.8, Fig.44) found similar broad, decadal-scalechanges in kittiwake productivity in the GOA and Bering Sea through the 1990s.When the data are pooled somewhat differently, by colony and regime (the durationof the mean state of each regime, except the most recent one that is apparently ongo-ing), a contrasting picture emerges (Fig.35). Although differences between intervalmeans are not generally significant, there is a common pattern of higher productivity
1970s-1980s 1990s 2000s0
0.1
0.2
0.3
0.4
0.5
0.6
0.7
0.8
0.9
1
PR
OD
UC
TIV
ITY
DECADE(S)
Chowiet I.
Chiniak Bay
Barren Is.
Middleton I.
PWS
Gull I.
Kittiwakecolonies
Figure 35: Productivity (chicks/nest) of black-legged kittiwakes at colonies in theGOA. Productivity averaged by decade, approximately the duration of climate
regimes as indexed by the PDO. Data from Dragoo et al. (2004), D. Irons (unpublished data), and D. Kildaw (unpublished data).
Ch04-N52960 8/22/06 11:14 AM Page 324
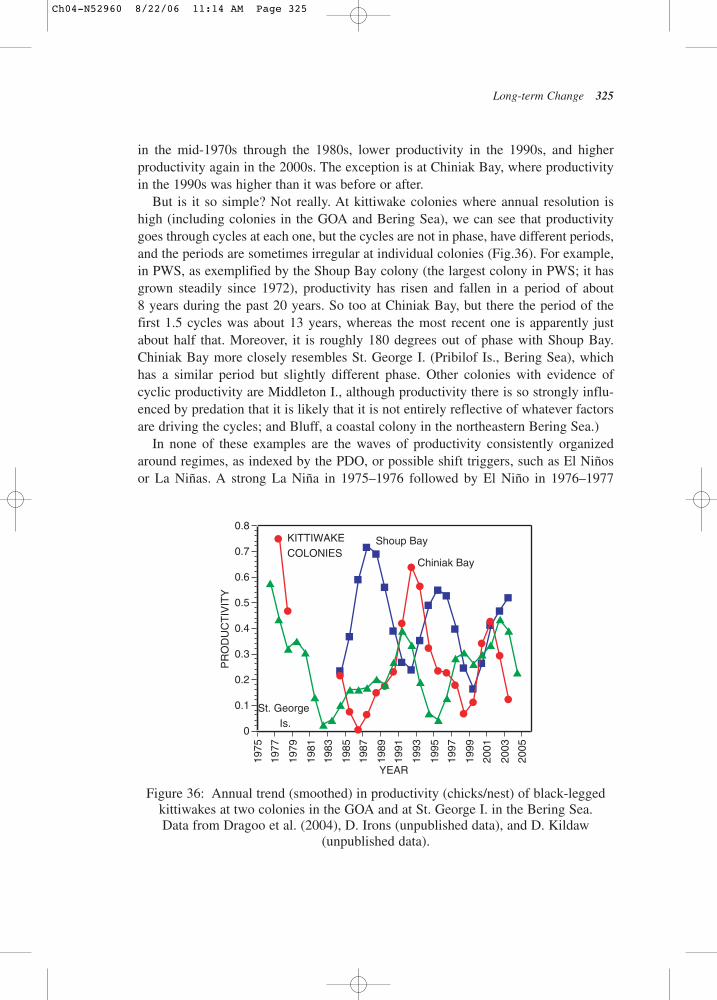
Long-term Change 325
in the mid-1970s through the 1980s, lower productivity in the 1990s, and higherproductivity again in the 2000s. The exception is at Chiniak Bay, where productivityin the 1990s was higher than it was before or after.
But is it so simple? Not really. At kittiwake colonies where annual resolution ishigh (including colonies in the GOA and Bering Sea), we can see that productivitygoes through cycles at each one, but the cycles are not in phase, have different periods,and the periods are sometimes irregular at individual colonies (Fig.36). For example,in PWS, as exemplified by the Shoup Bay colony (the largest colony in PWS; it hasgrown steadily since 1972), productivity has risen and fallen in a period of about8 years during the past 20 years. So too at Chiniak Bay, but there the period of thefirst 1.5 cycles was about 13 years, whereas the most recent one is apparently justabout half that. Moreover, it is roughly 180 degrees out of phase with Shoup Bay.Chiniak Bay more closely resembles St. George I. (Pribilof Is., Bering Sea), whichhas a similar period but slightly different phase. Other colonies with evidence ofcyclic productivity are Middleton I., although productivity there is so strongly influ-enced by predation that it is likely that it is not entirely reflective of whatever factorsare driving the cycles; and Bluff, a coastal colony in the northeastern Bering Sea.)
In none of these examples are the waves of productivity consistently organizedaround regimes, as indexed by the PDO, or possible shift triggers, such as El Niñosor La Niñas. A strong La Niña in 1975–1976 followed by El Niño in 1976–1977
1975
1977
1979
1981
1983
1985
1987
1989
1991
1993
1995
1997
1999
2001
2003
2005
0
0.1
0.2
0.3
0.4
0.5
0.6
0.7
0.8
PR
OD
UC
TIV
ITY
YEAR
Shoup Bay
Chiniak Bay
St. GeorgeIs.
KITTIWAKECOLONIES
Figure 36: Annual trend (smoothed) in productivity (chicks/nest) of black-leggedkittiwakes at two colonies in the GOA and at St. George I. in the Bering Sea. Data from Dragoo et al. (2004), D. Irons (unpublished data), and D. Kildaw
(unpublished data).
Ch04-N52960 8/22/06 11:14 AM Page 325

marked the mid-1970s regime shift; an El Niño in 1986–1987 followed by a strongLa Niña in 1988–1989 marked the next shift; and a La Niña in 1995 followed by astrong El Niño in 1997–1998 marked the most recent shift. The strong El Niño in1982–1983 without a corresponding La Niña was not associated with a regime shift.Rather, the beats in the various data sets appear to be independent of climate eventsor regimes.
4.7.8. Conclusions
There is little compelling evidence that the mid-1970s regime shift was of greatimportance to seabird populations in the GOA, certainly not as an agent of widespreaddecline or reproductive failure. Despite changes in the structure of fish communities,the ability of murres, puffins, and kittiwakes to buffer themselves against suchchanges through their natural history and survival strategies seems to have prevailed.Or, alternatively, there may not have been significant change in the prey assemblageimportant to seabirds.
The notion that the regime shift of 1977 and community reorganization led to a col-lapse of the assemblage of forage fishes essential to seabirds, i.e. especially those witha high lipid content, hinges on just a single species. Although shrimp and a fewspecies of fishes commonly referred to as forage fish declined in abundance at vari-ous times from the early to mid-1970s through the mid-1980s in the western and cen-tral GOA (Bechtol, 1997; Piatt and Anderson, 1996; Anderson and Piatt, 1999;Mueter and Norcross, 2000), capelin is the only one that was of particular importanceto seabirds (DeGange and Sanger, 1986; Piatt and Anderson, 1996). Sand lance wasthought to have declined in PWS (Kuletz et al., 1997), but evidence from elsewherein the GOA does not support a conclusion of widespread change (Golet et al., 2002).Despite the high nutritional value of capelin and the fact that it is usually consumedby seabirds when it is present, its decline, as revealed by changes in seabird diets andfishery survey results, is itself not evidence that seabirds were food limited – that is,limited to the extent that their populations fell. They still had available to them gadids,particularly walleye pollock and sand lance (a comparatively lipid-rich species), andelsewhere murres and kittiwakes subsist quite well, at least during the nesting season,on diets dominated by gadids and sand lance (Springer et al., 1984, 1987). Thus, inthis case the lack of capelin in seabird diets simply demonstrates that a decline inabundance of a common forage species can be seen at higher trophic levels.Moreover, increases, rather than decreases, in abundance of murres, puffins, and kit-tiwakes at many colonies in the GOA during the 1970s and 1980s indicate that foodshortage was not a universal characteristic in the environment at that time.
The abundance of murres and kittiwakes did change at several colonies during theyears following the first counts in the mid-1970s, and if the changes began then it
326 Long-Term Ecological Change in the Northern Gulf of Alaska
Ch04-N52960 8/22/06 11:14 AM Page 326

might be fair to assume that the mid-1970s regime shift was an important factor. Butwe do not know whether changes really did begin in the mid-1970s rather than ear-lier, as they did at Chisik I. in the GOA and at Cape Thompson in the Chukchi Sea.Nor do we know whether changes in abundance, whenever they began, were neces-sarily driven by changes in prey. Many likely were, but predation and habitat qualityalso can have major effects on seabird populations, as in the cases of murres and kit-tiwakes at Middleton I. and Chiniak Bay, Kittlitz’s murrelets in glacially influencedfjords, and kittiwakes and guillemots in PWS.
This is not to say that seabirds are insensitive to prey availability, or that there havenot been broadscale responses in seabird populations to regime shifts or other climatechange events such as El Nino that most likely involved food. They are sensitive toprey, and they have recorded signals of the effect climate has on ocean food webs –for example, changes in breeding parameter values described above by Piatt et al. thatwere associated with the regime shifts of 1977 and 1989; large episodic die offs ofseabirds in the GOA and Bering Sea apparently caused by food shortage and some-times, though not always, following El Nino and La Nina events (Nysewander andTrapp, 1984; Hatch, 1987; Piatt and Van Pelt, 1993); and adjustments kittiwakes havemade to short-term fluctuations in prey availability in PWS (Suryan et al., 2002).Moreover, patterns of colony size and distribution of the many kittiwake colonies inPWS has likely been shaped to a large degree by prey distribution and abundance(Ainley et al., 2003).
And, if abundance data of murres used by Piatt and Anderson (1996), and discussedin the subsequent chapter, are more or less accurate, then there may well have been abroadscale decline in murres beginning in the early 1970s, or before, and continuinginto the late 1980s. Furthermore, if pooling kittiwake productivity data across allcolonies, different as they are (in terms of the oceanographic settings in which theyare found), is informative, then those data can also be used in support of the idea ofbroadscale patterns in seabird biology in the GOA and Bering Sea. Finally, if capelinreally is the crucial forage species for seabirds in the GOA, and if its overall declinewas caused by the regime shift but lagged it by five or so years, i.e. did not reallybegin to decline until the early 1980s, and the timing of decline and other changes infish and shellfish assemblages varied substantially from place to place in the GOA(Mueter and Norcross, 2000), then this too might support the scenario that the regimeshift was important in some cases.
But El Niños, La Niñas, and regime shifts do not align well with much of the vari-ability in seabird abundance in the GOA or elsewhere in Alaska. For example, incolonies with the longest histories, the abundances of murres in most of them haveexhibited directional change over extended intervals that crossed one or more regimeboundaries. Such long-period fluctuations may be driven by climate change, and if sothe time frame is greater than the decadal-scale PDO-type oscillation and may reflectother modes of variability in marine ecosystems, as described by Minobe (1997).
Long-term Change 327
Ch04-N52960 8/22/06 11:14 AM Page 327
Likewise, variability in kittiwake productivity, which is thought to be particularlysensitive to prey availability and quality, does not match the PDO regime pattern.Productivity in many colonies shows wave patterns, although the waves are com-monly out of phase (even at nearby colonies) and the periods vary. There is no con-sistent relationship to major climate signals, but instead they seem to be driven byintrinsic properties of each population or of local environments, food webs, or preypopulations supporting them. The phase shifts and variable periods could lead to per-ceptions that pooled inter-regime means have significance relative to those regimes,when in reality they may not.
Effects of physical forcing on marine production patterns and processes are con-spicuous at low trophic levels; however, they are attenuated more and more at higherand higher trophic levels due to the survival strategies of individual species. The sur-vival strategies of murres, kittiwakes, and puffins, varied as they are, appear to havesucceeded in buffering most populations against adverse changes in prey, if they didin fact occur. For others, notably Chisik I., they were not successful in saving kitti-wakes and murres from apparent changes in prey, beginning in the early 1970s orbefore. Nor were survival strategies entirely successful in buffering some populationsagainst the effects of predators.
For seabirds, therefore, an alternative conclusion to the one most commonly pro-nounced could be that there is rather weak support for the notion that the regime shiftof the mid-1970s and the restructuring of the fish and shellfish communities in the GOAhad broadscale, negative effects on abundance. Rather, if changes in prey of significanceto seabird populations did occur, they were more at local scales and were both positiveand negative. The lack of organization of kittiwake productivity at many individualcolonies around regimes and regime shifts further argues against a pervasive, broad-scale, adverse effect of climate change on seabirds at those timescales in the GOA. At the local and even regional scale, chaos may be a more apt description of seabird pop-ulation biology in the North Pacific, and this may reflect complex interactions betweenmicroscale oceanographic conditions, local responses of individual species to physicalforcing, and predator–prey relationships. This contrasts in many important ways frompatterns in marine mammal biology, which will be described in Section 4.9.
4.7.9. Summary
Unfortunately, very little is known about seabird abundance or numerical trends in theGOA prior to the mid-1970s. In the two cases we have, both murres and kittiwakes atChisik I. in Lower Cook Inlet were in decline in the early 1970s, while both specieswere increasing at Middleton I. We do not know when the declines began at Chisik I.,but the increases at Middleton I. likely began following the 1964 earthquake thatincreased nesting habitat.
328 Long-Term Ecological Change in the Northern Gulf of Alaska
Ch04-N52960 8/22/06 11:14 AM Page 328
After the mid-1970s and through the 1980s, there are examples of increasing anddeclining populations, but for most of those that changed following the first counts, itis again not known when they began to change. The same holds true for the 1990s.This is not to say we know nothing about the timing of change. One exception isGull I., where murres apparently began to increase in the mid-1980s. And, there areexamples of abrupt changes in the early to mid-1990s.
Overall, there are just two apparent broadscale patterns in seabird abundance in theGOA – that of tufted puffins, which have been stable or increased slightly, andKittlitz’s murrelets, which have declined dramatically at all locations where they havebeen counted. For other species, there are examples of increases, decreases, and nochange over intervals spanning one to three decades. Moreover, for murres and kitti-wakes, about which we know the most, trends at individual colonies where bothspecies nest were not always in the same direction. This lack of pervasive patternsuggests that a variety of factors affecting populations have been at play, or that ifthere is only a single factor, its expression has differed markedly in the spatiallyheterogeneous environment of the GOA.
4.8. Populations of Seabirds in Cook Inlet John F. Piatt and Ann M.A. Harding
4.8.1. Introduction
Many seabird colony populations in the Gulf of Alaska have fluctuated in recentdecades, and they have declined markedly at a few sites (Hatch and Piatt, 1995;Dragoo et al., 2000). The Exxon Valdez oil spill of 1989 had an immediate impact onsome seabirds (Piatt et al., 1990; Piatt and Ford 1996), adding to other anthropogenicfactors influencing seabird populations in Alaska (e.g. gill-net mortality, introducedpredators, etc.; Hatch and Piatt, 1995). However, evidence accumulated during the1990s that background variability in the marine environment had an even greatereffect on seabird populations over annual and decadal timescales. Most notably, a“regime shift” occurred in the Gulf of Alaska during the late 1970s, apparently caus-ing marked changes in seabird diets, lower reproductive success, occasional wrecks(large-scale die-offs), and long-term declines in some marine bird and mammal pop-ulations (Piatt and Van Pelt, 1997; Piatt and Anderson, 1996; Francis et al., 1998).Fish communities on the continental shelf of the Gulf of Alaska also changed dramat-ically during that time period (Anderson and Piatt, 1999). Coincident with cyclicalfluctuations in seawater temperatures, the abundance of small forage fish species suchas capelin (Mallotus villosus) declined precipitously in the late 1970s, while popula-tions of large predatory fish such as walleye pollock (Theragra chalcogramma) and
Long-term Change 329
Ch04-N52960 8/22/06 11:14 AM Page 329
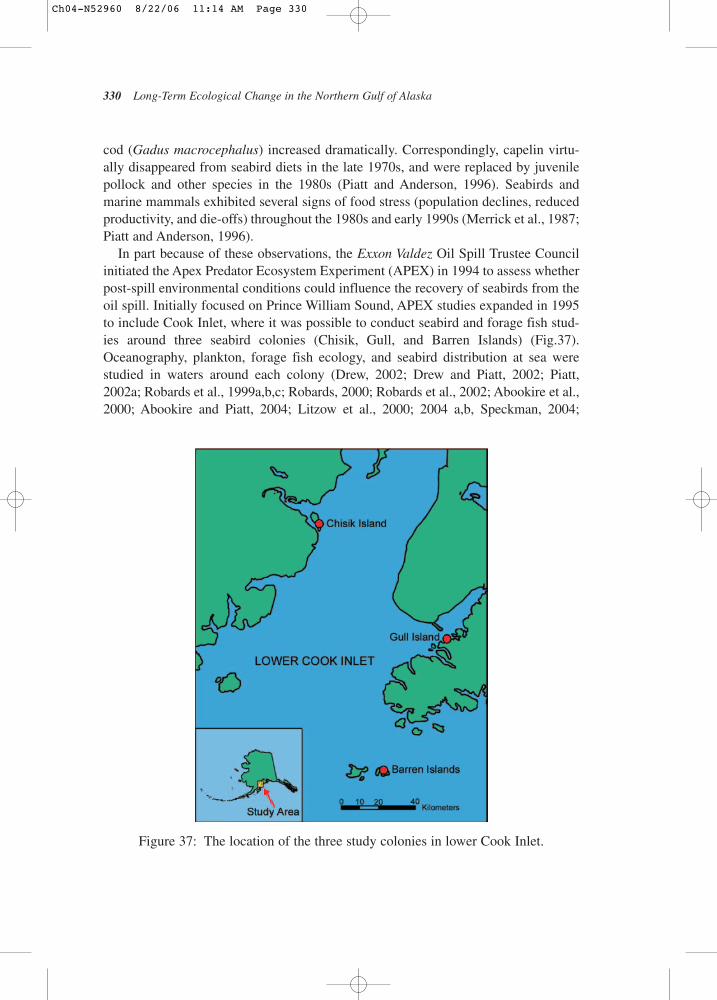
330 Long-Term Ecological Change in the Northern Gulf of Alaska
cod (Gadus macrocephalus) increased dramatically. Correspondingly, capelin virtu-ally disappeared from seabird diets in the late 1970s, and were replaced by juvenilepollock and other species in the 1980s (Piatt and Anderson, 1996). Seabirds andmarine mammals exhibited several signs of food stress (population declines, reducedproductivity, and die-offs) throughout the 1980s and early 1990s (Merrick et al., 1987;Piatt and Anderson, 1996).
In part because of these observations, the Exxon Valdez Oil Spill Trustee Councilinitiated the Apex Predator Ecosystem Experiment (APEX) in 1994 to assess whetherpost-spill environmental conditions could influence the recovery of seabirds from theoil spill. Initially focused on Prince William Sound, APEX studies expanded in 1995to include Cook Inlet, where it was possible to conduct seabird and forage fish stud-ies around three seabird colonies (Chisik, Gull, and Barren Islands) (Fig.37).Oceanography, plankton, forage fish ecology, and seabird distribution at sea werestudied in waters around each colony (Drew, 2002; Drew and Piatt, 2002; Piatt,2002a; Robards et al., 1999a,b,c; Robards, 2000; Robards et al., 2002; Abookire et al.,2000; Abookire and Piatt, 2004; Litzow et al., 2000; 2004 a,b, Speckman, 2004;
Figure 37: The location of the three study colonies in lower Cook Inlet.
Ch04-N52960 8/22/06 11:14 AM Page 330
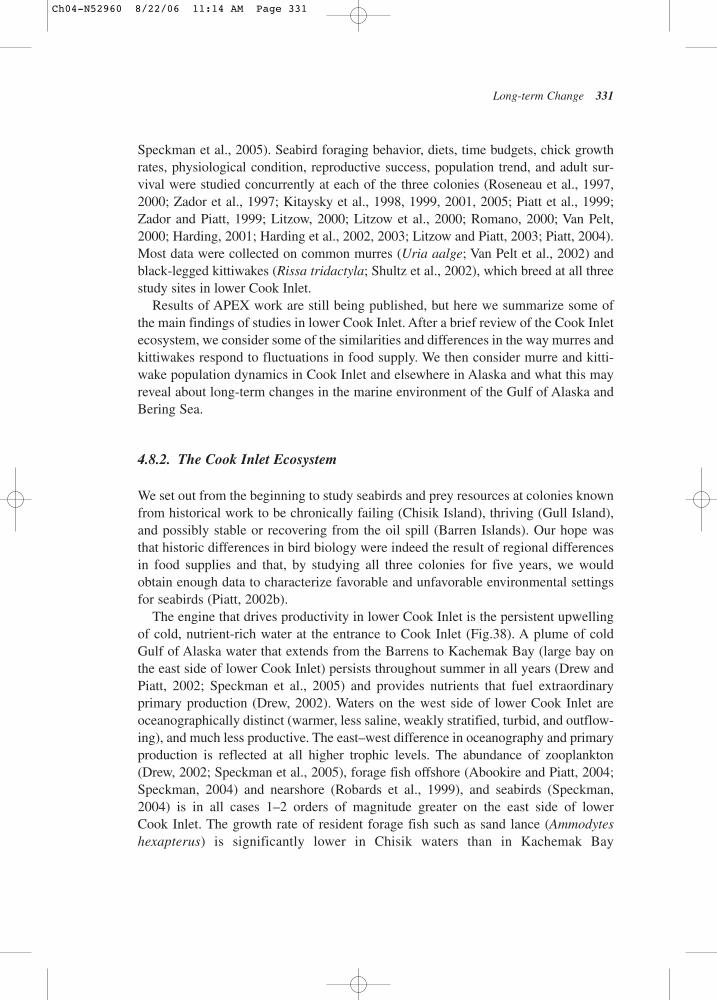
Speckman et al., 2005). Seabird foraging behavior, diets, time budgets, chick growthrates, physiological condition, reproductive success, population trend, and adult sur-vival were studied concurrently at each of the three colonies (Roseneau et al., 1997,2000; Zador et al., 1997; Kitaysky et al., 1998, 1999, 2001, 2005; Piatt et al., 1999;Zador and Piatt, 1999; Litzow, 2000; Litzow et al., 2000; Romano, 2000; Van Pelt,2000; Harding, 2001; Harding et al., 2002, 2003; Litzow and Piatt, 2003; Piatt, 2004).Most data were collected on common murres (Uria aalge; Van Pelt et al., 2002) andblack-legged kittiwakes (Rissa tridactyla; Shultz et al., 2002), which breed at all threestudy sites in lower Cook Inlet.
Results of APEX work are still being published, but here we summarize some ofthe main findings of studies in lower Cook Inlet. After a brief review of the Cook Inletecosystem, we consider some of the similarities and differences in the way murres andkittiwakes respond to fluctuations in food supply. We then consider murre and kitti-wake population dynamics in Cook Inlet and elsewhere in Alaska and what this mayreveal about long-term changes in the marine environment of the Gulf of Alaska andBering Sea.
4.8.2. The Cook Inlet Ecosystem
We set out from the beginning to study seabirds and prey resources at colonies knownfrom historical work to be chronically failing (Chisik Island), thriving (Gull Island),and possibly stable or recovering from the oil spill (Barren Islands). Our hope wasthat historic differences in bird biology were indeed the result of regional differencesin food supplies and that, by studying all three colonies for five years, we wouldobtain enough data to characterize favorable and unfavorable environmental settingsfor seabirds (Piatt, 2002b).
The engine that drives productivity in lower Cook Inlet is the persistent upwellingof cold, nutrient-rich water at the entrance to Cook Inlet (Fig.38). A plume of coldGulf of Alaska water that extends from the Barrens to Kachemak Bay (large bay onthe east side of lower Cook Inlet) persists throughout summer in all years (Drew andPiatt, 2002; Speckman et al., 2005) and provides nutrients that fuel extraordinaryprimary production (Drew, 2002). Waters on the west side of lower Cook Inlet areoceanographically distinct (warmer, less saline, weakly stratified, turbid, and outflow-ing), and much less productive. The east–west difference in oceanography and primaryproduction is reflected at all higher trophic levels. The abundance of zooplankton(Drew, 2002; Speckman et al., 2005), forage fish offshore (Abookire and Piatt, 2004;Speckman, 2004) and nearshore (Robards et al., 1999), and seabirds (Speckman,2004) is in all cases 1–2 orders of magnitude greater on the east side of lowerCook Inlet. The growth rate of resident forage fish such as sand lance (Ammodyteshexapterus) is significantly lower in Chisik waters than in Kachemak Bay
Long-term Change 331
Ch04-N52960 8/22/06 11:14 AM Page 331
332 Long-Term Ecological Change in the Northern Gulf of Alaska
(Robards et al., 2002). Thus, all evidence suggests that lower Cook Inlet is segregatedinto distinct oceanographic domains, with striking differences in productivity andbiology among them (Speckman et al., 2005).
In all years, the well-mixed, cold waters in the lower inlet – particularly offshore –were dominated by juvenile pollock and capelin (Abookire and Piatt, 2004), impor-tant prey for murres (Van Pelt et al., 2002). Sand lance and herring (Clupea pallasi)were the most common prey for kittiwakes (Shultz et al., 2002), and were most abun-dant in stratified coastal waters of the Kenai Peninsula and Kachemak Bay (Robardset al., 1999; Abookire and Piatt, 2004). Fish were markedly variable in the verticaldimension as well. Most acoustic biomass was concentrated in the upper 30 m in allareas, but in Chisik and Barren island waters, schools were also concentrated at depthsof 60–100 m (Speckman, 2004). There was also a clear segregation of species by waterdepth; sand lance and herring dominated above depths of 40 m, whereas pollock andcapelin dominated below 60 m.
Diets of adult murres and kittiwakes reflected food supplies around each colony.Whereas more than 90 species of fish were caught near shore and 40 species werecaught in offshore trawls, communities were overwhelmingly dominated (>95%) byfour species: sand lance, herring, Pollock, and capelin (Robards et al., 1999, 2002;
Figure 38: Sea surface temperature in the northern Gulf of Alaska on July 3, 1999.Note the colder (blue) surface water that results from upwelling in lower CookInlet and east of Kodiak Island in contrast to the warmer (red–orange–yellow),stratified waters in Prince William Sound and shelf waters south of the Kenai
Peninsula. Data is from NOAA AVHRR satellite.
Ch04-N52960 8/22/06 11:14 AM Page 332
Abookire and Piatt, 2004). Diets of adult murres and kittiwakes were dominated bythe same species in similar proportions to local abundance except that herring weregenerally eaten less and capelin eaten more in proportion to their relative abundances(Van Pelt et al., 2002; Shultz et al., 2002). Sand lance dominated murre and kittiwakediets at both Chisik and Gull, while pollock comprised a much larger proportion indiets of birds from the Barrens. The size classes of prey eaten by adults was similarto the size classes caught in trawls and seines. Taken together, the evidence suggeststhat adult murres and kittiwakes generally eat what is most available to them withinforaging range of their colonies. In contrast to adult diets, however, chick diets werepoor indicators of relative prey availability because adults choose to feed their chicksprey that are oily and rich in calories, a behavior with obvious adaptive value.
The breeding biology of seabirds differed markedly among colonies owing to thepersistent geographic differences in forage fish availability described earlier. Birds atChisik Island struggled to reproduce, while those at Gull and Barren islands usuallyhad few problems rearing young (Kitaysky et al., 1998, 1999; Zador and Piatt, 1999;Shultz et al., 2002; Van Pelt et al., 2002). Within each colony, breeding and behavioralparameters varied among years to a lesser degree than among sites. Breeding successin all species was lower in 1998 than in other years; presumably a lingering effect ofthe previous winters’ El Niño event (Piatt et al., 1999). Population censuses revealedthat seabirds at Chisik Island continued in a long-term decline, whereas populationsat Gull and Barren islands were increasing (Zador et al., 1997; Roseneau et al., 1997,2000; and Piatt, 2002). Behavioral studies revealed that seabirds worked harder(longer foraging trips, less discretionary time) at colonies where nearby fish densitieswere lower (Zador and Piatt, 1999; Piatt, 2002).
Overall, the studies show that seabird parameters (breeding success, foragingeffort, population trend, etc.) varied most between islands and to a much lesser degreebetween years. We attribute this regional variability and temporal stability in seabirdbiology to distinct, persistent oceanographic regimes around each colony that deter-mined the availability of fish to birds within those areas (Abookire and Piatt, 2004;Speckman et al., 2005).
4.8.3. Response of Seabirds to Variability in Prey
Form of ResponseWe predicted that – just like other vertebrates (Holling, 1959; Murdoch and Oaten,1975; Piatt, 1990) – murres and kittiwakes would exhibit nonlinear functional rela-tionships with food supply (Piatt, 2002b). Of the 25 relationships that we examinedbetween parameters of seabird biology, behavior or physiology (e.g., clutch size, bodycondition, chick growth, hatching success, feeding rate, etc.) and prey density, morethan half (14) were nonlinear, only one was linear, and the rest were not described by
Long-term Change 333
Ch04-N52960 8/22/06 11:14 AM Page 333
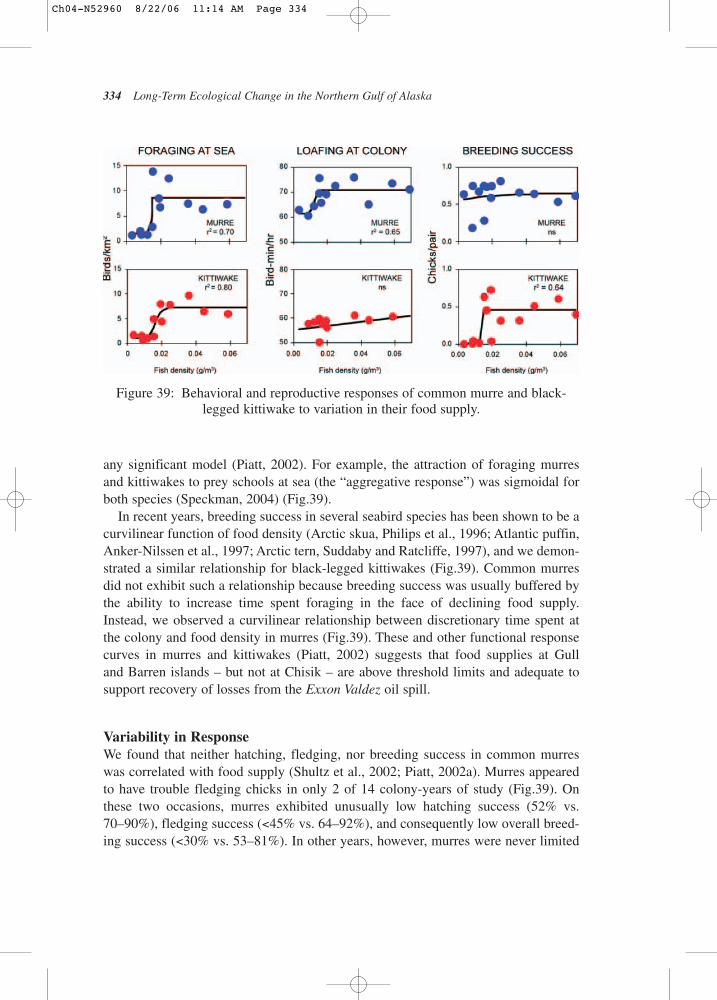
334 Long-Term Ecological Change in the Northern Gulf of Alaska
any significant model (Piatt, 2002). For example, the attraction of foraging murresand kittiwakes to prey schools at sea (the “aggregative response”) was sigmoidal forboth species (Speckman, 2004) (Fig.39).
In recent years, breeding success in several seabird species has been shown to be acurvilinear function of food density (Arctic skua, Philips et al., 1996; Atlantic puffin,Anker-Nilssen et al., 1997; Arctic tern, Suddaby and Ratcliffe, 1997), and we demon-strated a similar relationship for black-legged kittiwakes (Fig.39). Common murresdid not exhibit such a relationship because breeding success was usually buffered bythe ability to increase time spent foraging in the face of declining food supply.Instead, we observed a curvilinear relationship between discretionary time spent atthe colony and food density in murres (Fig.39). These and other functional responsecurves in murres and kittiwakes (Piatt, 2002) suggests that food supplies at Gull and Barren islands – but not at Chisik – are above threshold limits and adequate tosupport recovery of losses from the Exxon Valdez oil spill.
Variability in ResponseWe found that neither hatching, fledging, nor breeding success in common murreswas correlated with food supply (Shultz et al., 2002; Piatt, 2002a). Murres appearedto have trouble fledging chicks in only 2 of 14 colony-years of study (Fig.39). Onthese two occasions, murres exhibited unusually low hatching success (52% vs.70–90%), fledging success (<45% vs. 64–92%), and consequently low overall breed-ing success (<30% vs. 53–81%). In other years, however, murres were never limited
Figure 39: Behavioral and reproductive responses of common murre and black-legged kittiwake to variation in their food supply.
Ch04-N52960 8/22/06 11:14 AM Page 334
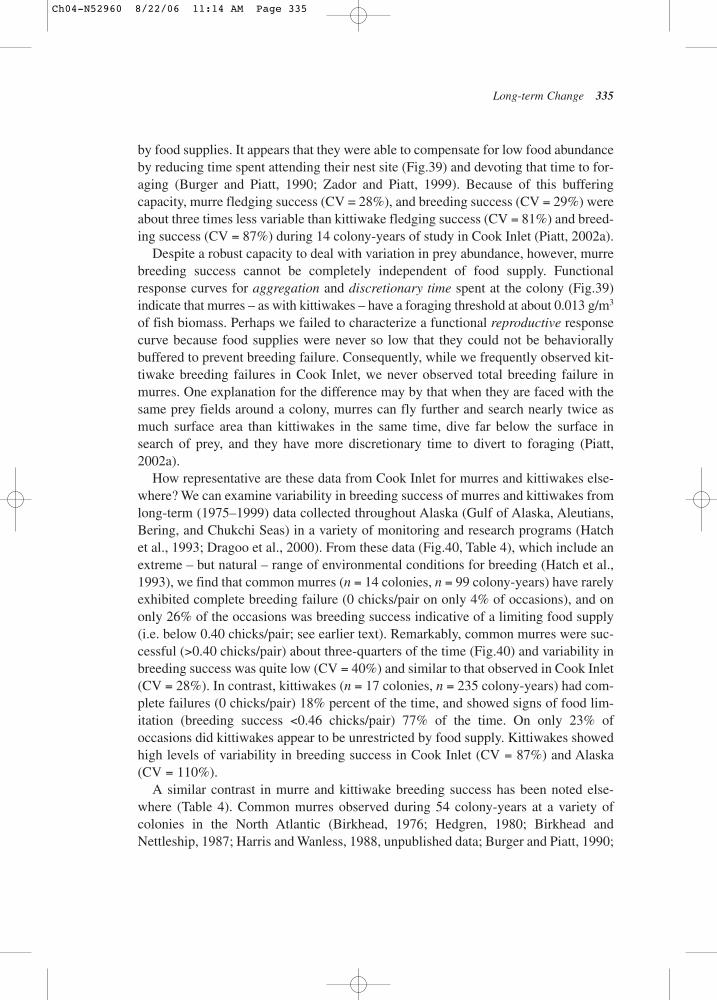
by food supplies. It appears that they were able to compensate for low food abundanceby reducing time spent attending their nest site (Fig.39) and devoting that time to for-aging (Burger and Piatt, 1990; Zador and Piatt, 1999). Because of this bufferingcapacity, murre fledging success (CV = 28%), and breeding success (CV = 29%) wereabout three times less variable than kittiwake fledging success (CV = 81%) and breed-ing success (CV = 87%) during 14 colony-years of study in Cook Inlet (Piatt, 2002a).
Despite a robust capacity to deal with variation in prey abundance, however, murrebreeding success cannot be completely independent of food supply. Functionalresponse curves for aggregation and discretionary time spent at the colony (Fig.39)indicate that murres – as with kittiwakes – have a foraging threshold at about 0.013 g/m3
of fish biomass. Perhaps we failed to characterize a functional reproductive responsecurve because food supplies were never so low that they could not be behaviorallybuffered to prevent breeding failure. Consequently, while we frequently observed kit-tiwake breeding failures in Cook Inlet, we never observed total breeding failure inmurres. One explanation for the difference may by that when they are faced with thesame prey fields around a colony, murres can fly further and search nearly twice asmuch surface area than kittiwakes in the same time, dive far below the surface insearch of prey, and they have more discretionary time to divert to foraging (Piatt,2002a).
How representative are these data from Cook Inlet for murres and kittiwakes else-where? We can examine variability in breeding success of murres and kittiwakes fromlong-term (1975–1999) data collected throughout Alaska (Gulf of Alaska, Aleutians,Bering, and Chukchi Seas) in a variety of monitoring and research programs (Hatchet al., 1993; Dragoo et al., 2000). From these data (Fig.40, Table 4), which include anextreme – but natural – range of environmental conditions for breeding (Hatch et al.,1993), we find that common murres (n = 14 colonies, n = 99 colony-years) have rarelyexhibited complete breeding failure (0 chicks/pair on only 4% of occasions), and ononly 26% of the occasions was breeding success indicative of a limiting food supply(i.e. below 0.40 chicks/pair; see earlier text). Remarkably, common murres were suc-cessful (>0.40 chicks/pair) about three-quarters of the time (Fig.40) and variability inbreeding success was quite low (CV = 40%) and similar to that observed in Cook Inlet(CV = 28%). In contrast, kittiwakes (n = 17 colonies, n = 235 colony-years) had com-plete failures (0 chicks/pair) 18% percent of the time, and showed signs of food lim-itation (breeding success <0.46 chicks/pair) 77% of the time. On only 23% ofoccasions did kittiwakes appear to be unrestricted by food supply. Kittiwakes showedhigh levels of variability in breeding success in Cook Inlet (CV = 87%) and Alaska(CV = 110%).
A similar contrast in murre and kittiwake breeding success has been noted else-where (Table 4). Common murres observed during 54 colony-years at a variety ofcolonies in the North Atlantic (Birkhead, 1976; Hedgren, 1980; Birkhead andNettleship, 1987; Harris and Wanless, 1988, unpublished data; Burger and Piatt, 1990;
Long-term Change 335
Ch04-N52960 8/22/06 11:14 AM Page 335
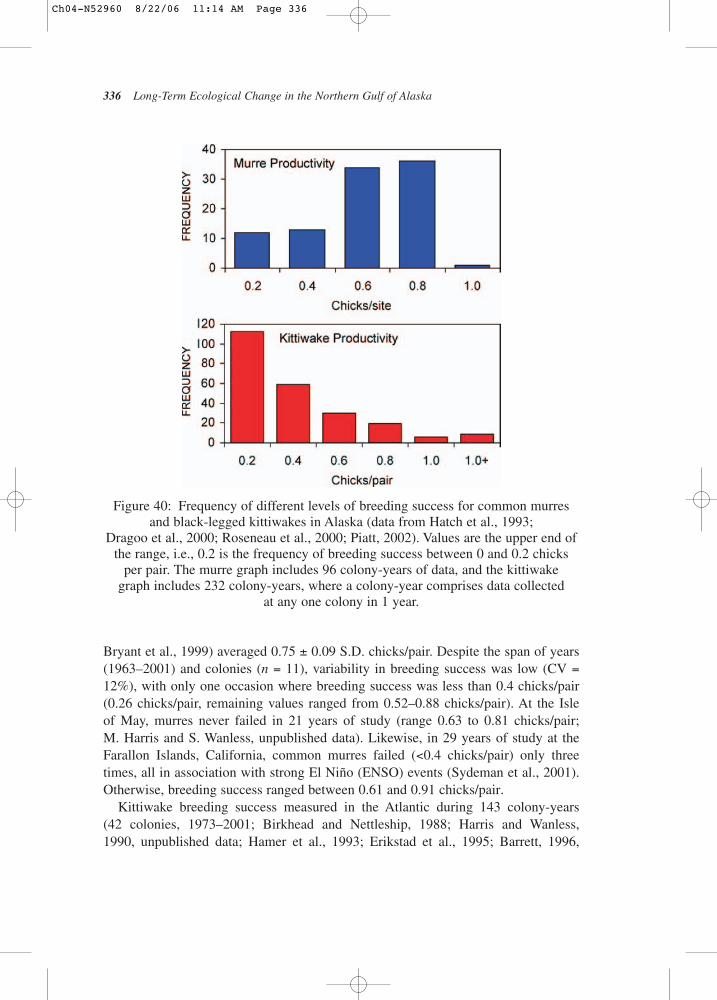
336 Long-Term Ecological Change in the Northern Gulf of Alaska
Bryant et al., 1999) averaged 0.75 ± 0.09 S.D. chicks/pair. Despite the span of years(1963–2001) and colonies (n = 11), variability in breeding success was low (CV =12%), with only one occasion where breeding success was less than 0.4 chicks/pair(0.26 chicks/pair, remaining values ranged from 0.52–0.88 chicks/pair). At the Isle of May, murres never failed in 21 years of study (range 0.63 to 0.81 chicks/pair; M. Harris and S. Wanless, unpublished data). Likewise, in 29 years of study at theFarallon Islands, California, common murres failed (<0.4 chicks/pair) only threetimes, all in association with strong El Niño (ENSO) events (Sydeman et al., 2001).Otherwise, breeding success ranged between 0.61 and 0.91 chicks/pair.
Kittiwake breeding success measured in the Atlantic during 143 colony-years(42 colonies, 1973–2001; Birkhead and Nettleship, 1988; Harris and Wanless, 1990, unpublished data; Hamer et al., 1993; Erikstad et al., 1995; Barrett, 1996,
Figure 40: Frequency of different levels of breeding success for common murresand black-legged kittiwakes in Alaska (data from Hatch et al., 1993;
Dragoo et al., 2000; Roseneau et al., 2000; Piatt, 2002). Values are the upper end ofthe range, i.e., 0.2 is the frequency of breeding success between 0 and 0.2 chicks
per pair. The murre graph includes 96 colony-years of data, and the kittiwake graph includes 232 colony-years, where a colony-year comprises data collected
at any one colony in 1 year.
Ch04-N52960 8/22/06 11:14 AM Page 336
Long-term Change 337
unpublished data; Anker-Nilssen et al., 1997) averaged 0.77 ± 0.39 chicks/pair andvariability (CV = 53%) was more than four times greater than that observed inAtlantic murres (12%, Table 4). Indeed, it appears that under a wide range of condi-tions, kittiwake productivity is always more variable than murre productivity (Fig.41).Furthermore, for both species, variability is high when productivity (and presumablyfood density) is low. This suggests that factors controlling seabird populations oper-ate over moderate to large regional scales such as those arbitrarily selected in Table 4.It appears that in “good times,” high-density prey aggregations are available to most
Table 4: Variability in breeding success of black-legged kittiwakes and commonmurres in different geographic areas
Breeding Success
Species Location N (years) mean CV (%) S.D.
Kittiwakes Cook Inlet 15 0.31 87 0.27Gulf of Alaska 113 0.24 110 0.26Aleutians 20 0.27 84 0.22Bering Sea 84 0.24 94 0.24Chukchi Sea 18 0.82 65 0.54Alaska 235 0.29 110 0.32Newfoundland 7 0.86 65 0.56Vedoy I., Norway 20 0.69 41 0.28Hornoya I., Norway 17 0.93 27 0.25Isle of May, UK 17 0.59 69 0.41North Sea 1986 15 1.09 29 0.32North Sea 1987 20 0.96 49 0.47North Sea 1988 21 0.61 85 0.52West Coast UK 31 0.62 56 0.35Atlantic Ocean 148 0.77 53 0.39
Murres Cook Inlet 14 0.61 29 0.18Gulf of Alaska 34 0.54 34 0.18Aleutians 13 0.41 76 0.31Bering Sea 52 0.50 35 0.17Alaska 99 0.50 41 0.20California 29 0.74 29 0.22Newfoundland 14 0.76 9 0.07Isle of May, UK 21 0.78 7 0.06Europe 19 0.70 20 0.14Atlantic Ocean 54 0.75 12 0.09
(See text for sources of data).
Ch04-N52960 8/22/06 11:14 AM Page 337
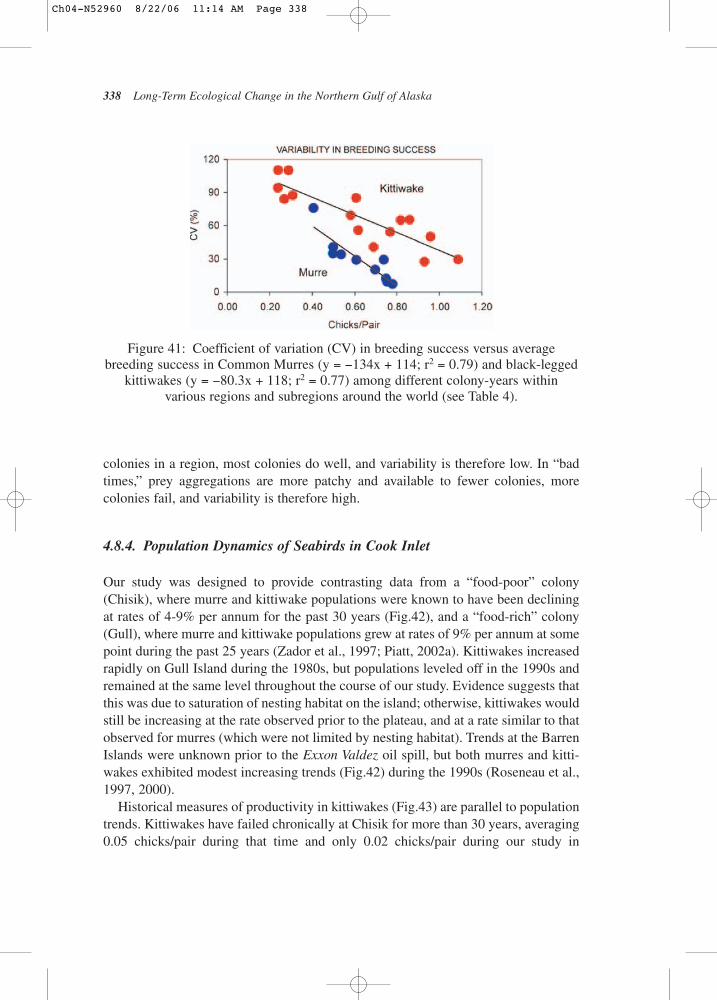
338 Long-Term Ecological Change in the Northern Gulf of Alaska
colonies in a region, most colonies do well, and variability is therefore low. In “badtimes,” prey aggregations are more patchy and available to fewer colonies, morecolonies fail, and variability is therefore high.
4.8.4. Population Dynamics of Seabirds in Cook Inlet
Our study was designed to provide contrasting data from a “food-poor” colony(Chisik), where murre and kittiwake populations were known to have been decliningat rates of 4-9% per annum for the past 30 years (Fig.42), and a “food-rich” colony(Gull), where murre and kittiwake populations grew at rates of 9% per annum at somepoint during the past 25 years (Zador et al., 1997; Piatt, 2002a). Kittiwakes increasedrapidly on Gull Island during the 1980s, but populations leveled off in the 1990s andremained at the same level throughout the course of our study. Evidence suggests thatthis was due to saturation of nesting habitat on the island; otherwise, kittiwakes wouldstill be increasing at the rate observed prior to the plateau, and at a rate similar to thatobserved for murres (which were not limited by nesting habitat). Trends at the BarrenIslands were unknown prior to the Exxon Valdez oil spill, but both murres and kitti-wakes exhibited modest increasing trends (Fig.42) during the 1990s (Roseneau et al.,1997, 2000).
Historical measures of productivity in kittiwakes (Fig.43) are parallel to populationtrends. Kittiwakes have failed chronically at Chisik for more than 30 years, averaging0.05 chicks/pair during that time and only 0.02 chicks/pair during our study in
Figure 41: Coefficient of variation (CV) in breeding success versus averagebreeding success in Common Murres (y = −134x + 114; r2 = 0.79) and black-legged
kittiwakes (y = −80.3x + 118; r2 = 0.77) among different colony-years withinvarious regions and subregions around the world (see Table 4).
Ch04-N52960 8/22/06 11:14 AM Page 338
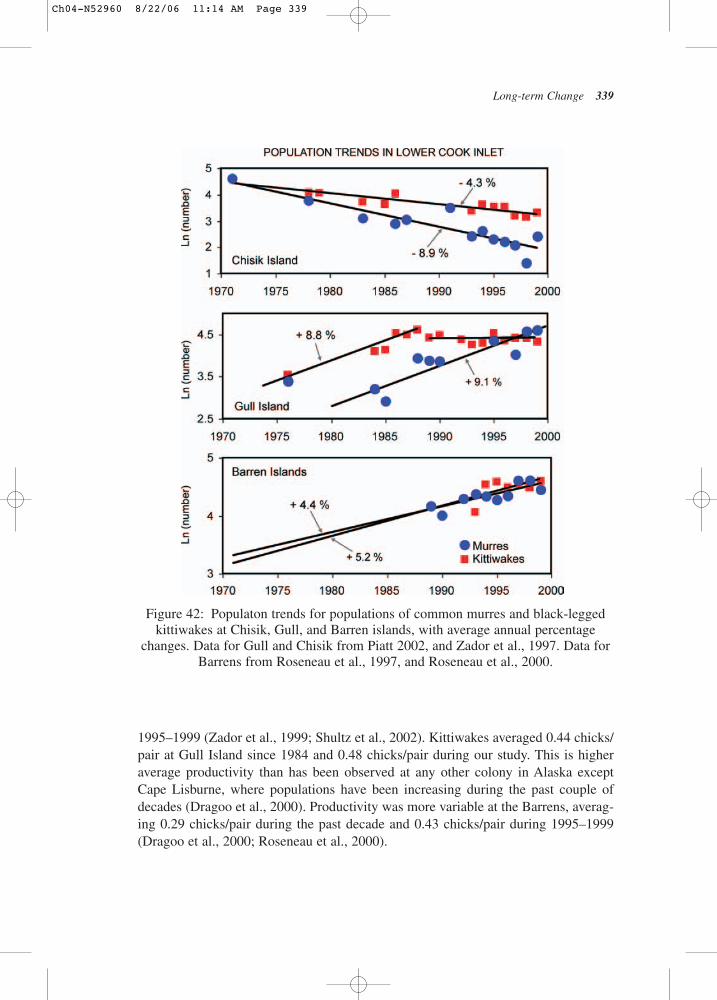
Long-term Change 339
1995–1999 (Zador et al., 1999; Shultz et al., 2002). Kittiwakes averaged 0.44 chicks/pair at Gull Island since 1984 and 0.48 chicks/pair during our study. This is higheraverage productivity than has been observed at any other colony in Alaska exceptCape Lisburne, where populations have been increasing during the past couple ofdecades (Dragoo et al., 2000). Productivity was more variable at the Barrens, averag-ing 0.29 chicks/pair during the past decade and 0.43 chicks/pair during 1995–1999(Dragoo et al., 2000; Roseneau et al., 2000).
Figure 42: Populaton trends for populations of common murres and black-leggedkittiwakes at Chisik, Gull, and Barren islands, with average annual percentage
changes. Data for Gull and Chisik from Piatt 2002, and Zador et al., 1997. Data forBarrens from Roseneau et al., 1997, and Roseneau et al., 2000.
Ch04-N52960 8/22/06 11:14 AM Page 339
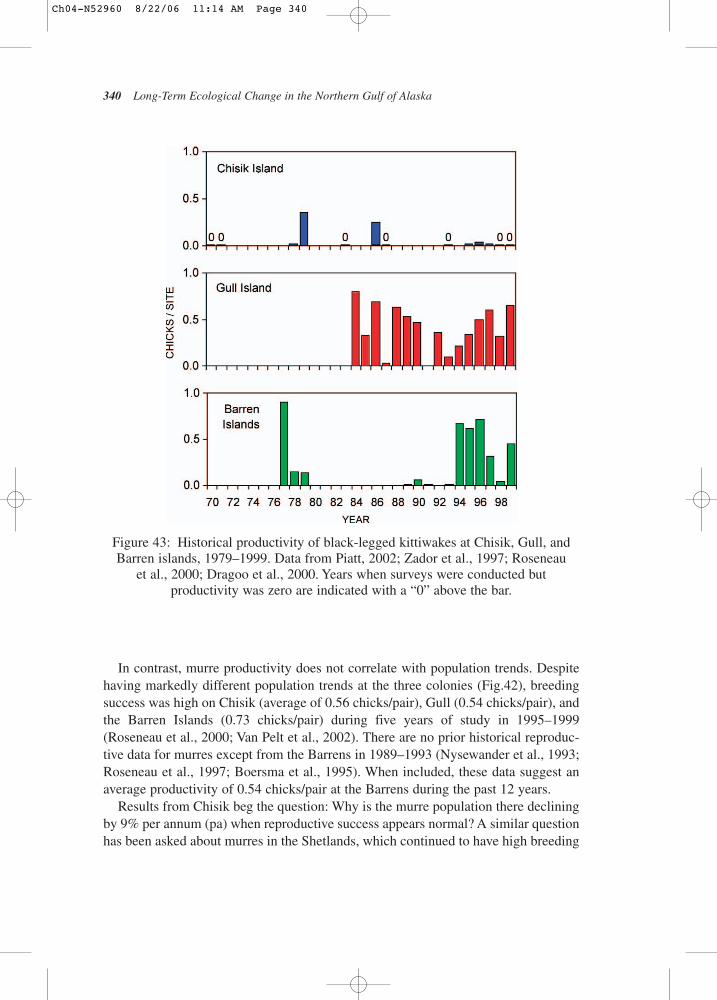
340 Long-Term Ecological Change in the Northern Gulf of Alaska
In contrast, murre productivity does not correlate with population trends. Despitehaving markedly different population trends at the three colonies (Fig.42), breedingsuccess was high on Chisik (average of 0.56 chicks/pair), Gull (0.54 chicks/pair), andthe Barren Islands (0.73 chicks/pair) during five years of study in 1995–1999(Roseneau et al., 2000; Van Pelt et al., 2002). There are no prior historical reproduc-tive data for murres except from the Barrens in 1989–1993 (Nysewander et al., 1993;Roseneau et al., 1997; Boersma et al., 1995). When included, these data suggest anaverage productivity of 0.54 chicks/pair at the Barrens during the past 12 years.
Results from Chisik beg the question: Why is the murre population there decliningby 9% per annum (pa) when reproductive success appears normal? A similar questionhas been asked about murres in the Shetlands, which continued to have high breeding
Figure 43: Historical productivity of black-legged kittiwakes at Chisik, Gull, andBarren islands, 1979–1999. Data from Piatt, 2002; Zador et al., 1997; Roseneau
et al., 2000; Dragoo et al., 2000. Years when surveys were conducted butproductivity was zero are indicated with a “0” above the bar.
Ch04-N52960 8/22/06 11:14 AM Page 340
success even as numbers at colonies declined in apparent response to a crash in foodstocks (Furness and Camphuysen, 1997). Preliminary results of a survival study onGull and Chisik islands (Piatt, 2004) may help answer this question. This study sug-gested that there are marked differences in population parameters of murres on Gulland Chisik islands. On Chisik, annual adult mortality (9.2% pa) exceeds slightly therate of population decline (−8.9% pa), suggesting a small balancing rate of 0.3% paincrease due to recruitment (or possibly immigration). This indicates that survival ofmurre chicks to breeding at Chisik is neglible. Indeed, survival of chicks is likely tobe much lower if fledgling chicks are underweight (Hatch, 1983; Sagar and Horning,1998) – as they frequently are at Chisik (Van Pelt et al., 2002). Furthermore, recruit-ment at a declining murre colony is likely to be less than 20% (Hudson, 1985) andpossibly less than 5% (Hatchwell and Birkhead, 1991). This would explain howChisik murres can maintain such high breeding success and yet experience seriouspopulation declines. In contrast, the high rate (9.1% pa) of murre population increaseat Gull Island can be explained by a low rate (6% pa) of adult mortality that is morethan offset by high rates of recruitment and/or immigration.
Kittiwake population parameters are more straightforward (Piatt, 2004). At Chisik,recruitment has to be virtually zero because productivity is negligible. Thus, the pop-ulation decline (−4.3% pa) is explained entirely by adult mortality (6.7% pa), offsetslightly by immigration. At Gull Island, a much higher adult mortality rate (14.5% pa)is balanced by much higher levels of productivity, recruitment, and immigration. The differences in survival and productivity between Gull and Chisik seem to supportthe hypothesis that long-lived seabirds trade off the costs of reproduction with adultsurvival (Erikstad et al., 1998; Golet et al., 1998, 2004).
Population Parameter IndicesThe question posed by the Exxon Valdez Oil Spill Trustee Council was whether or notrecovery of seabirds was limited by environmental conditions in the Gulf of Alaska –particularly at the Barren Islands, whose murre populations were hard hit by the spill(Piatt et al., 1990; Roseneau et al., 1997). But how do we compare the robustness ofseabird populations among colonies in Cook Inlet, or among regions in Alaska? Asillustrated in the preceeding text, any one parameter we choose to examine may bebiased depending on the form of its relationship to food supply and whether it ishighly variable or relatively constant in the face of environmental change. Similarly,any one species may be more sensitive to different aspects of environmental changethan another species.
One way to assess and compare the performance of seabirds among colonies inCook Inlet is to compare the deviation of parameter values at any one colony with theaverage of all three colonies combined (Fig.44). For example, the average breedingsuccess of kittiwakes in 15 colony-years (three colonies in 1995–1999) of study was
Long-term Change 341
Ch04-N52960 8/22/06 11:14 AM Page 341

342 Long-Term Ecological Change in the Northern Gulf of Alaska
0.312 chicks/pair (Shultz et al., 2002). Success of kittiwakes at the Barrens was lowerthan this in 2 years of study and higher in 3 years. Success was higher than this aver-age in all 5 years at Gull Island, and much lower than this average in all 5 years atChisik. Similarly, we calculated deviations from average in many different behav-ioural, reproductive and physiological parameters (e.g. attendance, feeding rate,growth rate, fledging success, etc., for both murres and kittiwakes; from tables inShultz et al., 2002; Van Pelt et al., 2002), standardized the deviations, and arbitrarilyranked them from largest to smallest at each colony so that we could examine themall together (Fig.44). In total, we can compare 266 parameter deviations (about 20species parameters by year, colony, with some missing values). This provides an inte-grated assessment of how well seabirds were doing at each colony during the 5 years
Figure 44: Normalized deviations from average of seabird breeding and behavioralparameters at Chisik, Gull, and Barren islands, 1995–1999. Deviations have beenarbitrarily ranked by magnitude from most positive (left) to most negative (right).
Data from Piatt, 2002a, and Roseneau et al., 2000.
Ch04-N52960 8/22/06 11:14 AM Page 342
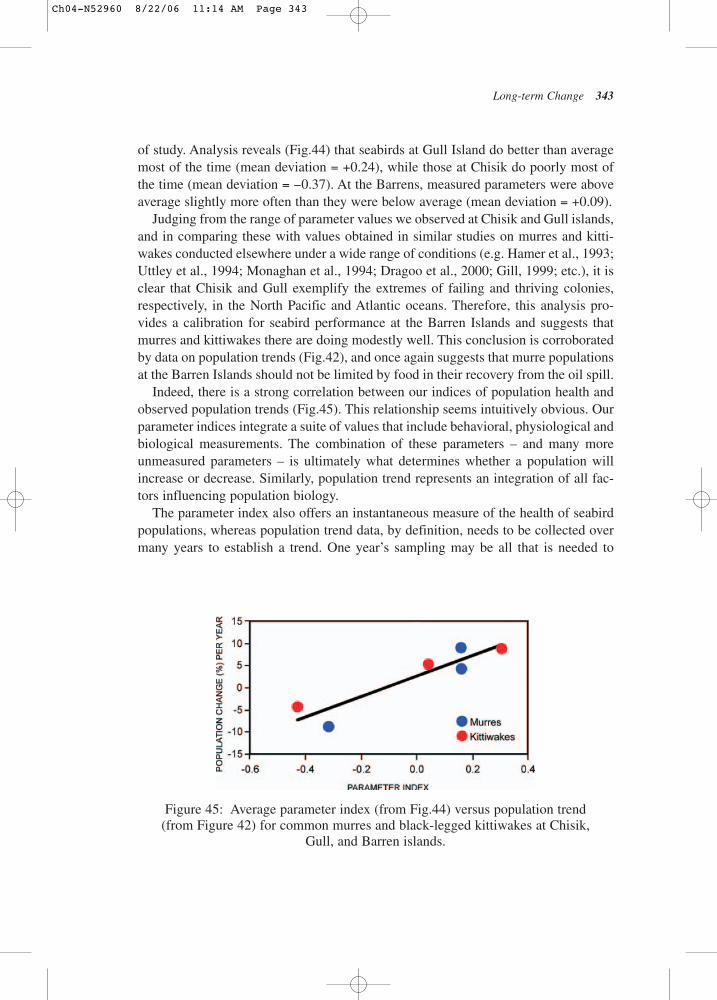
Long-term Change 343
of study. Analysis reveals (Fig.44) that seabirds at Gull Island do better than averagemost of the time (mean deviation = +0.24), while those at Chisik do poorly most ofthe time (mean deviation = −0.37). At the Barrens, measured parameters were aboveaverage slightly more often than they were below average (mean deviation = +0.09).
Judging from the range of parameter values we observed at Chisik and Gull islands,and in comparing these with values obtained in similar studies on murres and kitti-wakes conducted elsewhere under a wide range of conditions (e.g. Hamer et al., 1993;Uttley et al., 1994; Monaghan et al., 1994; Dragoo et al., 2000; Gill, 1999; etc.), it isclear that Chisik and Gull exemplify the extremes of failing and thriving colonies,respectively, in the North Pacific and Atlantic oceans. Therefore, this analysis pro-vides a calibration for seabird performance at the Barren Islands and suggests thatmurres and kittiwakes there are doing modestly well. This conclusion is corroboratedby data on population trends (Fig.42), and once again suggests that murre populationsat the Barren Islands should not be limited by food in their recovery from the oil spill.
Indeed, there is a strong correlation between our indices of population health andobserved population trends (Fig.45). This relationship seems intuitively obvious. Ourparameter indices integrate a suite of values that include behavioral, physiological andbiological measurements. The combination of these parameters – and many moreunmeasured parameters – is ultimately what determines whether a population willincrease or decrease. Similarly, population trend represents an integration of all fac-tors influencing population biology.
The parameter index also offers an instantaneous measure of the health of seabirdpopulations, whereas population trend data, by definition, needs to be collected overmany years to establish a trend. One year’s sampling may be all that is needed to
Figure 45: Average parameter index (from Fig.44) versus population trend(from Figure 42) for common murres and black-legged kittiwakes at Chisik,
Gull, and Barren islands.
Ch04-N52960 8/22/06 11:14 AM Page 343
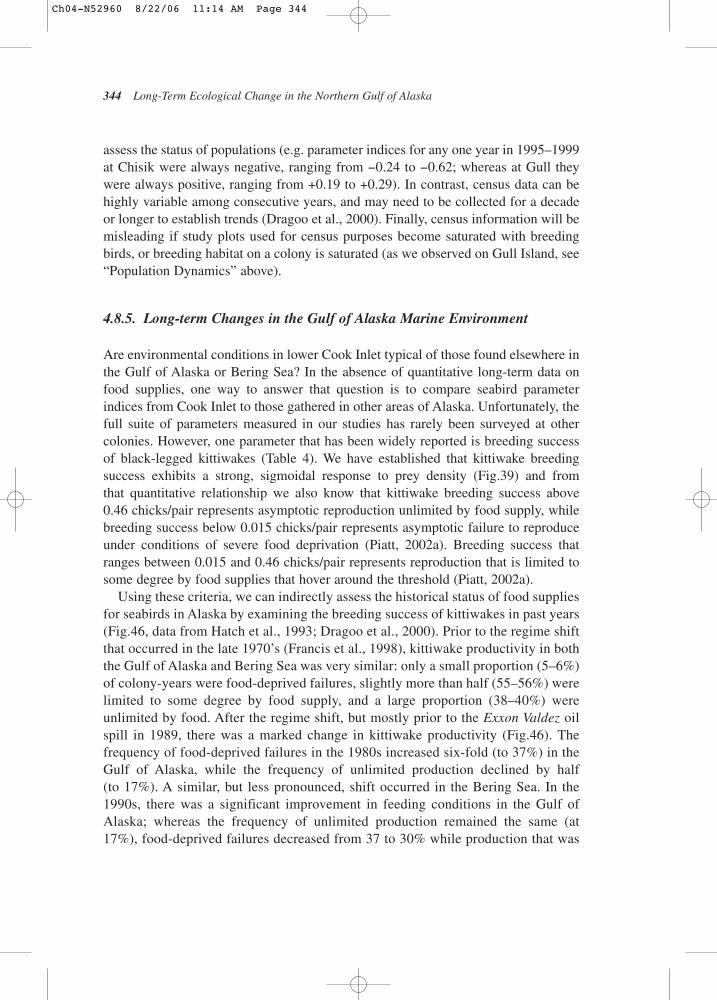
assess the status of populations (e.g. parameter indices for any one year in 1995–1999at Chisik were always negative, ranging from −0.24 to −0.62; whereas at Gull theywere always positive, ranging from +0.19 to +0.29). In contrast, census data can behighly variable among consecutive years, and may need to be collected for a decadeor longer to establish trends (Dragoo et al., 2000). Finally, census information will bemisleading if study plots used for census purposes become saturated with breedingbirds, or breeding habitat on a colony is saturated (as we observed on Gull Island, see“Population Dynamics” above).
4.8.5. Long-term Changes in the Gulf of Alaska Marine Environment
Are environmental conditions in lower Cook Inlet typical of those found elsewhere inthe Gulf of Alaska or Bering Sea? In the absence of quantitative long-term data onfood supplies, one way to answer that question is to compare seabird parameterindices from Cook Inlet to those gathered in other areas of Alaska. Unfortunately, thefull suite of parameters measured in our studies has rarely been surveyed at othercolonies. However, one parameter that has been widely reported is breeding successof black-legged kittiwakes (Table 4). We have established that kittiwake breedingsuccess exhibits a strong, sigmoidal response to prey density (Fig.39) and fromthat quantitative relationship we also know that kittiwake breeding success above 0.46 chicks/pair represents asymptotic reproduction unlimited by food supply, whilebreeding success below 0.015 chicks/pair represents asymptotic failure to reproduceunder conditions of severe food deprivation (Piatt, 2002a). Breeding success thatranges between 0.015 and 0.46 chicks/pair represents reproduction that is limited tosome degree by food supplies that hover around the threshold (Piatt, 2002a).
Using these criteria, we can indirectly assess the historical status of food suppliesfor seabirds in Alaska by examining the breeding success of kittiwakes in past years(Fig.46, data from Hatch et al., 1993; Dragoo et al., 2000). Prior to the regime shiftthat occurred in the late 1970’s (Francis et al., 1998), kittiwake productivity in boththe Gulf of Alaska and Bering Sea was very similar: only a small proportion (5–6%)of colony-years were food-deprived failures, slightly more than half (55–56%) werelimited to some degree by food supply, and a large proportion (38–40%) wereunlimited by food. After the regime shift, but mostly prior to the Exxon Valdez oilspill in 1989, there was a marked change in kittiwake productivity (Fig.46). Thefrequency of food-deprived failures in the 1980s increased six-fold (to 37%) in theGulf of Alaska, while the frequency of unlimited production declined by half (to 17%). A similar, but less pronounced, shift occurred in the Bering Sea. In the1990s, there was a significant improvement in feeding conditions in the Gulf ofAlaska; whereas the frequency of unlimited production remained the same (at17%), food-deprived failures decreased from 37 to 30% while production that was
344 Long-Term Ecological Change in the Northern Gulf of Alaska
Ch04-N52960 8/22/06 11:14 AM Page 344
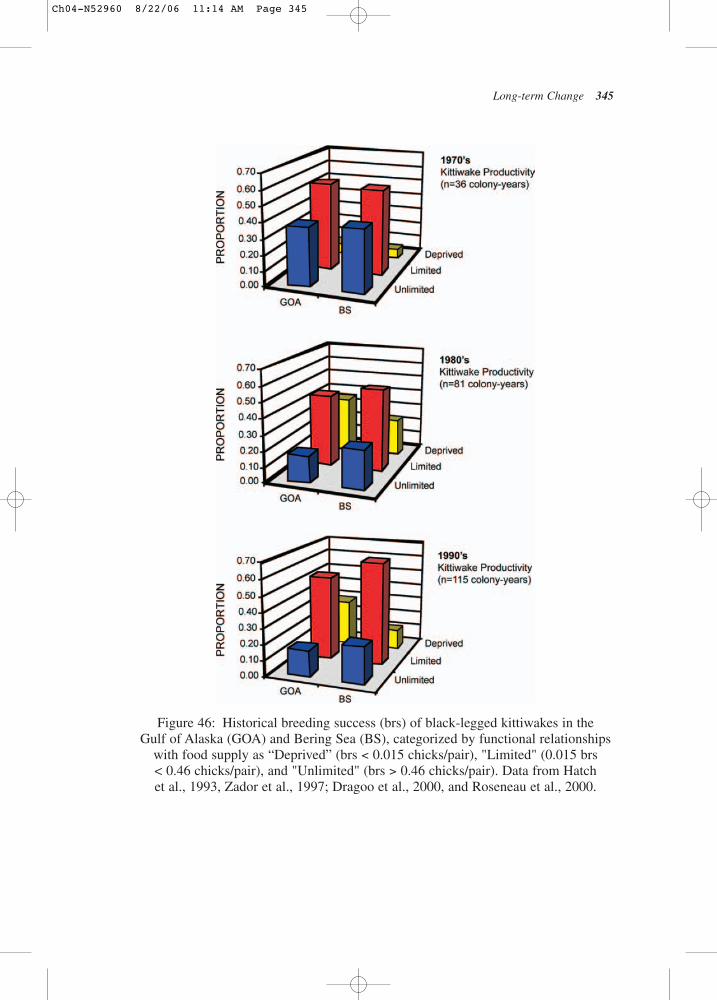
Long-term Change 345
Figure 46: Historical breeding success (brs) of black-legged kittiwakes in the Gulf of Alaska (GOA) and Bering Sea (BS), categorized by functional relationships
with food supply as “Deprived” (brs < 0.015 chicks/pair), "Limited" (0.015 brs < 0.46 chicks/pair), and "Unlimited" (brs > 0.46 chicks/pair). Data from Hatch et al., 1993, Zador et al., 1997; Dragoo et al., 2000, and Roseneau et al., 2000.
Ch04-N52960 8/22/06 11:14 AM Page 345
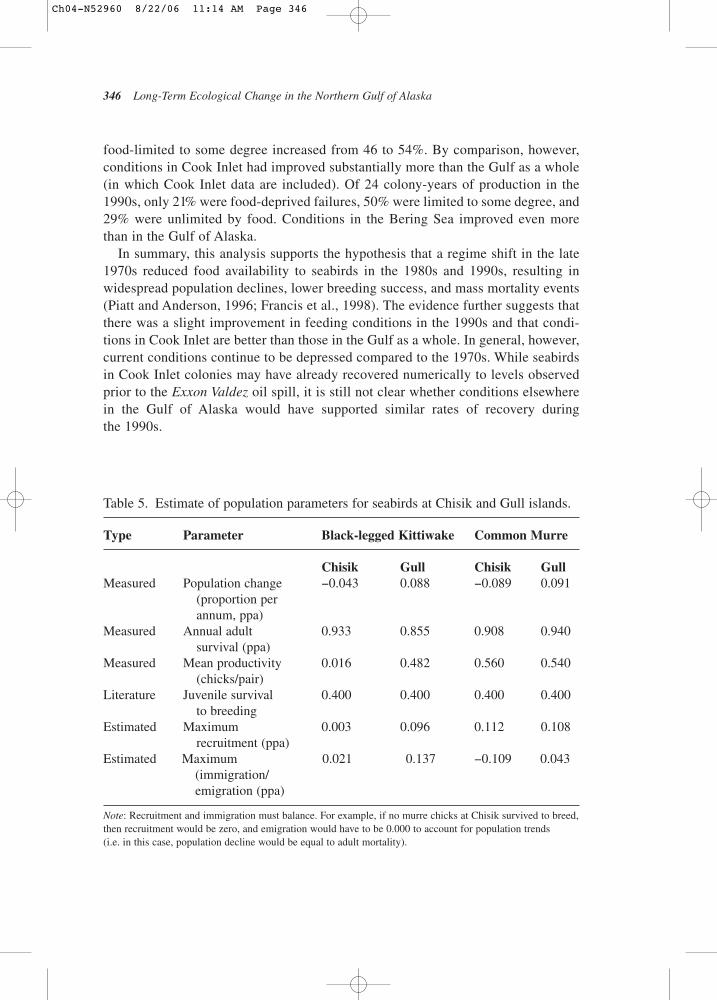
346 Long-Term Ecological Change in the Northern Gulf of Alaska
food-limited to some degree increased from 46 to 54%. By comparison, however,conditions in Cook Inlet had improved substantially more than the Gulf as a whole(in which Cook Inlet data are included). Of 24 colony-years of production in the1990s, only 21% were food-deprived failures, 50% were limited to some degree, and29% were unlimited by food. Conditions in the Bering Sea improved even morethan in the Gulf of Alaska.
In summary, this analysis supports the hypothesis that a regime shift in the late1970s reduced food availability to seabirds in the 1980s and 1990s, resulting inwidespread population declines, lower breeding success, and mass mortality events(Piatt and Anderson, 1996; Francis et al., 1998). The evidence further suggests thatthere was a slight improvement in feeding conditions in the 1990s and that condi-tions in Cook Inlet are better than those in the Gulf as a whole. In general, however,current conditions continue to be depressed compared to the 1970s. While seabirdsin Cook Inlet colonies may have already recovered numerically to levels observedprior to the Exxon Valdez oil spill, it is still not clear whether conditions elsewherein the Gulf of Alaska would have supported similar rates of recovery during the 1990s.
Table 5. Estimate of population parameters for seabirds at Chisik and Gull islands.
Type Parameter Black-legged Kittiwake Common Murre
Chisik Gull Chisik GullMeasured Population change −0.043 0.088 −0.089 0.091
(proportion per annum, ppa)
Measured Annual adult 0.933 0.855 0.908 0.940survival (ppa)
Measured Mean productivity 0.016 0.482 0.560 0.540(chicks/pair)
Literature Juvenile survival 0.400 0.400 0.400 0.400to breeding
Estimated Maximum 0.003 0.096 0.112 0.108recruitment (ppa)
Estimated Maximum 0.021 0.137 −0.109 0.043(immigration/emigration (ppa)
Note: Recruitment and immigration must balance. For example, if no murre chicks at Chisik survived to breed,then recruitment would be zero, and emigration would have to be 0.000 to account for population trends(i.e. in this case, population decline would be equal to adult mortality).
Ch04-N52960 8/22/06 11:14 AM Page 346
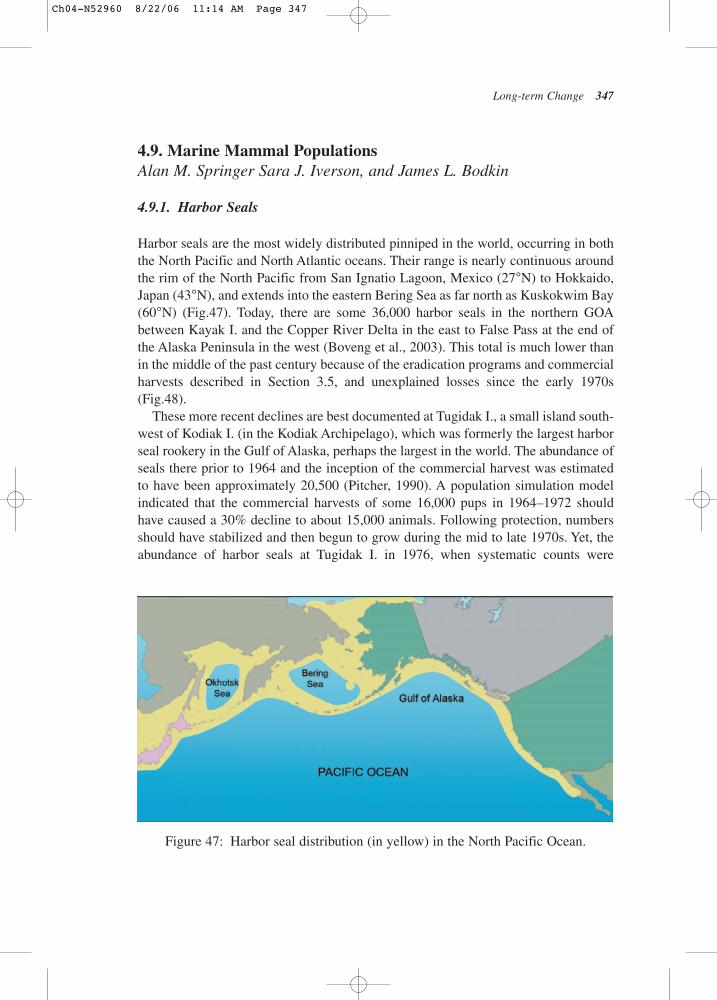
Long-term Change 347
4.9. Marine Mammal Populations Alan M. Springer Sara J. Iverson, and James L. Bodkin
4.9.1. Harbor Seals
Harbor seals are the most widely distributed pinniped in the world, occurring in boththe North Pacific and North Atlantic oceans. Their range is nearly continuous aroundthe rim of the North Pacific from San Ignatio Lagoon, Mexico (27°N) to Hokkaido,Japan (43°N), and extends into the eastern Bering Sea as far north as Kuskokwim Bay(60°N) (Fig.47). Today, there are some 36,000 harbor seals in the northern GOAbetween Kayak I. and the Copper River Delta in the east to False Pass at the end ofthe Alaska Peninsula in the west (Boveng et al., 2003). This total is much lower thanin the middle of the past century because of the eradication programs and commercialharvests described in Section 3.5, and unexplained losses since the early 1970s(Fig.48).
These more recent declines are best documented at Tugidak I., a small island south-west of Kodiak I. (in the Kodiak Archipelago), which was formerly the largest harborseal rookery in the Gulf of Alaska, perhaps the largest in the world. The abundance ofseals there prior to 1964 and the inception of the commercial harvest was estimatedto have been approximately 20,500 (Pitcher, 1990). A population simulation modelindicated that the commercial harvests of some 16,000 pups in 1964–1972 shouldhave caused a 30% decline to about 15,000 animals. Following protection, numbersshould have stabilized and then begun to grow during the mid to late 1970s. Yet, theabundance of harbor seals at Tugidak I. in 1976, when systematic counts were
Figure 47: Harbor seal distribution (in yellow) in the North Pacific Ocean.
Ch04-N52960 8/22/06 11:14 AM Page 347
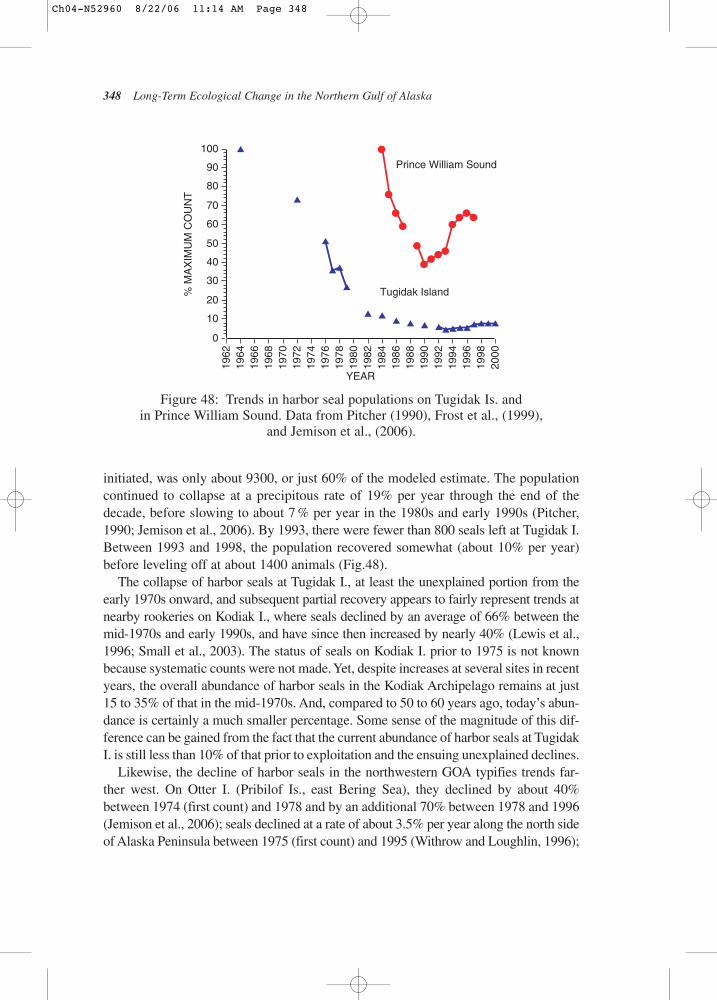
348 Long-Term Ecological Change in the Northern Gulf of Alaska
initiated, was only about 9300, or just 60% of the modeled estimate. The populationcontinued to collapse at a precipitous rate of 19% per year through the end of thedecade, before slowing to about 7 % per year in the 1980s and early 1990s (Pitcher,1990; Jemison et al., 2006). By 1993, there were fewer than 800 seals left at Tugidak I.Between 1993 and 1998, the population recovered somewhat (about 10% per year)before leveling off at about 1400 animals (Fig.48).
The collapse of harbor seals at Tugidak I., at least the unexplained portion from theearly 1970s onward, and subsequent partial recovery appears to fairly represent trends atnearby rookeries on Kodiak I., where seals declined by an average of 66% between themid-1970s and early 1990s, and have since then increased by nearly 40% (Lewis et al.,1996; Small et al., 2003). The status of seals on Kodiak I. prior to 1975 is not knownbecause systematic counts were not made. Yet, despite increases at several sites in recentyears, the overall abundance of harbor seals in the Kodiak Archipelago remains at just15 to 35% of that in the mid-1970s. And, compared to 50 to 60 years ago, today’s abun-dance is certainly a much smaller percentage. Some sense of the magnitude of this dif-ference can be gained from the fact that the current abundance of harbor seals at TugidakI. is still less than 10% of that prior to exploitation and the ensuing unexplained declines.
Likewise, the decline of harbor seals in the northwestern GOA typifies trends far-ther west. On Otter I. (Pribilof Is., east Bering Sea), they declined by about 40%between 1974 (first count) and 1978 and by an additional 70% between 1978 and 1996(Jemison et al., 2006); seals declined at a rate of about 3.5% per year along the north sideof Alaska Peninsula between 1975 (first count) and 1995 (Withrow and Loughlin, 1996);
0
10
20
30
40
50
60
70
80
90
100
1962
1964
1966
1968
1970
1972
1974
1976
1978
1980
1982
1984
1986
1988
1990
1992
1994
1996
1998
2000
% M
AX
IMU
M C
OU
NT
YEAR
Prince William Sound
Tugidak Island
Figure 48: Trends in harbor seal populations on Tugidak Is. and in Prince William Sound. Data from Pitcher (1990), Frost et al., (1999),
and Jemison et al., (2006).
Ch04-N52960 8/22/06 11:14 AM Page 348
and despite an annual increase in Nanvak Bay (Bristol Bay, east Bering Sea) of about2.1% per year from 1990 to 2000, the maximum count in 2000 was just 20% of thehighest count in 1975 (first count) (L. Jemison in Small et al., 2003). Systematiccounts of harbor seals have not been made in the Aleutian Islands, but conspicuousdeclines have been observed by scientists working there during the past 30 years (J. Estes, unpublished obs.).
Harbor seals in eastern and central PWS declined also – by 63% between 1984 and1997 and by about 3% per year since then (Frost et al., 1999; Ver Hoef and Frost, 2003).The lack of systematic counts prior to 1984 makes it impossible to know whether thedecline began before then, perhaps concurrent with declines in the Kodiak I. region.Notably, the decline in PWS was underway by the time of the 1989 oil spill, and themagnitude of the decline from 1984 to 1990 (50%) was similar to that in the sametime period at Tugidak I. (60%). Numbers in PWS continued to decline after 1990,but increased at Tugidak I.
Scientists believed initially that about 320 harbor seals were killed in PWS by oilfrom the spill (Frost et al., 1994). That estimate was based on changes in numbers at 25haul-out sites along a standard trend-count route established in the early 1980s.Subsequent monitoring of seals at those sites led to the further conclusion that thepopulation in the sound continued to decline through the 1990s (Frost et al., 1999).
However, this interpretation was challenged based on more widespread surveysthat included additional areas of PWS, particularly the western sound and glacialhaul-out sites (Hoover-Miller et al., 2001). These scientists contend that there is noevidence of significant direct mortality of seals by oil in 1989, and that surveys in1989 and since then along the original trend-count route failed to account for themobility of seals – they suggest that many seals likely moved to other parts of thesound to avoid oiled habitats. In support of their belief, they point out the large inter-annual variability in numbers of seals at individual haul-outs, suggesting short-termlocal movements, and that since 1991 numbers of seals at glacial sites have tended toincrease while numbers at land sites have tended to decrease. However, studies ofradio-tagged seals in the spill area did not show adult movements into the northernfjord areas of Prince William Sound where counts have been increasing. Also, deadharbor seal often sink, as may have happened following the spill.
In contrast to the widespread declines of harbor seals throughout the northern andwestern GOA, Aleutian Is., and Bering Sea since the 1970s, trends in abundance insoutheastern Alaska and British Columbia have been variable but generally opposite.In Glacier Bay in northern southeastern Alaska, a dramatic increase occurred betweenthe mid-1970s and mid-1980s, followed by declines beginning in the early 1990s(Mathews and Pendleton, 1997, 2000). Harbor seals near Ketchikan in southernsoutheastern Alaska increased rapidly from the early 1980s through the mid-1990s,then slowed through the end of the decade, whereas seals near Sitka increased little if anyover this same period (Small et al., 2003). In British Columbia, harbor seals had been
Long-term Change 349
Ch04-N52960 8/22/06 11:14 AM Page 349
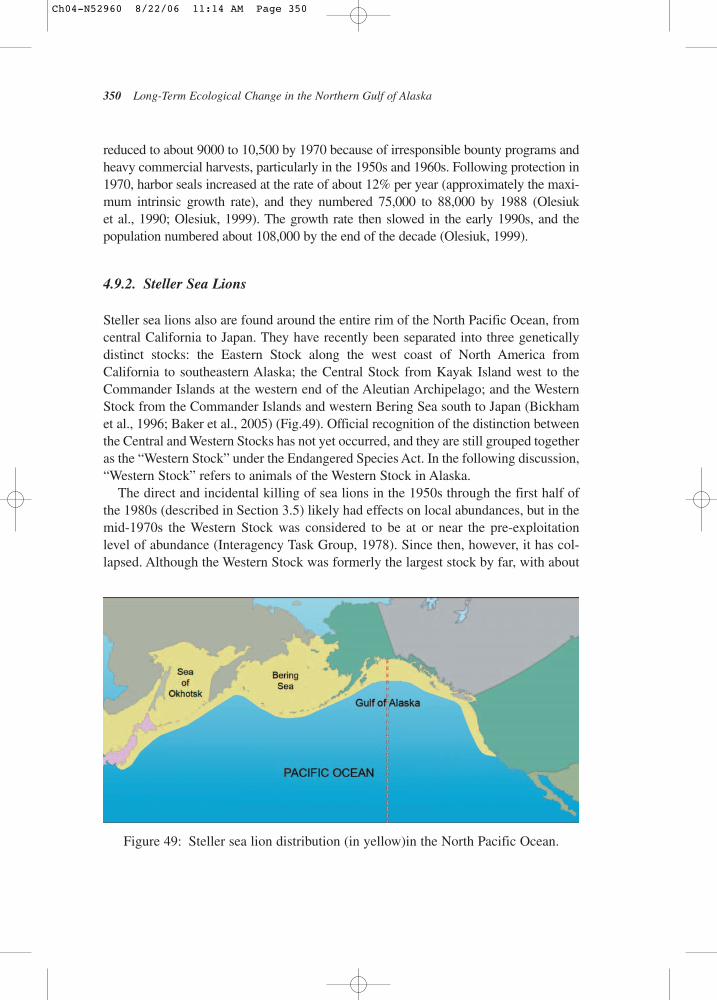
350 Long-Term Ecological Change in the Northern Gulf of Alaska
reduced to about 9000 to 10,500 by 1970 because of irresponsible bounty programs andheavy commercial harvests, particularly in the 1950s and 1960s. Following protection in1970, harbor seals increased at the rate of about 12% per year (approximately the maxi-mum intrinsic growth rate), and they numbered 75,000 to 88,000 by 1988 (Olesiuk et al., 1990; Olesiuk, 1999). The growth rate then slowed in the early 1990s, and the population numbered about 108,000 by the end of the decade (Olesiuk, 1999).
4.9.2. Steller Sea Lions
Steller sea lions also are found around the entire rim of the North Pacific Ocean, fromcentral California to Japan. They have recently been separated into three geneticallydistinct stocks: the Eastern Stock along the west coast of North America fromCalifornia to southeastern Alaska; the Central Stock from Kayak Island west to theCommander Islands at the western end of the Aleutian Archipelago; and the WesternStock from the Commander Islands and western Bering Sea south to Japan (Bickhamet al., 1996; Baker et al., 2005) (Fig.49). Official recognition of the distinction betweenthe Central and Western Stocks has not yet occurred, and they are still grouped togetheras the “Western Stock” under the Endangered Species Act. In the following discussion,“Western Stock” refers to animals of the Western Stock in Alaska.
The direct and incidental killing of sea lions in the 1950s through the first half ofthe 1980s (described in Section 3.5) likely had effects on local abundances, but in themid-1970s the Western Stock was considered to be at or near the pre-exploitationlevel of abundance (Interagency Task Group, 1978). Since then, however, it has col-lapsed. Although the Western Stock was formerly the largest stock by far, with about
Figure 49: Steller sea lion distribution (in yellow)in the North Pacific Ocean.
Ch04-N52960 8/22/06 11:14 AM Page 350
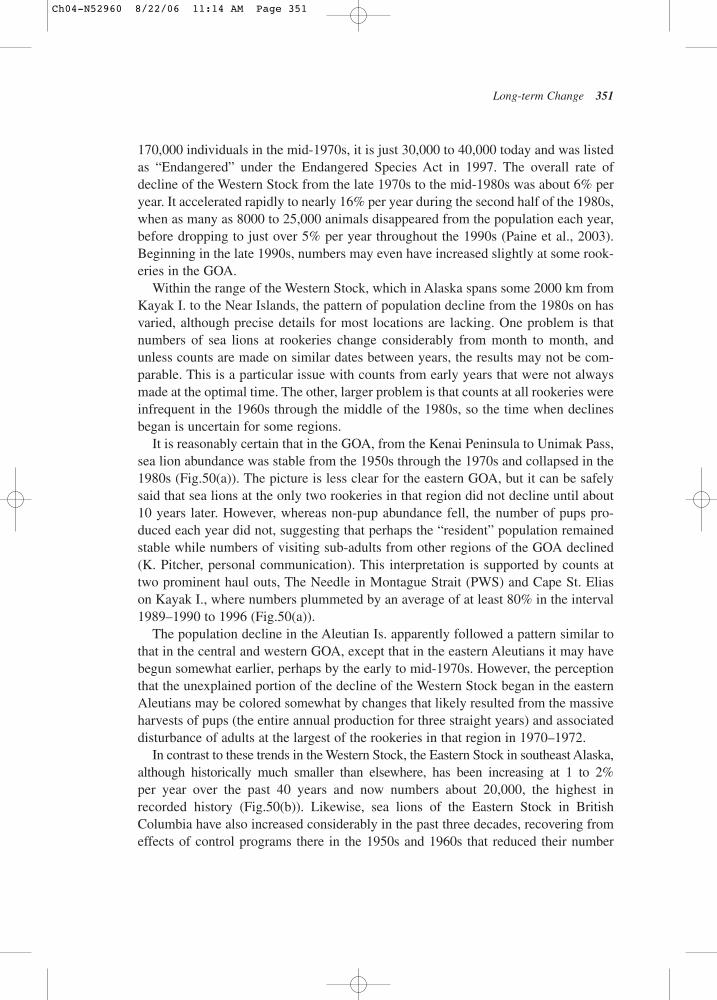
170,000 individuals in the mid-1970s, it is just 30,000 to 40,000 today and was listedas “Endangered” under the Endangered Species Act in 1997. The overall rate ofdecline of the Western Stock from the late 1970s to the mid-1980s was about 6% peryear. It accelerated rapidly to nearly 16% per year during the second half of the 1980s,when as many as 8000 to 25,000 animals disappeared from the population each year,before dropping to just over 5% per year throughout the 1990s (Paine et al., 2003).Beginning in the late 1990s, numbers may even have increased slightly at some rook-eries in the GOA.
Within the range of the Western Stock, which in Alaska spans some 2000 km fromKayak I. to the Near Islands, the pattern of population decline from the 1980s on hasvaried, although precise details for most locations are lacking. One problem is thatnumbers of sea lions at rookeries change considerably from month to month, andunless counts are made on similar dates between years, the results may not be com-parable. This is a particular issue with counts from early years that were not alwaysmade at the optimal time. The other, larger problem is that counts at all rookeries wereinfrequent in the 1960s through the middle of the 1980s, so the time when declinesbegan is uncertain for some regions.
It is reasonably certain that in the GOA, from the Kenai Peninsula to Unimak Pass,sea lion abundance was stable from the 1950s through the 1970s and collapsed in the1980s (Fig.50(a)). The picture is less clear for the eastern GOA, but it can be safelysaid that sea lions at the only two rookeries in that region did not decline until about10 years later. However, whereas non-pup abundance fell, the number of pups pro-duced each year did not, suggesting that perhaps the “resident” population remainedstable while numbers of visiting sub-adults from other regions of the GOA declined(K. Pitcher, personal communication). This interpretation is supported by counts attwo prominent haul outs, The Needle in Montague Strait (PWS) and Cape St. Eliason Kayak I., where numbers plummeted by an average of at least 80% in the interval1989–1990 to 1996 (Fig.50(a)).
The population decline in the Aleutian Is. apparently followed a pattern similar tothat in the central and western GOA, except that in the eastern Aleutians it may havebegun somewhat earlier, perhaps by the early to mid-1970s. However, the perceptionthat the unexplained portion of the decline of the Western Stock began in the easternAleutians may be colored somewhat by changes that likely resulted from the massiveharvests of pups (the entire annual production for three straight years) and associateddisturbance of adults at the largest of the rookeries in that region in 1970–1972.
In contrast to these trends in the Western Stock, the Eastern Stock in southeast Alaska,although historically much smaller than elsewhere, has been increasing at 1 to 2% per year over the past 40 years and now numbers about 20,000, the highest inrecorded history (Fig.50(b)). Likewise, sea lions of the Eastern Stock in BritishColumbia have also increased considerably in the past three decades, recovering fromeffects of control programs there in the 1950s and 1960s that reduced their number
Long-term Change 351
Ch04-N52960 8/22/06 11:14 AM Page 351
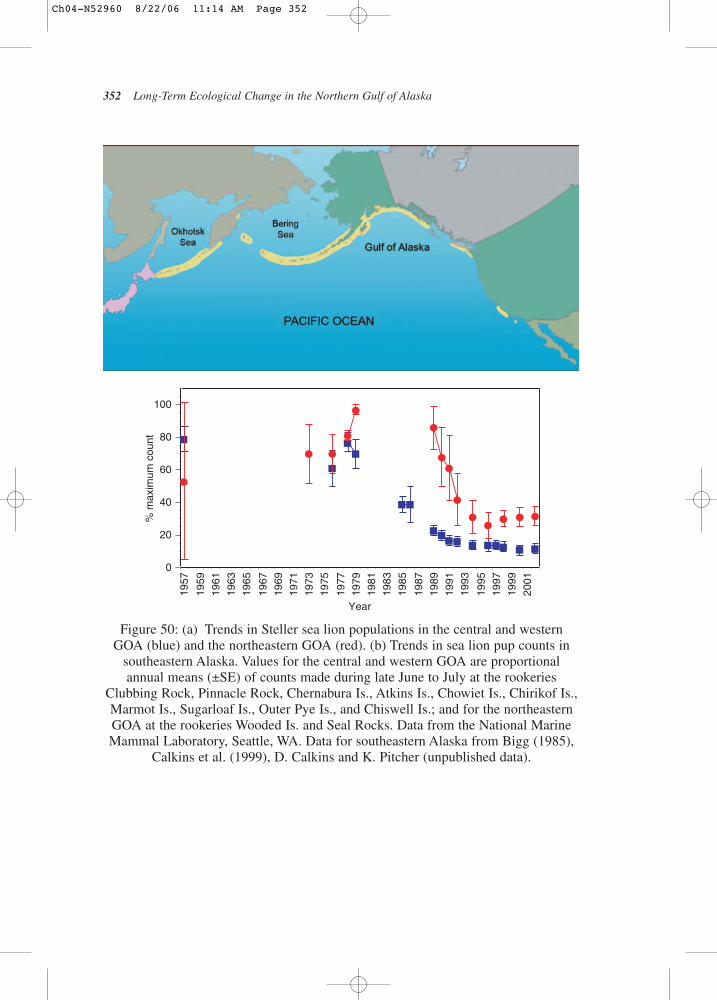
352 Long-Term Ecological Change in the Northern Gulf of Alaska
1957
1959
1961
1963
1965
1967
1969
1971
1973
1975
1977
1979
1981
1983
1985
1987
1989
1991
1993
1995
1997
1999
2001
0
20
40
60
80
100
% m
axim
um c
ount
Year
Figure 50: (a) Trends in Steller sea lion populations in the central and westernGOA (blue) and the northeastern GOA (red). (b) Trends in sea lion pup counts in
southeastern Alaska. Values for the central and western GOA are proportionalannual means (±SE) of counts made during late June to July at the rookeries
Clubbing Rock, Pinnacle Rock, Chernabura Is., Atkins Is., Chowiet Is., Chirikof Is.,Marmot Is., Sugarloaf Is., Outer Pye Is., and Chiswell Is.; and for the northeasternGOA at the rookeries Wooded Is. and Seal Rocks. Data from the National MarineMammal Laboratory, Seattle, WA. Data for southeastern Alaska from Bigg (1985),
Calkins et al. (1999), D. Calkins and K. Pitcher (unpublished data).
Ch04-N52960 8/22/06 11:14 AM Page 352
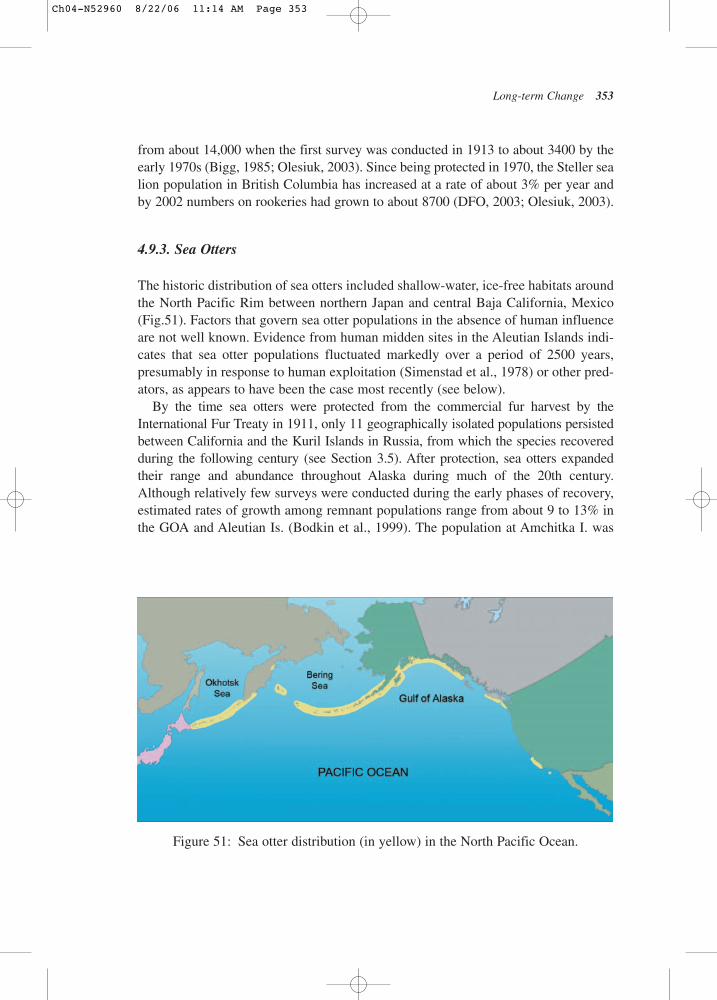
Long-term Change 353
from about 14,000 when the first survey was conducted in 1913 to about 3400 by theearly 1970s (Bigg, 1985; Olesiuk, 2003). Since being protected in 1970, the Steller sealion population in British Columbia has increased at a rate of about 3% per year andby 2002 numbers on rookeries had grown to about 8700 (DFO, 2003; Olesiuk, 2003).
4.9.3. Sea Otters
The historic distribution of sea otters included shallow-water, ice-free habitats aroundthe North Pacific Rim between northern Japan and central Baja California, Mexico(Fig.51). Factors that govern sea otter populations in the absence of human influenceare not well known. Evidence from human midden sites in the Aleutian Islands indi-cates that sea otter populations fluctuated markedly over a period of 2500 years,presumably in response to human exploitation (Simenstad et al., 1978) or other pred-ators, as appears to have been the case most recently (see below).
By the time sea otters were protected from the commercial fur harvest by theInternational Fur Treaty in 1911, only 11 geographically isolated populations persistedbetween California and the Kuril Islands in Russia, from which the species recoveredduring the following century (see Section 3.5). After protection, sea otters expandedtheir range and abundance throughout Alaska during much of the 20th century. Although relatively few surveys were conducted during the early phases of recovery,estimated rates of growth among remnant populations range from about 9 to 13% inthe GOA and Aleutian Is. (Bodkin et al., 1999). The population at Amchitka I. was
Figure 51: Sea otter distribution (in yellow) in the North Pacific Ocean.
Ch04-N52960 8/22/06 11:14 AM Page 353
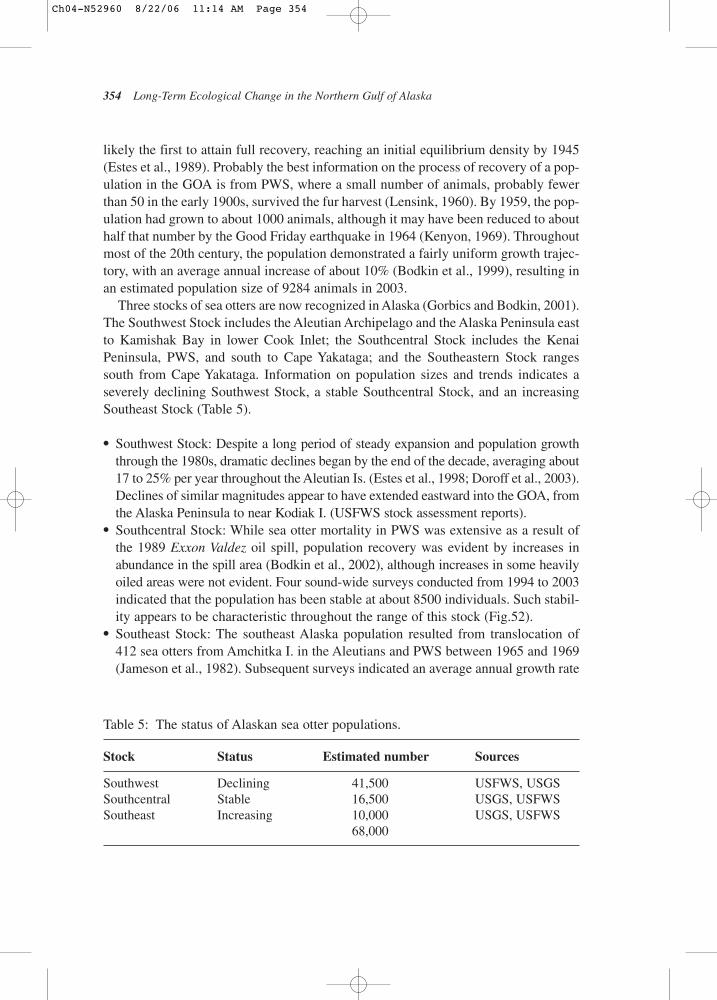
354 Long-Term Ecological Change in the Northern Gulf of Alaska
likely the first to attain full recovery, reaching an initial equilibrium density by 1945(Estes et al., 1989). Probably the best information on the process of recovery of a pop-ulation in the GOA is from PWS, where a small number of animals, probably fewerthan 50 in the early 1900s, survived the fur harvest (Lensink, 1960). By 1959, the pop-ulation had grown to about 1000 animals, although it may have been reduced to abouthalf that number by the Good Friday earthquake in 1964 (Kenyon, 1969). Throughoutmost of the 20th century, the population demonstrated a fairly uniform growth trajec-tory, with an average annual increase of about 10% (Bodkin et al., 1999), resulting inan estimated population size of 9284 animals in 2003.
Three stocks of sea otters are now recognized in Alaska (Gorbics and Bodkin, 2001).The Southwest Stock includes the Aleutian Archipelago and the Alaska Peninsula eastto Kamishak Bay in lower Cook Inlet; the Southcentral Stock includes the KenaiPeninsula, PWS, and south to Cape Yakataga; and the Southeastern Stock rangessouth from Cape Yakataga. Information on population sizes and trends indicates aseverely declining Southwest Stock, a stable Southcentral Stock, and an increasingSoutheast Stock (Table 5).
● Southwest Stock: Despite a long period of steady expansion and population growththrough the 1980s, dramatic declines began by the end of the decade, averaging about17 to 25% per year throughout the Aleutian Is. (Estes et al., 1998; Doroff et al., 2003).Declines of similar magnitudes appear to have extended eastward into the GOA, fromthe Alaska Peninsula to near Kodiak I. (USFWS stock assessment reports).
● Southcentral Stock: While sea otter mortality in PWS was extensive as a result ofthe 1989 Exxon Valdez oil spill, population recovery was evident by increases inabundance in the spill area (Bodkin et al., 2002), although increases in some heavilyoiled areas were not evident. Four sound-wide surveys conducted from 1994 to 2003indicated that the population has been stable at about 8500 individuals. Such stabil-ity appears to be characteristic throughout the range of this stock (Fig.52).
● Southeast Stock: The southeast Alaska population resulted from translocation of412 sea otters from Amchitka I. in the Aleutians and PWS between 1965 and 1969(Jameson et al., 1982). Subsequent surveys indicated an average annual growth rate
Table 5: The status of Alaskan sea otter populations.
Stock Status Estimated number Sources
Southwest Declining 41,500 USFWS, USGSSouthcentral Stable 16,500 USGS, USFWSSoutheast Increasing 10,000 USGS, USFWS
68,000
Ch04-N52960 8/22/06 11:14 AM Page 354
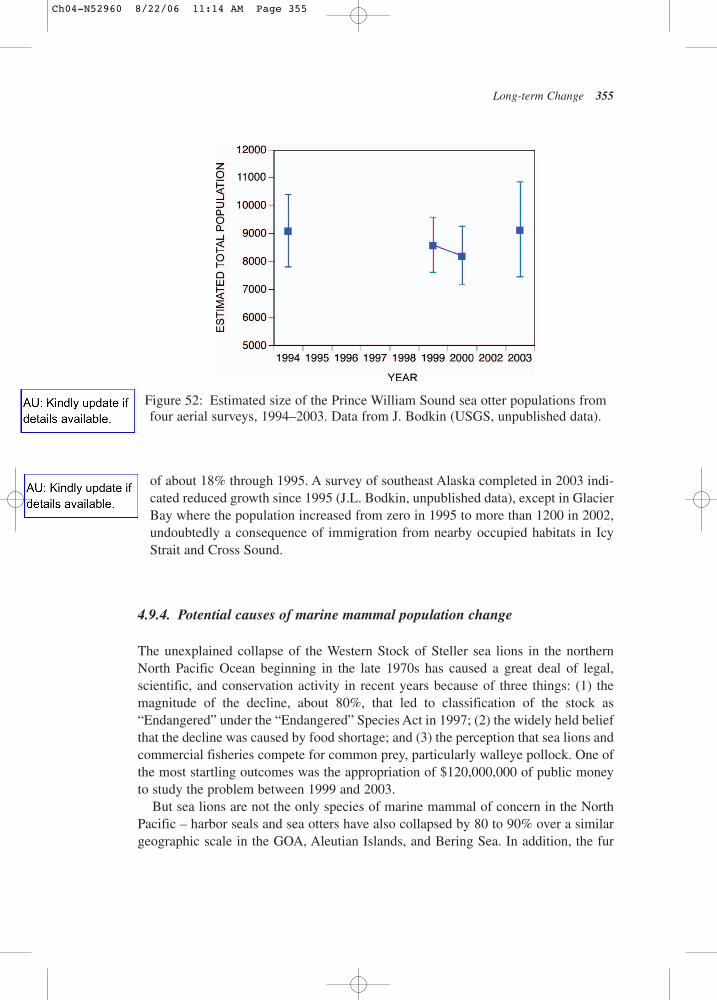
Long-term Change 355
of about 18% through 1995. A survey of southeast Alaska completed in 2003 indi-cated reduced growth since 1995 (J.L. Bodkin, unpublished data), except in GlacierBay where the population increased from zero in 1995 to more than 1200 in 2002,undoubtedly a consequence of immigration from nearby occupied habitats in IcyStrait and Cross Sound.
4.9.4. Potential causes of marine mammal population change
The unexplained collapse of the Western Stock of Steller sea lions in the northernNorth Pacific Ocean beginning in the late 1970s has caused a great deal of legal, scientific, and conservation activity in recent years because of three things: (1) themagnitude of the decline, about 80%, that led to classification of the stock as“Endangered” under the “Endangered” Species Act in 1997; (2) the widely held beliefthat the decline was caused by food shortage; and (3) the perception that sea lions andcommercial fisheries compete for common prey, particularly walleye pollock. One ofthe most startling outcomes was the appropriation of $120,000,000 of public moneyto study the problem between 1999 and 2003.
But sea lions are not the only species of marine mammal of concern in the NorthPacific – harbor seals and sea otters have also collapsed by 80 to 90% over a similargeographic scale in the GOA, Aleutian Islands, and Bering Sea. In addition, the fur
Figure 52: Estimated size of the Prince William Sound sea otter populations fromfour aerial surveys, 1994–2003. Data from J. Bodkin (USGS, unpublished data).
Ch04-N52960 8/22/06 11:14 AM Page 355
kavithank
Text Box
AU: Kindly update if details available.
kavithank
Text Box
AU: Kindly update if details available.
seal herd on the Pribilof Is. has declined by over two-thirds since the 1960s and iscontinuing to fall more than 6% per year since 1998 (York and Hartley, 1981; Tritesand Larkin, 1989; Towell, 2004). Among the many species of marine mammals in theNorth Pacific, including great whales, dolphins, porpoises, and other pinnipeds, thesefour species stand out because of the magnitudes and rates of their declines. None ofthe other species are known to have undergone such changes, and some, such as cer-tain whales, increased in number during this time.
Disease, contamination, redistribution, subsistence use, and commercial har-vests have been discounted as important causes of any of the major declines of pin-nipeds or sea otters in the North Pacific since the 1970s (Estes et al., 1998; Loughlinand York, 2000; DeMaster and Atkinson, 2002; Paine et al., 2003), except in theparticular case of sea otters in PWS. As noted above, direct and incidental killing weresignificant causes of mortality for harbor seals and sea lions in the 1950s and 1960s.This likely had broadscale effects on the abundance of harbor seals and sea lionsin the GOA, particularly in southeast Alaska and British Columbia, and localeffects at several rookeries in the Kodiak Archipelago and eastern Aleutian Is.Also, a misguided experimental harvest of fur seals on the Pribilof Is. in1958–1965 caused much of the initial decline throughout the 1960s and the firsthalf of 1970s, and entanglement in marine debris in the 1970s and 1980s may havefurther contributed to early declines (Fowler, 1987; Swartzman et al., 1990). Sincethe early to mid-1970s, however, intentional and accidental killing probably havenot had effects on populations of any of these species locally or rangewide thatwere large enough to explain the magnitude and rate of decline they all sufferedsince then.
Nutritional limitation, because of general lack of prey or because of the lack of preyof high nutritional quality, has been the leading hypothesis for the unexplained por-tions of the pinniped declines that began with harbor seals in the early 1970s (Alverson,1992; Anonymous, 1993; Trites and Donnelly, 2003). Initially, it was thought that foodshortage had two effects that combined to cause the declines – starvation and reducedproductivity. Although there is some evidence for lowered productivity of sea lions, pop-ulation models indicate that this was not sufficient to explain the collapse without greatlyelevated mortality of juveniles and adults (Pascual and Adkison, 1994; York, 1994;Pitcher et al., 1998; Paine et al., 2003). Yet, despite the huge annual toll of sea lionsduring the period of greatest decline in the mid to late 1980s, when as many as 25,000animals disappeared from the population each year, a lack of reports of distressedor emaciated sea lions (or of harbor seals or fur seals), on rookeries or haulouts insummer, of thin animals taken by subsistence hunters in fall, winter, and spring, orunusual numbers of dead sea lions or seals on beaches in any season, argued againststarvation or disease as a cause of high mortality (Hoover, 1988). Mortality fromnutritional limitation, disease, and pollution typically results in large numbers ofstranded carcasses, such as occurred during the morbillivirus outbreak in pinnipeds in
356 Long-Term Ecological Change in the Northern Gulf of Alaska
Ch04-N52960 8/22/06 11:14 AM Page 356
the North Sea (see Section 3.5) and during El Niño events in the North Pacific whenmany animals starve. Still, little is known about what happens to pinnipeds at sea atmany times of the year, especially in the juvenile age class, which is likely to be hithardest by food shortage. Yet, juvenile mortality alone could not account for the mag-nitude and rate of decline that was observed in harbor seal, sea lion, or sea otter pop-ulations in the 1970s, 1980s, and 1990s.
Lack of support for the starvation idea led to an important modification of thenutritional stress hypothesis, applied to the particular case of sea lions. The modifiedexplanation was that nutrition was not so poor as to cause sea lions to die outright,but was sufficiently poor to lower productivity and individual fitness and make themmuch more susceptible to other sources of mortality such as disease and predation(Trites and Donnelly, 2003). Trites and Donnelly further modified the hypothesis tosay that sea lions were physiologically compromised not because of an overall lack of prey, but because of a lack of prey with high fat content. Because disease appar-ently was not important, that leaves predation as the most plausible “other source,”or at least a dominant source among a suite of possible factors. The recent review bythe National Research Council (Paine et al., 2003) also failed to support the notionthat food shortage or disease was to blame for patterns of decline in the 1990s, butinstead implicated top-down processes such as predation. Paine et al. did not elabo-rate on the particular mechanisms of the sea lion collapse in the 1980s, beyondsaying it likely involved multiple agents. Their review also failed to support the ideathat commercial fisheries were responsible for perceived food shortages during thedecline.
More recently still, predation by killer whales has been proposed as a competing,unified hypothesis to nutritional stress to explain much of the decline of all threespecies of pinnipeds (Springer et al., 2003; Estes et al., 2004; Williams et al., 2004). It follows from compelling arguments and the weight of evidence that killer whalepredation was responsible for the collapse of the sea otter population in the AleutianIs. (Estes et al., 1998). In that case, thorough studies were made of disease, redistrib-ution, direct mortality, food availability, and other factors that might have been impor-tant to the otter population, but they were rejected as contributing in any importantway to the decline. According to the hypothesis, elevated killer whale predation wasnot caused by lowered individual fitness of pinnipeds and otters, and thus increasedsusceptibility to predation, but by a decline in the abundance of other prey of killerwhales, the great whales, that was brought on by industrial whaling following the endof World War II.
So, what is the evidence for these two ideas – lack of food or predation, or both?Are there similarities between observations of the various species? And, what are thetimelines? As we shall see, getting the timing right of when and where eventsoccurred and trends began is crucial to an understanding of the cause of the collapseof these species of megafauna in the northern North Pacific.
Long-term Change 357
Ch04-N52960 8/22/06 11:14 AM Page 357
358 Long-Term Ecological Change in the Northern Gulf of Alaska
4.9.5. Harbor Seal Decline
The commercial and bounty harvests of harbor seals in the GOA in the 1950s and1960s varied geographically in important ways. Very little seal killing occurred on thesouth side of the Alaska Peninsula or in the Aleutian Is. Pups were targeted in summerin the eastern Bering Sea (primarily Port Moller and Port Heiden on the north side ofthe Alaska Peninsula); on Tugidak I., where 90% of the seals killed were pups; andelsewhere in the northern GOA, including Yakutat, PWS, and Kodiak I. (K. Pitcher,personal communication). In southeast Alaska, however, most seal hunting was doneby fishermen in winter, the off-season for fishing, and older seals including adultswere taken. Likewise, all age classes were killed in British Columbia.
Although juvenile mortality accounts for most mortality in populations, harbor sealpopulations, like those of other pinnipeds and sea otters, are particularly sensitive toadult mortality. Therefore, effects of killing pups versus adults on population demo-graphics and stability must be born in mind when trying to understand the highly vari-able patterns in abundance of seals from British Columbia to the Bering Sea in thepast 3 to 4 decades. In British Columbia, and perhaps throughout the broader regionincluding southeast Alaska, reduction programs and commercial and bounty harvestsdecimated seals in the 1950s and 1960s, and abundances were very low by the begin-ning of the 1970s. In contrast, harbor seal populations in the northern GOA were notaffected as greatly, even though substantial numbers of seals were killed. Harvestswere localized at particular rookeries and targeted newly born pups, many of whichwould not have survived their first year of independence anyway, let alone survivedto adulthood. The Tugidak Is. case discussed above illustrates this difference nicely –the capture of some 16,000 pups over a period of 9 years should have resulted in apopulation decline of less than 30%.
At Tugidak Is., this initial portion of the harbor seal decline is therefore consideredto be “explained” by the pup harvest. However, the continuation and accelerationof the decline after 1972 and the cessation of the harvest remains “unexplained.” Ofparticular note is that this portion of the overall decline began well in advance of theclimate regime shift in the second half of the 1970s. Elsewhere in the GOA andBering Sea, harbor seals were clearly in decline from at least 1975–1976 onward, theperiod when counts at most rookeries were first made. The idea that unexplaineddeclines began earlier than the mid-1970s is further supported by counts at Otter I.(Pribilof Is.), which registered a 40% drop in abundance between 1974 and 1978.
Information on other aspects of harbor seal biology over time in the GOA is limited to pupping dates at Tugidak I. Pupping dates there, as indexed by the date ofmaximum pup numbers in the pupping period, were about 10 days later in 1976–1979than in either 1964 or 1994–1998 (~22–25 June compared to 11–13 June; Jemisonand Kelly, 2001). The authors suggested two possible explanations – differences intiming of when food was available to pregnant females and overall differences in the
Ch04-N52960 8/22/06 11:14 AM Page 358
quantity or quality of prey. A third factor that can influence pupping dates, age struc-ture of the population (older females tend to pup earlier than younger ones), was dis-counted: Jemison and Kelly argued that the large commercial pup harvests at Tugidak Is.in the 1960s and early 1970s should have skewed the population towards olderfemales by the mid-1970s and, all other things being equal, they should have givenbirth earlier on average than a younger population. Unfortunately, there is no infor-mation on the actual age structure of the population at any time during this interval.
The conclusion Jemison and Kelly reached in their study at Tugidak Is. was thatnutritional stress explained the later pupping dates in the mid to late 1970s. So, whatis the likelihood, based on information on harbor seals from Alaska and elsewhere, as well as on their survival strategies, that (1) differences as great as this in puppingdates would be owing to differences in food availability, (2) such differences in pup-ping dates would have demographic relevance because of related differences in the fit-ness of pups, and (3) the later pupping dates in the 1970s reflected decreased fitnessof adult females, and indeed the population in general (adults, juveniles, and youngof year) at other times of the year so severely that individuals would have been morelikely to not reproduce, to die of starvation, or to succumb to disease or predators? In aggregate, could these possible effects explain the population collapse?
These questions are not easily answered, given the limited information available fromthe GOA. Indeed, we know practically nothing about many aspects of harbor seal biol-ogy during difficult and critical times of the year outside the breeding season, for exam-ple, during winter for all age classes and during the first few months of independence forpups when they must learn to forage for themselves and learn other survival skills neces-sary to live in an extreme and uncertain environment. However, we can look at data onharbor seals from another population that is well studied as an example. On Sable Is.,Nova Scotia, the harbor seal population has been declining for 15 years, plummetingfrom about 625 animals in 1989 to fewer than 32 by 1997 and about 10 today (Lucas andStobo, 2000; Bowen et al., 2003; W. D. Bowen and S. Iverson, unpublished data). The decline is similar in relative magnitude and duration to that at Tugidak Is., except thatthe population at Sable Is., now at an all-time low, shows no sign of recovery.
Over this time at Sable I., there were no indications that food shortage during thebreeding season (or in the few months prior) contributed to the population decline.For example, no interannual or long-term trends were seen in maternal postpartummass, pup birth mass, the rate of mass gain by pups during the lactation period, orthe mass of pups at weaning (Bowen et al., 2003). But, as with Tugidak I., there weredifferences in pupping dates, which increased by 7 days over the course of the 1990s,suggesting that implantation in females became progressively later, perhaps due tonutritional stress (Bowen et al., 2003).
Support for nutritional stress of harbor seals at Sable Is. is found in information ondietary overlap and competition. Harbor seals on Sable consume primarily sand lance,flatfishes, cods, and herring, the same suite of prey consumed by the coexisting,
Long-term Change 359
Ch04-N52960 8/22/06 11:14 AM Page 359
larger grey seals (Halichoerus grypus) there (Bowen and Harrison, 1994, 1996). The Sable Is. grey seal population has been growing exponentially for the past40 years, and, whereas grey seals outnumbered harbor seals by about 20:1 in the late1980s, they outnumbered them in the late 1990s by more than 500:1 (Bowen et al.,2003). Thus, grey seals may have limited prey available to harbor seals, at least duringthe fall, when females are beginning to implant and gestate.
The observations from Sable Is. suggest that the answer to question 1 above is thatnutritional status of female harbor seals likely is the explanation for variability inpupping dates on Tugidak Is. However, the answers to questions 2 and 3 are that thelikelihood is low that later pupping dates led to reduced fitness of pups at weaning orwas related to debilitating physiological condition of females in the months prior toor during the lactation period.
Although harbor seals are buffered by their economical, largely capital-based ener-getic strategy during the breeding season, nutritional stress at other times of the yearmight have affected not only implantation date on Sable Is., but also female fecundityand, thus, may have contributed to the population decline (Bowen et al., 2003). However,even the complete cessation of pupping at Sable Is. would not have explained the coin-cident collapse of the population. In the GOA, reduced fecundity was apparently notthe cause of the population collapse on Tugidak I., as the pregnancy rate of maturefemales in the GOA in the mid-1970s was 92%, similar to rates observed in healthypopulations elsewhere (Pitcher, 1990).
Another change in the population at Sable Is. was a decline in recruitment, indicat-ing a decline in juvenile survival. This too might have been caused by nutritionalstress, but in this case it was more likely caused by predation. Indeed, the bulk of thedecline in harbor seals on Sable Is. has been attributed to predation by sharks, whichtake animals of both sexes and all age classes, including adult females, which arekilled in disproportionate numbers (Lucas and Stobo, 2000; Bowen et al., 2003).There was an obvious decline in recruitment at Tugidak Is. as well, and it too mighthave been caused by reduced fitness of pups and juveniles that was caused by nutri-tional stress. The transition to independence by pups is a critical time, and mortalityof young-of-year and juvenile harbor seals and other pinnipeds in general is high.There is no indication of fitness being so low that young harbor seals in the GOA diedoutright, but there are few observations of seals in winter that would permit an eval-uation of physiological condition. The only indication of the health of seals duringwinter is the lack of reports of weak or thin animals taken by subsistence hunters orof distressed or dead seals at haul outs or elsewhere. If fitness of juvenile harbor sealsin the GOA was compromised by a shortage of prey, it perhaps made them more sus-ceptible to predation. Although there is the possibility of an interaction between thetwo, the example at Sable Is. suggests that lowered fitness is not a prerequisite forincreased predation on juveniles, as sharks regularly take healthy adult females thatshould be less vulnerable than even the fittest juveniles.
360 Long-Term Ecological Change in the Northern Gulf of Alaska
Ch04-N52960 8/22/06 11:14 AM Page 360
Evidence of nutritional stress of harbor seals in the GOA based on diet informationis speculative. In general, harbor seals eat the usual forage species available in theNorth Pacific, primarily including pollock, Pacific herring, capelin, eulachon, sandlance, Pacific cod, salmon, octopus, and squid, as well as numerous miscellaneousspecies (Pitcher, 1980; Iverson et al., 2003). But as noted above, the importance of thevarious species to harbor seals changes considerably from place to place and fromseason to season. For example, in both the Kodiak Is. region and in PWS in the mid-1970s, salmon were important in summer, but were absent at all other times ofthe year; Pacific herring were important in all seasons in PWS but never aroundKodiak; and octopus were important in all seasons in both places. Likewise in PWSin the 1990s, Pacific herring and pollock were important to harbor seals in all loca-tions sampled, but the seals were taking large individuals in the southern sound andsmall individuals in the northern and eastern sound. Thus, harbor seals are clearlygeneralist feeders, selecting from a diversity of prey and apparently choosing amongthem those that are most abundant or energetically profitable at any time and place.
The diets and body condition of juvenile harbor seals in PWS were documented inthe late 1990s (1997 through 2000) and demonstrated the degree to which they makeuse of diverse prey species (Iverson et al., 2003). Across all 4 years, newly weanedpups were consistently heavy with very high body fat contents (42%) compared to anyother harbor seal populations studied, indicating that lactating females were not foodlimited. Yearlings and 2–3-year-old juveniles also had comparatively and consistentlyhigh body fat contents across years, suggesting no food limitation, at least in springand early summer. Diets of these yearlings and juveniles were dominated by medium-fat herring, low-fat pollock, and flatfish; however, they also included eulachon, sand-lance, shrimp, and cephalopods. In other words, their diets were quite diverse.Additionally, yearlings and juveniles with more diverse diets were in better conditionindependent of prey species eaten, provided that some high-quality prey (such asherring or very-high-fat eulachon) were obtained to balance the low-energy preyconsumed (Iverson et al., 2003).
Information on diets of harbor seals over longer intervals of time, such as decades,is not available for most of the GOA. This is unfortunate as there is no way to evalu-ate the food limitation hypothesis for them based on possible change in diet. The onlyinformation on long-term variability in harbor seal diets comes from PWS, whereherring and pollock were overall the most common prey in both the 1970s and 1990s.It has been hypothesized that the change in composition of fish communities in theGOA following the mid-1970s regime shift reduced the availability of nutritionallyhigh-quality prey to the point that harbor seals and sea lions were physiologicallycompromised to such a degree that their populations collapsed for one reason oranother. However, flexible diets and flexible digestive physiology should bufferharbor seals against variability in prey abundance, and, as we have seen, the declineof harbor seals predated the regime shift by several years.
Long-term Change 361
Ch04-N52960 8/22/06 11:14 AM Page 361
Thus, the evidence that nutritional limitation of harbor seals caused their popula-tions to collapse in the northern GOA and Bering Sea is weak. This is not to say thatthere is no evidence that harbor seals responded to a change in prey quantity or quality – later pupping dates in the 1970s demonstrated a sensitivity of seals to envi-ronmental conditions. If delayed pupping dates indicated nutritional limitations atcertain times of the year that translated into large negative impacts on juvenile forag-ing success, or were accompanied by changes in individual fitness and populationproductivity, and if these persisted for several years, a decline in abundance wouldhardly be surprising. For example, despite the capital-based energy strategy of harborseals, whereby most energy needed during lactation is acquired in the months prior toparturition and stored as blubber, females still exhibit effects of variable prey abun-dance, or in their abilities to obtain it. On Sable Is., heavier females give birth to largerpups that grow more rapidly and have higher survival than pups born of lighterfemales (Bowen et al., 2001). Over time, populations of seals, like other species in thesea, surely wax and wane as environmental conditions vary. But the buffers seals havein their life history characteristics generally keep populations from undergoing radi-cal fluctuations in abundance of the kind witnessed in Alaska, except in exceptionalcircumstances such as outbreaks of disease, e.g. the morbilovirus outbreak in thenortheast Atlantic (see Section 3.5); starvation, as occurs during El Niño; andpredation, as occurred on Sable Is.
Harbor seals are known to be preyed upon by killer whales, but unfortunately littleis known about the distribution and food habits of killer whales at many times of theyear or how this may have influenced the collapse of harbor seals in the northernGOA, Aleutian Is., and Bering Sea. Evidence from other regions has demonstratedthat killer whales can significantly affect the distribution and behavior of harborseals and that in one case in British Columbia, transient killer whale pods foraged formuch of their time near harbor seal haulouts and were almost 100% successful in 138capture attempts (Baird and Dill, 1995). Of all transient killer whale attacks observedsince the mid-1970s in British Columbia and Washington, about 62% were on harborseals, and harbor seals are known to be one of the most common pinnipeds taken bykiller whales around the world (Weller, 2002). Clearly, killer whale predation couldhave resulted in substantial mortality in some areas or populations in the NorthPacific.
4.9.6. Steller sea lion decline
Sea lions have been the subject of disproportionately more research in the past threedecades than harbor seals. Studies in the field and laboratory have been especiallyintense in the years since the Western Stock was listed as endangered. Concerns thatsea lions might be in conflict with commercial fisheries led to restrictions on fishing
362 Long-Term Ecological Change in the Northern Gulf of Alaska
Ch04-N52960 8/22/06 11:14 AM Page 362
activities around rookeries and haulouts, economic hardships for commercial fish-eries, and huge Federal appropriations for sea lion – fisheries research.
Despite the attention and major advances in understanding of sea lion biology andecology that have come from all of those studies, little more is known about them interms of population change than is known about harbor seals. As with harbor seals,sea lions were subjected to control programs in the 1950s and 1960s, and there was acommercial harvest of pups. These efforts apparently caused less change in sea lionabundance than they did for harbor seals. Still, it is possible that direct killing andincidental killing in commercial fishing gear contributed to small localized and pos-sibly broader declines by the 1970s (Paine et al., 2003). However, the beginning of thecollapse of the Western Stock in the northern and western GOA apparently did notbegin until about 1980, several years after the beginning of the harbor seal collapse.
The notion that a lack of food caused the collapse was based originally on three reportsfrom field studies suggesting that (1) sea lion diets changed from prey with high fat con-tent to prey with low fat content after the 1970s, the so called “junk food hypothesis”; (2) sea lions grew more slowly in the 1980s than in the 1970s; and (3) fewer female sealions carried their pregnancies full term in the 1980s (Alverson, 1992; Merrick andCalkins, 1996; Calkins et al., 1998; Pitcher et al., 1998). All of these changes, as wellas the decline in general, are considered by many people to have resulted from theregime shift of the mid-1970s and the effect it had on the structure of the fish com-munity in the GOA (Francis et al., 1996; Trites and Donnelly, 2003). Laboratory stud-ies of captive sea lions in the 1990s confirmed that they are sensitive to diet quantityand quality (see Trites and Donnelly, 2003); however, these studies tested individualsfed on only a single low-fat prey species, a situation likely not faced by sea lions inthe wild with a diverse assemblage of prey.
Several thorough reviews of the evidence of food limitation and other factors(DeMaster and Atkinson, 2002; Paine et al., 2003; Trites and Donnelly, 2003) failedto discover a sound explanation for the abrupt and rapid decline, and a recent reviewof the junk food hypothesis as applied to the case of sea lions rejected the notion (Fritzand Hinckley, 2005). Full accounts of those reviews will not be repeated here – wewill, however, examine several main issues in the context of sea lion life histories andstrategies for survival and the likelihood that nutritional stress could have caused theprecipitous collapse of the Western Stock of Steller sea lions.
The fundamental underpinning of the junk food hypothesis is diet. Diets of sea lionsin the GOA have been estimated in several periods since the 1940s from analyses ofstomach contents and scats. A small sample of sea lions was collected from a broadregion of the GOA in the summers of 1945 and 1946 (Imler and Sarber, 1947); largesamples were collected from southeast Alaska and the western GOA over four summersfrom 1958 to 1962 (Mathisen et al., 1962; Thorsteinson and Lensink, 1962; Fiscus andBain, 1966); and large samples were collected from a broad region of the northern GOAin all four seasons in the mid-1970s and in spring–fall in the mid-1980s (Pitcher, 1981;
Long-term Change 363
Ch04-N52960 8/22/06 11:14 AM Page 363
Calkins and Goodwin, 1988). In all of these studies, diets were determined by examin-ing stomach contents. Lethally collecting animals for biological studies was discontinuedin the 1990s, and instead of using stomach contents, diets were estimated by identifyingprey remains in feces or scats (Merrick et al., 1997; Sinclair and Zeppelin, 2002). Thismethod is superior to the analysis of stomach contents in that very large numbers ofsamples can be obtained, but otherwise is greatly inferior since the digestive tract of sea lions is highly efficient, owing in large part to its unusual length (as described in apreceding section), and few prey remains are passed in scats.
Recognizing that there are biases in estimates from these methods, it neverthelessappears that diets of the sea lions collected in the mid-1940s in southeast Alaska andthe northern GOA (Chiswell Is., Barren Is., and Kodiak Is.) were dominated by pol-lock, with important amounts of flatfishes, particularly arrowtooth flounder, andlesser amounts of salmon, Pacific cod, and other species. Sea lions collected fromsoutheast Alaska to Unimak Pass in the late 1950s and early 1960s had consumed fewpollock or flatfishes, but instead had been feeding primarily on capelin, sandlance,and rockfish, and on lesser amounts of sculpins, octopus, and various other species.Pollock was once again the predominant prey overall by the mid-1970s, a position itcontinued to hold in the mid-1980s and throughout the 1990s. By the mid-1980s andthrough the 1990s, flatfishes, again particularly arrowtooth flounder, also werecommon prey. Throughout this span of over half a century in the GOA, diets in thelate 1950s to early 1960s stand out as anomalous.
This suite of prey overlaps broadly with prey eaten by harbor seals in the GOA.Another characteristic sea lions share with harbor seals is dietary flexibility – withinyears, sea lion diets vary considerably between regions and seasons. For example, incommon with harbor seals, sea lions appear to consume many more salmon andcapelin in summer than winter, and they consume more herring and squids in PWSthan elsewhere (Pitcher, 1981). And, as with harbor seals, this flexibility complicatesefforts to ascribe importance to particular prey.
The conspicuous difference between diets in 1958 to 1962 and later years, as wellas a small increase in the proportions of pollock and flatfishes in diets in the 1980sand 1990s compared to the 1970s, have been proposed as evidence that a change inprey quantity or quality was the cause of the sea lion decline. The argument hinges onthe fact that forage species such as capelin have a higher fat content than pollock andflatfish, and thus their reduced abundance in diets led to lowered fitness, reduced pro-ductivity, and population decline (Merrick et al., 1997; Calkins et al., 1998; Pitcher et al., 2000; Trites and Donnelly, 2003). The principal evidence for food limitationand reduced individual fitness is that sea lions appeared to grow more slowly in thelate 1970s and early 1980s than they did prior to the 1970s regime shift, and the pro-portion of adult females that carried pregnancies to full term declined in the 1980s.
While it does appear that growth was slower in the 1980s than the 1970s, growthin the 1970s was actually slower still than in the late 1950s. Calkins et al. (1998)
364 Long-Term Ecological Change in the Northern Gulf of Alaska
Ch04-N52960 8/22/06 11:14 AM Page 364
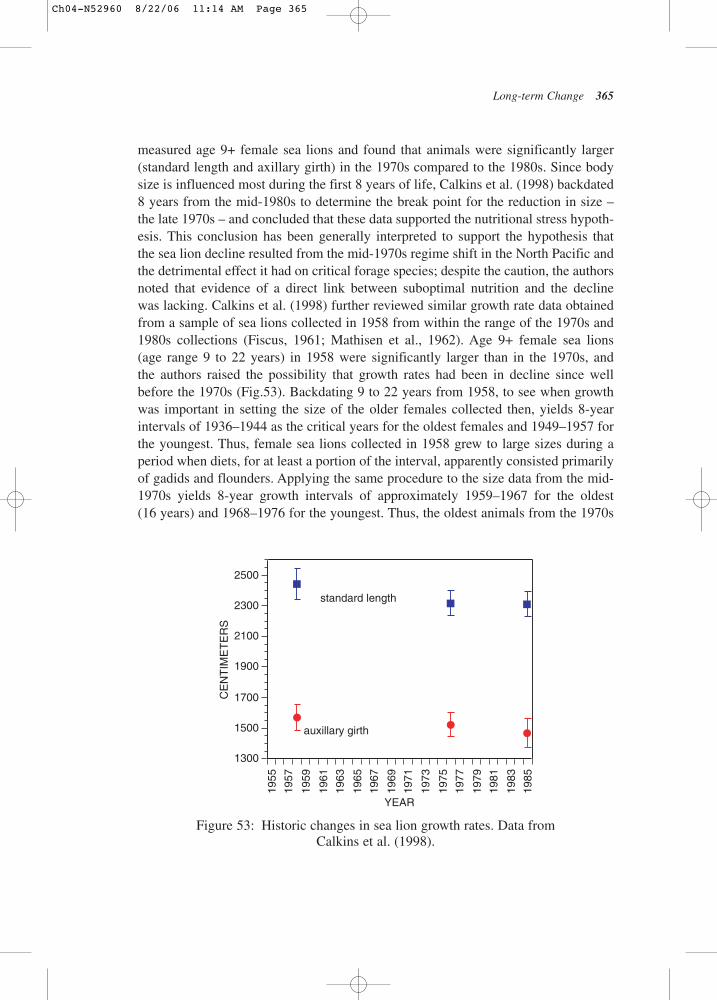
Long-term Change 365
measured age 9+ female sea lions and found that animals were significantly larger(standard length and axillary girth) in the 1970s compared to the 1980s. Since bodysize is influenced most during the first 8 years of life, Calkins et al. (1998) backdated8 years from the mid-1980s to determine the break point for the reduction in size –the late 1970s – and concluded that these data supported the nutritional stress hypoth-esis. This conclusion has been generally interpreted to support the hypothesis thatthe sea lion decline resulted from the mid-1970s regime shift in the North Pacific andthe detrimental effect it had on critical forage species; despite the caution, the authorsnoted that evidence of a direct link between suboptimal nutrition and the declinewas lacking. Calkins et al. (1998) further reviewed similar growth rate data obtainedfrom a sample of sea lions collected in 1958 from within the range of the 1970s and1980s collections (Fiscus, 1961; Mathisen et al., 1962). Age 9+ female sea lions(age range 9 to 22 years) in 1958 were significantly larger than in the 1970s, andthe authors raised the possibility that growth rates had been in decline since wellbefore the 1970s (Fig.53). Backdating 9 to 22 years from 1958, to see when growthwas important in setting the size of the older females collected then, yields 8-yearintervals of 1936–1944 as the critical years for the oldest females and 1949–1957 forthe youngest. Thus, female sea lions collected in 1958 grew to large sizes during aperiod when diets, for at least a portion of the interval, apparently consisted primarilyof gadids and flounders. Applying the same procedure to the size data from the mid-1970s yields 8-year growth intervals of approximately 1959–1967 for the oldest(16 years) and 1968–1976 for the youngest. Thus, the oldest animals from the 1970s
1955
1957
1959
1961
1963
1965
1967
1969
1971
1973
1975
1977
1979
1981
1983
1985
1300
1500
1700
1900
2100
2300
2500
CE
NT
IME
TE
RS
YEAR
standard length
auxillary girth
Figure 53: Historic changes in sea lion growth rates. Data from Calkins et al. (1998).
Ch04-N52960 8/22/06 11:14 AM Page 365
underwent their 8 critical growth years during a period of what is thought by some tohave been prey nirvana, yet they were conspicuously smaller than animals from thepreceding “junk food” era of the 1940s.
Two conclusions emerge from this analysis. The first one is that since growth ratelikely is an indication of nutritional state, then sea lions in the GOA experienced subop-timal nutrition during a large portion of the 20th century. The second conclusion is thatthe significance of the 1977 regime shift on growth rates of sea lions in the GOA is lost.
The other evidence from field studies that sea lions in the Western Stock were nutri-tionally compromised is the decline in the ratio of females that conceived to those thatgave birth in the 1980s compared to the 1970s (Pitcher et al., 1998). Although this toois compelling and a likely indicator of suboptimal nutrition, the difference in produc-tivity that would result from the change is far too small to account for the collapse ofthe population that occurred over the short interval of about a decade. Furthermore,as the complete record of declining growth rates tells us, there is no reason to supposethat declining productivity did not begin prior to the 1970s as well.
Diets of sea lions throughout the northern GOA and Aleutian Is. in the 1990s weremuch the same as in the 1980s (Sinclair and Zeppelin, 2002). They were dominated bypollock and flatfishes in the northern GOA and by Atka mackerel in the Aleutians. In contrast, sea lions in southeast Alaska enjoy a greater diversity of prey and higher-quality diet than animals in the Western Stock (Winship and Trites, 2003), and this hasbeen offered as a reason for the opposite population trends. Nevertheless, the physicalcondition in the past decade of adult females and pups in the Western Stock has beenexcellent and equal to or superior to that of females and pups in the Eastern Stock insoutheast Alaska (Merrick et al., 1995; Davis et al., 1996, 2002; Adams, 2000, Rea et al., 1998, 2003). Likewise, Western Stock maternal attendance patterns and foragingtrip durations in summer and attendance patterns at haul outs in winter are similar tothose in southeast Alaska (Brandon, 2000; Milette and Trites, 2003). Therefore, itappears that despite an expensive, income-based energey budget, the suite of sea lionsurvival strategies has effectively buffered animals of the Western Stock from theoret-ically adverse effects on individual fitness of existing in an environment replete with“junk food.” Given their large body size and proportionately even larger digestive tract,it is probable that, as with other large mammals such as bears, sea lions can compen-sate for a lack of food quality by consuming poorer-quality foods in abundant quantity(e.g. Schaller et al., 1985; Stirling and Derocher, 1990; Welch et al., 1997)
Despite demonstrations that captive sea lions can be put into negative energy bal-ance when fed single-species diets of low nutritional quality and will lose weightsteadily until switched to high-quality diets (Rosen and Trites, 2000), there is no evi-dence of such radical effects on sea lions in the wild in Alaska, nor of any individu-als consuming diets comprising single prey species. The small declines in growthrates from the 1950s to the 1970s to the 1980s and in full-term pregnancy rates fromthe1970s to the 1980s were subtle by comparison, and are of the kind that might help
366 Long-Term Ecological Change in the Northern Gulf of Alaska
Ch04-N52960 8/22/06 11:14 AM Page 366
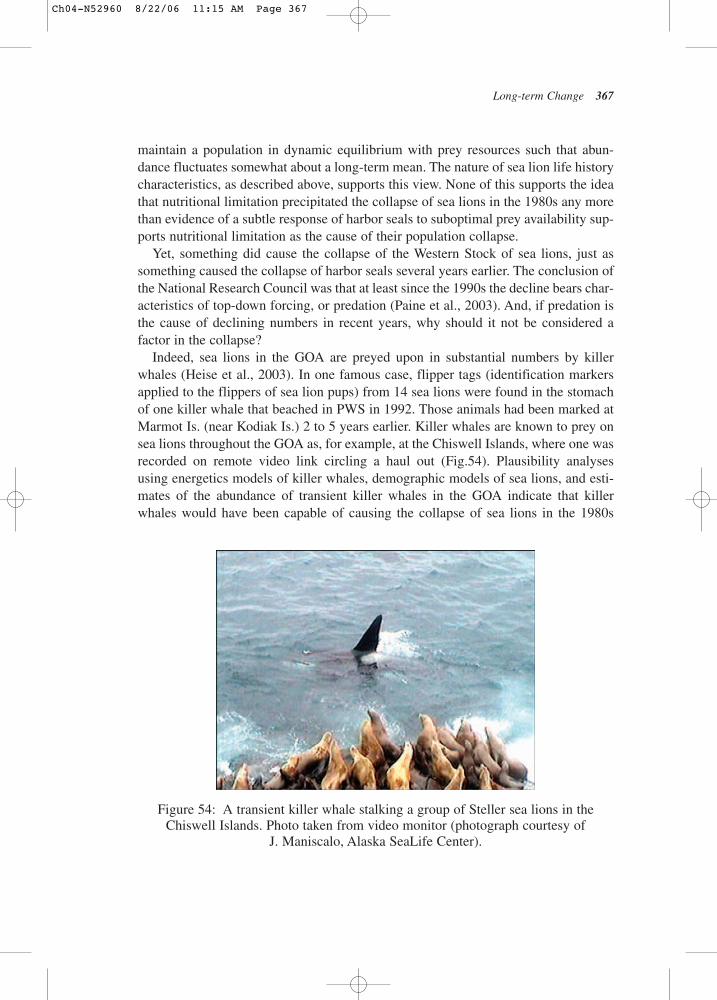
Long-term Change 367
maintain a population in dynamic equilibrium with prey resources such that abun-dance fluctuates somewhat about a long-term mean. The nature of sea lion life historycharacteristics, as described above, supports this view. None of this supports the ideathat nutritional limitation precipitated the collapse of sea lions in the 1980s any morethan evidence of a subtle response of harbor seals to suboptimal prey availability sup-ports nutritional limitation as the cause of their population collapse.
Yet, something did cause the collapse of the Western Stock of sea lions, just assomething caused the collapse of harbor seals several years earlier. The conclusion ofthe National Research Council was that at least since the 1990s the decline bears char-acteristics of top-down forcing, or predation (Paine et al., 2003). And, if predation isthe cause of declining numbers in recent years, why should it not be considered afactor in the collapse?
Indeed, sea lions in the GOA are preyed upon in substantial numbers by killerwhales (Heise et al., 2003). In one famous case, flipper tags (identification markersapplied to the flippers of sea lion pups) from 14 sea lions were found in the stomachof one killer whale that beached in PWS in 1992. Those animals had been marked atMarmot Is. (near Kodiak Is.) 2 to 5 years earlier. Killer whales are known to prey onsea lions throughout the GOA as, for example, at the Chiswell Islands, where one wasrecorded on remote video link circling a haul out (Fig.54). Plausibility analyses using energetics models of killer whales, demographic models of sea lions, and esti-mates of the abundance of transient killer whales in the GOA indicate that killerwhales would have been capable of causing the collapse of sea lions in the 1980s
Figure 54: A transient killer whale stalking a group of Steller sea lions in theChiswell Islands. Photo taken from video monitor (photograph courtesy of
J. Maniscalo, Alaska SeaLife Center).
Ch04-N52960 8/22/06 11:15 AM Page 367
(Springer et al., 2003; Williams et al., 2004). The lack of evidence of severe food short-age during the period of rapid decline in the 1980s, and the ability of sea lions in recenttimes to easily cope with prey considered by some to be nutritionally poor furtherargue that predation could have been a major factor in sea lion population dynamics.
4.9.7. Sea Otter Population Changes
Our view of coastal marine communities and the role of sea otters in those communi-ties has been shaped to a large degree by what we have observed during the 20th cen-tury, as sea otter numbers grew from a few hundred animals distributed overthousands of miles of shoreline to many tens of thousands of individuals occupyingmore than half of their historic range. Suitable, unoccupied habitat remains primarilyin southeast Alaska, and it would appear likely that in the absence of increased mor-tality sea otter populations there will continue to recover.
Annual adult female sea otter reproductive rates are nearly invariant (85 to 90%)among those populations studied, with most females producing a single offspringannually (Monson et al., 2000). In contrast to generally high and constant reproductiveoutput, survival appears to be the life history character resulting in variation in popu-lation size (Estes and Bodkin, 2002). Young sea otters are subjected to two periods ofelevated mortality during their first year of life. The first immediately follows birth andis likely highest among first-time mothers. The second follows weaning at about6 months of age. Survival of young sea otters is likely influenced by the age and expe-rience of the mother and the availability of food resources (Bodkin, 2003). Where foodand space are abundant (e.g. recently recolonized areas), females will be in better con-dition (greater mass per unit length) and their offspring will benefit through increasedsurvival. Conversely, in long-established populations, where food may be a limitingresource, females will weigh less per unit length on average and their offspring maysuffer elevated mortality. If a juvenile survives through its second year of life, survivalprobability remains high until about the age of 10 (Monson et al., 2000). As withharbor seals and sea lions, sea otter population sizes usually appear to be regulated pri-marily by mortality (principally starvation) of young during the first year of life (Estesand Bodkin, 2002). In California and the Aleutian Islands, while at or near equilibriumdensities, only about half of the pups reach weaning age, and fewer than half of thosesurvive to their first birthday. At Kodiak Is. during early recolonization, when femaleswere in relatively good condition, post-weaning survival was nearly 90% (Monson et al., 2000), demonstrating the importance of food resources in population regulation.
We know little about how sea otter prey populations respond to variability in pri-mary production in the Gulf of Alaska. Diets of sea otters in the soft sediment habi-tats of the GOA (PWS and Kodiak Island) consist predominantly of clams (>70%)(Dean et al., 2002), although in PWS dungeness crabs were important prey until
368 Long-Term Ecological Change in the Northern Gulf of Alaska
Ch04-N52960 8/22/06 11:15 AM Page 368
depleted by otters (Garshelis et al., 1986). On Kodiak Is., mussels become more abun-dant in otter diets in areas where clams have been depleted by otters (Doroff andDeGange, 1994). Among rocky reef habitats throughout their range, urchins, crabs,snails, and mussels are common prey (Estes and Bodkin, 2002). However, the natureof community structure, survival strategies of invertebrate prey species, and the rela-tively small magnitude of interannual variability in macrophyte production in the ben-thic food web tend to dampen fluctuations in productivity compared to pelagic foodwebs. Over longer intervals, increases in prey available to sea otters should eventuallyhave positive effects on population sizes. Conversely, as prey becomes less available,there is evidence that individuals respond through declining mean weights andreduced survival (Bodkin et al., 2000).
As local population densities reach equilibrium with food and space resources,large, abrupt declines in those populations might occur under stressful conditions,such as during a harsh winter. For example, recently at Bering Is. (Commander Is.,Russia), sea otters experienced a major winter die-off and the population declinedfrom about 5000 animals to 3000 in a single year (Bodkin et al., 2000). Nearly 80%of the recovered carcasses were male, leaving the surviving population with a higherproportion of females. Similar phenomena might be expected as recovery continuesin regions where sea otters have not recently declined, particularly on individualislands where emigration might be limited, or in local mainland areas where the dis-tance to unoccupied habitat exceeds the dispersal distance of sea otters. For example,in southeast Alaska, as unoccupied habitat shrinks and growing populations come intoequilibrium with their food resources, it seems unlikely that we will continue to seethe high growth rates we observed in the 20th century.
However, the catastrophic, widespread declines of sea otters of the magnitude wit-nessed in the Aleutian Is. and Alaska Peninsula in the past decade were unexpectedand appear to have been unrelated to food resources, traditionally considered to be aprimary factor regulating sea otter populations. Nowhere were there observations ofunusual numbers of stranded carcasses as there were recently during the decline in theCommander Is. Nor is there evidence that direct or indirect human removals inmodern times affected sea otter populations. There is strong evidence, at least for theAleutian Is., that predation by killer whales was the principal cause of the collapse(Estes et al., 1998), which began about 10 years after the start of the sea lion collapse.Similar information is not available from the Alaska Peninsula, but predation iscertainly a contributing factor to sea otter mortality throughout the species range.
4.9.8. Conclusions
Harbor seal, sea lion, and sea otter populations in Alaska have all been reduced attimes by irresponsible killing by people. In the case of sea otters, they were nearly
Long-term Change 369
Ch04-N52960 8/22/06 11:15 AM Page 369
exterminated 200 years ago. More recently, in the 1950s and 1960s, bounty programs,commercial hunting, and other control efforts had local and regional effects on theabundance of harbor seals and sea lions, with the greatest depletions in southeast Alaskaand British Columbia but much less effect in the northern GOA and Aleutian Is. By theearly 1970s, the abundance of all three species was relatively high in the northern andwestern GOA and low in the eastern and southern GOA.
Since the 1970s, we have witnessed a series of unexplained population collapsesthroughout the region of former abundance. The first species to go from much of itsrange were harbor seals, beginning in the early 1970s. Their collapse was followed bythat of sea lions, and in another 10 years, of sea otters. The leading, long-standingexplanation for the collapses of harbor seals and sea lions has been nutritional limita-tion. It was based on observations that pupping dates of harbor seals were delayed andthat sea lions grew more slowly and females achieved fewer successful pregnanciesduring the periods of decline in the 1970s and 1980s.
Furthermore, it was thought the regime shift of the mid-1970s was to blame forthese changes because of the negative effect it had on the structure of forage fish com-munities in the GOA. But, the problem with the nutritional limitation hypothesis isthat the apparent changes in individual fitness were not of a magnitude sufficient tocause starvation, and there is no other evidence that starvation did occur. The moresubtle effects on fitness that were observed in adults were not sufficient to cause apopulation collapse otherwise. Still, we must remember that there is much we do notknow about harbor seals or sea lions in winter and during the first 1 to 2 years of inde-pendence when most juvenile mortality occurs, likely at sea.
The problem with the regime shift hypothesis for these collapses in the northernNorth Pacific marine mammal populations is that the unexplained portion of the harborseal collapse on Tugidak Is., as well as the beginning of the unexplained portion of therecent decline of fur seals in the Bering Sea, began well in advance of the regime shift.Had food limitation caused a reduction in juvenile survival, and thus recruitment, thatprecipitated the collapse of the whole population, it would have had to begin manyyears prior to the onset of the collapse, such that the adult population would have hadtime for senescence and begin dying en masse by the early 1970s. There is no evidencefor this scenario either. A reduction in juvenile recruitment certainly could haveoccurred, and while it is a significant regulator of populations, there is no evidence thatit could have been so severe as to cause such a precipitous population collapse.Furthermore, the collapse of sea lions in the eastern GOA and of sea otters in theAleutian Is. and western GOA occurred in the 1990s, long after the mid-1970s regimeshift. In neither case is there evidence that food limited those populations.
The mid-1970s regime shift has also been invoked to explain the increases in abun-dance of harbor seals and sea lions in southeast Alaska and British Columbia for arelated reason – the positive effect it had in that region on forage fish species andcommunities. This notion is based on observations of inverse production regimes in the
370 Long-Term Ecological Change in the Northern Gulf of Alaska
Ch04-N52960 8/22/06 11:15 AM Page 370
broad region of the northern GOA and Bering Sea compared to the region from south-east Alaska to the Pacific Northwest. That is, when conditions are good in the north andwest, they are poor in the east and south, and visa versa, because of the ways oceanphysics in these regions are, or may be, differentially influenced by variable meteoro-logical forcing over the North Pacific (Wickett, 1966; Chelton and Davis, 1982;Hollowed and Wooster, 1992; Gargett, 1997; Francis et al., 1998; Hare et al., 1999).
While evidence for broadscale, east–west physical asymmetry in the GOA is com-pelling, as is evidence that it affects biology at lower and intermediate trophic levels,such a complex regime shift–phase shift mechanism is hardly needed to explain theincreasing pinniped populations in southeast Alaska and British Columbia. A morelikely explanation is simply that protections enacted in Canada and the US in 1970and 1972, respectively, against the irresponsible commercial and bounty programs ofthe 1950s and 1960s reversed the fortunes of pinnipeds and set the severely depletedpopulations on courses of recovery. The only question is why recovery has been soslow? Could it be poor nutrition and/or predation?
The ability of pinniped life history strategies to successfully buffer populationsagainst apparent effects of food limitation was recently demonstrated for elephantseals, the largest phocid seal, and relative of harbor seals, in the North Pacific.Elephant seals breed on islands off the coast of California, but feed in the central andnorthern GOA. Beginning in the mid-1970s (or earlier – the record does not beginuntil 1975), weaning weights of pups declined in association with increased foragingtrip durations of adult females and a decline in the mass females gained during theirpost-breeding foraging trip, both indications of reduced foraging success, i.e. reducedprey availability (Le Boeuf and Crocker, 2005). All trajectories changed sign in thelate 1990s, at about the time of the 1998 regime shift, indicating improved prey avail-ability. Yet, despite the negative effects on individuals of apparently suboptimal nutri-tion from the mid-1970s through the mid-1990s, the population nevertheless grewsubstantially during that era, increasing at the Año Nuevo colony from 605 pups bornin 1975 to 2500 in 2004.
None of this is to say that regime shifts and climate change that alter the nature ofphysical forcing are not important in structuring marine ecosystems. They clearly are,particularly at lower trophic levels, and this provides a mechanism for bottom-up reg-ulation of populations at higher trophic levels. Nor is it to say that marine mammalsare immune to the possible effects of fluctuations in prey – its abundance, quality, orspatial distribution – and nutritional limitation in the northern North Pacific in the pasthalf century. On the contrary, they are sensitive as indicated by changing puppingdates of harbor seals and changing growth rates and rates of fetal abortion in sea lions.But, radical effects of environmental change on population dynamics of species atlower trophic levels is attenuated at higher and higher levels in the food chain becauseof the buffers provided by strategies for survival of progressively longer-lived,more k-selected species. The comparatively mild individual responses to suboptimal
Long-term Change 371
Ch04-N52960 8/22/06 11:15 AM Page 371

nutrition of pinnipeds are of the kind that would reasonably be expected to adjustlong-term population dynamics and maintain abundances in equilibrium with prey,not of the magnitude to explain population collapses. Nutritional limitation was neveroffered as an explanation for the sea otter collapse, which has been blamed instead onpredation by killer whales.
Population dynamics of harbor seals, sea lions, and sea otters are believed to bedriven generally by recruitment success, i.e. by juvenile mortality. However, there arefew empirical data on juvenile survival for most species. In turn, juvenile mortality maybe due to poor nutrition and starvation, or disease and predation, both of which could beexacerbated by poor nutrition. However, population dynamics of all three species duringtheir respective crashes also had to necessarily include high adult mortality, for whichthere was no evidence of starvation or disease. The most parsimonious explanation isthat, while there could have been a suite of factors affecting individuals, the strategiesfor survival that these species have evolved to cope with uncertain environments, differ-ent as they are, were successful in buffering populations against the most common kindof variability, that of prey abundance, but may have been inadequate to save them fromeffects of a highly unusual change in predation pressure. Similarities and patterns in themagnitude (~89 to 90%), timing (7 to 10 years between events), and spatial extent(western GOA, Aleutian Is., southeast Bering Sea) of harbor seal, sea lion, and sea otterdeclines, in addition to weak support for nutritional limitation as causing their collapse,further imply that top-down forcing effects, not previously considered as important inthe dynamics of marine mammal populations, must be considered. Whichever is thecase, nutritional limitation or predation, these are unprecedented events in the recordedhistory of pinniped populations of the North Pacific.
4.10. Crabs and ShrimpsGordon Kruse
4.10.1. Introduction
Some of the species with the most widely fluctuating populations in the Gulf ofAlaska are invertebrates. Invertebrates are an extremely large and diverse group oforganisms that include copepods, clams, sea urchins, squid, abalone, and many others.As with many groundfishes and unlike many marine birds and mammals, inverte-brates typically offer little to no parental care for their young. However, some(e.g. crabs) carry a clutch of developing embryos for nearly one year until hatching,when larvae become free swimming. It is generally believed that invertebrate popula-tion fluctuations are largely driven by factors affecting larval and juvenile survival,including advection by ocean currents, food availability, and predation.
372 Long-Term Ecological Change in the Northern Gulf of Alaska
Ch04-N52960 8/22/06 11:15 AM Page 372
In this chapter, long-term changes in populations of red king crab (Paralithodescamtschaticus), tanner crab (Chionoecetes bairdi), and northern (sometimes locallycalled “pink”) shrimp (Pandalus borealis), are examined, as well as some potentialresponsible mechanisms. Fisheries take place for other crab and shrimp species in theGulf of Alaska, but changes are most well documented for these three species. Thesethree provide the best case studies of invertebrate population dynamics in the Gulf ofAlaska, because of a relatively long history of stock assessment surveys by state andfederal fishery management agencies owing to the high commercial value of thesespecies. In contrast to many of the groundfishes, most crab and shrimp stocks in theGulf of Alaska crashed to low levels of abundance in the late 1970s and early 1980s.Even after 25 years, the causes of these spectacular collapses remain a matter of muchdebate. Because of their divergent life history strategies and population trajectories,crabs and shrimps provide revealing contrasts with other taxa discussed so far. In thischapter, we will examine several of the leading theories for these declines.
4.10.2. Long-term Dynamics of Shrimp Stocks
The trawl fishery for northern shrimp in the central and western Gulf of Alaska and east-ern Bering Sea is an excellent example of a boom-bust fishery. Small recorded landingswere first recorded in the late 1950s, but the fishery did not take off until the late 1960s(Fig.55). Peak landings of approximately 68,000 mt were taken in 1973 and a secondpeak of 59,000 mt in 1977. Thereafter, the fishery collapsed to just 15,000 mt by 1980and was closed in most areas by 1983. Commercial harvest is not always indicative ofpopulation size, so it is difficult to infer trends in shrimp abundance from catch recordsalone. Whereas landings declined during the late 1970s to early 1980s because of declin-ing abundance, landings are unlikely to be indicative of changes in stock abundanceduring the development phase of the fishery in the 1950s and 1960s. Thus, fishery-inde-pendent surveys are preferred methods for estimating patterns in shrimp abundance.
Small-mesh trawl surveys have been conducted in the central and western Gulf ofAlaska by ADF&G and NMFS since 1953. Primary survey locations included PrinceWilliam Sound, lower Cook Inlet, Kodiak Island, and the south side of the AlaskaPeninsula, including Pavlof Bay. These data were analyzed for trends in northernshrimp survey catches for Kachemak Bay in lower Cook Inlet (Bechtol, 1997) and allareas combined (Anderson et al., 1997; Anderson and Piatt, 1999; Anderson, 2000).Unfortunately, survey gear and methods were not standardized during the early years,so catch rates, measured as catch-per-unit-effort (CPUE), among locations and agen-cies are comparable only since 1973.
Analyses of aggregated survey data indicate that the proportion of shrimp in thetotal (all taxa) survey catches declined slightly during 1972 to 1976, and then declinedexponentially through the late 1980s (Fig.56). Examination of aggregate CPUE data
Long-term Change 373
Ch04-N52960 8/22/06 11:15 AM Page 373
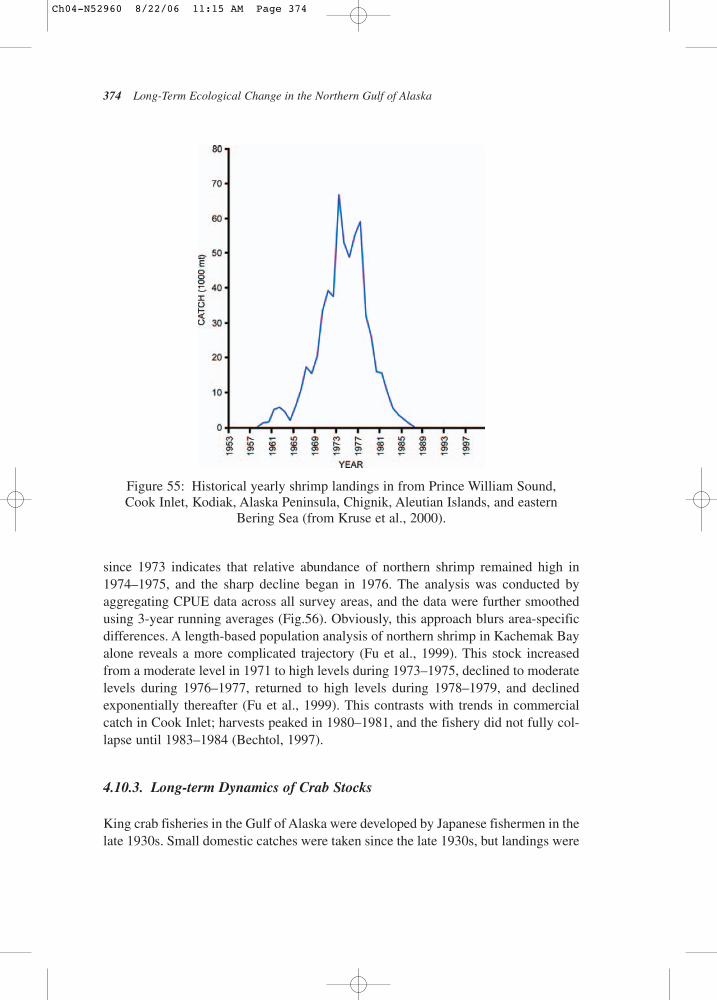
374 Long-Term Ecological Change in the Northern Gulf of Alaska
since 1973 indicates that relative abundance of northern shrimp remained high in1974–1975, and the sharp decline began in 1976. The analysis was conducted byaggregating CPUE data across all survey areas, and the data were further smoothedusing 3-year running averages (Fig.56). Obviously, this approach blurs area-specificdifferences. A length-based population analysis of northern shrimp in Kachemak Bayalone reveals a more complicated trajectory (Fu et al., 1999). This stock increasedfrom a moderate level in 1971 to high levels during 1973–1975, declined to moderatelevels during 1976–1977, returned to high levels during 1978–1979, and declinedexponentially thereafter (Fu et al., 1999). This contrasts with trends in commercialcatch in Cook Inlet; harvests peaked in 1980–1981, and the fishery did not fully col-lapse until 1983–1984 (Bechtol, 1997).
4.10.3. Long-term Dynamics of Crab Stocks
King crab fisheries in the Gulf of Alaska were developed by Japanese fishermen in thelate 1930s. Small domestic catches were taken since the late 1930s, but landings were
Figure 55: Historical yearly shrimp landings in from Prince William Sound, Cook Inlet, Kodiak, Alaska Peninsula, Chignik, Aleutian Islands, and eastern
Bering Sea (from Kruse et al., 2000).
Ch04-N52960 8/22/06 11:15 AM Page 374
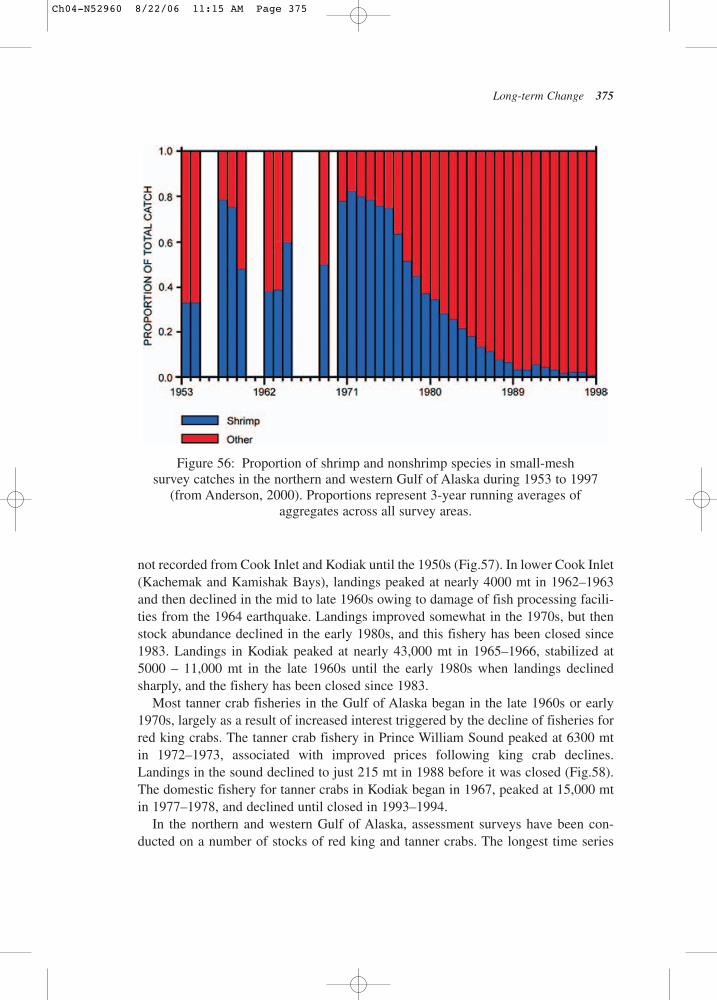
Long-term Change 375
not recorded from Cook Inlet and Kodiak until the 1950s (Fig.57). In lower Cook Inlet(Kachemak and Kamishak Bays), landings peaked at nearly 4000 mt in 1962–1963and then declined in the mid to late 1960s owing to damage of fish processing facili-ties from the 1964 earthquake. Landings improved somewhat in the 1970s, but thenstock abundance declined in the early 1980s, and this fishery has been closed since1983. Landings in Kodiak peaked at nearly 43,000 mt in 1965–1966, stabilized at5000 – 11,000 mt in the late 1960s until the early 1980s when landings declinedsharply, and the fishery has been closed since 1983.
Most tanner crab fisheries in the Gulf of Alaska began in the late 1960s or early1970s, largely as a result of increased interest triggered by the decline of fisheries forred king crabs. The tanner crab fishery in Prince William Sound peaked at 6300 mt in 1972–1973, associated with improved prices following king crab declines.Landings in the sound declined to just 215 mt in 1988 before it was closed (Fig.58).The domestic fishery for tanner crabs in Kodiak began in 1967, peaked at 15,000 mtin 1977–1978, and declined until closed in 1993–1994.
In the northern and western Gulf of Alaska, assessment surveys have been con-ducted on a number of stocks of red king and tanner crabs. The longest time series
Figure 56: Proportion of shrimp and nonshrimp species in small-meshsurvey catches in the northern and western Gulf of Alaska during 1953 to 1997
(from Anderson, 2000). Proportions represent 3-year running averages ofaggregates across all survey areas.
Ch04-N52960 8/22/06 11:15 AM Page 375
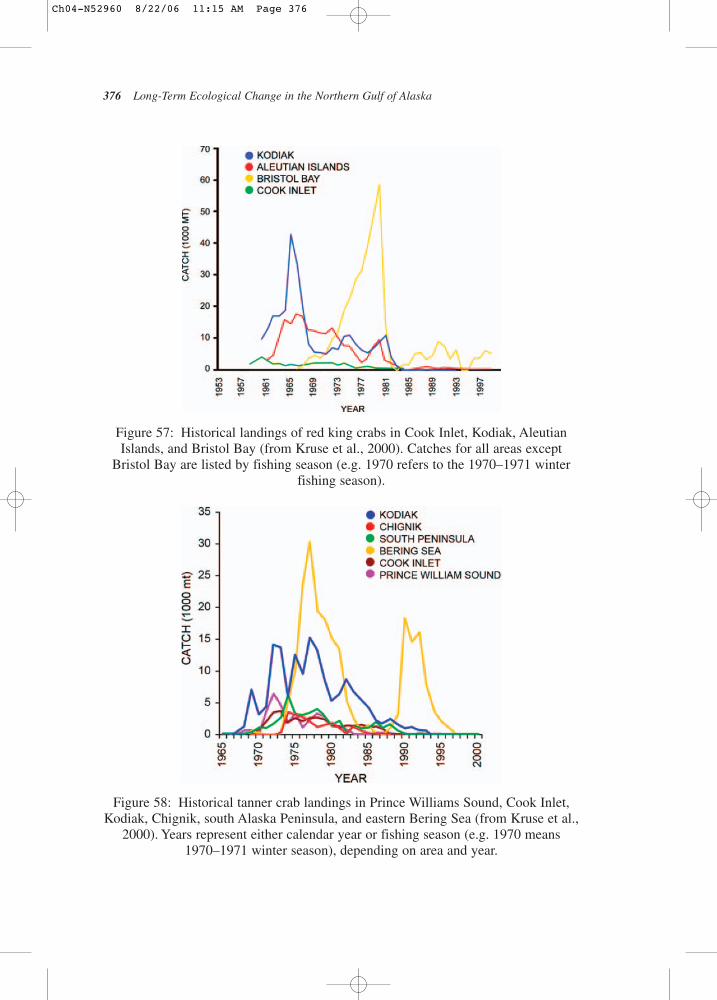
376 Long-Term Ecological Change in the Northern Gulf of Alaska
Figure 57: Historical landings of red king crabs in Cook Inlet, Kodiak, AleutianIslands, and Bristol Bay (from Kruse et al., 2000). Catches for all areas except
Bristol Bay are listed by fishing season (e.g. 1970 refers to the 1970–1971 winterfishing season).
Figure 58: Historical tanner crab landings in Prince Williams Sound, Cook Inlet,Kodiak, Chignik, south Alaska Peninsula, and eastern Bering Sea (from Kruse et al.,
2000). Years represent either calendar year or fishing season (e.g. 1970 means1970–1971 winter season), depending on area and year.
Ch04-N52960 8/22/06 11:15 AM Page 376
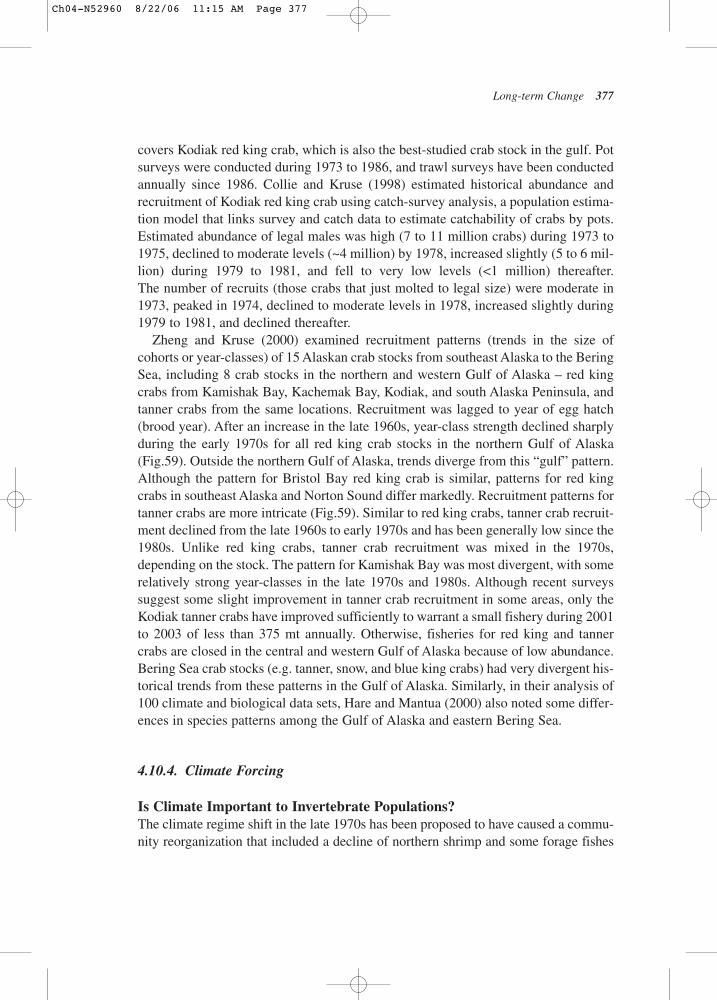
covers Kodiak red king crab, which is also the best-studied crab stock in the gulf. Potsurveys were conducted during 1973 to 1986, and trawl surveys have been conductedannually since 1986. Collie and Kruse (1998) estimated historical abundance andrecruitment of Kodiak red king crab using catch-survey analysis, a population estima-tion model that links survey and catch data to estimate catchability of crabs by pots.Estimated abundance of legal males was high (7 to 11 million crabs) during 1973 to1975, declined to moderate levels (~4 million) by 1978, increased slightly (5 to 6 mil-lion) during 1979 to 1981, and fell to very low levels (<1 million) thereafter. The number of recruits (those crabs that just molted to legal size) were moderate in1973, peaked in 1974, declined to moderate levels in 1978, increased slightly during1979 to 1981, and declined thereafter.
Zheng and Kruse (2000) examined recruitment patterns (trends in the size ofcohorts or year-classes) of 15 Alaskan crab stocks from southeast Alaska to the BeringSea, including 8 crab stocks in the northern and western Gulf of Alaska – red kingcrabs from Kamishak Bay, Kachemak Bay, Kodiak, and south Alaska Peninsula, andtanner crabs from the same locations. Recruitment was lagged to year of egg hatch(brood year). After an increase in the late 1960s, year-class strength declined sharplyduring the early 1970s for all red king crab stocks in the northern Gulf of Alaska(Fig.59). Outside the northern Gulf of Alaska, trends diverge from this “gulf” pattern.Although the pattern for Bristol Bay red king crab is similar, patterns for red kingcrabs in southeast Alaska and Norton Sound differ markedly. Recruitment patterns fortanner crabs are more intricate (Fig.59). Similar to red king crabs, tanner crab recruit-ment declined from the late 1960s to early 1970s and has been generally low since the1980s. Unlike red king crabs, tanner crab recruitment was mixed in the 1970s,depending on the stock. The pattern for Kamishak Bay was most divergent, with somerelatively strong year-classes in the late 1970s and 1980s. Although recent surveyssuggest some slight improvement in tanner crab recruitment in some areas, only theKodiak tanner crabs have improved sufficiently to warrant a small fishery during 2001to 2003 of less than 375 mt annually. Otherwise, fisheries for red king and tannercrabs are closed in the central and western Gulf of Alaska because of low abundance.Bering Sea crab stocks (e.g. tanner, snow, and blue king crabs) had very divergent his-torical trends from these patterns in the Gulf of Alaska. Similarly, in their analysis of100 climate and biological data sets, Hare and Mantua (2000) also noted some differ-ences in species patterns among the Gulf of Alaska and eastern Bering Sea.
4.10.4. Climate Forcing
Is Climate Important to Invertebrate Populations?The climate regime shift in the late 1970s has been proposed to have caused a commu-nity reorganization that included a decline of northern shrimp and some forage fishes
Long-term Change 377
Ch04-N52960 8/22/06 11:15 AM Page 377
378 Long-Term Ecological Change in the Northern Gulf of Alaska
in the Gulf of Alaska (Anderson and Piatt, 1999). Pacific salmon experienced a gen-eral increase in abundance subsequent to the regime shift; one hypothesis for thisincrease is an intensification of the Aleutian low-pressure system in winter, which pro-moted increased phytoplankton and zooplankton production and standing stocks thatled to enhanced feeding conditions and survival of outmigrating salmon smolts. If thismechanism was responsible for the increase in salmon, at least at face value it does notseem to explain declines in other taxa, such as forage fish species, shrimps, and crabs.
Most dynamics of exploitable crab and shrimp stocks appear to be explained byvariability in recruitment, although parental stock size has some effects on recruit-ment in some stocks, at least at low stock size (i.e. strong year-classes rarely resultfrom small parental stocks). Recruitment is periodic, not regular, and it seems thatstrong year-classes likely result when a number of factors affecting survival all lineup favorably, an apparently rare event. Crab and shrimp stocks wax and wane as theseoccasional large year-classes grow in body size and recruit to the adult population andthen age as natural and fishing mortality take their tolls on the survivors.
Figure 59: Time series of normalized (log-transformed) recruitment indices foreight crab stocks from Zheng and Kruse (2000). Red king crab and tanner crab
stocks and their abbreviations are South Peninsula (SPRK, SPTC), Kodiak(KODRC, KODTC), Cook Inlet – Kamishak District (CIKRK, CIKTC), and
Cook Inlet – Southern District (CISRK, CISTC).
Ch04-N52960 8/22/06 11:15 AM Page 378
Koslow (1984) suggested that positive correlations in recruitment among stockswithin species or among closely related species over large geographic areas areindicative of a role of large-scale physical forcing. Likewise, Zheng and Kruse (2000)interpreted the “gulf pattern” – the relatively strong correlation of recruitmenttrends among king and some tanner crab stocks in the northern and western Gulf ofAlaska – as indicative of a relatively strong role of climate-forced effects on crabstocks as opposed to other factors. For stocks with the gulf pattern, the declining trendin abundance since the early 1970s was similar to indices of the strength of theAleutian low, seemingly consistent with regime-shift theory (Francis et al., 1998).However, one irony is that their decline in recruitment actually started in the early1970s, 3 to 6 years prior to the regime shift in 1976–1977. In the rest of this chapter,we consider potential mechanisms for climate control of crab and shrimp populationsin greater detail, along with other potential explanations for the observed dynamics ofthese invertebrates.
Shrimp and the Match–Mismatch HypothesisBecause swings in crab and shrimp abundance seem to be driven largely by recruit-ment, most attempts to unravel the mystery of invertebrate population dynamicsinvolve theories about factors affecting early-life survival. Anderson and Piatt (1999)invoked Cushing’s (1995) match–mismatch hypothesis to attempt to explain whysome fishes and invertebrates declined in the face of a general increase in oceanproductivity (see Box 4). They noted that biomass peaks of Neocalanus copepods are1 to 2 months later during cold years than warm years. Larvae of most shrimp andcrabs hatch in late spring or early summer, as well as larvae of forage fishes such ascapelin. Thus, shifts to earlier plankton blooms, prior to shrimp egg hatch, couldresult in a mismatch between shrimp larvae and their zooplankton prey. On the con-trary, earlier plankton blooms could benefit groundfishes, many of which are winterspawners. However, as cooler temperatures delay the spawning time of northernshrimp (Apollonio et al., 1986) and prolong embryo incubation (Nunes andNishiyama, 1984), the match–mismatch hypothesis would apply only if temperaturedifferentially shifts the timing of the plankton bloom relative to the shift in larvalshrimp hatching. Field studies are required to carefully evaluate potential changes inthe match of the spring bloom and shrimp hatch timing.
The potential role of the match–mismatch hypothesis is intriguing, but climate caninfluence shrimp stocks through other mechanisms. For instance, a decline of 2 to 3°Cin bottom temperature was associated with a 40% increase in fecundity of northernshrimp in the Gulf of Maine (Apollonio et al., 1986). Thus, recruitment could increasedue to direct effect of temperature on reproductive output. Also, within temperaturesof 3 to 9°C, total hatch and viable hatch was highest at 3°C, and upon yolk exhaustion,these larvae were also larger compared to viable larvae reared at warmer temperatures
Long-term Change 379
Ch04-N52960 8/22/06 11:15 AM Page 379
380 Long-Term Ecological Change in the Northern Gulf of Alaska
(Nunes and Nishiyama, 1983). So, larger larvae, associated with colder incubationtemperatures, are expected to have greater chances of survival. So, temperature canregulate shrimp reproduction and survival by climate forcing, regardless of potentialadditional effects on a match or mismatch between shrimp larvae and their prey.
Red King Crab and the Match–Mismatch HypothesisThe match–mismatch hypothesis motivated an intensive study of red king crab recruit-ment dynamics in Auke Bay, southeast Alaska, in 1985 to 1989 called APPRISE,
Box 4: MATCH–MISMATCH HYPOTHESISby Gordon Kruse
David Cushing’s match–mismatch hypothesis suggests that the magnitude ofindividual year-classes varies, in part, due to year-to-year differences in thetiming of fish spawning with respect to timing of the spring bloom of primaryproduction (Cushing, 1995). Cushing (1969) noted that the timing of spawning ofmany fishes in the North Atlantic Ocean is virtually fixed at the same time eachyear, varying at most by one week. Noting that the onset of the spring planktonbloom varied by 4 to 6 weeks in the North Atlantic Ocean, he surmised that thechances of larvae finding food must vary from year to year. Cushing argued that,if climate change is to affect fish recruitment, it would have the greatest impactduring the larval stage through variations in the availability of food. The mecha-nism linking climate to the timing of the spring bloom is often called the Graneffect or the Sverdrup mechanism. During winter, cooling of the surface watersand strong winter winds create a well-mixed ocean in which nutrients at depth arebrought to the surface. Despite the high concentrations of nutrients near the sur-face, a bloom cannot occur because phytoplankton cells are regularly mixed todepths too dark for photosynthesis to occur. However, as spring approaches, thefrequency of strong winter winds subsides and more intense solar radiation cre-ates a stratified water column with warm water at the surface and cool water atdepth. This stratification causes mixing to be confined to the upper illuminatedlayers of the ocean, thereby allowing the bloom to occur as phytoplankton cellsnow experience high concentrations of nutrients and ample sunlight (see alsoSection 2.3). Climate regulates the timing of this stratification, and hence thetiming of the spring bloom, by modulating the frequency of storms, and theirassociated winds (mixing) and cloud cover (incident sunlight). When the springbloom is poorly matched with the relatively fixed spawning time of fishes, poorsurvival will lead to a weak year-class. If the timing is good, then fewer larvaewill starve, and the chances for a strong year-class are much improved.
Ch04-N52960 8/22/06 11:15 AM Page 380
Association of Primary Production and Recruitment in Subarctic Ecosystems (Shirleyand Shirley, 1989, 1990). However, incident light, not temperature, drives the timingof the spring bloom in Auke Bay (Ziemann et al., 1990). The timing of the primarybloom is nearly fixed and begins during the first or second week of April, whereassecondary blooms in May and June are triggered by increases in nutrient concentra-tion associated with wind-mixing events. Under controlled laboratory conditions, theincubation period of red king crab eggs is highly dependent on temperature; hatchingoccurs after 207 days at 12°C and 305 days at 3°C (Shirley et al., 1990). In theAPPRISE study, there was no relationship between larval survival and temporal syn-chrony of crab larvae with the spring bloom, so the match–mismatch hypothesis wasrejected in this case (Shirley and Shirley, 1989, 1990).
Reconciling the Match–Mismatch Hypothesis among Shrimp and CrabsOn face value, these red king crab findings for Auke Bay seem contrary to thematch–mismatch hypothesis for shrimp, but recall that Anderson and Piatt’s (1999)hypothesis concerned the role of temperature on the timing of the bloom of zooplank-ton, not phytoplankton. In fact, Anderson and Piatt did not mention phytoplankton intheir match–mismatch hypothesis. Although the phytoplankton bloom in Auke Baydepends primarily on incident solar radiation and not temperature, zooplanktonblooms in Auke Bay are related to temperature. For example, in Auke BayPseudocalanus populations peaked in late April in 1986, late May/early June in 1987,and late March or early April in 1988 and 1989 (Coyle and Paul, 1990). Coolest latewinter/early spring temperatures occurred in 1986 and warmest in 1988, a trend fairlyconsistent with the progressively earlier dates of Pseudocalanus population peaksfrom 1986 to 1989. Noting that Auke Bay is a small, partially closed embayment in asystem of fjords in southeast Alaska, it may not be possible to generalize these resultsto the entire Gulf of Alaska.
A comparison of the ecology of crab and shrimp species may shed more light onthe veracity of the match–mismatch mechanism. As mentioned in Section 2.5.5,diatoms, especially Thalassiosira spp., appear to be important prey of red king crabs,whereas copepods, particularly nauplii of Pseudocalanus, are common food of tannercrabs. Tanner crab zoeae are larger and faster swimmers than early red king crabzoeae, so their ability to capture larger, more elusive prey is not very surprising. So, even if a temperature-driven mechanism is discounted for red king crab larvaebecause temperature does not regulate the timing of the phytoplankton bloom, itremains plausible for crab larvae that eat copepod nauplii, such as tanner crabs owingto the apparent positive effect of temperature on copepod reproduction and develop-ment (Smith and Vidal, 1984). So, where do northern shrimp fit in? Early-stage north-ern shrimp larvae reportedly prey mainly on diatoms, although some copepods arealso eaten (Stickney and Perkins, 1981). Given this, one might expect that it may be
Long-term Change 381
Ch04-N52960 8/22/06 11:15 AM Page 381
more important for shrimp larvae to match the phytoplankton bloom (as with redking crab), rather than the zooplankton bloom (as with tanner crab). So, thematch–mismatch hypothesis begs further scrutiny for shrimp.
Other Potential Climate-forcing Mechanisms and Red King CrabZheng and Kruse (2000) sought to identify a mechanism to explain the similaritybetween Aleutian low-pressure dynamics and recruitment patterns of red king crabs(and some tanner crabs) in the Gulf of Alaska (Fig.59). They noted that red king crablarvae must feed within 2 to 6 days of hatching in order to survive (Paul and Paul, 1980),and growth of the survivors is directly related to concentrations of Thalassiosira (Paulet al., 1990). In the 5-year APPRISE study in Auke Bay, phytoplankton species com-position was greatly influenced by short-term weather (Bienfang and Ziemann, 1995).In years when winds were light and the water column was stable, Thalassiosira dom-inated the spring bloom of phytoplankton. In years of stronger vertical mixing, suchas might be expected during intensified Aleutian lows, a more well-mixed watercolumn supported a spring bloom comprising a more diverse phytoplankton commu-nity. Zheng and Kruse (2000) set these observations within the regime shift contextby suggesting that years of intensified Aleutian lows (e.g. post 1976–1977) may beassociated with stronger water-column mixing in late winter/early spring and lowerThalassiosira abundance, thus adversely affecting feeding success and survival oflarval red king crab. That is, total primary production may be less relevant to red kingcrab larval survival than phytoplankton species composition – in particular, the pre-dominance of Thalassiosira diatoms. This differs from the match–mismatch hypoth-esis in that it is the species composition of the spring bloom, not the timing of thebloom, which may determine larval crab survival. Of course, red king crab larvae mayfeed largely on Thalassiosira simply because they are generally dominant in thespring bloom, not because they are preferred prey. In any case, this hypothesis seemsconsistent with the limited observations in Auke Bay, but empirical testing of broaderapplicability to the northern gulf remains to be carried out.
Climate Forcing and Tanner CrabsAn emerging understanding is that tanner crab recruitment patterns (Fig.59b) and theircausative mechanisms are more reflective of local, rather than regional, conditions thanpreviously appreciated. The most detailed study of tanner crab recruitment was con-ducted in Bristol Bay, eastern Bering Sea (Rosenkranz, 1998; Rosenkranz et al., 2001).There is evidence that warmer sea surface temperatures during May–June are associ-ated with years of stronger tanner crab year-classes. Warmer temperatures favorgrowth of Pseudocalanus populations (Smith and Vidal, 1984), so warmer sea tem-peratures during spring may favor feeding success of tanner crab larvae because of
382 Long-Term Ecological Change in the Northern Gulf of Alaska
Ch04-N52960 8/22/06 11:15 AM Page 382
higher prey densities. Moreover, it appears that two other mechanisms operate:warmer bottom temperatures favor tanner crab gonadal development and egg incuba-tion, and winds blowing from the northeast along the Alaska Peninsula during springpromote coastal upwelling while advecting larvae offshore to soft bottom sedimentsused as nursery areas. Regression models with wind and bottom temperatureexplained about 50% of the recruitment variability of tanner crabs in Bristol Bay.However, as with any exploratory analysis, these results should be revisited to deter-mine if they stand the test of time.
Nonetheless, it seems that multiple factors and local conditions (e.g. wind directionrelative to coastline orientation) may foil attempts to find simplistic one-size-fits-allexplanations to tanner crab declines over the broad region of the northern Gulf ofAlaska. The greater diversity of recruitment patterns of tanner crabs compared to redking crabs (Fig.59) is consistent with a more important role of local, rather thanregional, factors. However, as discussed in the rest of this section, there may be otherexplanations for these recruitment patterns.
4.10.5. Biological ControlsAs described in the section on the Cascade Hypothesis, top-down controls throughpredation can have major impacts on ecosystem structure. As a corollary hypothesisto their match–mismatch hypothesis, Anderson and Piatt (1999) suggested that preda-tion contributed to the declines of forage species subsequent to the late 1970s regimeshift. They suggested that a negative correlation between groundfish predators(e.g. Pacific cod, arrowtooth flounder, and halibut) and forage species (e.g. shrimp,capelin) supports the notion that the Gulf of Alaska is moderated by predation.
Is there other evidence for the role of groundfish predation on declines of shrimpabundance in the northern Gulf of Alaska? There is some evidence from surveys andcommercial fishery data that there was a change in the abundance and distribution ofPacific cod in the 1970s. Cod biomass increased steadily from the late 1970s to the late1980s and since then has steadily declined to late 1970s levels (Thompson et al., 2003).Strong recruitment in the late 1970s was at least partly responsible for the increase inbiomass. Aside from changes in cod abundance, changes in distribution may haveoccurred. During the early 1970s, cod were infrequently observed in inshore baysoccupied by northern shrimp. By the late 1970s, they were frequently encountered inthese nearshore areas and remained common in nearshore waters even though cod and shrimp biomass have both declined. Anderson et al. (1997) suggested that warmertemperatures allowed cod to remain in inshore bays throughout winter, instead of migrating offshore after temperatures became cooler nearshore. At GAK1, temperature anomalies up to 4°C below the long-term average were common prior to1977; since 1978, anomalies more than 1°C than average have been rare. Pacific codare winter spawners, and both cod spawning activity and egg hatch success are
Long-term Change 383
Ch04-N52960 8/22/06 11:15 AM Page 383
associated with temperatures of 2.5 to 8.5°C (Alderdice and Forrester, 1971). So, ifnearshore temperatures dropped below this range, cod would be expected to move towarmer waters for spawning. Studies elsewhere seem to support this proposition. Forinstance, the degree of overlap between Pacific cod and their prey (including northernshrimp) was significantly correlated with temperature in the eastern Bering Sea(Kihara and Shimada, 1988). Also, the extent of cod migrations and their spatial dis-tribution are maximized when stock abundance is high and Bering Sea temperaturesare warm (Stepanenko, 1997). So, effects of warmer temperature on the movement ofPacific cod into nearshore bays, and associated increases in shrimp predation, seemquite plausible for the northern Gulf of Alaska.
Additional support for the role of predation on shrimp declines comes from adetailed study of the Kachemak Bay stock of northern shrimp. Natural mortality wasthe most important factor controlling this stock during the late 1970s and early 1990s(Fu et al., 1999). In particular, a strong increasing trend of natural mortality seems tohave been responsible for the crash of the stock in the 1980s. This trend virtually par-allels increasing trends in cod abundance from trawl surveys in Kachemak Bay, indi-cating that intensified predation by cod was likely to be responsible for the shrimpdecline (Fu and Quinn, 2000). Moreover, moderate levels of recruitment during themid-1980s failed to stem the decline, presumably because predation remained high.Similarly, an examination of Pacific cod stomachs led Albers and Anderson (1985) tosuggest that cod predation was the cause of the decline of a lightly fished stock ofnorthern shrimp in Pavlof Bay, Alaska.
Additional evidence for the role of predation on shrimp population dynamicscomes from the North Atlantic Ocean. Worm and Myers (2003) conducted a meta-analysis of data from nine regions in the Northwest and Northeast Atlantic from theGulf of Maine to the Barents Sea to test whether northern shrimp and Atlantic cod(Gadus morhua) are consistent with top-down (e.g. predation) or bottom-up (e.g.climate forcing) hypotheses. The top-down view emerged as the leading hypothesis,because eight of the nine regions exhibited inverse correlations between shrimp andcod. Exceptions occurred only near the southern range limits of both species on bothsides of the Atlantic. Shrimp biomass was strongly negatively related to cod biomassbut not to temperatures. Cod biomass was positively related to temperature but thestrength of the shrimp–cod relationship weakened at higher temperatures. Anothermeta-analysis of the relationships between temperature and recruitment in nine NorthAtlantic cod stocks revealed negative relationships for stocks located in warm waterand positive relationships for stocks in cold water (Planque and Frédou, 1999).
Detailed studies of specific shrimp populations in the Atlantic Ocean indicate that rela-tionships with cod and temperature may be more complex, but predation was invoked asa partial explanation for shrimp population dynamics in most areas. For instance, thewestern Scotian Shelf contains broad areas of suitable fine-sediment habitat for shrimp,but distribution and abundance of shrimp is typically restricted by patchy areas of
384 Long-Term Ecological Change in the Northern Gulf of Alaska
Ch04-N52960 8/22/06 11:15 AM Page 384
marginally suitable temperatures (Koeller, 2000). Shrimp abundance increases to com-mercially exploitable levels only after ocean temperatures decline to favorable levels. In addition to habitat and temperature, predation by cod contributed to trends in shrimpabundance in this region since 1977 (Koeller, 2000). On the northeast Newfoundlandshelf, it appears that the initial increase of shrimp biomass in the early to mid 1980s wasunrelated to cod, but a subsequent, larger increase in shrimp in the 1990s was related tothe collapse of the cod stock (Lilly et al., 2000). In the Barents Sea, the abundance of codand shrimp are significantly correlated over 1982 to 1998, and cod stomach data suggestthat age 3 to 6 cod have the strongest impacts (Berenboim et al., 2000).
Similar to Worm and Myers (2003), Zheng and Kruse (2000) tested top-down andbottom-up hypotheses involving five crab and three groundfish stocks in the easternBering Sea. Only one statistically significant relationship between predator and preywas found, and this involved Pacific cod predation of 1-year-old red king crabs. Usingupdated datasets, statistical support was found for a predation relationship betweenyellowfin sole and red king crab, as well (Zheng and Kruse, 2006). However, analy-ses of Pacific cod stomachs in the eastern Bering Sea do not indicate that cod eat largenumbers of young red king crabs. Interestingly, molting adult female red king crabsare consumed by cod in spring in the Bering Sea, but consumption rates cannotexplain the crab stock declines (Livingston, 1989). Likewise, in the Gulf of Alaska,field sampling of groundfish stomachs generally do not indicate heavy predation onred king crabs. During 12 years of red king crab pot surveys, only 77 (0.6%) of 46,125cod stomachs contained red king crabs, some of which may have consumed the crabwhile in the crab pot (Blau, 1986). A review of multiple studies of the feeding habitsof groundfish in the gulf indicated typically low rates of king crab predation (Tylerand Kruse, 1996). However, definitive conclusions are difficult, because of a relativelack of stomach samples from cod sampled in shallow waters where young-of-the-year king crab settle. Also, it must be remembered that most groundfish stomachs aresampled starting in early summer, whereas most adult male red king crabs molt in latewinter and early spring. So, the paucity of king crabs in cod stomachs may result froma sampling bias regarding time (adults) and space (young).
Conversely, a stronger case exists for the role of predation on tanner crabs owingto higher consumption rates of ages 0 and 1 crabs (Lang et al., 2003). Despite thisempirical evidence for a heavy predation of young tanner crabs by cod, conclusiveevidence of the role of predation on tanner crabs at the population level remain to bedemonstrated.
In the Bering Sea, crab population dynamics seem to be largely driven by fluctua-tions in recruitment, with two notable exceptions. Sharp increases in mortality ofjuvenile and adult crabs were associated with the declines of red king crabs in BristolBay in the early 1980s (Zheng et al., 1995a,b) and blue king crabs off St. MatthewIsland in the late 1990s (Zheng and Kruse, 2002). It remains unclear whether theseincreases in mortality were attributable to predation or other factors, but high rates of
Long-term Change 385
Ch04-N52960 8/22/06 11:15 AM Page 385
predation on adult and subadult crabs are unprecedented. Moreover, although fishingis highly unlikely to be involved in the decline off St. Matthew Island, the potentialfor fishing effects (e.g. discards in the directed crab fishery and/or bycatch in trawlfisheries) cannot be discounted in the case of elevated mortality of red king crabs inBristol Bay. Mass mortality from disease and sharp changes in environmental condi-tions (e.g. temperature) are alternative speculations.
4.10.6. Fishing Effects
Kruse et al. (1996) calculated an “overfishing” biological reference point for Kodiakred king crabs based on F30% (equating to a 41.1% harvest rate of legal males), thefishing mortality rate that reduces spawning stock biomass of male crabs to 30% ofthe unfished levels. If one accepts this definition, then it appears that overfishingoccurred during 1966–1968 and 1980–1982. Abundance of legal male king crabsdeclined coincident with overfishing from 30 million crabs in 1964–1965 to 6 millionin the late 1960s. During the autumn 1966, Kodiak fishermen began to report signif-icant numbers of mature barren females (McMullen and Yoshihara, 1969). Much sam-pling during 1968 found large concentrations of unmated mature females on thesoutheast side of Kodiak Island (McMullen, 1968; McMullen and Yoshihara, 1969).In April–May 1968, trawl samples revealed that 76% of mature females in KaguyakBay were not carrying eggs and had not mated – a most unusual observation.Female:male sex ratio was 72:1. This unusual percentage of unmated females wasattributed to heavy fishing (Powell et al., 1973; McMullen and Yoshihara, 1969).
In Kodiak, harvest rates were reduced to 14 to 33% during 1969–1972 and legalmales rebounded to 14 million crabs in 1972. However, the stock crashed to <1 mil-lion legal males in 1983 after severe overfishing in the early 1980s (harvest ratespeaked at 80% in 1982). In a more formal assessment of stock abundance and harvestrates, Collie and Kruse (1998) likewise concluded that harvest rates <40% generallycorresponded to periods of stable or increasing abundance and periods of harvest>40% corresponded to periods of stock decline and that the highest harvest rates(>80% for Kodiak) corresponded to the sharpest declines. Although there is evidencefor periods of overfishing, red king crab population dynamics are very complex andcannot be explained by fishing alone (Kruse et al., 1996).
Orensanz et al. (1998) went beyond these findings for Kodiak red king crab andconcluded that evidence of overfishing of Alaskan crustacean stocks in general wascompelling: “From a managerial perspective, the pattern and magnitude of the collec-tive rise and fall of the crustacean fisheries of Alaska are such that overfishing has tobe considered as the default working scenario.” The motivation for this conclusionwas the serial pattern of collapse, starting with the most valuable species closest toports to the most-distant, least-valuable species.
386 Long-Term Ecological Change in the Northern Gulf of Alaska
Ch04-N52960 8/22/06 11:15 AM Page 386
While this argument is intriguing, Orensanz’s conclusions are controversial and,clearly, declines of all Alaskan crustacean stocks cannot be explained by fishingalone. Year-class strength of red king crabs in Bristol Bay began declining after 1970,well before the heaviest catches in the late 1970s and 1980. Also, some lightly fishednorthern shrimp stocks experienced similar declines to shrimp stocks that were fished(Anderson, 1991). Similarly, a simulation study of northern shrimp in Kachemak Bayshowed that no alternative harvest strategies could have altered the fate of the stock,because natural mortality, not fishing mortality, was the most important contributor toits collapse (Fu et al., 1999). If fishing had a greater role in crab and shrimp declines,operative mechanisms would seem to have to involve effects of fishing that have yetto be demonstrated, such as genetic selection, disruption of mating systems, or dele-terious effects on stock productivity by habitat disturbance. Research has begun toinvestigate such subtle but potentially insidious effects of fishing in the NorthAtlantic, and similar studies should be conducted in Alaska.
4.10.7. Conclusions
Causes of crab and shrimp declines in the late 1970s and early 1980s remain uncer-tain, but some conclusions can be drawn about probable factors. For northern shrimp,cod predation appears to have played an important role in the declines. A regime shiftof the late 1970s was not only associated with several strong cod year-classes, butwarmer temperatures may have facilitated an influx of cod into bays occupied byshrimp. Laboratory experiments and field studies in the North Atlantic on the samespecies suggest that the deleterious effect of warmer temperatures on shrimp repro-duction may have triggered a series of year-class failures at the same time that preda-tion increased in the late 1970s. Evidence is weak, but equivocal, for a prominent roleof a match–mismatch hypothesis in shrimp declines.
Regarding red king crabs, some connection to Aleutian low-Pressure dynamics, asindexed by the PDO, seems likely, given the similarity of trends of red king crabsstocks over the broad expanse of the northern Gulf of Alaska. However, the fact thatking crab recruitment began to decline in the early 1970s and continued through the1980s, suggests a progressive deterioration in conditions favorable to their survival,rather than a simple shift from a regime with one set of environmental conditions in thelate 1970s to another regime with a different set of conditions, as suggested for otherspecies. The match–mismatch hypothesis was tested and rejected for red king crabs.Instead, field studies suggest that phytoplankton species composition may be muchmore important than timing of the zooplankton bloom. In particular, red king crab sur-vival may be favored by predominance of Thalassiosira diatoms in the spring bloom.This diatom is associated with relatively calm winds and a stable water column,presumably associated with the cool-phase of the PDO. Yet, this and other causative
Long-term Change 387
Ch04-N52960 8/22/06 11:15 AM Page 387

388 Long-Term Ecological Change in the Northern Gulf of Alaska
mechanisms remain speculative. Other beneficial effects of cool ocean temperatures onred king crab cannot be discounted. It seems unlikely that predation played much of arole in the decline of red king crab, but definitive conclusions are not possible owingto the lack of sampling of groundfish predators in shallow, nearshore waters, whereyoung-of-the-year red king crabs settle and during late winter, when adult males molt.Instances of overfishing have been demonstrated for red king crabs, but even in thesecases, overfishing cannot fully explain crab stock declines.
For tanner crabs, it seems clear that recruitment is affected by local rather thanregional conditions. Causes of tanner crab population changes are not simplistic, andthey seem to involve multiple factors at multiple timescales. Three mechanisms seemto combine to explain most of the variability in tanner crab recruitment in Bristol Bay:(1) warmer bottom temperatures favor tanner crab gonadal development and egg incu-bation, (2) winds blowing from the northeast along the Alaska Peninsula during springpromote coastal upwelling while advecting larvae offshore to soft bottom sedimentsused as nursery areas, and (3) warmer sea surface temperatures during May–June favorgrowth of calanoid copepods that are preyed upon by tanner crab larvae. Cod prey onyoung tanner crabs at high levels, but strong associations between cod abundance andtanner crab recruitment are not readily apparent, at least in the Bering Sea. Studies oftanner crab stocks in the northern Gulf of Alaska are required to determine the gener-ality of the three mechanisms that may be operating in Bristol Bay.
In general, simple, single-factor hypotheses are unlikely to fully explain the remarkablechanges in invertebrate populations observed in the northern Gulf of Alaska. Developmentof comprehensive life-stage-based models (e.g. Tyler and Kruse, 1996a,b, 1997, 1998) isone step toward understanding the causes of shrimp and crab population changes in thenorthern Gulf of Alaska. Such models are useful, not only because of their ability to eval-uate the consistency of alternative hypotheses with available empirical evidence within alogical framework, but they provide a means to organize existing information and to iden-tify gaps in knowledge that require laboratory experiments and field studies. A betterunderstanding of crab and shrimp population dynamics in the northern Gulf of Alaskaremains a challenge for invertebrate researchers in the 21st century. What ecosystem andregulatory changes must happen for these valuable invertebrate species to recover, and cansimilar collapses be avoided in the future? Time may provide these answers.
References
A’mar, T. (and 39 co-authors). 2003. Stock Assessment and Fishery Evaluation Report forthe Groundfish Resources of the Gulf of Alaska. Compiled by the Plan Team for theGroundfish Fisheries of the Gulf of Alaska, North Pacific Fishery Management Council,605 W. 4th Avenue, Suite 306, Anchorage, AK 99501.
Abookire, A. A., J. F. Piatt, and M. D. Robards. 2000. Nearshore fish distributions in anAlaskan estuary in relation to stratification, temperature and salinity. Estuarine, Coastaland Shelf Science 51: 45–59.
Ch04-N52960 8/22/06 11:15 AM Page 388
Abookire, A. A. and J. F. Piatt. 2004. Structure of forage fish communities in relation tooceanographic conditions in lower Cook Inlet, Alaska. Mar. Ecol. Progr. Ser. 287:229–240.
Adams, T. C. 2000. Foraging differences and early maternal investment in adult AlaskanSteller sea lions (Eumetopias jubatus). PhD thesis, Galveston, TX, Texas A&MUniversity.
Agler, B. A., S. J. Kendall, D. B. Irons, and S. P. Klosiewski. 1999. Declines in marinebird populations in Prince William Sound, Alaska coincident with a climatic regimeshift. Waterbirds 22: 98–103.
Ainley, D. G., R. G. Ford, E. D. Brown, R. M. Suryan, and D. B. Irons. 2003. Preyresources, competition, and geographic structure of kittiwake colonies in Prince WilliamSound. Ecology 84: 709–723.
Albers, W. D., and P. J. Anderson. 1985. Diet of Pacific cod, Gadus macrocephalus, andpredation on the northern pink shrimp, Pandalus borealis, in Pavlof Bay, Alaska. Fish.Bull. 83: 601–610.
Alderdice, D. F., and C. R. Forrester. 1971. Effects of salinity, temperature, and dissolvedoxygen on early development of the Pacific cod (Gadus macrocephalus). J. Fish. Res.Board Can. 28: 883–902.
Alexander, M. A., I. Blade, M. Newman, J. R. Lanzante, N.-C. Lau, and J. D. Scott. 2002.The atmospheric bridge: the influence of ENSO teleconnections on air–sea interactionover the global ocean. J. Clim. 15: 2205–2231.
Alverson, D. L. 1992. A review of commercial fisheries and the Steller sea lion(Eumetopias jubatus): the conflict arena. Rev. Aquat. Sci. 6: 203–256.
Anderson, P. J. 1991. Age, growth, and mortality of the northern shrimp, Pandalus bore-alis, in Pavlof Bay, Alaska. Fish. Bull. 83: 601–610.
Anderson, P. J. 2000. Pandalid shrimp as indicators of ecosystem regime shift. J. Northwest Atlantic Fish. Sci. 27: 1–10.
Anderson, P. J. and J. F. Piatt. 1999. Community reorganization in the Gulf of Alaska fol-lowing ocean climate regime shift. Mar. Ecol. Prog. Ser. 189: 117–123.
Anderson, P. J., J. E. Blackburn, and B. A. Johnson. 1997. Declines of forage species inthe Gulf of Alaska, 1972–95, as indicator of regime shift. In: Proceedings of the inter-national symposium on the role of forage fishes in marine ecosystems. Alaska Sea GrantCollege Program Report 97-01, University of Alaska, Fairbanks, pp. 531–543.
Anker-Nilssen, T., R. T. Barrett, and J. V. Krasnov. 1997. Long- and short-term responsesof seabirds in the Norwegian and Barents Seas to changes in stocks of prey fish. In: Proceedings of the International Symposium on the role of Forage Fishes in MarineEcosystems, University of Alaska Sea Grant Rep. 97-01. University of Alaska,Fairbanks, pp. 683–698.
Anonymous. 1993. Is it food? Addressing marine mammal and seabird declines.Fairbanks, AK, Alaska Sea Grant College Program. 59 pp.
Apollonio, S., D. K. Stevenson, and E. E. Dunton, Jr. 1986. Effects of temperature on thebiology of the northern shrimp, Pandalus borealis, in the Gulf of Maine. NOAATechnical Report NMFS 42.
Bailey, K. M. 2000. Shifting control of recruitment of walleye pollock, Theragrachalcogramma, after a major climatic and ecosystem change. Mar. Ecol. Prog. Ser. 198:215–224.
Bailey, K. M. and E. D. Houde. 1989. Predation on eggs and larvae of marine fishes andthe recruitment problem. Adv. Mar. Biol. 25: 1–83.
Long-term Change 389
Ch04-N52960 8/22/06 11:15 AM Page 389
Bailey, K. M. and S. A. Macklin. 1994. Analysis of patterns in larval walleye pollockTheragra chalcogramma survival and wind mixing events in Shelikof Strait, Gulf ofAlaska. Mar. Ecol. Prog. Ser. 113: 1–12.
Bailey, K. M. and S. J. Picquelle. 2002. Larval distribution of offshore spawning flatfishin the Gulf of Alaska: Potential transport pathways and enhanced onshore transportduring ENSO. Mar. Ecol. Prog. Ser. 236: 205–217.
Bailey, K. M., R. D. Brodeur, and A. B. Hollowed. 1996. Cohort survival patterns of wall-eye pollock, Theragra chalcogramma, in Shelikof Strait, Alaska: A critical factor analy-sis. Fish. Oceanogr. 5: 179–188.
Baird, R. W. and L. M. Dill. 1995. Occurrence and behaviour of transient killer whales: sea-sonal and pod-specific variability, foraging behaviour and prey handling. Can. J. Zool.73: 1300–1311.
Barrett, R. T. 1996. Egg laying, chick growth, and food of kittiwakes Rissa tridactyla atHopen, Svalbard. Polar Res. 15: 107–113.
Beamish, R. J. 1993. Climate and exceptional fish production off the west coast of NorthAmerica. Can. J. Fish. Aquat. Sci. 50: 2270–2291.
Beamish, R. J. and C. Mahnken. 2001. A critical size and critical period hypothesis toexplain the natural regulation of salmon abundance and the linkage to climate and cli-mate change. Prog. Oceanogr. 49: 423–427.
Beamish, R. J. and D. R. Bouillon. 1993. Pacific salmon production trends in relation toclimate. Can. J. Fish. Aquat. Sci. 50: 1002–1016.
Beamish, R. J., D. J. Noakes, G. A. McFarlane, L. Klyashtorin, V. V. Ivanov, and V. Kurashov. 1999. The regime concept and natural trends in the production of Pacificsalmon. Can. J. Fish. Aquat. Sci. 56: 516–526.
Bechtol, W. R. 1997. Changes in forage fish populations in Kachemak Bay, Alaska,1976–95. In Proceedings of the international symposium on the role of forage fishes inmarine ecosystems. Alaska Sea Grant College Program Report 97-01, University ofAlaska, Fairbanks, pp. 441–455.
Berenboim, B. J., A. V. Dolgov, V. A. Korzhev, and N. A. Yaragina. 2000. The impact ofcod on the dynamics of Barents Sea shrimp (Pandalus borealis) as determined by mul-tispecies models J. Northwest Atlantic Fish. Sci. 27: 69–75.
Bickham, J. W., J. C. Patton, and T. R. Loughlin. 1996. High variability for control regionsequences in a marine mammal; implications for conservation and maternal phylogenyof Steller sea lions (Eumetopias jubatus). J. Mammol. 77: 95–108.
Bigg, M. A. 1985. Status of the Steller sea lion (Eumetopias jubatus) and California sea lion(Zalophus californianus) in British Columbia. Can. Spec. Pub. Fish. Aquat. Sci. 77: 1–20.
Bigler, B. S., D. W. Welch, and J. H. Helle. 1996. A review of size trends among NorthPacific salmon (Oncorhynchus spp.). Can. J. Fish. Aquat. Sci. 53: 455–465.
Birkhead, T. R. 1976. Breeding biology and survival of Guillemots Uria aalge.Unpublished PhD thesis, University of Oxford, England.
Birkhead, T. R. and D. N. Nettleship. 1987. Ecological relationships between commonmurres, Uria aalge, and thick-billed murres, Uria lomvia, at the Gannet Islands,Labrador. II. Breeding success and site characteristics. Can. J. Zool. 65: 1630–1637.
Birkhead, T. R. and D. N. Nettleship. 1988. Breeding performance of black-legged kitti-wakes, Rissa tridactyla, at a small, expanding colony in Labrador. Can. Field Naturalist102: 20–24.
Blau, S. F. 1986. Recent declines of red king crab (Paralithodes camtschatica) populationsand reproductive conditions around the Kodiak Archipelago, Alaska. In: G. S. Jamieson
390 Long-Term Ecological Change in the Northern Gulf of Alaska
Ch04-N52960 8/22/06 11:15 AM Page 390
Long-term Change 391
and N. Bourne, (Eds.), North Pacific workshop on stock assessment and management of invertebrates. Canadian Special Report of Fisheries and Aquatic Sciences 92, pp. 360–369.
Bodkin, J. L. 2003. Sea otter. In: G. A. Feldhammer, B. C. Thompson and J. A. Chapman(Eds.), Wild mammals of North America. Baltimore, MD, John Hopkins UniversityPress, pp. 735–743.
Bodkin, J. L., A. M. Burdin, and D. A. Ryazanov. 2000. Age and sex-specific populationstructure in sea otters. Mar. Mam. Sci. 16: 201–219.
Bodkin, J. L., B. E. Ballachey, M. A. Cronin and K. T. Scribner. 1999. Population demo-graphics and genetic diversity in remnant and translocated populations of sea otters.Conser. Biol. 13: 1378–1385.
Bodkin, J. L., B. E. Ballachey, T. A. Dean, A. K. Fukuyama, S. C. Jewett, L. McDonald,D. H. Monson, C. E. O’Clair, and G. R. VanBlaricom. 2002. Sea otter population statusand the process of recovery from the 1989 ‘Exxon Valdez’ oil spill. Mar. Ecol. Prog. Ser.241: 237–253.
Boersma, P. D., J. K. Parrish, and A. B. Kettle. 1995. Common Murre abundance, phenol-ogy and productivity on the Barren Islands, Alaska: The Exxon Valdez oil spill and long-term environmental change. In: P. G. Wells, J. N. Butler, and J. S. Hughes (Eds.), ExxonValdez Oil Spill: Fate and effects in Alaskan waters. American Society for Testing andMaterials, Philadelphia, PA. ASTM STP 1219, pp. 820–853.
Bond, N. A., J. E. Overland, M. Spillane, and P. Stabeno. 2003. Recent shifts in the stateof the North Pacific. Geophys. Res. Lett. 30: 2183–2186.
Boveng, P. L., J. L. Bengtson, D. E. Withrow, J. C. Cesarone, M. A. Simpkins, K. J. Frost,and J. J. Burns. 2003. The abundance of harbor seals in the Gulf of Alaska. Mar. Mam.Sci. 19: 111–127.
Bowen, W. D. and G. Harrison. 1994. Offshore diets of grey seals (Halichoerus grypus)near Sable Island, Canada. Mar. Ecol. Prog. Ser. 112: 1–11.
Bowen, W. D. and G. Harrison. 1996. Comparison of harbour seal diets in two habitats ofAtlantic Canada. Can. J. Zool. 74: 125–135.
Bowen, W. D., D. Ellis, S. J. Iverson, and D. J. Boness. 2001. Maternal effects on off-spring growth rate and weaning mass in harbour seals. Can. J. Zool. 79: 1088–1101.
Bowen, W. D., D. Ellis, S. J. Iverson, and D. J. Boness. 2003. Maternal and newborn life-history traits during periods of contrasting population trends: implications for explain-ing the decline of harbour seals, Phoca vitulina, on Sable Island. J. Zool. London 261:155–163.
Brandon, E. A. 2000. Maternal investment in Steller sea lions in Alaska. Ph.D. thesis,Galveston, TX, Texas A&M University.
Brett, J. R. and D. D. Groves. 1979. Physiological energetics. VII: bioenergetics andgrowth. In: Hoar, W. S. and D.J. Randall (Eds.), Fish Physiology. Academic Press Inc.,pp. 261–342.
Brodeur, R. D. and D. M. Ware. 1992. Interannual and interdecadal changes in zooplank-ton biomass in the subarctic Pacific Ocean. Fish. Oceanogr. 1: 32–38.
Brodeur, R. D. and D. M. Ware. 1992. Long term variability in zooplankton biomass inthe subarctic Pacific Ocean. Fish. Oceanogr. 1: 32–38.
Brodeur, R. D. and D. M. Ware. 1995. Interdecadal variability in distribution and catchrates of epipelagic nekton in the Northeast Pacific Ocean. In: R. J. Beamish (Ed.),Climate Change and Northern Fish Populations. Can. Spec. Publ. Fish. Aquat. Sci. 121:329–356.
Ch04-N52960 8/22/06 11:15 AM Page 391
Brodeur, R. D. and M. T. Wilson. 1996. A review of the distribution, ecology and popula-tion dynamics of age-0 walleye pollock in the Gulf of Alaska. Fish. Oceanogr. 5:148–166.
Brodeur, R. D., B. Frost, S. R. Hare, R. C. Francis, and W. J. Ingerham. 1996. Interannualvariations in zooplankton biomass in the Gulf of Alaska and covariations with theCalifornia Current zooplankton biomass. CalCOFI Rept. 37: 80–99.
Brodeur, R. D., K. W. Myers, and J. H. Helle. 2003. Research conducted by the UnitedStates on the early ocean life history of Pacific salmon. In: P. Symons (Ed.), A Reviewof the Research on the Early Marine Period of Pacific Salmon by Canada. Japan, Russia,and the United States. N. Pac. Anadrom. Fish. Comm. Bull. 3: 89–131.
Brodeur, R. D., R. C. Francis, B. W. Frost, W. J. Ingraham, Jr., and S. R. Hare. 1996.Interannual variations in zooplankton biomass in the Gulf of Alaska, and covariationwith California Current zooplankton biomass. Scripps Institute, University ofCalifornia, San Diego, CalCOFI Report 37: 80–99.
Brodeur, R. D., S. J. Picquelle, D. M. Blood, and N. Merati. 1996. Walleye pollock eggdistribution and mortality in the western Gulf of Alaska. Fish. Oceanogr. 5: 92–111.
Brown, E. D. 2003. Stock structure and environmental effects on year class formation andpopulation trends on Pacific herring, Clupea pallasi, in Prince William Sound, Alaska.PhD Dissertation, University of Alaska Fairbanks, Fairbanks, Alaska.
Bryan, J. D., S. W. Kelsch, and W. H. Neill. 1990. The maximum power principle inbehavioral thermoregulation by fishes. Trans. Am. Fish. Soc. 119: 611–621.
Bryant, R., I. L. Jones, and J. M. Hipfner. 1999. Responses to changes in prey availabilityby common murres and thick-billed murres at the Gannet Islands, Labrador. Can. J. Zool.77: 1278–1287.
Burger, A. E. and J. F. Piatt. 1990. Flexible time budgets in breeding common murres:Buffers against variable prey availability. Studies in Avian Biology 14: 71–83.
Burn, D. M. and A. M. Doroff. 2005. Decline in sea otter populations along the AlaskaPeninsula, 1986–2001. Fish. Bull. 103: 270–279.
Byrd, G. V. 1989. Seabirds in the Pribilof Islands, Alaska: trends and monitoring methods.MS Thesis, University of Idaho, Moscow, ID.
Byrd, G. V., J. C. Williams, and R. Walder. 1992. Status and biology of the tufted puffinin the Aleutian Islands, Alaska after a ban on salmon drift nets. U.S. Fish and WildlifeService, Adak, AK.
Calkins, D. and E. Goodwin. 1988. Investigation of the decline of Steller sea lions in theGulf of Alaska. Anchorage, AK, Alaska Department of Fish and Game, 76 pp.
Calkins, D. C., D. C. McAllister, K. W. Pitcher, and G. W. Pendleton. 1999. Steller sealion status and trend in southeast Alaska: 1979–1997. Mar. Mam. Sci. 15: 462–477.
Calkins, D. G., E. F. Becker, and K. W. Pitcher. 1998. Reduced body size of female Stellersea lions from a declining population in the Gulf of Alaska. Mar. Mam. Sci. 14: 232–244.
Chelton, D. and R. W. Davis. 1982. Monthly mean sea-level variability along the westcoast of North America. J. Phys. Oceanogr. 12: 757–779.
Chelton, D. B. and R. E. Davis. 1982. Monthly mean sea-level variability along the westcoast of North America. J. Phys. Oceanogr. 12: 757–784.
Childers, A., T. E. Whitledge, and D. A. Stockwell. Seasonal and interannual variability inthe distribution of nutrients and chlorophyll-a across the Gulf of Alaska shelf, 2005,Deep-Sea Res. II 52: 193–216.
Collie, J. S., and G. H. Kruse. 1998. Estimating king crab (Paralithodes camtschaticus)abundance from commercial catch and research survey data. In: G. S. Jamieson and
392 Long-Term Ecological Change in the Northern Gulf of Alaska
Ch04-N52960 8/22/06 11:15 AM Page 392
Long-term Change 393
A. Campbell, (Eds.), Proceedings of the North Pacific symposium on invertebrate stockassessment and management. Canadian Special Publication of Fisheries and AquaticSciences 125, pp. 73–83.
Cooney, R. T. and R. D. Brodeur. 1998. Carrying capacity and North Pacific salmon pro-duction: stock enhancement implications. Bull. Mar. Sci. 62(2): 443–464.
Cooney, R. T., J. R. Allen, M. A. Bishop, D. L. Eslinger, T. Kline, B. L. Norcross, C. P. McRoy, J. Milton, J. Olsewn, V. Patrick, A. J. Paul, D. Salon, D. Scheel, G. L. Thomas, S. L. Vaughan, and M. Willette. 2001. Ecosystem controls of juvenilepink salmon (Oncorhynchus gorbuscha) and Pacific herring (Clupea pallasi) popula-tions in Prince William Sound, Alaska. Fish. Oceanogr. 10(Suppl. 1): 1–13.
Cooney, R. T., T. M. Willette, S. Sharr, D. Sharp, and J. Olsen. 1995. The effect of climateon North Pacific pink salmon (Oncorhynchus gorbuscha) production: examining somedetails of a natural experiment. In R. J. Beamish (Ed.), Climate Change and NorthernFish Populations. Can. Spec. Publ. Fish. Aquat. Sci., 121: 475–482.
Coyle, K. O., and A. J. Paul. 1990. In: D. A. Ziemann and K. W. Fulton-Bennett (Eds.),APPRISE – Interannual variability and fisheries recruitment. The Oceanic Institute,Honolulu, HI, pp. 179–228.
Cury, P. and C. Roy. 1989. Optimal environmental window and pelagic fish recruitmentsuccess in upwelling areas. Can. J. Fish. Aquat. Sci. 46: 670–680.
Cushing, D. H. 1969. The regularity of the spawning season of some fishes. InternationalCouncil for the Exploration of the Sea, Journal du Conseil 33: 81–92.
Cushing, D. H. 1995. Population production and regulation in the sea: a fisheries per-spective. Cambridge University Press, Cambridge, UK.
Davis, R. W., E. A. Brandon, T. C. Adams, T. M. Williams, M. Castellini, T. R. Loughlin,and D. C. Calkins. 1996. Indices of reproductive effort, pup condition and pup growthfor Steller sea lions (Eumetopias jubatus) in Alaska. Alaska Dept. of Fish and Game,Wildlife Tech. Bull. 13: 53–68.
Davis, R. W., T. C. Adams, E. A. Brandon, D. C. Calkins, and T. R. Loughlin 2002. Femaleattendance, lactation, and pup growth in Steller sea lions. In: D. DeMaster and S. Atkinson (Eds.), Steller sea lion decline: is it food II? Fairbanks, AK, University ofAlaska Sea Grant. AK-SG-02-02, pp. 23–27.
Dean, T. A., J. L. Bodkin, A. K. Fukuyama, S. C. Jewett, D. H. Monson, C. E. O’Clair,and G. R. VanBlaricom. 2002. Food limitation and the recovery of sea otters in PrinceWilliam Sound. Mar. Ecol. Prog. Ser. 241: 255–270.
DeGange, A. R. and G. A. Sanger 1986. Marine birds. In: D. W. Hood and S. T. Zimmerman (Eds.), The Gulf of Alaska. NOAA/MMS, Anchorage, Alaska. pp. 479–524.
DeMaster, D. and S. Atkinson (Eds.). 2002. Steller sea lion decline: Is it food II.University of Alaska Sea Grant, AK-SG-02-02, Fairbanks, AK, 80 pp.
Dettinger, M. D., D. S. Battisti, G. J. McCabe, C. M. Bitz, and R. D. Garreaud. 2001.Interhemispheric effects of interannual and decadal ENSO-like climate variations on theAmericas. pp. 1–22. In: V. Markgraf (Ed.), Interhemispheric Climate Linkages.Academic Press, New York, 454 pp.
DFO. 2003. Steller sea lion (Eumetopias jubatus). Nanaimo, B.C., Canada, Department ofFisheries and Oceans, Stock Status Report 2003/037.
Dorn, M., S. Barbeaux, M. Guttormsen, B. Megrey, A. Hollowed., M. Wilkins, and K. Spalinger. 2003. Assessment of walleye pollock in the Gulf of Alaska. In StockAssessment and Fishery Evaluation Report for the Groundfish Resources of the Gulf of
Ch04-N52960 8/22/06 11:15 AM Page 393
Alaska. Compiled by the Plan Team for the Groundfish Fisheries of the Gulf of Alaska,North Pacific Fishery Management Council, 605 W. 4th Avenue, Suite 306, Anchorage,AK 99501.
Doroff, A. M. and A. R. DeGange. 1994. Sea otter Enyhdra lutris prey, composition andforaging success in the northern Kodiak Archipelago. Fish. Bull. 92: 704–710.
Doroff, A. M., J. A. Estes, M. T. Tinker, D. M. Burn, and T. J. Evans. 2003. Sea otter pop-ulation decline in the Aleutian Archipelago. J. Mammol. 84: 55–64.
Dragoo, D. E., G. V. Byrd, and D. B. Irons. 2000. Breeding status and population trendsof seabirds in Alaska in 1999. U.S. Fish and Wildlife Service Report AMNWR 2000/02.Homer, AK.
Dragoo, D. E., G. V. Byrd, and D. B. Irons. 2004. Breeding status, population trends anddiets of seabirds in Alaska, 2002. U.S. Fish and Wildlife Service Report AMNWR 04/15.
Drew, G. 2002. Primary and Secondary Production in Lower Cook Inlet. In J. F. Piatt(Ed.), Response of seabirds to fluctuations in forage fish density. Final Report to ExxonValdez Oil Spill Trustee Council (Restoration Project 01163M) and MineralManagement Service (Alaska OCS Study MMS 2002-068). Alaska Science Center, U.S. Geological Survey, Anchorage, Alaska, pp. 27–32.
Drew, G., and Piatt, J. F. 2002. Oceanography of Lower Cook Inlet. Pages 18–26 in J.F. Piatt (ed.). Response of seabirds to fluctuations in forage fish density. Final Reportto Exxon Valdez Oil Spill Trustee Council (Restoration Project 01163M) and MineralManagement Service (Alaska OCS Study MMS 2002-068). Alaska Science Center, U.S. Geological Survey, Anchorage, Alaska.
Duffy-Anderson, J. T., K. M. Bailey, and L. Ciannelli. 2002. Consequences of a super-abundance of larval walleye pollock, Theragra chalcogramma, in the Gulf of Alaska in1981. Mar. Ecol. Prog. Ser. 243: 179–190.
Ebbesmeyer, C. C., D. R. Cayan, F. H. McLain, D. H. Peterson, and K. T. Redmond. 1991.1976 step in the Pacific climate: Forty environmental changes between 1968–1975 and1977–1985. In: J. L. Betancourt and V. L. Tharp (Eds.), Proceedings of the SeventhAnnual Pacific Climate Workshop. California Department of Water ResourcesInteragency Ecological Studies Program Technical Report 26: pp. 129–141.
Enfield, D. B. and A. M. Mestas-Nuñez. 1999. Multiscale variabilities in global sea sur-face temperature and their relationships with tropospheric climate patterns. J. Clim. 12:2719–2733.
Erikstad, K. E., P. Fauchald, T. Tveraa, and H. Steen. 1998. On the cost of reproduction inlong-lived birds; the influence of environmental variability. Ecol. 79: 1781–1788.
Erikstad, K. E., T. Tveraa, and R. T. Barrett. 1995. Adult survival and chick production inlong-lived seabirds: a 5-year study of the kittiwake Rissa tridactyla. In: Skjoldal, H. R., C. Hopkins, K. E. Erikstad, and H. P. Leinaas (Eds.), Ecology of Fjords andCoastal Waters. Elsevier Science, London, pp. 471–477.
Eschmeyer, W. N., E. S. Herald, and H. Hammann, 1983. A field guide to Pacific coastfishes of North America. Houghton Mifflin Company.
Eslinger, D. L., R. T. Cooney, C. P. McRoy, A. Ward, T. C. Kline, Jr., E. P. Simpson, J. Wang, and J. R. Allen. 2001. Population dynamics: observed and modeled responsesto physical conditions in Prince William Sound, Alaska. Fish. Oceanogr. 10(Suppl. 1):81–96.
Estes, J. A. and J. L. Bodkin. 2002. Marine Otters. In: W. F. Perrin, B. Wursig, J. G. M. Thewissen and C. R. Crumly (Eds.), Encyclopedia of Marine Mammals.Academic Press, pp. 843–858.
394 Long-Term Ecological Change in the Northern Gulf of Alaska
Ch04-N52960 8/22/06 11:15 AM Page 394
Estes, J. A., D. O. Duggins, and G. B. Rathbun. 1989. The ecology of extinctions in kelpforests. Cons. Biol. 3:252–264.
Estes, J. A., E. M. Danner, D. F. Doak, B. Konar, A. M. Springer, P. D. Steinberg, M. T. Tinker, and T. M. Williams. 2004. Complex trophic interactions in kelp forestecosystems. Bull. Mar. Sci. 74: 621–638.
Estes, J. A., M. T. Tinker, T. M. Williams, and D. F. Doak. 1998. Killer whale predationon sea otters: linking oceanic and nearshore ecosystems. Science 282: 473–476.
Fancett, M. S. and G. P. Jenkins. 1988. Predatory impact of scyphomedusae on ichthy-oplankton and other zooplankton in Port Phillip Bay. J. Exp. Mar. Biol. Ecol. 116:63–77.
Finney, B. P., I. Gregory-Eaves, M. S. V. Douglas, and J. P. Smol. 2002. Fisheries produc-tivity in the northeastern Pacific Ocean over the past 2,200 years. Nature 416: 729–733.
Fiscus, C. H. 1961. Growth in the Steller sea lion. J. Mammol. 47: 195–200.Fiscus, C. H. and G.A. Baines. 1966. Food and feeding behavior of Steller and California
sea lions. J. Mammol. 47: 195–200.Fowler, C. W. 1987. Marine debris and northern fur seals: a case study. Mar. Poll. Bull.
18: 326–335.Francis, R. C. and S. R. Hare. 1994. Decadal-scale regime shifts in the large marine
ecosystems of the North-east Pacific: a case for historical science. Fish. Oceanogr. 3/4:279–291.
Francis, R. C. and T. H. Sibley. 1991. Climate change and fisheries: what are the realissues? Northwest Environ. J. 7: 295–307.
Francis, R. C., S. R. Hare, A. B. Hollowed, and W. S. Wooster. 1998. Effects of interdecadalclimate variability on the oceanic ecosystems of the NE Pacific. Fish. Oceanogr. 7: 1–21.
Francis, R.C., L.G. Anderson, W.D. Bowen, S.K. Davis, J.M. Grebmeier, L.F. Lowry, I. Merculieff, N.S. Mirovitskaya, C.H. Peterson, C. Pungowiyi, T.G. Royer, A.M. Springer, and W.S. Wooster. 1996. The Bering Sea Ecosystem. Washington D.C.,The National Academies Press, 307 pp.
Freeland, H. 2002. The Heat Flux across Line P 1996–1999. Atmosphere–Ocean 40:81–89.
Freeland, H. and F. Whitney. 2000. Climate Changes: Gulf of Alaska. In: C. Sheppard (Ed.),Seas at the Millennium: An Environmental Evaluation. Elsevier Science Ltd., pp. 179–186.
Freeland, H., K. Denman, C. S. Wong, F. Whitney, and R. Jacobs. 1997. Evidence ofchange in the winter mixed layer depth in the Northeast Pacific Ocean. Deep-Sea Res.44: 2117–2129.
Fritz, L.W. and S. Hinckley. 2005. A critical review of the regime shift—”junk food”—hypothesis for the decline of the western stock of Steller sea lion. Mar. Mam. Sci. 21:476–518.
Frost, B. W. 1983. Interannual variation of zooplankton standing stock in the open Gulf ofAlaska. In: W. S. Wooster (Ed.), From Year to Year. Interannual Variability of theEnvironment and Fisheries of the Gulf of Alaska and the Eastern Bering Sea.Washington Sea Grant Program. University of Washington, Seattle, pp. 146–157.
Frost, K. J., L. F. Lowry, and J. M. Ver Hoef. 1999. Monitoring the trend of harbor sealsin Prince William Sound, Alaska, after the Exxon Valdez oil spill. Mar. Mam. Sci. 15:494–506.
Frost, K. J., L. F. Lowry, E. H. Sinclair, and J. M. Ver Hoef. 1994. Impacts on distribution,abundance, and productivity of harbor seals. In: T. R. Loughlin (Ed.), Marine mammalsand the Exxon Valdez. San Diego, CA, Academic Press, pp. 97–118.
Long-term Change 395
Ch04-N52960 8/22/06 11:15 AM Page 395
Fu, C., and T. J. Quinn, II. 2000. Estimability of natural mortality and other populationparameters in a length-based model: Pandalus borealis in Kachemak Bay, Alaska. Can.J. Fish. Aquat. Sci. 57: 2420–2432.
Fu, C., T. J. Quinn, II, and G. H. Kruse. 2000. Analyses of harvest strategies for pandalidshrimp populations. J. Northwest Atlantic Fish. Sci. 27: 247–260.
Fu, C., T. J. Quinn, II, and M. D. Adkison. 1999. Retrospective projection using MonteCarlo simulation: an application of a length-based model to Kachemak Bay pinkshrimp. In: Proceedings of the international symposium on the role of forage fishes inmarine ecosystems. Alaska Sea Grant College Program Report 97-01, University ofAlaska Fairbanks, pp. 59–77.
Fulton, J. 1983. Seasonal and annual variations of net zooplankton at Ocean Station “P”,1956–1980. Can. Data Rep. Fish. Aquat. Sci. 374.
Funk, F. and M. Harris. 1992. Preliminary forecasts of catch and stock abundance for 1992Alaska herring fisheries. Alaska Dept. Fish and Game, Division of CommercialFisheries, Information Report No. 5J92-04. Juneau, Alaska.
Furness, R. W. and C. J. Camphuysen. 1997. Seabirds as monitors of the marine environ-ment. ICES J. Mar. Sci. 54: 726–737.
Gargett, A. 1997. The optimum stability ‘window’: a mechanism underlying decadal fluc-tuations in North Pacific salmon stocks? Fish. Oceanogr. 6: 109–117.
Garshelis, D. L., J. A. Garshelis, and A. T. Kimker. 1986. Sea otter time budgets and preyrelationships in Alaska. J Wildlife Manage. 50: 637–647.
Gaudet, D. M. 1984. Prince William Sound herring survey, 1982. Alaska Department ofFish and Game, Prince William Sound Technical Data Report No. 1984-2.
Gharrett, A. J., A. K. Gray, and J. Heifetz. 2001. Identification of rockfish (Sebastes spp.)from restriction sites analysis of the mitochondrial NM-3/ND-4 and 12S/16S rRNAgene regions. Fish. Bull. 99: 49–62.
Gill, V. A. 1999. Breeding performance of black-legged kittiwakes (Rissa tridactyla) inrelation to food availability: a controlled feeding experiment. M.S. Thesis, University ofAlaska, Anchorage.
Goes, J. I., H. R. Gomes, A. Limsakul, W. M. Balch, and T. Saino, 2001: El Niño relatedinterannual variations in biological production in the North Pacific as evidenced bysatellite and ship data. Progr. Oceanogr., 49: 211–225.
Golet, G. H., D. B. Irons, and J. A. Estes. 1998. Survival costs of chick rearing in black-legged kittiwakes. J.Anim. Ecol. 67: 827–841.
Golet, G. H., J. A. Schmutz, D. B. Irons, and J. A. Estes. 2004. Determinants of reproduc-tive costs in the long-lived black-legged kittiwake: a multiyear experiment. Ecol.Monogr. 74: 353–372.
Golet, G. H., P. E. Seiser, A. D. McGuire, D. D. Roby, J. B. Fisher, K. J. Kuletz, D. B. Irons, T. A. Dean, S. C. Jewett, and S. H. Newman. 2002. Long-term direct andindirect effects of the ‘Exxon Valdez’ oil spill on pigeon guillemots in Prince WilliamSound, Alaska. Mar. Ecol. Progr. Ser. 241: 287–304.
Gorbics, C. S. and J. L. Bodkin. 2001. Stock structure of sea otters (Enhydra lutris keny-oni) in Alaska. Mar. Mam. Sci. 17:632–647.
Grant, W. S., C. I. Zhang, and T. Kobayashi. 1987. Lack of genetic stock discretion inPacific cod (Gadus macrocephalus). Can. J. Fish. Aquat. Sci. 44: 490–498.
Greene, D. H. and J. K. Babbitt. 1990. Control of muscle softening and protease-parasiteinteractions in arrowtooth flounder, Atheresthes stomias. J. Food Sci. 55: 579–580.
396 Long-Term Ecological Change in the Northern Gulf of Alaska
Ch04-N52960 8/22/06 11:15 AM Page 396
Grice, G. D. and N. J. Wilmovsky. 1957. Herring spawning surveys of Alaska with partic-ular reference to Southeast Alaska. Department of Interior, Bureau of CommercialFisheries, Alaska Region, Marine Fisheries Investigations, Operation Report-1957.
Hamer, K. C., P. Monaghan, J. D. Uttley, P. Walton, and M. D. Burns. 1993. The influence offood supply on the breeding ecology of kittiwakes Rissa tridactyla in Shetland. Ibis 135.
Hanselman, D., J. Heifetz, J. T. Fujioka, and J. N. Ianelli. 2003. Gulf of Alaska Pacificocean perch. In: Stock Assessment and Fishery Evaluation Report for the GroundfishResources of the Gulf of Alaska. Compiled by the Plan Team for the GroundfishFisheries of the Gulf of Alaska, North Pacific Fishery Management Council, 605 W. 4thAvenue, Suite 306, Anchorage, AK 99501.
Harding, A. A., T. van Pelt, J. F. Piatt, and A. S. Kitaysky. 2002. Reduction of provision-ing effort in response to experimental manipulation of chick nutritional status in thehorned puffin Fratercula corniculata. Condor 104: 842–847.
Harding, A. M. 2001. The breeding ecology of horned puffins Fratercula corniculata.M.Sc. Thesis, University of Durham, England. 74 pp.
Harding, A. M. A, J. F. Piatt, and K. C. Hamer. 2003. Breeding ecology of horned puffins(Fratercula corniculata) in Alaska: Annual variation and effects of El Niño. Can. J. Zool.81: 1004–1013.
Hare, S. R. and R. C. Francis. 1995. Climate change and salmon production in the north-east Pacific Ocean. In: R. J. Beamish (Ed.), Climate Change and Northern FishPopulations. Can. Spec. Publ. Fish. Aquat. Sci. 121: 357–372.
Hare, S. R., and Mantua, N. J. 2000. Empirical evidence for North Pacific regime shifts in1977 and 1989. Progr. Oceanogr. 47(2–4): 103–146.
Hare, S. R., N. J. Mantua, and R. C. Francis. 1999. Inverse production regimes: Alaskanand West Coast Pacific salmon. Fisheries 24: 6–14.
Harris, M. P. and S. Wanless. 1988. The breeding biology of guillemots Uria aalge on theIsle of May over a six year period. Ibis 130: 172–192.
Harris, M. P. and S. Wanless. 1990. Breeding success of British kittiwakes Rissa tridactylain 1986-1988: Evidence for changing conditions in the northern North Sea. J. Appl. Ecol.27: 172–187.
Hassell, M. P., J. H. Lawton, and J. R. Beddington. 1977. Sigmoid functional responsesby invertebrate predators and parasitoids. J. Anim. Ecol. 46: 249–262.
Hatch, S. A. 1983. The fledging of common and thick-billed murres on Middleton Island,Alaska. J. Field Ornith. 54: 266–274.
Hatch, S. A. 1987. Did the 1982–83 El Niño-Southern Oscillation affect seabirds inAlaska? Wilson Bulletin 99: 468–474.
Hatch, S. A. and M. A. Hatch. 1988. Colony attendance and population monitoring ofblack-legged kittiwakes on the Semidi Islands, Alaska. Condor 90: 613–620.
Hatch, S. A. and M. A. Hatch. 1989. Attendance patterns of murres at breeding sites:implications for monitoring. J. Wildlife Manag. 53: 483–493.
Hatch, S. A., and J. F. Piatt. 1995. Seabirds in Alaska, pp. 49–52. In: E. T. LaRoe, G. S. Farris, C. E. Puckett, P. D. Doran, and M. J. Mac (Eds.), Our living resources: A report to the nation on the distribution, abundance, and health or U.S. plants, ani-mals, and ecosystems. U.S. Department of the Interior, National Biological Service,Washington, DC., 530 pp.
Hatch, S. A., G. V. Byrd, D. B. Irons, and G. L. Hunt. 1993. Status and ecology ofkittiwakes (Rissa tridactyla and R. brevirostris) in the North Pacific. In: K. Vermeer,
Long-term Change 397
Ch04-N52960 8/22/06 11:15 AM Page 397
K. T. Briggs, K. H. Morgan, and D. Siegel-Causey (Eds), The Status, Ecology, andConservation of Marine Birds of the North Pacific. Special Publication, CanadianWildlife Service, Ottawa, pp. 140–153.
Hatch, S.A. 2003. Statistical power for detecting trends with applications to seabirdmonitoring. Biol. Conserv. 111: 317–329.
Hatchwell, B. J. and T. R. Birkhead. 1991. Population dynamics of common guillemotsUria aalge on Skomer Island, Wales. Ornis Scandinavica 22: 55–59.
Hay, D. E. 1985. Reproductive biology of Pacific herring (Clupea harengus pallasi). Can. J.Fish. Aquat. Sci. 42: 111–124.
Hay, D. E. and A. R. Kronlund. 1987. Factors affecting the distribution, abundance, andmeasurement of Pacific herring (Clupea harengus pallasi) spawn. Can. J. Fish. Aquat.Sci. 44: 1181–1194.
Hedgren, S. 1980. Reproductive success of guillemots Uria aalge on the island of StoraKarlso. Ornis Fennica 57: 49–57.
Heise, K. A., L. G. Barrett-Leonard, E. L. Saulitis, C. O. Matkin, and D. Bain. 2003.Examining the evidence for killer whale predation on Steller sea lions in BritishColumbia and Alaska. Aquat. Mam. 29: 325–334.
Helle, J. H. and M. S. Hoffman. 1995. Size decline and older age at maturity of two chum salmon (Oncorhynchus kewta) socks in western North America, 1972–92. In: R. J. Beamish (Ed.), Climate Change and Northern Fish Populations. Can. Spec.Publ. Fish. Aquat. Sci. 121: 245–260.
Hermann, A. J., D. B. Haidvogel, E. L. Dobbins, and P. J. Stabeno. 2002. Coupling globaland regional circulation models in the coastal Gulf of Alaska, Prog. Oceanogr. 53:335–367.
Hilborn, R. and D. Eggers. 2000. A review of hatchery programs for pink salmon in PrinceWilliam Sound and Kodiak Island, Alaska. Trans. Amer. Fish. Soc. 129: 333–350.
Holling, C. S. 1959. The components of predation as revealed by a study of small mammalpredation of the European pine sawfly. Can. Entomol. 91: 293–320.
Hollowed, A. B. and W. S. Wooster. 1992. Variability of winter ocean conditions and strongyear classes of Northeast Pacific groundfish. ICES Mar. Sci. Symp. 195: 433–444.
Hollowed, A. B. and W. S. Wooster. 1995. Decadal-scale variations in the eastern subarc-tic Pacific: II. Response of northeast Pacific fish stocks. Can. Spec. Pub. Fish. Aquat.Sci. 121: 373–385.
Hollowed, A. B., S. R. Hare, and W. S. Wooster. 1998. Pacific basin Climate variabilityand patterns of northeast Pacific marine fish production, In: (G. Holloway, P. Muller,and D. Henderson, Eds.), Proceedings on the 10th ‘Aha Huliko’a Hawaiian WinterWorkshop on Biotic Impacts of Extratropical Climate Variability in the Pacific. U.S. Department of Commerce, National Oceanic and Atmospheric Administration,NOEST Special Publication Award No. A67RJ0154. pp. 89–104.
Hollowed, A. B., S. R. Hare, and W. S. Wooster. 2001. Pacific Basin climate variabilityand patterns of Northeast Pacific marine fish production. Prog. Oceanogr. 49: 257–282.
Hoover, A. A. 1988. Steller sea lion, In: J.A. Lentfer (Ed.), Selected Marine Mammals ofAlaska. Washington, D.C., Mar. Mammal Comm. pp. 159–193.
Hoover-Miller, A., K. R. Parker, and J. J. Burns. 2001. A reassessment of the impact of theExxon Valdez oil spill on harbor seals (Phoca vitulina Richardsi) in Prince WilliamSound, Alaska. Mar. Mam. Sci. 17: 111–135.
Houde, E. D., and C. E. Zastrow. 1993. Ecosystem-specific and taxon-specific dynamicand energetics properties of larval fish assemblages. Bull. Mar. Sci. 53: 290–335.
398 Long-Term Ecological Change in the Northern Gulf of Alaska
Ch04-N52960 8/22/06 11:15 AM Page 398
Hourston, A. S and C. W. Haegele. 1980. Herring on Canada’s Pacific coast. Dept.Fisheries and Oceans, Ottawa, Can. Spec. Pub. Fish. Aquat. Sci. 48. 23 pp.
Hudson, P. J. 1985. Population parameters for the Atlantic Alcidae. In: D. N. Nettleshipand T. R. Birkhead (Eds.), The Atlantic Alcidae. Academic Press. New York, pp. 233–261.
Hunt, G. L., Jr., P. Stabeno, G. Walters, E. Sinclair, R. D. Brodeur, J. M. Napp, and N. A. Bond. 2002. Climate change and control of the southeastern Bering Sea pelagicecosystem. Deep-Sea Res. II 49: 5821–5853.
Hunt, H. D. 1996. Normal Mode Analysis of Dynamic Height in the Gulf of Alaska,1968–1990. MS thesis, University of Alaska, 66 pp.
Imler, R. H. and H. R. Sarber. 1947. Harbor seals and sea lions in Alaska, U.S. Fish andWildlife Service, Spec. Sci. Rep. No. 28, 28 pp.
Interagency Task Group. 1978. Final environmental impact statement. Consideration of awaiver of the moratorium and return of management of certain marine mammals to theState of Alaska. National Marine Fisheries Service and U.S. Fish and Wildlife Service,Washington, DC.
IPCC, 2001. J. T. Houghton, Y. Ding, D. J. Griggs, M. Noguer, P. J. van der Linden, X. Dai, K. Maskell, and C. A. Johnson (Eds.), Climate Change 2001: The ScientificBasis, Contribution of Working Group I to the Third Assessment Report of theIntergovernmental Panel on Climate Change, Cambridge University Press, Cambridge,United Kingdom and New York, NY, U.S.A, 881 pp.
Iverson, S. J., K. J. Frost, and S. L. C. Lang. 2003. High body energy stores and conditionare linked with diet diversity in juvenile harbor seals in Prince William Sound (PWS),Alaska: new insights from quantitative fatty acid signature analysis (QFASA). 15thBiennial Conference on the Biology of Marine Mammals, Greensboro, NC.
Jameson, R. J., K. W. Kenyon, A. M. Johnson, and H. M. Wight. 1982. History and statusof translocated sea otter populations in North America. Wildlife Soc. Bull. 10: 100–107.
Jemison, L. A. and B. P. Kelly. 2001. Pupping phenology and demography of harbor seals(Phoca vitulina richardsi) on Tugidak Island, Alaska. Mar. Mam. Sci. 17: 585–600.
Jemison, L. A., G. W. Pendleton, C. A. Wilson, and R. J. Small. 2006. Long-term trends inharbor seal numbers at Tugidak Island and Nanvak Bay, Alaska. Mar. Mam. Sci. 22: 1–22.
Karl, T. R. 1988. Multi-year fluctuations of temperature and precipitation: the gray areasof climate change. Clim. Change 12: 179–197.
Kelly, K. A., M. J. Caruso, and J. A. Austin. 1993. Wind-forced variations in sea surfaceheight in the Northeast Pacific Ocean, J. Phys. Oceanogr. 23: 2392–2411.
Kenyon, K.W. 1969. The sea otter in the eastern Pacific Ocean. North American Fauna68. 352 pp.
Kihara, K., and A. M. Shimada. 1988. Prey-predator interactions of Pacific cod Gadusmacrocephalus and water temperature. Nippon Suisan Gakkaishi, Japanese Soc. Sci.Fish, Bull. 54: 2085–2088.
Kitaysky, A. S., J. C. Wingfield, and J. F. Piatt. 1998. Dynamics of food availability, bodycondition and physiological stress response in breeding black-legged kittiwakes.Functional Ecol. 13: 577–584.
Kitaysky, A. S., J. F. Piatt, J. C. Wingfield, and M. Romano. 1999. The adrenocorticalstress-response of black-legged kittiwake chicks in relation to dietary restrictions. J. Comp. Physiol. (B): 303–310.
Kitaysky, A., J. Wingfield, and J. Piatt. 2001. Corticosterone facilitates begging andaffects resource allocation in the black-legged kittiwake. Behav. Ecol. 12: 619–625.
Long-term Change 399
Ch04-N52960 8/22/06 11:15 AM Page 399
Kitaysky, A.S., M.D. Romano, J.F. Piatt, J.C. Wingfield, M. Kikuchi. 2005. The adreno-cortical response of tufted puffin chicks to nutritional deficits. Horm. Behav. 47:606–619.
Klosiewski, S. P. and K. K. Lang. 1994. Marine bird populations of Prince William Sound,Alaska, before and after the Exxon Valdez oil spill. U.S. Fish and Wildlife Service,Anchorage, AK.
Koeller, P. A. 2000. Relative importance of abiotic and biotic factors to the managementof the northern shrimp (Pandalus borealis) fishery on the Scotian Shelf. J. NorthwestAtlantic Fish. Sci. 27: 21–33.
Koslow, A. J. 1984. Recruitment patterns in Northwest Atlantic fish stocks. Can. J. Fish.Aquat. Sci. 41: 1722–1729.
Kramer, D. E. and V. M. O’Connell. 1995. Guide to northeast Pacific rockfishes. GeneraSebastes and Sebastolobus. Alaska Sea Grant Program, Marine Advisory Bulletin No.25.
Kruse, G. H. 1993. Biological perspectives on crab management in Alaska. In: G. H. Kruse, D. M. Eggers, R. J. Marasco, C. Pautzke, and T. J. Quinn II (Eds.),Proceedings of the International Symposium on Management Strategies for ExploitedFish Populations, University of Alaska Sea Grant College Program Report 93-02,Fairbanks, pp. 355–384.
Kruse, G. H., and J. Zheng. 1999. Are changes in Bering Sea crab and groundfish popu-lations related?. In: Ecosystem approaches for fisheries management. University ofAlaska Sea Grant Report 99-01, Fairbanks, pp. 143–148.
Kruse, G. H., F. C. Funk, and J. Zheng. 1996. Were Alaskan red king crabs overfished? In: Proceedings of the international symposium on biology, management, and econom-ics of crabs from high latitude habitats. University of Alaska Fairbanks, Alaska SeaGrant Report 96-02, pp. 295–299.
Kruse, G. H., F. C. Funk, H. J. Geiger, K. R. Mabry, H. M. Savikko, and S. M. Siddeek.2000. Overview of state-managed marine fisheries in the central and western Gulf ofAlaska, Aleutian Islands, and southeastern Bering Sea, with reference to Steller sealions. Alaska Department of Fish and Game, Division of Commercial Fisheries,Regional Information Report 5J00-10, Juneau.
Kuletz, K. J. 2005. Foraging behaviour and productivity of a non-colonial seabird, themarbled murrelet (Brachyramphus marmoratus) relative to prey and habitat. Ph.D.Dissertation. University of Victoria, Victoria, British Columbia.
Kuletz, K. J., D. B. Irons, B. A. Agler, J. F. Piatt, and D. C. Duffy. 1997. Long-termchanges in diets and populations of piscivorous birds and mammals in Prince WilliamSound, Alaska. In Forage fishes in marine ecosystems. Alaska Sea Grant CollegeProgram Fairbanks, AK, AK-SG-97–01, pp. 703–706.
Kuletz, K. J., S. W. Stephensen, D. B. Irons, E. A. Labunski, and K. M. Brenneman. 2003.Changes in distribution and abundance of Kittlitz’s murrelets Brachyramphus brevi-rostris relative to glacial recession in Prince William Sound, Alaska. Mar. Ornith. 31:133–140.
Lagerloef, G. S. E. 1995. Interdecadal variations in the Alaska Gyre, J. Phys. Oceanogr.25: 2242–2258.
Lang, G. M., C. W. Derrah, and P. A. Livingston. 2003. Groundfish food habits and pre-dation on commercially important prey species in the eastern Bering Sea from 1993through 1996. National Marine Fisheries Service, AFSC Processed Report 2003–04,Seattle, WA.
400 Long-Term Ecological Change in the Northern Gulf of Alaska
Ch04-N52960 8/22/06 11:15 AM Page 400
Lasker, R. 1985. What limits clupeiod production. Can. J. Fish. Aquat. Sci. 42: 31–37.Le Boeuf, B. J. and D. C. Crocker. 2005. Ocean climate and seal condition. BMC Biol. 3:
1–10.Leaman, B. M. 1991. Reproductive styles and life history variables relative to exploitation
and management of Sebastes stocks. Environ. Biol. Fishes 30: 225–243.Lensink, C.J. 1960. Status and distribution of sea otters in Alaska. J. Mammol.
41:172–182.Lethcoe, J. and N. Lethcoe. 1994. A History of Prince William Sound, Alaska. Prince
William Sound Books, Valdez, Alaska. 275 pp.Lewis, J. P., G. W. Pendleton, K. W. Pitcher, and K. M. Wynne. 1996. Harbor seal popu-
lation trends in southeast Alaska and the Gulf of Alaska. Douglas, AK, AlaskaDepartment of Fish and Game.
Lilly, G. R., D. G. Parsons, and D. W. Kulka. 2000. Was the increase in shrimp biomasson the Northeast Newfoundland Shelf a consequence of a release in predation pressurefrom cod? J. Northwest Atlantic Fish. Sci. 27: 45–61.
Litzow, M. A. 2000. Food limitation in a generalist seabird: reproductive consequences of food quality and prey switching in the Pigeon Guillemot (Cepphus columba). M.Sc. Thesis, University of California, Santa Cruz, CA. 36 pp.
Litzow, M. A. and J. F. Piatt. 2003. Variance in prey abundance influences time budgets ofbreeding seabirds: evidence from pigeon guillemots. J. Avian. Biol. 34: 54–64.
Litzow, M. A., J. F. Piatt, A. A. Abookire, A. K. Prichard, and M. D. Robards. 2000.Monitoring temporal and spatial variability in sandeel (Ammodytes hexapterus) abun-dance with pigeon guillemot (Cepphus columba) diets. ICES J. Mar. Sci. 57: 976–986.
Litzow, M. A., J. F. Piatt, A. A. Abookire, and M. Robards. 2004a. Energy density andvariability in abundance of pigeon guillemot prey: support for the quality-variabilitytradeoff hypothesis. J. Animal Ecol. 73: 1149–1156.
Litzow, M. A., J. F. Piatt, A. A. Abookire, S. G. Speckman, M. L. Arimitsu, and J. D. Figurski. 2004b. Spatiotemporal predictability of schooling and non-schoolingprey of Pigeon Guillemots. Condor 106: 410–414.
Livingston, P. (Ed.). 2003. Ecosystem Considerations for 2003. Reviewed by the PlanTeam for the Groundfish Fisheries of the Bering Sea, Aleutian Islands, and Gulf ofAlaska, North Pacific Fishery Management Council, 605 W. 4th Avenue, Suite 306,Anchorage, AK 99501.
Livingston, P. A. 1989. Interannual trends in Pacific cod, Gadus macrocephalus, predationon three commercially important crab species in the eastern Bering Sea. Fish. Bull. 87:807–827.
Loughlin, T. R. and A. E. York. 2000. An account of the sources of Steller sea lion(Eumetopias jubatus) mortality. Mar. Fish. Rev. 62: 40–45.
Lucas, Z. and W. T. Stobo. 2000. Shark-inflicted mortality on a population of harbor seals(Phoca vitulina) as Sable Island, Nova Scotia. J. Zool., London 252: 405–414.
MacFarlane, G. A., J. R. King, and R. J. Beamish. 2000. Have there been recent changesin climate? Ask the fish. Prog. Oceanog. 47: 147–169.
Mackas, D. L. and A. Tsuda. 1999. Mesozooplankton in the eastern and western subarc-tic Pacific: community structure, seasonal life histories, and interannual variability.Prog. Oceanogr. 43: 335–363.
Mackas, D. L., R. Goldblatt, and A. G. Lewis. 1998. Interdecadal variation in develop-mental timing of Neocalanus plumchrus populations at Ocean Station P in the subarcticNorth Pacific. Can. J. Fish. Aquat. Sci. 55: 1878–1893.
Long-term Change 401
Ch04-N52960 8/22/06 11:15 AM Page 401
402 Long-Term Ecological Change in the Northern Gulf of Alaska
Mantua, N. J., S. R. Hare, Y. Zhang, J. M. Wallace, and R. C. Francis. 1997. A Pacificinterdecadal climate oscillation with impacts on salmon production. Bull. Amer. Meteor.Soc. 78: 1069–1079.
Martin, M. H. 1997. Data report: 1996 Gulf of Alaska bottom trawl survey. U.S. Dep.Commer., NOAA Tech. Memo. NMFS-AFSC-82, 235 pp.
Marty, G. D., E. F. Freiberg, T. R. Meyers, J. Wilcock, T. B. Farver, and D. E. Hinton.1998. Viral hemorrhagic septicemia virus, Ichthyophonus hoferi, and other causes ofmorbidity in Pacific herring (Clupea pallasi) in Prince William Sound, Alaska, U.S.A.Dis. Aquat. Org. 32: 15–40.
Marty, G. D., T. J. Quinn II, G. Carpenter, T. R. Meyers, and N. H. Willits. 2003. Role ofdisease in abundance of a Pacific herring (Clupea pallasi) population. Can. J. Fish.Aquat. Sci. 60: 1258–1265.
Matarese, A. C., D. M. Blood, S. J. Picquelle, and J. L. Benson. 2003. Atlas of abundanceand distribution patterns of ichthyoplankton from the northeast Pacific Ocean andBering Sea ecosystems based on research conducted by the Alaska Fisheries ScienceCenter (1972–1996). U.S. Department of Commerce, NOAA Professional Paper NMFS1, 281 pp.
Mathews, E. A. and G. W. Pendleton. 1997. Estimation of trends in abundance of harborseals from at terrestrial and glacial haulouts in Glacier Bay National Park, SoutheastAlaska. In Harbor seal investigations in Alaska. Anchorage, AK, Alaska Department ofFish and Game, pp. 57–76.
Mathews, E. A. and G. W. Pendleton. 2000. Declining trends in harbor seal (Phoca vit-ulina richardsi) numbers at glacial ice and terrestrial haulouts in Glacier Bay NationalPark, 1992–1998. Juneau, AK, University of Alaska Southeast. 24 pp.
Mathisen, O. A., R. T. Baade, and R.J. Lopp. 1962. Breeding habits, growth and stomachcontents of the Steller sea lion in Alaska. J. Mammol. 43: 469–477.
McMullen, J. C. 1968. Investigation of king crab ocean reproduction and brood stockcomposition, Kodiak Island. Alaska Department of Fish and Game, InformationalLeaflet 126, Kodiak.
McMullen, J. C., and H. T. Yoshihara. 1969. Fate of unfertilized eggs in king crabs,Paralithodes camtschatica (Tilesius). J. Fish. Res. Board Can. 26: 2737–2740.
Megrey, B. A. 1989. Exploitation of walleye pollock resources in the Gulf of Alaska,1964–1988: portrait of a fishery in transition. Proceedings of the InternationalSymposium on the Biology and Management of Walleye Pollock, Lowell WakefieldFisheries Symp., Alaska Sea Grant Rep. 89–1, 33–58.
Merrick, R. I., D. G. Brown, D. C. Calkins, and T. R. Loughlin. 1995. A comparison ofSteller sea lion, Eumetopias jubatus, pup masses between rookeries with increasing anddecreasing populations. Fish. Bull. 93: 753–758.
Merrick, R. L. and D. G. Calkins. 1996. Importance of juvenile walleye pollock, Theragrachalcogramma, in the diet of Gulf of Alaska Steller sea lions, Eumetopias jubatus. U.S.Dep. Comm. NOAA Tech. Rep., NMFS 126: 153–166.
Merrick, R. L., M. K. Chumbley, and G. V. Byrd. 1997. Diet diversity of Steller sea lions(Eumetopias jubatus) and their population decline in Alaska: a potential relationship.Can. J. of Fish. Aquat. Sci. 54: 1342–1348.
Merrick, R. L., T. R. Loughlin, and D. G. Calkins. 1987. Decline in abundance of thenorthern sea lion, Eumetopias jubatus, in Alaska, 1956–86. Fish. Bull. 85: 351–365.
Milette, L. L. and A. W. Trites. 2003. Maternal attendance patterns of lactating Steller sealions (Eumetopias jubatus) from a stable and a declining population in Alaska. CanadianJ. Zool. 81: 340–348.
Ch04-N52960 8/22/06 11:15 AM Page 402
Miller, C. B., J. Fulton, and B. W. Frost. 1992. Size variation of Neocalanus plumchrusand Neocalanus flemingeri in a 20-year sample series from the Gulf of Alaska. Can. J.Fish. Aquat. Sci. 49: 389–399.
Minobe, S. 1997. A 50–70 year oscillation over the North Pacific and North America.Geophys. Res. Letters 24: 683–686.
Monaghan, P., P. Walton, S. Wanless, J. D. Uttley, and M. D. Burns. 1994. Effects of preyabundance on the foraging behaviour, diving efficiency and time allocation of breedingGuillemots Uria aalge. Ibis 136: 214–222.
Monson, D. H., J. A. Estes, J. L. Bodkin, and D. B. Siniff. 2000. Life history plasticity andpopulation regulation in sea otters. Oikos 90: 457–468.
Mueter, F. J. and B. L. Norcross. 2000. Changes in species composition of the demersalfish community in nearshore waters of Kodiak Island, Alaska. Can. J. Fish. Aquat. Sci.57: 1169–1180.
Mueter, F. J., R. M. Peterman, and B. J. Pyper. 2002. Opposite effects of ocean tempera-ture on survival rates of 120 stocks of Pacific salmon (Oncorhynchus spp.) in northernand southern areas. Can. J. Fish. Aquat. Sci., 59: 456–463.
Murdoch, W. W. and A. Oaten. 1975. Predation and population stability. Adv. Ecol. Res.9: 1–125.
Murphy, E. C., M. I. Springer, D. G. Roseneau, and A. M. Springer. 1980. Monitoringpopulation numbers and productivity of colonial seabirds. MMS/NOAA OCSEAPAnnual Report 1: 142–272.
Murray, C. P., S. L. Morey, and J. J. O’Brien. 2001. Interannual variability of upper oceanvorticity balances in the Gulf of Alaska. J. Geophys. Res. 106: 4479–4491.
Nunes, P., and T. Nishiyama. 1984. Effects of temperature on the embryonic developmentof the northern pink shrimp Pandalus borealis Krøyer. J. Shellfish Res. 4: 96–97.
Nysewander, D. R. and J. L. Trapp. 1984. Widespread mortality of adult seabirds inAlaska, August–September 1983, U.S. Fish and Wildlife Service, Anchorage, Alaska.
Nysewander, D., C. H. Dipple, G. V. Byrd, and E. P. Knudtson. 1993. Effects of the T/VExxon Valdez oil spill on murres: A perspective from observations at colonies. NRDABird Study No. 3 Final Rep., U.S. U.S. Fish and Wildlife Service, Homer AK. 40 pp.
Oakley, K. L. and K. J. Kuletz. 1996. Population, reproduction, and foraging of pigeonguillemots at Naked Island, Alaska, before and after the Exxon Valdez oil spill. In: Rice,S. D., R. B. Spies, D. A. Wolfe, and B. A. Wright (Eds.), Proceedings of the ExxonValdez Oil Spill Symposium American Fisheries Society Symposium 18. AmericanFisheries Society, Bethesda, Maryland, pp. 759–769.
Olesiuk, P. F. 1999. An assessment of the status of harbor seals (Phoca vitulina) in BritishColumbia. Nanaimo, B.C., Canada, Department of Fisheries and Oceans, ResearchDocument 99/33.
Olesiuk, P. F. 2003. Recent trends in the abundance of Steller sea lions (Eumetopias juba-tus) in British Columbia. Nanaimo, B.C., Canada, Department of Fisheries and Oceans,Working Paper 2003–11.
Olesiuk, P. F., M. A. Bigg, and G. M. Ellis. 1990. Recent trends in the abundance of har-bour seals, Phoca vitulina, in British Columbia. Can. J. Fish. Aquat. Sci. 47: 992–1003.
Olsen, J. 1994. Development of the pink salmon enhancement program in Prince WilliamSound, Alaska. Proc. 16th Pink and Chum Salmon Workshop. Alaska Sea Grant CollegeProgram Rep. 94–02, Fairbanks, Alaska, pp. 57–68.
Orensanz, J. M., J. Armstrong, D. Armstrong, and R. Hilborn. 1998. Crustacean resourcesare vulnerable to serial depletion – the multifaceted decline of crab and shrimp fisheriesin the greater Gulf of Alaska. Rev. Fish . Biol. 8: 117–176.
Long-term Change 403
Ch04-N52960 8/22/06 11:15 AM Page 403
Ottesen, O. H. and S. Bolla. 1998. Combined effects of temperature and salinity on devel-opment and survival of Atlantic halibut larvae. Aquacult. Int. 6: 103–120.
Paine, R. T., D. W. Bromley, M. A. Castellini, L. B. Crowder, J. A. Estes, J. M. Grebmeier,F. M. D. Gulland, G. H. Kruse, N. J. Mantua, Two Crow, D. B. Siniff, and C. J. Walters.2003. Decline of the Steller sea lion in Alaskan waters. Washington, DC, The NationalAcademies Press. 204 pp.
Parslow, T. R. 1981. Phytoplankton-zooplankton interactions: Data analysis and modeling(with particular reference to Ocean Station P [50°N, 145°W] and controlled ecosystemexperiments). Ph.D. Dissertation, University of British Columbia, 400 pp.
Parsons, T. R. 1988. Trophodynamic phasing in theoretical experimental and naturalpelagic ecosystems. J. Oceanogr. Soc. Japan. 44: 94–101.
Pascual, M. A. and M. D. Adkison. 1994. The decline of the Steller sea lion in the north-east Pacific: demography, harvest or environment? Ecol. Appl. 4: 393–403.
Paul, A. J., and J. M. Paul. 1980. The effect of early starvation on later feeding success ofking crab zoea. J. Exper. Mar. Biol. Ecol. 44: 247–251.
Paul, A. J., J. M. Paul, and K. O. Coyle. 1990. Growth of stage I king crab larvae of Paralithodes camtschatica (Tilesius) (Decapoda: Lithodidae) in natural communities.J. Crustacean Biol. 10: 175–183.
Philips, R. A., Caldow, R. W. G., and Furness, R. W. 1996. The influence of food avail-ability on the breeding effort and reproductive success of Arctic Skuas Stercorarius par-asiticus. Ibis 138: 410–419.
Piatt, J. F (Ed.), 2002a. Response of seabirds to fluctuations in forage fish density. FinalReport to Exxon Valdez Oil Spill Trustee Council (Restoration Project 00163M) andMinerals Management Service (Alaska OCS Report 2002-068). Alaska Science Center,U.S. Geological Survey, Anchorage, Alaska. 454 pp.
Piatt, J. F. 1990. Aggregative response of Common Murres and Atlantic Puffins to theirprey. Studies in Avian Biol. 14: 36–51.
Piatt, J. F. 2002b. Introduction and Project Overview. In: J. F. Piatt (Ed.), Response ofseabirds to fluctuations in forage fish density. Final Report to Exxon Valdez Oil SpillTrustee Council (Restoration Project 01163M) and Mineral Management Service(Alaska OCS Study MMS 2002-068). Alaska Science Center, U.S. Geological Survey,Anchorage, Alaska, pp. 1–17.
Piatt, J. F. 2004. Survival of Adult Murres and Kittiwakes in Relation to Forage FishAbundance. Exxon Valdez Oil Spill Restoration Project Final Report (RestorationProject 00338), U.S. Geological Survey, Anchorage, Alaska.
Piatt, J. F. and A. S. Kitaysky 2002. Tufted puffin (Fratercula cirrhata). In: A. Pool and F. Gill (Eds.), The birds of North America, No. 708., The Birds of North America Inc.,Philadelphia, PA.
Piatt, J. F. and P. Anderson. 1996. Response of common murres to the Exxon Valdez oilspill and long-term changes in the Gulf of Alaska marine ecosystem, In: Rice, S. D., R. B. Spies, D. A. Wolfe, and B. A. Wright (Eds.), Proceedings of the ExxonValdez Oil Spill Symposium. American Fisheries Society Symposium 18. AmericanFisheries Society, Bethesda, Maryland, pp. 720–737.
Piatt, J. F. and R. G. Ford. 1993. Distribution and abundance of marbled murrelets inAlaska. Condor 95: 662–669.
Piatt, J. F. and R. G. Ford. 1996. How many seabirds were killed by the Exxon Valdez oilspill? In: Rice, S. D., R. B. Spies, D. A. Wolfe, and B. A. Wright (Eds.), Exxon ValdezOil Spill Symposium Proceedings. American Fisheries Society Symposium 18,Bethesda, Maryland, pp. 720–737.
404 Long-Term Ecological Change in the Northern Gulf of Alaska
Ch04-N52960 8/22/06 11:15 AM Page 404
Piatt, J. F. and T. Van Pelt. 1993. A wreck of common murres (Uria aalge) in the northernGulf of Alaska during February and March of 1993. U.S. Fish and Wildlife Service,Anchorage, AK.
Piatt, J. F. and T. Van Pelt. 1997. Mass-mortality of guillemots (Uria aalge) in the Gulf ofAlaska in 1993. Mar. Poll. Bull. 34: 656–662.
Piatt, J. F., C. J. Lensink, W. Butler, M. Kendziorek, and D. Nysewander. 1990. Immediateimpact of the Exxon Valdez oil spill on marine birds. Auk 107: 387–397.
Piatt, J. F., G. Drew, T. I. Van Pelt, A. Abookire, A. Nielsen, M. Shultz, and A. Kitaysky.1999. Biological effects of the 1997/1998 ENSO event in lower Cook Inlet, Alaska.PICES Scientific Report No. 10: 93–100.
Pitcher, K. 1980. Food of the harbor seal, Phoca vitulina richardsi, in the Gulf of Alaska.Fish. Bull. 78: 544–549.
Pitcher, K. W. 1981. Prey of the Steller sea lion, Eumetopias jubatus, in the Gulf ofAlaska. Fish. Bull. 79: 467–472.
Pitcher, K. W. 1990. Major decline in number of harbor seals, Phoca vitulina richardsi, onTugidak Island, Gulf of Alaska. Mar. Mam. Sci. 6: 121–134.
Pitcher, K. W., D. G. Calkins, and G. W. Pendleton. 1998. Reproductive performances offemale Steller sea lions from the Gulf of Alaska: an energetics-based reproductive strat-egy? Can. J. Zool. 76: 2075–2083.
Pitcher, K. W., D. G. Calkins, and G. W. Pendleton. 2000. Steller sea lion body conditionindices. Mar. Mam. Sci. 16: 427–436.
Planque, B., and T. Frédou. 1999. Temperature and the recruitment of Atlantic cod (Gadusmorhua). Can. J. Fish. Aquat. Sci 56: 2069–2077.
Polovina, J. J., G. T. Mitchum, and G. T. Evans. 1995. Decadal and basin-scale variationsin mixed layer depth and the impact on biological production in the Central and NorthPacific, 1960–88. Deep-Sea Res. 42: 1701–1716.
Porter, R. W., B. J. Kouri, and G. Kudo. 1993. Inhibition of protease activity in muscleextracts and surimi from Pacific whiting, Merluccius productus, and arrowtooth floun-der, Atherestes stomias, off Washington. Fish. Bull. 93: 127–138.
Poulin, R., and K. Rohde. 1997. Comparing the richness of metazoan ectoparasitecommunities of marine fishes: Controlling for host phylogeny. Oecologia. 110:278–283.
Powell, G. C., B. Shafford, and M. Jones. 1973. Reproductive biology of young adult kingcrabs Paralithodes camtschatica (Tilesius) at Kodiak, Alaska. Proceedings of theNational Shellfisheries Association 73: 77–87.
Rausch, R. 1958. The occurrence and distribution of birds on Middleton Island, Alaska.Condor 60: 227–242.
Rea, L. D., K. W. Pitcher, S. D. Farley, J. P. Richmond, and W. S. Dunlap-Harding.2003. Percent total body lipid content increases in Steller sea lion (Eummetopiasjubatus) pups throughout the first year of life in a similar pattern to other otariids pups. 15th Biennial Conference on the Biology of Marine Mammals,Greensboro, NC.
Rea, L. D., M. Castellini, B. S. Fadely, and T. R. Loughlin. 1998. Health status of youngAlaska Steller sea lion pups (Eumetopias jubatus) as indicated by blood chemistry andhematology. Comp. Biochem. Physiol. A 120: 617–623.
Reid, G. M. 1971. Age composition, weight, length and sex of herring, Clupea Pallasii,used for reduction in Alaska, 1929–66. U.S. Department of Commerce, NationalOceanic and Atmospheric Administration, National Marine Fisheries Service, Tech. Rpt. NMFS SSRF 634. Seattle, Washington.
Long-term Change 405
Ch04-N52960 8/22/06 11:15 AM Page 405
Robards, M. D. 2000. Ecology and demographics of Pacific sand lance, Ammodytes hexa-pterus Pallas, in lower Cook Inlet, Alaska. M.Sc. Thesis, Memorial University ofNewfoundland, St. John’s, Canada. 105 pp.
Robards, M. D., G. A. Rose, and J. F. Piatt. 2002. Growth and abundance of Pacific sandlance, Ammodytes hexapterus, under differing oceanographic regimes. Environ. Biol.Fish. 64: 429–441.
Robards, M. D., J. Anthony, J. F. Piatt, and G. Rose. 1999c. Changes in proximatecomposition and somatic energy content for Pacific sand lance (Ammodytes hexapterus)relative to maturity and season in Kachemak Bay, Alaska. J. Exper. Mar. Biol. Ecol. 242:245–258.
Robards, M. D., J. F. Piatt, A. B. Kettle, and A. A. Abookire. 1999b. Temporal and geo-graphic variation in fish communities of lower Cook Inlet, Alaska. Fish. Bull. 97:962–977.
Robards, M. D., J. F. Piatt, and G. A. Rose. 1999a. Maturation, fecundity and intertidalspawning of Pacific Sand Lance (Ammodytes hexapterus) in the northern Gulf ofAlaska. J. Fish Biol. 54: 1050–1068.
Robards, M., G. Drew, J. Piatt, J. M. Anson, A. Abookire, J. Bodkin, P. Hooge, and S. Speckman. 2003. Ecology of selected marine communities in Glacier Bay: zooplank-ton, forage fish, seabirds and marine mammals. U.S.G.S, Alaska Science Center,Anchorage, AK.
Rogers, D. E. 1984. Trends in abundance of northeastern Pacific stocks of salmon. In: W. G. Pearcy (Ed.), The Influence of Ocean Conditions on the Production ofSalmonids in the north Pacific. Publ. ORESU-W-83-001, Oregon State University SeaGrant College Program, Corvallis, Oreg. pp. 100–127.
Rogers, D. E. 1986. Pacific salmon, In: D. W. Hood and S. T. Zimmerman (Eds.), The Gulfof Alaska. Physical Environment and Biological Resources. NOAA, U.S. Department ofCommerce, Springfield, Va. pp. 461–478.
Romano, M. D. 2000. Effects of diet on growth and development of nestling seabirds.M.Sc. Thesis, Oregon State University, Corvallis OR. 59 pp.
Rosen, D. A. S. and A. W. Trites. 2000. Pollock and the decline of Steller sea lions: test-ing the junk food hypothesis. Can. J. Zool. 78: 1243–1250.
Roseneau, D. G., A. B. Kettle, and G. V. Byrd. 1997. Common murre population monitor-ing at the Barren Islands, Alaska, 1996. Exxon Valdez Oil Spill Restoration Ann. Rep.(Restoration Project 96144), U.S. Fish and Wildlife Serv., Alaska Maritime NWR,Homer, Alaska.
Roseneau, D. G., A. B. Kettle, and G. V. Byrd. 2000. Barren Islands seabird studies, 2000,Exxon Valdez Oil Spill Restoration Project Final Report (Reostoration Project 00163J),U.S. Fish and Wildlife Service, Alaska Maritime National Wildlife Service, Homer, Alaska.
Rosenkranz, G. E. 1998. Statistical modeling of Tanner crab recruitment in Bristol Bay,Alaska. Master’s thesis, University of Alaska Fairbanks, 119 pp.
Rosenkranz, G. E., A. V. Tyler, and G. H. Kruse. 2001. Effects of water temperature andwind on recruitment of Tanner crabs in Bristol Bay, Alaska. Fish. Oceanogr. 10: 1–12.
Rosenkranz, G. E., A. V. Tyler, G. H. Kruse, and H. J. Niebauer. 1998. Relationshipbetween wind and year class strength of Tanner crabs in the Southeastern Bering Sea.Alaska Fish. Res. Bull. 5: 18–24.
Rounsefell, G. A and E. H. Dahlgren. 1932. Fluctuations in the supply of herring (Clupeapallasii) in Prince William Sound, Alaska. Bull. Bureau of Fisheries Vol. XLVII,Bulletin No. 9, U.S. Dept. Commerce Bureau of Fisheries Doc. No. 9, Washington, DC.
406 Long-Term Ecological Change in the Northern Gulf of Alaska
Ch04-N52960 8/22/06 11:15 AM Page 406
Rounsefell, G. A. 1929. Contribution to the biology of the Pacific herring (Clupeapallasii), and the condition of the fishery in Alaska. Bulletin of the Bureau of FisheriesVol. XLV, U.S. Dept. Commerce, Bureau of Fisheries Doc. No. 1080, Washington DC.
Royer, T. C. 1982. Coastal freshwater discharge in the Northeast Pacific. J. Geophys. Res.87: 2017–2021.
Royer, T. C. 2005. Hydrographic responses of the coastal Gulf of Alaska to seasonal andinterannual forcing. Deep-Sea Res. Part II. 52: 267–288.
Sagar, P. and D. S. Horning. 1998. Mass related survival of fledging sooty shearwatersPuffinus griseus at the Snares, New Zealand. Ibis 140: 329–339.
Schaller, G. B., H. Jinchu, P. Wenshi, and Z. Jing. 1985. The Giant Pandas of Wolong.University of Chicago Press, Chicago, IL.
Scheel, D. and K. R. Hough. 1997. Salmon fry predation by seabirds near an Alaskanhatchery. Mar. Ecol. Prog. Ser. 150: 35–48.
Shimada, A. M. and D. K. Kimura. 1994. Seasonal movements of Pacific cod (Gadusmacrocephalus) in the eastern Bering Sea and adjacent waters based on tag-recapturedata. Fish. Bull. 92: 800–816.
Shirley, S. M., and T. C. Shirley. 1989. Interannual variability in density, timing andsurvival of Alaskan red king crab Paralithodes camtschatica larvae. Mar. Ecol. Prog.Ser. 54: 51–59.
Shirley, T. C., and S. M. Shirley. 1990. Planktonic survival of red king crab larvae in a sub-arctic ecosystem, 1985–1989, In: D. A. Ziemann and K. W. Fulton-Bennett (Eds.),APPRISE – Interannual Variability and Fisheries Recruitment. The Oceanic Institute,Honolulu, HI, pp. 263–285.
Shirley, T. C., S. M. Shirley, and S. Korn. 1990. Incubation period, molting and growth offemale red king crabs: effects of temperature, In: Proceedings of the international sym-posium on king and Tanner crabs. Alaska Sea Grant Program Report 90-04, Universityof Alaska, Fairbanks, pp. 51–63.
Shultz, M., Harding, A. M. A., and A. B. Kettle. 2002. Black-legged Kittiwake Biology inlower Cook Inlet. In: J. F. Piatt (Ed.), Response of seabirds to fluctuations in forage fishdensity. Final Report to Exxon Valdez Oil Spill Trustee Council (Restoration Project01163M) and Mineral Management Service (Alaska OCS Study MMS 2002-068).Alaska Science Center, U.S. Geological Survey, Anchorage, Alaska, pp. 87–100.
Simenstad, C. A., J. A. Estes, and K. W. Kenyon. 1978. Aleuts, sea otters, and alternatestable state communities. Science 200: 403–411.
Sinclair, E. H. and T. K. Zeppelin. 2002. Seasonal and spatial differences in diet in thewestern stock of Steller sea lions (Eumetopias jubatus). J. Mammol. 83: 973–990.
Sinclair, M. 1988. Marine Populations: An Essay on Population Regulation and Speciation,2nd edition. Washington Sea Grant Program, University of Washington Press, Seattle.
Skud, B. E., H. M. Sakuda, and G. M. Reid. 1960. Statistics of the Alaska herring fishery1878–1956. U.S. Department of the Interior, Fish Wildlife Service, Statistical Digest 48.
Small, R. J., G. W. Pendleton, and K. W. Pitcher. 2003. Trends in abundance of Alaskaharbor seals, 1983–2001. Mar. Mam. Sci. 19: 344–362.
Smith, S. L., and J. Vidal. 1984. Spatial and temporal effects of salinity, temperature, andchlorophyll on the communities of zooplankton in the southeastern Bering Sea. J. Mar.Res. 42: 221–257.
Speckman, S. G. 2004. Characterizing fish schools in relation to the marine environmentand their use by seabirds in Lower Cook Inlet, Alaska. PhD thesis, University ofWashington, Seattle.
Long-term Change 407
Ch04-N52960 8/22/06 11:15 AM Page 407

Speckman, S. G., J. F. Piatt, C. V. Minte-Vera, and J. K. Parrish. 2005. Parallel structureamong environmental gradients and three trophic levels in a subarctic estuary. Progr.Oceanogr. 66: 25–65.
Springer, A. M. 1998. Is it all climate change? Why marine bird and mammal populationsfluctuate in the North Pacific. In: G. Holloway, P. Muller and D. Henderson (Eds.),Biotic impacts of extratropical climate variability in the Pacific. Proceedings ‘AhaHuliko’a Hawaiian Winter Workshop. Honolulu, HI, University of Hawaii, pp. 109–119.
Springer, A. M., D. G. Roseneau, E. C. Murphy, and M. I. Springer. 1984. Environmentalcontrols of marine food webs: food habits of seabirds in the eastern Chukchi Sea. Can.J. Fish. Aquat. Sci. 41: 1202–1215.
Springer, A. M., E. C. Murphy, D. G. Roseneau, C. P. McRoy, and B. A. Cooper. 1987.The paradox of pelagic food webs in the northern Bering Sea – I. Seabird food habits.Cont. Shelf Res. 7: 895–911.
Springer, A. M., J. A. Estes, G. B. Van Vliet, T. M. Williams, D. F. Doak, E. M. Danner,K. A. Forney, and B. Pfister. 2003. Sequential megafaunal collapse in the North PacificOcean: An ongoing legacy of industrial whaling? Proceedings of the National Academyof Science, 100: 12223–12228.
Stabeno, P. J., N. A. Bond, A. J. Hermann, N. B. Kachel, C. W. Mordy, and J. E. Overland.2004. Meteorology and Oceanography of the northern Gulf of Alaska. Continental ShelfRes. 24: 859–898.
Stepanenko, M. A. 1997. Variations from year to year in the spatial differentiation of thewalleye pollock, Theragra chalcogramma, and the cod, Gadus macrocephalus, in theBering Sea. J. Ichthyol. 37: 14–20.
Stephensen, S. W., D. B. Irons, S. J. Kendall, B. K. Lance, and L. L. Mcdonald. 2001.Marine bird and sea otter population abundance of Prince William Sound, Alaska: trendsfollowing the T/V Exxon Valdez oil spill, 1989–2000. U.S. Fish and Wildlife Service,Anchorage, AK.
Stickney, A. P., and H. C. Perkins. 1981. Observations on the food of the larvae of north-ern shrimp, Pandalus borealis Krøyer (Decapoda, Caridea). Crustaceana 40: 36–49.
Stirling, I. and A. E. Derocher. 1990. Factors affecting the evolution of the modern bears.International Conference on Bear Research and Management 8: 189–205.
Strub, P. T. and C. James. 2002. Altimeter-derived surface circulation in the large-scalenortheast Pacific gyres, Part II: Seasonal variability. Progr. Oceanogr. 54: 185–214.
Suddaby, D. and N. Ratcliffe. 1997. The effects of fluctuating food availability on breed-ing Arctic terns (Sterna paradisaea). Auk 114: 524–530.
Sugimoto, T. and K. Tadokoro. 1997. Interannual-interdecadal variations in zooplanktonbiomass, chlorophyll concentration and physical environment in the subarctic Pacificand Bering Sea. Fish. Oceangr. 6: 74–93.
Sugimoto, T. and K. Tadokoro. 1998. Interdecadal variations in plankton biomass andphysical environment in the North Pacific. Fish. Oceanogr. 7: 289–299.
Suryan, R. M. and D. B. Irons. 2001. Colony and population dynamics of black-leggedkittiwakes in a heterogeneous environment. Auk 118: 636–649.
Suryan, R. M., D. B. Irons, J. Benson, and M. Kaufman. 2000. Foraging ecology, repro-ductive biology, and population dynamics of black-legged kittiwakes (Rissa tridactyla)in Prince William Sound, Alaska. Appendix E. In: APEX project: Alaska PredatorEcosystem Experiment in Prince William Sound and the Gulf of Alaska. B. A. Wrightand D. C. Duffy (compilers). Exxon Valdez Oil Spill Restoration Project Final Report,(Project 00163E), Exxon Valdez Oil Spill Trustee Council, Anchorage, Alaska.
408 Long-Term Ecological Change in the Northern Gulf of Alaska
Ch04-N52960 8/22/06 11:15 AM Page 408
Suryan, R. M., D. B. Irons, M. Kaufman, J. Benson, P. G. R. Jodice, D. D. Roby, and E. D. Brown. 2002. Short-term fluctuations in forage fish availability and the effect onprey selection and brood-rearing in the black-legged kittiwake Rissa tridactyla. Mar. Ecol. Progr. Ser. 236: 273–287.
Swartzman, G. L., C. A. Ribic, and C. P. Haung 1990. Simulating the role of entanglementin northern fur seal, Callorhinus ursinus, population dynamics. In: R. S. Shomura andM. L. Godfrey (Eds.), Proceedings of the Second International Conference on MarneDebris. Honolulu, HI, U.S. Department of Commerce. NOAA Technical MemorandumNMFS-SWFSC-154.
Sydeman, W. J., M. M. Hester, F. Gress, P. Martin, and J. Buffa. 2001. Climate change,reproductive performance, and diet composition of marine birds in the southernCalifornia Current system, 1969–1997. Progr. Oceanogr. 49: 309–329.
Tabata, S. 1991. Annual and interannual variability of baroclinic transports across Line Pin the northeast Pacific Ocean, Deep-Sea Res. 38(Suppl. 1): S221–S245.
Thompson, G. G., H. H. Zenger, and M. W. Dorn. 2003. Chapter 2: Assessment of thePacific cod stock in the Gulf of Alaska. In: Appendix B, Stock assessment and fisheryevaluation report for the groundfish resources of the Gulf of Alaska. North PacificFishery Management Council. Anchorage, Alaska, pp. 149–241.
Thorsteinson, F. V. and C. J. Lensink. 1962. Biological observations of Steller sea lionstaken during an experimental harvest. J. Wildl. Manage. 26: 353–359.
Thurston, R. V. and P. C. Gehrke, 1993. Respiratory oxygen requirements of fishes:description of OXYREF, a data file based on test results reported in the publishedliterature, In: R.C. Russo and R.V. Thurston (Eds.), Fish Physiology, Toxicology,and Water Quality Management. Proceedings of an International Symposium,Sacramento, California, U.S.A, September 18–19, 1990. U.S. Environmental ProtectionAgency EPA/600/R-93/157, pp. 95–108.
Towell, R. 2004. 2004 northern fur seal pup production on the Pribilof Islands, Alaska.Seattle, National Marine Mammal Laboratory.
Trites, A. W. and C. P. Donnelly. 2003. The decline of Steller sea lions in Alaska: a reviewof the nutritional stress hypothesis. Mammal. Rev. 33: 3–28.
Trites, A. W. and P. A. Larkin. 1989. The decline and fall of the Pribilof fur seal(Callorhinus ursinus): a simulation study. Can. J. Fish. Aquat. Sci. 46: 1437–1445.
Tyler, A. V., and G. H. Kruse. 1996a. Conceptual modeling of brood strength of red kingcrabs in the Bristol Bay region of the Bering Sea. In: Proceedings of the InternationalSymposium on Biology, Management and Economics of Crabs from High LatitudeHabitat. University of Alaska Fairbanks, Alaska Sea Grant Program Report 96-02, pp. 511–543.
Tyler, A. V., and G. H. Kruse. 1996b. Process modeling and red king crab year-classstrength in the Bristol Bay region of the Bering Sea. PICES Press 4: 2–7.
Tyler, A. V., and G. H. Kruse. 1997. Modeling workshop on year-class strength of Tannercrab, Chionoecetes bairdi. Alaska Department of Fish and Game, CommercialFisheries Management and Development Division, Regional Information Report 5J97-02, Juneau.
Tyler, A. V., and G. H. Kruse. 1998. A comparison of year-class variability of red kingcrabs and Tanner crabs in the eastern Bering Sea. Memoirs of the Faculty of Fisheries,Hokkaido University, 45: 90–95, Hakodate, Japan.
U.S.F.W.S. 2004. Seabird colony catalog. Available from U.S. Fish and Wildlife Service,1011 E. Tudor Road, Anchorage, AK.
Long-term Change 409
Ch04-N52960 8/22/06 11:15 AM Page 409
410 Long-Term Ecological Change in the Northern Gulf of Alaska
Uttley, J. D., P. Walton, P. Monaghan, and G. Austin. 1994. The effects of food abundanceon breeding performance and adult time budgets of guillemots Uria aalge. Ibis 136:205–213.
Van Pelt, T. I. 2000. Reproductive costs and their expression in the common guillemotUria aalge. MSc. Thesis, University of Glasgow, Scotland. 119 pp.
Van Pelt, T. I. and J. F. Piatt. 2003. Population status of Kittlitz’s and marbled murrelets,and surveys for other marine bird and mammal species in the Kenai Fjords area, Alaska.U.S.G.S, Alaska Science Center, Anchorage, AK.
Van Pelt, T. I., M. Shultz, and A. Kettle. 2002. Common murre Biology in lower CookInlet. In: J. F. Piatt (Ed.), Response of seabirds to fluctuations in forage fish density.Final Report to Exxon Valdez Oil Spill Trustee Council (Restoration Project 01163M)and Mineral Management Service (Alaska OCS Study MMS 2002-068). Alaska ScienceCenter, U.S. Geological Survey, Anchorage, Alaska, pp. 72–86.
Van Scoy, K. and E. R. M. Druffel. 1993. Ventilation and transport of thermocline andintermediate waters in the Northeast Pacific during recent El Niños. J. Geophys. Res.98: 18083–18088.
Ver Hoef, J. M. and K. Frost. 2003. A Bayesian hierarchical model for monitoring harborseal changes in Prince William Sound, Alaska. Environ. Ecol. Statis. 10: 201–209.
Wang, J., M. Jin, E. V. Patrick, J. R. Allen, D. L. Eslinger, C. N. K. Mooers, and R. T. Cooney. 2001. Numerical simulations of the seasonal circulation patterns and ther-mohaline structures of Prince William Sound, Alaska. Fish. Oceanogr. 10(Suppl. 1):132–148.
Ware, D. M. 1992. Climate, predators and prey: behaviour of a linked oscillating system.In: T. Kawasaki, S. Tanaka, T. Yoahiaki and A. Taniguchi (Eds.), Long-term variabilityof pelagic fish populations and their environment, Pergamon Press, Sendai, Japan, pp. 279–291.
Ware, D. M. and G. A. McFarlane. 1989. Fisheries production domains in the NortheastPacific Ocean. Can. J. Fish. Aquat. Sci. 108: 359–379.
Ware, D. M. and R. W. Tanasichuk. 1989. Biological basis of maturation and spawningwaves in Pacific herring (Clupea harengus pallasi). Can. J. Fish. Aquat. Sci. 46:1776–1784.
Weingartner, T. J., K. Coyle, B. Finney, R. Hopcroft, T. Whitledge, R. Brodeur, M. Dagg,E. Farley, D. Haidvogel, L. Haldorson, A. Hermann, S. Hinckley, J. Napp, P. Stabeno,T. Kline, C. Lee, E. Lessard, T. Royer and S. Strom. 2002. The Northeast PacificGLOBEC Program: Coastal Gulf of Alaska. Oceanography 15: 48–63.
Weingartner, T. J., S. Danielson, and T. Royer. 2005. Freshwater Variability andPredictability in the Alaska Coastal Current. Deep-Sea Res. II 52: 169–192.
Welch, C. A., J. Keay, K. Kendall, and C. T. Robbins. 1997. Constraints on frugivory bybears. Ecology 78: 1105–1119.
Weller, D. W. 2002. Predation on Marine Mammals. In: W. F. Perrin, B. Würsig, and H. Thewissen (Eds.), Encyclopedia of Marine Mammals. Academic Press, San Diego,CA, pp. 985–994.
Wertheimer, A. C., W. W. Smoker, T. L. Joyce, and W. R. Heard. 2001. Comment: a reviewof the hatchery programs for pink salmon in Prince William Sound and Kodiak Island,Alaska. Trans. Amer. Fish. Soc. 130: 712–720.
Wespestad, V. G. 1991. Pacific herring population dynamics, early life history, andrecruitment variation relative to eastern Bering Sea oceanographic factors. Doctoraldissertation, University of Washington, Seattle.
Ch04-N52960 8/22/06 11:15 AM Page 410
Long-term Change 411
Whitney, F. A. and H. J. Freeland. 1999. Variability in upper-ocean water properties in theNortheast Pacific. Deep-Sea Res. Part II, 46: 2351–2370.
Whitney, F. A., Wong, C. S., and P. W. Boyd. 1998. Interannual variability in nitrate supplyto surface waters of the Northeast Pacific Ocean. Mar. Ecol. Progr. Ser. 170: 15–23.
Wickett, W. P. 1966. Ekman transport and zooplankton concentration in the North PacificOcean. J. Fish. Res. Bd. Canada 24: 581–593.
Wickett, W. P. 1967. Ekman transport and zooplankton concentration in the North PacificOcean. J. Fish. Res. Bd. Canada 24: 581–594.
Willette, T. M., G. Carpenter, K. Hyer, and J. Wilcock. 1998. Herring Natal Habitats.Exxon Valdez Oil Spill Trustee Council Final Report for Restoration Project 97166.Anchorage, Alaska.
Willette, T. M., R. T. Cooney, and K. Hyer. 1999. Predator foraging mode shifts affectingmortality of juvenile fishes during a subarctic spring bloom. Can. J. Fish. Aquat. Sci. 56:364–376.
Willette, T. M., R. T. Cooney, V. Patrick, D. M. Mason, G. L. Thomas, and D. Scheel.2001. Ecological processes influencing the mortality of juvenile pink salmon(Ocorhynchus gorbuscha) in Prince William Sound, Alaska. Fish. Oceanogr.10(Suppl. 1): 14–41.
Williams, T. M., J. A. Estes, D.F. Doak, and A.M. Springer. 2004. Killer appetites: assess-ing the role of predators in ecological communities. Ecology 85: 3373–3384.
Winship, A. J. and A. W. Trites. 2003. Prey consumption of Steller sea lions (Eumetopiasjubatus) off Alaska: how much prey do they require? Fish. Bull. 101: 147–163.
Winters, G. H. and J. P. Wheeler. 1996. Environmental and phenotypic factors affectingthe reproductive cycle of Atlantic herring. ICES J. Mar. Sci. 53: 73–88.
Withrow, D. E. and T. R. Loughlin. 1996. Abundance and distribution of harbor seals(Phoca vitulina richardsi) along the north side of the Alaska Peninsula and Bristol Bayduring 1995. Annual Report to the MMPA Assessment Program, Office of ProtectedResources, NMFS, NOAA, Silver Springs, MD.
Worm, B., and R. A. Myers. 2003. Meta-analysis of cod-shrimp interactions reveals top-down control in oceanic food webs. Ecology 84: 162–173.
Wu, J. Q. and Hsieh, W. W. 1999. A modeling study of the 1976 climate regime shift inthe North Pacific Ocean. Can. J. Fish. Aquat. Sci. 56: 2450–2462.
Wunsch, C. 1999. The interpretation of short climate records, with comments on the NorthAtlantic and Southern Oscillations. Bull. Amer. Meteorol. Soc. 80: 245–255.
York, A. E. 1994. The population dynamics of Northern sea lions. Mar. Mam. Sci. 10: 38–51.York, A. E. and J. R. Hartley. 1981. Pup production following harvest of female northern
fur seals. Can. J. Fish. Aquat. Sci. 38: 84–90.Zador, S. and J. F. Piatt. 1999. Time-budgets of common murres at a declining and
increasing colony in Alaska. Condor 101: 149-152.Zador, S., A. Harding, J. F. Piatt, L. Ochikubo, and A. Nielsen. 1997. Monitoring Seabird
Populations in Areas of Oil and Gas Development on the Alaskan Continental Shelf:Monitoring Populations And Productivity Of Seabirds At Colonies In Lower Cook Inlet,Alaska, 1995. OCS Study, MMS 95-013.
Zebdi, A. and J. S. Collie. 1995. Effect of climate on herring (Clupea pallasi) populationdynamics in the northeast Pacific Ocean. Can. J. Fish. Aquat. Sci. 121: 277–290.
Zheng, J. M. C. Murphy, and G. H. Kruse. 1995b. An update of the length-based popula-tion model and stock-recruitment relationships for red king crab, Paralithodescamtschaticus, in Bristol Bay, Alaska. Alaska Fish. Res. Bull. 2: 114–124.
Ch04-N52960 8/22/06 11:15 AM Page 411
412 Long-Term Ecological Change in the Northern Gulf of Alaska
Zheng, J., and G. H. Kruse. 1998. Stock-recruitment relationships for Bristol Bay Tannercrab. Alaska Fish. Res. Bull. 5: 116–130.
Zheng, J., and G. H. Kruse. 2002. Assessment and management of crab stocks underuncertainty of massive die-offs and rapid changes in survey catchability. In: Paul, A. J., E. G. Dawe, R. Elner, G. S. Jamieson, G. H. Kruse, R. S. Otto, B. Sainte-Marie,T.C. Shirley, and D. Woodby (Eds.), Crabs in cold water regions: biology, management,and economics. University of Alaska Sea Grant, AK-SG-02-01, Fairbanks, pp. 367–384.
Zheng, J., and G. H. Kruse. 2003. Stock-recruitment relationships for three major Alaskancrab stocks. Fish. Res. 65: 103–121.
Zheng, J., and G. H. Kruse. 2006. Recruitment variation of eastern Bering Sea crabs:climate forcing or top-down effects? Progr. Oceanogr. in press.
Zheng, J., M. C. Murphy, and G. H. Kruse. 1995a. A length-based population model andstock-recruitment relationships for red king crab, Paralithodes camtschaticus, in BristolBay, Alaska. Can. J. Fish. Aquat. Sci. 52: 1229–1246.
Zheng. J., and G. H. Kruse. 2000. Recruitment patterns of Alaskan crabs and relationshipsto decadal shifts in climate and physical oceanography. ICES J. Mar. Sci. 57: 438–451.
Ziemann, D. A., L. D. Conquest, K. W. Fulton-Bennett, and P. K. Bienfang. 1990. In: D. A. Ziemann and K. W. Fulton-Bennett (Eds.), APPRISE – Interannual variabilityand fisheries recruitment. The Oceanic Institute, Honolulu, HI, pp. 129–170.
Zimmerman, M. 1997. Maturity and fecundity of arrowtooth flounder, Atherestes stomias,from the Gulf of Alaska. Fish. Bull. 95: 598–611.
Zimmerman, M., and P. Goddard. 1996. Biology and distribution of arrowtooth,Atherestes stomias, and Kamchatka, A. evermanni, flounders in Alaskan waters. Fish.Bull. 94: 358–370.
Zimmermann, M., R. C. Harrison, and A. F. Jones. 2001. Differential parasitism byNaobranchia occidentalis (Copepoda: Naobranchiidae) and Nectobrachia indivisa(Copepoda: Lernaeopodidae) on northern rock sole (Lepidopsetta polyxystra Orr andMatarese, 2000) and southern rock sole (L. bilineata Ayres, 1855) in Alaskan waters.Fish. Bull. 99: 371–380.
Ch04-N52960 8/22/06 11:15 AM Page 412
kavithank
Highlight
kavithank
Text Box
AU: Kindly cite this reference.
kavithank
Highlight
kavithank
Text Box
AU: Kindly cite this reference.