Spatial and temporal patterns in the demersal fish community on the shelf and upper slope regions of...
23
559 Abstract–We analyzed data from Na tional Marine Fisheries Service bottom trawl surveys carried out triennially from 1984 to 1996 in the Gulf of Alaska (GOA). The continental shelf and upper slope (0–500 m) of the GOA support a rich demersal fish fauna dominated by arrowtooth flounder (Atheresthes stomias), walleye pollock (Theragra chalcogramma), Pacific cod (Gadus macrocephalus), Pacific halibut (Hip poglossus stenolepis), and Pacific Ocean perch (Sebastes alutus). Average catch per unit of effort (CPUE) of all ground fish species combined increased with depth and had a significant peak near the shelf break at 150–200 m. Species richness and diversity had significant peaks at 200–300 m. The western GOA was characterized by higher CPUEs and lower species richness and diversity than the eastern GOA. Highest CPUEs were observed in Shelikof Strait, along the shelf break and upper slope south of Kodiak Island, and on the banks and in the gullies northeast of Kodiak Island. Significant differences in total CPUE among surveys suggest a 40% increase in total groundfish biomass between 1984 and 1996. A multivariate analysis of the CPUE of 72 groundfish taxa revealed strong gradients in spe cies composition with depth and from east to west, and a weak but signifi cant trend in species composition over time. The trend over time was associ ated with increases in the frequency of occurrence and CPUE of at least eight taxa, including skates (Rajidae), capelin (Mallotus villosus), three flat fish species, and Pacific Ocean perch, and decreases in frequency of occur rence and CPUE of several sculpin (Myoxocephalus spp.) species. Results are discussed in terms of spatial and temporal patterns in productivity and in the context of their ecological and management implications. Manuscript accepted 22 March 2002. Fish. Bull. 100:559–581 (2002). Spatial and temporal patterns in the demersal fish community on the shelf and upper slope regions of the Gulf of Alaska Franz J. Mueter Brenda L. Norcross Institute of Marine Science University of Alaska Fairbanks P.O. Box 757220 Fairbanks, Alaska 99775-7220 Present address (for F. J. Mueter): 697 Fordham Drive Fairbanks, Alaska 99709 E-mail address (for F. J. Mueter):[email protected] The continental shelf and upper slope of and Tyler, 1980; Rogers and Pikitch, the Gulf of Alaska (GOA, Fig. 1) support 1992; Jay, 1996). However, to our a diverse community of demersal fishes. knowledge there have been no studies This community includes many com- in which demersal fish assemblages mercial species that support rich bottom from the GOA shelf and slope were trawl and longline fisheries with land- examined. ings averaging approximately 250,000 To understand, and eventually to metric tons per year over the past two predict, the effects of environmental decades (NPFMC 1 ). The commercially variations on fish stocks, scientists most important species during the past and managers increasingly advocate decade have been walleye pollock (Ther- ecosystem approaches to research and agra chalcogramma), Pacific halibut management (Yaffee et al., 1996; Lang (Hippoglossus stenolepis), Pacific cod ton and Haedrich, 1997). Ecosystem (Gadus macrocephalus), other flatfish management must be based on mul species (Pleuronectidae), rockfish (Se- tispecies relationships and overcome bastes spp.), and sablefish (Anoplopoma the current focus on individual spe fimbria). Arrowtooth flounder (Atheres- cies (Langton and Haedrich, 1997). An thes stomias), although currently the important prerequisite for successful dominant demersal species by biomass, multispecies approaches is an under is a minor component of total landings. standing of the species structure of fish Triennial bottom trawl surveys have communities in space and time. been carried out since 1984 to assess The purpose of this paper is to iden the abundance and distribution of tify spatial and temporal patterns in the main commercial species in the the composition of the demersal fish GOA (Martin, 1997). The surveys also community from the GOA. Specific provide data on noncommercial fish objectives are 1) to identify the main species and other associated benthic environmental and spatial gradients megafauna. At least 140 species of along which the groundfish community fishes belonging to 33 families were is structured, and 2) to identify long collected during the 1996 GOA bottom term changes in the composition of the trawl survey (Martin, 1997). Rockfish groundfish community. (Scorpaenidae) were the best repre sented family with 25 species, followed by sculpins (Cottidae, 24 species) and flatfishes (Pleuronectidae, 16 species). 1 NPFMC (North Pacific Fisheries Man- Data from similar bottom trawl sur- agement Council). 1997. Stock assess veys have been used to investigate the ment and fishery evaluation report for the groundfish resources of the Gulf of ecology and zoogeography of fish as- Alaska. North Pacific Fisheries Manage semblages in many parts of the world, ment Council, 605 West 4th Ave., Suite including the North Pacific (Gabriel 306, Anchorage, AK 99501.
Transcript of Spatial and temporal patterns in the demersal fish community on the shelf and upper slope regions of...

559
Abstract–We analyzed data from National Marine Fisheries Service bottom trawl surveys carried out triennially from 1984 to 1996 in the Gulf of Alaska (GOA). The continental shelf and upper slope (0–500 m) of the GOA support a rich demersal fish fauna dominated by arrowtooth flounder (Atheresthes stomias), walleye pollock (Theragra chalcogramma), Pacific cod (Gadus macrocephalus), Pacific halibut (Hippoglossus stenolepis), and Pacific Ocean perch (Sebastes alutus). Average catch per unit of effort (CPUE) of all groundfish species combined increased with depth and had a significant peak near the shelf break at 150–200 m. Species richness and diversity had significant peaks at 200–300 m. The western GOA was characterized by higher CPUEs and lower species richness and diversity than the eastern GOA. Highest CPUEs were observed in Shelikof Strait, along the shelf break and upper slope south of Kodiak Island, and on the banks and in the gullies northeast of Kodiak Island. Significant differences in total CPUE among surveys suggest a 40% increase in total groundfish biomass between 1984 and 1996. A multivariate analysis of the CPUE of 72 groundfish taxa revealed strong gradients in species composition with depth and from east to west, and a weak but significant trend in species composition over time. The trend over time was associated with increases in the frequency of occurrence and CPUE of at least eight taxa, including skates (Rajidae), capelin (Mallotus villosus), three flatfish species, and Pacific Ocean perch, and decreases in frequency of occurrence and CPUE of several sculpin (Myoxocephalus spp.) species. Results are discussed in terms of spatial and temporal patterns in productivity and in the context of their ecological and management implications.
Manuscript accepted 22 March 2002. Fish. Bull. 100:559–581 (2002).
Spatial and temporal patterns in the demersal fish community on the shelf and upper slope regions of the Gulf of Alaska
Franz J. Mueter Brenda L. Norcross Institute of Marine ScienceUniversity of Alaska FairbanksP.O. Box 757220Fairbanks, Alaska 99775-7220Present address (for F. J. Mueter): 697 Fordham Drive
Fairbanks, Alaska 99709 E-mail address (for F. J. Mueter):[email protected]
The continental shelf and upper slope of and Tyler, 1980; Rogers and Pikitch, the Gulf of Alaska (GOA, Fig. 1) support 1992; Jay, 1996). However, to our a diverse community of demersal fishes. knowledge there have been no studies This community includes many com- in which demersal fish assemblages mercial species that support rich bottom from the GOA shelf and slope were trawl and longline fisheries with land- examined. ings averaging approximately 250,000 To understand, and eventually to metric tons per year over the past two predict, the effects of environmental decades (NPFMC1). The commercially variations on fish stocks, scientists most important species during the past and managers increasingly advocate decade have been walleye pollock (Ther- ecosystem approaches to research and agra chalcogramma), Pacific halibut management (Yaffee et al., 1996; Lang(Hippoglossus stenolepis), Pacific cod ton and Haedrich, 1997). Ecosystem (Gadus macrocephalus), other flatfish management must be based on mulspecies (Pleuronectidae), rockfish (Se- tispecies relationships and overcome bastes spp.), and sablefish (Anoplopoma the current focus on individual spefimbria). Arrowtooth flounder (Atheres- cies (Langton and Haedrich, 1997). An thes stomias), although currently the important prerequisite for successful dominant demersal species by biomass, multispecies approaches is an underis a minor component of total landings. standing of the species structure of fish
Triennial bottom trawl surveys have communities in space and time. been carried out since 1984 to assess The purpose of this paper is to identhe abundance and distribution of tify spatial and temporal patterns in the main commercial species in the the composition of the demersal fish GOA (Martin, 1997). The surveys also community from the GOA. Specific provide data on noncommercial fish objectives are 1) to identify the main species and other associated benthic environmental and spatial gradients megafauna. At least 140 species of along which the groundfish community fishes belonging to 33 families were is structured, and 2) to identify longcollected during the 1996 GOA bottom term changes in the composition of the trawl survey (Martin, 1997). Rockfish groundfish community. (Scorpaenidae) were the best represented family with 25 species, followed by sculpins (Cottidae, 24 species) and flatfishes (Pleuronectidae, 16 species). 1 NPFMC (North Pacific Fisheries Man-Data from similar bottom trawl sur- agement Council). 1997. Stock assess
veys have been used to investigate the ment and fishery evaluation report for the groundfish resources of the Gulf of
ecology and zoogeography of fish as- Alaska. North Pacific Fisheries Managesemblages in many parts of the world, ment Council, 605 West 4th Ave., Suite including the North Pacific (Gabriel 306, Anchorage, AK 99501.

560 Fishery Bulletin 100(3)
SoutheastYakutat
KodiakChirikofShumagin
Bering Sea
Aleutian Islands Kodiak I.
Alaskan Stream
Prince William Sound
Cook
Inle
t
250 km
Yakutat
100
m
200 m
500
m
500m
Figure 1 Bathymetric and geographic features of the Gulf of Alaska between 130°W and 170°W. The black vertical lines separate the five areas used in the survey design and analysis. Thin lines indicate 100 m, 200 m, and 500-m isobaths. The large shaded lines summarize major circulation patterns.
Materials and methods
Study area
Our study area included the continental shelf and the upper continental slope along the perimeter of the GOA to a depth of 500 m (Fig. 1). The total study area is approximately 300,000 km2, extending over a distance of 2600 km from Southeast Alaska to the western Aleutian Islands.
Data sources
All fisheries data for this study were obtained from the Alaska Fisheries Science Center (AFSC), National Marine Fisheries Service (NMFS) in Seattle, WA. Personnel from AFSC have executed bottom trawl surveys of groundfish stocks in the GOA on a triennial basis since 1984 (Table 1). All surveys were conducted during the summer with chartered fishing vessels and were based on a stratified random sampling design. The GOA was divided into five areas, three in the western GOA (Shumagin, Chirikof, Kodiak) and two in the eastern GOA (Yakutat, Southeast, see Fig. 1) and four depth strata (0–100 m, 100–200 m, 200–300 m, 300–500 m). Depth strata within each area were further subdivided into 2–5 strata based on the type of geographical area (e.g. banks, gullies, shelf, and slope), resulting in a total of 49 strata. Some modifications were made to the stratification scheme after 1987. Our analysis was based on current stratum boundaries. Details of the
sampling design, data collection, and sample processing are described in Brown (1986), Martin and Clausen (1995), Stark and Clausen (1995), and Martin (1997). In our analysis we excluded data from the 0–100 m stratum in the southeast area because it is mostly untrawlable and was not sampled during three out of five surveys; thus we used a total of 48 strata in the analysis. We further excluded all hauls that were classified as unsatisfactory in the database.
Several types of fishing gear were used in the bottom trawl surveys between 1984 and 1996. A poly-Nor’eastern high opening bottom trawl equipped with rubber bobbin roller gear has become the standard gear for GOA bottom trawl surveys (Munro and Hoff, 1995) and was used for at least part of the survey in all years (Table 1). In addition, an older Nor’eastern trawl (gear type 160) was used during parts of the 1984 and 1990 survey and two different Japanese trawls (Table 1) were used during the 1984 and 1987 joint Japanese-American surveys. Fishing effort for each gear type was spread out over most of the sampling region within each year and one gear type (gear type 172) was used during all surveys, allowing us to estimate gear differences.
Data analysis
Our analysis was based on standardized catch per unit of effort of 72 fish taxa collected in the bottom trawl surveys. Catches were standardized to weight per unit area (kg/ km2), where the area swept by the trawl was estimated

Mueter and Norcross: Spatial and temporal patterns in the demersal fish community off Alaska 561
Table 1 Number of quantitative hauls used in analysis by gear type, start and ending dates of survey, minimum, maximum, and average depth of hauls, and number of haul locations for which bottom temperature was obtained. Note changes in gear from 1984 to 1990, which were associated with a decrease in the average tow duration. Gear types: 160 = Nor’eastern trawl; 172 = poly-Nor’eastern high opening bottom trawl; 710 = Japanese poly trawl; 717 = Japanese poly trawl with roller gear.
1984 1990 1993 1996
Total number of hauls 867 758 705 774 807
Gear type: no. of hauls (160: 430) (172: 380) (160: 166) (all: 172) (all: 172) (172: 133) (717: 378) (172: 539) (710: 304)
Starting date Jun 3 May 22 Jun 4 Jun 6 May 22
Ending date Oct 2 Sep 10 Sep 9 Sep 7 Jul 30
Average depth (m) 167 150 167 156 157
Maximum depth (m) 499 499 494 488 479
Minimum depth (m) 16 20 20 22 20
Temp. measurements 563 298 285 726 716
1987
from the measured distance trawled and estimates or measurements of the width of the net opening. Taxa to include in the analysis were selected according to the following criteria: 1) all species consistently identified to species level and occurring at least at 1% of the stations, 2) taxa that were not consistently identified to species level were combined by genus or, if necessary, by family, 3) if, after grouping taxa, a species, genus, or family was present at less than 1% of the stations within each year, it was not included in the analysis.
As an initial estimate of abundance trends, we computed gulf-wide averages of CPUE for each species by year. CPUEs from the Japanese trawls used in 1984 and 1987 were adjusted to the US standard trawl gear by using fishing power coefficients provided in Tables 28 and 31 in Munro and Hoff (1995). Following standard NMFS methods (Martin, 1997), we averaged estimated CPUEs by stratum, weighted the averages by stratum area, and combined them to obtain area-wide averages.
From a haul-by-taxon matrix of CPUE data, we computed univariate and multivariate indices to examine spatial and temporal patterns in community structure. For each haul we computed species richness (number of species), species diversity (Shannon-Wiener index), and total CPUE of all groundfish taxa combined as univariate measures of community structure. We considered three indices of species diversity (Shannon-Wiener, Simpson’s D, Fisher’s α) and chose the Shannon-Wiener index because it showed little dependence on sample size in simulations, was approximately normally distributed (which facilitates statistical comparisons), and is widely used in the ecological literature. In addition, we computed multivariate indices of species composition based on Bray-Curtis dissimilarities of root-root transformed CPUEs and nonmetric multidimensional scaling (NMDS) as described in Mueter and Norcross (1999). Indices of species composition were computed separately for each year and were related to
explanatory variables to describe the major gradients in species composition by year. To examine trends in species composition over time, catches were averaged by stratum instead of using individual hauls, reducing the 3911 hauls to 240 within-year strata (5 years × 48 strata). An NMDS ordination of the stratum-by-species matrix was then used to test specifically for significant trends in species composition over time. We computed the linear combination of ordination axes that maximized the correlation with year and tested whether the correlation was significantly higher than would be expected by chance by using randomization tests. This linear combination was used as an index representing changes in species composition over time (time index). Species that were most strongly associated with the time index were identified based on scatterplots and Spearman rank correlations between the index and individual species abundances, and changes in these species were examined in more detail.
Depth, geographic location, bottom temperature (measured by sensors attached to the gear), Julian day, year, gear type, and area swept were included in the analysis as explanatory variables. Geographic location was represented in the analysis either as a categorical variable by using the five statistical areas depicted in Figure 1 or by using alongshore distances (AD). Alongshore distance was computed by projecting each station onto a line that approximately followed the shelf break and measuring the distance along this line from its origin in the southeast part of the study area (km 0) to the westernmost point (km 2600). Temperature was not measured for all hauls (Table 1); thus all regressions were done both with and without temperature included. Gear type was included in all models to account for potential differences among gear types. Area swept was only included for examining trends in species richness and diversity because the number of species per haul was expected to increase with the area sampled. All other indices were based on standardized CPUEs.

562 Fishery Bulletin 100(3)
Generalized additive models (GAM, Hastie and Tibshirani, 1990) and linear models were used to relate univariate and multivariate indices, individual species CPUEs, and presence-absence data to the independent variables. Additive models were used to allow for nonlinear relationships between the dependent and independent variables. A GAM is a nonparametric regression that uses smooth functions of the independent variables in place of linear functions and allows different probability distributions for the data. We initially assumed that species richness followed a Poisson distribution (counts), that the Shannon-Wiener index, log-transformed CPUEs, and all indices of species composition followed a normal distribution, and that presence-absence data followed a binomial distribution. The dependent variables were then modeled as the sum of nonparametric functions (smoothing splines) of the hypothesized independent variables. If no evidence of nonlinearity was found, linear terms were substituted for the smoothing splines. Residuals from each regression model were examined for violations of the underlying assumptions (error distribution and homogeneity of variance) and for outliers. Specifically, we examined residuals graphically by means of histograms, quantile-quantile plots, and plots of residuals against time and against other covariates. We further conducted formal tests of goodness-of-fit of the residuals against the assumed error distributions after each model fit. Model fits were generally deemed adequate, unless noted otherwise in the results.
To identify and evaluate the significance of relationships between species composition and explanatory variables we first chose the most appropriate regression model, then quantified the contribution of each explanatory variable to the model fit. A stepwise procedure based on the Akaike information criterion (Hastie and Tibshirani, 1990) was used to select a subset of significant variables. As a measure of model fit we computed a pseudo-coefficient of determination (pseudo-r2), or the fraction of the total deviance explained by the model, as a surrogate for the familiar r2
(Swartzman et al., 1992). The importance of individual variables in the model fits was evaluated similarly by using a pseudo-coefficient of partial determination based on reduced models that exclude the variable of interest (= 1 – deviance of best model/deviance of reduced model).
Trends in the abundance of those species that were strongly associated with the time index were examined in greater detail by haul. For this analysis we treated zero and nonzero catches separately to test for 1) changes in the catch rate of a species over time based on positive catches only (CPUE-where-present) and 2) changes in the frequency of occurrence of a species over time (by estimating the probability of a nonzero haul). To test for changes in the CPUE-where-present of these species, we used an analysis of covariance model of the following form:
log(CPUE-where-present) = area + depth stratum + gear + (area × depth stratum) + β × year.
Errors were assumed to be normally distributed, thus CPUE-where-present was assumed to follow a lognormal
distribution. A separate linear time trend was estimated and evaluated for significance within each depth stratum in each area (β parameters). The interaction term (area × depth stratum) was omitted if it was not significant at the 5% level. Strata within the same statistical area and depth stratum were pooled, unless fitting separate regression lines to each of the 48 strata improved the overall fit significantly. If the slope of the regression did not differ among areas or depth strata at the 5% level, data were further pooled across areas or depth strata (or both) to obtain the most parsimonious model.
The probability of nonzero hauls was estimated similarly using a logistic regression model (McCullagh and Nelder, 1989):
Pr(CPUE > 0) log
1 − Pr(CPUE > 0) = area + depth stratum +
gear + (area × depth stratum) + β × year,
where the number of positive catches (CPUE>0) was assumed to follow a binomial distribution. The most parsimonious models for each species were used to test the null hypothesis that there was no significant (linear) trend in the catch rate (CPUE-where-present) or frequency of occurrence (Pr{CPUE>0}) over time. The null hypothesis was rejected if the slope β was significantly different from zero at the 5% level.
Results
Arrowtooth flounder had the highest average CPUE (kg/km2) and the highest frequency of occurrence during all surveys (Table 2). Walleye pollock was second in most years, followed by Pacific cod and Pacific halibut. However, in 1996, the estimated CPUE of Pacific Ocean perch exceeded that of pollock, cod, and halibut. Sablefish, five other flatfish species, two Sebastes species, and Atka mackerel (Pleurogrammus monopterygius) were other important species by CPUE (> 200 kg/km2, Table 2). The most abundant species, including gadids and most of the flatfishes, were generally also the most widespread species in the survey (>50% frequency of occurrence). In spite of relatively high CPUEs, rockfishes, Atka mackerel, and yellowfin sole (Limanda aspera) had low frequencies of occurrence (4–40%), indicating high local abundances and a more restricted spatial distribution.
Independent variables used in the analysis of species richness, diversity, CPUE, and species composition were moderately correlated (Table 3). The largest correlations were between area swept and year (–0.452), due to a reduction in haul duration after 1987, between depth and temperature (–0.407), and between Julian day and alongshore distance (–0.383). Depth and bottom temperature on the shelf and slope are invariably confounded and their effects may generally be difficult to separate. The confounding between Julian day and AD was extreme in some years (e.g. r=–0.79 in 1993) because sampling vessels traveled from west to east during most surveys. However

Mueter and Norcross: Spatial and temporal patterns in the demersal fish community off Alaska 563
Table 2 All groundfish taxa included in analysis and their estimated average CPUE (kg/km2) by year and for all years combined. CPUEs were computed for each haul, averaged by stratum, weighted by stratum area, and combined to obtain area-wide averages. FO denotes overall frequency of occurrence for all years combined in percent.
Scientific name Common name 1984 1987 1990 1993 1996 Mean FO
Atheresthes stomias 1 arrowtooth flounder 3790 3339 5298 5574 4900 Theragra chalcogramma 1 walleye pollock 2431 3139 2586 2320 2670 Gadus macrocephalus 1 Pacific cod 1876 1516 1397 1821 1607 Hippoglossus stenolepis 1 Pacific halibut 1415 1410 2007 1936 1577 Sebastes alutus 1 Pacific Ocean perch 753 823 535 1649 2629 1278 40 Anoplopoma fimbria 1 sablefish 1379 731 844 492 840 52 Hippoglossoides elassodon 1 flathead sole 912 783 828 643 689 771 57 Lepidopsetta spp. 1 rock sole 515 668 531 590 695 600 44 Sebastes polyspinis 1 northern rockfish 475 365 356 337 334 20 Pleurogrammus monopterygius Atka mackerel 153 101 73 1179 5 Glyptocephalus zachirus 1 rex sole 187 269 335 297 245 266 67 Microstomus pacificus 1 Dover sole 164 263 329 291 266 263 55 Limanda aspera 1 yellowfin sole 313 192 277 162 228 Sebastes ciliatus 1 dusky rockfish 505 91 194 255 227 20 Sebastes aleutianus 1 rougheye rockfish 227 165 212 156 183 34 Rajidae unident. skate (unidentified) 129 164 205 274 182 33 Clupea pallasi Pacific herring 186 511 60 53 3 163 8 Sebastes zacentrus sharpchin rockfish 274 131 81 220 146 10 Albatrossia pectoralis giant grenadier 115 81 155 175 3 Sebastolobus alascanus shortspine thornyhead 126 127 68 114 177 122 24 Sebastes variegatus harlequin rockfish 247 60 32 68 83 11 Thaleichthys pacificus eulachon 56 95 119 110 81 32 Isopsetta isolepis 1 butter sole 80 71 59 102 71 77 7 Platichthys stellatus 1 starry flounder 63 35 137 93 76 5 Sebastes borealis shortraker rockfish 137 43 69 69 75 8 Sebastes proriger redstripe rockfish 90 92 101 51 71 4 Squalus acanthias spiny dogfish 34 65 114 96 69 16 Hemilepidotus jordani yellow Irish lord 49 46 40 40 61 47 27 Sebastes brevispinis silvergray rockfish 18 48 65 82 46 7 Ophiodon elongatus lingcod 32 35 53 80 43 10 Hemitripterus bolini bigmouth sculpin 54 35 29 19 14 30 18 Lamna ditropis salmon shark 27 43 42 26 11 30 1 Myoxocephalus spp. sculpin (unidentified) 23 18 22 30 26 9 Parophrys vetulus 1 English sole 11 28 26 28 15 22 7 Somniosus pacificus Pacific sleeper shark 1 1 6 29 72 22 1 Zaprora silenus prowfish 24 15 28 23 21 11 Pleuronectes quadrituberculatus1 Alaska plaice 7 16 20 9 17 14 4 Microgadus proximus Pacific tomcod 5.03 34.67 6.32 9.01 5.78 12.16 2 Sebastes babcocki redbanded rockfish 4.88 11.20 12.53 15.54 11 Hydrolagus colliei spotted ratfish 8.16 6.32 7.08 12.65 9.45 6 Hexagrammos decagrammus kelp greenling 3.89 8.17 13.87 8.21 6.69 8.16 8 Sebastes reedi yellowmouth rockfish 0.89 6.39 12.14 3.15 4.85 1 Sebastes ruberrimus yelloweye rockfish 10.17 3.29 3.88 3.70 4.63 3 Sebastes helvomaculatus rosethorn rockfish 5.12 2.50 2.54 7.71 3.97 4 Sebastes melanops black rockfish 3.75 4.65 0.86 7.89 3.66 1 Bathymaster signatus searcher 2.08 2.05 5.39 3.04 3.39 Trichodon trichodon Pacific sandfish 3.71 2.45 1.76 0.52 3.20 3 Malacocottus spp. sculpin (unidentified) 4.33 2.97 2.40 3.55 2.97 Cryptacanthodes giganteus giant wrymouth 0.76 3.26 3.98 1.17 2.77 2.39 1 Lycodes palearis wattled eelpout 0.86 1.75 3.10 3.16 2.23
continued
6499 91 2873 74 1424 73 1118 77
753
135 98 321
196 7 87
153 139
23 96 124
9 24
50 59 18 34
16 15
37
13
6.21 10.07 13.06
1.69 2.10 1.99 1.14
4.38 15 7.56
1.63 14
2.30 11

564 Fishery Bulletin 100(3)
Table 2 (continued)
Scientific name Common name 1984 1987 1990 1993 1996 Mean FO
Eopsetta jordani petrale sole 0.97 0.83 0.61 2.77 3.68 1.77 2 Mallotus villosus capelin 1.47 0.17 0.51 0.42 4.98 1.51 7 Lycodes brevipes shortfin eelpout 0.13 0.84 0.79 2.41 2.17 1.27 8 Dasycottus setiger spinyhead sculpin 1.33 0.49 0.89 1.88 0.83 1.08 11 Aptocyclus ventricosus smooth lumpsucker 0.74 1.29 1.77 0.37 0.56 0.95 2 Podothecus acipenserinus sturgeon poacher 0.19 0.42 1.23 2.34 0.33 0.90 5 Sebastes elongatus greenstriped rockfish 0.05 0.22 0.59 0.91 1.20 0.59 1 Sebastes wilsoni pygmy rockfish 0.00 1.38 0.30 0.01 0.96 0.53 1 Myctophidae lanternfish (unidentified) 0.19 0.19 0.11 1.52 0.53 0.51 4 Triglops spp. sculpin (unidentified) 0.37 0.32 0.68 0.40 0.61 0.48 6 Stichaeidae prickleback (unidentified) 0.58 0.05 0.51 0.70 0.41 0.45 4 Sebastes crameri darkblotched rockfish 0.02 0.13 0.59 0.99 0.41 0.43 1 Hexagrammos stelleri whitespotted greenling 0.17 0.56 0.64 0.33 0.27 0.39 1 Lyopsetta exilis slender sole 0.10 0.07 0.29 0.77 0.59 0.37 5 Cyclopteridae (Liparidinae) snailfish 0.30 0.23 0.30 0.28 0.04 0.23 3 Hemilepidotus hemilepidotus red Irish lord 0.07 0.29 0.05 0.32 0.10 0.16 1 Cottidae sculpin (unidentified) 0.25 0.00 0.28 0.08 0.01 0.12 1 Gymnocanthus spp. sculpin (unidentified) 0.16 0.03 0.00 0.06 0.06 0.06 1 Eumicrotremus orbis Pacific spiny lumpsucker 0.02 0.08 0.03 0.07 0.04 0.05 2 Lycodes diapterus black eelpout 0.08 0.05 0.00 0.01 0.02 0.03 2 Sarritor frenatus sawback poacher 0.03 0.03 0.01 0.04 0.04 0.03 2 Bathyagonus nigripinnis blackfin poacher 0.02 0.01 0.01 0.01 0.00 0.01 1 Total 14,786 17,286 17,436 18,400 20,662 17,714
1 Catches for 1984 and 1987 were adjusted by using fishing power coefficients in Tables 28 and 31 in Munro and Hoff (1995). Other flatfishes were adjusted by using rock sole coefficients.
Table 3 Pairwise Pearson’s correlation coefficients among independent variables used in the statistical analysis.
Depth Alongshore distance Gear temperature Julian day Year
Alongshore distance –0.326* Gear temperature –0.407* –0.203* Julian day 0.129* –.383* 0.330* Year –0.026 –0.035 –0.266* –0.306* Area swept 0.012 0.184* 0.019 0.145* –0.452*
* Highly significant (P=0.01)
the direction of sampling was reversed in some years, providing some contrast.
Species richness, as measured by the number of species per haul, was initially modeled as a Poisson variable (counts). However, an analysis of the distribution of the observed numbers and of residuals from the fitted models suggested that it could more appropriately be modeled as a normally distributed variable (see below). We fitted models assuming either a Poisson or a normal distribution and found that the estimated patterns were virtually identical and in both cases the same model was selected as
best model. Only results based on the normal distribution are presented. Species richness was highly variable and the best model explained a small portion of the overall variability (Pseudo-r2=0.25). The average number of species increased with area swept (Fig. 2), which may be expected if species area relationships established for terrestrial ecosystems also hold in the marine environment. The number of species tended to peak at intermediate depths (200–300 m) and was highest in the eastern GOA (Table 4), decreasing steadily west of Prince William Sound (km 1100, approximately 147°W). Species richness appeared

Mueter and Norcross: Spatial and temporal patterns in the demersal fish community off Alaska 565
-4
-2
0
2
-4
-2
0
2
-2
0
2
-2
0
2
-2
0
2
160 172 71
071
7 Gear typeArea swept (m2)
-4
-2
0
2
-4
-2
0
2
Effe
ct o
n nu
mbe
r of
spe
cies
0 100 200 300 400 500
Depth (m)
Julian day Year
'84 '87 '90 '93 '96140 180 220 260
0 4*104 8*104 12*104
0 1000 2000
Alongshore distance (km)
ShuChi
KodYakSE
Figure 2 Estimated trends in number of species per haul by depth, alongshore distance, Julian day, year, area swept, and gear type. Alongshore distance was measured along the 200-m depth contour from east to west. Major geographic regions from east to west are Southeast (SE), Yakutat (Yak), Kodiak (Kod), Chirikof (Chi), and Shumagin (Shu). Dashed lines indicate approximate 95% confidence limits of the regression lines. Horizontal lines in lower right plots indicate mean response with 95% pointwise confidence intervals. Width of bars is proportional to number of observations. Fitted lines in each panel are adjusted for the effects of all other variables. Standardized effects in each plot (y-axes, no units) are on the same scale for comparison. Effects are standardized because the estimated CPUE at a given value of a variable is dependent upon the levels of all other variables.
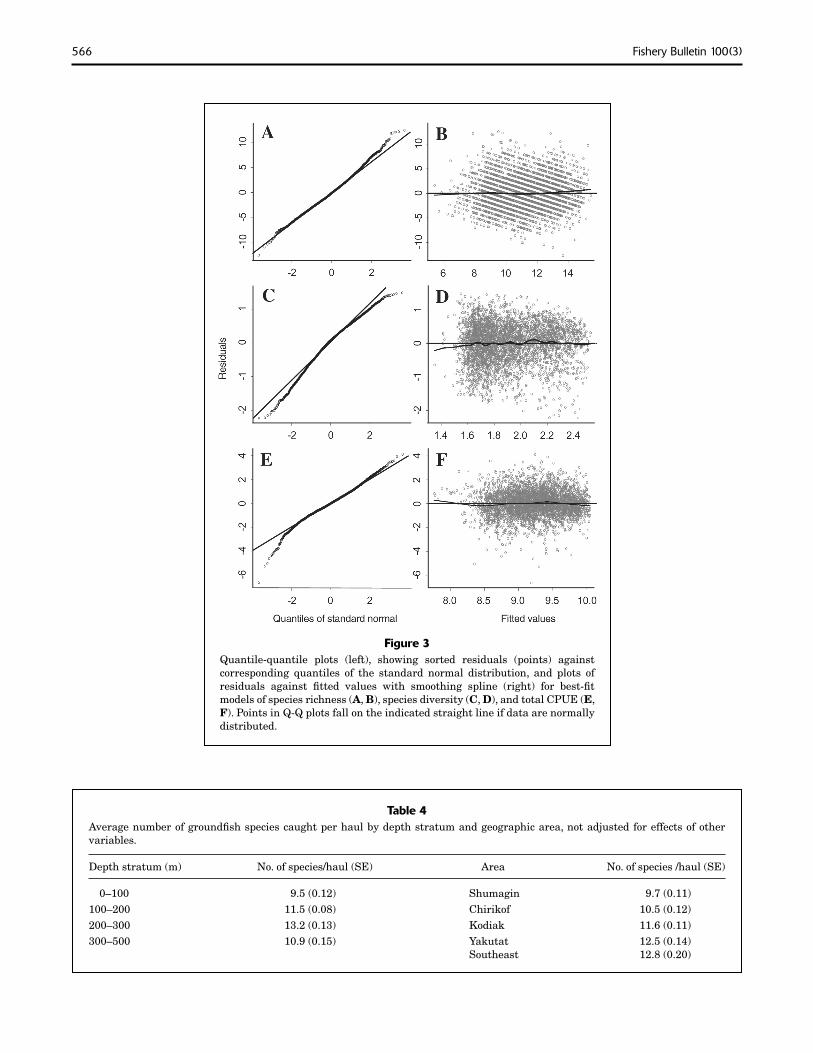
to decrease during the last month of the survey season and showed some variation across years (Fig. 2). There was no consistent trend in species richness with temperature (not shown). One of the Japanese trawls (gear type 717, Fig. 2) tended to have a much smaller number of species per haul on average, suggesting a low catchability for at least some species. Residuals from the best model were close to normally distributed (Fig. 3, A and B) and showed no apparent trends with any of the covariates or over time.
Only a very small portion of the variability in species diversity (Shannon-Wiener index) was accounted for by the best regression (Pseudo-r2=0.17). Depth had the strongest effect on species diversity with highest diversities observed at intermediate depths (Fig. 4). Diversity generally increased with the number of species, which showed a very similar trend with depth (Fig. 2). Diversity was higher in the eastern Gulf and decreased west of Prince William Sound (Figs. 4 and 5). It showed little variation over time, both within the survey period and across years. However,
566 Fishery Bulletin 100(3)
Figure 3 Quantile-quantile plots (left), showing sorted residuals (points) against corresponding quantiles of the standard normal distribution, and plots of residuals against fitted values with smoothing spline (right) for best-fit models of species richness (A, B), species diversity (C, D), and total CPUE (E, F). Points in Q-Q plots fall on the indicated straight line if data are normally distributed.
Table 4 Average number of groundfish species caught per haul by depth stratum and geographic area, not adjusted for effects of other variables.
Depth stratum (m) No. of species/haul (SE) Area No. of species /haul (SE)
0–100 9.5 (0.12) Shumagin 9.7 (0.11) 100–200 11.5 (0.08) Chirikof 10.5 (0.12) 200–300 13.2 (0.13) Kodiak 11.6 (0.11) 300–500 10.9 (0.15) Yakutat 12.5 (0.14)
Southeast 12.8 (0.20)

Mueter and Norcross: Spatial and temporal patterns in the demersal fish community off Alaska 567
0
-0.4
0.4
0 1000 2000
Alongshore distance (km)
ShuChi
KodYakSE
0 100 200 300 400 500
Depth (m)
Julian day Year
'84 '87 '90 '93 '96140 180 220 260
0
-0.4
0.4
0
-0.4
0.4
0
-0.4
0.4
Effe
ct o
n sp
ecie
s di
vers
ity
Figure 4 Trends in species diversity (Shannon-Wiener index) by depth, alongshore distance, Julian day, and year (area swept and gear type were not significant). For details see Figure 2.
95% confidence intervals suggest a significant drop in species diversity between 1993 and 1996. Area swept and temperature did not enter the best model, suggesting they had no strong effect on species diversity. Diagnostic plots indicated approximate normality and no apparent trends in the residuals (Fig. 3, C and D).
Total biomass (CPUE) showed strong trends with depth and alongshore distance (Fig. 6) but had high variability around these trends (Pseudo-r2=0.14). Average CPUE increased sharply with depth to about 150 m—a trend that reflected, on average, approximately a doubling of CPUE between the shallowest sampling stations and stations at 150–200 m depth. A similarly strong gradient exists in the alongshore direction between Yakutat (km 700) and the Kodiak Island area (km 1500), where total CPUE has a pronounced maximum. Estimates of the spatial trend suggested that highest CPUEs are found around Kodiak Island, particularly in Shelikof Strait, along the shelf break and upper slope, and on the banks and in the gullies northeast of Kodiak Island (Fig. 5). Total CPUE appeared to decrease significantly after approximately Julian day 240 (Aug. 28); however, Julian day was confounded with alongshore distance (r =–0.38, Table 3) and the effect could in part be due to lower abundance in the eastern GOA, which was often sampled later than other areas. Gear effects were significant and indicated a lower catch rate for one of the Japanese trawls (gear 717, Fig. 6). The estimated time trend (Fig. 6) indicated a significant increase
in total CPUE between 1984 and 1996 (P<0.001), based on a chi-square test of the difference in residual deviances (Hastie and Tibshirani, 1990). We estimated that the combined CPUE of all groundfish species included in the analysis increased from a gulf-wide average of 14,786 kg/km2
in 1984 to 20,600 kg/km2 in 1996 (Table 2), representing an increase of 40%. No significant effect of temperature on total CPUE was found. Diagnostic plots indicated approximate normality and no apparent trends in the residuals (Fig. 3, E and F).
The biomass of 72 groundfish species in 240 stratum/ year combinations could effectively be summarized by an NMDS ordination in three dimensions (stress=0.085). Our findings suggested that the main gradients along which species composition varied were depth and alongshore distance, whereas temperature and temporal gradients (within and between years) had relatively minor effects on these indices of species composition. The first two dimensions (axes 1 and 2) of the ordination accounted for 67% and 19% of the overall variation respectively. An ordination plot of the first two axes indicated that the sample strata were most clearly separated along the depth gradient (Fig. 7). The alongshore gradient was roughly perpendicular to the depth gradient and clearly distinguished areas Southeast from the other areas (Fig. 7). Yakutat strata occupy an intermediate position between the Southeast strata and strata in other areas. Kodiak, Chiniak, and Shumagin were similar in species composition, as sug-

568 Fishery Bulletin 100(3)
Figure 5 Spatial trends in species diversity (Shannon-Wiener index) and total CPUE. The trends are based on predictions from the best regression models for diversity and total CPUE (see Fig. 4 and Fig. 6).
gested by a substantial overlap in the location of strata in the ordination diagram. A three-way analysis of variance for each of the three axes by depth stratum, area, and year indicated highly significant differences for all three axes between depth strata and geographic areas, but weak and nonsignificant differences among years (Table 5), suggesting a relatively stable species composition from 1984 to 1996. Residuals from the ANOVA for axis 1 and 3 were approximately normally distributed and showed no apparent violations of the ANOVA assumptions. Residuals for axis 2 had a very long-tailed distribution, but an analysis of variance based on ranks yielded very similar results; therefore the conclusions appear to be robust.
Ordinations of individual hauls within each year confirmed that depth and alongshore distance explained much of the variation in species composition within years. The species composition in each year was effectively sum
marized by ordinations in five dimensions with Kruskal’s stress values that were very close to 0.1 in all years (axes 1–5 in Table 6). The first axis of all five ordinations accounted for 42–47% of the variation in species composition. This axis, as well as most of the other axes, was most strongly related to the depth gradient in all years (Table 6). Alongshore distance appeared to explain a relatively small proportion of the variance in species composition. However the pseudo-coefficients of partial determination for alongshore distance typically increased substantially if Julian day was excluded from the model because of high correlations between Julian day and alongshore distances. Regressions of the axes on depth and alongshore distance alone resulted in pseudo-r2 values that were very close to those from models that included Julian day. Furthermore, residuals from these models were not significantly related to Julian day for any year (P>0.5) based on linear regres-

569Mueter and Norcross: Spatial and temporal patterns in the demersal fi sh community off Alaska
Julian day Year
'84 '87 '90 '93 '96140 180 220 260
0 1000 2000
Alongshore distance (km)
ShuChi
KodYakSE
0 100 200 300 400 500
Depth (m)
-1.0 -0.4
-0.5
0.0
0.5
-0.8
0.0
0.4
-0.6
-1.0
-0.2
0.2
-0.6
-0.2
0.2
0.6
-0.4
-0.8
0.0
0.4
160 172
710
717
Gear type
Effe
ct o
n to
tal C
PU
E
Figure 6Trends in total CPUE by depth, alongshore distance, Julian day, year, and gear type. For details see Figure 2
-0.4
-0.2
0
0.2
0.4
-0.6 -0.4 -0.2 0 0.2 0.4 0.6
Axis 1
Axi
s 2
Shumagin Chirikof KodiakYakutat Southeast
-0.4
-0.2
0
0.2
0.4
-0.6 -0.4 -0.2 0 0.2 0.4 0.6
Axis 1
Axi
s 2
0-100 m 100-200 m200-300 m 300-500 mA
B
Figure 7Plots of the fi rst two axes from an NMDS (mul-tidimensional scaling) ordination of 48 strata sampled during each of fi vfe years. Distances between two points (strata) in the ordination dia-gram approximately refl ect their dissimilarity in terms of species composition. Symbols indicate depth strata (A) and geographic area (B).
sions). These fi ndings suggest that species composition within the summer remains relatively stable over the 14–16 week survey period.
To examine effects of temperature on species composi-tion we used only those hauls from the 1993 and 1996 data for which temperature measurements were avail-able (n=726 and n=716 respectively, Table 1). Results for other years are not reported because of the relatively small number of temperature measurements. The avail-able temperature data for earlier years were often local-ized in certain strata, whereas large areas had few if any measurements. The lack of contrast did not allow defi nite conclusions with regards to the temperature effect. For 1993 and 1996, we repeated the GAM analysis for the fi ve axes of species composition with temperature included. Temperature effects were apparently large. However, wide confi dence intervals and inconsistent patterns between years suggest that the apparent effects were at least in
part due to confounding of temperature with alongshore distance and depth. Therefore we fi rst adjusted for the effects of depth and alongshore distance using the re-gression models summarized in Table 6. Temperature explained a small but signifi cant portion of the remaining residual variation in three of the ordination axes in both 1993 and 1996 (Pseudo-r2 values <0.1).
To identify which species were most strongly related to the major gradients we computed rank correlations between each species and the three axes of species compo-sition based on the NMDS ordination of strata averages. We considered all species that had a positive or negative rank correlation of at least 0.4 with one of the axes for further examination, based on a visual inspection of scat-terplots. Species associated with the fi rst two axes were clearly separated along gradients of depth and alongshore distance (Figs. 8 and 9). The fi rst axis was positively cor-related with a number of deep-water species that were

570 Fishery Bulletin 100(3)
Table 5 Analysis of variance of three axes of species composition by statistical area, depth stratum, and year.
Effect df Sum of squares Mean squares F-value P-value
Axis 1 Depth stratum 3 129.793 43.264 613.856 0.000 Area 10.350 2.588 36.713 0.000 Year 0.665 0.166 2.358 0.056 Depth stratum:area 11 1.756 0.160 2.265 0.014 Depth stratum:year 12 0.412 0.034 0.487 0.920 Area:year 0.291 0.018 0.258 0.998 Depth stratum:area:year 44 0.839 0.019 0.271 1.000 Residuals 10.220 0.070
Axis 2 Depth stratum 3 6.601 2.200 37.581 0.000 Area 27.771 6.943 118.587 0.000 Year 0.346 0.087 1.478 0.212 Depth stratum:area 11 1.091 0.099 1.694 0.080 Depth stratum:year 12 0.366 0.030 0.521 0.899 Area:year 1.017 0.064 1.086 0.374 Depth stratum:area:year 44 0.815 0.019 0.317 1.000 Residuals 8.489 0.059
Axis 3 Depth stratum 3 0.478 0.159 1.231 0.301 Area 9.541 2.385 18.423 0.000 Year 0.615 0.154 1.188 0.318 Depth stratum:area 11 3.080 0.280 2.163 0.019 Depth stratum:year 12 0.212 0.018 0.137 1.000 Area:year 0.698 0.044 0.337 0.992 Depth stratum:area:year 44 1.365 0.031 0.240 1.000 Residuals 18.773 0.129
4 4
16
145
4 4
16
145
4 4
16
145
more abundant in the eastern GOA, but generally had a broad geographic distribution. The deep-water species included several rockfish species, rex sole (Glyptocephalus zachirus), Dover sole (Microstomus pacificus), sablefish, and myctophids. The alongshore distribution of CPUE suggests that many species displayed local maxima in biomass on the scale of 100–200 km (Fig. 8). The first axis was negatively correlated with a group of shallow-water species that were typically more abundant in the western GOA. The shallow-water group included a number of flatfish species, gadids, and sculpins. Many of the shallow water species had pronounced peaks in biomass at the longitude of Kodiak Island (km 1400–1700) and between the Shumagin Islands and Sanak Island (km 2000–2200).
The second axis was positively correlated with a “shelf break” group. Most of the species in this group had a pronounced peak in biomass near 200 m and were found primarily in the eastern GOA (Fig. 9). The group included a number of rockfish species, as well as lingcod (Ophiodon elongatus), petrale sole (Eopsetta jordani), and slender sole (Lyopsetta exilis). Species that were negatively or positively associated with the third axis (not shown) were not differentiated along gradients of depth and alongshore
distance, suggesting that the third axis, which accounted for 14% of the overall variation, was related to other, unidentified gradients.
Finally, we examined trends in species composition over the 12-year period from the first survey in 1984 to the most recent survey in 1996 in more detail based on the NMDS ordination of species CPUEs averaged by stratum (Fig. 7). Although the individual indices of species composition were not significantly different among years (Table 5), a canonical correlation between the ordination axes and time (survey years) indicated a highly significant trend (P<0.001) in species composition. The linear combination of ordination axes that maximized the correlation with survey year was used as an index for the trend in species composition (“time index”). The index increased in most areas and depth strata between 1984 and 1996. Eight species that were positively correlated with the time index showed significant and increasing trends in either CPUE-where-present or frequency of occurrence for at least two area-depth stratum combinations (Fig. 10). Skates were most strongly associated with the index and showed a widespread increase in CPUE-where-present and frequency of occurrence, particularly in the Chirikof,

Mueter and Norcross: Spatial and temporal patterns in the demersal fish community off Alaska 571
Table 6 Results from NMDS (multidimensional scaling) ordinations of species CPUEs in five dimensions (axes 1−5) by year, and GAM (generalized additive models) results for regressions of axis scores on depth, alongshore distance, and Julian day. Variance indicates proportion of overall variation accounted for by each axis. Stress indicates Kruskal’s stress values for each ordination. Numbers for the full model indicate pseudo-r2 values for the best model fit (1 – deviance of the best fitting model/deviance of the null model). Numbers following individual variables indicate pseudo-coefficient of partial determination, computed from a reduced model that excluded the variable (= 1 – deviance of best model / deviance of reduced model). Only coefficients of determination exceeding 0.1 are shown. Coefficient of determination for Julian day did not exceed 0.1 in any year or for any axis. AD = alongshore distances.
Year Axis 1 Axis 2 Axis 3 Axis 4 Axis 5 Stress
1984 Variance 44% 14% 11% 0.102 Full model 0.84 0.26 0.13 Depth 0.19 0.42 AD 0.13 0.12
1987 Variance 42% 14% 10% 0.100 Full model 0.77 0.32 0.21 Depth 0.67 0.28 0.17 AD 0.24
1990 Variance 42% 15% 10% 0.096 Full model 0.83 0.29 0.16 Depth 0.69 0.17 0.10 AD 0.12 0.17
1993 Variance 47% 13% 11% 0.098 Full model 0.81 0.37 0.31 Depth 0.26 0.42 0.27 AD 0.21
1996 Variance 44% 14% 10% 0.099 Full model 0.78 0.31 0.34 Depth 0.71 0.18 0.17
19% 12% 0.28 0.58
0.74 0.12
22% 12% 0.22 0.36 0.11 0.19
0.15
21% 12% 0.37 0.34 0.23 0.27
0.11
18% 11% 0.24 0.49
0.71
20% 12% 0.22 0.55 0.11 0.40
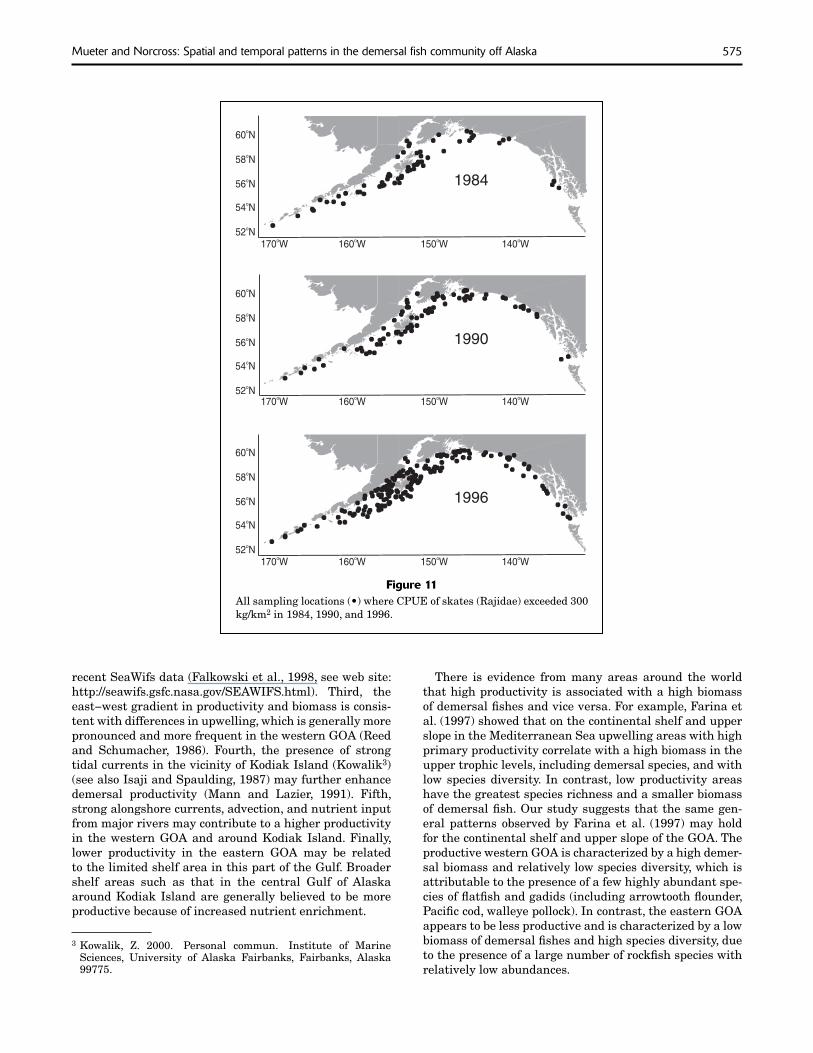
Kodiak, and Yakutat areas (Figs. 10 and 11). Another elasmobranch (Pacific sleeper shark, Somniosus pacificus), two osmerids (capelin, Mallotus villosus, and eulachon, Thaleichthys pacificus), three flatfish species (Dover sole, rex sole, and arrowtooth flounder), and one rockfish species (Pacific Ocean perch, Sebastes alutus) increased significantly in one or more areas and depth strata (Fig. 10). The frequency of occurrence of capelin in the trawl survey increased significantly, whereas CPUE-where-present did not change or, in some cases, decreased significantly. Closer examination revealed that the increase in frequency of occurrence occurred primarily between 1993 and 1996 (Fig. 12). Capelin were caught in 14% of all hauls in 1996, compared to only 7% in 1993. Changes in the CPUEwhere-present of three flatfish species differed among species. Although Dover sole increased primarily in the eastern GOA (Yakutat and Southeast), rex sole increased most strongly in the Chirikof area (Fig. 10). In contrast, arrowtooth flounder increased in all areas, but only in the 0–100 m depth stratum. Although all three flatfish species increased significantly over time, estimates of their gulfwide average CPUEs were highest in 1990 and declined from 1990 to 1996 (Table 2). Both the frequency of occurrence and CPUE-where-present of Pacific Ocean perch
increased strongly in the Chirikof area, and frequency of occurrence decreased in the Yakutat area.
CPUE-where-present of the four species that were negatively correlated with the time index did not decrease significantly, and, in the case of rock sole (Lepidopsetta spp.), even increased in some areas (Fig. 13). However, frequency of occurrence decreased significantly for three of the species, particularly for bigmouth sculpin (Hemitripterus bolini, Fig. 13).
Discussion
Research survey data provide standardized indices of relative abundance that often track abundance trends more accurately than methods that use commercial catch data (Pennington and Stromme, 1998). However, results need to be interpreted with caution because the catchability of species may change over time owing to changes in survey gear, vessel type, spatial distribution, or the length composition of a population. In our study we were particularly concerned that differences in gear type (Table 1) might bias our results. We opted to include gear type directly into the analysis as a “nuisance” variable, instead

572 Fishery Bulletin 100(3)
Depth (m)
0 00 400
Lepidopsetta sp.Hemilepidotus jordani
Hippoglossoides elassodonMyoxocephalus sp.
Hippoglossus stenolepisGadus macrocephalus
Isopsetta isolepisLimanda aspera
Hexagrammos decagrammusPlatichthys stellatus
Pleuronectes quadrituberculatusPodothecus acipenserinus
Theragra chalcogrammaRajidae unident.Mallotus villosus
Microgadus proximusTrichodon trichodon
Parophrys vetulusTriglops sp.
Bathymaster signatusGymnocanthus sp.
Sebastes helvomaculatusGlyptocephalus zachirus
Sebastes zacentrusLyopsetta exilis
Albatrossia pectoralisMyctophidae
Anoplopoma fimbriaSebastes alutus
Sebastes borealisSebastes babcocki
Sebastes aleutianusMicrostomus pacificus
Malacocottus sp.Sebastolobus alascanus
Alongshore distance (km)
0 000 2000
Lepidopsetta sp.Hemilepidotus jordani
Hippoglossoides elassodonMyoxocephalus sp.
Hippoglossus stenolepisGadus macrocephalus
Isopsetta isolepisLimanda aspera
Hexagrammos decagrammusPlatichthys stellatus
Pleuronectes quadrituberculatusPodothecus acipenserinus
Theragra chalcogrammaRajidae unident.Mallotus villosus
Microgadus proximusTrichodon trichodon
Parophrys vetulusTriglops sp.
Bathymaster signatusGymnocanthus sp.
Sebastes helvomaculatusGlyptocephalus zachirus
Sebastes zacentrusLyopsetta exilis
Albatrossia pectoralisMyctophidae
Anoplopoma fimbriaSebastes alutus
Sebastes borealisSebastes babcocki
Sebastes aleutianusMicrostomus pacificus
Malacocottus sp.Sebastolobus alascanusA
B
Figure 8Distribution of CPUE by depth and alongshore distance for all species that had a strong positive (A) or negative (B) association with the fi rst index of species composition derived from an NMDS ordination of abun-dances averaged by strata. Widths of dark bands are proportional to average CPUE of a given species. Average CPUE as a function of depth and alongshore distance was estimated by using a scatterplot smoother (cubic smoothing spline). Degree of smoothing was determined by cross-validation for each species separately.
of standardizing the CPUE of each species to a common gear standard prior to analysis because of large uncertain-ties in the estimation of fi shing power coeffi cients (Munro and Hoff, 1995). The estimated differences among gear types agreed qualitatively with results in Munro and Hoff (1995) for those species for which these authors estimated fi shing power. Nevertheless, differences among gear types may have biased some of our results. In spite of these problems, the survey data used in our study provided the best available indicator of relative changes in species com-position and distribution for many species of ecological or commercial interest.
The observed trends in species richness, diversity, and biomass, as well as in the CPUE of individual species, showed that depth is an important gradient structuring the groundfi sh community in the GOA, and that the shelf break and upper slope (at 150–300 m) is a particularly
important depth range. Strong depth-dependent gradi-ents are found in many other demersal fi sh communities inhabiting shelf and upper slope regions (Colvocoresses and Musick, 1984; Gomes et al., 1992; Blaber et al., 1994; Fujita et al., 1995; Jay, 1996; Farina et al., 1997; Mahon et al., 1998). Distinct depth preferences of many individual species (Fig. 8) result in a turnover of species along the depth gradient and lead to the observed patterns in rich-ness, diversity, and biomass. Similar to the altitude gra-dient in terrestrial environments (Brown and Lomolino, 1998), depth appears to be the major ecological gradient structuring benthic communities in the ocean from shal-low, nearshore areas (Mueter and Norcross, 1999) to the abyssal plain (Merrett, 1992).
Our results suggest a pronounced peak in species rich-ness, diversity, and total biomass at intermediate depths. Species richness as well as biomass of demersal fi sh com-
2 1

573Mueter and Norcross: Spatial and temporal patterns in the demersal fi sh community off Alaska
Depth (m)
0 00 400
Albatrossia pectoralis
Hemitripterus bolini
Sebastes aleutianus
Eopsetta jordani
Sebastes ciliatus
Hydrolagus colliei
Sebastes elongatus
Lyopsetta exilis
Sebastes ruberrimus
Sebastes proriger
Parophrys vetulus
Sebastes helvomaculatus
Sebastes zacentrus
Sebastes variegatus
Sebastes brevispinis
Squalus acanthias
Ophiodon elongatus
Alongshore distance (km)
0 000 2000
Albatrossia pectoralis
Hemitripterus bolini
Sebastes aleutianus
Eopsetta jordani
Sebastes ciliatus
Hydrolagus colliei
Sebastes elongatus
Lyopsetta exilis
Sebastes ruberrimus
Sebastes proriger
Parophrys vetulusSebastes helvomaculatus
Sebastes zacentrus
Sebastes variegatus
Sebastes brevispinis
Squalus acanthias
Ophiodon elongatusA
B
Figure 9Distribution of CPUE by depth and alongshore distance for all spe-cies that had a strong positive (A) or negative (B) association with the second index of species composition derived from an NMDS ordination of abundances averaged by strata. For details see Figure 8.
munities are generally higher on the continental shelf than on adjacent slope regions, refl ecting a strong gradient with depth (Day and Pearcy, 1968; Colvocoresses and Mu-sick, 1984; Farina et al., 1997). In contrast to our results for the GOA, these studies did not fi nd peaks in richness or biomass at intermediate depths. This may have been partly the result of aggregating data into relatively large depth ranges in those studies (and the associated loss in resolution), whereas our study examined patterns in rich-ness and biomass along a continuous depth gradient.
We suggest that the high biomass of demersal fi shes near the shelf break (in particular the biomass of fl at-fi shes, rockfi shes, and gadids) refl ects favorable feeding conditions at this depth range. Favorable feeding condi-tions may result from enhanced benthic productivity or availability of suitable prey at this depth. The region along the shelf break and over the upper slope has high primary productivity that may be driven by shelf-break fronts, seasonal upwelling, strong alongshore currents, and tidal mixing (Parsons, 1986). Shelf-break fronts have frequently been observed in the GOA (Weingartner2) and can enhance phytoplankton and zooplankton biomass, particularly when coupled with upwelling (Mann and Lazier, 1991), which is common during the summer in the western GOA (Reed and Schumacher, 1986). We speculate that increased production in the water column becomes available to the benthos when sinking particles are consumed by larger
organisms such as shrimp or euphausiids, which are often concentrated near the shelf break and are consumed by demersal fi sh (Mackas et al., 1997; Robinson and Gomez-Gutierrez, 1998). The most abundant demersal fi shes in the GOA, arrowtooth fl ounder and walleye pollock, as well as several rockfi sh species, have been shown to feed near or off the bottom on euphausiids, mysids, copepods, shrimps, and other fi shes (Yang, 1993). Thus, a region of enhanced benthic productivity near the shelf break is consistent with the total biomass of groundfi sh being highest just inshore of the shelf break between 150 and 200 m (Fig. 6).
In addition to depth (or elevation), latitude is a major ecological gradient in both marine and terrestrial environ-ments. Demersal fi shes on the continental shelf off both the east coast of North America (Mahon et al., 1998) and the U.S. west coast (Jay, 1996) form loose assemblages that are clearly separated by latitude. Although the latitudinal extent of our study region is relatively small, we found strong alongshore (roughly corresponding to longitudi-nal) differences in community structure from the eastern GOA to the Aleutian Islands, with the steepest gradient between the Yakutat and Kodiak areas. This gradient was apparent in species richness and diversity (Figs. 2 and 4), total CPUE (Fig. 6), and indices of species composition (Fig. 7). The alongshore gradient is perpendicular to the depth gradient, with depth generally increasing in the offshore direction. However, these two variables were moderately correlated (–0.32, ranging from –0.20 to –0.44 in individual years), primarily due to the larger number of shallow stations in the western part of the study area and a relative lack of shallow stations in Southeast Alaska.
2 Weingartner, T. J. 2000. Personal commun. Institute of Ma-rine Sciences, University of Alaska Fairbanks, Fairbanks, Alaska99775.
2 1

- -
- - - -
-
--
-
574 Fishery Bulletin 100(3)
Depth (m) Shumagin Chirikof Kodiak YakutatSoutheast Shumagin Chirikof Kodiak Yakutat Southeast 0 - 100 CPUE ++
FO ++ 100 - 200 CPUE + ++ +
FO ++ ++ ++ 200 - 300 CPUE ++ ++ + +
FO + + 300 - 500 CPUE
FO ++ +
Shumagin Chirikof Kodiak YakutatSoutheast Shumagin Chirikof Kodiak Yakutat Southeast 0 - 100 CPUE +
FO + ++ ++ + ++ 100 - 200 CPUE
FO + + ++ ++ + 200 - 300 CPUE - +
FO ++ ++ ++ ++ ++ 300 - 500 CPUE
FO
Depth (m) Shumagin Chirikof Kodiak YakutatSoutheast Shumagin Chirikof Kodiak Yakutat Southeast 0 - 100 CPUE + +
FO -100 - 200 CPUE ++ ++ ++ ++ +
FO ++ - ++ 200 - 300 CPUE ++ +
FO + 300 - 500 CPUE + +
FO - +
Shumagin Chirikof Kodiak YakutatSoutheast Shumagin Chirikof Kodiak Yakutat Southeast 0 - 100 CPUE ++ ++ ++ ++
FO ++ + + -100 - 200 CPUE + +
FO ++ ++ -200 - 300 CPUE + +
FO 300 - 500 CPUE ++
FO +
Microstomus pacificus Glyptocephalus zachirus
Atheresthes stomias Sebastes alutus
Rajidae (skates) Somniosus pacificus
Mallotus villosus Thaleichthys pacificus
Figure 10 Changes in CPUE-where-present and frequency of occurrence (FO) by depth stratum and area for eight species that increased significantly over time. Significant changes at the 5% level are indicated by ‘+’ or ‘-’. Changes that were significant at the 1% level are indicated by ‘++‘ or ‘--’. Areas-depth strata where a species was not caught in any of the five survey years are shaded. Significance was tested by using generalized linear models including gear effects (see text).
+
+
+
+
+
++
+
+
-
Therefore, the alongshore trends may be partly due to differences in the distribution of sampling depth between the eastern and western GOA resulting from differences in topography. Nevertheless, we do not believe that the magnitude of correlations (Table 3) presents a serious problem for the general patterns that were observed for CPUE, diversity, and species composition.
Alongshore patterns in CPUE (Figs. 5 and 6) indicate a higher biomass of demersal fishes in the western GOA, particularly in the Kodiak Island area. If the higher bio
mass is related to the availability of food, this pattern may reflect higher benthic productivity in the Kodiak Island region. There are several pieces of evidence that suggest a higher productivity in this region. First, there is a higher benthic biomass and productivity of infaunal organisms on the Chirikof and Kodiak shelf, compared with the Yakutat and Southeast areas (Semenov, 1965, as cited in Feder and Jewett, 1986). Second, enhanced primary productivity in the western GOA is evident in estimates from coastsl zone color scanner (CZCS) data and from more
575Mueter and Norcross: Spatial and temporal patterns in the demersal fi sh community off Alaska
170 Wo 160 Wo 150 Wo 140 Wo
54 No
52 No
56 No
58 No
60 No
170 Wo 160 Wo 150 Wo 140 Wo
54 No
52 No
56 No
58 No
60 No
170 Wo 160 Wo 150 Wo 140 Wo
54 No
52 No
56 No
58 No
60 No
1996
1990
1984
Figure 11All sampling locations (•) where CPUE of skates (Rajidae) exceeded 300 kg/km2 in 1984, 1990, and 1996.
recent SeaWifs data (Falkowski et al., 1998, see web site: http://seawifs.gsfc.nasa.gov/SEAWIFS.html). Third, the east−west gradient in productivity and biomass is consis-tent with differences in upwelling, which is generally more pronounced and more frequent in the western GOA (Reed and Schumacher, 1986). Fourth, the presence of strong tidal currents in the vicinity of Kodiak Island (Kowalik3) (see also Isaji and Spaulding, 1987) may further enhance demersal productivity (Mann and Lazier, 1991). Fifth, strong alongshore currents, advection, and nutrient input from major rivers may contribute to a higher productivity in the western GOA and around Kodiak Island. Finally, lower productivity in the eastern GOA may be related to the limited shelf area in this part of the Gulf. Broader shelf areas such as that in the central Gulf of Alaska around Kodiak Island are generally believed to be more productive because of increased nutrient enrichment.
There is evidence from many areas around the world that high productivity is associated with a high biomass of demersal fi shes and vice versa. For example, Farina et al. (1997) showed that on the continental shelf and upper slope in the Mediterranean Sea upwelling areas with high primary productivity correlate with a high biomass in the upper trophic levels, including demersal species, and with low species diversity. In contrast, low productivity areas have the greatest species richness and a smaller biomass of demersal fi sh. Our study suggests that the same gen-eral patterns observed by Farina et al. (1997) may hold for the continental shelf and upper slope of the GOA. The productive western GOA is characterized by a high demer-sal biomass and relatively low species diversity, which is attributable to the presence of a few highly abundant spe-cies of fl atfi sh and gadids (including arrowtooth fl ounder, Pacifi c cod, walleye pollock). In contrast, the eastern GOA appears to be less productive and is characterized by a low biomass of demersal fi shes and high species diversity, due to the presence of a large number of rockfi sh species with relatively low abundances.
3 Kowalik, Z. 2000. Personal commun. Institute of Marine Sciences, University of Alaska Fairbanks, Fairbanks, Alaska 99775.

576 Fishery Bulletin 100(3)
170 Wo 160 Wo 150 Wo 140 Wo
54 No
52 No
56 No
58 No
60 No
170 Wo 160 Wo 150 Wo 140 Wo
54 No
52 No
56 No
58 No
60 No
170 Wo 160 Wo 150 Wo 140 Wo
54 No
52 No
56 No
58 No
60 No
1996
1990
1984
Figure 12All sampling locations (•) where capelin (Mallotus villosus) were caught in 1984, 1990, and 1996.
In contrast to strong spatial and depth gradients, there was little evidence for strong temporal gradients in the GOA groundfi sh community between 1984 and 1996, except for the pronounced increase in total CPUE and a potential decrease in species diversity after 1993. The species composition of the groundfi sh community in the GOA, as refl ected in our indices, has remained relatively stable from 1984 through 1996. Furthermore, a visual comparison of the indices mapped by year (not shown) suggests that relative species composition is character-ized by spatial patterns that were stable from 1984 to 1996. Similarly, no apparent shifts in individual species distributions were found. The apparent stability of spatial patterns in the GOA may simply refl ect stability in species composition over the time period of the study, as well as a period of relatively moderate variations in the physical environment. It also suggests that recent levels of fi shing may not have had a strong impact on the relative species composition, or possibly had a stabilizing effect. The ob-served composition of the groundfi sh community, which is
currently dominated by relatively long-lived species, may also contribute to its own stability.
Some of the most pronounced changes over time oc-curred in noncommercial species such as skates and capelin (Fig. 10). Whether these changes are directly or in-directly linked to fi shing or are the result of environmen-tal changes is currently unknown. Interestingly, capelin decreased in abundance in some areas and depth ranges but have been caught at an increasing proportion of the sampling stations in more recent surveys. These changes appear to refl ect a “spreading out” of the population at relatively fi xed numbers, possibly in response to the in-creasing abundance of large predatory fi shes.
Other studies of groundfi sh communities have docu-mented relatively stable spatial patterns in species com-position over time periods of 10–20 years (Colvocoresses and Musick, 1984; Gabriel, 1992; Gomes et al., 1992; Jay, 1996). In contrast, Gomes et al. (1995) observed a sharp decline in the biomass and abundance of a number of com-mercial groundfi sh species on the Newfoundland-Labra-

-- -- --
-- -- -- --
-- -- --
-- -- --
--
Mueter and Norcross: Spatial and temporal patterns in the demersal fish community off Alaska 577
Depth (m) Shumagin Chirikof Kodiak Yakutat Southeast
0-100 CPUE FO
100-200 CPUE FO
200-300 CPUE FO
300-500 CPUE FO -
Shumagin Chirikof Kodiak Yakutat Southeast
0-100 CPUE FO -
100-200 CPUE FO
200-300 CPUE FO
300-500 CPUE FO
Shumagin Chirikof Kodiak Yakutat Southeast
0-100 CPUE ++ + FO -
100-200 CPUE + FO - -
200-300 CPUE FO -
300-500 CPUE FO
Myoxocephalus spp.
Lepidopsetta spp.
Hemitripterus bolini
Figure 13 Changes in CPUE-where-present and frequency of occurrence (FO) by depth stratum and area for three species that decreased significantly over time. Significant changes at the 5% level are indicated by ‘+’ or ‘-’. Changes that were significant at the 1% level are indicated by ‘++’ or ‘--’. Areas-depth strata where a species was not caught in any of the five survey years are shaded. Significance was tested by using generalized linear models including gear effects (see text).
-
dor shelf from 1978 to 1991 and dramatic changes in the spatial distribution of groundfish assemblages after 1987. They attributed the changes primarily to intense exploitation, although environmental effects were likely at work as well. Similarly, on the continental shelf off Northwest Spain, significant decreases in commercial groundfish species, and a concurrent increase of several noncommercial species, can be attributed to a combination of fishing and environmental changes (Farina et al., 1997).
The recent period of stability in the GOA can be contrasted with a period of dramatic changes in the late 1970s and early 1980s that affected many parts of the North Pacific ecosystem including groundfish communities (e.g. Beamish, 1995). There is strong evidence of a shift in species composition of at least the nearshore
demersal communities during this time period (Piatt and Anderson, 1996; Anderson and Piatt, 1999; Mueter and Norcross, 2000). Whether similarly dramatic changes occurred in offshore demersal communities is not known due to the lack of long time series for most species.
Estimated biomass trends for important commercial species based on recent stock assessment data (NPFMC1) and historical surveys (Ronholt et al.4) suggest that the
4 Ronholt, L. L., H. H. Shippen, and E. S. Brown. 1978. Demersal fish and shellfish resources of the Gulf of Alaska from Cape Spencer to Unimak Pass 1948–1976: a historical review. Proc. rep., vols. 1–3, 872 p. Northwest and Alaska Fisheries Center, National Marine Fisheries Service, NOAA, 7600 Sand Point Way N.E., Seattle, WA.

578 Fishery Bulletin 100(3)
Figure 14 Proportional biomass composition of Gulf of Alaska groundfish communities from the 1960s through the 1990s as estimated from bottom trawl surveys. All surveys used similar gear, but sampling in 1961 and 1973–76 was limited to 0–400 m depth. Total number of hauls is indicated below each time period.
rex sole
1961 (n =555)
1973-76 (n =310)
1984/87 (n =1625)
1993/96 (n =1581)
arrowtooth flounder
other flatfish
tanner crab
red king crab
walleye pollock
sculpins
sablefish
Pacific cod
Pacific Ocean perch
other roundfish
other rockfish
Pacific halibut
flathead sole
rock sole
elasmobranchs
Dover sole
composition of the groundfish community on the shelf and upper slope has changed substantially since the early 1960s. Resource assessment surveys were conducted in 1961 and 1973–76 with similar gear and covering much of the same area that was sampled during the later surveys. Survey data from the 1960s and 1970s have to be interpreted carefully because the sampling design, gear, and the spatial coverage of these surveys differ from the surveys done in the 1980s and 1990s.4 In particular, no stations below 400 m or east of 136°W were sampled in the early surveys. In spite of these caveats, changes in species composition among surveys are likely to reflect actual changes, at least for taxa that occur primarily above 400 m and west of 136°W. The data suggest a dramatic decrease in the relative abundance of red king crab (Paralithodes camtschaticus) and Tanner crab (Chionoecetes spp.), which together accounted for 22% of total CPUE in 1961, and for less than 1% after the 1970s (Fig. 14). The data indicated that walleye pollock became the dominant species in the mid-1970s, peaked in the early 1980s, and
has declined in relative abundance since then. Arrowtooth flounder replaced walleye pollock as the dominant groundfish species in the 1980s and 1990s. Pacific Ocean perch and other rockfishes have increased substantially in biomass since the 1970s. Sablefish and Pacific halibut, two of the commercially most valuable species, made up a substantially larger proportion of the total CPUE in the 1980s and 90s compared to earlier decades (Fig. 14). The relative abundance of sculpins declined from about 8% in the early 1960s to less than 0.1% in the 1980s and 1990s. The observed difference is likely to reflect a real decline in sculpin abundance of several orders of magnitude between the 1960s and 1980s. The decline appears to continue into the 1990s, as suggested by a decrease in the frequency of occurrence and biomass of two of the most abundant sculpin taxa (bigmouth sculpin and Myoxocephalus spp., see Fig. 13, Table 2).
The observed increase in overall groundfish biomass in the GOA from the 1980s to the 1990s (Fig. 6) is consistent with increases in the productivity of the northeast Pacific

Mueter and Norcross: Spatial and temporal patterns in the demersal fish community off Alaska 579
Ocean between the period of the 1960s and 70s and the 1980s and 90s. Polovina et al. (1995) suggested that the increase in primary and secondary productivity in the NE Pacific Ocean resulted from a shoaling of the mixed layer in the GOA by 20–30% associated with variations in the strength and position of the Aleutian low pressure system from the late 1970s to the late 1980s. Over the same time period large increases occurred in chlorophyll a levels (Venrick, 1995), zooplankton stocks (Brodeur and Pearcy, 1992; Brodeur et al., 1996), and upper trophic level species (Brodeur and Ware, 1995; Francis et al., 1998). Our study suggests that there has been a parallel increase in the biomass of demersal fish communities on the GOA shelf and upper slope since 1984, in response to the overall increase in productivity in the NE Pacific Ocean.
Given the increasing emphasis on ecosystem-based management, managers will have to rely on a variety of indicators in addition to traditional single-species biomass estimates to assess the status and health of an ecosystem (Yaffee et al., 1996). Indices of species composition like those used in this study, as well as survey-based assessments of noncommercial species, provide indicators that can help researchers in assessing changes in the community and can help managers in responding to such changes in a timely fashion.
Species richness and diversity are particularly simple, yet potentially very useful indices. The concept of marine biodiversity has received considerable attention in recent years (NRC, 1995) and should be included in planning and policy-making (Bengtsson et al., 1997). There is some evidence that bottom fishing can reduce the diversity of benthic communities (Collie et al., 1997) and, in turn, that changes in diversity can impact ecosystem function and productivity (Naeem et al., 1994). There was some indication in our study that the number of species and the diversity of the groundfish community in the GOA as measured by the Shannon-Wiener index decreased between 1993 and 1996 (Fig. 4). Although gear effects may have confounded differences among earlier surveys, the same gear and identical survey designs were used in both 1993 and 1996; thus the differences in species richness and diversity cannot be attributed to sampling effects and merit further study. The simple diversity indices used in our study were primarily chosen for practical considerations. Other indices, e.g. indices of beta-diversity, may be more appropriate for describing diversity of marine ecosystems and should be explored.
Multivariate techniques that summarize the major variation in species composition with a small number of indices (dimensions) provide another useful tool for monitoring changes in groundfish communities. Such indices provide sensitive indicators of change in community structure and can identify general trends that may not be apparent when using univariate measures (Austen and Warwick, 1989). The indices reduce the noise from random fluctuations of many individual stocks and the resulting “signal” may be used to test statistically for differences in species composition among areas or time periods, as well as helping to identify those species that show significant trends.
Another important part of an ecosystem approach to management is the monitoring of the abundance of noncommercial species, in addition to commercial species. Changes in the abundance of skates, sculpins, and other noncommercial species are examples of potentially important trends that may go undetected if management agencies focus on the assessment of commercial species only. Although these species comprise a small proportion of total biomass, such trends may be an early indication of changes in the groundfish community due to changes in the environment or fishing. Such monitoring, along with the monitoring of environmental variables, will further help to understand how and why groundfish communities change in response to environmental variation.
Current fisheries management often fails to account for the ecological complexities inherent in fish communities (Roberts, 1997). This is hardly surprising because of the focus of most stock assessment on individual stocks and on stock-recruitment relationships. Prediction becomes increasingly difficult as other species and environmental relationships are added to models. Nevertheless, the complexities should not discourage researchers from trying to understand species relationships and the response of species and communities to environmental variation and harvesting.
Knowledge of such relationships can improve management in several ways. First, it can help to explain why stocks are fluctuating in particular ways and help managers devise management strategies that take into account such fluctuations. Second, it can improve our understanding of multispecies or community-level relationships and can lead to better assessment methods that take such relationships into account. Third, it can lead to predictive hypotheses that can be explored and tested through rigorous research programs and adaptive management procedures. Ultimately, improved understanding of ecosystem processes will improve fisheries management only if it can reduce uncertainties in prediction. Thus the challenge remains to develop improved models that account for species relationships and environmental influences.
Acknowledgments
We thank Eric Brown and Michael Martin at the Alaska Fisheries Science Center, NOAA, Seattle, for granting us access to Gulf of Alaska bottom trawl survey data and for help with retrieving the data. The manuscript was greatly improved thanks to thorough reviews of earlier drafts by Ron Barry, Sue Hills, Mark Johnson, Terry Quinn, Bob Foy, and five anonymous reviewers. This work was funded in part by NOAA Saltonstall-Kennedy grant no. 50ABNF700086.
Literature cited
Anderson, P. J., and J. F. Piatt. 1999. Community reorganization in the Gulf of Alaska fol
lowing ocean climate regime shift. Mar. Ecol. Prog. Ser. 189: 117–123.

580 Fishery Bulletin 100(3)
Austen, M. C., and R. M. Warwick. 1989. Comparison of univariate and multivariate aspects of
estuarine meiobenthic community structure. Estuarine Coastal Shelf Sci. 29:23–32.
Beamish, R. J. 1995. Climate change and northern fish populations. Can.
Spec. Publ. Fish. Aquat. Sci. 121, 739 p. Bengtsson, J., H. Jones, and H. Setala.
1997. The value of biodiversity. Trends Ecol. Evol. 12:334– 336.
Blaber, S. J. M., D. T. Brewer, and A. N. Harris. 1994. Distribution, biomass and community structure of
demersal fishes of the Gulf of Carpentaria, Australia. Aust. J. Mar. Freshwater Res. 45:375–396.
Brodeur, R. D., and W. G. Pearcy. 1992. Effects of environmental variability on trophic inter
actions and food web structure in a pelagic upwelling ecosystem. Mar. Ecol. Prog. Ser. 84:101–119.
Brodeur, R. D., and D. M. Ware. 1995. Interdecadal variability in distribution and catch
rates of epipelagic nekton in the Northeast Pacific Ocean. In Climate change and northern fish populations (R. J. Beamish, ed.), p. 329–356. Can. Spec. Publ. Fish. Aquat. Sci. 121.
Brodeur, R., B. Frost, S. Hare, R. Francis, and W. J. Ingraham. 1996. Interannual variations in zooplankton biomass in the
Gulf of Alaska, and covariation with California Current zooplankton biomass. CALCOFI Rep. 37:80–99.
Brown, E. S. 1986. Preliminary results of the 1984 U.S.-Japan Coopera
tive bottom trawl survey of the central and western Gulf of Alaska. In Condition of groundfish resources of the Gulf of Alaska region as assessed in 1985 (R. L. Major, ed), p. 259–296. U.S. Dep. Commer., NOAA Tech. Memo. NMFS F/NWC-106.
Brown, J. H., and M. V. Lomolino. 1998. Biogeography, 691 p. Sinauer Associates Inc., Publs.,
Sunderland, MA. Collie, J. S., G. A. Escanero, and P. C. Valentine.
1997. Effects of bottom fishing on the benthic megafauna of Georges Bank. Mar. Ecol. Prog. Ser. 155:159–172.
Colvocoresses, J. A., and J. A. Musick. 1984. Species associations and community composition of
Middle Atlantic Bight continental shelf demersal fishes. Fish. Bull. 82:295–313.
Day, D. S., and W. G. Pearcy. 1968. Species associations of benthic fishes on the continen
tal shelf and slope off Oregon. J. Fish. Res. Board Can. 25: 2665–2675.
Falkowski, P. G., M. J. Behrenfeld, W. E. Esaias, W. Balch, J. W. Campbell, R. L. Iverson, D. A.. Kiefer, A. Morel, and J. A. Yoder.
1998. Satellite primary productivity data and algorithm development: a science plan for mission to Planet Earth. NASA Goddard Space Flight Center NASA Tech. Memo. 104566, vol. 42, 36 p.
Farina, A., J. Freire, and E. Gonzalez-Gurriaran. 1997. Demersal fish assemblages in the Galician continen
tal shelf and upper slope (NW Spain): spatial structure and long-term changes. Estuarine Coastal Shelf Sci. 44: 435–454.
Feder, H. M., and S. C. Jewett. 1986. The subtidal benthos. In The Gulf of Alaska: physi
cal environment and biological resources (D. W. Hood and S. T. Zimmerman, eds), p. 347–396. Minerals Management Service, Springfield, VA.
Francis, R. C., S. R. Hare, A. B. Hollowed, and W. S. Wooster. 1998. Effect of interdecadal climate variability on the oce
anic ecosystems of the NE Pacific. Fish. Oceanogr. 7:1–21. Fujita, T., T. Inada, T., and Y. Ishito.
1995. Depth-gradient structure of the demersal fish community on the continental shelf and upper slope off Sendai Bay, Japan. Mar. Ecol. Prog. Ser. 118:13–23.
Gabriel, W. 1992. Persistence of demersal fish assemblages between
Cape Hatteras and Nova Scotia, Northwest Atlantic. J. Northwest Atl. Fish. Sci. 14:29–46.
Gabriel, W. L., and A. V. Tyler. 1980. Preliminary analysis of Pacific Coast demersal fish
assemblages. Mar. Fish. Rev. 42:83–88. Gomes, M., R. Haedrich, and J. Rice.
1992. Biogeography of groundfish assemblages on the Grand Bank. J. Northwest Atl. Fish. Sci. 14:13–27.
Gomes, M. C., R. I. Haedrich, and M. G. Villagarcia. 1995. Spatial and temporal changes in the groundfish as
semblages on the north-east Newfoundland/Labrador Shelf, north-west Atlantic, 1978−1991. Fish. Oceanogr. 4:85–101.
Hastie, T. J., and R. J. Tibshirani. 1990. Generalized additive models. Monographs on statistics
and applied probability, 335 p. Chapman & Hall, London. Isaji, T., and M. L. Spaulding.
1987. A numerical model of the M2 and K1 tide in the northwestern Gulf of Alaska. J. Geophys. Res. 17:698–704.
Jay, C. 1996. Distribution of bottom-trawl fish assemblages over
the continental shelf and upper slope of the U.S. west coast, 1977–1992. Can. J. Fish. Aquat. Sci. 53:1203–1225.
Langton, R. W., and R. L. Haedrich. 1997. Ecosystem-based management. In Northwest Atlan
tic groundfish: perspectives on a fishery collapse, Bethesda, Maryland (J. Boreman, B. S. Nakashima, J.A.Wilson and R.L. Kendall, eds.), p. 153–158. Am. Fish. Soc., Bethesda, MD.
Mackas, D. L., R. Kieser, M. Saunders, D. R. Yelland, R.M. Brown, and D. F. Moore.
1997. Aggregation of euphausiids and Pacific hake (Merluccius productus) along the outer continental shelf off Vancouver Island. Can. J. Fish. Aquat. Sci. 54:2080–2096.
Mahon, R., S. K. Brown, K. C. T. Zwanenburg, D. B. Atkinson, K. R. Buja, L. Claflin, G. D. Howell, M. E. Monaco, R. N. O’Boyle, and M. Sinclair
1998. Assemblages and biogeography of demersal fishes of the east coast of North America. Can. J. Fish. Aquat. Sci. 55:1704–1738.
Mann, K H., and J. R. N. Lazier. 1991. Dynamics of marine ecosystems: biological—physi
cal interactions in the oceans, 466 p. Blackwell Scientific Publications, Boston, MA.
Martin, M. H. 1997. Data Report: 1996 Gulf of Alaska bottom trawl survey.
U.S. Dep. Commer. NOAA Tech. Memo. NMFS AFSC 82, 235 p. Martin, M. H., and D. M. Clausen.
1995. Data Report: 1993 Gulf of Alaska bottom trawl survey. U.S. Dep. Commer. NOAA Tech. Memo. NMFS AFSC 59, 217 p.
McCullagh, P., and J. A. Nelder. 1989. Generalized linear models. Monographs on Statistics
and Applied Probability. Chapman and Hall, London, 511 p. Merrett, N. R.
1992. Demersal ichthyofaunal distribution in the abyssal Eastern North Atlantic, with special reference to Coryphaeniodes (Nematonurus) Armatus (Macrouridae). J. Mar. Biol. Assoc. U.K. 72:5–24.

Mueter and Norcross: Spatial and temporal patterns in the demersal fish community off Alaska 581
Mueter, F. J., and B. L. Norcross. 1999. Linking community structure of small demersal fishes
around Kodiak Island, Alaska, to environmental variables. Mar. Ecol. Prog. Ser. 190:37–51.
2000. Changes in species composition of the demersal fish community in nearshore waters of Kodiak Island, Alaska. Can. J. Fish. Aquat. Sci. 57:1169–1180.
Munro, P. T., and R. Z. Hoff. 1995. Two demersal trawl surveys in the Gulf of Alaska:
Implications of survey design and methods. U.S. Dep. Commer. NOAA Tech. Memo. NMFS AFSC 50, 139 p.
Naeem, S., L. J. Thompson, S. P. Lawler, J. H. Lawton, and R. M. Woodfin.
1994. Declining biodiversity can alter the performance of ecosystems. Nature 368:734–738.
NRC (National Research Council). 1995. Understanding marine biodiversity, 114 p. National
Academy Press, Washington D. C. Parsons, T. R.
1986. Ecological relations. In The Gulf of Alaska: physical environment and biological resources (D. W. Hood and S. T. Zimmerman, eds), p. 561–570. Minerals Management Service, Springfield, VA.
Pennington, M., and T. Stromme. 1998. Surveys as a research tool for managing dynamic
stocks. Fish. Res. 37:97–106. Piatt, J. F., and P. Anderson.
1996. Response of common murres to Exxon Valdez oil spill and long-term changes in the Gulf of Alaska marine ecosystem. Am. Fish. Soc. Symp. 18:720–737.
Polovina, J., G. Mitchum, and G. Evans. 1995. Decadal and basin-scale variation in mixed layer depth
and the impact on biological production in the Central and North Pacific, 1960–88. Deep-Sea Res. 42:1701–1716.
Reed, R. K., and J. D. Schumacher. 1986. Physical oceanography. In The Gulf of Alaska: phys
ical environment and biological resources (D. W. Hood and
S. T. Zimmerman, eds). p. 57–75. Minerals Management Service Springfield, VA.
Roberts, C. M. 1997. Ecological advice for the global fisheries crisis. Trends
Ecol. Evol. 12:35–38. Robinson, C. J., and J. Gomez-Gutierrez.
1998. Daily vertical migration of dense deep scattering layers related to the shelf-break area along the northwest coast of Baja California, Mexico. J. Plankton Res. 20: 1679–1697.
Rogers, J. B., and E. K. Pikitch. 1992. Numerical definition of groundfish assemblages caught
off the coasts of Oregon and Washington using commercial fishing strategies. Can. J. Fish. Aquat. Sci. 49:2648– 2656.
Stark, J. W., and D. M. Clausen. 1995. Data Report: 1990 Gulf of Alaska bottom trawl
survey. U.S. Dep. Commer. NOAA Tech. Memo. NMFS AFSC 49, 221 p.
Swartzman, G., C. Huang, and S. Kaluzny. 1992. Spatial analysis of Bering Sea groundfish survey data
using generalized additive models. Can. J. Fish. Aquat. Sci. 49:1366–1378.
Venrick, E. L. 1995. Scales of variability in a stable environment: phy
toplankton in the central North Pacific. In Ecological time series (T. M. Powell and J. H. Steele, eds), p. 150–180. Chapman & Hall, New York, NY.
Yaffee, S. L., A. F. Phillips, I. C. Frentz, P. W. Hardy, S. M. Maleki, and B. E.Thorpe.
1996. Ecosystem management in the United States: an assessment of current experience, 352 p. Island Press., Washington, D.C.
Yang, M. 1993. Food habits of the commercially important ground
fishes in the Gulf of Alaska in 1990. U.S. Dep. Commer. NOAA Tech. Memo. NMFS-AFSC-22, 150 p.