ground water year book uttar pradesh (2021 -2022)
349
CENTRAL GROUND WATER BOARD MINISTRY OF WATER RESOURCES, RIVER DEVELOMENT AND GANGA REJUVINATION GOVERNMENT OF INDIA GROUND WATER YEAR BOOK UTTAR PRADESH (2021 -2022) September, 2022
-
Upload
khangminh22 -
Category
Documents
-
view
0 -
download
0
Transcript of ground water year book uttar pradesh (2021 -2022)

CENTRAL GROUND WATER BOARD
MINISTRY OF WATER RESOURCES, RIVER DEVELOMENT
AND GANGA REJUVINATION
GOVERNMENT OF INDIA
GROUND WATER YEAR BOOK
UTTAR PRADESH
(2021 -2022)
September, 2022

GROUND WATER YEAR BOOK
UTTAR PRADESH (2021 - 2022)


1
GROUND WATER YEAR BOOK
UTTAR PRADESH
(2021 - 22)
CONTENTS
CHAPTER TITLE PAGE NO.
FOREWORD
EXECUTIVE SUMMARY 6-21
1 INTRODUCTION 22-26
2 PHYSIOGRAPHY AND DRAINAGE 27
3 CLIMATE & RAINFALL 28-33
4 HYDROGEOLOGICAL FRAMEWORK 34-35
5 BEHAVIOUR OF WATER LEVELS 36-66
Depth to water level during 2021-22
May 2021
August 2021
November 2021
January 2022
6 WATER LEVEL FLUCTUATIONS 67-150
6.1 Seasonal Fluctuation During 2021-22
May 2021 – Nov 2021
May 2021– Jan 2022
6.2 Annual Fluctuation During 2021-22
May 2020–May 2021
August 2020– August2021
November 2020- November 2021
January 2021–January 2022
6.3 Decadal Mean Fluctuation During 2021-22
May (2011-2020) – May 2021
August (2011-2020) – August 2021
November (2011-2020) – November 2021
January (2012-2021) – January 2022

2
TABLES
1. Status of Ground Water Monitoring Wells, U.P.
2. Monthly and Annual Rainfall (mm) for the Year – 2021
3. District-wise DepthTo Water Level, U.P., May’ 2021
4. District-wise Depth ToWater Level, U.P., August’ 2021
5. District-wise Depth To Water Level, U.P., November’ 2021
6. District-wise Depth ToWater Level, U.P., January’ 2022
7. District-wise Seasonal Water Level Fluctuation, U.P., May 2021- Nov2021
8. District-wise Seasonal Water Level Fluctuation, U.P., May 2021 –Jan 2022
9. District-wise Annual Water Level Fluctuation, U.P., May 2020 –21
10. District-wise Annual Water Level Fluctuation, U.P., Aug 2020 –21
11. District-wise Annual Water Level Fluctuation, U.P., Nov 2020 –21
12. District-wise Annual Water Level Fluctuation, U.P., Jan 2021 – 22
13. District-wise Decadal Water Level Fluctuation, U.P., Mean May (2011 - 2020) - May 2021
14. District-wise Decadal Water Level Fluctuation, U.P., Mean Aug (2011 - 2020) - Aug 2021
15. District-wise Decadal Water Level Fluctuation, U.P., Mean Nov (2011 - 2020) - Nov2021
16. District-wise Decadal Water Level Fluctuation, U.P., Mean Jan (2012-2021)-Jan 2022
17. Methods used for Chemical Analysis of Ground Water Sample.
18. Hydro-Chemical Data of Ground Water in Uttar Pradesh (an overview) 2021-22
19. Frequency distribution of Electrical Conductivity (2021 -2022)
20. The blocks exhibiting high values of E.C. (>2250 µS/cm at 25°CµS/cm)
21. Frequency Distribution of T.D.S. in NH Stations of U.P
22. Frequency distribution of Chloride (2020-21)
23. Blocks exhibiting high values of Cl (>1000 mg/l)
24. Frequency Distribution of Nitrate in Shallow Groundwater of U.P
25. List of Blocks associated with high values of nitrate (>45 mg/l)
26. Frequency Distribution of Fluoride in Shallow Ground Water of U.P
27. List of Blocks associated with high values of Fluoride (>1.5 mg/l)
28. Frequency Distribution of Total Hardness in Shallow Ground Water of U.P
29. List of Blocks exhibiting high values of total hardness (>600 mg/l)
30. Frequency Distribution of Calcium in Shallow Ground Water of U.P
31. List of Blocks exhibiting high values of Calcium (>200 mg/l)
32. Frequency Distribution of Magnesium in Shallow Ground Water of U.P
33. List of Blocks exhibiting high values of Magnesium (>100 mg/l)
7 GROUND WATER QUALITY 151-189

3
34. Frequency Distribution of Sodium in Shallow Ground Water of U.P
35. List of Blocks exhibiting high values of Sodium (>500 mg/l)
36. Frequency Distribution of Potassium in Shallow Ground Water of U.P.
37. List of Blocks exhibiting high values of Potassium (>30 mg/l)
38. Frequency distribution of Electrical Conductivity as per USSL Classification
39. Frequency Distribution of R.S.C. in Shallow Ground Water Of U.P
40. Quality of water on the basis of SAR values. in Shallow Ground Water of U.P.
41. Statistical distribution of Heavy Metals in Uttar Pradesh 2021
42. Locations of high concentration of Arsenic in shallow ground water of U.P
43. Locations of high concentration of Uranium (U) in ground water of Uttar Pradesh
PLATES:
I. Location of Ground Water Monitoring Wells, U.P.
II. Annual Isohyets 2021, U.P
III. Normal Isohyets,U.P
IV. Depth To Water Level Contours, U.P., May’ 2021
V. Depth To Water Level Contours, U.P., August’ 2021
VI. Depth To Water Level Contours, U.P., November’ 2021
VII. Depth To Water Level Contours, U.P., January’ 2022
VIII. Seasonal Water Level Fluctuation Contours, U.P., May 2021 – Nov 2021
IX. Seasonal Water Level Fluctuation Contours, U.P., May 2021 – Jan2022
X. Annual Water Level Fluctuation Contours, U.P., May 2020–21
XI. Annual Level Water Fluctuation Contours, U.P., Aug 2020 –21
XII. Annual Water Level Fluctuation Contours, U.P., Nov 2020 –21
XIII. Annual Water Level Fluctuation Contours, U.P., Jan 2021–22
XIV. Decadal Water Level Fluctuation Contours, U.P., Mean May (2011 - 2020) - May 2021
XV. Decadal Water Level Fluctuation Contours, U.P., Mean Aug (2011 - 2020) - Aug 2021
XVI. Decadal Water Level Fluctuation Contours, U.P., Mean Nov (2011 - 2020) - Nov 2021
XVII. Decadal Water Level Fluctuation Contours, U.P., Mean Jan (2012-2021) - Jan 2022.
XVIII. Decadal Water Level Trend, U.P. Pre- Monsoon (2012-2021)
XIX. Decadal Water Level Trend, U.P. Post- Monsoon (2012-2021)
XX. Electrical Conductivity Map of U.P. (2021)
XXI. Chloride Distribution Map of U.P. (2021)
XXII. Fluoride Concentration Map of U.P. (2021)
XXIII. Iron Concentration Map of U.P. (2021)

4
XXIV. Arsenic Concentration Map of U.P. (2021)
XXV. Uranium Concentration Map of U.P. (2021)
ANNEXURES: 190-346
1. Well-wise Depth to Water Level of Ground Water Monitoring Wells, U.P during
May’21, Aug’21, Nov’21, Jan’22
2. Trend of Water Level from 2012 to 2021 of Ground Water Monitoring Wells, U.P
3. Chemical Analysis data of Samples collected from Ground Water Monitoring Wells in
Uttar Pradesh, 2021-22.

5
Contributors
Dr. R.K.Prasad, Scientist ‘C’ (HM)
Smt. Kiran Singh, Scientist ‘C’ (Chemist)

6
EXECUTIVE SUMMARY
The state of Uttar Pradesh covering an area of 2,40,928Sq.km. forms a part of the vast
Gangetic plain. It is a south easterly sloping flat terrain with a gentle, variable land slope,
steeper in western part and flattening eastward. The river Ganga is the major drainage with
Yamuna, Ramganga, Gomti and Ghagra as its main tributaries. The state consists of two
geomorphic units (i) Central Ganga plains (ii) Bundelkhand plateau. The Central Ganga
plain covers nearly 85% area and is underlain by a thick pile of unconsolidated alluvial
sediments of Quaternary age overlying the Precambrian basement. These sediments
consist of sands of different grades with clay, silt and occasional gravel and kankar. The
southern part of the state comprises of hard rocks of Bijawar and Vindhyan groups. The
alluvium forms a very rich reservoir of ground water. The exploratory data have shown
that ground water occurs in a multiple aquifer system which can broadly be divided into
four groups. The shallow aquifer is being extensively exploited and hence is under heavy
stress.
The State is covered with rich fertile soil and underlain by a large thickness of
alluvium making it one of the richest ground water repositories of the world. The State
being the most populous in the country with a population density of 649 persons per
sq. km and a high rate of population growth (26%), its demand for water is soaring.
Also due to industrialization, urbanization and modern farming practices, its quality is
also at stake. To meet this high irrigational requirement, water resources are being
increasingly developed. Ground water contributes to about 71% of the irrigation needs
of the State. The indiscriminate development of ground water has resulted in depletion
of groundwater storage and lowering of water levels in certain areas on one hand. On
other side, the surface water canals in areas having shallow water level has resulted in
water logging and soil salinization.
All these negative impacts on the resource give rise to the need for regular and
continuous monitoring of the ground water regime. The monitoring of hydrological
regime is of utmost importance for scientific and planned management of the resource.
In order to manage the water resources and plan development on scientific lines, a data
base needs to be generated. In view of relative importance of this valuable resource, it
becomes imperative to adopt sound and scientific management of groundwater
resources.

7
The State experienced a sub-humid and tropical climate with three distinct seasons
summer, monsoon & winter. The summer is hot and dry with maximum daily
temperature ranging between 380C to 430C.
The monsoon starts retreating from the State in late September or early October. There
is large variation in temperature both in time and space. The normal rainfall of the
State is 955 mm and the average annual rainfall for the year 2021 is 972.06mm.The
amount of average monsoonal rainfall of 848.92mm received during 2021.Central
Ground Water Board has been monitoring the ground water regime since 1969 and has
generated a vast database to understand the behavior of water levels in response to
recharge to ground water storage or withdrawal from it. The data is being analyzed and
reported annually. The present report is one in the series. There are 1007 Ground Water
Monitoring Wells as on 31.3.22 out of which 210 are piezometers and 797 open dug wells.
Depth to Water Level during 2021 - 22
The depth to water level was found to vary from season to season over the state. The
percentage of wells showing water level depth of different range during the year 2021 -22
is summarized below:
DEPTH RANGE (m) No. and Percentage of wells
May’21 Aug’21 Nov’21 Jan’22
0-2 73 (11.04%) 275(38.30%) 248 (34.20%) 115(15.33%)
2-5 245(37.06%) 182 (25.34%) 229 (31.58%) 345 (46%)
5-10 211(31.92%) 150 (20.89%) 136 (18.75%) 167 (22%)
10-20 104 (15.73%) 86(11.97%) 89(12.27%) 98 (13.06%)
>20 28 (4.12%) 25 (3.47%) 23(3.16%) 25(3.33%)
Pre monsoon Depth to Water Level (May – 21)
The pre-monsoon period as it appears after one complete cycle of inputs and outputs.
Generally this period shows the deepest water levels during the year. May is the dry season
and the water levels are used for most of the ground water calculations. In general water level
ranges mostly from 2 to 20 mbgl, however parts of the state show variation of 20 mbgl or
above. The water levels in the range of 0 to 2 mbgl (i.e., water logged condition) is observed
only in 73 wells.
Water level in the range of 2 - 5 mbgl is observed in 245 Monitoring Wells (about
37.06%). It is usually observed along the Terai belt, extending from parts of

8
Moradabad to Kushi Nagar and upto Ballia in eastern U.P. As per available data, the
given range of water level is found in the district of Ambedkar Nagar, Bahraich,
Gonda, Azamgarh, Ghazipur, Mirzapur and Sonbhadra.
About 31.92 % of wells (211 nos.) show water level between 5 and 10 m bgI. This
area is observed in almost all parts of U.P. The water level of 5 to 10 mbgl is observed
in Saharanpur, Miuzaffarnagr, Bijnaur, Moradabad, Rampur, Barelly, Shajahnpur,
Lakhimpur Khiri, Sitapur, Barabanki, Hamirpur, Mahoba,Banda, Chitrakoot,
Fatehpur, Pratapgarh, Jaunpur, Jaunpur, Allahabad, Mirzapur, Varanasi, Sonbhadra
and Ghazipur. Water level in the range of 10 – 20m have been observe in 104 wells
(15.73%) mainly in Sharanpur, Shamli, Muzaffarnagar, Meeut, Ghaziabad, Hapur,
Sambhal, Badaun, Farukhabad, Kannauj, Unnao, Hamirpur, Jalaun, Itawah, Mainpuri,
Etah, Hathras and Aligarh. There were few wells (25) where was water level recorded
between 20 to 40mbgl mainly in Agra, Auraiya, Baghpat, Budaun, Etawah, Firozabad
etc. whereas 3 wells in the state where water level are found to be more than 40m
namely Agra, G.B.Nagar and Lucknow having water level 44.20,45.21 and 41.82m
respectively.
Depth to Water Level –August 2021
The water level during August indicates the immediate impact of rain fall on ground
water storage. This is the month of peak monsoon rainfall hence this measurement is
carried out to get the peak of the water level hydrograph. The water level rises in
response to rainfall.
Water level has become shallower in large part of the state as per available data. Out
of 718 analyzed well 275 (38.30%) falls in the range of 0 to 2mbgl and182 wells
(25.32%) fall in the range of 2 – 5mbgl, it occurs mainly in Lakhimpur Khiri,
Shrawasti, Bahraich, Balrampur, Gonda, Ayodhya, Ambedkar Nagar, Azamgarh,
Sidarth Nagar, Mau, Ballia and northern part of Sonbhadra Districts.
The water level in the range of 5-10 and 10-20mbgl occur in the 20.89% and 11.97%
respectively. As per record, the water level between 10 – 20 are observed mainly
western UP such as Saharanpur, Shamli, Muzaffarnagar, Amroha, Sambhal, Budaun,
Baghpat, Meerut, Hapur and some parts of Kannauj and Lucknow Districts.
Post Monsoon Depth to Water Level (November 2021)

9
The water level starts receding gradually after August with lateral flow of ground
water due to change in hydraulic conditions with recession of monsoon and ground
water storage.
The water level stabilizes by November and there after natural out flow reduces
considerably. This is the post monsoon water level which reflects the change in
ground water storage which is the dynamic ground water resource.
Water logged area showing DWL 0-2 mbgl has been found in 248 wells (34.20%) and
are located in patches like LakhimpurKhiri, Banda, Bahraich, Shrawasti, Balrampur,
SiddharthNagar,Maharajganj, KushiNagar, Sultanpur, Azamgarh, Ghazipur,Mau,
Ballia,Chandauli and Allahabad district.
The depth to water level from 2 to 5mbgl is found in 229 monitored wells (31.58%)
This range is observed in most parts of the districts in Terai, Eastern, Central U.P and
few districts of Bundelkhand region. Along the Gomti, Ghaghra and Sharda rivers
water level ranges from 2 to 5 mbgl. Most parts of districts of eastern U.P. and Terai
region shows DWL < 5mbgl.
The depth to water levels from 5 to 10 mbgl are observed in 136 wells (18.75%).
This range is prominent in Western, Central & Southern U.P. A thin strip showing
this range runs along the Ganga river, and extends over the Ganga - Ramganga
interfluve area.
The depth to water levels from 5 to 10 mbgl are observed along the Ganga-Yamuna
doab from Aligarh up to Allahabad through Mathura, Kanpur Dehat, Kanpur Nagar,
Jalaun, Hamirpur and Banda. On both the sides of Betwa river in Jhansi and Jalaun
water level are observed to vary from 5 to 10 mbgl.
The water levels of 10 to 20 mbgl are noticed in 89 wells (12.27%), mostly along the
Yamuna river upto Varanasi, through Mathura, Agra, Kanpur, Jalaun, Fatehpur,
Hamirpur, Chitrakoot and Banda districts. This is mainly due to higher elevation of
natural levee formed on either side of the Yamuna river. Most parts of districts of
western U.P. Shamli, Meerut, Hapur, Amorha, Sambhal Bulandshahar, Baghpat,
Ghaziabad, G.B.Nagar, J.P.Nagar, Moradabad, show water level in this range. Few
patches are seen in Agra, Bijnor, Chitrakoot, Fatehpur, Hamirpur, Hathras,
Kaushambi, Pratapgarh, Sultanpur and Unnao districts. Along the Ganga river a wide

10
patch shows water level in the range. In Lucknow city water level in this range is
observed in most of the wells.
The depth range of 20 - 30 mbgl are found in 23wells along Agra, Baghpat, Meerut,
Firozabad, and Lucknow districts. In Lucknow city DWL in this range is found only
in 7 wells (7.8%).Only 20 wells shows depth to water levels greater than 20m. These
areas showing deeper water levels are due to bearing of geomorphology as presence
of ravenous tract along the Yamuna and Betwa rivers.
The water level observed between 30 – 40mbgl are noticed in three districts such as
Agra, Firozabad, G.B.Nagar and Lucknow.
Depth to Water Level – January 2022
Winter season is the peak season of ground water abstraction for Rabi cultivation.
Consequently bulk of ground water storage is depleted during this season which is
well reflected in the water level measurement during January 2022.
The water logged area showing depth to water level in the range of 0-2 mbgl has been
reduced to 15.33%. The water level in the range of 0 - 2 mbgl is observed as isolated
patches in Bijnour, Moradabad, Bareilly, Bahraich, Balrampur , Amethi, Banda and
Ballia district.
Water levels in the range of 2–5 and 5-10 mbgl are predominant during this period as
reflected at 46% and 22.26% of monitored wells respectively. The moderate water
level zone remains at 15.08%. The very deep water level occurs in 3.83% wells. Thus
there seems to be a balance between the input and output in these areas.
The water level in the range of 2 – 5 mbgl is seen in most of the districts except in
western part; being predominantly concentrated along the northern border (Terai
region) eastern and North eastern parts of the state and as scattered patches in central
and southern part of the State.
The depth to water level of 5 - 10 m.bgl is observed predominantly in the central,
western, southern and lower eastern parts of U.P from Saharanpur to Sonbhadra
districts.
The water level in range of 10-20 m.bgl is observed all along Yamuna river and parts
of western U.P. This range is observed as patches in Agra, Etawah, Aurriya,
Allahabad, Baghpat, Chitrakoot, Gautam Buddha Nagar, Ghaziabad, Hamirpur,
Jalaun, , Kaushambi, Lucknow, Meerut, Muzaffar Nagar, St.Ravidas Nagar and
Sonbhadra districts.

11
The water level of 20 mbgl and more is present along Yamuna river in isolated
patches. It is seen mostly in Bagpat, Agra, Etawah, Fatehpur, Hamirpur and
Muzaffarnagar districts. This is due to effluent nature of river Yamuna and also due to
higher elevations in the area. In the central parts of Lucknow, water level of more
than 20 mbgl is observed.
In Gandak and Saryu canal commands water level predominately ranges from 2 to 5
mbgl. ShardaSahayak canal command shows predominance of depth to water level
between 2 and 10 mbgl while Ram Ganga canal command shows predominance of 5 -
10 mbgl water level range.
Seasonal Fluctuation during 2021-22
May 2021 – November 2021
The difference between the pre and post-monsoon water level of the year is the most
important seasonal fluctuation which gives a clear picture of groundwater potential
which could be fruitfully utilized for various uses over the succeeding year. This
fluctuation is used to evaluate the dynamic ground water resource through the change
in ground water storage.
The district wise data indicate a rise in water level in almost 86.29% of the wells
indicating monsoon recharge to ground water. There is a general rise in water
levels from 0 to 2 m as noticed at 262 (42.73%) wells. This rise is seen in almost
all the districts of the state except north Central part of the state.
The rise in water levels in the range of 2 - 4 m is observed in 193 wells
(31.48%).This range is observed mostly in eastern and parts of central and
southern U.P. But their spatial extent is limited to patches and are confined in
Jalaun, Hamirpur, Banda, Chitrakoot of Bundelkhand region and Faizabad,Basti,
S.Kabir Nagar, Kushi Nagar and Pratapgarh districts of Poorvanchal.
The rise of more than 4 m is observed in 74 wells (12%), covering few parts of
hard rock areas of Lalitpur, Chitrakoot, Kaushambi, Hamirpur, Jalaun, Jhansi,
Kaushambi and Pratapgarh districts.

12
May 2021 – January 2022
By January the rainfall infiltration starts dissipating and ground water extraction
which had come down during the monsoon also starts building up. But the rise in
water level continues though at a lower scale. The water level data during pre-
monsoon period i.e. May’21 and that of January’2022 have been analyzed to estimate
the change in water levels.
There is a rise of water level in 486 no. of analyzed wells (78.13%) and a fall in 133
no. (21.38%) of analyzed wells. The rise in water levels in the range of 0–2 m is seen
in 48.55% wells covering almost all the districts of the state. Rise of 2 – 4 m is
observed in 22.5% wells spread throughout the state. Rise of more than 4 m is
observed in 44 analyzed wells (7.0%). About 19.4% of analyzed wells (121) show fall
of 0-2min patches, in few districts and 0.96% of wells (6 no.) show fall of 2-4m and 6
wells show fall of >4m.
Fluctuation Change of Groundwater Storage in U.P. (2021-22)
Magnitude of
Change (m)
May’21 – Nov’21 May’21 – Jan’22
Rise (%) Fall (%) Rise (%) Fall (%)
0-2 262 (42.73%)
72 (11.74%)
302 (48.55%)
121 (19.4%)
2-4 193 (31.48%)
8 (1.30%)
140 (22.5%)
6 (0.96%)
>4 74 (12%)
4 (0.65%)
44 (7.0%)
6 (0.96)%
It is evident from analyses that ground water has been recharged in most parts of the
state and the quantum of recharge is reflected through a rise in water level to a tune
of 0-4 m. Number of wells showing rise of 0-2 m in water level from May’2021 to
November’2021 and it has further increases while comparing with May’2021 to
January’2022 from 42.73% to 48.55% respectively.
The rise of water level in the range of 2-4 m has been decrease from 31.48 % to
22.5% while compared with May 2021 –November 2021 to May 2021 to January
2022 respectively and number of wells showing rise of water level of more than 4 m
has also been reduced from 12% to 7%.

13
Annual Fluctuation
Whereas the seasonal fluctuation in the water level occurs due to rainfall and irrigation
as the two main factors during different periods of the year it is the annual fluctuation which
gives the net result of one whole cycle of recharge and discharge that has taken place during
one year. An annual decline indicates that ground water extraction has been in excess of the
rainfall recharge in broad terms.
Annual fluctuation during May 2020-21
The water level data collected during May'2021 has been compared with May'2020
data to evaluate the rise and fall in water levels since last one year. The wells have
been categorized depending on rise and fall in water levels.
Due to covid -19 pandemic, only 189 well have been monitored in 23 districts. It is
found that 54 no. (28.57%) monitoring wells show rise and 89 no. (47.08%) show fall
in water level in range of 0 – 2m. Out of the total monitoring well, 35.97% and
64.02% shows rise and fall in the water level respectively.
Fluctuation during August 2021 -21
The water level data collected during August'2020 has been compared with
Aug'2021 data to evaluate the rise and fall in water levels since last one year. The
wells have been categorized depending on rise and fall in water levels.
There is rise of water level in 198 wells (48.41%) and fall in 211 wells
(51.58%). The fall in water level is due to scanty monsoonal rainfall in some of the
area.
A rise of 0 -2 m is observed at 166 monitoring stations (40.58% of the
monitored wells) scattered in the patches. A rise of 2-4 m is seen in 23 wells (5.62%)
and rise of more than 4 m is seen in only 9 wells (2.20%), mainly concentrated in
Shamli, Hamirpur, Mahoba, Chitrakoot, Shrawasti and Sonbhadra districts of the
State.
The fall of 0 -2 water levels is observed in 177 wells (43.27%) of the monitored wells
covering some patches in the western, southern and central districts of U.P.
A fall of 2 - 4m is observed in 31 wells (7.57%) found in Sitapur, Kannauj,
Hamirpur, Fatehpur, Raebareli and Mau.

14
Fluctuation during November 2020 -21:
The water level data collected during November'2020 has been compared with
November'2021 data to evaluate the rise and fall in water levels since last one
year. It is observed that 542 wells (82.87%) show rise and 110 wells (16.81%)
show fall in water level. The 82.87% rise in water level is mainly because the area
has received very good amount of monsoonal rainfall.
A rise of 0 -2m, water levels, is observed at 432 wells (66.05%) covering all parts
of UP except Sambhal ,Firozabad and some parts of Amroha, Hapur,
Bulandshahar, Rampur, Ghaziabad districts. Rise of 2 - 4 m is observed in 88
wells (13.45%) and rise of more than 4m is observed only at 22 wells covering in
very small patches.
The fall of 0-2m water levels is observed in 94 wells (14.37%) mostly in districts
of Sambhal, Amroha, Bulandshahar, Hapur, Firozabad Hardoi, Jalaun , Jhansi,
Banda and Chitrakoot.
A fall of 2 - 4m is observed in 10wells (1.95%) and fall in water level > 4 m is
found in 6 wells (0.45%) mainly in Sambhal and Jhansi District.
Fluctuation during January 2021 -22
To evaluate the rise and fall in water level in January’2021 with respect to
January’2022, water level data of wells have been analysed. The fluctuation data
shows rise of water level in 572 nos (83.5%) and fall in 113 nos (16.45%) of the
analysed wells.
The fluctuation data of the state shows a fall of 0 to 2 m in 104 no. of analysed
wells (15.18%) in mainly Amroha, Sambhal, Bulandshahar, Aligarh, Budaun,
Hardoi, Siatpur, Jaaun, lalitpur, Banda, Chitrakoot and Chandaulli districts.
A fall of 2 to 4m is observed only in 7 no. wells and rise of > 4 m in 2 wells
(0.28%) of G.B.Nagar and Chandauli.A rise of 0-2 m in water level is noticed in 490
no. of analysed wells (71.53%). Districts showing in all parts of Uttar Pradesh except
Amroha, Sambhal, Bulandshahar, Aligarh, Budaun and parts of Hardoi, Siatpur,
Jalaun, lalitpur, Banda, Chitrakoot and Chandaulli districts. and rise of 2 to 4 m is
seen only in 87nos(12.41%) and rise of > 4m are mainly seen in Shamli, Bhagpat,
Kanpur Dehat, Hamirpur, Fatehpur, Allahabad, S.Ravidas Nagar, Mirzapur and
Varanasi.

15
The over all status of annual fluctuation in the state is summarized in following table.
Annual Fluctuation in Water Level during 2021 –22, U.P.
FLUCTUATION
RANGE
May 20 – 21 August 20 - 21 November 20 -21 January 21 – 22
Rise (%) Fall (%) Rise (%) Fall (%) Rise (%) Fall (%) Rise (%) Fall (%)
0-2 54 (28.57%)
89 (47.08%)
166 (40.58%)
177 (43.27%)
432 (66.05%)
94 (14.37%)
490 (71.53%)
104 (15.18%)
2-4 6 (3.17%)
27 (14.28%)
23 (5.62%)
31 (7.57%)
88 (13.45%)
10 (1.52%)
66 (9.63%)
7 (1.02%)
>4 8 (4.23%)
5 (2.64)
9 (2.20%)
3 (0.73%)
22 (3.36%)
6 (0.91%)
104 (15.18%)
09 (0.28%)
TOTAL 68
(35.97%)
121
(64.02%)
198
(48.41%)
211
(51.58%)
542
(82.87%)
110
(16.81%)
572
(83.5%)
113
(16.45%)
From the analysis of table it is evident that the water level has shown maximum
decline in August 21 as compared to the May’21 but the decline percentage has gradually
decrease and increase in rise of water level percentage in November’21 and January’22 due to
monsoonal recharge as compared to the previous year.
Fluctuation form the Decadal Mean during 2021 -22
The fluctuations in water level described earlier are very much dependent on the
rainfall and give a very short term picture. In order to remove the rainfall anomalies the long
term water level is considered as this would normalize the erratic highs and lows.
Mean May (2011-2020) - May 2021
The pre-monsoon water level data for 2021 has been compared to decadal mean (2011-
2020) for pre-monsoon periods, and district-wise analysis of Ground Water The analyzed
data shows that rise in water level for 395 (60%) wells and fall in 263no.(39.96%).
It is observed that 395no. Monitoring wells (60 %) shows rise and 39.96% fall in water
level. A fall in water level of 0-2 m is observed in 191(26.02%) wells. Fall of higher
magnitude is found along Yamuna river.
A fall in water levels between 2- 4m is observed in 47Monitoring wells (6.86%) found in
small patches Like Agra, Hapur, Meerut, Bhagpat, Muzaffarnagar, Firozabad,
Farukhabad, Fatehpur, Mahoba, Jalaun Chitrakoot, and Lucknow.
There is a rise in water level from 0 to 2 m with respect to decadal mean of May in 258
(39.10%) monitoring wells and rise of 2 - 4 m is observed in 100 monitoring wells and
rise of more than 4 m is observed in 37 monitoring wells.

16
Mean November (2011-20) – November 2021:
The average water level of last 10 years (2011-20) for each hydrograph station for the
month of November has been evaluated and compared with water level data of
November’21.
There is a rise in water level in 542 nos. wells (75.06%) and fall in DWL is observed
in 180 Nos. of wells(24.93%). Rise in DWL is mostly occurs in South eastern U.P
Mirzapur, Varanasi, Chandauli, Jaunpur and some isolated patches in western U.P.
such as Saharanpur, Shamli, Muzaffarnagar, Bijnour, Mathura District.
Rise of 2 - 4 m is observed only at 117 wells (16.20%) and rise of more than 4m is
noticed only at 22wells.Fall is observed mostly in Sambhal, Amroha, baghpat,
Ghaziabad, Badaun, Firozabad etc.
The status for the State as a whole is summarized as under:
DECADAL FLUCTUATION 2021 – 22, U.P.
FLUCTUATION
RANGE
Mean May (2011-20) to
May 21
Mean August (2011-20) to
August 21
Mean Nov(2011-20) to
November 21
Mean Jan(2012-21) to
January 22
Rise (%) Fall (%) Rise (%) Fall (%) Rise (%) Fall (%) Rise (%) Fall (%)
0-2 258 (39.20%)
191 (29.02%)
307 (42.81%)
209 (29.14%)
403 (55.81%)
126 (17.45%)
420 (56.14%)
178 (23.79%)
2-4 100 (14.59%)
47 (6.86%)
86 (11.99%)
61 (8.50%)
117 (16.20%)
38 (5.26%)
92 (12.29%)
31 (4.14%)
>4 37 (5.40%)
25 (3.79%)
28 (3.90%)
26 (3.62%)
22 (3.04%)
16 (2.2%)
16 (2.13%)
11 (1.47%)
Total 395 (60%)
263 (39.96%)
421 (58.71%)
296 (41.28%)
542 (75.06%)
180 (24.93%)
528 (70.58%)
220 (29.41%)
Trend of Water Level:
The seasonal, annual and decadal fluctuation gives an idea of the behavior of the
water level but is subjected to many anomalous factors which give a short-term picture. To
have a true picture where highs and lows are balanced out, the long-term trend for ten years
2012 to 2021 has been worked out and analyzed on the basis of DWL data of Ground Water
Monitoring Wells.

17
The results of water level trend data during Pre-monsoon for the period 2012-2021 are
summarized as follows:
Percentage of wells showing Pre-monsoon DWL Trend (cm/year) from 2012 -2021
Total
Well
Analyzed
Rise (cm/year) Fall (cm/Year) Total
0 -20 20-40 >40 0 -20 20 -40 >40 Rise Fall
834 185
(22.18%)
64
(7.67%)
29
(5.87%)
213
(25.53%)
85
(10.19%)
95
(11.39%)
278
(33.33%)
556
(66.66%)
The declining trend is observed in 66.66 % of the monitoring wells (556) covering
over 10 year’s period. Decline of 0 – 20 cm/yr is commonly observed in 25.53% wells
followed by 20 – 40 cm/yr in 10.19% wells and >40 cm/yr in 11.39%.
The low decline is spread all over the state but dominant in north and south western
parts of the State.
Higher decline occurs in Shamli, Muzaffarnagar, Baghpat, Meerut, Ghaziabad, Hapur,
Amroha, G.B.Nagar, Sambhal, Etah, Firozabad, Auriya, Unnao, Kanpur Nagar,
Kanpur Dehat, Hamirpur, Lucknow, and Sitapur.
There is a rising trend observed in 278 wells (33.33%), out of which 22.18 % and
7.67% of analysed wells shows rising trend in the range of 0-20cm/year and 20-
40cm/year respectively and very few wells of 5.87% shows rising trend of more than
40cm/year. The rises in wells are mostly located in North and South Eastern parts of
the State.
The results of Water Level trend data during Post-monsoon for the period 2012-2021 are
summarized as follows:
Percentage of wells showing Post-monsoon DWL Trend (cm/year) from 2009 -2019
Total
Well
Analyzed
Rise (cm/year) Fall (cm/Year) Total
0 -20 20-40 >40 0 -20 20 -40 >40 Rise Fall
836 338
(40.43%)
61
(7.29%)
46
(5.5%)
200
(23.92%)
87
(10.40%)
104
(12.44%)
445
(53.22%)
391
(46.77%)
There is a declining trend in 46.77% of the monitoring wells over 10 years period.
Decline of 0 – 20 cm/yr is mostly observed in 23.93% (200) wells followed by 20 –
40 cm/yr in 10.40% wells and more than 40 cm/yr is found in 12.44% wells.

18
The low decline is spread in North and South Western parts of the state. There is a
rise in trend in 53.22% of the monitoring wells over 10 years period.
Rise of 0 – 20cm/year is found in 40.43% followed by 20-40cm/year in 7.29% and
very few wells of 5.5% showing water level trend of more than 40cm/year.
GROUND WATER QUALITY
To evaluate the chemical quality of ground water in phreatic zones, 817 water samples
were collected from Ground Water Monitoring Stations (GWMS) established by CGWB,
Lucknow during the Pre monsoon period. (A.A.P. 2019-20). Generally the monitoring
stations are Hand pumps IM-II tapping phreatic aquifer. All the samples were analyzed for
the determination of pH, EC, CO3, HCO3, Cl, F, NO3, SO4, PO4, SiO2, T.H., Ca, Mg, Na& K.
Suitability of Ground Water for Potable Purposes
The suitability of ground water for drinking purposes has been assessed according to
the guidelines laid down by BIS (2012) for various analyzed parameters
Hydro-Chemical Data of Ground Water in Uttar Pradesh (2021 - 2022)
S. No. Constituents Minimum Maximum Average
1 pH 7.14 8.81 7.99
2 EC µS/cm at 25 ºC 234 37230 875
3 CO3 mg/l 0 84 3
4 HCO3 mg/l 49 1257 312
5 Cl mg/l 7 9018 77
6 F mg/l 0 6.8 1
7 NO3 mg/l 0 1177 15
8 SO4 mg/l 0 5600 51
9 PO4 mg/l 0 0.65 0.002
10 TH (as CaCO3) mg/l 15 4620 267
11 Ca mg/l 4 548 38
12 Mg mg/l 0 780 38
13 Na mg/l 0 6763 91
14 K mg/l 0 165 6
15 SiO2 mg/l 3 68 28

19
Suitability of Ground Water for Irrigation Purpose
The chemical quality of water is an important factor to be considered in evaluating its
usefulness for irrigation purposes. In addition to problems caused by excessive concentration
of dissolved solids (TDS), certain constituents in irrigation water are especially undesirable
and some may be damaging even when present in small concentrations viz. Sodium
Adsorption Ratio (SAR) & Residual Sodium Carbonate (RSC). The potential hazards to crop
growth are salinity, sodicity, alkalinity & toxicity.
The Electrical Conductivity is a reflection of the concentration of various chemical
constituents in ground water and gives the overall quality of ground water for its various
uses like irrigation. The Electrical Conductivity data reveals that the majority of the samples
belong to C2, C3 class as per USSL classification given in table below –
Frequency distribution of Electrical Conductivity (2021-2022)
EC ranges in µS/cm at 25ºC 0-500 501-2000 >2000
No. of samples 256 542 42
% 30.48 64.52 5.00
The the Residual Sodium Carbonate value are less than 1.25 in 0.95% of samples, no
samples found in RSC range of 1.25-2.5 and 99.05% of samples found in RSC range of more
than 2.5 which are tabulated.
Frequency Distribution of R.S.C.in NH Stations of U.P.
RSC range (meq/l) No. of samples Percentage
<1.25 ( Very safe water ) 8 0.95
1.25-2.5 ( Marginally safe water ) 0 0.00
>2.5 ( Unsuitable water ) 832 99.05
Heavy Metals:
Heavy metals normally occurring in nature are not harmful to our environment,
because they are only present in very small amounts. However, if the levels of these
metals are higher than the levels of healthy life, the roles of these metals change to a
negative dimension.
A total number of 912 representative ground water samples were collected for Fe,
Mn, Cr, Pb. Cu, Zn, As and U analysis treated with Supra pure HNO3 from pre
defined water quality stations of U.P during May- 2021. The samples were collected

20
in polyethylene bottles of 125 ml capacity. They were immediately closed, labeled
and stored properly for laboratory analysis.
The chemical analysis for iron (Fe), manganese (Mn), Chromium (Cr), Lead (Pb),
Copper (Cu), Zinc (Zn), Arsenic (As) and Uranium (U) was carried on inductively
coupled plasma- Mass spectrometry (Thermo iCAP Q) at Regional Chemical
Laboratory CGWB, NR, Lucknow as per the standard methods.
Copper concentration was found within the permissible limit of 1.5 mg/l. Zinc
concentration is found above permissible limit 15 mg/l in two locations, with
value 16.744 mg/l in Jalesar block of Etah district and 16.442 mg/l at Gonda
block of Aligarh district as per BIS Drinking Water Specification IS 10500: 2012
in ground water samples.
The concentration of lead was found more than 0.01 mg/l in 5 ground water
samples. The value of maximum concentration of lead was found to be 0.03 mg/l
at Dilari block of Moradabad district. Chromium was not found in any sample to
be more than 0.05 mg/l/.
The value of maximum concentration of chromium was found to be 0.034 mg/l
at Karchana block, Prayagraj district.
Arsenic concentration was found more than 0.01 mg/l in 52 samples (5.70%).
Iron concentration was found more than 1.0 mg/l in 260 samples (28.51%).
The concentration of Manganese was found more than 0.3 mg/l at 63 water
quality stations and its maximum concentration was found 1.857 mg/l at
Rajepur block of Farrukhabad district.
Iron is the main pollutant in shallow ground water of the studied area. Its
concentration was found more than 1.0 mg/l at 293 block locations (H/P IM-II)
of 63 districts of Uttar Pradesh. The concentration of iron in shallow ground
water of Uttar Pradesh is shown in Figure-2. The maximum concentration of iron
is found to be 21.705 mg/l at Myorpur block of Sonbhadra district.
The concentration of Arsenic was found above the permissible limit of BIS 2012
at 52 water quality stations in 26 districts

21
Ground Water Challenges:
The rise in the number of over-exploited blocks in the state of U.P is a biggest
challenge because these are the blocks wherein storage ground water resources are
depleting very fast. There is a probability for adjacent block which may also be comes
in water stressed category in future if proper effective intervention is not taken by
stakeholder
Non-scientific and disconnected approach of ground water development for
agriculture and industrial use is also creating hurdles in managing this precious
resource.
Rigidity in adoption of new cropping pattern depending on available groundwater
resources because of high market value of the present crop and non-availability of
market for the adopted crop.
There is increase in total Sodic soil due to water logging in most of canal command
area due to excess use of surface water irrigation causing decrease in per hectare yield
potential.
Detoriating ground water quality due to geogenic and anthropogenic contamination is
biggest challenge before the scientific fraternity to provide the safe domestic water.
Agriculture and industrial revolution in central Ganga plain has added challenge both
in terms quality and quantity.
The change in climatic pattern is also exerting withdrawal pressure on groundwater
resource creating imbalance in groundwater resources.
Conclusion:
By and large, the chemical quality of ground water of phreatic zone in Uttar Pradesh
is found to be suitable for drinking purposes as per available analyzed chemical
parameter data (as per BIS 2012).
Presence of some constituents beyond the permissible limit at some locations
renders the water unfit for public water supply.
Considering the parameters responsible for suitability of ground water of Uttar
Pradesh, it is observed that it is generally fit for irrigation purposes as per Electrical
conductivity, Residual Sodium Carbonate, Sodium Adsorption Ratio except at few
places where corrective measures are to be taken before agricultural usage.

22
GROUND WATER YEAR BOOK
UTTAR PRADESH
(2021 – 22)
CHAPTER 1
INTRODUCTION
The State of Uttar Pradesh forms a part of vast Gangetic Alluvial Plain covering an
area of 2,40,928 Sq. Km. and lies between North latitude 23052'12" & 30024'30" and East
longitude 77005'38" & 84038'30". It is bounded by Uttaranchal on the NW, Nepal on the NE,
Bihar on the East, Madhya Pradesh in the South, and Haryana, Delhi & Rajasthan in the West.
The state is covered with rich fertile soil and underlain by a large thickness of alluvium
making it one of the richest ground water repositories of the world. Ground water is a major
source of fresh water on earth. It is the most dependable source of water, comparatively free
from the vagaries of nature, easily accessible, available at the point of use and economical.
Hence it is being developed indiscriminately and the ground water reservoir is stressed. The
State being the most populous in the country with a population density of 829 persons per sq.
km and a high rate of population growth (20%) its demand for water is soaring. Also due to
industrialization, urbanization and modern farming practices its quality is also at stake.
The food production in UP is commensurate with the self sufficiency of the country.
One of the major contributors for this sufficiency is irrigation. To meet this high irrigational
requirement, water resources are being increasingly developed. Ground water contributes to
about 71% of the irrigation needs of the State. The indiscriminate development of ground
water has resulted in depletion of groundwater storage and lowering of water level in certain
areas on one hand. On other side the surface water development in areas having shallow water
level has resulted in water logging and soil salinization.
All these negative impacts on the resource give rise to the need for regular and
continuous monitoring of the ground water regime. The monitoring data forms the base of
management practices. In order to manage the water resources and plan development on
scientific lines a data base needs to be generated. In view of relative importance of this
valuable resource it becomes imperative to adopt sound and scientific management of
groundwater resources.
With this in view the Central Ground Water Board, an apex organization of India in
the field of ground water studies has established a network of 1007 monitoring wells, mostly
open wells spread all over the State. These are being monitored four times a year (January,
May, August & November). Few wells are being monitored through participatory monitoring

23
program for the remaining eight months. To study the hydro chemical behavior ground water
samples are collected from these stations once a year in May and analysed in the Regional
chemical laboratory. The data thus generated are carefully analysed and interpreted to study the
impact of various developmental activities on the groundwater regime. As dug wells are fast
becoming obsolete, these are slowly being replaced by special bore wells for monitoring called
Piezometers.
The statistical analysis of water level is carried out to decipher the water level status
during different seasons of the year and prepare a zoning. The water levels of different periods
are compared to analyse the behavioral patterns. The trend of water level behavior is worked
out and future predictions are estimated. The management programs are framed safe guarding
the environment and meet the requirement to optimal possibility.
Ground water is a dynamic resource; hence it requires continuous monitoring both in
terms of quality and quantity. The main objectives of ground water monitoring are:
-To study the behavior of the water level in space and time in response to recharge and
discharge.
-To study the long term behavior and trends for future predictions.
-To assess the ground water resource.
-To study the hydro chemical behavior of shallow ground water.
-To develop Artificial Recharge plan.
The district wise status of Ground Water Monitoring Wells (G.W.M.W.) as on
31.3.2022 are shown in Table-1 and location of wells are shown in Plate -1

24
Plate -1

25
Table: 1
STATUS OF GROUND WATER MONITORING WELLS (G.W.M.W.), UTTAR
PRADESH AS ON 31.3.22
S.No. Name Of The
District No. of G.W.M.W. as on 31.03.2022
DW PZ Total
1 Agra 4 7 11
2 Aligarh 10 0 10
3 Allahabad 37 0 37
4 Ambedkar Nagar 6 3 9
5 Amethi 14 1 15
6 Auraiya 12 2 14
7 Azamgarh 20 0 20
8 Baghpat 0 2 2
9 Bahraich 16 4 20
10 Ballia 23 0 23
11 Balrampur 16 4 20
12 Banda 15 0 15
13 Barabanki 23 5 28
14 Bareilly 7 5 12
15 Basti 7 1 8
16 Bijnor 6 5 11
17 Budaun 0 7 7
18 Bulanshahar 1 2 3
19 Chandauli 9 0 9
20 Chitrakoot 9 0 9
21 Deoria 11 0 11
22 Etah 3 4 7
23 Etawah 8 3 11
24 Faizabad 11 2 13
25 Farrukhabad 1 1 2
26 Fatehpur 15 3 18
27 Ferozabad 1 7 8
28 G.B.Nagar 0 5 5
29 Ghaziabad 0 8 8
30 Ghazipur 24 0 24
31 Gonda 7 4 11
32 Gorakhpur 8 0 8
33 Hamirpur 14 1 15
34 Hapur 0 2 2
35 Hardoi 16 9 25
36 J.P.Nagar 0 11 11
37 Jalaun 31 0 31

26
S.No. Name Of The
District No. of G.W.M.W. as on 31.03.2022
DW PZ Total
38 Jaunpur 33 0 33
39 Jhansi 21 1 22
40 Kannauj 4 4 8
41 Kanpur Dehat 10 1 11
42 Kanpur Nagar 15 2 17
43 Kanshiram Nagar 0 2 2
44 Kaushambi 12 1 13
45 Kushinagar 5 0 5
46 Lakhimpur 13 2 15
47 Lalitpur 20 1 21
48 Lucknow 7 18 25
49 Mahamaya Nagar 3 0 3
50 Maharajganj 6 1 7
51 Mahoba 8 1 9
52 Mainpuri 5 5 10
53 Mathura 16 0 16
54 Maunathbhanjan 9 0 9
55 Meerut 1 13 14
56 Mirzapur 15 0 15
57 Moradabad 3 8 11
58 Muzaffarnagar 2 4 6
59 Pilibhit 8 4 12
60 Pratapgarh 28 0 28
61 Rae Bareli 23 4 27
62 Rampur 3 2 5
63 Saharanpur 7 7 14
64 Sambhal 0 2 2
65 SantRavidas Nagar 5 0 5
66 Santkabir Nagar 5 0 5
67 Shahjahanpur 3 0 3
68 Shamli 0 6 6
69 Shrawasti 11 1 12
70 Siddharth Nagar 10 2 12
71 Sitapur 23 5 28
72 Sonbhadra 19 0 19
73 Sultanpur 20 5 25
74 Unnao 30 0 30
75 Varanasi 9 0 9
Grand Total 797 210 1007

27
Chapter 2
PHYSIOGRAPHY AND DRAINAGE
The State of Uttar Pradesh can broadly be divided into 2 physiographic units, the
Central Ganga Plain and the Bundelkhand and Vindhyan Plateau.
The Ganga Plain covering 85% of the State is a vast, flat expanse of alluvium having a
gentle south easterly regional slope. The highest elevation is around 350mamsl in the north
western parts and lowest 60mamsl in extreme south eastern part of the state. The land slope is
variable, being steep in the north western parts and gradually diminishing south east wards.
The slope ranges between less than a meter per kilometer to 5m/km. This Plain has three sub
divisions – the Terai in the northwest, the Central Ganga Plain in the center and the Marginal
alluvial Plain in the south.
The southern part of the state south of the Marginal Alluvial Plain is a part of
Bundelkhand and Vindhyan plateau. This plateau region slopes northerly and is represented by
undulating hilly terrain. The land slope varies from 550 – 130mamsl in the western part and
650 – 100 m amsl in the eastern part with steeper gradients than those in the northern Ganga
plain.
The State forms a part of Ganga basin. The master drainage of the state is river Ganga
and its tributaries. The Ramganga, Ghagra and Gomti are the main left bank tributaries, while
the Yamuna is the main right bank tributary. All these rivers except Gomti originate from
Himalayan ranges and are snow fed. Initially the rivers flow southward in the northwestern
part of the State, then turn south eastward and finally leave the State in an easterly direction.

28
Chapter3
CLIMATE AND RAINFALL
The State experiences a sub-humid and tropical climate with three distinct seasons
summer, monsoon & winter. The intervening periods are transitional period on the basis of
IMD long term normal data. The summer is hot and dry with maximum daily temperature
ranging between 38°C. to 43°C. The humidity during this season is lowest ranging between
30% to 53% at 08.30 hrs and 18% to 42% at 17.30 hrs. Summer seasons ends by May and
transition period starts. The rainy season commences by late June when south western
monsoon sets in over the State. The humidity gradually increases and reaches above 80%.
August is the peak rainy season. The bulk of annual rainfall about 85% occurs during
monsoon period (June to September). The monsoon starts retreating from the State in late
September or early October. Then commences another transitional period followed by winter
from late November till February. January is the coldest month of the period. Another
transitional period follows between winter and summer.
There is large variation in temperature both in time and space. The lowest temperature
is observed during January when night temperature ranges between 2°C & 6°C over the state.
With the start of summer the temperature starts rising with maximum during May when the
mercury may touch 45°C in central and eastern parts of the State. Gradually with the
beginning of rainy season the temperature drops which again shows a mild rising trend during
the intervening period before winter (October, November). The wind speed varies between 8-
10 km/hr during summer season and 4-6 km/hr during winter and rainy seasons. The wind is
mainly south westerly during summer and south easterly during winter. The Normal annual
potential Evapotranspiration of Uttar Pradesh is 1491.5 mm. The Normal annual potential
Evapotranspiration of East Uttar Pradesh is 1484.0 mm and of West Uttar Pradesh is 1499.0
mm. The monthly normal potential Evapotranspiration is high in hot months and low in
winter months. Normal potential Evapotranspiration is highest in the month of May with
value of 217.8 mm fallowed by June with value of 201.6 mm. The normal potential
Evapotranspiration is lowest in the month of December with value of 50.7 mm fallowed by
January with value of 55.6 mm.

29
Rainfall:
The rainfall is variable over the State ranging from maximum 1436.90 to minimum of
595.60 mm at Maharajganj and Mathura district respectively. The normal rainfall of the State
is 955 mm and the average annual rainfall for the year 2021 is 972.06 mm. The amount of
average monsoonal rainfall of 848.92 mm. The monthly Rainfall of the state along with
monsoonal and non-monsoonal rainfall has been shown in table 2. Isohyetal map of the area
shown in plate II, suggest that North and South eastern part of the has received very good
amount of Rainfall.

30
Table 2: Monthly and Annual Rainfall (mm) for the Year – 2021
S.No. DISTRICT JAN FEB MAR APR MAY JUN JUL AUG SEPT OCT NOV DEC Total Monsoon Non-
Monsoon
1 AGRA 16.5 10.3 8.1 4.9 11.5 52.5 232.3 272 136 26.9 4 4 779 692.8 86.2
2 ALIGARH 16.5 14.2 10.1 5.1 14.7 41.3 207.1 237.3 138 36.3 3.6 6.4 730.6 623.7 106.9
3 AMBEDKAR NAGAR 16.6 13.9 9 6.9 19.6 101.7 317 279.3 208 44.9 3.1 5.9 1025.9 906 119.9
4 AURAIYA 15.5 17.4 8.2 4 11.2 57.2 235.7 276.9 155.8 46.7 3.3 5.4 837.3 725.6 111.7
5 AYODHYA 17.7 13.1 9 4.9 15.9 94.8 308.9 277 179.7 40.4 2.8 6.7 970.9 860.4 110.5
6 AZAMGARH 15.7 13.2 8.8 5.7 15.1 97.6 334.1 294 220.9 46.1 5.6 4.9 1061.7 946.6 115.1
7 BAGHPAT 19.5 17.2 13.1 6.2 13.4 41.9 200.2 209.4 99.6 18.9 3.8 5.8 649 551.1 97.9
8 BAHRAICH 24.3 15.1 12.1 7.9 27.6 145 337.4 286 216.2 62.9 1.7 7.5 1143.7 984.6 159.1
9 BALLIA 15.1 9.6 6.9 4.5 18.5 118.2 315.4 280.5 180.7 43.8 4.1 2.2 999.5 894.8 104.7
10 BALRAMPUR 19.7 15.2 9.5 9.6 40.9 145.9 389.9 332.5 208.5 71.7 1.2 8.5 1253.1 1076.8 176.3
11 BANDA 18.6 12.6 7.5 3.7 7.3 80.5 286.8 342.6 160.7 37.5 7.5 7.3 972.6 870.6 102
12 BARABANKI 19.5 14.1 7.7 5 14.2 96 324.4 286.7 223.7 61.3 1.2 6.7 1060.5 930.8 129.7
13 BAREILLY 23.9 19.5 12.8 5.9 17.2 91.8 319 324.6 169.4 58.9 1.8 5.7 1050.5 904.8 145.7
14 BASTI 16.8 13.2 11.1 7.2 24.6 130 348.9 291.8 216.4 52.4 1.5 7.2 1121.1 987.1 134
15 BIJNOR 33.2 27 20 7.8 17.8 84.5 348.7 329 167.7 42 4.4 11.4 1093.5 929.9 163.6
16 BADAUN 17.6 16.7 11.7 3.9 13.6 63 270.3 280.5 140.4 53.4 2.3 5.3 878.7 754.2 124.5
17 BULANDSHAHR 19.6 15.1 12.4 5 11.4 47.5 236.5 247.7 143.5 36.6 3.8 5.4 784.5 675.2 109.3
18 CHANDAULI - - - - - - - - - - - - - - -
19 CHITRAKOOT - - - - - - - - - - - - - - -
20 DEORIA 15.7 19.2 10.5 11.4 29.5 132.4 324.7 311.2 205.3 63.4 3.6 5.2 1132.1 973.6 158.5
21 ETAH 16.7 11.7 11 4.3 12.4 50 217.4 254.6 132.3 40.2 2.2 4.9 757.7 654.3 103.4
22 ETAWAH 15.5 13.2 9.5 4.4 11 60.7 235.2 301.7 157.5 40.3 3.1 5.4 857.5 755.1 102.4
23 FARRUKHABAD 17.8 11.3 8.8 4.5 13.5 69.5 261.1 300.9 146.2 50 2.5 3.2 889.3 777.7 111.6
24 FATEHPUR 22.6 14.9 9.3 4.4 6.2 72.1 279.3 318.8 183.3 43.5 3.5 8.2 966.1 853.5 112.6

31
S.No. DISTRICT JAN FEB MAR APR MAY JUN JUL AUG SEPT OCT NOV DEC Total Monsoon Non-
Monsoon
25 FIROZABAD 15.2 11.4 6.8 4.6 9.8 58.1 238 250.6 146.1 33.1 2.7 3.9 780.3 692.8 87.5
26 GAUTAM BUDDHA NAGAR
- - - - - - - - - - - - - - -
27 GHAZIABAD 20.5 20.6 17.5 5.8 13 43.8 221.6 234.7 127.6 33.9 4.3 7 750.3 627.7 122.6
28 GHAZIPUR 18.7 14.2 6.7 4.4 14.3 114.5 288.2 310.8 214.7 54.2 8.8 3.2 1052.7 928.2 124.5
29 GONDA 18.5 10.5 8.6 7 22 136.7 346.2 307.4 239.5 60.7 1.3 8.4 1166.8 1029.8 137
30 GORAKHPUR 19.2 12.8 12.4 13.3 34.6 156.6 352.7 337.8 232 75.7 4.7 7.5 1259.3 1079.1 180.2
31 HAMIRPUR 16.8 12.7 5.4 2.2 6 58.5 244.5 294.1 146.8 28.4 4.6 5.6 825.6 743.9 81.7
32 HARDOI 20.4 13.3 9.5 5.7 15.5 82.6 279.8 270 172.5 57.9 2 6 935.2 804.9 130.3
33 JALAUN 16 12.2 6.2 2.5 8.4 62.7 248 316.6 155.7 42.2 3.8 5.3 879.6 783 96.6
34 JAUNPUR 16.9 13.7 7.5 4.3 11.3 91 325.1 268 220.2 34.9 7.2 5.4 1005.5 904.3 101.2
35 JHANSI 15.3 12.5 6.5 3.3 7.2 88.1 283.9 303.7 171.3 34 6.2 6.1 938.1 847 91.1
36 JYOTIBA PHULE NAGAR 24.7 20.5 15 5.6 13.8 60.5 301.2 295.5 157.4 45.9 4.3 7.7 952.1 814.6 137.5
37 KANNAUJ - - - - - - - - - - - - - - -
38 KANPUR DEHAT 15.7 14.3 7.1 4.8 7.4 76.3 228.5 271.7 150.3 39 2.5 5.7 823.3 726.8 96.5
39 KANPUR NAGAR 19 12.9 6.9 2.7 7.5 58.8 241.1 283.7 157.5 48 2 6.4 846.5 741.1 105.4
40 KANSIRAM NAGAR - - - - - - - - - - - - - - -
41 KAUSHAMBI - - - - - - - - - - - - - - -
42 KHERI 23.7 16.4 13.1 7.3 29.4 132.2 318.9 310.1 198.8 65.6 1.9 7.3 1124.7 960 164.7
43 KUSHINAGAR 18.6 12.7 11.1 15.8 41.9 173.2 372.4 354.6 238.5 74.6 3.3 7 1323.7 1138.7 185
44 LALITPUR 24.3 12.1 7.8 3.3 6.7 93 346 341.7 173.3 31.2 14.1 8.6 1062.1 954 108.1
45 LUCKNOW 20.3 13.3 7.9 5 12.4 81.7 276.2 278.8 175.9 47.9 1.4 6.2 927 812.6 114.4
46 MAHAMAYA NAGAR 13.3 11.9 8.8 3.7 10.2 46.8 212.4 249.8 132.1 25.7 2.1 4.5 721.3 641.1 80.2
47 MAHARAJGANJ 20.1 14.2 15.1 17.2 42.6 180.7 431.7 371 251.6 85.2 2.2 5.3 1436.9 1235 201.9
48 MAHOBA - - - - - - - - - - - - - - -
49 MAINPURI 13.6 10.2 8.7 4 10.7 59.1 218 253.2 140.5 35.5 3.1 5.9 762.5 670.8 91.7

32
S.No. DISTRICT JAN FEB MAR APR MAY JUN JUL AUG SEPT OCT NOV DEC Total Monsoon Non-
Monsoon
50 MATHURA 10.8 9.3 7.3 2.7 7.5 30.2 188.3 215.7 99.8 18.9 2.4 2.7 595.6 534 61.6
51 MAU 18.5 11.2 9.3 5.3 19 117.3 336.6 312.5 226.4 50.2 6.4 4.6 1117.3 992.8 124.5
52 MEERUT 24.1 20.6 15.9 9.3 14.2 61.6 271.8 279.8 153.2 39.3 4.5 10.4 904.7 766.4 138.3
53 MIRZAPUR 18.3 13.5 7.1 2.5 8 83.2 268.6 295.5 192.1 33.7 8.4 2.6 933.5 839.4 94.1
54 MORADABAD 23 20.2 13.6 6.3 15.9 79.7 306.7 302.8 158 47.7 3.4 8.9 986.2 847.2 139
55 MUZAFFARNAGAR 25 20.8 13.9 5.3 11.5 54.2 257.4 257.4 142.6 31.2 4.5 9.9 833.7 711.6 122.1
56 PILIBHIT 25 18 13.6 5.2 20 116 333.8 334.8 186.9 65.6 3.6 7 1129.5 971.5 158
57 PRATAPGARH - - - - - - - - - - - - - - -
58 PRAYAGRAJ 19.8 14.4 8.2 3.6 6.7 80.1 269.1 303.1 170.8 31.4 7.9 4.8 919.9 823.1 96.8
59 RAE BARELI 18.9 13.1 7.6 3.5 7.5 69.3 287.5 292.6 179.7 60 1.4 8 949.1 829.1 120
60 RAMPUR 22 21.8 19.1 8.7 25.3 116.4 364.2 330.1 154.4 39 4.9 11.2 1117.1 965.1 152
61 SAHARANPUR 31 26.2 20.3 5.5 15.6 79.9 268.9 282.1 133.1 32 5.4 12.2 912.2 764 148.2
62 SANT KABIR NAGAR - - - - - - - - - - - - - - -
63 SANT RAVI DAS NAGAR(BHADOHI)
19.3 14.9 9.6 5.7 9.8 86.2 299.7 301.4 187.3 37 9.3 3.2 983.4 874.6 108.8
64 SHAHJAHANPUR 19 15.7 12 5.1 18.6 92.3 294.2 306.9 158.1 63 2.6 6.5 994 851.5 142.5
65 SHRAWASTI 24.3 15.1 12.1 7.9 27.6 145 337.4 286 216.2 62.9 1.7 7.5 1143.7 984.6 159.1
66 SIDDHARTH NAGAR 17.7 13.8 11.5 9.8 30.6 150.7 391.8 316.9 205.1 67.6 1 7.3 1223.8 1064.5 159.3
67 SITAPUR 21.3 10.9 12.3 5.6 15.1 101.9 270.5 283.4 190.3 62.3 2 5.9 981.5 846.1 135.4
68 SONBHADRA 23.4 19.3 13 5.8 13.2 121.9 308.2 318.1 205.1 40.2 8.7 5.9 1082.8 953.3 129.5
69 SULTANPUR 16 12.7 8.1 5.4 13.9 81.1 324.6 298.1 198.7 41.2 2.6 6.2 1008.6 902.5 106.1
70 UNNAO 16.5 15.4 7 2.8 10.6 75.4 264.5 289.1 176.8 51.1 1.7 7.1 918 805.8 112.2
71 VARANASI 17.8 13.8 9 5.2 10.5 81.9 291.4 263.6 204.9 33.4 9.6 4 945.1 841.8 103.3

33
Plate II
Plate-III

34
Chapter 4
HYDROGEOLOGICAL FRAME WORK
The geology and structure of the formations existing in an area control occurrence and
movement of ground water. The geomorphic conditions also have a great impact on ground
water scenario. The larger part of the State is underlain by fluvial sediments laid down in the
fore deep between Plateau region in south and Himalayas in north during the Quaternary
period by the Indus-Ganga system of drainage over the Precambrian topography existing
during geological past. These deposits owe their origin to riverine activity. The southern part
of the State has entirely different geological conditions being underlain by Precambrian
formations under a thin alluvial cover. Broadly, the State can be divided into two
hydrogeological units.
1. Unconsolidated zone.
2. Consolidated, hard rock zone.
The hydrogeological conditions of the above two units widely differ and are discussed
subsequently in brief.
Unconsolidated Zone:
This unit covers nearly 85% of the State area. The unconsolidated formations
comprising the area have been deposited through mighty rivers originating from great
Himalayan Mountains. These sediments are an admixture of pebble, gravel, sand, silt, clay and
kankar. The sediments are generally coarser in the north and gradually become finer south east
ward along downstream of the drainage which is a typical feature of fluvial deposits. This zone
consists of mainly two parts, the Terai and the Alluvial Plain. However, foot hill zone is very
small part of Bhaber belt and lies in the northern parts of Bijnore and Saharanpur districts. The
Terai is a narrow disconnected belt along the north western fringe of the State. The Alluvial
Plain occupies the area south of Terai and can further be divided in two sub units - Younger
Alluvium and Older Alluvium.
The younger alluvium occurs mostly along the present day flood plain area. The
continuous shifting of the drainage network with time caused reworking of their earlier
deposits giving rise to the younger alluvium. The older alluvium occupying comparatively high
area covers major part of the Plain. A typical characteristic of older alluvium is formation of
kankar within itself due to leaching of calcium carbonate under favourable climatic conditions.
The kankar occasionally forms pans restricting downward movement of water.

35
The thickness of alluvial sediments is variable and generally goes upto 500m. below
which occur the semi-consolidated Upper Siwalik formations. The Shallower basement occurs
in isolated areas which are known as “Basement highs."
This unconsolidated zone is porous and permeable with primary intergranular porosity
and has good ground water potential. The sub-surface correlation of formations in the state has
shown presence of several aquifers down to a depth of 750 m below the ground. These aquifers
mainly encountered in Central Ganga Plain have been grouped on the basis of lithological
characters as well as based on interpretation of electrical logs of Boreholes drilled and are as
follows
1. First aquifer 0.0 – 150.00 mbgl
2. Second aquifer 160.00 – 210.00 mbgl
3. Third aquifer 250.00 – 360.00 mbgl
4. Forth deep aquifer 380.00 – 600.00 mbgl
The upper part of first aquifer down to 50 mbgl is the main source of drinking water
through hand pumps and dug wells and is unconfined in nature. The first aquifer as a whole
which is under unconfined to semi-confined conditions, it is the most potential aquifer group
which is the main source of groundwater in the State extensively exploited through private as
well as Government tube wells to meet the drinking water and irrigation needs. The deeper
aquifers are confined in nature being exploited to a very limited extent. The yield of second
aquifer is limited while the third aquifer is potential. The shallow and phreatic aquifers are
under heavy stress.
Consolidated Zone:
The Bundelkhand Vindhyan plateau region is underlain by variety of Precambrian
formations, mostly granite and granite gneisses, Vindhyan sandstone, limestone & shale,
under a thin a alluvial cover or without alluvial cover. As such these formations are hard and
compact and devoid of any primary porosity. The ground water in these formations occurs in
the secondary porosity of these formations. The secondary porosity has developed due to
cracks and fractures which are open at the surface and tighten at depth. The ground water
occurs under unconfined or water level conditions in these formations. The alluvial sediments
of moderate depth along the river courses and in valleys form potential groundwater
repositories. The weathered mantle over the entire unit also forms potential aquifers. These
aquifers are being monitored mostly through open wells over the area.

36
Chapter 5
BEHAVIOUR OF WATER LEVEL
The groundwater storage is largely controlled by the prevailing
hydrogeological and geomorphic conditions. Besides, magnitude of input (recharge) to the
ground water system and output (discharge) from it also influences the status of groundwater
regime. In the State of Uttar Pradesh hydrogeological as well as the geomorphological
conditions are highly variable as evident from earlier chapters. The chief source of recharge to
storage is rainfall which is highly variable over space and time. The main source of discharge
is ground water abstraction which is also varying and also growing exponentially. The regions
having ground water as the main source for irrigation always remain under heavy stress. The
imbalance between the recharge and discharge expresses itself in terms of variations in the
ground water level. Thus, the water level is a very important parameter for ground water
studies. The behavior of the water level in the state during year 2021-22 has been studied based
upon the observations made on the permanent Ground Water Monitoring Wells and described
in the following paragraphs.
Depth to Water Level during 2021 - 22
The depth to ground water level in the state is highly variable throughout the year
ranging from ground level to 45.21 m bgl. The distribution pattern remains same during the
year with the areas under different ranges increasing/reducing in different seasons.
The water level in general increases from north-east to south-west roughly parallel to
the northern boundary of the State. The shallow water level occurs in the north, north eastern
part and parts of central region of the state. The moderate water level occurs in the north
western part, the central part and along the southern boundary. The deeper water level occurs
in the western part, along Yamuna river, parts of southern U.P. and cities.
There are four canal command areas in the state but these do not have the same depth
to water level pattern and all do not necessarily show very shallow ground water levels. The
Gandak and Saryu command areas in general show very shallow water level 2 – 5 mbgl and
water logging conditions exists in the monsoon and post monsoon period with few areas within
these zones showing 5 – 10 mbgl. Generally the larger areas in Sharda Sahayak command fall

37
under 5 – 10 mbgl water level range In comparison to above commands, in Ramganga
command the water level is generally deeper falling in the range of 5 – 10 mbgl in the north
eastern part and 10 – 20 mbgl in the south western part along the River Yamuna.
The different water level zones are controlled by geomorphological features such as
flood plains, natural levees of main rivers, interfluves areas etc. as well as by the nature of
deposits.
May 2021:
This is the pre-monsoon period as it appears after one complete cycle of inputs
and outputs. Generally this period shows the deepest water levels during the year. May is the
dry season and the water levels are used for most of the ground water calculations. The
analyses of 661 wells have carried out for groundwater studies.
In general water level ranges mostly from 2 to 20 mbgl, however parts of the state
show variation of 20 mbgl or above. The water levels in the range of 0 to 2 mbgl (i.e., water
logged condition) is observed only in 73 wells.
Water level in the range of 2 - 5 mbgl is observed in 245 Monitoring Wells (about 37.06%). It
is usually observed along the Terai belt, extending from parts of Moradabad to Kushi Nagar
and upto Ballia in eastern U.P. As per available data, the given range of water level is found
in the district of Ambedkar Nagar, Bahraich, Gonda, Azamgarh, Ghazipur, Mirzapur and
Sonbhadra.
About 31.92 % of wells (211 nos.) show water level between 5 and 10 m bgI. This
area is observed in almost all parts of U.P. The water level of 5 to 10 mbgl is observed in
Saharanpur, Miuzaffarnagr, Bijnaur, Moradabad, Rampur, Barelly, Shajahnpur, Lakhimpur
Khiri, Sitapur, Barabanki, Hamirpur, Mahoba,Banda, Chitrakoot, Fatehpur, Pratapgarh,
Jaunpur, Jaunpur, Allahabad, Mirzapur, Varanasi, Sonbhadra and Ghazipur. Water level in
the range of 10 – 20m have been observe in 104 wells (15.73%) mainly in Sharanpur, Shamli,
Muzaffarnagar, Meeut, Ghaziabad, Hapur, Sambhal, Badaun, Farukhabad, Kannauj, Unnao,
Hamirpur, Jalaun, Itawah, Mainpuri, Etah, Hathras and Aligarh. There were few wells (25)
where was water level recorded between 20 to 40mbgl mainly in Agra, Auraiya, Baghpat,
Budaun, Etawah, Firozabad etc. whereas 3 wells in the state where water level are found to
be more than 40m namely Agra, G.B.Nagar and Lucknow having water level 44.20,45.21 and
41.82mrespectively.

38
Table-3
DISTRICT- WISE DEPTH TO WATER LEVEL, U.P.
May, 2021 District No. of Wells
Analysed
Depth to Water
Table (mbgl) No. / Percentage of Wells Showing Depth to Water Table (mbgl) in the Range of
Min Max 0.0 - 2.0 2.0 - 5.0 5.0 - 10.0 10.0 - 20.0 20.0 - 40.0 > 40.0
AGRA 9 1.78 44.20
1
11.11%
1
11.11%
1
11.11%
2
22.22 %
3
33.33%
1
11.11%
ALIGARH 5 3.62 15.88 0
1
20.00%
2
40.00%
2
40.00 % 0 0
ALLAHABAD 30 1.81 19.14
1
3.33%
13
43.33%
9
30.00%
7
23.33 % 0 0
AMBEDKAR NAGA 7 1.99 5.50
1
14.29%
5
71.43%
1
14.29% 0 0 0
AURAIYA 6 4.06 22.66 0
1
16.67%
3
50.00%
1
16.67 %
1
16.67% 0
AZAMGARH 13 1.56 7.87
3
23.08%
5
38.46%
5
38.46% 0 0 0
BAGHPAT 2 27.80 28.83 0 0 0 0
2
100.00% 0
BAHRAICH 10 1.79 9.50
3
30.00%
5
50.00%
2
20.00% 0 0 0
BALLIA 18 0.70 8.83
7
38.89%
7
38.89%
4
22.22% 0 0 0
BALRAMPUR 17 0.10 9.90
6
35.29%
9
52.94%
2
11.76% 0 0 0
BANDA
10 1.15 15.90 1
10.00%
4
40.00%
3
30.00%
2
20.00 % 0 0

39
BARABANKI 15 3.63 8.21 0
7
46.67%
8
53.33% 0 0 0
BAREILLY 8 0.80 12.30
1
12.50%
3
37.50%
3
37.50%
1
12.50 % 0 0
BASTI 7 1.20 3.82
2
28.57%
5
71.43% 0 0 0 0
BIJNOR 6 2.29 19.37 0
3
50.00% 0
3
50.00 % 0 0
BUDAUN 4 7.24 21.14 0 0
1
25.00%
2
50.00 %
1
25.00% 0
BULANDSHAHR 3 5.82 11.67 0 0
1
33.33%
2
66.67 % 0 0
CHANDAULI 4 2.40 8.64 0
3
75.00%
1
25.00% 0 0 0
CHITRAKOOT 7 2.45 19.20 0
1
14.29%
2
28.57%
4
57.14 % 0 0
DEORIA 8 0.76 5.05
3
37.50%
4
50.00%
1
12.50% 0 0 0
ETAH 6 3.49 14.90 0
1
16.67%
3
50.00%
2
33.33 % 0 0
ETAWAH 4 6.93 37.60 0 0
2
50.00%
1
25.00 %
1
25.00% 0
FAIZABAD 11 1.65 8.05
1
9.09%
3
27.27%
7
63.64% 0 0 0
FARRUKHABAD 2 5.11 15.98 0 0
1
50.00%
1
50.00 % 0 0
FATEHPUR 7 2.60 14.00 0
4
57.14%
1
14.29%
2
28.57 % 0 0
FIROZABAD
4 10.70 28.67 0 0 0 2
50.00 %
2
50.00% 0

40
GAUTAM BUDDHA
NAGAR
2 20.55 45.21 0 0 0 0 1
50.00%
1
50.00%
GHAZIABAD 6 3.67 21.71 0 1
16.67%
2
33.33%
2
33.33 %
1
16.67%
0
GHAZIPUR 16 0.35 11.60 8
50.00%
3
18.75%
3
18.75%
2
12.50 %
0 0
GONDA 7 1.63 7.25 1
14.29%
5
71.43%
1
14.29%
0 0 0
GORAKHPUR 3 3.72 5.36 0 2
66.67%
1
33.33%
0 0 0
HAMIRPUR 7 0.84 24.70 1
14.29%
2
28.57%
3
42.86%
0 1
14.29%
0
HARDOI 18 1.62 9.42 2
11.11%
10
55.56%
6
33.33%
0 0 0
HATHRAS 3 4.23 15.32 0 1
33.33%
1
33.33%
1
33.33 %
0 0
JALAUN 21 0.85 25.89 1
4.76%
7
33.33%
7
33.33%
4
19.05 %
2
9.52%
0
JAUNPUR 17 1.76 8.35 1
5.88%
7
41.18%
9
52.94%
0 0 0
JHANSI 15 3.10 9.57 0 1
6.67%
14
93.33%
0 0 0
JYOTIBA PHULE N 6 11.89 19.81 0 0 0 6
100.00 %
0 0
KANNAUJ 4 0.71 25.77 1
25.00%
0 1
25.00%
0 2
50.00%
0
KANPUR DEHAT 4 5.89 18.00 0 0 3
75.00%
1
25.00 %
0 0
KANPUR NAGAR 12 3.76 39.55 0 4
33.33%
4
33.33%
3
25.00 %
1
8.33%
0

41
KAUSHAMBI 7 7.58 20.59 0 0 1
14.29%
5
71.43 %
1
14.29%
0
KHERI 7 2.31 9.83 0 6
85.71%
1
14.29%
0 0 0
KUSHINAGAR 4 0.60 2.37 3
75.00%
1
25.00%
0 0 0 0
LALITPUR 14 2.32 16.14 0 6
42.86%
6
42.86%
2
14.29 %
0 0
LUCKNOW 17 2.69 41.82 0 4
23.53%
3
17.65%
7
41.18 %
2
11.76%
1
5.88%
MAHOBA 9 4.55 14.70 0 2
22.22%
6
66.67%
1
11.11 %
0 0
MAHRAJGANJ 6 0.41 2.85 5
83.33%
1
16.67%
0 0 0 0
MAINPURI 4 4.92 7.68 0 1
25.00%
3
75.00%
0 0 0
MATHURA 12 2.39 11.78 0 6
50.00%
3
25.00%
3
25.00 %
0 0
MAU 6 0.63 7.85 2
33.33%
3
50.00%
1
16.67%
0 0 0
MEERUT 10 8.16 23.17 0 0 4
40.00%
4
40.00 %
2
20.00%
0
MIRZAPUR 4 1.74 14.71 2
50.00%
1
25.00%
0 1
25.00 %
0 0
MORADABAD 11 1.51 18.41 1
9.09%
3
27.27%
1
9.09%
6
54.55 %
0 0
MUZAFFARNAGA 9 2.15 21.79 0 2
22.22%
1
11.11%
4
44.44 %
2
22.22%
0
PILIBHIT 9 2.66 5.67 0 7
77.78%
2
22.22%
0 0 0

42
PRATAPGARH 23 2.05 15.79 0 4
17.39%
15
65.22%
4
17.39 %
0 0
RAE BARELI 25 2.23 12.85 0 14
56.00%
9
36.00%
2
8.00 %
0 0
RAMPUR 2 5.62 10.78 0 0 1
50.00%
1
50.00 %
0 0
SAHARANPUR 9 4.17 10.34 0 2
22.22%
6
66.67%
1
11.11 %
0 0
SANT KABIR NAGA 4 2.05 3.10 0 4
100.00%
0 0 0 0
SANT RAVIDAS NA 4 3.50 8.88 0 1
25.00%
3
75.00%
0 0 0
SHRAWASTI 11 0.62 4.48 5
45.45%
6
54.55%
0 0 0 0
SIDDHARTHNAGA 10 0.83 5.42 4
40.00%
5
50.00%
1
10.00%
0 0 0
SITAPUR 19 2.50 12.99 0 10
52.63%
7
36.84%
2
10.53 %
0 0
SONBHADRA 8 2.98 14.92 0 3
37.50%
4
50.00%
1
12.50 %
0 0
SULTANPUR 34 0.65 11.95 3
8.82%
19
55.88%
9
26.47%
3
8.82 %
0 0
UNNAO 13 0.47 15.57 2
15.38%
5
38.46%
4
30.77%
2
15.38 %
0 0
VARANASI 6 1.78 11.88 1
16.67%
1
16.67%
2
33.33%
2
33.33 %
0 0
Total 661 0.10 45.21 73 245 211 104 25 3

43
The district wise categorization table of water level during May 2021 is presented in
table-3 and the pictorial view is shown in Plate –IV.
Plate IV
August 2021:
The water level during August indicates the immediate impact of rain fall on ground
water storage. This is the month of peak monsoon rainfall hence this measurement is carried
out to get the peak of the water level hydrograph. The water level rises in response to rainfall.
Water level has become shallower in large part of the state as per available data. Out
of 718 analyzed well 275 (38.30%) falls in the range of 0 to 2mbgl and182 wells (25.32%)
fall in the range of 2 – 5mbgl, it occurs mainly in Lakhimpur Khiri, Shrawasti, Bahraich,
Balrampur, Gonda, Ayodhya, Ambedkar Nagar, Azamgarh, Sidarth Nagar, Mau, Ballia and
northern part of Sonbhadra Districts. The water level in the range of 5-10 and 10-20mbgl
occur in the 20.89% and 11.97% respectively. As per record, the water level between 10 – 20
are observed mainly western UP such as Saharanpur, Shamli, Muzaffarnagar, Amroha,
Sambhal, Budaun, Baghpat, Meerut, Hapur and some parts of Kannauj and Lucknow
Districts.

44
The district wise categorization table of water level during August 2021 is presented
in table-4 and the pictorial view is shown in Plate-V.
Plate-V

45
DISTRICT- WISE DEPTH TO WATER LEVEL, U.P. Table-4
August, 2021
District No. of Wells
Analysed
Depth to Water
Table (mbgl) No. / Percentage of Wells Showing Depth to Water Table (mbgl) in the Range of
Min Max 0.0 - 2.0 2.0 - 5.0 5.0 - 10.0 10.0 - 20.0 20.0 - 40.0 > 40.0
AGRA 9 0.47 43.97 2
22.22%
0 2
22.22%
1
11.11 %
3
33.33%
1
11.11%
ALIGARH 6 1.33 5.11 2
33.33%
2
33.33%
2
33.33%
0 0 0
ALLAHABAD 26 0.15 18.46 14
53.85%
4
15.38%
6
23.08%
2
7.69 %
0 0
AMBEDKAR NAGA 7 0.80 3.50 4
57.14%
3
42.86%
0 0 0 0
AURAIYA 7 1.50 21.40 1
14.29%
3
42.86%
2
28.57%
0 1
14.29%
0
AZAMGARH 14 0.85 7.00 6
42.86%
6
42.86%
2
14.29%
0 0 0
BAGHPAT 2 25.51 28.69 0 0 0 0 2
100.00%
0
BAHRAICH 11 0.02 8.75 9
81.82%
0 2
18.18%
0 0 0
BALLIA 17 0.15 3.90 12
70.59%
5
29.41%
0 0 0 0
BALRAMPUR 15 0.02 5.50 14
93.33%
0 1
6.67%
0 0 0
BANDA 13 0.05 10.50 7
53.85%
2
15.38%
3
23.08%
1
7.69 %
0 0

46
BARABANKI 18 0.53 10.49 8
44.44%
5
27.78%
3
16.67%
2
11.11 %
0 0
BAREILLY 9 0.85 13.22 1
11.11%
3
33.33%
4
44.44%
1
11.11 %
0 0
BASTI 7 0.70 3.18 6
85.71%
1
14.29%
0 0 0 0
BIJNOR 5 1.27 18.50 1
20.00%
1
20.00%
1
20.00%
2
40.00 %
0 0
BUDAUN 3 15.92 19.87 0 0 0 3
100.00 %
0 0
BULANDSHAHR 3 4.33 10.56 0 1
33.33%
1
33.33%
1
33.33 %
0 0
CHANDAULI 8 0.42 9.21 5
62.50%
2
25.00%
1
12.50%
0 0 0
CHITRAKOOT 9 0.70 13.35 1
11.11%
2
22.22%
5
55.56%
1
11.11 %
0 0
DEORIA 9 0.19 0.93 9
100.00%
0 0 0 0 0
ETAH 7 2.68 14.36 0 2
28.57%
2
28.57%
3
42.86 %
0 0
ETAWAH 6 3.87 30.14 0 1
16.67%
3
50.00%
1
16.67 %
1
16.67%
0
FAIZABAD 11 0.25 6.55 4
36.36%
5
45.45%
2
18.18%
0 0 0
FARRUKHABAD 2 3.02 13.13 0 1
50.00%
0 1
50.00 %
0 0
FATEHPUR 12 2.25 27.70 0 4
33.33%
3
25.00%
4
33.33 %
1
8.33%
0

47
FIROZABAD 4 10.11 26.78 0 0 0 3
75.00 %
1
25.00%
0
GAUTAM BUDDHA 4 2.07 39.79 0 1
25.00%
0 1
25.00 %
2
50.00%
0
GHAZIABAD 6 3.48 22.40 0 1
16.67%
2
33.33%
2
33.33 %
1
16.67%
0
GHAZIPUR 13 0.32 8.30 8
61.54%
3
23.08%
2
15.38%
0 0 0
GONDA 6 0.20 6.00 5
83.33%
0 1
16.67%
0 0 0
GORAKHPUR 4 0.27 1.01 4
100.00%
0 0 0 0 0
HAMIRPUR 6 0.80 13.56 3
50.00%
2
33.33%
0 1
16.67 %
0 0
HARDOI 17 1.48 9.32 3
17.65%
9
52.94%
5
29.41%
0 0 0
HATHRAS 3 2.63 11.08 0 2
66.67%
0 1
33.33 %
0 0
JALAUN 25 0.22 32.69 5
20.00%
7
28.00%
7
28.00%
3
12.00 %
3
12.00%
0
JAUNPUR 23 0.19 8.01 15
65.22%
4
17.39%
4
17.39%
0 0 0
JHANSI 17 0.98 11.27 2
11.76%
6
35.29%
8
47.06%
1
5.88 %
0 0
JYOTIBA PHULE N 6 11.50 20.17 0 0 0 5
83.33 %
1
16.67%
0
KANNAUJ 4 0.42 25.10 1
25.00%
0 1
25.00%
0 2
50.00%
0
KANPUR DEHAT 8 2.95 18.80 0 3
37.50%
3
37.50%
2
25.00 %
0 0

48
KANPUR NAGAR 13 1.65 41.52 1
7.69%
4
30.77%
6
46.15%
1
7.69 %
0 1
7.69%
KAUSHAMBI 6 2.16 12.37 0 1
16.67%
2
33.33%
3
50.00 %
0 0
KHERI 7 0.83 7.98 4
57.14%
2
28.57%
1
14.29%
0 0 0
KUSHINAGAR 5 0.17 1.00 5
100.00%
0 0 0 0 0
LALITPUR 17 1.16 15.08 4
23.53%
8
47.06%
4
23.53%
1
5.88 %
0 0
LUCKNOW 18 0.60 42.19 2
11.11%
5
27.78%
0 9
50.00 %
1
5.56%
1
5.56%
MAHOBA 9 1.10 10.36 2
22.22%
3
33.33%
3
33.33%
1
11.11 %
0 0
MAHRAJGANJ 6 0.14 0.95 6
100.00%
0 0 0 0 0
MAINPURI 5 2.42 8.37 0 2
40.00%
3
60.00%
0 0 0
MATHURA 12 0.20 10.45 7
58.33%
2
16.67%
2
16.67%
1
8.33 %
0 0
MAU 6 1.04 5.17 3
50.00%
2
33.33%
1
16.67%
0 0 0
MEERUT 9 7.91 22.69 0 0 4
44.44%
2
22.22 %
3
33.33%
0
MIRZAPUR 10 0.43 10.57 5
50.00%
1
10.00%
3
30.00%
1
10.00 %
0 0
MORADABAD 6 0.32 18.20 2
33.33%
1
16.67%
0 3
50.00 %
0 0
MUZAFFARNAGA 9 1.82 17.76 1
11.11%
1
11.11%
2
22.22%
5
55.56 %
0 0

49
PILIBHIT 9 1.26 3.74 3
33.33%
6
66.67%
0 0 0 0
PRATAPGARH 26 0.41 15.78 11
42.31%
5
19.23%
8
30.77%
2
7.69 %
0 0
RAE BARELI 25 0.50 18.00 11
44.00%
7
28.00%
4
16.00%
3
12.00 %
0 0
RAMPUR 3 4.78 10.72 0 1
33.33%
1
33.33%
1
33.33 %
0 0
SAHARANPUR 12 1.26 14.28 2
16.67%
1
8.33%
7
58.33%
2
16.67 %
0 0
SANT KABIR NAGA 4 0.23 0.46 4
100.00%
0 0 0 0 0
SANT RAVIDAS NA 4 2.42 4.00 0 4
100.00%
0 0 0 0
SHRAWASTI 8 0.10 1.85 8
100.00%
0 0 0 0 0
SIDDHARTHNAGA 10 0.20 0.95 10
100.00%
0 0 0 0 0
SITAPUR 19 0.39 12.59 6
31.58%
6
31.58%
6
31.58%
1
5.26 %
0 0
SONBHADRA 17 0.58 9.64 4
23.53%
8
47.06%
5
29.41%
0 0 0
SULTANPUR 36 0.50 11.90 15
41.67%
12
33.33%
5
13.89%
4
11.11 %
0 0
UNNAO 18 0.18 14.22 6
33.33%
6
33.33%
3
16.67%
3
16.67 %
0 0
VARANASI 7 1.04 10.22 1
14.29%
3
42.86%
2
28.57%
1
14.29 %
0 0
Total 718 0.23 43.97 275 182 150 86 22 3

50
November 2021:
The water level starts receding gradually after August with lateral flow of ground
water due to change in hydraulic conditions with recession of monsoon and ground water
storage. The water level stabilizes by November and there after natural out flow reduces
considerably. This is the post monsoon water level which reflects the change in ground water
storage which is the dynamic ground water resource. The volume of water available in
storage may be safely used during the remaining year. This water level is an important
parameter for resource estimation, planning etc.
Water logged area showing DWL 0-2 mbgl has been found in 248 wells (34.20%) and
are located in patches like LakhimpurKhiri, Banda, Bahraich, Shrawasti, Balrampur,
SiddharthNagar,Maharajganj, KushiNagar, Sultanpur, Azamgarh, Ghazipur,Mau,
Ballia,Chandauli and Allahabad district.
.
The depth to water level from 2 to 5mbgl is found in 229 monitored wells (31.58%)
This range is observed in most parts of the districts in Terai, Eastern, Central U.P and few
districts of Bundelkhand region. Along the Gomti, Ghaghra and Sharda rivers water level
ranges from 2 to 5 mbgl. Most parts of districts of eastern U.P. and Terai region shows DWL
< 5mbgl.
The depth to water levels from 5 to 10 mbgl are observed in 136 wells (18.75%).
This range is prominent in Western, Central & Southern U.P. A thin strip showing this range
runs along the Ganga river, and extends over the Ganga - Ramganga interfluve area. This
range is also seen along the Ganga-Yamuna doab from Aligarh up to Allahabad through
Mathura, Kanpur Dehat, Kanpur Nagar, Jalaun, Hamirpur and Banda. On both the sides of
Betwa river in Jhansi and Jalaun water level are observed to vary from 5 to 10 mbgl.
The water levels of 10 to 20 mbgl are noticed in 89 wells (12.27%), mostly along the
Yamuna river upto Varanasi, through Mathura, Agra, Kanpur, Jalaun, Fatehpur, Hamirpur,
Chitrakoot and Banda districts. This is mainly due to higher elevation of natural levee formed
on either side of the Yamuna river. Most parts of districts of western U.P. Shamli, Meerut,
Hapur, Amorha, Sambhal Bulandshahar, Baghpat, Ghaziabad, G.B.Nagar, J.P.Nagar,
Moradabad, show water level in this range. Few patches are seen in Agra, Bijnor, Chitrakoot,
Fatehpur, Hamirpur, Hathras, Kaushambi, Pratapgarh, Sultanpur and Unnao districts. Along

51
the Ganga river a wide patch shows water level in the range. In Lucknow city water level in
this range is observed in most of the wells.
The depth range of 20 - 30 mbgl are found in 23wells along Agra, Baghpat, Meerut,
Firozabad, and Lucknow districts. In Lucknow city DWL in this range is found only in 7
wells (7.8%).Only 20 wells shows depth to water levels greater than 20m. These areas
showing deeper water levels are due to bearing of geomorphology as presence of ravenous
tract along the Yamuna and Betwa rivers. The water level observed between 30 – 40mbgl are
noticed in three districts such as Agra, Firozabad, G.B.Nagar and Lucknow.

52
Table-5
DISTRICT-WISE DEPTH TO WATER LEVEL, U.P.
November, 2021
District No. of Wells
Analysed
Depth to Water Table (mbgl) No. / Percentage of Wells Showing Depth to Water Table (mbgl) in the Range of
Min Max 0.0 - 2.0 2.0 - 5.0 5.0 - 10.0 10.0 - 20.0 20.0 - 40.0 > 40.0
AGRA 9 0.85 43.95 2
22.22%
0 2
22.22%
1
11.11 %
3
33.33%
1
11.11%
ALIGARH 8 1.87 10.90 1
12.50%
2
25.00%
3
37.50%
2
25.00 %
0 0
ALLAHABAD 33 0.42 13.93 13
39.39%
12
36.36%
6
18.18%
2
6.06 %
0 0
AMBEDKAR NAGA 7 1.59 3.40 4
57.14%
3
42.86%
0 0 0 0
AURAIYA 9 1.40 19.58 2
22.22%
4
44.44%
1
11.11%
2
22.22 %
0 0
AZAMGARH 15 0.50 3.83 11
73.33%
4
26.67%
0 0 0 0
BAGHPAT 2 25.79 30.55 0 0 0 0 2
100.00%
0
BAHRAICH 11 0.97 8.85 5
45.45%
4
36.36%
2
18.18%
0 0 0
BALLIA 15 0.54 4.83 11
73.33%
4
26.67%
0 0 0 0
BALRAMPUR 17 0.20 7.30 9
52.94%
6
35.29%
2
11.76%
0 0 0
BANDA 12 0.68 13.86 3
25.00%
6
50.00%
1
8.33%
2
16.67 %
0 0

53
BARABANKI 19 0.78 9.78 9
47.37%
6
31.58%
4
21.05%
0 0 0
BAREILLY 8 1.07 12.10 1
12.50%
4
50.00%
2
25.00%
1
12.50 %
0 0
BASTI 7 1.15 4.27 6
85.71%
1
14.29%
0 0 0 0
BIJNOR 6 0.51 17.47 2
33.33%
1
16.67%
2
33.33%
1
16.67 %
0 0
BUDAUN 4 15.67 19.57 0 0 0 4
100.00 %
0 0
BULANDSHAHR 2 7.33 11.34 0 0 1
50.00%
1
50.00 %
0 0
CHANDAULI 8 0.48 8.09 4
50.00%
2
25.00%
2
25.00%
0 0 0
CHITRAKOOT 8 2.93 14.10 0 3
37.50%
2
25.00%
3
37.50 %
0 0
DEORIA 9 0.61 3.32 5
55.56%
4
44.44%
0 0 0 0
ETAH 8 2.35 14.10 0 2
25.00%
2
25.00%
4
50.00 %
0 0
ETAWAH 7 3.50 34.89 0 2
28.57%
2
28.57%
1
14.29 %
2
28.57%
0
FAIZABAD 11 0.74 4.95 4
36.36%
7
63.64%
0 0 0 0
FARRUKHABAD 2 1.30 16.05 1
50.00%
0 0 1
50.00 %
0 0
FATEHPUR 11 0.89 18.53 1
9.09%
3
27.27%
2
18.18%
5
45.45 %
0 0

54
FIROZABAD 4 8.15 26.70 0 0 1
25.00%
2
50.00 %
1
25.00%
0
GAUTAM BUDDHA 3 14.00 39.37 0 0 0 1
33.33 %
2
66.67%
0
GHAZIABAD 5 6.56 20.52 0 0 2
40.00%
1
20.00 %
2
40.00%
0
GHAZIPUR 15 0.06 8.60 12
80.00%
0 3
20.00%
0 0 0
GONDA 7 1.10 5.23 5
71.43%
1
14.29%
1
14.29%
0 0 0
GORAKHPUR 4 1.43 3.55 1
25.00%
3
75.00%
0 0 0 0
HAMIRPUR 6 1.08 12.99 2
33.33%
3
50.00%
0 1
16.67 %
0 0
HARDOI 16 1.33 7.49 4
25.00%
8
50.00%
4
25.00%
0 0 0
HATHRAS 3 1.80 10.82 1
33.33%
1
33.33%
0 1
33.33 %
0 0
JALAUN 27 0.31 29.75 4
14.81%
7
25.93%
11
40.74%
2
7.41 %
3
11.11%
0
JAUNPUR 22 0.16 15.07 12
54.55%
7
31.82%
2
9.09%
1
4.55 %
0 0
JHANSI 16 1.63 9.95 2
12.50%
4
25.00%
10
62.50%
0 0 0
JYOTIBA PHULE N 7 10.79 19.47 0 0 0 7
100.00 %
0 0
KANNAUJ 4 0.31 23.90 1
25.00%
1
25.00%
0 0 2
50.00%
0

55
KANPUR DEHAT 7 2.69 18.85 0 5
71.43%
0 2
28.57 %
0 0
KANPUR NAGAR 13 1.21 41.25 4
30.77%
3
23.08%
4
30.77%
1
7.69 %
0 1
7.69%
KAUSHAMBI 9 2.04 18.13 0 1
11.11%
2
22.22%
6
66.67 %
0 0
KHERI 7 0.96 7.49 3
42.86%
3
42.86%
1
14.29%
0 0 0
KUSHINAGAR 5 1.39 3.54 3
60.00%
2
40.00%
0 0 0 0
LALITPUR 15 1.40 7.40 3
20.00%
6
40.00%
6
40.00%
0 0 0
LUCKNOW 15 1.00 42.80 5
33.33%
1
6.67%
0 7
46.67 %
1
6.67%
1
6.67%
MAHOBA 9 2.33 9.75 0 1
11.11%
8
88.89%
0 0 0
MAHRAJGANJ 6 1.54 3.81 2
33.33%
4
66.67%
0 0 0 0
MAINPURI 5 2.20 7.25 0 2
40.00%
3
60.00%
0 0 0
MATHURA 14 0.94 11.90 3
21.43%
6
42.86%
3
21.43%
2
14.29 %
0 0
MAU 7 0.35 2.60 6
85.71%
1
14.29%
0 0 0 0
MEERUT 10 6.73 22.28 0 0 5
50.00%
3
30.00 %
2
20.00%
0
MIRZAPUR 9 1.42 10.27 3
33.33%
3
33.33%
2
22.22%
1
11.11 %
0 0

56
MORADABAD 7 0.40 18.66 3
42.86%
0 0 4
57.14 %
0 0
MUZAFFARNAGA 5 2.08 17.11 0 2
40.00%
1
20.00%
2
40.00 %
0 0
PILIBHIT 11 1.54 3.99 3
27.27%
8
72.73%
0 0 0 0
PRATAPGARH 25 0.51 12.31 6
24.00%
13
52.00%
5
20.00%
1
4.00 %
0 0
RAE BARELI 27 1.15 15.34 13
48.15%
9
33.33%
3
11.11%
2
7.41 %
0 0
RAMPUR 3 3.84 10.07 0 2
66.67%
0 1
33.33 %
0 0
SAHARANPUR 11 1.94 14.68 1
9.09%
3
27.27%
5
45.45%
2
18.18 %
0 0
SANT KABIR NAGA 4 0.79 2.14 3
75.00%
1
25.00%
0 0 0 0
SANT RAVIDAS NA 4 2.55 4.21 0 4
100.00%
0 0 0 0
SHAHJAHANPUR 1 5.03 5.03 0 0 1
100.00%
0 0 0
SHRAWASTI 11 0.65 4.10 8
72.73%
3
27.27%
0 0 0 0
SIDDHARTHNAGA 10 1.10 5.25 8
80.00%
1
10.00%
1
10.00%
0 0 0
SITAPUR 19 0.33 11.14 5
26.32%
7
36.84%
6
31.58%
1
5.26 %
0 0
SONBHADRA 16 1.44 13.01 4
25.00%
8
50.00%
1
6.25%
3
18.75 %
0 0

57
SULTANPUR 33 0.75 11.68 16
48.48%
9
27.27%
5
15.15%
3
9.09 %
0 0
UNNAO 15 0.56 13.18 6
40.00%
6
40.00%
1
6.67%
2
13.33 %
0 0
VARANASI 5 1.31 8.80 2
40.00%
0 3
60.00%
0 0 0
Total 725 0.06 43.95 248 229 136 89 20 3

58
The district wise status of water level during the month has been shown in table -5
and pictorial view is shown in Plate-VI.
Plate VI
January 2022:
Winter season is the peak season of ground water abstraction for Rabi cultivation.
Consequently, bulk of ground water storage is depleted during this season which is well
reflected in the water level measurement during January 2022.
The depth to water level shows a large variation. The distribution pattern of the
various depth ranges is the same only a general deepening in the water level is seen. The
water logged area showing depth to water level in the range of 0-2 mbgl has been reduced to
15.33%. Water levels in the range of 2–5 and 5-10 mbgl are predominant during this period
as reflected at 46% and 22.26% of monitored wells respectively. The moderate water level
zone remains at 15.08%. The very deep water level occurs in 3.83% wells. Thus there seems
to be a balance between the input and output in these areas.The water level in the range of 0 -
2 mbgl is observed as isolated patches in Bijnour, Moradabad, Bareilly, Bahraich, Balrampur
, Amethi, Banda and Ballia district.

59
The water level in the range of 2 – 5 mbgl is seen in most of the districts except in
western part; being predominantly concentrated along the northern border (Terai region)
eastern and North eastern parts of the state and as scattered patches in central and southern
part of the State. The depth to water level of 5 - 10 m.bgl is observed predominantly in the
central, western, southern and lower eastern parts of U.P from Saharanpur to Sonbhadra
districts.
The water level in range of 10-20 m.bgl is observed all along Yamuna river and parts
of western U.P. This range is observed as patches in Agra, Etawah, Aurriya, Allahabad,
Baghpat, Chitrakoot, Gautam Buddha Nagar, Ghaziabad, Hamirpur, Jalaun, , Kaushambi,
Lucknow, Meerut, Muzaffar Nagar, St.Ravidas Nagar and Sonbhadra districts.
The water level of 20 mbgl and more is present along Yamuna river in isolated
patches. It is seen mostly in Bagpat, Agra, Etawah, Fatehpur, Hamirpur and Muzaffarnagar
districts. This is due to effluent nature of river Yamuna and also due to higher elevations in
the area. In the central parts of Lucknow, water level of more than 20 mbgl is observed.
In Gandak and Saryu canal commands water level predominately ranges from 2 to 5
mbgl. ShardaSahayak canal command shows predominance of depth to water level between 2
and 10 mbgl while Ram Ganga canal command shows predominance of 5 - 10 mbgl water
level range.
The district wise status of water level during the month has been shown in Table-6
and the same has been depicted in Plate-VII.

60
Table -6
DISTRICT- WISE DEPTH TO WATER LEVEL, U.P.
January, 2022
District No. of Wells
Analysed
Depth to Water Table (mbgl)
No. / Percentage of Wells Showing Depth to Water Table (mbgl) in the Range of
Min Max 0.0 - 2.0 2.0 - 5.0 5.0 - 10.0 10.0 - 20.0 20.0 - 40.0 > 40.0
AGRA 9 0.50 44.13 2 22.22%
0 2 22.22%
1 11.11 %
3 33.33%
1 11.11%
ALIGARH 7 2.00 10.98 1
14.29%
1
14.29%
4
57.14%
1
14.29 %
0 0
ALLAHABAD 32 0.61 15.13 6
18.75%
16
50.00%
9
28.13%
1
3.13 %
0 0
AMBEDKAR NAGA 7 2.20 4.67 0 7
100.00%
0 0 0 0
AURAIYA 7 1.75 19.14 2
28.57%
2
28.57%
2
28.57%
1
14.29 %
0 0
AZAMGARH 19 1.10 5.57 5
26.32%
13
68.42%
1
5.26%
0 0 0
BAGHPAT 2 20.16 23.09 0 0 0 0 2
100.00%
0
BAHRAICH 11 1.32 8.95 3 27.27%
6 54.55%
2 18.18%
0 0 0
BALLIA 21 0.91 8.28 8
38.10%
9
42.86%
4
19.05%
0 0 0
BALRAMPUR 17 0.13 7.60 5
29.41%
10
58.82%
2
11.76%
0 0 0
BANDA 10 2.28 15.02 0 5
50.00%
1
10.00%
4
40.00 %
0 0

61
BARABANKI 17 1.58 10.05 1
5.88%
12
70.59%
3
17.65%
1
5.88 %
0 0
BAREILLY 9 0.80 11.75 1
11.11%
4
44.44%
3
33.33%
1
11.11 %
0 0
BASTI 7 1.83 4.80 1
14.29%
6
85.71%
0 0 0 0
BIJNOR 6 0.20 17.47 2
33.33%
1
16.67%
1
16.67%
2
33.33 %
0 0
BUDAUN 3 16.46 19.48 0 0 0 3
100.00 %
0 0
BULANDSHAHR 3 7.73 12.38 0 0 1
33.33%
2
66.67 %
0 0
CHANDAULI 8 0.60 8.68 2
25.00%
3
37.50%
3
37.50%
0 0 0
CHITRAKOOT 7 2.78 16.90 0 1
14.29%
3
42.86%
3
42.86 %
0 0
DEORIA 9 1.15 4.75 2
22.22%
7
77.78%
0 0 0 0
ETAH 7 2.85 13.72 0 2
28.57%
1
14.29%
4
57.14 %
0 0
ETAWAH 6 4.20 35.76 0 2
33.33%
1
16.67%
1
16.67 %
2
33.33%
0
FAIZABAD 10 1.35 6.18 2
20.00%
5
50.00%
3
30.00%
0 0 0
FARRUKHABAD 2 1.40 15.70 1
50.00%
0 0 1
50.00 %
0 0
FATEHPUR 8 3.50 20.27 0 3
37.50%
1
12.50%
2
25.00 %
2
25.00%
0
FIROZABAD 4 8.57 26.65 0 0 1
25.00%
2
50.00 %
1
25.00%
0

62
GAUTAM BUDDHA 4 2.49 38.90 0 1
25.00%
0 1
25.00 %
2
50.00%
0
GHAZIABAD 7 1.68 20.37 1
14.29%
0 3
42.86%
2
28.57 %
1
14.29%
0
GHAZIPUR 17 0.10 12.58 2
11.76%
12
70.59%
1
5.88%
2
11.76 %
0 0
GONDA 7 1.70 5.60 1
14.29%
5
71.43%
1
14.29%
0 0 0
GORAKHPUR 4 2.27 4.31 0 4
100.00%
0 0 0 0
HAMIRPUR 7 2.87 15.89 0 3
42.86%
2
28.57%
2
28.57 %
0 0
HARDOI 17 1.87 8.97 2
11.76%
10
58.82%
5
29.41%
0 0 0
HATHRAS 4 2.63 10.73 0 3
75.00%
0 1
25.00 %
0 0
JALAUN 27 0.96 30.75 3
11.11%
8
29.63%
11
40.74%
1
3.70 %
4
14.81%
0
JAUNPUR 27 0.63 12.96 6
22.22%
14
51.85%
5
18.52%
2
7.41 %
0 0
JHANSI 16 2.13 9.95 0 6
37.50%
10
62.50%
0 0 0
JYOTIBA PHULE N 7 10.41 19.24 0 0 0 7
100.00 %
0 0
KANNAUJ 4 0.16 24.19 1
25.00%
1
25.00%
0 0 2
50.00%
0
KANPUR DEHAT 7 2.86 19.51 0 4
57.14%
1
14.29%
2
28.57 %
0 0

63
KANPUR NAGAR 13 1.25 40.98 3
23.08%
4
30.77%
4
30.77%
1
7.69 %
0 1
7.69%
KAUSHAMBI 9 3.37 18.14 0 1
11.11%
1
11.11%
7
77.78 %
0 0
KHERI 6 1.46 7.88 2
33.33%
3
50.00%
1
16.67%
0 0 0
KUSHINAGAR 5 1.18 3.59 1
20.00%
4
80.00%
0 0 0 0
LALITPUR 16 1.45 13.40 4
25.00%
5
31.25%
6
37.50%
1
6.25 %
0 0
LUCKNOW 18 2.19 41.37 0 7
38.89%
1
5.56%
8
44.44 %
1
5.56%
1
5.56%
MAHOBA 7 3.34 13.24 0 2
28.57%
3
42.86%
2
28.57 %
0 0
MAHRAJGANJ 6 1.59 3.85 1
16.67%
5
83.33%
0 0 0 0
MAINPURI 5 2.90 7.40 0 1
20.00%
4
80.00%
0 0 0
MATHURA 14 0.99 11.82 5
35.71%
4
28.57%
3
21.43%
2
14.29 %
0 0
MAU 8 1.30 6.13 1
12.50%
6
75.00%
1
12.50%
0 0 0
MEERUT 10 5.65 21.58 0 0 5
50.00%
3
30.00 %
2
20.00%
0
MIRZAPUR 10 2.38 12.54 0 4
40.00%
3
30.00%
3
30.00 %
0 0
MORADABAD 7 0.35 18.75 2
28.57%
1
14.29%
0 4
57.14 %
0 0
MUZAFFARNAGA 10 2.38 17.50 0 2
20.00%
3
30.00%
5
50.00 %
0 0

64
PILIBHIT 11 2.03 4.18 0 11
100.00%
0 0 0 0
PRATAPGARH 24 0.65 12.13 3
12.50%
15
62.50%
5
20.83%
1
4.17 %
0 0
RAE BARELI 23 1.39 9.90 8
34.78%
13
56.52%
2
8.70%
0 0 0
RAMPUR 3 3.92 10.20 0 2
66.67%
0 1
33.33 %
0 0
SAHARANPUR 10 1.69 12.00 1
10.00%
2
20.00%
6
60.00%
1
10.00 %
0 0
SANT KABIR NAGA 4 1.32 3.18 2
50.00%
2
50.00%
0 0 0 0
SANT RAVIDAS NA 4 3.72 7.76 0 3
75.00%
1
25.00%
0 0 0
SHAHJAHANPUR 1 5.17 5.17 0 0 1
100.00%
0 0 0
SHRAWASTI 11 1.31 4.44 4
36.36%
7
63.64%
0 0 0 0
SIDDHARTHNAGA 10 1.35 6.27 2 20.00%
7 70.00%
1 10.00%
0 0 0
SITAPUR 19 1.15 10.59 3
15.79%
11
57.89%
4
21.05%
1
5.26 %
0 0
SONBHADRA 17 2.88 14.16 0 8
47.06%
6
35.29%
3
17.65 %
0 0
SULTANPUR 34 1.34 11.32 7
20.59%
17
50.00%
8
23.53%
2
5.88 %
0 0
UNNAO 25 0.56 13.21 5
20.00%
9
36.00%
8
32.00%
3
12.00 %
0 0
VARANASI 7 1.27 6.51 1
14.29%
3
42.86%
3
42.86%
0 0 0
Total 750 0.10 44.13 115 345 167 98 22 3

65
Plate VII
A summarized status of water level over the state during different seasons of the year
2021 –22 is as follows:
DEPTH RANGE (M) No. and Percentage of wells
May’21 Aug’21 Nov’21 Jan’22
0-2 73 (11.04%) 275(38.30%) 248 (34.20%) 115(15.33%)
2-5 245(37.06%) 182 (25.34%) 229 (31.58%) 345 (46%)
5-10 211(31.92%) 150 (20.89%) 136 (18.75%) 167 (22%)
10-20 104 (15.73%) 86(11.97%) 89(12.27%) 98 (13.06%)
>20 28 (4.12%) 25 (3.47%) 23(3.16%) 25(3.33%)
From the table it is seen that:-
1. There is a large variation in water logged area, water logging being maximum during
August’21, reducing in Nov’21 and in Jan’22.
2. Shallow water level condition (2-5 mbgl) keeps fluctuating in response to the factors such
as rainfall recharge and ground water draft.

66
3. The area having moderate depth to water level between 5-10 is maximum in May’21,
reducing considerably in August’21, November’21 and January’22.
4. The deep water level conditions (above 10 mbgl) are reaches maximum in May 21 and
gradually decreases in August 21, November 21 and January 22.
5. The spatial and temporal distribution of deeper water level zones is more or less constant.
The well-wise Depth to Water level of Ground Water Monitoring Wells of the state for
May’21, Aug’21, Nov’21 & Jan’22 is given in Annexure-I.

67
Chapter 6
WATER LEVEL FLUCTUATIONS
Ground water is a dynamic resource and its storage changes in response to many
factors such as monsoon rainfall, ground water draft for various purposes, hydrogeological
conditions, topography, landuse, cropping pattern, irrigation status – surface and ground water
etc. These changes in storage are reflected in form of water level fluctuations. The periodic
monitoring of water levels gives an insight into these changes through study of spatial and
temporal variations of water level throughout the year. The seasonal, annual and decadal
comparisons of the water level data monitored at stations have been done and is analyzed as
follows.
6.1 Seasonal Fluctuation during 2021 -22
The fluctuation of the water level in a particular year gives a picture of the response to
rainfall and ground water extraction. The water level of May, the pre-monsoon water level, which
is the lowest water level after all the inputs and outputs during one year, has been compared with
that of Post-monsoon water level i.e. November’2021 and January’2022.
May2021 – November 2021
The difference between the pre and post-monsoon water level of the year is the most
important seasonal fluctuation which gives a clear picture of groundwater potential which could
be fruitfully utilized for various uses over the succeeding year. This fluctuation is used to evaluate
the dynamic ground water resource through the change in ground water storage. The depth to
water level data during pre and post monsoon seasons of the year 2021 has been compiled and
computed to estimate the seasonal change in water level. The same has been presented on district
level in Table-7 and depicted in Plate-VIII.

68
Table -7
DISTRICT WISE –SEASONAL WATER LEVEL FLUCTUATION, U.P.
May’ 2021 – November’ 2021
District
Name
No. of
Wells Range of Fluctuation (m) No. of Wells/Percentage Showing Fluctuation Total No. of Wells
Rise Fall Rise Fall
Rise
Fall
Min Max Min Max 0 to 2 2 to 4 >4 0 to 2 2 to 4 >4
AGRA
9
)
0.10
8.82
-
-
6
66.67%
2
22.22 %
1
11.11%
0
0
0
9
0
ALIGARH
5
)
0.28
5.56
0.72
0.72
2
40.00%
1
20.00 %
1
20.00%
1
20.00%
0
0
4
1
ALLAHABA
D
30
)
0.22
10.00
-
-
8
26.67%
9
30.00 %
13
43.33%
0
0
0
30
0
AMBEDKAR
NAGAR
7
)
0.40
2.69
0.07
0.07
4
57.14%
2
28.57 %
0
1
14.29%
0
0
6
1
AURAIYA
6
)
2.64
6.96
-
-
0
4
66.67 %
2
33.33%
0
0
0
6
0
AZAMGARH
11
)
0.41
4.64
-
-
2
18.18%
5
45.45 %
4
36.36%
0
0
0
11
0
BAGHPAT
2
)
2.01
2.01
1.72
1.72
0
1
50.00 %
0
1
50.00%
0
0
1
1
BAHRAICH
10
)
0.53
1.51
0.05
0.05
9
90.00%
0
0
1
10.00%
0
0
9
1

69
District
Name
No. of
Wells Range of Fluctuation (m) No. of Wells/Percentage Showing Fluctuation Total No. of Wells
Rise Fall Rise Fall
Rise
Fall
Min Max Min Max 0 to 2 2 to 4 >4 0 to 2 2 to 4 >4
BALLIA
14
)
0.30
4.82
0.35
0.43
6
42.86%
3
21.43 %
2
14.29%
3
21.43%
0
0
11
3
BALRAMPU
R
16
)
0.15
3.65
0.01
0.43
8
50.00%
2
12.50 %
0
6
37.50%
0
0
10
6
BANDA
10
)
0.47
4.23
0.15
0.37
5
50.00%
2
20.00 %
1
10.00%
2
20.00%
0
0
8
2
BARABANKI
15
)
1.21
5.40
-
-
2
13.33%
11
73.33 %
2
13.33%
0
0
0
15
0
BAREILLY
6
)
0.20
1.09
0.27
1.68
4
66.67%
0
0
2
33.33%
0
0
4
2
BASTI
7
)
0.03
2.33
0.23
0.57
3
42.86%
2
28.57 %
0
2
28.57%
0
0
5
2
BIJNOR
6
)
0.96
4.33
-
-
4
66.67%
1
16.67 %
1
16.67%
0
0
0
6
0
BUDAUN
4
)
0.21
2.25
9.60
9.60
2
50.00%
1
25.00 %
0
0
0
1
25.00%
3
1
BULANDSH
AHR
2
)
0.33
3.08
-
-
1
50.00%
1
50.00 %
0
0
0
0
2
0
CHANDAULI
4
)
1.24
4.82
-
-
2
50.00%
1
25.00 %
1
25.00%
0
0
0
4
0

70
District
Name
No. of
Wells Range of Fluctuation (m) No. of Wells/Percentage Showing Fluctuation Total No. of Wells
Rise Fall Rise Fall
Rise
Fall
Min Max Min Max 0 to 2 2 to 4 >4 0 to 2 2 to 4 >4
CHITRAKOO
T
6
)
0.23
5.84
0.48
3.44
1
16.67%
0
3
50.00%
1
16.67%
1
16.67%
0
4
2
DEORIA
8
)
0.58
2.08
0.13
1.77
4
50.00%
1
12.50 %
0
3
37.50%
0
0
5
3
ETAH
6
)
0.20
1.47
-
-
6
100.00%
0
0
0
0
0
6
0
ETAWAH
4
)
1.16
2.71
0.19
0.20
1
25.00%
1
25.00 %
0
2
50.00%
0
0
2
2
FAIZABAD
11
)
0.91
3.63
-
-
6
54.55%
5
45.45 %
0
0
0
0
11
0
FARRUKHA
BAD
2
)
3.81
3.81
0.07
0.07
0
1
50.00 %
0
1
50.00%
0
0
1
1
FATEHPUR
6
)
0.30
1.72
0.52
9.92
4
66.67%
0
0
1
16.67%
0
1
16.67%
4
2
FIROZABAD
4
)
1.77
2.55
-
-
3
75.00%
1
25.00 %
0
0
0
0
4
0
GAUTAM
BUDDHA
NAGAR
2
)
6.01
6.55
-
-
0
0
2
100.00%
0
0
0
2
0
GHAZIABAD
5
)
0.34
1.29
0.67
0.67
4
80.00%
0
0
1
20.00%
0
0
4
1

71
District
Name
No. of
Wells Range of Fluctuation (m) No. of Wells/Percentage Showing Fluctuation Total No. of Wells
Rise Fall Rise Fall
Rise
Fall
Min Max Min Max 0 to 2 2 to 4 >4 0 to 2 2 to 4 >4
GHAZIPUR
13
)
0.09
5.83
0.43
1.07
5
38.46%
2
15.38 %
3
23.08%
3
23.08%
0
0
10
3
GONDA
7
)
1.47
2.10
0.14
0.14
4
57.14%
2
28.57 %
0
1
14.29%
0
0
6
1
GORAKHPU
R
3
)
0.17
3.05
-
-
2
66.67%
1
33.33 %
0
0
0
0
3
0
HAMIRPUR
5
)
1.70
5.03
3.34
3.34
1
20.00%
2
40.00 %
1
20.00%
0
1
20.00%
0
4
1
HARDOI
16
)
0.21
2.76
0.88
1.00
10
62.50%
4
25.00 %
0
2
12.50%
0
0
14
2
HATHRAS
3
)
2.43
4.50
-
-
0
2
66.67 %
1
33.33%
0
0
0
3
0
JALAUN
21
)
0.54
7.51
1.32
1.63
9
42.86%
8
38.10 %
2
9.52%
2
9.52%
0
0
19
2
JAUNPUR
14
)
0.32
5.77
0.44
0.44
3
21.43%
6
42.86 %
4
28.57%
1
7.14%
0
0
13
1
JHANSI
15
)
0.52
5.51
0.71
0.88
6
40.00%
4
26.67 %
3
20.00%
2
13.33%
0
0
13
2

72
District
Name
No. of
Wells Range of Fluctuation (m) No. of Wells/Percentage Showing Fluctuation Total No. of Wells
Rise Fall Rise Fall
Rise
Fall
Min Max Min Max 0 to 2 2 to 4 >4 0 to 2 2 to 4 >4
JYOTIBA
PHULE
NAGAR
6
)
0.21
1.60
-
-
6
100.00%
0
0
0
0
0
6
0
KANNAUJ
4
)
0.40
1.87
-
-
4
100.00%
0
0
0
0
0
4
0
KANPUR
DEHAT
4
)
1.88
2.80
-
-
1
25.00%
3
75.00 %
0
0
0
0
4
0
KANPUR
NAGAR
12
)
1.14
4.68
1.70
1.70
5
41.67%
4
33.33 %
2
16.67%
1
8.33%
0
0
11
1
KAUSHAMBI
7
)
1.98
5.54
-
-
1
14.29%
3
42.86 %
3
42.86%
0
0
0
7
0
KHERI
7
)
1.26
2.96
-
-
3
42.86%
4
57.14 %
0
0
0
0
7
0
KUSHINAGA
R
4
-
-
0.46
2.94
0
0
0
3
75.00%
1
25.00%
0
0
4
LALITPUR
12
)
0.53
8.74
0.02
0.02
5
41.67%
3
25.00 %
3
25.00%
1
8.33%
0
0
11
1
LUCKNOW
14
)
1.06
5.38
0.98
1.94
6
42.86%
4
28.57 %
2
14.29%
2
14.29%
0
0
12
2

73
District
Name
No. of
Wells Range of Fluctuation (m) No. of Wells/Percentage Showing Fluctuation Total No. of Wells
Rise Fall Rise Fall
Rise
Fall
Min Max Min Max 0 to 2 2 to 4 >4 0 to 2 2 to 4 >4
MAHOBA
7
)
0.08
4.95
2.14
2.14
3
42.86%
1
14.29 %
2
28.57%
0
1
14.29%
0
6
1
MAHRAJGA
NJ
6
)
0.98
0.98
0.77
2.51
1
16.67%
0
0
4
66.67%
1
16.67%
0
1
5
MAINPURI
4
)
2.38
2.93
0.83
0.83
0
3
75.00 %
0
1
25.00%
0
0
3
1
MATHURA
12
)
0.27
4.96
0.16
0.48
4
33.33%
4
33.33 %
2
16.67%
2
16.67%
0
0
10
2
MAU
5
)
0.07
2.72
0.37
0.49
2
40.00%
1
20.00 %
0
2
40.00%
0
0
3
2
MEERUT
10
)
0.55
1.43
0.80
7.01
8
80.00%
0
0
1
10.00%
0
1
10.00%
8
2
MIRZAPUR
3
)
1.72
1.72
0.44
0.77
1
33.33%
0
0
2
66.67%
0
0
1
2
MORADABA
D
7
)
0.25
1.65
0.25
3.96
5
71.43%
0
0
1
14.29%
1
14.29%
0
5
2
MUZAFFAR
NAGAR
5
)
0.31
4.37
0.17
0.99
2
40.00%
0
1
20.00%
2
40.00%
0
0
3
2
PILIBHIT
9
)
0.85
2.86
-
-
7
77.78%
2
22.22 %
0
0
0
0
9
0

74
District
Name
No. of
Wells Range of Fluctuation (m) No. of Wells/Percentage Showing Fluctuation Total No. of Wells
Rise Fall Rise Fall
Rise
Fall
Min Max Min Max 0 to 2 2 to 4 >4 0 to 2 2 to 4 >4
PRATAPGAR
H
23
)
1.54
6.36
-
-
1
4.35%
14
60.87 %
8
34.78%
0
0
0
23
0
RAE BARELI
25
)
0.24
4.57
4.89
4.89
7
28.00%
16
64.00 %
1
4.00%
0
0
1
4.00%
24
1
RAMPUR
2
)
0.71
1.78
-
-
2
100.00%
0
0
0
0
0
2
0
SAHARANP
UR
8
)
0.82
3.55
-
-
3
37.50%
5
62.50 %
0
0
0
0
8
0
SANT KABIR
NAGAR
4
)
0.80
2.31
-
-
3
75.00%
1
25.00 %
0
0
0
0
4
0
SANT
RAVIDAS
NAGAR
4
)
0.95
4.67
-
-
1
25.00%
2
50.00 %
1
25.00%
0
0
0
4
0
SHRAWASTI
11
)
0.20
2.29
0.20
0.66
6
54.55%
2
18.18 %
0
3
27.27%
0
0
8
3
SIDDHARTH
NAGAR
10
)
0.02
1.82
0.20
0.67
6
60.00%
0
0
4
40.00%
0
0
6
4
SITAPUR
18
)
0.28
2.80
0.05
0.05
11
61.11%
6
33.33 %
0
1
5.56%
0
0
17
1

75
District
Name
No. of
Wells Range of Fluctuation (m) No. of Wells/Percentage Showing Fluctuation Total No. of Wells
Rise Fall Rise Fall
Rise
Fall
Min Max Min Max 0 to 2 2 to 4 >4 0 to 2 2 to 4 >4
SONBHADR
A
8
)
0.12
3.88
-
-
4
50.00%
4
50.00 %
0
0
0
0
8
0
SULTANPUR
31
)
0.55
4.10
0.58
3.37
10
32.26%
16
51.61 %
1
3.23%
2
6.45%
2
6.45%
0
27
4
UNNAO
11
)
1.11
2.45
0.28
0.28
6
54.55%
4
36.36 %
0
1
9.09%
0
0
10
1
VARANASI
5
)
0.47
5.31
-
-
1
20.00%
3
60.00 %
1
20.00%
0
0
0
5
0
Total 613 6.01 0.98 262 193 74 72 8 4 529 84

76
Plate-VIII
The district wise data indicate a rise in water level in almost 86.29% of the wells
indicating monsoon recharge to ground water. There is a general rise in water levels from 0 to
2 m as noticed at 262 (42.73%) wells. This rise is seen in almost all the districts of the state
except north Central part of the state. The rise in water levels in the range of 2 - 4 m is
observed in 193 wells (31.48%). This range is observed mostly in eastern and parts of central
and southern U.P. But their spatial extent is limited to patches and are confined in Jalaun,
Hamirpur, Banda, Chitrakoot of Bundelkhand region and Faizabad,Basti, S.Kabir Nagar,
Kushi Nagar and Pratapgarh districts of Poorvanchal. The rise of more than 4 m is observed
in 74 wells (12%), covering few parts of hard rock areas of Lalitpur, Chitrakoot, Kaushambi,
Hamirpur, Jalaun, Jhansi, Kaushambi and Pratapgarh districts.
May 2021 – January 2022:
By January the rainfall infiltration starts dissipating and ground water extraction which had
come down during the monsoon also starts building up. But the rise in water level continues
though at a lower scale. The water level data during pre-monsoon period i.e. May’21 and that

77
of January’2022 have been analyzed to estimate the change in water levels. The same has
been presented on district level in table-8 and depicted in Plate-IX.
Plate - IX
There is a rise of water level in 486 no. of analyzed wells (78.13%) and a fall in 133
no. (21.38%) of analyzed wells. The rise in water levels in the range of 0–2 m is seen in
48.55% wells covering almost all the districts of the state. Rise of 2 – 4 m is observed in
22.5% wells spread throughout the state. Rise of more than 4 m is observed in 44 analyzed
wells (7.0%). About 19.4% of analyzed wells (121) show fall of 0-2min patches, in few
districts and 0.96% of wells (6 no.) show fall of 2-4m and 6 wells show fall of >4m.
The overall picture of change of ground water storage over the entire state during
2021 -22 which emerged from the analysis of pre and post monsoon water level observation
and water level fluctuation during May’21 and January’22 has been summarized as follows.
Fluctuation Change of Groundwater Storage in U.P. (2021-22)
Magnitude of
Change (m)
May’21 – Nov’21 May’21 – Jan’22
Rise (%) Fall (%) Rise (%) Fall (%)
0-2 262
(42.73%)
72
(11.74%)
302
(48.55%)
121
(19.4%)

78
Magnitude of
Change (m)
May’21 – Nov’21 May’21 – Jan’22
Rise (%) Fall (%) Rise (%) Fall (%)
2-4 193
(31.48%)
8
(1.30%)
140
(22.5%)
6
(0.96%)
>4 74
(12%)
4
(0.65%)
44
(7.0%)
6
(0.96)%
It is evident from analyses that ground water has been recharged in most parts of the
state and the quantum of recharge is reflected through a rise in water level to a tune of 0-4 m.
Number of wells showing rise of 0-2 m in water level from May’2021 to November’2021 and
it has further increases while comparing with May’2021 to January’2022 from 42.73% to
48.55% respectively. The rise of water level in the range of 2-4 m has been decrease from
31.48 % to 22.5% while compared with May 2021 –November 2021 to May 2021 to January
2022 respectively and number of wells showing rise of water level of more than 4 m has also
been reduced from 12% to 7%.

79
Table- 8
DISTRICT WISE – SEASONAL WATER LEVEL FLUCTUATION, U.P.
May’ 2021 – January’ 2022
District
Name
No. of
Wells Range of Fluctuation (m) No. of Wells/Percentage Showing Fluctuation Total No. of Wells
Rise Fall Rise Fall
Rise
Fall
Min Max Min Max 0 to 2 2 to 4 >4 0 to 2 2 to 4 >4
AGRA
9
)
0.03
6.87
-
-
5
55.56%
1
11.11 %
2
22.22%
0
0
0
8
0
ALIGARH
4
)
0.20
5.97
1.37
1.37
2
50.00%
0
1
25.00%
1
25.00%
0
0
3
1
ALLAHABA
D
29
)
0.15
7.04
0.30
0.30
9
31.03%
12
41.38 %
7
24.14%
1
3.45%
0
0
28
1
AMBEDKAR
NAGAR
7
)
0.82
1.15
0.70
1.07
3
42.86%
0
0
4
57.14%
0
0
3
4
AURAIYA
6
)
2.06
4.87
-
-
0
5
83.33 %
1
16.67%
0
0
0
6
0
AZAMGARH
13
)
0.09
3.70
0.25
0.64
4
30.77%
6
46.15 %
0
3
23.08%
0
0
10
3
BAGHPAT
2
)
5.74
7.64
-
-
0
0
2
100.00%
0
0
0
2
0
BAHRAICH
10
)
0.33
1.17
-
-
10
100.00%
0
0
0
0
0
10
0
BALLIA
18
)
0.04
2.61
0.05
1.51
9
50.00%
2
11.11 %
0
7
38.89%
0
0
11
7

80
BALRAMPU
R
16
)
0.02
3.10
0.03
1.26
3
18.75%
2
12.50 %
0
11
68.75%
0
0
5
11
BANDA
8
)
0.88
3.03
0.92
6.87
3
37.50%
1
12.50 %
0
2
25.00%
1
12.50%
1
12.50%
4
4
BARABANKI
15
)
0.81
2.93
-
-
9
60.00%
6
40.00 %
0
0
0
0
15
0
BAREILLY
7
)
0.52
1.14
1.62
1.62
5
71.43%
0
0
1
14.29%
0
0
5
1
BASTI
7
)
0.98
1.37
0.15
1.10
2
28.57%
0
0
5
71.43%
0
0
2
5
BIJNOR
6
)
0.71
4.13
-
-
3
50.00%
2
33.33 %
1
16.67%
0
0
0
6
0
BUDAUN
3
)
0.41
2.56
9.22
9.22
1
33.33%
1
33.33 %
0
0
0
1
33.33%
2
1
BULANDSH
AHR
3
)
0.46
2.68
6.56
6.56
1
33.33%
1
33.33 %
0
0
0
1
33.33%
2
1
CHANDAULI
4
)
0.48
1.80
0.58
0.58
3
75.00%
0
0
1
25.00%
0
0
3
1
CHITRAKOO
T
6
)
2.30
4.02
0.33
5.60
0
3
50.00 %
1
16.67%
1
16.67%
0
1
16.67%
4
2
DEORIA
8
)
0.04
0.57
0.79
1.32
4
50.00%
0
0
4
50.00%
0
0
4
4
ETAH
5
)
0.64
1.25
-
-
4
80.00%
0
0
0
0
0
4
0

81
ETAWAH
4
)
1.84
2.04
0.15
0.27
1
25.00%
1
25.00 %
0
2
50.00%
0
0
2
2
FAIZABAD
10
)
0.30
2.37
0.18
0.18
8
80.00%
1
10.00 %
0
1
10.00%
0
0
9
1
FARRUKHA BAD
2
)
0.28
3.71
-
-
1
50.00%
1
50.00 %
0
0
0
0
2
0
FATEHPUR
3
)
0.57
0.57
0.97
1.12
1
33.33%
0
0
2
66.67%
0
0
1
2
FIROZABAD
4
)
1.42
2.29
-
-
1
25.00%
3
75.00 %
0
0
0
0
4
0
GAUTAM
BUDDHA
NAGAR
2
)
6.45
7.50
-
-
0
0
2
100.00%
0
0
0
2
0
GHAZIABAD
6
)
0.20
1.99
-
-
6
100.00%
0
0
0
0
0
6
0
GHAZIPUR
15
)
0.25
5.03
0.48
1.59
3
20.00%
2
13.33 %
1
6.67%
9
60.00%
0
0
6
9
GONDA
7
)
0.49
1.65
0.60
0.60
6
85.71%
0
0
1
14.29%
0
0
6
1
GORAKHPU R
3
)
0.31
1.05
-
-
3
100.00%
0
0
0
0
0
3
0
HAMIRPUR
5
)
3.78
5.03
0.28
4.33
0
1
20.00 %
1
20.00%
2
40.00%
0
1
20.00%
2
3
HARDOI
17
)
0.17
3.06
0.22
0.30
13
76.47%
2
11.76 %
0
2
11.76%
0
0
15
2

82
HATHRAS
3
)
1.60
4.59
-
-
1
33.33%
1
33.33 %
1
33.33%
0
0
0
3
0
JALAUN
21
)
0.83
6.36
0.06
1.72
9
42.86%
5
23.81 %
2
9.52%
5
23.81%
0
0
16
5
JAUNPUR
15
)
0.01
4.51
0.38
0.38
4
26.67%
8
53.33 %
2
13.33%
1
6.67%
0
0
14
1
JHANSI
15
)
0.55
4.41
0.33
0.58
4
26.67%
7
46.67 %
2
13.33%
2
13.33%
0
0
13
2
JYOTIBA
PHULE
NAGAR
6
)
0.50
1.97
-
-
6
100.00%
0
0
0
0
0
6
0
KANNAUJ
4
)
0.51
1.58
-
-
4
100.00%
0
0
0
0
0
4
0
KANPUR
DEHAT
4
)
1.15
1.94
-
-
4
100.00%
0
0
0
0
0
4
0
KANPUR
NAGAR
12
)
1.02
4.41
1.43
1.43
4
33.33%
5
41.67 %
2
16.67%
1
8.33%
0
0
11
1
KAUSHAMBI
7
)
0.87
4.40
-
-
3
42.86%
2
28.57 %
2
28.57%
0
0
0
7
0
KHERI
6
)
0.85
1.95
-
-
6
100.00%
0
0
0
0
0
6
0
KUSHINAGA R
4
-
-
0.58
1.26
0
0
0
4
100.0 %
0
0
0
4
LALITPUR
13
)
0.13
5.31
0.92
0.92
8
61.54%
2
15.38 %
2
15.38%
1
7.69%
0
0
12
1

83
LUCKNOW
16
)
0.45
4.33
0.13
1.24
9
56.25%
3
18.75 %
2
12.50%
2
12.50%
0
0
14
2
MAHOBA
6
)
0.50
3.41
0.67
2.13
3
50.00%
1
16.67 %
0
1
16.67%
1
16.67%
0
4
2
MAHRAJGA NJ
6
-
-
0.04
2.41
0
0
0
4
66.67%
2
33.33%
0
0
6
MAINPURI
4
)
1.85
2.02
0.98
0.98
1
25.00%
2
50.00 %
0
1
25.00%
0
0
3
1
MATHURA
12
)
0.32
5.80
0.40
0.40
6
50.00%
3
25.00 %
2
16.67%
1
8.33%
0
0
11
1
MAU
6
)
1.72
1.72
0.19
2.05
1
16.67%
0
0
4
66.67%
1
16.67%
0
1
5
MEERUT
10
)
0.38
2.77
8.58
8.58
8
80.00%
1
10.00 %
0
0
0
1
10.00%
9
1
MIRZAPUR
4
)
4.09
4.09
1.36
1.97
0
0
1
25.00%
3
75.00%
0
0
1
3
MORADABA D
7
)
0.35
1.39
0.34
0.34
6
85.71%
0
0
1
14.29%
0
0
6
1
MUZAFFAR
NAGAR
8
)
0.77
7.20
0.23
0.23
3
37.50%
1
12.50 %
3
37.50%
1
12.50%
0
0
7
1
PILIBHIT
9
)
0.58
2.30
-
-
8
88.89%
1
11.11 %
0
0
0
0
9
0
PRATAPGAR H
23
)
1.40
5.09
-
-
1
4.35%
19
82.61 %
3
13.04%
0
0
0
23
0

84
RAE BARELI
23
)
0.23
3.93
0.52
0.52
12
52.17%
10
43.48 %
0
1
4.35%
0
0
22
1
RAMPUR
2
)
0.58
1.70
-
-
2
100.00%
0
0
0
0
0
2
0
SAHARANP UR
8
)
1.93
2.53
0.11
0.11
3
37.50%
4
50.00 %
0
1
12.50%
0
0
7
1
SANT KABIR
NAGAR
4
)
0.22
1.78
0.24
0.24
3
75.00%
0
0
1
25.00%
0
0
3
1
SANT
RAVIDAS
NAGAR
4
)
1.06
2.56
0.22
0.22
2
50.00%
1
25.00 %
0
1
25.00%
0
0
3
1
SHRAWASTI
11
)
0.34
1.59
0.11
1.58
4
36.36%
0
0
7
63.64%
0
0
4
7
SIDDHARTH
NAGAR
10
)
0.57
0.57
0.15
1.75
1
10.00%
0
0
9
90.00%
0
0
1
9
SITAPUR
17
)
0.28
2.40
0.13
0.13
15
88.24%
1
5.88 %
0
1
5.88%
0
0
16
1
SONBHADR A
8
)
0.10
1.77
0.03
0.50
6
75.00%
0
0
2
25.00%
0
0
6
2
SULTANPUR
32
)
0.15
3.18
0.05
3.65
20
62.50%
8
25.00 %
0
3
9.38%
1
3.13%
0
28
4
UNNAO
13
)
0.48
2.36
0.15
0.28
9
69.23%
2
15.38 %
0
2
15.38%
0
0
11
2
VARANASI
5
)
0.51
4.55
0.68
0.68
3
60.00%
0
1
20.00%
1
20.00%
0
0
4
1
Total 622 6.45 0.57 0.00 9.22 302 140 44 121 6 6 486 133

85
6.2 Annual Fluctuation
Whereas the seasonal fluctuation in the water level occurs due to rainfall and
irrigation as the two main factors during different periods of the year it is the annual
fluctuation which gives the net result of one whole cycle of recharge and discharge that has
taken place during one year. An annual decline indicates that ground water extraction has
been in excess of the rainfall recharge in broad terms.
To evaluate the annual change in groundwater levels during 2021-22 as a resultant of
different variables and to develop a strategy for future development, the water level of
different seasons over the state was compared to that of the same season in the previous year.
The outcome is discussed subsequently in brief.
May 2020 –21:
The water level data collected during May'2021 has been compared with May'2020
data to evaluate the rise and fall in water levels since last one year. The wells have been
categorized depending on rise and fall in water levels.
Due to covid -19 pandemic, only 189 well have been monitored in 23 districts. It is
found that 54 no. (28.57%) monitoring wells show rise and 89 no. (47.08%) show fall in
water level in range of 0 – 2m. Out of the total monitoring well, 35.97% and 64.02% shows
rise and fall in the water level respectively.
The district wise changes have been shown in Table-9 and the same is depicted in Plate-X.
Plate – X
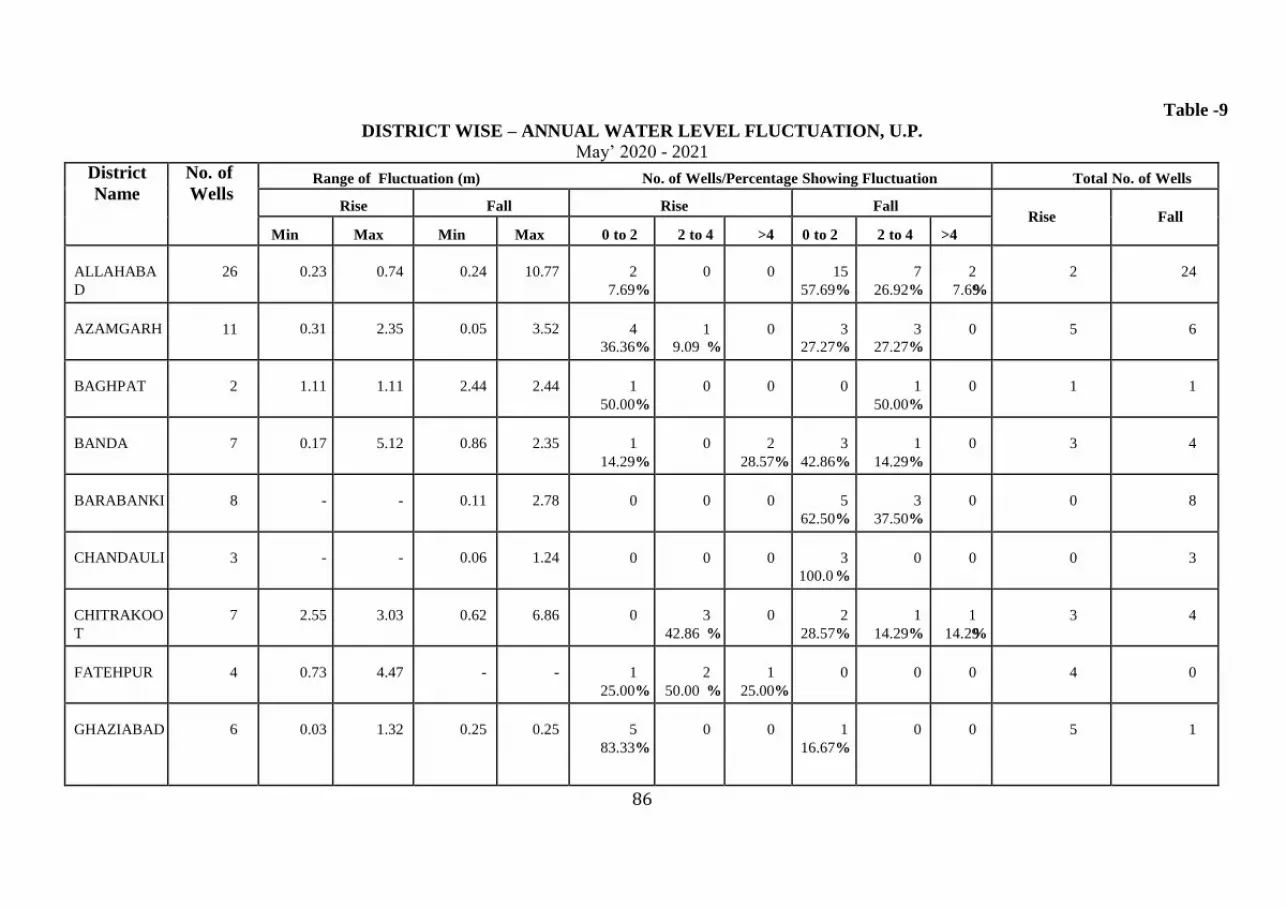
86
Table -9
DISTRICT WISE – ANNUAL WATER LEVEL FLUCTUATION, U.P.
May’ 2020 - 2021
District
Name
No. of
Wells Range of Fluctuation (m) No. of Wells/Percentage Showing Fluctuation Total No. of Wells
Rise Fall Rise Fall
Rise
Fall
Min Max Min Max 0 to 2 2 to 4 >4 0 to 2 2 to 4 >4
ALLAHABA
D
26
)
0.23
0.74
0.24
10.77
2
7.69%
0
0
15
57.69%
7
26.92%
2
7.69%
2
24
AZAMGARH
11
)
0.31
2.35
0.05
3.52
4
36.36%
1
9.09 %
0
3
27.27%
3
27.27%
0
5
6
BAGHPAT
2
)
1.11
1.11
2.44
2.44
1
50.00%
0
0
0
1
50.00%
0
1
1
BANDA
7
)
0.17
5.12
0.86
2.35
1
14.29%
0
2
28.57%
3
42.86%
1
14.29%
0
3
4
BARABANKI
8
-
-
0.11
2.78
0
0
0
5
62.50%
3
37.50%
0
0
8
CHANDAULI
3
-
-
0.06
1.24
0
0
0
3
100.0 %
0
0
0
3
CHITRAKOO
T
7
)
2.55
3.03
0.62
6.86
0
3
42.86 %
0
2
28.57%
1
14.29%
1
14.29%
3
4
FATEHPUR
4
)
0.73
4.47
-
-
1
25.00%
2
50.00 %
1
25.00%
0
0
0
4
0
GHAZIABAD
6
)
0.03
1.32
0.25
0.25
5
83.33%
0
0
1
16.67%
0
0
5
1

87
GHAZIPUR
14
)
0.14
4.70
0.20
6.88
7
50.00%
0
2
14.29%
3
21.43%
1
7.14%
1
7.14%
9
5
HAMIRPUR
3
-
-
1.71
2.77
0
0
0
2
66.67%
1
33.33%
0
0
3
LUCKNOW
7
)
0.92
0.92
0.17
2.07
1
14.29%
0
0
5
71.43%
1
14.29%
0
1
6
MAHOBA
9
)
0.20
4.22
0.14
3.86
3
33.33%
0
1
11.11%
2
22.22%
3
33.33%
0
4
5
MAU
4
)
0.09
0.09
0.05
3.77
1
25.00%
0
0
2
50.00%
1
25.00%
0
1
3
MEERUT
9
)
0.22
9.41
0.10
0.65
4
44.44%
0
1
11.11%
4
44.44%
0
0
5
4
MIRZAPUR
3
)
0.52
1.38
1.66
1.66
2
66.67%
0
0
1
33.33%
0
0
2
1
MUZAFFAR
NAGAR
7
)
0.16
0.20
0.39
2.16
2
28.57%
0
0
4
57.14%
1
14.29%
0
2
5
PRATAPGAR
H
18
)
0.19
1.25
0.15
1.82
4
22.22%
0
0
14
77.78%
0
0
4
14
SAHARANP
UR
8
)
0.22
0.82
0.40
0.85
4
50.00%
0
0
4
50.00%
0
0
4
4
SANT
RAVIDAS
NAGAR
3
)
1.12
1.12
0.12
2.44
1
33.33%
0
0
1
33.33%
1
33.33%
0
1
2

88
SITAPUR
19
)
0.03
0.55
0.05
0.74
8
42.11%
0
0
11
57.89%
0
0
8
11
SONBHADR
A
8
)
0.58
13.13
0.78
2.15
1
12.50%
0
1
12.50%
4
50.00%
2
25.00%
0
2
6
VARANASI
3
)
0.13
0.28
5.55
5.55
2
66.67%
0
0
0
0
1
33.33%
2
1
Total 189 2.55 0.09 0.00 10.77 54 6 8 89 27 5 68 121

89
August 2020-21:
The water level data collected during August'2020 has been compared with Aug'2021
data to evaluate the rise and fall in water levels since last one year. The wells have been
categorized depending on rise and fall in water levels.
There is rise of water level in 198 wells (48.41%) and fall in 211 wells (51.58%). The
fall in water level is due to scanty monsoonal rainfall in some of the area. A rise of 0 -2 m is
observed at 166 monitoring stations (40.58% of the monitored wells) scattered in the
patches. A rise of 2-4 m is seen in 23 wells (5.62%) and rise of more than 4 m is seen in
only 9 wells (2.20%), mainly concentrated in Shamli, Hamirpur, Mahoba, Chitrakoot,
Shrawasti and Sonbhadra districts of the State.
The fall of 0 -2 water levels is observed in 177 wells (43.27%) of the monitored wells
covering some patches in the western, southern and central districts of U.P. A fall of 2 - 4m
is observed in 31 wells (7.57%) found in Sitapur, Kannauj, Hamirpur, Fatehpur, Raebareli
and Mau.
The district wise changes have been shown in Table-10 and the same is depicted in Plate-XI.
Plate-XI

90
Table-10
DISTRICTWISE– ANNUAL WATER LEVEL FLUCTUATION, U.P
August’ 2020 -2021
District
Name
No. of
Wells Range of Fluctuation (m) No. of Wells/Percentage Showing Fluctuation Total No. of Wells
Rise Fall Rise Fall
Rise
Fall
Min Max Min Max 0 to 2 2 to 4 >4 0 to 2 2 to 4 >4
ALLAHABA D
26
)
0.14
4.86
0.06
3.07
9
34.62%
4
15.38 %
1
3.85%
11
42.31%
1
3.85%
0
14
12
AMBEDKAR
NAGAR
7
)
0.40
1.84
0.13
0.27
5
71.43%
0
0
2
28.57%
0
0
5
2
AURAIYA
7
)
0.37
0.61
0.02
1.71
3
42.86%
0
0
4
57.14%
0
0
3
4
AZAMGARH
13
)
0.20
4.10
0.01
4.74
2
15.38%
0
1
7.69%
7
53.85%
2
15.38%
1
7.69%
3
10
BAGHPAT
2
)
1.78
3.69
-
-
1
50.00%
1
50.00 %
0
0
0
0
2
0
BAHRAICH
10
)
0.25
1.10
0.17
0.35
7
70.00%
0
0
3
30.00%
0
0
7
3
BALLIA
13
)
0.06
2.90
0.02
1.98
4
30.77%
2
15.38 %
0
7
53.85%
0
0
6
7
BALRAMPU R
13
)
0.40
2.50
0.02
0.23
9
69.23%
2
15.38 %
0
2
15.38%
0
0
11
2
BANDA
12
)
0.16
6.13
0.05
1.46
2
16.67%
1
8.33 %
2
16.67%
7
58.33%
0
0
5
7

91
BARABANKI
17
)
0.20
1.64
0.01
3.89
8
47.06%
0
0
7
41.18%
2
11.76%
0
8
9
BASTI
7
)
0.15
1.70
0.07
0.30
5
71.43%
0
0
2
28.57%
0
0
5
2
CHITRAKOO
T
9
)
0.04
0.89
0.48
2.34
6
66.67%
0
0
2
22.22%
1
11.11%
0
6
3
FAIZABAD
11
)
0.20
3.20
-
-
10
90.91%
1
9.09 %
0
0
0
0
11
0
FATEHPUR
11
)
1.22
2.06
0.21
5.40
1
9.09%
1
9.09 %
0
6
54.55%
2
18.18%
1
9.09%
2
9
GHAZIABAD
6
)
0.18
0.30
0.31
0.83
3
50.00%
0
0
3
50.00%
0
0
3
3
GHAZIPUR
9
)
0.40
2.64
0.10
3.00
3
33.33%
1
11.11 %
0
4
44.44%
1
11.11%
0
4
5
GONDA
6
)
0.35
1.55
-
-
6
100.00%
0
0
0
0
0
6
0
HAMIRPUR
6
)
0.24
4.44
0.04
3.53
2
33.33%
0
1
16.67%
2
33.33%
1
16.67%
0
3
3
HARDOI
15
)
0.02
0.06
0.50
2.60
2
13.33%
0
0
11
73.33%
2
13.33%
0
2
13
KANNAUJ
4
-
-
0.06
2.66
0
0
0
3
75.00%
1
25.00%
0
0
4
KANPUR
DEHAT
7
)
0.48
2.16
0.28
1.49
4
57.14%
1
14.29 %
0
2
28.57%
0
0
5
2

92
KANPUR
NAGAR
12
)
0.06
1.25
0.03
2.75
3
25.00%
0
0
6
50.00%
3
25.00%
0
3
9
KHERI
6
)
0.26
0.71
0.22
1.49
3
50.00%
0
0
3
50.00%
0
0
3
3
LUCKNOW
15
)
1.45
1.45
0.12
2.80
1
6.67%
0
0
12
80.00%
2
13.33%
0
1
14
MAHOBA
8
)
0.10
5.64
0.40
1.67
3
37.50%
0
1
12.50%
4
50.00%
0
0
4
4
MAU
4
)
0.25
0.25
0.06
3.40
1
25.00%
0
0
1
25.00%
2
50.00%
0
1
3
MEERUT
8
)
0.30
1.17
0.09
0.53
5
62.50%
0
0
3
37.50%
0
0
5
3
MUZAFFAR
NAGAR
7
)
0.44
6.49
0.09
0.70
2
28.57%
1
14.29 %
1
14.29%
3
42.86%
0
0
4
3
RAE BARELI
24
)
0.20
0.20
0.12
3.15
2
8.33%
0
0
17
70.83%
5
20.83%
0
2
22
SAHARANP
UR
10
)
0.04
2.67
0.21
2.28
4
40.00%
2
20.00 %
0
3
30.00%
1
10.00%
0
6
4
SANT
RAVIDAS
NAGAR
4
)
2.06
4.83
1.06
1.87
0
1
25.00 %
1
25.00%
2
50.00%
0
0
2
2
SHRAWASTI
8
)
0.15
3.15
-
-
7
87.50%
1
12.50 %
0
0
0
0
8
0

93
SIDDHARTH
NAGAR
10
)
0.22
3.89
0.01
0.01
8
80.00%
1
10.00 %
0
1
10.00%
0
0
9
1
SITAPUR
19
)
0.15
0.50
0.15
3.46
6
31.58%
0
0
12
63.16%
1
5.26%
0
6
13
SONBHADR
A
14
)
0.02
8.48
0.10
3.47
4
28.57%
1
7.14 %
1
7.14%
6
42.86%
2
14.29%
0
6
8
SULTANPUR
35
)
0.05
3.00
0.03
4.40
20
57.14%
1
2.86 %
0
12
34.29%
1
2.86%
1
2.86%
21
14
UNNAO
9
)
0.03
0.30
0.17
1.28
4
44.44%
0
0
5
55.56%
0
0
4
5
VARANASI
5
)
1.20
3.48
1.22
2.94
1
20.00%
1
20.00 %
0
2
40.00%
1
20.00%
0
2
3
Total 409 2.06 0.06 0.00 5.40 166 23 9 177 31 3 198 211

94
November 2020 – 21:
The water level data collected during November'2020 has been compared with
November'2021 data to evaluate the rise and fall in water levels since last one year. It is
observed that 542 wells (82.87%) show rise and 110 wells (16.81%) show fall in water level.
The 82.87% rise in water level is mainly because the area has received very good amount of
monsoonal rainfall.
A rise of 0 -2m, water levels, is observed at 432 wells (66.05%) covering all parts of
UP except Sambhal ,Firozabad and some parts of Amroha, Hapur, Bulandshahar, Rampur,
Ghaziabad districts. Rise of 2 - 4 m is observed in 88 wells (13.45%) and rise of more than
4m is observed only at 22 wells covering in very small patches.
The fall of 0-2m water levels is observed in 94 wells (14.37%) mostly in
districts of Sambhal, Amroha, Bulandshahar, Hapur, Firozabad Hardoi, Jalaun , Jhansi,
Banda and Chitrakoot. A fall of 2 - 4m is observed in 10wells (1.95%) and fall in water level
> 4 m is found in 6 wells (0.45%) mainly in Sambhal and Jhansi District.
The district wise changes have been shown in Table-11 and the same is depicted in
Plate-XII.
Plate-XII.

95
Table – 11
DISTRICTWISE– ANNUAL WATER LEVEL FLUCTUATION, U.P
November’ 2020– 2021
District
Name
No. of
Wells Range of Fluctuation (m) No. of Wells/Percentage Showing Fluctuation Total No. of Wells
Rise Fall Rise Fall
Rise
Fall
Min Max Min Max 0 to 2 2 to 4 >4 0 to 2 2 to 4 >4
AGRA
9
)
0.12
9.24
0.30
4.14
4
44.44%
1
11.11 %
1
11.11%
2
22.22%
0
1
11.11%
6
3
ALIGARH
7
)
0.25
1.14
0.19
0.25
5
71.43%
0
0
2
28.57%
0
0
5
2
ALLAHABA
D
31
)
0.03
8.43
0.07
0.64
23
74.19%
4
12.90 %
2
6.45%
2
6.45%
0
0
29
2
AMBEDKAR
NAGAR
7
)
1.16
2.54
-
-
6
85.71%
1
14.29 %
0
0
0
0
7
0
AURAIYA
7
)
0.32
4.27
-
-
3
42.86%
3
42.86 %
1
14.29%
0
0
0
7
0
AZAMGARH
15
)
0.17
4.23
-
-
9
60.00%
5
33.33 %
1
6.67%
0
0
0
15
0
BAGHPAT
2
)
3.09
3.09
2.98
2.98
0
1
50.00 %
0
0
1
50.00%
0
1
1
BAHRAICH
11
)
0.05
0.97
0.12
0.44
9
81.82%
0
0
2
18.18%
0
0
9
2
BALLIA
14
)
0.23
3.38
0.08
0.79
9
64.29%
1
7.14 %
0
3
21.43%
0
0
10
3

96
BALRAMPU
R
17
)
0.10
1.95
-
-
16
94.12%
0
0
0
0
0
16
0
BANDA
12
)
0.11
4.55
0.04
1.23
2
16.67%
2
16.67 %
1
8.33%
7
58.33%
0
0
5
7
BARABANKI
18
)
0.42
2.51
0.30
0.30
15
83.33%
2
11.11 %
0
1
5.56%
0
0
17
1
BAREILLY
8
)
0.12
6.90
0.12
2.11
4
50.00%
1
12.50 %
1
12.50%
1
12.50%
1
12.50%
0
6
2
BASTI
7
)
0.23
1.68
0.06
0.06
6
85.71%
0
0
1
14.29%
0
0
6
1
BIJNOR
6
)
0.20
1.45
0.10
0.25
4
66.67%
0
0
2
33.33%
0
0
4
2
BUDAUN
3
)
0.23
2.11
10.34
10.34
1
33.33%
1
33.33 %
0
0
0
1
33.33%
2
1
BULANDSH
AHR
2
-
-
0.30
0.31
0
0
0
2
100.0 %
0
0
0
2
CHANDAULI
6
)
0.12
2.57
-
-
5
83.33%
1
16.67 %
0
0
0
0
6
0
CHITRAKOO
T
8
)
0.18
2.18
0.56
2.38
4
50.00%
2
25.00 %
0
1
12.50%
1
12.50%
0
6
2
DEORIA
9
)
0.33
1.18
0.09
1.07
7
77.78%
0
0
2
22.22%
0
0
7
2
ETAH
7
)
0.43
0.93
0.04
0.32
5
71.43%
0
0
2
28.57%
0
0
5
2

97
FAIZABAD
11
)
0.97
4.23
-
-
9
81.82%
1
9.09 %
1
9.09%
0
0
0
11
0
FARRUKHA
BAD
2
)
1.89
1.89
0.06
0.06
1
50.00%
0
0
1
50.00%
0
0
1
1
FATEHPUR
10
)
0.12
12.96
0.61
4.48
4
40.00%
3
30.00 %
1
10.00%
1
10.00%
0
1
10.00%
8
2
FIROZABAD
4
-
-
0.05
3.54
0
0
0
3
75.00%
1
25.00%
0
0
4
GHAZIABAD
5
)
0.30
1.52
0.93
0.93
4
80.00%
0
0
1
20.00%
0
0
4
1
GHAZIPUR
12
)
0.65
4.90
0.25
3.39
3
25.00%
3
25.00 %
1
8.33%
4
33.33%
1
8.33%
0
7
5
GONDA
6
)
0.33
1.36
-
-
6
100.00%
0
0
0
0
0
6
0
GORAKHPU
R
4
)
0.17
1.55
0.12
0.12
3
75.00%
0
0
1
25.00%
0
0
3
1
HAMIRPUR
6
)
0.65
2.42
0.90
1.00
2
33.33%
2
33.33 %
0
2
33.33%
0
0
4
2
HARDOI
15
)
0.06
1.11
0.02
1.21
10
66.67%
0
0
5
33.33%
0
0
10
5
HATHRAS
3
)
0.52
2.03
-
-
2
66.67%
1
33.33 %
0
0
0
0
3
0
JALAUN
25
)
0.25
5.40
0.35
4.15
14
56.00%
4
16.00 %
2
8.00%
3
12.00%
1
4.00%
1
4.00%
20
5

98
JAUNPUR
16
)
0.12
7.58
1.10
1.10
12
75.00%
2
12.50 %
1
6.25%
1
6.25%
0
0
15
1
JHANSI
14
)
0.55
2.85
1.30
5.10
7
50.00%
4
28.57 %
0
1
7.14%
1
7.14%
1
7.14%
11
3
JYOTIBA
PHULE
NAGAR
7
)
0.52
0.62
0.35
1.20
3
42.86%
0
0
4
57.14%
0
0
3
4
KANNAUJ
4
)
0.04
1.38
0.98
0.98
3
75.00%
0
0
1
25.00%
0
0
3
1
KANPUR
DEHAT
5
)
1.10
2.79
-
-
2
40.00%
3
60.00 %
0
0
0
0
5
0
KANPUR
NAGAR
12
)
0.32
3.91
0.05
0.24
9
75.00%
1
8.33 %
0
2
16.67%
0
0
10
2
KAUSHAMBI
6
)
1.84
4.05
-
-
1
16.67%
4
66.67 %
1
16.67%
0
0
0
6
0
KHERI
6
)
0.77
2.12
0.27
0.27
4
66.67%
1
16.67 %
0
1
16.67%
0
0
5
1
KUSHINAGA
R
5
)
0.26
0.72
2.49
2.49
4
80.00%
0
0
0
1
20.00%
0
4
1
LALITPUR
13
)
0.02
4.35
0.30
1.19
6
46.15%
3
23.08 %
1
7.69%
3
23.08%
0
0
10
3
LUCKNOW
13
)
0.74
2.82
0.36
1.88
9
69.23%
1
7.69 %
0
3
23.08%
0
0
10
3

99
MAHOBA
8
)
0.27
2.36
0.76
1.30
4
50.00%
2
25.00 %
0
2
25.00%
0
0
6
2
MAHRAJGA
NJ
6
)
0.21
1.03
2.46
2.46
5
83.33%
0
0
0
1
16.67%
0
5
1
MAINPURI
5
)
0.25
0.87
0.22
0.22
4
80.00%
0
0
1
20.00%
0
0
4
1
MATHURA
14
)
0.35
2.93
0.13
0.13
11
78.57%
2
14.29 %
0
1
7.14%
0
0
13
1
MAU
6
)
0.02
2.25
-
-
5
83.33%
1
16.67 %
0
0
0
0
6
0
MEERUT
8
)
0.70
1.69
0.61
0.93
6
75.00%
0
0
2
25.00%
0
0
6
2
MIRZAPUR
8
)
0.12
2.13
4.12
4.12
5
62.50%
2
25.00 %
0
0
0
1
12.50%
7
1
MORADABA
D
5
)
0.09
0.75
0.51
1.76
3
60.00%
0
0
2
40.00%
0
0
3
2
MUZAFFAR
NAGAR
5
)
1.51
4.35
0.24
1.09
1
20.00%
0
1
20.00%
3
60.00%
0
0
2
3
PILIBHIT
10
)
0.63
1.53
-
-
10
100.00%
0
0
0
0
0
10
0
PRATAPGAR
H
22
)
0.24
3.48
0.03
0.03
14
63.64%
7
31.82 %
0
1
4.55%
0
0
21
1
RAE BARELI
22
)
0.07
2.39
0.10
0.89
17
77.27%
1
4.55 %
0
4
18.18%
0
0
18
4

100
RAMPUR
2
-
-
0.05
0.45
0
0
0
2
100.0 %
0
0
0
2
SAHARANP
UR
11
)
0.15
3.15
0.13
0.50
6
54.55%
2
18.18 %
0
3
27.27%
0
0
8
3
SANT KABIR
NAGAR
4
)
0.40
1.31
-
-
4
100.00%
0
0
0
0
0
4
0
SANT
RAVIDAS
NAGAR
4
)
0.02
7.49
-
-
2
50.00%
1
25.00 %
1
25.00%
0
0
0
4
0
SHAHJAHAN
PUR
1
)
0.74
0.74
-
-
1
100.00%
0
0
0
0
0
1
0
SHRAWASTI
11
)
0.35
1.32
-
-
11
100.00%
0
0
0
0
0
11
0
SIDDHARTH
NAGAR
9
)
0.02
1.15
-
-
9
100.00%
0
0
0
0
0
9
0
SITAPUR
17
)
0.01
4.79
0.06
0.36
12
70.59%
0
1
5.88%
4
23.53%
0
0
13
4
SONBHADR
A
15
)
0.24
13.84
1.14
1.14
6
40.00%
6
40.00 %
2
13.33%
1
6.67%
0
0
14
1
SULTANPUR
33
)
0.02
4.14
2.55
2.55
27
81.82%
4
12.12 %
1
3.03%
0
1
3.03%
0
32
1
UNNAO
13
0.02
2.20
0.07
0.07
11
84.62%
1
7.69 %
0
1
7.69%
0
0
12
1
VARANASI
5
)
1.10
4.39
-
-
3
60.00%
1
20.00 %
1
20.00%
0
0
0
5
0
Total 654 3.09 0.62 432 88 22 94 10 6 542 110

101
January 2021 –22
To evaluate the rise and fall in water level in January’2021 with respect to
January’2022, water level data of wells have been analysed. The fluctuation data shows rise
of water level in 572 nos (83.5%) and fall in 113 nos (16.45%) of the analysed wells.
The fluctuation data of the state shows a fall of 0 to 2 m in 104 no. of analysed wells
(15.18%) in mainly Amroha, Sambhal, Bulandshahar, Aligarh, Budaun, Hardoi, Siatpur,
Jaaun, lalitpur, Banda, Chitrakoot and Chandaulli districts.
A fall of 2 to 4m is observed only in 7 no. wells and rise of > 4 m in 2 wells (0.28%)
of G.B.Nagar and Chandauli
A rise of 0-2 m in water level is noticed in 490 no. of analysed wells (71.53%).
Districts showing in all parts of Uttar Pradesh except Amroha, Sambhal, Bulandshahar,
Aligarh, Budaun and parts of Hardoi, Siatpur, Jalaun, lalitpur, Banda, Chitrakoot and
Chandaulli districts. and rise of 2 to 4 m is seen only in 87nos(12.41%) and rise of > 4m are
mainly seen in Shamli, Bhagpat, Kanpur Dehat, Hamirpur, Fatehpur, Allahabad, S.Ravidas
Nagar, Mirzapur and Varanasi. The district wise changes has been shown in Table-12 and
depicted in the Plate-XIII. Plate –XIII

102
Table -12
DISTRICTWISE– ANNUAL WATER LEVEL FLUCTUATION, U.P
January’ 2021 – 2022
District
Name
No. of
Wells Range of Fluctuation (m) No. of Wells/Percentage Showing Fluctuation Total No. of Wells
Rise Fall Rise Fall
Rise
Fall
Min Max Min Max 0 to 2 2 to 4 >4 0 to 2 2 to 4 >4
AGRA
9
)
0.12
9.24
0.30
4.14
4
44.44%
1
11.11 %
1
11.11%
2
22.22%
0
1
11.11%
6
3
ALIGARH
7
)
0.25
1.14
0.19
0.25
5
71.43%
0
0
2
28.57%
0
0
5
2
ALLAHABA
D
31
)
0.03
8.43
0.07
0.64
23
74.19%
4
12.90 %
2
6.45%
2
6.45%
0
0
29
2
AMBEDKAR
NAGAR
7
)
1.16
2.54
-
-
6
85.71%
1
14.29 %
0
0
0
0
7
0
AURAIYA
7
)
0.32
4.27
-
-
3
42.86%
3
42.86 %
1
14.29%
0
0
0
7
0
AZAMGARH
15
)
0.17
4.23
-
-
9
60.00%
5
33.33 %
1
6.67%
0
0
0
15
0
BAGHPAT
2
)
3.09
3.09
2.98
2.98
0
1
50.00 %
0
0
1
50.00%
0
1
1
BAHRAICH
11
)
0.05
0.97
0.12
0.44
9
81.82%
0
0
2
18.18%
0
0
9
2

103
BALLIA
14
)
0.23
3.38
0.08
0.79
9
64.29%
1
7.14 %
0
3
21.43%
0
0
10
3
BALRAMPU
R
17
)
0.10
1.95
-
-
16
94.12%
0
0
0
0
0
16
0
BANDA
12
)
0.11
4.55
0.04
1.23
2
16.67%
2
16.67 %
1
8.33%
7
58.33%
0
0
5
7
BARABANKI
18
)
0.42
2.51
0.30
0.30
15
83.33%
2
11.11 %
0
1
5.56%
0
0
17
1
BAREILLY
8
)
0.12
6.90
0.12
2.11
4
50.00%
1
12.50 %
1
12.50%
1
12.50%
1
12.50%
0
6
2
BASTI
7
)
0.23
1.68
0.06
0.06
6
85.71%
0
0
1
14.29%
0
0
6
1
BIJNOR
6
)
0.20
1.45
0.10
0.25
4
66.67%
0
0
2
33.33%
0
0
4
2
BUDAUN
3
)
0.23
2.11
10.34
10.34
1
33.33%
1
33.33 %
0
0
0
1
33.33%
2
1
BULANDSH
AHR
2
-
-
0.30
0.31
0
0
0
2
100.0 %
0
0
0
2
CHANDAULI
6
)
0.12
2.57
-
-
5
83.33%
1
16.67 %
0
0
0
0
6
0
CHITRAKOO
T
8
)
0.18
2.18
0.56
2.38
4
50.00%
2
25.00 %
0
1
12.50%
1
12.50%
0
6
2

104
DEORIA
9
)
0.33
1.18
0.09
1.07
7
77.78%
0
0
2
22.22%
0
0
7
2
ETAH
7
)
0.43
0.93
0.04
0.32
5
71.43%
0
0
2
28.57%
0
0
5
2
FAIZABAD
11
)
0.97
4.23
-
-
9
81.82%
1
9.09 %
1
9.09%
0
0
0
11
0
FARRUKHA
BAD
2
)
1.89
1.89
0.06
0.06
1
50.00%
0
0
1
50.00%
0
0
1
1
FATEHPUR
10
)
0.12
12.96
0.61
4.48
4
40.00%
3
30.00 %
1
10.00%
1
10.00%
0
1
10.00%
8
2
FIROZABAD
4
-
-
0.05
3.54
0
0
0
3
75.00%
1
25.00%
0
0
4
GHAZIABAD
5
)
0.30
1.52
0.93
0.93
4
80.00%
0
0
1
20.00%
0
0
4
1
GHAZIPUR
12
)
0.65
4.90
0.25
3.39
3
25.00%
3
25.00 %
1
8.33%
4
33.33%
1
8.33%
0
7
5
GONDA
6
)
0.33
1.36
-
-
6
100.00%
0
0
0
0
0
6
0
GORAKHPU
R
4
)
0.17
1.55
0.12
0.12
3
75.00%
0
0
1
25.00%
0
0
3
1
HAMIRPUR
6
)
0.65
2.42
0.90
1.00
2
33.33%
2
33.33 %
0
2
33.33%
0
0
4
2

105
HARDOI
15
)
0.06
1.11
0.02
1.21
10
66.67%
0
0
5
33.33%
0
0
10
5
HATHRAS
3
)
0.52
2.03
-
-
2
66.67%
1
33.33 %
0
0
0
0
3
0
JALAUN
25
)
0.25
5.40
0.35
4.15
14
56.00%
4
16.00 %
2
8.00%
3
12.00%
1
4.00%
1
4.00%
20
5
JAUNPUR
16
)
0.12
7.58
1.10
1.10
12
75.00%
2
12.50 %
1
6.25%
1
6.25%
0
0
15
1
JHANSI
14
)
0.55
2.85
1.30
5.10
7
50.00%
4
28.57 %
0
1
7.14%
1
7.14%
1
7.14%
11
3
JYOTIBA
PHULE
NAGAR
7
)
0.52
0.62
0.35
1.20
3
42.86%
0
0
4
57.14%
0
0
3
4
KANNAUJ
4
)
0.04
1.38
0.98
0.98
3
75.00%
0
0
1
25.00%
0
0
3
1
KANPUR
DEHAT
5
)
1.10
2.79
-
-
2
40.00%
3
60.00 %
0
0
0
0
5
0
KANPUR
NAGAR
12
)
0.32
3.91
0.05
0.24
9
75.00%
1
8.33 %
0
2
16.67%
0
0
10
2
KAUSHAMBI
6
)
1.84
4.05
-
-
1
16.67%
4
66.67 %
1
16.67%
0
0
0
6
0
KHERI
6
)
0.77
2.12
0.27
0.27
4
66.67%
1
16.67 %
0
1
16.67%
0
0
5
1

106
KUSHINAGA
R
5
)
0.26
0.72
2.49
2.49
4
80.00%
0
0
0
1
20.00%
0
4
1
LALITPUR
13
)
0.02
4.35
0.30
1.19
6
46.15%
3
23.08 %
1
7.69%
3
23.08%
0
0
10
3
LUCKNOW
13
)
0.74
2.82
0.36
1.88
9
69.23%
1
7.69 %
0
3
23.08%
0
0
10
3
MAHOBA
8
)
0.27
2.36
0.76
1.30
4
50.00%
2
25.00 %
0
2
25.00%
0
0
6
2
MAHRAJGA
NJ
6
)
0.21
1.03
2.46
2.46
5
83.33%
0
0
0
1
16.67%
0
5
1
MAINPURI
5
)
0.25
0.87
0.22
0.22
4
80.00%
0
0
1
20.00%
0
0
4
1
MATHURA
14
)
0.35
2.93
0.13
0.13
11
78.57%
2
14.29 %
0
1
7.14%
0
0
13
1
MAU
6
)
0.02
2.25
-
-
5
83.33%
1
16.67 %
0
0
0
0
6
0
MEERUT
8
)
0.70
1.69
0.61
0.93
6
75.00%
0
0
2
25.00%
0
0
6
2
MIRZAPUR
8
)
0.12
2.13
4.12
4.12
5
62.50%
2
25.00 %
0
0
0
1
12.50%
7
1
MORADABA
D
5
)
0.09
0.75
0.51
1.76
3
60.00%
0
0
2
40.00%
0
0
3
2

107
MUZAFFAR
NAGAR
5
)
1.51
4.35
0.24
1.09
1
20.00%
0
1
20.00%
3
60.00%
0
0
2
3
PILIBHIT
10
)
0.63
1.53
-
-
10
100.00%
0
0
0
0
0
10
0
PRATAPGAR
H
22
)
0.24
3.48
0.03
0.03
14
63.64%
7
31.82 %
0
1
4.55%
0
0
21
1
RAE BARELI
22
)
0.07
2.39
0.10
0.89
17
77.27%
1
4.55 %
0
4
18.18%
0
0
18
4
RAMPUR
2
-
-
0.05
0.45
0
0
0
2
100.0 %
0
0
0
2
SAHARAN
P UR
11
)
0.15
3.15
0.13
0.50
6
54.55%
2
18.18 %
0
3
27.27%
0
0
8
3
SANT
KABIR
NAGAR
4
)
0.40
1.31
-
-
4
100.00%
0
0
0
0
0
4
0
SANT
RAVIDA
S NAGAR
4
)
0.02
7.49
-
-
2
50.00%
1
25.00 %
1
25.00%
0
0
0
4
0
SHAHJAHA
N PUR
1
)
0.74
0.74
-
-
1
100.00%
0
0
0
0
0
1
0
SHRAWASTI
11
)
0.35
1.32
-
-
11
100.00%
0
0
0
0
0
11
0
SIDDHART
H NAGAR
9
)
0.02
1.15
-
-
9
100.00%
0
0
0
0
0
9
0

108
SITAPUR
17
)
0.01
4.79
0.06
0.36
12
70.59%
0
1
5.88%
4
23.53%
0
0
13
4
SONBHAD
R A
15
)
0.24
13.84
1.14
1.14
6
40.00%
6
40.00 %
2
13.33%
1
6.67%
0
0
14
1
SULTANPUR
33
)
0.02
4.14
2.55
2.55
27
81.82%
4
12.12 %
1
3.03%
0
1
3.03%
0
32
1
UNNAO
13
)
0.02
2.20
0.07
0.07
11
84.62%
1
7.69 %
0
1
7.69%
0
0
12
1
VARANASI
5
)
1.10
4.39
-
-
3
60.00%
1
20.00 %
1
20.00%
0
0
0
5
0
Total 654 3.09 0.62 432 88 22 94 10 6 542 110

110
The overall status of annual fluctuation in the state is summarized in following table.
Annual Fluctuation in Water Level During 2021 –22, U.P.
FLUCTUATION
RANGE
May 20 – 21 August 20 - 21 November 20 - 21 January 21 – 22
Rise (%) Fall (%) Rise (%) Fall (%) Rise (%) Fall (%) Rise (%) Fall (%)
0-2 54
(28.57%)
89
(47.08%)
166
(40.58%)
177
(43.27%)
432
(66.05%)
94
(14.37%)
490
(71.53%)
104
(15.18%)
2-4 6
(3.17%)
27
(14.28%)
23
(5.62%)
31
(7.57%)
88
(13.45%)
10
(1.52%)
66
(9.63%)
7
(1.02%)
>4 8
(4.23%)
5
(2.64)
9
(2.20%)
3
(0.73%)
22
(3.36%)
6
(0.91%)
104
(15.18%)
09
(0.28%)
TOTAL 68
(35.97%)
121
(64.02%)
198
(48.41%)
211
(51.58%)
542
(82.87%)
110
(16.81%)
572
(83.5%)
113
(16.45%)
From the analysis of table it is evident that the water level has shown maximum decline in
August 21 as compared to the May’21 but the decline percentage has gradually decrease and
increase in rise of water level percentage in November’21 and January’22 due to monsoonal
recharge as compared to the previous year.
6.3 Fluctuation from the Decadal Mean during 2021 – 22
The fluctuations in water level described earlier are very much dependent on the
rainfall and give a very short term picture. In order to remove the rainfall anomalies the long
term water level is considered as this would normalize the erratic highs and lows. For this the
water level of each season has been compared to the mean water level of past 10 years. This
has been done to evaluate the status of water level during the year 2021-22 with respect to
long term mean. The outcome of the analysis has been compiled on district level and the
same has been discussed subsequently for the four seasons of observation.
Mean May (2011- 2020) – May 2021
The pre-monsoon water level data for 2021 has been compared to decadal mean
(2011-2020) for pre-monsoon periods, and district-wise analysis of Ground Water
Monitoring wells has been compiled in Table-13 and fluctuation map has been prepared and
given in Plate –XIV. The analyzed data shows that rise in water level for 395 (60%) wells
and fall in 263no. (39.96%).

111
Table-13
DISTRICT WISE – DECADAL WATER LEVEL FLUCTUATION, U.P.
Mean May (2011 – 2020) – May, 2021
District
Name
No. of
Wells
Range of Fluctuation No. of Wells/Percentage Showing Fluctuation Total No. of Wells
Rise (m) Fall (m)
Rise (m) Fall (m) Rise Fall
Min Max Min Max 0 to 2 2 to 4 >4 0 to 2 2 to 4 >4
AGRA 9
0.18 0.18 0.07 5.03 1
11.11 %
0 0 3
33.33%
4
44.44 %
1
11.11%
1 8
ALIGARH 5 2.23 2.23 0.75 6.40 0 1
20.00%
0 3
60.00%
0 1
20.00%
1 4
ALLAHABA
D
30 0.12 1.78 0.08 3.99
13
43.33 %
0 0 13
43.33%
4
13.33 %
0 13 17
AMBEDKAR
NAGAR
7 1.21 4.56 - -
3
42.86 %
2
28.57%
2
28.57%
0 0 0 7 0
AURAIYA 6
- - 0.29 5.69 0 0 0 3
50.00%
2
33.33 %
1
16.67%
0 6
AZAMGARH 13
0.64 4.67 0.37 1.31 6
46.15 %
2
15.38%
2
15.38%
3
23.08%
0 0 10 3
BAGHPAT 2
- - 1.51 5.61 0 0 0 1
50.00%
0 1
50.00%
0 2
BAHRAICH 10 0.40 1.13 0.44 1.03 7
70.00 %
0 0 3
30.00%
0 0 7 3

112
District
Name
No. of
Wells
Range of Fluctuation No. of Wells/Percentage Showing Fluctuation Total No. of Wells
Rise (m) Fall (m)
Rise (m) Fall (m) Rise Fall
Min Max Min Max 0 to 2 2 to 4 >4 0 to 2 2 to 4 >4
BALLIA 18 0.32 5.58 - - 7
38.89 %
7
38.89%
4
22.22%
0 0 0 18 0
BALRAMPU
R
17 0.91 3.42 0.77 1.52 6
35.29 %
9
52.94%
0 2
11.76%
0 0 15 2
BANDA 10 0.44 6.06 0.07 7.37 3
30.00 %
0 3
30.00%
3
30.00%
0 1
10.00%
6 4
BARABANKI 15 0.31 1.15 0.09 1.26 9
60.00 %
0 0 6
40.00%
0 0 9 6
BAREILLY 7 0.09 2.00 0.24 3.68 3
42.86 %
0 0 3
42.86%
1
14.29 %
0 3 4
BASTI 7 0.39 3.84 - - 3
42.86 %
4
57.14%
0 0 0 0 7 0
BIJNOR 6 0.01 1.38 0.08 4.08 3
50.00 %
0 0 2
33.33%
0 1
16.67%
3 3
BUDAUN 4 - - 1.58 6.23 0 0 0 1
25.00%
0 3
75.00%
0 4
BULANDSH
AHR
3 4.33 4.33 2.44 3.11 0 0 1
33.33%
0 2
66.67 %
0 1 2

113
District
Name
No. of
Wells
Range of Fluctuation No. of Wells/Percentage Showing Fluctuation Total No. of Wells
Rise (m) Fall (m)
Rise (m) Fall (m) Rise Fall
Min Max Min Max 0 to 2 2 to 4 >4 0 to 2 2 to 4 >4
CHANDAULI 4 1.13 2.81 - - 1
25.00 %
3
75.00%
0 0 0 0 4 0
CHITRAKOO
T
7 0.10 6.62 0.26 2.76 2
28.57 %
1
14.29%
1
14.29%
2
28.57%
1
14.29 %
0 4 3
DEORIA 8 1.48 2.69 - - 3
37.50 %
5
62.50%
0 0 0 0 8 0
ETAH 6 - - 0.78 3.03 0 0 0 4
66.67%
2
33.33 %
0 0 6
ETAWAH 4 0.26 0.92 1.29 4.14 2
50.00 %
0 0 1
25.00%
0 1
25.00%
2 2
FAIZABAD 11 0.06 4.18 0.21 0.30 6
54.55 %
2
18.18%
1
9.09%
2
18.18%
0 0 9 2
FARRUKHA
BAD
2 - - 0.75 3.44 0 0 0 1
50.00%
1
50.00 %
0 0 2
FATEHPUR 7 0.75 7.86 0.45 0.45 3
42.86 %
1
14.29%
2
28.57%
1
14.29%
0 0 6 1
FIROZABAD 4 - - 1.49 6.08 0 0 0 1
25.00%
1
25.00 %
2
50.00%
0 4

114
District
Name
No. of
Wells
Range of Fluctuation No. of Wells/Percentage Showing Fluctuation Total No. of Wells
Rise (m) Fall (m)
Rise (m) Fall (m) Rise Fall
Min Max Min Max 0 to 2 2 to 4 >4 0 to 2 2 to 4 >4
GAUTAM
BUDDHA
NAGAR
2 - - 6.43 20.83 0 0 0 0 0 2
100.0 %
0 2
GHAZIABAD 6 0.57 0.57 0.62 2.75 1
16.67 %
0 0 4
66.67%
1
16.67 %
0 1 5
GHAZIPUR 16 0.37 4.94 0.11 0.43 4
25.00 %
5
31.25%
5
31.25%
2
12.50%
0 0 14 2
GONDA 7 0.36 2.94 - - 5
71.43 %
2
28.57%
0 0 0 0 7 0
GORAKHPU
R
3 0.91 2.10 - - 2
66.67 %
1
33.33%
0 0 0 0 3 0
HAMIRPUR 7 1.07 7.26 0.16 1.74 2
28.57 %
0 1
14.29%
4
57.14%
0 0 3 4
HARDOI 18 0.05 3.57 0.06 1.72 10
55.56 %
2
11.11%
0 6
33.33%
0 0 12 6
HATHRAS 3 - - 0.44 6.61 0 0 0 2
66.67%
0 1
33.33%
0 3
JALAUN 21 0.07 1.02 0.08 6.92 4
19.05 %
0 0 11
52.38%
4
19.05 %
2
9.52%
4 17

115
District
Name
No. of
Wells
Range of Fluctuation No. of Wells/Percentage Showing Fluctuation Total No. of Wells
Rise (m) Fall (m)
Rise (m) Fall (m) Rise Fall
Min Max Min Max 0 to 2 2 to 4 >4 0 to 2 2 to 4 >4
JAUNPUR 16 0.04 6.29 0.20 1.78 7
43.75 %
3
18.75%
2
12.50%
4
25.00%
0 0 12 4
JHANSI 15 0.02 1.29 0.29 3.81 7
46.67 %
0 0 7
46.67%
1
6.67 %
0 7 8
JYOTIBA
PHULE
NAGAR
6 0.19 0.19 1.74 5.45 1
16.67 %
0 0 1
16.67%
3
50.00 %
1
16.67%
1 5
KANNAUJ 4 0.19 0.19 2.81 6.76 1
25.00 %
0 0 0 2
50.00 %
1
25.00%
1 3
KANPUR
DEHAT
4 0.12 4.73 0.45 0.97 1
25.00 %
0 1
25.00%
2
50.00%
0 0 2 2
KANPUR
NAGAR
12 0.18 1.64 0.06 1.12 7
58.33 %
0 0 5
41.67%
0 0 7 5
KAUSHAMB
I
7 0.01 1.61 1.97 1.97 6
85.71 %
0 0 1
14.29%
0 0 6 1
KHERI 7 0.12 0.98 0.07 0.74 4
57.14 %
0 0 3
42.86%
0 0 4 3
KUSHINAGA
R
4 1.57 2.77 - - 1
25.00 %
3
75.00%
0 0 0 0 4 0

116
District
Name
No. of
Wells
Range of Fluctuation No. of Wells/Percentage Showing Fluctuation Total No. of Wells
Rise (m) Fall (m)
Rise (m) Fall (m) Rise Fall
Min Max Min Max 0 to 2 2 to 4 >4 0 to 2 2 to 4 >4
LALITPUR 14 0.06 2.98 0.33 3.14 6
42.86 %
1
7.14%
0 5
35.71%
2
14.29 %
0 7 7
LUCKNOW 17 0.02 2.12 0.11 7.85 6
35.29 %
1
5.88%
0 5
29.41%
4
23.53 %
1
5.88%
7 10
MAHOBA 9 0.23 4.88 1.95 2.93 4
44.44 %
0 1
11.11%
1
11.11%
3
33.33 %
0 5 4
MAHRAJGA
NJ
6 2.82 3.52 0.35 0.35 0 5
83.33%
0 1
16.67%
0 0 5 1
MAINPURI 4 0.18 0.18 0.60 2.04 1
25.00 %
0 0 2
50.00%
1
25.00 %
0 1 3
MATHURA 12 0.59 1.65 0.28 4.37 4
33.33 %
0 0 5
41.67%
2
16.67 %
1
8.33%
4 8
MAU 6 0.08 4.75 - - 2
33.33 %
2
33.33%
2
33.33%
0 0 0 6 0
MEERUT 10 .00 6.56 0.20 3.13 3
30.00 %
0 1
10.00%
4
40.00%
2
20.00 %
0 4 6
MIRZAPUR 4 3.43 4.52 0.54 0.54 0 2
50.00%
1
25.00%
1
25.00%
0 0 3 1

117
District
Name
No. of
Wells
Range of Fluctuation No. of Wells/Percentage Showing Fluctuation Total No. of Wells
Rise (m) Fall (m)
Rise (m) Fall (m) Rise Fall
Min Max Min Max 0 to 2 2 to 4 >4 0 to 2 2 to 4 >4
MORADABA
D
11 0.51 1.29 0.04 4.23 4
36.36 %
0 0 2
18.18%
3
27.27 %
2
18.18%
4 7
MUZAFFAR
NAGAR
9 0.73 10.93 0.38 4.33 2
22.22 %
0 1
11.11%
4
44.44%
1
11.11 %
1
11.11%
3 6
PILIBHIT 9 0.07 0.62 0.09 0.24 6
66.67 %
0 0 3
33.33%
0 0 6 3
PRATAPGAR
H
23 0.03 3.59 0.05 1.53 13
56.52 %
1
4.35%
0 9
39.13%
0 0 14 9
RAE BARELI 25 0.10 1.84 0.04 4.50 16
64.00 %
0 0 8
32.00%
0 1
4.00%
16 9
RAMPUR 2 2.79 2.79 1.18 1.18 0 1
50.00%
0 1
50.00%
0 0 1 1
SAHARANP
UR
9 0.17 1.04 0.03 1.29 2
22.22 %
0 0 7
77.78%
0 0 2 7
SANT KABIR
NAGAR
4 1.24 2.51 - - 1
25.00 %
3
75.00%
0 0 0 0 4 0
SANT
RAVIDAS
NAGAR
4 2.58 4.63 - - 0 2
50.00%
2
50.00%
0 0 0 4 0

118
District
Name
No. of
Wells
Range of Fluctuation No. of Wells/Percentage Showing Fluctuation Total No. of Wells
Rise (m) Fall (m)
Rise (m) Fall (m) Rise Fall
Min Max Min Max 0 to 2 2 to 4 >4 0 to 2 2 to 4 >4
SHRAWASTI 11 0.26 2.79 - - 5
45.45 %
6
54.55%
0 0 0 0 11 0
SIDDHARTH
NAGAR
10 1.32 4.06 - - 3
30.00 %
6
60.00%
1
10.00%
0 0 0 10 0
SITAPUR 19 0.07 2.38 0.01 1.50 9
47.37 %
1
5.26%
0 9
47.37%
0 0 10 9
SONBHADR
A
8 0.86 6.97 0.02 0.02 3
37.50 %
3
37.50%
1
12.50%
1
12.50%
0 0 7 1
SULTANPUR 34 0.17 4.22 0.30 1.58 20
58.82 %
9
26.47%
2
5.88%
3
8.82%
0 0 31 3
UNNAO 13 0.38 2.33 0.01 1.30 3
23.08 %
1
7.69%
0 9
69.23%
0 0 4 9
VARANASI 5
0.65 3.94 1.48 1.48 1
20.00 %
3
60.00%
0 1
20.00%
0 0 4 1
Total 658 0.18 4.33 0.00 20.83 258 100 37 191 47 25 395 263

119
Plate –XIV
It is observed that 395no. Monitoring wells (60 %) shows rise and 39.96% fall in
water level. A fall in water level of 0-2 m is observed in 191(26.02%) wells. Fall of higher
magnitude is found along Yamuna river. A fall in water levels between 2- 4m is observed in
47Monitoring wells (6.86%) found in small patches Like Agra, Hapur, Meerut, Bhagpat,
Muzaffarnagar, Firozabad, Farukhabad, Fatehpur, Mahoba, Jalaun Chitrakoot, and Lucknow.
There is a rise in water level from 0 to 2 m with respect to decadal mean of May in
258 (39.10%) monitoring wells and rise of 2 - 4 m is observed in 100 monitoring wells and
rise of more than 4 m is observed in 37 monitoring wells.
Mean August (2011 - 2020) – August 2021
The average water level of last 10 years (2011to 2020) for each well for the month of
August has been evaluated and compared with water level data for August’2021. The wells
have been categorized depending on rise and fall in water levels and shown in Table-14 and
fluctuation map has been given in Plate-XV.

120
Table-14
DISTRICT WISE – DECADAL WATER LEVEL FLUCTUATION, U.P.
Mean August (2011 – 2020) – August, 2021
District
Name
No. of
Wells
Range of Fluctuation No. of Wells/Percentage Showing Fluctuation Total No. of Wells
Rise (m) Fall (m)
Rise (m) Fall (m) Rise Fall
Min Max Min Max 0 to 2 2 to 4 >4 0 to 2 2 to 4 >4
AGRA 9
0.27 0.79 0.07 5.20 2
22.22 %
0 0 4
44.44%
1
11.11 %
2
22.22%
2 7
ALIGARH 6 0.97 6.77 0.37 2.13 1
16.67 %
0 2
33.33%
2
33.33%
1
16.67 %
0 3 3
ALLAHABA
D
26 0.04 4.44 1.09 2.65
14
53.85 %
6
23.08%
2
7.69%
3
11.54%
1
3.85 %
0 22 4
AMBEDKAR
NAGAR
7 0.22 2.59 - -
3
42.86 %
4
57.14%
0 0 0 0 7 0
AURAIYA 7
0.40 0.40 0.91 3.55 1
14.29 %
0 0 3
42.86%
3
42.86 %
0 1 6
AZAMGARH 14
0.27 6.89 0.05 1.16 7
50.00 %
3
21.43%
1
7.14%
3
21.43%
0 0 11 3
BAGHPAT 2
- - 1.38 2.82 0 0 0 1
50.00%
1
50.00 %
0 0 2
BAHRAICH 11 0.21 1.00 0.11 0.34 7
63.64 %
0 0 4
36.36%
0 0 7 4

121
District
Name
No. of
Wells
Range of Fluctuation No. of Wells/Percentage Showing Fluctuation Total No. of Wells
Rise (m) Fall (m)
Rise (m) Fall (m) Rise Fall
Min Max Min Max 0 to 2 2 to 4 >4 0 to 2 2 to 4 >4
BALLIA 17 0.42 4.16 0.11 0.72 9
52.94 %
3
17.65%
2
11.76%
3
17.65%
0 0 14 3
BALRAMPU
R
15 0.11 2.33 - - 11
73.33 %
4
26.67%
0 0 0 0 15 0
BANDA 13 0.07 6.47 0.02 2.82 5
38.46 %
1
7.69%
1
7.69%
4
30.77%
2
15.38 %
0 7 6
BARABANKI 18 0.14 1.01 0.17 0.86 12
66.67 %
0 0 6
33.33%
0 0 12 6
BAREILLY 9 0.32 0.65 0.50 3.96 2
22.22 %
0 0 6
66.67%
1
11.11 %
0 2 7
BASTI 7 0.15 2.87 - - 6
85.71 %
1
14.29%
0 0 0 0 7 0
BIJNOR 5 0.41 0.99 0.02 1.90 2
40.00 %
0 0 3
60.00%
0 0 2 3
BUDAUN 3 - - 4.24 12.13 0 0 0 0 0 3
100.0 %
0 3
BULANDSH
AHR
3 5.44 5.44 1.29 4.08 0 0 1
33.33%
1
33.33%
0 1
33.33%
1 2

122
District
Name
No. of
Wells
Range of Fluctuation No. of Wells/Percentage Showing Fluctuation Total No. of Wells
Rise (m) Fall (m)
Rise (m) Fall (m) Rise Fall
Min Max Min Max 0 to 2 2 to 4 >4 0 to 2 2 to 4 >4
CHANDAULI 8 0.11 2.75 0.03 0.03 4
50.00 %
3
37.50%
0 1
12.50%
0 0 7 1
CHITRAKOO
T
9 0.03 3.66 0.33 3.74 5
55.56 %
1
11.11%
0 2
22.22%
1
11.11 %
0 6 3
DEORIA 9 0.56 4.18 - - 5
55.56 %
3
33.33%
1
11.11%
0 0 0 9 0
ETAH 7 - - 0.79 3.66 0 0 0 4
57.14%
3
42.86 %
0 0 7
ETAWAH 6 1.26 6.00 0.87 5.69 1
16.67 %
0 1
16.67%
2
33.33%
1
16.67 %
1
16.67%
2 4
FAIZABAD 11 0.20 3.32 0.15 0.15 9
81.82 %
1
9.09%
0 1
9.09%
0 0 10 1
FARRUKHA
BAD
2 1.22 1.22 0.21 0.21 1
50.00 %
0 0 1
50.00%
0 0 1 1
FATEHPUR 12 0.55 2.52 0.43 6.47 3
25.00 %
1
8.33%
0 5
41.67%
2
16.67 %
1
8.33%
4 8
FIROZABAD 4 5.75 5.75 3.67 5.81 0 0 1
25.00%
0 2
50.00 %
1
25.00%
1 3

123
District
Name
No. of
Wells
Range of Fluctuation No. of Wells/Percentage Showing Fluctuation Total No. of Wells
Rise (m) Fall (m)
Rise (m) Fall (m) Rise Fall
Min Max Min Max 0 to 2 2 to 4 >4 0 to 2 2 to 4 >4
GAUTAM
BUDDHA
NAGAR
4 2.95 2.95 1.16 14.98 0 1
25.00%
0 1
25.00%
0 2
50.00%
1 3
GHAZIABAD 6 - - 0.50 3.28 0 0 0 4
66.67%
2
33.33 %
0 0 6
GHAZIPUR 13 0.29 3.53 0.32 1.21 2
15.38 %
7
53.85%
0 4
30.77%
0 0 9 4
GONDA 6 1.27 2.87 - - 3
50.00 %
3
50.00%
0 0 0 0 6 0
GORAKHPU
R
4 1.09 3.91 - - 2
50.00 %
2
50.00%
0 0 0 0 4 0
HAMIRPUR 6 0.48 3.94 1.49 1.76 1
16.67 %
3
50.00%
0 2
33.33%
0 0 4 2
HARDOI 17 0.17 1.96 0.19 1.94 6
35.29 %
0 0 11
64.71%
0 0 6 11
HATHRAS 3 0.40 0.40 1.22 3.30 1
33.33 %
0 0 1
33.33%
1
33.33 %
0 1 2
JALAUN 25 .00 1.29 0.11 3.86 8
32.00 %
0 0 12
48.00%
5
20.00 %
0 8 17

124
District
Name
No. of
Wells
Range of Fluctuation No. of Wells/Percentage Showing Fluctuation Total No. of Wells
Rise (m) Fall (m)
Rise (m) Fall (m) Rise Fall
Min Max Min Max 0 to 2 2 to 4 >4 0 to 2 2 to 4 >4
JAUNPUR 22 0.24 4.85 0.22 6.06 10
45.45 %
5
22.73%
3
13.64%
3
13.64%
0 1
4.55%
18 4
JHANSI 17 0.06 1.38 0.15 2.52 9
52.94 %
0 0 5
29.41%
3
17.65 %
0 9 8
JYOTIBA
PHULE
NAGAR
6 0.14 0.14 1.72 6.48 1
16.67 %
0 0 1
16.67%
3
50.00 %
1
16.67%
1 5
KANNAUJ 4 - - 0.07 6.21 0 0 0 2
50.00%
1
25.00 %
1
25.00%
0 4
KANPUR
DEHAT
8 1.66 4.11 0.37 1.76 2
25.00 %
0 1
12.50%
5
62.50%
0 0 3 5
KANPUR
NAGAR
13 .00 0.87 0.22 2.69 5
38.46 %
0 0 7
53.85%
1
7.69 %
0 5 8
KAUSHAMB
I
6 0.83 4.66 - - 3
50.00 %
2
33.33%
1
16.67%
0 0 0 6 0
KHERI 7 0.17 1.65 0.35 1.51 4
57.14 %
0 0 3
42.86%
0 0 4 3
KUSHINAGA
R
5 0.09 0.73 0.48 0.48 4
80.00 %
0 0 1
20.00%
0 0 4 1

125
District
Name
No. of
Wells
Range of Fluctuation No. of Wells/Percentage Showing Fluctuation Total No. of Wells
Rise (m) Fall (m)
Rise (m) Fall (m) Rise Fall
Min Max Min Max 0 to 2 2 to 4 >4 0 to 2 2 to 4 >4
LALITPUR 17 0.57 1.61 0.17 4.42 4
23.53 %
0 0 9
52.94%
2
11.76 %
2
11.76%
4 13
LUCKNOW 18 0.02 1.72 0.05 8.75 5
27.78 %
0 0 8
44.44%
3
16.67 %
2
11.11%
5 13
MAHOBA 9 0.35 3.87 0.02 3.61 2
22.22 %
1
11.11%
0 4
44.44%
2
22.22 %
0 3 6
MAHRAJGA
NJ
6 0.55 2.15 0.05 0.05 4
66.67 %
1
16.67%
0 1
16.67%
0 0 5 1
MAINPURI 5 - - 1.21 2.48 0 0 0 2
40.00%
3
60.00 %
0 0 5
MATHURA 12 0.18 5.97 2.58 3.35 9
75.00 %
0 1
8.33%
0 2
16.67 %
0 10 2
MAU 6 1.18 4.01 0.25 1.92 2
33.33 %
1
16.67%
1
16.67%
2
33.33%
0 0 4 2
MEERUT 9 0.07 0.96 0.77 4.23 3
33.33 %
0 0 3
33.33%
2
22.22 %
1
11.11%
3 6
MIRZAPUR 10 0.11 5.99 - - 6
60.00 %
2
20.00%
2
20.00%
0 0 0 10 0

126
District
Name
No. of
Wells
Range of Fluctuation No. of Wells/Percentage Showing Fluctuation Total No. of Wells
Rise (m) Fall (m)
Rise (m) Fall (m) Rise Fall
Min Max Min Max 0 to 2 2 to 4 >4 0 to 2 2 to 4 >4
MORADABA
D
6 0.56 0.66 0.35 5.00 2
33.33 %
0 0 1
16.67%
1
16.67 %
2
33.33%
2 4
MUZAFFAR
NAGAR
9 0.04 4.94 0.46 1.82 4
44.44 %
0 1
11.11%
4
44.44%
0 0 5 4
PILIBHIT 9 0.71 1.63 0.21 0.67 4
44.44 %
0 0 5
55.56%
0 0 4 5
PRATAPGAR
H
26 0.22 4.63 0.00 5.46 11
42.31 %
9
34.62%
1
3.85%
3
11.54%
0 2
7.69%
21 5
RAE BARELI 25 0.09 0.72 0.08 5.76 3
12.00 %
0 0 19
76.00%
1
4.00 %
2
8.00%
3 22
RAMPUR 3 0.95 0.95 0.82 2.10 1
33.33 %
0 0 1
33.33%
1
33.33 %
0 1 2
SAHARANP
UR
12 0.17 2.76 0.01 2.52 8
66.67 %
1
8.33%
0 1
8.33%
2
16.67 %
0 9 3
SANT KABIR
NAGAR
4 0.77 2.59 - - 1
25.00 %
3
75.00%
0 0 0 0 4 0

127
District
Name
No. of
Wells
Range of Fluctuation No. of Wells/Percentage Showing Fluctuation Total No. of Wells
Rise (m) Fall (m)
Rise (m) Fall (m) Rise Fall
Min Max Min Max 0 to 2 2 to 4 >4 0 to 2 2 to 4 >4
SANT
RAVIDAS
NAGAR
4 0.84 5.35 - - 1
25.00 %
1
25.00%
2
50.00%
0 0 0 4 0
SHRAWASTI 8 0.21 3.03 - - 7
87.50 %
1
12.50%
0 0 0 0 8 0
SIDDHARTH
NAGAR
10 0.47 3.48 - - 9
90.00 %
1
10.00%
0 0 0 0 10 0
SITAPUR 19 0.03 2.23 0.22 3.22 10
52.63 %
1
5.26%
0 4
21.05%
4
21.05 %
0 11 8
SONBHADR
A
17 0.17 3.79 0.12 1.56 10
58.82 %
3
17.65%
0 4
23.53%
0 0 13 4
SULTANPUR 36 0.08 3.29 0.02 2.29 20
55.56 %
6
16.67%
0 9
25.00%
1
2.78 %
0 26 10
UNNAO 18 0.06 1.20 0.18 6.66 9
50.00 %
0 0 8
44.44%
0 1
5.56%
9 9
VARANASI 7
1.57 9.70 2.01 3.90 1
14.29 %
1
14.29%
3
42.86%
0 2
28.57 %
0 5 2
Total 717 0.14 5.75 0.00 14.98 307 86 28 209 61 26 421 296

128
There is rise in water level in 421 wells (58.71%) and fall in 296 (41.28%) wells.
However, a rise of 0 to 2 m water level occurs in patches for 307 wells (42.81% of the
monitored wells). It is found in eastern U.P with a few exceptions in the western U.P. Most of
the Rise of 2 - 4m and more than 4 m are observed in 86 (11.99%) and 28 wells (3.90%)
wells respectively.
Plate-XV
The fall in water level are noticed in 296 wells (41.20% of the monitored wells).
Most of the districts of western parts of the state and few in south eastern U.P. show a fall in
the range of 0 - 2 m at 209 wells (29.14%). Districts showing major parts under fall in water
level of 0-2 m are Saharanpur, Shamli, Bijnour, Baghpat, Muzafarnagar,Hardoi, Sitapur,
Lucknow etc. The fall of 2 - 4 m is observed in 61 wells (8.50%). Fall of >4m is observed
only in 26 no. wells (3.62%).

129
Mean November (2011- 20) – November 2021:
The average water level of last 10 years (2011-20) for each hydrograph station for the
month of November has been evaluated and compared with water level data of November’21.
The wells have been categorized depending on rise and fall in water levels and shown in
table-15 and fluctuation map has been given in Plate-XVI.
Plate-XVI
There is a rise in water level in 542 nos. wells (75.06%) and fall in DWL is observed
in 180 Nos. of wells (24.93%). Rise in DWL is mostly occurs in South eastern U.P Mirzapur,
Varanasi, Chandauli, Jaunpur and some isolated patches in western U.P. such as Saharanpur,
Shamli, Muzaffarnagar, Bijnour, Mathura District. Rise of 2 - 4 m is observed only at 117
wells (16.20%) and rise of more than 4m is noticed only at 22wells.Fall is observed mostly in
Sambhal, Amroha, baghpat, Ghaziabad, Badaun, Firozabad etc.

130
Table-15
DISTRICT WISE – DECADAL WATER LEVEL FLUCTUATION, U.P.
Mean November (2011 – 2020) – November, 2021
District
Name
No. of
Wells
Range of Fluctuation No. of Wells/Percentage Showing Fluctuation Total No. of Wells
Rise (m) Fall (m)
Rise (m) Fall (m) Rise Fall
Min Max Min Max 0 to 2 2 to 4 >4 0 to 2 2 to 4 >4
AGRA 9
0.35 2.05 0.27 3.46 2
22.22 %
1
11.11%
0 4
44.44%
2
22.22 %
0 3 6
ALIGARH 8 0.15 0.79 0.84 1.56 3
37.50 %
0 0 5
62.50%
0 0 3 5
ALLAHABA
D
33 0.02 5.63 0.12 3.28
20
60.61 %
9
27.27%
2
6.06%
1
3.03%
1
3.03 %
0 31 2
AMBEDKAR
NAGAR
7 0.97 4.11 - -
1
14.29 %
5
71.43%
1
14.29%
0 0 0 7 0
AURAIYA 9
0.02 0.85 0.43 3.78 4
44.44 %
0 0 3
33.33%
2
22.22 %
0 4 5
AZAMGARH 15
0.42 5.24 - - 4
26.67 %
9
60.00%
2
13.33%
0 0 0 15 0
BAGHPAT 2
- - 3.71 6.38 0 0 0 0 1
50.00 %
1
50.00%
0 2
BAHRAICH 11 0.01 0.95 0.15 0.52 9
81.82 %
0 0 2
18.18%
0 0 9 2

131
District
Name
No. of
Wells
Range of Fluctuation No. of Wells/Percentage Showing Fluctuation Total No. of Wells
Rise (m) Fall (m)
Rise (m) Fall (m) Rise Fall
Min Max Min Max 0 to 2 2 to 4 >4 0 to 2 2 to 4 >4
BALLIA 14 0.30 3.34 - - 9
64.29 %
5
35.71%
0 0 0 0 14 0
BALRAMPU
R
17 0.37 2.70 - - 15
88.24 %
2
11.76%
0 0 0 0 17 0
BANDA 12 0.21 2.78 0.30 3.95 5
41.67 %
1
8.33%
0 5
41.67%
1
8.33 %
0 6 6
BARABANKI 19 0.25 2.17 - - 17
89.47 %
2
10.53%
0 0 0 0 19 0
BAREILLY 8 0.81 0.97 0.36 2.98 4
50.00 %
0 0 3
37.50%
1
12.50 %
0 4 4
BASTI 7 0.73 2.34 - - 6
85.71 %
1
14.29%
0 0 0 0 7 0
BIJNOR 6 0.10 1.54 0.50 0.50 5
83.33 %
0 0 1
16.67%
0 0 5 1
BUDAUN 4 - - 3.13 11.29 0 0 0 0 2
50.00 %
2
50.00%
0 4
BULANDSH
AHR
2 - - 1.51 2.01 0 0 0 1
50.00%
1
50.00 %
0 0 2

132
District
Name
No. of
Wells
Range of Fluctuation No. of Wells/Percentage Showing Fluctuation Total No. of Wells
Rise (m) Fall (m)
Rise (m) Fall (m) Rise Fall
Min Max Min Max 0 to 2 2 to 4 >4 0 to 2 2 to 4 >4
CHANDAULI 8 0.30 2.92 0.01 0.32 5
62.50 %
1
12.50%
0 2
25.00%
0 0 6 2
CHITRAKOO
T
8 0.11 2.81 1.88 1.88 5
62.50 %
2
25.00%
0 1
12.50%
0 0 7 1
DEORIA 9 0.19 2.11 0.99 0.99 6
66.67 %
2
22.22%
0 1
11.11%
0 0 8 1
ETAH 8 - - 0.15 2.57 0 0 0 6
75.00%
2
25.00 %
0 0 8
ETAWAH 7 0.19 1.70 0.43 4.79 4
57.14 %
0 0 1
14.29%
1
14.29 %
1
14.29%
4 3
FAIZABAD 11 0.60 4.06 - - 8
72.73 %
2
18.18%
1
9.09%
0 0 0 11 0
FARRUKHA
BAD
2 2.69 2.69 3.60 3.60 0 1
50.00%
0 0 1
50.00 %
0 1 1
FATEHPUR 11 0.18 6.08 0.24 3.20 1
9.09 %
2
18.18%
2
18.18%
5
45.45%
1
9.09 %
0 5 6
FIROZABAD 4 - - 1.70 4.89 0 0 0 1
25.00%
2
50.00 %
1
25.00%
0 4

133
District
Name
No. of
Wells
Range of Fluctuation No. of Wells/Percentage Showing Fluctuation Total No. of Wells
Rise (m) Fall (m)
Rise (m) Fall (m) Rise Fall
Min Max Min Max 0 to 2 2 to 4 >4 0 to 2 2 to 4 >4
GAUTAM
BUDDHA
NAGAR
3 - - 0.83 11.87 0 0 0 1
33.33%
0 2
66.67%
0 3
GHAZIABAD 5 - - 0.39 3.32 0 0 0 4
80.00%
1
20.00 %
0 0 5
GHAZIPUR 15 0.36 6.18 - - 9
60.00 %
3
20.00%
3
20.00%
0 0 0 15 0
GONDA 7 0.75 2.76 - - 4
57.14 %
3
42.86%
0 0 0 0 7 0
GORAKHPU
R
4 0.31 2.98 0.26 0.26 2
50.00 %
1
25.00%
0 1
25.00%
0 0 3 1
HAMIRPUR 6 0.26 5.47 0.10 0.10 3
50.00 %
1
16.67%
1
16.67%
1
16.67%
0 0 5 1
HARDOI 16 0.01 2.55 0.31 0.83 8
50.00 %
3
18.75%
0 5
31.25%
0 0 11 5
HATHRAS 3 0.71 1.57 2.68 2.68 2
66.67 %
0 0 0 1
33.33 %
0 2 1
JALAUN 27 0.17 1.75 0.28 4.02 17
62.96 %
0 0 7
25.93%
2
7.41 %
1
3.70%
17 10

134
District
Name
No. of
Wells
Range of Fluctuation No. of Wells/Percentage Showing Fluctuation Total No. of Wells
Rise (m) Fall (m)
Rise (m) Fall (m) Rise Fall
Min Max Min Max 0 to 2 2 to 4 >4 0 to 2 2 to 4 >4
JAUNPUR 22 0.28 5.30 0.35 10.91 10
45.45 %
6
27.27%
2
9.09%
3
13.64%
0 1
4.55%
18 4
JHANSI 16 0.19 2.38 0.87 5.92 10
62.50 %
2
12.50%
0 2
12.50%
1
6.25 %
1
6.25%
12 4
JYOTIBA
PHULE
NAGAR
7 0.11 0.11 0.84 4.40 1
14.29 %
0 0 1
14.29%
4
57.14 %
1
14.29%
1 6
KANNAUJ 4 0.16 0.16 0.84 4.22 1
25.00 %
0 0 2
50.00%
0 1
25.00%
1 3
KANPUR
DEHAT
7 0.59 2.56 1.43 1.43 5
71.43 %
1
14.29%
0 1
14.29%
0 0 6 1
KANPUR
NAGAR
13 0.26 1.93 0.11 0.11 12
92.31 %
0 0 1
7.69%
0 0 12 1
KAUSHAMB
I
8 0.91 4.50 - - 2
25.00 %
5
62.50%
1
12.50%
0 0 0 8 0
KHERI 7 0.47 2.12 0.01 0.75 4
57.14 %
1
14.29%
0 2
28.57%
0 0 5 2
KUSHINAGA
R
5 0.21 0.26 1.04 2.29 3
60.00 %
0 0 1
20.00%
1
20.00 %
0 3 2

135
District
Name
No. of
Wells
Range of Fluctuation No. of Wells/Percentage Showing Fluctuation Total No. of Wells
Rise (m) Fall (m)
Rise (m) Fall (m) Rise Fall
Min Max Min Max 0 to 2 2 to 4 >4 0 to 2 2 to 4 >4
LALITPUR 15 0.15 2.45 1.14 1.14 12
80.00 %
2
13.33%
0 1
6.67%
0 0 14 1
LUCKNOW 15 0.08 3.70 0.31 7.79 7
46.67 %
2
13.33%
0 3
20.00%
1
6.67 %
2
13.33%
9 6
MAHOBA 9 0.22 1.87 0.09 2.27 3
33.33 %
0 0 4
44.44%
2
22.22 %
0 3 6
MAHRAJGA
NJ
6 0.54 0.58 0.06 2.46 2
33.33 %
0 0 3
50.00%
1
16.67 %
0 2 4
MAINPURI 5 0.15 0.15 0.26 1.36 1
20.00 %
0 0 4
80.00%
0 0 1 4
MATHURA 14 0.25 1.61 0.07 1.50 11
78.57 %
0 0 3
21.43%
0 0 11 3
MAU 7 0.91 3.45 - - 2
28.57 %
5
71.43%
0 0 0 0 7 0
MEERUT 10 1.02 3.45 0.06 4.41 2
20.00 %
1
10.00%
0 6
60.00%
0 1
10.00%
3 7
MIRZAPUR 9 0.62 6.00 0.02 2.17 4
44.44 %
2
22.22%
1
11.11%
1
11.11%
1
11.11 %
0 7 2

136
District
Name
No. of
Wells
Range of Fluctuation No. of Wells/Percentage Showing Fluctuation Total No. of Wells
Rise (m) Fall (m)
Rise (m) Fall (m) Rise Fall
Min Max Min Max 0 to 2 2 to 4 >4 0 to 2 2 to 4 >4
MORADABA
D
7 0.98 1.69 2.15 4.77 3
42.86 %
0 0 0 3
42.86 %
1
14.29%
3 4
MUZAFFAR
NAGAR
5 0.06 10.56 1.46 1.46 2
40.00 %
1
20.00%
1
20.00%
1
20.00%
0 0 4 1
PILIBHIT 11 0.29 2.21 - - 10
90.91 %
1
9.09%
0 0 0 0 11 0
PRATAPGAR
H
25 0.27 4.28 - - 11
44.00 %
13
52.00%
1
4.00%
0 0 0 25 0
RAE BARELI 26 0.01 1.87 0.06 3.67 20
76.92 %
0 0 5
19.23%
1
3.85 %
0 20 6
RAMPUR 3 2.08 2.08 0.64 0.89 0 1
33.33%
0 2
66.67%
0 0 1 2
SAHARANP
UR
11 0.24 2.89 0.35 0.66 8
72.73 %
1
9.09%
0 2
18.18%
0 0 9 2
SANT KABIR
NAGAR
4 0.92 2.21 - - 3
75.00 %
1
25.00%
0 0 0 0 4 0
SANT
RAVIDAS
NAGAR
4 1.06 5.77 - - 1
25.00 %
1
25.00%
2
50.00%
0 0 0 4 0

137
District
Name
No. of
Wells
Range of Fluctuation No. of Wells/Percentage Showing Fluctuation Total No. of Wells
Rise (m) Fall (m)
Rise (m) Fall (m) Rise Fall
Min Max Min Max 0 to 2 2 to 4 >4 0 to 2 2 to 4 >4
SHAHJAHAN
PUR
1 0.06 0.06 - - 1
100.0 %
0 0 0 0 0 1 0
SHRAWASTI 11 0.57 1.62 - - 11
100.0 %
0 0 0 0 0 11 0
SIDDHARTH
NAGAR
10 0.32 1.30 - - 10
100.0 %
0 0 0 0 0 10 0
SITAPUR 19 0.05 2.16 0.12 1.73 10
52.63 %
1
5.26%
0 8
42.11%
0 0 11 8
SONBHADR
A
16 0.10 4.19 0.28 2.69 10
62.50 %
2
12.50%
1
6.25%
2
12.50%
1
6.25 %
0 13 3
SULTANPUR 33 0.09 3.86 0.01 1.02 19
57.58 %
10
30.30%
0 4
12.12%
0 0 29 4
UNNAO 15
0.10 1.71 0.28 0.84 13
86.67 %
0 0 2
13.33%
0 0 13 2
VARANASI 5
0.51 4.49 1.39 1.39 1
20.00 %
2
40.00%
1
20.00%
1
20.00%
0 0 4 1
Total 722 0.06 2.69 0.00 11.87 403 117 22 126 38 16 542 180

138
The fall of 0 - 2m in water levels are noticed in 126 wells (17.45%). Districts showing
major parts as decline of 0-2 m are Agra, Aligarh, Hathras, Etah, Kasganj, Etah,
Garrukhabad, Mainpuri, Kasganj, Jalaun, Jhansi, Mahoba, Lucknow, Sitapur jaunpur and
Raebareli. The fall of 2 - 4 m is observed in 38 wells (5.26%) mainly in Amroha, Sambhal,
Budaun, FirozabadMeerut, Ghaziabad, Agra, Firozabad, Hapur, Baghpat and Agra. Fall of >
4 m in water level is observed in 25 wells (2.2%) mainly in Sambhal, Baghpat, Ghaziabad,
Firozabad, Lucknow, Jhansi and Jaunpur.
Mean January (2012- 21) – January 2022:
Monitoring station for the month of January has been evaluated and compared with
water level data for January’2022. The wells have been categorized depending on rise and fall
in water levels and shown in Table-16 and map showing this fluctuation is shown in Plate-
XVII.
There is a rise in water level for 528 analyzed wells (70.58%) and 220 wells (29.41%)
showing fall. About 56.14% of analyzed wells (420) shows rise of 0 to 2 m in water levels.
This rise is observed mainly in south eastern parts of districts such as Amethi, Sultanpur,
Ambedkar Nagar, Sonbhadra, Chandauli, Varanasi, Jaunpur, Gahzipur, Fatehpur and
Hamirpur as well as Saharanpur, Shamli, Bijnour, Mathura. A rise of 2 to 4 m is noticed only
in 92 (12.29%) wells and rise of > 4 mbgl is observed only in 16 wells (2.13%)mainly
Shamli, Gonda, Fatehpur, Pratapgarh, Kaushambi, Jaunpur, Varanasi, Azamgarh, Gazipur
and Ballia.
A fall of 0 to 2 m is observed in 178 no. wells (about 23.79%) in major parts of the
districts in eastern, central and few districts of western U.P. Districts with major parts
showing decline of 0-2 m are Agra, Aligarh, Bareilly, Bijnor, Budaun, Bulandshar,
Chandauli, Etawah, Farrukhabad, Firozabad, G.B.Nagar, Ghaziabad, Hamirpur, Hardoi,
Hathras, Jalaun, Jhansi, Kanpur Dehat, Lucknow, Mainpuri, Mathura, Moradabad,
Sonbhadra and Unnao. Fall of 2 to 4 m is observed in 31 wells (5.29%) in parts of Amroha,
Sambhal, Budaun, Kannauj, Mainpuri, Ghaziabad, Kanpur Dehat, Lucknow, Mirzapur,
Sitapur, Sonbhadra, Unnao and Chandaulli districts. Fall of more than 4 m fall is encountered
in 11 wells (1.47%).

139
Plate-XVII
DECADAL FLUCTUATION 2021 – 22, U.P.
FLUCTUATI
ON RANGE
Mean
May (2011-20) to
May 21
Mean
August (2011-20) to
August 21
Mean
Nov(2011-20) to
November 21
Mean
Jan(2012-21) to
January 22
Rise (%) Fall (%) Rise (%) Fall (%) Rise (%) Fall (%) Rise (%) Fall (%)
0-2 258
(39.20%)
191
(29.02%)
307
(42.81%)
209
(29.14%)
403
(55.81%)
126
(17.45%)
420
(56.14%)
178
(23.79%)
2-4 100
(14.59%)
47
(6.86%)
86
(11.99%)
61
(8.50%)
117
(16.20%)
38
(5.26%)
92
(12.29%)
31
(4.14%)
>4 37
(5.40%)
25
(3.79%)
28
(3.90%)
26
(3.62%)
22
(3.04%)
16
(2.2%)
16
(2.13%)
11
(1.47%)
Total 395
(60%)
263
(39.96%)
421
(58.71%)
296
(41.28%)
542
(75.06%)
180
(24.93%)
528
(70.58%)
220
(29.41%)

140
Table -16
DISTRICT WISE – DECADAL WATER LEVEL FLUCTUATION, U.P.
Mean January (2012 – 2021) – January, 2022
District
Name
No. of
Wells
Range of Fluctuation No. of Wells/Percentage Showing Fluctuation Total No. of Wells
Rise (m) Fall (m)
Rise (m) Fall (m) Rise Fall
Min Max Min Max 0 to 2 2 to 4 >4 0 to 2 2 to 4 >4
AGRA 9
0.28 1.18 0.01 2.82 4
44.44 %
0 0 3
33.33%
2
22.22 %
0 4 5
ALIGARH 7 0.07 0.07 0.24 1.64 1
14.29 %
0 0 6
85.71%
0 0 1 6
ALLAHABA
D
32 0.03 8.35 0.06 3.07
21
65.63 %
5
15.63%
2
6.25%
3
9.38%
1
3.13 %
0 28 4
AMBEDKAR
NAGAR
7 0.83 2.66 - -
5
71.43 %
2
28.57%
0 0 0 0 7 0
AURAIYA 7
0.22 0.59 0.25 2.17 3
42.86 %
0 0 3
42.86%
1
14.29 %
0 3 4
AZAMGARH 19
0.23 3.55 0.85 0.85 10
52.63 %
8
42.11%
0 1
5.26%
0 0 18 1
BAGHPAT 2
3.20 3.20 0.02 0.02 0 1
50.00%
0 1
50.00%
0 0 1 1

141
BAHRAICH 11 0.33 0.69 0.01 0.69 7
63.64 %
0 0 4
36.36%
0 0 7 4
BALLIA 20 0.24 5.13 - - 17
85.00 %
1
5.00%
2
10.00%
0 0 0 20 0
BALRAMPU
R
17 0.32 2.29 - - 15
88.24 %
2
11.76%
0 0 0 0 17 0
BANDA 10 0.11 3.33 0.82 5.51 3
30.00 %
1
10.00%
0 4
40.00%
1
10.00 %
1
10.00%
4 6
BARABANKI 17 0.18 1.48 - - 17
100.0 %
0 0 0 0 0 17 0
BAREILLY 9 0.21 0.97 0.09 2.42 4
44.44 %
0 0 4
44.44%
1
11.11 %
0 4 5
BASTI 7 0.09 1.79 - - 7
100.0 %
0 0 0 0 0 7 0
BIJNOR 6 0.40 1.72 0.08 0.73 4
66.67 %
0 0 2
33.33%
0 0 4 2
BUDAUN 3 - - 3.23 9.79 0 0 0 0 2
66.67 %
1
33.33%
0 3

142
BULANDSH
AHR
3 - - 1.36 1.92 0 0 0 3
100.0 %
0 0 0 3
CHANDAULI 8 0.45 3.40 0.13 0.56 4
50.00 %
1
12.50%
0 3
37.50%
0 0 5 3
CHITRAKOO
T
7 0.20 2.34 1.39 1.39 4
57.14 %
2
28.57%
0 1
14.29%
0 0 6 1
DEORIA 9 0.07 1.77 0.08 0.08 8
88.89 %
0 0 1
11.11%
0 0 8 1
ETAH 7 - - 0.20 2.67 0 0 0 5
71.43%
2
28.57 %
0 0 7
ETAWAH 6 0.13 1.75 0.05 3.60 2
33.33 %
0 0 3
50.00%
1
16.67 %
0 2 4
FAIZABAD 10 0.45 2.79 - - 8
80.00 %
2
20.00%
0 0 0 0 10 0
FARRUKHA
BAD
2 2.84 2.84 2.68 2.68 0 1
50.00%
0 0 1
50.00 %
0 1 1
FATEHPUR 8 0.36 4.19 0.12 1.55 2
25.00 %
0 1
12.50%
5
62.50%
0 0 3 5

143
FIROZABAD 4 - - 1.37 3.66 0 0 0 2
50.00%
2
50.00 %
0 0 4
GAUTAM
BUDDHA
NAGAR
4 2.70 2.70 0.14 11.60 0 1
25.00%
0 1
25.00%
0 2
50.00%
1 3
GHAZIABAD 7 1.69 1.69 0.02 2.48 1
14.29 %
0 0 5
71.43%
1
14.29 %
0 1 6
GHAZIPUR 17 0.30 6.58 0.34 2.22 9
52.94 %
4
23.53%
1
5.88%
2
11.76%
1
5.88 %
0 14 3
GONDA 7 0.44 2.91 - - 5
71.43 %
2
28.57%
0 0 0 0 7 0
GORAKHPU
R
4 0.88 1.69 0.00 0.00 3
75.00 %
0 0 1
25.00%
0 0 3 1
HAMIRPUR 7 0.50 4.46 0.53 2.00 2
28.57 %
1
14.29%
1
14.29%
2
28.57%
1
14.29 %
0 4 3
HARDOI 17 0.22 2.83 0.18 0.80 9
52.94 %
2
11.76%
0 6
35.29%
0 0 11 6
HATHRAS 4 0.23 0.98 0.23 2.27 2
50.00 %
0 0 1
25.00%
1
25.00 %
0 2 2

144
JALAUN 27 0.10 2.12 0.08 4.52 7
25.93 %
1
3.70%
0 15
55.56%
3
11.11 %
1
3.70%
8 19
JAUNPUR 26 0.30 4.24 0.11 0.31 15
57.69 %
6
23.08%
3
11.54%
2
7.69%
0 0 24 2
JHANSI 16 0.21 1.91 0.09 1.65 10
62.50 %
0 0 6
37.50%
0 0 10 6
JYOTIBA
PHULE
NAGAR
7 0.57 0.57 1.05 4.48 1
14.29 %
0 0 2
28.57%
3
42.86 %
1
14.29%
1 6
KANNAUJ 4 0.58 0.58 1.04 5.14 1
25.00 %
0 0 2
50.00%
0 1
25.00%
1 3
KANPUR
DEHAT
7 0.96 1.56 0.57 2.39 5
71.43 %
0 0 1
14.29%
1
14.29 %
0 5 2
KANPUR
NAGAR
13 0.02 1.98 0.10 0.10 12
92.31 %
0 0 1
7.69%
0 0 12 1
KAUSHAMB
I
9 0.86 3.98 1.43 1.63 2
22.22 %
5
55.56%
0 2
22.22%
0 0 7 2
KHERI 6 0.18 1.39 0.24 0.24 5
83.33 %
0 0 1
16.67%
0 0 5 1

145
KUSHINAGA
R
5 0.04 0.59 0.27 0.48 3
60.00 %
0 0 2
40.00%
0 0 3 2
LALITPUR 16 0.08 2.82 0.04 1.90 8
50.00 %
2
12.50%
0 6
37.50%
0 0 10 6
LUCKNOW 18 0.05 2.79 0.07 7.44 6
33.33 %
3
16.67%
0 7
38.89%
0 2
11.11%
9 9
MAHOBA 7 0.14 0.14 0.11 4.73 1
14.29 %
0 0 5
71.43%
0 1
14.29%
1 6
MAHRAJGA
NJ
6 0.51 0.78 0.03 0.68 3
50.00 %
0 0 3
50.00%
0 0 3 3
MAINPURI 5 - - 0.12 1.18 0 0 0 5
100.0 %
0 0 0 5
MATHURA 14 0.16 1.75 1.32 1.32 13
92.86 %
0 0 1
7.14%
0 0 13 1
MAU 8 0.34 2.24 - - 7
87.50 %
1
12.50%
0 0 0 0 8 0
MEERUT 10 0.14 3.36 0.42 1.94 2
20.00 %
2
20.00%
0 6
60.00%
0 0 4 6

146
MIRZAPUR 10 0.11 3.19 0.02 1.04 4
40.00 %
3
30.00%
0 3
30.00%
0 0 7 3
MORADABA
D
7 0.47 1.24 0.55 4.08 3
42.86 %
0 0 1
14.29%
2
28.57 %
1
14.29%
3 4
MUZAFFAR
NAGAR
10 0.26 5.22 0.32 0.39 4
40.00 %
2
20.00%
1
10.00%
3
30.00%
0 0 7 3
PILIBHIT 11 0.19 1.62 - - 11
100.0 %
0 0 0 0 0 11 0
PRATAPGAR
H
24 0.39 3.76 0.29 0.29 9
37.50 %
14
58.33%
0 1
4.17%
0 0 23 1
RAE BARELI 23 0.11 2.04 0.01 1.76 18
78.26 %
1
4.35%
0 4
17.39%
0 0 19 4
RAMPUR 3 2.88 2.88 0.58 1.36 0 1
33.33%
0 2
66.67%
0 0 1 2
SAHARANP
UR
10 0.06 1.92 2.01 2.01 9
90.00 %
0 0 0 1
10.00 %
0 9 1
SANT KABIR
NAGAR
4 0.98 2.40 - - 3
75.00 %
1
25.00%
0 0 0 0 4 0

147
SANT
RAVIDAS
NAGAR
4 0.69 5.11 - - 2
50.00 %
0 2
50.00%
0 0 0 4 0
SHAHJAHAN
PUR
1 0.06 0.06 - - 1
100.0 %
0 0 0 0 0 1 0
SHRAWASTI 11 0.49 1.37 - - 11
100.0 %
0 0 0 0 0 11 0
SIDDHARTH
NAGAR
10 0.47 1.37 - - 10
100.0 %
0 0 0 0 0 10 0
SITAPUR 19 0.31 1.59 0.00 1.32 8
42.11 %
0 0 11
57.89%
0 0 8 11
SONBHADR
A
17 - 2.46 0.02 2.32 8
47.06 %
2
11.76%
0 6
35.29%
1
5.88 %
0 10 7
SULTANPUR 34 0.12 3.56 0.23 0.23 25
73.53 %
8
23.53%
0 1
2.94%
0 0 33 1
UNNAO 25
0.09 2.33 0.08 2.61 15
60.00 %
1
4.00%
0 7
28.00%
2
8.00 %
0 16 9
VARANASI 7
1.49 8.15 - - 1
14.29 %
3
42.86%
3
42.86%
0 0 0 7 0
Total 748 0.06 3.20 11.60 420 92 16 178 31 11 528 220

148
From the analysis of table, it is evident that the water level has shown a maximum rise
in Nov 21 and Jan 22 as compare to May and August 21. The fall percentage decreases in
November 21 and January 22. The changes in water level with respect to mean were confined to
a magnitude of 0-2 m. The rise/fall of higher magnitude was limited and isolated in nature.
WATER LEVEL TREND
The seasonal, annual and decadal fluctuation gives an idea of the behavior of the
water level but is subjected to many anomalous factors which give a short term picture. To
have a true picture where highs and lows are balanced out, the long term trend for ten years
2012 to 2021 has been worked out and analysed on the basis of DWL data of Ground Water
Monitoring Wells. The pre monsoon, post monsoon and annual trend for the said period is
given in Annexure-II and Plate XVIII and XIX respectively.
The results of water level trend data during Pre-monsoon for the period 2012-2021 are
summarized as follows:
Percentage of wells showing Pre-monsoon DWL Trend (cm/year) from 2012 -2021
Total
Well
Analyzed
Rise (cm/year) Fall (cm/Year) Total
0 -20 20-40 >40 0 -20 20 -40 >40 Rise Fall
834 185
(22.18%)
64
(7.67%)
29
(5.87%)
213
(25.53%)
85
(10.19%)
95
(11.39%)
278
(33.33%)
556
(66.66%)
The declining trend is observed in 66.66 % of the monitoring wells (556) covering
over 10 year’s period. Decline of 0 – 20 cm/yr is commonly observed in 25.53% wells
followed by 20 – 40 cm/yr in 10.19% wells and >40 cm/yr in 11.39%. The low decline is
spread all over the state but dominant in north and south western parts of the state. Higher
decline occurs in Shamli, Muzaffarnagar, Baghpat, Meerut, Ghaziabad, Hapur, Amroha,
G.B.Nagar, Sambhal, Etah, Firozabad, Auriya, Unnao, Kanpur Nagar, Kanpur Dehat,
Hamirpur, Lucknow, and Sitapur. There is a rising trend observed in 278 wells (33.33%), out
of which 22.18 % and 7.67% of analysed wells shows rising trend in the range of 0-
20cm/year and 20-40cm/year respectively and very few wells of 5.87% shows rising trend of
more than 40cm/year. The rise in wells are mostly located in North and South Eastern parts
of the State.

149
The results of Water Level trend data during Post-monsoon for the period 2012-2021
are summarized as follows:
Percentage of wells showing Post-monsoon DWL Trend (cm/year) from 2012 -2021
Total
Well
Analysed
Rise (cm/year) Fall (cm/Year) Total
0 -20 20-40 >40 0 -20 20 -40 >40 Rise Fall
836 338
(40.43%)
61
(7.29%)
46
(5.5%)
200
(23.92%)
87
(10.40%)
104
(12.44%
)
445
(53.22%)
391
(46.77%)
There is a declining trend in 46.77% of the monitoring wells over 10 years period.
Decline of 0 – 20 cm/yr is mostly observed in 23.93% (200) wells followed by 20 – 40 cm/yr
in 10.40% wells and more than 40 cm/yr is found in 12.44% wells. The low decline is spread
in North and South Western parts of the state. There is a rise in trend in 53.22% of the
monitoring wells over 10 years period. Rise of 0 – 20cm/year is found in 40.43% followed by
20-40cm/year in 7.29% and very few wells of 5.5% showing water level trend of more than
40cm/year. Plate-XVIII

150
Plate-XIX

151
Chapter 7
CHEMICAL QUALITY OF GROUND WATER OF U.P.
INTRODUCTION
Groundwater is the most important source of fresh water on the earth surface. Now a day, due
to pollution in environment, surface water can’t be used directly for drinking purpose.
Groundwater has become the only reliable resource for drinking purpose. Due to increasing
population and industrialisation greater amounts of domestic and industrial effluents are
discharged that lead to pollution of ground water. To meet the requirement of fresh water, the
dependency on ground water is increasing in comparison to surface water because during
summer season most of the surface water bodies do not have sufficient water, while ground
water is easily accessible throughout the year. Human activities are the main important factor
which effect ground water quality of any region.
Water has two dimensions that are closely linked-quantity and quality. Water quality is
commonly defined by its physical, chemical biological and aesthetic characteristics. Human
life can be seriously affected by water. The quality of groundwater reflects inputs from the
atmosphere, from soil and water rock reactions-weathering as well as from pollutant sources
such as land clearance, agriculture, acid precipitation, domestic and industrial wastes. The
relatively slow movement of water through the ground means that residence times in ground
waters are generally longer than in surface waters. It is also dependent on the solubility of the
minerals present in the rocks. To some extent the atmospheric precipitation (rain water) is
also contributory factor for affecting the quality of ground water as during the rain fall most
of the gases such as CO2, SO2 and NO2 present in the atmosphere gets dissolved in the rain
water during the course of downward travel and percolate down through the earth surface
dissolving mainly calcium and magnesium present in the soil forming calcium bicarbonate.
The pH plays an important role in the geochemical reactions as low pH tends to help faster
dissolution of the minerals. The quality of ground water is also influenced by the excessive
use of fertilizers and pesticides for agricultural production and also industrial activity.
Ground water due to its long standing with minerals and rocks is generally more mineralized
than surface water. This was found to be confirmed largely for water in phreatic zones. The
chemical quality of ground water in phreatic zones is also affected by anthropogenic sources
at the ground surface, whether it is domestic, agriculture or industrial in nature.

152
METHODOLOGY
To evaluate the chemical quality of ground water in phreatic zones, 841 water samples were
collected from Ground Water Monitoring Stations (GWMS) established by CGWB, Lucknow
during the Pre monsoon period. (A.A.P. 2020-21). Out of 841 samples, one sample was found
leaked and no data is generated, 840 samples were analysed. Generally, the monitoring
stations are Hand pumps- IM-II tapping phreatic aquifer. All the samples were analysed for
the determination of pH, EC, CO3, HCO3, Cl, F, NO3, SO4, PO4, SiO2, TH, Ca, Mg, Na & K.
These water samples were analysed as per standard methods (APHA 2005) at NABL
accredited Regional Chemical Laboratory of CGWB, Lucknow. Following standard methods
(Table-17) have been adopted for the chemical analysis of different constituents in water
samples.
TABLE -17: Method used for Chemical Analysis of Ground Water Samples
Sl. No. Constituents Method Used
1. pH pH Meter
2. EC EC Meter
3. Carbonate Titrimetric method (Acid- base titration)
4. Bi-carbonate Titrimetric method (Acid- base titration)
5. Chloride Mohr’s method
6. Fluoride Spectrophotometric method (ECR-Method)
7. Nitrate UV- Spectrophotometric Screening method
8. Sulphate USGS- Gelatine Spectrophotometric method
9. Phosphate Ascorbic Acid method
10. Silica Molybdosilicate method
11. Total Hardness EDTA (Titrimetric method)
12. Calcium EDTA (Titrimetric method)
13. Magnesium Evaluation from TH and Ca
14. Sodium Flame Emission Photometric method
15. Potassium Flame Emission Photometric method
The chemical analysis results for 840 nos. of water samples collected from GW monitoring
Stations spread in entire Uttar Pradesh have been tabulated in Annexure 3.

153
CHEMICAL QUALITY OF GROUND WATER IN UTTAR PRADESH
The chemical quality of ground water depends on various factors like source of water
such as rainfall, erosion, dry fall out, weathering of rocks and as a result of chemical
reactions taking place on and below the surface. Thus, the chemical quality of water is
dependent on geological and hydro geological conditions prevailing in the area, climate, and
topography, nature of soil, physicochemical characteristics of rocks, nature of plantation and
finally the activities of man resulting in environmental pollution. Therefore, it becomes
necessary to assess the suitability of ground water for drinking and irrigation purpose before
corrective measures are undertaken.
SUITABILITY OF GROUND WATER FOR POTABLE PURPOSES
The suitability of ground water for drinking purposes has been assessed according to
the guidelines laid down by BIS (2012) for various analysed parameters. The minimum,
maximum, average and standard deviation values of various constituents determined during
chemical analysis have been summarized in following Table-18.
TABLE -18: Hydro-Chemical Data of Ground Water in Uttar Pradesh (an overview)
S. No. Constituents Minimum Maximum Average
1 pH 7.14 8.81 7.99
2 EC µS/cm at 25 ºC 234 37230 875
3 CO3 mg/l 0 84 3
4 HCO3 mg/l 49 1257 312
5 Cl mg/l 7 9018 77
6 F mg/l 0 6.8 1
7 NO3 mg/l 0 1177 15
8 SO4 mg/l 0 5600 51
9 PO4 mg/l 0 0.65 0.002
10 TH (as CaCO3) mg/l 15 4620 267
11 Ca mg/l 4 548 38
12 Mg mg/l 0 780 38
13 Na mg/l 0 6763 91
14 K mg/l 0 165 6
15 SiO2 mg/l 3 68 28

154
Hydrogen Ion Concentration (pH):
The pH value of ground water in the state of U.P. varies from 7.14 to 8.81 and is
generally well within the permissible limit and the water is slightly alkaline in nature. The
average pH value has been found to be 7.99.
Carbonate & Bicarbonate (CO3 & HCO3):
The Carbonate concentration has been observed to be nil in most of the cases however
it has been found upto 84 mg/l with an average value of 3mg/l & Bicarbonate concentration
has been observed in the range of 49 to 1257 mg/l with an average value of 312 mg/l.
Electrical Conductivity (EC):
The Electrical Conductivity is a reflection of the concentration of various chemical
constituents in ground water and gives the overall quality of ground water for its various uses
like drinking, irrigation and other purposes. In the state of Uttar-Pradesh, E.C. value varied
from 234 to 37230 µSiemens/cm at 25ºC with an average value of 875 µSiemens/cm at 25ºC.
The E.C. value was observed in the range of 0-500 in 256 samples, 501-2000 in 542 samples
and >2000 in 42 samples. In 30.48% of samples E.C. ranges between 0 to 500 µS/cm,
64.52% of samples E.C. ranges between 501 to 2000 µS/cm whereas 5% samples are found
to have E.C. value more than 2000 µS/cm at 25ºC. The highest value of E.C. 37230 µS/cm at
25ºC was observed in ground water from Nandgaon (Mathura district). The frequency
distribution is shown in the following Table-19 Fig 1.depicts the range of Electrical
Conductivity in shallow ground water of U.P
TABLE -19 Frequency distribution of Electrical Conductivity (BIS- 2012)
EC ranges in µS/cm at 25ºC 0-500 501-2000 >2000
No. of samples 256 542 42
% 30.48 64.52 5.00

155
Plate: XX
Fig 1. Depicts the range of Electrical Conductivity in shallow ground water of U.P
0
100
200
300
400
500
600
0-500 501-2000 >2000
No
of
Sam
ple
s
EC ranges in µS/cm at 25°C
Fig. 1 EC Range in shallow ground water of U.P. (2021)

156
The various blocks exhibiting high values of E.C. (>2000 µS/cm at 25°C) are tabulated in
following Table-20.
TABLE -20: The blocks exhibiting high values of E.C. (>2000 µS/cm at 25°C µS/cm)
Sl. No. District Block EC µS/cm at 25°C
1 Unnao Nawabganj 2003
2 Ferrukabad Shamsabad 2007
3 Meerut Sardhana 2016
4 Pratapgarh Sangaipur 2029
5 Mahamaya Nagar Sasni 2062
6 Ferrukabad Mohammadabad 2091
7 Firozabad Khairagarh/ Hathwant 2103
8 Mathura Baldeo 2110
9 Sultanpur Jagdishpur 2147
10 Agra Jagner 2192
11 Mathura Farah 2259
12 Gonda Katra Bazar H.Q. 2281
13 Mahamaya Nagar Hathras 2286
14 Jhansi Gursarai 2300
15 Hamirpur Sareela 2330
16 Mainpuri Kishni 2488
17 Agra Fatehpur Sikri 2509
18 Raibareli Lalganj 2517
19 Etah Sheetalpur 2621
20 Mathura Chhata 2650
21 Hamirpur Rath 2735
22 Basti Rudauli H.Q. 2840
23 Agra Fatehabad 2856
24 Kaushambi Kara 2907
25 Agra Bichpuri 2946
26 Aligarh Khair 3188
27 Agra Khandauli 3226
28 Mathura Manth 3298
29 Unnao Asoha 3303
30 Firozabad Narkhi 3321
31 Mahamaya Nagar Sadabad 3360
32 Aligarh Gonda 3790
33 Mathura Goverdhan 3957
34 Mahamaya Nagar Mursan 4296
35 Mathura Chaumuhan 4819
36 Mathura Raya 4946

157
37 Agra Etmadpur 4955
38 Agra Kheragarh 6507
39 Agra Akola 8194
40 Mathura Naujhil 8349
41 Agra Achhnera 9048
42 Mathura Nandgaon 37230
Total Dissolved Solids (TDS):
The total load of dissolved solids in water is determined theoretically by taking into account
the EC of that particular water body.
Thus,
TDS cal = EC * 0.65 mg/l where EC is in µS/cm at 25º C
TDS is responsible for the mineralization of water and gives its degree of salinity. The
perusal of the analysis data of U.P. shows that the ground water is fresh in most of the
samples analysed. TDS of total 769 no. of samples found in range of 0-1000 mg/l, 63 no. of
samples found in range of 1001-3000 mg/l, 4 no. of samples found in range of 3001-5000 and
4 no. of samples found more than 5000 mg/l which are tabulated in Table-21.
Table -21 Frequency Distribution of T.D.S. in NH Stations of U.P.
Salinity as per T.D.S range in mg/l No. of Samples Percentage
Fresh, non-saline (0-1000) 769 91.55
Slightly saline (1001-3000 ) 63 7.5
Moderately saline (3001-5000 ) 4 0.48
Highly saline (>5000 ) 4 0.48

158
Figure-2 Depicts the T.D.S. range in shallow ground water of U.P.
Chloride (Cl):
The chemical data reveals that concentration of chloride ion ranges from 7.0 to 9018 mg/l in
Nandgaon old Aganwadi, block Nandgaon, district Mathura with an average value of 77
mg/l. From Table-22, it reveals that 99.52% water samples fall within the acceptable limit
prescribed by BIS (2012) and only 0.48% samples exhibit Chloride values > 1000 mg/l.
TABLE-22: Frequency distribution of Chloride (2020-21)
Range of Chloride in
mg/l 0-250 251-1000 >1000
No. of samples 804 32 4
% 95.71 3.81 0.48
0
100
200
300
400
500
600
700
800
900
0-1000 1001-3000 3001-5000 >5000
No
of
Sam
ple
s
TDS range in mg/l
Fig. 2 TDS range in shallow ground water of U.P. (2021)

159
Plate: XXI
Fig. 3 Depicts the range of Chloride in shallow ground water of U.P.
0
100
200
300
400
500
600
700
800
900
0-250 251-1000 >1000
No
of
Sam
ple
s
Chloride range in mg/l
Fig. 3- Chloride Range in shallow ground water of U.P.
(2021)

160
The various blocks exhibiting high values of Cl (>1000 mg/l) are tabulated in following table
23 below-
TABLE-23: Blocks exhibiting high values of Cl (>1000 mg/l)
Sl. No. District Block Cl (mg/l)
1 Mathura Nandgaon 9018
2 Agra Achhnera 1917
3 Agra Akola 1704
4 Agra Kheragarh 1299
Nitrate (NO3):
The concentration of Nitrate has been found varying widely. It ranges between not
detectable to 1177 mg/l with an average value of 15 mg/l. Total 91.55% of water samples
fall within the permissible limit of 45 mg/l (BIS 2012) and 8.45% samples have higher level
of Nitrate concentration with the highest value 1177 mg/l recorded at Naujhil, block Naujhil,
district Mathura. High Nitrate is found all over the state and does not follow any definite
pattern of distribution. The distribution of samples in different concentration ranges are given
in Table-24.
TABLE-24 Frequency Distribution of Nitrate
Range of Nitrate in mg/l 0-45 > 45
No. of Samples 769 71
% 91.55 8.45

161
Fig. 4 Depicts the nitrate range in shallow ground water of U.P.
The various blocks exhibiting high values of nitrate concentration (>45 mg/l) are tabulated in
following Table25:
TABLE -25 Blocks associated with high values of nitrate (>45 mg/l) (2020-21)
Sl. No. District Block NO3
1 Varanasi Kashi Vidya Peeth 46
2 Prayagraj Meja 46
3 Agra Shamsabad 47
4 Ghazipur Saidpur 47
5 Lucknow Chinhat 48
6 Kanpur Dehat Sandalpur 48
7 Gonda Tarabganj H.Q. 49
8 Budaun Usawan 52
9 Banda Baberu 52
10 Bulandshahr Unchagaon 52
11 Budaun Gunnaur 53
12 Muzaffarnagar Charthawal 54
13 Ferrukabad Mohammadabad 55
0
100
200
300
400
500
600
700
800
900
0-45 >45
No
of
Sam
ple
s
Nitrate range in mg/l
Fig. 4 Nitrate Range in shallow ground water of U.P. 2021

162
Sl. No. District Block NO3
14 Muzaffarnagar Budhana 57
15 Moradabad Baniakhera 57
16 Jaunpur Jaunpur H.Q. 59
17 Mathura Nandgaon 59
18 Kasganj Sidhpura 60
19 Meerut Hastinapur 60
20 Kanpur Dehat Amraudha 61
21 Jalaun Konch 63
22 Sultanpur Amethi 64
23 Kanpur Nagar Shivrajpur 65
24 Kanpur Dehat Derapur 65
25 Fatehpur Dhata 65
26 Kasganj Soron 65
27 Hardoi Sandila 66
28 Budaun Salarpur 68
29 Etah Sheetalpur 68
30 Unnao Safipur 69
31 Jalaun Dakore 70
32 Sultanpur Musafir Khana 71
33 Meerut Meerut 71
34 Firozabad Narkhi 73
35 Saharanpur Nakur 73
36 Mathura Chaumuhan 74
37 Mahamaya Nagar Hasayan 76
38 J.P. Nagar Hasanpur 77
39 Ghazipur Jamania 81
40 Baghpat Baraut 85

163
Sl. No. District Block NO3
41 J.P. Nagar Gajraula 86
42 Saharanpur Sadauli Qudim 89
43 Aligarh Khair 92
44 Mahamaya Nagar Sahpau 92
45 Mirzapur Narainpur 94
46 Mahamaya Nagar Sasni 94
47 Prayagraj Manda 96
48 Meerut Sardhana 97
49 Mathura Baldeo 98
50 Mirzapur Pahari 102
51 Auraiya Auraiya 103
52 Gautam Buddha Nagar Jewar 104
53 Ferrukabad Kamalganj 108
54 Agra Bah 108
55 Budaun Ujhani 109
56 Mahoba Jaitpur 110
57 Agra Khandauli 111
58 Firozabad Khairagarh/ Hathwant 112
59 Mahoba Kabrai 130
60 Sultanpur Jagdishpur 134
61 Sonbhadra Chopan 134
62 Mirzapur Mirzapur H.Q. 134
63 Sonbhadra Babhani 163
64 Mahamaya Nagar Hathras 184
65 Ferrukabad Shamsabad 201
66 Aligarh Akrabad 217
67 Banda Barokhar 280

164
Sl. No. District Block NO3
68 Kaushambi Kara 361
69 Hamirpur Rath 410
70 Kaushambi Moorat Ganj 476
71 Mathura Naujhil 1177
Fluoride (F):
Small quantities of Fluoride are beneficial in reducing tooth decay, whereas excess
concentration (>1.5 mg/l) is harmful causing staining of tooth enamel and Fluorosis. The
value of Fluoride concentration is found to range between 0 to 6.8 mg/l with an average value
of 1mg/l. Total 95.95% samples falling within the permissible limit prescribed by BIS (2012).
The highest value of 6.8 mg/l has been recorded in block Palhana of Azamgarh district. The
distribution of samples in different Fluoride ranges has been tabulated in Table-26.
TABLE -26 Frequency Distribution of Fluoride
Range of Fluoride in mg/l 0-1.0 1.0-1.5 >1.5
No. of Samples 741 65 34
% 88.21 7.74 4.05

165
Plate: XXII
Figure-5 Depicts the Fluoride range in shallow ground water of U.P.
0
100
200
300
400
500
600
700
800
0-1 1-1.5 >1.5
No
of
Sam
ple
s
Fluoride range in mg/l
Fig. 5 Fluoride Range in shallow ground water of U.P.

166
The various Blocks exhibiting high values of Fluoride concentration (>1.5 mg/l) are tabulated
in Table-27.
TABLE -27 Blocks associated with high values of Fluoride (>1.5 mg/l) (2020-21)
Sl. No. District Block F (mg/l)
1 Agra Fatehabad 1.6
2 Mainpuri Kishni 1.6
3 Hamirpur Gohand 1.6
4 Hamirpur Maudaha 1.6
5 Hamirpur Muskara 1.6
6 Hamirpur Kurara 1.6
7 Mahoba Charkhari 1.7
8 Mainpuri Kishni 1.7
9 Mathura Manth 1.7
10 Auraiya Achhalda 1.8
11 Jaunpur RamNagar 1.8
12 Jaunpur Rampur 1.8
13 Kanpur Nagar Kakwan 1.9
14 Aligarh Tappal 1.9
15 Agra Etmadpur 2.0
16 Mainpuri Kishni 2.0
17 Fatehpur Hathgaon 2.0
18 Fatehpur Vijayeepur 2.0
19 Jaunpur Machhali Shahar 2.1
20 Ferrukabad Rajepur 2.1
21 Fatehpur Teliyani 2.2
22 Gautam Buddha Nagar Dankaur 2.3
23 Hamirpur Sareela 2.4
24 Agra Jagner 2.5
25 Ferrukabad Rajepur 2.6

167
Sl. No. District Block F (mg/l)
26 Ferrukabad Rajepur 3.0
27 Fatehpur Malwan 3.2
28 Firozabad Tundla 3.2
29 Mathura Farah 3.3
30 Mathura Baldeo 3.5
31 Mathura Goverdhan 4.3
32 Ghazipur Jakhaniya 5.3
33 Ghazipur Deokali 6.4
34 Azamgarh Palhana 6.8
Total Hardness (TH):
The concentration of Total Hardness has been found to vary widely It ranges between 15 to
4620 mg/l with an average value of 267 mg/l. Total 96.19% of water samples falling within
the permissible limit of 600 mg/l (BIS- 2012) and 3.81% samples have higher value of Total
Hardness concentration with the highest value 4620 mg/l recorded at Nandgaon old
Aganwadi, block Nandgaon, district Mathura. The distribution of samples in different
concentration ranges are given in table-28.
TABLE -28 Frequency Distribution of Total Hardness (2021-22)
Range of T.H. in mg/l 0-200 >200-600 >600
No. of Samples 366 442 32
% 43.57 52.62 3.81

168
Figure 6- Depicts the TH range in shallow ground water of U.P.
The various Blocks exhibiting high values of TH concentration (>600 mg/l) are tabulated in
table-29.
TABLE -29 Blocks exhibiting high values of Total Hardness (>600 mg/l)
Sl. No. District Block Hardness as CaCO3
1 Mathura Chhata 620
2 Ferrukabad Shamsabad 630
3 Jalaun Dakore 630
4 Agra Bichpuri 640
5 Meerut Sardhana 655
6 Barabanki Dewa 672
7 Agra Khandauli 680
8 Barabanki Haidergarh 687
9 Jhansi Gursarai 700
10 Ferrukabad Mohammadabad 720
11 Lalitpur Maadawara 730
12 Kaushambi Moorat Ganj 740
13 Barabanki Rudauli 750
14 Mathura Chaumuhan 760
15 Barabanki Banki 788
0
50
100
150
200
250
300
350
400
450
500
0-200 201-600 >600
No
of
Sam
ple
s
Total Hardness range in mg/l
Fig. 6 Total Hardness Range in shallow ground water of U.P. 2021

169
Sl. No. District Block Hardness as CaCO3
16 Jhansi Bangra 790
17 Mathura Raya 790
18 Kanpur Nagar Shivrajpur 850
19 Firozabad Khairagarh/ Hathwant 910
20 Raibareli Lalganj 1005
21 Kaushambi Kara 1020
22 Barabanki Siddharthnagar 1153
23 Barabanki Sirauli Gauspur 1221
24 Barabanki Masauli 1432
25 Barabanki Fatehpur 1600
26 Agra Akola 1650
27 Mathura Naujhil 1780
28 Agra Kheragarh 1880
29 Barabanki Ramnagar 1936
30 Barabanki Suratganj 2050
31 Agra Achhnera 2350
32 Mathura Nandgaon 4620
Calcium (Ca):
The concentration of Calcium has been found varying widely. It ranges between 4 mg/l to
548 mg/l with an average value of 38 mg/l. Total 94.17% of water samples falling within the
acceptable limit of 75 mg/l (BIS- 2012) and 5.36% samples have higher level of calcium
concentration but within permissible limit of 200 mg/l. Only 0.48% water samples exhibited
calcium values >200 mg/l with a maximum value of 548 mg/l recorded at Nandgaon old
Aganwadi, block Nandgaon, district Mathura. The distribution of samples in different
concentration ranges are given in Table-30.
TABLE -30 Frequency Distribution of Calcium
Range of Calcium in mg/l 0-75 75-200 >200
No. of Samples 791 45 4
% 94.17 5.36 0.48

170
Figure-7 Depicts the Calcium range in shallow ground water of U.P.
The various Blocks exhibiting high values of Calcium concentration (>200 mg/l) are
tabulated in Table 31.
TABLE -31 Blocks exhibiting high values of Calcium (>200 mg/l)
Sl. No. District Block Ca Hardness (mg/l)
1 Jhansi Bangra 244
2 Agra Kheragarh 264
3 Agra Achhnera 348
4 Mathura Nandgaon 548
Magnesium (Mg) :
The main sources of magnesium in ground water are (i) rain water (ii) evaporate deposits &
(iii) weathering of magnesium silicate minerals. The source of magnesium in igneous rocks is
olivine, pyroxenes, amphiboles, dark coloured micas etc. Among the sedimentary rocks, the
sources are chlorite, serpentine biotite, amphiboles, staurolite etc. Mg is one of the
constituents responsible for hardness of water. The lower concentration of Mg is not harmful
but higher concentration is laxative. The concentration of Magnesium has been found varying
widely. It ranges between 0 to 780 mg/l with an average value of 38 mg/l. Total 44.76% of
0
100
200
300
400
500
600
700
800
900
0-75 75-200 >200
No
of
Sam
ple
s
Calcium range in mg/l
Fig. 7 Calcium Range in shallow ground water of U.P. 2021

171
water samples falling within the acceptable limit of 30 mg/l (BIS- 2012) and 52.26% samples
have higher level of Mg concentration but within maximum permissible limit of 100 mg/l.
Only 2.98% water samples exhibited Mg values >100 mg/l with a maximum value of 780
mg/l recorded at Nandgaon old Aganwadi, block Nandgaon, district Mathura. The
distribution of samples in different concentration ranges are given in Table-32:
TABLE-32 Frequency Distribution of Magnesium
Range of Magnesium in mg/l 0-30 >30-100 >100
No. of Samples 376 439 25
% 44.76 52.26 2.98
Figure-8 Depicts the Magnesium range in shallow ground water of U.P.
The various Blocks exhibiting high values of Magnesium concentration (>100 mg/l) are
tabulated in Table-33.
TABLE-33 Blocks exhibiting high values of Magnesium (>100 mg/l) (2020-21)
Sl. No. District Block Mg Hardness in mg/l
1 Jalaun Dakore 101
2 Meerut Sardhana 102
0
50
100
150
200
250
300
350
400
450
500
0-30 31-100 >100
No
of
Sam
ple
s
Magnesium range in mg/l
Fig. 8 Magnesium Range in shallow ground water of U.P. 2021

172
Sl. No. District Block Mg Hardness in mg/l
3 Raibareli Lalganj 106
4 Ferrukabad Shamsabad 110
5 Agra Bichpuri 113
6 Kanpur Nagar Shivrajpur 113
7 Jaunpur Jaunpur H.Q. 113
8 Mahoba Charkhari 113
9 Mahamaya Nagar Mursan 122
10 Agra Khandauli 125
11 Raibareli Chhatoh 125
12 Lalitpur Maadawara 127
13 Firozabad Khairagarh/ Hathwant 132
14 Sultanpur Musafir Khana 132
15 Ferrukabad Mohammadabad 146
16 Kaushambi Moorat Ganj 146
17 Mathura Chaumuhan 151
18 Mathura Raya 168
19 Kaushambi Kara 192
20 Raibareli Lalganj 222
21 Agra Kheragarh 293
22 Agra Akola 298
23 Agra Achhnera 355
24 Mathura Naujhil 384
25 Mathura Nandgaon 780

173
Sodium (Na):
It is found in varying concentrations in all natural waters. It is found in evaporates and sea
water in high concentration. It occurs among silicate minerals in feldspar, mica, amphiboles
and pyroxenes. The main sources of sodium in ground water are (i) rain water, (ii) evaporate
deposits, (iii) weathering of rock minerals present in the soil, (iv) disposal of sewage and
industrial wastes containing sodium. The higher concentration of Na in drinking water is
harmful especially to those suffering from cardiac, renal diseases pertaining to circulatory
system of the human body.
The analysis result of shallow ground water indicate that sodium ranges between 0 to
6763 mg/l with an average value of 91 mg/l. Out of total samples analysed, 80.83 % of water
samples exhibit sodium concentration up to 100 mg/l, 9.76 % of samples exhibit
concentration up to 200 mg/l, 7.14% of samples exhibit concentration up to 500 mg/l and
2.26% samples were found to be associated with extremely high levels of Na concentration
>500 mg/l with a maximum value of 6763 mg/l recorded at Nandgaon old Aganwadi, block
Nandgaon, district Mathura. The distribution of samples in different concentration ranges are
given in table-34. No guidelines have been issued by BIS, however for the sake of
representation the various range has been taken in Table-34.
TABLE-34 Frequency Distribution of Sodium
Range of Sodium in mg/l 0-100 >100-200 >200-500 >500
No. of Samples 679 82 60 19
% 80.83 9.76 7.14 2.26

174
Figure-9 Depicts the Sodium range in shallow ground water of U.P.
The various Blocks exhibiting high values of Sodium concentration (>500 mg/l) are tabulated
in Table-35.
TABLE-35 Blocks exhibiting high values of Sodium (>500 mg/l)
0
100
200
300
400
500
600
700
800
0-100 101-200 201-500 >500
No
of
Sam
ple
s
Sodium range in mg/l
Fig. 9 Sodium Range in shallow ground water of U.P. (2021)
Sl. No. District Block Na in mg/l
1 Firozabad Narkhi 544
2 Mathura Farah 562
3 Mathura Baldeo 562
4 Mahamaya Nagar Sadabad 631
5 Aligarh Khair 708
6 Unnao Asoha 725
7 Aligarh Gonda 729
8 Mathura Manth 730
9 Mahamaya Nagar Mursan 763
10 Agra Kheragarh 795
11 Mathura Raya 887

175
Potassium (K):
Although potassium is more abundant than sodium in sedimentary rocks, its
concentration in natural waters is quite low due to greater resistance to weathering of
potassium bearing minerals. The main sources of K in natural waters are (i) rain water, (ii)
weathering of Potash silicate minerals, (iii) potash fertilizers. K enters into structure of clay
and clay bearing minerals during weathering. In illite K ions are incorporated in spaces
between crystal layers where these are not removable by further ion exchange reactions
(Buckman& Brady, 1960). Usually the concentration of K in water from natural source is
small but high concentration of this ion if present may be attributed to pollution.
Potassium is an essential plant nutrient. It plays an important role in maintenance of
cellular organization and in keeping the protoplasm in a proper degree of hydration by
stabilizing the emulsions of highly colloidal particles. K deficiency causes water imbalance.
The carbohydrate metabolism is also affected by inadequate supplies of potassium.
The analysis result of shallow ground water indicate that Potassium ranges between 0
to 165 mg/l with an average value of 6 mg/l. Out of total samples analysed; 93.93% of water
samples exhibit Potassium concentration up to 10 mg/l, 2.14% samples were found
concentration up to 20 mg/l, 2.14% samples were found concentration up to 30 mg/l and
1.79% samples were found to be associated with extremely high level of K concentration >30
mg/l with a maximum value of 165 mg/l recorded at Nandgaon old Aganwadi, block
Nandgaon, district Mathura. The distribution of samples in different concentration ranges are
given in Table-36.
12 Agra Achhnera 900
13 Mathura Chaumuhan 967
14 Mathura Goverdhan 1020
15 Agra Etmadpur 1064
16 Fatehpur Dhata 1108
17 Agra Akola 1125
18 Mathura Naujhil 1129
19 Mathura Nandgaon 6763

176
TABLE-36 Frequency Distribution of Potassium
Range of Potassium in mg/l 0-10 >10-20 >20-30 >30
No. of Samples 789 18 18 15
% 93.93 2.14 2.14 1.79
Figure-10 Depicts the Potassium range in shallow ground water of U.P
The various Blocks exhibiting high values of Potassium concentration (>30 mg/l) are
tabulated in Table-37.
TABLE-37 Blocks exhibiting high values of Potassium (>30 mg/l) (2020-21)
0
100
200
300
400
500
600
700
800
900
0-1000 1001-3000 3001-5000 >5000
No
of
Sam
ple
s
Potassium range in mg/l
Fig. 10 Potassium Range in shallow ground water of U.P. (2021)
Sl. No. District Block K in mg/l
1 Mirzapur Narainpur 31
2 Meerut Hastinapur 32
3 Ballia Belhari 35
4 Sultanpur Jamo 42
5 Bahraich Fakarpur H.Q. 45
6 Kushinagar Nebuwa Naurangia 46

177
SUITABILITY OF GROUND WATER FOR IRRIGATION PURPOSE
The chemical quality of water is an important factor to be considered in evaluating its
use for irrigation purposes. Plants grown by irrigation absorb and transpire the water but
leave nearly all the salts behind in the soil, where they accumulate and eventually prevent
plant growth. Excessive concentrations of solute interfere with the osmotic process by which
plant root membranes are able to assimilate water and nutrients. CaCO3 has low solubility, it
may precipitate harmlessly but the bulk of residual solutes present a disposal problem that
must be solved effectively to maintain productivity of the irrigated soil. In areas where
natural drainage is inadequate, the irrigation water infiltrating the root zone will cause water
table to rise excessively. The crop productivity depends on the quality of the water used for
irrigation. Water suitability for irrigation needs to be evaluated on the basis of hazards it can
create in the soil, affecting yield & quality of crops.
In addition to problems caused by excessive concentration of total dissolved solids
(TDS), certain constituents in irrigation water are especially undesirable and some may be
damaging even when present in small concentrations viz. Sodium Adsorption Ratio (SAR) &
Residual Sodium Carbonate (RSC). The potential hazards to crop growth are salinity,
sodicity, alkalinity & toxicity.
Electrical Conductivity (EC):
The Electrical Conductivity is a reflection of the concentration of various chemical
constituents in ground water and gives the overall quality of ground water for its various uses
7 Mahamaya Nagar Hathras 49
8 Budaun Gunnaur 53
9 Barabanki Suratganj 65
10 Bareilly Shergarh 77
11 Firozabad Aron 94
12 Meerut Sardhana 96
13 Mahamaya Nagar Sahpau 97
14 Mahamaya Nagar Hasayan 98
15 Mathura Nandgaon 165

178
like irrigation. The Electrical Conductivity data shown in table 38 reveals that the majority of
the samples belong to C2 and C3 class as per USSL classification.
TABLE -38 Frequency distribution of Electrical Conductivity
EC ranges in
µS/cm at 25ºC
0-250 251 – 750 751-2250 >2250
C1 C2 C3 C4
No. of samples 1 542 265 32
Percentage 0.12 64.52 31.55 3.81
Alkalinity Hazard or Residual Sodium Carbonate (RSC):
When carbonate or bicarbonate concentration in irrigation water is relatively higher
than the alkaline earth metals, there is tendency for calcium and magnesium ions to
precipitate as carbonates in the soil, thereby reducing the level of calcium and magnesium
ions and increasing the relative levels of sodium in the soil. The highly soluble sodium
carbonate (black alkali) known as residual sodium carbonate (RSC) is defined as –
RSC = (HCO3 + CO3) – (Ca + Mg)
where concentrations are expressed in meq/l.
On computation of chemical analysis shows that the Residual Sodium Carbonate
value are less than 1.25 in 0.95% of samples, no samples found in RSC range of 1.25-2.5 and
99.05% of samples found in RSC range of more than 2.5 which are tabulated in Table-39.
Table -39: Frequency Distribution of R.S.C. in NH Stations of U.P
RSC range (meq/l) No. of samples Percentage
<1.25 8 0.95
1.25-2.5 0 0.00
>2.5 832 99.05

179
Figure-11 Depicts the R.S.C. range in shallow ground water of U.P
Sodium Adsorption Ratio:
Sodium Adsorption Ratio (SAR) is an estimate of the degree to which Sodium will be
absorbed by soil from water. Sodium in irrigation, waters adversely affects soil structure and
permissibility by replacing Ca and Mg ions.
SAR = ½22 2/
MgCa
Na
where Na+, Ca+2 and Mg+2 are expressed in meq/l
Table-40 shows that the quality of water samples as per SAR is good in 63.93% samples have
SAR value less than 10.
Table-40 : Quality of water on the basis of SAR values
S. No. Range of
SAR
No. of
Samples
% of
Samples Quality of Water
1 ≤10 537 63.93 Low Na hazard (good quality)
2 >10-18 149 17.74 Medium Na hazard (medium quality)
3 >18 154 18.33 High Na hazard (low quality)
0
100
200
300
400
500
600
700
800
900
<1.25 1.25-2.5 >2.5
No
. of
sam
ple
s
RSC
Fig. 11 RSC range in shallow ground water of U.P. 2021

180
HEAVY METALS
Heavy metals normally occurring in nature are not harmful to our environment,
because they are only present in very small amounts shown in Table 41. However, if the
levels of these metals are higher than the levels of healthy life, the roles of these metals
change to a negative dimension.
A total number of 912 representative ground water samples were collected for Fe,
Mn, Cr, Pb. Cu, Zn, As and U analysis treated with Supra pure HNO3 from pre-defined water
quality stations of U.P during May- 2021. The samples were collected in polyethylene bottles
of 125 ml capacity. They were immediately closed, labeled and stored properly for laboratory
analysis. The hand pumps were continuously pumped for at least 10 minutes prior to the
sampling, to ensure that ground water to be sampled is representative of ground water
aquifer.
The chemical analysis for iron (Fe), manganese (Mn), Chromium (Cr), Lead (Pb),
Copper (Cu), Zinc (Zn), Arsenic (As) and Uranium (U) was carried on inductively coupled
plasma- Mass spectrometry (Thermo iCAP Q) at Regional Chemical Laboratory CGWB, NR,
Lucknow as per the standard methods. The chemical lab of CGWB, NR, Lucknow is NABL
accredited. The chemical analysis results for 912 nos. of water samples collected from GW
monitoring Stations spread in entire Uttar Pradesh have been tabulated in Annexure 3.
Results and Discussion-
Copper concentration was found within the permissible limit of 1.5 mg/l. Zinc
concentration is found above permissible limit 15 mg/l in two locations, with value 16.744
mg/l in Jalesar block of Etah district and 16.442 mg/l at Gonda block of Aligarh district as
per BIS Drinking Water Specification IS 10500: 2012 in ground water samples. The
concentration of lead was found more than 0.01 mg/l in 5 ground water samples. The value of
maximum concentration of lead was found to be 0.03 mg/l at Dilari block of Moradabad
district. Chromium was not found in any sample to be more than 0.05 mg/l/. The value of
maximum concentration of chromium was found to be 0.034 mg/l at Karchana block,
Prayagraj district. Arsenic concentration was found more than 0.01 mg/l in 52 samples
(5.70%). Iron concentration was found more than 1.0 mg/l in 260 samples (28.51%). The
concentration of Manganese was found more than 0.3 mg/l at 63 water quality stations and its
maximum concentration was found 1.857 mg/l at Rajepur block of Farrukhabad district. Iron
is the main pollutant in shallow ground water of the studied area. Its concentration was found

181
more than 1.0 mg/l at 293 block locations (H/P IM-II) of 63 districts of Uttar Pradesh. The
concentration of iron in shallow ground water of Uttar Pradesh is shown in Plate XXIII. The
maximum concentration of iron is found to be 21.705 mg/l at Myorpur block of Sonbhadra
district. The concentration of Arsenic was found above the permissible limit of BIS 2012 at
52 water quality stations in 26 districts. The concentration of Arsenic in ground water of
Uttar Pradesh is shown in Table 42.
Table-41: Statistical distribution of Heavy Metals in Uttar Pradesh 2021
Heavy Metal Minimum
(mg/l)
Maximum
(mg/l)
Average
(mg/l)
No of Districts
affected partly
Chromium 0 0.034 0 Nil
Iron 0 21.705 1.342 63
Manganese 0 1.857 0.111 33
Copper 0 0.047 0 Nil
Zinc 0 16.744 0.7 2
Arsenic 0 0.144 0.003 26
Lead 0 0.030 0.001 5
Uranium 0 0.239 0.012 32
Plate: XXIII

182
Plate: XXIV
Table-42 : Locations of high concentration of Arsenic in shallow ground water of U.P
Sl. No. District Block Latitude Longitude As in mg/l
1 Barabanki Suratganj 27.19320 81.33440 0.144
2 Bahraich Huzurpur 27.35278 81.66583 0.110
3 Ghazipur Ghazipur 25.5684 83.0008 0.047
4 Bahraich Mahasi H.Q. 27.63972 81.38750 0.046
5 Ballia Dubahar 27.4450 84.2393 0.041
6 Ballia Reoti 25.8418 84.3718 0.041
7 Ballia Bairya 25.7769 84.4734 0.040
8 Bijnor AFZALGARH 29.37965 78.73171 0.040
9 Lakhimpur Kheri NAKAHA 27.88518 80.94799 0.038
10 Lakhimpur Kheri NIGHASAN 28.23961 80.86365 0.034
11 Raibareli Kheron 26.29173 80.92759 0.034

183
Sl. No. District Block Latitude Longitude As in mg/l
12 Bahraich Shivpur H.Q. 27.81083 81.39333 0.034
13 Kushi Nagar Sewarhi 26.7244 84.2164 0.033
14 Ballia Sohaon 25.6293 84.0040 0.027
15 Gonda Haldharmau H.Q. 27.13917 81.76111 0.026
16 Azamgarh Palhana 25.7832 83.0859 0.026
17 Siddharth Nagar Badhni H.Q. 27.48917 82.77694 0.024
18 Lakhimpur Kheri ISHANAGASR 27.90759 81.20733 0.024
19 Gonda Paraspur H.Q. 27.03472 81.78639 0.023
20 Gorakhpur Kauriram 26.5161 83.4152 0.022
21 Kushi Nagar Dudhai 26.7847 84.1556 0.022
22 Hardoi SHAHABAD 27.64863 79.94333 0.021
23 Bahraich Fejawapur H.Q. 27.53139 81.49583 0.021
24 Bijnor NOORPUR 29.15190 78.40275 0.021
25 Mirzapur Kon 25.17056 82.55111 0.021
26 Moradabad MOONDHA
PANDEY 28.82314 78.87967 0.021
27 Moradabad CHHAJLET 28.9867 78.6333 0.019
28 Gonda Katra Bazar H.Q. 27.20556 81.79361 0.019
29 Sant Kabir Nagar Poli 26.5858 82.9019 0.018
30 Deoria Bhaluwani 26.3581 83.7757 0.018
31 Azamgarh Maharajganj 26.2511 83.1201 0.017
32 Maharajganj Ghughuli 27.0715 83.6129 0.017
33 Shahjahanpur DADRAUL 27.83672 79.87013 0.016
34 Balrampur Rehra Bazar H.Q. 27.18167 82.27861 0.016
35 Bareilly SHERGARH 28.65410 79.36506 0.014
36 Balrampur Gainsari H.Q. 27.52944 82.54750 0.014

184
Sl. No. District Block Latitude Longitude As in mg/l
37 Siddharth Nagar Jogiya H.Q. 27.25278 83.00806 0.013
38 Sant Kabir Nagar Santha 27.0086 83.0110 0.013
39 Gorakhpur Gagaha 26.4493 83.4376 0.012
40 Ballia Belhari 25.7363 84.2934 0.012
41 Balrampur Balrampur H.Q. 27.42861 82.17111 0.012
42 J.P. Nagar JOYA 28.83557 78.47319 0.012
43 Moradabad BHAGATPUR
TANDA 28.95141 78.82683 0.012
44 Muzaffarnagar Purkaji 29.64917 77.83889 0.012
45 Bijnor Mohammadpur
Deomal 29.35865 78.13419 0.011
46 Budaun SALARPUR 28.07057 79.13302 0.011
47 Shahjahanpur JAITIPUR 27.99392 79.57051 0.011
48 Kushi Nagar Nebuwa Naurangia 27.0542 83.8688 0.011
49 Gonda Padri Kripal H.Q. 27.16278 81.96833 0.011
50 Maharajganj Maharajganj 27.1456 83.5421 0.011
51 Pratapgarh Sangaipur 26.05730 81.65130 0.011
52 Basti Parasurampur H.Q. 26.90500 82.34000 0.011
On perusal of chemical analysis results it was found that Uranium concentrations showed a
wide range from 0 to 239 μg/L with an average value of 12 μg/L. The concentration of
Uranium was found less than 2 μg/L in 194 samples (21.27%). Its concentration was mainly
found in the range of 2 to 30 μg / L in nearly 637 ground water samples (69.84%). The
concentration of Uranium in 81 samples (8.88%) was found more than 30 μg/L in ground
water samples collected from 70 blocks of 32 districts of U.P. Thus concentration of uranium
in most ground water samples was found below the drinking water health standard shown in
Table 43. The maximum concentration of Uranium (239 μg/L) was found in Mohammadpur
Deomal block of Bijnor district.

185
Plate: XXV
Table-43 Locations of high concentration of Uranium (U) in ground water of Uttar
Pradesh
Sl.
No. District Block Latitude Longitude
U in
μg/L
(>30)
1 Bijnor MOHAMMADPUR
DEOMAL 29.37647 78.13236 239
2 Aligarh Khair 27.94351 77.83641 126
3 Fatehpur Khuajuha 26.05617 80.51662 110
4 Bulandshahr Jahangirabad 28.41387 78.08847 98
5 Pratapgarh Sangaipur 26.05730 81.65130 86
6 Mainpuri Kishni 27.03160 79.26555 83

186
Sl.
No. District Block Latitude Longitude
U in
μg/L
(>30)
7 Gautam Buddha Nagar Dankaur 28.26954 77.65958 82
8 Raibareli Chhatoh 26.15952 81.52078 80
9 Raibareli Lalganj 26.16737 80.97911 70
10 Raibareli Lalganj 26.17053 80.97584 65
11 Pratapgarh Sangaipur 26.05210 81.65780 64
12 Pratapgarh Babaganj 25.85220 81.55440 64
13 Mathura Baldeo 27.41141 77.81998 62
14 Sultanpur Musafir Khana 26.37627 81.79961 56
15 Azamgarh Palhana 25.7832 83.0859 55
16 Firozabad Tundla 27.22545 78.24661 54
17 Sultanpur Bhetya 26.21060 81.87524 50
18 Ferrukabad Rajepur 27.47727 79.66173 49
19 Raibareli Tiloee 26.39286 81.47077 49
20 Firozabad Narkhi 27.29036 78.40702 49
21 Budaun SALARPUR 28.07057 79.13302 49
22 Mathura Manth 27.63071 77.71605 48
23 Etah Sheetalpur 27.55593 78.65479 48
24 Kanpur Dehat Akbarpur 26.38202 79.95627 47
25 Auraiya Bidhuna 26.80250 79.50242 47
26 Mathura Goverdhan 27.48276 77.49056 46
27 Sultanpur Dostpur 26.27003 82.46646 45
28 Bulandshahr Danpur 28.19229 78.20595 45
29 Ferrukabad Rajepur 27.48043 79.66195 45
30 Hardoi SANDI 27.29246 79.96401 44

187
Sl.
No. District Block Latitude Longitude
U in
μg/L
(>30)
31 Hardoi MALLAWAN 27.02579 80.15472 44
32 Pratapgarh Baba Bekhernath 25.91590 82.10480 44
33 Aligarh Bijauli 27.97887 78.39968 43
34 Ferrukabad Mohammadabad 27.30800 79.43679 42
35 Varanasi Kashi Vidya Peeth 25.30639 82.96278 42
36 Ferrukabad Rajepur 27.48084 79.66325 41
37 Mahamaya Nagar Sasni 27.69113 78.07405 40
38 Unnao Nawabganj 26.62105 80.67590 40
39 Deoria Bhaluwani 26.3581 83.7757 40
40 Raibareli Chhatoh 26.15970 81.51837 39
41 Mainpuri Karhal 26.99648 78.94045 39
42 Bulandshahr Shikarpur 28.22744 78.03990 39
43 Mathura Goverdhan 27.39449 77.50056 38
44 Prayagraj Phoolpur 25.54600 82.08100 38
45 Bijnor KIRTAPUR 29.49962 78.20781 38
46 Saharanpur Gangoh 29.78417 77.26028 37
47 Hardoi MALLAWAN 27.03459 80.15240 37
48 Raibareli Unchahar 25.89875 81.29765 37
49 Pratapgarh Lakshmanpur 25.89590 81.75900 37
50 Mahoba Panwari 25.42656 79.46497 36
51 Prayagraj Pratappur 25.52150 82.16020 36
52 Chandauli Niyamatabad 25.27194 83.14444 36
53 Sultanpur Gauriganj 26.20620 81.68693 36
54 Ghaziabad Muradnagar 28.77000 77.50333 35

188
Sl.
No. District Block Latitude Longitude
U in
μg/L
(>30)
55 Muzaffarnagar Kairana 29.66833 77.21654 35
56 Gautam Buddha Nagar Dankaur 28.35329 77.55594 35
57 Raibareli Sareni 26.15461 80.82822 35
58 Budaun BISOULI 28.31259 78.92968 34
59 Baghpat Chaprauli 29.20778 77.17917 34
60 Shahjahanpur MIRZAPUR 27.67052 79.54801 34
61 Mathura Raya 27.54948 77.78480 34
62 Sultanpur Sangrampur 26.07727 81.83799 34
63 Pratapgarh Babaganj 25.85170 81.55300 34
64 Raibareli Maharajganj 26.38467 81.27440 34
65 Ghaziabad Razapur 28.71000 77.45639 33
66 Jaunpur Dharampur 25.75250 82.74750 33
67 Aligarh Tappal 28.04280 77.57917 33
68 Sultanpur Amethi 26.15671 81.80836 33
69 Raibareli Harichandpur 26.34467 81.16182 32
70 Pratapgarh Baba Bekhernath 25.90720 82.09990 32
71 Firozabad Eka 27.37907 78.60743 32
72 Mahamaya Nagar Mursan 27.56838 77.94111 32
73 Pratapgarh Sangaipur 26.03190 81.68050 32
74 Aligarh Gonda 27.83668 77.87962 32
75 Gautam Buddha Nagar Jewar 28.12498 77.56721 32
76 Gautam Buddha Nagar Dadri 28.55452 77.55351 31
77 Agra Akola 27.07154 77.88569 31
78 Muzaffarnagar Budhana 29.28972 77.47222 31

189
Sl.
No. District Block Latitude Longitude
U in
μg/L
(>30)
79 Firozabad Madanpur 27.02711 78.64422 31
80 Kanpur Dehat Rasoolabad 26.66804 79.78387 31
81 Auraiya Sahar 26.75847 79.60017 31
Conclusion:
By and large, the chemical quality of ground water of phreatic zone in Uttar Pradesh
is found to be suitable for drinking purposes as per available analysed chemical parameter
data (as per BIS 2012). Presence of some constituents beyond the permissible limit at some
locations renders the water unfit for public water supply.
Considering the parameters responsible for suitability of ground water of Uttar
Pradesh it is observed that it is generally suitable for irrigation purposes as per Electrical
Conductivity, Residual Sodium Carbonate, Sodium Adsorption Ratio except at few places
where corrective measures are to be taken before agricultural usage.

190
Annexure-I
DEPTH TO WATER LEVEL OF GROUND WATER MONITORING WELLS
(GWMW), U.P.
Sl.No
. District Well
May-
2021
Aug-
2021
Nov-
2021
Jan-
2022
1 Agra
Acchanera PZ-
GWD 7.08 6.3 6 5.93
2 Bah Pz-GWD 35.8 35.62 35.7 35.8
3 Fatehabad Pz-GWD 44.2 43.97 43.95 44.13
4 Dabar Pz-GWD 17.95 17.96 17.65 17.92
5 Undera 1.58 0.27 0.65 0.3
6 Gangapur Basai 4.58 1.52 1.7 1.7
7 Mewli (Bhara) 13.93 5.7 5.11 7.06
8 Khundauli Pz-GWD 33.59 33.05 29.95 28.49
9 Saiyan Pz-GWD 32.48 31.7 31.55 32.23
10 Etmadpur 29.63 29.75 29.85 30.19
1 Aligarh Hardanaganj 5.72 4.91 3.93 5.05
2 Safedpur 5.03 3.63 5.75 6.4
3 Gonda 3.62 2.37 1.87 2
4 Sudiyal 11.18 5.01 10.9 10.98
5 Andla 15.88 10.32 9.91
6 Khair 1.68 9.95 9.8
7 Palachand 5.99 6.01
8 Taquipur(new) 1.33 3.7 4.23
1 Allahabad Aandwa 18.39 16.13 14.39 14.38
2 Allahabad 5.72 7.13 9.99
3 Kasarua 11.9 8.48
4 Mau-Aima 6.39 3.1 1.76 2.04
5 Naini 13.77 9.02 8.19 9.97
6 Imamganj 7.03 1.36 2.07 3.48
7 Baraut1 1.81 0.97 1.15 1.25
8 Handia 2.18 0.42 0.77
9 Holagarh 5.12 2.2 2.04 3.36
10 Bara 4 1.05 1.63 1.97
11 Chilla 12.52 7.01 5.82 7.79
12 Gauhania 5.84 1.34 1.82 2.13
13 Lalpur 4.23 1.48 2.59 2.72
14 Barokhar 5.75 6.68 8.09
15 Koraon 4.52 9.8 0.98 1.48
16 Ladiri Bazar 4.43 1.49 1.98 3.02

191
Sl.No
. District Well
May-
2021
Aug-
2021
Nov-
2021
Jan-
2022
17 Pasna 4.47 0.98 1.09 2.37
18 Karchanna 12.32 7.48 4.88 7.41
19 Meja Road 15.25 8.14 5.12 8.08
20 Akodha 9.46 2.28 2.2 4
21 Saraon 6.92 2.54 2.37 3.09
22 Atrampur 7.46 3.83 1.19 2.86
23 Bawarikalaan 4.41 1.13 1.29 2.39
24 Rampur tulapur 4.94 1.08 4.72 5.24
25 Meja 4.94 1.35 3.86 3.69
26 Mallhan 6.61 3.29 2.06 2.64
27 Phulpur2 5.94 2.22 2.53 3.21
28 Sikandra1 11.06 10.32 9.26 9.01
29 Bairi 2.65 0.15 0.95 1.12
30 Gadwa Fort 3.59 2.69 3.22 3.44
31 Khaptia Kheri 4.06 1.31 1.73 2.38
32
Jail Road (Power
House) 9.63 10.7
33 Naribari 3.59 0.52 1.56
34 Zari Bazar 2.36 2.1
1 Ambedkar
Nagar
Akbarpur Pz GWD
NEW 5.5 3.05 3.4 4.67
2 Baskhari Pz-GWD 3.35 1.02 1.61 2.2
3 Bhiti New 2.45 2.95 1.81 3.52
4 Mahrua gola-New 3 3.5 3.07 3.85
5 Kesharpur 1.99 0.89 1.59 2.69
6 Akbarpur1 4.5 0.8 1.81 3.68
7 Katehari 3 1.15 2.06 3.7
8 Bhiyaon New Pz 6.28 3.43 2.71 3.99
9 Surapur 3.2 0.45 1.16 2.18
1 Auraiya Pz GWD Ajitmal 22.66 21.4 20.58 19.14
2 Hasulia 10.67 7.6 3.71 5.8
3 Basundhara 4.06 1.5 1.42 2
4 Phaphund 4.8 4.2 4.32
5 Bandhamau 7.1 4.68 3.6 4.16
6 Sahar 5.65 2.74 1.4 1.75
7 Sahayal 8.36 7.08 4.46 5.67
8 Premnagar-Bajera 2.3 0.14 1.98 0.6
9 Gadhalot 1.76 2.48
10 Bidhuna Pz 13.29 11.76

192
Sl.No
. District Well
May-
2021
Aug-
2021
Nov-
2021
Jan-
2022
1 Azamgarh Ahraula 7 2.02 4.13
2 Sageri 2.95 1.65 2.69
3 Badihari 5.53 2.4 3.21
4 Langerpur 4.5 1 1.76
5 Kanauna 1.06 1.89
6 Rahul Nagar 3.97
7 Rampur 0.13 2.27 0.27 1.9
8 Deogaon 3.36 0.65 1.1
9 Madayan 1.92 4.1 2.43
10 Belwana 1.56 2 1.15 2.2
11 Saraimir 1.8 1 1.71
12 Bahrapur 5.66 1.02 2.1
13 Bairadih 7.87 3.04 3.83 4.62
14 Azamgarh 1.35 3.15 5.57
15 Phulpur 4.23 3.5 0.82 2.38
16 Bibipur Khatauli 2.65 3.3 1.4 2.9
17 Nizamabad 5.3 0.2 2.36
18 Kharihani 5.15 4.2 1.1 4.258
19 Sidhauna 4.13 1.9 0.77 2.48
20 Kharsahan Kalan 5.27 0.85 0.77 1.57
1 Baghpat Khekhra Pz 28.83 25.51 30.55 23.09
2 Pilana Pz 27.8 25.79 20.21
3 Huzurpur 0.8 0.6 1 1.2
4 Parpatganj 5.27 1.47 2.77 4.5
5 Jarwal1 1.95 1.95 2.35
6 BhakrauliKapurw 2.25 0.55 1.42 1.83
7 Sablapur 3.08 1.28 2.16 2.38
8 Gaighat 3.03 0.9 1.62 2.7
9 Katarniaghat 1.8 1.15 2.35 1.3
10 Tapri godh 3.58 2.67 3.16
11 Razichauraha 1.82 0.57 0.97 1.42
12 Bhopatpur 8.3 7.67 7.77 7.87
13 Lachmanpur 8.52 4.97 4.62 6.17
14 Nanpara 9.55 8.75 8.85 8.95
15 Baisanpurwa 2.42 1.25 1.65 1.95
16 Kapurpur 3.73 1.08 2.22 2.56
17 Baba Kutir 1.9 0.15 1.05 1.45
18 Kolhuwa 5.02 2.2 2.6 2.83
19 Mihirpurwa(Kudwa 4.94 2.85 2.82 3.56

193
Sl.No
. District Well
May-
2021
Aug-
2021
Nov-
2021
Jan-
2022
)
20 Mote Baba 1.5 0.45 1.35 1.35
21 Pyagpur – I 4.98 3.3 4.52 4.68
1 Ballia Babhnauli 1.89 1.77 1.47 2.48
2 Bansdih New 2.47 1.18 1.92
3 Balesara 1.09 2.42 1.47 2.6
4 Haldi 2.78 0.95
5 Chilkahar New 0.71 0.4 1.14 2.04
6 Jahangrapur 0.6 2.33
7 Ballia 3.52 0.52 1.07 1.82
8 Chitbargaon 0.95 0.65 0.91
9 Garwar 1.35 0.5 0.54 1.72
10 Manihar 4.8 3.45 4.85
11 Nasirabad 8.83 1.2 4.83 8.28
12 Kharsanda 4.3 0.76 1.69
13 Dalan Chapra 7.74 3.15 2.92 5.38
14 Jaiprakashnagar 7.25 3.9 5.37
15 Jamuan 3.95 0.55 2.42
16 Sikanderpur 4.65 0.2 1.25 2.69
17 Pur 1.98 1.75 1.21 2.04
18 Rasra 1.37
19 Rewati 0.7 0.58 1.05 1.64
20 Ubhavan 3.57 0.15 0.9 2.39
21 Narhi 3.03 3.73 6.57
22 Sikandarpur2 5.4 2.65 1.07 3.8
1 Balrampur
Balrampur
PZ(GWD) 2.88 0.8 2.6 3.15
2 Balrampur1 2.6 1 3.02 3.55
3 Deoria1 2.91 2.18 2.83
4 Utraula 2.7 0.56 1.85 2.57
5 Sonpur 0.07 1.35 2.05
6 Sridutganj1 0.87 0.1 1.3 2.13
7 Gainsari 1.03 0.45 1.17 1.4
8 Gaura Crossing 1.01 1.02 1.5
9 Jarwa 9.4 5.5 5.75 6.3
10 Semri1 2.84 1.04 2.08 3.34
11 Bankatwa 9.9 7.3 7.6
12 Chandanpur 2.97 0.9 2.38 2.95
13 Pachperwa 0.1 0.02 0.2 0.13

194
Sl.No
. District Well
May-
2021
Aug-
2021
Nov-
2021
Jan-
2022
14
Rehrabazar
PZ(GWD) 1.42 1.4 1.18 1.92
15 Gangnar 2.4 0.8 2.25 2.85
16 Harriaya bazar 2.22 0.4 1.77 2.6
17 Sipahia Village 1.33 0.8 1.62 1.97
18
Tulsipur
(Devipatan) 2.12 1 1.3 1.4
1 Banda Banda 15.9 10.5 13.86 15.02
2 Bargaini 7 6.6 8.82
3 Bisanda 4.9 1.9 3.73 2.92
4 Girwan 1.15 0.2 0.68 3.09
5 Khhurand 0.05 1.25 2.28
6 Naraini New 5.9 0.93 1.67 2.87
7 Badausa 4.55 3.1 4.92 3.45
8 Badehan 6.3 5.2 4.97 10.24
9 Mukera 3.23 5.85 2.47 10.1
10 Roli Kalyanpur 10.9 2.7 10.12 11.82
1 Barabanki Bhitaria 8.97 7.96
2 Baba ki Kuti 5.24 1.69 1.74 2.42
3 Fatehpur(new) 4.8 2.18 2.18 3.28
4 Kitlupur 3.47 1.19 1.52 2.28
5 Chaubisi 4.83 2.09 0.9 2.78
6 Datauli Chanda 10.49 9.78 10.05
7 Dewa 4.48 1.3 1.83 2.74
8 Rasauli 3.82 0.53 0.78 1.58
9 Kotwa Sarai 8.21 7.58 5.59 6.44
10 Daryabad 4.31 0.81 1.3 1.95
11 Rani Katra 6.83 6.33 5.62 6.02
12 Sarai Barai 3.4 3.1 4.3
13 Tikaitnagar 7.27 5.87 4.6 5.6
14 Purwa amarsingh 3.97 1.43 1.57 2.09
15 Sundhia mau 6.21 4.69 3.55 4.88
16 Kaisarganj 9.78 7.57 5.26
17 Sidhaur 6.17 4.3 2.66 3.24
18 Bhiwal 7.49 2.09 4.73
19 Gutauna 4.96 1.81 1.75 3.4
20 Trivediganj 6.63 1.65 1.33 3.78
21 Harakh 6.27 2.05 1.62 2.97
22
Pure Dalai (Pz
Gwd) 4.81 3.19 2.35 3.43

195
Sl.No
. District Well
May-
2021
Aug-
2021
Nov-
2021
Jan-
2022
23 Ramnagar 8.58 8.13 7.8 8.25
1 Bareilly Baheri 0.8 0.85 1.07 0.8
2 Nawabganj1 4.57 3.72 3.5 3.52
3 Bhuta 5.18 4.02 4.11
4 Bareilly1 6.65 6.4 6.12 6.13
5
Kandharpur Pz
GWD 3.66 2.15 2.51
6 Mirganj Pz GWD 7.48 7 6.39 6.34
7 Ramnagar2 12.3 14.1 12.98 12.63
8 Siroli Pz GWD 9.7 8.25 8.63
9 Shishgarh 2.7 3.42 4.38 4.32
10 Deorania 1.52 1.4 1.42
11 Nakati Narayan 2.77 2.95
1 Basti Kalwari 2.75 1.55 1.3 2.5
2 Kharauan jat 1.22 1.1 1.45 2.22
3 Basti 3.7 1.4 4.27 4.8
4 Haraiya 2.05 1.2 1.75 2.85
5 Captainganj1 3.2 3.18 1.15 1.83
6 Bhanpur 1.2 0.7 1.17 2.05
7 Rudauli 1.53 0.8 1.86 2.83
8 Bhikamjot 3.82 1.09 1.49 2.84
1 Bijnor Dhampur 7.34 4.45 4.82
2 Milak Beniram 3.79 1.27 1.42 1.52
3 Chandok 19.95 18.38 17.35 17.35
4 Nagina 4.73 3.5 2.93 3.13
5 Swaheri Khurd 11.09 9.35 9.9 10.05
6 Najibabad New 2.29 0.51 0.2
7 Sneh Rd.rly.stn. 13.6 9.75 9.27 9.47
8 Sarakthal 4.73 3.9 3.77 4.02
9 Chandpur 11.97 11.65 10.96 10.88
10
Motamahadev
(Vijaypur) 8.16 6.68 5.78 6
11 Seohara 7.17 6.2 6.4
1 Budaun
Dabthara Shyam Pz
GWD 17.24 17.4 16.84 16.46
2
Mansa Nagla Pz
GWD 19.89 19.87 19.57 19.48
3 Ujhani Pz GWD 21.14 18.89 18.58

196
Sl.No
. District Well
May-
2021
Aug-
2021
Nov-
2021
Jan-
2022
4 Dhanari 5.52
5 Sihawali 6.18 4.67
1 Bulandshahar
Daulatpur Khurd
EW/Pz 11.63 10.52 11.3 11.17
2 Lakhaothi Pz 10.5 9.31 7.42 7.82
1 Chandauli Kamalpur 4.71 1.48 1.57 2.97
2 Marufpur xing 9.21 8.09 8.68
3 Chakia 4.34 1.36 3.1 4.92
4 Baburi 8.65 3.26 3.825 6.84
5 Dhanpur 2.41 0.43 1.015 1.93
6 Chandraprabha 4.5 6.43 6.97
7 Mugal Sarai 0.54 0.48 12.08
8 Sakaldiha 1.12 1.82 3.17
9 Chandauli New 2.9
1 Chitrakoot Chakrajafar 9.7 11.89 14.12
2 Karwi 8.3 5.7 8.07 5.61
3 Jorwara 10.15 4.5 4.31 7.48
4 Manikpur 2.45 0.7 2.93 2.78
5 Mau 19.2 13.35 14.1 16.9
6 Pahari Buzurg New 10.25 4.65 4.87 6.23
7 Raipura 7.6 7.15 11.04 13.2
1 Deoria Ratasia Kothi 3.7 0.42 3.12 3.22
2 Baitalpur 0.27 1.82 2.26
3 Deoria2 2.04 0.93 1.42 2.95
4 Desai Deoria 0.76 0.19 0.89 2.08
5 Gauri Bazar 1.19 0.84 0.61 1.15
6 Lar road 2.3 0.21 1.14 1.73
7
Pathardewa
(Narayanpur Kothi) 3.15 0.33 3.32 3.95
8 Rampur Karkhana 1 0.45 2.77 2.23
9 Rudrapur1 5.05 0.39 2.97 4.75
10 Baitalpur 1.15 0.27 1.82 2.11
11 Usra Bazaar 3.78 0.56 1.67 3.75
1 Etah Amanpur Pz-GWD 5.07 4.2 3.6 3.82
2 Jaithra Pz-GWd 11.96 11.2 11.6

197
Sl.No
. District Well
May-
2021
Aug-
2021
Nov-
2021
Jan-
2022
3 Jalesar Pz-GWD 11.82 10.9 11.3
4 Marahchi Pz-GWD 9.75 9.37 8.65 8.54
5 Daryaganj 10.43 10.23 10.43
6 Etah Pz-GWD 14.9 14.36 14.1 13.72
7 Dhumri1 3.49 2.68 2.35 2.85
1 Etawah Barecha 37.6 30.14 34.89 35.7
2
Pz GWD Jaswant
Nagar 16.38 16.43 16.57 16.65
3 Ujhayani 5.05 3.5 4.2
4 Bakewar 6.93 5.57 4.77 4.89
5 Patya Chaturpur 7.03 3.87 7.29 7.24
6 Sabdalpur 27.42 28.14
7 Pakkatal 4.48 4.4
8 Govt ITI Parisar 10.27 10.38
9 Bharthana Pz 6.4 3.71 3.82
1 Faizabad Amaniganj 6.1 3.2 4.29 4.71
2 Chaure bazar 2.85 1.4 1.37 3.03
3 Khajurahat 7.55 6.05 3.92 5.68
4 Faizabad Pz-CGWB 7.8 6.4 5.45 5.92
5 Madhopur 3.05 0.3 1.08 1.9
6 Naokua 1.65 0.3 0.74 1.35
7 Bakarganj 3.15 0.15 1.46 2.04
8 Gosaiganj new 5.15 2.3 2.66 3.8
9 Milkipur 5.4 4.55 3.4 3.03
10 Sarai Rasi 6.3 4.75 4.16 5.29
11 Rudauli 1 3.64 0.64 1.32 2.06
12 Ramdin Purwa 6.75 5.4 4.9 5.4
1 Farrukhabad Rajepur 5.31 3.02 1.3 1.4
2 Shamshabad 15.98 13.13 16.05 15.7
1 Fatehpur Naubasta 10.14 8.71 10.66 11.11
2 Bahua 8.68 6 6.52
3 Bela 4.07 3.5 3.77 3.5
4 Bhitaura PZ Gwd 12.55 13.9 12.47 12.3
5 Barwa 27.7 18.53 20.27
6 Jahanabad 18.97 16.86 19.87
7 Musfha 12.14 6.74 8.98
8 Sarain Bakewar 5.81 2.62 4.82
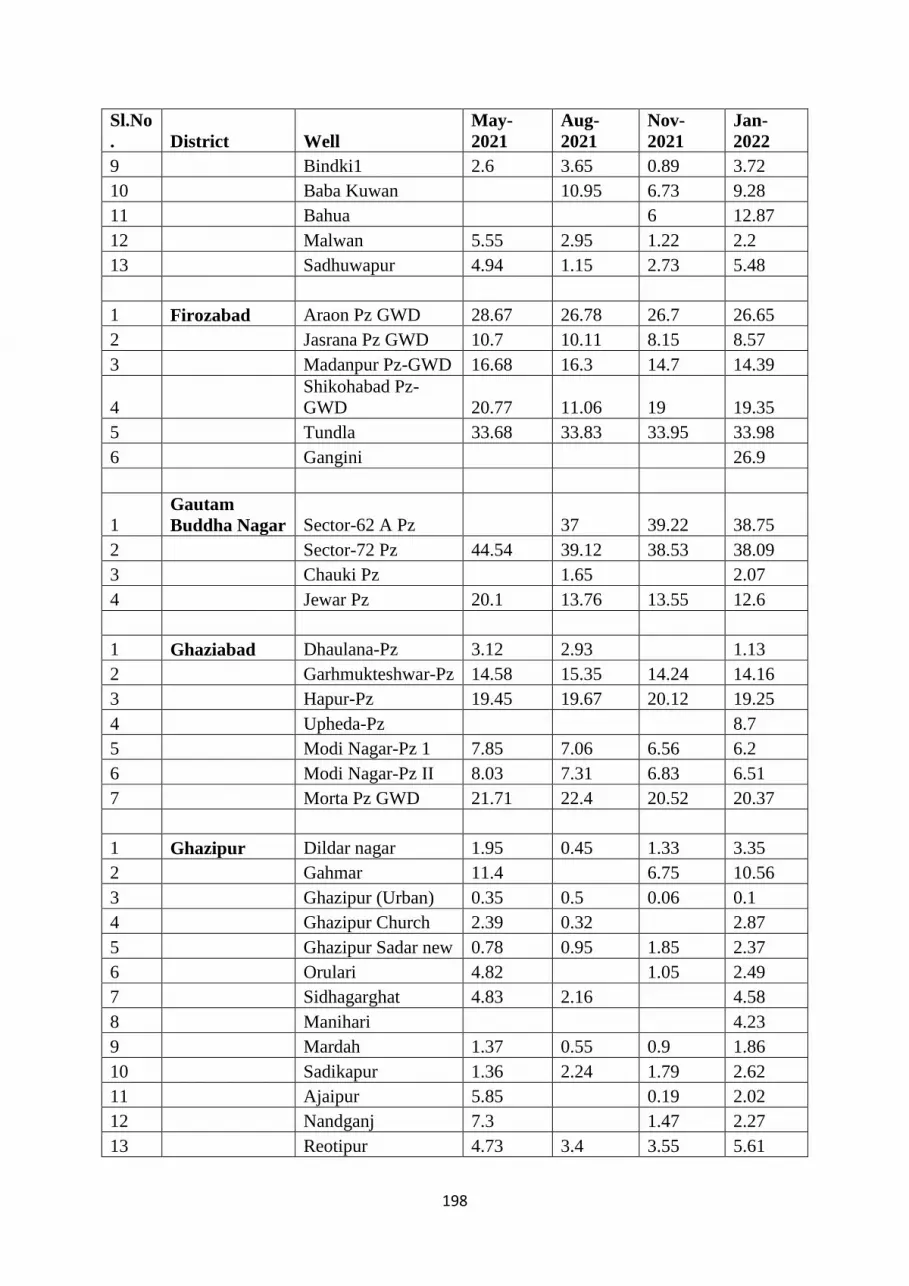
198
Sl.No
. District Well
May-
2021
Aug-
2021
Nov-
2021
Jan-
2022
9 Bindki1 2.6 3.65 0.89 3.72
10 Baba Kuwan 10.95 6.73 9.28
11 Bahua 6 12.87
12 Malwan 5.55 2.95 1.22 2.2
13 Sadhuwapur 4.94 1.15 2.73 5.48
1 Firozabad Araon Pz GWD 28.67 26.78 26.7 26.65
2 Jasrana Pz GWD 10.7 10.11 8.15 8.57
3 Madanpur Pz-GWD 16.68 16.3 14.7 14.39
4
Shikohabad Pz-
GWD 20.77 11.06 19 19.35
5 Tundla 33.68 33.83 33.95 33.98
6 Gangini 26.9
1 Gautam
Buddha Nagar Sector-62 A Pz 37 39.22 38.75
2 Sector-72 Pz 44.54 39.12 38.53 38.09
3 Chauki Pz 1.65 2.07
4 Jewar Pz 20.1 13.76 13.55 12.6
1 Ghaziabad Dhaulana-Pz 3.12 2.93 1.13
2 Garhmukteshwar-Pz 14.58 15.35 14.24 14.16
3 Hapur-Pz 19.45 19.67 20.12 19.25
4 Upheda-Pz 8.7
5 Modi Nagar-Pz 1 7.85 7.06 6.56 6.2
6 Modi Nagar-Pz II 8.03 7.31 6.83 6.51
7 Morta Pz GWD 21.71 22.4 20.52 20.37
1 Ghazipur Dildar nagar 1.95 0.45 1.33 3.35
2 Gahmar 11.4 6.75 10.56
3 Ghazipur (Urban) 0.35 0.5 0.06 0.1
4 Ghazipur Church 2.39 0.32 2.87
5 Ghazipur Sadar new 0.78 0.95 1.85 2.37
6 Orulari 4.82 1.05 2.49
7 Sidhagarghat 4.83 2.16 4.58
8 Manihari 4.23
9 Mardah 1.37 0.55 0.9 1.86
10 Sadikapur 1.36 2.24 1.79 2.62
11 Ajaipur 5.85 0.19 2.02
12 Nandganj 7.3 1.47 2.27
13 Reotipur 4.73 3.4 3.55 5.61

199
Sl.No
. District Well
May-
2021
Aug-
2021
Nov-
2021
Jan-
2022
14 Pyrepur 1.16 1.26 2.28
15 Tanda Bairakh 1.94 1.31 3.23
16 Saidpur1 6.68 5.4 6.05 7.58
17 Kasimabad 0.22 4.26
18 Baresar 11.6 8.3 8.6 12.58
19 Deoria 0.62 1.56 1.11 2.19
20 Karnda 9.77 5.35 4.25 6.98
21 Naudar (Chotti) 6.16 4.44 5.64
1 Gonda Chapiya 2.9 0.35 1.1 1.7
2 Parsa gondri 3.52 0.2 2 2.83
3 Gonda (Urban) 7.25 6 5.83 5.6
4 Kazi Dewar 3.14 0.76 1.65 2.65
5 Birpur Katra 1.63 1.77 2.23
6 Mankapur 3.6 1.45 1.5 2.55
7 Bhauriganj 3.68 0.58 2.21 2.83
8 Karanailganj 3.38 1.1 1.92 2.18
9 Mankapur 3.6 1.45 1.5 2.46
10 Mankapur – I 4.58 1.74 1.92 2.64
11 Tarabganj 2.63 1.6 1.79 2.35
1 Gorakhpur Geruababa 3.72 0.37 3.55 3.41
2 Dubauli 4.14 0.76 3.36 3.25
3 Kauriram 5.36 1.01 2.31 4.31
4 Jagdishpur1 0.71 1.77 2.61
5 Bharohia 6.26 1.13 1.77 4.37
6 Maniram 3.51 0.8 4.18
7 Mehra 3.92 1.31 3.43 3.35
8 Tola Bhawan Bari 2.24 0.15 3.37 3.9
1 Hamirpur Khanna 7.9 0.8 4.31 2.87
2 Kunetha 6.78 2.56 1.75 3
3 Bewar 13.56 12.99 12.34
4 Kharela A 4.55 0.85 2.85 4.83
5 Dhagwan 4.71 0.94 1.08 5.17
6 Sarila NEW DW 0.84 4.95 4.18 5.17
7 Pachkura 15.89
8 Bibhuni 1.65 2.15 1.1 1.52
9 Mamna 2.3 4.7 0.41 2.93

200
Sl.No
. District Well
May-
2021
Aug-
2021
Nov-
2021
Jan-
2022
1 Hardoi Ahrori 3.94 1.97 1.59 2.24
2 Bawan Pz-GWD 4.2 2.9 3.29 3.54
3 Behdar(GWD PZ) 3.83 1.87
4 Quasimpur 1.62 1.21 2.62 1.92
5 Dhobia 6.19 6 5.52 5.73
6 Gopamau 7.56 7.39 6.61 6.58
7 Harpalpur PZ-GWD 8 7.95 7.49 7.58
8 Kachauna 3.32 2.65 1.37 2.04
9
Kachauna (GWD
PZ) 4.36 2.65 1.6 2.05
10 Mallawan 15.06 14.82 13.4 13.44
11 Del Panderwa 2.74 1.55 1.33 2.67
12 Pihani 4.5 3.6 1.77 2.5
13 Manjila 4.81 3.36 3.84 3.94
14 Sursa (GWD PZ) 4.86 3.6 4.65 4.69
15 Barganwan 5.78 5.53 5.43 5.23
16 Tediaon (GWD PZ) 4.13 3.1 2.28 2.5
17 Bharawan 9.1 7.75 8.22 8.45
18 Bharkhani 9.42 9.32 8.97
19 Dalel Nagar Rly 6.01 4.8 3.63 2.95
20 Budhagaon 1.56 3.56
21 Saidpur 2.1 2.97
1 Hathras Hasyan 4.35
2 Rattika Nagla 4.23 2.63 1.8 2.63
3 Iglas 15.32 11.08 10.82 10.73
4 Sikandara Rao 5.95 4.19 3.1 3.9
1 Jalaun Ait2 5.26 6.06
2 Dekor 9.07 6.78 6.4 5.9
3 Hardoi Gujar 5.45 5.65
4 Kishora Mauza 7.13 5.68 5.35 5.75
5 Kusumilia 11.26 4.61 3.75 4.9
6 Marora 3.69 3.45 3.9
7 Orai 3.97 2.24 2.35 3.12
8 Jalaun 6.93 6.1 6.7
9 Ata 10.39 8.87 8.55 7.3
10 Babina-new 3.29 1.37 0.93 1.63
11 Keolari-New 4.8 3.67 6.12 6.52
12 Konch(new) 7.76 6.13 9.39 8.69
13 Hadrukh 16.66 12.07 9.85 11.7

201
Sl.No
. District Well
May-
2021
Aug-
2021
Nov-
2021
Jan-
2022
14 Sirsakalar 4.97 3.46 3 3.3
15 Madhogarh 5.15 1.09 2.25 2.85
16 Churkhi 13.51 11.79 10.85 9.73
17 Damras 25.08 23.8 27.8
18 Kalpi 25.89 24.09 24.3 25.95
19 Mahewa 20.67 17.83 17.58 20.9
20 Gopalpura1 0.85 0.22 0.31 0.96
21 Kailaiya 7.9 7.69 5.37 6.27
22 Kamsaira 3.61 1.14 0.75 4.08
23 Kanasi 7.41 7.01 6.27 6.17
24 Gohan 7.54 4.01 3.95 4.6
25 Jagmanpur 32.69 29.75 30.75
26 Rajpura 3.04 0.73 1.35 1.75
27 Umri 4.98 3.73 3.95 4.15
1 Jaunpur Badlapur 8.03 6.76 5.14 5.958
2 Sigra mau 5.05 0.98 1.66 2.26
3 Barsathi 0.19 3.54
4 Marihun 2.75 1.01 1.62 2.74
5 Horipur 8.01 7.73 7.68
6 Chandwak 11.43
7 Mehreon1 2.34 1.72 2.78 2.72
8 Tarti 2.75 3.62 4.54
9 Kirakat1 12.61 12.68 12.82
10 Dhitauli Pratappur 0.34 1.05 1.69
11 Kheta Sarai1 1.32 2.04 2.68
12 Shahganj1 1.34 0.345 2.6
13 Janghai 5.34 0.9 1.74 2.39
14 Machhalishahr 2.9 0.15 0.628
15 Maheshganj 7.61 2.66 1.99 3.109
16 Maharajganj2 5.77 1.31 2.3
17 Raja Bazar 4.64 1.59 2.39 2.68
18
Mungra
Badshahpur1 8.35 6.13 3.03 3.49
19 Narar(jamnipur) 4.72 1.04 0.92 1.25
20 Itaili(muftiganj) 7.96 7.89 8.48
21 Pisara 0.66 1.88 1.71
22 Barai par 7.88 3.21 2.11 3.91
23 Jaunpur1 15.37 13.16 12.96
24 Dhiuraha 3.42 4.08 5.46
25 Hasanpur 0.91 4.81

202
Sl.No
. District Well
May-
2021
Aug-
2021
Nov-
2021
Jan-
2022
26 Rampur1 1.76 0.37 1.14 1.73
27 Barji Kalan 4.62 0.64 1.79 2.01
28 Belwa Tarpatti 0.79 1.56 1.66
1 Jhansi Babina1 7.46 0.98 1.95 3.05
2 Khailara 9.36 3.02 5.3 6.6
3 Raksa 6.19 3.31 5.2 4.2
4 Ghugawa 7.79 5.64 4.85 5.3
5 Jhansi1 5.73 3.43 3.11 3.55
6 Ajneri Madhopura 6.08 3.52 3.2 3.05
7 Bamaur 6.87 5.1 5.05 5.5
8 Auldan-New 9.22 7.11 8.5 9.55
9 Bangra Pz 10.18 6.23 5.4 7.55
10 Sakrar1 9.79 5.84 5.9 6
11 Khillawari 8.59 2.3 9 4.05
12 Semri 6.85 5.64 4.55 5.8
13 Rewan 9.57 7.91 5.25 6.15
14 Kuangaon 11.27 9.95 9.95
15
Mauranipur
Rajpaharia 7.87 5.15 8.75 6.1
16 Moth 3.82 1.57 1.65 2.15
17 Samthar 7.82 7.09 5.63 6.73
18 Phutera 4.2 4.7
1 Jyotiba Phule
nagar Amroha Pz CGWB 16.13 15.76 14.91 14.73
2 Gajraula Pz CGWB 14.86 14.93 14.65 14.35
3 Jogipura Pz GWD 15.55 15.09 13.95 13.58
4 Bagadpur Pz GWD 19.81 20.17 19.47 19.24
5 Hasanpur Pz GWD 17.2 16.9
6 Joya Pz GWD 17.1 17.23 16.8 16.6
7 Dariyal 6.99 6.87 6.27 6.15
8 Rehra 8.27 7.85 7.92
1 Kannauj
Chibramau Pz-
GWD 23.9 24.07 22.21 23.39
2 Haseran Pz-GWD 0.71 0.42 0.31 0.16
3 Jalalabad Pz-GWD 25.77 25.1 23.9 24.19
4 Kharni Pz-GWD 6.08 5.82 4.52 4.82
1 Kanpur Dehat Raura 6.13 3.25 4.47
2 Baghpur 4.4 2.69 2.86

203
Sl.No
. District Well
May-
2021
Aug-
2021
Nov-
2021
Jan-
2022
3 Kadari 5.89 2.95 3.65 4.41
4 Muhammadpur 18.8 18.85 19.51
5 Shahjahanpur 18 14 15.2 16.85
6 Kainjari 5.94 5.29 3.53 4
7 Derapur 17.97 17.46
8 Pukhanraya 6.65 4.79 4.77 5.5
9 Sahtawanpurwa 4.63 1.15 1.22 1.52
10 Shivli 1.52 2.02
1 Kanpur Nagar sarh 4.52 3.28 1.33 1.83
2 Niwada Dhamni 7.19 3.52 4.3
3 Chaubepur1 13.65 13.5 12.51 11.42
4 Bithoor-Nganj 10.68 9.56 9.25 9.35
5 Defence Colony Pz 39.5 41.47 41.2 40.93
6 Motipura 4.8 2.2 2.51 3.78
7 Narmau(new) 7.55 6.57 6.15 6.23
8 sachendi 6.15 4.07 1.7 1.99
9 Ramsari 9.1 6.32 4.42 4.69
10 Kulgaon 10.2 9.5 8.54 8.48
11 Bhaisana 4.76 3.5 1.54 2.3
12 Baradari 8.15 7.82 6.34 6.1
13 Bidhnu 3.76 4 1.21 1.25
14 Bhadras 18.7 17.33 13.75 14.05
15 Moyaiya 9.4 9 8.2 8.26
16 Sambarpur 1.53 1.32
17 Bidhnu Pz 3.76 4 3.14 2.95
1 Kaushambi Mandari 20.96 18.13 18.14
2 Sallahpur 15.88 12.37 13.87 14.52
3 Lehdari 14.69 10.56 11.07 13.14
4 Pulia Sandalpur 9.04 6.8 10.39
5 Usargaura 7.58 2.61 2.04 3.37
6 Perai 14.68 12.02
7 Sarai Akil 17.44 14.01 16.57
8 Kushambhi 12.39 8.72 6.97 9.5
9 Kasia 15.52 12.26 10.12 11.12
10 Ajrauli Pz 8.22 10.51
1 Kheri Asogapur 3.91 0.86 0.95 1.99
2 Chamlapur 2.75 1.27 1.05 1.46
3 Chauapur 3.57 1.87 2.08 2.5

204
Sl.No
. District Well
May-
2021
Aug-
2021
Nov-
2021
Jan-
2022
4 Jhandi raj 4.05 2.26 1.25 2.5
5 Chandan Chowki 4.53 1.92 2.45 3.18
6 Dudhwa f.r.h. 10.02 7.98 7.49 7.88
7 Gomti_West Bank 3.4 3.02 2.38 2.78
8 Khajanchi Purwa 5.15 4.02 3.54 3.64
9 Khiri Pz 7.18 6.23 6.27 6.41
10 Ramia Behar 3.67 1.82 2.33 3.33
11 Phool Behar 1.88 2.7
1 Kushinagar Mansurganj 0.29 1.27 2.32
2 Chittauni 0.6 1 3.54 1.18
3 Mathauli 0.93 0.27 1.39 2.15
4 Naurangia 1.2 0.43 1.83 2.46
5 Rambar 2.18 0.51 3.15 3.4
1 Lalitpur Bar 10.31 1.99 3.4 5
2 Amjhari Ghati 2.82 1.4 1.47 1.62
3 Betna 9.23 9.07 7.05 9.1
4 Birdha Pz-GWD 16.14 15.08 7.4 13.4
5 Jakhlaun 3.34 2.22 2.76 2.55
6 Bansi 3.08 2.02 2.55 2.95
7 Jakhaura1 3.24 2.36 2 1.5
8 Lalitpur 5.62 1.71 2.65 2
9 Mahroni1 9.37 6.2 6.45
10 Saidpur 4.62 4.5 7.2
11 Silawan 9.67 4.46 7.05 8.7
12 Digwar 6.93 5.14 5.29
13 Hisar kalan 6.2 5.89 6.92 7.12
14 Talbhet-III 7.44 2.32 2.6 3.4
15 Talbhet-IV 4.87 3.6
16 Talbhet-New 2.32 1.29 1.45 1.3
17 Deogarh 3.3 3.9
18 Buragaon 5.85 6.2
19 Burari 4.35 4.7
1 Lucknow Bakshi ka talab 15 14.7 12.98 12.91
2 Itaunja 12.88 11.47 10.15 10.9
3 Itaunja Pz 12.85 12.3 11.1 11.16
4 Kumrahawan 6.53 3.58 1.15 2.2
5 Lu New Campus 21.26 23.57 23.2 22.15
6 Vikasnagar 41.82 42.19 42.8 41.37

205
Sl.No
. District Well
May-
2021
Aug-
2021
Nov-
2021
Jan-
2022
7 Gosaiganj1 3.19 1 2.6
8 Khawas Khera 4.97 0.6 1.8 2.19
9 Munshiganj 7.66 3.71 2.7 4.23
10 Fatehganj 17.73 14.97 13.5 13.4
11 Aat Garhi Sonra 14.31 12.62
12 Mal 14.23 14.03 13.17 12.83
13 Rehta New 8.1 8.26
14 Malihabad 13.84 13.37 12.4 12.58
15 Rehman Khera 10.56 9.63
16 Mohanlalganj 5.6 4.1 2 3.15
17 Nagram 4.41 1.26 1.16 2.26
18 Bijnor 12.53 11.9 11.9
19 Mohanlalganj 5.6 4.1 2 3.49
1 Mahoba Charkhari 6.75 1.95 2.33 3.34
2 Bela Tal 5.27 4.07 5.19 4.77
3 Jaitpur New 4.15 6.79 6.78
4 Kulpahar2 5.9 1.1 5.48 6.57
5 Chatesar pz GWD 14.7 10.36 9.75 13.24
6 Srinagar 7.45 7.7 10.35
7 Kashipura 7.08 5.43 5.89 6.39
1 Mahrajganj Koluhi 1.2 0.57 1.97 2.45
2 Ghughali 1.59 0.68 2.73 3.85
3 Maharajganj2 0.41 0.95 2.29 2.82
4 Kukesar 2.85 0.27 1.87 2.89
5 Pharenda pz Gwd 1.3 0.75 2.81 1.59
6 Siswa Bazar 1.93 0.45 2.98 3.84
7 Munila Tola 1.41 0.5 1.07 2.93
1 Mainpuri Bewar Pz-GWD 6.42 8.37 7.25 7.4
2 Katra Saman 4.92 2.42 2.2 2.9
3 Kishni Pz-GWD 7.28 6.35 6.67
4 Kuraoli Pz-GWD 7.6 4.93 4.67 5.58
5 Sultanganj Pz-GWD 7.68 6.67 5.3 5.83
6 Ajitganj 6.41 6.35 5.75 6.05
1 Mathura Baldeo 6.93 4.92 5.3 5.62
2 Jamunapar Thana 11.42 5.54 11.9 11.82
3 Sahar1 6.82 0.79 1.86 1.02
4 Chhata New 4.41 1.36 1.66 1.66

206
Sl.No
. District Well
May-
2021
Aug-
2021
Nov-
2021
Jan-
2022
5
Nagra Chhitar
Singh 3.46 1.42 2.32 2.28
6 Jhinga Nagla 3.19 0.2 2.92 2.43
7
Paintha
(Govardhan) 4.66 0.79 2.23 2
8 Saunkh 2.39 1.12 2.18 1.75
9 Surir (new) 7.52 7.96
10 Jachoda 3.91 4.1 0.94 0.99
11 Barsana 10.22 10.45 10.38 9.9
12 Kosi 6.17 1.3 2.06 2.05
13 Kharab 2.22 2.49
14 pirsua 11.78 9.9 9.38 10.07
15 Auwa Nagla 2.43 0.89 2.46 2.64
1 Mau Ghosi 0.63 3.4 1 1.3
2 Amila 1.58 2.24
3 Dhorighat 4.67 3.2 1.95 4.86
4 Jejawali 2.95 0.92 2.18 3.56
5 Paharipur- NEW 2.01 1.04 1.94 2.86
6 Kapaganj 7.85 5.17 6.13
7 Mau (Urban) 0.79 3.89
8 Ratanpura 1.21 1.61 1.7 3.26
9 Bhiti 6.37 4.52 4.38
1 Meerut Sakoti Tanda Pz 8.74 8 7.69 7.67
2 Hastinapur 1 10.77 9.96 10.22 10.39
3 Timkia Kothi Pz I 8.16 7.91 6.73 6.57
4 Timkia Kothi Pz II 8.42 8.38 7 5.65
5 Timkia Kothi Pz III 8.31 6.89 7.22
6 Kaili Pz 20.91 22.69 21.71 19.33
7 Meerut Pz 12.67 20.17 19.38 20.95
8 Parikshat garh Pz 11.43 10.11 9.56 9.21
9 Sisauli 23.17 21.83 22.28 21.58
10
Machhra-Pz I-8"
(Shallow-45M) 11.12 13.71 12.96 10.96
11
Machhra-Pzii-6"
(Deep-274M) 11.23 13.64 13.05 11.85
12
Machhra-Pziii-2.5"
(Shallow-35M) 11.12 13.71 12.96 12.67
13
Mawana
Khurd/Chota
Mawana 12.07 11.49 11.08 10.79

207
Sl.No
. District Well
May-
2021
Aug-
2021
Nov-
2021
Jan-
2022
1 Mirzapur Gaipura 10.57 10.27 11.03
2 Halia 2.74 6.71 6.42
3 Lalganj 1.85 1.79 2.62 3.21
4 Lohangpur 3.41 0.84 1.69 5.38
5 Baghura 1.74 0.43 2.18 3.29
6 Marihan 6.82 9.14 12.54
7 Goplapur 5.53 4.98 8.38
8 Mirzapur 14.71 9.03 7.87 10.62
9 Ahraura 0.59 1.42 2.38
10 Barhanchuan 0.52 1.46 2.54
11 Kotwa 4 12.43
12 Mirzapur New 6.9 9.03 7.87 10.78
13 Sukrit 6.36 10.94
1 Moradabad Bahjoi Pz GWD 16.6 16.42 16.3 16.17
2 Chandausi-PZ 18.41 18.66 18.75
3 Fauladpur 2.74 3.85 3.15 3.35
4 Dingarpur Pz GWD 14.22 13.97 13.87
5
Moradabad Pz
GWD 6.56 10.18 10.22 10.55
6 Sambhal Pz 20 20.4
7 Painapur 3.82 2.42 1.67 2.41
8 Thakurdwara 1.51 0.32 0.4 0.35
9 Matlabpur 11.89 11.5 10.79 10.41
1 Muzaffarnaga
r Baghra Pz 18.09 12.41 10.89
2 Chartawal 8.41 5.48
3 Chartawal Pz 7.21
4 Khatauli 3.75 1.86 2.12 2.5
5 Morna Pz 17.94 17.76 17.17
6 Sukratal 2.15 2.78 3.14 2.38
7 Kukra-Sadar Pz 13.97 13.91 13.66 12.56
8 Paldi Pz GWD 21.79 17.17 17.5
9 Shamli PZ GWD 21.58 14.69 17.21 14.6
10 Kamalpur Pz 10.49 9.49 7.8
11 Un Pz 23.58 23.63 21.41
1 Pilibhit Faradia 1.9 3.74 4.15
2 Baldeopur 3.99 4.18

208
Sl.No
. District Well
May-
2021
Aug-
2021
Nov-
2021
Jan-
2022
3 Bilsanda1 4.4 1.45 1.54 2.1
4 Bilaspur Pz GWD 5.08 2.82 3.42
5 Jeora Kalyanpur 4.5 3.82 2.8 3.92
6 Bargad Chauraha 4.08 2.4 2.8
7 Bhamora 3.81 1.69 2.14 2.46
8 Gajraula1 3.27 2.63 2.18 2.69
9 Jahanabad1 5.71 3.43 3.5 3.7
10 Pilibhit Pz GWD 3.69 3 2.77 3.26
11 Puranpur Pz GWD 2.66 2.17 1.81 2.05
1 Pratapgarh Bhusar 4.98 0.92 2.28 2.45
2 Udai Shahpur 6.44 1.75 2.16 3.22
3 Nanasukul purwa 6.01 4.16 2.51 2.73
4 Maddupur 3.47 1 0.87 0.85
5 Belhupur 6.42 4.35 3.73 3.14
6 Gaura 5.73 1.34 2.58 3.01
7 Sangramgarh 5.98 5.34 3.58 3.76
8 Sishahia 7.27 2.63 2.41 3.72
9 Garhi Manikpur 11.09 7.41 6.69 8.18
10 Gutni 11.14 9.72 8.33 8.02
11 Kunda 8.88 3.41 2.52 3.79
12 Lalgopalganj 6.61 1.02 1.49 2.51
13 Narainpur 4.61 1.09 1.32 2.02
14 Kohdaur 6.38 3.21 2.78 3.38
15 Patti 1 3.87 0.89 2.41 2.32
16 Mohanganj 11.4 8.77 7.06 7.89
17 Pratapgarh Sadar 15.04 12.92 11.07 11.89
18 Lalganj2 2.05 0.41 0.51 0.65
19 Rampur Batauli 5.63 1.77 2.41 2.985
20 Mandhata 6.23 5.08 3.34 3.95
21 Ateha 7.16 5.9 3.77 4.36
22 Gorai1 7.92 7.57 7.39
23 Jamtoli 15.79 15.78 12.31 12.13
24 Raniganj 8.94 7.94 6.65 6.86
25 Dih Balri 5.42 1.44 1.26 1.4
26 Jathwara 5.56 0.66 1.54 2.08
27 Kohola 7.47 7.62
1 Rae Bareli Chauraha Dusti 2.98 1.42 1.58
2 Cheek dadar 5.85 6 3.48 3.8
3 Dhonda ka Purwa 4.48 2.55 1.84 2.75

209
Sl.No
. District Well
May-
2021
Aug-
2021
Nov-
2021
Jan-
2022
4 Fursatganj 4.12 2.62 1.4 2.11
5 Kachunda 3.7 1.65 1.66 1.72
6 Jais 2.6 1.8 1.29 1.6
7 Nigohan1 3.27 1.92 1.15 1.39
8 Dalmau Pz(GWD) 6.25 3.3 3.28 3.89
9 Gopalipur 7.05 5.55 2.48 3.12
10 Katghar 3.86 1.96 1.66 1.76
11 Mohanganj1 2.23 1.4 1.85 2.75
12 Jagatpur 2.85 1.5 1.6 1.74
13 Ketanpurwa 5.99 3.86 3.96
14 Kheron PZ (GWD) 6.9 6.9 6.66 6.67
15 Mau garbi 3.92 1.5 1.86 1.95
16 Laxmanganjbazar 4.15 1.65 2.18 2.82
17 Hunsepur 12.9 14.85 9.64 9.95
18 Ahrauri bhawani 5.2 2.1 1.78 2.37
19 Bhawanigarh 3.65 0.5 1.45 1.66
20 Kumbhi ka purwa 5.85 2.85 3.04 3.11
21 Simrauta(ii) 5.35 3.85 2.55 2.88
22 Matrwa 3.95 1.25 1.64 2.03
23 Simrauta 5.63 4.65 2.77 3.1
1 Rampur Bilaspur Pz GWD 5.62 3.84 3.92
2 Shahabad Pz GWD 10.78 10.07 10.2
3 Tanda 4.95 4.82 5.02
4 Dhaneli Purwi 6.52 6 6.1 6.15
1 Saharanpur Babail Buzurg 7.77 7.09 4.66 5.55
2 Dhaula Kuan 8.18 7.09 5.8 8.29
3 Mohand 9.94 6.15 6.39 7.73
4 Shakhambari 4.17 1.94 3.35 2.19
5 Tilhari Buzurg 10.64 9.21 8.82 8.31
6 Lundi Pz GWD 6.75 7.67
7 Siriska Pz GWD 11.72 12.79 12
8 Nanauta Pz GWD 5.63 3.35 2.95 3.7
9 Tikrol Pz GWD 8.47 6.85 6.79 6.53
10 Ghuna 4.22 1.6 1.94 1.69
1 Sant Kabir
Nagar Dhanghata 3.2 0.22 1.27 2.5
2 Nathnagar 2.05 0.31 1.04 1.83
3 Khalilabad 3.48 0.18 1.17 1.7

210
Sl.No
. District Well
May-
2021
Aug-
2021
Nov-
2021
Jan-
2022
4 Maidawal 2.94 0.46 2.14 3.18
5 Tighra 2.13 0.43 2.08 3.06
1 Sant Ravidas
Nagar Aurai 3.5 2.42 2.55 3.72
2 Koirauna 8.88 3.77 4.21 7.76
3 Pali1 6.81 4 3.03 4.25
4 Suriyawan 6.01 2.53 2.78 4.95
5 Gyanpur New 4.74 1.86 1.8 2.91
1 Shahjahanpur Sidhauli 5.03 5.17
1 Shrawasti Bhagwanpur 1.14 0.44 0.94 1.54
2 Madora chowki 2.15 0.1 1.05 1.62
3 Dikauli 0.62 1.28 2.2
4 Tulsipur2 4.45 1.51 2.36 3.38
5 Laxman Nagar 3.7 1.85 4.1 4.44
6 Pakaria 1.85 1.65 2.3
7 Pratapur 2.94 0.2 0.65 1.35
8 Shrawasti 0.71 0.71 0.91 1.31
9 Bhujanga 1.69 0.59 1.19 2.09
10 Ratanpur 2.4 1.62 2.51
11 Sirsia1 3.44 0.18 2.25 3.1
12 Sirsiya 4.1 2.4 3.41
1 Siddharthnag
ar Bansi1 0.83 0.56 1.33 1.92
2 Kajhai 5.42 0.9 5.25 6.27
3 Badhni 2.1 0.45 1.9 2.25
4 Parsa 1.25 0.65 1.5 2.3
5 Ramnagara 3.87 0.3 2.05 3.3
6 Birdpur 2.02 0.95 1.75 2.5
7 Dumariyaganj 2.11 0.16 1.68 2.36
8 Uska 2.5 0.83 2.08 3.75
9 Belwa Laghunahi 1.25 0.6 1.92 3
10 Chilihia 0.9 0.35 1.1 1.35
11 Itwa 2.45 1.1 1.88 1.9
12 Shohratgarh 1.15 0.75 1.54 1.8
1 Sitapur Behta 3.67 0.88 1.15 1.9
2 Shekhwapur 5 2.65 2.55 3.74

211
Sl.No
. District Well
May-
2021
Aug-
2021
Nov-
2021
Jan-
2022
3 Khamaria 6.08 4.75 4.2 4.07
4 Karauna 13.68 12.59 11.14 10.59
5
MachchretaPz-
GWD 10.33 10 9.19 9.9
6 Bahoranpur 3.8 2.2 1.49 2.3
7 Purwara Gosai 3.54 2.57 3.06 2.74
8 Maholi Pz-GWD 9.5 8.9 8.2 8.51
9 Misrikh1 7.33 6.12 5.25 5.67
10 Naimisharanya-1 1.35 1.85 1.4 1.07
11 Sikandrabad 8.2 8.5
12 Dhoudhi 5.24 2.54 3.52 4.29
13 Hargaon 5.6 7.12 3.55 4.37
14 Madnapur 3.01 0.63 1.17 1.15
15
Rampur Mathura
Pz-GWD 4.3 1.87 1.5 3.04
16 Biswan2 5.7 4.68 5.03 4.65
17 Biutmani 3.84 1.39 3.56 3.14
18 Jahangirabad 2.92 0.39 0.33 1.61
19 Sanda 4 1.8 2.17 4.13
20 Bada Gaon 5.18 2.85 3.28 4.31
21 Ramdana Crossing 7.6 6.2 4.5 8.09
1 Sonbhadra Asandih 8.55 4.77 4.58 7.82
2 Babhani 9.78 6.66 6.89 8.46
3 Chopan 2.87 4.5 6
4 Hatinala 3.67 2.88 3.55 4.17
5 Ghorawal1 2.98 1.44 1.76 2.88
6 Son Barsa 1.42 2.27 3.92
7 Dudhi 5.24 2.54 3.52 4.82
8 Anpara 14.92 9.64 12.17 14.16
9 Bairpan 5.32 0.58 1.44 3.55
10 Dhrtidand1 2.19 4.2 6.63
11 Gara 8.94 10.53 12.28
12 Jarha 7.9 3.83 4.92 7.33
13 Muirpur 2.11 2.85 3.63
14 Renukoot 9.14 13.01 14.04
15 Robertsganj1 3.43 0.86 1.87 3.46
16 Shahganj 2.16 1.66 8.34
17 Telgudwa 3.64 7.06
18 Kohraul New 2.84 2.35 3.84

212
Sl.No
. District Well
May-
2021
Aug-
2021
Nov-
2021
Jan-
2022
1 Sultanpur Akhand Nagar 2.25 0.9 0.84 1.17
2 Kusitali 4.95 2.3 1.42 1.8
3 Munshiganj1 4.55 4.05 1.49 2.37
4 Bhadayian Pz-GWD 12 11.95 11.38 11.1
5 Ramgarh1 3.9 0.75 1.13 1.7
6 Sultanpur2 9.5 8.5 8.16 9.12
7
Pratushmanik
(Partosh) 4.35 1.5 0.75 1.99
8 Kutta 4.75 2.4 2.16 2.9
9 Khaluhat1 3.34 1.39 1.79 2.38
10 Bhada 6.53 3.98 2.43 5.93
11 Gauriganj new-2 4.67 2.27 1.37 2.42
12 Jagdishpur2 10.3 9.5 7.25 7.12
13 Khutahna 3.75 1.75 2.09 2.6
14 Naghipur Bajhan 0.75 0.9 1.54 1.84
15 Bhatgaon 1.25 3.8 4.62 4.9
16 Goriabad 1 0.85 1.58 1.69
17 Janapur 3.95 1.4 3.1 3.8
18 Kadipur 8.85 7.7 6.97 7.5
19 Sagardeh 11.65 8.89 10.1
20 Kurebhar1 2.25 1.4 1.7 2.3
21 Kurwar 5.51 4.91 3.8 4.27
22 Mundawa 4.2 4.05 1.62 3.07
23 Lambua pz-GWD 4.18 3.05 1.99 2.8
24 Shivgarh 4.37 1.37 2 2.52
25 Piparpur 5.81 4.17 4.03 4.51
26 Trisundi 4.3 1.6 2.23 1.8
27 Musafirkhana 4.05 1.3 1.44 2.13
28 Kotra Khurd 6.48 5.3 4.28 4.94
29
Pratap pur
Kamaicha Pz 8.15 6.32 10.22 6.5
30 Badgaon 11.15 11.6 9.1 8.8
31
Dariyan ka purwa
(Soraon) 3.7 1.9 1.56 2.27
32 Mahona 5.47 1.92 2.62 3.59
33 Sathin 11.68 11.32
34 Bahurawa 2.85 0.5 1.22 1.69
35 Dostpur New Pz 4.75 2.5 2.51 3.12
36 Shukul Bazar 11.93 11.63 11.24 9.82
1 Unnao Kantha 4.05 3.5
2 Auras 5.88 4.68 3.93 4.42

213
Sl.No
. District Well
May-
2021
Aug-
2021
Nov-
2021
Jan-
2022
3 Thaura 2.69 0.42 1.1 1.05
4 Hasanganj1 7.37
5 Hasewan 3.78 2.53 1.62 2.19
6 Tonda 3.43 0.18 0.56 0.96
7 Maurawan 8.51 8.03
8 Azmatnagar 9.45 8.7 7.63 7.7
9 Makur 4.24 1.8 2.42 2.17
10 Pinjra 7.65 6.85 6.66 6.65
11 Purwa 2.35 2.35 2.33
12 Unchagaon kila 2.41 0.19 0.63 0.57
13 Methi Tikur 5.13 2.24 2.57 3.62
14 Safipur1 9.55
15 Bighapur 11.61 3.3
16 Chakalvanshi 0.76 0.96 1.06
17 Pariyar 7.9
18 Santakhera 3.71 3.44 4.08
19 Sikanderpur1 15.07 14.22 13.18 13.21
20 Unnao 11.85
21 Baksar 6.42
22 Bhagwant Nagar 4.44
23 Malauna 1.1 0.68 0.75 0.62
24 Sumerpur 12.7 11.38 10.73 12.21
25 Unchagaon1 7.65 2.88 3.38 3.86
26 Bhaisai 6.75 6.5 3.45 5.09
27 Raniganj-New 14.24 14.04 13.44 15.04
1 Varanasi Jikhan(narsara) 10.45 5.74 5.14 5.9
2 Anai 1.78 1.04 1.38 1.27
3 Babatpur Chaura 10.22 5.8
4 Rustampur 2.1 3.88
5 Chobepur 5.32 2.7 1.91 3.39
6 Varanasi 8.12 4.8 5.51 6.51
7 Phulpur1 1.91 5.26 4.97 5.56
8 Sindhaura 3 3.7

213
Annexure - II
DEPTH TO WATER LEVEL TREND OF GROUND WATER MONITORING WELLS
(GWMW) FOR THE PERIOD 2012 – 2021, U.P.
Sl
No.
District Location Pre-Monsoon Post-Monsoon
Data
Points
Pre Rise
(m/year)
Pre Fall
(m/year)
Data
Points
Post
Rise
(m/year)
Post Fall
(m/year)
1 Agra Khundauli Pz-Gwd 8 0.4307 8 0.2754
2 Agra Saiyan Pz-Gwd 8 1.3140 8 1.0799
3 Agra Jagner Pz-Gwd 7 1.1975 8 1.5855
4 Agra Achhanera Pz-Gwd 8 0.1694 9 0.1902
5 Agra Fatehabad Pz-Gwd 7 0.4309 8 0.4020
6 Agra Bah Pz-Gwd 8 0.3634 8 0.3823
7 Agra Gangapur Basai
New
3 6 0.0747
8 Agra Undera 7 0.0220 10 0.0303
9 Agra Dabar Pz-Gwd 8 0.3997 9 0.3183
10 Agra Kagraul 6 0.5477 8 0.7680
11 Agra Mewli (Bhara) 8 0.6644 10 0.6445
12 Aligarh Harduaganj 7 0.1268 8 0.0783
13 Aligarh Taquipur(New) 8 0.1550 8 0.0951
14 Aligarh Khair 8 0.2894 9 0.1089
15 Aligarh Safedpur 8 0.0705 9 0.0035
16 Aligarh Andla 9 0.5218 9 0.2312
17 Aligarh Gonda 9 0.1703 9 0.0309
18 Aligarh Jawan 7 0.0439 6 0.2225
19 Aligarh Sudiyal 9 0.2934 9 0.2666
20 Aligarh Palachand 5 8 0.2129
21 Allahabad Meja 10 0.1013 10 0.0485
22 Allahabad Pasna 10 0.1180 10 0.0596
23 Allahabad Barwarikalaan 10 0.1312 9 0.0912
24 Allahabad Rampur Tulapur 6 0.5449 9 0.1760
25 Allahabad Naribari 4 6 0.1072
26 Allahabad Khaptia Kheri 10 0.0553 10 0.0129
27 Allahabad Ladiri Bazar 9 0.1179 10 0.0342
28 Allahabad Akodha 6 0.2669 9 0.0515
29 Allahabad Koraon 10 0.0897 10 0.3098
30 Allahabad Barokhar 3 9 0.4142
31 Allahabad Ghoose 2 7 0.0589

214
Sl
No.
District Location Pre-Monsoon Post-Monsoon
Data
Points
Pre Rise
(m/year)
Pre Fall
(m/year)
Data
Points
Post
Rise
(m/year)
Post Fall
(m/year)
32 Allahabad Meja Road 5 9 0.0936
33 Allahabad Bairi 10 0.1159 9 0.0593
34 Allahabad Mau-Aima 8 0.1344 9 0.0531
35 Allahabad Holagarh 10 0.2445 9 0.0510
36 Allahabad Lalpur 8 0.0371 7 0.0638
37 Allahabad Gauhania 7 0.1729 7 0.5692
38 Allahabad Gadwa Fort 8 0.0137 7 0.0847
39 Allahabad Baraut1 10 0.0720 10 0.0197
40 Allahabad Malka Harhar 7 0.2333 10 0.2816
41 Allahabad Aandwa 5 6 0.4829
42 Allahabad Atrampur 9 0.3144 9 0.0567
43 Allahabad Sikandra1 10 0.1398 9 0.1593
44 Allahabad Mallhan 9 0.1377 10 0.0002
45 Allahabad Imamganj 6 0.3519 9 0.7439
46 Allahabad Phulpur2 8 0.3354 10 0.3079
47 Allahabad Handia 9 0.0845 10 0.0163
48 Allahabad Kasarua 7 0.2204 8 1.0575
49 Allahabad Chilla 5 7 0.9412
50 Allahabad Saraon 10 0.2444 10 0.0713
51 Allahabad Karchhana 4 6 0.3713
52 Allahabad Iradat Nagar 5 9 0.4401
53 Allahabad Bara 10 0.0495 10 0.2160
54 Allahabad Naini 9 0.0055 9 0.0169
55 Ambedkar
Nagar
Kesharpur 9 0.0464 10 0.0153
56 Ambedkar
Nagar
Akbarpur1 4 10 0.0641
57 Ambedkar
Nagar
Mahrua Gola-New 5 10 0.1695
58 Ambedkar
Nagar
Katehari 9 0.0808 10 0.0798
59 Ambedkar
Nagar
Baskhari Pz-Gwd 6 0.0053 7 0.1903
60 Ambedkar
Nagar
Akbarpur Pz-Gwd
New
4 6 0.4912
61 Ambedkar
Nagar
Bhiti-New 5 12 0.1523

215
Sl
No.
District Location Pre-Monsoon Post-Monsoon
Data
Points
Pre Rise
(m/year)
Pre Fall
(m/year)
Data
Points
Post
Rise
(m/year)
Post Fall
(m/year)
62 Auraiya Bandhamau 9 0.4486 10 0.3092
63 Auraiya Pz Gwd Ajitmal 6 1.4557 10 1.1347
64 Auraiya Hasulia 9 0.5962 10 0.5329
65 Auraiya Basundhara 7 0.0313 9 0.0180
66 Auraiya Sahar 9 0.2403 10 0.0546
67 Auraiya Achhalda 8 0.1520 9 0.1161
68 Auraiya Sahayal 9 0.2650 10 0.3289
69 Auraiya Dinamau 5 8 0.2401
70 Auraiya Phaphund 8 0.4888 10 0.2108
71 Azamgarh Badihari 10 0.1775 10 0.0346
72 Azamgarh Langerpur 4 7 0.0154
73 Azamgarh Sageri 8 0.0491 10 0.3943
74 Azamgarh Phulpur 8 0.1353 9 0.2970
75 Azamgarh Azamgarh 2 8 0.4853
76 Azamgarh Bairadih 8 0.0293 10 0.3416
77 Azamgarh Sidhauna 10 0.1125 10 0.0803
78 Azamgarh Karsandia Kalan 10 0.1251 10 0.0799
79 Azamgarh Nizamabad 5 8 0.3881
80 Azamgarh Deogaon 10 0.0214 10 0.0553
81 Azamgarh Ahraula 6 0.2180 10 0.3178
82 Azamgarh Bahrapur 10 0.0169 10 0.1621
83 Azamgarh Belwana 9 0.1012 10 0.1388
84 Azamgarh Madayan 10 0.4824 9 0.3279
85 Azamgarh Bibipur Khatauli 7 0.1283 10 0.2468
86 Azamgarh Saraimir 10 0.2826 9 0.0388
87 Azamgarh Rahul Nagar 8 0.1516 7 0.0254
88 Azamgarh Kharihani 7 0.2763 9 0.2730
89 Bahraich Nanpara 8 0.0857 10 0.0417
90 Bahraich Tapri Godh 9 0.0378 10 0.0091
91 Bahraich Katarniaghat 9 0.0105 10 0.0458
92 Bahraich Baisanpurwa 9 0.1084 10 0.0899
93 Bahraich Razichauraha 9 0.0431 10 0.0132
94 Bahraich Gaighat 9 0.1030 10 0.0514
95 Bahraich Bhopatpur 9 0.2470 10 0.0263
96 Bahraich Sablapur 9 0.0579 10 0.0255
97 Bahraich Kapurpur 9 0.0372 10 0.0501

216
Sl
No.
District Location Pre-Monsoon Post-Monsoon
Data
Points
Pre Rise
(m/year)
Pre Fall
(m/year)
Data
Points
Post
Rise
(m/year)
Post Fall
(m/year)
98 Bahraich Bhakraulikapurw 9 0.0275 10 0.0623
99 Bahraich Jarwal1 2 8 0.0840
100 Bahraich Mihipurwa 3 6 0.1977
101 Bahraich Huzurpur Pz (Gwd) 5 6 0.0947
102 Ballia Ballia 9 0.1807 10 0.4851
103 Ballia Kharsanda 6 0.0459 9 0.2474
104 Ballia Ubhavan 8 0.0042 10 0.2843
105 Ballia Pur 9 0.0436 10 0.1012
106 Ballia Chitbargaon 9 0.2221 10 0.1602
107 Ballia Haldi 8 0.4101 8 0.3926
108 Ballia Manihar 9 0.1782 10 0.1186
109 Ballia Garwar 9 0.1682 10 0.1059
110 Ballia Nasirabad 9 0.0579 10 0.2333
111 Ballia Jahangrapur 6 0.0082 8 0.1038
112 Ballia Babhnauli 8 0.2570 10 0.3465
113 Ballia Rasra 7 0.1489 9 0.4266
114 Ballia Bairia 6 0.0721 7 0.1590
115 Ballia Jaiprakashnagar 8 0.0197 9 0.1548
116 Ballia Dalan Chapra 9 0.0322 10 0.2605
117 Ballia Rewati 7 0.2770 9 0.2762
118 Balrampur Utraula 9 0.0720 10 0.0433
119 Balrampur Jarwa 9 0.5977 10 0.1764
120 Balrampur Pachperwa 9 0.1050 10 0.0581
121 Balrampur Sridutganj1 8 0.2706 10 0.0437
122 Balrampur Harriaya Bazar 8 0.1660 10 0.1341
123 Balrampur Sonpur 7 0.0785 10 0.0995
124 Balrampur Deoria1 9 0.0578 10 0.0181
125 Balrampur Gangnar 9 0.0837 10 0.0684
126 Balrampur Gaura Crossing 8 0.1455 10 0.1310
127 Balrampur Semri1 9 0.0416 10 0.0654
128 Balrampur Gainsari 9 0.1479 10 0.0896
129 Balrampur Bankatwa 9 0.2655 9 0.1096
130 Balrampur Sipahia Village 9 0.1631 10 0.0219
131 Balrampur Chandanpur 6 0.2482 9 0.0672
132 Balrampur Tulsipur
(Devipatan)
7 0.2765 7 0.1466

217
Sl
No.
District Location Pre-Monsoon Post-Monsoon
Data
Points
Pre Rise
(m/year)
Pre Fall
(m/year)
Data
Points
Post
Rise
(m/year)
Post Fall
(m/year)
133 Balrampur Balrampur1 7 0.2580 8 0.1347
134 Balrampur Balrampur
Pz(Gwd)
5 6 0.1484
135 Balrampur Rehrabazar
Pz(Gwd)
4 6 0.6919
136 Banda Naraini New 5 6 0.0550
137 Banda Mukera 5 6 0.4671
138 Banda Jamnipurwa 5 6 0.5709
139 Banda Badausa 9 0.7563 10 0.3733
140 Banda Mataundh 7 0.9299 4
141 Banda Atarra 10 0.0062 10 0.0483
142 Banda Girwan 5 10 0.0295
143 Banda Bisanda 8 0.3321 9 0.0634
144 Banda Badehan 10 0.3576 9 0.2329
145 Banda Banda 9 0.7766 10 0.6115
146 Banda Khhurand 9 0.3726 10 0.0535
147 Banda Roli Kalyanpur 5 10 0.2231
148 Banda Pangara 7 0.2537 10 0.0444
149 Banda Bargaini 3 8 0.1936
150 Barabanki Fatehpur (New) 9 0.0971 9 0.0970
151 Barabanki Tikaitnagar 9 0.1317 9 0.1357
152 Barabanki Bhanmau 2 6 0.1359
153 Barabanki Sundhia Mau 10 0.0384 10 0.0047
154 Barabanki Sarai Barai 8 0.0393 10 0.0208
155 Barabanki Purwa Amarsingh 10 0.0637 10 0.0504
156 Barabanki Rani Katra 10 0.1043 10 0.0675
157 Barabanki Gutauna 10 0.0515 12 0.0652
158 Barabanki Dewa 10 0.0343 10 0.0388
159 Barabanki Kalkeshwar Temp 4 10 0.1133
160 Barabanki Baba Ki Kuti 10 0.0027 10 0.0645
161 Barabanki Kitlupur 10 0.0165 10 0.0077
162 Barabanki Masauli Chaurah 8 0.1793 10 0.0054
163 Barabanki Rasauli 8 0.0537 10 0.1363
164 Barabanki Sidhaur 9 0.0638 10 0.0630
165 Barabanki Kotwa Sarai 8 0.0497 6 0.3244
166 Barabanki Datauli Chanda 7 0.1425 10 0.0531

218
Sl
No.
District Location Pre-Monsoon Post-Monsoon
Data
Points
Pre Rise
(m/year)
Pre Fall
(m/year)
Data
Points
Post
Rise
(m/year)
Post Fall
(m/year)
167 Barabanki Chaubisi 7 0.0189 10 0.1980
168 Barabanki Trivediganj 9 0.0281 10 0.0838
169 Barabanki Bhiwal 9 0.1127 10 0.0105
170 Barabanki Kaisarganj Pz
(Gwd)
4 6 0.1236
171 Barabanki Puredalai Pz (Gwd) 5 6 0.5365
172 Bareilly Nawabganj1 9 0.0433 9 0.2837
173 Bareilly Bareilly1 9 0.1307 10 0.0859
174 Bareilly Aliganj 6 0.0598 4
175 Bareilly Shishgarh 8 0.2957 10 0.0861
176 Bareilly Bhuta 5 10 0.1007
177 Bareilly Baheri 9 0.2280 10 0.0453
178 Bareilly Ramnagar2 6 0.3577 9 0.2516
179 Bareilly Shahi Pz Gwd 7 0.0693 9 0.0222
180 Bareilly Mirganj Pz Gwd 9 0.1574 10 0.0746
181 Bareilly Bhitora Pz Gwd 6 0.0792 7 0.1816
182 Bareilly Itaura Sukhdevpur
Pz Gwd
6 0.0200 7 0.0373
183 Bareilly Kandharpur Pz
Gwd
6 0.0166 10 0.0634
184 Bareilly Siroli Pz Gwd 1 7 0.3993
185 Bareilly Bhojipura Pz Gwd 9 0.0313 8 0.0311
186 Basti Basti 9 0.0468 10 0.0024
187 Basti Haraiya 9 0.0198 10 0.0953
188 Basti Bhanpur 9 0.1996 10 0.0623
189 Basti Captainganj1 7 0.0164 10 0.0252
190 Basti Kharauan Jat 9 0.1182 10 0.0540
191 Basti Kalwari 7 0.0069 10 0.1102
192 Basti Bhikamjot 9 0.0238 8 0.0872
193 Basti Rudauli Pz (Gwd} 5 6 0.1684
194 Bijnor Swaheri Khurd 9 0.2765 10 0.0300
195 Bijnor Chandok 8 0.0855 10 0.0174
196 Bijnor Bijnor Pz Gwd 7 0.2049 6 0.0400
197 Bijnor Sneh Rd.Rly.Stn. 7 0.4122 6 0.2080
198 Bijnor Sarakthal 9 0.0581 10 0.1320
199 Bijnor Milak Beniram 8 0.0809 10 0.2035

219
Sl
No.
District Location Pre-Monsoon Post-Monsoon
Data
Points
Pre Rise
(m/year)
Pre Fall
(m/year)
Data
Points
Post
Rise
(m/year)
Post Fall
(m/year)
200 Bijnor Najibabad New 9 0.0801 10 0.1980
201 Budaun Qadar Chowk Pz
Gwd
7 0.4157 6 0.5049
202 Budaun Ujhani Pz Gwd 9 0.8899 10 0.8408
203 Budaun Kolhai Pz Gwd 6 0.5032 6 0.4565
204 Budaun Dabthara Shyam Pz
Gwd
8 0.2549 8 0.9140
205 Budaun Mansa Nagla Pz
Gwd
9 0.6856 10 0.7104
206 Budaun Wazirganj Pz Gwd 5 7 0.6864
207 Budaun Sarauriya Pz Gwd 5 6 0.7808
208 Budaun Asafpur Pz Gwd 9 0.5769 9 0.6049
209 Budaun Daharpur Pz Gwd 5 6 0.3768
210 Budaun Badaun Pz Gwd 8 0.6728 7 0.6576
211 Bulandshahr Nandpur 4 7 0.0783
212 Bulandshahr Batli 5 6 0.0904
213 Bulandshahr Daulatpur Khurd
Ew/Pz
3 8 0.4120
214 Bulandshahr Lakhaothi Pz 8 0.4925 9 0.2262
215 Bulandshahr Sikandrabad 1 8 0.0281 8 0.0201
216 Chandauli Chandauli 7 0.1292 8 0.1536
217 Chandauli Naugarh 7 0.1030 7 0.0822
218 Chandauli Dhanpur 9 0.1993 10 0.1320
219 Chandauli Sakaldiha 7 0.1519 9 0.0215
220 Chandauli Kamalpur 8 0.4749 10 0.1571
221 Chandauli Chahania 6 0.6625 7 0.0360
222 Chandauli Mugal Sarai 8 0.2027 8 0.0067
223 Chandauli Marufpur Xing 8 0.5696 10 0.5281
224 Chandauli Chakia 8 0.0990 10 0.0108
225 Chandauli Baburi 3 8 0.1004
226 Chandauli Chandraprabha 5 8 0.0105
227 Chitrakoot Pahari Buzurg New 4 6 0.0240
228 Chitrakoot Karwi 9 0.1004 10 0.2530
229 Chitrakoot Mau 7 0.0375 10 0.3595
230 Chitrakoot Manikpur 10 0.3704 10 0.1902
231 Chitrakoot Raipura 10 0.1038 10 0.0938
232 Chitrakoot Chiwalaha 5 8 0.6208

220
Sl
No.
District Location Pre-Monsoon Post-Monsoon
Data
Points
Pre Rise
(m/year)
Pre Fall
(m/year)
Data
Points
Post
Rise
(m/year)
Post Fall
(m/year)
233 Chitrakoot Bhaunri 9 0.3248 9 0.2369
234 Chitrakoot Jorwara 10 0.3147 10 0.0108
235 Chitrakoot Chakrajafar 5 10 0.3916
236 Deoria Deoria2 9 0.0578 10 0.1007
237 Deoria Gauri Bazar 6 0.3109 10 0.1600
238 Deoria Desai Deoria 9 0.3102 9 0.0060
239 Deoria Baitalpur 5 10 0.0851
240 Deoria Rampur Karkhana 8 0.3121 10 0.1188
241 Deoria Pathardewa(Naraya
Npur
6 0.1443 10 0.1620
242 Deoria Rudrapur1 7 0.0530 7 0.1342
243 Deoria Ratasia Kothi 5 9 0.0144
244 Deoria Lar Road 5 9 0.1030
245 Etah Jalesar Pz- Gwd 6 0.6057 7 0.0295
246 Etah Sakit Pz-Gwd 6 0.6973 7 0.4181
247 Etah Etah Pz-Gwd 7 0.7398 8 0.6266
248 Etah Jaithra Pz-Gwd 6 0.5559 8 0.7108
249 Etah Marahchi Pz-Gwd 7 0.3863 8 0.2695
250 Etah Sidhpura Pz-Gwd 7 0.2399 8 0.1394
251 Etah Amanpur Pz-Gwd 7 0.2932 8 0.1217
252 Etah Daryaganj 9 0.4150 9 0.3926
253 Etah Dhumri1 7 0.0966 9 0.0492
254 Etah Locha 8 0.4625 8 0.5335
255 Etawah Barecha 9 0.0461 9 0.0740
256 Etawah Pz Gwd Jaswant
Nagar
6 1.0970 8 1.1618
257 Etawah Sabdalpur 2 6 0.0584
258 Etawah Patya Chaturpur 7 0.2822 7 0.3642
259 Etawah Ujhayani 6 0.0814 7 0.0242
260 Etawah Bharthana2 5 8 0.1601
261 Etawah Bakewar 9 0.2284 9 0.3604
262 Faizabad Naokua 8 0.1601 9 0.1392
263 Faizabad Bakarganj 9 0.1460 9 0.0206
264 Faizabad Sakhupura 5 8 0.0774
265 Faizabad Milkipur 5 7 0.1007
266 Faizabad Chaure Bazar 6 0.4249 9 0.1590

221
Sl
No.
District Location Pre-Monsoon Post-Monsoon
Data
Points
Pre Rise
(m/year)
Pre Fall
(m/year)
Data
Points
Post
Rise
(m/year)
Post Fall
(m/year)
267 Faizabad Madhopur 5 9 0.1182
268 Faizabad Faizabad Pz-Cgwb 4 7 0.2516
269 Faizabad Gosaiganj Pz-Gwd 6 0.0017 8 0.0877
270 Faizabad Amaniganj 7 0.0212 6 0.0140
271 Faizabad Khajurahat 3 6 0.0838
272 Faizabad Sarai Rasi 2 6 0.1076
273 Faizabad Gosaiganj-New 3 7 0.1795
274 Farrukhabad Rajepur 9 0.2283 10 0.4045
275 Farrukhabad Pz Gwd
Shamshabad
6 0.8511 9 0.8326
276 Fatehpur Jahanabad 4 7 0.4821
277 Fatehpur Bindki1 9 0.6660 10 0.7840
278 Fatehpur Umradipur 8 0.1706 7 0.0344
279 Fatehpur Bela 10 0.0987 10 0.0684
280 Fatehpur Sarain Bakewar 9 0.3560 9 0.1598
281 Fatehpur Musfha 8 0.8674 10 0.3304
282 Fatehpur Naubasta 4 8 0.1985
283 Fatehpur Barwa 9 1.6514 9 1.0847
284 Fatehpur Bahua 4 9 0.4167
285 Fatehpur Lalauli 10 0.0409 10 0.0918
286 Fatehpur Asother 10 0.1465 10 0.0829
287 Firozabad Madanpur Pz-Gwd 8 1.2902 8 1.0206
288 Firozabad Shikohabad Pz-
Gwd
7 0.6504 9 0.5553
289 Firozabad Araon Pz Gwd 8 0.7746 9 0.6997
290 Firozabad Jasrana Pz Gwd 8 0.5142 10 0.3086
291 Gautam
Buddha Nagar
Sector-72 Pz 7 2.6725 8 2.1386
292 Gautam
Buddha Nagar
Sector-92 Pz 7 0.5197 7 0.6150
293 Gautam
Buddha Nagar
Sector- 62 A Pz 7 2.2084 9 1.9874
294 Gautam
Buddha Nagar
Chauki Pz 8 0.0609 7 0.0489
295 Gautam
Buddha Nagar
Jewar- Pz 9 0.6576 9 0.2900
296 Gautam
Buddha Nagar
Dhankaur 5 7 0.1331

222
Sl
No.
District Location Pre-Monsoon Post-Monsoon
Data
Points
Pre Rise
(m/year)
Pre Fall
(m/year)
Data
Points
Post
Rise
(m/year)
Post Fall
(m/year)
297 Ghaziabad Modi Nagar-Pz I 9 0.2402 8 0.2010
298 Ghaziabad Modi Nagar-Pz Ii 10 0.3245 10 0.1603
299 Ghaziabad Hapur-Pz 10 0.5929 10 0.5826
300 Ghaziabad Garhmukteshwar-
Pz
10 0.1898 10 0.2227
301 Ghaziabad Badauli-Hapur-Pz 4 6 0.7009
302 Ghaziabad Bhojpur-Pz 6 0.6080 7 0.5238
303 Ghaziabad Azad Nagar-Pz 7 0.9082 7 0.6547
304 Ghaziabad Upheda-Pz 8 0.6495 8 0.4770
305 Ghaziabad Dhaulana-Pz 10 0.1305 6 0.1701
306 Ghaziabad Morta Pz Gwd 7 0.6262 8 0.6749
307 Ghazipur Baresar 9 0.2097 9 0.3176
308 Ghazipur Ajaipur 8 0.2880 8 0.6421
309 Ghazipur Nandganj 6 0.4165 8 0.5150
310 Ghazipur Deoria 9 0.2629 9 0.0110
311 Ghazipur Gahmar 10 0.3791 9 0.4981
312 Ghazipur Dildar Nagar 10 0.1644 9 0.0205
313 Ghazipur Mohammadabad2 7 0.4084 8 0.4896
314 Ghazipur Kasimabad 3 6 0.5253
315 Ghazipur Karimuddinpur 4 8 0.4828
316 Ghazipur Sadikapur 9 0.5255 9 0.1605
317 Ghazipur Pyrepur 10 0.2375 8 0.1091
318 Ghazipur Orulari 10 0.0360 9 0.0010
319 Ghazipur Ghazipur (Urban) 8 0.0302 5
320 Ghazipur Saidpur 1 8 0.2482 8 0.0489
321 Ghazipur Mardah 6 0.5791 4
322 Ghazipur Tanda Bairakh 5 7 0.3462
323 Gonda Mankapur 9 0.0667 10 0.0724
324 Gonda Birpur Katra 9 0.1908 10 0.0789
325 Gonda Parsa Gondri 9 0.0366 10 0.0053
326 Gonda Chapiya 5 9 0.1604
327 Gonda Bhauriganj 6 0.0598 9 0.0003
328 Gonda Gonda (Urban) 7 0.1219 8 0.1730
329 Gonda Kazi Dewar 6 0.1771 8 0.2739
330 Gonda Karnailganj Pz
(Gwd)
5 6 0.2807

223
Sl
No.
District Location Pre-Monsoon Post-Monsoon
Data
Points
Pre Rise
(m/year)
Pre Fall
(m/year)
Data
Points
Post
Rise
(m/year)
Post Fall
(m/year)
331 Gorakhpur Kauriram 9 0.0498 10 0.0271
332 Gorakhpur Jagdishpur1 8 0.2425 10 0.0253
333 Gorakhpur Geruababu 4 9 0.1092
334 Gorakhpur Dubauli 6 0.0361 9 0.0844
335 Hamirpur Rath 6 0.4700 6 1.2395
336 Hamirpur Dhagwan 7 0.3267 10 0.0034
337 Hamirpur Bewar 9 0.7207 8 0.4799
338 Hamirpur Lalpura 6 0.5474 5
339 Hamirpur Maudaha 6 0.2132 6 0.2845
340 Hamirpur Kharela 6 0.1377 3
341 Hamirpur Khanna 10 0.3634 9 0.1284
342 Hamirpur Kapsa 5 9 0.1869
343 Hamirpur Kunetha 9 0.3376 9 0.5225
344 Hardoi Pihani 7 0.0946 10 0.0078
345 Hardoi Sahabadpur 6 0.2136 9 0.2250
346 Hardoi Del Panderwa 8 0.0715 8 0.1759
347 Hardoi Kachauna 7 0.0804 10 0.1260
348 Hardoi Gopamau 6 0.0652 10 0.0926
349 Hardoi Dhobia 9 0.0515 10 0.0550
350 Hardoi Barganwar 6 0.0826 8 0.0393
351 Hardoi Mohammadpur 4 6 0.0759
352 Hardoi Marhia 4 6 0.1602
353 Hardoi Dalel Nagar Rly 7 0.0198 8 0.1459
354 Hardoi Gangau 8 0.1159 9 0.0427
355 Hardoi Bhadaial 7 0.2035 7 0.0947
356 Hardoi Ahrori 7 0.1199 7 0.2406
357 Hardoi Harpalpur Pz-Gwd 6 0.4009 8 0.2336
358 Hardoi Bawan Pz-Gwd 6 0.1244 7 0.0443
359 Hardoi Barkhani Pz-Gwd 6 0.4454 6 0.3145
360 Hardoi Sursa (Gwd Pz) 3 6 0.1122
361 Hardoi Kachauna (Gwd
Pz)
4 6 0.9572
362 Hardoi Panch Deora 3 8 0.2109
363 Hardoi Gokul Behta 3 7 0.0534
364 Hardoi Manjila 8 0.0887 8 0.1312
365 Hathras Purdil Nagar 6 0.3385 4

224
Sl
No.
District Location Pre-Monsoon Post-Monsoon
Data
Points
Pre Rise
(m/year)
Pre Fall
(m/year)
Data
Points
Post
Rise
(m/year)
Post Fall
(m/year)
366 Hathras Sikandara Rao 4 8 0.0648
367 Hathras Thulai 7 0.1328 7 0.7065
368 Hathras Iglas 9 0.6851 10 0.5665
369 Hathras Rattika Nagla 8 0.0718 8 0.0988
370 Hathras Hasyan 6 0.1686 7 0.4083
371 Jalaun Konch(New) 9 0.0003 10 0.0756
372 Jalaun Babina-New 9 0.1578 9 0.0171
373 Jalaun Keolari-New 8 0.0670 10 0.0369
374 Jalaun Madhogarh 7 0.1118 8 0.0958
375 Jalaun Marora 7 0.4259 9 0.0875
376 Jalaun Kusumilia 7 1.0530 8 0.1001
377 Jalaun Sirsakalar 6 0.1839 8 0.1342
378 Jalaun Umri 7 0.0961 8 0.4956
379 Jalaun Kamsaira 7 0.1600 7 0.3304
380 Jalaun Hardoi Gujar 4 8 0.0419
381 Jalaun Ait2 4 9 0.0819
382 Jalaun Kalpi 9 0.2583 10 0.3444
383 Jalaun Jalaun 6 0.3613 10 0.5622
384 Jalaun Orai 14 0.3144 13 0.2057
385 Jalaun Gohan 9 0.4059 10 0.3143
386 Jalaun Chhota Rampur 7 0.9184 6 1.6356
387 Jalaun Ata 9 0.4759 10 0.2587
388 Jalaun Hadrukh 9 1.2018 9 0.7916
389 Jalaun Damras 7 0.5776 10 0.7261
390 Jalaun Musaria 8 1.3720 6 2.1464
391 Jalaun Churkhi 8 0.6704 10 0.4787
392 Jalaun Rajpura 14 0.0867 10 0.0880
393 Jalaun Kanasi 8 0.2534 10 0.1406
394 Jalaun Dekor 9 0.4350 10 0.3650
395 Jalaun Kailaiya 9 0.1704 10 0.1100
396 Jalaun Mahewa 7 0.7054 8 0.3336
397 Jalaun Jagmanpur 5 7 0.0946
398 Jalaun Kishora Mauza 8 0.1000 9 0.0883
399 Jalaun Gopalpura1 8 0.0271 7 0.4322
400 Jaunpur Machhalishahr 7 0.0450 9 0.0172
401 Jaunpur Shahganj1 5 7 0.0540

225
Sl
No.
District Location Pre-Monsoon Post-Monsoon
Data
Points
Pre Rise
(m/year)
Pre Fall
(m/year)
Data
Points
Post
Rise
(m/year)
Post Fall
(m/year)
402 Jaunpur Maharajganj2 8 0.0514 8 0.0096
403 Jaunpur Honipur 7 0.0138 7 0.0636
404 Jaunpur Itaili (Muftiganj) 5 6 0.1771
405 Jaunpur Rampur1 7 0.6422 9 0.5572
406 Jaunpur Kheta Sarai1 6 0.2942 7 0.1017
407 Jaunpur Chandwak 4 7 0.1954
408 Jaunpur Mehreon1 6 0.0863 6 0.0214
409 Jaunpur Raja Bazar 8 0.1478 9 0.0820
410 Jaunpur Sigra Mau 8 0.1755 9 0.2181
411 Jaunpur Barai Par 4 6 0.1296
412 Jaunpur Dhiuraha 2 6 0.5796
413 Jaunpur Hasanpur 4 8 0.1205
414 Jaunpur Tarti 5 9 0.1386
415 Jaunpur Pisara 6 0.3456 7 0.0174
416 Jaunpur Sarpatha 7 0.5841 6 0.3499
417 Jaunpur Barji Kalan 5 7 0.1208
418 Jaunpur Marihun 7 0.2396 8 0.1288
419 Jaunpur Mungra
Badshahpur
7 0.0799 7 0.1212
420 Jaunpur Narar(Jamnipur) 8 0.1096 9 0.0063
421 Jaunpur Janghai 6 0.0380 9 0.1305
422 Jaunpur Maheshganj 7 0.2311 8 0.0996
423 Jhansi Bamaur 6 0.0683 8 0.0660
424 Jhansi Khillawari 9 0.4281 10 0.2460
425 Jhansi Sakrar 1 7 0.3690 9 0.2169
426 Jhansi Auldan-New 8 0.2248 10 0.1445
427 Jhansi Ajneri Madhopura 9 0.1891 9 0.0659
428 Jhansi Kuangaon 3 6 0.7843
429 Jhansi Mauranipur
Rajpaharia
8 0.1570 9 0.2047
430 Jhansi Ghugawa 7 0.1544 8 0.5086
431 Jhansi Moth 9 0.0312 10 0.0062
432 Jhansi Samthar 9 0.1591 10 0.1569
433 Jhansi Semri 9 0.0319 10 0.0633
434 Jhansi Barua Sagar 7 0.8424 4
435 Jhansi Punch 6 0.1647 7 0.0346

226
Sl
No.
District Location Pre-Monsoon Post-Monsoon
Data
Points
Pre Rise
(m/year)
Pre Fall
(m/year)
Data
Points
Post
Rise
(m/year)
Post Fall
(m/year)
436 Jhansi Farida 5 7 0.1815
437 Jhansi Rewan 7 0.3163 9 0.0444
438 Jhansi Babina1 8 0.0468 10 0.1186
439 Jhansi Khailara 9 0.1877 10 0.0019
440 Jhansi Jhansi1 14 0.1734 11 0.2898
441 Jhansi Raksa 9 0.0389 10 0.0174
442 Jyotiba Phule
Nagar
Dhanaura Pz Cgwb 7 0.2168 7 0.0225
443 Jyotiba Phule
Nagar
Matlabpur Pz Gwd 8 0.0529 9 0.0019
444 Jyotiba Phule
Nagar
Gajraula Pz Gwd 9 0.4303 10 0.5693
445 Jyotiba Phule
Nagar
Jogipura Pz Gwd 9 0.3174 9 0.1098
446 Jyotiba Phule
Nagar
Daurala Pz Gwd 7 0.3087 6 0.2056
447 Jyotiba Phule
Nagar
Hasanpur Pz Gwd 8 0.4610 9 0.6040
448 Jyotiba Phule
Nagar
Bagadpur Pz Gwd 9 0.8493 9 0.8790
449 Jyotiba Phule
Nagar
Joya Pz Gwd 7 0.5350 8 0.5090
450 Jyotiba Phule
Nagar
Amroha Pz Cgwb 7 0.5301 8 0.4320
451 Kannauj Chibramau Pz-Gwd 7 1.1837 8 0.9072
452 Kannauj Haseran Pz-Gwd 7 0.0105 7 0.0401
453 Kannauj Jalalabad Pz-Gwd 7 0.8171 8 0.5033
454 Kannauj Kharni Pz-Gwd 7 0.5726 8 0.3339
455 Kannauj Tirwaganj 7 0.4391 8 0.0574
456 Kannauj Kannauj1 6 0.1363 7 0.0417
457 Kanpur Dehat Pukhrayan1 5 8 0.2364
458 Kanpur Dehat Baghpur 6 0.3227 9 0.0628
459 Kanpur Dehat Kadari 6 0.0052 8 0.0320
460 Kanpur Dehat Roura 5 10 0.0791
461 Kanpur Dehat Muhammadpur 7 0.5948 10 0.6005
462 Kanpur Dehat Jaunra 2 6 0.1643
463 Kanpur Dehat Kainjari 8 0.1603 9 0.1092
464 Kanpur Nagar Ramsari 6 0.0900 7 0.2201

227
Sl
No.
District Location Pre-Monsoon Post-Monsoon
Data
Points
Pre Rise
(m/year)
Pre Fall
(m/year)
Data
Points
Post
Rise
(m/year)
Post Fall
(m/year)
465 Kanpur Nagar Sachendi 9 0.1954 9 0.0184
466 Kanpur Nagar Niwada Dhamni 6 0.3828 8 0.3294
467 Kanpur Nagar Sarh 9 0.2704 9 0.0650
468 Kanpur Nagar Narmau(New) 8 0.1190 9 0.0030
469 Kanpur Nagar Motipura 9 0.1686 9 0.1689
470 Kanpur Nagar Bhaisana 7 0.0044 7 0.2927
471 Kanpur Nagar Baradari 7 0.1234 8 0.0200
472 Kanpur Nagar Chaubepur1 9 0.1271 9 0.0401
473 Kanpur Nagar Bithoor-Nganj 9 0.0374 9 0.0012
474 Kanpur Nagar Bidhnu 9 0.0352 9 0.0944
475 Kaushambi Kasia 6 0.2296 7 0.5765
476 Kaushambi Sallahpur 6 0.0115 8 0.0733
477 Kaushambi Mandari 4 7 0.3204
478 Kaushambi Lehdari 9 0.0209 8 0.1459
479 Kaushambi Sarai Akil 7 0.3904 6 0.2478
480 Kaushambi Usargaura 8 0.0215 8 0.4047
481 Kaushambi Kushambhi 8 0.1411 8 0.1060
482 Kheri Chandan Chowki 8 0.0177 10 0.0252
483 Kheri Mailani 5 7 0.1818
484 Kheri Chamlapur 5 9 0.0100
485 Kheri Asogapur 9 0.0475 10 0.1440
486 Kheri Chauapur 6 0.0587 10 0.0669
487 Kheri Dudhwa F.R.H. 9 0.0646 10 0.0416
488 Kheri Bijua 3 6 0.0204
489 Kheri Jhandi Raj 7 0.0157 8 0.1149
490 Kushinagar Naurangia 6 0.2868 10 0.0020
491 Kushinagar Belwa 6 0.0743 5
492 Kushinagar Chittauni 8 0.2428 10 0.0654
493 Kushinagar Rambar 9 0.1200 10 0.1976
494 Kushinagar Mathauli 5 10 0.0113
495 Kushinagar Mansurganj 7 0.1413 10 0.0280
496 Lalitpur Talbhet-New 9 0.0514 9 0.0475
497 Lalitpur Jakhaura1 8 0.1019 9 0.1427
498 Lalitpur Bar 7 0.4387 10 0.0342
499 Lalitpur Betna 4 9 0.0901
500 Lalitpur Saidpur 4 9 0.0238

228
Sl
No.
District Location Pre-Monsoon Post-Monsoon
Data
Points
Pre Rise
(m/year)
Pre Fall
(m/year)
Data
Points
Post
Rise
(m/year)
Post Fall
(m/year)
501 Lalitpur Mahroni 1 3 8 0.2751
502 Lalitpur Talbhet-Iii 4 6 0.0787
503 Lalitpur Silawan 6 0.3318 8 0.3685
504 Lalitpur Lalitpur 9 0.2125 10 0.0432
505 Lalitpur Amjhara Ghati 9 0.0292 9 0.0305
506 Lalitpur Bansi 9 0.4097 10 0.1820
507 Lalitpur Hisar Kalan 9 0.0040 10 0.0061
508 Lalitpur Digwar 5 10 0.0870
509 Lalitpur Jakhlaun 9 0.0286 10 0.0853
510 Lalitpur Khitwans 10 0.1243 10 0.0604
511 Lucknow Mohanlalganj 8 0.0249 10 0.2625
512 Lucknow Itaunja 11 0.0630 12 0.0832
513 Lucknow Gosaiganj1 9 0.0918 10 0.0580
514 Lucknow Rakabganj Crossing 7 0.6871 8 0.3772
515 Lucknow Nagram 8 0.0211 10 0.0796
516 Lucknow Arjunganj 5 6 0.6174
517 Lucknow Bakshi Ka Talab 9 0.9638 4
518 Lucknow Khawas Khera 7 0.0198 9 0.0258
519 Lucknow Munshiganj 9 0.0523 10 0.0684
520 Lucknow Bijnor 8 0.5768 10 0.4030
521 Lucknow Fatehganj 9 0.8823 10 0.5206
522 Lucknow Kathwara 7 0.3650 6 0.2402
523 Lucknow Mohanlalganj 9 0.0323 8 0.3176
524 Lucknow Rehman Khera 10 0.1882 6 0.1685
525 Lucknow Behta Bazar 6 0.3126 7 0.6042
526 Lucknow Nigohan1 7 0.0813 3
527 Lucknow Cantt 8 1.4620 6 1.7203
528 Lucknow River Bank Colony 8 1.2279 8 1.1110
529 Lucknow Rehta 8 0.7138 9 0.5095
530 Lucknow Arya Nagar 8 0.3098 9 0.2179
531 Lucknow Tejkishan Khera 8 0.4692 8 0.0169
532 Lucknow Kumrahawan 10 0.1302 9 0.2658
533 Lucknow Malihabad 9 0.5890 10 0.4034
534 Lucknow Gulistan Colony 9 0.9004 8 1.0596
535 Lucknow New Hyderabad 6 1.4244 5
536 Lucknow Itaunja 10 0.1340 10 0.0211

229
Sl
No.
District Location Pre-Monsoon Post-Monsoon
Data
Points
Pre Rise
(m/year)
Pre Fall
(m/year)
Data
Points
Post
Rise
(m/year)
Post Fall
(m/year)
537 Lucknow Bakshi Ka Talab 10 0.4167 10 0.3737
538 Lucknow Lu New Campus 10 1.0466 10 1.0867
539 Lucknow Rahimabad 6 0.5276 8 0.2235
540 Lucknow Bhatoiya 6 0.6975 6 0.6544
541 Lucknow Mal 9 0.8123 9 0.5113
542 Lucknow Lu Old Campus 6 1.7268 4
543 Lucknow Aat Garhi Sonra 6 1.2284 9 0.5331
544 Lucknow Vikasnagar 10 1.5324 9 1.6666
545 Mahoba Kulpahar2 10 0.1441 9 0.1728
546 Mahoba Teiya1 7 0.4475 10 0.5200
547 Mahoba Bela Tal 8 0.0635 10 0.3175
548 Mahoba Kashipura 10 0.0682 10 0.3666
549 Mahoba Charkhari 9 0.3751 10 0.0612
550 Mahoba Pipramauf 6 0.2382 6 0.4357
551 Mahrajganj Maharajganj2 8 0.2006 10 0.0258
552 Mahrajganj Siswa Bazar 9 0.3000 10 0.0869
553 Mahrajganj Ghughali 9 0.0435 10 0.0191
554 Mahrajganj Kukesar 5 10 0.1514
555 Mahrajganj Koluhi 8 0.3026 10 0.1346
556 Mainpuri Kuraoli Pz-Gwd 7 0.3379 8 0.2143
557 Mainpuri Sultanganj Pz-Gwd 7 0.4517 8 0.3567
558 Mainpuri Kishni Pz-Gwd 5 8 0.1245
559 Mainpuri Bewarpz-Gwd 7 0.1035 8 0.2719
560 Mainpuri Nagal Bhujia 6 0.1140 5
561 Mainpuri Katra Saman 8 0.1422 10 0.0750
562 Mainpuri Ghirore 5 8 0.0067
563 Mathura Jamunapar Thana 7 0.0575 9 0.1278
564 Mathura Pirsua 7 0.0447 9 0.0121
565 Mathura Kharab 6 0.0598 9 0.0148
566 Mathura Chhata New 9 0.1926 10 0.0467
567 Mathura Nagra Chhitar
Singh
9 0.0245 10 0.0298
568 Mathura Mat 6 0.2526 7 0.3031
569 Mathura Baldeo 9 0.1780 10 0.0249
570 Mathura Surir (New) 8 0.2205 10 0.2245
571 Mathura Paintha 9 0.1577 10 0.0443

230
Sl
No.
District Location Pre-Monsoon Post-Monsoon
Data
Points
Pre Rise
(m/year)
Pre Fall
(m/year)
Data
Points
Post
Rise
(m/year)
Post Fall
(m/year)
(Govardhan)
572 Mathura Barsana 8 0.4691 8 0.2545
573 Mathura Jhinga Nagla 9 0.0454 10 0.1177
574 Mathura Kosi 9 0.1896 9 0.1401
575 Mathura Jachoda 9 0.1188 9 0.0001
576 Mathura Sahar1 9 0.2644 9 0.0336
577 Mathura Saunkh 9 0.1640 9 0.2216
578 Mau Dhorighat 10 0.3708 10 0.2136
579 Mau Jejawali 9 0.2096 10 0.1082
580 Mau Amila 5 7 0.1508
581 Mau Ghosi 10 0.2714 10 0.0850
582 Mau Kapaganj 5 7 0.0841
583 Mau Ratanpura 7 0.9029 7 0.4344
584 Meerut Timikia Kothi Pz I 7 0.0980 6 1.0535
585 Meerut Sakoti Tanda Pz 10 0.1302 8 0.1238
586 Meerut Parikshat Garh Pz 8 0.4459 8 0.3387
587 Meerut Chota Mawana Pz 7 0.3481 8 0.4874
588 Meerut Kaili Pz 9 0.6276 10 1.0992
589 Meerut Machhara
Shallowpz
9 0.2627 10 0.4263
590 Meerut Hastinapur 1 8 0.0253 9 0.0525
591 Meerut Sisauli 5 6 0.7751
592 Meerut Meerut Pz 8 0.0092 9 0.3265
593 Mirzapur Mirzapur 7 0.2372 9 0.4262
594 Mirzapur Marihan 2 9 0.0049
595 Mirzapur Ahraura 7 0.0212 10 0.0585
596 Mirzapur Lalganj 9 0.2305 10 0.0137
597 Mirzapur Halia 8 0.3502 10 0.1481
598 Mirzapur Lohangpur 6 0.5611 9 0.2029
599 Mirzapur Adalhat 8 0.2121 9 0.1714
600 Mirzapur Kunabimar 4 7 1.1602
601 Mirzapur Gaipura 6 0.4156 9 0.0365
602 Mirzapur Barhanchuan 8 0.1811 10 0.1724
603 Mirzapur Gopalpur 5 10 0.5290
604 Mirzapur Baghura 8 0.3008 10 0.0777
605 Moradabad Asmauli Pz Gwd 6 0.7223 6 1.0425

231
Sl
No.
District Location Pre-Monsoon Post-Monsoon
Data
Points
Pre Rise
(m/year)
Pre Fall
(m/year)
Data
Points
Post
Rise
(m/year)
Post Fall
(m/year)
606 Moradabad Bahjoi Pz Gwd 9 0.5019 10 0.5721
607 Moradabad Maukather Pz Gwd 6 0.6287 6 0.5330
608 Moradabad Sahapura Sirpura-
Pz
6 0.8360 5
609 Moradabad Chandausi-Pz 9 0.6844 8 0.6159
610 Moradabad Moradabad-Pz 6 0.4378 6 0.5757
611 Moradabad Thakurdwara 8 0.1151 10 0.1327
612 Moradabad Fauladpur 8 0.0576 9 0.2115
613 Moradabad Painapur 7 0.0356 10 0.1824
614 Moradabad Karanpur Pz Gwd 7 0.0942 6 0.0763
615 Moradabad Dingarpur Pz Gwd 9 0.4689 10 0.3840
616 Moradabad Mahmudpurmafi Pz
Gwd
9 0.5385 9 0.5134
617 Moradabad Moradabad Pz Gwd 9 0.1344 9 0.0645
618 Moradabad Fatehulla Ganj Pz
Gwd
7 0.5329 6 0.1585
619 Muzaffarnagar Sukratal 6 0.2689 9 0.0263
620 Muzaffarnagar Inchauli(Ratanpuri)
Pz Gwd
5 6 0.2373
621 Muzaffarnagar Paldi Pz Gwd 8 0.8121 7 0.4345
622 Muzaffarnagar Khatauli Pz (Gwd) 8 0.0448 7 0.0241
623 Muzaffarnagar Shamli Pz Gwd 8 0.3801 7 0.0110
624 Muzaffarnagar Kukra-Sadar Pz 8 0.3707 9 0.2783
625 Muzaffarnagar Un Pz 8 2.0040 9 1.9856
626 Muzaffarnagar Kamalpur Pz 8 0.0683 4
627 Muzaffarnagar Baghra Pz 9 0.7003 8 0.3083
628 Muzaffarnagar Morna Pz 10 0.2280 8 0.8160
629 Muzaffarnagar Chartawal 5 7 0.1936
630 Pilibhit Madho Tanda Pz
Gwd
7 0.1035 8 0.0339
631 Pilibhit Puranpur Pz Gwd 9 0.0076 10 0.0353
632 Pilibhit Jeora Kalyanpur 8 0.0616 10 0.0076
633 Pilibhit Faradia 5 10 0.0634
634 Pilibhit Gajraula1 6 0.0659 10 0.0166
635 Pilibhit Bhamora 9 0.0037 10 0.0669
636 Pilibhit Baldeopur 4 7 0.0494
637 Pilibhit Bargad Chauraha 8 0.0580 8 0.0307

232
Sl
No.
District Location Pre-Monsoon Post-Monsoon
Data
Points
Pre Rise
(m/year)
Pre Fall
(m/year)
Data
Points
Post
Rise
(m/year)
Post Fall
(m/year)
638 Pilibhit Jahanabad1 8 0.0322 10 0.0298
639 Pilibhit Bilsanda1 5 9 0.0858
640 Pilibhit Pilibhit Pz Gwd 9 0.0342 10 0.0216
641 Pilibhit Bilaspur Pz Gwd 8 0.0042 9 0.0804
642 Pratapgarh Raniganj 8 0.1503 7 0.0885
643 Pratapgarh Sangramgarh 9 0.0222 8 0.1581
644 Pratapgarh Ateha 6 0.0525 8 0.1953
645 Pratapgarh Sangipur 8 0.1450 7 0.4409
646 Pratapgarh Dih Balri 7 0.0989 7 0.2013
647 Pratapgarh Mandhata 10 0.0646 8 0.1116
648 Pratapgarh Delhupur 10 0.0747 7 0.1278
649 Pratapgarh Mohanganj 8 0.0137 8 0.2034
650 Pratapgarh Gaura 9 0.1027 6 0.0809
651 Pratapgarh Nanasukul Purwa 9 0.0307 8 0.1966
652 Pratapgarh Rampur Batauli 8 0.0164 7 0.4415
653 Pratapgarh Maddupur 6 0.0355 7 0.0401
654 Pratapgarh Jathwara 6 0.0352 8 0.1054
655 Pratapgarh Kohdaur 9 0.1757 8 0.2129
656 Pratapgarh Bhusar 8 0.0642 8 0.0213
657 Pratapgarh Lalganj2 9 0.1860 8 0.2562
658 Pratapgarh Udai Shahpur 5 6 0.6480
659 Pratapgarh Lalgopalganj 10 0.1855 8 0.1493
660 Pratapgarh Narainpur 5 6 0.5840
661 Pratapgarh Garhi Manikpur 2 7 0.5899
662 Pratapgarh Bishahia 10 0.1594 8 0.0657
663 Pratapgarh Kunda 10 0.2130 8 0.1749
664 Pratapgarh Gutni 10 0.1421 8 0.2079
665 Pratapgarh Gaura 1 4 6 0.0704
666 Rae Bareli Mohanganj1 9 0.0337 10 0.0886
667 Rae Bareli Jagatpur 8 0.0291 10 0.0101
668 Rae Bareli Jais 9 0.0242 9 0.0612
669 Rae Bareli Harchandpur 6 0.1762 8 0.3096
670 Rae Bareli Fursatganj 9 0.2106 10 0.0090
671 Rae Bareli Simrauta 8 0.0579 9 0.0315
672 Rae Bareli Bhawanigarh 8 0.2092 9 0.0192
673 Rae Bareli Simrauta(Ii) 9 0.0085 10 0.1365

233
Sl
No.
District Location Pre-Monsoon Post-Monsoon
Data
Points
Pre Rise
(m/year)
Pre Fall
(m/year)
Data
Points
Post
Rise
(m/year)
Post Fall
(m/year)
674 Rae Bareli Chauraha Dusti 9 0.0042 10 0.0361
675 Rae Bareli Kachunda 8 0.0584 10 0.0128
676 Rae Bareli Nigohan1 9 0.0488 10 0.0136
677 Rae Bareli Laxmanganjbazar 7 0.0397 10 0.0188
678 Rae Bareli Katghar 8 0.0375 10 0.0284
679 Rae Bareli Suchi 6 0.2902 6 0.4491
680 Rae Bareli Dhonda Ka Purwa 8 0.0740 10 0.0132
681 Rae Bareli Ahraura Bhawani 5 9 0.0804
682 Rae Bareli Cheek Daadar 8 0.5108 8 0.1336
683 Rae Bareli Mazzamganj Ngr 6 0.0324 6 0.3653
684 Rae Bareli Matrwa 9 0.1039 10 0.0266
685 Rae Bareli Mau Garbi 9 0.1343 10 0.0081
686 Rae Bareli Kumbhi Ka Purwa 8 0.1361 10 0.0830
687 Rae Bareli Domapur 7 0.5534 9 0.8770
688 Rae Bareli Hunsepur 6 0.9768 9 0.4463
689 Rae Bareli Binjh 6 0.4830 9 0.2683
690 Rae Bareli Dalmau-1 4 8 0.1609
691 Rae Bareli Kheron Pz (Gwd) 4 6 0.0895
692 Rae Bareli Gopalipur 9 0.1115 10 0.0311
693 Rae Bareli Rawalpur 6 0.1049 6 0.0368
694 Rampur Pahari Dis 3 6 0.1777
695 Rampur Bilaspur Pz Cgwb 5 7 0.4555
696 Rampur Shahabad Pz Gwd 7 0.3248 10 0.2632
697 Rampur Tanda 3 9 0.0021
698 Saharanpur Sunderpur1 5 9 0.5083
699 Saharanpur Ghuna 8 0.0460 8 0.0294
700 Saharanpur Mainpura Pz Gwd 6 0.3401 7 0.2418
701 Saharanpur Lundi Pz Gwd 6 0.2349 5
702 Saharanpur Siriska Pz Gwd 3 6 0.1126
703 Saharanpur Dhaula Kuan 6 0.1502 8 0.1389
704 Saharanpur Tilhari Buzurg 7 0.1193 7 0.1266
705 Saharanpur Nanauta Pz Gwd 8 0.0399 8 0.1609
706 Saharanpur Rampur Pz Gwd 7 0.2985 6 0.1554
707 Saharanpur Tikrol Pz Gwd 7 0.2037 7 0.1626
708 Saharanpur Babail Buzurg 8 0.0330 8 0.1185
709 Saharanpur Shakhambari 7 0.1443 9 0.0190

234
Sl
No.
District Location Pre-Monsoon Post-Monsoon
Data
Points
Pre Rise
(m/year)
Pre Fall
(m/year)
Data
Points
Post
Rise
(m/year)
Post Fall
(m/year)
710 Saharanpur Mohand 7 0.1413 7 0.0292
711 Saharanpur Bagh Colony 9 0.4910 7 0.0120
712 Sant Kabir
Nagar
Khalilabad 8 0.2069 9 0.0376
713 Sant Kabir
Nagar
Nathnagar 8 0.0667 9 0.1003
714 Sant Kabir
Nagar
Dhanghata 9 0.0762 8 0.0825
715 Sant Kabir
Nagar
Maidawal 9 0.0554 9 0.0423
716 Sant Ravidas
Nagar
Aurai 9 0.2961 10 0.2377
717 Sant Ravidas
Nagar
Suriyawan 5 7 0.2195
718 Sant Ravidas
Nagar
Koirauna 9 0.1744 10 0.2205
719 Sant Ravidas
Nagar
Pali1 7 0.2606 10 0.5906
720 Shahjahanpur Banda2(Pasyapur) 4 6 0.5838
721 Shahjahanpur Sidhauli 3 9 0.0852
722 Shahjahanpur Sehramau 5 6 0.0704
723 Shahjahanpur Shahjahanpur1 6 0.4137 9 0.1751
724 Shrawasti Sirsia1 8 0.1090 10 0.1597
725 Shrawasti Shrawasti 7 0.2507 9 0.0459
726 Shrawasti Laxman Nagar 7 0.2416 9 0.0450
727 Shrawasti Pratapur 9 0.0808 10 0.0634
728 Shrawasti Pakaria 9 0.0826 10 0.0246
729 Shrawasti Ratanpur 9 0.1594 10 0.0001
730 Shrawasti Bhujanga 9 0.3501 10 0.1251
731 Shrawasti Tulsipur2 9 0.0475 10 0.0211
732 Shrawasti Bhagwanpur 8 0.1575 10 0.0472
733 Shrawasti Madora Chowki 7 0.1261 10 0.0381
734 Shrawasti Dikauli 9 0.1871 9 0.0131
735 Shrawasti Lachmanpur 6 0.0516 4
736 Shrawasti Sirsia Pz(Gwd) 5 6 0.1943
737 Siddharthnagar Bansi1 9 0.2232 10 0.0513
738 Siddharthnagar Dumariaganj 8 0.1731 10 0.0434
739 Siddharthnagar Parsa 9 0.0604 10 0.0272

235
Sl
No.
District Location Pre-Monsoon Post-Monsoon
Data
Points
Pre Rise
(m/year)
Pre Fall
(m/year)
Data
Points
Post
Rise
(m/year)
Post Fall
(m/year)
740 Siddharthnagar Birdpur 9 0.1506 10 0.0971
741 Siddharthnagar Badhni 9 0.0276 10 0.0034
742 Siddharthnagar Uska 9 0.2365 10 0.0883
743 Siddharthnagar Ramnagara 9 0.1269 10 0.0735
744 Siddharthnagar Kajhai 8 0.1516 9 0.0416
745 Siddharthnagar Chilihia 9 0.2344 10 0.0376
746 Siddharthnagar Belwa Laghunahi 9 0.1278 10 0.0579
747 Siddharthnagar Itwa Pz (Gwd) 5 6 0.0727
748 Sitapur Purwara Gosai 9 0.0479 10 0.0160
749 Sitapur Jahangirabad 10 0.0091 10 0.0847
750 Sitapur Madnapur 10 0.0062 10 0.0787
751 Sitapur Hargaon 7 0.0895 10 0.1150
752 Sitapur Karauna 10 0.5444 9 0.4131
753 Sitapur Deokalia 8 0.2274 9 0.1854
754 Sitapur Biutmani 9 0.1007 10 0.1345
755 Sitapur Kutub Nagar 7 0.1701 4
756 Sitapur Manpur Chowki 6 0.3300 7 0.2862
757 Sitapur Khamaria 10 0.2978 10 0.3376
758 Sitapur Dhoudhi 5 8 0.2544
759 Sitapur Biswan2 10 0.1429 11 0.1653
760 Sitapur Misrikh1 10 0.2125 10 0.1812
761 Sitapur Sanda 7 0.0144 7 0.1317
762 Sitapur Behta 8 0.0452 7 0.2421
763 Sitapur Naimisharanya-1 6 1.0863 6 0.9270
764 Sitapur Rampur Mathura
Pz-Gwd
7 0.0365 8 0.0419
765 Sitapur Laharpur Pz-Gwd 6 0.1036 7 0.0054
766 Sitapur Maholi Pz-Gwd 7 0.1586 7 0.2715
767 Sitapur Machchretapz-Gw
D
7 0.5126 8 0.3450
768 Sonbhadra Bhagwan Nagar 8 0.5717 9 0.5319
769 Sonbhadra Dudhi 9 0.0770 10 0.1543
770 Sonbhadra Muirpur 8 0.1104 10 0.0182
771 Sonbhadra Babhani 9 0.1025 10 0.0423
772 Sonbhadra Markundi 6 0.0264 6 0.0884
773 Sonbhadra Bairpan 7 0.7505 10 0.3576

236
Sl
No.
District Location Pre-Monsoon Post-Monsoon
Data
Points
Pre Rise
(m/year)
Pre Fall
(m/year)
Data
Points
Post
Rise
(m/year)
Post Fall
(m/year)
774 Sonbhadra Jarha 9 0.0908 10 0.0423
775 Sonbhadra Dhrtidand1 6 0.1660 10 0.0682
776 Sonbhadra Anpara 7 0.0704 10 0.0518
777 Sonbhadra Gara 6 0.2654 10 0.1023
778 Sonbhadra Hatinala 8 0.2109 10 0.0600
779 Sonbhadra Chopan 8 0.4228 9 0.0777
780 Sonbhadra Renukoot 2 6 0.6715
781 Sonbhadra Ghorawal1 6 0.4264 10 0.0956
782 Sonbhadra Shahganj 4 8 0.1994
783 Sonbhadra Son Barsa 4 10 0.0165
784 Sonbhadra Kakrahi 5 7 0.1732
785 Sonbhadra Robertsganj1 4 10 0.3021
786 Sultanpur Musafirkhana 9 0.0573 10 0.0770
787 Sultanpur Kadipur 9 0.0282 10 0.1125
788 Sultanpur Sultanpur2 9 0.2396 10 0.1179
789 Sultanpur Kurebhar1 9 0.1064 10 0.0894
790 Sultanpur Jagdishpur2 6 0.2589 8 0.3643
791 Sultanpur Trisundi 9 0.0443 9 0.0410
792 Sultanpur Maniari Aliganj 4 7 0.1103
793 Sultanpur Pratushmanik 8 0.0836 10 0.1707
794 Sultanpur Khaluhat1 9 0.0311 10 0.1128
795 Sultanpur Naghipur Bajhan 8 0.1941 10 0.0159
796 Sultanpur Kutta 7 0.1310 10 0.2301
797 Sultanpur Khutahna 9 0.0035 10 0.0921
798 Sultanpur Bhatgaon 3 10 0.1292
799 Sultanpur Babuganj 7 0.0000 9 0.1539
800 Sultanpur Munshiganj1 8 0.0241 10 0.1254
801 Sultanpur Mundawa 9 0.0153 9 0.0669
802 Sultanpur Bhim Pashim 9 0.0396 9 0.1188
803 Sultanpur Mahona 8 0.0202 10 0.1455
804 Sultanpur Mardanpur 5 9 0.0356
805 Sultanpur Sathin 6 0.4841 8 0.2683
806 Sultanpur Janapur 8 0.0189 10 0.1161
807 Sultanpur Sikrabad (Para) 6 0.5939 7 0.3627
808 Sultanpur Bahurawa 2 9 0.0555
809 Sultanpur Kurwar 7 0.1182 10 0.1044

237
Sl
No.
District Location Pre-Monsoon Post-Monsoon
Data
Points
Pre Rise
(m/year)
Pre Fall
(m/year)
Data
Points
Post
Rise
(m/year)
Post Fall
(m/year)
810 Sultanpur Ramgarh1 8 0.0747 10 0.0848
811 Sultanpur Shivgarh 8 0.0128 10 0.1180
812 Sultanpur Sagardeh 8 0.0394 9 0.0283
813 Sultanpur Badgaon 8 0.1921 10 0.3400
814 Sultanpur Dariyan Ka Purw 8 0.0802 9 0.1023
815 Sultanpur Bhadar 8 0.0730 10 0.1712
816 Sultanpur Kusitali 8 0.0280 10 0.0046
817 Sultanpur Goriabad 8 0.3590 10 0.0103
818 Sultanpur Piparpur 9 0.0037 10 0.0351
819 Sultanpur Lambua Pz-Gwd 5 8 0.3345
820 Sultanpur Bhadayian Pz-Gwd 6 0.2430 8 0.3653
821 Sultanpur Kotra Khurd 7 0.0148 7 0.2600
822 Sultanpur Pratap Pur
Kamaicha (Pz
Gwd)
4 6 0.0658
823 Sultanpur Gauriganj New -2 3 6 0.1839
824 Unnao Auras 6 0.0630 10 0.0215
825 Unnao Maurawan 9 0.1164 9 0.1569
826 Unnao Tonda 8 0.0759 9 0.0383
827 Unnao Kantha 5 6 0.8923
828 Unnao Makur 7 0.1750 9 0.0598
829 Unnao Hasewan 6 0.0290 9 0.0664
830 Unnao Safipur1 5 8 0.3274
831 Unnao Unnao 6 0.6474 7 0.7072
832 Unnao Purwa 5 7 0.1182
833 Unnao Unchagaon1 8 0.3298 10 0.1915
834 Unnao Sumerpur 9 0.3795 10 0.3150
835 Unnao Thaura 9 0.0883 10 0.0071
836 Unnao Ganj Moradabad 3 8 0.0943
837 Unnao Chakalvanshi 6 0.0276 9 0.0309
838 Unnao Azmatnagar 9 0.1597 10 0.0262
839 Unnao Methi Tikur 9 0.0555 10 0.0419
840 Unnao Sikanderpur1 4 9 0.0300
841 Unnao Unchagaon Kila 5 9 0.0880
842 Unnao Pinjra 8 0.1832 8 0.1395
843 Unnao Malauna 8 0.0159 10 0.0351

238
Sl
No.
District Location Pre-Monsoon Post-Monsoon
Data
Points
Pre Rise
(m/year)
Pre Fall
(m/year)
Data
Points
Post
Rise
(m/year)
Post Fall
(m/year)
844 Unnao Bhagwant Nagar 5 6 0.6842
845 Unnao Baksar 8 0.1083 8 0.0217
846 Unnao Santakhera 4 7 0.0408
847 Varanasi Cholapur1 5 6 0.2537
848 Varanasi Chobepur 9 0.5206 10 0.4295
849 Varanasi Varanasi 9 0.3664 10 0.4093
850 Varanasi Thatra 6 0.3673 8 0.1773
851 Varanasi Tahipur 8 0.1373 6 0.0846
852 Varanasi Kakrahwan 6 0.2756 5
853 Varanasi Rajatalab1 7 0.6229 9 0.6509
854 Varanasi Anai 7 0.2941 10 0.0593
855 Varanasi Jikhan(Narsara) 9 0.4076 10 0.6284
856 Varanasi Rustampur 8 0.2987 9 0.3180

Annexure-III
239
CHEMICAL ANALYSIS DATA OF SAMPLES COLLECTED FROM GROUND WATER
MONITORING WELLS IN UTTAR PRADESH, 2021-22
S.No. District Block pH
EC
µS/cm
at
25°C
CO3 HC
O3 Cl F NO3 SO4 TH Ca Mg Na K SiO2
mg/l
1 Agra Achhnera 7.62 9048 0 458 1917 0.86 0 1000 2350 348 355 900 6.1 22
2 Agra Akola 7.64 8194 0 445 1704 0.78 39 921 1650 164 298 1125 19 22
3 Agra Bah 7.83 1426 0 366 170 0.51 108 29 440 60 70 109 3.0 33
4 Agra Barauli Ahir 7.89 1725 0 537 156 0.66 0 232 340 48 53 281 4.6 19
5 Agra Bichpuri 7.76 2946 0 439 320 0.54 0 747 640 68 113 449 6.7 21
6 Agra Etmadpur 8.12 4955 0 390 639 2.0 0 1312 420 80 53 1064 5.6 16
7 Agra Fatehabad 8.08 2856 0 610 305 1.6 12 481 295 40 47 463 2.0 21
8 Agra Fatehpur Sikri 7.73 2509 0 415 312 0.24 23 444 320 56 43 432 2.1 39
9 Agra Jagner 8.23 2192 0 830 213 2.5 12 192 190 32 26 431 2.3 23
10 Agra Jaitpur Kalan 8.09 760 0 268 57 0.99 0 47 240 48 29 59 2.5 17
11 Agra Khandauli 7.68 3226 0 500 596 0.73 111 219 680 64 125 449 3.8 23
12 Agra Kheragarh 7.62 6507 0 390 1299 0.40 14 1363 1880 264 293 795 3.8 30
13 Agra Pinhat 7.89 969 0 390 57 0.70 16 35 295 56 37 64 4.4 29

Annexure-III
240
S.No. District Block pH
EC
µS/cm
at
25°C
CO3 HC
O3 Cl F NO3 SO4 TH Ca Mg Na K SiO2
mg/l
14 Agra Saiyan 8.20 1566 0 549 99 0.60 8.1 229 300 48 43 254 1.3 25
15 Agra Shamsabad 7.87 1204 0 439 107 0.94 47 16 410 44 72 95 2.9 30
16 Aligarh Akrabad 7.66 1515 0 305 128 0.33 217 102 380 52 60 135 16.3 25
17 Aligarh Dhanipur 7.95 622 0 366 14 0.79 3.2 21 190 24 31 67 6.7 22
18 Aligarh Jawan 7.77 750 0 342 21 0.57 4.4 96 230 32 36 79 6.2 26
19 Aligarh Atrauli 8.51 968 18 317 106 0.40 11 37 340 8.0 77 69 9.9 27
20 Aligarh Gangiri 8.10 1382 0 634 71 0.52 36 30 160 12 31 255 5.7 28
21 Aligarh Bijauli 8.34 1620 12 329 191 0.21 38 135 210 8.0 46 266 6.6 31
22 Aligarh Chandaus 8.36 531 18 232 21 0.61 19 12 120 4.0 26 73 4.8 25
23 Aligarh Tappal 7.89 1173 0 390 71 1.9 30 116 210 28 34 172 4.3 24
24 Aligarh Khair 8.45 3188 42 659 383 1.1 92 219 240 8.0 53 708 13.6 25
25 Aligarh Lodha 8.54 869 30 366 35 0.42 13 32 140 8.0 29 155 10.6 26
26 Aligarh Gonda 8.12 3790 0 525 503 0.62 16 521 380 12 84 729 14.6 24
27 Aligarh Iglas 7.76 960 0 403 50 0.47 9.9 73 240 32 38 114 4.1 22
28 Ambedkar Nagar Akberpur 8.13 436 0 244 14 0.13 0 4.8 150 13 29 32 3.4 28

Annexure-III
241
S.No. District Block pH
EC
µS/cm
at
25°C
CO3 HC
O3 Cl F NO3 SO4 TH Ca Mg Na K SiO2
mg/l
29 Ambedkar Nagar Baskhari 7.94 351 0 183 14 0.15 19 8.8 160 25 24 16 2.0 28
30 Ambedkar Nagar Bhiti 7.72 518 0 317 14 0.36 0 3.9 230 29 38 25 3.5 28
31 Ambedkar Nagar Bhiyaon 8.16 450 0 244 21 0.30 9.3 17 190 21 34 29 2.8 29
32 Ambedkar Nagar Jahangirganj 8.23 366 0 244 14 0.27 0 1.3 150 13 29 30 2.6 31
33 Ambedkar Nagar Jalalpur 7.93 833 0 329 99 0.03 17 13 240 17 48 87 4.6 30
34 Ambedkar Nagar Katehari 8.23 474 0 220 35 0.10 0 11 170 13 34 32 3.0 27
35 Ambedkar Nagar Ramnagar 8.27 418 0 244 14 0.58 0 21 220 46 26 6.7 2.5 25
36 Ambedkar Nagar Tanda 8.14 420 0 220 21 0.05 0 13 180 25 29 20 3.0 30
37 Auraiya Achhalda 8.46 482 36 207 14 1.8 0 6.3 140 16 24 55 2.3 28
38 Auraiya Airwa Katra 8.12 964 0 488 35 0.57 0 67 250 40 36 120 12 27
39 Auraiya Ajitmal 8.53 674 48 244 35 0.71 6.9 23 150 16 26 96 2.9 36
40 Auraiya Auraiya 7.83 1019 0 146 163 0.00 103 47 310 52 43 80 3.4 39
41 Auraiya Bhagya Nagar 8.52 685 36 317 21 0.28 11 19 250 16 50 54 3.4 35
42 Auraiya Bidhuna 8.62 887 48 378 43 0.56 5.0 33 260 12 55 99 8.2 32
43 Auraiya Sahar 8.21 1136 0 586 57 0.98 7.0 46 360 72 43 114 6.1 32

Annexure-III
242
S.No. District Block pH
EC
µS/cm
at
25°C
CO3 HC
O3 Cl F NO3 SO4 TH Ca Mg Na K SiO2
mg/l
44 Azamgarh Ahiraula 8.23 406 0 238 7.1 0.47 3.2 2.3 155 6.0 34 25 2.6 27
45 Azamgarh Atraulia 7.86 482 0 287 7.1 0.22 0.06 2.4 180 20 31 37 3.2 28
46 Azamgarh Azmatgarh 7.81 525 0 268 21 0.47 1.9 8.0 215 16 42 24 2.0 29
47 Azamgarh Bilariyaganj 7.95 700 0 305 50 0.35 1.4 17 215 6.0 48 62 4.2 27
48 Azamgarh Harraiya 7.92 510 0 293 11 0.40 6.2 3.4 215 42 26 37 2.7 31
49 Azamgarh Jahanaganj 7.87 644 0 378 14 0.21 4.3 1.9 260 16 53 39 2.4 29
50 Azamgarh Koyalsa 8.26 395 0 195 14 0.03 0.29 12 90 6.0 18 51 3.5 29
51 Azamgarh Lalganj 8.44 617 18 287 21 0.28 9.6 19 170 4.0 38 72 6.5 25
52 Azamgarh Maharajganj 8.01 372 0 220 7.1 0.07 1.3 1.1 160 46 11 11 2.3 25
53 Azamgarh Mehnagar 7.94 434 0 244 7.1 0.77 0.47 14 165 24 25 29 2.9 23
54 Azamgarh Mirzapur H.Q. 7.88 641 0 354 35 0.23 0.09 6.3 240 16 48 46 3.6 25
55 Azamgarh Mohammadpur 8.33 617 21 329 11 1.2 0.72 4.7 160 6.0 35 81 1.9 25
56 Azamgarh Palhana 8.26 1116 0 628 7.1 6.8 3.1 5.5 15 4.0 1 293 0.40 15
57 Azamgarh Palhani 7.72 806 0 360 50 0.28 2.5 43 320 30 59 44 3.9 23
58 Azamgarh Pawai 8.21 489 0 293 11 0.33 0.11 2.3 165 6.0 36 44 2.7 25

Annexure-III
243
S.No. District Block pH
EC
µS/cm
at
25°C
CO3 HC
O3 Cl F NO3 SO4 TH Ca Mg Na K SiO2
mg/l
59 Azamgarh Phoolpur 8.02 448 0 262 7.1 0.28 1.7 1.9 190 14 37 25 2.6 27
60 Azamgarh Rani Ki Sarai 7.91 551 0 329 7.1 0.53 0.12 5.8 225 22 41 37 1.8 27
61 Azamgarh Sathiaon 7.94 688 0 390 18 0.48 0.18 4.2 180 16 34 88 1.6 25
62 Azamgarh Tahabarpur 7.90 426 0 214 11 0.31 1.7 6.0 180 24 29 17 1.9 25
63 Azamgarh Tarwa 8.72 1062 27 586 14 1.4 0.90 2.9 60 4.0 12 228 1.1 20
64 Azamgarh Thekma 7.97 498 0 287 11 0.37 0.07 6.5 180 16 34 40 4.4 27
65 Baghpat Chaprauli 7.87 1225 0 451 92 0.38 20 66 330 64 41 104 6.4 32
66 Baghpat Baghpat 8.24 1154 0 458 32 0.57 0 76 200 40 24 152 4.0 27
67 Baghpat Binauli 8.23 1140 0 342 107 0.32 36 90 195 52 16 188 4.7 33
68 Baghpat Baraut 8.17 898 0 238 64 1.5 85 51 270 32 46 75 2.9 23
69 Baghpat Pilana 8.24 1492 0 622 64 0.42 22 110 325 56 44 209 7.3 30
70 Baghpat Khekra 8.23 1206 0 439 60 0.47 12 74 380 48 62 91 6.1 28
71 Bahraich Jarwal H.Q. 8.03 998 0 262 128 1.3 0 76 350 40 60 70 13 16
72 Bahraich Kaisarganj H.Q. 8.06 1065 0 512 43 0 0 15 500 120 48 10 3.7 27
73 Bahraich Fakarpur H.Q. 8.43 990 18 287 114 0.11 0 24 245 20 47 68 45 21
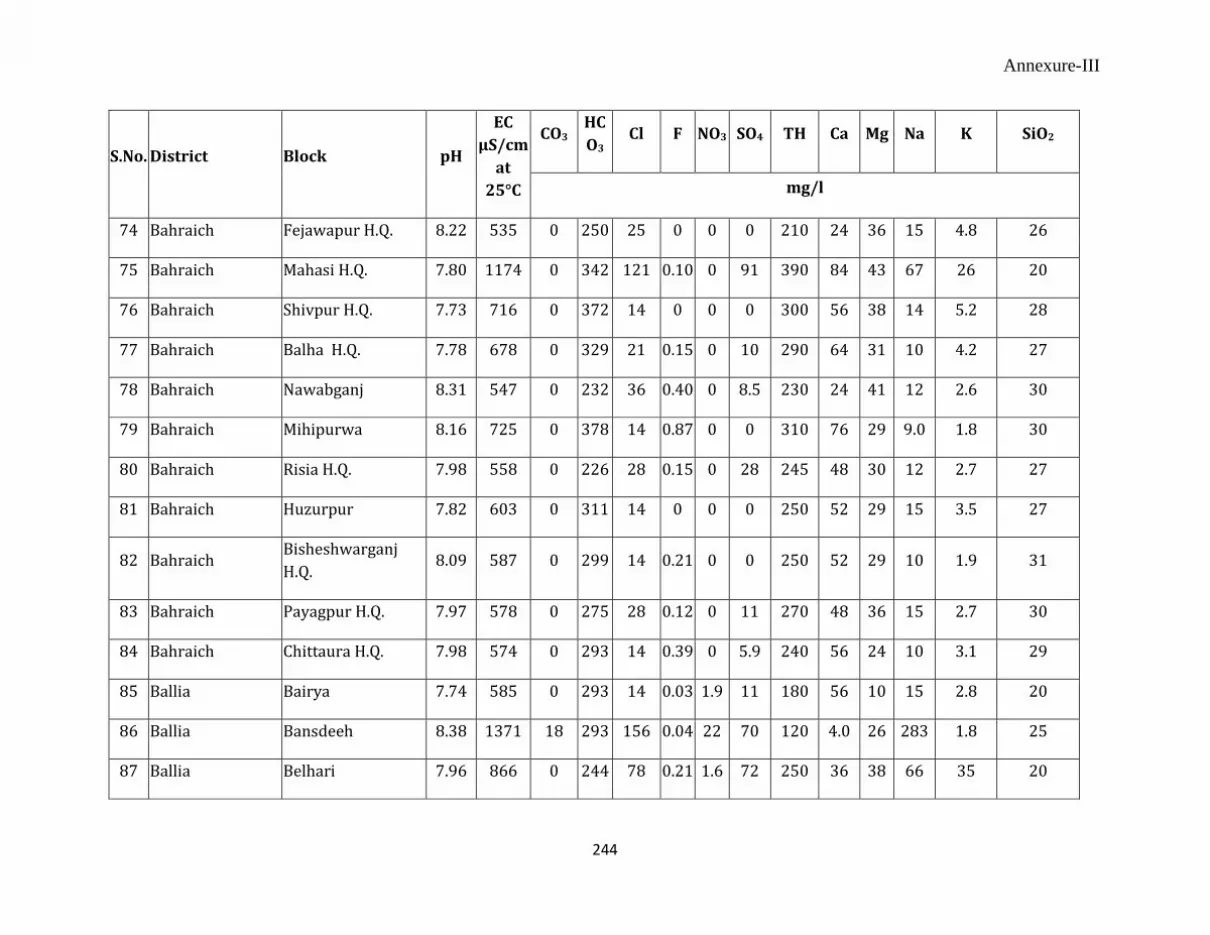
Annexure-III
244
S.No. District Block pH
EC
µS/cm
at
25°C
CO3 HC
O3 Cl F NO3 SO4 TH Ca Mg Na K SiO2
mg/l
74 Bahraich Fejawapur H.Q. 8.22 535 0 250 25 0 0 0 210 24 36 15 4.8 26
75 Bahraich Mahasi H.Q. 7.80 1174 0 342 121 0.10 0 91 390 84 43 67 26 20
76 Bahraich Shivpur H.Q. 7.73 716 0 372 14 0 0 0 300 56 38 14 5.2 28
77 Bahraich Balha H.Q. 7.78 678 0 329 21 0.15 0 10 290 64 31 10 4.2 27
78 Bahraich Nawabganj 8.31 547 0 232 36 0.40 0 8.5 230 24 41 12 2.6 30
79 Bahraich Mihipurwa 8.16 725 0 378 14 0.87 0 0 310 76 29 9.0 1.8 30
80 Bahraich Risia H.Q. 7.98 558 0 226 28 0.15 0 28 245 48 30 12 2.7 27
81 Bahraich Huzurpur 7.82 603 0 311 14 0 0 0 250 52 29 15 3.5 27
82 Bahraich Bisheshwarganj
H.Q. 8.09 587 0 299 14 0.21 0 0 250 52 29 10 1.9 31
83 Bahraich Payagpur H.Q. 7.97 578 0 275 28 0.12 0 11 270 48 36 15 2.7 30
84 Bahraich Chittaura H.Q. 7.98 574 0 293 14 0.39 0 5.9 240 56 24 10 3.1 29
85 Ballia Bairya 7.74 585 0 293 14 0.03 1.9 11 180 56 10 15 2.8 20
86 Ballia Bansdeeh 8.38 1371 18 293 156 0.04 22 70 120 4.0 26 283 1.8 25
87 Ballia Belhari 7.96 866 0 244 78 0.21 1.6 72 250 36 38 66 35 20

Annexure-III
245
S.No. District Block pH
EC
µS/cm
at
25°C
CO3 HC
O3 Cl F NO3 SO4 TH Ca Mg Na K SiO2
mg/l
88 Ballia Beruwarbari 7.78 422 0 232 7.1 0.14 0.10 9.9 190 8.0 41 12 2.5 22
89 Ballia Chilkahar 7.74 598 0 366 7.1 0.58 2.6 1.5 245 20 47 37 2.5 27
90 Ballia dubahar 7.93 521 0 287 18 0.33 2.0 0.58 195 24 32 40 4.0 27
91 Ballia Garwar 8.33 484 21 244 14 0.24 0.23 2.2 175 6.0 38 43 3.6 25
92 Ballia Hanumanganj 8.27 346 0 201 7.1 0.43 1.3 1.5 145 16 25 22 2.5 27
93 Ballia Maniyar 8.05 327 0 177 7.1 0.06 0.46 4.8 95 14 14 33 7.2 25
94 Ballia Murali Chhapara 8.13 302 0 177 7.1 0.00 0.69 1.5 125 10 24 18 2.8 22
95 Ballia Nawa Nagar 8.05 266 0 140 7.1 0.13 0.09 8.1 110 18 16 13 2.4 24
96 Ballia Negara 8.01 292 0 159 11 0.08 0.34 3.1 100 12 17 24 3.4 25
97 Ballia Pandah 7.87 400 0 220 14 0.09 0.10 3.8 165 18 29 25 3.3 26
98 Ballia Rasara 8.47 802 24 409 14 0.57 0.43 19 130 4.0 29 202 1.6 22
99 Ballia Reoti 7.92 278 0 159 7.1 0.23 2.3 0.87 115 28 11 11 0.9 22
100 Ballia Siyar 8.15 315 0 171 11 0.13 0.12 5.7 110 14 18 34 2.7 27
101 Ballia Sohaon 8.01 380 0 220 7.1 0.15 1.3 1.0 130 18 20 41 3.1 19

Annexure-III
246
S.No. District Block pH
EC
µS/cm
at
25°C
CO3 HC
O3 Cl F NO3 SO4 TH Ca Mg Na K SiO2
mg/l
102 Balrampur Harraiya
Satgharwa H.Q. 8.46 894 24 409 14 0 0 10 250 24 46 72 1.8 22
103 Balrampur Tulsipur 7.89 448 0 268 14 0.52 0 7.6 200 28 31 19 1.2 27
104 Balrampur Balrampur H.Q. 7.61 536 0 305 21 0.25 0 7.8 250 68 19 14 2.7 32
105 Balrampur Utraula 8.04 487 0 256 21 0 0 0 190 40 22 14 4.2 29
106 Balrampur Gaidas Buzurg H.Q. 8.19 522 0 305 14 0.12 0 0 220 32 34 16 3.0 33
107 Balrampur Rehra Bazar H.Q. 8.13 651 0 220 71 0.26 0 22 280 40 43 21 3.5 27
108 Balrampur Sriduttaganj H.Q. 8.15 523 0 250 21 0 0 9.0 210 32 31 25 2.5 30
109 Balrampur Pachperwa H.Q. 8.30 797 0 500 14 0 0 0 280 20 55 74 0 24
110 Balrampur Gainsari H.Q. 8.13 544 0 171 71 0.58 0 11 220 44 26 16 2.3 23
111 Banda Baberu 8.04 1635 0 671 113 0.79 52 80 440 48 77 172 22 31
112 Banda Barokhar 7.83 1915 0 342 177 0.60 280 120 520 52 94 176 6.3 30
113 Banda Bisanda 7.97 1407 0 573 128 0.45 8.0 44 430 20 91 134 1.6 33
114 Banda Jaspura 7.88 562 0 317 21 0.18 5.0 6.0 160 24 24 70 2.3 34
115 Banda Kamasin 8.21 835 0 464 28 0.55 13 15 130 12 24 152 1.1 31

Annexure-III
247
S.No. District Block pH
EC
µS/cm
at
25°C
CO3 HC
O3 Cl F NO3 SO4 TH Ca Mg Na K SiO2
mg/l
116 Banda Mahua 8.10 925 0 512 28 0.66 14 17 140 12 26 172 1.3 34
117 Banda Naraini 8.18 771 0 244 78 0.39 14 62 300 24 58 44 1.2 28
118 Banda Tindwari 7.82 689 0 342 43 0.25 13 11 200 32 29 80 1.6 29
119 Barabanki Trivediganj 8.04 524 0 305 14 0.76 10 20 250 16 51 23 3.9 31
120 Barabanki Banki 8.32 800 36 329 14 0.57 0 16 788 36 24 82 4.3 27
121 Barabanki Dewa 8.07 610 0 281 14 0.67 0 13 672 48 24 19 5.7 24
122 Barabanki Fatehpur 7.99 847 0 366 35 0.15 0 32 1600 80 26 32 5.5 21
123 Barabanki Ramnagar 7.98 610 0 207 35 0.21 0 39 1936 44 24 25 3.3 27
124 Barabanki Suratganj 7.89 2000 0 793 175 0.28 12 41 2050 40 46 272 65 37
125 Barabanki Sirauli Gauspur 8.24 391 0 146 14 0.25 0 24 1221 32 17 8.0 2.1 17
126 Barabanki Daraiyabad 8.13 620 0 317 14 0.87 0 8.9 443 32 31 38 2.8 29
127 Barabanki Puredalai 8.15 485 0 220 14 0.27 0 2.9 145 28 24 17 1.9 27
128 Barabanki Banikodar 7.92 609 0 293 14 0.24 0 12 600 36 29 33 3.2 30
129 Barabanki Masauli 7.96 700 0 317 14 0.77 0 29 1432 44 34 30 3.6 28
130 Barabanki Harak 8.07 706 0 342 14 0.59 0 6.0 299 28 41 29 5.1 27

Annexure-III
248
S.No. District Block pH
EC
µS/cm
at
25°C
CO3 HC
O3 Cl F NO3 SO4 TH Ca Mg Na K SiO2
mg/l
131 Barabanki Siddharthnagar 7.98 760 0 342 35 0.07 0 23 1153 48 36 33 18 23
132 Barabanki Haidergarh 8.05 700 0 354 7.0 0.61 0 14 687 28 46 29 4.2 30
133 Barabanki Nindura 8.16 531 0 256 14 0.55 0 12 578 24 34 21 4.3 29
134 Barabanki Mawai 8.08 610 0 317 14 0.56 0 2.6 129 32 38 21 2.4 25
135 Barabanki Rudauli 8.01 615 0 281 28 0.56 0 15 750 36 34 25 4.2 30
136 Bareilly Alampur Jafarabad 8.10 528 0 256 21 0.42 0 38 110 24 12 77 2.8 25
137 Bareilly Baheri 7.90 312 0 159 7.1 0.62 0 15 105 36 3.6 23 2.6 23
138 Bareilly Bhadpura 7.80 420 0 207 14 0.39 0.51 4.2 140 20 22 23 4.7 26
139 Bareilly Bhojipura 8.10 261 0 134 7.1 0.39 0 14 120 40 4.8 6.4 2.8 24
140 Bareilly Bhutah 7.60 356 0 195 7.1 0.41 0 9.0 165 40 16 7.2 2.8 27
141 Bareilly Bithri Chainpur 7.70 401 0 195 21 0.42 0 16 135 40 8.4 28 9.7 27
142 Bareilly Faridpur 8.09 357 0 146 21 0.42 1.5 21 135 48 3.6 17 3.1 24
143 Bareilly Fatehganj West 8.20 394 0 220 14 0.36 0 7.1 65 20 3.6 65 2.0 25
144 Bareilly Kiyara 7.70 414 0 220 21 0.28 0 21 180 40 19 23 3.7 28
145 Bareilly Majhgawan 8.01 656 0 293 28 0.42 0.53 46 120 28 12 96 1.9 26

Annexure-III
249
S.No. District Block pH
EC
µS/cm
at
25°C
CO3 HC
O3 Cl F NO3 SO4 TH Ca Mg Na K SiO2
mg/l
146 Bareilly Meerganj 7.90 551 0 299 21 0.36 0.67 14 190 44 19 43 2.7 22
147 Bareilly Nawabganj 8.13 408 0 207 7.1 0.51 0 21 110 24 12 43 2.2 27
148 Bareilly Ram Nagar 7.60 408 0 183 14 0.29 29 27 190 72 2.4 13 2.6 38
149 Bareilly Richha 8.01 398 0 195 14 0.59 0 22 70 12 10 62 2.5 25
150 Bareilly Shergarh 8.04 566 0 281 35 0.32 0.87 17 185 52 13 7.5 77 27
151 Basti Rudauli H.Q. 7.93 2840 0 952 227 1.5 0 271 340 28 65 456 0 26
152 Basti Saunghat H.Q. 7.87 670 0 329 21 0.59 0 10 290 48 41 7.7 2.0 32
153 Basti Basti Sadar H.Q. 7.70 666 0 329 28 0.50 0 10 290 60 34 29 0 49
154 Basti Saltauwa Gopalpur
H.Q. 7.90 860 0 488 14 0.78 0 0 360 36 65 26 2.6 31
155 Basti Ramnagar H.Q. 8.19 650 0 329 14 0.66 0 5.9 230 28 38 30 3.0 32
156 Basti Gaur H.Q. 7.80 1345 0 262 241 0.35 0 63 490 80 70 68 1.3 29
157 Basti Bahadurpur H.Q. 8.00 685 0 342 21 0.63 0 0 240 44 31 33 2.6 30
158 Basti Dubauliya H.Q. 8.19 570 0 293 14 0.50 0 0 250 32 41 4.9 2.6 33
159 Basti Kudraha H.Q. 8.03 598 0 299 18 0.54 0 0 280 44 41 0 2.3 30

Annexure-III
250
S.No. District Block pH
EC
µS/cm
at
25°C
CO3 HC
O3 Cl F NO3 SO4 TH Ca Mg Na K SiO2
mg/l
160 Basti Bankati H.Q. 8.24 434 0 220 7.1 0.38 0 10 200 44 22 2 1.9 30
161 Basti Kaptanganj H.Q. 7.99 1175 0 329 149 0.39 0 69 245 40 35 131 5.3 24
162 Basti Harraiya
Satgharwa H.Q. 8.26 447 0 232 14 0.67 0 5.1 200 28 31 2.9 0 27
163 Basti Vikramjot H.Q. 8.18 529 0 268 14 0.64 0 0 240 48 29 3.8 2.4 31
164 Basti Parasurampur H.Q. 8.26 597 0 262 36 0.68 0 7.6 230 24 41 24 1.8 26
165 Bijnor Budhanpur
(Seohara) 7.99 337 0 201 11 0.26 0 0 140 28 17 20 2.7 18
166 Bijnor Alhepur 7.79 410 0 207 28 1.2 0 5.1 160 48 10 30 2.3 30
167 Bijnor Afzalgarh 7.78 374 0 207 14 1.0 0 0 180 56 10 10 1.1 27
168 Bijnor Aku (Nehtaur) 7.62 319 0 165 14 0.84 0 0 135 32 13 17 3.6 33
169 Bijnor Kotwali 7.68 384 0 207 14 1.1 0 5.4 150 32 17 28 2.3 30
170 Bijnor Najibabad 7.76 569 0 281 21 1.3 0 11 225 36 32 32 1.6 27
171 Bijnor Kirtapur 7.61 723 0 232 71 0.68 0 55 300 56 38 31 10 24
172 Bijnor Mohammadpur
Deomal 7.78 787 0 281 53 0.72 0 70 285 36 47 47 21 18

Annexure-III
251
S.No. District Block pH
EC
µS/cm
at
25°C
CO3 HC
O3 Cl F NO3 SO4 TH Ca Mg Na K SiO2
mg/l
173 Bijnor Khari jhalu 7.80 304 0 159 11 0.88 0 0 130 32 12 13 4.7 31
174 Bijnor Noorpur 7.69 550 0 238 43 0.71 0 20 240 44 31 24 6.5 36
175 Bijnor Jaleelpur 7.90 482 0 195 18 1.0 0 53 220 68 12 18 4.3 29
176 Budaun Rajpura 8.06 338 0 177 14 1.1 0 8.7 130 32 12 23 5.5 31
177 Budaun Gunnaur 8.07 928 0 220 64 0.78 53 148 250 20 48 89 53 31
178 Budaun Junawahi 8.07 470 0 220 21 0.80 0 36 190 20 34 29 5.7 28
179 Budaun Dahigawaan 8.20 917 0 201 99 0.85 15 133 210 28 34 126 5.2 27
180 Budaun Sahswan 8.02 357 0 183 21 0.98 0 10 150 36 14 19 2.9 28
181 Budaun Badaun(hq) 7.92 494 0 134 64 0.75 0 47 175 20 30 42 6.2 35
182 Budaun Jagat 8.12 371 0 207 14 1.1 0 6.1 170 48 12 13 4.2 30
183 Budaun Dataganj 7.80 419 0 220 7.1 0.92 0 11 150 56 2.4 30 4.1 33
184 Budaun Samrer 8.23 486 0 293 14 1.1 0 6.2 40 12 2.4 98 0 25
185 Budaun Miaon 7.65 463 0 207 28 0.81 0 23 175 40 18 31 5.3 32
186 Budaun Usawan 7.59 456 0 134 43 0.91 52 29 200 56 14 21 4.7 29
187 Budaun Quadar Chowk 7.73 285 0 146 14 0.90 0 8.5 130 36 10 11 3.0 30

Annexure-III
252
S.No. District Block pH
EC
µS/cm
at
25°C
CO3 HC
O3 Cl F NO3 SO4 TH Ca Mg Na K SiO2
mg/l
188 Budaun Ujhani 7.53 1235 0 183 185 0.76 109 100 440 84 55 81 7.6 35
189 Budaun Ambiapur 7.72 642 0 183 71 0.82 24 28 240 44 31 36 5.4 29
190 Budaun Islamnagar 8.17 380 0 220 7.1 1.1 0 0 125 48 1.2 22 4.0 33
191 Budaun Asafpur 7.79 653 0 244 50 0.76 26 40 230 36 34 56 4.8 31
192 Budaun Bisouli 7.75 594 0 232 43 0.81 5.5 34 230 36 34 36 8.7 30
193 Budaun Wajirganj 7.76 508 0 256 28 0.87 0 7.9 150 28 19 56 5.5 32
194 Budaun Salarpur 8.11 567 0 122 28 0.80 68 89 260 28 46 18 7.3 25
195 Bulandshahr Danpur 7.90 688 0 354 21 0.03 9.8 23 150 20 24 107 4.7 31
196 Bulandshahr Debai 8.27 618 0 293 14 0.58 0.63 43 120 12 22 103 4.7 25
197 Bulandshahr Anupshahr 8.09 438 0 268 7.1 0.64 2.0 11 180 24 29 26 4.7 32
198 Bulandshahr Jahangirabad 8.22 779 0 366 28 0.14 30 24 150 16 26 134 6.8 30
199 Bulandshahr Unchagaon 8.12 422 0 134 14 0.00 52 37 190 24 31 7 4.7 20
200 Bulandshahr Siyana 7.85 859 0 256 92 0.00 29 30 220 28 36 89 6.4 31
201 Bulandshahr Bhagwan Bahadur
Nagar 7.87 542 0 317 14 0.43 0.45 6.5 200 28 31 41 6.6 25

Annexure-III
253
S.No. District Block pH
EC
µS/cm
at
25°C
CO3 HC
O3 Cl F NO3 SO4 TH Ca Mg Na K SiO2
mg/l
202 Bulandshahr Agauta 8.12 335 0 183 21 0.83 0.19 18 130 20 19 28 4.2 20
203 Bulandshahr Gulaothi 7.84 621 0 293 28 0.67 0.37 43 270 32 46 26 3.7 21
204 Bulandshahr Sikandrabad 8.68 1321 36 403 113 0.22 31 39 120 20 17 305 5.9 31
205 Bulandshahr Khurja 8.27 777 0 329 35 0.39 9 53 150 12 29 108 5.7 27
206 Bulandshahr Pahasu 7.70 533 0 171 43 0.04 36 35 220 40 29 14 4.8 29
207 Bulandshahr Shikarpur 7.84 1777 0 378 213 0.55 43 127 270 36 43 235 7.4 30
208 Bulandshahr Lakhaoti 8.34 560 12 232 21 0.75 13 49 170 8.0 36 59 6.3 23
209 Bulandshahr Bulanshahr 7.98 259 0 146 7.1 0.17 0.79 21 110 28 10 7 2.0 16
210 Bulandshahr Arnia 8.35 513 12 220 21 0.04 13 26 110 8.0 22 79 4.8 25
211 Chandauli Barahani 7.91 747 0 110 128 0.43 32 59 230 48 26 86 1.6 22
212 Chandauli Chahania 7.72 843 0 293 99 0.43 27 39 340 16 72 77 3.4 25
213 Chandauli Chakiya 8.09 458 0 207 35 0.70 19 10 200 16 38 48 1.0 22
214 Chandauli Chandauli 8.14 337 0 183 21 0.65 7.0 10 140 12 26 34 1.4 28
215 Chandauli Dhanapur 8.32 674 18 403 14 0.69 0.21 4.7 220 8.0 48 111 2.9 27
216 Chandauli Naugarh 8.04 340 0 122 35 0.05 6.8 14 130 24 17 38 1.4 11

Annexure-III
254
S.No. District Block pH
EC
µS/cm
at
25°C
CO3 HC
O3 Cl F NO3 SO4 TH Ca Mg Na K SiO2
mg/l
217 Chandauli Niyamatabad 8.67 1133 48 488 64 0.72 0.96 67 370 8.0 84 215 7.7 21
218 Chandauli Sakaldiha 8.12 426 0 171 35 0.62 7.8 27 180 20 31 33 3.3 28
219 Chandauli Shahabganj 7.92 361 0 183 14 0.14 11 10 150 36 14 35 0.9 28
220 Chitrakoot Karvi 8.18 998 0 476 50 0.84 38 24 440 16 96 44 0.0 30
221 Chitrakoot Manikpur 7.93 706 0 159 85 0.37 26 56 180 40 19 63 20 19
222 Chitrakoot Mau 7.79 660 0 256 57 0.37 40 5.0 220 40 29 55 1.3 23
223 Chitrakoot Pahari 8.05 875 0 159 128 0.96 40 48 170 36 19 106 1.4 68
224 Chitrakoot Ram Nagar 8.45 817 0 305 78 0.60 31 15 180 12 36 103 4.9 23
225 Deoria Baitalpur 7.56 520 0 207 57 0.00 0 41 210 52 19 36 5.3 32
226 Deoria Bankara 7.62 880 0 281 21 0.00 0 230 340 80 34 78 3.4 27
227 Deoria Barhaj 7.67 620 0 293 28 0.30 0 65 290 68 29 30 3.5 30
228 Deoria Bhagalpur 8.11 380 0 195 14 0.00 0 35 180 36 22 17 3.2 25
229 Deoria Bhaluwani 8.06 520 0 232 50 0.00 0 38 240 24 44 26 6.4 26
230 Deoria Bhatani 8.15 430 0 268 14 0.39 0 0 160 28 22 38 3.0 35
231 Deoria Bhatparani 7.76 480 0 293 21 0.14 0 0 250 52 29 13 3.1 36

Annexure-III
255
S.No. District Block pH
EC
µS/cm
at
25°C
CO3 HC
O3 Cl F NO3 SO4 TH Ca Mg Na K SiO2
mg/l
232 Deoria Deoria Sadar 7.92 440 0 122 71 0.00 0 23 180 60 7.3 17 3.4 36
233 Deoria Desahi Deoria 8.16 480 0 232 21 0.17 12 35 230 28 39 18 3.2 38
234 Deoria Gauri Bazar 8.15 380 0 183 21 0.00 0 25 190 44 19 8.2 2.3 33
235 Deoria Lar 8.12 385 0 220 14 0.00 0 15 200 60 12 8.6 2.2 34
236 Deoria Pather Dewa 8.09 340 0 171 21 0.00 0 21 170 36 19 8.4 1.6 32
237 Deoria Rampur Karkhana 7.94 350 0 183 14 0.12 0 20 170 40 17 6.0 3.1 34
238 Deoria Rudrapur 7.72 485 0 244 43 0.69 0 17 130 40 7.3 64 2.6 34
239 Deoria Salempur 7.95 360 0 195 21 0.56 0 0 160 32 19 14 2.0 36
240 Deoria Tarkulwa 7.99 380 0 195 28 0.11 0 12 170 32 22 15 3.6 30
241 Etah Aliganj 7.89 570 0 305 21 0.94 7.6 6.4 185 36 23 56 4.7 25
242 Etah Awagarh 8.35 630 36 299 14 1.2 5.9 7.5 170 36 19 79 3.0 24
243 Etah Jaithara 8.03 480 0 232 21 0.59 5.7 0 215 44 25 15 2.8 31
244 Etah Jalesar 8.40 1801 48 226 412 0.61 0 29 270 12 58 318 4.5 5.0
245 Etah Marhara 8.06 537 0 293 21 0.77 0 0 195 24 32 44 5.7 28
246 Etah Nidholi Kalan 8.21 768 0 403 28 0.94 0 21 200 32 29 99 5.5 21

Annexure-III
256
S.No. District Block pH
EC
µS/cm
at
25°C
CO3 HC
O3 Cl F NO3 SO4 TH Ca Mg Na K SiO2
mg/l
247 Etah Sakeet 7.82 680 0 378 28 0.42 0 10 180 32 24 88 4.4 24
248 Etah Sheetalpur 7.68 2621 0 512 337 0.56 68 482 410 56 65 453 7.2 34
249 Etawah Barhpura 8.11 757 0 207 106 0.00 16 42 280 32 48 47 3.7 24
250 Etawah Basrehar 7.44 721 0 329 35 0.35 22 44 250 52 29 60 5.1 34
251 Etawah Bharthana 8.12 915 0 549 21 0.62 0 11 230 36 34 111 4.0 30
252 Etawah Chakkar Nagar 8.51 740 60 281 28 0.26 18 15 150 16 26 111 2.9 33
253 Etawah Jaswant Nagar 7.91 878 0 317 121 0.00 19 36 300 56 38 79 3.3 33
254 Etawah Mahewa 8.26 520 48 146 21 0.00 11 29 200 40 24 28 3.1 31
255 Etawah Saifai 8.14 714 0 378 7.1 0.90 0 32 230 44 29 57 5.4 33
256 Etawah Takha 8.16 898 0 525 21 0.77 5.1 30 350 48 55 58 6.0 33
257 Faizabad Amaniganj 8.07 454 0 268 21 0.52 4.4 5.0 200 25 34 26 4.1 31
258 Faizabad Bikapur 8.16 634 0 244 50 0.32 19 43 210 21 38 53 6.8 27
259 Faizabad Haringtonganj 7.88 356 0 183 14 0.11 0 13 150 34 17 13 2.2 29
260 Faizabad Masodha 7.91 337 0 183 7.1 0.30 0 21 160 42 14 8.2 2.0 24
261 Faizabad Maya Bazar 8.05 298 0 171 21 0.11 0 18 160 21 26 10 3.3 24

Annexure-III
257
S.No. District Block pH
EC
µS/cm
at
25°C
CO3 HC
O3 Cl F NO3 SO4 TH Ca Mg Na K SiO2
mg/l
262 Faizabad Milkipur 8.09 650 0 305 43 0.36 28 21 270 17 55 36 4.4 29
263 Faizabad Pura Bazar 8.09 410 0 244 14 0.05 0 10 190 17 36 17 3.4 28
264 Faizabad Sohawal 7.88 480 0 268 21 0.20 3.0 10 220 29 36 16 4.1 27
265 Faizabad Tarun 8.05 565 0 171 21 0.00 19 103 210 25 36 37 3.4 29
266 Faizabad Mawai 8.14 433 0 329 14 0.54 0 2.1 260 17 53 14 2.8 26
267 Faizabad Rudauli 8.01 361 0 171 14 0.12 0 12 150 25 22 10 3.6 30
268 Fatehpur Airayan 7.72 1350 0 342 184 0.43 36 58 400 44 70 105 9.2 28
269 Fatehpur Amauli 7.91 600 0 281 35 0.16 15 9.0 220 24 38 38 3.4 31
270 Fatehpur Asother 7.98 673 0 378 35 0.86 0 15 300 20 60 37 4.0 31
271 Fatehpur Bahua 7.80 645 0 220 64 0.26 24 25 240 40 34 35 5.6 32
272 Fatehpur Bhitaura 7.95 585 0 329 28 0.79 0 0 230 24 41 37 7.2 29
273 Fatehpur Dhata 7.76 1469 0 329 184 0.32 65 130 470 40 89 1108 3.6 32
274 Fatehpur Haswa 7.98 498 0 281 14 0.78 20 0 190 48 17 36 6.2 28
275 Fatehpur Hathgaon 7.64 581 0 305 21 2.0 0 15 240 36 36 15 25 29
276 Fatehpur Khuajuha 8.17 696 0 390 28 1.5 8.2 10 250 8.0 55 60 3.6 33

Annexure-III
258
S.No. District Block pH
EC
µS/cm
at
25°C
CO3 HC
O3 Cl F NO3 SO4 TH Ca Mg Na K SiO2
mg/l
277 Fatehpur Malwan 8.09 1250 0 683 43 3.2 5.0 13 100 20 12 250 4.8 23
278 Fatehpur Teliyani 8.01 976 0 561 7.0 2.2 0 47 140 12 26 178 6.3 28
279 Fatehpur Vijayeepur 7.70 526 0 256 28 2.0 10 29 250 32 41 22 2.7 33
280 Ferrukabad Barhpur 7.56 676 0 342 36 0.61 18 13 275 40 42 44 3.4 29
281 Ferrukabad Kamalganj 8.04 1450 0 232 192 0.20 108 117 210 20 38 232 6.0 31
282 Ferrukabad Kayamganj 7.73 591 0 305 21 0.86 14 8.5 215 40 28 25 4.1 30
283 Ferrukabad Mohammadabad 7.42 2091 0 366 376 0.41 55 161 720 44 146 114 3.7 34
284 Ferrukabad Nawabganj 7.60 780 0 427 21 0.69 7.6 9.4 250 36 38 47 5.7 30
285 Ferrukabad Rajepur 8.21 1397 0 622 43 3.0 0 146 60 12 7.2 328 1.4 23
286 Ferrukabad Shamsabad 7.38 2007 0 220 241 0.36 201 247 630 68 110 154 6.6 32
287 Ferrukabad Rajepur 7.60 1348 0 427 99 0.38 6.1 168 360 28 70 107 22 23
288 Ferrukabad Rajepur 8.19 1434 0 586 50 2.6 0 189 200 72 4.8 271 1.5 23
289 Ferrukabad Rajepur 8.17 1280 0 537 36 2.1 0 137 85 24 6.0 280 1.9 23
290 Firozabad Aron 8.01 1026 0 439 50 0.85 10 30 190 36 24 91 94 24
291 Firozabad Eka 8.20 897 0 427 43 1.5 36 26 250 40 36 111 5.1 23

Annexure-III
259
S.No. District Block pH
EC
µS/cm
at
25°C
CO3 HC
O3 Cl F NO3 SO4 TH Ca Mg Na K SiO2
mg/l
292 Firozabad Firozabad 8.03 707 0 390 21 0.67 12 0 210 36 29 69 21 9.4
293 Firozabad Jasrana 8.17 873 0 439 43 0.98 5.9 14 305 44 47 78 4.9 26
294 Firozabad Khairagarh/
Hathwant 7.60 2103 0 342 398 0.29 112 68 910 144 132 58 7.7 30
295 Firozabad Madanpur 7.99 895 0 421 43 0.84 13 14 365 40 64 47 4.9 28
296 Firozabad Narkhi 8.04 3321 0 915 369 1.2 73 404 420 24 86 544 4.3 26
297 Firozabad Shikohabad 7.90 791 0 372 21 0.42 36 10 245 40 35 74 3.9 27
298 Firozabad Tundla 8.20 1628 0 561 178 3.2 39 30 230 28 38 284 2.4 17
299 Gautam Buddha
Nagar Dadri 8.28 816 0 293 43 0.46 32 59 180 12 36 101 6.3 25
300 Gautam Buddha
Nagar Bisrakh 7.90 865 0 207 57 0.2 2.7 143 300 36 50 57 5.5 17
301 Gautam Buddha
Nagar Jewar 8.70 1964 48 525 163 0.36 104 79 130 8.0 26 405 4.3 29
302 Gautam Buddha
Nagar Dankaur 8.44 1712 54 549 78 2.3 12 147 140 8.0 29 390 6.2 23
303 Ghaziabad Loni 7.68 1550 0 415 138 0.46 27 146 405 96 40 169 5.5 32

Annexure-III
260
S.No. District Block pH
EC
µS/cm
at
25°C
CO3 HC
O3 Cl F NO3 SO4 TH Ca Mg Na K SiO2
mg/l
304 Ghaziabad Razapur 8.07 1420 0 458 110 1.0 29 74 200 32 29 216 7.0 32
305 Ghaziabad Muradnagar 7.82 916 0 317 60 0.48 22 37 360 72 43 31 6.4 31
306 Ghaziabad Bhojpur 7.87 1066 0 549 21 0.79 0 31 230 40 31 117 6.0 31
307 Ghaziabad Hapur 8.08 872 0 427 14 0.36 6.6 15 300 72 29 46 4.7 34
308 Ghaziabad Dholana 8.02 964 0 390 36 0.18 27 36 310 52 43 62 5.8 33
309 Ghaziabad Simbholi 7.68 770 0 293 14 0.18 5.3 77 330 72 36 16 5.7 32
310 Ghaziabad Garh 7.67 825 0 366 21 0.24 0 35 330 56 46 16 5.2 21
311 Ghazipur Barachawar 8.24 439 0 244 7.1 0.65 6.4 3.5 130 8.0 26 29 3.6 24
312 Ghazipur Bhadaura 7.90 493 0 171 57 0.28 6.4 23 220 24 38 32 3.7 29
313 Ghazipur Bhawarkol 8.06 575 0 317 14 0.39 20 6.3 200 16 38 59 2.6 27
314 Ghazipur Birno 8.27 430 0 244 7.1 0.40 6.2 5.1 160 8.0 34 31 2.2 27
315 Ghazipur Deokali 8.52 1269 48 610 14 6.4 0.90 7.8 60 4.0 12 316 0.80 17
316 Ghazipur Ghazipur 7.78 1991 0 378 312 0.31 9.5 80 380 28 74 229 3.4 25
317 Ghazipur Jakhaniya 8.56 1144 36 561 7.1 5.3 0.90 3.5 20 8.0 0 313 0.64 15
318 Ghazipur Jamania 7.86 994 0 110 170 0.13 81 22 280 28 50 71 1.6 30

Annexure-III
261
S.No. District Block pH
EC
µS/cm
at
25°C
CO3 HC
O3 Cl F NO3 SO4 TH Ca Mg Na K SiO2
mg/l
319 Ghazipur Karanda 7.59 443 0 183 21 0.34 14 15 150 40 12 26 0.68 27
320 Ghazipur Kasimabad 8.32 828 24 342 43 0.95 3.9 24 180 4.0 41 148 1.3 22
321 Ghazipur Manihari 7.74 586 0 317 21 0.13 2.8 7.0 230 28 38 41 2.9 28
322 Ghazipur Mardah 8.03 626 0 293 21 0.48 7.0 27 160 8.0 34 83 2.9 25
323 Ghazipur Muhammadabad 8.22 685 0 220 57 0.04 0.42 51 200 4.0 46 69 6.2 26
324 Ghazipur Reotipur 7.88 383 0 159 28 0.09 0.18 17 150 36 14 13 3.2 22
325 Ghazipur Sadat 7.99 725 0 390 21 0.77 0.26 6.8 230 16 46 77 3.0 22
326 Ghazipur Saidpur 7.77 1800 0 244 305 0.28 47 80 430 32 84 162 4.1 27
327 Gonda Katra Bazar H.Q. 7.58 2281 0 622 341 0.24 5.9 95 560 88 82 224 28 20
328 Gonda Karnailganj H.Q. 8.03 1269 0 354 142 0 0 97 320 44 50 114 9.0 23
329 Gonda Haldharmau H.Q. 7.76 650 0 342 14 0 0 0 260 60 26 14 4.4 25
330 Gonda Rupaideeh H.Q. 8.13 424 0 220 14 0 0 0 165 24 25 12 2.0 28
331 Gonda Itigathok H.Q. 8.14 477 0 244 14 0.20 0 0 180 36 22 16 2.5 30
332 Gonda Padri Kripal H.Q. 8.19 646 0 378 7.1 0.20 0 0 300 80 24 12 2.7 32
333 Gonda Jhanjhari H.Q. 8.32 837 0 268 57 0.31 21 94 370 28 72 25 0 44

Annexure-III
262
S.No. District Block pH
EC
µS/cm
at
25°C
CO3 HC
O3 Cl F NO3 SO4 TH Ca Mg Na K SiO2
mg/l
334 Gonda Mankapur H.Q. 8.19 555 0 281 14 0.24 0 6.9 190 28 29 28 2.9 36
335 Gonda Chhapia H.Q. 8.05 737 0 329 50 0.17 0 7.9 270 48 36 29 3.6 34
336 Gonda Babhanjot H.Q. 8.21 763 0 403 21 0 0 5.6 315 72 32 15 2.8 32
337 Gonda Mujehna H.Q. 8.29 474 0 232 18 0.43 0 0 170 20 29 24 2.8 32
338 Gonda Nawabganj H.Q. 8.31 459 0 226 21 0 0 0 215 28 35 9.5 3.4 32
339 Gonda Wazirganj H.Q. 8.15 380 0 232 7.1 0.56 0 0 195 36 25 4.0 2.0 29
340 Gonda Tarabganj H.Q. 7.64 985 0 342 64 0.38 49 39 380 72 48 42 9.8 27
341 Gonda Belsar H.Q. 8.06 648 0 329 21 0.51 0 0 255 36 40 16 3.8 34
342 Gonda Paraspur H.Q. 7.75 695 0 366 21 0.44 0 0 270 44 38 21 3.5 28
343 Gorakhpur Bansgaon 7.73 600 0 317 36 0.00 0 28 300 72 29 20 2.9 31
344 Gorakhpur Barahalganj 8.37 520 24 244 14 0.00 20 18 250 36 39 20 3.6 28
345 Gorakhpur Belghat 7.99 480 0 220 36 0.00 26 15 250 48 32 6.0 7.4 33
346 Gorakhpur Bhatahat 8.18 360 0 207 21 0.00 0 5.0 190 36 24 7.2 2.8 32
347 Gorakhpur Brahmpur 8.26 365 0 207 21 0.00 0 0 195 52 16 7.6 2.3 36
348 Gorakhpur Campierganj 7.76 665 0 366 36 0.16 0 26 340 56 49 20 3.7 35

Annexure-III
263
S.No. District Block pH
EC
µS/cm
at
25°C
CO3 HC
O3 Cl F NO3 SO4 TH Ca Mg Na K SiO2
mg/l
349 Gorakhpur Chargawan 8.13 492 0 232 43 0.13 0 28 240 36 36 20 3.4 33
350 Gorakhpur Gagaha 8.11 510 0 317 14 0.19 0 12 270 48 36 12 2.8 31
351 Gorakhpur Gola 8.05 555 0 317 14 0.23 5.2 26 300 56 39 9.0 1.4 28
352 Gorakhpur Jangal Kuriya 7.76 295 0 146 7.1 0.22 0.19 2.1 120 20 17 15 2.5 35
353 Gorakhpur Kauriram 8.06 294 0 171 7.1 0.40 0.19 5.2 150 20 24 10 3.8 24
354 Gorakhpur Khajani 7.77 497 0 305 14 0.22 0.52 2.2 190 20 34 48 3.5 31
355 Gorakhpur Khorabar 7.59 447 0 207 28 0.07 0.28 25 200 48 19 16 3.1 37
356 Gorakhpur Pali 7.99 328 0 207 14 0.32 0.22 2.5 140 12 26 22 2.5 28
357 Gorakhpur Pipraich 8.04 257 0 159 7.1 0.30 0.23 1.1 120 16 19 19 3.4 30
358 Gorakhpur Piprauli 8.12 573 0 342 21 0.60 0.29 6.5 280 48 38 22 2.1 31
359 Gorakhpur Sahjanwa 7.71 372 0 232 14 0.11 0.35 2.3 170 36 19 10 1.9 27
360 Gorakhpur Sardar Nagar 8.06 302 0 146 14 0.46 0.29 21 200 36 26 7.7 2.5 28
361 Gorakhpur Uruwa 7.67 484 0 293 14 0.24 0.28 1.2 160 20 26 31 3.5 30
362 Hamirpur Gohand 7.94 540 0 305 21 1.6 6.4 15 180 24 29 60 1.4 42
363 Hamirpur Kurara 7.84 654 0 354 21 1.6 6.0 13 160 28 22 86 1.5 28

Annexure-III
264
S.No. District Block pH
EC
µS/cm
at
25°C
CO3 HC
O3 Cl F NO3 SO4 TH Ca Mg Na K SiO2
mg/l
364 Hamirpur Maudaha 7.94 1447 0 622 106 1.6 17 72 220 16 43 250 1.9 28
365 Hamirpur Muskara 7.72 1267 0 512 113 1.6 44 23 430 28 86 100 3.1 30
366 Hamirpur Rath 7.57 2735 0 329 298 1.5 410 340 430 64 65 450 1.5 36
367 Hamirpur Sareela 8.07 2330 0 683 199 2.4 0 262 200 12 41 430 1.8 22
368 Hamirpur Sumerpur 7.99 734 0 415 28 1.1 9.0 6.0 200 28 31 93 1.3 34
369 Hardoi Ahirori 7.75 393 0 195 14 0.44 0 15 150 28 19 18 6.4 32
370 Hardoi Bilgram 7.78 443 0 244 14 0.91 0 8.3 160 32 19 29 6.7 29
371 Hardoi Bavan 7.89 466 0 226 21 0.36 1.5 21 195 48 18 18 5.5 20
372 Hardoi Bahendra Khurd 8.43 633 0 293 28 0.39 0.79 50 170 8.0 36 72 4.4 28
373 Hardoi Bharawan 8.18 362 0 195 14 0.66 4.9 11 140 16 24 21 5.0 30
374 Hardoi Bharkhani 7.70 488 0 268 14 0.30 0 30 190 52 14 34 5.0 31
375 Hardoi Harpalpur 7.85 1167 0 512 50 0.43 0 66 260 36 41 136 4.1 26
376 Hardoi Hariyawan 7.70 650 0 226 113 0.62 14 13 305 36 52 23 4.4 30
377 Hardoi Kachhauna 8.17 390 0 232 14 0.90 3.0 1.7 150 24 22 27 4.6 22
378 Hardoi Kothawan 8.30 635 0 250 64 0.93 6.3 29 205 24 35 52 5.8 23

Annexure-III
265
S.No. District Block pH
EC
µS/cm
at
25°C
CO3 HC
O3 Cl F NO3 SO4 TH Ca Mg Na K SiO2
mg/l
379 Hardoi Madhavganj 7.98 425 0 232 14 0.20 1.6 11 180 36 22 21 6.0 31
380 Hardoi Mallawan 8.20 377 0 146 21 1.1 0 27 160 28 22 8 5.0 22
381 Hardoi Pihani 7.80 1198 0 415 142 0.42 44 48 430 52 72 70 8.0 27
382 Hardoi Shahabad 8.20 336 0 159 14 0.20 0 12 110 28 10 23 3.7 22
383 Hardoi Sursa 8.00 428 0 268 7.1 0.45 0.67 0.9 165 28 23 25 9.8 28
384 Hardoi Sandi 8.20 511 0 195 28 0.25 22 38 160 24 24 47 9.8 16
385 Hardoi Sandila 7.80 668 0 305 28 0.41 66 21 230 44 29 37 4.6 25
386 Hardoi Tadiyawan 7.90 560 0 281 21 0.56 0 26 220 52 22 30 4.4 24
387 Hardoi Todarpur 7.84 457 0 256 7.1 0.51 0 10 210 48 22 13 5.6 29
388 J.P. Nagar Dhanaura 7.92 348 0 110 43 0.81 0 12 140 40 10 15 4.0 20
389 J.P. Nagar Amroha 7.68 659 0 244 50 0.85 17 29 240 60 22 45 5.6 28
390 J.P. Nagar Joya 8.14 603 0 159 78 0.85 0 41 180 32 24 55 7.2 29
391 J.P. Nagar Gajraula 7.92 855 0 134 128 0.73 86 107 260 40 38 90 6.3 36
392 J.P. Nagar Hasanpur 7.93 603 0 146 50 0.79 77 35 200 48 19 47 4.6 36
393 J.P. Nagar Gangeshwari 8.12 389 0 207 14 0.92 0 5.3 100 16 14 49 3.4 27

Annexure-III
266
S.No. District Block pH
EC
µS/cm
at
25°C
CO3 HC
O3 Cl F NO3 SO4 TH Ca Mg Na K SiO2
mg/l
394 Jalaun Kadaura 7.89 930 0 524 35 1.5 5.6 1.8 290 48 41 91 8.6 17
395 Jalaun Mahewa 7.71 1090 0 586 28 0.42 10 13 170 52 10 177 8.5 32
396 Jalaun Kuthond 7.82 1035 0 512 42 0.54 36 15 410 64 60 56 7.6 28
397 Jalaun Jalaun 7.90 990 0 549 28 0.84 3.5 11 180 24 29.0 146 8.6 14
398 Jalaun Konch 7.85 1030 0 403 64 0.56 63 38 350 72 41 75 8.4 29
399 Jalaun Nadigaon 7.86 970 0 427 28 1.2 8.9 29 230 40 31 97 8.7 26
400 Jalaun Madhogarh 7.90 810 0 403 28 0.87 4.4 17 250 44 34 61 9.1 30
401 Jalaun Rampura 7.60 1007 0 451 43 0.32 1.3 14 360 60 50 46 8.6 31
402 Jalaun Orai (HQ) 7.84 1220 0 549 28 0.37 1.0 59 230 40 31 154 8.2 14
403 Jalaun Dakore 7.99 1770 0 561 227 1.3 70 60 630 60 101 120 9.3 26
404 Jaunpur M Badshahpur 8.24 665 0 409 14 0.80 0.70 2.4 200 8.0 43 72 3.3 23
405 Jaunpur Machhali Shahar 8.15 368 12 85 64 2.1 2.3 16 100 20 12 46 2.0 16
406 Jaunpur Sikrara 8.40 718 36 317 21 0.32 0.80 9.1 170 16 31 103 1.9 27
407 Jaunpur Buxa 8.61 574 0 323 21 0.32 6.8 8.4 210 24 36 43 2.6 29
408 Jaunpur Badlapur 8.64 716 12 256 7.1 0.38 0.70 38 155 20 25 46 4.6 22

Annexure-III
267
S.No. District Block pH
EC
µS/cm
at
25°C
CO3 HC
O3 Cl F NO3 SO4 TH Ca Mg Na K SiO2
mg/l
409 Jaunpur Maharajganj 7.99 483 0 305 7.1 0.60 2.9 2.2 180 20 31 37 2.1 28
410 Jaunpur Sujanganj 8.58 586 18 299 14 0.40 0.64 1.1 190 12 38 47 4.3 23
411 Jaunpur Jaunpur H.Q. 7.63 1754 0 342 241 0.15 59 159 550 32 113 117 3.9 28
412 Jaunpur Barsathi 8.29 525 0 268 14 0.23 0.50 1.9 180 16 34 50 3.5 25
413 Jaunpur Dharampur 8.08 522 0 317 14 0.60 5.0 8.1 230 12 48 39 4.8 28
414 Jaunpur Dobhi 7.98 476 0 293 21 0.13 0.26 1.5 170 8.0 36 50 2.8 32
415 Jaunpur Jalalpur 7.93 446 0 128 7.1 0.15 14 4.6 210 16 41 25 2.9 30
416 Jaunpur Karanja Kalan 8.52 833 6 329 64 1.4 0.56 30 200 4.0 46 151 2.6 23
417 Jaunpur Kerakat 8.19 441 0 268 7.1 0.62 7.6 2.2 170 8.0 36 38 2.4 32
418 Jaunpur Khutahan 7.99 527 0 317 21 0.53 12 6.0 230 24 41 49 4.6 30
419 Jaunpur Madiyahun 8.35 717 18 293 57 0.79 7.3 29 230 4.0 53 86 3.7 24
420 Jaunpur Muftiganj 8.15 523 0 342 7.1 0.47 0.32 2.8 190 8.0 41 58 3.2 24
421 Jaunpur RamNagar 8.46 865 36 488 14 1.8 0.73 2.7 70 12 10 230 1.8 23
422 Jaunpur Rampur 8.53 1032 42 537 14 1.8 0.82 15 100 4.0 22 301 2.4 21
423 Jaunpur Shahganj 8.08 469 0 256 28 0.42 4.9 12 130 12 24 73 4.8 27

Annexure-III
268
S.No. District Block pH
EC
µS/cm
at
25°C
CO3 HC
O3 Cl F NO3 SO4 TH Ca Mg Na K SiO2
mg/l
424 Jaunpur Sirkoni 8.54 1590 54 451 128 1.2 0.78 193 390 16 84 276 1.5 24
425 Jaunpur Suitha Kalan 8.26 436 0 281 7.1 0.41 0.36 8.6 170 8.0 36 40 4.5 27
426 Jhansi Bamaur 8.00 1529 0 622 85 0.95 10 170 440 80 58 182 8.4 32
427 Jhansi Gursarai 7.90 2300 0 647 411 0.77 32 17 700 124 94 215 4.1 30
428 Jhansi Mauranipur 7.50 810 0 403 50 0.42 0 12 280 52 36 57 12 34
429 Jhansi Bangra 7.14 890 0 268 482 0.22 29 19 790 244 43 72 7.2 38
430 Jhansi Jhansi (HQ) 7.75 431 0 183 50 0.65 0 5.0 120 28 12 47 5.4 31
431 Jhansi Babina 7.93 800 0 317 50 0.54 21 11 250 80 12 51 4.7 42
432 Jhansi Badagaon 7.69 1297 0 354 78 0.60 3.3 21 350 104 22 35 7.6 52
433 Jhansi Chirgaon 7.86 842 0 317 35 0.44 2.0 58 260 32 43 55 7.2 21
434 Jhansi Moth 7.64 1230 0 549 92 0.22 3.1 9.0 320 32 58 129 2.3 27
435 Kannauj Chhibramau 8.03 790 0 415 35 0.70 13 1.0 210 44 24 82 3.5 33
436 Kannauj Gugrapur 8.09 607 0 293 35 0.24 0 21 200 60 12 49 2.8 31
437 Kannauj Haseran 8.12 358 0 183 14 1.4 0 17 160 36 17 15 2.4 28
438 Kannauj Jalalabad 7.89 788 0 354 85 0.22 0 12 240 48 29 85 4.4 21

Annexure-III
269
S.No. District Block pH
EC
µS/cm
at
25°C
CO3 HC
O3 Cl F NO3 SO4 TH Ca Mg Na K SiO2
mg/l
439 Kannauj Kannauj 7.86 762 0 329 78 0.00 0 5.0 250 64 22 58 4.0 32
440 Kannauj Saurikh 8.11 481 0 232 14 0.30 0 29 150 20 24 38 11 30
441 Kannauj Talgram 8.35 690 24 342 7.1 0.70 11 20 240 16 48 56 5.5 32
442 Kannauj Umarda 7.59 1350 0 305 255 0.00 0 5.0 370 128 12 117 6.3 32
443 Kanpur Dehat Akbarpur 8.81 1260 84 390 71 1.4 19 51 270 20 53 156 1.7 25
444 Kanpur Dehat Amraudha 8.14 619 0 268 21 0.00 61 10 250 32 41 21 4.7 38
445 Kanpur Dehat Derapur 8.11 1430 0 281 213 0.00 65 117 510 48 94 90 4.5 36
446 Kanpur Dehat Jhinjhak 8.35 566 36 134 14 0.27 11 15 110 20 14 49 3.3 33
447 Kanpur Dehat Maitha 8.32 975 30 171 184 0.54 9.3 32 180 16 34 135 4.3 32
448 Kanpur Dehat Malasa 8.45 760 36 305 28 0.22 5.0 27 200 4.0 46 83 2.8 35
449 Kanpur Dehat Rajpur 7.95 749 0 390 28 0.20 16 13 300 48 43 39 4.8 37
450 Kanpur Dehat Rasoolabad 8.37 725 48 293 28 1.5 15 22 280 12 60 51 6.7 34
451 Kanpur Dehat Sandalpur 8.45 798 48 244 71 0.54 48 18 360 16 77 34 1.6 38
452 Kanpur Dehat Sarvan Khera 8.42 511 42 122 71 0.30 0 5.9 230 20 43 21 1.7 34
453 Kanpur Nagar Bhitar Gaon 8.55 972 72 317 50 0.86 11 48 300 24 58 88 2.2 29

Annexure-III
270
S.No. District Block pH
EC
µS/cm
at
25°C
CO3 HC
O3 Cl F NO3 SO4 TH Ca Mg Na K SiO2
mg/l
454 Kanpur Nagar Bidhnoo 7.92 981 0 366 121 0.30 27 50 450 60 72 38 6.3 34
455 Kanpur Nagar Bilhaur 8.37 577 72 146 14 0.42 6.2 10 200 28 31 35 4.5 38
456 Kanpur Nagar Chaubeypur 8.39 750 72 293 21 0.75 0 5.0 230 44 29 69 5.8 32
457 Kanpur Nagar Ghatampur 8.03 768 0 415 21 0.34 10 34 330 52 48 32 3.1 38
458 Kanpur Nagar Kakwan 8.04 643 0 281 14 1.9 0 36 180 32 24 51 5.9 32
459 Kanpur Nagar Kalyanpur leaked 0 0 0 0 0 0 0 0 0 0 0 0 0
460 Kanpur Nagar Sarsaul 8.51 734 60 293 21 1.4 7.6 12 180 20 31 100 2.8 31
461 Kanpur Nagar Shivrajpur 7.91 1784 0 98 532 0.00 65 90 850 152 113 50 23 28
462 Kasganj Amanpur 8.08 620 0 281 21 0.63 14 12 240 48 29 20 6.0 32
463 Kasganj Ganj dundwara 8.15 429 0 244 14 0.31 0 11 215 52 20 7 6.2 20
464 Kasganj Kasganj 7.82 554 0 268 21 0.54 26 8.7 240 52 26 27 4.6 30
465 Kasganj Patiyali 7.90 583 0 293 28 0.76 7.3 16 235 48 28 36 5.5 29
466 Kasganj Sahawar 8.09 363 0 195 21 0.57 0 7.7 170 48 12 10 4.2 28
467 Kasganj Sidhpura 7.68 1339 0 354 156 0.34 60 150 400 64 58 120 3.2 28
468 Kasganj Soron 7.50 936 0 256 99 0.94 65 27 350 64 46 55 5.1 30

Annexure-III
271
S.No. District Block pH
EC
µS/cm
at
25°C
CO3 HC
O3 Cl F NO3 SO4 TH Ca Mg Na K SiO2
mg/l
469 Kaushambi Chail 7.65 834 0 317 99 0.36 12 25 260 36 41 79 3.5 34
470 Kaushambi Kara 7.32 2907 0 586 432 0.11 361 85 1020 88 192 204 5.7 32
471 Kaushambi Kaushambi 7.74 805 0 439 35 0.58 5.8 5.0 230 28 38 87 2.6 31
472 Kaushambi Manjhanpur 7.98 718 0 378 35 0.48 17 16 175 12 35 95 7.0 29
473 Kaushambi Moorat Ganj 7.62 1882 0 232 241 0.30 476 14 740 52 146 85 3.8 29
474 Kaushambi Newada 7.67 546 0 305 14 0.51 11 7.5 170 20 29 53 3.4 26
475 Kaushambi Sarsawan 7.70 566 0 317 14 0.91 25 7.0 245 56 25 25 4.2 29
476 Kaushambi Sirathu 8.02 848 0 403 71 0.64 2.0 28 275 20 54 84 3.0 11
477 Kushinagar Dudhai 7.92 450 0 244 36 0.00 0 0 240 36 36 6.2 7.2 36
478 Kushinagar Fazil Nagar 7.45 780 0 305 99 0.00 0 31 390 132 15 19 3.3 36
479 Kushinagar Hata 7.89 470 0 281 21 0.25 0 6.1 200 36 27 25 4.0 36
480 Kushinagar Kaptan Ganj 7.56 640 0 256 78 0.00 0 45 320 80 29 24 4.6 30
481 Kushinagar Kasiya 7.65 550 0 220 50 0.00 0 46 270 56 32 16 3.4 37
482 Kushinagar Khadda 7.66 570 0 293 21 0.00 0 46 300 60 36 7 9.1 24
483 Kushinagar Motichak 7.99 380 0 207 21 0.33 0 18 200 32 29 8.5 2.8 33

Annexure-III
272
S.No. District Block pH
EC
µS/cm
at
25°C
CO3 HC
O3 Cl F NO3 SO4 TH Ca Mg Na K SiO2
mg/l
484 Kushinagar Nebuwa Naurangia 7.92 1130 0 476 92 0.00 0 110 480 72 73 50 46 26
485 Kushinagar Padrauna 7.99 780 0 134 128 0.00 0 140 370 44 63 31 5.5 34
486 Kushinagar Ramkola 7.97 480 0 232 28 0.30 0 42 260 36 41 7.2 3.7 31
487 Kushinagar Sewarhi 8.02 530 0 305 14 0.00 0 28 290 48 41 5.6 6.0 30
488 Kushinagar Sukrauli 7.76 640 0 256 50 0.38 0 81 330 60 44 17 4.1 35
489 Kushinagar Tamkuhi 8.23 400 0 207 21 0.26 0 25 200 36 27 12 3.9 33
490 Kushinagar Vishunpurwa 7.82 980 0 512 64 0.00 0 38 410 76 54 57 27 31
491 Lakhimpur Kheri Bankeyganj 7.77 567 0 207 35 0.40 8.7 42 240 48 29 29 8.6 22
492 Lakhimpur Kheri Behjam 7.91 565 0 336 21 0.44 0.57 1.9 230 28 38 34 5.9 27
493 Lakhimpur Kheri Bijua 8.13 316 0 183 14 0.26 0 0.90 150 40 12 9 4.2 25
494 Lakhimpur Kheri Dhaurahra 8.17 337 0 207 7.1 0.08 0.70 1.3 160 24 24 9 4.6 28
495 Lakhimpur Kheri Gola 7.90 375 0 220 14 0.32 0 1.1 180 40 19 6 3.3 25
496 Lakhimpur Kheri Ishanagasr 7.80 427 0 281 14 0.15 1.5 0.68 205 36 28 10 6.5 26
497 Lakhimpur Kheri Lakhimpur Khiri 7.88 445 0 232 21 0.15 0 12 210 28 34 10 6.0 22
498 Lakhimpur Kheri Mohammadi 7.64 551 0 378 14 0.47 0.57 3.4 280 28 50 23 5.4 29

Annexure-III
273
S.No. District Block pH
EC
µS/cm
at
25°C
CO3 HC
O3 Cl F NO3 SO4 TH Ca Mg Na K SiO2
mg/l
499 Lakhimpur Kheri Mitauli 8.00 549 0 268 28 0.64 0 21 170 32 22 48 4.7 28
500 Lakhimpur Kheri Nakaha 7.85 605 0 317 21 0.24 2.6 20 270 68 24 27 4.6 23
501 Lakhimpur Kheri Nighasan 7.80 520 0 317 14 0.18 1.0 1.9 260 72 19 6 6.8 20
502 Lakhimpur Kheri Pasgawan 8.00 300 0 159 7.1 0.33 0 18 150 40 12 4 2.4 23
503 Lakhimpur Kheri Palia Kalan 8.01 532 0 323 7.1 0.35 0.68 8.0 170 32 22 55 4.3 24
504 Lakhimpur Kheri Phoolbehar 8.05 551 0 220 50 0.10 0 40 140 32 14 65 6.1 22
505 Lakhimpur Kheri Ramaiyabehar 7.79 452 0 281 14 0.19 1.2 0.90 220 44 26 13 5.5 26
506 Lalitpur Talbehat 7.75 610 0 256 50 1.4 14 7.0 220 76 7 41 3.1 34
507 Lalitpur Jakhaura 7.96 1200 0 561 71 1.1 21 9.0 380 64 53 97 4.6 48
508 Lalitpur Bar 7.79 730 0 305 49 0.57 21 11 300 92 17 25 2.9 47
509 Lalitpur Lalitpur (HQ) 7.34 790 0 268 92 0.40 21 21 290 64 31 50 3.5 31
510 Lalitpur Mahroni 7.27 1020 0 366 128 0.52 18 5.0 370 68 48 59 6.6 40
511 Lalitpur Maadawara 7.66 1620 0 610 184 0.09 28 23 730 80 127 39 4.1 55
512 Lalitpur Birdha 7.92 990 0 500 50 0.50 2.6 10 360 56 53 65 2.3 26
513 Lucknow Chinhat 7.60 944 0 207 78 0.35 48 120 380 72 48 33 4.5 34

Annexure-III
274
S.No. District Block pH
EC
µS/cm
at
25°C
CO3 HC
O3 Cl F NO3 SO4 TH Ca Mg Na K SiO2
mg/l
514 Lucknow Bakshi Ka Talab 8.10 522 0 293 7.0 0.78 0 31 210 16 41 35 5.4 34
515 Lucknow Mal 7.79 500 0 281 14 0.67 0 6.0 200 32 29 25 4.2 35
516 Lucknow Malihabad 8.20 442 0 244 14 0.64 0 6.0 160 8.0 34 29 6.2 36
517 Lucknow Kakori 7.93 557 0 195 50 0.94 10 33 220 24 39 28 3.9 36
518 Lucknow Gosaiganj 7.72 409 0 232 7.0 0.49 0 21 200 36 27 12 2.4 24
519 Lucknow Mohanlalganj 7.81 498 0 256 14 0.50 0 25 200 24 34 28 4.2 30
520 Lucknow Sarojini Nagar 7.89 395 0 207 7.0 1.1 0 15 160 28 22 17 3.5 24
521 Mahamaya Nagar Sikandra Rao 8.14 312 0 171 7.1 1.3 0.25 12 110 16 17 25 4.1 20
522 Mahamaya Nagar Sasni 8.04 2062 0 125
7 156 0.97 94 153 230 12 48 448 4.6 24
523 Mahamaya Nagar Hathras 8.47 2286 30 525 213 0.89 184 107 220 4.0 50 380 49 24
524 Mahamaya Nagar Hasayan 8.25 1464 0 268 177 0.39 76 88 270 20 53 147 98 24
525 Mahamaya Nagar Sahpau 8.48 1805 18 317 170 0.32 92 156 220 8.0 48 313 97 25
526 Mahamaya Nagar Sadabad 8.11 3360 0 378 312 1.3 7.1 51 320 28 60 631 4.4 16
527 Mahamaya Nagar Mursan 7.91 4296 0 573 773 0.24 29 345 590 32 122 763 8.1 24

Annexure-III
275
S.No. District Block pH
EC
µS/cm
at
25°C
CO3 HC
O3 Cl F NO3 SO4 TH Ca Mg Na K SiO2
mg/l
528 Maharajganj Brijman Ganj 7.97 460 0 268 21 0.00 15 7.2 220 64 15 20 1.6 35
529 Maharajganj Dhani 8.06 370 0 207 21 0.15 0 10 180 52 12 12 0.0 30
530 Maharajganj ghughuli 8.04 564 0 195 85 0.00 0 28 210 56 17 40 3.6 37
531 Maharajganj Laxmipur 8.27 400 0 244 21 0.54 0 0 180 48 15 23 0.0 34
532 Maharajganj Maharaj Ganj 8.03 580 0 226 92 0.00 0 14 290 84 19 20 3.1 36
533 Maharajganj Mithaura 8.28 330 0 134 21 0.00 0 29 160 52 7 5.4 1.3 26
534 Maharajganj Nautanwa 8.38 440 24 226 14 0.00 0 0 200 44 22 25 1.0 33
535 Maharajganj Nichlaul 8.24 380 0 195 36 0.18 0 6.2 190 52 15 13 1.5 28
536 Maharajganj Paniyara 8.13 367 0 232 14 0.28 0 0 180 52 12 11 2.9 34
537 Maharajganj Partawal 8.21 340 0 183 21 0.00 0 14 180 52 12 7.9 1.5 28
538 Maharajganj Pharenda 7.82 490 0 305 14 0.00 0 14 235 64 18 18 1.3 30
539 Maharajganj Siswa 7.87 280 0 159 21 0.00 0 3.4 130 20 19 11 3.5 39
540 Mahoba Charkhari 7.76 1900 0 439 376 1.7 0 24 550 32 113 174 0.0 35
541 Mahoba Jaitpur 7.44 1200 0 195 199 1.2 110 10 350 84 34 93 1.4 42
542 Mahoba Kabrai 7.48 1283 0 195 184 1.2 130 19 450 96 50 49 0.0 62

Annexure-III
276
S.No. District Block pH
EC
µS/cm
at
25°C
CO3 HC
O3 Cl F NO3 SO4 TH Ca Mg Na K SiO2
mg/l
543 Mahoba Panwari 7.78 633 0 317 28 1.4 15 9.0 200 28 31 61 1.2 36
544 Mainpuri Barnahal 7.61 1327 0 336 206 0.47 37 11 505 56 88 71 6.1 30
545 Mainpuri Bewar 7.94 446 0 262 14 0.70 0 7.1 180 36 22 24 3.6 30
546 Mainpuri Ghirore 7.93 424 0 232 14 0.84 0 8.3 185 44 18 20 4.1 25
547 Mainpuri Jageer 7.87 453 0 268 7.1 0.50 0 10 215 40 28 13 3.1 27
548 Mainpuri Karhal 7.68 910 0 439 64 0.94 36 24 210 32 31 117 5.4 28
549 Mainpuri Kishni 8.00 1955 0 561 124 2.0 10 425 270 20 53 342 7.1 24
550 Mainpuri Kishni 8.24 2488 0 641 245 1.6 32 258 270 28 48 464 2.7 19
551 Mainpuri Kishni 7.97 1492 0 561 78 1.7 0 117 230 16 46 231 6.9 24
552 Mainpuri Kurawali 7.71 737 0 366 21 0.75 0 25 240 32 38 57 5.2 26
553 Mainpuri Mainpuri 7.76 433 0 256 14 0.54 0 6.7 190 68 5 20 2.8 29
554 Mainpuri Sultanganj 7.82 591 0 354 14 0.61 0 6.4 250 28 43 32 5.1 26
555 Mathura Raya 8.01 4946 0 390 993 1.2 31 287 790 36 168 887 3.8 20
556 Mathura Manth 7.97 3298 0 634 383 1.7 24 345 240 20 46 730 30 24
557 Mathura Baldeo 8.38 2110 84 683 113 3.5 98 74 130 12 24 562 7.0 21

Annexure-III
277
S.No. District Block pH
EC
µS/cm
at
25°C
CO3 HC
O3 Cl F NO3 SO4 TH Ca Mg Na K SiO2
mg/l
558 Mathura Farah 8.18 2259 0 671 199 3.3 12 212 270 16 55 562 2.1 22
559 Mathura Mathura 7.95 1466 0 207 227 0.26 11 94 250 36 38 241 3.1 25
560 Mathura Goverdhan 8.31 3957 42 549 510 4.3 3.5 471 270 20 53 1020 3.2 24
561 Mathura Nandgaon 7.31 37230 0 49 9018 1.2 59 5600 4620 548 780 6763 165 5
562 Mathura Chhata 7.58 2650 0 244 411 0.05 7.1 365 620 112 82 290 3.3 25
563 Mathura Naujhil 7.65 8349 0 293 908 0.63 117
7 42 1780 72 384 1129 20 19
564 Mathura Chaumuhan 7.80 4819 0 329 922 0.1 74 411 760 52 151 967 4.7 25
565 Maunath Bhanjan Badraon 8.27 594 0 232 57 0.34 5.9 5.6 225 8.0 49 44 2.5 27
566 Maunath Bhanjan Dohari Ghat 8.21 325 0 165 14 0.29 0.22 7.3 130 10 25 25 3.9 25
567 Maunath Bhanjan Fatehpur Madaon 8.16 282 0 153 7.1 0.18 0.31 7.0 105 12 18 21 4.3 24
568 Maunath Bhanjan Ghosi 7.84 1162 0 427 103 0.42 15 29 355 28 68 112 12 25
569 Maunath Bhanjan Kopaganj 8.16 472 0 232 32 0.18 0.18 6.7 160 10 32 50 2.9 24
570 Maunath Bhanjan Mohammadabad 8.46 550 21 250 25 0.78 5.6 1.5 200 4.0 46 60 1.6 22
571 Maunath Bhanjan Pardaha 8.08 789 0 433 25 0.46 1.2 16 255 10 55 107 2.0 21

Annexure-III
278
S.No. District Block pH
EC
µS/cm
at
25°C
CO3 HC
O3 Cl F NO3 SO4 TH Ca Mg Na K SiO2
mg/l
572 Maunath Bhanjan Ranipur 7.87 813 0 451 14 0.69 3.3 20 200 18 37 101 1.8 24
573 Maunath Bhanjan Ratanpura 8.32 584 9 232 21 0.19 0.12 68 180 4.0 41 58 1.6 27
574 Meerut Saroorpur 8.22 830 0 390 21 0.55 5.3 20 300 52 41 45 4.8 31
575 Meerut Parichhatgarh 8.23 790 0 372 7.1 0 0 35 340 68 41 19 5.7 31
576 Meerut Meerut 8.21 1540 0 683 64 0.19 71 56 430 44 77 118 6.7 33
577 Meerut Hastinapur 8.21 980 0 342 50 0.30 60 45 340 80 34 43 32 30
578 Meerut Rohta 8.27 786 0 281 28 0.54 7.8 74 270 28 48 36 15 30
579 Meerut Daurala 8.27 834 0 195 71 0 11 95 240 40 34 57 7.7 24
580 Meerut Mawana 8.20 713 0 378 7.1 0 7.0 28 330 72 36 25 6.4 33
581 Meerut Rajpura 8.21 622 0 323 14 0.56 0 7.7 240 32 38 35 5.0 31
582 Meerut Kharkhoda 8.22 1035 0 244 135 0 28 64 230 20 43 113 8.5 33
583 Meerut Sardhana 8.24 2016 0 702 163 0.35 97 32 655 92 102 90 96 35
584 Meerut Janikhurd 8.24 591 0 293 7.1 0.61 0 27 250 56 26 8 4.5 26
585 Meerut Machhra 8.23 673 0 329 28 0 0 11 240 52 26 26 6.0 27
586 Mirzapur Mirzapur H.Q. 7.67 1069 0 256 106 0.36 134 48 400 56 62 77 1.6 30

Annexure-III
279
S.No. District Block pH
EC
µS/cm
at
25°C
CO3 HC
O3 Cl F NO3 SO4 TH Ca Mg Na K SiO2
mg/l
587 Mirzapur Chanbey 7.97 234 0 122 7.1 0.32 4.0 3.0 80 24 5 28 0.38 23
588 Mirzapur City 8.55 788 30 342 50 1.5 23 32 240 8.0 53 162 1.4 20
589 Mirzapur Haliya 7.72 252 0 98 7.1 0.42 11 24 100 24 10 5 11 12
590 Mirzapur Jamalpur 7.52 364 0 232 7.1 0.22 0.10 2.2 160 48 10 15 1.2 21
591 Mirzapur Kon 7.58 397 0 256 7.1 0.09 0.25 2.0 180 40 19 18 2.3 26
592 Mirzapur Lalganj 7.64 600 0 244 57 0.66 8.9 22 160 32 19 85 0.29 21
593 Mirzapur Majhawan 7.62 467 0 268 14 0.39 11 8.9 210 44 24 19 1.4 29
594 Mirzapur Marihan 7.70 254 0 98 21 0.04 19 6.8 100 28 7 8 0.84 22
595 Mirzapur Narainpur 7.79 1816 0 512 199 1.1 94 154 500 40 96 260 31 20
596 Mirzapur Pahari 7.45 1136 0 183 184 0.12 102 4.1 420 100 41 47 0.68 33
597 Mirzapur Rajgarh 7.77 352 0 146 28 0.00 2.5 15 130 24 17 25 3.7 9
598 Mirzapur Sikhar/ Shikhad 7.64 452 0 244 14 0.10 0 14 200 44 22 18 4.0 12
599 Moradabad Bhagatpur Tanda 7.98 445 0 268 14 0.33 0 0 190 56 12 21 1.6 24
600 Moradabad Thakurdwara 7.93 425 0 244 14 0.32 0 11 160 32 19 34 1.2 28
601 Moradabad Dilari 7.89 440 0 256 14 0.41 0 0 140 44 7 46 1.3 23

Annexure-III
280
S.No. District Block pH
EC
µS/cm
at
25°C
CO3 HC
O3 Cl F NO3 SO4 TH Ca Mg Na K SiO2
mg/l
602 Moradabad Moondha Pandey 7.90 465 0 244 28 0.17 0 10 200 40 24 24 2.6 24
603 Moradabad Sambhal 7.82 550 0 262 11 0.34 14 30 230 44 29 28 5.0 29
604 Moradabad Panwasa 7.96 463 0 232 28 0.55 0 5.1 180 40 19 14 3.1 29
605 Moradabad Bahjoi 7.92 480 0 201 32 0.38 0 8.5 175 36 20 24 5.1 31
606 Moradabad Baniakhera 7.93 690 0 256 57 0.30 57 43 190 52 14 79 4.7 26
607 Moradabad Bilari 7.94 723 0 262 43 0.38 27 40 185 64 6 81 6.8 26
608 Moradabad Deengarpur 7.94 582 0 220 25 0 0 51 175 44 16 49 9.0 27
609 Moradabad Moradabad 8.00 398 0 207 14 0.20 0 0 135 20 20 32 5.4 25
611 Moradabad Asmoli 7.98 394 0 159 14 0 0 62 160 32 19 23 4.5 28
610 Moradabad Chhajlet 7.87 340 0 177 18 0.18 0 8.7 130 48 2 20 2.7 29
612 Muzaffarnagar Kandhala 8.06 505 0 207 14 1.1 0 31 200 36 26 4 24 24
613 Muzaffarnagar Kairana 7.84 958 0 415 50 0.61 23 38 380 36 70 5 29 29
614 Muzaffarnagar Bhaghara 8.11 596 0 268 14 0.18 0 27 230 40 31 4 30 30
615 Muzaffarnagar Budhana 8.08 1010 0 427 78 0.44 57 34 385 84 42 46 5.9 32
616 Muzaffarnagar Charthawal 7.63 1701 0 378 234 0 54 169 590 116 72 83 7.4 32

Annexure-III
281
S.No. District Block pH
EC
µS/cm
at
25°C
CO3 HC
O3 Cl F NO3 SO4 TH Ca Mg Na K SiO2
mg/l
617 Muzaffarnagar Jansath 7.87 598 0 305 7.1 0.29 0 18 240 52 26 12 5.6 31
618 Muzaffarnagar Khatauli 7.74 876 0 342 71 0 0 38 330 56 46 32 6.5 29
619 Muzaffarnagar Morna 7.86 610 0 244 21 0 22 35 255 60 25 9 3.4 29
620 Muzaffarnagar Muzaffarnagar 8.45 525 24 201 14 0.81 0 19 230 40 31 10 3.7 27
621 Muzaffarnagar Purkaji 8.47 612 48 195 14 0.17 0 23 250 76 14 9 4.1 27
622 Muzaffarnagar Shahpur 7.92 654 0 342 7.1 0.59 0 12 250 48 31 17 4.2 28
623 Muzaffarnagar Shamli 8.12 604 0 220 28 0.98 0 45 250 52 29 14 4.1 23
624 Muzaffarnagar Thana Bhawan 7.94 609 0 299 14 0.73 0 0 225 32 35 5 28 28
625 Muzaffarnagar UN 8.00 755 0 354 43 0.72 0 14 295 72 28 4 29 29
626 Pilibhit Amaria 8.12 388 0 195 14 0.55 0 15 125 36 8 31 3.1 23
627 Pilibhit Bar khera 7.81 451 0 232 21 0.39 0.65 13 185 48 16 21 4.0 27
628 Pilibhit Bilsanda 7.90 434 0 244 14 0.48 0 3.7 190 52 14 14 4.7 31
629 Pilibhit Bisalpur 7.95 386 0 195 14 0.35 0 34 145 40 11 28 4.0 22
630 Pilibhit Lalauri Khera 8.20 429 0 207 43 0.33 0 3.5 180 20 31 24 4.6 3
631 Pilibhit Marori 8.17 456 0 268 21 0.37 0 2.0 180 44 17 30 3.9 31

Annexure-III
282
S.No. District Block pH
EC
µS/cm
at
25°C
CO3 HC
O3 Cl F NO3 SO4 TH Ca Mg Na K SiO2
mg/l
632 Pilibhit Puranpur 7.95 304 0 189 7.1 0.40 0 2.1 140 36 12 11 2.9 28
633 Pratapgarh Aspur- Deosara 8.19 546 0 329 7.1 0.66 0.60 2.7 160 12 31 56 3.6 26
634 Pratapgarh Baba Bekhernath 8.57 1526 42 708 57 1.3 6.1 87 160 8.0 34 271 3.6 22
635 Pratapgarh Babaganj 8.10 773 0 403 28 0.70 20 16 190 36 24 96 4.9 23
636 Pratapgarh Bihar 8.10 800 0 403 21 0.93 3.7 64 310 32 55 53 7.4 23
637 Pratapgarh Gaura 7.98 596 0 378 14 1.1 0.91 1.6 220 16 43 49 5.2 24
638 Pratapgarh Kalanker 7.90 658 0 390 7.1 0.96 2.1 26 200 32 29 72 2.8 16
639 Pratapgarh Kunda 7.80 1135 0 512 92 0.48 1.5 30 320 12 70 118 4.7 23
640 Pratapgarh Lakshmanpur 8.20 611 0 390 7.1 0.77 0.70 1.6 180 12 36 65 5.0 24
641 Pratapgarh Lalganj 8.20 892 0 561 14 0.94 1.0 5.4 150 12 29 154 1.8 21
642 Pratapgarh Mandhata 8.58 492 84 110 7.1 0.73 0.50 10 150 16 26 46 2.8 25
643 Pratapgarh Mangraura 8.45 437 78 134 7.1 0.37 2.5 3.2 175 12 35 35 4.4 28
644 Pratapgarh Patti 8.14 710 0 354 43 0.28 5.4 18 250 40 36 54 5.8 29
645 Pratapgarh Pratapgarh Sadar 8.42 670 12 305 50 1.2 5.0 7.7 290 12 62 58 8.0 25
646 Pratapgarh Rampur- Sangramg 7.87 1270 0 586 28 0.83 1.4 36 90 8.0 17 216 2.0 17

Annexure-III
283
S.No. District Block pH
EC
µS/cm
at
25°C
CO3 HC
O3 Cl F NO3 SO4 TH Ca Mg Na K SiO2
mg/l
647 Pratapgarh Sandwa- Chandrik 8.41 616 12 220 21 0.96 17 33 230 20 31 42 4.8 23
648 Pratapgarh Sangaipur 8.62 2029 24 106
1 43 0.57 2.0 70 160 20 26 404 5.3 20
649 Pratapgarh Shivgarh 8.15 544 0 317 14 0.76 4.0 4.4 230 20 43 24 4.7 27
650 Prayagraj Bahadurpur 7.64 396 0 159 43 0.82 0 10 170 40 17 12 2.2 31
651 Prayagraj Bahera 7.89 612 0 329 35 0.76 0 18 180 20 31 70 4.1 26
652 Prayagraj Chaka 7.80 646 0 293 50 0.51 23 12 210 36 29 57.5 2.9 29
653 Prayagraj Dhanpur 7.52 580 0 329 14 0.14 8.2 5.7 225 44 28 34 2.7 33
654 Prayagraj Handa 7.80 1034 0 512 50 1.5 6.6 64 370 56 55 87 3.1 21
655 Prayagraj Holagarh 7.69 809 0 390 35 0.91 20 31 220 40 29 86 6.0 27
656 Prayagraj Jasra 7.87 1419 0 598 99 0.51 6.1 78 230 20 43 224 2.2 21
657 Prayagraj Karchana 7.57 565 0 281 35 0.76 9.0 12 225 40 30 34 1.5 27
658 Prayagraj Kaundhiyara 7.82 544 0 299 28 0.48 6.4 10 200 32 29 44 2.0 25
659 Prayagraj Kaurihar 7.74 803 0 342 64 0.60 36 7.0 280 36 46 56 4.0 28
660 Prayagraj Koran 7.68 1069 0 390 128 0.51 2.0 37 280 36 46 100 1.6 33

Annexure-III
284
S.No. District Block pH
EC
µS/cm
at
25°C
CO3 HC
O3 Cl F NO3 SO4 TH Ca Mg Na K SiO2
mg/l
661 Prayagraj Manda 7.56 700 0 232 57 0.16 96 22 155 56 4 98 2.0 26
662 Prayagraj Mau-Aima 7.90 659 0 403 14 0.50 0 5.2 160 16 29 91 2.0 19
663 Prayagraj Meja 7.80 882 0 268 121 0.22 46 50 225 12 47 118 0.62 22
664 Prayagraj Phoolpur 7.77 626 0 329 28 0.77 2.0 14 160 24 24 76 3.2 24
665 Prayagraj Pratappur 7.71 1438 0 769 71 0.50 2.4 29 220 16 43 247 7.0 29
666 Prayagraj Saidabad 7.98 745 0 451 21 1.1 0 5.1 230 44 29 80 2.3 23
667 Prayagraj Shankargarh 7.50 1289 0 311 206 0.28 34 64 380 56 58 110 17 13
668 Prayagraj Soraon 7.97 705 0 342 43 0.88 18 17 205 28 32 76 3.9 24
669 Prayagraj Urwa 7.49 871 0 293 135 0.02 8.0 27 295 64 32 77 3.2 33
670 Raibareli Amawan 8.21 463 0 317 21 0.43 0.50 2.5 200 13 41 39 5.7 23
671 Raibareli Bachharawan 8.38 451 0 256 14 0.40 1.2 3.8 160 13 31 33 4.7 28
672 Raibareli Bahadurpur 7.74 745 0 366 57 0.62 7.5 3.8 320 55 46 30 4.2 29
673 Raibareli Chhatoh 7.82 1380 0 464 50 0.79 1.5 253 530 59 94 84 5.7 26
674 Raibareli Chhatoh 8.12 1428 0 561 53 1.3 0 207 590 29 125 72 6.1 22
675 Raibareli Chhatoh 7.64 794 0 378 28 0.36 2.5 78 340 55 50 42 3.4 27

Annexure-III
285
S.No. District Block pH
EC
µS/cm
at
25°C
CO3 HC
O3 Cl F NO3 SO4 TH Ca Mg Na K SiO2
mg/l
676 Raibareli Dalmau 8.03 569 0 293 50 0.36 0.90 14 240 29 41 38 3.0 29
677 Raibareli Deeh 7.84 949 0 342 78 0.25 5.8 101 350 34 65 64 6.9 28
678 Raibareli Dinshahgaura 7.83 616 0 268 43 0.39 11 21 230 38 34 35 5.1 30
679 Raibareli Harichandpur 8.04 798 0 195 85 0.00 43 83 280 21 55 53 4.1 30
680 Raibareli Jagatpur 8.26 431 0 268 14 0.57 0 2.3 160 13 31 35 4.8 26
681 Raibareli Kheron 7.66 696 0 317 57 0.11 4.4 9.0 240 46 31 46 7.9 20
682 Raibareli Lalganj 8.05 2517 0 878 220 1.4 3.5 210 1005 34 222 111 4.6 21
683 Raibareli Lalganj 7.96 1345 0 378 170 0.72 26 72 490 21 106 69 5.6 23
684 Raibareli Lalganj 8.03 430 0 244 14 1.3 1.0 25 230 38 34 6 2.8 23
685 Raibareli Maharajganj 7.76 818 0 403 35 0.36 7.5 52 280 42 43 71 5.2 30
686 Raibareli Rahi 8.25 662 0 268 57 0.17 7.9 34 210 13 43 57 3.4 29
687 Raibareli Rohnia 7.85 406 0 232 14 0.08 0 15 180 34 24 20 4.1 30
688 Raibareli Salon 8.22 492 0 281 28 0.52 12 14 200 17 38 39 4.7 29
689 Raibareli Sareni 8.68 900 0 427 35 0.26 0 35 350 46 58 37 4.2 24
690 Raibareli Sartawan 7.75 1029 0 451 60 0.83 0.90 43 340 25 67 70 6.5 23

Annexure-III
286
S.No. District Block pH
EC
µS/cm
at
25°C
CO3 HC
O3 Cl F NO3 SO4 TH Ca Mg Na K SiO2
mg/l
691 Raibareli Sheogarh 8.01 626 0 390 21 0.85 0 6.4 220 42 29 61 5.2 26
692 Raibareli Singhpur 7.91 464 0 256 14 0.96 0 10 190 29 29 19 5.7 29
693 Raibareli Tiloee 7.93 1572 0 427 191 0.97 18 115 380 38 70 169 7.9 28
694 Raibareli Unchahar 8.47 901 12 323 78 0.87 6.5 50 230 8.4 50 99 6.2 26
695 Raibareli Unchahar 8.55 1001 30 378 85 0.79 3.4 40 230 8.4 50 109 6.0 28
696 Raibareli Unchahar 8.28 449 0 244 28 1.0 0.94 6.9 160 8.4 34 37 4.3 28
697 Rampur Milak 7.85 890 0 403 36 0.26 5.0 72 310 40 50 74 15 21
698 Rampur Shahbad 7.87 1047 0 293 85 0.29 34 87 350 88 31 73 6.2 23
699 Rampur Chamraua 7.85 465 0 207 21 0.18 0 43 205 44 23 22 2.9 26
700 Rampur Bilaspur 7.95 582 0 305 14 0.32 0 34 235 36 35 38 1.4 25
701 Rampur Swar 7.97 558 0 293 14 0.21 0 43 235 52 25 26 1.8 27
702 Rampur Saidnagar 7.92 352 0 201 14 0.14 0 6.0 155 52 6 11 1.5 28
703 Saharanpur Nanauta 8.22 597 0 281 7.1 0.54 0 25 220 36 31 18 5.5 25
704 Saharanpur Nakur 8.21 1232 0 390 85 0 73 68 410 80 50 80 6.8 28
705 Saharanpur Nagal 8.22 582 0 293 11 0.33 0 0 220 56 19 18 3.2 29

Annexure-III
287
S.No. District Block pH
EC
µS/cm
at
25°C
CO3 HC
O3 Cl F NO3 SO4 TH Ca Mg Na K SiO2
mg/l
706 Saharanpur Puwarka 8.23 662 0 342 7.1 0.16 0 5.4 240 44 31 31 4.2 27
707 Saharanpur Rampur 7.79 555 0 256 14 0.47 0 29 220 40 29 12 5.7 28
708 Saharanpur Sadauli Qudim 7.70 967 0 110 156 0.10 89 38 380 84 41 21 2.2 26
709 Saharanpur Sarsawa 7.69 927 0 378 43 0 0 37 340 36 60 35 7.4 26
710 Saharanpur Deoband 7.83 727 0 317 21 0.53 0 30 300 60 36 9 15 28
711 Saharanpur Baliakheri 8.00 590 0 281 28 0.55 0 28 230 40 31 19 5.4 22
712 Saharanpur Gangoh 7.99 729 0 305 43 0.42 0 23 280 44 41 5 28 28
713 Saharanpur Muzafarabad 8.13 530 0 244 14 0 11 12 230 36 34 0 23 23
714 Sant Kabir Nagar Bagholi 7.98 600 0 323 28 0.00 7.3 7.1 290 64 32 15 1.2 27
715 Sant Kabir Nagar Belhar Kalan 8.13 320 0 195 11 0.00 0 0 130 36 10 18 2.2 32
716 Sant Kabir Nagar Hessar Bazar 7.89 500 0 281 25 0.12 0 15 270 36 44 7.7 2.1 29
717 Sant Kabir Nagar Khalilabad 7.69 1000 0 451 99 0.00 20 45 470 84 63 48 2.8 36
718 Sant Kabir Nagar Mehdawal 8.16 500 0 232 50 0.00 0 18 210 20 39 35 2.6 35
719 Sant Kabir Nagar Nnath Nagar 7.89 550 0 354 14 0.00 0 0 200 48 19 56 1.2 31
720 Sant Kabir Nagar Poli 8.39 530 36 232 36 0.00 0 0 290 92 15 7.5 2.6 26

Annexure-III
288
S.No. District Block pH
EC
µS/cm
at
25°C
CO3 HC
O3 Cl F NO3 SO4 TH Ca Mg Na K SiO2
mg/l
721 Sant Kabir Nagar Santha 7.91 415 0 220 28 0.00 0 12 210 52 19 6.7 1.2 26
722 Sant Kabir Nagar Semariyawan 7.62 300 0 159 21 0.00 0 7.2 150 44 10 7.6 4.4 11
723 Sant Ravidas
Nagar Abholi 8.32 532 18 244 14 0.46 12 31 160 12 31 80 5.8 31
724 Sant Ravidas
Nagar Aurai 7.94 321 0 122 35 0.19 11 12 110 24 12 29 1.4 27
725 Sant Ravidas
Nagar Bhadohi 7.93 510 0 220 35 0.68 4.1 38 150 32 17 61 3.7 14
726 Sant Ravidas
Nagar Deegh 7.81 636 0 378 21 1.1 17 21 300 32 53 41 1.0 22
727 Sant Ravidas
Nagar Gyanpur 7.81 667 0 403 28 0.59 0.41 5.3 270 28 48 63 5.1 26
728 Sant Ravidas
Nagar Suriyawan 8.22 585 0 220 57 0.14 16 37 180 12 36 71 2.4 32
729 Shahjahanpur Banda 7.81 454 0 207 35 0.17 0 27 200 80 0 20 5.7 33
730 Shahjahanpur Bhawal Khera 7.63 1420 0 464 163 0.02 19 79 490 36 96 100 3.0 36
731 Shahjahanpur Dadraul 8.20 595 0 268 28 0.30 0.53 32 115 36 6 82 3.0 32

Annexure-III
289
S.No. District Block pH
EC
µS/cm
at
25°C
CO3 HC
O3 Cl F NO3 SO4 TH Ca Mg Na K SiO2
mg/l
732 Shahjahanpur Jaitipur 8.20 344 0 214 7.1 0.34 0 4.0 110 8.0 22 35 3.2 33
733 Shahjahanpur Jalalabad 7.90 342 0 207 7.1 0.37 0 4.8 140 52 2 18 3.3 33
734 Shahjahanpur Kalan 7.87 718 0 305 43 0.33 0.65 55 170 56 7 87 3.8 35
735 Shahjahanpur Kanth 7.90 535 0 214 28 0.34 0 74 230 32 36 27 4.8 29
736 Shahjahanpur Katra 8.33 500 0 214 35 0.33 0 41 130 28 14 60 5.8 33
737 Shahjahanpur Khutar 7.75 767 0 317 78 0.27 0.86 31 270 20 53 57 7.9 28
738 Shahjahanpur Madanapur 8.30 795 0 244 110 0.44 0.62 61 170 20 29 109 7.8 28
739 Shahjahanpur Mirzapur 8.08 679 0 390 21 1.2 2.5 22 115 24 13 117 4.0 29
740 Shahjahanpur Nigohi 8.06 503 0 275 14 0.31 6.9 12 230 16 46 12 8.6 32
741 Shahjahanpur Puyawan 7.55 519 0 244 43 0.22 0 8.6 210 32 31 23 7.0 34
742 Shahjahanpur Sindhauli 7.70 999 0 451 92 0.26 6.0 13 315 24 61 92 3.6 37
743 Shahjahanpur Tilhar 7.93 375 0 183 18 0.27 0 18 120 20 17 29 8.5 32
744 Shrawasti Jamunaha H.Q. 8.12 708 0 390 14 0.22 0 0 230 32 36 42 2.1 25
745 Shrawasti Hariharpur Rani
H.Q. 8.35 605 18 262 21 0.15 0 0 200 20 36 34 1.9 26

Annexure-III
290
S.No. District Block pH
EC
µS/cm
at
25°C
CO3 HC
O3 Cl F NO3 SO4 TH Ca Mg Na K SiO2
mg/l
746 Shrawasti Sirsiya H.Q. 8.31 825 0 451 14 0.21 0 0 280 16 58 45 0 22
747 Shrawasti Ikauna H.Q. 8.28 1044 0 342 149 0.48 0 6.7 260 24 48 99 4.6 13
748 Shrawasti Gilaula H.Q. 8.08 485 0 232 18 0 0 6.8 220 44 26 6 1.8 25
749 Siddharth Nagar Bhanwapur H.Q. 8.15 690 0 329 28 0.80 0 9.0 300 76 26 11 2.6 30
750 Siddharth Nagar Dumariyaganj H.Q. 7.79 1192 0 488 71 0.65 28 63 390 56 60 69 2.5 21
751 Siddharth Nagar Itwa H.Q. 7.97 610 0 317 14 0.55 0 6.5 245 44 32 16 1.7 29
752 Siddharth Nagar Badhni H.Q. 8.40 847 24 384 21 0.81 0 0 340 76 36 34 0 18
753 Siddharth Nagar Shohratgarh H.Q. 8.28 454 0 226 14 0.77 0 5.9 200 20 36 10 1.7 27
754 Siddharth Nagar Naugarh H.Q. 7.89 827 0 415 36 0.75 0 5.4 320 36 55 25 2.2 28
755 Siddharth Nagar Lotan H.Q. 8.13 672 0 342 18 0.79 0 0 240 44 31 33 1.5 31
756 Siddharth Nagar Uska bazar H.Q. 7.80 757 0 390 14 0.51 0 7.0 310 60 38 27 3.4 36
757 Siddharth Nagar Birdpur H.Q. 8.01 996 0 525 14 0.93 0 37 330 48 50 94 1.1 25
758 Siddharth Nagar Jogiya H.Q. 7.82 946 0 500 21 0.77 0 0 380 48 62 23 2.0 29
759 Siddharth Nagar Khuniyaw H.Q. 7.72 279 0 128 7.1 0.80 0 11 110 20 14 3 9.5 16
760 Siddharth Nagar Mithawal H.Q. 7.95 560 0 293 14 0.49 0 0 235 56 23 8 1.4 26

Annexure-III
291
S.No. District Block pH
EC
µS/cm
at
25°C
CO3 HC
O3 Cl F NO3 SO4 TH Ca Mg Na K SiO2
mg/l
761 Siddharth Nagar Bansi H.Q. 7.80 900 0 378 64 0.53 0 14 340 52 50 32 2.9 32
762 Siddharth Nagar Khesraha H.Q. 7.65 628 0 323 14 0.70 0 0 260 40 38 16 2.1 32
763 Sitapur Mahmudabad 8.05 404 0 220 21 0.24 0 5.4 170 48 12 17 4.8 28
764 Sitapur Rampur Mathura 7.97 496 0 281 14 0.00 0 14 200 60 12 25 2.7 19
765 Sitapur Rewsa 7.76 588 0 317 21 0.21 0 9.2 190 44 19 51 3.7 28
766 Sitapur Behta 7.48 725 0 317 50 0.00 0 56 280 60 31 42 10 26
767 Sitapur Sakran 7.79 651 0 317 35 0.22 0 22 200 44 22 59 5.8 34
768 Sitapur Biswan 7.77 386 0 232 7.1 0.00 0 5.0 170 32 22 15 3.1 39
769 Sitapur Pahala 7.84 327 0 183 14 0.00 0 6.6 150 32 17 10 3.0 39
770 Sitapur Sidhauli 7.39 813 0 366 71 0.00 14 35 350 40 60 42 5.5 38
771 Sitapur Gondlamau 7.85 581 0 305 21 0.60 0 11 250 40 36 15 5.1 36
772 Sitapur Machhreta 8.36 521 36 122 64 0.00 5 26 160 16 29 52 4.6 32
773 Sitapur Misrikh 7.83 810 0 329 78 0.00 0 22 170 24 26 98 6.1 29
774 Sitapur Pisawan 7.81 441 0 232 14 0.00 0 25 190 28 29 22 4.9 30
775 Sitapur Mohol 8.39 411 48 134 14 0.29 0 5.0 180 16 34 14 4.3 33

Annexure-III
292
S.No. District Block pH
EC
µS/cm
at
25°C
CO3 HC
O3 Cl F NO3 SO4 TH Ca Mg Na K SiO2
mg/l
776 Sitapur Aliya 8.09 680 0 268 50 0.30 25 43 250 16 50 36 30 33
777 Sitapur Hargaon 7.62 632 0 268 64 0.38 0 32 290 44 43 23 5.1 33
778 Sitapur Laharpur 7.54 479 0 207 43 0.00 0 23 220 52 22 9 4.9 34
779 Sitapur Khairabad 8.14 396 0 220 14 0.97 0 9.4 180 60 7 13 4.3 34
780 Sitapur Parsendi 7.73 498 0 281 14 0.52 0 5.0 200 16 38 19 4.3 34
781 Sitapur Kasmanda 7.97 436 0 207 14 0.39 0 26 200 40 24 5 3.8 28
782 Sonbhadra Babhani 7.85 938 0 232 78 0.97 163 91 280 44 41 80 1.2 60
783 Sonbhadra Chatara 7.86 506 0 183 43 0.25 22 17 190 28 29 34 1.1 32
784 Sonbhadra Chopan 7.41 1459 0 256 142 0.14 134 161 440 72 62 103 2.0 34
785 Sonbhadra Dudhi 7.66 1052 0 403 50 0.56 33 56 250 28 43 117 0.52 36
786 Sonbhadra Ghorwal 7.57 498 0 268 14 0.38 8.4 8.2 210 24 36 32 0.77 22
787 Sonbhadra Myorpur 8.04 398 0 171 28 1.3 0.36 27 130 24 17 44 0.33 35
788 Sonbhadra Nagawa 7.54 420 0 207 28 0.32 3.7 1.0 180 36 22 16 1.9 11
789 Sonbhadra Robertsganj 8.00 589 0 183 71 0.16 4.8 29 150 28 19 71 0.78 18
790 Sultanpur Sultanpur 8.19 417 0 244 21 1.1 8.5 5.3 170 17 31 31 2.9 28

Annexure-III
293
S.No. District Block pH
EC
µS/cm
at
25°C
CO3 HC
O3 Cl F NO3 SO4 TH Ca Mg Na K SiO2
mg/l
791 Sultanpur Akhand Nagar 8.11 471 0 305 7.1 0.82 0 1.2 190 21 34 32 4.0 28
792 Sultanpur Amethi 8.11 1712 0 464 177 0.81 64 144 330 17 70 237 6.6 28
793 Sultanpur Baldirai 8.17 391 0 220 7.1 1.1 2.5 20 190 55 14 15 4.2 23
794 Sultanpur Bhadaiyau 7.94 456 0 244 14 1.2 6.3 17 220 13 46 8 3.5 26
795 Sultanpur Bhadar 8.49 664 30 305 21 1.1 0.69 26 90 13 14 93 4.0 28
796 Sultanpur Bhetya 8.60 1055 36 470 57 0.76 8.7 39 130 8.4 26 185 7.8 31
797 Sultanpur Dhanpatganj 7.95 511 0 305 14 0.87 2.9 4.2 205 25 41 31 3.7 28
798 Sultanpur Dostpur 8.34 575 24 293 14 0.79 2.5 19 130 13 24 68 4.1 32
799 Sultanpur Dubeypur 8.40 488 30 220 14 1.0 8.5 14 105 8.4 20 52 4.1 27
800 Sultanpur Gauriganj 7.84 607 0 268 60 0.74 0 25 215 34 32 51 6.8 29
801 Sultanpur Jagdishpur 7.85 1341 0 403 142 0.74 16 104 270 38 43 176 5.6 31
802 Sultanpur Jagdishpur 7.86 686 0 329 21 1.1 0 37 180 38 22 71 4.2 30
803 Sultanpur Jagdishpur 7.76 2147 0 403 255 0.93 134 204 300 76 29 322 6.6 29
804 Sultanpur Jaisinghpur 7.81 622 0 329 18 0.87 3.3 14 210 25 36 45 4.0 28
805 Sultanpur Jamo 7.90 845 0 415 43 0.92 6.3 34 190 21 34 91 42 25

Annexure-III
294
S.No. District Block pH
EC
µS/cm
at
25°C
CO3 HC
O3 Cl F NO3 SO4 TH Ca Mg Na K SiO2
mg/l
806 Sultanpur Kadipur 7.83 565 0 305 21 0.67 5.0 16 220 42 29 34 4.6 29
807 Sultanpur Kurebhar 8.21 414 0 232 14 1.2 0.00 3.0 150 17 26 27 4.0 24
808 Sultanpur Kurwar 7.91 607 0 354 21 0.91 7.1 6.4 260 29 46 29 4.1 28
809 Sultanpur Lambhua 7.63 1114 0 354 121 0.55 16 38 280 38 46 101 10 28
810 Sultanpur Motigarpur 8.15 466 0 244 28 1.1 9.1 14 210 17 41 21 3.6 25
811 Sultanpur Musafir Khana 8.17 1987 0 793 135 1.1 71 100 580 13 132 191 5.9 29
812 Sultanpur P.P. kannaicha 7.99 509 0 317 14 0.79 5.2 2.2 240 42 34 17 3.5 30
813 Sultanpur P.P. kannaicha 7.84 551 0 268 35 0.86 8.0 18 240 38 36 24 4.3 30
814 Sultanpur P.P. kannaicha 8.04 487 0 305 14 1.1 0 2.9 230 42 31 18 4.8 26
815 Sultanpur Sangrampur 8.42 945 30 384 64 1.1 0.60 52 270 13 58 104 9.1 26
816 Sultanpur Shahgarh 7.84 646 0 293 64 0.96 0.55 12 270 25 50 28 8.6 30
817 Sultanpur Shukul Bazar 7.79 443 0 232 14 0.46 11 11 200 42 24 11 3.2 30
818 Unnao Auras 7.87 737 0 354 43 0.74 0 54 200 40 24 92 3.3 27
819 Unnao Ganj Moradabad 8.05 353 0 195 14 0.30 5.0 5.0 120 20 17 29 3.0 39
820 Unnao Bangarmau 7.63 613 0 329 14 0.37 18 16 200 56 14 51 3.5 39

Annexure-III
295
S.No. District Block pH
EC
µS/cm
at
25°C
CO3 HC
O3 Cl F NO3 SO4 TH Ca Mg Na K SiO2
mg/l
821 Unnao Fatehpur Chaurasi 7.73 395 0 207 21 0.47 0 13 170 48 12 16 2.4 40
823 Unnao Hasanganj 8.01 531 0 207 43 0.76 5.0 30 160 20 26 44 4.2 37
824 Unnao Miyanganj 7.83 441 0 256 14 0.44 0 11 170 40 17 30 4.8 36
822 Unnao Safipur 7.74 689 0 232 21 0.77 69 31 240 56 24 31 4.7 36
825 Unnao Asoha 8.14 3303 0 146 652 0.00 0 706 240 44 31 725 8.6 39
826 Unnao Nawabganj 7.83 2003 0 488 199 0.60 13 313 200 44 22 390 7.2 36
827 Unnao Bichhiya 7.93 663 0 342 28 0.61 0 7.6 240 32 38 36 6.2 36
828 Unnao Purwa 7.89 904 0 415 71 1.0 29 40 310 12 67 86 2.4 38
829 Unnao Hilauli 8.11 715 0 293 50 0.00 5.0 37 170 16 31 82 6.2 29
830 Unnao Sumerpur 8.48 1087 24 549 43 1.1 0 43 70 8.0 12 240 4.2 30
831 Unnao Bighapur 8.05 517 0 268 21 1.1 0 5.0 170 16 31 38 4.5 32
832 Unnao Sikandarpur Karan 7.62 585 0 354 14 0.47 0 5.7 210 44 24 47 4.9 36
833 Unnao Sikandarpur
Sarausi 7.79 630 0 317 14 0.99 0 53 200 36 26 66 3.7 36
834 Varanasi Arajiline 7.93 599 0 390 14 0.51 0.35 5.8 130 12 24 140 3.0 22

Annexure-III
296
S.No. District Block pH
EC
µS/cm
at
25°C
CO3 HC
O3 Cl F NO3 SO4 TH Ca Mg Na K SiO2
mg/l
835 Varanasi Baragaon 7.58 805 0 390 50 0.56 6.26 37 300 20 60 115 5.7 31
836 Varanasi Chiraigaon 7.87 687 0 403 14 0.46 0 3.7 260 12 55 105 2.5 26
837 Varanasi Cholapur 8.18 310 0 183 14 0.57 2.9 27 150 12 29 25 2.0 26
838 Varanasi Harhuwa 8.11 293 0 183 7.1 0.23 4.7 2.7 130 8.0 26 41 2.0 30
839 Varanasi Kashi Vidya Peeth 8.37 1118 18 244 135 0.80 46 84 380 8.0 86 131 5.3 26
840 Varanasi Pindra 8.43 583 18 293 14 0.36 11 14 270 8.0 60 110 3.5 31
841 Varanasi Sewapuri 7.71 470 0 317 7.1 0.56 1.8 2.2 100 20 12 51 2.5 28
For Heavy Metals:
S. No. District Block Cr Fe Mn Cu Zn As Pb U
mg/l
1 Agra Achhnera 0.000 3.100 0.035 -0.001 0.058 0.000 0.000 0.020
2 Agra Akola 0.000 0.093 0.140 0.002 0.072 0.000 0.000 0.031
3 Agra Bah 0.005 -0.028 -0.001 -0.001 0.083 0.001 0.000 0.001
4 Agra Barauli Ahir 0.000 -0.014 0.021 -0.001 1.160 0.000 0.001 0.013
5 Agra Bichpuri 0.000 9.346 0.185 0.000 1.951 0.000 0.000 0.009
6 Agra Etmadpur 0.000 0.201 0.027 -0.001 0.428 0.000 0.000 0.019

Annexure-III
297
S. No. District Block Cr Fe Mn Cu Zn As Pb U
mg/l
7 Agra Fatehabad 0.000 -0.028 -0.001 -0.001 0.014 0.001 0.000 0.028
8 Agra Fatehpur Sikri 0.000 0.540 0.060 0.001 0.211 0.000 0.000 0.006
9 Agra Jagner 0.000 0.158 0.027 0.000 0.258 0.000 0.001 0.024
10 Agra Jaitpur Kalan 0.000 0.037 0.021 0.001 2.638 0.000 0.001 0.007
11 Agra Khandauli 0.000 -0.029 0.030 -0.001 0.401 0.000 0.000 0.025
12 Agra Kheragarh 0.001 -0.028 -0.001 -0.001 -0.003 0.000 0.000 0.026
13 Agra Pinhat 0.000 -0.029 0.003 -0.001 0.163 0.000 0.000 0.010
14 Agra Saiyan 0.001 -0.028 -0.001 -0.001 0.007 0.001 0.000 0.011
15 Agra Shamsabad 0.001 0.002 0.000 0.000 0.013 0.001 0.001 0.016
16 Aligarh Akrabad 0.000 0.348 0.104 0.001 0.472 0.001 0.001 0.027
17 Aligarh Dhanipur 0.000 0.314 0.035 0.000 0.925 0.000 0.002 0.019
18 Aligarh Jawan 0.000 0.337 0.097 0.001 0.792 0.001 0.001 0.028
19 Aligarh Atrauli 0.000 0.567 0.240 0.016 0.852 0.000 0.001 0.028
20 Aligarh Gangiri 0.000 0.505 0.032 0.001 0.155 0.001 0.001 0.027
21 Aligarh Bijauli 0.000 0.283 1.243 0.001 0.051 0.001 0.001 0.043
22 Aligarh Chandaus -
0.001 0.303 0.179 0.006 1.827 0.000 0.001 0.011
23 Aligarh Tappal 0.000 0.434 0.484 0.004 0.137 0.001 0.002 0.033
24 Aligarh Khair 0.000 0.597 0.805 0.019 1.657 0.001 0.001 0.126
25 Aligarh Lodha 0.001 0.034 0.015 0.005 2.873 0.001 0.007 0.027
26 Aligarh Dhanipur 0.000 1.340 0.456 0.004 0.417 0.001 0.001 0.016
27 Aligarh Gonda 0.000 0.286 0.928 0.001 16.44
2 0.003 0.002 0.032
28 Aligarh Gonda 0.000 3.205 1.362 0.001 0.031 0.002 0.000 0.012

Annexure-III
298
S. No. District Block Cr Fe Mn Cu Zn As Pb U
mg/l
29 Aligarh Iglas 0.000 0.407 1.161 0.010 5.769 0.001 0.001 0.014
30 Ambedkar Nagar
Akberpur 0.000 2.358 0.030 -0.002 0.952 0.001 0.000 0.001
31 Ambedkar Nagar
Baskhari 0.000 0.051 0.011 -0.001 0.694 0.000 0.000 0.001
32 Ambedkar Nagar
Bhiti 0.000 2.643 0.102 -0.002 0.922 0.000 0.000 0.003
33 Ambedkar Nagar
Bhiyaon 0.001 0.150 0.002 0.003 0.188 0.000 0.000 0.010
34 Ambedkar Nagar
Jahangirganj 0.000 0.787 0.041 -0.002 0.433 0.000 0.001 0.006
35 Ambedkar Nagar
Jalalpur 0.000 0.809 0.287 -0.002 1.376 0.000 0.000 0.004
36 Ambedkar Nagar
Katehari 0.000 1.662 0.050 -0.002 0.677 0.001 0.008 0.002
37 Ambedkar Nagar
Ramnagar 0.000 0.095 0.032 -0.002 1.238 0.000 0.002 0.004
38 Ambedkar Nagar
Tanda 0.000 2.279 0.056 -0.002 0.045 0.001 0.002 0.002
39 Auraiya Bidhuna 0.000 0.887 0.052 0.006 0.360 0.000 0.002 0.012
40 Auraiya Bidhuna 0.002 0.280 0.004 0.001 0.097 0.000 0.002 0.004
41 Auraiya Bidhuna -
0.001 1.112 0.033 0.000 0.136 0.001 0.000 0.021
42 Auraiya Bidhuna 0.000 2.866 0.064 0.000 0.180 0.000 0.000 0.024
43 Auraiya Achhalda -
0.001 0.128 0.017 -0.001 0.068 0.001 0.000 0.016
44 Auraiya Airwa Katra -
0.001 0.393 0.063 -0.001 0.524 0.000 0.000 0.010

Annexure-III
299
S. No. District Block Cr Fe Mn Cu Zn As Pb U
mg/l
45 Auraiya Ajitmal 0.000 0.195 0.006 0.002 0.275 0.000 0.000 0.015
46 Auraiya Auraiya 0.004 1.630 0.040 0.001 2.251 0.000 0.002 0.008
47 Auraiya Bhagya Nagar -
0.001 0.011 0.015 0.001 -0.002 0.001 0.001 0.017
48 Auraiya Bidhuna -
0.001 0.187 0.015 0.000 0.450 0.000 0.001 0.047
49 Auraiya Sahar 0.000 0.294 0.028 0.000 1.968 0.001 0.002 0.031
50 Azamgarh Ahiraula 0.000 1.030 0.021 -0.003 1.407 0.000 0.002 0.004
51 Azamgarh Atraulia 0.000 1.176 0.029 -0.003 0.973 0.000 0.003 0.003
52 Azamgarh Azmatgarh 0.000 0.242 0.032 -0.002 0.443 0.000 0.004 0.005
53 Azamgarh Bilariyaganj 0.000 0.050 0.158 -0.003 1.232 0.000 0.002 0.008
54 Azamgarh Harraiya 0.000 0.709 0.018 0.000 0.277 0.000 0.002 0.012
55 Azamgarh Jahanaganj 0.000 0.139 0.022 -0.002 0.518 0.000 0.002 0.019
56 Azamgarh Koyalsa 0.000 0.194 0.026 -0.003 0.014 0.000 0.001 0.002
57 Azamgarh Lalganj 0.000 0.290 0.011 -0.002 0.095 0.000 0.003 0.014
58 Azamgarh Maharajganj 0.000 0.026 0.191 -0.003 0.232 0.017 0.001 0.000
59 Azamgarh Mehnagar 0.000 0.480 0.008 -0.001 0.231 0.000 0.004 0.010
60 Azamgarh Mirzapur H.Q. 0.000 0.091 0.029 -0.003 1.373 0.000 0.001 0.009
61 Azamgarh Mohammadpur
0.000 0.158 0.008 -0.003 0.275 0.000 0.001 0.013
62 Azamgarh Palhana 0.000 0.019 0.002 0.001 0.051 0.026 0.001 0.055
63 Azamgarh Palhani 0.000 0.971 0.039 -0.002 2.482 0.000 0.004 0.012
64 Azamgarh Pawai 0.000 0.091 0.045 0.004 0.126 0.000 0.001 0.008
65 Azamgarh Phoolpur 0.000 0.030 0.016 -0.002 0.177 0.000 0.001 0.007

Annexure-III
300
S. No. District Block Cr Fe Mn Cu Zn As Pb U
mg/l
66 Azamgarh Rani Ki Sarai 0.001 0.378 0.012 -0.003 0.045 0.000 0.001 0.008
67 Azamgarh Sathiaon 0.000 0.197 0.011 -0.003 0.203 0.000 0.001 0.007
68 Azamgarh Tahabarpur 0.001 0.277 0.011 0.001 0.158 0.001 0.004 0.005
69 Azamgarh Tarwa 0.000 0.072 0.004 -0.003 0.256 0.001 0.001 0.010
70 Azamgarh Thekma 0.000 0.707 0.071 -0.003 0.748 0.000 0.001 0.008
71 Baghpat Chaprauli 0.000 0.263 0.066 0.000 0.536 0.000 0.000 0.034
72 Baghpat Baghpat 0.000 0.148 0.031 0.001 0.175 0.001 0.001 0.013
73 Baghpat Binauli 0.000 0.433 0.029 0.000 0.240 0.000 0.001 0.015
74 Baghpat Baraut 0.000 0.119 0.004 0.000 0.156 0.001 0.001 0.009
75 Baghpat Pilana 0.001 0.269 0.123 0.002 1.561 0.000 0.001 0.023
76 Baghpat Khekra 0.000 -0.001 0.008 0.002 0.016 0.001 0.000 0.025
77 Bahraich Jarwal H.Q. 0.000 7.064 0.191 -0.001 1.458 0.002 0.001 0.000
78 Bahraich Kaisarganj H.Q.
0.000 4.629 0.249 0.000 2.311 0.008 0.001 0.000
79 Bahraich Fakarpur H.Q. 0.000 12.26
0 0.178 -0.001 0.359 0.003 0.000 0.000
80 Bahraich Fejawapur H.Q.
0.000 10.71
5 0.122 -0.001 0.866 0.021 0.001 0.000
81 Bahraich Mahasi H.Q. 0.000 7.930 0.453 -0.001 0.952 0.046 0.001 0.000
82 Bahraich Shivpur H.Q. 0.000 3.266 0.126 -0.001 0.022 0.034 0.001 0.000
83 Bahraich Balha H.Q. 0.000 8.235 0.095 -0.001 0.033 0.004 0.001 0.000
84 Bahraich Nawabganj 0.000 1.225 0.124 -0.001 0.042 0.008 0.001 0.002
85 Bahraich Mihipurwa 0.000 2.840 0.165 -0.001 0.949 0.008 0.002 0.000
86 Bahraich Risia H.Q. 0.000 1.265 0.060 -0.001 0.041 0.001 0.001 0.000

Annexure-III
301
S. No. District Block Cr Fe Mn Cu Zn As Pb U
mg/l
87 Bahraich Huzurpur 0.000 2.635 0.039 -0.001 0.061 0.110 0.001 0.000
88 Bahraich Bisheshwarganj H.Q.
0.000 1.449 0.035 -0.001 0.589 0.002 0.001 0.001
89 Bahraich Payagpur H.Q. 0.000 2.316 0.119 -0.001 0.430 0.002 0.002 0.001
90 Bahraich Chittaura H.Q. 0.000 2.501 0.050 -0.001 0.472 0.003 0.001 0.000
91 Ballia Bairya 0.000 2.038 0.264 -0.003 0.393 0.040 0.001 0.000
92 Ballia Bansdeeh 0.000 0.753 0.115 0.000 0.902 0.000 0.001 0.002
93 Ballia Belhari 0.000 4.291 0.144 0.000 2.176 0.012 0.006 0.000
94 Ballia Beruwarbari 0.001 1.900 0.047 0.001 0.374 0.001 0.002 0.025
95 Ballia Chilkahar 0.000 0.163 0.029 -0.003 1.426 0.000 0.001 0.005
96 Ballia dubahar 0.000 1.544 0.027 -0.003 0.083 0.041 0.001 0.000
97 Ballia Garwar 0.000 1.986 0.098 -0.003 0.059 0.001 0.001 0.003
98 Ballia Hanumanganj 0.000 0.258 0.028 -0.003 0.068 0.000 0.002 0.004
99 Ballia Maniyar 0.000 4.236 0.201 -0.003 0.253 0.001 0.001 0.001
100 Ballia Murali Chhapara
0.000 -0.012 -0.001 -0.004 -0.007 0.001 0.000 0.014
101 Ballia Nawa Nagar 0.000 1.602 0.082 -0.003 0.109 0.002 0.001 0.000
102 Ballia Negara 0.000 2.220 0.192 0.000 0.070 0.002 0.001 0.000
103 Ballia Pandah 0.000 3.617 0.064 -0.003 0.263 0.002 0.002 0.001
104 Ballia Rasara 0.000 0.473 0.014 -0.002 0.339 0.000 0.005 0.010
105 Ballia Reoti 0.000 1.333 0.080 -0.003 1.026 0.041 0.001 0.000
106 Ballia Siyar 0.000 0.628 0.104 -0.004 0.266 0.003 0.001 0.000
107 Ballia Sohaon 0.000 3.512 0.124 0.007 0.317 0.027 0.001 0.000

Annexure-III
302
S. No. District Block Cr Fe Mn Cu Zn As Pb U
mg/l
108 Balrampur Harraiya Satgharwa H.Q.
0.000 0.156 0.193 -0.001 0.374 0.000 0.001 0.011
109 Balrampur Tulsipur 0.000 3.392 0.295 0.000 0.168 0.008 0.001 0.002
110 Balrampur Balrampur H.Q.
0.000 0.567 0.197 -0.001 0.297 0.012 0.001 0.000
111 Balrampur Utraula 0.000 1.099 0.240 -0.001 1.419 0.001 0.001 0.002
112 Balrampur Gaidas Buzurg H.Q.
0.000 2.006 0.161 -0.001 1.709 0.010 0.003 0.002
113 Balrampur Rehra Bazar H.Q.
0.000 4.027 0.381 -0.001 0.058 0.016 0.001 0.001
114 Balrampur Sriduttaganj H.Q.
0.000 2.082 0.125 0.000 0.438 0.005 0.000 0.000
115 Balrampur Pachperwa H.Q.
0.000 0.665 0.104 -0.001 1.014 0.000 0.001 0.009
116 Balrampur Gainsari H.Q. 0.000 3.306 0.422 -0.001 0.044 0.014 0.001 0.000
117 Banda Baberu 0.000 -0.005 0.049 0.000 0.102 0.002 0.001 0.012
118 Banda Barokhar 0.001 1.470 0.011 0.000 0.044 0.000 0.000 0.014
119 Banda Bisanda 0.000 0.600 0.123 0.003 0.836 0.000 0.001 0.011
120 Banda Jaspura 0.000 -0.010 0.000 0.004 0.043 0.001 0.001 0.005
121 Banda Kamasin 0.003 0.385 0.006 0.001 0.226 0.000 0.000 0.005
122 Banda Mahua 0.003 0.332 0.065 0.000 0.017 0.000 0.001 0.005
123 Banda Naraini 0.000 1.313 0.316 0.000 0.034 0.000 0.002 0.005
124 Banda Tindwari 0.000 0.427 0.060 0.006 2.834 0.000 0.001 0.004
125 Barabanki Trivediganj 0.000 0.094 0.042 -0.001 0.312 0.000 0.000 0.009
126 Barabanki Banki 0.000 0.090 0.131 -0.008 1.384 0.000 0.001 0.001

Annexure-III
303
S. No. District Block Cr Fe Mn Cu Zn As Pb U
mg/l
127 Barabanki Dewa 0.000 2.292 0.053 -0.009 0.127 0.002 0.000 0.004
128 Barabanki Fatehpur 0.000 4.257 0.158 -0.009 0.707 0.002 0.001 0.001
129 Barabanki Ramnagar 0.000 1.761 0.088 -0.009 0.016 0.005 0.000 0.000
130 Barabanki Suratganj 0.000 5.528 0.049 -0.008 0.019 0.144 0.001 0.000
131 Barabanki Sirauli Gauspur
0.000 0.476 0.042 0.008 0.222 0.001 0.004 0.000
132 Barabanki Daraiyabad 0.000 0.419 0.028 -0.008 0.725 0.001 0.001 0.005
133 Barabanki Puredalai 0.000 -0.036 -0.001 -0.009 -0.008 0.000 -
0.001 0.000
134 Barabanki Banikodar 0.000 2.799 0.118 -0.008 0.183 0.004 0.001 0.001
135 Barabanki Masauli 0.000 0.130 0.138 -0.008 0.001 0.001 0.001 0.002
136 Barabanki Harak 0.000 1.603 0.059 -0.008 0.528 0.003 0.001 0.005
137 Barabanki Siddharthnagar
0.000 0.430 0.044 -0.008 1.267 0.000 0.001 0.011
138 Barabanki Haidergarh 0.000 0.155 0.086 -0.008 0.926 0.000 0.001 0.010
139 Barabanki Nindura 0.000 0.617 0.095 -0.008 0.335 0.001 0.001 0.010
140 Barabanki Mawai 0.000 3.548 0.026 -0.008 1.292 0.000 0.001 0.000
141 Barabanki Rudauli 0.000 0.761 0.087 -0.006 0.008 0.004 0.002 0.001
142 Bareilly ALAMPUR JAFARABAD
0.000 1.566 0.100 0.000 0.006 0.000 0.001 0.005
143 Bareilly BAHERI 0.000 0.312 0.034 0.000 0.063 0.001 0.000 0.002
144 Bareilly BHADPURA 0.001 2.159 0.057 0.000 0.023 0.000 0.002 0.014
145 Bareilly BHOJIPURA 0.000 0.767 0.098 -0.001 0.009 0.005 0.001 0.000
146 Bareilly BHUTAH 0.001 4.478 0.202 0.000 0.021 0.002 0.001 0.000

Annexure-III
304
S. No. District Block Cr Fe Mn Cu Zn As Pb U
mg/l
147 Bareilly BITHRI CHAINPUR
0.000 0.802 0.245 0.000 0.145 0.002 0.001 0.016
148 Bareilly FARIDPUR 0.001 4.945 0.147 -0.001 0.030 0.007 0.001 0.000
149 Bareilly FATEHGANJ WEST
0.000 1.302 0.090 -0.001 0.151 0.006 0.001 0.000
150 Bareilly KIYARA 0.001 0.199 0.056 0.000 1.141 0.001 0.001 0.002
151 Bareilly MAJHGAWAN 0.000 2.280 0.180 -0.001 0.012 0.001 0.000 0.002
152 Bareilly MEERGANJ 0.000 6.429 0.334 0.000 0.160 0.006 0.001 0.000
153 Bareilly NAWABGANJ 0.000 0.660 0.066 0.000 0.032 0.003 0.001 0.006
154 Bareilly RAM NAGAR 0.000 0.049 0.002 0.000 0.160 0.003 0.001 0.000
155 Bareilly RICHHA 0.000 0.802 0.076 -0.001 0.011 0.001 0.001 0.004
156 Bareilly SHERGARH 0.000 0.215 0.098 0.001 0.978 0.014 0.001 0.002
157 Basti Rudauli H.Q. 0.000 0.752 0.109 -0.002 4.158 0.001 0.001 0.016
158 Basti Saunghat H.Q. 0.000 2.260 0.174 -0.002 0.709 0.002 0.003 0.002
159 Basti Basti Sadar H.Q.
0.000 0.154 0.011 0.000 0.549 0.000 0.001 0.000
160 Basti Saltauwa Gopalpur H.Q.
0.000 9.373 0.063 -0.002 2.078 0.000 0.001 0.005
161 Basti Ramnagar H.Q. 0.000 1.611 0.181 -0.002 2.739 0.001 0.000 0.003
162 Basti Gaur H.Q. 0.000 0.960 0.140 -0.001 5.524 0.001 0.001 0.002
163 Basti Bahadurpur H.Q.
0.000 2.793 0.056 -0.002 0.856 0.000 0.001 0.002
164 Basti Dubauliya H.Q. 0.000 1.689 0.068 -0.002 1.765 0.000 0.001 0.003
165 Basti Kudraha H.Q. 0.000 3.057 0.393 -0.002 0.636 0.000 0.000 0.001
166 Basti Bankati H.Q. 0.000 1.046 0.070 -0.002 0.214 0.004 0.001 0.000

Annexure-III
305
S. No. District Block Cr Fe Mn Cu Zn As Pb U
mg/l
167 Basti Kaptanganj H.Q.
0.000 0.464 0.307 -0.001 0.363 0.000 0.000 0.020
168 Basti Harraiya Satgharwa H.Q.
0.000 0.523 0.022 -0.002 0.335 0.000 0.001 0.001
169 Basti Vikramjot H.Q. 0.000 0.687 0.038 -0.002 1.706 0.002 0.001 0.002
170 Basti Parasurampur H.Q.
0.000 6.605 0.122 -0.002 0.387 0.011 0.001 0.000
171 Bijnor Kiratpur 0.000 0.846 0.299 0.000 0.039 0.001 0.001 0.002
172 Bijnor Kiratpur 0.000 2.429 0.285 0.000 0.973 0.005 0.001 0.009
173 Bijnor Kiratpur 0.000 1.282 0.143 -0.001 0.279 0.009 0.007 0.003
174 Bijnor Kiratpur 0.000 1.392 0.036 0.000 0.008 0.003 0.002 0.005
175 Bijnor Mohammadpur Deomal
0.000 0.073 0.063 0.000 0.241 0.004 0.002 0.026
176 Bijnor Mohammadpur Deomal
0.000 0.028 0.051 -0.001 0.071 0.005 0.001 0.013
177 Bijnor Mohammadpur Deomal
0.000 0.432 0.166 -0.001 0.135 0.011 0.002 0.007
178 Bijnor Mohammadpur Deomal
0.000 0.519 0.041 0.000 0.277 0.001 0.001 0.001
179 Bijnor BUDHANPUR (SEOHARA)
0.000 1.332 0.069 -0.001 0.228 0.002 0.001 0.000
180 Bijnor ALHEPUR 0.000 0.261 0.113 -0.002 0.113 0.002 0.000 0.005
181 Bijnor AFZALGARH 0.000 1.487 0.368 -0.002 0.209 0.040 0.001 0.000
182 Bijnor AKU(NEHTAUR)
0.000 0.577 0.213 -0.003 0.047 0.008 0.000 0.002
183 Bijnor KOTWALI 0.000 0.972 0.095 -0.003 0.029 0.007 0.000 0.005

Annexure-III
306
S. No. District Block Cr Fe Mn Cu Zn As Pb U
mg/l
184 Bijnor NAJIBABAD 0.000 0.634 0.097 -0.002 0.678 0.000 -
0.001 0.010
185 Bijnor KIRTAPUR 0.000 7.044 0.160 -0.001 0.030 0.003 0.000 0.038
186 Bijnor MOHAMMADPUR DEOMAL
0.000 0.834 0.062 -0.002 0.550 0.001 0.001 0.239
187 Bijnor KHARI JHALU 0.000 0.666 0.180 -0.002 0.228 0.006 0.001 0.002
188 Bijnor NOORPUR 0.000 2.314 0.192 -0.001 0.772 0.021 0.002 0.006
189 Bijnor JALEELPUR 0.000 0.272 0.016 -0.002 0.094 0.000 0.001 0.005
190 Budaun RAJPURA 0.000 2.021 0.035 0.001 0.248 0.001 0.003 0.013
191 Budaun GUNNAUR 0.000 0.205 0.168 0.002 0.394 0.000 0.003 0.010
192 Budaun JUNAWAHI 0.000 1.730 0.097 0.000 1.285 0.001 0.002 0.013
193 Budaun DAHIGAWAAN 0.000 6.791 0.248 0.000 0.388 0.001 0.001 0.007
194 Budaun SAHSWAN 0.000 0.074 0.012 0.002 0.143 0.002 0.001 0.007
195 Budaun BADAUN(HQ) 0.000 0.586 0.342 0.000 3.540 0.001 0.002 0.009
196 Budaun JAGAT 0.000 0.130 0.072 0.000 0.223 0.003 0.001 0.002
197 Budaun DATAGANJ 0.000 1.501 0.147 0.000 0.015 0.000 0.003 0.020
198 Budaun SAMRER 0.000 0.347 0.024 0.000 0.018 0.002 0.001 0.003
199 Budaun MIAON 0.000 0.819 0.037 0.000 0.636 0.001 0.002 0.013
200 Budaun USAWAN 0.000 0.127 0.248 0.000 0.022 0.001 0.001 0.008
201 Budaun QUADAR CHOWK
0.000 0.074 0.116 0.000 0.032 0.002 0.001 0.001
202 Budaun UJHANI 0.000 0.247 0.317 0.003 0.176 0.000 0.001 0.015
203 Budaun AMBIAPUR 0.000 0.150 0.239 0.000 0.074 0.002 0.002 0.001
204 Budaun ISLAMNAGAR 0.000 0.472 0.097 -0.001 0.115 0.005 0.001 0.001

Annexure-III
307
S. No. District Block Cr Fe Mn Cu Zn As Pb U
mg/l
205 Budaun ASAFPUR 0.000 0.139 0.102 0.002 0.210 0.001 0.001 0.026
206 Budaun BISOULI 0.000 0.079 0.278 0.003 0.315 0.001 0.002 0.034
207 Budaun WAJIRGANJ 0.000 3.552 0.296 0.003 0.902 0.003 0.002 0.014
208 Budaun SALARPUR 0.000 0.303 0.209 0.002 0.676 0.011 0.001 0.049
209 Budaun Miaon 0.000 0.132 0.169 -0.001 0.474 0.004 0.002 0.007
210 Budaun Miaon 0.000 2.341 0.286 -0.001 0.067 0.001 0.001 0.006
211 Budaun Miaon 0.000 0.976 0.201 0.013 0.463 0.005 0.003 0.003
212 Budaun Miaon 0.000 0.315 0.185 0.000 0.246 0.002 0.001 0.016
213 Budaun Bisouli 0.000 0.312 0.128 -0.001 0.159 0.005 0.001 0.006
214 Budaun Bisouli 0.000 0.096 0.007 0.000 0.331 0.003 0.001 0.001
215 Budaun Bisouli 0.000 14.65
9 0.271 -0.001 0.032 0.004 0.001 0.004
216 Budaun Bisouli 0.000 1.119 0.402 -0.001 2.435 0.001 0.001 0.026
217 Budaun Wajirganj 0.000 0.206 0.239 0.000 0.854 0.004 0.001 0.004
218 Budaun Wajirganj 0.000 1.123 0.239 -0.001 0.181 0.008 0.001 0.009
219 Budaun Wajirganj 0.000 9.365 0.264 -0.001 0.034 0.000 0.002 0.001
220 Budaun Wajirganj 0.000 5.257 0.234 -0.001 0.003 0.004 0.001 0.004
221 Bulandshahr Danpur -
0.001 0.302 0.044 0.000 0.168 0.000 0.001 0.045
222 Bulandshahr Debai -
0.001 3.556 0.102 0.000 0.032 0.000 0.001 0.013
223 Bulandshahr Anupshahr -
0.001 0.150 0.004 0.000 0.063 0.001 0.002 0.003
224 Bulandshahr Jahangirabad -
0.001 0.269 0.229 0.009 0.140 0.000 0.001 0.098

Annexure-III
308
S. No. District Block Cr Fe Mn Cu Zn As Pb U
mg/l
225 Bulandshahr Unchagaon 0.000 0.110 0.004 0.002 1.345 0.000 0.001 0.003
226 Bulandshahr Siyana -
0.001 0.529 0.210 0.004 2.704 0.001 0.001 0.008
227 Bulandshahr Bhagwan Bahadur Nagar
-0.001
6.961 0.406 0.000 2.308 0.001 0.002 0.018
228 Bulandshahr Agauta 0.000 0.173 0.278 0.000 2.860 0.001 0.001 0.008
229 Bulandshahr Gulaothi 0.000 1.053 0.031 0.002 0.654 0.000 0.001 0.008
230 Bulandshahr Sikandrabad 0.000 0.846 0.252 0.009 0.080 0.001 0.001 0.022
231 Bulandshahr Khurja 0.000 0.458 0.214 0.001 0.157 0.000 0.001 0.023
232 Bulandshahr Pahasu 0.000 0.438 0.008 0.002 0.068 0.001 0.001 0.005
233 Bulandshahr Shikarpur -
0.001 0.606 0.097 0.000 1.851 0.001 0.002 0.039
234 Bulandshahr Shikarpur 0.000 0.068 0.272 0.008 0.105 0.001 0.002 0.030
235 Bulandshahr Lakhaoti 0.000 0.554 0.092 0.000 0.259 0.001 0.001 0.013
236 Bulandshahr Bulanshahr 0.000 0.032 0.005 0.001 0.207 0.001 0.002 0.002
237 Bulandshahr Arnia 0.000 0.219 0.080 0.001 0.281 0.001 0.002 0.006
238 Chandauli Barahani 0.000 0.712 0.271 -0.001 0.094 0.000 0.001 0.006
239 Chandauli Chahania -
0.001 0.308 0.005 0.001 2.322 0.000 0.002 0.009
240 Chandauli Chakiya 0.000 0.170 0.016 0.002 0.690 0.000 0.001 0.002
241 Chandauli Chandauli -
0.001 0.027 0.003 0.003 0.224 0.001 0.001 0.003
242 Chandauli Dhanapur -
0.001 0.682 0.011 -0.001 0.032 0.001 0.002 0.017

Annexure-III
309
S. No. District Block Cr Fe Mn Cu Zn As Pb U
mg/l
243 Chandauli Naugarh -
0.001 12.01
8 0.218 -0.001 0.135 0.000 0.001 0.000
244 Chandauli Niyamatabad -
0.001 2.714 0.048 -0.002 1.259 0.000 0.000 0.036
245 Chandauli Sakaldiha 0.000 -0.005 0.004 0.043 0.334 0.000 0.003 0.006
246 Chandauli Shahabganj -
0.001 0.076 0.006 0.001 1.252 0.000 0.001 0.001
247 Chitrakoot Karvi 0.001 0.025 0.007 0.006 0.111 0.000 0.001 0.009
248 Chitrakoot Manikpur 0.000 0.721 0.201 0.000 5.174 0.000 0.001 0.001
249 Chitrakoot Mau 0.000 0.211 0.008 0.006 0.473 0.000 0.002 0.004
250 Chitrakoot Pahari 0.000 0.341 0.004 0.000 0.088 0.000 0.001 0.012
251 Chitrakoot Ram Nagar 0.000 1.728 0.036 0.001 0.140 0.000 0.005 0.004
252 Deoria Bhaluwani -
0.001 0.465 0.054 -0.001 0.415 0.001 0.001 0.002
253 Deoria Bhaluwani -
0.001 1.975 0.105 -0.001 0.014 0.003 0.001 0.005
254 Deoria Bhaluwani -
0.001 0.157 0.037 0.011 0.823 0.000 0.000 0.040
255 Deoria Bhaluwani -
0.001 20.37
1 0.508 -0.001 0.640 0.018 0.000 0.000
256 Deoria Bhaluwani -
0.001 0.018 0.016 -0.001 0.016 0.002 0.000 0.004
257 Deoria Baitalpur 0.000 0.153 0.107 -0.001 0.093 0.005 0.001 0.005
258 Deoria Bankata -
0.001 14.17
1 0.561 -0.001 0.605 0.001 0.000 0.000
259 Deoria Barhaj -
0.001 -0.060 -0.002 -0.002 -0.009 0.000
-0.001
0.001

Annexure-III
310
S. No. District Block Cr Fe Mn Cu Zn As Pb U
mg/l
260 Deoria Bhagalpur -
0.001 2.221 0.039 -0.001 0.404 0.000 0.001 0.000
261 Deoria Bhaluwani -
0.001 5.757 0.140 -0.001 0.575 0.000 0.001 0.011
262 Deoria Bhatani -
0.001 2.256 0.082 -0.001 0.545 0.000 0.000 0.002
263 Deoria Bhatparani -
0.001 0.310 0.024 -0.001 1.164 0.000 0.001 0.005
264 Deoria Deoria Sadar -
0.001 -0.022 0.008 -0.001 0.093 0.001 0.001 0.000
265 Deoria Desahi Deoria -
0.001 1.713 0.077 -0.001 0.246 0.001 0.001 0.001
266 Deoria Gauri Bazar -
0.001 0.796 0.011 -0.001 0.011 0.004 0.001 0.000
267 Deoria Lar -
0.001 0.024 0.015 -0.001 0.106 0.002 0.000 0.001
268 Deoria Pather Dewa -
0.001 -0.025 0.002 -0.001 0.222 0.001 0.001 0.001
269 Deoria Rampur Karkhana
-0.001
0.923 0.048 0.000 0.401 0.000 0.001 0.004
270 Deoria Rudrapur -
0.001 5.776 0.209 -0.001 0.029 0.001 0.000 0.003
271 Deoria Salempur -
0.001 1.593 0.054 -0.001 0.006 0.000 0.001 0.001
272 Deoria Tarkulwa -
0.001 1.995 0.022 -0.001 0.006 0.001 0.001 0.003
273 Etah Aliganj 0.000 -0.029 0.090 -0.001 0.020 0.000 0.000 0.014
274 Etah Awagarh 0.000 0.001 0.012 0.000 0.248 0.001 0.002 0.016
275 Etah Jaithara 0.000 0.108 0.025 0.000 0.046 0.001 0.002 0.006

Annexure-III
311
S. No. District Block Cr Fe Mn Cu Zn As Pb U
mg/l
276 Etah Jalesar 0.001 0.181 0.039 -0.001 16.74
4 0.000 0.003 0.001
277 Etah Marhara 0.000 0.949 0.049 -0.001 0.103 0.001 0.000 0.021
278 Etah Nidholi Kalan 0.000 -0.029 0.059 -0.001 0.399 0.000 0.000 0.005
279 Etah Sakeet 0.000 -0.029 0.235 -0.001 0.027 0.001 0.000 0.004
280 Etah Sheetalpur 0.000 -0.029 0.627 -0.001 0.126 0.000 0.000 0.048
281 Etawah Barhpura -
0.001 5.071 0.237 0.003 1.310 0.000 0.000 0.012
282 Etawah Basrehar 0.000 0.088 0.036 0.001 0.206 0.000 0.002 0.021
283 Etawah Bharthana -
0.001 0.078 0.027 -0.001 0.109 0.001 0.001 0.017
284 Etawah Chakkar Nagar 0.000 0.017 0.028 0.008 1.951 0.000 0.001 0.010
285 Etawah Jaswant Nagar -
0.001 0.087 0.049 0.005 1.391 0.000 0.001 0.010
286 Etawah Mahewa 0.003 0.647 0.016 0.000 0.658 0.000 0.001 0.012
287 Etawah Saifai -
0.001 0.306 0.039 0.000 0.173 0.001 0.001 0.028
288 Etawah Takha -
0.001 0.011 0.087 0.003 0.290 0.001 0.001 0.018
289 Faizabad Amaniganj 0.000 0.388 0.100 -0.002 0.084 0.000 0.001 0.008
290 Faizabad Bikapur 0.000 0.078 0.124 0.006 0.194 0.000 0.000 0.012
291 Faizabad Haringtonganj 0.000 0.293 0.262 -0.002 0.202 0.007 0.002 0.000
292 Faizabad Masodha 0.000 0.737 0.122 -0.002 0.222 0.004 0.000 0.000
293 Faizabad Maya Bazar 0.000 1.141 0.115 -0.002 0.376 0.005 0.000 0.001
294 Faizabad Milkipur 0.000 0.333 0.067 -0.001 0.179 0.000 0.001 0.008

Annexure-III
312
S. No. District Block Cr Fe Mn Cu Zn As Pb U
mg/l
295 Faizabad Pura Bazar 0.000 0.290 0.033 -0.002 0.157 0.001 0.000 0.005
296 Faizabad Sohawal 0.000 0.193 0.026 -0.002 0.480 0.002 0.000 0.005
297 Faizabad Tarun 0.000 0.261 0.032 0.000 0.190 0.001 0.000 0.003
298 Faizabad Mawai 0.000 4.684 0.040 -0.002 1.161 0.000 0.001 0.001
299 Faizabad Rudauli 0.000 0.792 0.098 -0.002 0.239 0.005 0.000 0.002
300 Fatehpur Airayan 0.000 0.856 0.159 0.001 5.946 0.000 0.001 0.019
301 Fatehpur Amauli 0.000 0.141 0.053 0.001 2.665 0.000 0.002 0.008
302 Fatehpur Asother 0.000 3.842 0.036 0.000 2.013 0.000 0.001 0.005
303 Fatehpur Bahua 0.000 0.979 0.010 0.000 0.340 0.000 0.001 0.008
304 Fatehpur Bhitaura 0.000 0.170 0.034 0.002 0.579 0.000 0.001 0.016
305 Fatehpur Demai 0.000 0.192 0.024 0.001 0.845 0.000 0.001 0.012
306 Fatehpur Dhata 0.000 3.157 0.153 0.000 0.007 0.001 0.001 0.005
307 Fatehpur Haswa 0.000 0.778 0.052 0.000 0.403 0.000 0.002 0.012
308 Fatehpur Hathgaon 0.003 0.495 0.015 0.002 0.350 0.000 0.001 0.017
309 Fatehpur Khuajuha 0.000 0.046 0.028 0.000 0.048 0.001 0.000 0.110
310 Fatehpur Malwan 0.000 0.078 0.030 0.001 0.325 0.001 0.002 0.020
311 Fatehpur Teliyani 0.000 0.458 0.009 0.007 0.086 0.001 0.001 0.007
312 Fatehpur Vijayeepur 0.000 0.143 0.006 0.016 1.032 0.000 0.001 0.006
313 Ferrukabad Barhpur 0.000 -0.035 0.013 -0.001 0.059 0.000 -
0.001 0.012
314 Ferrukabad Kamalganj 0.000 -0.035 0.116 -0.001 0.180 0.000 -
0.001 0.005
315 Ferrukabad Kayamganj 0.000 -0.035 0.024 -0.001 0.064 0.002 0.000 0.008

Annexure-III
313
S. No. District Block Cr Fe Mn Cu Zn As Pb U
mg/l
316 Ferrukabad Mohammadabad
0.000 -0.035 -0.001 -0.001 -0.003 0.000 -
0.001 0.042
317 Ferrukabad Nawabganj 0.000 -0.035 0.036 -0.001 -0.001 0.000 -
0.001 0.030
318 Ferrukabad Rajepur 0.000 0.004 0.016 -0.001 0.088 0.002 0.000 0.045
319 Ferrukabad Shamsabad 0.000 -0.035 0.295 -0.001 0.063 0.000 -
0.001 0.003
320 Ferrukabad Rajepur 0.000 -0.035 1.857 -0.001 -0.006 0.003 -
0.001 0.001
321 Ferrukabad Rajepur 0.000 0.030 0.002 -0.001 0.004 0.001 0.001 0.041
322 Ferrukabad Rajepur 0.000 -0.035 0.000 -0.001 -0.007 0.003 -
0.001 0.049
323 Firozabad Aron 0.000 -0.029 -0.001 -0.001 -0.005 0.001 0.000 0.016
324 Firozabad Eka 0.000 0.020 0.007 0.004 0.151 0.000 0.000 0.032
325 Firozabad Firozabad 0.000 0.190 0.030 0.001 0.502 0.000 0.002 0.001
326 Firozabad Jasrana 0.000 0.113 0.025 0.001 0.392 0.000 0.000 0.022
327 Firozabad Khairagarh/ Hathwant
0.006 4.130 0.211 0.006 1.771 0.000 0.007 0.024
328 Firozabad Madanpur 0.000 -0.028 0.022 -0.001 0.027 0.001 0.000 0.031
329 Firozabad Narkhi 0.000 0.242 0.066 0.006 0.841 0.000 0.000 0.049
330 Firozabad Shikohabad 0.000 0.151 0.077 0.000 1.104 0.000 0.001 0.008
331 Firozabad Tundla 0.003 0.070 0.000 -0.001 0.152 0.002 0.000 0.054
332 Gautam Buddha Nagar
Dadri -
0.001 0.058 0.108 0.001 0.215 0.001 0.001 0.031
333 Gautam Buddha Nagar
Bisrakh -
0.001 0.024 0.002 0.000 0.316 0.000 0.001 0.013

Annexure-III
314
S. No. District Block Cr Fe Mn Cu Zn As Pb U
mg/l
334 Gautam Buddha Nagar
Jewar 0.000 0.375 0.004 0.000 0.205 0.000 0.001 0.032
335 Gautam Buddha Nagar
Jewar 0.000 0.315 0.009 -0.001 0.338 0.001 0.001 0.026
336 Gautam Buddha Nagar
Dankaur -
0.001 0.072 0.031 0.029 0.138 0.001 0.001 0.082
337 Gautam Buddha Nagar
Dankaur 0.000 0.000 0.000 0.000
338 Gautam Buddha Nagar
Dankaur -
0.001 0.101 0.055 0.000 0.102 0.001 0.001 0.035
339 Ghaziabad Loni 0.001 1.099 0.094 0.001 0.811 0.000 0.001 0.011
340 Ghaziabad Razapur 0.000 0.012 0.105 0.008 0.337 0.000 0.001 0.033
341 Ghaziabad Muradnagar 0.001 0.384 0.099 0.005 0.246 0.001 0.002 0.035
342 Ghaziabad Bhojpur 0.000 0.876 0.029 0.002 0.704 0.000 0.002 0.029
343 Ghaziabad Hapur 0.000 0.115 0.059 0.002 2.477 0.000 0.001 0.006
344 Ghaziabad Dholana 0.000 0.258 0.186 0.008 1.403 0.000 0.001 0.012
345 Ghaziabad Simbholi 0.001 0.882 0.135 0.004 0.278 0.001 0.001 0.009
346 Ghaziabad Garh 0.000 -0.030 0.129 0.006 2.190 0.000 0.001 0.007
347 Ghazipur Barachawar 0.000 0.051 0.001 -0.003 0.301 0.000 0.001 0.008
348 Ghazipur Bhadaura 0.000 0.508 0.008 0.001 0.188 0.000 0.001 0.003
349 Ghazipur Bhawarkol 0.000 0.279 0.042 -0.001 0.066 0.000 0.001 0.005
350 Ghazipur Birno 0.000 0.737 0.037 0.000 0.539 0.000 0.003 0.006
351 Ghazipur Deokali 0.000 0.051 0.023 -0.004 0.293 0.001 0.002 0.025
352 Ghazipur Ghazipur 0.000 0.907 0.490 -0.003 1.405 0.047 0.001 0.000
353 Ghazipur Jakhaniya 0.000 0.122 0.008 -0.003 0.053 0.003 0.001 0.019

Annexure-III
315
S. No. District Block Cr Fe Mn Cu Zn As Pb U
mg/l
354 Ghazipur Jamania 0.000 0.361 0.007 0.001 2.822 0.000 0.003 0.009
355 Ghazipur Karanda 0.000 0.901 0.011 0.005 0.208 0.000 0.003 0.003
356 Ghazipur Kasimabad 0.000 0.092 0.006 -0.003 0.124 0.000 0.001 0.014
357 Ghazipur Manihari 0.000 0.278 0.012 -0.002 0.485 0.000 0.001 0.008
358 Ghazipur Mardah 0.000 0.146 0.092 -0.003 0.287 0.000 0.001 0.009
359 Ghazipur Muhammadabad
0.000 0.598 0.085 -0.002 0.246 0.002 0.001 0.004
360 Ghazipur Reotipur 0.000 1.095 0.310 -0.003 0.165 0.010 0.001 0.000
361 Ghazipur Sadat 0.000 3.096 0.276 -0.004 0.325 0.002 0.001 0.012
362 Ghazipur Saidpur 0.001 1.424 0.015 -0.002 0.415 0.000 0.003 0.030
363 Ghazipur Zakhania 0.000 0.419 0.012 -0.002 0.181 0.000 0.001 0.012
364 Ghazipur Zakhania 0.000 0.120 0.028 -0.003 0.741 0.000 0.001 0.011
365 Ghazipur Zakhania 0.000 0.115 0.147 0.000 0.559 0.000 0.001 0.028
366 Ghazipur Zakhania 0.000 0.136 0.025 -0.002 0.028 0.000 0.001 0.011
367 Ghazipur Jananaganj 0.000 0.092 0.005 0.000 0.238 0.001 0.001 0.010
368 Ghazipur Jananaganj 0.000 0.812 0.079 -0.002 0.336 0.000 0.001 0.025
369 Ghazipur Jananaganj 0.000 1.066 0.026 -0.002 0.262 0.000 0.001 0.024
370 Ghazipur Jananaganj 0.001 0.421 0.020 0.011 0.123 0.000 0.002 0.013
371 Gonda Katra Bazar H.Q.
0.000 16.37
5 0.322 -0.001 0.964 0.019 0.001 0.004
372 Gonda Karnailganj H.Q.
0.000 3.608 0.077 -0.001 1.902 0.002 0.000 0.000
373 Gonda Haldharmau H.Q.
0.000 6.288 0.066 -0.001 0.067 0.026 0.001 0.000

Annexure-III
316
S. No. District Block Cr Fe Mn Cu Zn As Pb U
mg/l
374 Gonda Rupaideeh H.Q.
0.000 4.095 0.168 -0.001 0.203 0.004 0.001 0.000
375 Gonda Itigathok H.Q. 0.000 0.959 0.137 -0.001 0.728 0.007 0.001 0.001
376 Gonda Padri Kripal H.Q.
0.000 0.625 0.090 -0.001 0.652 0.011 0.001 0.000
377 Gonda Jhanjhari H.Q. 0.001 0.036 0.001 -0.001 1.034 0.000 0.005 0.003
378 Gonda Mankapur H.Q. 0.000 0.759 0.047 -0.001 0.526 0.003 0.002 0.001
379 Gonda Chhapia H.Q. 0.000 12.54
7 0.185 -0.001 3.452 0.000 0.001 0.001
380 Gonda Babhanjot H.Q. 0.000 0.913 0.059 -0.001 0.516 0.002 0.002 0.002
381 Gonda Mujehna H.Q. 0.000 1.370 0.138 -0.001 0.469 0.006 0.001 0.001
382 Gonda Nawabganj H.Q.
0.000 1.905 0.170 -0.001 1.506 0.001 0.001 0.002
383 Gonda Wazirganj H.Q. 0.000 0.827 0.047 0.000 0.970 0.002 0.001 0.001
384 Gonda Tarabganj H.Q. 0.000 0.287 0.216 -0.001 0.624 0.001 0.001 0.005
385 Gonda Belsar H.Q. 0.000 0.357 0.050 -0.001 1.445 0.001 0.002 0.006
386 Gonda Paraspur H.Q. 0.000 3.978 0.153 -0.001 0.678 0.023 0.001 0.000
387 Gorakhpur Bansgaon 0.000 1.632 0.172 0.003 1.424 0.004 0.006 0.000
388 Gorakhpur Barahalganj -
0.001 0.982 0.144 -0.001 0.061 0.001 0.001 0.000
389 Gorakhpur Belghat -
0.001 0.145 0.011 0.001 0.733 0.001 0.001 0.001
390 Gorakhpur Bhatahat -
0.001 0.062 0.078 0.000 0.103 0.003 0.004 0.001
391 Gorakhpur Brahmpur 0.000 0.308 0.050 0.003 0.382 0.008 0.005 0.001

Annexure-III
317
S. No. District Block Cr Fe Mn Cu Zn As Pb U
mg/l
392 Gorakhpur Campierganj -
0.001 1.427 0.020 -0.001 2.182 0.000 0.002 0.010
393 Gorakhpur Chargawan 0.000 5.801 0.052 0.000 0.839 0.002 0.004 0.002
394 Gorakhpur Gagaha -
0.001 0.475 0.074 -0.001 0.946 0.012 0.001 0.000
395 Gorakhpur Gola -
0.001 0.057 0.141 0.001 0.136 0.004 0.003 0.000
396 Gorakhpur Jangal Kuriya -
0.001 1.657 0.073 0.000 1.102 0.003 0.005 0.001
397 Gorakhpur Kauriram 0.000 1.944 0.214 0.003 1.233 0.022 0.010 0.003
398 Gorakhpur Khajani 0.000 5.715 0.093 0.000 2.497 0.001 0.006 0.003
399 Gorakhpur Khorabar 0.000 1.817 0.134 0.001 1.773 0.004 0.005 0.000
400 Gorakhpur Pali -
0.001 2.091 0.187 0.003 1.663 0.003 0.004 0.001
401 Gorakhpur Pipraich -
0.001 1.572 0.117 -0.001 0.433 0.009 0.004 0.001
402 Gorakhpur Piprauli -
0.001 0.419 0.045 0.014 0.557 0.007 0.003 0.003
403 Gorakhpur Sahjanwa -
0.001 2.515 0.149 0.000 1.195 0.001 0.004 0.001
404 Gorakhpur Sardar Nagar 0.000 1.015 0.089 0.006 0.233 0.002 0.003 0.001
405 Gorakhpur Uruwa 0.000 1.519 0.136 0.001 1.224 0.002 0.004 0.005
406 Hamirpur Gohand 0.003 0.044 0.002 0.001 0.116 0.000 0.001 0.004
407 Hamirpur Kurara 0.001 0.003 0.003 0.002 0.147 0.000 0.000 0.008
408 Hamirpur Maudaha -
0.001 0.016 0.041 0.001 3.139 0.000 0.002 0.014
409 Hamirpur Muskara 0.000 0.173 0.038 0.004 1.408 0.000 0.000 0.014

Annexure-III
318
S. No. District Block Cr Fe Mn Cu Zn As Pb U
mg/l
410 Hamirpur Rath 0.000 1.878 0.069 -0.001 0.467 0.000 0.000 0.023
411 Hamirpur Sareela 0.010 0.005 0.001 -0.001 0.016 0.000 0.001 0.005
412 Hamirpur Sumerpur 0.000 0.832 0.055 0.000 0.360 0.000 0.000 0.025
413 Hardoi AHIRORI 0.000 2.384 0.151 -0.001 0.018 0.002 0.001 0.006
414 Hardoi BILGRAM 0.000 1.369 0.035 -0.001 0.230 0.000 0.000 0.024
415 Hardoi BAVAN 0.000 1.712 0.122 0.002 0.156 0.004 0.001 0.000
416 Hardoi BAHENDRA KHURD
0.000 1.152 0.165 -0.001 0.146 0.001 0.001 0.018
417 Hardoi BHARAWAN 0.000 0.034 0.053 0.001 0.189 0.001 0.001 0.009
418 Hardoi BHARKHANI 0.000 4.120 0.135 -0.001 0.166 0.001 0.001 0.002
419 Hardoi HARPALPUR 0.000 1.320 0.105 0.000 0.191 0.001 0.001 0.026
420 Hardoi HARIYAWAN 0.000 0.483 0.052 -0.001 0.100 0.002 0.001 0.005
421 Hardoi KACHHAUNA 0.001 4.927 0.512 -0.001 0.167 0.002 0.000 0.002
422 Hardoi KOTHAWAN 0.000 0.779 0.152 0.000 0.146 0.000 0.000 0.020
423 Hardoi MADHAVGANJ 0.000 0.086 0.016 0.000 0.091 0.001 0.001 0.012
424 Hardoi MALLAWAN 0.000 0.600 0.155 0.001 0.170 0.001 0.001 0.044
425 Hardoi MALLAWAN 0.000 0.411 0.085 0.001 0.258 0.000 0.001 0.024
426 Hardoi MALLAWAN 0.002 0.628 0.301 0.001 0.084 0.000 0.001 0.037
427 Hardoi MALLAWAN 0.002 2.452 0.182 0.010 2.783 0.000 0.013 0.010
428 Hardoi PIHANI 0.000 0.249 0.214 0.001 2.913 0.000 0.002 0.020
429 Hardoi SHAHABAD 0.000 3.463 0.201 0.000 0.008 0.021 0.001 0.000
430 Hardoi SURSA 0.000 2.173 0.036 0.000 0.183 0.000 0.001 0.017
431 Hardoi SANDI 0.000 0.421 0.325 0.002 0.147 0.000 0.000 0.044

Annexure-III
319
S. No. District Block Cr Fe Mn Cu Zn As Pb U
mg/l
432 Hardoi SANDILA 0.001 0.304 0.013 0.000 0.461 0.000 0.001 0.011
433 Hardoi TADIYAWAN 0.000 1.307 0.254 -0.001 3.024 0.010 0.001 0.001
434 Hardoi TODARPUR 0.002 0.371 0.157 0.000 0.837 0.001 0.001 0.003
435 J.P. Nagar DHANAURA 0.000 2.134 0.174 0.000 0.555 0.002 0.001 0.000
436 J.P. Nagar AMROHA 0.000 0.246 0.055 0.003 1.339 0.001 0.002 0.005
437 J.P. Nagar JOYA 0.000 8.989 0.247 0.001 0.064 0.012 0.003 0.012
438 J.P. Nagar GAJRAULA 0.000 0.230 0.786 0.003 1.003 0.000 0.002 0.019
439 J.P. Nagar HASANPUR 0.000 0.419 0.167 0.001 0.020 0.000 0.001 0.003
440 J.P. Nagar GANGESHWARI
0.000 0.232 0.118 0.000 0.213 0.001 0.002 0.004
441 J.P. Nagar Joya 0.000 1.487 0.169 0.007 0.060 0.008 0.003 0.002
442 J.P. Nagar Joya 0.000 1.930 0.153 0.000 0.294 0.004 0.002 0.000
443 J.P. Nagar Joya 0.000 0.048 0.130 0.001 0.027 0.003 0.001 0.015
444 J.P. Nagar Joya 0.000 0.034 0.113 0.001 0.005 0.001 0.001 0.011
445 Jalaun Kadaura 0.000 0.024 0.024 -0.004 0.441 0.000 0.001 0.007
446 Jalaun Mahewa 0.001 0.189 0.003 -0.005 0.261 0.000 0.001 0.005
447 Jalaun Kuthond 0.003 0.097 0.000 -0.007 0.361 0.001 0.001 0.005
448 Jalaun Jalaun 0.000 1.421 0.123 -0.007 0.333 0.000 0.001 0.004
449 Jalaun Konch 0.000 0.269 0.007 0.018 0.310 0.000 0.001 0.005
450 Jalaun Nadigaon 0.000 0.179 0.008 -0.005 0.765 0.000 0.000 0.003
451 Jalaun Madhogarh 0.001 0.336 0.002 -0.008 0.271 0.000 0.001 0.004
452 Jalaun Rampura 0.000 1.850 0.013 -0.008 0.597 0.000 0.001 0.003
453 Jalaun Orai (HQ) 0.000 1.295 0.091 -0.007 1.009 0.000 0.002 0.006

Annexure-III
320
S. No. District Block Cr Fe Mn Cu Zn As Pb U
mg/l
454 Jalaun Dakore 0.001 0.079 0.001 -0.007 0.075 0.000 0.001 0.006
455 Jaunpur Jaunpur H.Q. -
0.001 1.128 0.014 -0.001 0.176 0.000 0.000 0.013
456 Jaunpur Barsathi -
0.001 1.330 0.131 -0.001 5.206 0.001 0.001 0.007
457 Jaunpur Dharampur -
0.001 0.246 0.019 -0.001 0.086 0.000 0.001 0.033
458 Jaunpur Dobhi -
0.001 1.828 0.016 -0.002 0.617 0.000 0.001 0.006
459 Jaunpur Jalalpur -
0.001 0.068 0.008 -0.001 4.828 0.000 0.001 0.006
460 Jaunpur Karanja Kalan -
0.001 -0.036 0.002 -0.001 0.070 0.000 0.000 0.023
461 Jaunpur Kerakat -
0.001 0.096 0.005 0.002 0.164 0.000 0.001 0.008
462 Jaunpur Khutahan -
0.001 -0.033 0.076 -0.001 0.114 0.001 0.001 0.004
463 Jaunpur Madiyahun -
0.001 0.100 0.030 0.000 0.711 0.000 0.000 0.022
464 Jaunpur Muftiganj -
0.001 0.106 0.024 -0.001 1.541 0.000 0.001 0.006
465 Jaunpur RamNagar -
0.001 -0.017 0.001 -0.001 0.239 0.000 0.000 0.015
466 Jaunpur Rampur -
0.001 -0.051 0.001 -0.001 0.495 0.000 0.001 0.029
467 Jaunpur Shahganj -
0.001 0.037 0.037 0.004 0.215 0.001 0.001 0.004
468 Jaunpur Sirkoni -
0.001 16.11
3 0.073 -0.001 1.567 0.000 0.001 0.021

Annexure-III
321
S. No. District Block Cr Fe Mn Cu Zn As Pb U
mg/l
469 Jaunpur Suitha Kalan -
0.001 0.437 0.027 -0.001 0.210 0.000 0.001 0.010
470 Jaunpur M Badshahpur -
0.001 1.441 0.018 -0.001 0.723 0.001 0.000 0.008
471 Jaunpur Machhali Shahar
-0.001
0.228 0.023 -0.002 0.270 0.001 0.000 0.027
472 Jaunpur Sikrara -
0.001 3.000 0.024 -0.002 0.469 0.000 0.000 0.009
473 Jaunpur Buxa 0.000 0.095 0.001 -0.001 0.176 0.000 0.000 0.008
474 Jaunpur Badlapur -
0.001 0.374 0.000 -0.001 3.036 0.000 0.000 0.008
475 Jaunpur Maharajganj 0.000 0.167 0.033 -0.001 0.027 0.000 0.001 0.013
476 Jaunpur Sujanganj -
0.001 1.754 0.034 -0.001 0.594 0.001 0.000 0.009
477 Jhansi Bamaur 0.000 0.075 0.003 -0.007 1.819 0.000 0.001 0.012
478 Jhansi Gursarai 0.000 0.160 0.008 -0.007 2.325 0.000 0.001 0.022
479 Jhansi Mauranipur 0.000 2.346 0.023 -0.005 0.119 0.000 0.001 0.004
480 Jhansi Bangra 0.000 0.886 0.013 -0.006 0.351 0.000 0.001 0.012
481 Jhansi Jhansi (HQ) 0.000 0.101 0.079 -0.008 2.583 0.000 0.001 0.000
482 Jhansi Babina 0.000 0.211 0.002 -0.006 0.531 0.000 0.004 0.001
483 Jhansi Badagaon 0.000 0.099 0.007 0.004 0.114 0.000 0.001 0.011
484 Jhansi Chirgaon 0.001 0.008 0.000 -0.007 0.275 0.001 0.004 0.003
485 Jhansi Moth 0.000 0.078 0.013 -0.007 0.702 0.000 0.001 0.005
486 Kannauj Chhibramau 0.000 0.219 0.024 0.001 0.611 0.001 0.002 0.015
487 Kannauj Gugrapur -
0.001 0.144 0.048 0.000 5.891 0.001 0.001 0.006

Annexure-III
322
S. No. District Block Cr Fe Mn Cu Zn As Pb U
mg/l
488 Kannauj Haseran -
0.001 0.214 0.049 -0.001 0.177 0.004 0.001 0.006
489 Kannauj Jalalabad -
0.001 0.013 0.434 0.003 0.140 0.000 0.001 0.008
490 Kannauj Kannauj -
0.001 2.110 0.065 0.001 0.850 0.000 0.000 0.008
491 Kannauj Saurikh -
0.001 0.120 0.134 0.000 0.034 0.001 0.001 0.026
492 Kannauj Talgram -
0.001 0.225 0.016 0.000 0.453 0.000 0.001 0.026
493 Kannauj Umarda 0.000 1.716 1.718 0.002 0.944 0.000 0.001 0.001
494 Kanpur Dehat Akbarpur -
0.001 -0.055 0.018 -0.001 0.420 0.002
-0.001
0.047
495 Kanpur Dehat Amraudha -
0.001 0.305 0.011 0.000 0.216 0.000 0.001 0.008
496 Kanpur Dehat Derapur -
0.001 0.367 0.019 -0.001 1.172 0.000 0.000 0.021
497 Kanpur Dehat Jhinjhak -
0.001 0.407 0.028 0.001 0.343 0.000 0.001 0.017
498 Kanpur Dehat Maitha -
0.001 0.001 0.011 0.001 0.187 0.000 0.000 0.023
499 Kanpur Dehat Malasa -
0.001 0.214 0.013 0.000 1.283 0.000 0.001 0.008
500 Kanpur Dehat Rajpur -
0.001 0.135 0.095 0.000 0.045 0.000 0.001 0.009
501 Kanpur Dehat Rasoolabad -
0.001 0.177 0.042 0.001 0.374 0.000 0.001 0.031
502 Kanpur Dehat Sandalpur 0.001 0.701 0.122 0.001 0.222 0.000 0.002 0.008

Annexure-III
323
S. No. District Block Cr Fe Mn Cu Zn As Pb U
mg/l
503 Kanpur Dehat Sarvan Khera -
0.001 0.079 0.028 -0.001 0.113 0.001 0.001 0.017
504 Kanpur Nagar Bhitar Gaon -
0.001 0.524 0.027 0.001 0.505 0.000 0.001 0.023
505 Kanpur Nagar Bidhnoo -
0.001 -0.054 0.000 -0.001 -0.018 0.000
-0.001
0.028
506 Kanpur Nagar Bilhaur -
0.001 0.168 0.054 0.001 0.218 0.000 0.002 0.013
507 Kanpur Nagar Chaubeypur -
0.001 2.509 0.077 -0.001 0.231 0.000 0.000 0.014
508 Kanpur Nagar Ghatampur 0.004 0.053 0.002 0.001 0.329 0.000 0.001 0.008
509 Kanpur Nagar Kakwan -
0.001 0.198 0.053 0.000 0.015 0.001 0.001 0.023
510 Kanpur Nagar Kalyanpur -
0.001 0.155 0.263 0.001 0.126 0.000 0.001 0.024
511 Kanpur Nagar Patara -
0.001 0.410 0.155 0.002 0.110 0.000 0.001 0.022
512 Kanpur Nagar Sarsaul -
0.001 0.076 0.004 0.000 0.386 0.000 0.000 0.030
513 Kanpur Nagar Shivrajpur -
0.001 0.924 0.130 0.000 1.845 0.000 0.000 0.019
514 Kanpur Nagar Chaubeypur 0.000 0.283 0.006 0.000 0.145 0.001 0.001 0.023
515 Kanpur Nagar Chaubeypur 0.000 0.282 0.006 0.000 0.147 0.001 0.001 0.024
516 Kanpur Nagar Chaubeypur 0.003 0.080 0.017 0.002 0.003 0.002 0.000 0.016
517 Kanpur Nagar Chaubeypur -
0.001 0.300 0.031 -0.001 0.084 0.001 0.000 0.017
518 Kasganj Amanpur 0.000 1.011 0.019 0.000 0.165 0.000 0.001 0.015

Annexure-III
324
S. No. District Block Cr Fe Mn Cu Zn As Pb U
mg/l
519 Kasganj Ganj dundwara
0.000 1.104 0.162 0.000 0.233 0.005 0.001 0.001
520 Kasganj Kasganj 0.003 0.041 0.002 0.003 0.196 0.001 0.001 0.016
521 Kasganj Patiyali 0.000 0.055 0.006 0.001 0.166 0.001 0.001 0.010
522 Kasganj Sahawar 0.000 0.867 0.019 -0.001 0.015 0.001 0.001 0.003
523 Kasganj Sidhpura 0.000 -0.029 0.200 0.002 1.361 0.000 0.000 0.024
524 Kasganj Soron 0.000 0.071 0.092 0.000 0.090 0.000 0.001 0.014
525 Kaushambi Chail 0.000 0.139 0.005 0.000 0.347 0.000 0.001 0.012
526 Kaushambi Kara -
0.001 0.932 0.062 0.001 0.225 0.000 0.000 0.023
527 Kaushambi Kaushambi 0.000 0.745 0.007 -0.001 0.047 0.000 0.001 0.010
528 Kaushambi Manjhanpur -
0.001 0.237 0.064 -0.001 0.282 0.000 0.004 0.013
529 Kaushambi Moorat Ganj -
0.001 4.043 0.056 0.000 0.578 0.000 0.000 0.014
530 Kaushambi Newada -
0.001 1.040 0.059 0.000 1.467 0.000 0.002 0.006
531 Kaushambi Sarsawan 0.001 0.184 0.004 0.006 0.966 0.000 0.001 0.008
532 Kaushambi Sirathu -
0.001 0.876 0.170 -0.001 0.339 0.000 0.000 0.002
533 Kushi Nagar Dudhai -
0.001 3.851 0.139 -0.001 0.011 0.022 0.001 0.000
534 Kushi Nagar Fazil Nagar -
0.001 1.953 0.321 -0.001 8.267 0.000 0.002 0.000
535 Kushi Nagar Hata -
0.001 2.421 0.087 -0.001 0.252 0.006 0.000 0.002
536 Kushi Nagar Kaptan Ganj 0.001 7.493 0.134 0.000 0.441 0.003 0.001 0.001

Annexure-III
325
S. No. District Block Cr Fe Mn Cu Zn As Pb U
mg/l
537 Kushi Nagar Kasiya -
0.001 0.435 0.036 -0.001 0.577 0.008 0.002 0.001
538 Kushi Nagar Khadda -
0.001 2.687 0.307 -0.001 0.272 0.000 0.001 0.000
539 Kushi Nagar Motichak -
0.001 4.438 0.039 -0.001 0.419 0.001 0.002 0.001
540 Kushi Nagar Nebuwa Naurangia
-0.001
9.261 0.702 -0.001 0.742 0.011 0.001 0.000
541 Kushi Nagar Padrauna 0.000 13.31
4 0.199 -0.001 0.263 0.001 0.001 0.002
542 Kushi Nagar Ram Kola -
0.001 1.070 0.231 -0.001 0.236 0.000 0.001 0.003
543 Kushi Nagar Sewarhi -
0.001 0.613 0.170 -0.001 0.037 0.033 0.001 0.000
544 Kushi Nagar Sukrauli -
0.001 3.141 0.047 -0.001 0.004 0.001 0.000 0.002
545 Kushi Nagar Tamkuhi -
0.001 2.197 0.037 -0.001 0.352 0.000 0.001 0.008
546 Kushi Nagar Vishnupurwa 0.000 3.746 0.635 -0.001 0.155 0.001 0.001 0.000
547 Lakhimpur Kheri
BANKEYGANJ 0.000 0.069 0.137 0.005 0.032 0.000 0.001 0.009
548 Lakhimpur Kheri
BEHJAM 0.000 5.186 0.081 -0.001 0.064 0.001 0.001 0.002
549 Lakhimpur Kheri
BIJUA 0.002 0.633 0.144 -0.001 0.175 0.006 0.001 0.000
550 Lakhimpur Kheri
DHAURAHRA 0.000 2.000 0.044 0.000 0.640 0.001 0.000 0.000
551 Lakhimpur Kheri
GOLA 0.000 0.372 0.074 -0.001 0.413 0.001 0.000 0.002

Annexure-III
326
S. No. District Block Cr Fe Mn Cu Zn As Pb U
mg/l
552 Lakhimpur Kheri
ISHANAGASR 0.002 6.749 0.067 -0.001 0.111 0.024 0.001 0.000
553 Lakhimpur Kheri
LAKHIMPUR KHIRI
0.000 0.470 0.106 0.000 0.385 0.001 0.000 0.002
554 Lakhimpur Kheri
MOHAMMADI 0.001 4.614 0.063 -0.001 1.056 0.000 0.001 0.003
555 Lakhimpur Kheri
MITAULI 0.001 0.685 0.028 0.001 0.122 0.001 0.000 0.006
556 Lakhimpur Kheri
NAKAHA 0.001 7.634 0.251 0.004 0.018 0.038 0.001 0.000
557 Lakhimpur Kheri
NIGHASAN 0.000 1.489 0.140 0.000 0.349 0.034 0.001 0.000
558 Lakhimpur Kheri
PASGAWAN 0.000 0.168 0.012 0.002 0.086 0.001 0.001 0.000
559 Lakhimpur Kheri
PALIA KALAN 0.001 1.492 0.037 -0.001 0.038 0.002 0.000 0.002
560 Lakhimpur Kheri
PHOOLBEHAR 0.001 3.264 0.115 -0.001 0.039 0.002 0.001 0.000
561 Lakhimpur Kheri
RAMAIYABEHAR
0.000 2.882 0.129 -0.001 0.521 0.001 0.000 0.000
562 Lalitpur Talbehat 0.000 0.121 0.009 -0.007 3.128 0.000 0.002 0.001
563 Lalitpur Jakhaura 0.000 0.146 0.002 -0.006 0.484 0.000 0.001 0.004
564 Lalitpur Bar 0.000 0.057 0.002 -0.008 1.424 0.000 0.001 0.002
565 Lalitpur Lalitpur (HQ) 0.000 0.222 0.029 -0.008 0.010 0.000 0.001 0.002
566 Lalitpur Mahroni 0.000 0.609 0.010 -0.008 0.211 0.000 0.000 0.006
567 Lalitpur Maadawara 0.000 0.260 0.025 -0.004 8.285 0.000 0.001 0.001
568 Lalitpur Birdha 0.000 0.171 0.032 -0.007 1.772 0.000 0.001 0.003

Annexure-III
327
S. No. District Block Cr Fe Mn Cu Zn As Pb U
mg/l
569 Lucknow Chinhat 0.001 0.498 0.022 -0.002 0.230 0.000 0.001 0.005
570 Lucknow Bakshi Ka Talab
0.000 0.678 0.094 -0.002 0.506 0.005 0.001 0.013
571 Lucknow Mal 0.000 0.535 0.048 -0.003 0.388 0.000 0.001 0.004
572 Lucknow Malihabad 0.000 0.722 0.043 -0.003 0.009 0.000 0.001 0.004
573 Lucknow Kakori 0.000 0.807 0.030 -0.002 2.830 0.000 0.001 0.004
574 Lucknow Gosaiganj 0.000 0.416 0.014 -0.003 0.037 0.000 0.001 0.004
575 Lucknow Mohanlalganj 0.000 1.221 0.062 -0.001 0.426 0.000 0.001 0.006
576 Lucknow Sarojini Nagar 0.000 0.223 0.006 -0.002 0.147 0.000 0.001 0.004
577 Mahamaya Nagar
Sikandra Rao 0.000 0.270 0.367 0.001 0.784 0.006 0.001 0.008
578 Mahamaya Nagar
Sasni -
0.001 0.463 0.108 -0.001 0.473 0.000 0.001 0.040
579 Mahamaya Nagar
Hathras -
0.001 0.830 0.037 0.002 0.294 0.000 0.000 0.028
580 Mahamaya Nagar
Hasayan -
0.001 0.690 0.334 0.002 0.066 0.000 0.001 0.009
581 Mahamaya Nagar
Sahpau 0.001 0.016 0.005 0.000 1.034 0.001 0.001 0.015
582 Mahamaya Nagar
Sadabad -
0.001 0.056 0.146 -0.001 1.646 0.000 0.001 0.009
583 Mahamaya Nagar
Mursan 0.000 0.462 0.046 0.002 2.516 0.000 0.000 0.032
584 Maharajganj Brijman Ganj 0.000 0.121 0.008 -0.001 0.054 0.003 0.000 0.000
585 Maharajganj Dhani -
0.001 1.128 0.095 -0.001 0.096 0.000 0.000 0.000

Annexure-III
328
S. No. District Block Cr Fe Mn Cu Zn As Pb U
mg/l
586 Maharajganj Ghughuli -
0.001 8.695 0.222 0.000 0.798 0.017 0.002 0.000
587 Maharajganj Laxmipurr -
0.001 5.323 0.363 -0.001 0.351 0.008 0.000 0.006
588 Maharajganj Maharajganj -
0.001 8.480 0.706 -0.002 2.423 0.011
-0.001
0.002
589 Maharajganj Mithaura -
0.001 0.623 0.023 -0.001 0.033 0.004 0.000 0.000
590 Maharajganj Nautanwa -
0.001 0.829 0.067 -0.001 0.110 0.001 0.000 0.001
591 Maharajganj Nichlaul -
0.001 0.273 0.241 -0.001 7.290 0.003 0.000 0.000
592 Maharajganj Paniyara 0.000 2.347 0.576 -0.001 14.22
4 0.002 0.001 0.002
593 Maharajganj Partawal -
0.001 0.202 0.049 -0.001 1.225 0.003 0.001 0.000
594 Maharajganj Pharenda -
0.001 0.161 0.028 -0.001 0.080 0.000 0.000 0.003
595 Maharajganj Siswa -
0.001 1.801 0.060 0.000 0.180 0.006 0.000 0.000
596 Mahoba Charkhari 0.000 0.486 0.056 -0.001 0.034 0.000 0.000 0.008
597 Mahoba Jaitpur 0.000 0.898 0.014 0.005 0.111 0.000 0.001 0.014
598 Mahoba Kabrai 0.000 0.067 0.018 0.004 0.636 0.000 0.000 0.009
599 Mahoba Panwari 0.000 0.134 0.010 -0.001 0.034 0.000 0.000 0.036
600 Mainpuri Barnahal 0.000 -0.029 0.221 -0.001 1.599 0.000 0.000 0.022
601 Mainpuri Bewar 0.000 0.351 0.021 0.000 0.192 0.001 0.002 0.015
602 Mainpuri Ghirore 0.000 -0.035 0.109 -0.001 0.013 0.000 -
0.001 0.012

Annexure-III
329
S. No. District Block Cr Fe Mn Cu Zn As Pb U
mg/l
603 Mainpuri Jageer 0.000 -0.036 0.009 0.000 0.057 0.001 -
0.001 0.008
604 Mainpuri Karhal 0.005 0.150 0.101 0.017 0.126 0.001 0.001 0.039
605 Mainpuri Kishni 0.000 -0.035 0.077 -0.001 0.002 0.001 -
0.001 0.083
606 Mainpuri Kishni 0.000 -0.036 0.013 -0.001 0.118 0.001 -
0.001 0.019
607 Mainpuri Kishni 0.000 -0.035 0.048 -0.001 0.034 0.000 -
0.001 0.006
608 Mainpuri Kurawali 0.000 1.363 0.036 -0.001 0.150 0.001 0.001 0.030
609 Mainpuri Mainpuri 0.000 -0.036 0.251 -0.001 0.157 0.001 -
0.001 0.002
610 Mainpuri Sultanganj 0.000 1.090 0.028 0.000 1.111 0.001 0.011 0.022
611 Mathura Raya -
0.001 0.178 0.058 0.001 0.815 0.001 0.001 0.034
612 Mathura Manth -
0.001 0.043 0.008 0.002 1.429 0.000 0.001 0.048
613 Mathura Raya -
0.001 0.220 0.156 0.001 0.057 0.000 0.001 0.026
614 Mathura Baldeo 0.000 0.323 0.018 0.003 0.338 0.001 0.003 0.062
615 Mathura Mathura 0.000 0.381 0.020 0.008 5.025 0.000 0.003 0.009
616 Mathura Goverdhan 0.000 0.059 0.008 0.000 0.720 0.001 0.001 0.046
617 Mathura Goverdhan -
0.001 1.732 0.433 0.000 0.035 0.000 0.000 0.038
618 Mathura Nandgaon 0.000 0.178 0.511 0.000 0.009 0.000 0.001 0.015
619 Mathura Nandgaon -
0.001 0.328 0.376 0.000 2.469 0.000 0.000 0.000

Annexure-III
330
S. No. District Block Cr Fe Mn Cu Zn As Pb U
mg/l
620 Mathura Chhata -
0.001 0.375 0.236 0.000 2.250 0.000 0.001 0.014
621 Mathura Chhata 0.000 0.102 0.014 0.000 0.013 0.000 0.002 0.003
622 Mathura Naujhil 0.000 1.412 0.051 0.001 0.582 0.000 0.000 0.030
623 Mathura Chaumuhan 0.000 0.481 0.041 0.003 4.213 0.000 0.001 0.026
624 Maunath Bhanjan
Badraon 0.000 0.237 0.088 0.000 0.870 0.000 0.001 0.010
625 Maunath Bhanjan
Dohari Ghat 0.000 4.058 0.089 -0.003 0.007 0.004 0.001 0.000
626 Maunath Bhanjan
Fatehpur Madaon
0.000 0.593 0.078 -0.003 0.175 0.002 0.001 0.001
627 Maunath Bhanjan
Ghosi 0.000 1.549 0.035 -0.003 0.183 0.000 0.001 0.005
628 Maunath Bhanjan
Kopaganj 0.000 0.412 0.054 -0.003 0.256 0.000 0.001 0.003
629 Maunath Bhanjan
Mohammadabad
0.000 0.207 0.007 -0.003 0.306 0.000 0.001 0.006
630 Maunath Bhanjan
Pardaha 0.000 0.061 0.013 -0.003 2.320 0.000 0.001 0.011
631 Maunath Bhanjan
Ranipur 0.000 0.301 0.003 -0.002 0.049 0.000 0.002 0.015
632 Maunath Bhanjan
Ratanpura 0.000 0.365 0.028 -0.004 0.091 0.000 0.002 0.007
633 Meerut Saroorpur 0.000 0.277 0.068 -0.001 1.600 0.000 0.001 0.012
634 Meerut Parichhatgarh 0.000 5.884 0.079 0.005 0.879 0.000 0.001 0.011
635 Meerut Meerut 0.000 0.640 0.208 0.009 0.054 0.000 0.000 0.008
636 Meerut Hastinapur 0.001 0.040 0.001 0.001 0.317 0.001 0.001 0.005

Annexure-III
331
S. No. District Block Cr Fe Mn Cu Zn As Pb U
mg/l
637 Meerut Rohta 0.000 0.509 0.368 0.000 0.174 0.000 0.001 0.014
638 Meerut Daurala 0.000 0.148 0.156 0.001 1.036 0.000 0.001 0.007
639 Meerut Mawana 0.000 0.069 0.086 0.003 0.340 0.001 0.000 0.024
640 Meerut Rajpura 0.000 3.541 0.151 -0.001 0.027 0.003 0.000 0.010
641 Meerut Kharkhoda 0.000 0.213 0.549 0.002 1.973 0.000 0.001 0.013
642 Meerut Sardhana 0.000 0.456 0.006 0.000 0.230 0.004 0.001 0.029
643 Meerut Janikhurd 0.000 2.583 0.122 0.000 0.274 0.000 0.000 0.011
644 Meerut Machhra 0.001 6.078 0.109 0.000 0.471 0.001 0.001 0.007
645 Mirzapur Mirzapur H.Q. -
0.001 0.171 0.008 0.000 0.528 0.000 0.000 0.012
646 Mirzapur Chanbey -
0.001 -0.029 0.004 0.009 0.047 0.000 0.001 0.001
647 Mirzapur City -
0.001 0.075 0.001 0.001 0.117 0.000 0.000 0.015
648 Mirzapur Haliya 0.000 0.085 0.025 0.001 0.084 0.001 0.001 0.000
649 Mirzapur Jamalpur -
0.001 1.021 0.022 -0.002 2.126 0.000 0.000 0.001
650 Mirzapur Kon -
0.001 4.720 0.340 -0.002 0.123 0.021 0.000 0.000
651 Mirzapur Lalganj -
0.001 0.365 0.083 -0.001 0.186 0.000 0.001 0.004
652 Mirzapur Majhawan -
0.001 -0.005 0.008 0.004 0.761 0.000 0.001 0.008
653 Mirzapur Marihan -
0.001 -0.043 -0.001 -0.001 -0.003 0.000 0.002 0.000
654 Mirzapur Narainpur -
0.001 0.019 0.032 0.006 0.113 0.000 0.000 0.028

Annexure-III
332
S. No. District Block Cr Fe Mn Cu Zn As Pb U
mg/l
655 Mirzapur Pahari -
0.001 0.195 0.009 0.003 1.012 0.000 0.000 0.003
656 Mirzapur Rajgarh -
0.001 0.946 0.445 -0.001 0.290 0.000 0.001 0.000
657 Mirzapur Sikhar/ Shikhad
-0.001
1.781 0.201 -0.002 0.900 0.000 0.000 0.002
658 Moradabad BHAGATPUR TANDA
0.000 1.841 0.161 -0.002 0.410 0.012 0.000 0.000
659 Moradabad THAKURDWARA
0.000 0.035 0.073 -0.002 0.001 0.001 0.000 0.005
660 Moradabad DILARI 0.000 0.331 0.135 -0.002 0.024 0.006 0.030 0.001
661 Moradabad MOONDHA PANDEY
0.000 1.494 0.143 -0.002 0.132 0.021 0.001 0.000
662 Moradabad SAMBHAL 0.000 0.226 0.134 0.001 0.391 0.001 0.003 0.003
663 Moradabad PANWASA 0.000 0.148 0.040 -0.002 0.027 0.001 0.001 0.007
664 Moradabad BAHJOI 0.000 3.002 0.264 -0.002 0.012 0.000 0.000 0.017
665 Moradabad BANIAKHERA 0.000 0.184 0.166 -0.001 0.087 0.003 0.000 0.007
666 Moradabad BILARI 0.000 0.466 0.072 -0.002 0.025 0.001 0.000 0.005
667 Moradabad DEENGARPUR 0.000 2.987 0.273 -0.002 0.024 0.004 0.000 0.007
668 Moradabad MORADABAD 0.000 2.364 0.033 -0.002 0.423 0.000 0.000 0.015
669 Moradabad CHHAJLET 0.000 0.776 0.280 -0.002 0.039 0.019 0.000 0.007
670 Moradabad ASMOLI 0.000 3.162 0.148 -0.001 0.261 0.003 0.001 0.012
671 Muzaffarnagar
Kandhala 0.000 0.443 0.029 0.002 0.040 0.000 0.001 0.016
672 Muzaffarnagar
Kairana 0.000 0.593 0.049 0.000 0.764 0.000 0.001 0.035

Annexure-III
333
S. No. District Block Cr Fe Mn Cu Zn As Pb U
mg/l
673 Muzaffarnagar
Bhaghara 0.000 0.514 0.031 0.000 0.391 0.001 0.001 0.013
674 Muzaffarnagar
Budhana 0.000 0.146 0.145 0.000 1.618 0.000 0.001 0.031
675 Muzaffarnagar
Charthawal 0.000 0.455 0.488 0.001 1.565 0.000 0.001 0.014
676 Muzaffarnagar
Jansath 0.000 0.890 0.032 0.002 0.216 0.001 0.001 0.009
677 Muzaffarnagar
Khatauli 0.000 0.341 0.123 0.000 0.527 0.000 0.001 0.011
678 Muzaffarnagar
Morna 0.000 0.007 0.005 0.006 0.338 0.000 0.002 0.002
679 Muzaffarnagar
Muzaffarnagar 0.000 2.347 0.091 -0.001 0.003 0.000 0.001 0.006
680 Muzaffarnagar
Purkaji 0.000 0.079 0.125 0.002 0.544 0.012 0.001 0.009
681 Muzaffarnagar
Shahpur 0.000 5.224 0.083 0.000 0.529 0.001 0.001 0.005
682 Muzaffarnagar
Shamli 0.000 0.120 0.152 0.000 1.666 0.000 0.001 0.019
683 Muzaffarnagar
Thana Bhawan 0.000 1.668 0.034 0.000 0.020 0.000 0.001 0.023
684 Muzaffarnagar
UN 0.000 0.038 0.051 0.002 1.449 0.000 0.002 0.006
685 Pilibhit AMARIA 0.000 0.844 0.080 -0.001 0.015 0.007 0.001 0.001
686 Pilibhit BAR KHERA 0.000 0.965 0.075 0.000 0.231 0.006 0.002 0.004
687 Pilibhit BILSANDA 0.000 2.374 0.043 0.000 0.039 0.001 0.001 0.002
688 Pilibhit BISALPUR 0.000 4.103 0.081 0.000 0.227 0.001 0.001 0.002

Annexure-III
334
S. No. District Block Cr Fe Mn Cu Zn As Pb U
mg/l
689 Pilibhit LALAURI KHERA
0.000 0.625 0.185 -0.001 0.018 0.005 0.000 0.004
690 Pilibhit MARORI 0.001 0.296 0.040 -0.001 0.501 0.001 0.003 0.004
691 Pilibhit PURANPUR 0.000 0.201 0.041 -0.001 0.093 0.010 0.005 0.000
692 Pratapgarh Aspur- Deosara
-0.001
0.119 0.036 -0.001 1.302 0.000 0.000 0.012
693 Pratapgarh Baba Bekhernath
0.000 0.652 0.040 0.002 0.325 0.001 0.000 0.032
694 Pratapgarh Baba Bekhernath
0.000 1.042 0.208 0.000 0.585 0.002 0.001 0.044
695 Pratapgarh Baba Bekhernath
0.000 0.090 0.009 0.018 0.295 0.000 0.001 0.023
696 Pratapgarh Baba Bekhernath
0.006 2.308 0.027 -0.001 0.373 0.000 0.000 0.028
697 Pratapgarh Baba Bekhernath
0.000 -0.015 0.000 0.016 0.817 0.000 0.000 0.019
698 Pratapgarh Babaganj 0.000 0.115 0.012 0.000 0.215 0.001 0.000 0.034
699 Pratapgarh Babaganj -
0.001 0.193 0.006 -0.002 0.025 0.001 0.000 0.016
700 Pratapgarh Babaganj -
0.001 0.551 0.047 0.000 1.418 0.002 0.000 0.064
701 Pratapgarh Babaganj -
0.001 0.688 0.027 -0.002 0.091 0.003 0.000 0.014
702 Pratapgarh Bihar -
0.001 0.379 0.005 -0.001 0.147 0.000 0.000 0.021
703 Pratapgarh Gaura -
0.001 0.065 0.013 -0.001 0.209 0.000 0.000 0.017
704 Pratapgarh Kalanker -
0.001 0.601 0.203 -0.001 2.125 0.000 0.000 0.006

Annexure-III
335
S. No. District Block Cr Fe Mn Cu Zn As Pb U
mg/l
705 Pratapgarh Kunda -
0.001 1.305 0.077 -0.001 0.136 0.000 0.001 0.023
706 Pratapgarh Lakshmanpur 0.001 0.504 0.201 0.001 2.675 0.001 0.001 0.037
707 Pratapgarh Lalganj -
0.001 -0.008 0.003 -0.001 0.141 0.001 0.000 0.029
708 Pratapgarh Mandhata -
0.001 1.822 0.137 -0.002 0.110 0.000 0.000 0.005
709 Pratapgarh Mangraura -
0.001 0.524 0.051 -0.001 0.073 0.000 0.001 0.008
710 Pratapgarh Patti -
0.001 -0.043 0.040 -0.001 0.014 0.000 0.000 0.014
711 Pratapgarh Pratapgarh Sadar
-0.001
0.109 0.031 0.002 1.144 0.000 0.001 0.027
712 Pratapgarh Rampur- Sangramg
-0.001
0.097 0.018 -0.002 0.080 0.005 0.000 0.028
713 Pratapgarh Sandwa- Chandrik
0.000 0.286 0.136 -0.001 0.511 0.000 0.000 0.021
714 Pratapgarh Sangaipur -
0.001 2.522 0.136 -0.002 1.428 0.000 0.000 0.014
715 Pratapgarh Sangaipur -
0.001 0.047 0.008 0.003 0.319 0.000 0.000 0.032
716 Pratapgarh Sangaipur -
0.001 2.462 0.954 -0.002 0.676 0.001 0.000 0.064
717 Pratapgarh Sangaipur 0.000 0.240 0.179 0.001 0.833 0.011 0.000 0.086
718 Pratapgarh Shivgarh -
0.001 -0.005 0.026 0.003 0.199 0.000 0.002 0.013
719 Prayagraj Bahadurpur 0.001 1.320 0.071 0.000 1.258 0.000 0.002 0.005

Annexure-III
336
S. No. District Block Cr Fe Mn Cu Zn As Pb U
mg/l
720 Prayagraj Bahera 0.000 6.128 0.045 -0.001 0.607 0.000 0.001 0.009
721 Prayagraj Chaka 0.000 0.443 0.017 0.003 0.943 0.000 0.001 0.009
722 Prayagraj Dhanpur 0.001 0.272 0.074 0.000 1.598 0.000 0.001 0.005
723 Prayagraj Handa 0.000 0.162 0.034 -0.001 0.222 0.001 0.002 0.015
724 Prayagraj Holagarh 0.000 0.053 0.028 0.000 0.540 0.000 0.000 0.022
725 Prayagraj Jasra -
0.001 2.102 0.082 -0.001 0.199 0.000 0.001 0.021
726 Prayagraj Karchana 0.034 14.17
5 0.408 0.039 2.659 0.001 0.018 0.005
727 Prayagraj Kaundhiyara 0.000 0.214 0.005 0.003 0.493 0.001 0.001 0.004
728 Prayagraj Kaurihar 0.000 0.451 0.047 -0.001 0.572 0.000 0.001 0.024
729 Prayagraj Koran 0.000 -0.009 0.067 -0.001 0.020 0.001 0.001 0.005
730 Prayagraj Manda 0.005 0.089 0.000 0.000 0.063 0.000 0.002 0.002
731 Prayagraj Mau-Aima 0.000 0.082 0.012 0.000 0.181 0.001 0.001 0.013
732 Prayagraj Meja 0.000 0.228 0.005 0.005 0.231 0.000 0.002 0.011
733 Prayagraj Phoolpur 0.000 0.237 0.017 -0.001 0.166 0.001 0.002 0.038
734 Prayagraj Pratappur 0.000 0.379 0.161 0.000 1.900 0.000 0.001 0.036
735 Prayagraj Saidabad 0.000 1.032 0.008 -0.001 0.106 0.002 0.002 0.011
736 Prayagraj Shankargarh -
0.001 1.198 0.129 0.003 0.595 0.000 0.004 0.002
737 Prayagraj Soraon 0.000 0.195 0.018 0.001 0.042 0.001 0.001 0.018
738 Prayagraj Urwa 0.000 0.619 0.143 0.006 1.726 0.000 0.001 0.004
739 Raibareli Amawan 0.000 2.300 0.176 -0.002 0.975 0.000 0.000 0.010
740 Raibareli Bachharawan 0.000 1.249 0.044 -0.001 0.403 0.000 0.000 0.018

Annexure-III
337
S. No. District Block Cr Fe Mn Cu Zn As Pb U
mg/l
741 Raibareli Bahadurpur 0.000 -0.023 0.014 -0.003 0.115 0.000 -
0.001 0.023
742 Raibareli Chhatoh 0.000 0.402 0.070 -0.002 1.153 0.000 0.000 0.039
743 Raibareli Chhatoh 0.000 2.601 0.039 -0.002 0.011 0.001 0.000 0.080
744 Raibareli Chhatoh 0.001 0.262 0.029 0.000 1.102 0.000 0.002 0.022
745 Raibareli Dalmau 0.000 0.724 0.014 -0.002 1.528 0.000 0.000 0.010
746 Raibareli Deeh 0.000 1.670 0.021 -0.002 3.403 0.000 0.001 0.023
747 Raibareli Dinshahgaura 0.000 0.152 0.049 -0.001 0.018 0.001 0.001 0.013
748 Raibareli Harichandpur 0.000 0.502 0.052 -0.002 0.228 0.000 0.000 0.032
749 Raibareli Jagatpur 0.000 4.309 0.052 -0.001 0.030 0.001 0.000 0.008
750 Raibareli Kheron 0.000 17.55
6 0.999 -0.002 0.128 0.034 0.000 0.001
751 Raibareli Lalganj 0.000 0.399 0.034 -0.002 0.079 0.000 0.000 0.065
752 Raibareli Lalganj 0.000 0.605 0.037 -0.002 2.197 0.000 0.000 0.070
753 Raibareli Lalganj 0.000 0.105 0.005 -0.001 0.400 0.001 0.000 0.017
754 Raibareli Maharajganj 0.000 0.333 0.036 0.002 0.821 0.000 0.000 0.034
755 Raibareli Rahi 0.000 0.703 0.061 -0.002 0.477 0.000 0.000 0.025
756 Raibareli Rohnia 0.000 0.324 0.014 -0.002 0.067 0.001 0.000 0.006
757 Raibareli Salon 0.000 0.250 0.058 -0.002 0.581 0.000 0.000 0.013
758 Raibareli Sareni 0.000 1.384 0.059 -0.002 0.138 0.000 0.000 0.035
759 Raibareli Sartawan 0.000 3.694 0.101 -0.001 4.062 0.001 0.001 0.007
760 Raibareli Sheogarh 0.000 3.120 0.085 0.000 0.160 0.000 0.000 0.014
761 Raibareli Singhpur 0.001 0.368 0.051 -0.001 0.428 0.000 0.001 0.008
762 Raibareli Tiloee 0.000 0.943 0.221 -0.001 0.324 0.000 0.000 0.049

Annexure-III
338
S. No. District Block Cr Fe Mn Cu Zn As Pb U
mg/l
763 Raibareli Unchahar 0.000 0.500 0.112 -0.001 2.197 0.000 0.000 0.016
764 Raibareli Unchahar 0.000 1.983 0.095 -0.002 2.070 0.000 0.000 0.037
765 Raibareli Unchahar 0.000 0.272 0.016 -0.002 0.180 0.001 0.001 0.015
766 Rampur MILAK 0.000 4.084 0.245 -0.001 0.262 0.008 0.000 0.002
767 Rampur SHAHBAD 0.000 0.067 0.032 0.000 0.427 0.000 0.001 0.006
768 Rampur CHAMRAUA 0.000 9.891 0.316 -0.002 0.006 0.002 0.001 0.001
769 Rampur BILASPUR 0.000 5.706 0.115 -0.002 0.022 0.001 0.000 0.005
770 Rampur SWAR 0.000 0.415 0.066 -0.002 0.508 0.001 0.001 0.004
771 Rampur SAIDNAGAR 0.000 0.658 0.115 -0.002 0.054 0.007 0.005 0.000
772 Saharanpur Nanauta 0.000 4.203 0.200 -0.001 0.083 0.001 0.000 0.005
773 Saharanpur Nakur 0.000 0.039 0.466 0.001 2.230 0.000 0.000 0.004
774 Saharanpur Nagal 0.000 0.036 0.089 0.000 0.865 0.002 0.001 0.005
775 Saharanpur Puwarka 0.001 0.034 0.101 0.000 0.776 0.000 0.001 0.007
776 Saharanpur Rampur 0.000 0.871 0.127 -0.001 0.027 0.001 0.000 0.003
777 Saharanpur Sadauli Qudim 0.000 0.236 0.007 0.003 0.504 0.000 0.000 0.005
778 Saharanpur Sarsawa -
0.001 -0.089 0.142 -0.001 -0.006 0.001
-0.001
0.012
779 Saharanpur Deoband 0.000 0.491 0.153 0.000 0.264 0.001 0.000 0.007
780 Saharanpur Baliakheri 0.001 3.931 0.122 0.001 0.127 0.004 0.002 0.004
781 Saharanpur Gangoh 0.000 0.122 0.089 0.000 0.927 0.000 0.001 0.037
782 Saharanpur Muzafarabad 0.000 0.411 0.743 0.003 0.121 0.000 0.001 0.001
783 Sant Kabir Nagar
Bagholi 0.000 1.765 0.132 0.010 0.752 0.002 0.003 0.001

Annexure-III
339
S. No. District Block Cr Fe Mn Cu Zn As Pb U
mg/l
784 Sant Kabir Nagar
Belhar Kalan -
0.001 0.390 0.206 0.002 0.782 0.009 0.002 0.001
785 Sant Kabir Nagar
Hessar Bazar -
0.001 0.936 0.174 0.000 0.507 0.001 0.001 0.000
786 Sant Kabir Nagar
Khalilabad 0.000 0.449 0.123 0.006 0.374 0.000 0.004 0.027
787 Sant Kabir Nagar
Mehdawal -
0.001 2.289 0.141 0.000 1.220 0.001 0.003 0.000
788 Sant Kabir Nagar
Nnath Nagar -
0.001 2.136 0.071 -0.001 0.021 0.003 0.000 0.001
789 Sant Kabir Nagar
Poli 0.000 0.892 0.095 -0.001 1.306 0.018 0.003 0.000
790 Sant Kabir Nagar
Santha 0.000 2.022 0.194 0.024 0.472 0.013 0.007 0.001
791 Sant Kabir Nagar
Semariyawan 0.005 3.074 0.202 0.047 1.918 0.004 0.018 0.002
792 Sant Ravidas Nagar
Abholi -
0.001 0.001 0.018 0.009 0.111 0.000 0.000 0.013
793 Sant Ravidas Nagar
Aurai -
0.001 0.278 0.017 -0.001 0.165 0.000 0.001 0.003
794 Sant Ravidas Nagar
Bhadohi -
0.001 0.055 0.027 0.001 0.031 0.001 0.000 0.005
795 Sant Ravidas Nagar
Deegh -
0.001 -0.022 0.005 -0.001 4.529 0.000 0.003 0.010
796 Sant Ravidas Nagar
Gyanpur -
0.001 1.057 0.089 -0.001 3.619 0.000 0.001 0.009
797 Sant Ravidas Nagar
Suriyawan 0.000 0.080 0.000 0.003 0.601 0.000 0.003 0.007
798 Shahjahanpur BANDA 0.000 1.337 0.126 0.000 0.032 0.010 0.002 0.001

Annexure-III
340
S. No. District Block Cr Fe Mn Cu Zn As Pb U
mg/l
799 Shahjahanpur BHAWAL KHERA
0.001 0.486 0.056 -0.001 11.40
4 0.000 0.002 0.003
800 Shahjahanpur DADRAUL 0.000 1.344 0.102 -0.001 0.049 0.016 0.002 0.000
801 Shahjahanpur JAITIPUR 0.000 1.537 0.076 -0.001 0.207 0.011 0.001 0.000
802 Shahjahanpur JALALABAD 0.000 0.321 0.090 0.000 0.032 0.002 0.001 0.007
803 Shahjahanpur KALAN 0.000 5.914 0.209 -0.001 0.045 0.000 0.003 0.020
804 Shahjahanpur KANTH 0.000 1.138 0.217 0.000 0.039 0.003 0.000 0.001
805 Shahjahanpur KATRA 0.000 2.648 0.159 -0.001 0.085 0.002 0.003 0.006
806 Shahjahanpur KHUTAR 0.000 10.47
7 0.732 0.000 3.884 0.001 0.001 0.000
807 Shahjahanpur MADANAPUR 0.000 3.554 0.453 0.000 0.121 0.005 0.000 0.005
808 Shahjahanpur MIRZAPUR 0.000 0.208 0.007 0.000 0.051 0.001 0.000 0.034
809 Shahjahanpur NIGOHI 0.000 -0.024 0.102 -0.001 1.662 0.001 0.003 0.003
810 Shahjahanpur PUYAWAN 0.000 4.240 0.051 -0.001 0.143 0.000 0.000 0.002
811 Shahjahanpur SINDHAULI 0.002 0.517 0.367 0.005 0.690 0.000 0.001 0.005
812 Shahjahanpur TILHAR 0.000 1.818 0.143 0.000 0.324 0.004 0.001 0.001
813 Shrawasti Jamunaha H.Q. 0.000 5.090 0.288 0.006 0.046 0.004 0.001 0.001
814 Shrawasti Hariharpur Rani H.Q.
0.000 1.343 0.148 -0.001 1.711 0.006 0.001 0.001
815 Shrawasti Sirsiya H.Q. 0.000 7.696 0.248 -0.001 1.023 0.001 0.001 0.007
816 Shrawasti Ikauna H.Q. 0.000 5.392 0.145 -0.001 0.210 0.001 0.002 0.000
817 Shrawasti Gilaula H.Q. 0.000 0.524 0.110 -0.001 0.185 0.001 0.001 0.001
818 Siddharth Nagar
Bhanwapur H.Q.
0.000 0.989 0.116 -0.001 0.488 0.008 0.003 0.000

Annexure-III
341
S. No. District Block Cr Fe Mn Cu Zn As Pb U
mg/l
819 Siddharth Nagar
Dumariyaganj H.Q.
0.000 0.071 0.366 0.000 1.131 0.000 0.002 0.003
820 Siddharth Nagar
Itwa H.Q. 0.000 2.804 0.222 -0.001 0.620 0.003 0.001 0.002
821 Siddharth Nagar
Badhni H.Q. 0.000 2.842 0.065 -0.001 4.719 0.024 0.004 0.000
822 Siddharth Nagar
Shohratgarh H.Q.
0.000 0.655 0.096 -0.001 1.995 0.000 0.002 0.000
823 Siddharth Nagar
Naugarh H.Q. 0.000 0.533 0.333 -0.001 0.121 0.000 0.001 0.013
824 Siddharth Nagar
Lotan H.Q. 0.000 4.774 0.124 -0.001 0.805 0.001 0.001 0.004
825 Siddharth Nagar
Uska bazar H.Q.
0.000 2.752 0.123 -0.002 0.568 0.005 0.001 0.000
826 Siddharth Nagar
Birdpur H.Q. 0.000 0.063 0.164 0.000 0.583 0.000 0.000 0.003
827 Siddharth Nagar
Jogiya H.Q. 0.000 3.239 0.185 -0.002 1.717 0.013 0.001 0.000
828 Siddharth Nagar
Khuniyaw H.Q. 0.000 0.660 0.082 -0.001 0.318 0.003 0.000 0.001
829 Siddharth Nagar
Mithawal H.Q. 0.000 0.102 0.031 -0.001 1.604 0.000 0.001 0.001
830 Siddharth Nagar
Bansi H.Q. 0.000 10.18
4 0.339 -0.002 0.422 0.003 0.000 0.001
831 Siddharth Nagar
Khesraha H.Q. 0.000 4.430 0.185 -0.002 0.685 0.003 0.000 0.001
832 Sitapur Mahmudabad 0.000 0.841 0.047 -0.010 0.324 0.002 0.000 0.001
833 Sitapur Rampur Mathura
0.000 0.750 0.056 -0.010 0.172 0.010 0.001 0.000

Annexure-III
342
S. No. District Block Cr Fe Mn Cu Zn As Pb U
mg/l
834 Sitapur Rewsa 0.000 2.550 0.173 -0.010 0.163 0.001 0.000 0.000
835 Sitapur Behta 0.000 1.866 0.182 -0.010 0.659 0.002 0.001 0.000
836 Sitapur Sakran 0.000 0.881 0.045 -0.010 0.146 0.007 0.001 0.000
837 Sitapur Biswan 0.000 0.217 0.054 -0.010 0.421 0.000 0.001 0.002
838 Sitapur Pahala 0.000 0.376 0.131 -0.010 0.200 0.003 0.001 0.001
839 Sitapur Sidhauli 0.000 0.227 0.203 -0.009 0.384 0.001 0.001 0.006
840 Sitapur Gondlamau 0.000 2.218 0.039 -0.010 0.087 0.000 0.001 0.011
841 Sitapur Machhreta 0.000 0.254 0.018 -0.009 0.285 0.000 0.001 0.003
842 Sitapur Misrikh 0.000 4.882 0.108 -0.010 0.130 0.000 0.000 0.003
843 Sitapur Pisawan 0.000 0.251 0.025 -0.007 0.817 0.000 0.000 0.003
844 Sitapur Mohol 0.000 0.832 0.045 -0.010 0.905 0.001 0.001 0.005
845 Sitapur Aliya 0.000 0.239 0.033 -0.010 0.346 0.000 0.001 0.005
846 Sitapur Hargaon 0.000 0.254 0.012 -0.007 0.315 0.000 0.000 0.002
847 Sitapur Laharpur -
0.001 1.973 0.175 -0.012 0.168 0.003 0.000 0.000
848 Sitapur Khairabad -
0.001 2.432 0.050 -0.009 0.131 0.000 0.001 0.002
849 Sitapur Parsendi 0.000 0.540 0.086 -0.011 0.346 0.003 0.000 0.003
850 Sitapur Kasmanda -
0.001 2.539 0.028 -0.012 0.158 0.001 0.001 0.001
851 Sonbhadra Babhani 0.000 0.334 0.029 0.011 0.158 0.000 0.001 0.004
852 Sonbhadra Chatara -
0.001 0.181 0.005 0.001 0.464 0.000 0.000 0.003
853 Sonbhadra Chopan -
0.001 1.251 0.218 0.003 2.877 0.000 0.001 0.001

Annexure-III
343
S. No. District Block Cr Fe Mn Cu Zn As Pb U
mg/l
854 Sonbhadra Dudhi -
0.001 0.001 0.008 0.010 0.367 0.000 0.001 0.005
855 Sonbhadra Ghorwal -
0.001 0.128 0.014 0.000 0.637 0.000 0.001 0.006
856 Sonbhadra Myorpur -
0.001 21.70
5 0.471 -0.001 0.405 0.000 0.001 0.002
857 Sonbhadra Nagawa -
0.001 3.689 0.114 -0.001 0.358 0.000 0.000 0.000
858 Sonbhadra Robertsganj -
0.001 1.643 0.036 -0.002 8.007 0.000 0.001 0.003
859 Sultanpur Sultanpur 0.000 0.355 0.024 -0.002 0.029 0.000 0.000 0.008
860 Sultanpur Akhand Nagar 0.000 0.993 0.076 -0.002 0.605 0.000 0.000 0.006
861 Sultanpur Amethi 0.000 0.351 0.068 -0.002 0.171 0.000 0.000 0.033
862 Sultanpur Baldirai 0.000 0.303 0.034 -0.002 0.064 0.000 0.000 0.006
863 Sultanpur Bhadaiyau 0.000 0.153 0.016 0.001 0.482 0.000 0.000 0.008
864 Sultanpur Bhadar 0.000 0.600 0.132 -0.002 0.467 0.000 0.000 0.017
865 Sultanpur Bhetya 0.000 0.189 0.051 0.001 0.263 0.000 0.000 0.050
866 Sultanpur Dhanpatganj 0.000 0.085 0.018 0.002 0.247 0.000 0.001 0.017
867 Sultanpur Dostpur 0.000 0.263 0.006 -0.002 0.054 0.000 0.000 0.045
868 Sultanpur Dubeypur 0.000 0.201 0.084 0.002 0.085 0.001 0.001 0.012
869 Sultanpur Gauriganj 0.000 6.341 0.049 -0.002 0.038 0.000 0.000 0.036
870 Sultanpur Jagdishpur 0.000 0.267 0.365 0.011 0.667 0.000 0.000 0.014
871 Sultanpur Jagdishpur 0.000 0.304 0.152 -0.003 1.127 0.000 0.003 0.011
872 Sultanpur Jagdishpur 0.000 0.460 0.269 -0.002 0.051 0.000 0.000 0.017
873 Sultanpur Jaisinghpur 0.000 2.113 0.130 -0.003 0.725 0.000 0.001 0.027

Annexure-III
344
S. No. District Block Cr Fe Mn Cu Zn As Pb U
mg/l
874 Sultanpur Jamo 0.000 0.190 0.096 -0.001 0.252 0.000 0.001 0.015
875 Sultanpur Kadipur 0.001 0.896 0.086 0.004 0.184 0.000 0.001 0.006
876 Sultanpur Kurebhar 0.000 1.838 0.259 -0.002 0.609 0.002 0.000 0.006
877 Sultanpur Kurwar 0.000 0.449 0.057 -0.001 0.137 0.000 0.001 0.016
878 Sultanpur Lambhua 0.000 0.526 0.054 0.000 0.572 0.000 0.001 0.005
879 Sultanpur Motigarpur 0.000 0.081 0.138 -0.002 0.401 0.001 0.000 0.011
880 Sultanpur Musafir Khana 0.000 0.138 0.055 -0.001 0.117 0.001 0.000 0.056
881 Sultanpur P.P. kannaicha 0.000 0.216 0.012 -0.002 0.160 0.001 0.000 0.009
882 Sultanpur P.P. kannaicha 0.000 0.094 0.084 -0.002 3.793 0.000 0.001 0.007
883 Sultanpur P.P. kannaicha 0.000 0.271 0.012 -0.002 0.096 0.000 0.001 0.013
884 Sultanpur Sangrampur 0.000 1.103 0.017 -0.002 0.048 0.000 0.000 0.034
885 Sultanpur Shahgarh 0.000 0.233 0.082 -0.002 0.091 0.000 0.000 0.015
886 Sultanpur Shukul Bazar 0.000 0.090 0.004 0.002 0.503 0.000 0.001 0.005
887 Unnao Auras 0.000 0.849 0.039 -0.010 -0.002 0.000 0.001 0.009
888 Unnao Ganj Moradabad
0.001 0.305 0.002 -0.010 0.020 0.001 0.001 0.005
889 Unnao Bangarmau 0.000 0.080 0.252 -0.007 0.499 0.000 0.000 0.006
890 Unnao Fatehpur Chaurasi
0.000 0.040 0.012 -0.009 0.495 0.002 0.002 0.002
891 Unnao Safipur 0.000 0.133 0.018 -0.010 0.126 0.000 0.001 0.011
892 Unnao Hasanganj 0.000 1.978 0.017 -0.010 0.043 0.000 0.001 0.009
893 Unnao Miyanganj 0.000 0.511 0.022 -0.010 0.049 0.000 0.000 0.010
894 Unnao Asoha 0.000 1.221 0.091 -0.010 0.888 0.000 0.000 0.018

Annexure-III
345
S. No. District Block Cr Fe Mn Cu Zn As Pb U
mg/l
895 Unnao Nawabganj 0.000 0.695 0.127 -0.010 0.251 0.000 0.000 0.040
896 Unnao Bichhiya 0.000 4.724 0.050 -0.009 0.078 0.000 0.001 0.015
897 Unnao Purwa 0.000 0.177 0.007 -0.006 0.147 0.000 0.001 0.009
898 Unnao Hilauli 0.000 8.843 0.129 -0.010 0.663 0.000 0.000 0.005
899 Unnao Sumerpur 0.000 0.125 0.005 -0.009 0.199 0.001 0.001 0.030
900 Unnao Bighapur 0.000 0.153 0.039 -0.010 0.315 0.000 0.000 0.012
901 Unnao Sikandarpur Karan
0.000 0.503 0.074 -0.010 1.600 0.000 0.001 0.009
902 Unnao Sikandarpur Sarausi
0.000 0.184 0.019 -0.010 0.095 0.000 0.000 0.022
903 Unnao Nawabganj -
0.001 0.060 0.003 -0.012 0.088 0.002 0.000 0.015
904 Unnao Nawabganj -
0.001 0.060 0.015 -0.008 0.397 0.000 0.000 0.004
905 Unnao Nawabganj -
0.001 0.116 0.019 -0.011 0.096 0.001 0.000 0.012
906 Varanasi Arajiline -
0.001 0.483 0.066 -0.002 0.261 0.001 0.000 0.011
907 Varanasi Baragaon -
0.001 0.270 0.105 0.001 0.897 0.000 0.000 0.019
908 Varanasi Chiraigaon -
0.001 1.650 0.026 -0.001 1.107 0.000 0.000 0.005
909 Varanasi Cholapur -
0.001 0.346 0.021 -0.002 0.282 0.000 0.001 0.011

Annexure-III
346
S. No. District Block Cr Fe Mn Cu Zn As Pb U
mg/l
910 Varanasi Harhuwa -
0.001 0.005 0.003 0.000 0.423 0.000 0.001 0.006
911 Varanasi Kashi Vidya Peeth
0.000 0.099 0.000 -0.001 0.062 0.000 0.000 0.042
912 Varanasi Pindra 0.003 0.001 -0.002 -0.001 0.026 0.000 0.001 0.011
913 Varanasi Sewapuri -
0.001 0.675 0.013 -0.001 0.195 0.000 0.001 0.008