Greying Italy - UNECE Statswiki
23
Greying Italy across Time, Space and Gender by Luciana Quattrociocchi Daria Squillante Mauro Tibaldi INTERNATIONAL SEMINAR BRUSSELS 16-17 April 2015 Building an evidence base for active ageing policies: Active Ageing Index and its potential
-
Upload
khangminh22 -
Category
Documents
-
view
1 -
download
0
Transcript of Greying Italy - UNECE Statswiki

Greying Italy across
Time, Space and Gender
by
Luciana Quattrociocchi
Daria Squillante
Mauro Tibaldi INTERNATIONAL SEMINAR BRUSSELS 16-17 April 2015
Building an evidence base for active ageing policies: Active Ageing Index and its potential

GREYING ITALY \1: THE CONTEXT Italy is one of the countries most affected by aging:
On 1st January 2014, the Italian resident population was 60.782.668, but an analysis of
the age structure of the population shows that:
33,0% is aged 55 years or over;
21,4% is aged 65 years or over;
10,7% is aged 75 years or over.
AGING INDEX
TOTAL FERTILITY
RATE
LIFE EXPECTANCY AT BIRTH
MALE FEMALE
Nevertheless, the mere reference to
“age” can’t define the positivity or
negativity of the national social and
economic adjustement to aging.
On the one hand because in Italy the
way of “becoming” and the way of
“being” “older people” are strictly
tied to the territorial specificities,
and on the other hand because
although Italy is one of the countries
most affected by aging, the society
and policy makers have yet to
acquire full awareness of the
phenomenon, to improve active
ageing strategies.

All things considered, we have calculated the ACTIVE AGEING INDEX at the
regional level focusing:
- on methodological comparisons between indicators calculated at the European
level and indicators calculated for the Italian regions;
- on likely explainations of regional trends betweeen 2007 and 2012;
- on gender gaps.
GREYING ITALY \2: OUR GOALS
TEMPORAL PERSPECTIVE
GREYING ITALY
Methodological perspective
Spatial perspective
Gender perspective
Temporal perspective

The level of economic activity in 2013 is back to 2000
levels and GDP per capita to the values of 1996.
WHY AAI “ACROSS TIME”?
The intense and prolonged contraction of the
economy has led to a number of effects on the
population not only limited to the economic
sphere.
A “time perspective” is highly recommended to
analyze the trend of the AAI.
Since 2007, the financial crisis has spread by
contagion from the States to the major part of
countries and has also invested Italy.
With the credit crunch and lack of liquidity the financial
crisis has moved to the real sector.
In 2009, the decline in orders and production has
resulted in the collapse of GDP. The growth rates of
GDP from 2011 to 2013 were always lower not only
than those of 2010 but clearly lower than the
values recorded in the decade before the crisis.
Imported from abroad, the crisis in Italy has now
manifested as particularly intense. The decrease in
the value of GDP between 2008 and 2009 was
greater than in the rest of Western economies and
the short-term recovery in 2010 less consistent than in
other economies of the more developed countries.

WHY AAI “ACROSS SPACE”?
Since the 70's and with an accelerated
regulatory intervention at the beginning of the
Millennium, the gradual process of
administrative decentralisation has been
redesigning the distribution of
competences among the Central
Government, the Regions and the Municipalities.
Therefore, the social, political,
economic programming is now
shared by three different political and
administrative subjects, which have to
cooperate, as far as their specific levels
of competences and resources are
concerned, to define and to adopt
strategic and operational programming
aimed at improving the wellbeing of older people.
Source: ISTAT, EU-SILC
ABSOLUTE POVERTY (2007-2012) (%)
Since is foundation, Italy has been
crossed by pronounced disparities and a
chronic and inveterate socio-economic
tripartion in a northern and more developed
macroareas, a central part and a less
developed Southern part, still persists, also
in spite of a welfare system model, which
has an all-ecompassing vocation.
PEOPLE WHO LIVE IN FAMILIES WITH SEVERE DEPRIVATIONS (2007-2013) (%)

Methodological Concerns about the AAI at the regional level
To make the data comparable on the European level, the international working Group opted to calculate indicators exploiting harmonized sources on the European level. These sources, however, do not allow to calculate the indicators at the regional level. Therefore, to be able to calculate all the indicators in each domain previously and then the overall indicator, it has been necessary, in certain cases, to rely on national and official sources, eventhough the adoption of alternative sources to those harmonized on the European level could determine different results.
Data have been collected and calculated by the Italian National Institute of Statistics (ISTAT).
Domain 1 – Employment \ 1
To analyse the first domain at the regional level we have used the LFS, which
allows comparisons at the European level as well.
AAI INDICATOR
SOURCE FOR CALCULATING THE INDICATOR AT THE REGIONAL LEVEL
SAMPLE SIZE
METHODOLOGICAL DIFFERENCES FOR CALCULATING THE AAI AT THE REGIONAL
LEVEL DUE TO DATA NOT COMPLYING WITH AAI SPECIFICATIONS
YEAR OF REFERENCE
OF DATA FOR CALCULATING INDICATORS
REASON FOR USING YEARS DIFFERENT FROM THOSE OF REFERENCE FOR
CALCULATING THE AAI AT THE REGIONAL LEVEL
TIME REFERENCE
CONSTRUCTION/DEFINITION OF THE INDICATOR
2007 2012
EMPLOYMENT
1.1 Employment rate for the age group 55-59
"Labour force survey"
Every year, a sample of more than 250,000 families residing in Italy (for a total of about 600,000 individuals), distributed in approximately 1,600 Italian municipalities, is interviewed.
2007 2012
1.2 Employment rate for the age group 60-64
" Labour force survey"
2007 2012
1.3 Employment rate for the age group 65-69
" Labour force survey"
2007 2012
1.4 Employment rate for the age group 70-74
" Labour force survey"
2007 2012
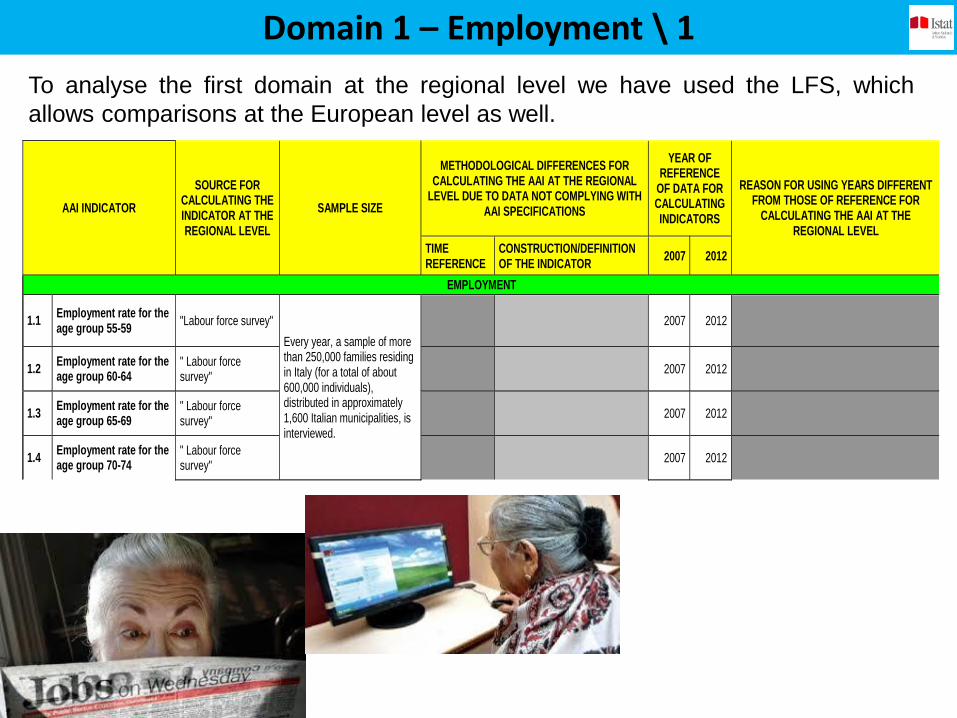
In 2007, the general index ranges from a minimum
of 16.7 points in Puglia to a maximum of 24.9 points
in Bolzano – respectively the last- and first-ranked
regions.
The presence of some regions in the north – an area
economically more developed and with a high total
employment rate – at the bottom of the rankings
(Piedmont, Friuli-Venezia Giulia, Veneto) is explained
by the early entries into the working world, and
thus by working careers that often end before 60
years of age.
Domain 1 – Employment \ 2
1.1
Employment
rate 55-59
1.2
Employment
rate 60-64
1.3
Employment
rate 65-69
1.4
Employment
rate 70-74
Index Rank
Nr. Region LFS-2007 LFS-2007 LFS-2007 LFS-2007 Value Rank
1 Piemonte 43,1 13,7 7,0 3,7 16,9 21
2 Valle D'Aosta 50,2 17,7 7,7 2,3 19,5 9
3 Lombardia 42,1 19,5 8,3 3,4 18,3 14
4 Bolzano 54,7 24,1 13,8 7,1 24,9 1
5 Trento 44,7 16,9 7,2 3,9 18,2 15
6 Veneto 45,0 15,4 8,0 3,5 18,0 16
7 Friuli-Venezia Giulia 42,5 16,3 6,7 3,5 17,2 19
8 Liguria 48,0 21,9 7,9 3,5 20,3 7
9 Emilia-Romagna 53,4 21,3 9,9 4,9 22,4 2
10 Toscana 49,6 20,0 9,1 4,5 20,8 5
11 Umbria 49,1 20,5 5,6 4,4 19,9 8
12 Marche 51,2 19,5 10,2 3,2 21,0 4
13 Lazio 51,0 22,8 8,2 3,0 21,2 3
14 Abruzzo 47,9 20,1 7,4 2,2 19,4 10
15 Molise 48,4 15,6 5,9 1,7 17,9 17
16 Campania 46,4 21,6 4,6 1,6 18,5 13
17 Puglia 42,4 18,4 4,3 1,8 16,7 22
18 Basilicata 50,5 23,7 5,5 2,4 20,5 6
19 Calabria 48,8 22,2 4,4 1,0 19,1 11
20 Sicilia 43,2 19,9 5,0 1,2 17,3 18
21 Sardegna 41,8 18,5 5,0 3,6 17,2 20
22 ITALY 46,1 19,4 7,3 3,1 19,0 12
Employment (TOTAL)
Total employment. Year 2007
1.1
Employment
rate 55-59
1.2
Employment
rate 60-64
1.3
Employment
rate 65-69
1.4
Employment
rate 70-74
Index Rank
Nr. Region LFS-2012 LFS-2012 LFS-2012 LFS-2012 Value Rank
1 Piemonte 59,1 19,0 7,1 3,7 22,3 16
2 Valle D'Aosta 60,3 22,1 9,7 3,9 24,0 10
3 Lombardia 60,0 20,8 7,5 3,5 22,9 14
4 Bolzano 68,2 29,8 14,9 7,0 30,0 1
5 Trento 64,8 20,3 9,6 4,2 24,7 6
6 Veneto 60,5 24,5 7,8 4,7 24,4 8
7 Friuli-Venezia Giulia 61,3 19,2 9,5 2,6 23,1 11
8 Liguria 64,2 24,1 11,4 5,8 26,4 4
9 Emilia-Romagna 67,1 23,0 10,4 5,3 26,4 3
10 Toscana 64,8 25,3 9,9 4,8 26,2 5
11 Umbria 61,6 23,1 8,5 3,9 24,3 9
12 Marche 64,3 23,6 14,9 4,6 26,9 2
13 Lazio 60,8 26,1 8,2 2,7 24,4 7
14 Abruzzo 57,9 23,0 7,7 3,8 23,1 12
15 Molise 57,0 23,7 5,1 2,3 22,0 17
16 Campania 48,1 24,2 6,0 1,4 19,9 20
17 Puglia 45,7 19,8 6,6 2,3 18,6 22
18 Basilicata 56,0 25,4 6,8 2,3 22,6 15
19 Calabria 51,5 23,7 5,8 2,4 20,9 19
20 Sicilia 47,4 22,6 5,8 2,6 19,6 21
21 Sardegna 56,6 22,3 5,9 2,7 21,9 18
22 ITALY 57,7 22,8 8,0 3,5 23,0 13
Employment (TOTAL)
Total employment. Year 2012
A comparison with 2012 shows considerable
improvements, above all in the indicator “up to
64 years of age”: in five years, the value of the
general index has risen from 19.0 to 23.0.
This result may be ascribed to the double effect of:
- the over replacements of different cohorts from
2007 and 2012
- the social security reforms introduced in our
country.
Nevertheless, only the northern regions are
improving their standing.

Domain 1 – Employment \ 3
Gender Gap 2007
-18,0
-15,0
-12,0
-9,0
-6,0
-3,0
0,0
Vall
e D
'Ao
sta
Um
bria
Pie
mo
nte
Friu
li-V
en
ezia
Giu
lia
Lig
uria
Tren
to
March
e
To
scan
a
Cala
bria
Ab
ru
zzo
Mo
lise
Lo
mb
ard
ia
ITA
LY
Ven
eto
Em
ilia
-Ro
mag
na
Bo
lzan
o
Lazio
Basil
icata
Sard
eg
na
Sic
ilia
Pu
gli
a
Cam
pan
ia
Gender Gap 2012
-18,0
-15,0
-12,0
-9,0
-6,0
-3,0
0,0
Vall
e D
'Ao
sta
Lig
uri
a
Pie
mo
nte
Fri
uli
-Ven
ezia
Giu
lia
Um
bri
a
Marc
he
Sard
eg
na
Em
ilia
-Ro
mag
na
Bo
lzan
o
To
scan
a
Lazio
Tre
nto
Lo
mb
ard
ia
ITA
LY
Cala
bri
a
Mo
lise
Ven
eto
Sic
ilia
Cam
pan
ia
Basil
icata
Ab
ruzzo
Pu
gli
a
-1.1 percentage points from 2007,
but the gender gap still remains
unfavourable to women.
The gaps range from a minimum of
7.7 percentage points in Val d’Aosta
to 16.5 points in Puglia.
Gaps remain larger in Southern
Italy: all the regions in this area,
except for Sardinia, have recorded
values higher than the national
average.
Veneto, on the other hand, is the only
northern region not to show a level
higher than the national figure.
2007
2012
Analysis by gender highlights
major gaps, with women lagging
up to 14.2 percentage points
behind.
These gaps, which are larger in
Southern Italy, range from a
minimum of 7.7 percentage points
in Val d’Aosta to 16.8 in
Campania.

Domain 2 - Participation in society \ 1
In this domain
some
methodological
differences
characterise
the
measurement
of the AAI
indicators.
Data come from
two sample
surveys:
“Aspects of
Daily Life”
“Family and
social
subjects.”
For both surveys, in
fact, the sample
design allows
regional-level
estimates.

Domain 2 - Participation in society \ 2 2.1 Voluntary
activities
2.2 Care to children,
grandchildren
2.3 Care to older
adults
2.4 Political
participationIndex Rank
Nr. Region AVQ2007 FSS2003 FSS2003 AVQ2008
1 Piemonte 8,9 10,8 4,4 19,3 10,1 8
2 Valle D'Aosta 10,4 7,4 4,2 22,3 10,2 7
3 Lombardia 11,6 11,9 5,3 18,5 11,2 5
4 Bolzano 15,5 13 2,0 40,5 15,8 2
5 Trento 18,7 14 5,8 32,2 16,4 1
6 Veneto 12,3 12,3 5,2 23,1 12,3 3
7 Friuli-Venezia Giulia 9,1 11,7 6,2 22,1 11,5 4
8 Liguria 6,0 8,6 5,0 15,4 8,2 13
9 Emilia-Romagna 10,7 10,6 5,3 20,3 11,0 6
10 Toscana 9,7 11 4,2 15,6 9,6 9
11 Umbria 5,1 8,7 5,2 18,9 8,8 12
12 Marche 6,8 9,2 3,8 13,8 7,9 14
13 Lazio 4,2 7,6 4,0 16,9 7,5 15
14 Abruzzo 3,5 8,1 3,8 13,5 6,7 17
15 Molise 3,5 5,3 2,0 10,7 4,9 22
16 Campania 3,9 6,9 4,0 9,8 5,9 20
17 Puglia 3,9 6,1 2,6 13,1 5,9 19
18 Basilicata 4,3 7,7 3,5 17,2 7,5 16
19 Calabria 2,7 4,2 2,5 12,7 5,0 21
20 Sicilia 3,7 6,6 3,6 12,9 6,2 18
21 Sardegna 8,6 10,4 4,0 16,3 9,2 10
22 ITALY 7,8 9,4 4,4 16,9 9,0 11
Participation in society
(TOTAL) Indicators are highly affected by the
institutional and territorial settings,
marking their limits and opportunities.
Clearly prominent, in fact, is the
phenomenon of “local polarization,” typical
of our country.
There thus emerges a country divided
into three areas: the northern regions
lead the rankings with high levels of
participation, the regions of central Italy
and Sardinia are in the middle segment,
and the southern regions are bringing up
the rear.
Participation in Society. Year 2007
All the indicators on informal care networks show a north-
south slope.
In general, they are most likely affected by the mutual
influence of labour market dynamics and local welfare
systems. For example, in the case of childcare, it is to be kept in
mind that the regions of central/northern Italy are those where
there is the greatest number of couples with minors in which both
parents work. This element, combined with the dearth of services
on the territory for children up to two years of age, may be an
additional element that requires, to a greater degree, the activation
of and reliance upon care networks.

Domain 2 - Participation in society \ 3
2.1 Voluntary
activities
2.2 Care to
children,
grandchildren
2.3 Care to older
adults
2.4 Political
participationIndex Rank
Nr. Region AVQ2012 FSS2009 FSS2009 AVQ2012
1 Piemonte 10,8 16,5 5,9 17,3 12,1 6
2 Valle D'Aosta 8,2 9,3 6,9 22,3 10,9 8
3 Lombardia 13,9 15,7 5,9 19,8 13,1 4
4 Bolzano 18,6 13,8 2,9 34,3 15,8 2
5 Trento 17,3 22,1 9,0 26,7 17,9 1
6 Veneto 11,8 15,5 8,2 21,8 13,6 3
7 Friuli-Venezia Giulia 9,9 14,2 7,1 20,7 12,3 5
8 Liguria 10,7 7,2 5,1 19,8 10,0 13
9 Emilia-Romagna 8,4 13,5 5,9 17,0 10,6 9
10 Toscana 9,6 12,3 4,6 17,2 10,3 10
11 Umbria 5,3 12,5 5,5 14,3 9,0 15
12 Marche 8,0 16,0 6,6 15,7 11,1 7
13 Lazio 6,0 12,2 5,3 16,9 9,5 14
14 Abruzzo 5,0 6,4 2,7 14,3 6,5 18
15 Molise 4,1 5,6 3,8 11,1 5,8 22
16 Campania 3,7 9,2 3,5 10,1 6,3 19
17 Puglia 4,5 10,4 3,2 13,5 7,4 16
18 Basilicata 5,2 7,7 3,6 13,5 7,0 17
19 Calabria 4,0 5,5 4,3 11,4 5,9 21
20 Sicilia 4,4 6,9 3,3 11,7 6,2 20
21 Sardegna 10,0 10,1 5,2 17,7 10,1 12
22 ITALY 8,7 12,3 5,2 16,7 10,2 11
Participation in society
(TOTAL)
On a national level, between 2007
and 2012 the domain’s trend showed
improvement, rising from 9 to 10.2.
The evolution of the rankings over time
shows some very interesting aspects.
It is noted that the improvement may
be ascribed to the positive trend in
three of the four indicators
considered: voluntary activities
(+1.4), care to children (+3.4) and
care to older adults and other adults
(+1.8), while political participation
held basically steady.
Care activities, both individual and
through organizations, show increases
greater than the average increase
recorded on the Italian level mainly in
the regions of northern and central Italy,
and only in a scant number of southern
regions.
Participation in Society. Year 2012

Domain 2 - Participation in society \ 4
Nevertheless, although older
women maintain the role as
main caregivers, men are
increasing their commitment more
than in the past, gaining a few
points of ground.
In the case of informal care
networks, between the two years
older men have recorded greater
participation in activities of care
to children and adults by (+3.5
and +1.4), reducing the gender
gap.
«Informal care» seems to be
the only sphere women
prevail in.

Domain 3 - Independent, healthy and secure living \ 1

Domain 3 - Independent, healthy and secure living \ 2 3.1 Physical
exercise
3.2 No unmet
needs of
health and
dental care
3.3
Independent
living
arrangements
3.4 Relative
median
income
3.5 No poverty
risk
3.6 No
material
deprivation
3.7 Physical
safety
3.8 Lifelong
learningIndex Rank
Nr. Region AVQ2007 SILC2007 SILC2007 SILC2007 SILC2007 SILC2007 AVQ2009 LFS2007 Value Rank
1 Piemonte 44,5 89,1 79,6 76,7 90,7 94,5 42,1 1,5 68,7 7
2 Valle D'Aosta 46,0 95,5 82,8 77,0 91,8 99,2 23,9 0,5 77,2 1
3 Lombardia 42,5 89,1 79,0 79,0 90,0 97,8 47,4 1,8 69,5 5
4 Bolzano 68,6 91,8 69,6 78,9 90,8 96,9 19,2 1,5 67,9 10
5 Trento 63,1 92,8 81,8 81,3 89,5 100,0 20,6 3,2 70,7 3
6 Veneto 52,3 89,8 71,6 74,6 87,6 96,5 44,0 2,3 68,0 9
7 Friuli-Venezia Giulia 42,2 93,0 75,6 77,7 92,3 98,7 26,3 2,4 67,7 12
8 Liguria 28,4 90,8 77,8 84,4 91,7 97,6 36,9 2,3 67,9 11
9 Emilia-Romagna 45,0 90,3 69,0 78,1 94,2 98,7 45,0 1,5 68,1 8
10 Toscana 41,7 89,6 74,7 78,1 92,4 96,4 41,7 1,5 71,0 2
11 Umbria 33,1 91,9 68,8 84,7 92,9 98,1 34,9 2,1 66,7 15
12 Marche 30,7 89,6 72,2 82,1 93,1 97,3 35,3 1,1 66,3 16
13 Lazio 31,0 87,1 71,6 89,9 87,8 92,2 51,9 2,0 68,9 6
14 Abruzzo 26,4 86,8 72,2 81,6 83,4 95,3 35,7 0,9 67,3 13
15 Molise 24,6 88,5 75,6 79,5 78,5 91,1 25,3 0,9 62,8 21
16 Campania 18,9 81,8 62,3 109,2 82,1 87,3 56,4 0,8 65,2 17
17 Puglia 18,4 77,0 75,3 100,1 85,4 86,9 46,7 0,9 64,3 18
18 Basilicata 22,9 74,7 76,0 81,5 81,8 93,3 23,0 1,1 60,5 22
19 Calabria 19,2 79,8 70,6 111,7 82,3 85,4 36,4 0,8 63,7 19
20 Sicilia 17,0 74,2 78,5 100,9 75,7 84,3 49,2 0,5 63,3 20
21 Sardegna 34,7 81,6 56,8 109,5 91,3 91,6 28,8 1,8 70,3 4
22 ITALY 35,0 86,2 73,5 85,8 87,9 93,7 44,0 1,5 66,7 15
Independent, healthy and
secure living (TOTAL)
Total independent, healthy and secure living. Year 2007 AND 2012
3.1 Physical
exercise
3.2 No unmet
needs of
health and
dental care
3.3
Independent
living
arrangements
3.4 Relative
median income
3.5 No
poverty risk
3.6 No
material
deprivation
3.7 Physical
safety
3.8 Lifelong
learningIndex Rank
Nr. Region AVQ2012 SILC-2012 SILC-2012 SILC-2012 SILC-2012 SILC-2012 AVQ2012 LFS-2012
1 Piemonte 43,9 81,2 79,4 90,9 94,9 89,8 39,9 2,9 68,3 12
2 Valle D'Aosta 41,1 96,6 88,1 84,2 97,8 96,9 20,9 2,6 78,9 1
3 Lombardia 44,0 87,7 79,5 82,8 95,8 90,1 48,0 2,6 69,8 7
4 Bolzano 65,8 91,1 74,4 91,8 92,2 95,4 22,2 3,1 70,1 4
5 Trento 65,4 86,3 76,2 84,5 90,2 93,5 20,8 4,3 68,4 11
6 Veneto 53,1 89,3 73,2 86,1 96,0 97,9 48,2 2,7 70,9 3
7 Friuli-Venezia Giulia 44,8 76,0 71,3 84,4 95,4 91,8 32,8 3,4 64,7 19
8 Liguria 40,7 84,1 81,9 94,2 94,3 92,4 35,1 3,1 69,2 10
9 Emilia-Romagna 45,4 87,7 75,6 88,0 98,6 95,7 41,8 2,7 69,9 6
10 Toscana 40,4 84,8 66,6 90,3 96,0 92,5 43,2 2,9 69,4 9
11 Umbria 34,8 89,7 72,5 98,5 95,1 93,5 46,5 2,5 69,5 8
12 Marche 42,1 80,4 69,0 96,6 95,5 88,0 39,8 3,4 66,4 15
13 Lazio 33,6 85,0 74,3 95,1 91,0 88,0 50,3 2,7 69,9 5
14 Abruzzo 25,6 74,1 71,7 88,4 91,0 92,9 38,6 1,5 65,7 16
15 Molise 22,3 83,4 85,4 98,3 89,4 87,7 30,2 1,2 66,7 14
16 Campania 16,7 80,3 67,6 111,5 88,0 76,9 55,5 1,0 65,6 17
17 Puglia 20,2 63,5 71,7 107,5 91,9 69,8 48,1 1,2 60,9 22
18 Basilicata 27,3 85,5 71,7 103,8 90,0 78,5 31,6 1,4 64,7 20
19 Calabria 23,8 73,9 75,3 112,1 93,5 84,9 38,7 0,7 65,2 18
20 Sicilia 16,3 81,4 75,8 108,9 79,5 64,1 47,6 1,0 63,2 21
21 Sardegna 32,6 75,6 72,2 99,3 94,2 94,1 37,1 2,4 72,5 2
22 ITALY 36,1 82,6 74,5 94,8 93,0 87,0 44,8 2,3 67,2 14
Independent, healthy
and secure living
(TOTAL)
In general, the centre-north regions
are ranked higher.
The indicators on economic
conditions confirm the situation of
greater disadvantage in the
southern regions.
2007
2012
After five years, there has been
minimal progress.
But the two indicators referring to
economic conditions and poverty
risk have improved considerably,
in spite of the economic crisis.
Two factors have contributed to this
result: the greater maintenance of
employment levels by mature
workers, and the possibility for older
persons to be able to count on
pension income.
In spite of this, the conditions of
material deprivation have worsened.

2007
2012
Domain 3 - Independent, healthy and secure living \ 3
The nationwide gender gap shows
women lagging by one percentage
point, ranging from -6.9 percentage
points in Lombardy to +4.2 points in
Veneto, with no major local features.
Gaps remain larger in territorial
terms than for gender, with
Sardinia charging to second
place in both rankings.
The nationwide gender gap has
risen slightly to 1.6 percentage
points unfavourable to women,
ranging from -5.7 percentage
points in Campania to +2.4 points
in Valle d’Aosta.
2007

Domain 4 - Capacity for active ageing \ 1
2007 4.1 RLE
achievement of 50
years at age 55
4.2 Share of
healthy life years
in the RLE at age
55
4.3 Mental well-
being4.4 Use of ICT
4.5 Social
connectedness
4.6 Educational
attainmentIndex Rank
Nr. Region AVQ2007 AVQ2007 AVQ2010 AVQ2008 AVQ2007 LFS2007
1 Piemonte 56,4 35,0 43,1 13,9 77,7 25,6 47,1 11
2 Valle D'Aosta 55,8 36,1 48,6 14,7 83,7 23,4 48,8 5
3 Lombardia 56,9 36,9 49,3 16,3 74,5 28,9 48,7 6
4 Bolzano 58,1 49,9 62,4 18,3 77,3 21,5 54,4 2
5 Trento 57,8 54,2 62,2 11,8 80,5 29,1 55,7 1
6 Veneto 57,3 34,7 46,8 13,3 77,4 22,8 49,5 3
7 Friuli-Venezia Giulia 56,7 38,8 44,4 18,0 77,9 28,7 48,8 4
8 Liguria 56,6 36,8 40,9 14,1 74,7 32,6 47,3 10
9 Emilia-Romagna 57,5 34,4 45,6 16,6 80,2 26,5 48,3 7
10 Toscana 57,4 38,8 39,2 13,1 77,8 25,5 47,7 9
11 Umbria 57,6 34,7 35,4 14,1 81,0 28,6 48,1 8
12 Marche 58,5 33,4 35,3 10,9 76,4 25,4 45,8 13
13 Lazio 56,2 31,2 34,9 19,1 72,9 36,1 41,0 19
14 Abruzzo 56,9 28,3 37,0 12,5 76,5 26,5 44,5 16
15 Molise 57,2 28,7 40,3 8,9 81,4 24,1 45,5 14
16 Campania 53,6 26,1 26,3 8,8 79,2 23,5 35,2 22
17 Puglia 56,4 19,3 30,1 9,1 73,8 21,4 40,2 21
18 Basilicata 56,2 25,4 34,6 13,0 81,6 20,8 43,6 17
19 Calabria 56,3 13,9 34,6 8,8 77,7 24,8 40,4 20
20 Sicilia 54,6 23,6 34,6 10,2 75,1 21,5 41,6 18
21 Sardegna 57,1 31,5 37,1 14,0 77,0 22,1 45,2 15
22 ITALY 56,5 31,9 39,9 13,7 76,6 26,4 45,8 12
Capacity and enabling
environment for active
ageing (TOTAL)
Domain 4 - Capacity for active ageing \ 2
Capacity for active ageing. Year 2007 AND 2012
4.1 RLE
achievement of 50
years at age 55
4.2 Share of
healthy life years in
the RLE at age 55
4.3 Mental well-
being4.4 Use of ICT
4.5 Social
connectedness
4.6 Educational
attainmentIndex Rank
Nr. Region AVQ2012 AVQ2012 AVQ2012 AVQ2012 AVQ2012 LFS 2012
1 Piemonte 57,5 37,6 37,8 29,3 74,2 33,2 48,3 11
2 Valle D'Aosta 57,9 42,8 41,9 33,4 80,1 32,9 51,4 4
3 Lombardia 58,0 41,8 38,5 29,4 71,7 35,3 49,4 7
4 Bolzano 58,9 47,8 62,0 29,4 81,1 32,1 56,0 1
5 Trento 60,0 52,9 43,5 28,5 78,8 37,3 54,5 2
6 Veneto 58,4 45,2 39,9 24,8 78,8 31,9 52,3 3
7 Friuli-Venezia Giulia 57,6 41,4 38,5 28,5 73,5 34,0 49,3 8
8 Liguria 57,5 41,7 32,3 34,9 78,5 42,4 49,9 6
9 Emilia-Romagna 58,5 46,5 37,5 28,1 75,5 36,0 50,9 5
10 Toscana 58,2 42,4 28,2 26,9 72,6 33,6 47,7 14
11 Umbria 58,6 33,7 33,7 23,9 76,7 40,3 48,0 12
12 Marche 59,2 33,6 33,2 22,7 75,4 33,6 46,9 16
13 Lazio 56,8 43,7 25,9 31,7 76,9 44,8 44,5 18
14 Abruzzo 58,0 38,3 35,6 22,3 80,4 36,5 48,8 9
15 Molise 58,3 42,3 28,1 18,5 79,0 32,8 47,9 13
16 Campania 54,9 35,5 18,9 16,9 76,4 31,3 38,0 22
17 Puglia 58,0 25,0 26,1 16,1 73,3 26,5 42,1 20
18 Basilicata 58,0 37,2 25,9 12,4 84,8 31,8 46,6 17
19 Calabria 57,2 15,6 28,3 17,6 78,4 32,3 41,2 21
20 Sicilia 55,8 29,9 26,7 17,0 77,5 28,9 43,4 19
21 Sardegna 58,0 41,7 34,9 23,0 75,9 30,1 48,5 10
22 ITALY 57,5 38,7 32,5 25,0 75,5 34,2 47,6 15
Capacity and enabling
environment for active
ageing (TOTAL)
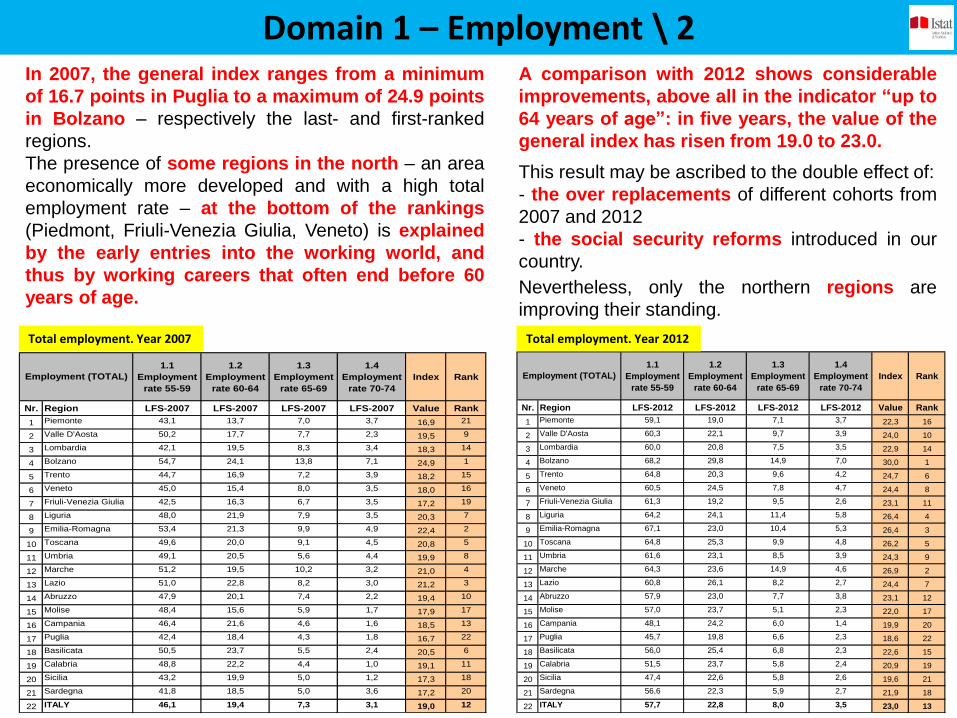
In 2007, the attainment of 105 years at the
Italian level is a hope with solid
foundations in reality for 56.5% of people.
The joint analysis of this indicator with that
regarding the number of healthy life years
that we may expect to live after 55 years of
age (equal to 31.9 years in the same year of
reference in Italy) describes the landscape of
the quantity and quality of “elderly life”.
But it is with regard to the second
indicator – years of life without limitations
after 55 – that the depth of the regional
gaps on Italian territory become clear in
all its dramatic nature.
Considered together, the domain indicators
trace a ranking on the map that starts from
the north, passes through central Italy and
heads southward
2012
In 2012, the total index for the fourth domain
of the AAI shows a 3.9% increase from the
2007 figure of 47.6, thanks above all to the
highly positive performance of three indicators:
Share of healthy life years in the remaining life
expectancy at age 55 (+21.3%); use of ICT
(+82.5%), and educational attainment (+29.6%)
2007
2012
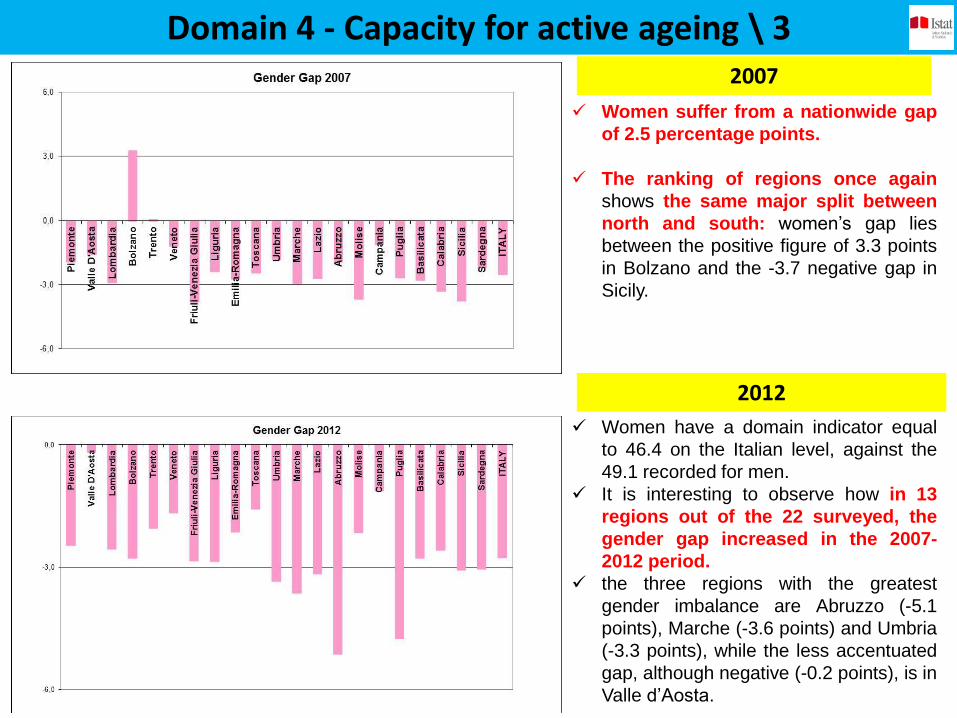
Domain 4 - Capacity for active ageing \ 3
Women have a domain indicator equal
to 46.4 on the Italian level, against the
49.1 recorded for men.
It is interesting to observe how in 13
regions out of the 22 surveyed, the
gender gap increased in the 2007-
2012 period.
the three regions with the greatest
gender imbalance are Abruzzo (-5.1
points), Marche (-3.6 points) and Umbria
(-3.3 points), while the less accentuated
gap, although negative (-0.2 points), is in
Valle d’Aosta.
Women suffer from a nationwide gap
of 2.5 percentage points.
The ranking of regions once again
shows the same major split between
north and south: women’s gap lies
between the positive figure of 3.3 points
in Bolzano and the -3.7 negative gap in
Sicily.

OVERALL INDEX \ 1 Total Overall index. Year 2007 and 2012
TOTAL
Nr. Region Emp Soc Liv Cap Value Rank
1 Piemonte 16,9 10,1 68,7 47,1 25,7 12
2 Valle D'Aosta 19,5 10,2 77,2 48,8 27,9 4
3 Lombardia 18,3 11,2 69,5 48,7 27,0 7
4 Bolzano 24,9 15,8 67,9 54,4 31,9 1
5 Trento 18,2 16,4 70,7 55,7 30,3 2
6 Veneto 18,0 12,3 68,0 49,5 27,3 5
7 Friuli-Venezia Giulia 17,2 11,5 67,7 48,8 26,6 8
8 Liguria 20,3 8,2 67,9 47,3 26,3 10
9 Emilia-Romagna 22,4 11,0 68,1 48,3 28,2 3
10 Toscana 20,8 9,6 71,0 47,7 27,3 6
11 Umbria 19,9 8,8 66,7 48,1 26,3 9
12 Marche 21,0 7,9 66,3 45,8 25,9 11
13 Lazio 21,2 7,5 68,9 41,0 25,2 15
14 Abruzzo 19,4 6,7 67,3 44,5 24,8 16
15 Molise 17,9 4,9 62,8 45,5 23,4 18
16 Campania 18,5 5,9 65,2 35,2 22,1 22
17 Puglia 16,7 5,9 64,3 40,2 22,4 21
18 Basilicata 20,5 7,5 60,5 43,6 24,6 17
19 Calabria 19,1 5,0 63,7 40,4 22,9 20
20 Sicilia 17,3 6,2 63,3 41,6 22,9 19
21 Sardegna 17,2 9,2 70,3 45,2 25,3 14
22 ITALY 19,0 9,0 66,7 45,8 25,6 13
Indices Total
Nr. Region Emp Soc Liv Cap Value Rank
1 Piemonte 22,3 12,1 68,3 48,3 28,5 11
2 Valle D'Aosta 24,0 10,9 78,9 51,4 30,4 4
3 Lombardia 22,9 13,1 69,8 49,4 29,5 7
4 Bolzano 30,0 15,8 70,1 56,0 34,3 1
5 Trento 24,7 17,9 68,4 54,5 32,7 2
6 Veneto 24,4 13,6 70,9 52,3 30,9 3
7 Friuli-Venezia Giulia 23,1 12,3 64,7 49,3 28,7 10
8 Liguria 26,4 10,0 69,2 49,9 29,6 6
9 Emilia-Romagna 26,4 10,6 69,9 50,9 30,2 5
10 Toscana 26,2 10,3 69,4 47,7 29,3 9
11 Umbria 24,3 9,0 69,5 48,0 28,2 12
12 Marche 26,9 11,1 66,4 46,9 29,3 8
13 Lazio 24,4 9,5 69,9 44,5 27,8 15
14 Abruzzo 23,1 6,5 65,7 48,8 26,7 16
15 Molise 22,0 5,8 66,7 47,9 26,0 18
16 Campania 19,9 6,3 65,6 38,0 23,3 22
17 Puglia 18,6 7,4 60,9 42,1 23,6 21
18 Basilicata 22,6 7,0 64,7 46,6 26,2 17
19 Calabria 20,9 5,9 65,2 41,2 24,1 19
20 Sicilia 19,6 6,2 63,2 43,4 24,0 20
21 Sardegna 21,9 10,1 72,5 48,5 28,2 13
22 ITALY 23,0 10,2 67,2 47,6 27,8 14
Indices
The summary indicator of Active Ageing saw
an 8.6% increase over the course of 2007-2012,
rising from 25.6 to 27.8.
Thanks to a positive trend for all the domains:
+20.0% percentage variation in the
“Employment” domain; +13.3% in the
“Participation in Society” domain; +0.7% in the
“Independent and secure living” domain; +3.9%
in the “Capacity for active ageing” domain.

OVERALL INDEX \ 2
Ranking by Sex. Years 2007 and 2012
Region Value Rank Region Value Rank
Bolzano 35,0 1 Bolzano 29,2 1
Trento 32,8 2 Trento 27,9 2
Emilia-Romagna 31,3 3 Valle D'Aosta 26,1 3
Molise 26,4 20 Sicilia 19,5 20
Calabria 25,8 21 Campania 18,8 21
Campania 25,7 22 Puglia 18,8 22
ITALY 28,9 11 ITALY 22,7 13
Men Women
Region Value Rank Region Value Rank
Bolzano 36,8 1 Bolzano 31,8 1
Trento 34,6 2 Trento 30,7 2
Veneto 34,1 3 Valle D'Aosta 29,0 3
Sicilia 27,5 20 Sicilia 21,0 20
Calabria 27,0 21 Campania 20,2 21
Campania 26,8 22 Puglia 19,9 22
ITALY 31,0 11 ITALY 24,6 15
Men Women
Compared with the gender gap, within
Italy, during the period of reference, the
condition of women, already
compromised in 2007 with a gender
gap equal to 6.2 percentage points,
worsened further, arriving at 6.5
percentage points in 2012.
Particularly critical is the gender gap in
Puglia (8 points), Abruzzo (8 points), and
Basilicata (7 points), while the more
contained levels are found in Valle d’Aosta
(2.9 points), Liguria (4 points), and Trento
(4 points).

A REGIONAL HARMONISED AAI?
Our country have to target broad margins of improvement in the future, and the AAI, with a regional perspective, might provide sound support to: - evaluate living conditions al the local
level; - find out gaps in specific areas; - monitoring the areas of intervention
and contribute to active ageing policies.
In conclusion, given the undisputed strategic importance of an analysis by sub-territories of reference particularly in countries like Italy where marked imbalances at the level of different geographical areas persist, there is a pressing need to rethink the harmonization of sources on the international level so they may guarantee data that can be used sub-nationally as well.

Thank You!