Maternal Olfaction Differentially Modulates Oxytocin and Prolactin Release during Suckling in Goats

1
Animal (2008), 2:12, 1818–1831 © The Animal Consortium 2008 doi:10.1017/S1751731108003224
Grazing behaviour and performance of lactating suckler cows, ewes and goats on partially improved heathlands
R. Celaya1, R. Benavides1, U. García1, L. M. M. Ferreira2, I. Ferre3, A. Martínez1, L. M. Ortega-Mora3 and K. Osoro1† 1Servicio Regional de Investigación y Desarrollo Agroalimentario (SERIDA), Apartado 13 – 33300, Villaviciosa, Asturias, Spain
2CECAV - Departamento de Zootecnia, Universidade de Trás-os-Montes e Alto Douro, PO Box 1013, 5000-911, Vila Real, Portugal
3SALUVET - Departamento de Sanidad Animal, Facultad de Veterinaria, Universidad Complutense de Madrid, Ciudad Universitaria s/n, 28040,
Madrid, Spain
Abstract The foraging behaviour (grazing time and diet composition), live-weight (LW) changes and parasitic infection (faecal egg counts of gastrointestinal nematodes) of 12 beef cows, 84 ewes and 84 goats suckling their offspring, managed in mixed grazing on heathlands with 24% of improved pasture of perennial ryegrass-white clover, were studied during the years 2003 and 2006. The results showed that goats tended to graze for a longer time, and utilised significantly more heathland vegetation than cattle and sheep, including in their diet an average of 0.39 herbaceous plants, 0.11 gorse and 0.51 heather over the grazing season, comparing with respective mean values of 0.85, 0.02 and 0.13 in cattle and sheep. Dietary overlap was higher between cattle and sheep (0.76) than between sheep and goats (0.53) or between cattle and goats (0.47). Despite the high performance of autumn-calving cows in spring, sheep had the best LW changes per livestock unit (LU) during the whole grazing season. Goats’ performance per LU was lower than in sheep but higher than in spring-calving cows. Regarding offspring production, lambs had higher LW gains per LU than calves and kids. Mean nematode eggs/g fresh faeces (epg) during the grazing season were higher in goats (91 epg) compared to sheep (34 epg) and cattle (14 epg), particularly from September to December. In conclusion, sheep performed best on these heathlands with improved pasture areas if the entire grazing season was considered, despite the good level of production in spring from autumn-calving cows. The results suggested the complementary use of goats in order to increase the effective utilisation of the available vegetation, achieving production levels similar to those from spring-calving cows. Therefore, mixed flocks of sheep and goats would be the most appropriate sustainable systems from the animal production and vegetation use points of view.
Keywords: domestic ruminants, marginal land, grazing, live weight, gastrointestinal nematode
Introduction Grazing animals are actually viewed as vegetation management tools for biodiversity benefits in many European regions. However, we should not forget their economic significance for the rural development in many marginal and less favoured areas (Rook et al., 2004). The establishment of sustainable grazing systems under any vegetation condition requires the understanding of animals’ grazing behaviour and their responses in animal performance and welfare, as well as their effects on vegetation dynamics. Many mountain areas of temperate regions are grazed by multispecies flocks of sheep, goats, cattle and even horses. Thus it is important to get knowledge on the performance of these animal species grazing under the same conditions (pasture availability, quality) which change across the grazing season as a consequence of the continuous grazing management, in addition to the changes in climatic conditions.
Significant differences in the grazing behaviour have been observed between animal species due to their different evolutionary morphophysiological adaptations (Hofmann, 1989). Body size influences the foraging strategy of ruminants as it determines nutrient requirements, mouth morphology, and intake and digestion capacity (Illius and Gordon, 1993), thus affecting their productive efficiency (Fitzhugh, 1978), which can also vary depending on the physiological status (lactating, dry, pregnant). A smaller body size implies higher energy requirements relative to their gut capacity than in larger animals. Therefore, small ruminants have to select higher quality foods, and are in general more selective than large herbivores such as cattle (Demment and Van Soest, 1985; Illius and Gordon, 1993). Those linked attributes have lead to a herbivores’ classification, in which cattle and sheep are considered as grazers, and goats as mixed feeders or predominantly browsers (Milne, 1994; Gordon, 2003).
Small ruminants, especially goats, are able to include high proportions of browse species such as heather (Erica spp) and gorse (Ulex spp) in their diets. Goats select gorse in different proportions during the year (Clark et al., 1982). In contrast, sheep graze mainly the new green shoots of gorse in spring, while cattle hardly select this shrub and only consume small proportions of heather species (Celaya et al., 2007b). In complex vegetation resources (i.e. grassland-shrubland), the selection of browse species by herbivores is greatly determined by the availability of preferred pasture. Both cattle and sheep increase the utilization of heathlands as the quantity (biomass, height) of better quality herbage decreases (Grant and Hodgson, 1986; Gordon, 1989), whereas goats browse on heathlands

2
even with high pasture availability (Radcliffe, 1986; Gordon, 1989).
In the context of mixed grazing, the levels of complementarity in grazing behaviour between domestic ruminant species will affect the productivity and sustainability of the systems, as a high dietary overlap between animal species means a high interspecific competition for the same plant resources (Wright and Connolly, 1995). Previous studies have set out the complementary levels between herbivores (Lechner-Doll et al., 1995; Aldezabal, 2001), showing a low complementarity between cattle and horses, intermediate between cattle and sheep, and high between cattle and goats. Nevertheless, these complementarity levels can change depending on the relative population densities and the available vegetation (Bullock, 1985).
It is widely accepted that the sward height that maximizes pasture intake differs between animal species. In perennial ryegrass (Lolium perenne)-white clover (Trifolium repens) pastures established in lowlands, ewes were able to maximize live-weight gains on pastures with 5-6 cm mean sward height (Osoro et al., 2002), while cattle needed at least 8 cm for similar vegetation conditions (Wright and Whyte, 1989; Osoro et al., 2000b), reducing the level of intake below their maintenance needs on shorter pastures. Goats also responded linearly to the reduction of sward height between 4 and 11 cm (Merchant and Riach, 1994). Previous studies (Maxwell et al., 1986; Osoro et al., 2007a) have already shown the limitation of heather-gorse communities located in marginal lands with poor soils to develop sustainable production systems with ruminants, supporting the need for incorporation of improved pasture areas with the purpose of increasing digestible dry matter intake and consequently to improve the animal performance and welfare.
Animal welfare is a very important aspect that should also be considered, since the low nutrient intake achieved in heathlands could facilitate parasitic diseases. Significant differences in gastrointestinal nematode infection between animal species, e.g. sheep and goats, have been observed (Hoste et al., 2008), affecting in a different way according to the grazing management and available vegetation components (Osoro et al., 2007b).
In this work the grazing behaviour, live-weight changes and gastrointestinal nematode infection of suckler beef cows, ewes and does grazing with their calves, lambs and kids during the spring-summer grazing season, and grazing alone in the autumn, after weaning at the end of summer, were recorded in a heathland vegetation area with 24% of the total available area converted to perennial ryegrass-white clover pasture. The objective was to study the interactions between grazing behaviour, animal performance and parasite infection of different animal species grazing together in a heathland incorporating improved pasture.
Material and methods Experimental site The experiment was conducted in years 2003 and 2006 on one plot of 22.3 ha located at 900-1000 m a.s.l. at the Carbayal Research Station, Sierra de San Isidro, Illano, western Asturias, NW Spain (43° 21’ N, 6° 53’ W). Annual rainfalls recorded at Carbayal (2002 to 2006) averaged 1557 mm, being more abundant from October to January. Mean temperature was 10.2 ºC with a maximum of 16.4 ºC in August and a minimum of 4.0 ºC in February.
A big plot was used to assess animal behaviour and performance in a more realistic way, i.e. managing livestock extensively as usually practised in the region, without disturbing the natural grazing behaviour by flock size. The natural vegetation covered 17 ha (76.2%) and it mostly consisted (67.8%) of short (less than 50 cm high) heather-gorse shrubland, dominated by heather species (Erica umbellata, E. cinerea, Calluna vulgaris) and gorse (Ulex gallii), a thorny and woody legume. Tall scrublands (up to 2 m high) dominated by Erica australis subsp. aragonensis and E. arborea were more sparsely present (7.8% of total plot area), as well as a small pinewood (0.5%) of Scots pine (Pinus sylvestris). The rest of the plot area (5.3 ha) was improved during 1999 by soil breakingup, dressing, and sowing of perennial ryegrass (Lolium perenne cv ‘Phoenix’), hybrid ryegrass (L. x hybridum cv ‘Dalita’) and white clover (Trifolium repens cv ‘Huia’), and reseeded again in 2002 with the same mixture. Previous experiences indicated that 33% of improved area allows satisfactory animal performances in these heathlands, at least in small ruminants (Osoro and Martínez, 1995).
Animals and management The grazing season extended from May to December of both 2003 and 2006. Adult animals were lactating females, with sheep and goats lambing and kiding at the beginning of the spring. Cows calving took place in autumn in year 2002 and early spring in year 2006. During each grazing season, six Asturiana de los Valles beef cows (532 ± 31.4 kg live weight (LW)), 42 Gallega and Lacha crossed ewes (43 ± 1.0 kg LW) and 42 Cashmere does (38 ± 1.1 kg LW) were managed together in a mixed herd under continuous grazing to have the same opportunities for diet selection, shelter, etc. As the equivalence established by the EU Common Agricultural Policy between cattle and small ruminants in our conditions is 1:7 (1 livestock unit (LU) = 1 cow = 7 ewes = 7 goats), such a ratio was chosen to maintain a theoretical equilibrium between these animal species. The overall stocking rate (i.e. 0.8 LU/ha) was set according to previous experience (see Celaya et al., 2007) in order to prolong the grazing season without causing an excessive penalty to animals.
Offspring were weaned according to the normal practice and market weights. Lambs and kids were weaned in July-August, when ageing around 4 months old, and calves with 6-8 months, in August-September. Wintering period for mating began depending on the weight losses and body condition.
All animals were drenched with ivermectin (Oramec®, Merial Lyon, France) against gastrointestinal nematodes two weeks before turning out.
3
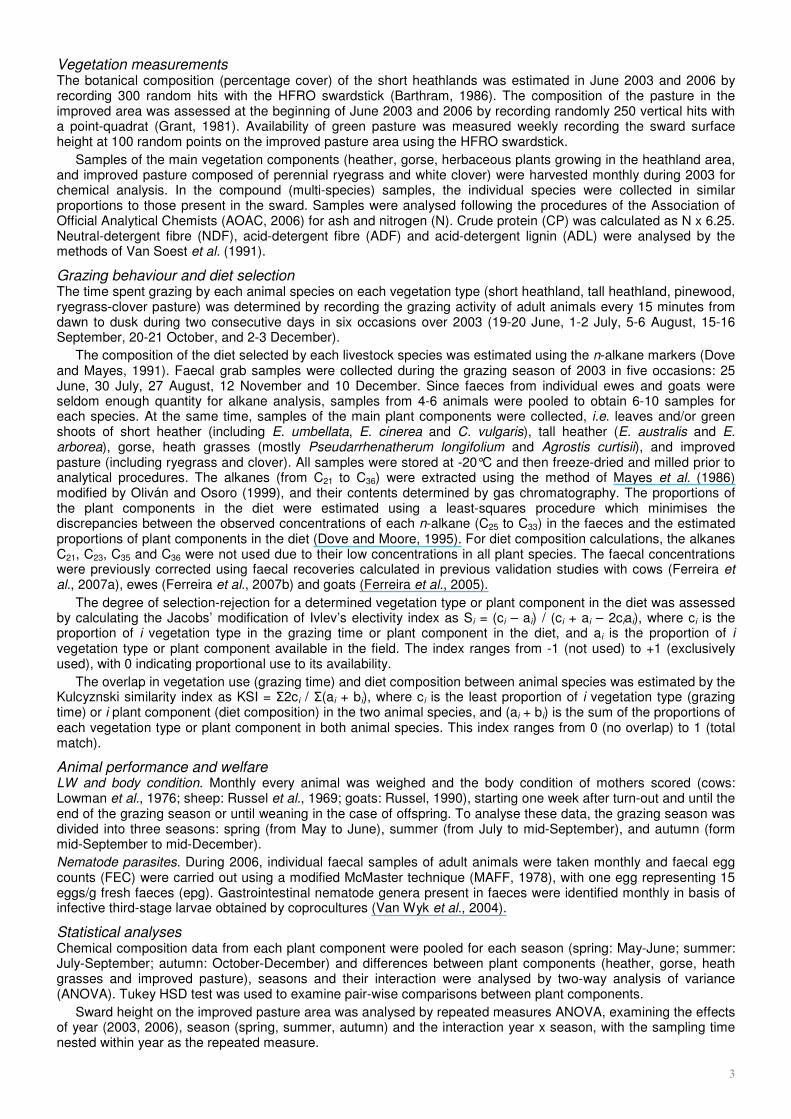
Vegetation measurements The botanical composition (percentage cover) of the short heathlands was estimated in June 2003 and 2006 by recording 300 random hits with the HFRO swardstick (Barthram, 1986). The composition of the pasture in the improved area was assessed at the beginning of June 2003 and 2006 by recording randomly 250 vertical hits with a point-quadrat (Grant, 1981). Availability of green pasture was measured weekly recording the sward surface height at 100 random points on the improved pasture area using the HFRO swardstick.
Samples of the main vegetation components (heather, gorse, herbaceous plants growing in the heathland area, and improved pasture composed of perennial ryegrass and white clover) were harvested monthly during 2003 for chemical analysis. In the compound (multi-species) samples, the individual species were collected in similar proportions to those present in the sward. Samples were analysed following the procedures of the Association of Official Analytical Chemists (AOAC, 2006) for ash and nitrogen (N). Crude protein (CP) was calculated as N x 6.25. Neutral-detergent fibre (NDF), acid-detergent fibre (ADF) and acid-detergent lignin (ADL) were analysed by the methods of Van Soest et al. (1991).
Grazing behaviour and diet selection The time spent grazing by each animal species on each vegetation type (short heathland, tall heathland, pinewood, ryegrass-clover pasture) was determined by recording the grazing activity of adult animals every 15 minutes from dawn to dusk during two consecutive days in six occasions over 2003 (19-20 June, 1-2 July, 5-6 August, 15-16 September, 20-21 October, and 2-3 December).
The composition of the diet selected by each livestock species was estimated using the n-alkane markers (Dove and Mayes, 1991). Faecal grab samples were collected during the grazing season of 2003 in five occasions: 25 June, 30 July, 27 August, 12 November and 10 December. Since faeces from individual ewes and goats were seldom enough quantity for alkane analysis, samples from 4-6 animals were pooled to obtain 6-10 samples for each species. At the same time, samples of the main plant components were collected, i.e. leaves and/or green shoots of short heather (including E. umbellata, E. cinerea and C. vulgaris), tall heather (E. australis and E. arborea), gorse, heath grasses (mostly Pseudarrhenatherum longifolium and Agrostis curtisii), and improved pasture (including ryegrass and clover). All samples were stored at -20°C and then freeze-dried and milled prior to analytical procedures. The alkanes (from C21 to C36) were extracted using the method of Mayes et al. (1986) modified by Oliván and Osoro (1999), and their contents determined by gas chromatography. The proportions of the plant components in the diet were estimated using a least-squares procedure which minimises the discrepancies between the observed concentrations of each n-alkane (C25 to C33) in the faeces and the estimated proportions of plant components in the diet (Dove and Moore, 1995). For diet composition calculations, the alkanes C21, C23, C35 and C36 were not used due to their low concentrations in all plant species. The faecal concentrations were previously corrected using faecal recoveries calculated in previous validation studies with cows (Ferreira et al., 2007a), ewes (Ferreira et al., 2007b) and goats (Ferreira et al., 2005).
The degree of selection-rejection for a determined vegetation type or plant component in the diet was assessed by calculating the Jacobs’ modification of Ivlev’s electivity index as Si = (ci – ai) / (ci + ai – 2ciai), where ci is the proportion of i vegetation type in the grazing time or plant component in the diet, and ai is the proportion of i vegetation type or plant component available in the field. The index ranges from -1 (not used) to +1 (exclusively used), with 0 indicating proportional use to its availability.
The overlap in vegetation use (grazing time) and diet composition between animal species was estimated by the Kulcyznski similarity index as KSI = Σ2ci / Σ(ai + bi), where ci is the least proportion of i vegetation type (grazing time) or i plant component (diet composition) in the two animal species, and (ai + bi) is the sum of the proportions of each vegetation type or plant component in both animal species. This index ranges from 0 (no overlap) to 1 (total match).
Animal performance and welfare LW and body condition. Monthly every animal was weighed and the body condition of mothers scored (cows: Lowman et al., 1976; sheep: Russel et al., 1969; goats: Russel, 1990), starting one week after turn-out and until the end of the grazing season or until weaning in the case of offspring. To analyse these data, the grazing season was divided into three seasons: spring (from May to June), summer (from July to mid-September), and autumn (form mid-September to mid-December).
Nematode parasites. During 2006, individual faecal samples of adult animals were taken monthly and faecal egg counts (FEC) were carried out using a modified McMaster technique (MAFF, 1978), with one egg representing 15 eggs/g fresh faeces (epg). Gastrointestinal nematode genera present in faeces were identified monthly in basis of infective third-stage larvae obtained by coprocultures (Van Wyk et al., 2004).
Statistical analyses Chemical composition data from each plant component were pooled for each season (spring: May-June; summer: July-September; autumn: October-December) and differences between plant components (heather, gorse, heath grasses and improved pasture), seasons and their interaction were analysed by two-way analysis of variance (ANOVA). Tukey HSD test was used to examine pair-wise comparisons between plant components.
Sward height on the improved pasture area was analysed by repeated measures ANOVA, examining the effects of year (2003, 2006), season (spring, summer, autumn) and the interaction year x season, with the sampling time nested within year as the repeated measure.

4
Overall diet composition data set over the grazing season could not be normalized nor the variances equalized by transformation due to many zero values found at several sampling dates. Thus, differences between cows, ewes and goats’ diets were analysed for each date, using the non-parametric Kruskal-Wallis test. Comparisons between pairs of livestock species were examined applying the Mann-Whitney U test. This approach was also used to analyse the selectivity values (Jacobs’ index) of each plant component in the diet, as well as FEC data.
Individual daily LW changes, expressed on a LU basis, and body condition score changes during the different periods of the grazing season were subjected to a General Linear Model ANOVA. The model used was y = µ + Sp + Y + Sp*Y + ε, where y is the measured LW or body condition score change, µ is the overall mean, Sp is the main effect of animal species (cattle, sheep, goat), Y is the main effect of year (2003, 2006), Sp*Y is the interaction effect between animal species and year, and ε is the residual error term. Post-hoc differences between animal species were examined using Tukey-Kramer test for unbalanced data.
All analyses were performed using the program STATISTICA 6.0 (StatSoft Inc., 2001, Tulsa, OK, USA).
Results Available vegetation Natural vegetation. The short heathland was dominated by heather species, with cover percentages of 68% and 56% in 2003 and 2006, respectively. In particular, Erica umbellata was the dominant species accounting for 58% in 2003 and 47% in 2006 (Table 1). Gorse percentage varied between 14% in 2003 and 19% in 2006, whilst other shrubs only represented 3% and 2% in 2003 and 2006, respectively. Herbaceous plants consisted mainly of tough grasses such as P. longifolium and A. curtisii, accounting for 8% in 2003 and 13% in 2006, and the percentage of dead matter varied between 7% (2003) and 10% (2006).
Improved area. The improved pasture was dominated by perennial ryegrass in both years, although with higher cover in 2003 (66%) than in 2006 (51%). Conversely, the cover percentage of white clover increased from 19% (2003) to 23% (2006). The same trend was observed for the indigenous grass species, mainly Agrostis capillaris (13% in 2003 and 21% in 2006). Other unsown species only accounted for 2% and 5% in 2003 and 2006, respectively (Table 1).
Available sward height of the improved pasture area decreased significantly (P < 0.001) during the grazing season in both years (Figure 1), from a mean of 9.0 cm in spring (May-June) to 5.2 cm in summer (July-September) and to 3.2 cm in autumn (September-December). Significant (P < 0.05) differences between years were observed, but these occurred mainly in spring (10.3 and 7.7 cm in 2003 and 2006, respectively), so the interaction year x season was also significant (P < 0.05). In summer, mean sward heights were 5.9 and 4.5 cm in the first and the second year, respectively, whilst in autumn the means were equally low in both years, 3.2 and 3.4 cm, respectively.
Chemical composition of vegetation. All the chemical parameters differed significantly (P < 0.001) between vegetation components (Table 2). The improved pasture had higher CP contents and lower fibre (NDF, ADF) contents than the natural plant components. Lignin content (ADL) was higher in shrubs (heather and gorse) than in the herbaceous plants. In general, the nutritive value of all plant components decreased as grazing season passed. Average CP content decreased from 133 g/kg DM in spring to 119 and 94 g/kg DM in summer and autumn respectively (P < 0.001), while NDF and ADF contents increased from 574 to 642 g/kg DM (P < 0.05), and from 387 to 432 g/kg DM (P < 0.1), respectively.
Foraging behaviour Grazing time. On average, goats spent more daily time grazing than the other species throughout the grazing season (633 min/day compared to 537 and 527 min/day spent by cows and ewes, respectively). This difference was particularly marked during summer, when the averaged grazing activity of goats exceeded 720 min/day, compared to the figures of cattle and sheep that remained nearly steady. On the contrary, autumn controls showed shorter grazing periods for goats (mean values of 609, 593 and 512 min/day for cows, ewes and goats, respectively).
Differences in the proportion of grazing time spent on each vegetation type were also registered among animal species (Figure 2). The proportional time that goats spent grazing on shrubland (including short and tall heathlands) was greater than for the other two species, and it was frequently higher than 0.50 of the grazing time, whereas cows and ewes spent the most of their grazing activity on the improved pasture (exceeding 0.70). These proportions varied seasonally, especially in the case of cows and goats. The proportion of grazing time on the improved pasture decreased over the grazing season, from 0.96 in June to 0.70 in December for cows, and from 0.64 to 0.28 for goats. Sheep hardly varied their behaviour, as they only reduced their utilisation of the improved area during a short period in the summer (from 0.90 in July to 0.78 in September), with a new increase in autumn. Goat was the only species browsing on pines, with a maximum grazing time of 0.06 registered in August and isolated records in other controls.
The diurnal grazing pattern exhibited by the animals changed during the grazing season, depending on the available sward height in the improved pasture area, meteorological conditions and daylight hours (Figure 3). In spring and summer, both cattle and sheep rested during two main breaks, at midday and in the afternoon. Goats’ behaviour was more variable within the herd, i.e. it was less synchronic between individuals. During autumn, with shorter sward height and daytime length, resting times decreased, especially in sheep. Grazing time of ewes on heathlands was mainly restricted to the evening on their way to their resting area.

5
Diet composition. The estimated composition of the diet selected by each animal species during the grazing season is presented in Table 2. The herbaceous species were the main dietary component of cattle and sheep throughout the grazing season, ranging from a minimum of 0.81 (August-December) to a maximum of 0.92 (June) in cattle, and from a minimum of 0.66 (August) to a maximum of 0.95 (July) in sheep. The proportion of this vegetation component in the diet of these two animal species was only significantly (P < 0.01) different in July (0.90 vs. 0.95 in cattle and sheep, respectively) and August (0.81 vs. 0.66 in cattle and sheep, respectively). The inclusion of herbaceous species in the diet of goats was significantly (P < 0.01) lower throughout the whole season, achieving a minimum value (0.16) in November and a maximum (0.69) in July (Table 3).
Gorse was essentially selected by goats at the beginning of the grazing season (0.28 and 0.10 in June and July, respectively) and in November (0.09). In contrast, cattle and sheep tended to reject it, with the exception of June when gorse accounted for 0.08 and 0.06 of their diets, respectively.
Differences in the estimated proportion of heather in the diet among livestock species were also registered. The selection of heather increased significantly in every animal species from June, with proportions in the diet close to zero (0 for cattle and sheep and 0.04 for goats), to August when they reached maximum values of 0.19, 0.34 and 0.81 for cattle, sheep and goats, respectively. Afterwards, the selection of this plant component decreased, especially in sheep and goats, even though heather continued as the main component of goats’ diet until the end of the grazing season.
Vegetation type and diet selection. According to the Jacobs’ electivity index (S), all livestock species showed positive selection to graze on improved pasture, but the indexes for goats during summer-autumn were consistently lower (0.11-0.48) than those for cattle and sheep (0.76-0.95) (Table 4). Short heathlands, covering the greatest surface, had the lowest (negative) S indexes (from -1.00 to -0.71 for cattle and sheep; from -0.78 to 0.07 for goats). However, tall heathlands reached positive indexes in cows (from August to October) and goats (from July to October).
With respect to the diet selection, herbaceous plants were positively selected by cattle and sheep in all sampled periods, whereas goats presented negative Jacobs’ indexes from August to December. Gorse was rejected from July onwards by both cattle and sheep, while goats selected it positively in June (S = 0.57), and consumed it in proportion to its availability in July (S = 0.01). Both cattle and sheep selected against heather, though in August this rejection was stronger for cattle than for sheep (-0.66 vs. -0.38; P < 0.001). In contrast, goats showed positive selection for heather from August to December (Table 4).
Grazing overlap between livestock species. The degree of grazing overlap between livestock species assessed by the Kulcyznski similarity index (KSI) was higher between cattle and sheep compared to that found between sheep and goats or between cattle and goats (Table 5), considering either the grazing time spent on each vegetation type (KSI mean values from June to December of 0.86, 0.58 and 0.56 for cattle-sheep, sheep-goat and cattle-goat, respectively) or the diet composition (respective means of 0.76, 0.53 and 0.47). In general, dietary overlap between species decreased over the grazing season, but this trend was less noteworthy for the indexes derived from the grazing time, with an overlapping between cattle and sheep exceeding 0.86 from July onwards.
Animal performance Daily LW changes of mothers. Autumn-calving cows (2003) gained 1159 g/day during the spring while spring-calving cows (2006) recovered only 421 g/day. During summer, autumn-calving cows, which were at the end of lactation, maintained LW (6 g/day), whereas spring-calving cows, in the middle of lactation, lost 557 g/day. In autumn, cows belonging to both calving seasons lost near a half a kilo per day (540 and 455 g/day in autumn- and spring-calving cows, respectively).
Small ruminants showed different trends in their individual LW changes in comparison with cows. Ewes and goats increased their LW at 63 and 49 g/day respectively (P < 0.05) during the spring, without significant differences among years. Conversely, significant (P < 0.001) differences between years were observed during summer; in 2003 ewes and goats gained LW at the same level as in spring, 67 and 51 g/day respectively, but in 2006 ewes and goats lost 32 and 8 g/day, respectively. During autumn ewes lost only 5 g/day and goats 24 g/day (P < 0.001) without significant differences between years.
On the overall grazing season (from May to December), cows lost LW, particularly spring-calving cows (260 g/day), while ewes and does increased their LW in 14 and 7 g/day, respectively.
Body condition score. Changes in body condition of mothers were in some extent related to the live weight changes. Thus, small ruminants maintained or improved their body condition throughout the grazing season (+0.10) while for cows it worsened (-0.55; P < 0.001; Table 6).
Daily LW gains of offspring. During spring, calves’ daily LW gains (1016 g) were obviously higher than those for lambs (193 g) and kids (99 g). During summer, considerable reduction in calves LW gains were observed, resulting in 591 and 626 g/day for autumn- and spring-born calves, respectively. The reduction was also important for lambs, 85 g/day, while kids practically keep their gains (80 g/day). For the overall spring-summer grazing season, mean daily LW gains for each species were 790, 125 and 89 g/day in calves, lambs and kids, respectively, with autumn-born calves showing significantly (P < 0.001) higher LW gains (904 g/day) than those born in spring (676 g/day; Table 7).
LW changes of mothers expressed on a LU basis. LW changes per LU differed significantly (P < 0.001) between animal species, varying the difference level over the grazing season (Table 6). In spring, the highest LW gains per LU corresponded to autumn-calving cows (1159 g/day per LU) and the lowest figures to does (342 g/day per LU).

6
Ewes’ LW changes per LU (442 g/day per LU) were similar to spring-calving cows (421 g/day per LU) and higher (P = 0.067) than goats’ LW gains.
In summer, small ruminants had higher LW gains per LU, with significant (P < 0.001) differences between years because all the species lost weight in 2006, though in a lesser extent in the case of small ruminants. Averaging both years, cows lost 275 g/day per LU while ewes and does recovered 121 and 152 g/day per LU, respectively (P < 0.001). The balance of LW changes for the spring-summer grazing season was not significantly different between the three animal species although the interaction year x species was highly significant (P < 0.001).
During autumn, all animal species lost weight, but cows did at significant (P < 0.001) higher level (-497 g/day per LU) than goats (-170 g/day per LU) and ewes (-35 g/day per LU), with a significant (P < 0.01) interaction between year and species.
Considering the whole grazing season, cows had a negative balance (-143 g/day per LU) while ewes and goats gained 101 and 47 g/day per LU respectively (P < 0.001). In this case, the year x species interaction was not significant, while year effect was highly significant (P < 0.001) (Table 6).
LW gains of offspring expressed on a LU basis. LW production per LU during spring was higher (P < 0.001) in lambs (1348 g/day) than in spring-born calves (737 g/day) and kids (695 g/day), and similar to that achieved by autumn-born calves in 2003 (1295 g/day; Table 7). During summer, the production per LU was more similar between the three species, but with significant (P < 0.001) interaction between year and species, due to the lower performance of lambs and kids in the second year (Table 7). On the overall spring-summer grazing season of both years, higher (P < 0.001) LW production was achieved by lambs (874 g/day per LU), followed by calves (790 g/day per LU) and kids (620 g/day per LU); year effect was highly significant (P < 0.001) and the interaction year x species was significant (P < 0.05).
Total production per LU. Figure 4 shows the contribution of mothers and offspring from each animal species to the total production during the different periods of the two studied grazing seasons. A similar production between cattle and sheep during the spring grazing was observed, with significant (P < 0.001) differences between years in the case of cattle, related to some extent with the different calving season. In summer the total production was significantly (P < 0.001) higher in small ruminants (712 g/day per LU) than in cattle (333 g/day per LU).
In the spring-summer grazing period, the highest production was achieved by sheep (1110 g/day per LU) followed by cattle (990 g/day per LU), and the lowest corresponded to goats (857 g/day per LU). However, during the whole grazing season (from May to December) the lowest production was from cattle (647 g/day per LU) while goats had 667g/day per LU and sheep achieved 975 g/day per LU.
Nematode parasites In general, gastrointestinal nematode FECs increased during the grazing season in 2006, although differences among the livestock species were recorded (Figure 5). There were also considerable differences between individuals within species. The FEC increase was higher in goats when compared to cattle and sheep, mainly from September to December (with a mean figure ranging from 110 to 200 epg). The mean FECs were lower in cattle (14 epg) and sheep (34 epg) during all grazing season, with a maximum of 40 (in August) and 90 epg (in October), respectively. Significant (P < 0.001) differences were observed in the last control (December) with higher mean FECs in goats (197 epg) compared to cattle (20 epg) and sheep (33 epg).
Nematode genera identified were Ostertagia in cattle and Teladorsagia and Trichostrongylus in sheep and goats. The percentage of Trichostrongylus (from 30% in June to 75% in December) increased during the grazing period, while that of Teladorsagia decreased.
Discussion Nutritive value of vegetation The CP, NDF, ADF and ADL contents of the different plant components were quite similar to those found in a previous work in the same location (Celaya et al., 2007) and revealed the low nutritive value of the natural components, even the herbaceous ones, compared to the ryegrass-clover pasture. The general trends of the chemical parameters over the grazing season also agreed with the aforementioned work, indicating that the nutritive value of the available vegetation decreased from spring to autumn.
Grazing behaviour and diet selection Results showed that cattle and sheep grazed preferentially on the improved ryegrass-clover pasture area, regardless of the available sward height or nutritive quality of the herbage in that area. Although goats showed a similar behaviour in spring they readily shifted to woody vegetation when the available sward height decreased below 7 cm in July. Many studies have reported a higher willingness of goats to browse on woody plants compared to other domestic ruminants (Lu, 1988; Gordon, 1989).
Previous works showed that goats consume gorse (Ulex europaeus) at a higher proportion than sheep (Clark et al., 1982; Radcliffe, 1986). Also Bullock (1985) found a higher consumption of heather by goats than by sheep as observed in the present study. However, the differences between sheep and goats in heather selection were less clear in previous studies, depending on the heather species (Bartolomé et al., 1998) or season (Celaya et al., 2007).
It is known that sheep graze more intensively on ryegrass-clover pastures than goats (Grant et al., 1984). In the present work, as sward height in the improved area did not decrease below 4 cm until November, sheep continued

7
grazing on the improved pasture without apparently limiting their intake. They consumed lower proportions of heather than in a previous work (Celaya et al., 2007) under similar experimental conditions with non-lactating animals, in which the mean sward height during autumn was 2.7 cm, and thus the ewes selected diets with more than 0.4 heather from September to December. In contrast, cattle are known to hardly consume these woody plants (Aldezabal, 2001; Celaya et al., 2007) in spite of their higher intake limitation as sward height decreases when compared to sheep (Baker et al., 1981; Forbes and Beattie, 1987). This feature of cattle may be related to their inability to select efficiently the green shoots of shrubs due to their muzzle anatomy (Illius and Gordon, 1993; Milne, 1994).
A higher complementarity in resource explotation is expected between ruminant species from different feeding categories, i.e. browsers and grazers (Hofmann, 1989; Gordon, 2003). The lower dietary overlap between goats and cattle or sheep as opposed to that between cattle and sheep has also been observed in other works under very different conditions (e.g. Lechner-Doll et al., 1995; Aldezabal, 2001). This indicates a lower interspecific competition between goats and other animal species, and a more efficient use of heterogeneous plant resources (Wright and Connolly, 1995).
Animal performance The results showed that in spring, when available sward height in the improved pasture area was higher than 7-8 cm, LW gains per LU of autumn-calving cows were higher than in spring-calving cows and small ruminants. However in summer and autumn, with sward height lower than 6 and 4 cm respectively, the LW changes of small ruminants were more favourable than those of cattle. In summer, goats’ LW gains were as high as in sheep, partly because sheep achieved a high performance level in spring and, therefore, the gain rates during summer were reduced as a consequence of the good body condition at the end of spring. These interactions between livestock species and season (pasture availability) were the result of differences in intake capacity and grazing behaviour between animal species. Previous studies (Wright and Whyte, 1989) showed that suckler cows achieve maximum intake and production when available mean sward height is around 8 cm. However, when grass availability decreases to 5-6 cm, herbage intake and milk production are significantly reduced in cows. Therefore, calves’ milk intake decreased affecting negatively their growth rates (Baker et al., 1981). In contrast, ewes are able to maximize growth rate in ryegrass-clover pastures with 5-6 cm mean sward height (Orr et al., 1990; Osoro et al., 2002), and in natural vegetation communities with very short sward they are able to maintain their body weight (Osoro et al., 2000a). Nevertheless, the animal responses to sward height are affected by the initial body condition, with higher LW gains achieved by those animals with previous poorer condition.
The LW changes recorded under the present conditions showed better response to the sward height than that found under lowland conditions in the case of cattle (Osoro et al., 2000b) and goats (Osoro and Martínez, 1995), and similar in the case of sheep (Osoro et al., 2002). Different reasons may explain these differences. Higher pasture density has been observed in mountain pastures compared to lowland pastures (Celaya et al., 2002), and thus higher intakes per bite could be obtained in the former, increasing total intake (Hodgson, 1985). In the case of goats, a better performance was observed when they had heather available, due to a lower parasitism (Osoro et al., 2007b) and a more efficient protein utilization (Frutos et al., in press).
Moreover, the interaction between body size, intake capacity and nutrient requirements with the quantity and quality of available vegetation is known (Fitzhugh, 1978). Illius and Gordon (1993) indicated that small herbivores generally require more energy relative to their gut capacity than large ones and thus have to select higher quality foods. In contrast, larger animals with comparatively larger gut capacity relative to their metabolic requirements can retain digesta in the gastrointestinal tract for longer time and thus digest it more thoroughly (Demment and Van Soest, 1985). In spite of such beneficial capacity, and in contrast with sheep and goats, cattle are unable to maintain their required intake consuming only the components of the natural vegetation in heathlands, due to their poor ability to select them and limited intake rate when sward height of the improved pasture area decreases, as stated above.
In the current study, the effect of calving time (spring vs. autumn) can not be fully assessed as it is confounded with year and the conjoint differences in pasture availability and botanical composition. Nevertheless, sward height only differed in spring when it was not limiting intake, whilst botanical differences were presumably of minor importance on cattle performance, considering that the relative proportions of improved pasture and natural heathland remained the same between 2003 and 2006. Higher performances of autumn-calving than spring-calving cows during the spring-summer grazing season have been previously observed in lowland pastures (Russel et al., 1986), although with higher costs of winter feeding for the former (Chestnutt, 1984). It would be related to the different lactation status of cows during the spring-summer, and to the development of intake capacity by calves, which will be higher in autumn-born calves than in those younger calves born in winter-spring (Russel et al., 1986).
Parasite burden Although the gastrointestinal nematode infection was only studied during 2006, data obtained showed the infection level in the three ruminant species and their contribution to pasture contamination by these parasites. Results showed that goats tended to shed more nematode eggs in faeces than sheep and cattle. Firstly, the differences in FEC between cattle, sheep and goats could be related to their development of immunity to gastrointestinal nematodes, and secondly, to their nutrition level. It is known that goats are mainly browsers and have evolved the lowest levels of immunity, and both young and adult animals usually require anthelmintic treatment to maintain their health in grazing conditions (Hoste et al., 2008). In change, adult sheep develop a higher level of immunity than

8
goats as they are naturally grazers. Unless they got a heavy buden of parasite nematodes, treatment of adults may not be necessary. On the other hand, adult cattle generally do not require treatment for nematodes, although treatment may enhance the productivity (Vercruysse and Claerebout, 2001). Nevertheless, the FECs found in goats in the current study (i.e. maximum values of 197 epg in December) are much lower than those (> 8000 epg) found at the end of the grazing season in goats grazing on ryegrass-clover pastures with no available heather (Osoro et al., 2007b). In such report, a significant effect of heather supplementation on FEC reduction was observed.
Conclusions In conclusion, on these heterogeneous vegetation communities (heathlands with areas of improved pasture) and management conditions, sheep achieved the best performance if the entire grazing season is considered (from May to December), despite the good level of production in spring from autumn-calving cows. Goats would be a good complement for an efficient use of the natural vegetation, achieving production levels as high as those from spring-calving cows without compromising parasitic infection rates between animal species. Therefore, considering LW gains per LU and complementarity in their grazing behaviour, mixed flocks of sheep and goats would be the most appropriate to achieve sustainable systems from the animal production and vegetation use points of view. Anyway, market meat values should be considered to settle the best ways to operate at a profit in each particular condition.
Acknowledgements We thank the staff of the the Carbayal Research Station for their field work in animal management. This study was funded by the Ministry of Education and Science of Spain, project AGL2003-05342. R Celaya is funded by the European Social Fund.
References Aldezabal A 2001. El sistema de pastoreo del Parque Nacional de Ordesa y Monte Perdido (Pirineo central, Aragón).
Interacción entre la vegetación supraforestal y los grandes herbívoros. Consejo de Protección de la Naturaleza de Aragón, Zaragoza, Spain.
Association of Official Analytical Chemists 2006. Official methods of analysis, 18th edition (1st revision). AOAC, Gaithersburg, MD, USA.
Baker RD, Alvarez F and Le Du YLP 1981. The effect of herbage allowance upon the herbage intake and performance of suckler cows and calves. Grass and Forage Science 36, 189-200.
Barthram GT 1986. Experimental techniques: the HFRO swardstick. In The Hill Farming Research Organisation biennial report 1984-85. HFRO, Bush Estate, Penicuik, Midlothian, UK, pp. 29-30.
Bartolomé J, Franch J, Plaixats J and Seligman NG 1998. Diet selection by sheep and goats on Mediterranean heath-woodland range. Journal of Range Management 51, 383-391.
Benavides R, Celaya R, Ferreira LMM, Jáuregui BM, García U and Osoro K in press. Grazing behaviour of ruminants according to flock type and subsequent vegetation dynamics on improved heathlands. Rangeland Ecology and Management.
Bullock DJ 1985. Annual diets of hill sheep and feral goats in southern Scotland. Journal of Applied Ecology 22, 423-434. Celaya R, Martínez A and Osoro K 2002. Relationship between sward height and available biomass in lowland, hill and
mountain pastures. In Multi-function grasslands. Quality forages, animal products and landscapes (eds JL Durand, JC Emile, C Huyghe and G Lemaire), pp. 286-287. P. Oudin, Poitiers, France.
Celaya R, Oliván M, Ferreira LMM, Martínez A, García U and Osoro K 2007. Comparison of grazing behaviour, dietary overlap and performance in non-lactating domestic ruminants grazing on marginal heathland areas. Livestock Science 106, 271-281.
Chestnutt DMB 1984. Some effects of changes in cow live weight in the autumn calving suckler herd. In Grassland Beef Production (ed W Holmes), pp. 35-43. Martinus Nijhoff Publishers, Nijmegen, the Netherlands.
Clark DA, Lambert MG, Rolston MP and Dymock N 1982. Diet selection by goats and sheep on hill country. Proceedings of the New Zealand Society of Animal Production 42, 155-157.
Demment MW and Van Soest PJ 1985. A nutritional explanation for body size patterns of ruminant and nonruminant herbivores. The American Naturalist 125, 641-672.
Dove H and Mayes RW 1991. The use of plant wax alkanes as markers substances in studies of the nutrition of herbivores: a review. Australian Journal of Agricultural Research 42, 913-957.
Dove H and Moore AD 1995. Using a least-squares optimisation procedure to estimate diet composition based on the alkanes of plant cuticular wax. Australian Journal of Agricultural Research 46, 1535-1544.
Ferreira LMM, Oliván M, Rodrigues MAM, Garcia U and Osoro K 2005. Validation of the alkane technique to estimate diet selection of goats grazing heather-gorse vegetation communities. Journal of the Science of Food and Agriculture 85, 1636-1646.
Ferreira LMM, Garcia U, Rodrigues MAM, Celaya R, Dias-da-Silva A and Osoro K 2007a. The application of the n-alkane technique for estimating the composition of diets consumed by equines and cattle feeding on upland vegetation communities. Animal Feed Science and Technology 138, 47-60.
Ferreira LMM, Oliván M, Celaya R, García U, Rodrigues MAM and Osoro K 2007b. The use of the alkane technique to estimate diet selection of sheep grazing grass-clover/heather-gorse vegetation communities. Journal of the Science of Food and Agriculture 87, 274-285.
Fitzhugh HA 1978. Animal size and efficiency with special reference to the breeding female. Animal Production 27, 393-401. Forbes TDA and Beattie MM 1987. Comparative studies of the influence of sward conditions on the ingestive behaviour of cows
and sheep. Grass and Forage Science 40, 69-77. Frutos P, Moreno-Gonzalo J, Hervás G, García U, Ferreira LMM, Celaya R, Toral PG, Ortega-Mora LM, Ferre I and Osoro K (in
press). Is the anthelmintic effect of heather supplementation to grazing goats always accompanied by antinutritional effects? Animal.
9
Gordon IJ 1989. Vegetation community selection by ungulates on the isle of Rhum. II. Vegetation community selection. Journal of Applied Ecology 26, 53-64.
Gordon IJ 2003. Browsing and grazing ruminants: are they different beasts? Forest Ecology and Management 181, 13-21. Grant SA 1981. Sward components. In Sward measurement handbook (eds J Hodgson, RD Baker, A Davies, AS Laidlaw and
JD Leaver), pp. 71-92. British Grassland Society, Hurley, Maidenhead, Berkshire, UK. Grant SA and Hodgson J 1986. Grazing effects on species balance and herbage production in indigenous plant communities. In
Grazing Research at Northern Latitudes (ed O Gudmundsson), pp. 69-77. Plenum, London, UK. Grant SA, Bolton GR and Russel AJF 1984. The utilization of sown and indigenous plant species by sheep and goats grazing
hill pastures. Grass and Forage Science 39, 361-370. Hodgson J 1985. The control of herbage intake in the grazing ruminant. Proceedings of the Nutrition Society 44, 339-346. Hofmann RR 1989. Evolutionary steps of ecophysiological adaptation and diversification of ruminants: comparative view of their
digestive system. Oecologia 78, 443-457. Hoste H, Torres-Acosta JFJ and Aguilar-Caballero AJ 2008. Nutrition-parasite interactions in goats: is immunoregulation
involved in the control of gastrointestinal nematodes? Parasite Immunology 30, 79-88. Illius AW and Gordon IA 1993. Diet selection in mammalian herbivores: constraints and tactics. In Diet selection. An
interdisciplinary approach to foraging behaviour (ed RN Hughes), pp. 157-181. Blackwell Scientific Publications, Oxford, UK. Lechner-Doll M, Hume ID and Hofmann RR 1995. Comparison of herbivore forage selection and digestion. In Recent
developments in the nutrition of herbivores (eds M Journet, E Grenet, M-H Farce, M Thériez and C Demarquilly), pp. 231-248. INRA, Paris, France.
Lowman BG, Scott NA and Somerville SH 1976. Condition scoring in suckler cows. East of Scotland College of Agricuture, Bulletin No. 6, pp. 1-31.
Lu CD 1988. Grazing behaviour and diet selection of goats. Small Ruminant Research 1, 205-216. MAFF 1978. Manual of veterinary parasitological techniques. Technical Bulletin no. 18. Ministry of Agriculture, Fisheries and
Food, London, UK. Maxwell TJ, Grant SA, Milne JA and Sibbald AR 1986. Systems of sheep production on heather moorland. In Hill land
symposium (ed MA O’Toole), pp. 187-211. An Foras Talúntais, Dublin, Ireland. Mayes RW, Lamb CS and Colgrove PM 1986. The use of dosed and herbage n-alkanes as markers for the determination of
herbage intake. Journal of Agricultural Science, Cambridge 107, 161-170. Merchant M and Riach DJ 1994. The intake and performance of cashmere goats grazing sown swards. Grass and Forage
Science 49, 429-437. Milne JA 1994. Comparative abilities of different herbivorous species to graze in upland areas: consequences for productivity
and vegetation. Annales de Zootechnie 43, 3-9. Oliván M and Osoro K 1999. Effect of temperature on alkane extraction from faeces and herbage. Journal of Agricultural
Science, Cambridge 132, 305-312. Orr RJ, Parsons AJ, Penning PD and Treacher TT 1990. Sward composition, animal performance and the potential production
of grass ⁄ white clover swards continuously stocked by sheep. Grass and Forage Science 45, 325-336. Osoro K and Martínez A 1995. Grazing behaviour and performance of goats and sheep on natural and improved vegetation. In
The nutrition and grazing ecology of speciality fibre producing animals (eds JP Laker and AJF Russel), pp. 109-125. Macaulay Land Use Research Institute, Aberdeen, UK.
Osoro K, Oliván M, Celaya R and Martínez A 1999. Effects of genotype on the performance and intake characteristics of sheep grazing contrasting hill vegetation communities. Animal Science 69, 419-426.
Osoro K, Oliván M, Celaya R and Martínez A 2000a. The effect of Calluna vulgaris cover on the perfomance and intake of ewes grazing hill pastures. Grass and Forage Science 55, 300-308.
Osoro K, Ormazabal JJ and Celaya R 2000b. Suckler cows performance during the spring under different sward heights and grazing systems. In Beef from grass and forage (ed D Pullar), pp. 159-163. British Grassland Society, Occasional Symposium No. 35.
Osoro K, Martínez A and Celaya R 2002. The effect of breed and sward height on sheep performance and production per hectare during the spring and autumn in Northern Spain. Grass and Forage Science 57, 137-146.
Osoro K, García U, Jáuregui BM, Ferreira LMM, Rook AJ and Celaya R 2007a. Diet selection and live-weight changes of two breeds of goats grazing on heathlands. Animal 1, 449-457.
Osoro K, Mateos-Sanz A, Frutos P, García U, Ortega-Mora LM, Ferreira LMM, Celaya R and Ferre I 2007b. Anthelmintic and nutritional effects of heather supplementation on Cashmere goats grazing perennial ryegrass-white clover pastures. Journal of Animal Science 85, 861-870.
Radcliffe JE 1986. Gorse - a resource for goats? New Zealand Journal of Experimental Agriculture 14, 399-410. Rook AJ, Dumont B, Isselstein J, Osoro K, WallisDeVries MF, Parente G and Mills J 2004. Matching type of grazing animal to
desired biodiversity outcomes – a review. Biological Conservation 119, 137-150. Russel AJF 1990. Body condition scoring of goats. Scottish Cashmere Producers Association Newsletter 10, 3. Russel AJF, Doney JM and Gunn RG 1969. Subjective assessment of body fat in live sheep. Journal of Agricultural Science,
Cambridge 72, 451-454. Russel AJF, Wright IA, Hodgson J and Hunter EA 1986. Factors affecting production from grazing beef cows and calves. In Hill
Land Symposium, Galway 1984 (ed MA O’Toole), pp. 300-329. An Foras Talúntais, Dublin, Ireland. Van Soest PJ, Robertson JB and Lewis BA 1991. Methods for dietary fiber, neutral detergent fiber, and nonstarch
polysaccharides in relation to animal nutrition. Journal of Dairy Science 74, 3583-3597. Van Wyk JA, Cabaret J and Michael LM 2004. Morphological identification of nematode larvae of small ruminants and cattle
simplified. Veterinary Parasitology 119, 277-306. Vercruysse J and Claerebout E 2001. Treatment vs non-treatment of helminth infections in cattle: defining the threshold.
Veterinary Parasitology 98, 195-214. Wright IA and Connolly J 1995. Improved utilization of heterogeneous pastures by mixed species. In Recent developments in
the nutrition of herbivores (eds. M Journet, E Grenet, M-H Farce, M Thériez and C Demarquilly), pp. 425-436. INRA, Paris, France.
Wright IA and Whyte TK 1989. Effects of sward surface height on the performance of continuously stocked spring-calving beef cows and their calves. Grass and Forage Science 44, 259-266.

10
Table 1. Botanical composition (percentage cover) of the short heathland and improved pasture in the two years of the study (2003 and 2006).
Heathland Pasture 2003 2006 2003 2006
Shrubs: Calluna vulgaris 2.7 2.3 Daboecia cantabrica 0.3 Erica cinerea 7.0 6.0 Erica tetralix 0.3 Erica umbellata 57.7 47.3 Genistella tridentata 2.0 0.7 Halimium alyssoides 1.3 1.0 Ulex gallii 13.7 18.7 0.4 0.8
Grasses: Agrostis capillaris 0.3 11.2 14.4 Agrostis curtisii 2.3 3.3 0.8 2.8 Avenula sulcata 0.3 0.3 0.4 0.4 Lolium perenne 65.6 51.2 Poa annua 1.2 Pseudarrhenatherum longifolium 4.3 7.3 0.8 2.0
Other monocots: Carex pilulifera 0.3 Scilla verna 0.3 Simethis mattiazzi 0.3
Forbs: Cerastium arvense 0.8 2.0 Cirsium filipendulum 0.3 0.7 0.4 0.4 Hypochoeris radicata 0.4 Plantago lanceolata 0.4 Potentilla erecta 0.3 0.3 0.8 0.4 Scorzonera humilis 0.3 Serratula tinctoria 0.3 Taraxacum officinale 0.4 Trifolium repens 18.8 22.8 Veronica officinalis 0.4
Dead matter 7.0 10.3
Table 2. Chemical composition of the main plant components in a partially improved gorse-heathland across the grazing season.
Season Significance Variable Spring Summer Autumn Mean s.e.m. Plant Season Pl x S
CP (g/kg DM) 133.3 118.7 93.8 5.32 *** *** ** Heather 78.6 71.6 68.1 72.7c 5.22 Gorse 172.0 112.0 100.4 128.1b 6.27 Heath grass 105.2 115.8 85.2 102.1b 6.97 Improved pasture 177.6 175.5 121.6 158.2a 6.15
NDF (g/kg DM) 573.7 623.9 642.1 15.31 *** * NS Heather 561.4 611.1 606.2 592.9b 15.04 Gorse 636.3 668.3 652.3 652.3ab 18.07 Heath grass 649.3 700.1 741.1 696.8a 20.08 Improved pasture 447.9 516.2 568.6 510.9c 17.71
ADF (g/kg DM) 387.3 420.2 431.7 13.33 *** + NS Heather 439.4 516.7 512.9 489.7a 13.10 Gorse 506.3 526.7 511.4 514.8a 15.73 Heath grass 345.2 351.8 411.0 369.3b 17.49 Improved pasture 258.2 285.7 291.6 278.5c 15.42
ADL (g/kg DM) 153.1 167.7 181.1 14.65 *** NS NS Heather 346.9 382.9 387.4 372.4a 14.40 Gorse 192.2 200.5 236.9 209.9b 17.30 Heath grass 32.2 50.4 42.3 41.6c 19.22 Improved pasture 41.4 37.0 57.7 45.3c 16.95 CP: crude protein; NDF: neutral detergent fiber; ADF: acid detergent fiber; ADL: acid detergent lignin. + P < 0.10; * P < 0.05; ** P < 0.01; *** P < 0.001; NS not significant (P > 0.10). Means with different letters within each chemical variable are significantly different (P < 0.05).

11
Table 3. Diet composition of cattle, sheep and goats across the grazing season on a gorse-heathland with 24% of improved pasture.
Month Plant component Cattle Sheep Goats s.e.m. sign
June Herbaceous 0.916a 0.935a 0.687b 0.014 ** Gorse 0.084b 0.065b 0.278a 0.013 ** Heather 0.000b 0.000b 0.035a 0.008 ** July Herbaceous 0.905b 0.951a 0.693c 0.012 *** Gorse 0.009b 0.000b 0.100a 0.009 *** Heather 0.086b 0.049c 0.207a 0.010 *** August Herbaceous 0.806a 0.655b 0.187c 0.022 *** Gorse 0.000 0.000 0.000 - NS Heather 0.194c 0.345b 0.813a 0.022 *** November Herbaceous 0.807a 0.829a 0.162b 0.037 *** Gorse 0.023ab 0.000b 0.063a 0.018 ** Heather 0.170b 0.171b 0.775a 0.040 *** December Herbaceous 0.809a 0.849a 0.206b 0.038 *** Gorse 0.000b 0.000b 0.091a 0.025 *** Heather 0.191b 0.151b 0.703a 0.039 ***
** P < 0.01; *** P < 0.001; NS not significant; means with different letters in each row are significantly different (P < 0.05). n = 6 for each animal species, except for cattle in November (n = 5), and sheep and goats in November and December (n = 10).
Table 4. Jacobs’s electivity index for each livestock species according to the vegetation use (grazing time) and diet composition.
Grazing time Improved pasture Short heathland Tall heathland Cattle Sheep Goat Cattle Sheep Goat Cattle Sheep Goat
June 0.97 0.80 0.70 -0.99 -0.71 -0.57 -0.37 -1.00 -1.00 July 0.99 0.94 0.17 -1.00 -0.90 -0.66 -0.82 -0.96 0.77 August 0.84 0.86 0.48 -0.93 -0.83 -0.73 0.36 -0.43 0.54 September 0.83 0.84 0.44 -0.88 -0.78 -0.78 0.19 -0.70 0.72 October 0.85 0.95 0.11 -0.91 -0.93 -0.13 0.23 -0.99 0.11 December 0.76 0.87 0.12 -0.72 -0.81 0.07 -0.27 -1.00 -0.90
Diet selection Herbaceous plants Gorse Heather Cattle Sheep Goat Cattle Sheep Goat Cattle Sheep Goat
June 0.93a 0.94a 0.69b -0.10b -0.23b 0.57a -1.00b -1.00b -0.94a July 0.92a 0.96a 0.69b -0.87b -1.00b 0.01a -0.85b -0.92b -0.63a August 0.82a 0.65a -0.30b -1.00 -1.00 -1.00 -0.66c -0.38b 0.57a November 0.82a 0.84a -0.40b -0.68ab -1.00b -0.38a -0.70b -0.70b 0.49a December 0.82a 0.86a -0.27b -1.00b -1.00b -0.37a -0.66b -0.74b 0.34a
For diet selection, means with different letters in each row within each plant component are significantly different (P < 0.05).
Table 5. Overlapping level (Kulcyznski similarity index) between livestock species in the vegetation use (grazing time) and diet composition.
Grazing time Diet composition
Month Cattle-Sheep
Cattle-Goat
Sheep-Goat
Cattle-Sheep
Cattle-Goat
Sheep-Goat
June 0.74 0.64 0.89 0.94 0.68 0.70 July 0.91 0.31 0.40 0.79 0.65 0.74 August 0.88 0.69 0.67 0.65 0.33 0.53 September 0.90 0.67 0.67 October
(1) 0.86 0.47 0.35 0.60 0.34 0.31
December 0.87 0.55 0.46 0.81 0.35 0.36 Mean 0.86 0.56 0.58 0.76 0.47 0.53
(1) Sampling date at November 12
th for diet composition.

12
Table 6. Daily live-weight (LW) changes per Livestock Unit (LU) and body condition score (BCS) changes in suckller cows, ewes and goats grazing on partially improved heathlands during two grazing seasons (from May to December).
Year (Y) 2003 2006 Significance level Species (Sp) Cattle Sheep Goat Cattle Sheep Goat Sp Y Sp x Y n 6 42 42 6 42 42 Initial LW (kg) 590 44 38 462 41 38 *** *** *** LW change (g/day)
Spring 1159 62 40 421 64 57 *** *** *** Summer 6 67 51 -556 -32 -8 *** *** *** Autumn -540 -10 -18 -455 0 -31 *** * * Overall -26 22 14 -260 6 -1 *** *** ***
Initial BCS (scale 0-5) 2.71 2.97 2.45 3.00 2.67 2.67 *** NS *** BCS change
Spring 0.42 0.34 0.25 0.05 0.26 0.21 NS * NS Summer -0.04 0.01 0.05 -0.35 -0.34 -0.01 *** *** * Autumn -0.88 0.13 -0.16 -0.30 0.09 -0.21 *** * ** Overall -0.50 0.26 0.14 -0.60 0.03 -0.01 *** + NS
Initial LW per LU (kg/LU) 590 305 263 462 288 264 *** ** ** LW change (g/day per LU)
Spring 1159 437 282 421 447 402 *** ** *** Summer 6 468 360 -556 -227 -57 *** *** * Autumn -540 -71 -124 -455 2 -216 *** NS ** Overall -26 156 98 -260 45 -4 *** *** NS
+ P < 0.10; * P < 0.05; ** P < 0.01; *** P < 0.001; NS not significant (P > 0.10).
Table 7. Daily live-weight (LW) gains per Livestock Unit (LU) in calves, lambs and kids grazing on partially improved heathlands during two grazing seasons (from May to December).
Year (Y) 2003 2006 Significance level Species (Sp) Cattle Sheep Goat Cattle Sheep Goat Sp Y Sp x Y n 6 42 42 6 42 42 Initial LW (kg) 228.3 13.7 8.1 50.1 11.0 10.2 *** *** *** LW change (g/day)
Spring 1295 191 102 737 195 97 *** *** *** Summer 591 131 102 626 38 58 *** * ** Overall 904 155 102 676 95 75 *** *** ***
Initial LW per LU (kg/LU) 228 96 57 50 77 71 *** *** *** LW change (g/day per LU)
Spring 1295 1335 713 737 1362 677 *** ** ** Summer 591 919 717 626 264 403 NS *** *** Overall 904 1082 715 676 665 525 *** *** *
* P < 0.05; ** P < 0.01; *** P < 0.001; NS not significant (P > 0.05).

13
0
2
4
6
8
10
12
14
May June July August Sept. Oct. Nov. Dec.
cm
2003
2006
Figure 1. Sward height in the improved pasture area during the grazing season of the two study years (2003 and 2006). Vertical bars show ± standard errors of the means.
0
0.2
0.4
0.6
0.8
1
Improved pasture Short heathland Tall heathland Pinewood
Jn Jl Ag Sp Oc Dc Jn Jl Ag Sp Oc Dc Jn Jl Ag Sp Oc Dc
Goats Ewes Cows
Pro
po
rtio
n o
f th
e g
razin
g ti
me
Figure 2. Proportion of the grazing time spent on each vegetation type by lactating cows, ewes and goats during the grazing season of 2003 in a partially (24%) improved heathland plot.

14
Spring
Co
ws
Ew
es
Go
ats
Summer
Co
ws
Ew
es
Go
ats
Proportion of animals grazing
Autumn
Co
ws
Ew
es
Go
ats
7 8 9 10 11 12 13 14 15 16 17 18 19 20 21 22 h
On improved perennial ryegrass-white clover pasture
On natural heathlands
0
1
0
0
0
1
0
1
0
1
0
1
0
1
0
1
1
1
Figure 3. Diurnal variation in the grazing use by lactating cows, ewes and goats in a partially (24%) improved heathland plot. Spring: June-July; Summer: August-September; Autumn: October-December.

15
-1000
-500
0
500
1000
1500
2000
2500
3000
g/day per LU
Spring Summer Autumn Spring Summer Autumn
2003 2006
Cows Calves
Ewes Lambs
Does Kids
Figure 4. Daily live-weight changes per Livestock Unit (LU) of lactating cattle, sheep and goats grazing on partially improved heathlands. Vertical lines show standard errors of means.
0
50
100
150
200
250
May June July August Sept. Oct. Nov. Dec.
epg
Cattle Sheep Goats
Figure 5. Gastrointestinal nematode faecal egg counts in cattle, sheep and goats across the grazing season on partially improved heathlands. Data are shown as mean ± s.e.
Copyright © 2022 FDOKUMEN