the-probable-genetic-introgression-between-walia-ibex-capra ...

1School of Rural Science and Natural Resources, University of New England, Armidale, NSW 2351,Australia, 2Department of Biology, Universiti Putra Malaysia, 43400 UPM, Serdang, Malaysia,3CSIRO Division of Tropical Animal Production, Molecular Animal Genetics Centre, University ofQueensland, St Lucia, Queensland 4072, Australia and 4Institute of Advanced Studies, University of
Malaya, 59100 Kuala Lumpur, Malaysia
Genetic variation within and relationships among populationsof Asian goats (Capra hircus)
By J. S. F. BARKER1, S. G. TAN
2, S. S. MOORE3, T. K. MUKHERJEE
4, J.-L. MATHESON3
and O. S. SELVARAJ4
SummaryGenetic variation at 59 protein coding loci (16 polymorphic) and 25 microsatellite loci was analysed for11 indigenous south-east Asian goat populations, and the Australian feral population, to determine themagnitude of genetic differentiation and the genetic relationships among the populations. Signi®cantdeviations from Hardy±Weinberg equilibrium were detected in one or more populations for eight ofthe nine protein loci with codominant alleles, and for microsatellites for all except the two Sri Lankanpopulations and for all but four loci. For both marker types, average inbreeding coef®cients (FIS) wereexceptionally high. Heterogeneity of deviations from Hardy±Weinberg equilibrium for the micro-satellites showed no differences for among loci within populations as compared with amongpopulations within loci. For protein loci, however, the former was higher, indicating selection affectingallele frequencies at some loci. The variance among protein loci was signi®cantly higher than amongmicrosatellite loci, further indicating selection at some protein loci. There was signi®cant differen-tiation among populations for both protein and microsatellite loci, most likely re¯ecting the geographyof south-east Asia, and the presumed spread of goats throughout the region. Phylogenies derived frompair-wise genetic distance estimates show some similar clustering for the microsatellite and proteinbased trees, but bootstrap support was generally low for both. A phylogeny based on the combined setof 38 protein and microsatellite loci showed better consistency with geography and higher bootstrapvalues. The genetic distance phylogeny and the Weitzman diversity tree derived from microsatellitedata showed some identical clusters, and both identi®ed the Ujung Pandang and Australia populationsas contributing most to overall genetic diversity.
Keywords: Biochemical polymorphism, microsatellites, genetic distance, phylogeny,inbreeding
Introduction
The indigenous goats of south-east Asia are not classi®ed into breeds, and all are similarphenotypically to the Kambing Katjang of Indonesia and Malaysia (DEVENDRA andNOZAWA 1976). However, since their spread through the region, local populations mayhave been largely isolated, and thus may now be genetically differentiated. The majority ofthe goats are kept by small holder farmers, primarily for meat production, and mating isuncontrolled and indiscriminate (DEVENDRA and NOZAWA 1976). Although generallysecondary to other farm enterprises, goat production may contribute substantially to farmincome, particularly for small holders. Nevertheless, the breeding and improvement ofindigenous goats has received relatively little attention in the region (FOOD AND FERTILIZER
TECHNOLOGY CENTER 1984), with only limited study of crossbreeding with exotic breeds(PANANDAM et al. 1987; HIROOKA et al. 1997).
J. Anim. Breed. Genet. 118 (2001), 213±233Ó 2001 Blackwell Wissenschafts-Verlag, BerlinISSN 0931±2668
Ms. received: 02.01.2001
U.S. Copyright Clearance Center Code Statement: 0931±2668/2001/1804±0213 $15.00/0 www.blackwell.de/synergy

There is a growing world-wide recognition of the need for conservation of livestockdiversity (FAO 1995), and for the characterization of breeds and populations, includingtheir genetic differentation and relationships. Although there have been some studies ofblood group and protein variation in Asian goats (NOZAWA et al. 1978; KATSUMATA et al.1982), and of breed relationships using microsatellites (YANG et al. 1999), no systematicstudy has considered populations across the region. We present here an analysis of geneticstructure and relationships of 12 geographic populations, using both protein coding andmicrosatellite loci.
Materials and methods
Experimental animals
The populations (Fig. 1) and numbers of animals studied for protein variation (600 in total± 80 males, 520 females) and for microsatellite variation (a subset of 308) were: Sri Lanka ±Sri Lanka South (52, 26), Sri Lanka North-Central (31, 30); Thailand ± Chiang Mai (50, 31),Hat Yai (39, 32); Malaysia ± Malaysian Agriculture Research and Development Institute/University of Malaya (55, 0 ± samples lost before DNA extraction due to freezerbreakdown), Sabah (51, 26), Sarawak (71, 24); Philippines ± Musuan (51, 26); Indonesia ±Medan (50, 26), Bogor (50, 25), Ujung Pandang (48, 27); Australia (52, 35). The Australianpopulation derived from some 1000 feral goats collected in western New South Wales in1978 and 1981, and subsequently maintained as a closed ¯ock. All other populations wereindigenous goats. With the exception of Medan, Hat Yai, Australia and Sri Lanka North-Central, animals were sampled from two or more subpopulations, generally differentvillages in the same area (except Hat Yai and Malaysia ± institutional ¯ocks). In all cases,owners were questioned in detail to minimize the sampling of closely related individuals.
Fig. 1. Map of South-East Asia, with locations shown for the 12 populations sampled
214 J. S. F. Barker et al.

Twenty millilitres of whole blood was collected from each animal into vacuum tubeswith heparin as anticoagulant. The blood was centrifuged for 5 min and plasma, white celllayer (buffy coat) and red cells were suctioned separately into 2 ml vials. These vials wereimmediately frozen in liquid nitrogen in the ®eld, and transferred later to a ±80°C freezerin the laboratory.
DNA extraction
DNA was extracted from frozen white blood cells. To each sample 2.5 volumes of 0.01 MKCl, 0.15 M NH4Cl, 0.1 mM EDTA was added and the sample kept on ice for 10 min.The nuclear pellet was spun down at 4000 rpm at 4°C and washed twice with 10 ml of Trisbuffered saline (0.14 M NaCl, 5 mM KCl, 0.25 mM Tris pH 7.4). The pellet wassuspended in 9 ml of TE buffer and then 500 ll of 0.5 M EDTA (pH 8), 40 ll ofProteinase-K (20 mg/ml) and 500 ll of 10% SDS was added. The resulting nuclear lysatewas incubated at 55°C for 3±4 h or overnight at 37°C. Following incubation 3 ml of 5 MNaCl and 13 ml of chloroform was added. The sample was mixed slowly on a rotator for30 min and then the precipatated proteins spun down at 4000 rpm for 30 min at roomtemperature. The top aqueous layer was recovered, being careful not to disturb the proteinlayer at the chloroform interface. DNA was precipitated by gentle addition of 2.5 volumesof ethanol. The resulting DNA strands were spooled out and washed twice with ice cold70% ethanol to remove excess salt. DNA was redissolved in 1±2 ml of TE buffer pH 8.0.
Protein loci
The 59 loci analysed and electrophoretic assay systems are given in Appendix 1. Assay andstaining methods for most are given by TAN et al. (1990, 1991, 1993) and BARKER et al.(1997a). Electrophoretic assay systems for other loci were: Blvr ± 0.1 M Phosphate pH 7.0buffer, 100 V for 2 h at 4°C, stain (RICHARDSON et al. 1986); Dpgm ± 0.1 M Tris, 0.1 MNaH2PO4, pH 7.4 buffer, 200 V for 1 h, stain (HARRIS and HOPKINSON 1976); Gsr ±0.13 M Tris±EDTA-borate pH 8.9 buffer, 200 V for 2 h, stain (RICHARDSON et al. 1986);Sordh ± 0.1 M Tris±HCl pH 8.0 buffer, 200 V for 100 min, stain (RICHARDSON et al.1986). Known standards were included on all gels to ensure consistency of genotypescoring. When null phenotypes were detected, the assay was repeated to con®rm absence ofactivity.
For each locus, 25 animals from each population were assayed initially, and 43 loci werefound monomorphic in all populations (Appendix 1). Null alleles were detected at ®ve loci(c Amy-1, Ca, Dia1±1, Dia1±2, and Xp), and variants at Amy and Np showed high and lowactivity, with high dominant. Mendelian inheritance with codominant alleles has beendemonstrated from family studies for Alb, Hb, Tf and Xp (see TAN et al. 1991), and for Ca,Dia1±1, Dia1±2, Mdh and Me (unpublished data).
Microsatellite loci
The 25 microsatellite markers used (Appendix 2) were selected from a panel of 51 on thebasis of ampli®cation, and ability to coload based on product size and dye label. Three(MAF70, OarFCB48 and OarFCB193) are ovine markers, the rest are bovine, and all areincluded in the linkage map analysis of VAIMAN et al. (1996). Genotyping was carried outusing an Applied Biosystems 373 DNA sequencer. One of each PCR primer pair waslabelled with proprietry dye TET, 6FAM or HEX (Perkin Elmer/ABI). PCR reactionswere carried out as previously described (MOORE et al. 1994) with some adjustment ofannealing temperature in some cases to produce strong and speci®c PCR product in goats(Appendix 2). PCR products were coloaded as indicated in Appendix 2 and separated on a12-cm well to read plates. Data was captured using GeneScan software (Perkin Elmer/
215Genetic variation in Capra hircus

ABI). Data analysis was carried out using Genotyper 2.0 software (Perkin Elmer/ABI) andindependently checked manually for genotyping errors. Genotypic data was thenassembled into Excel spreadsheets for further analysis. Three loci (INRA005, INRA063,INRA071) were not assayed in one or more populations because of degraded orinsuf®cient DNA.
Allelic frequency and heterozygosity
For the ®ve protein loci where null homozygotes were detected in one or morepopulations, genotype and allele frequencies were estimated using the computer programGENEPOP Version 3.1d (RAYMOND and ROUSSET 1995) separately for each subpopulationwhere null homozygotes were detected, and weighted (by number of animals in eachsubpopulation) overall allele frequencies estimated. Allele frequencies at the two loci whereone allele is dominant were computed using the bias correction of LYNCH and MILLIGAN
(1994). Thus for these seven loci, Hardy±Weinberg equilibrium is assumed.For the nine protein loci where the genotypes of each animal were determined directly
(i.e. excluding loci with null alleles, or dominance) and for the 22 microsatellite loci assayedin all populations, observed and expected heterozygosity estimates and average inbreedingcoef®cients for each population were obtained using the BIOSYS-1 computer program(SWOFFORD and SELANDER 1989), but tests for deviations from Hardy±Weinbergequilibrium were done using the exact tests of GENEPOP. Signi®cance levels for eachtest were determined by applying to the probability estimates calculated by GENEPOPthe sequential Bonferroni procedure (HOCHBERG 1988; LESSIOS 1992) over loci within eachpopulation. Heterogeneity of deviations from Hardy±Weinberg equilibrium for theprotein loci was examined among loci within each population and among populations foreach locus by treating the deviations as correlation coef®cients and testing accordingly(GAFFNEY et al. 1990; SOKAL and ROHLF 1981).
Statistical analyses
For those populations where samples were obtained from two or more subpopulations,deviations from Hardy±Weinberg equilibrium in the population could be due to geneticdifferences between subpopulations, and a consequent Wahlund effect. Thus tests ofHardy±Weinberg equilibrium and genotypic differentiation between subpopulations weredone using GENEPOP. For those population/locus combinations where genotypicdifferentiation was not signi®cant, overall allele frequencies for the population were used insubsequent analyses. Where genotypic differentiation among subpopulations was signi®-cant, then (i) if Hardy±Weinberg was not signi®cant for each subpopulation or for thepopulation, overall allele frequencies for the population were used, or (ii) if Hardy±Weinberg was not signi®cant for all or most subpopulations, but signi®cant for thepopulation, overall allele frequencies were used, but the Wahlund effect on genotypefrequencies was computed. Given the observed allele frequencies in each subpopulation,the expected heterozygote de®cit due to the Wahlund effect can be computed (LI 1976).Expressing this as a percentage of the observed heterozygote de®cit then measures thecontribution of the Wahlund effect to the observed heterozygote de®cit.
Tests for conformance of the protein-coding loci to neutral expectations were done usingthe ARLEQUIN package (SCHNEIDER et al. 2000). Tests for pair-wise linkage (genotypic)disequilibria among the microsatellite loci, separately for each population and overall, weredone using GENEPOP, and then applying the sequential Bonferroni procedure todetermine signi®cance levels. For the microsatellite loci and for the nine protein loci whosegenotypes were determined directly, F-statistics and their signi®cance were determinedusing FSTAT Version 2.7 (GOUDET 1995), with the sequential Bonferroni procedureapplied over loci in deriving signi®cance levels. These parameters of population structure
216 J. S. F. Barker et al.

are de®ned as the correlations between pairs of genes (i) within individuals (F) (ii) betweenindividuals in the same population (h), and (iii) within individuals within populations (f),and are analogous to WRIGHT'S (1951, 1978) FIT, FST and FIS, respectively. F-statistics forthe seven protein loci with null alleles or dominance were computed using the methods ofWEIR and COCKERHAM (1984), as implemented in the computer program DIPLOID (WEIR
1990), adapted for input of the numbers of each genotype at each locus. HierarchicalF-statistics were computed using the methods of WEIR and COCKERHAM (1984), asimplemented in the computer program GDA (LEWIS and ZAYKIN 1999), with Musuan andAustralia deleted as each had only one population sampled.
Mean gene diversity for each locus and genetic distances among populations (standardgenetic distance of NEI (1978) and the DA distance of NEI et al. (1983) were obtained usingthe DISPAN computer program (T. OTA, personal communication). REYNOLDS'distance (REYNOLDS et al. 1983) and the (dl)2 distance (GOLDSTEIN et al. 1995) wereobtained using the MICROSAT computer program (MINCH et al. 1995). In addition, theDA microsatellite distances were used to measure diversity, as proposed by WEITZMAN
(1992, 1993), and to evaluate expected losses of diversity due to extinction of individualpopulations (THAON D'ARNOLDI et al. 1998).
Isolation by distance was tested using data on the microsatellite loci and on the ninepolymorphic protein loci where the genotypes of each animal were determined directly.Estimates of h (WEIR and COCKERHAM 1984) for each pair of populations were computed,and pair-wise h/(1 ± h) values then were regressed on log (geographic distance) betweeneach pair of populations (ROUSSET 1997), and the signi®cance of the association estimatedusing MANTEL'S (1967) permutation test. A signi®cant association indicates geneticstructuring, and limited dispersal.
Results
For the 16 polymorphic protein loci, some populations show markedly different allelefrequencies for some loci, although there are few cases of consistent patterns for differentloci. One apparent pattern is for Australia and the Sri Lankan populations, where HbB andTfA have very high frequencies, whereas HbA shows highest frequency and TfA is at muchlower frequency in all other populations. Eleven loci were polymorphic in all 12populations, while one locus (Dia1±1) was polymorphic in only ®ve populations. The totalnumber of alleles detected at the microsatellite loci ranged from ®ve (ILSTS005) to 18(TGLA179). Two loci (BL25 and ILSTS005) were each ®xed in one population, whileBM757 was ®xed in six populations. As for the protein loci, some populations showmarkedly different microsatellite allele frequencies for some loci. In fact, for 19 of the 25loci, the overall most frequent allele was not the most frequent in one or more populations,and in some cases, was not even present in one population. Across the 25 loci, 85 of the 295alleles detected were unique to one population, with these alleles generally those at thelower or upper ends of the size distribution, and occurring only once. The Ujung Pandangpopulation was the most extreme, with 28 alleles of 283 (this population was not assayedfor INRA071) unique to this population, including three alleles of seven for BM757 andeight of 15 for TGLA272. Tables of allele frequencies for the polymorphic protein and themicrosatellite loci and the primary data ®les (genotypes of all animals) are available athttp://ansc.une.edu.au/ansc/genetics/± link through Barker, J. S. F. Measures of geneticvariation for each population (mean number of alleles per locus and observed and expectedheterozygosity) are given in Table 1. For all populations, average observed heterozygos-ities are less than the expected. Average gene diversity within populations (NEI 1973) forthe protein loci ranged from 0.117 (Cat) to 0.572 (Xp), with an overall mean of 0.339, andfor the microsatellite loci from 0.259 (INRA003) to 0.702 (MAF070), with an overall meanof 0.520.
217Genetic variation in Capra hircus

Tab
le1.
Sam
ple
size
san
dg
enet
icv
aria
bil
ity
inal
lp
op
ula
tio
ns
(sta
nd
ard
erro
rsin
par
enth
eses
)
Pro
tein
loci
Mic
rosa
tell
ite
loci
(22
loci
)
All
16p
oly
mo
rph
iclo
ciM
ean
het
ero
zygo
sity
(9lo
ci)a
Mea
nh
eter
ozy
gosi
ty
Po
pu
lati
on
Mea
nsa
mp
lesi
zep
erlo
cus
Mea
nn
o.
of
alle
les
per
locu
sD
irec
tco
un
tH
ard
y±W
ein
ber
gex
pec
ted
bM
ean
sam
ple
size
per
locu
sM
ean
no
.o
fal
lele
sp
erlo
cus
Dir
ect
cou
nt
Har
dy
±Wei
nb
erg
exp
ecte
db
Sri
Lan
ka
Sou
th47
.3(0
.43)
2.3
(0.2
1)0.
193
(0.0
42)
0.32
3(0
.063
)21
.4(0
.8)
5.6
(0.5
)0.
477
(0.0
60)
0.56
3(0
.055
)Sr
iL
ank
aN
-Cen
tral
30.9
(0.0
6)2.
1(0
.14)
0.19
5(0
.044
)0.
264
(0.0
48)
14.4
(1.0
)5.
3(0
.5)
0.48
6(0
.053
)0.
598
(0.0
52)
Ch
ian
gM
ai48
.4(0
.68)
2.3
(0.1
7)0.
269
(0.0
68)
0.34
9(0
.054
)23
.4(0
.8)
4.7
(0.5
)0.
393
(0.0
42)
0.49
6(0
.043
)H
atY
ai38
.6(0
.26)
2.2
(0.1
6)0.
342
(0.0
80)
0.38
3(0
.059
)23
.4(0
.9)
4.5
(0.4
)0.
427
(0.0
49)
0.49
4(0
.052
)M
AR
DI/
UM
52.6
(0.9
6)2.
4(0
.18)
0.17
5(0
.048
)0.
228
(0.0
54)
±±
±±
Sab
ah49
.4(0
.68)
2.3
(0.1
7)0.
195
(0.0
56)
0.25
0(0
.055
)17
.6(1
.0)
4.4
(0.4
)0.
308
(0.0
45)
0.43
0(0
.043
)Sa
raw
ak64
.4(2
.54)
2.4
(0.1
8)0.
243
(0.0
66)
0.29
6(0
.066
)17
.9(1
.2)
4.5
(0.4
)0.
329
(0.0
48)
0.45
8(0
.052
)M
usu
an47
.5(1
.35)
2.5
(0.1
8)0.
339
(0.0
88)
0.38
2(0
.052
)21
.6(0
.6)
5.3
(0.5
)0.
447
(0.0
58)
0.57
6(0
.058
)M
edan
47.1
(1.1
2)2.
4(0
.18)
0.25
4(0
.049
)0.
336
(0.0
41)
16.8
(1.0
)4.
3(0
.4)
0.41
7(0
.057
)0.
478
(0.0
50)
Bo
gor
49.1
(0.4
5)2.
3(0
.15)
0.24
1(0
.073
)0.
305
(0.0
58)
21.3
(0.7
)5.
9(0
.7)
0.47
6(0
.047
)0.
556
(0.0
50)
Uju
ng
Pan
dan
g47
.0(0
.42)
2.4
(0.1
8)0.
218
(0.0
50)
0.35
5(0
.057
)20
.9(0
.8)
5.6
(0.5
)0.
379
(0.0
45)
0.58
1(0
.042
)A
ust
rali
a51
.8(0
.17)
2.3
(0.1
8)0.
185
(0.0
30)
0.31
5(0
.046
)19
.5(2
.0)
5.4
(0.5
)0.
451
(0.0
49)
0.66
2(0
.049
)
a Lo
ciw
ho
sege
no
typ
esw
ere
enu
mer
ated
com
ple
tely
.bU
nb
iase
des
tim
ate
(see
NE
I19
78)
218 J. S. F. Barker et al.

Signi®cant deviations from Hardy±Weinberg equilibrium were detected in one or morepopulations for eight of the nine protein loci where genotypes were enumeratedcompletely (Table 2). Three loci (Gc, Mdh, Me) showed signi®cant deviations in eightor more populations. All populations had both positive and negative signi®cant deviations,while deviations for each locus across populations were consistently positive (observedheterozygote de®ciency) for Gc, Mdh and Me. For Alb, all populations showed negativedeviations, except for Ujung Pandang (signi®cantly positive). Observed heterozygoteexcesses (negative f) were found for Lap-1 in all but two populations. Tests forheterogeneity of deviations from Hardy±Weinberg equilibrium for the protein loci(Table 3) show greater heterogeneity among loci (higher v2 values) within each populationthan among populations for each locus. For the microsatellite loci, signi®cant deviationsfrom Hardy±Weinberg equilibrium were detected in all except the two Sri Lankanpopulations, and for all but four loci (Table 2). All signi®cant deviations except one(TGLA325 in Medan) were positive (observed heterozygote de®ciency). For both proteinand microsatellite loci, Wahlund effects account for less than 40% of the observedheterozygote de®cits for a few locus/population combinations (Table 2), and averageinbreeding coef®cients (FIS) for each population are very high (Table 4). Tests forheterogeneity of deviations from Hardy±Weinberg equilibrium for the microsatellite locihad similar total v2 values for heterogeneity among loci and for among populations. Forboth protein and microsatellite loci, Ujung Pandang had the highest frequency ofsigni®cant deviations. Strong evidence for selection affecting allele frequencies at protein-coding loci was found for Amy (one population, p < 0.01; eight populations,0.05 < p < 0.10), Np (seven ± p < 0.05; two ± 0.05 < p < 0.10), and Xp (seven ±p < 0.05; three ± 0.05 < p < 0.10). Signi®cant effects (p < 0.05) in two ± ®ve populationswere found for Ca, Dia1±2, Lap-1 and Mdh. In all cases, the observed allele frequencydistributions were more even than expected under the neutral model.
Signi®cant linkage disequilibria (p < 0.05) were detected in the overall microsatellite datafor 16 locus pairs (of a possible 300). For individual populations, the numbers of testssigni®cant after Bonferroni correction were: Ujung Pandang ± 7, Musuan ± 5, Sri LankaSouth ± 2, and Sarawak ± 1. Only one of the signi®cant cases (in both overall and UjungPandang) was for markers on the same chromosome (TGLA272 and TGLA378 ± unlinkedon chromosome 10).
Overall means for the F-statistics are signi®cantly different from zero, while thoseestimated for the nine protein loci with codominant alleles and for the microsatellite loci(Table 5) are not signi®cantly different. For the seven protein loci with null alleles ordominance, Hardy±Weinberg was assumed in estimating genotype frequencies, so festimates are not expected to differ from zero. The signi®cant F-value for Dia1±2, and highbut not signi®cant estimates for Ca and Dia1±1 most likely result from undetected nullheterozygotes in some populations.
To quantify genetic differentiation among populations for microsatellite loci, SLATKIN
(1995) derived the RST statistic under the assumptions of the generalized stepwise mutationmodel. As we wish to compare the microsatellite results with those from the protein loci,and as RST and WEIR and COCKERHAM'S (1984) h statistic are not expected to be greatlydifferent for short-term differentiation of populations (SLATKIN 1995), we present results interms of h. As a check, however, both h and q (an estimator of RST, GOODMAN 1997) wereestimated for the 13 microsatellite loci where the total length of the ¯anking sequence wasknown. Over all loci, h and q were similar (0.132 and 0.128, respectively), and for pair-wiseestimates, the regression coef®cient for q on h was 0.960 � 0.163. Analyses of populationdifferentiation (h in Table 5) show signi®cant differentiation among populations for bothprotein and microsatellite loci, but with mean estimates for each class of locus notsigni®cantly different. As pointed out by ESTOUP and ANGERS (1998) and HEDRICK (1999),the high level of polymorphism for microsatellite loci is expected to increase the power ofexact tests for population differentiation, and to decrease the values of FST, as compared
219Genetic variation in Capra hircus

Tab
le2.
Sig
ni®
can
tte
sts
of
dev
iati
on
fro
mH
ard
y±W
ein
ber
geq
uil
ibri
um
.F
igu
res
giv
enfo
rsi
gn
i®ca
nt
test
sar
ef-
val
ues
(WE
IRan
dC
OC
KE
RH
AM
1984
)
Lo
cus
Sri
Lan
ka
Sou
thSr
iL
ank
aN
-Cen
tral
Ch
ian
gM
aiH
atY
aiM
AR
DI/
UM
Sab
ahSa
raw
akM
usu
anM
edan
Bo
gor
Uju
ng
Pan
dan
gA
ust
rali
a
Pro
tein
loci
Alb
0.74
7C
atA
AA
Gc
0.67
10.
294a
0.40
80.
325
0.51
80.
410
0.57
80.
386
Hb
0.56
10.
461
Md
h1.
000
0.51
10.
758
0.83
1a0.
716a
0.49
90.
822
0.40
90.
868
Me
0.85
80.
464
0.59
40.
514
0.61
90.
590
0.91
10.
658
0.83
30.
605
0.79
8L
ap-1
)0.
550
Tf
A0.
142
Pt-
Tf
0.50
7A
A0.
441
A
Mic
rosa
tell
ite
loci
BL
25A
CB
0.78
7B
M75
7A
AA
CB
AA
B0.
519
AB
M32
05C
0.56
40.
558
BM
C10
09C
0.66
0a
CSS
M02
6C
0.39
8a0.
109
0.84
7IL
STS0
05C
AB
INR
A00
3C
BB
0.72
60.
524
INR
A00
5C
C0.
466
INR
A06
3C
C0.
285
CIN
RA
071
CC
0.81
3C
CC
CIN
RA
177
CM
AF
70C
Oar
FC
B48
C0.
164
Oar
FC
B19
3C
0.23
61.
000
0.43
5
220 J. S. F. Barker et al.

Tab
le2.
con
tin
ued
Lo
cus
Sri
Lan
ka
Sou
thSr
iL
ank
aN
-Cen
tral
Ch
ian
gM
aiH
atY
aiM
AR
DI/
UM
Sab
ahSa
raw
akM
usu
anM
edan
Bo
gor
Uju
ng
Pan
dan
gA
ust
rali
a
RM
004
C0.
468
0.62
51.
000
0.57
6R
M00
6C
0.48
4a0.
709
0.50
90.
190
0.41
50.
700
RM
044
C0.
546
RM
188
CR
ME
23C
0.21
1T
GL
A75
BC
0.64
40.
223
0.49
2T
GL
A17
90.
598
C0.
592
0.37
00.
352
TG
LA
245
C0.
837
0.79
20.
907
BT
GL
A27
2C
0.28
30.
654
TG
LA
325
0.59
70.
316
C0.
654
)0.
827
0.17
8T
GL
A37
8C
0.31
90.
268
0.42
7
A,
mo
no
mo
rph
ic;
B,
on
ly1
het
ero
zygo
tein
sam
ple
;C
,n
ot
assa
yed
.a W
ahlu
nd
acco
un
tsfo
r9±
20%
of
ob
serv
edh
eter
ozy
gote
de®
cit
for
pro
tein
loci
,an
d30
±40%
for
mic
rosa
tell
ite
loci
221Genetic variation in Capra hircus

with allozyme loci. For these goat populations, there is little or no difference between thetwo classes of markers, either for FST or exact tests of population differentiation. Allmicrosatellite and the nine protein loci with codominant alleles had h-values signi®cantlygreater than zero (GENEPOP exact tests), and only two loci showed no signi®cantdifferentiation among populations (Amy and Xp ± t-test using jackknife estimates,Table 5). Further, all pair-wise comparisons (across all loci) of populations for genotypicfrequencies were highly signi®cant (p < 0.001) for microsatellites, and (with exceptions ofHat Yai/Musuan, Bogor/Ujung Pandang and Medan/Ujung Pandang ± p < 0.01, ChiangMai/Musuan ± p < 0.05) for protein loci.
Population subdivision was analysed among countries (hP) and among populationswithin countries (hS). For the nine protein loci where genotypes were enumeratedcompletely, estimates were 0.086 and 0.131, respectively, and for the 25 microsatellite loci0.049 and 0.150, with all estimates signi®cantly greater than zero.
The regressions of h/(1 ± h) on log (geographic distance), estimated separately for theprotein and microsatellite loci, but excluding Australia as a nonindigenous population,were not signi®cant, either for all pairs of populations, or when excluding those < 1500 km
Table 3. Tests for heterogeneity of deviations from Hardy±Weinberg equilibrium for the proteinloci
Heterogeneity among loci for each population Heterogeneity among populations for each locus
Population d.f. v2 Locus d.f. v2
Sri Lanka South 6 71.13*** Alb 10 58.90***Sri Lanka N-Central 7 347.98*** Cat 8 21.33**Chiang Mai 6 44.34*** Gc 10 26.11**Hat Yai 7 38.21*** Hb 10 41.27***MARDI/UM 7 53.86*** Mdh 10 310.33***Sabah 5 80.89*** Me 10 60.13***Sarawak 6 61.41*** Lap-1 10 37.43***Musuan 7 148.48*** Tf 9 6.77Medan 7 46.84*** Pt-Tf 8 29.00***Bogor 7 122.07***Ujung Pandang 7 43.81***Australia 7 103.30***
**p < 0.01, ***p < 0.001
Table 4. Average inbreeding coef®cients (f = FIS) estimated for each population from data on nineprotein loci and 22 microsatellite loci
Population Protein loci Microsatellite loci
Sri Lanka South 0.397 0.127Sri Lanka N-Central 0.252 0.150Chiang Mai 0.226 0.190Hat Yai 0.095 0.119MARDI/UM 0.227 ±Sabah 0.212 0.257Sarawak 0.183 0.249Musuan 0.109 0.206Medan 0.233 0.090Bogor 0.201 0.118Ujung Pandang 0.382 0.333Australia 0.407 0.277
222 J. S. F. Barker et al.

Table 5. F-statistics analyses for (1) nine allozyme loci (all genotypes de®ned (2) seven allozymeloci with null homozygotes or dominance and (3) 25 microsatellite loci. For (1) and (3), signi®cancefrom permutation tests in the FSTAT program; for (2), signi®cance from t-test using estimated
standard deviation
Locusa f (FIS) Q (FST) F (FIT)
Protein lociAlb )0.105 (0.105) 0.045 (0.020)*** )0.056 (0.099)Cat 0.148 (0.063)* 0.069 (0.031)*** 0.208 (0.074)***Gc 0.369 (0.063)*** 0.076 (0.049)*** 0.415 (0.044)***Hb 0.258 (0.073)*** 0.449 (0.100)*** 0.589 (0.074)***Mdh 0.589 (0.067)*** 0.036 (0.021)*** 0.603 (0.062)***Me 0.679 (0.045)*** 0.069 (0.036)*** 0.702 (0.047)***Lap-1 )0.124 (0.083) 0.112 (0.043)*** 0.001 (0.082)Tf )0.015 (0.042) 0.111 (0.047)*** 0.097 (0.059)*Pt-Tf 0.323 (0.082)*** 0.035 (0.016)*** 0.347 (0.079)***Meanb 0.256 (0.120)*** 0.121 (0.047)*** 0.345 (0.105)***
Loci for which exact tests of signi®cance are not possible (dominance or null alleles)Amy 0.009 (0.005) 0.009 (0.009) 0.017 (0.009)Ca 0.179 (0.103) 0.149 (0.039)*** 0.304 (0.109)**c Amy-1 )0.013 (0.013) 0.154 (0.035)*** 0.143 (0.034)***Dia1±1 0.159 (0.204) 0.225 (0.088)* 0.339 (0.140)*Dia1±2 0.217 (0.089)* 0.201 (0.074)** 0.377 (0.108)***Np )0.005 (0.004) 0.024 (0.011)* 0.019 (0.010)Xp 0.058 (0.039) 0.095 (0.072) 0.149 (0.089)Meanb 0.085 (0.039)* 0.106 (0.031)*** 0.183 (0.062)**
Microsatellite lociBL25 0.329 (0.129)*** 0.079 (0.027)*** 0.384 (0.130)***BM757 0.468 (0.315)** 0.109 (0.066)*** 0.553 (0.356)***BM3205 0.281 (0.071)*** 0.131 (0.026)*** 0.375 (0.066)***BMC1009 0.155 (0.058)*** 0.115 (0.039)*** 0.253 (0.066)***CSSM026 0.172 (0.077)*** 0.178 (0.063)*** 0.319 (0.077)***ILSTS005 0.278 (0.108)*** 0.085 (0.032)*** 0.340 (0.101)***INRA003 0.408 (0.126)*** 0.442 (0.271)*** 0.687 (0.229)***INRA005 0.206 (0.062)*** 0.093 (0.028)*** 0.278 (0.046)***INRA063 0.249 (0.069)*** 0.208 (0.096)*** 0.401 (0.062)***INRA071 0.502 (0.109)*** 0.207 (0.031)*** 0.607 (0.096)***INRA177 0.123 (0.039)** 0.116 (0.031)*** 0.224 (0.044)***MAF70 0.110 (0.039)** 0.068 (0.020)*** 0.170 (0.040)***OarFCB48 0.161 (0.058)*** 0.175 (0.051)*** 0.308 (0.070)***OarFCB193 0.184 (0.066)*** 0.123 (0.059)*** 0.285 (0.086)***RM004 0.429 (0.104)*** 0.156 (0.109)*** 0.519 (0.111)***RM006 0.262 (0.079)*** 0.108 (0.033)*** 0.342 (0.071)***RM044 0.132 (0.058)*** 0.104 (0.023)*** 0.223 (0.060)***RM188 0.210 (0.051)*** 0.179 (0.040)*** 0.352 (0.058)***RME23 0.143 (0.034)** 0.189 (0.050)*** 0.305 (0.051)***TGLA75 0.220 (0.065)*** 0.125 (0.046)*** 0.317 (0.058)***TGLA179 0.344 (0.058)*** 0.086 (0.024)*** 0.400 (0.052)***TGLA245 0.490 (0.174)*** 0.130 (0.069)*** 0.548 (0.133)***TGLA272 0.146 (0.090)** 0.221 (0.088)*** 0.340 (0.136)***TGLA325 0.182 (0.113)*** 0.143 (0.034)*** 0.298 (0.093)***TGLA378 0.150 (0.057)*** 0.150 (0.030)*** 0.277 (0.049)***Meanb 0.230 (0.023)*** 0.143 (0.010)*** 0.340 (0.023)***
aStandard deviations in parentheses ± estimate from jackknife over populations, bStandard deviations in par-entheses ± estimate from jackknife over loci. *p < 0.05, **p < 0.01, ***p < 0.001
223Genetic variation in Capra hircus

apart. Up to 1500 km, h/(1 ± h) values were < 0.2, but for greater distances the valuesranged from zero to 0.473 for the protein loci and 0.082±0.278 for the microsatellite loci.
TAKEZAKI and NEI (1996) showed that the DA distance is generally best for inferring thecorrect topology for both the in®nite alleles model (protein loci) and for the stepwisemutation model (microsatellites). Thus DA was used to derive dendrograms of geneticrelationships among the populations, constructed as neighbour-joining trees (SAITOU andNEI 1987). For the protein loci, most nodes were not very strongly supported, but thetopology of most populations was consistent with what might be expected from theirgeography. The microsatellite based tree showed some similar clustering of the popula-tions, although again very few nodes were strongly supported. Microsatellite based treesusing NEI's standard (D) and REYNOLDS' distances (not shown) were very similar toeach other, and had the same main clusters as the DA tree. In contrast, the (dl)2 tree showeda markedly different topology. However, nearly 80% of the pair-wise (dl)2 distances werenot signi®cant, or signi®cant only at p < 0.05, whereas more than 96% of the D andREYNOLDS' distances were signi®cant at p < 0.01 or better. As we have no reason tosuspect that either the protein or microsatellite tree is distorted (e.g. by bottlenecks of somepopulations ± see BARKER et al. 1997b), DA distances were computed for the combined setof 38 loci, and used to construct a neighbour joining tree (Fig. 2). This tree shows betterconsistency with geography and higher bootstrap values than either of the microsatellite orprotein-based trees.
The WEITZMAN diversity tree based on the microsatellite DA distances (Fig. 3), andthe marginal losses of diversity for each population (Table 6) show that the losses ofdiversity due to extinction of any population would be highest for Ujung Pandang andAustralia, and lowest for Sri Lanka South and Sarawak.
Discussion
As expected, the microsatellite loci showed many more alleles/locus and higher geneticdiversity than the protein loci. Average numbers of alleles/locus were 11.8 (range 5±18) formicrosatellites and 3.0 (range 2±4) for protein loci. Average gene diversities were 0.520(range 0.259±0.702) for microsatellites and 0.339 (range 0.117±0.572) for protein loci. Ahigh proportion of the locus-population combinations showed signi®cant departures from
Fig. 2. Dendrogram of relationships among 11 goat populations, using DA genetic distances and theneighbour-joining method of clustering ± based on 38 loci (16 protein and 22 microsatellite). Numbers
on the nodes are percentage bootstrap values from 1000 replications of resampled loci
224 J. S. F. Barker et al.

Hardy±Weinberg equilibrium (34.7% for protein and 21.7% for microsatellite loci), withonly one signi®cant case of an observed excess of heterozygotes for each class of marker(Table 2). Consequently, average observed heterozygosity was less than expected for all
Fig. 3. Diversity dendrogram for 11 goat populations, derived using WEITZMAN'S (1992) method andthe pair-wise DA genetic distances among the populations
Table 6. Marginal losses of Weitzman diversity that would be due to extinction of each population
Population Marginal loss (%)
Ujung Pandang 17.66Australia 13.56Chiang Mai 9.43Hat Yai 9.18Medan 8.82Sri Lanka N-Central 8.42Sabah 8.33Bogor 8.21Musuan 8.14Sarawak 7.69Sri Lanka South 6.22
225Genetic variation in Capra hircus

populations, for both protein and microsatellite loci (Table 1), and mean f (FIS) estimateswere extremely high, ranging from 0.095 (Hat Yai) to 0.407 (Australia) for protein loci, and0.090 (Medan) to 0.333 (Ujung Pandang) for microsatellites (Table 4), with overall meansfor both protein loci (0.256) and for microsatellite loci (0.230) signi®cantly different fromzero (Table 5). These high f estimates contrast strongly with most studies of livestockpopulations, where f generally is not signi®cantly different from zero, even for rare breeds(e.g. ZANOTTI CASATI et al. 1988; CIAMPOLINI et al. 1995; BEHARA et al. 1998; CANÄ ON et al.2000). However, signi®cant heterozygote de®ciencies have been reported in some studies.LUIKART et al. (1999) found a signi®cant de®cit of heterozygotes at one microsatellite locus(of 22) in all four goat breeds studied, and at another locus for three of the breeds, with aglobal de®cit of heterozygotes across loci. For any single locus, however, the de®cit wasgenerally slight and not signi®cant. For six of 15 cattle breeds, LOFTUS et al. (1999) foundsigni®cant deviations (p < 0.01) from Hardy±Weinberg equilibrium across all 20 micro-satellite loci, due to heterozygote de®ciency. In both of these studies, the heterozygotede®ciencies were ascribed to Wahlund effects, due to pooling samples (within breeds) fromdifferent breeding units (i.e. subpopulation structure).
The extreme heterozygote de®ciencies found in these south-east Asian native goatpopulations could be due to any one or more of the following: segregation ofnonamplifying (null) alleles, Wahlund effects, scoring bias (heterozygotes scored incor-rectly as homozygotes), selection against heterozygotes or inbreeding. Distinguishingamong these generally is dif®cult (CHRISTIANSEN et al. 1974). However, protein loci withnull alleles known to be segregating are not included in the above estimates, while nullalleles at other loci could not have been at high enough frequencies to account for thede®cits. In any case, nulls are most unlikely to be segregating at most other protein and allmicrosatellite loci. Similarly, possible Wahlund effects (localities with known subpopu-lations) do not account for more than 40% of the observed heterozygote de®cits, and thenonly for some loci in a few populations. Scoring bias or selection against heterozygotesmay be possible for a few loci, but not for essentially all loci. Overall then, it seems thatthere is strong inbreeding within these south-east Asian native goat populations,presumably resulting in some way from the uncontrolled and indiscriminate mating(DEVENDRA and NOZAWA 1976), leading to small effective population sizes, breedingbetween relatives and consequent genetic drift. This is in direct contrast to the results ofLUIKART et al. (1999) and LOFTUS et al. (1999) noted previously.
Inbreeding levels in the Australian population, which had the highest average f forprotein loci (0.407) and second highest for microsatellites (0.227) are more dif®cult toreconcile. The animals sampled were derived from a very large feral population which has avery mixed ancestry ± indigenous goats from South Africa and present day Bangladesh,imported to the early European settlement in Australia (late 1700s), Angora and Cashmereimported in the early to mid-1800s (PARSONSON 1998 and, personal communication), andmost likely a number of breeds from England. We have no knowledge of the proportion ofgenes in the feral population contributed by each of these ancestral breeds, but it is thisdiverse ancestry which is no doubt re¯ected in the Australian population having thehighest expected heterozygosity for microsatellite loci (Table 1). However, the commonfactor in the Australian feral and the Asian populations may well be `uncontrolled mating'.In feral goat populations, and presumably in the uncontrolled Asian populations, breedinggroups most likely comprise a dominant male and some number of females. Many malesmay aggregate in the vicinity of oestrus females, but the dominant male generally excludessubordinate males, and presumably sires most of the offspring (O'BRIEN 1988). Withphilopatric females, breeding groups will become genetically differentiated (CHESSER 1991),leading to Wahlund effects at our level of sampling (i.e. sampling at random from the wholepopulation). In addition, the breeding groups will be expected to be inbred, with theunequal sex ratio of breeding animals and variance in sire family size causing the effectivepopulation size to be small and inbreeding to accumulate. If this mating structure is the
226 J. S. F. Barker et al.

primary factor, then inbreeding should be less in closely managed breeds. Few data areavailable, but for four Spanish goat breeds and data on three protein loci (BARBANCHO
et al. 1984), we compute an overall f-value that is not signi®cantly different from zero(0.007 � 0.011).
GAFFNEY et al. (1990) argued that if heterozygote de®ciencies were the result of non-random mating, they should be consistent in magnitude, i.e. not show signi®cantheterogeneity among loci within a population. HOULE (1994) advised caution in makingthis argument, because of sampling variation in f-values, variation in true f-values owing to®nite population size and possible selection obscuring evidence of inbreeding. For theprotein loci here, all populations showed highly signi®cant heterogeneity among loci(Table 3). Although heterogeneity among populations for each locus was signi®cant foreight of the nine loci, the magnitude of the v2 values was generally less (Table 3). That is,deviations from Hardy±Weinberg equilibrium for individual loci tend to be moreconsistent across populations than across loci within each population. In contrast,heterogeneity among loci and among populations were of similar magnitude for themicrosatellite loci. Thus the more consistent deviations across populations for the proteinloci suggest that selection has affected allele and genotype frequencies at some of them.
Detecting selection
The difference between the protein and microsatellite loci in the heterogeneity ofdeviations from Hardy±Weinberg, and in the rankings of populations for observedheterozygosity indicates something other than drift or inbreeding has affected one or otherclass of loci. Comparison of geographic variation in allele frequencies for different classesof polymorphic loci is a powerful method for detecting effects of natural selection(MCDONALD 1994). As the effects of drift and migration are the same for all alleles at allneutral polymorphic loci, all such alleles have the same expected FST, and there should beno signi®cant heterogeneity of FST estimates. BARKER et al. (1997b) used the modi®edLEWONTIN and KRAKAUER (1973) test of POGSON et al. (1995) to compare the mean FST andthe variance of FST estimates from the two classes of loci, treating all polymorphisms astwo-allele polymorphisms, by using the frequencies of the overall most common allele andpooling the others. Thus unweighted FST (as computed by BIOSYS-1) were estimated fromthe collapsed two-allele data for each of the microsatellite and protein loci. Mean FST andvariance were 0.1904 and 0.002657 for microsatellites, and 0.1227 and 0.011763 for proteinloci. Applying the modi®ed LEWONTIN-KRAKAUER tests, the means are not signi®cantlydifferent, but the variances are (v2
(10) � 44.272, p < 0.001). Thus the 16 protein loci aremore heterogeneous than expected from the variation shown by the microsatellite loci,indicating (assuming the microsatellite loci are neutral) selection affecting some of theprotein loci. A rough test for this selection is to treat the ratio of the FST for each proteinlocus to the mean FST for microsatellites as a variance ratio F-test, and to do a two-tailedtest of signi®cance ( d.f. � 10, 10). On this test, six protein loci show a signi®cantly lowerFST estimate (Alb, Amy, Mdh, Np, Pt-Tf and Xp), suggesting some form of selectionaffecting genetic variation at these loci. Results of the direct tests con®rmed selectionaffecting allele frequencies at Amy, Np and Xp in most populations, and in two to ®vepopulations for Ca, Dia1±2, Lap-1 and Mdh, but not for Alb and Pt-Tf. In all cases ofsigni®cant deviation from neutrality expectations, there was an excess of genetic diversityfor the number of alleles observed, consistent with selection favouring heterozygotes.
Population differentiation and history
Signi®cant differentiation among populations is shown by h estimates (Table 5), withsimilar mean estimates for protein and microsatellite loci. This differentiation undoubtedlyre¯ects the geography of South-East Asia, with its vast archipelago of islands through
227Genetic variation in Capra hircus

Indonesia and the Philippines, and the spread of goats throughout the region. DEVENDRA
and NOZAWA (1976) postulate this spread from the centre of domestication in western Asia,through India, and possibly reaching South-East Asia by 2000 years ago. However, theyquote YAMANE (1943) as suggesting that goats entered Indonesia only `after the Mosleminvasion (fourteenth century).' Our data support this latter suggestion. Using NEI'sstandard genetic distances from the microsatellite data, and assuming an averagemicrosatellite mutation rate of 1.2 ´ 10±3 (WEBER and WONG 1993), the average divergencetime between the two Sri Lankan populations (as representing the Indian subcontinent) andMedan and Bogor in Indonesia, is 64 generations (say 250 years). For a mutation rate of5.6 ´ 10±4 (WEBER and WONG 1993 ± dinucleotide repeats), the time is 138 generations(550 years). Given the traditional communication routes from western Asia and the Indiansubcontinent to South-East Asia, introductions would have continued over time, so theestimated divergence times above would be conservative of the time of ®rst introduction.Goats may have entered Indonesia directly from western Asia or through the Indiansubcontinent, but the Musuan/Sabah/Sarawak cluster (Fig. 2) indicates a possible separatedispersion via China, as suggested previously for the spread of swamp buffalo throughSouth-East Asia (BARKER et al. 1997b; LAU et al. 1998).
After the initial spread through the region, continued movement of animals betweenpopulations would cause the true relationships to be reticulate rather than strictlybifurcating, most likely contributing to the low bootstrap support for some of the nodes(Fig. 2). We note, however, that for pair-wise population comparisons of genotypicdifferentiation across all loci, all were highly signi®cant (p < 0.001) for microsatellites, andall but four for protein loci. Further, the dendrogram of relationships among the south-eastAsian goat populations, based on the combined set of 38 loci (Fig. 2), is consistent withtheir geography and the most likely pathways of dispersal through the region. The closerelationship of the Australian feral population to the Sri Lankan populations indicates thatthe early goat introductions to Australia from the Indian subcontinent and nearby regionshave made a major contribution to the genetic composition of the Australian population.
Although the microsatellite-based phylogeny and the Weitzman diversity tree (Fig. 3)showed some identical clusters, it should not be expected that they will give the sameinformation (THAON D'ARNOLDI et al. 1998). But as branch lengths in the neighbour joiningphylogeny indicate the magnitude of the differences between populations, one mightexpect a positive relationship between branch length for a population and expected loss ofdiversity on extinction of that population. Both the microsatellite phylogeny and theWeitzman diversity tree were derived from the DA distances, and for these goatpopulations, the regression coef®cient for diversity loss on branch lengths was0.779 � 0.076 (p < 0.001). Thus the branch lengths in the neighbour joining DA phylogenyapparently give essentially the same information as the Weitzman analysis on expected lossof diversity due to extinction of individual populations. This may not be true for other setsof populations, and of course, the Weitzman analysis allows estimation of expected loss ofdiversity if two or more breeds were to become extinct.
In addition to the phylogenetic relationships among the populations, we note the longbranch lengths for Australia and Ujung Pandang in the microsatellite tree (not shown) andin the combined tree (Fig. 2). These two populations also were identi®ed by the Weitzmananalysis (Fig. 3, Table 6) as those whose extinction would cause the greatest loss ofdiversity. They are exceptional in a number of ways ± higher expected heterozygosity andhigher proportion of private alleles than other populations (9.9% of alleles in UjungPandang are unique to that population, and 5.2% for Australia), but also highest inbreedingcoef®cients (FIS ± Table 6). Although there were relatively few cases of signi®cant linkagedisequilibrium overall, these two populations contrast in that Ujung Pandang showed morethan any other population, while Australia had none. Yet the Australian feral population,because of its recent and diverse breed ancestry, might have been expected to exhibit higherlinkage disequilibrium than other populations. The long branch lengths for these two
228 J. S. F. Barker et al.

populations and the signi®cant linkage disequilibrium for Ujung Pandang are compatiblewith the high inbreeding coef®cients (FIS). With such high inbreeding, however, loss of lowfrequency alleles and reduced observed heterozygosity would be expected, yet thesepopulations have above average to very high expected heterozygosity for both protein andmicrosatellite loci.
Acknowledgements
We gratefully acknowledge the cooperation and assistance during sample collection of ProfessorC. CHANTALAKHANA, Kasetsart University, Dr B. CHEVA-ISARAKUL, Chiang Mai University andMs. ANCHARLEE, Department of Livestock Development, Thailand; Professor R. L. ANACLETO,Central Mindanao University of the Philippines; Dr P. ABEYNAYAKE, University of Peradeniya, SriLanka; Dr SUDARISMAN and Dr P. DANIELS, Balitvet, Indonesia; Dr S. P. CHIA, Department of AnimalServices, Sabah; Dr K. Y. HSIUNG, Department of Agriculture, Sarawak; Dr M. HILMI, UniversitiPutra Malaysia; and Dr B. RESTALL, NSW Department of Agriculture and Fisheries, Wollongbar,Australia. We are grateful to Ms ROHANI MAN and Ms NORLIZA OSMAN for laboratory assistance, andto Dr J.-L. FOULLEY for carrying out the Weitzman analysis. This work was supported by theAustralian Centre for International Agricultural Research (Project no. 8364 and Contract AS1 : 96/66), the Malaysian Program for Intensi®cation of Research in Priority Areas (Project no. 1±07±05±057), Universiti Putra Malaysia and the University of Malaya.
References
BARBANCHO, M.; LLANES, D.; MORERA, L.; GARZOÂ N, R.; RODERO, A., 1984: Genetic markers in theblood of Spanish goat breeds. Anim. Bld Groups Biochem. Genet. 15: 207±212.
BARKER, J. S. F.; TAN, S. G.; SELVARAJ, O. S.; MUKHERJEE, T. K., 1997a: Genetic variation within andrelationships among populations of water buffalo (Bubalus bubalis). Anim. Genet. 28: 1±13.
BARKER, J. S. F.; MOORE, S. S.; HETZEL, D. J. S.; EVANS, D.; TAN, S. G.; BYRNE, K., 1997b: Geneticdiversity of Asian water buffalo (Bubalus bubalis): microsatellite variation and a comparison withprotein-coding loci. Anim. Genet. 28: 103±115.
BEHARA, A. M. P.; COLLING, D. T.; COTHRAN, E. G.; GIBSON, J. P., 1998: Genetic relationshipsbetween horse breeds based on microsatellite data: applications for livestock conservation.Proceedings 6th Wld. Cong. Genet. Appl. Livestock Prod. 28: 119±122.
CANÄ ON, J.; CHECA, M. L.; CARLEOS, C.; VEGA-Pla, J. L.; VALLEGO, M.; DUNNER, S., 2000: The geneticstructure of Spanish Celtic horse breeds inferred from microsatellite data. Anim. Genet. 31: 39±48.
CHESSER, R. K., 1991: Gene diversity and female philopatry. Genetics 127: 437±447.CHRISTIANSEN, F. B.; FRYDENBERG, O.; GYLDENHOLM, A. O.; SIMONSEN, V., 1974: Genetics of Zoarces
populations VI. Further evidence, based on age group samples, of a heterozygote de®cit in theESTIII polymorphism. Hereditas 77: 225±236.
CIAMPOLINI, R.; MOAZAMI-GOUDARZI, K.; VAIMAN, D.; DILLMANN, C.; MAZZANTI, E.; FOULLEY, J.-L.;LEVEZIEL, H.; CIANCI, D., 1995: Individual multilocus genotypes using microsatellite polymor-phisms to permit the analysis of the genetic variability within and between Italian beef cattlebreeds. J. Anim. Sci. 73: 3259±3268.
DEVENDRA, C.; NOZAWA, K., 1976: Goats in South East Asia ± their status and production. Z. Tierz.ZuÈ chtbiol. 93: 101±120.
ESTOUP, A.; ANGERS, B., 1998: Microsatellites and minisatellites for molecular ecology: theoretical andempirical considerations. In: CARVALHO, G. ed., Advances in Molecular Ecology. IOS Press,Amsterdam, pp. 55±86.
FAO., 1995: World Watch List for Domestic Animal Diversity, 2nd edn., FAO, Rome, Italy.FOOD AND FERTILIZER TECHNOLOGY CENTER, 1984: Goat production in southeast Asia. Extension
Bull. 206: 44pp.GAFFNEY, P. M.; SCOTT, T. M.; KOEHN, R. K.; DIEHL, W. J., 1990: Interrelationships of heterozygosity,
growth rate and heterozygote de®ciencies in the coot clam, Mulinia lateralis. Genetics 124:687±699.
GOLDSTEIN, D. B.; LINARES, A. R.; CAVALLI-SFORZA; L. L.; FELDMAN, M. W., 1995: Genetic absolutedating based on microsatellites and the origin of modern humans. Proc. Natl. Acad. Sci. USA 92:6723±6727.
GOODMAN, S. J., 1997: RST Calc: a collection of computer programs for calculating estimates of geneticdifferentiation from microsatellite data and determining their signi®cance. Mol. Ecol. 6: 881±885.
GOUDET, J., 1995: FSTAT (Version 1.2): a computer program to calculate F-statistics. J. Hered. 86:485±486.
229Genetic variation in Capra hircus

HARRIS, H.; HOPKINSON, D. A., 1976: Handbook of Enzyme Electrophoresis in Human Genetics.North-Holland Publishing Co., Amsterdam.
HEDRICK, P. W., 1999: Perspective: Highly variable loci and their interpretation in evolution andconservation. Evolution 53: 313±318.
HIROOKA, H.; MUKHERJEE, T. K.; PANANDAM, J. M.; HORST, P., 1997: Genetic parameters for growthperformance of the Malaysian local goats and their crossbreds with the German (improved) Fawngoats. J. Anim. Breed. Genet. 114: 191±199.
HOCHBERG, Y., 1988: A sharper Bonferroni procedure for multiple tests of signi®cance. Biometrika 75:800±802.
HOULE, D., 1994: Adaptive distance and the genetic basis of heterosis. Evolution 48: 1410±1417.KATSUMATA, M.; AMANO, T.; TANAKA, K.; NOZAWA, K.; BAHK, K.; PARK, B.; LEE, C., 1982: Blood
protein variations of the Korean native goats. Jpn. J. Zootech. Sci. 53: 521±527.LAU, C. H.; DRINKWATER, R. D.; YUSOFF, K.; TAN, S. G.; HETZEL, D. J. S.; BARKER, J. S. F., 1998:
Genetic diversity of Asian water buffalo (Bubalus bubalis): Mitochondrial DNA D-loop andcytochrome b sequence variation. Anim. Genet. 29: 253±264.
LESSIOS, H. A., 1992: Testing electrophoretic data for agreement with Hardy±Weinberg expectations.Marine Biol. 112: 517±523.
LEWIS, P. O.; ZAYKIN, D., 1999: Genetic Data Analysis: computer program for the analysis of allelicdata, Version 1.0 (d12). Free program distributed by the authors over the internet from the GDAHome Page at http://chee.unm.edu/gda/.
LEWONTIN, R. C.; KRAKAUER, J., 1973: Distribution of gene frequency as a test of the theory of theselective neutrality of polymorphisms. Genetics 74: 175±195.
LI, C. C., 1976: First Course in Population Genetics. Boxwood Press. Paci®c Grove, California.LOFTUS, R. T.; ERTUGRUL, O.; HARBA, A. H.; EL-BARODY, M. A. A.; MACHUGH, D. E.; PARK, S. D. E.;
BRADLEY, D. G., 1999: A microsatellite survey of cattle from a centre of origin: the Near East.Mol. Ecol. 8: 2015±2022.
LUIKART, G.; BIJU-DUVAL, M.-P.; ERTUGRUL, O.; ZAGDSUREN, Y.; MAUDET, C.; TABERLET, P., 1999:Power of 22 microsatellite markers in ¯uorescent multiplexes for parentage testing in goats (Caprahircus). Anim. Genet. 30: 431±438.
LYNCH, M.; MILLIGAN, B. G., 1994: Analysis of population genetic structure with RAPD markers.Mol. Ecol. 3: 91±99.
MCDONALD, J. H., 1994: Detecting natural selection by comparing geographic variation in protein andDNA polymorphisms. In: GOLDING, B. ed., Non-Neutral Evolution Theories and MolecularData. Chapman & Hall, New York, pp. 88±100.
MANTEL, N., 1967: The detection of disease clustering and a generalized regression approach. CancerRes. 27: 209±220.
MINCH, E.; RUIZ-LINARES, A.; GOLDSTEIN, D. B.; FELDMAN, M. W.; CAVALLI-SFORZA, L. L., 1995:Microsat (Version 1.5d): a computer program for calculating various statistics on microsatelliteallele data. WWW: http://lotka.stanford.edu/microsat.html.
MOORE, S. S.; BYRNE, K.; MCCARTHY, F.; BARENDSE, W.; WOMACK, J. E.; HETZEL, D. J. S., 1994:Characterisation of 65 bovine microsatellites. Mamm. Genome 5: 84±90.
NEI, M., 1973: Analysis of gene diversity in subdivided populations. Proc. Natl. Acad. Sci. USA 70:3321±3323.
NEI, M., 1978: Estimation of average heterozygosity and genetic distance from a small number ofindividuals. Genetics 89: 583±590.
NEI, M.; TAJIMA, F.; TATENO, Y., 1983: Accuracy of estimated phylogenetic trees from molecular dataII. Gene frequency data. J. Mol. Evol. 19: 153±170.
NOZAWA, K.; SHINJO, A.; SHOTAKE, T., 1978: Population genetics of farm animals III. Blood-proteinvariations in the meat goats in Okinawa Islands of Japan. Z. Tierz. ZuÈ chtbiol. 95: 60±77.
O'BRIEN, P. H., 1988: Feral goat social organization: a review and comparative analysis. Appl. Anim.Behav. Sci. 21: 209±221.
PANANDAM, J. M.; MUKHERJEE, T. K.; HORST. P., 1987: Comparison of Katjang goats and their ®rstand second generation crosses with German Fawn ± individual and maternal heterosis for growthtraits. SABRAO J. 19: 61±68.
PARSONSON, I. M., 1998: The Australian Ark. CSIRO Publishing, Collingwood.POGSON, G. H.; MESA, K. A.; BOUTILIER, R. G., 1995: Genetic population structure and gene ¯ow in
the Atlantic cod Gadus morhua: a comparison of allozyme and nuclear RFLP loci. Genetics 139:375±385.
RAYMOND, M.; ROUSSET, F., 1995: GENEPOP (Version 1.2): Population genetics software for exacttests and ecumenicism. J. Hered. 86: 248±249.
REYNOLDS, J.; WEIR, B. S.; COCKERHAM, C. C., 1983: Estimation of the coancestry coef®cient: basis fora short-term genetic distance. Genetics 105: 767±779.
RICHARDSON, B. J.; BAVERSTOCK, P. R.; ADAMS, M., 1986: Allozyme Electrophoresis. A Handbook forAnimal Systematics and Population Studies. Academic Press Australia, Sydney.
230 J. S. F. Barker et al.

ROUSSET, F., 1997: Genetic differentiation and estimation of gene ¯ow from F-statistics under isolationby distance. Genetics 145: 1219±1228.
SAITOU, N.; NEI, M., 1987: The neighbour-joining method: a new method for reconstructingphylogenetic trees. Mol. Biol. Evol. 4: 406±425.
SCHNEIDER, S.; ROESSLI, D.; EXCOFFIER, L., 2000: Arlequin, Version 2.000: A software for populationgenetics data analysis. Genetics and Biometry Laboratory. University of Geneva, Switzerland.
SLATKIN, M., 1995: A measure of population subdivision based on microsatellite allele frequencies.Genetics 139: 457±462.
SOKAL, R. R.; ROHLF, F. J., 1981: Biometry, 2nd edn. W.H. Freeman & Co., San Francisco.SWOFFORD, D. L.; SELANDER, R. B., 1989: BIOSYS-1 A computer program for the analysis of allelic
variation in population genetics and biochemical systematics. Release 1.7. Illinois Natural HistorySurvey, Campaign, Ill.
TAKEZAKI, N.; NEI, M., 1996: Genetic distances and reconstruction of phylogenetic trees frommicrosatellite DNA. Genetics 144: 389±399.
TAN, S. G.; SELVARAJ, O. S.; SEKARAN, M.; MUKHERJEE, T. K.; BARKER, J. S. F., 1990: Biochemicalpolymorphisms in swamp buffaloes (Bubalus bubalis) I. Cellulose acetate gel methodology. In:VIDYADARAN, M. K.; AZMI, T. I.; BASRUR, P. K. (eds.) Seminar on Buffalo Genotypes for SmallFarms in Asia, 1989. Universiti Pertanian Malaysia, Serdang, pp. 255±261.
TAN, S. G.; SELVARAJ, O. S.; ROSLIN, J.; AKLIMA, O.; GAN, Y. Y.; MUKHERJEE, T. K.; BARKER, J. S. F., 1991:Electrophoretic studies on southeast Asian buffalo and goats: Methodology. In: TULLOH, N. H.;ed. Buffalo and Goats in Asia: Genetic Diversity and its Application. ACIAR Proceedings 34,Australian Centre for International Agricultural Research, Canberra, pp. 28±33.
TAN, S. G.; BARKER, J. S. F.; SELVARAJ, O. S.; MUKHERJEE, T. K.; WONG, Y. F., 1993: Genetic studies ofwater buffalo blood markers. I. Red cell acid phosphatase, albumin, catalase, red cell a-esterase-3,group-speci®c component and protease inhibitor. Biochem. Genet. 31: 223±230.
THAON D'ARNOLDI, C.; FOULLEY, J.-L.; OLLIVIER, L., 1998: An overview of the Weitzman approach todiversity. Genet. Sel. Evol. 30: 149±161.
VAIMAN, D.; SCHIBLER, L.; BOURGEOIS, F.; OUSTRY, A.; AMIGUES, Y.; CRIBIU, E. P., 1996: A geneticlinkage map of the male goat genome. Genetics 144: 279±305.
WEBER, J. L.; WONG, C., 1993: Mutation of human short tandem repeats. Hum. Mol. Genet. 2:1123±1128.
WEIR, B. S., 1990: Genetic Data Analysis. Sinauer, Sunderland.WEIR, B. S.; COCKERHAM, C. C., 1984: Estimating F-statistics for the analysis of population structure.
Evolution 38: 1358±1370.WEITZMAN, M. L., 1992: On diversity. Q. J. Econ. 107: 363±405.WEITZMAN, M. L., 1993: What to preserve? An application of diversity theory to crane conservation.
Q. J. Econ. 108: 157±183.WRIGHT, S., 1951: The genetical structure of populations. Ann. Eugenics (London) 15: 323±354.WRIGHT, S., 1978: Evolution and the Genetics of Populations, Vol. 4. Variability Within and Among
Natural Populations. University of Chicago Press, Chicago.YAMANE, J., 1943: Animal Husbandry of the East Indies. Yoken-do, Tokyo (in Japanese).YANG, L.; ZHAO, S. H.; LI, K.; PENG, Z. Z.; MONTGOMERY, G. W., 1999: Determination of genetic
relationships among ®ve indigenous Chinese goat breeds with six microsatellite markers. Anim.Genet. 30: 452±455.
ZANOTTI CASATI, M.; GANDINI, G. C.; LEONE, P.; ROGNONI, G., 1988: Genetic relationship amongfour sheep breeds of the Italian Alpine Ark. J. Anim. Breed. Genet. 105: 135±142.
Author's address: J. S. F. BARKER, School of Rural Science and Natural Resources, University of NewEngland, Armidale, NSW 2351, Australia. E-mail: [email protected]
231Genetic variation in Capra hircus
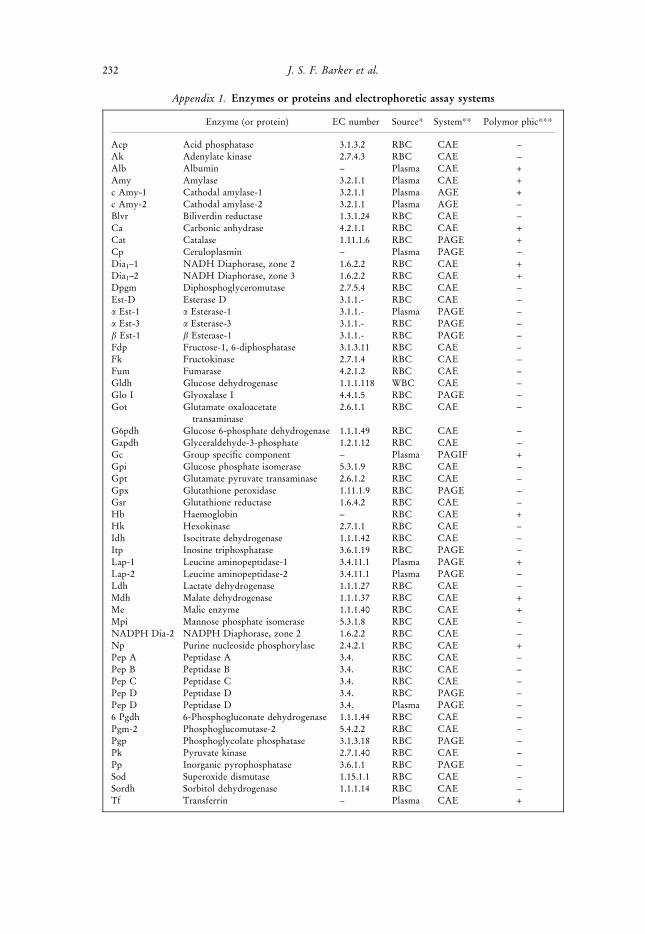
Appendix 1. Enzymes or proteins and electrophoretic assay systems
Enzyme (or protein) EC number Source* System** Polymor phic***
Acp Acid phosphatase 3.1.3.2 RBC CAE ±Ak Adenylate kinase 2.7.4.3 RBC CAE ±Alb Albumin ± Plasma CAE +Amy Amylase 3.2.1.1 Plasma CAE +c Amy-1 Cathodal amylase-1 3.2.1.1 Plasma AGE +c Amy-2 Cathodal amylase-2 3.2.1.1 Plasma AGE ±Blvr Biliverdin reductase 1.3.1.24 RBC CAE ±Ca Carbonic anhydrase 4.2.1.1 RBC CAE +Cat Catalase 1.11.1.6 RBC PAGE +Cp Ceruloplasmin ± Plasma PAGE ±Dia1±1 NADH Diaphorase, zone 2 1.6.2.2 RBC CAE +Dia1±2 NADH Diaphorase, zone 3 1.6.2.2 RBC CAE +Dpgm Diphosphoglyceromutase 2.7.5.4 RBC CAE ±Est-D Esterase D 3.1.1.- RBC CAE ±a Est-1 a Esterase-1 3.1.1.- Plasma PAGE ±a Est-3 a Esterase-3 3.1.1.- RBC PAGE ±b Est-1 b Esterase-1 3.1.1.- RBC PAGE ±Fdp Fructose-1, 6-diphosphatase 3.1.3.11 RBC CAE ±Fk Fructokinase 2.7.1.4 RBC CAE ±Fum Fumarase 4.2.1.2 RBC CAE ±Gldh Glucose dehydrogenase 1.1.1.118 WBC CAE ±Glo I Glyoxalase I 4.4.1.5 RBC PAGE ±Got Glutamate oxaloacetate
transaminase2.6.1.1 RBC CAE ±
G6pdh Glucose 6-phosphate dehydrogenase 1.1.1.49 RBC CAE ±Gapdh Glyceraldehyde-3-phosphate 1.2.1.12 RBC CAE ±Gc Group speci®c component ± Plasma PAGIF +Gpi Glucose phosphate isomerase 5.3.1.9 RBC CAE ±Gpt Glutamate pyruvate transaminase 2.6.1.2 RBC CAE ±Gpx Glutathione peroxidase 1.11.1.9 RBC PAGE ±Gsr Glutathione reductase 1.6.4.2 RBC CAE ±Hb Haemoglobin ± RBC CAE +Hk Hexokinase 2.7.1.1 RBC CAE ±Idh Isocitrate dehydrogenase 1.1.1.42 RBC CAE ±Itp Inosine triphosphatase 3.6.1.19 RBC PAGE ±Lap-1 Leucine aminopeptidase-1 3.4.11.1 Plasma PAGE +Lap-2 Leucine aminopeptidase-2 3.4.11.1 Plasma PAGE ±Ldh Lactate dehydrogenase 1.1.1.27 RBC CAE ±Mdh Malate dehydrogenase 1.1.1.37 RBC CAE +Me Malic enzyme 1.1.1.40 RBC CAE +Mpi Mannose phosphate isomerase 5.3.1.8 RBC CAE ±NADPH Dia-2 NADPH Diaphorase, zone 2 1.6.2.2 RBC CAE ±Np Purine nucleoside phosphorylase 2.4.2.1 RBC CAE +Pep A Peptidase A 3.4. RBC CAE ±Pep B Peptidase B 3.4. RBC CAE ±Pep C Peptidase C 3.4. RBC CAE ±Pep D Peptidase D 3.4. RBC PAGE ±Pep D Peptidase D 3.4. Plasma PAGE ±6 Pgdh 6-Phosphogluconate dehydrogenase 1.1.1.44 RBC CAE ±Pgm-2 Phosphoglucomutase-2 5.4.2.2 RBC CAE ±Pgp Phosphoglycolate phosphatase 3.1.3.18 RBC PAGE ±Pk Pyruvate kinase 2.7.1.40 RBC CAE ±Pp Inorganic pyrophosphatase 3.6.1.1 RBC PAGE ±Sod Superoxide dismutase 1.15.1.1 RBC CAE ±Sordh Sorbitol dehydrogenase 1.1.1.14 RBC CAE ±Tf Transferrin ± Plasma CAE +
232 J. S. F. Barker et al.

Appendix 1. continued
Enzyme (or protein) EC number Source* System** Polymor phic***
Pt-Tf Post-transferrin ± Plasma PAGE +Tpi Triose phosphate isomerase 5.3.1.1 RBC CAE ±Umpk Uridine monophosphate kinase 2.7.1.48 RBC CAE ±Xp X Protein ± RBC STAGE +
*RBC = Red blood cells, WBC = White blood cells. **CAE = cellulose acetate electrophoresis, PAGE =polyacrylamide electrophoresis, STAGE = starch gel electrophoresis, PAGIF = polyacrylamide gel, isoelectricfocussing. ***+ indicates those loci that are polymorphic in one or more population.
Appendix 2. Microsatellite loci investigated, running conditions, allele size ranges, number ofalleles and expected heterozygosity
Co-load Annealing No. ofExpected heterozygosity
Locus group Temp. Dye Size range alleles Range Mean
BL25 1 60 6FAM 173±190 6 0.000±0.554 0.278INRA003 1 60 TET 182±193 9 0.043±0.569 0.266TGLA325 1 55 TET 104±130 13 0.392±0.866 0.622TGLA245 1 55 6FAM 121±147 8 0.048±0.615 0.292RM004 1 55 HEX 107±133 10 0.206±0.653 0.463RME23 2 55 6FAM 139±155 9 0.152±0.763 0.517INRA071 2 50 TET 182±200 12 0.000±0.801 0.356TGLA378 2 55 TET 106±128 11 0.529±0.824 0.682INRA005 2 50 HEX 134±148 8 0.000±0.697 0.461TGLA179 2 55 HEX 67±95 18 0.410±0.866 0.710INRA177 3 55 HEX 167±201 18 0.246±0.859 0.693CSSM026 3 55 6FAM 256±281 12 0.129±0.852 0.564TGLA272 3 55 6FAM 92±128 15 0.333±0.692 0.515OarFCB48 3 60 TET 145±174 14 0.193±0.815 0.607MAF070 4 60 HEX 137±163 13 0.554±0.886 0.721RM188 4 60 6FAM 115±146 13 0.482±0.824 0.664INRA063 4 50 TET 156±181 13 0.000±0.833 0.475BMC1009 4 60 TET 280±299 11 0.351±0.790 0.663BM3205 5 50 TET 211±233 12 0.431±0.889 0.715BM757 5 50 HEX 176±192 7 0.000±0.411 0.064RM006 5 55 6FAM 122±147 13 0.434±0.901 0.706ILSTS005 5 55 TET 173±186 5 0.048±0.605 0.299RM044 5 60 HEX 77±115 15 0.345±0.841 0.662TGLA75 6 55 TET 156±200 13 0.100±0.807 0.508OarFCB193 6 55 6FAM 114±136 17 0.167±0.813 0.574
233Genetic variation in Capra hircus
Copyright © 2022 FDOKUMEN