Graphical Interaction Analysis Impact on Groups Collaborating through Blogs
11
Fessakis, G., Dimitracopoulou, A., & Palaiodimos, A. (2013). Graphical Interaction Analysis Impact on Groups Collaborating through Blogs. Educational Technology & Society, 16 (1), 243–253. 243 ISSN 1436-4522 (online) and 1176-3647 (print). © International Forum of Educational Technology & Society (IFETS). The authors and the forum jointly retain the copyright of the articles. Permission to make digital or hard copies of part or all of this work for personal or classroom use is granted without fee provided that copies are not made or distributed for profit or commercial advantage and that copies bear the full citation on the first page. Copyrights for components of this work owned by others than IFETS must be honoured. Abstracting with credit is permitted. To copy otherwise, to republish, to post on servers, or to redistribute to lists, requires prior specific permission and/or a fee. Request permissions from the editors at [email protected]. Graphical Interaction Analysis Impact on Groups Collaborating through Blogs Georgios Fessakis, Angelique Dimitracopoulou and Aggelos Palaiodimos* Learning Technology & Educational Engineering Laboratory University of the Aegean, Demokratias 1, 85100 Rhodes, Greece // [email protected] // [email protected] // [email protected] *Corresponding author (Submitted June 19, 2011; Revised November 29, 2011; Accepted December 27, 2011) ABSTRACT This paper presents empirical research results regarding the impact of Interaction Analysis (IA) graphs on groups of students collaborating through online blogging according to a “learning by design” scenario. The IA graphs used are of two categories; the first category summarizes quantitatively the activity of the users for each blog, hence permitting the comparison of the students’ activity level in a group, while the second category allows the comparison among different groups. The statistical analysis of the students’ interactions shows the significant impact of the graphs presence based on the number of posts and comments produced by the groups. Furthermore, the graphs of the first category (intra-group IA) have stronger impact than the graphs of the second (intergroup IA). The results support the general claim that interaction analysis is an important component of self-regulation in computer supported collaborative learning environments. In addition the research conclusion suggests that collaborative learning by design is an effective model especially when combined with interaction analysis tools. Keywords Blogs, Learning by design, Interaction analysis, CSCL, E-Learning, Higher education Introduction Increasing interest has recently emerged on the utilization of social software (Allen, 2004) by the educational community. This occurs not only due to the increased availability of social applications on the internet (e.g., web 2.0 services) but also because of their consistency to modern learning theories. Indeed, the use of social software for educational purposes is directly related to the sociocultural theory (Vygotsky, 1986) and to the social constructivism theory (Ernest, 1994; Kim 2001). These theories advocate the importance of the learners’ interaction during active participation to learning activities which provide opportunities for design and construction of meaningful artefacts. Blogs (“Blog,” n.d.) constitute special instance of social software that is a network application supporting groups of actors in communication and interaction. In a general overview of educational uses of blogs, Downes (2004) notices that students participating in blogging have opportunities to (a) reflect on their texts; (b) engage in writing for significant time intervals; and (c) trigger long dialogue with their readers leading to new writing cycles. In teaching and learning, the blogs can be used (indicatively) to (“Blog,” n.d.): collect learning resources and share ideas and experiences; log notes and observations during an inquiry learning activity; manage a project; develop dialogue like in an online forum; reflect and communicate with teachers and peers-students; develop collaboration and social skills; obtain the motivation of writing for readers who comment you in order to participate more actively in the course; run online school newspapers, etc. In Chen et al. (2005) the researchers integrated blogging with the learning portfolio approach highlighting the importance of the adoption of a well-defined pedagogical approach for the successful integration of blogs or any other content management model (e.g., wikis). The study of the impact of the kind of work or the genre of learning activity (e.g. project, problem solving, brainstorming, etc.) to blogging used for educational purposes appears as interesting field of research. In this direction Fesakis et al. (2008) studied the combination of blogs to learning by design pedagogical approach (Han & Bhattacharya, 2001) and claimed that teachers can utilize blogs in order to increase the communication and interaction among the students as well as enhance their participation and active engagement in the classroom. The research evidence showed that blogs fulfill the requirements of the learning approach in an acceptable level. Moreover, students claimed that the blog support for the learning by design activity communication and information management was decisive. Through the use of blogging students had increased opportunities to receive feedback though comments of both fellow-students and teachers. The blog assisted teachers in monitoring the evolution/progress of students’ interactions, intervene whenever needed and obtain diagnostic information during the implementation of the appropriate assignments. The quantitative summarization of
Transcript of Graphical Interaction Analysis Impact on Groups Collaborating through Blogs

Fessakis, G., Dimitracopoulou, A., & Palaiodimos, A. (2013). Graphical Interaction Analysis Impact on Groups Collaborating through Blogs. Educational Technology & Society, 16 (1), 243–253.
243 ISSN 1436-4522 (online) and 1176-3647 (print). © International Forum of Educational Technology & Society (IFETS). The authors and the forum jointly retain the copyright of the articles. Permission to make digital or hard copies of part or all of this work for personal or classroom use is granted without fee provided that copies are not made or distributed for profit or commercial advantage and that copies bear the full citation on the first page. Copyrights for components of this work owned by others than IFETS must be honoured. Abstracting with credit is permitted. To copy otherwise, to republish, to post on servers, or to redistribute to lists, requires prior specific permission and/or a fee. Request permissions from the editors at [email protected].
Graphical Interaction Analysis Impact on Groups Collaborating through Blogs
Georgios Fessakis, Angelique Dimitracopoulou and Aggelos Palaiodimos* Learning Technology & Educational Engineering Laboratory University of the Aegean, Demokratias 1, 85100
Rhodes, Greece // [email protected] // [email protected] // [email protected] *Corresponding author
(Submitted June 19, 2011; Revised November 29, 2011; Accepted December 27, 2011) ABSTRACT
This paper presents empirical research results regarding the impact of Interaction Analysis (IA) graphs on groups of students collaborating through online blogging according to a “learning by design” scenario. The IA graphs used are of two categories; the first category summarizes quantitatively the activity of the users for each blog, hence permitting the comparison of the students’ activity level in a group, while the second category allows the comparison among different groups. The statistical analysis of the students’ interactions shows the significant impact of the graphs presence based on the number of posts and comments produced by the groups. Furthermore, the graphs of the first category (intra-group IA) have stronger impact than the graphs of the second (intergroup IA). The results support the general claim that interaction analysis is an important component of self-regulation in computer supported collaborative learning environments. In addition the research conclusion suggests that collaborative learning by design is an effective model especially when combined with interaction analysis tools.
Keywords
Blogs, Learning by design, Interaction analysis, CSCL, E-Learning, Higher education
Introduction Increasing interest has recently emerged on the utilization of social software (Allen, 2004) by the educational community. This occurs not only due to the increased availability of social applications on the internet (e.g., web 2.0 services) but also because of their consistency to modern learning theories. Indeed, the use of social software for educational purposes is directly related to the sociocultural theory (Vygotsky, 1986) and to the social constructivism theory (Ernest, 1994; Kim 2001). These theories advocate the importance of the learners’ interaction during active participation to learning activities which provide opportunities for design and construction of meaningful artefacts. Blogs (“Blog,” n.d.) constitute special instance of social software that is a network application supporting groups of actors in communication and interaction. In a general overview of educational uses of blogs, Downes (2004) notices that students participating in blogging have opportunities to (a) reflect on their texts; (b) engage in writing for significant time intervals; and (c) trigger long dialogue with their readers leading to new writing cycles. In teaching and learning, the blogs can be used (indicatively) to (“Blog,” n.d.): collect learning resources and share ideas and experiences; log notes and observations during an inquiry learning activity; manage a project; develop dialogue like in an online forum; reflect and communicate with teachers and peers-students; develop collaboration and social skills; obtain the motivation of writing for readers who comment you in order to participate more actively in the course; run online school newspapers, etc. In Chen et al. (2005) the researchers integrated blogging with the learning portfolio approach highlighting the importance of the adoption of a well-defined pedagogical approach for the successful integration of blogs or any other content management model (e.g., wikis). The study of the impact of the kind of work or the genre of learning activity (e.g. project, problem solving, brainstorming, etc.) to blogging used for educational purposes appears as interesting field of research. In this direction Fesakis et al. (2008) studied the combination of blogs to learning by design pedagogical approach (Han & Bhattacharya, 2001) and claimed that teachers can utilize blogs in order to increase the communication and interaction among the students as well as enhance their participation and active engagement in the classroom. The research evidence showed that blogs fulfill the requirements of the learning approach in an acceptable level. Moreover, students claimed that the blog support for the learning by design activity communication and information management was decisive. Through the use of blogging students had increased opportunities to receive feedback though comments of both fellow-students and teachers. The blog assisted teachers in monitoring the evolution/progress of students’ interactions, intervene whenever needed and obtain diagnostic information during the implementation of the appropriate assignments. The quantitative summarization of

244
participants’ interaction using time bubble charts for posts and comments and Social Network Analysis (SNA) for comments shows that students have been reading and commenting each other intensively during the activity. This graphical analysis of the students’ interactions during blogging is a third research dimension in Computer Supported Collaborative Learning using blogs. The work of Fessakis et al. (2008) aimed at understanding the relation of collaborative electronic learning environment (blog) and the genre of assigned work (learning by design). Learning by design is related to constructionism, according to which new knowledge is more effectively developed by students when they are actively engaged in the construction of an external, shareable artefact that helps them to reflect and collaborate. Learning by design emphasises the learning value of the artefact design and at the same time underlines the learning benefits of the process regardless of the final product. In learning by design activities the designed artefacts are of personal significance for the students and “represent” the learning outcome. There are several views on what constitutes learning by design; according to Han and Bhattacharya (2001) learning by design environments include: authenticity of the design theme, a balanced mixture of constrained, guided, scaffolded challenges and open design tasks, a rich variety of feedback information for designers, discussion and collaboration, experimentation, inquiry and reflection. During learning by design activities students follow repetitively, in general, the following stages: theme-question selection; target group description; design and first implementation of the artefact; pilot application of the artefact; feedback information gathering; reflection; and design adaptation. Learning by design activities foster interaction between participants (students and teachers). The teacher’s role includes supporting the students’ efforts and guiding their interaction in order to obtain the desirable learning result. The teacher needs to supervise systematically the group interactions and decide for the quality of their verbal exchanges. In a conventional classroom the students’ interaction is often not allowed at all (frontal teaching); furthermore, in the case of non-online group-teaching, teachers cannot easily monitor and intervene during the collaboration, focusing mainly on the output-product of the activity. The use of an online environment seems to be an efficient solution for managing the increased number of learning interactions occurring in group collaboration and for the improvement of the provided education quality. As was pointed out in Fessakis et al. (2008) case study, weblogs can fulfill the information management requirements of learning by design through group blogging. Following the aforementioned work, this paper discusses/presents the quantitative interaction analysis of groups collaborating on learning by design activities through blogging. Interaction analysis and blogs Computer based Interaction Analysis (IA) is an emerging field (Dimitracopoulou, 2008) aiming at supporting directly or indirectly the participants in technology mediated activities. There are two main complementary directions of IA according to the end user of the information produced. In the first direction, the IA informs the adaptivity components of the learning environment. In the second direction, the participants have direct access to IA information supporting them to self-regulate. For example, in Fessakis et al. (2004) the authors define and test Collaboration Activity Function (CAF), a graphical collaborative interaction analysis tool that uses as raw data the actions, on a shared workspace, of the members of a small group (2-4 persons) that are collocated and solve modeling problems. The empirical examination of CAF showed that teachers can utilize it in order to a) assess collaboration; b) evaluate students’ contribution; c) choose the appropriate time for intervention; and d) assess teacher’s intervention consequences. The teachers were allowed to use CAF in order to reflect on their intervention strategies and self-regulate. Other typical works concerning interaction analysis in asynchronous communication environments include Bratitsis & Dimitracopoulou (2008) for forums and Anjewierden et al (2006, 2009) for blogs. This paper advances the work of Fessakis et al. (2008) using a significantly larger number of groups learning by design through group blogging while focusing on the impact of graphical IA tools on participants during their collaboration. Therefore, this paper examines whether the graphical synopses of the interaction raw data of the group blogging helps the group to increase the level of awareness and to regulate its function allowing students to collaborate effectively and teachers to moderate them in a more efficient way. In the following sections the research conditions are explained along with the research questions and data collection tools, then the data is analyzed and interpreted and finally an overview discussion is provided.

245
Research In the field of collaborative learning the interaction analysis is considered of great importance. IA aims at foster productive interactions among the users (students, teachers, researchers) by increasing their awareness and facilitating their self-regulation. Besides, blogs are social software for asynchronous communication, content management systems, and recently quite popular collaborative learning environments. It is therefore useful to study IA for group blogs through which students implement learning activities according to collaboration scripts. The aim of the present research is firstly to explore the impact of IA graphs on the members of group blogs during collaboration and secondly to examine the generalization possibility of the pilot study results (Fessakis et al, 2008) concerning the consistency of blogs to the “learning by design” approach, using a larger sample. The paper focuses on blogs because they are more adequate to the “learning by design” iterative and adaptive process than other services like for instance forums or wikis. Since blogs are usually available as a component in more complex environments like Learning Management Systems, the results are interesting for learning design in general. The present research stems from the comments of participants of the previous research on graphical synopses of their action after the completion of the activity. Students showed interest in the interpretation of the graphs and commented that it would be useful if the interaction analysis graphs were available during the collaboration through the blog. Finally, the weblog technology that is available, normally, does not offer graphical representation of the interaction analysis of the users. This offers an incentive to propose and examine experimentally, specific interaction analysis graphs in order to produce design specification for future development of integrated interaction analysis toolkits for educational blogging. Research questions The following questions have been set for the approximation of the research aim: Q1. How user-friendly are the group blogs for students and to what extent do they believe that blogs can enhance collaboration and communication skills? How consistent is blogging to the “learning design” approach? (Could the blogs efficiently facilitate the communicational and information management requirements?) Q2. How useful and understandable is the information provided by the interaction analysis graphs according to the students? What graphs do the students prefer? Q3. To what extent do the interaction analysis graphs affect self-regulation of the group blog members? Are there any significant differences for impact among the different kinds of graphs? Research conditions The experiment took place in the interval between 19 FEB and 04 JUN of 2009. The participants were 147 students from the Department of Preschool Education and Educational Design of the University of the Aegean in Greece, who were attending a course about the design and development of ICT applications in education. The majority of the students were at their third year of study while some of them were at the second or forth. The age of the students is not considered as a significant factor in this research since all of them were adults with similar educational background. Students were organized in 21 groups, consisting of 7 members each. The group allocation was made according to the list of their surnames in alphabetical order. A blog was created in a popular free blogging service for each group. The access to the blog content was restricted to the members of each group. Students participated in a three-hour training so at to familiarize themselves with blogs prior to the conduction of the research. In addition, every student on each blog had access to a manual with detailed instructions for posting, commenting, files uploading, etc. The students' task was to design technology enhanced lesson plans. The learning activity was organised according to the following phases: Phase 1. Socialization: Each student publishes a brief presentation of him/her and a short reflection on the lesson plan models. Phase 2. First design and peer review: Each student publishes 1-2 lesson plans on the blog and makes comments on the versions provided by the other members of the group.

246
Phase 3. Revision and peer review: Each student revises the lesson plans as many times he/she thinks necessary, taking into account the comments of his/her colleagues. Students continue also, the commenting of the others’ designs and revisions. Phase 4. Final project deliverable: Finally, students compile the deliverable of the project by selecting, after discussion, the best lesson plan. The groups were separated in three categories. The first category (K1-intragroup analysis) included the groups: (1, 2, 3, 7, 8 and 17). The researcher supplied the groups with the IA graphs (A1-A4, figures 1-4) which were summarizing data for comparison of the group members according to their contribution on posting and commenting. In addition, the groups of the category K1 had available social network analyses diagram (A5, figure 5) regarding who was commenting on whom. The second category (K2 - inter-group analysis) included the groups: (10, 11 and 19). These groups were given by the researcher IA graphs that were comparing the groups of this category to other groups in terms of total number of posts and comments (B1-B3, figures 6-8). The difference in the case of category K2 is that the members of each group were allowed to compare quantitative data of their group to other groups without reference to the individual contributions of its members. The third category (K3 – Control groups) included the remaining groups that did not receive any IA graph. The organization of the groups during the experiment and their correspondence to the different kinds of graphs is depicted in schema 1. The posting of the graphs to the blogs had been scheduled to take place after the completion of each main phase of the scenario. The graphs are presented per group category in detail in the next section.
Schema 1. The research experiment schema The interaction analysis graphs of the research The decision regarding the number and the kind of graphs was reached taking into account that most students were not experienced social software users neither were experienced graph readers. So the selected graphs provided were quite simple apart from the social network analysis diagram. Even though the SNA diagram was rather complex, it was included since students were using it in compulsory courses during their first year of study in the University. The selection of the specific graphical representation of interaction analysis stems from the basic, visible actions of the students in the blog which are: post of an article and publishing of a comment. Weblogs, normally, do not offer graphical analyses of their users’ post and comments production. In the case of a collaboration group blog, it is useful for the members to be aware of how many posts and comments are produced by each member in order to decode simple self-regulation rules. Each group member can use this information to compare her/his contribution/productivity to the blog in relation to that of the others. The representation of this regulative information should be readable at a glance in a simple graphical format; the bar graphs of the total number of posts and comments of each member seem suitable for this purpose. Furthermore, in order to make an easy relative comparison of the number of posts and comments published by each member of the group simultaneously, we selected a bubble chart sorting the users according to the number of comments in the yy’ axis (height of the bubble center) and using diameter for the bubble proportional to the number of posts. This chart gives regulative information to the users in

247
relation to their reading and writing behavior in the blog. In other words each user can assess graphically whether she/he is reading or writing more than the others through the use of a single graphical representation. Finally, there is another important dimension of the interaction concerning not only the intention of commenting but also the variety of the recipients’ comments. It is useful for each collaborator to read and comment to most of her/his peers. From another perspective, it is important for the students to increase their influence on their collaborators causing commenting to and from the most members of their group. To facilitate this kind of interaction analysis, we selected SNA diagrams constructed with a vertex for each user and a directed arc for each pair that has commenting users, the arrow of the arc depicts the receiver of the comments. The thickness of the arcs is proportional to the total number of comments while the exact number of comments is mentioned explicitly as a label to the arc near the recipient vertex. This complex diagram gives information to the users in order to become aware of how many other users (and which) they read and help with their comments. Furthermore students can see how many of their peers are interested in their work and who worked harder than the others in the group. In fact, the interpretation of the diagrams depends on several factors, e.g., the phase of the learning scenario, the content of the posts and comments, the kind of comments (positive, negative). In any case simple self-regulating rules are expected to be derived from the availability of graphs. More specifically, the post bar graphs during the lesson plans proposal is expected to encourage/motivate students with the least number of proposals to publish some more while the number of comments posted bar graph during the peer review phase could guide the students to read and review more lesson plans from their colleagues. The ‘comments received’ bar graph in combination to their content gives an indication to the students regarding the quality of their proposed lesson plans and their influence (on what?). Finally the SNA diagram could lead students to increase their circle of collaborators reading and commenting those who have not yet (done what?). As far as the inter-group interaction analysis is concerned similar graphs are selected for the posts and comments summarizing and comparing whole group production instead of separate users. In this instance SNA is not applicable. In any case, the IA graphs should depict information for arbitrary time intervals of the learning process (e.g., each phase of the learning scenario) in order to inform students and teachers about the dynamics of the collaborators’ contribution. The time periods are related loosely to the phases of learning scenario because of the semiautomatic way of their production by the researches. The production of graphs for each phase facilitates its interpretation according to the semantics of the phase, e.g., much commenting in the socialization phase has different meaning than in the peer review phase. In a fully developed and integrated interaction analysis system, students and teachers should have the opportunity to choose arbitrary time intervals and produce automatically any interaction analysis graph they choose at any time. Based on the aforementioned assumptions specific diagrams are assigned to group categories to support intragroup and intergroup interaction analysis as it is described in detail in the next sections. Graphs for the groups of category K1 The interaction analysis graphs enabled students to retrieve information about their own actions as well as those of the members of their group. More specifically the graphs for category K1 groups were: Graph A1: Bar chart of the number of posts of each member per period and in total (Figure 1). Graph A2: Bar chart of the number of comments published by each member per period and in total (Figure 2). Graph A3: Bar chart of the number of comments received by each member per period and in total (Figure 3). Graph A4: Bubble chart of the number of posts and comments published by each member in total (Figure 4). The height of the bubble is proportional to the number of comments while the diameter is proportional to the number of posts. Graph Α5: Social Network Analysis diagram (Figure 5). The nodes represent the students while the arcs depict commenting. Graphs for the groups of category K2 Regarding the groups of the K2 category (10, 11, 19) the graphs were comparing the number of posts and comments of each such group to those of category K1 groups (1, 2, 3, 7, 8, 17). More specifically the graphs in this case were: Graph B1: Bar chart of the number of posts of each group per period and totally (Figure 6). Graph B2: Bar chart of the number of comments of each group per period and totally (Figure 7). Graph B3: Bubble chart of the number of

248
posts-comments for each group (Figure 8). The height of the bubble is proportional to the number of comments while the diameter is proportional to the number of posts.
Figure 1. Graph A1
Figure 2. Graph A2.
Figure 3. Graph A3.
Figure 4. Graph A4.
Figure 5. Graph A5.
Figure 6. Graph Β1.
Figure 7. Graph Β2.
Figure 8. Graph Β3.

249
Research data collection As far as questions 1 and 2 were concerned, the data was collected using online questionnaires. With reference to question 3 the raw data about the students' actions to the blogs was analyzed. This data was used for the production of the interaction analysis graphs by a semi-automatic process. The process of the specific graphs production could be fully automated if there was full access to the blog platform database. In this study we chose to use a free popular weblog service because it is a study of feasibility, user requirements specification and verification of the proposed graphs. The full development of the automatic production of the graphs and their integration in the blogging service could be a future elaboration of the work. In addition to the quantitative data of user actions logging, the students of the category K1 and K2 groups were asked to comment on the posts with the graphs on their blogs in order to (a) make sure that they had noticed the graphs and (b) collect evidence about what information they decode from them. Research data analysis – Results Q1. How user-friendly are the group blogs for students and to what extent do they believe that these blogs can enhance collaboration and communication skills. How consistent is blogging to the “learning design” approach? (Could the blogs efficiently facilitate the communicational and information management requirements?) Based on the students’ answers to the questionnaires at the end of the experiment we can conclude that: (a) the students had familiarized themselves with the blogs within a few hours. Publishing articles and comments, blog browsing and monitoring, was easy for the students while many of them found the file uploading quite complicated in the beginning for the specific blogging service, (b) 58% of the students felt that group blogging helped them to improve their collaboration and communication skills, (c) 70% of the students stated that they would use blogs again in a future collaboration. Considering the above, it can be concluded that blogs are not only easy for students to use but they also fulfill the requirements of online group “learning by design” scenario to a satisfactory extent. As was rather expected, there is no statistically significant differentiation among the group categories. The results are consistent to those of the pilot study (Fesakis et al., 2008), supporting their generalization in similar situations. Q2. How useful and understandable is the information provided by the interaction analysis graphs according to the students? What graphs do the students prefer? Category K1 groups’ students’ views With reference to the question, “Which graph did you take most into account?” 52.38% of the students of category K1 groups answered that they took into account the graph A4 (posts-comments bubble chart), the second most popular graph being A1 with percentage of 33.33% and the least popular being the SNA diagram A5 (9.52%) and the comments bar graph A3. As to the question, “How useful is the information of the graphs?” the students evaluated all the graphs characterizing the information from “enough” to “very useful” according to the following percentages: Α1 – (>85%), Α2 – (>85%), Α3 – (~70%), Α4 – (>85%), Α5 – (~70%). In the case of SNA (A5), 9.52% of students answered that the information was not useful at all. In the question, “How much did the graphs affect your behaviour-participation to the blog?” more than 70% of the students answered from “fairly” to “very much” for each of the graphs A1, A2 and A4, while the percentage for A3 is ~60% and for the SNA diagram A5 ~65%. In the case of SNA, 4.76% of students answered that they were not affected at all by this graph. This is significant because no student selected this answer for any of the other graphs. At the same time, SNA received the largest percentage (14.29%) of students answering that they were affected considerably. No other graph gathered so many answers in the “very much” option. This could be due to the fact that most of the students were not able to interpret the rich information of the SNA while those who were able to do so were affected by SNA the most. The students that were not able to interpret the SNA diagram could not use it to make a self-regulation plan. This is easy for the bar charts where every student can understand rather straightforward if she/he needs to increase his contribution. The comments of the students on the SNA diagram post that follow are informative and show that some students could use SNA as brief representation of the “dynamics” and the “liveliness” of their group:

250
Student K. O. said: The SNA diagram show the dynamics of our group. I think that our group function is satisfactory!!! 02 April 2009 10:26 Student Κ. Ε. said: The SNA diagram reflects the dynamics of our group. A group which works in a good tempo. 08 April 2009 12:05 Student Κ. Ε. said: The SNA express the liveliness of the participants to the group.....08 April 2009 10:13 Similar appear to be the answers of students to the question, “How clear-understandable is the information of the graphs?” For the graphs A1-A4 more than 90% of students selected the “fairly” or “very useful” answers. In the case of SNA diagram the same percentage decreases to ~70%, while 23.81% answered that SNA is “little” understandable and 4.76% answered “not at all.” This explains more the findings in the research question 1 and justifies the selection of simple graphs in this case. Users need training on information decoding and guidelines for the transformation of this information to regulative action in order to use more complex interaction analysis graphs. In the complementary question, “What graphs need guidelines for their reading?” students answered: A5 – SNA diagram (42.86%), A4 – bubble chart (33.33%) and then A1-A3 (< 5%). A percentage of 28.57% of students answered that there is no need for guidelines for reading the graphs. Summarizing, students seems to take most into account, for self-regulation, the graphs concerning the number of posts per student and the number of comments he/she had received (A4). Category K2 groups’ students’ views With reference to the question, “Which graph did you take most into account?” students answered: B1 – (36.36%), B2 – (9.09%) and B3 – (54.55%). Consequently, the bubble chart of posts and comments (B3) had the greater impact. In the complementary question, “Which graph did you take least into account?” students answered: B1 – (36.36%), B2 – (63.64%) and B3 – (0%). The answers are consistent to the previous outcome supporting the reliability of the data. In the question, “How useful is the information of the graphs?” students answered “fairly” or “very much” in a percentage > 90% for each of the graphs B1-B3. In the question, “How much did the graphs affect your behaviour-participation to the blog?” the students answered “fairly” or “very much” in ~55% for B1 and ~70% for each of B2 and B3. This is reasonable since B1 depicts the number of posts for which the least number was defined in the scenario and the groups did not have significant variations. In the question, “How clear-understandable is the information of the graphs?” the students answered “fairly” or “very much” for all the graphs. In the complementary question, “What graphs need guidelines for their reading?” the students answered: B1 – (9.09%), B2 – (18.18%), B3 – (45.45%) and «none» – (36.36%). The percentages are proportional to the complexity of the graphs. Q3. To what extent do the interaction analysis graphs affect self-regulation of the group blog members? Are there any significant differences for impact among the different kinds of graphs? In question 3, we examine the impact of IA graphs to the groups of students collaborating through the blogs. For the comparison of the group categories we use: (a) the mean number of posts and (b) the mean number of comments published, per group for each category. The data collected from the blogs show that the total number of actions for the 147 students was greater than 2095 (817 posts and 1278 comments). The comments of students to the graphs posts are not included in the calculation. Tables 1 and 2 summarize a separate variable for comments and posts for each group category. There are six variables of the form: KXC for comments and KXP for posts where X denotes the category of group (X in {1, 2, 3}). K1 and K2 categories are similar except from the kind of graphs they had available. Consequently any significant differences to the control groups’ category K3 and among K1 and K2 could be related to the impact of the interaction analysis graphs. In order to examine whether there is any significant difference among the groups of the different categories we could apply ANOVA using the category (K) as a factor variable and the Comments (C) and Posts (P) variables as dependent variable. In order for the ANOVA to be applicable, there are specific prerequisites that need to be met: The samples should be random and independent and the variances of the populations should be equal. In our case the samples are fairly random because of the use of the surname list on alphabetical order for the group formation. In addition the samples are independent because they have not got students in common.
251
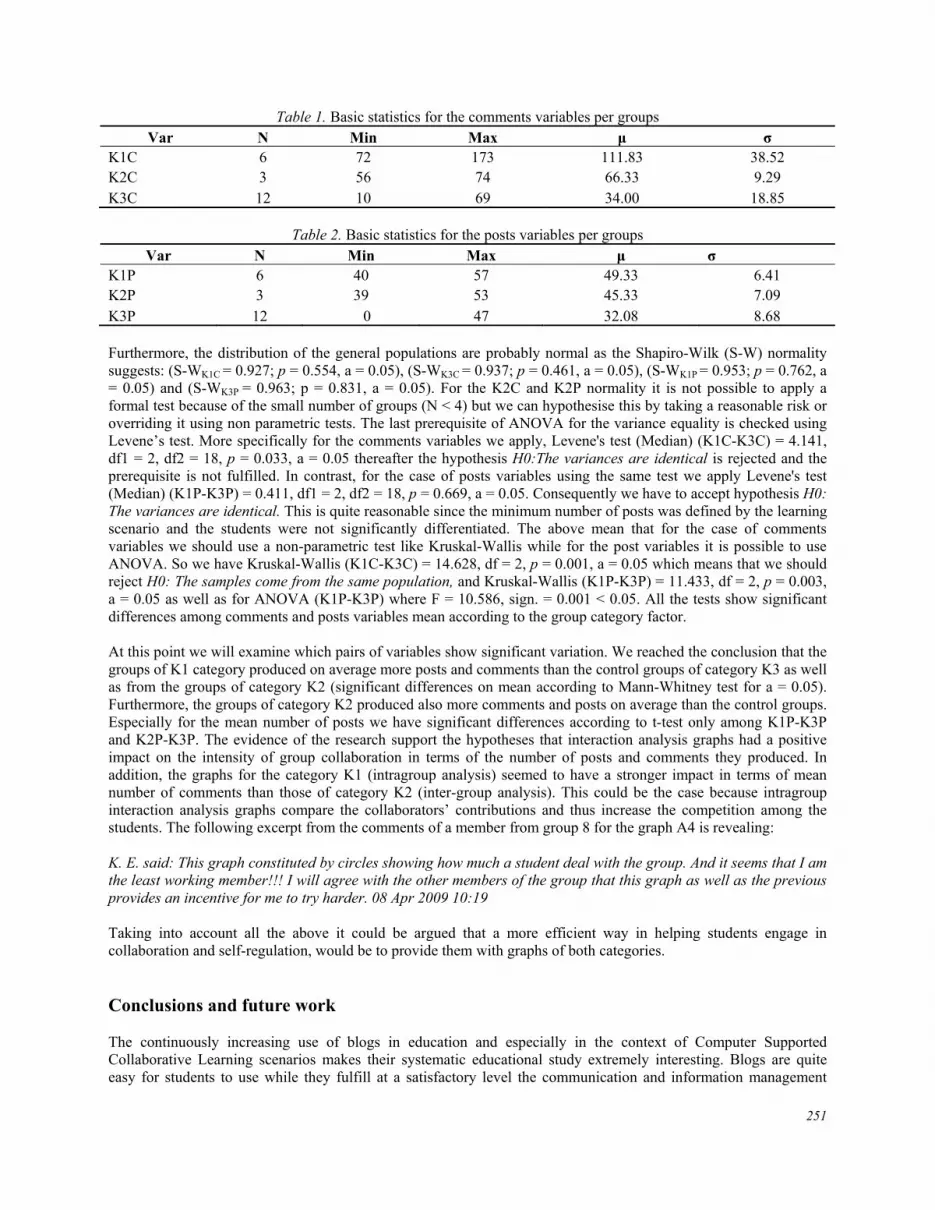
Table 1. Basic statistics for the comments variables per groups Var Ν Min Max μ σ
K1C 6 72 173 111.83 38.52 K2C 3 56 74 66.33 9.29 K3C 12 10 69 34.00 18.85
Table 2. Basic statistics for the posts variables per groups Var Ν Min Max μ σ
K1P 6 40 57 49.33 6.41 K2P 3 39 53 45.33 7.09 K3P 12 0 47 32.08 8.68 Furthermore, the distribution of the general populations are probably normal as the Shapiro-Wilk (S-W) normality suggests: (S-WK1C = 0.927; p = 0.554, a = 0.05), (S-WK3C = 0.937; p = 0.461, a = 0.05), (S-WK1P = 0.953; p = 0.762, a = 0.05) and (S-WK3P = 0.963; p = 0.831, a = 0.05). For the K2C and K2P normality it is not possible to apply a formal test because of the small number of groups (N < 4) but we can hypothesise this by taking a reasonable risk or overriding it using non parametric tests. The last prerequisite of ANOVA for the variance equality is checked using Levene’s test. More specifically for the comments variables we apply, Levene's test (Median) (K1C-K3C) = 4.141, df1 = 2, df2 = 18, p = 0.033, a = 0.05 thereafter the hypothesis Η0:The variances are identical is rejected and the prerequisite is not fulfilled. In contrast, for the case of posts variables using the same test we apply Levene's test (Median) (K1P-K3P) = 0.411, df1 = 2, df2 = 18, p = 0.669, a = 0.05. Consequently we have to accept hypothesis Η0: The variances are identical. This is quite reasonable since the minimum number of posts was defined by the learning scenario and the students were not significantly differentiated. The above mean that for the case of comments variables we should use a non-parametric test like Kruskal-Wallis while for the post variables it is possible to use ANOVA. So we have Kruskal-Wallis (K1C-K3C) = 14.628, df = 2, p = 0.001, a = 0.05 which means that we should reject H0: The samples come from the same population, and Kruskal-Wallis (K1P-K3P) = 11.433, df = 2, p = 0.003, a = 0.05 as well as for ANOVA (K1P-K3P) where F = 10.586, sign. = 0.001 < 0.05. All the tests show significant differences among comments and posts variables mean according to the group category factor. At this point we will examine which pairs of variables show significant variation. We reached the conclusion that the groups of K1 category produced on average more posts and comments than the control groups of category K3 as well as from the groups of category K2 (significant differences on mean according to Mann-Whitney test for a = 0.05). Furthermore, the groups of category K2 produced also more comments and posts on average than the control groups. Especially for the mean number of posts we have significant differences according to t-test only among K1P-K3P and K2P-K3P. The evidence of the research support the hypotheses that interaction analysis graphs had a positive impact on the intensity of group collaboration in terms of the number of posts and comments they produced. In addition, the graphs for the category K1 (intragroup analysis) seemed to have a stronger impact in terms of mean number of comments than those of category K2 (inter-group analysis). This could be the case because intragroup interaction analysis graphs compare the collaborators’ contributions and thus increase the competition among the students. The following excerpt from the comments of a member from group 8 for the graph A4 is revealing: K. E. said: This graph constituted by circles showing how much a student deal with the group. And it seems that I am the least working member!!! I will agree with the other members of the group that this graph as well as the previous provides an incentive for me to try harder. 08 Apr 2009 10:19 Taking into account all the above it could be argued that a more efficient way in helping students engage in collaboration and self-regulation, would be to provide them with graphs of both categories. Conclusions and future work The continuously increasing use of blogs in education and especially in the context of Computer Supported Collaborative Learning scenarios makes their systematic educational study extremely interesting. Blogs are quite easy for students to use while they fulfill at a satisfactory level the communication and information management

252
requirements of online collaborative learning by design scenario. The interaction analysis graphs of collaborating students could help teachers to monitor, moderate, coordinate, assess, etc., and students to increase their awareness and self-regulate during their participation. The interaction analysis is also interesting for education researchers. The presented study advances on a previous pilot study using a larger sample of participants to examine their views on (a) the usability of blogs, (b) the suitability of blogs for the implementation of the “online collaborative learning by design” scenario, and (c) the facilitation of general communication and collaboration skills by blogging. The research results are fairly positive and consistent to those of the pilot study. More specifically the research data confirms that most students learn to use blogs easily, they recognize the suitability of blogs to the communication and information management requirements of the scenario and believe that blogging in the particular context of the learning scenario makes them better collaborators. Furthermore the research explores the impact of interaction analysis graphs organized in two categories. The first category includes: (a) bar graphs and a bubble chart that summarize the evolution of the contribution in posts and comments for each group member separately, and (b) a Social Network Analysis diagram with one node per student and arcs showing who was commenting on whom. For each group the SNA depicts how extended and intensive the communication (in term of comments) developed was during collaboration, permitting the analysis of this communication for each pair of students. The graphs of the first category concern intra-group interaction analysis and aim to facilitate competition among the group members. The second category of graphs includes bar graphs and bubble chart summarizing the volume of posts and comments of whole groups, thus permitting the comparison among groups. The graphs of the second category concern intergroup interaction analysis and aim to facilitate competition among the groups. From the experiment presented in the paper there is evidence of statistically significant differences among groups, posts and comments production depending to the presence and the category of graphs. This means that the interaction analysis graphs that were used had a significant impact on collaborative groups helping them to self-regulate during the learning scenario implementation in order to increase their participation and intension of their efforts. As far as the different categories of graphs is concerned (intra vs. inter group analysis), in this study the intra-group analysis graphs had a significantly stronger impact resulting in more active, productive and engaged groups with extensive commenting among their members. The Interaction Analysis Graphs give students the impression that teachers are monitoring their participation in the groups and this facilitates/urges students to contribute and collaborate more. The current research results which were based on a large scale experiment support the generalization of the claim of the previous case study (Fessakis et al., 2008) that collaborative learning by design model is supported efficiently by weblogs in terms of information management and communication requirements for teachers and learners. In addition the research validates the efficiency of the proposed interaction analysis graphs on enhancing learners’ self-regulation and makes their integration in educational blogging systems a justified goal. The main weakness of this research can be identified as the small sample of the groups of category K2 which does not allow a secure conclusion for the results concerning the graphs of the specific category. In contrast, the results from the comparison among the interaction analysis graphs of category K1 to the control groups are quite strong. Future aims of the research include the automatic production of the graphs and their smooth integration in the learning environment in order to give continuous access to the users and be possible to collect interaction data of the students to the graphs. More specifically the research supports the feasibility of an Interaction Analysis toolkit in the form of a plugin that could be integrated in learning environments that educational blogs offer. Teachers and students could utilize this toolkit in order to support self-regulation and monitoring of the collaboration process to improve learning in learning by design scenarios. The toolkit will permit the dynamic production of interaction analysis graphs for an arbitrary user at selected time intervals upon demand and could be accompanied to an intelligent system to support their interpretation in self-regulating rules. References Allen, C. (2004, October 13). Tracing the evolution of social software. Retrieved October 4, 2011 from http://www.lifewithalacrity.com/2004/10/tracing_the_evo.html
Anjewierden, A., & Efimova, L. (2006). Understanding weblog communities through digital traces: A framework, a tool and an example. Lecture Notes in Computer Science, 4277, 279-289.

253
Anjewierden, A., Efimova, L., & de Hoog, R. (2009, June). Visualizing linking patterns in weblogs: Indicators of self-directed learning activities in a community of inquiry. Paper presented at the Computer Supported Collaborative Learning/Interaction Analysis and Visualization for Asynchronous Communication Workshop, Rhodes, Greece. Retrieved from http://www.ltee.gr/IA_WS_CSCL2009/iav_anjewierden_et_al.pdf
Bratitsis, T., & Dimitracopoulou, A. (2008). Interpretation issues in monitoring and analyzing group interactions in asynchronous discussions. International Journal of e-Collaboration, 4(1), 20-40.
Blog. (n.d.). EduTech Wiki, A resource kit for educational technology teaching, practice and research. Retrieved, October 4, 2011 from http://edutechwiki.unige.ch/mediawiki/index.php?title=Blog&oldid=28435
Chen, H. L., Cannon, D., Gabrio, J. Leifer, L. Toye, G., & Bailey, T. (2005). Using wikis and weblogs to support reflective learning in an introductory engineering design course. Proceedings of the 2005 American Society for Engineering Education Annual Conference & Exposition. Rretrieved October 4, 2011 from: citeseerx.ist.psu.edu/viewdoc/download?doi=10.1.1.127.5481&rep=rep1&type=pdf
Dimitracopoulou, A. (2009). Computer based interaction analysis supporting self-regulation: Achievements and prospects of an emerging research direction. Journal of Technology, Instruction, Cognition and Learning, 6(4), 291-314.
Downes, S. (2004). Educational blogging. EDUCAUSE Review, 39(5), 14-26.
Ernest, P. (1994). What is social constructivism in the psychology of mathematics education? In J. P. da Ponte & J. F. Matos (Eds.), Proceedings of the 18th Annual Conference of the International Group for the Psychology of Mathematics Education (pp. 304-311). Lisbon, Portugal: University of Lisbon.
Fesakis, G., Petrou, A., & Dimitracopoulou, A. (2004). Collaboration activity function: An interaction analysis tool for computer supported collaborative learning activities, advanced learning technologies. In Kinshuk et al. (Eds), IEEE International Conference on Fourth IEEE International Conference on Advanced Learning Technologies (ICALT'04) (pp. 196-200). Los Alamitos, CA: IEEE Computer Society.
Fessakis G., Dimitracopoulou A., & Tatsis K. (2008). Supporting “learning by design” activities using group blogs. Journal of Educational Technology and Society, 11(4), 199-212
Kim, B. (2001). Social constructivism. In M. Orey (Ed.), Emerging Perspectives on Learning, Teaching, and Technology. Retrieved October 4, 2011 from http://projects.coe.uga.edu/epltt/index.php?title=Social_Constructivism&oldid=3287
Han, S., & Bhattacharya, K. (2001). Constructionism, Learning by Design, and Project-based Learning. In M. Orey (Ed.), Emerging Perspectives on Learning, Teaching, and Technology. Retrieved October 14, 2011 from http://projects.coe.uga.edu/epltt/index.php?title=Constructionism,_Learning_by_Design,_and_Project_Based_Learning&oldid=3318.
Vygotsky, L. S. (1986). Thought and Language (A. Kozulin, Ed. & Trans.), Cambridge, MA: MIT Press.