Collaborating with physicians to redesign a sign-out tool
21
Collaborating With Physicians to Redesign a Sign-Out Tool: An iterative, multifaceted approach with users – even busy ones – can yield a satisfying and efficient product. JUSTIN M. DEVOGE, ELLEN J. BASS, RICHARD M. D. SLEDD, STEPHEN M. BOROWITZ, and LINDA WAGGONER-FOUNTAIN FEATURE AT A GLANCE Physician sign-out is a mechanism for transferring patient information from one group of hospital care-givers to another at shift changes. Support tools are critical to the success of sign-out. To ensure that a tool is effective, designers must collaborate with end users, but collaboration can be difficult when working with users who are busy and have irregular schedules. In this article, we report on a collaborative effort between physicians and engineers to redesign a sign-out support tool. Strategies included focus groups, interviews, “on-the-fly” feedback, and an iterative design process, which engaged end users in the design process. Task analysis methods enabled us to quantify the differences in functionality between the original tool and the prototype. Keywords sign-out; handoff of care; user-centered design; collaborative design; process support tools; medical decision making A user-centered approach is critical in the development of new process support tools, but engaging end users can be challenging (Hooper, 1986). Users may not always be able to articulate their problems or point to their root causes; they may jump to potential solutions before truly understanding the underlying issues; and they may not be available during typical work hours to discuss problems with their tools. In this article, we describe a multifaceted approach that combines focus groups, interviews, iterative prototyping, testing, and feedback for engaging one such group of end users – resident physicians – in the design process for a sign-out support tool. Suggested improvements are based on task analysis methods comparing the work flow found with the existing and redesigned tools, and practical strategies are discussed for increasing end user involvement in the design process. Background Sign-out (that is, when outgoing physicians hand off patient care to incoming physicians) is a critical process in hospital settings (Borowitz, Waggoner-Fountain, Bass, & Sledd, 2008). Residents’ duty hours are restricted to 30 continuous hours and 80 total hours per week, accompanied by 10-hour rest periods away from patient care (Accreditation Council for Graduate Medical Education, n.d.). As a result of these restrictions, the number of sign-outs between resident physicians has increased, along with concern for their effect on continuity of care (Horwitz, Krumholz, Green, & Huot, 2006; Okie, 2007; Vidyarthi, Arora, Schnipper, Wall, & Wachter, 2006). This article is based on the study of sign-out between residents on the general pediatric wards of a university-based tertiary care hospital. On such wards, sign-out occurs in the NIH Public Access Author Manuscript Ergon Des. Author manuscript; available in PMC 2011 August 2. Published in final edited form as: Ergon Des. 2009 January 1; 17(1): 20–28. doi:10.1518/106480409X415170. NIH-PA Author Manuscript NIH-PA Author Manuscript NIH-PA Author Manuscript
Transcript of Collaborating with physicians to redesign a sign-out tool

Collaborating With Physicians to Redesign a Sign-Out Tool:An iterative, multifaceted approach with users – even busy ones – can yield a satisfyingand efficient product.
JUSTIN M. DEVOGE, ELLEN J. BASS, RICHARD M. D. SLEDD, STEPHEN M. BOROWITZ,and LINDA WAGGONER-FOUNTAIN
FEATURE AT A GLANCEPhysician sign-out is a mechanism for transferring patient information from one group of hospitalcare-givers to another at shift changes. Support tools are critical to the success of sign-out. Toensure that a tool is effective, designers must collaborate with end users, but collaboration can bedifficult when working with users who are busy and have irregular schedules. In this article, wereport on a collaborative effort between physicians and engineers to redesign a sign-out supporttool. Strategies included focus groups, interviews, “on-the-fly” feedback, and an iterative designprocess, which engaged end users in the design process. Task analysis methods enabled us toquantify the differences in functionality between the original tool and the prototype.
Keywordssign-out; handoff of care; user-centered design; collaborative design; process support tools;medical decision making
A user-centered approach is critical in the development of new process support tools, butengaging end users can be challenging (Hooper, 1986). Users may not always be able toarticulate their problems or point to their root causes; they may jump to potential solutionsbefore truly understanding the underlying issues; and they may not be available duringtypical work hours to discuss problems with their tools.
In this article, we describe a multifaceted approach that combines focus groups, interviews,iterative prototyping, testing, and feedback for engaging one such group of end users –resident physicians – in the design process for a sign-out support tool. Suggestedimprovements are based on task analysis methods comparing the work flow found with theexisting and redesigned tools, and practical strategies are discussed for increasing end userinvolvement in the design process.
BackgroundSign-out (that is, when outgoing physicians hand off patient care to incoming physicians) isa critical process in hospital settings (Borowitz, Waggoner-Fountain, Bass, & Sledd, 2008).Residents’ duty hours are restricted to 30 continuous hours and 80 total hours per week,accompanied by 10-hour rest periods away from patient care (Accreditation Council forGraduate Medical Education, n.d.). As a result of these restrictions, the number of sign-outsbetween resident physicians has increased, along with concern for their effect on continuityof care (Horwitz, Krumholz, Green, & Huot, 2006; Okie, 2007; Vidyarthi, Arora, Schnipper,Wall, & Wachter, 2006).
This article is based on the study of sign-out between residents on the general pediatricwards of a university-based tertiary care hospital. On such wards, sign-out occurs in the
NIH Public AccessAuthor ManuscriptErgon Des. Author manuscript; available in PMC 2011 August 2.
Published in final edited form as:Ergon Des. 2009 January 1; 17(1): 20–28. doi:10.1518/106480409X415170.
NIH
-PA Author Manuscript
NIH
-PA Author Manuscript
NIH
-PA Author Manuscript

morning and in the afternoon. The brief morning sign-out allows the night staff to update theincoming residents on overnight events and the status of each patient. The morecomprehensive afternoon sign-out allows the outgoing residents to review with the nightstaff what care is required until the following morning.
Prior to the work reported here, residents had developed a Microsoft Excel®-basedspreadsheet to support sign-out (Figure 1). They considered this system a reasonable meansfor storing and summarizing patient data for sign-out. However, the sign-out tool wasmanually updated by residents as they had time, and it was difficult to access because it wasinstalled on a single, inconveniently located computer. As a result, data in the sign-out toolwere not always up to date, and often, information for recently admitted patients was notincluded at all.
The Excel sign-out tool had usability issues as well. Some residents were not familiar withExcel or had never received formal training on how to use the tool. Residents who werefamiliar with the Excel tool’s functionality complained that adding, deleting, or modifyingrecords could be tedious, error prone, and time consuming.
Part of the problem stemmed from having to add a patient’s record to the spreadsheet whilemaintaining proper ordering (by room number). This required the physician to find thecorrect place to add the record, insert a new row, and then ensure that the room number wastyped in the correct format. As Figure 1 shows, data entry over time yielded inconsistentroom-numbering formats. Simple errors such as these can have serious consequences; forexample, patients can be overlooked. In addition, because of the limited column fields andsizes, residents could not provide information according to their needs, personal style, theexperience of the receiving physician, or the receiving physician’s familiarity with thepatients on the ward (e.g., some residents prefer to include more detailed information thando others). Physicians in teaching hospitals are aware of the experience (or lack thereof) oftheir colleagues, such as when a senior resident (i.e., in his or her second or third year) givessign-out to an intern (a first-year resident).
A Collaborative Design StrategyTo begin redesigning the sign-out tool, we initially focused on defining requirements forinformation content and functionality. We used a multifaceted approach that included focusgroups, interviews, task analyses, iterative prototyping, testing, and feedback. Focus groupsand interviews were conducted to help residents define the information and functionalrequirements for the prototype sign-out tool (Sledd, Bass, Borowitz, & Waggoner-Fountain,2006). As residents defined additional requirements, they were incrementally implementeduntil a working prototype was put into use on the general wards. During this time, residentsinteracted with the prototype and provided feedback and additional requirements, whichwere iteratively incorporated into the prototype’s design.
Defining Requirements and Design of a PrototypeInformation requirements
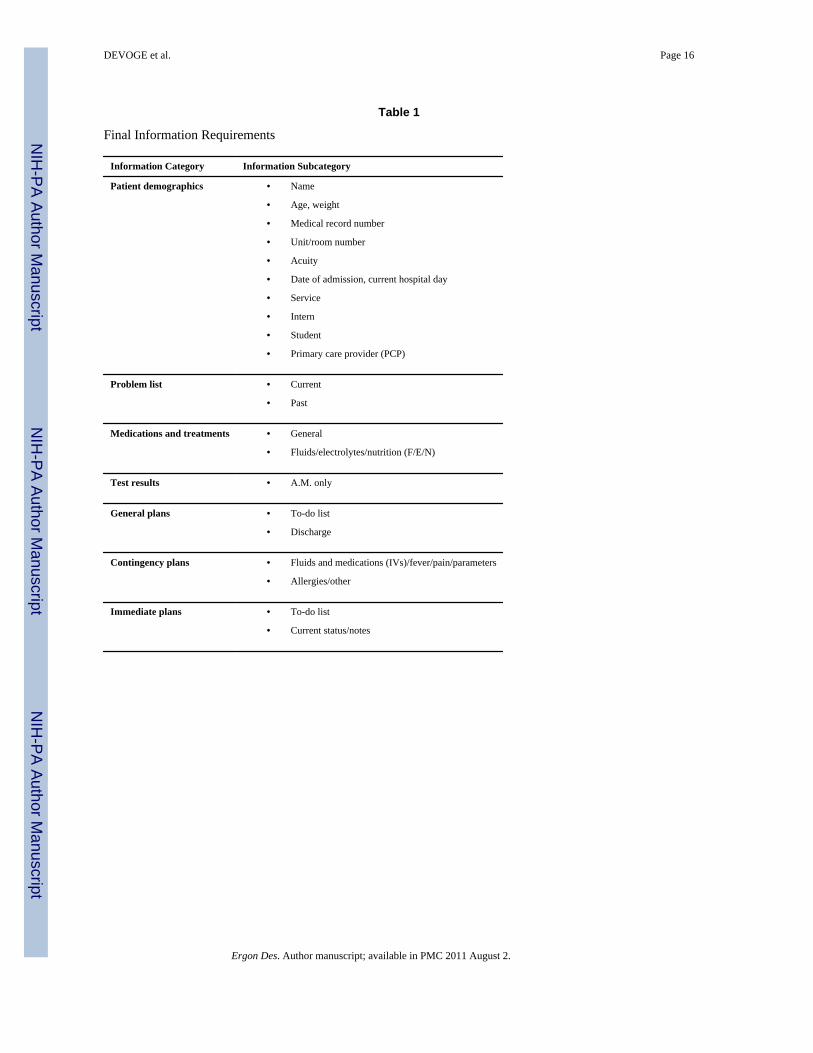
In the first round of focus groups, residents identified 6 general and 29 specific informationrequirements for each patient discussed during sign-out. The information requirements wererefined via interviews with two pediatric chief residents. The final list of informationcategories consisted of 7 general information categories and 21 subcategories (see Table 1,next page).
DEVOGE et al. Page 2
Ergon Des. Author manuscript; available in PMC 2011 August 2.
NIH
-PA Author Manuscript
NIH
-PA Author Manuscript
NIH
-PA Author Manuscript
In terms of the tool’s functionality, the chief residents outlined two general requirements:data entry/modification requirements and data reporting/printing requirements. Detailedrequirements were then identified in focus groups with all the pediatric residents andadditional meetings with only the chief residents. Based on these requirements, it was notpossible to develop a working prototype using a spreadsheet format, so, for two reasons, wechose Microsoft Access® as the platform for the prototype. First, Microsoft Access offersseparation of the data entry, storage, and output processes, making prototype design a“divide-and-conquer” activity. Second, Access includes design tools that help to simplifyfunctionality for end users.
Data entry requirementsThe main focus for data entry was to reduce the complexity of the process and provideflexibility not found in the existing spreadsheet tool. The list on the next page includesrequirements, followed by design elements in parentheses.
1. Allow patients to be added to the system (using Microsoft Access, a blank patientrecord is always available at the bottom of the page; see Figure 2).
2. Allow patients to be deleted from the system (by placing the Active RecordIdentifier on a record and pressing the delete key; Figure 2).
3. Provide a separate entry space for each of the 21 information subcategories (seemultiple data input areas in Figure 2).
4. Employ features such as drop-down menus for information subcategories that havea limited set of choices, such as “Demographics–Room Number,” or “GeneralPlans–Discharge” (Figure 2).
5. Allow free text input when drop-down menus are not applicable (Figure 2).
6. Limit the number of characters available for free text input to maintain simplicity(Microsoft Access provides this ability when specifying data types in the database).
7. Initially sort records by one of the common ways residents discuss patients: byacuity (that is, the seriousness of the patient’s condition; a high-acuity patient isone in very serious or critical condition) or room number (the data entry pageinitially sorts patients by room number; Figure 2).
8. Allow records to be sorted by any of the information categories for flexibility (seeinsert in Figure 2).
“On-the-fly” feedbackWe sought feedback from as many end users as possible. To help achieve this goal, we builtan interactive user feedback form into the data entry page. This allowed residents to givefeedback on the fly while using the tool and provided an outlet for comments wheninterviews could not be scheduled. The comments were used throughout the process todefine additional requirements and modify the prototype.
Data output/printing requirementsWith respect to data output, the tool should generate and print customized reports based onresident preferences and predetermined values –for example, the time of day (morning/a.m.or afternoon/p.m.) and the sorting method for patients (by acuity or room number). WhereasExcel spreadsheets can be printed only in the format of the data entry interface, Accessallows the creation of multiple reports linked to the same data table. Therefore, we designedfour reports corresponding to each of the four possible combinations of the time of day and
DEVOGE et al. Page 3
Ergon Des. Author manuscript; available in PMC 2011 August 2.
NIH
-PA Author Manuscript
NIH
-PA Author Manuscript
NIH
-PA Author Manuscript

the desired sorting method. Each report could be viewed or printed via the print menu on thedata entry form (Figure 3).
The design of each report (see Figure 4) was based on the resident-defined formattingrequirements:
1. Reports must be able to display at least five patients per page.
2. The tool must be able to shrink or expand data columns in a report, based on theamount of data entered.
3. The text for a patient’s name, room, and acuity must be salient (e.g., appear inbold).
4. The report must highlight (using text shading) the acuity of any patient categorizedas high acuity as well as the discharge plan for any patient scheduled to bedischarged at 9:00 a.m.
5. The tool must provide the pager numbers of the current rotating physicians in thefooter of all sign-out reports.
Although footer information was initially included at the bottom of each printed report, thechief residents pointed out that names and numbers needed to be updated when a newrotation was under way. Therefore, we added the functionality to modify the report footer(see Figure 5, next page).
Additional requirementsPatients on the pediatric wards include those on the general wards service, the hematology/oncology (Heme/Onc) service, and the pediatric intensive care unit (PICU). The sign-outprocesses for all three services are similar, but the location, time, and residents involvedvary. Comments from the feedback forms and interviews suggested that the prototypeneeded to support sign-out for Heme/Onc and PICU patients. Therefore, separate data entryforms, database tables, and reports – all based on the original designs – were added to theprototype for the two additional services.
Residents also requested a patient archive and a patient dictation list. The archive anddictation list were added to the tool as separate data entry forms and database tables. Withnew data entry forms, residents also specified the need to transfer patients’ records betweenthe service lists, the archive, and the dictation list. Transfers were implemented in theprototype so residents could transfer one patient’s records to one location or multiplepatients’ records (from one list) to multiple locations at one time.
The multiple reports designed for the Heme/Onc service were identical to those for thegeneral wards. However, residents required only one report for the PICU service, as fewpatients are typically on the service at a given time. Residents did not request a report for thepatient archive and requested only one report for the dictation list, similar to the PICUreport.
During interviews, resident supervisors and attending physicians requested support forprocedures other than sign-out. They described how the data stored in the prototype could beused to generate morning reports as well as a portion of each patient’s daily progress note.Both of these functions were added to the prototype in subsequent revisions. The morningreport function displays a single report of the current and past problems for all patientsadmitted between two specified dates, sorted by date and service, and it is formatted withlarge text for output to a projector. The daily progress note required the implementation of
DEVOGE et al. Page 4
Ergon Des. Author manuscript; available in PMC 2011 August 2.
NIH
-PA Author Manuscript
NIH
-PA Author Manuscript
NIH
-PA Author Manuscript

tabs (one for sign-out, one for the daily progress note) for each patient on the data entry pagefor the general wards, Heme/Onc, and PICU services.
With the addition of six new reports (excluding the morning report, as residents wanted it tobe a separate function), it was no longer appropriate to associate viewing or printing reportswith separate buttons. Therefore, the print menu was removed in favor of a report menu thatutilized drop-down menus instead of buttons to view and print reports. To organize all thefunctions implemented in the prototype, we developed a main menu that opened with thedatabase (see Figure 6, previous page).
Comparing the Sign-Out ToolsBased on the task analyses, we utilized the keystroke-level model (KLM; Card, Moran, &Newell, 1983) to quantify the time required to complete the tasks on each of the twosystems. Tables 2 through 5 (pages 25–26) provide task analyses of the spreadsheet and theprototype for two tasks common to both tools: adding a patient and modifying the reportfooter. For the KLM, P refers to pointing with the mouse, B to pressing or releasing themouse button, H to moving hands between keyboard and mouse, and K to pressing a key onthe keyboard. For the KLM, we collected and averaged timing data for one participant.
When a user enters patient identifying information into either system, the number of keyspressed is identical. Therefore, we modeled this as a single keystroke because there wouldbe no difference in time, no matter how many keys were pressed. For adding a patient, thespreadsheet required completion of four plans involving 33 separate keystroke-level actions,whereas the prototype required only one plan and 9 actions. The spreadsheet required oneplan and 26 keystroke-level actions to modify the footer of the printed sign-out reports,whereas the prototype required one plan and only 12 actions.
Both tasks could be completed in a much shorter time using the prototype (see Table 6, page27). There was a larger discrepancy between the two tools for adding a patient, but overall,modifying the report footer was the more complex of the two tasks. Results such as thesemay explain why some residents found working with the spreadsheet to be tedious, errorprone, and time consuming.
Access to the toolsOne of the problems with the original sign-out tool was that it was stored on only onecomputer, away from the location of most patients. Therefore, updates did not occur as oftenas they should have, and patient information was often missing. The prototype was madeavailable on a secure hospital server that was accessible from any computer on the pediatricwards. This change allowed residents to update the database without disruptions to theircurrent activities. Increased accessibility, combined with the simplification of commontasks, improved efficiency.
Prototype yoga: Improving flexibilityA number of tasks implemented in the database were not available with the spreadsheet – inparticular, support for sign-out on additional pediatric services and support for pediatricprocedures beyond sign-out. The prototype provided five unique data entry/modificationforms for patient data (sign-out and daily progress notes for three pediatric services, apatient archive, a patient dictation list, and the ability to transfer patients), compared withone form in the spreadsheet, which provided no specific method for transferring patients.
The prototype provided 11 unique presorted reports selected via drop-down menus forviewing and printing. With the old spreadsheet tool, only the current view of the data could
DEVOGE et al. Page 5
Ergon Des. Author manuscript; available in PMC 2011 August 2.
NIH
-PA Author Manuscript
NIH
-PA Author Manuscript
NIH
-PA Author Manuscript

be printed, and manual sorting was required in order to obtain different views. In addition,reports in the prototype are automatically resized based on the amount of informationentered. In the spreadsheet, a user would have to format the text manually in order to adjustthe size of the printed sheet.
Creating Successful Collaboration With End UsersCollaboration can be difficult when working with hard-to-reach end users, let alone trying togain their interest in the process. However, we were able successfully to utilize a fewpractical strategies that are universally applicable in situations in which collaboration isnecessary but difficult to achieve.
A multifaceted strategy is important. Limiting collaboration to a single strategy may isolateend users, gain the interest of only those who thrive on the method chosen, and skewfeedback. Our strategy included focus groups, interviews, feedback “on the fly,” and aniterative design process. The focus groups were a central aspect for creating buy-in. Inaddition, the focus groups helped to create a sense of teamwork, not only between the endusers and the systems engineers but also among the end users themselves. Interviews werean extension of the focus groups and enabled the designers to gain a more detailed andexpert perspective of the process the tool was meant to support, a critical step toward itsoverall improvement.
Providing users with the opportunity to give feedback and comments in the context of usingthe tool was beneficial in a number of ways. First, it was a way to gather feedback in actualwork situations and minimize the time in which a user had to commit his or her comments tomemory before reporting them. Second, it helped users gain a sense of personal involvementand interaction in the design process and the feeling that every comment was important inrelation to the final product. Finally, allowing users to provide feedback during the design ofthe tool was an easy way to note necessary improvements for each version that wasdeveloped, and it ultimately enabled the designers to incorporate user suggestions iterativelyinto the evolving prototype.
An iterative design process was essential in creating an atmosphere that did not pressure thesystem designers to develop a perfect tool on the first try or force the end users to “get itright” the first time either. Over time, it allowed modifications to be adapted incrementallyinto the prototype in an effort to shape the tool to the end users’ needs. In addition, userscame to feel that they could provide negative (as well as positive) feedback without theconcern that it would be detrimental to implementation of the tool or to their collaborationswith the designers. An iterative process also helped reinforce and maintain the end users’interest by periodically providing new and interesting designs to review instead of makingthem wait for the final product.
When designing a computerized process support tool, it is critical to understand the processclearly and develop requirements that support that process. End users must be involvedearly, to pique their interest; they must also be involved continuously because additionalrequirements become apparent after the tool or prototype is put into operation. Collaborationwith end users throughout the design activities enhances buy-in to the system andencourages the users to modify and improve the process on their own.
AcknowledgmentsThe project described was supported in part by Grant Number T15LM009462 from the National Library ofMedicine. The content is solely the responsibility of the authors and does not necessarily represent the officialviews of the National Library of Medicine or the National Institutes of Health.
DEVOGE et al. Page 6
Ergon Des. Author manuscript; available in PMC 2011 August 2.
NIH
-PA Author Manuscript
NIH
-PA Author Manuscript
NIH
-PA Author Manuscript

ReferencesAccreditation Council for Graduate Medical Education. ACGME duty hours standards fact sheet.
(n.d.). Retrieved July 30, 2007, fromhttp://www.acgme.org/acWebsite/newsRoom/newsRm_dutyHours.asp
Borowitz SM, Waggoner-Fountain LA, Bass EJ, Sledd RMD. Adequacy of information transferred atresident sign-out (inhospital handover of care): A prospective survey. Quality and Safety in HealthCare. 2008; 17:6–10. [PubMed: 18245212]
Card, S.; Moran, T.; Newell, A. The psychology of human-computer interaction. Mahwah, NJ:Erlbaum; 1983.
Hooper, K. Architectural design: An analogy. In: Norman, DA.; Draper, SW., editors. User centeredsystem design. Mahwah, NJ: Erlbaum; 1986. p. 9-23.
Horwitz LI, Krumholz HM, Green ML, Huot SJ. Transfers of patient care between house staff oninternal medicine wards: A national survey. Archives of Internal Medicine. 2006; 166:1173–1177.[PubMed: 16772243]
Okie S. An elusive balance – Resident work hours and the continuity of care. New England Journal ofMedicine. 2007; 356:2665–2667. [PubMed: 17596598]
Sledd, RMD.; Bass, EJ.; Borowitz, SM.; Waggoner-Fountain, LA. Characterization of sign out inpediatric acute care wards to inform process improvement. Proceedings of the Human Factors andErgonomics Society 50th Annual Meeting; Santa Monica, CA: Human Factors and ErgonomicsSociety; 2006. p. 1068-1072.
Vidyarthi AR, Arora V, Schnipper JL, Wall SD, Wachter RM. Managing discontinuity in academicmedical centers: Strategies for safe and effective resident sign-out. Journal of Hospital Medicine.2006; 1:257–266. [PubMed: 17219508]
Biographies
Justin M. DeVoge is a PhD student in the Department of Systems and InformationEngineering, School of Engineering and Applied Science at the University of Virginia,where he earned his MS in systems engineering in 2006. He is studying methods forimproving the sign-out process in the hospital setting. His research interests include humanfactors, cognitive systems engineering, instructional systems design, and database designand implementation.
Ellen J. Bass is an associate professor in the Department of Systems and InformationEngineering in the School of Engineering and Applied Science at the University of Virginia.
DEVOGE et al. Page 7
Ergon Des. Author manuscript; available in PMC 2011 August 2.
NIH
-PA Author Manuscript
NIH
-PA Author Manuscript
NIH
-PA Author Manuscript

She earned a PhD in systems engineering from the Georgia Institute of Technology in 2002.Bass’s research interests include human-automation interaction, intelligent decision supportsystems, and intelligent learning environments. She may be reached at University ofVirginia, Department of Systems and Information Engineering, 151 Engineers’ Way,Charlottesville, VA 22904, [email protected].
Richard Michael DuVal Sledd is a senior consultant with Booz Allen Hamilton. He earnedhis MS in systems engineering from the University of Virginia in 2006. He works in theinformation assurance domain, integrating security into strategic business planning tominimize the impact of disruptions to business operations. His areas of interest includequantitative analysis, human factors engineering, data mining and analysis, and systemcertification and accreditation.
Stephen M. Borowitz is a professor of pediatrics and public health at the University ofVirginia. He has long been interested in resident and medical student education and hasreceived many teaching awards. He has spearheaded educational initiatives involvinginformation technology throughout the university. Borowitz obtained a BA in sociology andstatistics at Tulane University and an MD at Rush Medical College; he completed pediatricresidency and fellowship in pediatric gastroenterology and nutrition at VanderbiltUniversity.
DEVOGE et al. Page 8
Ergon Des. Author manuscript; available in PMC 2011 August 2.
NIH
-PA Author Manuscript
NIH
-PA Author Manuscript
NIH
-PA Author Manuscript
Linda A. Waggoner-Fountain is an associate professor of pediatrics in the School ofMedicine and program director for the General Pediatric Residency Training Program at theUniversity of Virginia. She earned her MD at the University of Iowa. She completed hergeneral pediatric residency training, chief residency, and pediatric infectious disease trainingat the University of Virginia. Her research interests include residency education, ambulatoryinfection control, and infectious issues in international adoptees and refugees.
DEVOGE et al. Page 9
Ergon Des. Author manuscript; available in PMC 2011 August 2.
NIH
-PA Author Manuscript
NIH
-PA Author Manuscript
NIH
-PA Author Manuscript
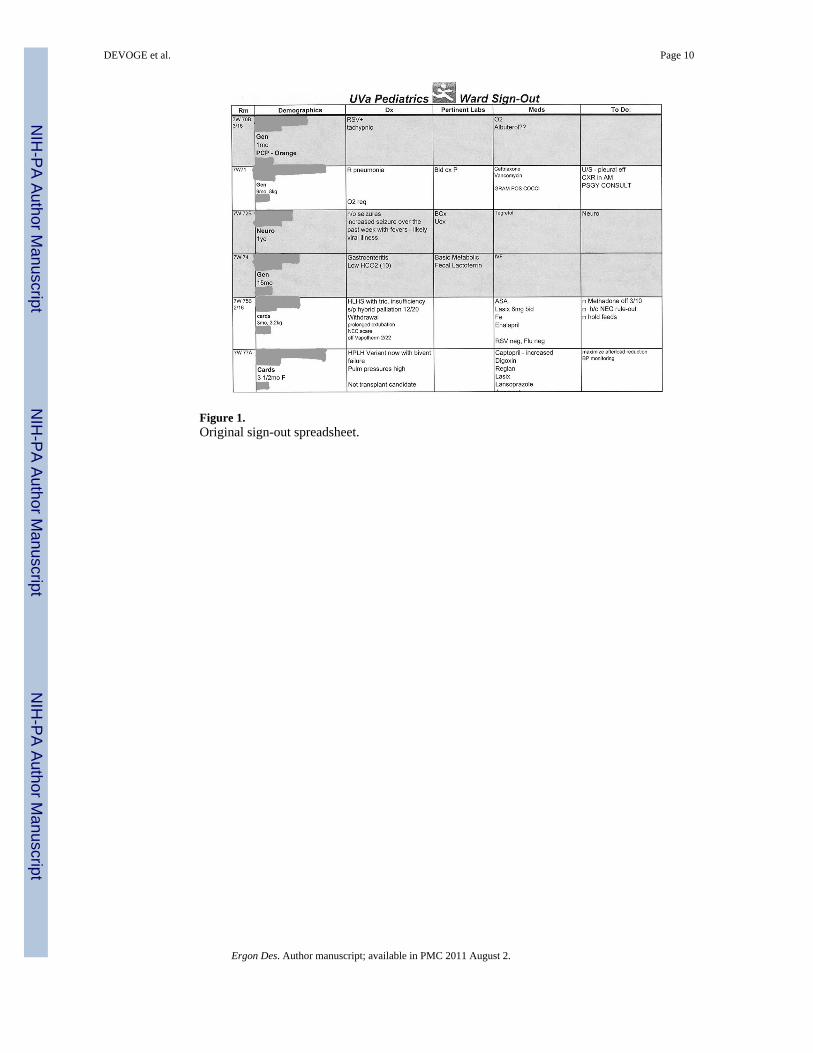
Figure 1.Original sign-out spreadsheet.
DEVOGE et al. Page 10
Ergon Des. Author manuscript; available in PMC 2011 August 2.
NIH
-PA Author Manuscript
NIH
-PA Author Manuscript
NIH
-PA Author Manuscript

Figure 2.Prototype data entry page.
DEVOGE et al. Page 11
Ergon Des. Author manuscript; available in PMC 2011 August 2.
NIH
-PA Author Manuscript
NIH
-PA Author Manuscript
NIH
-PA Author Manuscript

Figure 3.Menu for printing reports.
DEVOGE et al. Page 12
Ergon Des. Author manuscript; available in PMC 2011 August 2.
NIH
-PA Author Manuscript
NIH
-PA Author Manuscript
NIH
-PA Author Manuscript

Figure 4.Prototype sign-out report (a.m. by acuity).
DEVOGE et al. Page 13
Ergon Des. Author manuscript; available in PMC 2011 August 2.
NIH
-PA Author Manuscript
NIH
-PA Author Manuscript
NIH
-PA Author Manuscript

Figure 5.Modify Report Footer page.
DEVOGE et al. Page 14
Ergon Des. Author manuscript; available in PMC 2011 August 2.
NIH
-PA Author Manuscript
NIH
-PA Author Manuscript
NIH
-PA Author Manuscript

Figure 6.Final prototype main menu.
DEVOGE et al. Page 15
Ergon Des. Author manuscript; available in PMC 2011 August 2.
NIH
-PA Author Manuscript
NIH
-PA Author Manuscript
NIH
-PA Author Manuscript
NIH
-PA Author Manuscript
NIH
-PA Author Manuscript
NIH
-PA Author Manuscript
DEVOGE et al. Page 16
Table 1
Final Information Requirements
Information Category Information Subcategory
Patient demographics • Name
• Age, weight
• Medical record number
• Unit/room number
• Acuity
• Date of admission, current hospital day
• Service
• Intern
• Student
• Primary care provider (PCP)
Problem list • Current
• Past
Medications and treatments • General
• Fluids/electrolytes/nutrition (F/E/N)
Test results • A.M. only
General plans • To-do list
• Discharge
Contingency plans • Fluids and medications (IVs)/fever/pain/parameters
• Allergies/other
Immediate plans • To-do list
• Current status/notes
Ergon Des. Author manuscript; available in PMC 2011 August 2.

NIH
-PA Author Manuscript
NIH
-PA Author Manuscript
NIH
-PA Author Manuscript
DEVOGE et al. Page 17
Table 2
Task Analysis for Adding a Patient to the Spreadsheet
Keystroke-Level Model Task 1.1:Add a patient to the spreadsheet.PLAN: Do 1.1.1 then 1.1.2 then 1.1.3 (for name column) and 1.1.4 (for all other columns); repeat 1.1.1–1.1.4 (untilall patients added).
P – B – P – B
1.1.1: Place the patient in the correct order by room.PLAN: Do 1.1.1.1 then 1.1.1.2.
1.1.1.1: Scroll to the row for the existing patient whose room number is one higher than the number for thepatient to be added.
P – B – P – B 1.1.1.2: In the far left column showing the row number of the existing patient, right-click and select “insert.”
P – BBBB 1.1.2: Select and double-click the desired box to edit the text column of the new row.
1.1.3:Add patient identification information.PLAN: Do 1.1.3.1 then 1.1.3.2 then 1.1.3.3 then (if needed) do 1.1.3.4 and/or 1.1.3.5; repeat 1.1.3.2–1.1.3.5 until alllines are entered.
H – K 1.1.3.1:Type the name of the patient.
K 1.1.3.2: Press Alt + Enter to move to the next line.
K 1.1.3.3: Enter additional text.
H – P – BB 1.1.3.4: Click the “increase font size” button.
H – P – BB 1.1.3.5: Click the “B” button to make the text bold.
1.1.4:Add data to the text field.PLAN: Do 1.1.4.1; if desired do 1.1.4.2 and repeat until all data are entered.
H – P – BBBB – K 1.1.4.1:Type text into box.
K 1.1.4.2:To make a new line, press Alt + Enter.
Note. P = pointing with the mouse, B = pressing or releasing the mouse button, H = moving hands between keyboard and mouse, and K = pressinga key on the keyboard.
Ergon Des. Author manuscript; available in PMC 2011 August 2.

NIH
-PA Author Manuscript
NIH
-PA Author Manuscript
NIH
-PA Author Manuscript
DEVOGE et al. Page 18
Table 3
Task Analysis for Adding a Patient to the Prototype
Keystroke-Level Model Task 1.2:Add a patient to the prototype.PLAN: Do 1.2.2 then 1.2.3 then 1.2.4 or 1.2.5 (repeat 1.2.3–1.2.5 until all desired data have been added).
P – BB 1.2.2:At the bottom of the page, click the → * icon.
P – BB 1.2.3: Select a data field to edit.
H – K 1.2.4: (If text box) Modify text of the data field.
P 1.2.5: (If drop-down) Change the selection of the drop-down menu.
Note. P = pointing with the mouse, B = pressing or releasing the mouse button, H = moving hands between keyboard and mouse, and K = pressinga key on the keyboard.
Ergon Des. Author manuscript; available in PMC 2011 August 2.

NIH
-PA Author Manuscript
NIH
-PA Author Manuscript
NIH
-PA Author Manuscript
DEVOGE et al. Page 19
Table 4
Task Analysis for Modifying the Footer of the Report in the Spreadsheet
Keystroke-Level Model Task 2.1: Modify the footer of a sign-out report.PLAN: Do 2.1.1 then 2.1.2 then 2.1.3 then 2.1.4 then 2.1.5 then 2.1.6 then 2.1.7.
P – B – P – B 2.1.1: Click View menu and select “Header and Footer.”
P – BB 2.1.2: Click the “custom header” or “custom footer” button.
P – BB 2.1.3: Click the “left section” text box.
H – P – BB – K 2.1.4: Edit the text in the “left section” text box.
H – P – BB 2.1.5: Click the “OK” button to close the editing window.
P – BB 2.1.6: Click the “OK” button to close the header and footer window.
P – B – P – B 2.1.7: Save changes: Select File → Save from the top menu.
Note. P = pointing with the mouse, B = pressing or releasing the mouse button, H = moving hands between keyboard and mouse, and K = pressinga key on the keyboard.
Ergon Des. Author manuscript; available in PMC 2011 August 2.

NIH
-PA Author Manuscript
NIH
-PA Author Manuscript
NIH
-PA Author Manuscript
DEVOGE et al. Page 20
Table 5
Task Analysis for Modifying the Footer of the Reports in the Prototype
Keystroke-Level Model Task 2.2: Modify the footer of a sign-out report.PLAN: Do 2.2.1 then 2.2.2 then 2.2.3.
P – BB 2.2.1: Click “modify footer” button on main menu.
H – P – BB – K 2.2.2: Edit text in the text box of the “edit footer” window.
H – P – BB 2.2.3: Click “return to main menu” button.
Note. P = pointing with the mouse, B = pressing or releasing the mouse button, H = moving hands between keyboard and mouse, and K = pressinga key on the keyboard.
Ergon Des. Author manuscript; available in PMC 2011 August 2.

NIH
-PA Author Manuscript
NIH
-PA Author Manuscript
NIH
-PA Author Manuscript
DEVOGE et al. Page 21
Table 6
Predictive Klm-Based Models for Two Sign-Out Tasks
Keystroke-Level Model Tool Predictive Equation Total Time (seconds)
Add patient Spreadsheet Texecute = 8Tp + 16TB + 4TH + 5TK 13.4
Prototype Texecute = 3Tp + 4TB + TH + TK 4.4
Modify footer Spreadsheet Texecute = 9Tp + 14TB + 2TH + TK 12.4
Prototype Texecute = 3Tp + 6TB + 2TH + TK 5.0
Note. TP (move mouse to a point) = 1.1 seconds; TB (time to press or release mouse button) = 0.1 seconds; TH (time to home hands to keyboard ormouse) = 0.4 seconds; TK (time to press a key on the keyboard) = 0.28 seconds.
Ergon Des. Author manuscript; available in PMC 2011 August 2.