a strategic planning methodology for aircraft redesign
409
A STRATEGIC PLANNING METHODOLOGY FOR AIRCRAFT REDESIGN A Thesis Presented to The Academic Faculty by Fairuz Izzuddin Romli In Partial Fulfillment of the Requirements for the Degree Doctor of Philosophy in the School of Aerospace Engineering Georgia Institute of Technology May 2009 COPYRIGHT 2009 FAIRUZ I. ROMLI
-
Upload
khangminh22 -
Category
Documents
-
view
5 -
download
0
Transcript of a strategic planning methodology for aircraft redesign

A STRATEGIC PLANNING METHODOLOGY
FOR AIRCRAFT REDESIGN
A Thesis Presented to
The Academic Faculty
by
Fairuz Izzuddin Romli
In Partial Fulfillment of the Requirements for the Degree
Doctor of Philosophy in the School of Aerospace Engineering
Georgia Institute of Technology May 2009
COPYRIGHT 2009 FAIRUZ I. ROMLI

A STRATEGIC PLANNING METHODOLOGY
FOR AIRCRAFT REDESIGN
Approved by: Prof. Dimitri Mavris, Advisor School of Aerospace Engineering Georgia Institute of Technology
Prof. Daniel P. Schrage School of Aerospace Engineering Georgia Institute of Technology
Dr. Elena Garcia School of Aerospace Engineering Georgia Institute of Technology
Mr. Mathias Emeneth Application Engineer PACE America, Inc.
Dr. Neil Weston School of Aerospace Engineering Georgia Institute of Technology
Date Approved: April 3, 2009

Dedicated to my late father and my loving mother

III
ACKNOWLEDGEMENTS
I like to start by thanking my advisor, Prof. Dimitri Mavris for giving me this opportunity
to learn exciting things and to experience working with many great people here in ASDL
for the past few years. I also wish to extend my deep gratitude to Dr. Elena Garcia for all
her invaluable feedbacks and advices throughout this thesis process. My thanks are also
extended to my thesis committee members: Dr. Weston, Prof. Schrage and Mr. Emeneth;
for their inputs to improve this work.
Throughout my time here in Georgia Tech, I am very fortunate to have the support and
encouragement from many friends both here and across the globe. For that, I am forever
thankful. In particular, I offer my gratitude to my close friends Jose, Dennis, Susan, Daili,
Hongjun, Farooq, Joslyn and Dr. Lee, who have helped me in one way or another through
ups and downs of this educational journey. May it be the long talks over lunch or simple
notes of thoughts; our friendship is something that I treasure dearly. In addition, for those
who I had the luxury of working with and who I befriended during my study here in both
ASDL and ISYE, thanks for those great experiences and fond memories.
Finally, I would like to thank my whole family for their undying confidence and support
even when times were tough, especially my mother. This whole journey is inspired by my
late father and although I cannot thank him enough now for pushing me to this moment, I
am thankful to be able to complete this for him.

IV
TABLE OF CONTENTS
Page
ACKNOWLEDGEMENTS……………………………………………………………... III
LIST OF TABLES……………………………………………………………………..... IX
LIST OF FIGURES…………………………………………………………………….XIII
LIST OF ABBREVIATIONS…………………………………………………………..XIX
SUMMARY…………………………………………………………………………. XXII
CHAPTER
1 RESEARCH MOTIVATION…………………………………………………….. 1
1.1 The Changing Marketplace……………………………………………….. 1
1.1.1 Dynamic Market Factors…………………………………………….2
1.1.2 Primary Market Challenges………………………………………… 4
1.1.3 The Shift to Mass Customization and Product Redesign…………... 6
1.2 Research Scope Definition………………………………………………. 10
1.2.1 Engineering Changes in Product Redesign Process………………..10
1.2.2 Characteristics of Engineering Change Process……………………14
1.2.3 Potential Benefits of Strategic Redesign…………………………...19
1.2.4 Current Gaps in Change Management for Product Redesign……... 23
1.2.5 Scope Limitations…………………………………………………. 32
1.3 Research Objectives……………………………………………………... 38
1.4 Thesis Organization……………………………………………………... 39
1.5 Chapter Summary……………………………………………………….. 40
2 DERIVATIVE AIRCRAFT DEVELOPMENT………………………………… 42
2.1 Aircraft Development Practices…………………………………………. 42

V
2.1.1 The Significance of Aircraft Derivatives………………………….. 44
2.1.2 Aircraft Development Process…………………………………….. 49
2.2 Engineering Change Challenges in Aircraft Redesign Process…………. 56
2.2.1 “Top-Down” Aircraft Subsystems Development…………………. 58
2.2.2 A Better Aircraft Redesign Planning……………………………… 62
2.3 Building a Methodology………………………………………………… 64
2.3.1 Collaborative Management of Engineering Changes……………... 65
2.3.2 Parameter-based Engineering Change Management……………… 68
2.3.3 Change Process Planning………………………………………….. 70
2.3.4 Reverse Engineering and Redesign Methodology………………… 73
2.3.5 “Anchoring and Adjustment” Redesign Process………………….. 75
2.3.6 “Design for Assembly”-based Product Redesign Approach……… 76
2.3.7 Comparison of Identified Methods to Research Objectives………. 79
2.3.8 Strategic Planning of Engineering Changes (SPEC) Framework…. 83
2.4 Chapter Summary……………………………………………………….. 86
3 LITERATURE REVIEW…………………………………………...................... 88
3.1 Baseline Assessment Methods…………………………………………... 89
3.1.1 Quantitative System Evolvability…………………………………. 92
3.1.2 System Adaptability Factor……………………………………….. 96
3.1.3 Methodology for Assessing the Adaptability of Products………… 98
3.1.4 Summarized Review of Baseline Assessment Methods…………. 103
3.2 Change Propagation Modeling………………………………………….104
3.2.1 Functional Change Modeling…………………………………….. 106
3.2.2 Component-Function Propagation Model………………………...109
3.2.3 Component Linkage Model……………………………………….114

VI
3.2.4 Change Favorable Representation………………………………...118
3.2.5 Product Dependency Model……………………………………… 121
3.2.6 Summarized Review of Change Propagation Modeling Methods.. 124
3.3 Change Impact Analysis……………………………………………….. 126
3.3.1 Change Propagation Analysis……………………………………. 129
3.3.2 Progressive Change Probabilities………………………………... 132
3.3.3 Response Surface Method in Change Impact Assessment………. 134
3.3.4 Summarized Review of Change Impact Analysis Methods……... 137
3.4 Change Implementation Planning……………………………………… 139
3.3.1 RedesignIT……………………………………………………….. 141
3.3.2 KRITIK…………………………………………………………... 146
3.3.3 Change Prediction Method………………………………………. 149
3.3.4 Summarized Review of Change Planning Methods……………... 156
3.5 Other Enabling Techniques and Definitions…………………………… 158
3.5.1 Qualitative Change Impact Measurement………………………... 158
3.5.2 Taxonomy for Change Propagation Prediction…………………...162
3.6 Chapter Summary……………………………………………………….164
4 RESEARCH HYPOTHESES AND PROPOSED METHODOLOGY………... 167
4.1 Research Questions and Hypotheses…………………………………... 168
4.2 Proposed Methodology………………………………………………… 180
4.2.1 Step 1: Aircraft Change Modeling……………………………….. 181
4.2.2 Step 2: Baseline Assessment……………………………………... 188
4.2.3 Step 3: Change Plan Generation…………………………………. 202
4.2.4 Step 4: Change Impact Assessment……………………………… 214
4.2.5 Step 5: Change Plan Selection…………………………………… 219

VII
4.3 Summary of Proposed Methodology Activities……………………….. 221
4.4 Comparison to Existing Methods and Tools…………………………… 223
4.4.1 Aircraft Change Modeling……………………………………….. 226
4.4.2 Baseline Assessment……………………………………………... 228
4.4.3 Change Plan Generation…………………………………………. 230
4.5 Chapter Summary……………………………………………………… 234
5 IMPLEMENTATION OF PROPOSED METHODOLOGY…………………. 236
5.1 More Electric Aircraft (MEA) Initiatives……………………………… 237
5.1.1 Electrical-based Flight Controls…………………………………. 238
5.1.2 Context-Aware In-Flight Entertainment System………………… 241
5.1.3 Advanced Electrical Power Generation and Networking………... 244
5.1.4 Summary of Considered MEA Initiatives……………………….. 249
5.2 Case Study 1: Derivative Aircraft with Electrical Flight Controls…….. 250
5.2.1 Creation of Change Models………………..…………………….. 254
5.2.2 Assessment of Baseline Candidates……………………………… 255
5.2.3 Conclusion from Case Study 1…………………………………... 264
5.3 Case Study 2: Notional Aircraft Redesign for MEA…………………... 266
5.3.1 Step 1: Aircraft Change Modeling……………………………….. 267
5.3.2 Step 2: Baseline Assessment……………………………………... 270
5.3.3 Step 3: Change Plan Generation…………………………………. 274
5.3.4 Step 4: Change Impact Assessment……………………………… 284
5.3.5 Step 5: Change Plan Selection…………………………………… 292
5.3.6 Conclusion from Case Study 2……………………………………294
5.4 Contributions of the Proposed SPEC Methodology…………………… 303
5.4.1 Decision-making Aid for Aircraft Redesign……………………... 303

VIII
5.4.2 Baseline Assessment and Selection Scheme…………………….. 306
5.4.3 Definition of Change Solution Space……………………………. 308
5.4.4 Redesign Risk Analysis………………………………………….. 311
5.5 Chapter Summary……………………………………………………… 312
6 DISCUSSIONS AND CONCLUSIONS……………………………………… 313
6.1 Revisiting Research Questions and Hypotheses……………………….. 315
6.1.1 Baseline Assessment……………………………………………... 315
6.1.2 Change Propagation……………………………………………… 317
6.1.3 Change Impact Analysis…………………………………………. 320
6.1.4 Change Implementation Planning………………………………... 322
6.2 Summary of Research Contributions…………………………………... 324
6.3 Avenues of Future Works……………………………………………… 326
6.4 Personal Notes…………………………………………………………. 328
APPENDIX A: FLIGHT ROLL CONTROLS MODEL FOR CASE STUDY 1……. 330
APPENDIX B: AIRCRAFT SUBSYSTEMS MODEL FOR CASE STUDY 2…….. 335
APPENDIX C: APPROXIMATED SUBSYSTEM-SYSTEM
INTERRELATIONSHIP MODEL FOR CASE STUDY 2………….352
REFERENCES………………………………………………………………………….357
VITA……………………………………………………………………………..…….. 385

IX
LIST OF TABLES
Page
Table 1: Key Differences between Mass Production and Mass Customization ................. 6
Table 2: Categories of Companies in Aircraft Development Process [31, 266]............... 53
Table 3: Aircraft Development Process Milestones at Airbus [266]................................ 60
Table 4: Challenges of Engineering Changes in Aircraft Derivative Development......... 64
Table 5: Advantages and Disadvantages of CM-EC ........................................................68
Table 6: Advantages and Disadvantages of Parameter-based Change Management ....... 70
Table 7: Advantages and Disadvantages of Change Planning Process ............................ 72
Table 8: Advantages and Disadvantages of Reverse Engineering & Redesign Method .. 74
Table 9: Advantages and Disadvantages of “Anchoring & Adjustment” Redesign......... 76
Table 10: Advantages and Disadvantages of DBPRA...................................................... 79
Table 11: Qualitative Comparison of Identified Process Frameworks............................. 81
Table 12: Identified Tools and Methods in Research Areas............................................. 89
Table 13: Classes of System Evolvability [74, 75]........................................................... 92
Table 14: Difficulty Scale for Evolvability Analysis [75]................................................ 93
Table 15: Advantages and Disadvantages of the Quantitative System Evolvability........ 95
Table 16: Qualitative Comparison of Quantitative System Evolvability ......................... 96
Table 17: ISO/IEC 9126-1 Characteristics and Sub-characteristics [136] ....................... 96
Table 18: Adaptability Metrics Description [125]............................................................ 97
Table 19: Advantages and Disadvantages of SAF............................................................ 98
Table 20: Qualitative Comparison of SAF ....................................................................... 98
Table 21: Advantages and Disadvantages of MAAP ..................................................... 102
Table 22: Qualitative Comparison of MAAP ................................................................. 102
Table 23: Qualitative Comparison of Identified Baseline Assessment Methods ........... 103
Table 24: Advantages and Disadvantages of Functional Change Modeling .................. 108

X
Table 25: Qualitative Comparison of Functional Change Modeling.............................. 109
Table 26: Advantages and Disadvantages of Component-Function Propagation .......... 114
Table 27: Qualitative Comparison of Component-Function Propagation ...................... 114
Table 28: Modified FMEA Rating for Change Likelihood and Impact Measure [176]. 117
Table 29: Advantages and Disadvantages of Component Linkage Model..................... 118
Table 30: Qualitative Comparison of Component Linkage Model ................................ 118
Table 31: Advantages and Disadvantages of C-FAR ..................................................... 121
Table 32: Qualitative Comparison of C-FAR................................................................. 121
Table 33: Item Descriptive Attributes............................................................................. 123
Table 34: Advantages and Disadvantages of Product Dependency Model .................... 124
Table 35: Qualitative Comparison of Product Dependency Model................................ 124
Table 36: Qualitative Comparison of Identified Change Propagation Models............... 126
Table 37: Advantages and Disadvantages of CPA .........................................................131
Table 38: Qualitative Comparison of CPA..................................................................... 131
Table 39: Advantages and Disadvantages of Progressive Change Probability .............. 134
Table 40: Qualitative Comparison of Progressive Change Probability .......................... 134
Table 41: Advantages and Disadvantages of RSM in Change Impact Assessment ....... 137
Table 42: Qualitative Comparison of RSM in Change Impact Assessment................... 137
Table 43: Qualitative Comparison of Identified Change Impact Analysis Methods...... 139
Table 44: Advantages and Disadvantages of RedesignIT .............................................. 145
Table 45: Qualitative Comparison of RedesignIT .......................................................... 145
Table 46: Advantages and Disadvantages of KRITIK ................................................... 149
Table 47: Qualitative Comparison of KRITIK ............................................................... 149
Table 48: Advantages and Disadvantages of CPM.........................................................155
Table 49: Qualitative Comparison of CPM to Desired Criteria ..................................... 155
Table 50: Qualitative Comparison of Change Implementation Planning Methods........ 157
Table 51: NASA Technology Readiness Level [279] .................................................... 160

XI
Table 52: System Readiness Level [23, 279].................................................................. 161
Table 53: Change Impact Rating Scale........................................................................... 161
Table 54: Change Cost Rating Scale .............................................................................. 162
Table 55: Taxonomy of System Element Interactions [257, 293] .................................. 163
Table 56: Tools and Methods in Literature Review ....................................................... 165
Table 57: Taxonomy of System Element Interactions [257, 293] .................................. 183
Table 58: Change Tolerance Level Definition................................................................ 183
Table 59: Modified Aircraft System Evolvability Metrics ............................................. 189
Table 60: Change Impact Rating Scale........................................................................... 192
Table 61: Change Cost Rating Scale .............................................................................. 192
Table 62: Example Change Requirements...................................................................... 196
Table 63: Example Calculation of Generality and Scalability Scores............................ 197
Table 64: Example Calculation of Adaptability and Extensibility Risks ....................... 198
Table 65: Example Calculation of Complexity Risk ......................................................198
Table 66: Sample Calculation to Establish Relative Priorities ....................................... 206
Table 67: Qualitative Scale for Pairwise Change Preference ......................................... 207
Table 68: Example Evaluation of Subsystem Change Likelihood Score ....................... 210
Table 69: Example Evaluation of Subsystem Change Preference Score........................ 211
Table 70: Example Generated Change Plans.................................................................. 213
Table 71: Example Process Risk Calculation for Alternative Change Plans.................. 216
Table 72: Example Performance Impact Calculation for Alternative Change Plans...... 218
Table 73: Advantages and Disadvantages of Change Planning Process ........................ 225
Table 74: Summarized Comparison of the Change Modeling Procedure ...................... 227
Table 75: Summarized Comparison of the Baseline Assessment Procedure ................. 229
Table 76: Summarized Comparison of the Change Plan Generation Procedure ............ 234
Table 77: Summarized State of Considered MEA Technologies ................................... 250
Table 78: Driving Change Requirements for Case Study 1............................................ 251

XII
Table 79: Pugh Performance Evaluation Matrix of Baseline Candidates....................... 252
Table 80: Identified Initiating Change Components....................................................... 256
Table 81: Generality and Scalability Scores for Case Study 1 ....................................... 257
Table 82: Adaptability and Extensibility Risk Assessment for Airbus A320 ................ 258
Table 83: Adaptability and Extensibility Risk Assessment for Lockheed L-1011......... 259
Table 84: Adaptability and Extensibility Risk Assessment for Boeing B727................ 260
Table 85: Summary of Notional Aircraft Subsystems Model Build-Up ........................ 268
Table 86: Comparison of Competing Aircraft Characteristics ....................................... 271
Table 87: Initiating Change Components for Notional Aircraft System Model............. 273
Table 88: Change Alternative Plans for Notional Aircraft ............................................. 282
Table 89: Process Risks Assessment for Change Alternative Plans............................... 285
Table 90: Weight Impact Assessment for Change Alternative Plans ............................. 289
Table 91: Estimated Gross Weight for Derivative Aircraft System ............................... 291
Table 92: Triangular Distribution for Subsystem Parameters ........................................ 291
Table 93: Deterministic Performance and Process Indexes............................................ 293
Table C.1: Considered Subsystem Weight Parameters in FLOPS ................................. 353

XIII
LIST OF FIGURES
Page
Figure 1: Dynamic Factors in Product Market [137].......................................................... 2
Figure 2: Families of Aircraft from Airbus [266]............................................................... 8
Figure 3: General Redesign Process Framework [248] ....................................................11
Figure 4: Engineering Change Process within Product Development [174] .................... 12
Figure 5: Initiated and Emergent Changes [115].............................................................. 13
Figure 6: Change Management Workflow by ISO10007 [176] ....................................... 15
Figure 7: Typical Flow of Change Impacts [120]............................................................. 16
Figure 8: Propagation of Engineering Change Effects..................................................... 17
Figure 9: Types of Engineering Change Propagation [115] ............................................. 18
Figure 10: Cost versus Time for Engineering Change Handling [14] .............................. 19
Figure 11: Paradigm Shift in Design Process [61]............................................................ 21
Figure 12: Degree of Changeability versus Cost [286] .................................................... 27
Figure 13: Engineering Change Process Example [210].................................................. 36
Figure 14: Thesis Organization......................................................................................... 40
Figure 15: Primary Factors for Commercial Aircraft Environment [15].......................... 43
Figure 16: Previous Aircraft Development Timeline ....................................................... 44
Figure 17: Relative System Upgrades on Boeing Aircraft [125]...................................... 46
Figure 18: Development of Derivative Aircraft Family [86]............................................ 47
Figure 19: Traditional Aircraft Development Process [214] ............................................ 50
Figure 20: Quality Planning in Aerospace Manufacturing [214] ..................................... 50
Figure 21: Aircraft Design Process [262] ......................................................................... 52
Figure 22: Boeing’s Systems Design Environment [31].................................................. 53
Figure 23: Comparison between Traditional Serial Design and IPPD Approaches [14] . 54
Figure 25: Overview of Subsystem Development Process in Airbus [33] ....................... 60
Figure 26: Collaborative Management of Engineering Changes [267] ............................ 66

XIV
Figure 27: Parameter-based Engineering Change Management [270] ............................. 69
Figure 28: General Change Process Planning [120] ......................................................... 71
Figure 29: Reverse Engineering and Redesign Methodology [248]................................. 73
Figure 30: “Anchoring and Adjustment” Redesign Process [104] ................................... 75
Figure 31: Redesign Procedure in DBPRA [163]............................................................. 77
Figure 32: SWOT Plot for Identified Engineering Change Frameworks ......................... 80
Figure 33: Relationships of Observations, Research Questions and Proposed Method... 84
Figure 35: Functional Breakdown of System Evolvability [75]....................................... 92
Figure 36: Plots of Wymorian Standard Scoring Functions SSF1 and SSF7 [74] ........... 94
Figure 37: Structure of the Adaptation Metric [339]...................................................... 100
Figure 38: Assignment of MAAP Metric Weightings [339] .......................................... 101
Figure 39: Functional Modeling of a Power Screwdriver [312]..................................... 107
Figure 40: DSM Configuration for System Representation [148].................................. 110
Figure 41: Component-Function Propagation Method [134] ......................................... 111
Figure 42: Propagation Path Determination in Feature-Feature Matrix [134] ............... 112
Figure 43: Product Linkage Modeling Method [174]..................................................... 115
Figure 44: Ball Point Pen Linkage Modeling [174]........................................................ 116
Figure 45: DSM Representation for Linkage Models [174]........................................... 116
Figure 46: C-FAR Product Representation [83] ............................................................. 119
Figure 47: Dependency Modeling [273]......................................................................... 122
Figure 48: General Impact Analysis Step in Software Change Management [237]....... 128
Figure 49: Simple Change Propagation Tree [273] ........................................................ 130
Figure 50: Example Product Structure for Progressive Change Probabilities [160] ...... 133
Figure 51: A Four-Stroke, Turbocharged Diesel Engine Model [247]........................... 142
Figure 52: Summarized Redesign Procedure in KRITIK ............................................... 147
Figure 53: Change Prediction Method [80] .................................................................... 150
Figure 54: Sample Representation of Risk Graph [80]...................................................151

XV
Figure 55: Direct Propagated Change Risk Calculation [80] ......................................... 152
Figure 56: Example Case for Combined Change Propagation Risk Calculation [80].... 152
Figure 57: System Development and TRL [279]............................................................ 160
Figure 58: Observations, Research Questions and Proposed Method ............................ 168
Figure 60: Proposed Framework for SPEC Methodology.............................................. 180
Figure 61: SPEC Support Tool Main Program Interface................................................ 181
Figure 62: Considered ATA-100 Chapters for Aircraft Change Model ......................... 185
Figure 63: Overall Workflow for Step 1......................................................................... 186
Figure 64: Block Diagram Representation of B737-200 Electrical Power Subsystem .. 186
Figure 65: Sample Change Model for B737-200 Electrical Power Subsystem.............. 187
Figure 66: Aircraft Change Modeling by SPEC Support Tool....................................... 187
Figure 67: Overall Workflow for Step 2......................................................................... 195
Figure 68: Required Changes for Starter-Generator Implementation............................. 198
Figure 69: Evolvability Assessment for Equal Weightings............................................ 200
Figure 70: Evolvability Assessment for Minimum Affected Components .................... 202
Figure 71: Baseline Assessment by SPEC Support Tool............................................... 202
Figure 72: Overall Workflow for Step 3......................................................................... 210
Figure 73: Example Subsystem Change Likelihood-Change Preference Mapping........ 212
Figure 74: Change Plan Generation by SPEC Support Tool .......................................... 213
Figure 75: Overall Workflow for Step 4......................................................................... 216
Figure 76: Change Impact Assessment by SPEC Support Tool ..................................... 218
Figure 77: Sample Performance-Risk Plot ..................................................................... 220
Figure 78: Change Plan Selection Step in Proposed SPEC Method............................... 220
Figure 79: Change Plan Selection Environment by SPEC Support Tool ....................... 221
Figure 80: Activities in Strategic Planning of Engineering Changes (SPEC) Method... 221
Figure 82: Basic Configuration for EMA Implementation [322] ................................... 239
Figure 83: EMA Functional Diagram [93] ..................................................................... 239

XVI
Figure 84: Integrated Electrical Power and Control of Elevator for AEA [132]............ 240
Figure 85: Technology Enablers for IFE [45]................................................................. 242
Figure 86: Architecture for Context-Aware In-Flight Entertainment System [208] ...... 243
Figure 87: Estimates for Connected Electrical Loads in Future AEA [131] .................. 245
Figure 88: Typical VSCF Starter/Generator System [122]............................................. 247
Figure 89: Estimated AC Bus Loads in Various Wattage Ranges for AEA [131] ......... 248
Figure 90: Conceptual Advanced Aircraft Power System Architecture [124] ............... 248
Figure 91: First Experiment – Influence of Baseline Architecture................................. 250
Figure 92: DSM Change Model for Primary Roll Control of Airbus A320................... 254
Figure 93: DSM Change Model for Primary Roll Control of Lockheed L-1011 ........... 254
Figure 94: DSM Change Model for Primary Roll Control of Boeing B727 .................. 255
Figure 95: SPEC Program Snapshot of Baseline Assessment Input Interface ............... 261
Figure 96: Comparisons of System Evolvability Metrics............................................... 262
Figure 97: SPEC Program Snapshot of Baseline Assessment Results ........................... 263
Figure 98: Baseline Assessment Results for Modified Weighting Scenario .................. 264
Figure 99: Notional Aircraft Subsystem Interrelationships............................................ 267
Figure 101: Weight Savings for All-Electric 500-Pax Transport Aircraft [94].............. 272
Figure 102: Baseline Assessment for Notional Aircraft System Model......................... 273
Figure 103: Change Likelihood Matrix for Notional Aircraft System ........................... 274
Figure 104: Subsystem Change Likelihood Ranking for Notional Aircraft System ...... 275
Figure 105: Estimated System Cost Breakdown for Conventional Aircraft [94]........... 276
Figure 106: Change Preference Matrix for Notional Aircraft System............................ 277
Figure 107: Subsystem Change Preference Ranking for Notional Aircraft System....... 277
Figure 108: Change Likelihood and Preference for Notional Aircraft Subsystems ....... 278
Figure 109: “Constant” Change Role Assignment in SPEC Support Tool .................... 279
Figure 110: Change Plan Generation Environment in SPEC Support Tool ................... 279
Figure 111: Change Effects Propagation from IFE Control Modification ..................... 280

XVII
Figure 112: Summary of Predicted Potential Change Effects Propagation Paths .......... 281
Figure 113: Comparison of Process Risk Scores for Change Alternative Plans ............ 287
Figure 114: Gross Weight Distribution in Probabilistic Change Impact Assessment .... 292
Figure 115: Performance-Risk Plot for Sample Case Study 2........................................ 293
Figure 116: Step 3 and Hypothesis 2 .............................................................................. 295
Figure 117: Effect of Component’s Change Role in Change Effects Propagation......... 295
Figure 118: Step 1 and Hypothesis 3 .............................................................................. 297
Figure 119: All Possible Change Propagation Paths for Air Cycle Machine................. 297
Figure 120: Change Propagation Paths for Air Cycle Machine after Screening ............ 298
Figure 121: Step 4 and Hypotheses 4 and 5.................................................................... 299
Figure 122: Redesign Risks and Number of Affected Components for Change Plans .. 300
Figure 123: Step 5 and Hypothesis 6 .............................................................................. 301
Figure 124: Projected Conflicting Change Propagation Paths for Sample Case Study.. 302
Figure A.1: A320 Roll Control System [338]................................................................. 330
Figure A.2: DSM Change Model for Primary Roll Control of A320 Aircraft ............... 331
Figure A.3: Lockheed L-1011 Aileron Control System Schematic [338] ...................... 331
Figure A.4: DSM Change Model for Primary Roll Control of L-1011 Aircraft ............ 332
Figure A.5: Roll Control Aileron System on Boeing B727 [338] .................................. 333
Figure A.6: DSM Change Model for Primary Roll Control of B727 Aircraft ............... 334
Figure B.1: DSM Model for ATA21 Subsystem of the Notional Aircraft System ........ 335
Figure B.2: DSM Model for ATA22 Subsystem of the Notional Aircraft System ........ 335
Figure B.3: DSM Model for ATA23 Subsystem of the Notional Aircraft System ........ 336
Figure B.4: DSM Model for ATA24 Subsystem of the Notional Aircraft System ........ 336
Figure B.5: DSM Model for ATA25 Subsystem of the Notional Aircraft System ........ 337
Figure B.6: DSM Model for ATA26 Subsystem of the Notional Aircraft System ........ 337
Figure B.7: DSM Model for ATA27 Subsystem of the Notional Aircraft System ........ 338
Figure B.8: DSM Model for ATA26 Subsystem of the Notional Aircraft System ........ 338

XVIII
Figure B.9: DSM Model for ATA29 Subsystem of the Notional Aircraft System ........ 339
Figure B.10: DSM Model for ATA30 Subsystem of the Notional Aircraft System ...... 339
Figure B.11: DSM Model for ATA31 Subsystem of the Notional Aircraft System ...... 340
Figure B.12: DSM Model for ATA32 Subsystem of the Notional Aircraft System ...... 340
Figure B.13: DSM Model for ATA33 Subsystem of the Notional Aircraft System ...... 341
Figure B.14: DSM Model for ATA34 Subsystem of the Notional Aircraft System ...... 341
Figure B.15: DSM Model for ATA35 Subsystem of the Notional Aircraft System ...... 342
Figure B.16: DSM Model for ATA36 Subsystem of the Notional Aircraft System ...... 342
Figure B.17: DSM Model for ATA38 Subsystem of the Notional Aircraft System ...... 343
Figure B.18: DSM Model for ATA49 Subsystem of the Notional Aircraft System ...... 343
Figure B.19: DSM Model for ATA52 Subsystem of the Notional Aircraft System ...... 344
Figure B.20: DSM Model for ATA53 Subsystem of the Notional Aircraft System ...... 344
Figure B.21: DSM Model for ATA54 Subsystem of the Notional Aircraft System ...... 345
Figure B.22: DSM Model for ATA55 Subsystem of the Notional Aircraft System ...... 345
Figure B.23: DSM Model for ATA56 Subsystem of the Notional Aircraft System ...... 346
Figure B.24: DSM Model for ATA57 Subsystem of the Notional Aircraft System ...... 346
Figure B.25: DSM Model for ATA71 Subsystem of the Notional Aircraft System ...... 347
Figure B.26: DSM Model for ATA72 Subsystem of the Notional Aircraft System ...... 347
Figure B.27: DSM Model for ATA73 Subsystem of the Notional Aircraft System ...... 348
Figure B.28: DSM Model for ATA74 Subsystem of the Notional Aircraft System ...... 348
Figure B.29: DSM Model for ATA75 Subsystem of the Notional Aircraft System ...... 349
Figure B.30: DSM Model for ATA76 Subsystem of the Notional Aircraft System ...... 349
Figure B.31: DSM Model for ATA77 Subsystem of the Notional Aircraft System ...... 350
Figure B.32: DSM Model for ATA78 Subsystem of the Notional Aircraft System ...... 350
Figure B.33: DSM Model for ATA79 Subsystem of the Notional Aircraft System ...... 351
Figure B.34: DSM Model for ATA80 Subsystem of the Notional Aircraft System ...... 351
Figure C.1: Residual Histogram for the Random Cases................................................. 356

XIX
LIST OF ABBREVIATIONS
AEA All Electric Aircraft
AC Alternating Current
AM Actuator Module
CAD Computer Aided Design
CE Concurrent Engineering
CFAR Change Favorable Representation
CM-EC Collaborative Management of Engineering Changes
CPA Change Propagation Analysis
CPM Change Prediction Method
CSD Constant Speed Drive
DBPRA “Design for Assembly”-based Product Redesign Approach
DC Direct Current
DFA Design for Assembly
DML Design Maturity Level
DoD Department of Defense
DoE Design of Experiments
DSM Design Structure Matrix
DSTO Defense Science and Technology Organization
EIA Electronic Industries Alliance
ECM Engineering Change Management
ECO Engineering Change Order
ECP Engineering Change Proposal

XX
ECR Engineering Change Request
ECU Electronic Control Unit
EHA Electrohydrostatic Actuation
EMA Electromechanical Actuation
ERP Enterprise Resource Planning
FBW Fly by Wire
FLIR Forward Looking Infrared Radar
FMEA Failure Mode Effect Analysis
IEC International Electrotechnical Commission
IFE In-Flight Entertainment
IML Interface Maturity Level
INCOSE International Council on Systems Engineering
IPC Intelligent Power Controller
IPPD Integrated Product/Process Development
ISO International Organization for Standardization
MAAP Methodology for Assessing the Adaptability of Products
MEA More Electric Aircraft
MIDAS Memory for Initial Design of Aircraft Subsystems
MRL Manufacturing Readiness Level
NASA National Aeronautics and Space Administration
PBW Power by Wire
PCU Power Conversion Unit
PDM Product Data Management
PEP Productivity Enhancement Program
PFCC Primary Flight Control Computer

XXI
PLM Product Lifecycle Management
RSM Response Surface Method
RSE Response Surface Equation
SAF System Adaptability Factor
SBF Structure-Behavior-Function
SOP Subtract-and-Operate
SPEC Strategic Planning of Engineering Changes
SRL System Readiness Level
SWOT Strength, Weakness, Opportunity and Threat
TIES Technology Identification, Evaluation and Selection
TML Technology Maturity Level
TRL Technology Readiness Level
VA Value Analysis
VSCF Variable Speed Constant Frequency

XXII
SUMMARY
Due to a progressive market shift to a customer-driven environment, the influence of
engineering changes on the product’s market success is becoming more prominent. This
situation affects many long lead-time product industries including aircraft manufacturing.
Derivative development has been the key strategy for many aircraft manufacturers to
survive the competitive market and this trend is expected to continue in the future. Within
this environment of design adaptation and variation, the main market advantages are
often gained by the fastest aircraft manufacturers to develop and produce their range of
market offerings without any costly mistakes. This realization creates an emphasis on the
efficiency of the redesign process, particularly on the handling of engineering changes.
However, most activities involved in the redesign process are supported either
inefficiently or not at all by the current design methods and tools, primarily because they
have been mostly developed to improve original product development. In view of this,
the main goal of this research is to propose an aircraft redesign methodology that will act
as a decision-making aid for aircraft designers in the change implementation planning of
derivative developments.
The proposed method, known as Strategic Planning of Engineering Changes (SPEC),
combines the key elements of the product redesign planning and change management
processes. Its application is aimed at reducing the redesign risks of derivative aircraft
development, improving the detection of possible change effects propagation, increasing
the efficiency of the change implementation planning and also reducing the costs and the

XXIII
time delays due to the redesign process. To address these challenges, four research areas
have been identified: baseline assessment, change propagation prediction, change impact
analysis and change implementation planning. Based on the established requirements for
the redesign planning process, several methods and tools that are identified within these
research areas have been abstracted and adapted into the proposed SPEC method to meet
the research goals.
The proposed SPEC method is shown to be promising in improving the overall efficiency
of the derivative aircraft planning process through two notional aircraft system redesign
case studies that are presented in this study.

1
CHAPTER I
RESEARCH MOTIVATION
“Design is an evolutionary process and change is inevitable.”
- Phillips, C. (1987)
1.1 The Changing Marketplace
Manufacturers used to have absolute control over their product development, its price and
its market direction [84]. Their operation during those early days of market economy was
mainly based on mass production that focused on developing standardized mass products
[323]. Similarly, commercial aircraft development was driven by technical and functional
superiority at the expense of cost and time-to-market, which was inherited from military
aircraft manufacturing [212]. This is synonym with the mantra “Higher, Faster, Farther”
in aerospace products and systems development for many years [239]. Over the past few
decades, this seller-dominated environment progressively evolves into a customer-driven
market. This transition alters the competitive landscape between product manufacturers
as they are forced to be more pro-active in responding to dynamic market demands [176].
In commercial aircraft industry today, several factors apart from performance capabilities
are considered by airlines during their aircraft purchases. Among others, these include air
traffic demands, fleet commonalities and price [88]. Accordingly, aircraft manufacturers
need to reevaluate their past performance-based development and capture these elements
into their offerings. Many aerospace companies today are striving to develop cheaper but
higher performance products that are better tailored to their customer needs [77].

2
1.1.1 Dynamic Market Factors
Primary market factors: customers, competitors and technologies; and their effects on the
dynamics of general product marketplace today are illustrated in Figure 1.
Late to Market
Lack of Product Distinctiveness
Distribution Channels are not Developed
Mismatch between Customer Value and Selling Price
Mismatch between Technology
Development and Customer Needs
Processes are not Stable
CUSTOMER
TECHNOLOGICAL EVOLUTION
COMPETITOR
Late to Market
Lack of Product Distinctiveness
Distribution Channels are not Developed
Mismatch between Customer Value and Selling Price
Mismatch between Technology
Development and Customer Needs
Processes are not Stable
CUSTOMER
TECHNOLOGICAL EVOLUTION
COMPETITOR
Figure 1: Dynamic Factors in Product Market [137]
Customers today are able to demand more innovative and customized products at a lower
price since they are usually provided with multiple choices [137]. Subsequently, product
demands become more diversified [226] and the market is increasingly fragmented by the
rising trend of individualized mass products [175]. Product manufacturers have to revise
their business strategy in response to increased market competition, which is intensified
by rapid shortening of product lifecycle and emergence of new competitors due to market
globalization [315]. This situation accelerates new technologies development that causes
many existing components or subsystems to have a shorter technology half-life than their
planned operational life [264]. The pursuit of new technologies could be necessary when
matching technological innovation offered by other competitors or satisfying new market
preferences or requirements beyond current product capabilities [117, 222]. Nonetheless,
this can also set off a rapidly changing technology base for product development process
[169] and challenges manufacturers to capture the novelties and uncertainties of fresh,

3
immature technologies into their products within a shorter timeframe. It is imperative for
them to evaluate potential risks and benefits of new technologies in their product prior to
making any commitment [222].
A typical aircraft development can take up to about five years, depending on whether it is
an original or a derivative design [266]. This long lead time allows high possibilities for
changing market requirements and strategies while the aircraft is still under development.
Air transportation demands, for example, is exceptionally sensitive to any irregularities in
economic condition, demographic trend and fuel price fluctuation that are uncontrollable
by aircraft manufacturers [26]. Furthermore, market globalization has raised the level of
competition in this industry, mainly the rivalry between Airbus and Boeing companies in
large commercial transport aircraft market segment [21, 174]. In July 2008, Bombardier
became the latest competitor to enter that market with their C-series aircraft line [149]. If
based on past trend, the increased competition will force these manufacturers to introduce
fresh offerings at adequate market pace and become more flexible in their development.
Moreover, aircraft operation in the air transportation system-of-systems is governed by a
stringent aviation regulation that has been made stricter over the years, especially those
regarding environmental issues. For instance, major actors in European aviation markets
have set new requirements for aircraft by year 2020 to have 50% less CO2 emission, 80%
less NOX emission and 50% less perceptible noise in comparison to current standard [16].
Although the rules are not frequently revised, it is a major advantage for manufacturers if
their aircraft can perform well due to their operational longevity that is typically about 30
years [266]. On the whole, regulation changes and economics of air transportation market
can be taken as the main drivers in the pursuit of new aircraft technologies.
Current dynamic market settings introduce new challenges to existing product design and
development methods [40, 320] including those applied in aircraft manufacturing. Coping
4
with these challenges in the best competitive manner is the main focus for current aircraft
manufacturers, which drives the evolution of methods in their design and manufacturing
processes [63].
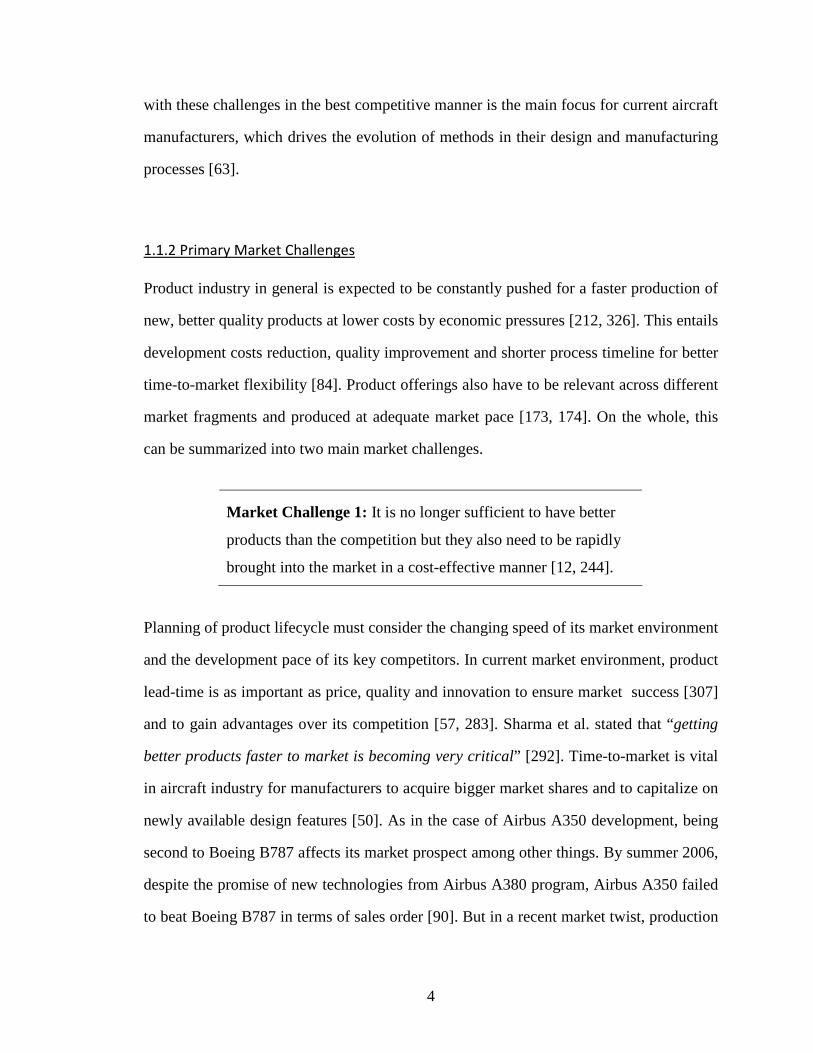
1.1.2 Primary Market Challenges
Product industry in general is expected to be constantly pushed for a faster production of
new, better quality products at lower costs by economic pressures [212, 326]. This entails
development costs reduction, quality improvement and shorter process timeline for better
time-to-market flexibility [84]. Product offerings also have to be relevant across different
market fragments and produced at adequate market pace [173, 174]. On the whole, this
can be summarized into two main market challenges.
Market Challenge 1: It is no longer sufficient to have better
products than the competition but they also need to be rapidly
brought into the market in a cost-effective manner [12, 244].
Planning of product lifecycle must consider the changing speed of its market environment
and the development pace of its key competitors. In current market environment, product
lead-time is as important as price, quality and innovation to ensure market success [307]
and to gain advantages over its competition [57, 283]. Sharma et al. stated that “getting
better products faster to market is becoming very critical ” [292]. Time-to-market is vital
in aircraft industry for manufacturers to acquire bigger market shares and to capitalize on
newly available design features [50]. As in the case of Airbus A350 development, being
second to Boeing B787 affects its market prospect among other things. By summer 2006,
despite the promise of new technologies from Airbus A380 program, Airbus A350 failed
to beat Boeing B787 in terms of sales order [90]. But in a recent market twist, production

5
problems for Boeing B787 aircraft have delayed its market introduction and reduces lead-
time advantages it has over Airbus A350, whose orders have since began to pile in [28,
223]. This example demonstrates the advantages of being first-in-the-market but also how
fast market fortune could change if the development process is rushed and not properly
managed.
Market Challenge 2: With a wide variation of market
demands, a single design can no longer be expected to cover a
broad range of the increasingly fragmented markets [84].
With this realization, traditional mass tailoring of product designs to a generalized set of
customer needs is becoming a fading scenario [320]. Instead, product manufacturers need
to be more innovative and flexible in producing varieties of their market offerings within
a shorter timeframe [290]. In commercial aircraft manufacturing industry, this condition
relates to derivative planning. Due to risky and costly investments to develop an original
aircraft, it is arguably a big misstep for manufacturers not to capitalize on their successful
designs whenever possible to extend their payoffs. Amid the pressures to introduce fresh
designs for new market niches, competition between aircraft manufacturers heavily relies
on derivative strategy. As new emerging market segments are forecasted, manufacturers
will freshen up their aircraft offerings accordingly. In their latest aircraft development,
Airbus and Boeing companies commit their efforts on totally different market directions.
Airbus, with their jumbo A380 aircraft, foresees that the emerging market segments with
greatest potential are those associated with ‘hub and spoke’ operations. In the meantime,
Boeing puts their money on more direct flights between smaller airports with their B787
aircraft [27]. Since both original aircraft developments have been costly and risky, a good
derivative plan is crucial to maximize market coverage of their future varieties and to pay
off invested resources and efforts.

6
Faced with the abovementioned market challenges, it becomes rather necessary for many
manufacturers to shift their paradigm from mass production to mass customization.
1.1.3 The Shift to Mass Customization and Product Redesign
Traditional mass production has been focused on manufacturing standardized products in
large quantities at low unit cost [67]. However, as demands become more diversified, it is
hard to have good market coverage with only a single product design [341]. In contrast,
mass customization strategy aims to satisfy diverse customer needs by increasing product
varieties while maintaining high efficiency of mass production [323, 342]. It principally
transforms product development process into production of customer variants that rapidly
adapts to varying market demands [117, 256]. Comparison between principles of mass
production and mass customization is shown in Table 1 [341].
Table 1: Key Differences between Mass Production and Mass Customization
Mass Production Mass Customization
Focus Efficient through stability and control Variety and customization through flexibility and quick responsiveness
Goal
Developing, producing, marketing and delivering goods and services at prices low enough that nearly everyone can
afford them
Developing, producing, marketing and delivering affordable goods and services with enough variety and
customization so that nearly everyone finds exactly what they want
Stable demand Fragmented demand Large, homogenous markets Heterogeneous niches Low cost, consistent quality,
standardized goods and services Low cost, high quality, customized
goods and services Long product development cycles Short product development cycles
Key Features
Long product life cycles Short product life cycles
Paradigm shift to mass customization calls for changes in product development approach.
Inness proposed that mass customization be achieved by designing original products with
several variants, handling required product changes more efficiently and having flexible
manufacturing capabilities [172]. In general manufacturing industry, all products can be

7
grouped as either original or redesigned. An original product is defined as a novel design
solution that is generated from scratch while a redesigned product involves adaptation of
already known solutions [35]. Although most redesigned products are normally perceived
as novel by customers, they do not involve extensive redevelopment of their predecessor
[175]. This makes them more economically attractive to be developed than revolutionary
designs under dynamic market environment such as today’s [107]. Redesign approaches
satisfy diverse market demands by upgrading or downgrading, enlarging or reducing and
rearranging or modernizing parts of existing product designs [340]. By reusing already
proven design elements and solution principles, it enables a faster development process
and helps to leverage costs and risks for customized product varieties [238, 280]. Since
many markets are rather ambivalent to accept new radical design [142], the resemblance
of derivative products to past successful designs aids their marketability [120]. Based on
these advantages, it can be concluded that product redesign strategies help to make mass
customization, hence coping with dynamic marketplace, more economically feasible for
product manufacturers [146].
The benefits of redesign strategies are often more pronounced in long lead-time, complex
product industries [263]. Since original developments in these industries is commonly of
high cost and risk, manufacturers frequently rely on incremental product improvements to
satisfy new requirements [142]. This is apparent in commercial aircraft industry where
design evolution of transport aircraft systems has always been made through revisions of
their successful predecessors [118]. This development trend is expected to continue in the
future unless there are new technological achievements for aircraft design process and/or
some dramatic changes in governing aviation regulation [86]. Because redesign strategy
is common in aircraft manufacturing, the utmost advantage is often gained by the fastest
manufacturers to develop their range of aircraft options without any costly mistakes. This
relates to current “Better, Faster, Cheaper” goal in aerospace industry [239], which puts a

8
high emphasis on the efficiency of redesign planning. As depicted in Figure 2, Airbus has
maximized its market shares by strategically producing their aircraft derivatives. Further
discussion on current aircraft redesign strategies is presented in next chapter.
Figure 2: Families of Aircraft from Airbus [266]
Thus far, paradigm shift to mass customization in product manufacturing has been shown
to focus on making design modifications [67]. In conjunction with this, product redesign
has become an inevitable task in response to new market requirements [163]. At present,
product development process is perceived as an art of making a series of changes on an
existing product until it satisfies its driving requirements [82, 120]. Design changes have
become more prominent throughout a product’s entire lifecycle: from its conception until
end of its operational life [82, 242, 273]. It is impossible to avoid having reiterations in
product development process today [92, 242] and a key issue within this environment of
design adaptation and variation is the handling of required design changes [175]. Due to
high competitiveness of aircraft manufacturing business, the ability to efficiently handle
change requests from their customer airlines is a big advantage for manufacturers against
their competitors [268]. Aircraft purchase orders often include some customized requests
[115] that need to be implemented without inflating their costs too much. For this reason,
most challenges in aircraft redesign are linked to its change management process [268].

9
Despite its high relevance in current industrial practices, focus of design researchers has
been concentrated on improving original product developments than redesign process of
existing products [175, 345]. According to Sferro et al., very few methods are developed
for use in product redesign process [291] and most of its activities have been supported
either inefficiently or not at all by available change management methods and tools [270].
It can be hypothesized that this lack of research interest is because product redesign is
generally perceived as an interruption to production [134]. A conducted survey in several
product companies showed that more than 60% of them believed that product changes
should be avoided at any cost [166]. This very strong notion of design changes solely as a
problem leads to the neglect of any efforts to improve their strategy and process, which
unfortunately also ignores the competitive benefits that could be gained from their proper
planning and management [316]. Wright provided an overview of change management
field in [344] and concluded that topics regarding product changes were largely ignored
in the academic world notwithstanding their recognized importance in the manufacturing
industry.
Taking into account the above arguments, the focus of this dissertation is to develop, test
and evaluate a methodology for strategic redesign process. It is intended to be a decision-
making support for designers who are attempting to modify an existing product design.
Instead of treating redesign efforts in similar fashion as normal design iterations, which is
what most companies are doing, it is believed that several competitive advantages could
be gained if manufacturers effectively plan and manage design changes prior to executing
their product redesign process. In that respect, the proposed redesign method is infused
with key elements of product change planning and management. The proposed method is
focused on aircraft redesign process but it can be extended to general product redesigns.
The following section describes the scope of this thesis work in accomplishing this main
research goal.

10
1.2 Research Scope Definition
The role of product redesign approach in current market strategies is well-acknowledged
[160] and this has been reflected by its high rate of process adoption [108]. Most products
in market today are essentially a modified version of their predecessor [96, 117]. A study
by Booz-Allen and Hamilton Inc. revealed that 44% of perceptively new products were
improved from older ones [70] and in such cases, many solution principles, properties,
functionalities, components and parts are being reused [142]. Design of American cars is
an exemplary case to highlight this situation since 80% of their parts were reported to be
always derived from previous designs [184, 242].
As argued, the shift to mass customization has raised the adoption of redesign practices
and as a result, design changes become more prominent in product development process
today. The general scope of this research encompasses cross elements of product redesign
and change management processes, which explores underlying interrelationships between
these two areas of design researches.
1.2.1 Engineering Changes in Product Redesign Process
Like original development, product redesign process includes tasks such as requirement
identification, benchmarking, specification planning, product concept generation, product
embodiment, prototyping and testing, and design for manufacturing [248]. Nonetheless,
product redesign does not start from scratch [171]. Instead, it often begins with a reverse
engineering step to identify baseline components structure and their interconnections [73]
but this procedure is often skipped when proper baseline design documentation is already
available [302]. The baseline design information is essential in providing a solid decision
basis for its evolution path, whether its redesign is best pursued from its configuration,
subsystem, component or parametric level [249].

11
An example product redesign framework is illustrated in Figure 3, which highlights three
primary redesign approaches. Parametric redesign is achieved by optimizing parametric
product model without changing its design composition. It is essentially an optimization
problem rather than a design problem, which is executed only after all required adaptive
or original redesign plans are established [249]. On the other hand, adaptive redesign will
modify product components or subassemblies but its original design concept is preserved.
In this case, new components might be added and existing ones might be eliminated or
combined. Last but not least, original redesign introduces a new product concept that is
constructed from known design principles and knowledge of past product variations. It is
pursued when new requirements are in serious conflicts with current product capabilities.
Investigation, Prediction and Hypothesis Product Functions and Forms
Design Models Design Analysis
Step 1: Reverse Engineering
Step 2: Modeling and Analysis
Parametric Redesign Adaptive Redesign Original Redesign
Step 3: Redesign
Figure 3: General Redesign Process Framework [248]
Application of redesign procedure within the overall product development framework is
shown in Figure 4. While most design researchers tend to assume that product design and
development process ends when its detailed specification has been passed to production
and marketing teams [174], the real process is often far from being ideal. As illustrated in
Figure 4, potential needs for design changes throughout product lifecycle indicate that it
might need to be redesigned further. Motivations behind these latter changes are usually
related to dynamic market factors such as changing customer needs or competitive moves

12
made by other competitors. It is good to note that redesign process can also be initiated
during original product development and is not limited to derivative development.
Figure 4: Engineering Change Process within Product Development [174]
It is apparent that redesign process involves making product changes. These changes are
formally known as “engineering changes”, which by definition is any alteration made on
a product or its component that can affect its form, fits, materials, dimensions, functions
or documentation [166]. These include any revision of components, drawings or software
that have been released throughout its entire lifecycle [321]. Engineering change is not to
be confused with design iteration, which is defined as a change on product items that are
not yet validated or formally released [265]. Based on this, engineering change effects are
more pronounced since it occurs after some aspects of product design have already been
specified and some parts of development resources have been allocated. The US Military
Standard (MIL-STD-480B) classifies engineering change into Class I and Class II [10].
Class I refers to design modifications that can affect product physical configuration and
functionalities such as its weight, performance specification, interfacing, reliability and
safety [98]. Meanwhile, design changes in Class II category are associated with product
configuration management that mainly involves documentation updates like amendments
of design drawings and system description [98].
Since potential engineering changes are necessitated in various stages of product lifecycle
and accordingly produce different effects [166], they can also be grouped based on their

13
sources as either initiated or emergent. Initiated changes are caused by external sources to
a product that are driven by its market dynamics [175]. These include modifications made
to better meet its operational requirements and/or to improve its market competitiveness.
In contrast, emergent changes are due to a product’s state and they are required to remove
or correct design weaknesses and/or to resolve design operational flaws [175]. Examples
of initiated and emergent changes are depicted in Figure 5, which is based on helicopter
development process in Westland Helicopters Company.
Figure 5: Initiated and Emergent Changes [115]
Change effects and their process efforts generally vary with time of handling [209, 321],
type [273] and magnitude [193, 321]. In the best scenario, they only cause documentation
amendments but in the worst case, they can stall entire production and force a recall on
already delivered products [256]. Overall, change process contributes towards increased
development costs and prolonged schedule delays [137, 176]. Documented studies based
on several product companies show that change implementation process can consume up
to half of their total engineering work capacity [301, 321] and is responsible for 20% to
50% of their overall tool costs [321]. In some extreme cases, as much as 70% to 80% of

14
final product cost is contributed to engineering changes [71, 231]. A conducted survey in
several American and European companies from defense, aerospace, consumer products,
construction, electronics and a few other industries revealed that their difficulties to lower
production costs were associated to their product change handlings that reportedly range
between 2 to 1000 per month [54]. Since market success today highly depends on time-
to-market, price and quality [242], it is important to have a good redesign strategy.
The vitality of a proper change management process to be competitive in current market
environment is admitted by many manufacturers [321]. Majority of successful industrial
organizations operates with a formal change process [190] and a survey on several UK
product companies showed that 95% of them apply formal engineering change procedure
in their operation [166]. As design changes rapidly become a prominent means for market
survival, proper methods and tools to control their undesirable effects while upholding
their offered advantages are required [160]. To do so, it is imperative to first understand
change process characteristics.
1.2.2 Characteristics of Engineering Change Process
Engineering change management is a process of planning and managing product changes
[174]. Its main objective is to outline all activities involved in monitoring and controlling
of engineering changes [71, 190], which aids designers to plan for required changes and
manage their implementation [25]. Fundamental properties of this process are change-
independent and remains similar in spite of change causes and types [115]. An example
of high-level procedure that is outlined by ISO10007 standard for managing engineering
changes during product development is shown in Figure 6. Other change processes also
generally follow a similar workflow but terminologies and strategies for each step might
vary in different companies [176]. Most product companies tailor their own set of change

15
tasks and management requirements to their organizational needs and work environment.
Discussion of typical change activities is available by Huang and Mak in [165].
Identification of the need for a
change
Evaluation of possible
change impacts
Approval of the proposed change
Implementation of the approved
change
Review of the implemented
change
Identification of the need for a
change
Evaluation of possible
change impacts
Approval of the proposed change
Implementation of the approved
change
Review of the implemented
change Figure 6: Change Management Workflow by ISO10007 [176]
In short, the process is started when an engineering change request (ECR) is initiated in
response to new product requirement or change in company market strategy. Preliminary
assessments on potential costs and benefits of the proposed modification are done prior to
it being formally logged. Once it is officially documented, the change request is known as
engineering change proposal (ECP). Each proposal will go through impact analysis and
feasibility studies that determine its approval or rejection. If approved, an engineering
change order (ECO) containing complete redesign plans and allocated resources for the
product modification will be released and issued to affected personnel. A final review is
done once the process is completed to document its details for future change support.
On the whole, it is evident that the outlined change process is very broad and serves only
as a guideline for product manufacturers [273]. In reality, the “cause-change-effect” steps
in change management are not entirely serial [137]. As evident in many product redesign
cases, modification effects can propagate and create a network of interconnected changes
[38]. Based on recent researches, Earl et al. summarized general characteristics of change
process as follow [109]:
• Change takes place against a rich background of knowledge and experience
embodied in a current product design, which is the starting point for change

16
• Change process is a fast moving, dynamic process, often highly creative in
finding solutions
• Change processes work on descriptions of different design aspects such as
function and geometry, available processes and resources, and requirements of
the company, its suppliers and its customers
First of all, change process entails a well-defined baseline to be modified. It is impossible
to describe an engineering change without its reference product design due to its relative
nature. Secondly, change planning solution is usually not unique. There are often several
ways to change an existing product depending on its redesign objectives and conditions.
Lastly, product changes do not just affect its design but also its development process and
associated business entities. One of the main process difficulties in redesigning a product
is to capture its undesirable side effects [247], which affect other product characteristics
apart from the targeted properties [314]. The effects can cross different boundaries within
company’s operation [127] as shown in Figure 7.
Figure 7: Typical Flow of Change Impacts [120]
In brief explanation, change effects are passed from initiating components to other parts
through their physical or functional interfaces. To accommodate these changes, new or

17
recurring development tasks have to be outlined. Since their execution typically involves
information exchanges with existing tasks, this disrupts overall development process due
to potential data revisions. Moreover, since those tasks are usually designated to different
development teams or personnel, the change effects can be further felt throughout whole
organization. In collaborative product development, this includes all associated business
partners and suppliers.
Product architecture complexity has a big role in this “change propagation” phenomenon,
where implementation of one engineering change drives several other changes [321]. Its
possibility is dictated by level of connectivity between various product parts and a greater
chance exists if they are highly interconnected [115]. Complex products such as aircraft
are more susceptible to this phenomenon because connections between their constituent
parts or subsystems cannot be totally avoided [295]. These intricate interlinks complicate
the prediction of product behaviors during change process by introducing complex effects
propagation paths that highly interact with each other [115]. This affects the budgets and
scheduling constraints of product development process, mostly in an unexpected manner
[267]. As depicted in Figure 8, change effects could be directly and indirectly transmitted
through product architecture [265].
PART A
PART B PART C
PART D
• Both Part B and Part C receive direct propagation of the change in Part A
• Part D receives indirect propagation of the change in Part A but a direct propagation from Part C
PART A
PART B PART C
PART D
• Both Part B and Part C receive direct propagation of the change in Part A
• Part D receives indirect propagation of the change in Part A but a direct propagation from Part C
Figure 8: Propagation of Engineering Change Effects
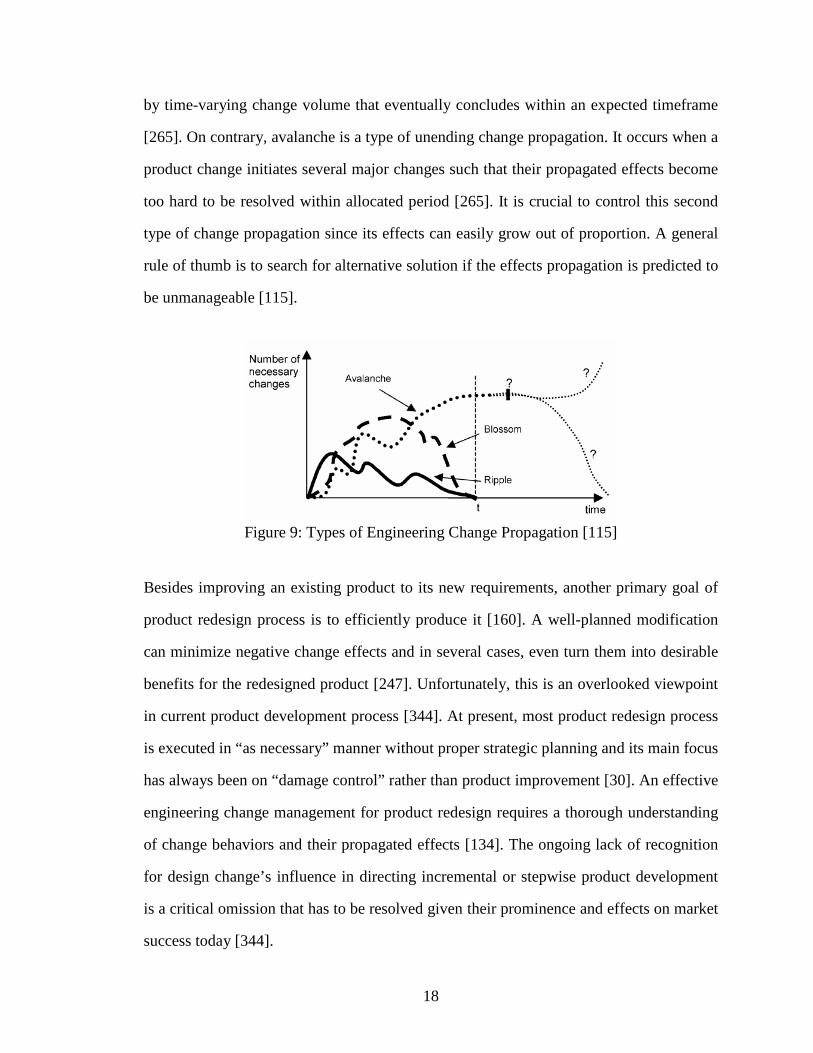
Two types of change propagation: ending and unending [114] are illustrated in Figure 9.
Blossoms and ripples are variants of ending change propagation, which are characterized
18
by time-varying change volume that eventually concludes within an expected timeframe
[265]. On contrary, avalanche is a type of unending change propagation. It occurs when a
product change initiates several major changes such that their propagated effects become
too hard to be resolved within allocated period [265]. It is crucial to control this second
type of change propagation since its effects can easily grow out of proportion. A general
rule of thumb is to search for alternative solution if the effects propagation is predicted to
be unmanageable [115].
Figure 9: Types of Engineering Change Propagation [115]
Besides improving an existing product to its new requirements, another primary goal of
product redesign process is to efficiently produce it [160]. A well-planned modification
can minimize negative change effects and in several cases, even turn them into desirable
benefits for the redesigned product [247]. Unfortunately, this is an overlooked viewpoint
in current product development process [344]. At present, most product redesign process
is executed in “as necessary” manner without proper strategic planning and its main focus
has always been on “damage control” rather than product improvement [30]. An effective
engineering change management for product redesign requires a thorough understanding
of change behaviors and their propagated effects [134]. The ongoing lack of recognition
for design change’s influence in directing incremental or stepwise product development
is a critical omission that has to be resolved given their prominence and effects on market
success today [344].

19
1.2.3 Potential Benefits of Strategic Redesign
A general rule of thumb in product development known as “Rule of Ten” estimates that
late design changes cost as much as 10 times higher than those made during early stages
[65]. If engineering changes are executed later in product lifecycle such as during its full-
scale production, design specifications have been detailed out and development costs and
resources have been mostly committed [166]. Cost of change implementation also rises
steadily as time approaches closer to pre-determined deadlines since the process becomes
more time-critical and the product design becomes more integrated [115]. The projected
trend for change handling cost is depicted in Figure 10, which exponentially increases as
time progresses in product lifecycle. Moreover, change impacts are spread across other
business processes when they occur after production has started [176]. Requirements for
change notification and documentation updates are increased when marketing division,
manufacturing teams, subcontractors, external suppliers and other work partners are also
involved [174]. This affects the smoothness of the development process and lengthens its
timeframe.
Do
llars
High
Low
Cost ofChange
Time
Do
llars
High
Low
Cost ofChange
Time
Figure 10: Cost versus Time for Engineering Change Handling [14]
From above arguments, late engineering changes have the most negative effects because
they tend to cause higher additional costs and longer time delays [147, 210]. A simple but
late washer replacement on a F-15 fighter, for instance, cost an astounding $56,000 [215].
That said, a considerable amount of development efforts and resources could have been

20
saved if proper change assessment and planning strategy is made before making decisions
on product modification [247]. Most opportunities for engineering changes are presented
during early product development stages since effective redesign strategy helps to limit
downstream change impacts and improve company’s ability to deal with change requests
from its customers [265].
Potential advantages of a strategic product redesign planning have been demonstrated by
a few academically-developed methods. Cambridge Engineering Design Centre develops
Change Prediction Method (CPM), which shows that better redesign risks assessment can
be achieved by having more accurate prediction of change propagation paths [80]. With
early knowledge of full effects from a proposed design modification, unexpected changes
during product development are significantly reduced and better resources management
can be accomplished. Another example method is RedesignIT by Ollinger and Stahovich,
which highlights how a proper planning of product redesign can assist the management of
change effects to achieve its performance targets [246]. In general, these change methods
underscore the relationships between change management process and product redesign
development, and their potential to provide manufacturers with notable advantages when
applied in good synergy together. These two methods are further discussed in Chapter 3.
The need for a proper change assessment during early product redesign stages is aligned
with ongoing design paradigm shift as illustrated in Figure 11. In short, the “knowledge-
cost-freedom” curve highlights the preference to have more available product knowledge
during early design phases, to maintain adequate design freedom throughout the process
and to reduce overall committed costs, which are all functions of time [61]. This shift is
driven by “design for affordability” and stresses on bringing product knowledge forward
for better early design decisions [227].

21
Figure 11: Paradigm Shift in Design Process [61]
In redesign process, the lack of early product knowledge is not an issue [62] but the main
question is how available information can be appropriately exploited to make better early
redesign decisions. Current natural tendency of many designers is to modify their product
based on its targeted performances with “as necessary” manner and this outlook is largely
shaped by available design methods that are developed for original product development.
But unlike original development, product redesign is constricted by baseline flexibility,
tighter budget and shorter development timeframe. If product redesign process costs and
requires time as much as an original product development to satisfy similar requirements,
manufacturer will be hard-pressed to justify that investment against usually higher market
interest for originals. There is a need to support product redesign process in reaching for a
well-planned solution that satisfies its driving requirements while making the most out of
its allocated resources [314]. Product change proposals must be strategically planned and
executed.
Without a good strategy during early redesign phases, change process can easily become
mismanaged and trigger late changes due to overlooked problems with the product design
or its manufacturing process. Some competitive drawbacks in automotive and aeronautics

22
industries caused by a mismanaged change process are discussed in [267], which involve
significant cost increments and prolonged development schedule [137, 176]. Almost half
of product development projects in the early 1990’s were reported to overrun their budget
and scheduling time [56]. Such situation is often blamed on unexpected product changes
that result from ineffective change management process [109]. However, several product
companies are observed to still proficiently gain engineering change benefits despite their
schedule conflicts and extra costs. Their operational element that contributes towards this
advantage is their capability to have rapid and adept responses in managing their product
changes [182, 273, 294]. A well-organized change management can help offset negative
change effects with an efficient production of better and improved products [103]. In fact,
agility of product manufacturing companies today is often measured by their competence
in managing their engineering changes [168, 197].
To summarize, mismanaged engineering changes (hence a mismanaged product redesign
process) often leads towards increased costs and prolonged schedule delays. These effects
are more pronounced for late product changes, which explain the tendencies of current
change strategies to minimize or eliminate them. However, since many required changes
are driven by market challenges, avoiding them can also bring potential disadvantages to
manufacturers. Though many manufacturers would like to avoid making changes to their
products, they have to accept that some product changes are inevitable [115]. As market
demands and requirements continue to evolve, product designs have to be improved at a
potentially substantial cost and process disruption to remain competitively relevant in the
new environment [125]. The next best situation is to have a good redesign strategy that
minimizes negative change effects while providing its advantages to manufacturers.
23
Key Note: A well-managed product redesign process, hence a good
change management strategy during the early development stages, can
help reduce the negative effects of engineering changes and bring
competitive advantages to the product manufacturers.
1.2.4 Current Gaps in Change Management for Product Redesign
In principle, engineering change handling in product redesign process is similar to that in
original product development but its conditions are more constraining [270]. As change
effects increase with time, product redesign efforts come with a higher impact since they
occur at some point into its lifecycle. In addition, redesign process is commonly executed
under tighter budget and time constraints, which create a higher requisite for an efficient
change management procedure [120].
Current gaps in engineering change management for general product manufacturing can
be contributed to attitudes of project managers and product designers towards change [30,
174]. They are more inclined to treat their product design change as a problem than as an
opportunity for its evolution and tend to suppress them even when there is a great market
value due to difficulties in capturing their full effects [264]. A conducted survey in 100
UK manufacturing companies revealed half of them considered engineering changes to
be a primary problem in their product development [30] and accordingly, arising need for
changes is seen as a sign of production failure instead of a process management issue that
should be resolved [321]. Application of available change methods and tools are limited
to eradicate product changes or to minimize future change impacts by incorporating high
design flexibility into original products. None of these change handling approaches is an
active method that can be applied when a required product change has been identified and
needs to be implemented. Hence it can be concluded that the general competitive paucity

24
of available change methods or tools is their incapability to effectively support and guide
product redesign process [254].
Recall back the change process characteristics as previously mentioned [109]:
Characteristic 1: It requires a well-defined baseline to work on
Characteristic 2: Change implementation solution is not always unique
Characteristic 3: Implementation of engineering changes can affect more
than just initiating change components or aspects
The main essence of an engineering change process is its baseline design. Working with
existing or finished product designs, even at conceptual level, usually comes with less
flexibility in terms of change implementation [115]. This relates to some constraints that
are imposed by baseline product architecture and underlines the challenges in selecting a
suitable design for adaptation or customization [117]. The importance of choosing a right
baseline product in terms of its capability to be changed or adapted for the change tasks at
hand has been emphasized by Pimmler and Eppinger [257], which generally requires an
evolvable design to be effective [74]. A study has projected up to 80% of total design and
manufacturing costs in a product development project could be dictated by such choice
[343].
In current redesign projects, most baseline products are chosen based on their proximity
to target requirements or because they are the natural choice for incremental progression
in their product family [105]. This practice assumes that imminence of baseline capability
to target requirements ensures minimum possible amount of required changes but this is
not always true. Even closely similar components can have different level of complexity
and cost for their manufacturing [110]. Therefore, baseline suitability should be reflected
by its redesign cost-effectiveness and its required amount of reworks [178]. Furthermore,
25
a smaller amount of required product changes does not automatically mean the redesign
plan is easier or cheaper since that also depends on their type and magnitude. This insight
leads to the first identified area of potential improvement.
Potential Improvement 1: A good baseline for product redesign process
needs to have high-quality change characteristics with respect to proposed
modification.
Secondly, there are often several different ways on how required engineering changes can
be implemented into a product. Even for a similar set of requirements, several alternative
redesign plans can be derived [309]. Because different parts can have very different level
of change complexity and cost, the way a product is redesigned corresponds to a different
level of change effects and development risks [25, 109]. Tu et al. said that the success of
product mass customization depends on controlling its costs through proper development
planning and process selection [324]. This draws attention to overlooked opportunities in
change management field, which lacks strategies to decide how required changes are best
realized into existing product architecture.
Fricke et al. discussed several current change strategies in [137] and the most common
among them are change prevention and change front-loading [270, 286]. The prevention
of product changes aims at avoiding design mistakes during early design conception. It is
focused on correct translation of product requirements and reduction of needless product
specifications that designers are forced to make without adequate information [137, 314].
Among research efforts that have been done in this area include knowledge-aided design
for requirements management [203] and requirements management based on traceability
and attributes [325]. System engineering standards like EIA 632 and ISO/IEC 15288 also
aid the translation of customer needs into their associated product technical requirements
26
[148]. Alternatively, change front-loading involves early detection of possible sources for
design changes to reduce their effects and costs [174]. By doing so, product changes can
be handled during its early development stages and are prevented from becoming costly
late changes. In this approach, risk management strategies are applied to control change
risks [137], which are estimated using design simulation tools such as CATIA or methods
that facilitate early validation and verification of design concepts like failure mode effect
analysis (FMEA) or value analysis (VA) [137, 166].
Despite the abovementioned efforts, engineering changes still present in typical product
development process [166, 270]. A reason for this situation is the inevitability of initiated
changes. Eliminating or reducing design errors has no effects on market dynamics and it
is quite impossible to control initiated changes due to irrepressible market factors. In fact,
it is unwise to totally ignore them as they often reflect competitive product characteristics
that are preferred by the market. It is good to note that not all change effects are negative.
Design change allows designers to correct performance deficiencies of their product and
improve its features against its competition [321]. When product requirements go beyond
the capability of adopted solution principles, engineering change becomes the means to
infuse novel ideas. Moreover, design change can be applied to gain market advantages in
terms of scheduling; either to speed up product development process to gain first-in-the-
market advantages or to compensate the current state of project resources [137]. In a fast
moving business environment such as today, avoiding changes can be a serious obstacle
to the evolution of product functions and technologies [138]. Based on these arguments,
manufacturers should not be reluctant to redesign their products when the driving change
requirements are important for their market competitiveness and associated development
risks are manageable. Objectives of change strategies should not be limited to minimizing
change likelihood but also reducing its implementation cost [201].

27
Corresponding to this realization, another main category of available change strategies is
to equip original product designs with high changeability attributes in anticipation of their
future changes [270]. Since the flexibility to generate a variety of product offerings from
a single design resides principally with its architecture [326], objectives of this strategy
are to furnish intended baseline designs with the ability to be changed easily and rapidly,
and to be insensitive or adaptable to their varying environment [286]. It aims at deriving
product variants in the most cost-optimized way when reacting to foreseen or unforeseen
requirements for engineering changes [138, 277]. A baseline product can be developed to
house predicted future changes in its original architecture, facilitate their implementation
through pre-planned design options or be fully modified easily [272]. However, building
products with high in-built design changeability considerably increases their development
costs [67], as shown in Figure 12. Due to this disadvantage, not all product types suit this
strategy and a basic guideline to evaluate product suitability for this approach is available
in [308]. Examples of design methods that can be associated with this change strategy are
product platforming and modular design.
Figure 12: Degree of Changeability versus Cost [286]
28
A product platform is described as a common set of subsystems, components, interfaces,
processes and other attributes shared by all design variants within a product family [234].
In product platforming, the main idea is not to design with definite number of variants but
to make it easily modified for its future derivatives [117]. Accommodation of engineering
changes is enabled on certain aspects of the platform design but its other characteristics
are maintained for all its variants. This approach is recognized to support and ease change
implementation process [280].
On the other hand, modular products are designed with distinctive physical modules [147,
252, 326] that are mapped one-to-one to their functions [241, 327]. This enables changes
to be contained only within affected design modules without involving their interfaces or
other modules [129, 175, 326] since they are basically de-coupled from each other [125].
Change management in this case is practically reduced to two typologies: “local changes”
in the affected design modules and “interface changes” in the linkages between modules
[175, 259]. Though design modularity provides the necessary flexibility that aids product
mass customization [326], not all product types can be made modular with sensible costs
and efforts [81]. In fact, most products are neither fully modular nor fully integrated [110,
175]. In addition to extra development costs and risks, and restricted applicability of this
second category of change strategies, high market uncertainties also create difficulties to
justify built-in design attributes based solely on manufacturers’ prediction.
To summarize, change prevention and front-loading, and high in-built design flexibility
are adequate for stationary or slow-paced market environment. Their application however
becomes fairly deficient when product requirements constantly vary over time [174, 314].
In today’s market, some requirements are adjusted during the detailed product design step
[203] when these strategies are no longer applicable since they are meant to avert changes
during the early development stages [184]. As for improving product design flexibility, it

29
seems to be highly targeted for original development [272], which makes it unsuitable for
redesign process. While these strategies have been proven useful in reducing changes due
to designer’s errors, a proper in-process change handling is also required [264]. Schmitt
and Gomory argued that most US manufacturers tend to have long development cycle to
research product market and avoid design changes that might not even there [285]. This
differs from high-performance Japanese companies that put their products into the market
faster to obtain first-in-the-market advantages and rapidly make necessary adjustments as
their market evolves [320]. Changes that are driven by dynamic market factors could be
“make or break” product features and manufacturers need to have a viable development
strategy to manage their product changes [267]. However, current practices demonstrate a
lack of understanding and appreciation on how engineering changes could be turned into
market advantages [344]. The omission of any emphasis on change management during
redesign process ignores its capacity to strategically drive the product development [166],
which leads to the following second area of potential improvement.
Potential Improvement 2: A strategic redesign planning process can help
manufacturers to gain change benefits without a big penalty of their effects.
In the meantime, a major advancement in engineering change management field has been
made in computer-based support tools for its process execution [154, 270]. This is driven
by compliance to industrial standards on product quality and process management such as
ISO10007 and ISO9000 [109]. Traditional paper-based change management is naturally
inefficient and slow [66, 157, 190], especially when serially executed throughout various
departments in the company [66]. As product designs become more complicated, paper-
based system grows to be incompetent in handling their subsequent alteration [175, 176].
Change implementation increases the amount of product data to be processed and makes
it hard to manually maintain design updates. With progression in computing technology,

30
most of these tasks have been converted into computer-based execution. Between 1980s
to 1990s, several standalone and integrated computer aids for engineering change process
have been developed [190] and they are classified into decision-making support, database
storing, configuration management or product data management [165].
Decision-making support tools are aimed to assist product designers in approval process
of proposed engineering changes. However, most of them do not capture the full extent of
change process or its impact analysis [80, 115]. Capabilities of available computer-aided
design (CAD) tools are usually not sufficient to realize the benefits of information reuse
for redesign process [318]. Advanced CAD systems such as CATIA and ProEngineer can
predict immediate geometrical behaviors but not other types of propagated change effects
that result from product modification [80, 120, 259]. In contrast, computer-based change
support tools to store historical product change data and process documentation are often
built in-house [174] in relation to enterprise resource planning (ERP) or product lifecycle
management (PLM) software packages [176, 344]. They compile all process records and
product data across different phases of its lifecycle, including all past changes description
[174, 316]. Their main application is to facilitate product data exchanges during change
management process but they are not equipped to strategically guide designers in making
the actual change implementation. Moreover, change support tools that are developed for
configuration management are more focused on effective control of product information
throughout its entire lifecycle [189]. They are meant for high-level documentation control
and management of product design options but the actual process of making engineering
changes is either ignored or covered by them in little depth [120, 174, 176, 278]. Last but
not least, product data management (PDM) system essentially combines the functions of
decision-making support and configuration management. Commercial packages such as
IMAN, Metaphase 2 and Optegra are examples of PDM systems that cover entire product
lifecycle [165, 190]. Among others, their main functions include product data vaulting,

31
document management, part classification, production configuration, data conversion,
workflow management and project management [251]. However, they are not equipped
with capabilities beyond the linking of parts, processes and resources based on manual
user judgment [120, 268]. In other words, they are simply a direct computerized version
of conventional paper-based change management procedures [174, 268].
To sum up, most available change support tools are not equipped to guide or aid decision-
making process in product redesign [120, 199] and they often can only record and track
data related to past product changes [116, 176]. Additionally, due to traditional views of
engineering changes as production-manufacturing issues [344], those available methods
and tools only support change process after it has been initiated and production stage has
began [175]. They are not intended to assist designers in predicting change effects while
planning for product redesign but only to facilitate process execution and documentation
that have been manually planned beforehand. In absence of proper change aids, current
product redesign planning task is limited to listing likely affected design parts and related
processes based on designers’ past experiences. No strategic planning is formally infused
into the process, which increases the possibility of overlooked change effects that have to
be unexpectedly handled during late production stages [186]. A conducted case study in
Westland Helicopters showed that about 50% of their total helicopter modifications were
overlooked during its initial change assessment stage and had to be abruptly handled later
in its development process when they were identified [81]. This solidifies the belief that
available change tools and methods lack the critical element of strategic planning.
The use of computer-based tools in engineering change management is fast becoming an
operational necessity for many manufacturers, especially those with a large scale product
business [204]. Unfortunately, their application is presently limited to mostly information
processing and documentation control [47]. An efficient change management process is

32
only possible if change methods or tools are tailored to competitive product development
strategies [267]. Amid high market competition today, personnel responsible for product
changes have to be more than just an implementer [156] and able to strategically plan to
the best capability of their company [113]. To date, no well-known ready-to-use software
package that supports all aspects of change management process is available [259]. This
should be perceived as a key absence given its established prominence, as highlighted in
the following identified area of improvement.
Potential Improvement 3: Change support methods and tools should be
equipped with capability to guide designers in making the strategically best
change implementation decisions.
On top of these observations, it should also be noted that there are limited researches that
address the supports for change management process in product development [166, 270].
Engineering change topics have garnered little attention notwithstanding their recognized
importance in product manufacturing industry [316], which is unfortunate considering the
potential market opportunities that they could provide to manufacturers. Current product
change strategies need an implementation planning strategy and an expanded application
scope to cover the key challenges in product redesign. Despite a small amount of research
efforts in engineering change field, all of them highlight existing needs that support the
relevance of this thesis study.
1.2.5 Scope Limitations
The scope of product redesign and engineering change management processes has been
discussed in preceding sections. In this study, some limitations are applied to its problem
scope to better refine its focus. This section is intended to detail out these limitations to

33
avoid any confusion with the research work to be presented later in this thesis. In brief,
they are derived based on aircraft redesign process, considered engineering change types
and intended application capacity of the proposed methodology.
First of all, the proposed method is tailored to aircraft redesign process. Though for most
parts the procedures are similar to other product types, their level of details and extent of
decision-making are adapted for products with such a high design complexity. For simple
products, decisions are usually made at their component level where the modification is
directly applied but for complex products such as aircraft, involvement of many business
partners and suppliers makes it hard for their primary manufacturers to always decide on
that detailed level. In view of this, aircraft redesign decisions are commonly made at its
subsystem level than its actual components. It can be noted that a typical aircraft system
design has millions of parts. The MD-11 commercial transport aircraft, for instance, has
about 184,000 different parts for its numerous subsystems [333]. In spite of the decision
complexity, it is important for main aircraft manufacturers to identify engineering change
effects that can propagate between major components of their aircraft subsystem. Many
opportunities currently exist for innovation in quality and productivity aspects of aircraft
redesign practices [239], and accommodation of this condition drives the construction of
steps in the proposed method. It should be noted that requirements analysis procedure for
the aircraft redesign is not included in this study since the proposed method assumes that
this has been completed prior to its initiation and the list of change initiating components
(and their proposed modification) has been supplied to engineering teams responsible for
their implementation planning into the product. Further narrowing of the research scope
due to this focus on aircraft redesign process is discussed in next chapter.
Secondly, from the standpoint of engineering design research community, “redesign” can
have different meanings [68]. While the core of the procedures remains similar, which is

34
making changes to an existing product, their objective and time of execution can lead to
different interpretation. Three main types of redesign process are defined based on their
handling time in the product lifecycle: during original design, after original design period
or during reconstruction of original product [270]. The focused redesign problem in this
study is to take an existing aircraft design and modify it to satisfy new requirements that
are imposed on its next derivative, which is related to the last redesign process category.
In contrast, the first category of redesign process is related to the handling of engineering
changes during original aircraft development while the second is associated with aircraft
modification during or after its original design has made its way to manufacturing floor.
Hence for the interested redesign case in this thesis study, the baseline aircraft design has
been well-defined and available degree of freedom for the redesign process is constricted
by its existing flexibility. The rationale for this decision is discussed as follows.
The shift in market environment has led to shortened product lifecycle [196] and this also
translates into a time decrease for manufacturers to competitively process their required
engineering changes [40, 250, 348]. It is imperative to successfully conclude the product
design projects on time to assure their financial viability and long-term competitiveness
[113]. Despite such time pressure however, typical process lead time in reported product
change studies still vary between several weeks to a year, with value-added time as low
as 8.5% [48, 316]. In general, this long processing time is attributed to complex approval
process, scarce capacity and congestion, set-ups and batching, organizational issues and
“snowballing” of change effects [321]. Despite the efforts of design researches that focus
on resolving intensive data requirements, high time consumption, change data access and
impact prediction [165, 344], the same problem still persist. This leads to a strong belief
that change process lead times can only be improved if a proper change implementation
planning is done upfront of the redesign development process. In view of this notion, this
research is focused on supporting change process that occurs during early redesign stages

35
to highlight overlooked benefits of redesign change planning. Based on “strategic design”
definition by Seepersad et al. [287], the proposed redesign method can be described as a
marriage of strategic methods for leveraging and adapting existing products, procedures
for assessing and infusing necessary design innovations, and systematic evaluations for
comparing and selecting the best redesign plan among a portfolio of change alternatives.
Accordingly, this means that engineering changes considered in this study are those that
arise during conceptual and preliminary product redesign stages. It is not the focus of the
proposed method to handle changes like design retrofits that occur after the production
stage has started or while the aircraft is already in operation.
In addition, it is known that the form of engineering changes ranges from physical design
alteration to documentation update to software maintenance. From previous discussion of
available methods and tools, management of product documentation has been covered in
the development of computer-based change support tools while software maintenance has
been captured by researches in software management field. Physical product changes, on
the other hand, are lacking proper focus in current change management process. Although
these various forms of changes are tackled separately, they can be easily interconnected
to one another. For instance, each physical product change automatically signifies a need
to revise its related documentation [270]. Hence the proposed redesign method is focused
on planning physical engineering changes and it is assumed that their information can be
routinely extended to the company’s product documentation database.
Last but not least, most manufacturing companies adopt a customized engineering change
management process that is tailored to their organizational needs and strategies. As stated
by O’Donovan et al., the range of interests and views for product design process makes it
hard for a single method to capture various interests and practices [244]. Accordingly, the
key problem for commercially available computer-based change support tools is typically

36
linked to their generalized change procedure that is made to increase their applicability in
companies from diverse industrial backgrounds. However, this makes them unsuitable for
application in detailed product redesign process. British Aerospace developed their own
change management software because the required efforts to refine available commercial
packages to suit their organizational needs are perceived as too taxing for them. Their
customized engineering change management package is described in [190]. Taking this
into account, it makes more sense to develop the proposed method in support of existing
change processes than as their total replacement.
While time delays caused by inefficiencies of adopted change methods, tools or working
environment are difficult to improve without affecting the entire company’s organization,
change processing time can be minimized by eliminating or reducing process iterations.
In previous Figure 6, engineering change itself is iterative in nature as it goes through its
review and approval stages [71]. Loch and Terwiesch offered a structural map of adopted
change process in actual product company in Figure 13.
Arrival of an officially
recognized ECO
Generation of alternatives by the engineers
Simulation of new designs at CAD level
Administrative approval
(accounting & finance)
Engineering approval (project manager)
Approval and Implementation
through purchasing
Arrival of modified parts for
prototypes
Feedback on the effectiveness of
the ECO
ECO Approval Process
Iteration if not approved
?
Resolved
Iteration if not effective
Figure 13: Engineering Change Process Example [210]

37
From Figure 13, change process require iterations when the proposed modification is not
approved for implementation or when the problems still remain after the product has been
modified. A proposed product modification is rejected if it is assessed to be too risky and
remaining problems after modification are commonly due to misinterpreted requirements
or unaccounted change effects by the proposed change plan [174].
A good change proposal helps to reduce process iteration by ensuring a high possibility
that the requirements can be met by the proposed product modification and having all its
side effects pre-determined in its specification. A good change planning includes accurate
identification of its implementation tasks and effective allocation of available resources
[111]. As decision-making process is often the “bottleneck” point in change management
procedure [316], availability of these details helps to smooth out the process. In fact, a lot
of time can be saved within overall product redesign development if several competitive
change implementation options are simultaneously generated. Instead of having to restart
redesign planning for each change process iteration, available backup plans can be used
in cases when the first chosen plan is disapproved [243].
Thus far, it is apparent that the main potential room for improvement is to support present
change management process with means to generate competitive change proposals. This
entails a good change implementation planning strategy to screen out infeasible proposals
based on their possible impacts of change propagation [185, 270] while complementing
the depth of product designers’ experiences [115]. In view of this, the proposed method is
focused on supporting existing change management process by aiding product designers
in generating good change proposal plans based on their redesign objectives.

38
Key note: Summarized scope limitations for this study are listed as follows:
1. The proposed methodology is tailored to the aircraft redesign process.
2. This study does not include change requirements analysis for the aircraft
redesign.
3. The application of the proposed methodology is intended for the conceptual
or preliminary phases of the reconstruction of an existing baseline product.
4. The main focus on the proposed methodology is the planning of the
physical product engineering changes.
5. The proposed methodology is intended to support the existing formal
change management process by being an efficient change decision-making
aid to generate competitive change implementation plans.
1.3 Research Objectives
The urgent needs to improve product redesign process have been sufficiently established
and the scope of this study has been clarified in previous section. In short, this research is
narrowed down to the formulation of an engineering change planning method for product
redesign approach, which is applied prior to the initiation of formal engineering change
management process in the manufacturing company. The major output from this method
is a set of engineering change proposals for any well-defined initiating product changes.
It should be emphasized that the proposed methodology is meant to be a change decision-
making aid and not an automated change plan generator. This is amply summarized in the
following purpose statement for this thesis.
The purpose of this thesis is to develop a methodology that supports
decision-making process in product redesign through efficient
engineering change implementation planning

39
In corroboration with the above work intent, several research objectives are set up based
on current gaps in product redesign methods and underlining characteristics of change
management process. It should be noted that these research objectives are in parallel with
suggestions from several primary engineering change literatures such as Eckert, Pulm and
Jarratt [117], Rouibah and Caskey [270] and Eckert, Clarkson and Zanker [115].
Research Objective 1: Reduce risks of product redesign process by
incorporating changeability assessment on baseline design in early stages
Research Objective 2: Improve identification of potential change effects by
incorporating analysis of direct and indirect change propagation
Research Objective 3: Improve product change implementation planning by
aiding designers in defining appropriate change solution space and supporting
their change decision-making process
Research Objective 4: Reduce costs and time delays of product redesign
process by generating competitive change implementation proposals
1.4 Thesis Organization
Overall structure for this thesis documentation is depicted in Figure 14. This first chapter
has built the case for relevance of this research by explaining its motivation and pressing
industrial needs. In addition, the study scope has been outlined by defining its limitations
and research objectives that guides development of proposed method. Chapter 2 describes
current aircraft redesign process that is the central focus of this thesis study. It discusses
the challenges in aircraft development process, which further shape required steps for the
proposed method. Chapter 3 reports upon extensive literature review to identify available

40
tools and methods to close identified gaps in aircraft redesign practices. Based on gained
knowledge, research questions and hypotheses for this study are presented in Chapter 4.
Proposed methodology to address research questions is also described within this chapter,
along with an Excel-based computer program to support its application. Next, Chapter 5
explores research questions and hypotheses through two implementation case studies of
notional aircraft redesign using proposed method. This thesis concludes with Chapter 6,
which contains final discussion on this research work and suggested future work.
Figure 14: Thesis Organization
1.5 Chapter Summary
The progressive shift of product marketplace towards a customer-driven environment has
increased its dynamics. In product manufacturing industry, this leads to changing mindset
from traditional mass production to mass customization. This is to cope with rising needs
for manufacturers to improve product’s quality, functionality and features while reducing
its costs and shorten its time to market [318]. Prominence of product redesign approaches
and engineering changes is becoming more pronounced. It is common to perceive present

41
product development as a continuous change management process [137], which involves
substantial redesigning and administrative efforts that can be reduced only if it is well-
managed [259]. Despite acknowledgement of their significant effects on product success
today, potential for having a strategic redesign planning is still largely been ignored by
many manufacturers.
At present, redesign approach is focused on eliminating late product changes or build-in
high design flexibility into original products to absorb their expected future changes. This
is primarily due to attitudes of product engineers and design managers, who view changes
more as a problem rather than an opportunity to improve their product competitiveness.
As evident in many product development cases, even experienced downstream engineers
cannot totally avoid late changes [337]. In addition, while many change implementation
proposals appear deceptively simple [109], they are associated with level of complexity
that influences their required amount of efforts and process completion timeframe [112].
Available change methods and tools are limited and inadequate to deal with challenges of
dynamic market environment today. In several case studies, improperly planned redesign
changes have been shown to negatively affect the product development process [111] and
this strengthens the belief that current change processes are usually mismanaged. This
situation needs to be properly addressed since market success today is greatly dependent
on product’s time-to-market, price and quality, which are significantly affected by a poor
redesign planning [242].
In particular, the main overlooked aspect of product redesign process is the planning of
its proposed modification. As demonstrated in several academic research works, notable
competitive benefits could be gained by manufacturers if they spent more time planning
their product’s initiating modification [76, 321]. This notion is the primary motivation for
this thesis work to develop a strategic product redesign methodology.

42
CHAPTER 2
DERIVATIVE AIRCRAFT DEVELOPMENT
“An efficient control of engineering changes at the development
stage is strategic for aircraft manufacturers.”
- Riviere, Feru and Tollenaere (2003)
As stated in previous chapter, the focus of this study is on derivative aircraft development
process. This chapter is intended to offer essential background of current aircraft redesign
strategies. In the first section, eminence of aircraft redesign practices and their relevance
to current market challenges are highlighted. Typical aircraft development process is also
described within this section. In the second section, main challenges of aircraft redesign
process due to engineering changes are recognized and associated with identified areas of
improvement. This chapter concludes with the tailoring of steps for the proposed aircraft
redesign method based on gained knowledge so far.
2.1 Aircraft Development Practices
An aircraft is one of the most complex, technology-based, engineered systems [141]. Its
design and development process is a daunting task since it is not just a system performing
some specified functions but also a revenue generator for its operators: the airlines [220].
Very few product industries can match the volatility of aircraft industry where numerous
external factors can contribute to its market dynamics. Systems Engineering Application
Technical Committee in the International Council on Systems Engineering (INCOSE) has
outlined five main external factors that contribute towards aircraft system environment as
illustrated in Figure 15.

43
Figure 15: Primary Factors for Commercial Aircraft Environment [15]
In general, commercial transport aircraft market is split into two main segments based on
design capacity. The first market sector corresponds to aircraft systems with more than
100-passenger capacity while the second accommodates those with less than that, which
are mostly business and regional types [266]. Airbus and Boeing are currently the leading
aircraft manufacturers in the world and they have a market duopoly in the 100+ capacity
segment [319]. The second market segment, on the other hand, is mostly being served by
various regional manufacturers [255]. For both market segments, derivative development
has been a prominent approach in aircraft manufacturing. Between 1980’s to late 1990’s,
only five original designs were introduced into large commercial aircraft market. Boeing
produced their original B757, B767 and B777 aircraft while Airbus had their A320 and
A330/340 designs [86]. As depicted in Figure 16, the market during that time period was
filled with more than 20 derivative aircraft [86].

44
1980
MD-80/81/82/83/87/88 MD-90, MD-11 B737-300/400/500/600/700/800
B747-300/400 B777-300, B767-300, B757-300 A310, A319, A321
B757-200
(1982)
A320
(1988)
B767-200
(1982)
B777-200
(1995)
A330/A340
(1993)
DERIVATIVES
ORIGINALS
1980
MD-80/81/82/83/87/88 MD-90, MD-11 B737-300/400/500/600/700/800
B747-300/400 B777-300, B767-300, B757-300 A310, A319, A321
B757-200
(1982)
A320
(1988)
B767-200
(1982)
B777-200
(1995)
A330/A340
(1993)
DERIVATIVES
ORIGINALS
Figure 16: Previous Aircraft Development Timeline
Over the last few decades, the aerospace market has progressively changed. Many aircraft
manufacturers struggle to survive the market that is characterized by drastically shortened
production cycle, intensified fierce global competition and increased product variety and
complexity [331]. The marketplace demands more customization and this leads to more
engineering changes being introduced during development process [267]. Because a new
aircraft development usually takes more than five years, it is highly infeasible to develop
individualized design for each customer airline. It is more common to exploit available
flexibility within existing aircraft designs to implement the customized options. Based on
Utterback’s industrial innovation model, the current aerospace industry can be considered
to be in “specific phase” with well-established dominant designs, in which most market
opportunities exist in incremental improvements instead of revolutionary product designs
[239, 328].
2.1.1 The Significance of Aircraft Derivatives
According to Dassault Aviation, the twin business challenges for aircraft manufacturers
today are to design and develop technologically sophisticated aircraft with affordable cost
and in a shorter timeframe [50]. Due to high competition in commercial aviation industry,
manufacturers are pressured to reduce their aircraft development risks [262]. In view of
this, advantages of aircraft redesign approach make it more favorable than building new
original aircraft. Besides cheaper and faster to develop, derivative aircraft also feature an
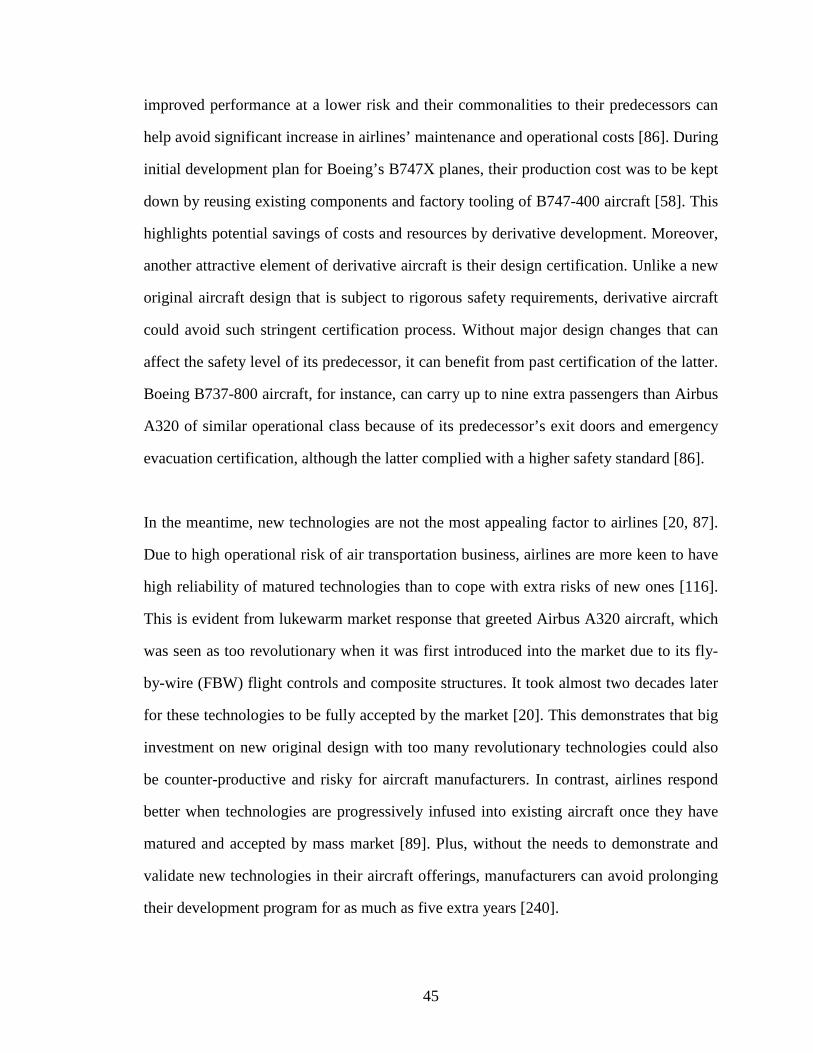
45
improved performance at a lower risk and their commonalities to their predecessors can
help avoid significant increase in airlines’ maintenance and operational costs [86]. During
initial development plan for Boeing’s B747X planes, their production cost was to be kept
down by reusing existing components and factory tooling of B747-400 aircraft [58]. This
highlights potential savings of costs and resources by derivative development. Moreover,
another attractive element of derivative aircraft is their design certification. Unlike a new
original aircraft design that is subject to rigorous safety requirements, derivative aircraft
could avoid such stringent certification process. Without major design changes that can
affect the safety level of its predecessor, it can benefit from past certification of the latter.
Boeing B737-800 aircraft, for instance, can carry up to nine extra passengers than Airbus
A320 of similar operational class because of its predecessor’s exit doors and emergency
evacuation certification, although the latter complied with a higher safety standard [86].
In the meantime, new technologies are not the most appealing factor to airlines [20, 87].
Due to high operational risk of air transportation business, airlines are more keen to have
high reliability of matured technologies than to cope with extra risks of new ones [116].
This is evident from lukewarm market response that greeted Airbus A320 aircraft, which
was seen as too revolutionary when it was first introduced into the market due to its fly-
by-wire (FBW) flight controls and composite structures. It took almost two decades later
for these technologies to be fully accepted by the market [20]. This demonstrates that big
investment on new original design with too many revolutionary technologies could also
be counter-productive and risky for aircraft manufacturers. In contrast, airlines respond
better when technologies are progressively infused into existing aircraft once they have
matured and accepted by mass market [89]. Plus, without the needs to demonstrate and
validate new technologies in their aircraft offerings, manufacturers can avoid prolonging
their development program for as much as five extra years [240].

46
As shown in Figure 17, Boeing has practiced incremental upgrade strategy in their B737,
B747, B757 and B767 aircraft programs [258]. It can be observed that prevalent redesign
approaches in aircraft manufacturing are product platforming and family modeling [107],
both of which follow evolutionary or incremental progress of existing designs [84].
Figure 17: Relative System Upgrades on Boeing Aircraft [125]
In product platforming or module-based redesign approaches, a derivative aircraft can be
developed by adding, removing or substituting one or more modules in its baseline design
[296]. Despite the changes, the redesigned aircraft mostly retains the basic architecture of
its baseline. Boeing has long practiced this strategy, which is apparent by observing their
derivative aircraft series. For instance, even after more than 30 years of its first flight, the
original B737-100 aircraft design is still visible in its derivative B737-700 [127]. In each
derivative progression, new subsystem technologies are often phased in to extend design
applicability in newly-changed market environment [86, 316]. Overall, the key advantage
of this incremental derivative strategy is its ability to develop a perceptively new aircraft
in a shorter timeframe and with significantly reduced efforts as compared to starting from
scratch. By upgrading aircraft subsystems with newly available technologies, its market
relevance is prolonged and its competitiveness is maintained.

47
On the other hand, in family modeling or scale-based redesign, architecture of each future
variant in the aircraft family is developed as a package within a single common baseline
[128]. It involves systematic planning of modularity and commonality for physical and
functional aspects of each product family member [107]. From airlines’ point of view, an
aircraft design is often measured by its capacity and range [88, 266] and for that reason,
derivative aircraft family is developed by adjusting baseline design based on its range-
payload relationship. While keeping as much subsystems commonality as possible with
other members of the aircraft family, payload capacity of derivative aircraft is reduced to
increase its operational range and vice versa [86]. This concept is illustrated in Figure 18.
It can be noted that most derivatives are often derived through shortening or stretching of
their baseline aircraft [296].
Range
Seats
Reduce capacity to increase range OR reduce range to
increase capacity
Increase maximum take-off weight to
increase capacity at constant range OR to increase range at constant capacity
Baseline Design Point
Range
Seats
Reduce capacity to increase range OR reduce range to
increase capacity
Increase maximum take-off weight to
increase capacity at constant range OR to increase range at constant capacity
Baseline Design Point
Figure 18: Development of Derivative Aircraft Family [86]
Airbus has capitalized on this derivative strategy since their introduction into the large
commercial aircraft market. This approach enables a faster development of wide range of
aircraft offerings, which greatly helped them to cover broad range of the aircraft market
spectrum in shorter timeframe. As the latest market entrant at that time, this capability is

48
instrumental for their survival against established aircraft manufacturers like Boeing and
then-McDonnell Douglas [85]. Thus far, aircraft families produced by Airbus are based
on three designs: Airbus A300 in early 1970’s (baseline for A300-600 and A310), Airbus
A320 in mid-1980’s (baseline for A318, A319, A320 and A321) and Airbus A340/330 in
early 1990’s [85]. By using this family-oriented approach, Airbus is able to provide more
flexibility to their customers to switch orders from one capacity module to another within
the same aircraft family until time of delivery without much cost penalties owing to their
inherent commonality features [303]. This is very appealing to airlines and a competitive
move that is not able to be effectively offered by incremental development approach [20].
It is important to note that this derivative strategy is not based on an existing design. An
original aircraft design has to be developed as a main baseline for future derivatives in a
family. This is usually perceived by airlines as simultaneous development of several new
aircraft instead of simple reuse of old design elements and principles. Airbus has enjoyed
high interests that are typically associated with novel aircraft developments for each of
their derivative markets by developing only one new design. Nonetheless, this also means
that the process starts off like an original aircraft development and has relatively higher
risks and costs than step-by-step derivative approach [58]. The ongoing development of
Airbus A350 can be used to demonstrate this condition. By changing its plan from being
a direct incremental derivative of A330 aircraft to an original baseline design for eventual
A350-800 and A350-900 derivatives, its market entry was pushed back four years behind
initial market introduction of its rival: Boeing 787 [90] and its total development cost is
projected to top $15 billion [223], which is significantly higher as compared to a typical
incremental derivative.
To summarize, derivative strategy has a big role for aircraft manufacturers in maintaining
their market competitiveness. Murman et al. predicted that derivative configurations will

49
continue to dominate commercial aircraft systems market [239]. Both aircraft platforming
and family modeling strategies offer their own advantages that are relevant with current
market challenges, especially in coping with growing customization trend where original
aircraft development is not a viable option. In addition, ability of aircraft manufacturers
to address change requests from customer airlines as early as during negotiation process
is key to their market competitiveness [268]. A study in Westland Helicopters revealed
that 10% to 15% of their helicopter redesign costs occurred before the sales contract was
signed, which were generally spent on planning required design changes and estimating
their full effects [81]. This puts further emphasis on efficiency of redesign planning that
can only be achieved if the change management process is executed in good synergy with
aircraft development process.
2.1.2 Aircraft Development Process
Aircraft design and development is unquestionably a very complex process. John Leahy,
the Airbus sales chief, echoed this sentiment while commenting on production delays that
have affected both Airbus and Boeing companies in their current A380 and B787 aircraft
development, respectively [223]. The shift in aircraft market environment towards a more
customer-driven setting has forced a rethinking and restructuring of its long-established
development process. In general, traditional aircraft design and development framework
(shown in Figure 19) has been adapted into a customer-driven quality process in Figure
20. This shift is in parallel with other product industries, where “many companies have
come to realize that the key to world-competitive products lies in high-quality product
design” [102]. Instead of sole focus on performances, aircraft manufacturers today has to
design for “affordability” where main challenges are associated with development costs
and manufacturing process [284].

50
Figure 19: Traditional Aircraft Development Process [214]
Figure 20: Quality Planning in Aerospace Manufacturing [214]
The scope of this study can be associated with the “quality in information and planning”
phase in Figure 20, specifically “design planning and specifications” tasks. Main output
from this phase is a documentation of planned design specification [214], which is similar
to an engineering change proposal for redesign process. Though the framework in Figure
20 is focused on original development, aircraft redesign process can be perceived as its
subset due to their shared design and development tasks [33]. Many engineering changes
during original aircraft development occur before its proposed design gets to production

51
floor [268]. For instance, amid their received criticisms for proposed A350 aircraft design
as a direct derivative of A330, Airbus redesigned the aircraft before it was later approved
for development and production [24, 90]. It took a whole year and at least four definition
reworks before the redesigned A350 proposal was released [89]. This shows that redesign
process can occur during original aircraft design and development process and is not only
limited to derivative development. Note that in this thesis work, redesign process of “new
original aircraft” is termed together with derivative aircraft development.
Like other product industries, aircraft development process involves identification of its
requirements, listing of tasks to accomplish the work, and identification and allocation of
required resources for its successful execution [212]. Design process of an aircraft system
prior to its production stages can be decomposed into three phases: conceptual design,
preliminary design and detailed design, which are traditionally executed in that sequential
order. In short, conceptual design results in a feasible aircraft concept that is tailored to
the established driving requirements, which is refined through higher fidelity analyses in
preliminary design before a complete specification is finalized in detailed design stage.
An example process is illustrated in Figure 21. A main challenge to design an aircraft is
its multi-disciplinary nature. This is characterized by degrees of influences that one of its
design disciplines has on others, such as how aerodynamic lift and yaw moments drive
the sizing of horizontal stabilizer and rudder, which in turn affect flight controls system
[262]. In his discussion on flight control system development for Boeing B777 aircraft,
McWha acknowledged how interdependent aircraft subsystems are and how crucial it is
to consider the overall system integration during its design process [233]. The situation is
more problematic when early design decisions are made with very little hard information
about these interactions [62].

52
Conceptual
Design
CAD Definition
Detailed Design
Aerodynamic Analysis
Propulsion Analysis
Structural Analysis
Experimental
Testing
Model
Fabrication
Other Disciplinary
Analyses
Ma
jor
De
sig
n L
oo
p
Min
or
De
sig
n L
oo
p
PlanningConceptual
DesignPreliminary
DesignDetailed Design
Production Ramp-Up Manufacturing
Figure 21: Aircraft Design Process [262]
In Figure 22, while high level concept and requirements for main aircraft subsystems are
decided during conceptual stage or early preliminary step, their interactions are seriously
considered only during the detailed design stage. If the early decisions are found to be
mismatched at this later point of development process, the aircraft design will be brought
back to its analysis stages once the required design changes to remedy the situation have
been proposed. In general, this ‘top-down’ development strategy puts enormous pressure
on designers’ ability to correctly conceptualize detailed aircraft design in the early stages
with very limited knowledge of its final subsystems [31].
For products with high design complexity, it is a common practice to outsource some of
its development aspects to various sub-contractors or suppliers [71, 270]. Most aerospace
products today are produced by outsourcing as much as 70% of their design elements to
different suppliers [130]. For instance, 70% of activities in Airbus A380 development are
carried out by a network of sub-contractors that involves about 39 companies [31, 266].
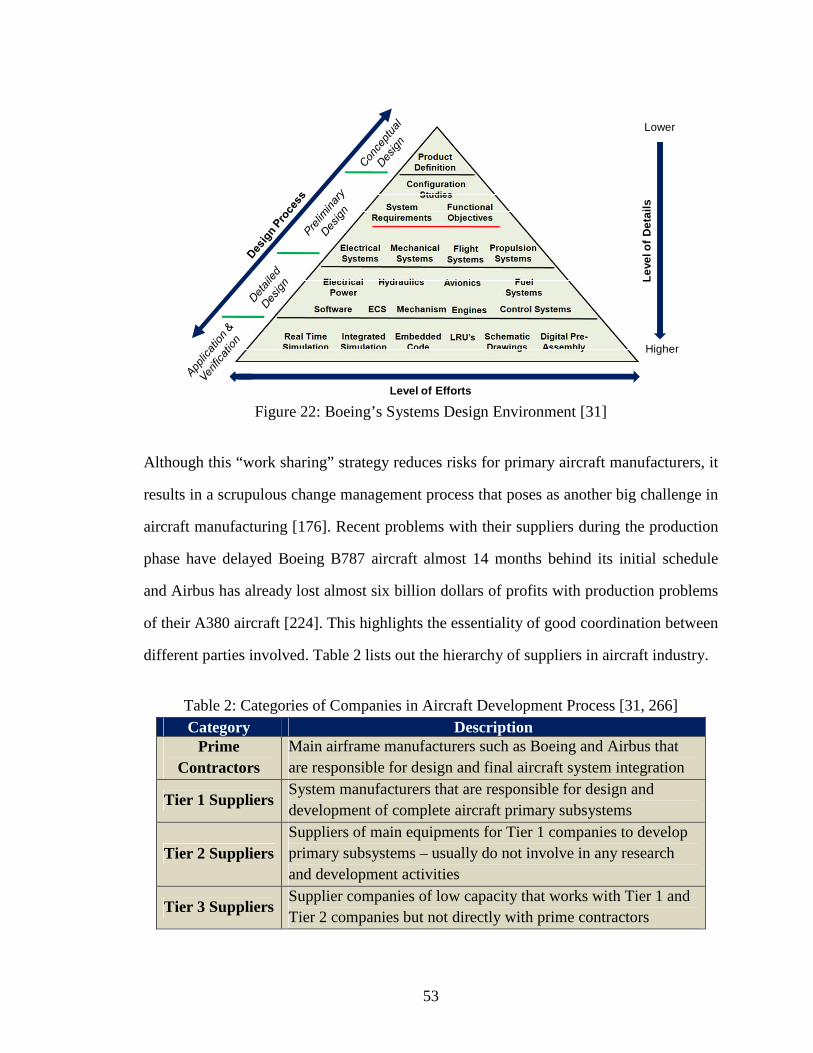
53
Lev
el o
f D
etai
ls
Lower
Higher
Level of Efforts Figure 22: Boeing’s Systems Design Environment [31]
Although this “work sharing” strategy reduces risks for primary aircraft manufacturers, it
results in a scrupulous change management process that poses as another big challenge in
aircraft manufacturing [176]. Recent problems with their suppliers during the production
phase have delayed Boeing B787 aircraft almost 14 months behind its initial schedule
and Airbus has already lost almost six billion dollars of profits with production problems
of their A380 aircraft [224]. This highlights the essentiality of good coordination between
different parties involved. Table 2 lists out the hierarchy of suppliers in aircraft industry.
Table 2: Categories of Companies in Aircraft Development Process [31, 266] Category Description
Prime Contractors
Main airframe manufacturers such as Boeing and Airbus that are responsible for design and final aircraft system integration
Tier 1 Suppliers System manufacturers that are responsible for design and development of complete aircraft primary subsystems
Tier 2 Suppliers Suppliers of main equipments for Tier 1 companies to develop primary subsystems – usually do not involve in any research and development activities
Tier 3 Suppliers Supplier companies of low capacity that works with Tier 1 and Tier 2 companies but not directly with prime contractors

54
To deal with these aircraft design and development issues, several concurrent engineering
(CE) methods and techniques have been introduced over the years [253]. The main goal
of CE approaches is to bring more design constraints that are used to be considered later
to the early stages where conceptual decisions are made [105, 196]. This enables a better
coordination between aircraft design and its manufacturing process [155], and improves
the communication between various business partners and suppliers [174, 316]. Potential
benefits offered by CE methods in aircraft redesign are evident in Airbus A340-500/600
derivative development, in which an estimated reduction of 25% development time and
30% costs (equivalent to a saving of about 50 million Euros) are reported in comparison
to basic A340 development [253, 266]. In relation to engineering changes, making good
decisions during conceptual stage is a significant step towards eliminating the needs for
expensive late changes. CE approaches such as Integrated Product/Process Development
(IPPD) have been demonstrated to reduce the amount of late design changes in aerospace
product development [227], as highlighted in Figure 23.
High
Low
Nu
mb
er o
f De
sign
Cha
nge
s
Do
llars
High
Low
TraditionalSerial
Approach
IPPDApproach
Cost ofChange
Conceptualizationand Design
Test andProduction
Support
Time
High
Low
Nu
mb
er o
f De
sign
Cha
nge
s
Do
llars
High
Low
TraditionalSerial
Approach
IPPDApproach
Cost ofChange
Conceptualizationand Design
Test andProduction
Support
Time Figure 23: Comparison between Traditional Serial Design and IPPD Approaches [14]

55
Although CE efforts improve early decision-making process and enable smoother product
information flow [214], issues of design changes largely remain in aircraft development
process. They target efficient execution of design and development process, which focus
on preventing or reducing emergent changes due to decision-making or communication
errors [32], but they offer little help to aircraft designers when it comes to actual change
implementation. In addition, many aircraft manufacturers are more inclined to regard the
need for changes during their development cycle as a problem instead of an opportunity
for their product evolution [266]. This underlines the lack of appreciation for engineering
changes among aircraft manufacturers as their potential competitive means. Despite this
negative attitude, manufacturers do concede that an efficient change management during
their development process is an issue that influences their product and organization [268].
Boeing, for instance, encountered a necessary redesign of a critical part in B787 aircraft
when it was already on the assembly line [224]. This is an exemplary case to demonstrate
that engineering changes still occur even with the application of CE methods. Without the
backing of a proper redesign strategy and support, such process can prolong development
downtime that cannot be afforded by aircraft manufacturers. In the case of Boeing B787,
its wing redesign forced a month-long downtime that cost some of its competitiveness
against rival Airbus A350 aircraft [29].
Several industrial standards related to engineering change management that are relevant
to aircraft manufacturing including ISO 10007, RG AERO 00023, MIL-HDBK-61B and
ANSI/EIA 649 [273] only offer generic change process outlines. None of them suggests
any change impact analysis methods despite emphasizing the importance of such process
[273]. Robert Goussault, the Vice President of Information Systems Division at Dassault
Aviation, commented: “when a modification is made, the impact on the design has to be
considered very quickly. You have to be able to make the design changes in days rather
than weeks, and in weeks rather than months” [50]. From this statement, the challenges

56
of engineering changes in aircraft redesign process are closely related to the efficiency of
manufacturers in identifying causes of change and evaluating its impacts on their product,
process and organization [267].
2.2 Engineering Change Challenges in Aircraft Redesign Process
Redesign process of complex products is rarely straightforward and is highly susceptible
to problems of change propagation [79]. For one redesign case in Westland Helicopters
Company, initial design changes to add a forward looking infrared radar (FLIR) turret on
their helicopter design ended up causing modifications to its avionics, fuselage structure
and nose cap, power supply, cabling and piping [81]. To date, several studies have been
done to identify causing factors of design changes in aerospace industry, such as Riviere
for commercial aircraft development [266] and Hsu et al. for military aerospace programs
[164]. Among identified change factors in the aerospace industry are listed as follows:
• Changes in market needs and product requirements
• Interactions between simultaneous development programs or phases
• Identification of product flaws due to design errors
• Advancement of new technologies and obsolescence of current ones
• Changes in governing regulations
• Changes in business strategies or scheduling
The presence of engineering changes in aircraft development for both commercial and
military applications should always be expected. Clarkson et al. stressed the importance
of a good change management procedure for complex products due to the high magnitude
of their change effects. Interviewed engineers in Westland Helicopters commented that
each kilogram of additional weight from implemented design changes cost them almost
$25,000 and unexpected late changes in their helicopter redesign averagely cost as much

57
as five times higher than if they were handled during early stages [81]. The fact that most
engineering changes in aircraft derivative development are initiated during early redesign
phases should have been to the manufacturers’ advantages. With available information
about its baseline aircraft design, a good redesign strategy can help to assess proposed
change effects and provide market advantages to manufacturers by eliminating necessary
reworks in later stages. But in current aerospace industry, these design changes are often
linked to negative performance effects, prolonged development activities and significant
cost increments, which can be blamed on lack of efficiency and responsiveness of many
aerospace companies in their change handling process [267]. Clarkson et al. stated that
current industry lacks a clear approach in predicting and representing change propagation
phenomenon, and is too dependent on product experts to manually minimize its effects
[79].
There is no doubt that the advancement of aircraft subsystems for commercial transport is
outpacing the changes made at its system level [44]. Learning from Boeing’s problems in
their B787 production, Airbus recognized the importance of efficient change handling at
subsystems level by enabling more times and design involvement to their sub-contractors
before production of their A350 aircraft is started [224]. If any subsystem deviates from
its initial specifications, proper assessment of change effects propagation has to be made
to identify other affected subsystems. The potential to increase the efficiency of change
management for aircraft redesign process lies mainly in capturing overall change effects
propagation at subsystems level. But with current ‘top-down’ subsystems development
approach, many system engineers find it difficult to predict how their proposed change
effects can propagate to other subsystems and what other required modifications should
be expected [229].

58
2.2.1 “Top-Down” Aircraft Subsystems Development
An overview of aircraft development process is illustrated in Figure 24. As depicted in
the figure, aircraft subsystems development starts once the overall aircraft system concept
is chosen but before its complete specification is detailed out. This is one of the accepted
traditional rules for a good aircraft development policy, which is to provide a clear idea to
contractors about the expected role of their subsystems without specifying in details how
they must look and perform [153]. However, it is apparent that simultaneous subsystems
development by various subcontractors will challenge the precision of task division made
by aircraft manufacturers [266].
Within competitive concurrent design engineering and development environment today,
aircraft manufacturers make early outsourcing decisions of their subsystems development
to distribute risks and costs, and to garner the best contractors’ skills and competencies to
their advantages [284]. Because aircraft subsystems will be independently developed and
optimized according to specifications in their technical and contractual definition [63], it
is important for aircraft manufacturers to thoroughly consider the effects of any proposed
redesign before providing such details to their designated sub-contractors and suppliers.
Although initial contract definition often specifies preliminary installation space volumes
and expected subsystem performances, it is not until much later that the actual details can
be finalized by sub-contractors through their own system development process [266]. If
there is a deviation from initial concept, manufacturers have to assess subsequent impacts
and update other affected subsystem contractors. The failure to efficiently do so may lead
to expensive reworks during final assembly. Design reworks for Boeing B787 aircraft on
its assembly line have delayed its market launch by almost 14 months [29] and increased
Boeing’s research and development spending to almost three billion dollars to keep the
program on track [106]. Such negative effects have a big impact on manufacturers’ image
and their market competitiveness.
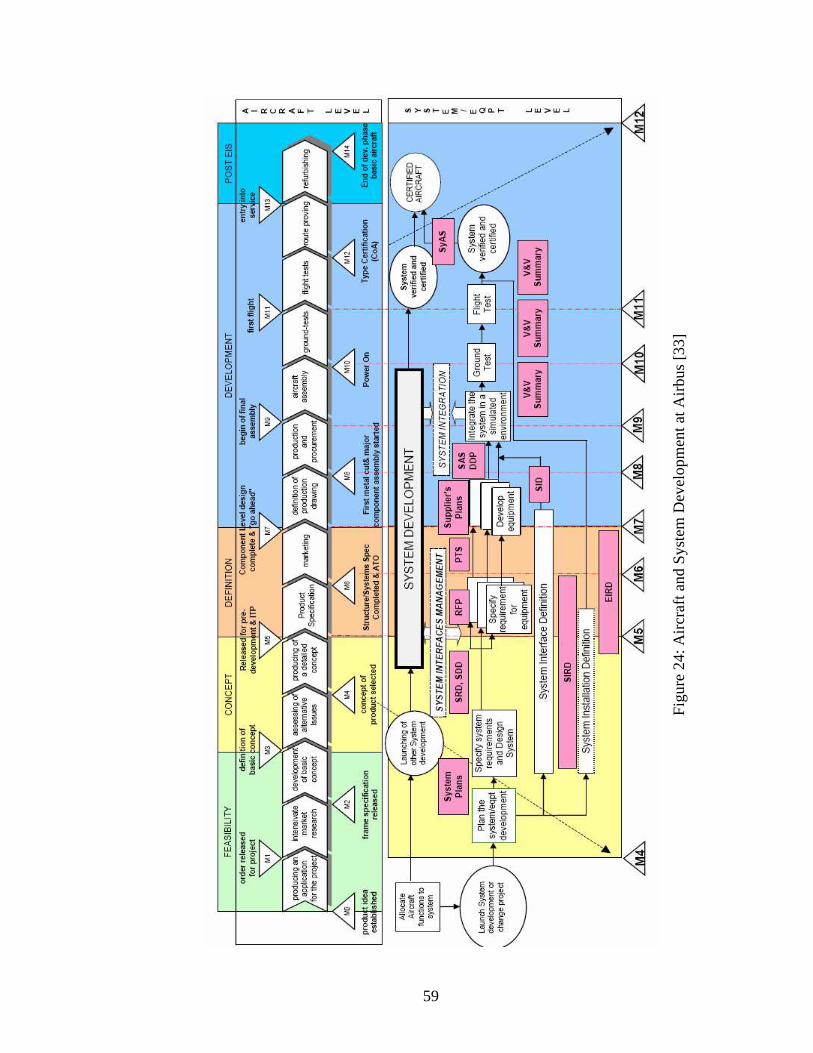
59
Fig
ure
24: A
ircra
ft an
d S
yste
m D
evel
opm
ent a
t Airb
us
[33]
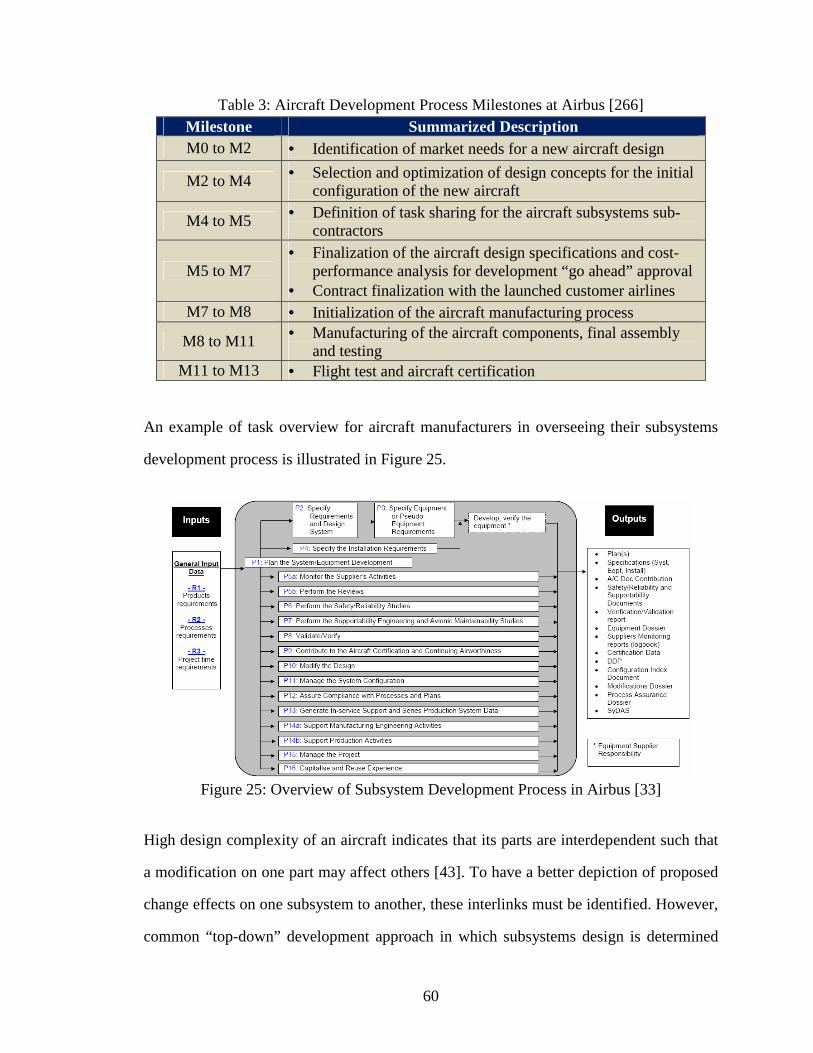
60
Table 3: Aircraft Development Process Milestones at Airbus [266] Milestone Summarized Description M0 to M2 • Identification of market needs for a new aircraft design
M2 to M4 • Selection and optimization of design concepts for the initial configuration of the new aircraft
M4 to M5 • Definition of task sharing for the aircraft subsystems sub-contractors
M5 to M7 • Finalization of the aircraft design specifications and cost-
performance analysis for development “go ahead” approval • Contract finalization with the launched customer airlines
M7 to M8 • Initialization of the aircraft manufacturing process
M8 to M11 • Manufacturing of the aircraft components, final assembly and testing
M11 to M13 • Flight test and aircraft certification An example of task overview for aircraft manufacturers in overseeing their subsystems
development process is illustrated in Figure 25.
Figure 25: Overview of Subsystem Development Process in Airbus [33]
High design complexity of an aircraft indicates that its parts are interdependent such that
a modification on one part may affect others [43]. To have a better depiction of proposed
change effects on one subsystem to another, these interlinks must be identified. However,
common “top-down” development approach in which subsystems design is determined
61
by target aircraft performances often ignores any feedbacks to system level and hence to
other subsystems [229]. During initial conceptual design, subsystems are assumed to be
able to accomplish any operational requirements that are imposed on them by decisions
made at aircraft system level without creating new constraints themselves [229, 262] but
no such guarantee exists. There is a clear danger that decisions are made solely based on
top system level metrics [181] and mismatches between subsystems will induce several
reworks in later development stages. For instance, if the redesigned aircraft subsystems
are aimed to be more electrical-based, then higher-capacity electrical generators may be
required. However, installation of these generators may require a bigger volumetric space
than initially prescribed, which imposes modification to airframe structure. Traditionally,
system designers only hope that additive effects of subsystems integration will not affect
overall aircraft requirements and performance goals, and falls within design tolerances
that are incorporated in initial design specifications [63]. However, as reported in many
product development projects, there are “many stories on how a seemingly innocuous
change blossomed into a series of costly impacts” [264].
Unlike original aircraft development that is started from scratch, aircraft redesign process
has the luxury of more detailed information available on its baseline design specification.
Instead of just hoping for everything to fall into places, aircraft system designers can use
this knowledge to track and estimate change impacts earlier in the process or to predict
possible reworks due to their redesign plan. Subsystems interdependencies require that
any proposed redesign plans to consider them simultaneously to avoid a “redesign chain
reaction” [243]. Proper understanding of feedback and cross-subsystem constraints can
prevent costly changes late in the design process and provide guidance in the evaluation
of architecture alternatives [229].

62
2.2.2 A Better Aircraft Redesign Planning
So far, it has been argued that problems with engineering changes during aircraft redesign
process can be attributed to lack of consideration for interrelationships that exist between
its different subsystems. With as many as two millions parts in each aircraft design, their
coordination could not be any more important [253]. Based on an empirical case study of
Trent 800 aircraft engine at Rolls Royce, systemic nature of interactions between its sub-
components has been shown to complicate overall aircraft design process. Instead of just
“ requirements pass down”, development of this subsystem imposes “definitions pass up”
flow that can possibly lead to a few large-scale system redesigns [243]. This underlines
the needs for sufficient knowledge regarding baseline subsystems interconnection before
proposing any design changes to it.
To further emphasize this matter, observations made in Westland Helicopters, the world
leader in rotorcraft design, are listed as follow [79]:
• Designers often fail to realize how their design decisions will affect others
• Several knock-on changes occur during redesign process, resulting in changes
typically no more than 4 steps removed from the initial change
• Estimates of total unexpected changes ranged from 5% to 50% of total amount
of modifications made in each redesign case
Without any change management aids, the responsibility is left on designers to manually
plan product redesigns. In most companies, this often translates into tremendous reliance
on senior design staffs to remember all past changes and to be able to mentally track them
quickly when required [176]. Under market environment today, demands and pressures
on designers to reduce lead times and to avoid costly revision are considerably increased
[47, 304]. In many observed cases, they often fail to recognize the complete insinuations
of their proposed changes, particularly in cases of complex products [38, 142]. Typical
63
aircraft system has tens of thousands different parts that support hundreds of its diverse
functions and they are integrated in various ways that create millions of potential change
critical interconnections [185]. It is rather impossible to thoroughly understand such high
system complexity and manually identify full engineering change effects on its elements,
which are difficult to envisage once they cross boundaries between various subsystems
[247]. In addition, it is rare for designers to have detailed knowledge about the complete
product apart from the portion that they are responsible of [115]. This ultimately leads to
situations where change process is executed without proper planning of their complete
impacts [120, 259].
Aircraft redesign process can greatly benefit from the consolidation and reuse of design
knowledge of its baseline [38]. This is acknowledged in the development of Memory for
Initial Design of Aircraft Subsystems (MIDAS) tool, which is intended to support design
process of utility subsystems during early aircraft development [105]. Though no further
indication is available in the literature to suggest that this tool has been completed for full
aircraft system design application; its concept supports that subsystems interconnections
play a big role in aircraft redesign. Overall, observations of redesign challenges in aircraft
manufacturing with regards to the potential areas of improvements identified in previous
chapter are listed in Table 4.
It can be concluded that current aircraft redesign process shares similar lack of emphasis
and strategy regarding management of engineering changes with other product industries.
Although redesigning an existing product is usually perceived as a less challenging effort
than developing an original product design, its outcome is no less important in securing
market competitiveness for manufacturers. In environment of massive product adaptation
today, it is very beneficial for manufacturers to have a viable redesign strategy that can be
improved through design process researches [70]. Traditional methods of prevention and

64
early prediction of design engineering changes are not enough to provide the best market
competitiveness for manufacturers. Instead, their application needs to be augmented with
an efficient change implementation strategy [264]. Next section discusses development of
the proposed aircraft redesign method.
Table 4: Challenges of Engineering Changes in Aircraft Derivative Development
Area of Improvement Observation in Aircraft Industry
A good baseline for product redesign has high-quality change characteristics with
respect to the proposed modification
Common choice of aircraft baseline is made based on closest performances to
target requirements and no serious consideration is made regarding its
change effectiveness
A strategic redesign planning process helps manufacturers to gain offered
change benefits without the penalty of its effects
Engineering changes encountered in aircraft development are often treated in “as necessary” manner and as a result, their effects have been mostly negative
Change support methods and tools should be equipped with capabilities to guide
designers in making the strategically best change implementation decision
Most change management methods and tools that have been used in aircraft
development process are more focused on data networking between various business partners but no redesign decision-making
support is offered
2.3 Building a Methodology
The first step in constructing the proposed strategic aircraft redesign method is to identify
available methods and tools that, when modified or used together, can effectively form
the foundation for a better method. Based on state-of-the-art capabilities and potential
areas of improvement recognized from previous observations in aircraft manufacturing
industries, the application gaps between current methods and research objectives for this
thesis study can be identified. This knowledge guides the formulation of steps for a better
aircraft redesign process.

65
Research objectives outlined in previous chapter indicate that resultant change proposals
from the proposed methodology should not only contain a good redesign plan but they
also have to be planned in a way that suits the requirements of formal change process in
the company. Therefore, this initial review is focused on extracting the main essences of
process workflow in available product redesign and change management frameworks.
Methods that are identified and discussed here are listed as follows:
1. Collaborative Management of Engineering Changes (CM-EC)
2. Parameter-based Engineering Change Management
3. Change Process Planning
4. Reverse Engineering and Redesign Methodology
5. “Anchoring and Adjustment” Redesign Strategy
6. “Design for Assembly”-based Product Redesign Approach
2.3.1 Collaborative Management of Engineering Changes (CM-EC)
For complex products such as aircraft, the goodness of their documentation is associated
with that of adopted configuration management system by their manufacturers. In view of
this situation for aircraft development process, Riviere proposed a methodology known as
Collaborative Management of Engineering Changes (CM-EC) that effectively combines
product configuration management and engineering change management processes [266].
However, instead of developing new change methods or tools to enhance its management
process, this framework is more focused on improving global performance of the aircraft
development process [267]. Its emphasis is on efficient data communication between all
business partners, which is one of the key determinants for success or failure in a product
development project [218]. In other words, its primary goal is to construct a cooperative
environment for engineering change management process where everyone involved can
access updated product information, share results, and use incorporated change analysis

66
methods or tools to investigate change impacts and derive product change solution [268].
By accomplishing this, manufacturers’ responsiveness in processing their product change
requests is enhanced and its implementation process can be executed more efficiently by
providing full control to configuration managers.
CM-EC process framework is shown in Figure 26, which is constructed based on studies
in automotive and aeronautics industries. It is divided into three stages: change proposal,
change investigation and change embodiment. The application of the proposed method in
this thesis study fits into the change proposal step where change pre-feasibility studies are
done for implementation planning analysis.
Engineering Change
Requests
Stage 1: Engineering
Change ProposalEngineering Change Initialization
Engineering Change Pre-Feasibility Studies
Engineering Change Impacts and Feasibility Studies
ECR Initialized
Engineering Change Proposal
Selection and Solution Definition
Potential Solution Defined
Stage 2: Engineering
Change Investigation
Associated Documentation Updates
Solution to be Implemented and Potential Impacts Assessed ECO Released
New Solution Notification
Documentation Updated
New Solution Embodiment
New Solution NotifiedSolution Implemented
and Notified, and Documentation Updated
Stage 3: Engineering
Change Embodiment
Figure 26: Collaborative Management of Engineering Changes [267]

67
An aspect of this framework that can be used to improve general change process is its
proposed typology of interconnectivities to track potential change propagation, which is
listed as follows [268]:
• Association links –progression of components’ description throughout
different stages of product lifecycle
• Interface links – closeness of two components in a product system such as
their positioning, geometry and assembly process
• Dimensioning links – component property that affects definition of another
such as how pipe design diameter is influenced by pump delivery rate
• Organization links – works shared by different business partners in product
development process
To summarize, CM-EC framework is aimed to improve the efficiency of redesign process
execution by creating a collaborative environment where change process can be executed
with better data exchange and control. However, its application is tailored to conventional
change strategies such as change front-loading and prevention that limits the inclusion of
strategic planning for change implementation [267]. Its analysis measures also provide no
insight on how the change process is best approached apart from evaluating its execution
efficiency. While its suggested typology of interconnectivities covers aspects of product
and process that can be affected by accommodation of engineering changes, no method or
tool to improve and support the analysis is detailed out. Change impact analysis process
within this framework is restricted by capabilities of existing PLM or PDM systems and
experiences of product engineers, which lacks guidance for its decision-making process
regarding change implementation [120, 199]. CM-EC also does not support simultaneous
change propagation analysis [265]. On the whole, the main advantages and disadvantages
of this method based on research objectives are listed in Table 5.

68
Table 5: Advantages and Disadvantages of CM-EC Advantages Disadvantages
• Improve overall efficiency of change
management process execution through better product data exchanges
• Assist prediction of change propagation paths through suggested typology of interconnectivities
• Lack emphasis on improving
redesign planning process • Lack emphasis on improving and
supporting change impact analysis • Do not support baseline assessment • Do not support simultaneous changes
planning
2.3.2 Parameter-based Engineering Change Management
Rouibah and Caskey proposed a collaborative change management framework known as
Parameter-based Engineering Change Management. Unlike CM-EC, this method is more
focused on product change management instead of overall process efficiency. The main
aspect of this framework is its product design parameter, which is defined as a particular
circumstance of design variable in a given engineering situation [270]. It can be used to
describe the dimensions of product components as well as their forces and movements. In
reference to typology of interconnectivities in CM-EC, this parameter is a combination of
interface and dimensioning links. Since most decisions in a collaborative design process
are usually made at this parameter level, it becomes the best platform for cross-company
communication and linking of processes, people and product items [270].
The outline of this method is depicted in Figure 27. In short, it starts with identification of
required product changes that are mapped to their affected product parameters. Based on
defined parameter interrelation or network information, other affected parameters through
propagated change effects can be traced. These parameters are referred to their physical
components and documentation, and all personnel and sub-contractors who are involved

69
in the product changes implementation are identified based on this information. Detailed
description on how to derive the parameter network is explained in [270].
Definition of
Required Design Changes
Identification of Parameters to be Changed
Identification of All Change
Impacts
Audits of Affected
Parameters
Record for Future
References
Definition of Required Design
Changes
Identification of Parameters to be Changed
Identification of All Change
Impacts
Audits of Affected
Parameters
Record for Future
References Figure 27: Parameter-based Engineering Change Management [270]
This collaborative, multi-company change management framework is developed based on
concurrent engineering concept. It emphasizes on communication supports, collaborative
involvement in change process, consensus in design decisions and management of change
impacts [265, 270]. The latter criterion is the main driver behind parameter-based change
propagation technique in this method. While it helps to distinguish possible propagation
paths of the initial change effects, the overall process relies heavily on the experiences of
decision makers and lacks strategic redesign decision-making support. Decision is made
based on parameter values that depend on a compromise between various users, which is
subject to biasness of their expertise or past experiences [265]. Furthermore, the inclusion
of product attributes or parameters is totally dependent on user judgment and this creates
modeling problems for complex product systems [265]. There has to be a proper scheme
to balance the product model and the efficiency of its change process. Overall, the main
advantages and disadvantages of this method based on research objectives are tabulated
in Table 6.
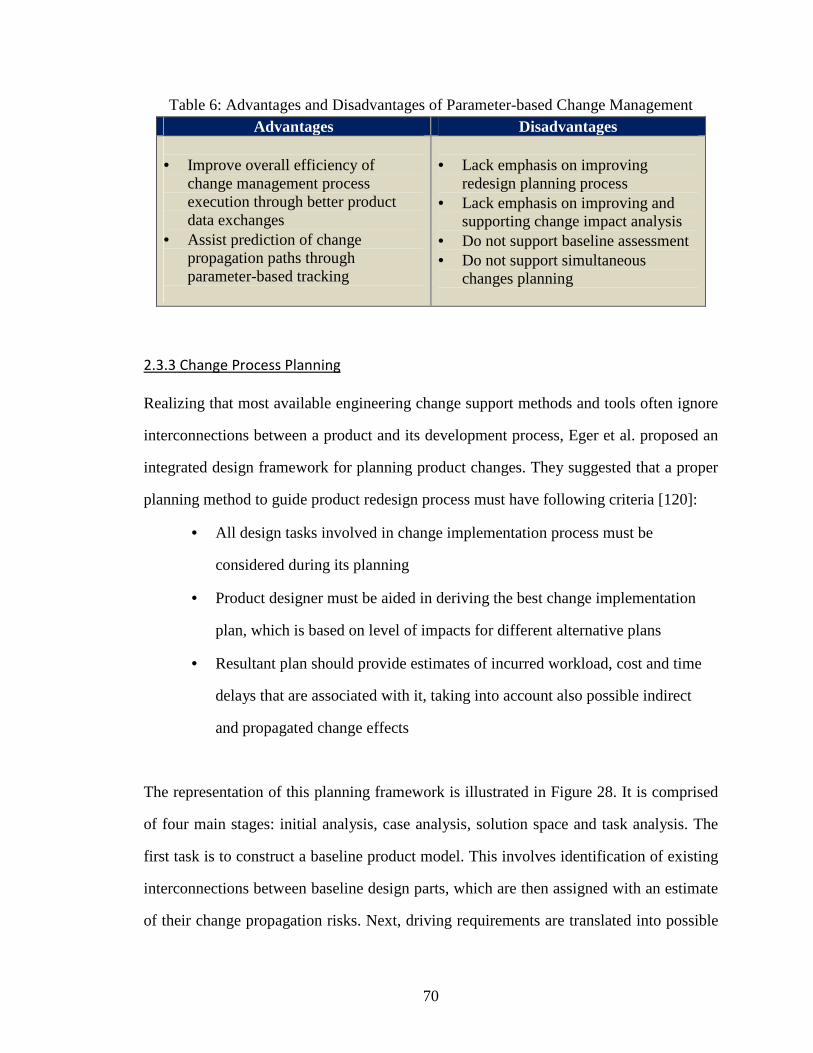
70
Table 6: Advantages and Disadvantages of Parameter-based Change Management Advantages Disadvantages
• Improve overall efficiency of
change management process execution through better product data exchanges
• Assist prediction of change propagation paths through parameter-based tracking
• Lack emphasis on improving
redesign planning process • Lack emphasis on improving and
supporting change impact analysis • Do not support baseline assessment • Do not support simultaneous
changes planning
2.3.3 Change Process Planning
Realizing that most available engineering change support methods and tools often ignore
interconnections between a product and its development process, Eger et al. proposed an
integrated design framework for planning product changes. They suggested that a proper
planning method to guide product redesign process must have following criteria [120]:
• All design tasks involved in change implementation process must be
considered during its planning
• Product designer must be aided in deriving the best change implementation
plan, which is based on level of impacts for different alternative plans
• Resultant plan should provide estimates of incurred workload, cost and time
delays that are associated with it, taking into account also possible indirect
and propagated change effects
The representation of this planning framework is illustrated in Figure 28. It is comprised
of four main stages: initial analysis, case analysis, solution space and task analysis. The
first task is to construct a baseline product model. This involves identification of existing
interconnections between baseline design parts, which are then assigned with an estimate
of their change propagation risks. Next, driving requirements are translated into possible

71
product modifications to satisfy them. Using information in the product model, the list of
alternatives is screened out according to change propagation risks from directly affected
parts. The decision to keep or discard implementation plan options depends on designer’s
experience but the provided mapping of interconnections should be able to assist them in
identifying possible propagation paths that they might otherwise overlook. This is helpful
when dealing with very complex architectures. Finally, implementation tasks outline for
each change alternative plan is generated and the best redesign plan is chosen according
to their associated risks.
Figure 28: General Change Process Planning [120]
Though this process framework is well-structured to aid designers in planning for change
implementation, methods and tools to be applied for each of its steps are still essentially
under development [120]. Development of this framework is heavily tailored to Change
Prediction Method (CPM) [273], which is discussed in next chapter. Due to its infancy
state, some aspects of this framework need further refinements to improve its capability.
For its case analysis in particular, a high reliance is placed on designer’s experiences to
accept or discard prospective change implementation plans. This is one of the identified
problems for current change methods and tools. Even though it eases designer’s task by

72
identifying potential change effects, there is still a need for guidance in making change
implementation decision because designers often have incomplete knowledge about their
overall product system [80, 115]. Therefore, their decisions are biased towards what they
know instead of the overall best. Provision of a proper reference can avoid inefficient or
improper decisions for change alternative planning.
Furthermore, while the main idea behind the pursuit of this method recognizes the effects
of engineering changes on product design, there seems to be no formal consideration on
its performance impacts. This is another lacking aspect of current change methods and
tools, which focus on process management issues but disregard the effects on redesigned
product’s capabilities [116]. In addition to the knowledge of which components that have
to be modified and the processes to realize them, change effects on product performances
are an important consideration as they dictate its ability to accomplish both its new and
existing operational requirements [176]. The omission of a formal emphasis on this can
be seen as the main deficiency of this method that needs to be resolved. On the whole, the
main advantages and disadvantages of this method based on outlined research objectives
are tabulated in Table 7.
Table 7: Advantages and Disadvantages of Change Planning Process
Advantages Disadvantages
• Provide a structured workflow for redesign planning process
• Provide a structured means to track change propagation and analyze its impacts on product development process
• Lack emphasis on strategic redesign
decision-making • Lack emphasis on change impact
analysis regarding product performances
• Do not support baseline assessment • Do not support simultaneous
changes planning

73
2.3.4 Reverse Engineering and Redesign Methodology
From main perspective of redesign practice, baseline product information offers a good
basis to decide on potential path of its evolution, either it should be approached from its
configuration, subsystem, component or parametric level [249]. This is useful for change
decision-making procedure, particularly in planning and analyzing change impacts on a
product and its process. A general design method for reverse engineering and product
redesign is proposed by Otto and Wood [248], which is depicted in Figure 29.
Investigation, Prediction
& Hypothesis
Product Functions & Forms
Design Analysis
Parametric Redesign Adaptive Redesign Original Redesign
Design Models
Reverse Engineering
Modeling & Analysis
Redesign
Investigation, Prediction & Hypothesis
Product Functions & Forms
Design Analysis
Parametric Redesign Adaptive Redesign Original Redesign
Design Models
Reverse Engineering
Modeling & Analysis
Redesign
Figure 29: Reverse Engineering and Redesign Methodology [248]
This method highlights the fundamental steps to understand and represent a product prior
to its redesign consideration [249]. It consists of three major phases: reverse engineering,
modeling and analysis, and redesign. Although modeling approaches for product system
often involve construction of mathematical-based or physic-based relationships, they are
not always applicable or relevant for redesign process. This condition is indicated by the
dashed line in Figure 29. In redesign planning for adaptive and original product variants,
it requires qualitative knowledge about product composition to identify affected parts or
subsystems. Mathematical-based relationships are typically used for parametric redesign,
where existing product design is modified based on its optimization process.

74
This redesign framework offers a structured approach to guide designers in planning for
their product variants, which is highly favored over ad-hoc approaches within educational
and industry settings [68]. Application of reverse engineering process to extract necessary
information about baseline product underlines the importance to have an accurate product
system representation while making redesign decisions. However, it can be implied that
execution of this method on complex products demands costly physical experiments and
takes a long time to be completed. To obtain required information for creating baseline
product model, this method requires the actual product to be disassembled and analyzed.
In addition, baseline parametric model is developed through a manual “trial-and-error”
process known as Subtract-and-Operate (SOP) [200, 249]. The high extent of manual
processes in this method makes it unsuitable for complex product systems [247]. There is
also no mention of a strategy to handle engineering changes during redesign process. This
is a common paucity of available product redesign methodologies, which typically treat
required modifications as a straight-forward design implementation problem.
All in all, the main advantages and disadvantages of this methodology based on outlined
research objectives are tabulated in Table 8.
Table 8: Advantages and Disadvantages of Reverse Engineering & Redesign Method
Advantages Disadvantages
• Provide basic workflow for redesign process
• Support change impact analysis on product performances through manual experimentation
• Lack emphasis on strategic redesign
planning • Lack emphasis on change
propagation analysis • Do not support baseline assessment • Do not support simultaneous
changes planning

75
2.3.5 “Anchoring and Adjustment” Redesign Process
Dixon and Colton suggested that many product redesign cases have been executed in an
ad-hoc manner because no universal guidance is available to designers [104]. Based on
their “anchoring and adjustment” process model, they proposed a redesign management
strategy that was aimed to understand and manage the manner designers approach their
product redesign problems [68]. In general, it is developed to capture the common human
reasoning and judgment heuristics that dictates the way existing product is redesigned for
new requirements. The “anchoring and adjustment” heuristic relates to the approximation
of redesign solution based on closely similar problem that has already been solved in the
past [104]. The illustration of this redesign strategy is shown in Figure 30.
Develop Problem
Statement based on
Customer Needs
Assemble “Anchor”
Define “deltaSpecs”
[target specification –
current performance]
Check
“deltaSpecs”
Calculate and Check
“jump metrics”
Select Level of
Adjustment from Plan
Adjust Solution
Update “deltaSpecs”
Detail the Derived Solution
NO
YES
Figure 30: “Anchoring and Adjustment” Redesign Process [104]
In short, the process starts with identification of design change needs. Next, an “anchor”
is selected to approximate the redesign solution based on its proximity to the real problem
in hand. Alternatively said, the “anchor” is an already resolved design problem in the past
that has similar characteristics to the current problem. An evaluation metric, “deltaSpecs”
is defined to measure relative improvements made on the estimated solution towards the
perceived actual solution. Adjustment to the solution is made iteratively and the value of
“deltaSpecs” is re-calculated. Another metric, “jump metric” is defined to determine if a

76
big “jump” in change or adjustment level is necessary when no significant improvement
to the value of “deltaSpecs” is recorded. This process is continued until the “deltaSpecs”
value is 0 or falls within a specified tolerance range, or when the value of “jump metric”
exceeds the prescribed stopping criterion.
The selection of appropriate “anchor” mimics the emphasis on choice of baseline design.
While this method provides a clear workflow for product redesign approach, designers
still have to manually generate the adjustment plans. Therefore, the success or failure of
the redesign development highly depends on their capability to create appropriate change
plans based on their experiences [68]. This situation does not improve the pressure that
designers currently have to endure in planning for their product redesign or aid them from
making errors in their decision-making. Furthermore, application of this method seems to
be designated for one modification per run by focusing on one target performance metric.
As argued before, there are often multiple initial changes that need to be simultaneously
considered in real product development cases because their impacts are interrelated.
In summary, the advantages and disadvantages of this redesign method based on research
objectives are tabulated in Table 9.
Table 9: Advantages and Disadvantages of “Anchoring & Adjustment” Redesign
Advantages Disadvantages
• Provide a structured redesign process based on target specification
• Support impact analysis on a pre-determined target metric
• Lack emphasis on strategic change
planning • Do not support change propagation
analysis • Lack detailed emphasis on change
impact analysis • Do not support simultaneous
changes planning • Do not support baseline assessment

77
2.3.6 “Design for Assembly”-based Product Redesign Approach (DBPRA)
Design for assembly (DFA) methodologies are well-recognized in product manufacturing
industries, which are developed to bring forward issues regarding assembly operations to
early product design stages [150]. Despite proven benefits of DFA methods in increasing
manufacturer’s competitiveness by reducing part-count, simplifying product structure and
improving reliability of their new original design development; little attention has been
made to apply its scheme to product redesign case [163]. Realizing the potential from this
overlooked viewpoint, Hsu and Lin proposed a product redesign method that essentially
combines functional analysis and design for assembly (DFA) assessment. The method is
called design for assembly-based product redesign approach (DBPRA), which is shown
in Figure 31.
Identify Constraints
Identify Problems
Identify Affected
Functional Areas
Identify Design
Interrelationships
Select the Highest
Ranked Affected
Functional Area
Modify Product to
Solve Problem
Select the Next
Ranked Affected
Functional Area
Finished
Modifying All
Functional
Areas?
Modify Product to
Solve Remaining
Problem
New Design
Acceptable?
Detail Redesign Plan
NO
YESNO
YES
Figure 31: Redesign Procedure in DBPRA [163]
The process starts when market requirements impose a modification on existing product
design. Based on that, potential assembly problems that could result from the change are
78
identified. Next, necessary constraints and redesign targets are outlined to govern design
solutions. The existing product is analyzed through functional analysis and all functional
areas that are affected by redesign process are identified. After that, the product design is
further examined to extract all physical relationships that exist between its parts such as
its underlying interface networks. Once this is determined, the redesign process is ready
to be executed. Functional area that is affected the most is selected first and necessary
product design changes to resolve it are derived. Next, the second-ranked functional area
is considered and resolved, and this cycle is continued until all affected functional areas
have been resolved. Remaining redesign problems after that, which are not related to any
product functional areas, are later considered and solved. Finally, the modified product is
assessed to see whether all problems have been resolved. If not, the process is reiterated
until there is no redesign problem left.
This methodology introduces a structured workflow on how a redesign problem could be
approached. Its application assists product designers in identifying promising adaptation
plans for “local changes” (component parametric changes) and “global changes” (system
level functions) [163]. Another aspect that is highlighted by this method is the ranking of
initial changes to be executed. Since different requirements can affect similar components
in conflicting manner, the ranking will determine which of them has a priority over the
others. Nonetheless, its high dependence on DFA scheme constricts the identified change
problems to only assembly-related issues [68]. In this method, change problems have to
be translated into their potential assembly-related issue, which reduces the transparency
of the problem and increases the potential to overlook interrelationship between initiating
change problems. Furthermore, the core assumption of functional independence between
product’s functional areas can overlook many interrelated change effects that should have
been simultaneously considered during product redesign planning.

79
All in all, the advantages and disadvantages of this redesign method based on research
objectives are tabulated in Table 10.
Table 10: Advantages and Disadvantages of DBPRA
Advantages Disadvantages
• Provide a structured workflow for redesign process
• Manual support of change impact determination through functional analysis
• Lack emphasis on strategic redesign
planning • Lack emphasis on change
propagation or impact analysis • Do not support simultaneous
changes planning • Do not support baseline assessment
2.3.7 Comparison of Identified Methods to Research Objectives
From above discussions, available product redesign and change management frameworks
do address parts of the outlined research objectives. While none of them independently
provides a detailed solution for identified research areas in this study, their good process
characteristics can be combined to form a better platform for the new proposed method. It
can be observed that the main reason for this condition is the inherent separation of their
application, whereby none of the identified product redesign methods considers change
management in their procedure and vice versa. This is in spite of the fact that there exists
a close relationship between these two areas of product development, which solidifies the
relevance of this thesis study to current product industry practices.
The advantages and disadvantages of all identified methods are summed up in a Strength,
Weakness, Opportunity and Threat (SWOT) plot depicted in Figure 32. In short, SWOT
is an analytical method that is used to formulate new strategy by qualitatively evaluates
the competitiveness of current one [195]. Its appreciation of strengths and weaknesses, as
well as external market opportunities and threats, is highly beneficial to strategically plan

80
for preferred performance targets in relative to the competition [162]. In this assessment,
identified product redesign and change management process frameworks are collectively
reviewed and interpretation of their combined SWOT plot is slightly modified as follows.
First quadrant shows their combined strengths that offer market opportunities to product
manufacturers. On the other hand, their weaknesses that can provide market opportunities
if strengthened are listed in second quadrant. Finally, desired process characteristics from
outlined research objectives that are lacking in all identified frameworks are highlighted
in joint third-and-fourth quadrant. These missing criteria have been argued to potentially
threaten manufacturers’ market competitiveness with regards to the effectiveness of their
redesign process.
Figure 32: SWOT Plot for Identified Engineering Change Frameworks
Product data management process has progressively improved over the last few years and
is the sole identified strength from this review. This is in line with previous findings that
available change support tools have been mostly focused on smoothing data sharing and
networking in redesign process. This strength of current methods can be readily exploited
by the proposed method, as highlighted by quadrant I. On the other hand, criteria listed in
quadrants II and III & IV highlight shortcomings of identified frameworks with respect to
research objectives. They can be classified into four main areas of concentration for the
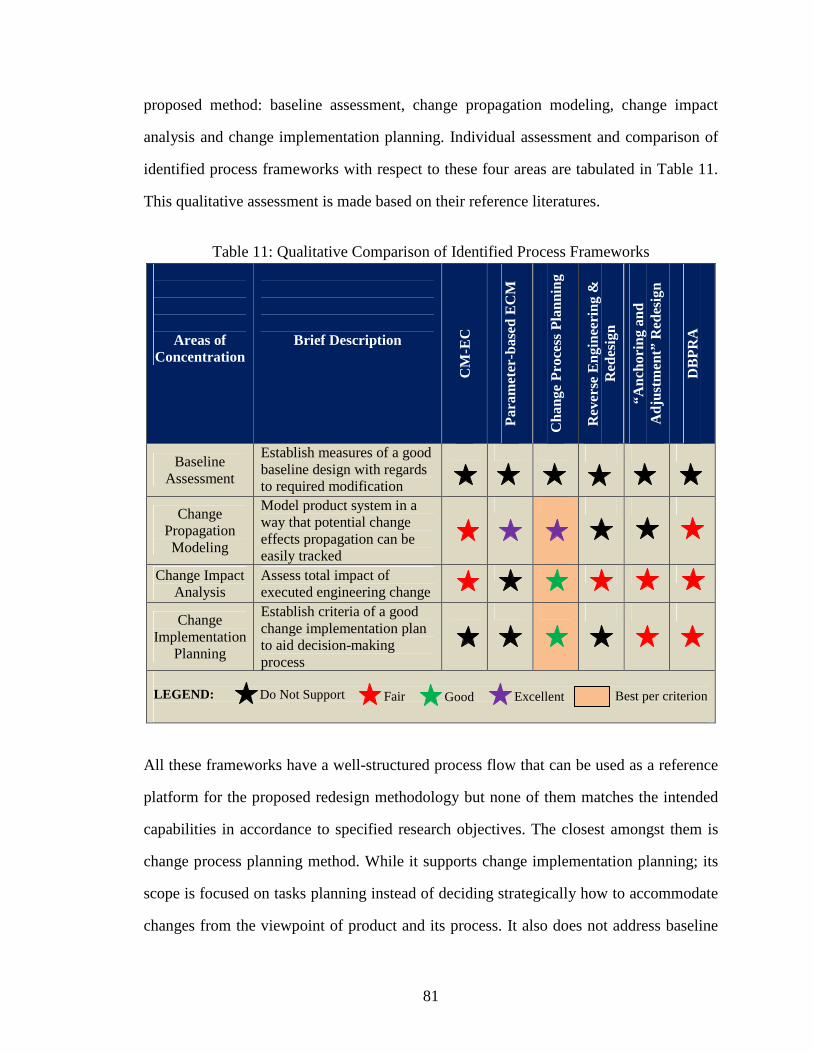
81
proposed method: baseline assessment, change propagation modeling, change impact
analysis and change implementation planning. Individual assessment and comparison of
identified process frameworks with respect to these four areas are tabulated in Table 11.
This qualitative assessment is made based on their reference literatures.
Table 11: Qualitative Comparison of Identified Process Frameworks
Areas of Concentration
Brief Description
CM
-EC
Par
amet
er-b
ased
EC
M
Cha
nge
Pro
cess
Pla
nnin
g
Rev
erse
Eng
inee
ring
&
Red
esig
n
“Anc
horin
g an
d A
djus
tmen
t” R
edes
ign
DB
PR
A
Baseline Assessment
Establish measures of a good baseline design with regards to required modification
Change Propagation Modeling
Model product system in a way that potential change effects propagation can be easily tracked
Change Impact Analysis
Assess total impact of executed engineering change
Change Implementation
Planning
Establish criteria of a good change implementation plan to aid decision-making process
LEGEND:
All these frameworks have a well-structured process flow that can be used as a reference
platform for the proposed redesign methodology but none of them matches the intended
capabilities in accordance to specified research objectives. The closest amongst them is
change process planning method. While it supports change implementation planning; its
scope is focused on tasks planning instead of deciding strategically how to accommodate
changes from the viewpoint of product and its process. It also does not address baseline
Do Not Support Fair Good Excellent Best per criterion

82
redesign suitability, which is crucial to justify the decision to redesign a product against
developing a new original design. In fact, none of identified change frameworks provides
a formal support to assess baseline suitability. A few baseline candidates are available in
many cases of product derivative development and their choice will influence the success
of the redesign development. A bad baseline choice will complicate the redesign process;
contributing to high costs and long development time.
Since the proposed aircraft redesign method is expected to overcome these shortcomings,
several research questions have been formulated for their clarification and they are listed
as follow.
1. How to assess whether the redesign risks associated with selected baseline aircraft
are manageable?
I. What are characteristics of a good baseline for aircraft redesign approach?
II. How these characteristics affect the change process?
2. How to efficiently capture potential change effects propagation within an aircraft
system?
I. How engineering change effects propagate from one architecture locality
to another?
II. What are control parameters of change propagation?
III. How to properly model aircraft system to predict change propagation?
3. How to assess impact of engineering changes on aircraft and its development
process?
I. What are characteristics of aircraft and its development process that can be
affected by engineering changes?
II. How to sufficiently measure change impacts on these characteristics?
III. How to manage overall aircraft redesign risks?

83
4. How to competitively plan for required engineering change implementation into
existing aircraft system?
I. What are important criteria for a good change implementation plan?
II. What are available control parameters in change planning?
III. How to generate implementation plan for required changes?
IV. How to select the best change implementation plan among possible
alternatives?
These questions guide literature review in next chapter and become the foundation for the
proposed redesign method, which is called “Strategic Planning of Engineering Changes”
(SPEC).
2.3.8 Strategic Planning of Engineering Changes (SPEC) Framework
With respect to observation made in aircraft derivative development process and research
questions that emerge in previous section, their association with the steps of the proposed
method is shown in Figure 33.
Sequence of steps for the proposed SPEC method is illustrated in Figure 34. In brief, the
main inputs for the methodology come from requirements analysis, PDM or PLM system
and preliminary candidate(s) for the baseline design. Having all these inputs, the first step
is to model considered baseline candidates in such a way that change effects propagation
can be efficiently predicted. Next, the model is applied to assess baseline suitability with
regards to required modifications that have been established from requirements analysis,
which is not part of this method. This baseline assessment stage could also be a selection
step if multiple baseline candidates are preliminarily considered. If the baseline is valued
to be flexible enough for redesign development, possible change implementation plans

84
are generated. These plans are passed on to change impact analysis step, where the effects
of their proposed modification on both product and its process are estimated. Based on
this analysis results, the change proposal options are ranked with respect to some defined
evaluation criteria. This method concludes with selection of the best engineering change
implementation plan, which becomes an input into formal change management process in
the company.
Figure 33: Relationships of Observations, Research Questions and Proposed Method

85
Fig
ure
34: P
ropo
sed
Fra
mew
ork
for
SP
EC
Met
hod

86
The process framework in Figure 34 is not yet complete and several high-level research
questions regarding its overall workflow need to be addressed by literature review in next
chapter. These questions are listed as follow:
1. What are detailed inputs and outputs for each step in the framework?
2. What are specific techniques and tools required to accomplish each step?
3. Is any iteration process necessary within the framework?
2.4 Chapter Summary
It has been discussed throughout this chapter the big role that derivative development has
in aircraft manufacturing industry. This redesign strategy is frequently applied by aircraft
manufacturers to maintain their competitiveness amid increased market competition and
to satisfy emerging trend of customized demands from airlines. Complexity of aircraft
design and collaborative nature of its development translate into a complicated redesign
process, which makes it an exemplary case to demonstrate the proposed SPEC method.
Without proper assistance from available engineering change methods and tools, aircraft
engineers have to manually plan derivative redesign based on their previous experiences.
They tend to follow notions from available design methods that have been developed for
original development [104] and this often leads to overlooked change effects that have to
be unexpectedly handled during late phases of the development process. For high risk and
high cost products like aircraft, these late changes are detrimental to their manufacturers’
competitiveness and market image. Potential benefits of a structured change management
in product redesign process have been preliminarily demonstrated by several concurrent
engineering methods and tools. Dassault Aviation reported a reduction of design cost and
production time by almost 50% for Falcon 7x aircraft development in comparison to their
normal rate by supporting the process with a better collaborative workspace environment

87
[50]. It has been argued that more advantages can be gained by manufacturers if elements
of strategic redesign planning are also included in the capabilities of change methods and
tools, on top of their current focus to increase the efficiency of process execution.
Several redesign and change management process frameworks that are currently available
have been preliminarily assessed to identify potential improvements based on observation
in these first two chapters. Although none of them possesses all desired capabilities, their
assessment helps to recognize current gaps that need to be focused in the formulation of
the proposed method. One highlight from this review is the traditional separation between
methods for product redesign and engineering change management, even though they are
closely related in securing product market success. It is believed their combination into a
single methodology can greatly benefit aircraft manufacturers in their redesign process.
Based on the knowledge gained so far, initial formulation of steps for the proposed SPEC
method has been constructed. The outlined research questions are used to guide literature
review study presented in next chapter.

88
CHAPTER 3
LITERATURE REVIEW
“ It is neither desirable nor realistic to focus one’s effort on
simply eliminating the engineering changes.”
- Clark and Fujimoto (1991)
In the big picture, the proposed SPEC methodology fundamentally combines the aspects
of product redesign, change management and strategic change implementation planning
processes. A case is made in this chapter that even though none of the existing works deal
directly with the focused problem for this thesis study, there are some areas that they can
contribute in the formulation of the proposed method. The two main goals of this chapter
are to identify the positive and negative aspects of available methods and tools, and to
assess their relative performance gaps to the specified research objectives in Chapter 1.
This provides the basis and further justification to the research hypotheses to be defined
in next chapter.
This literature review is tailored to four main research areas that have been established in
preceding chapter: baseline assessment, change propagation modeling, change impact
analysis and change implementation planning. Some of the available state-of-the-art tools
that can address the recognized problems in these areas of study and how their knowledge
can improve the current change management frameworks are identified. The shortlist of
identified methods and tools is presented in Table 12, and they are discussed in details
within this chapter. Although there are other identified methods and tools in this literature
study, only the major ones that contribute towards the formulation of the proposed SPEC
method are included and discussed here.
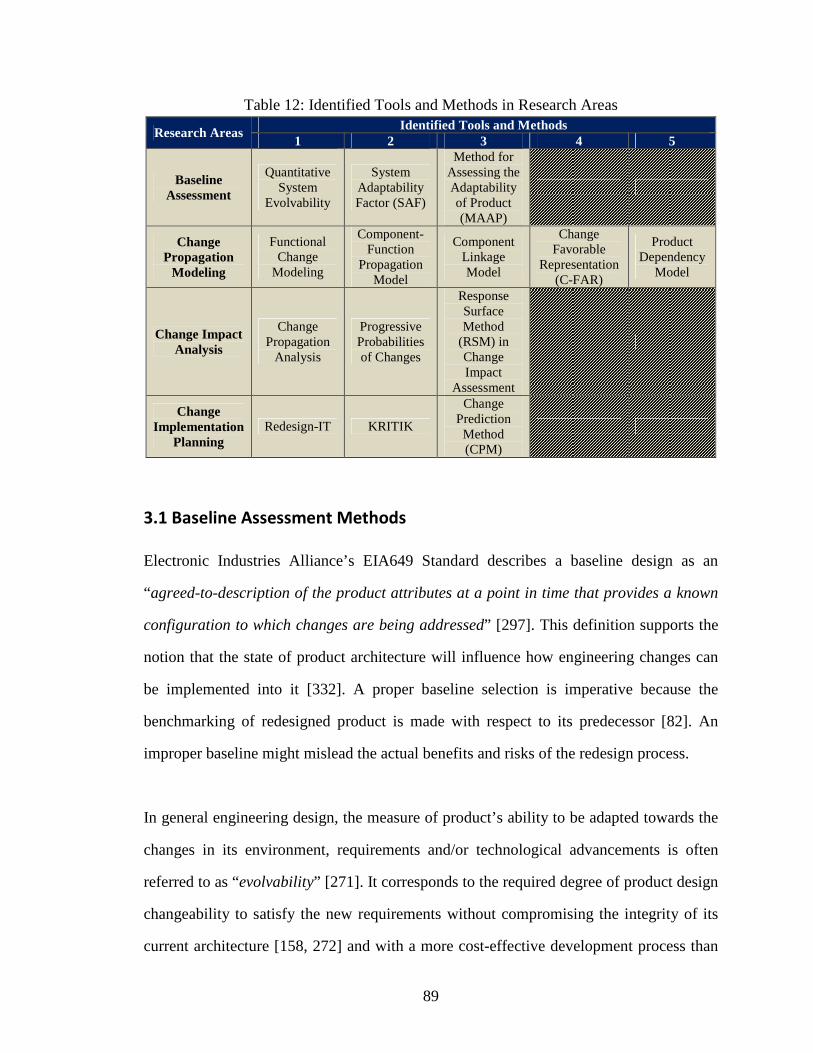
89
Table 12: Identified Tools and Methods in Research Areas Identified Tools and Methods
Research Areas 1 2 3 4 5
Baseline Assessment
Quantitative System
Evolvability
System Adaptability Factor (SAF)
Method for Assessing the Adaptability of Product (MAAP)
Change Propagation
Modeling
Functional Change
Modeling
Component-Function
Propagation Model
Component Linkage Model
Change Favorable
Representation (C-FAR)
Product Dependency
Model
Change Impact Analysis
Change Propagation
Analysis
Progressive Probabilities of Changes
Response Surface Method
(RSM) in Change Impact
Assessment
Change Implementation
Planning Redesign-IT KRITIK
Change Prediction Method (CPM)
3.1 Baseline Assessment Methods
Electronic Industries Alliance’s EIA649 Standard describes a baseline design as an
“agreed-to-description of the product attributes at a point in time that provides a known
configuration to which changes are being addressed” [297]. This definition supports the
notion that the state of product architecture will influence how engineering changes can
be implemented into it [332]. A proper baseline selection is imperative because the
benchmarking of redesigned product is made with respect to its predecessor [82]. An
improper baseline might mislead the actual benefits and risks of the redesign process.
In general engineering design, the measure of product’s ability to be adapted towards the
changes in its environment, requirements and/or technological advancements is often
referred to as “evolvability” [271]. It corresponds to the required degree of product design
changeability to satisfy the new requirements without compromising the integrity of its
current architecture [158, 272] and with a more cost-effective development process than

90
building a new product for similar purpose [74]. The accommodation of changes is
dictated by the state of product architecture and based on the driving requirements;
different baseline systems might require different levels of modification. This highlights
the profound implication of product design architecture on manufacturer’s ability to
execute the redesign development process [326]. In view of that, this section is focused
on addressing the following research questions:
1) What are characteristics of a good baseline aircraft for the redesign approach?
2) How will these characteristics affect the change process?
In this literature review, no known formal method is found to be directly focused on the
assessment of baseline suitability for product redesign, particularly from the viewpoint of
its architecture. While there are several standard definitions that have been proposed to
guide the evaluation process; having a structured, quantitative means to select the product
baseline is more beneficial [311]. Rowe et al. proposed evaluation metrics for software
system’s capability to accommodate modification in [272] and it is believed that they can
be extended to hardware products. A generalized description of these metrics from the
viewpoint of engineering product architecture is given as follows:
• Adaptability : ability to modify or add modules without affecting other
existing modules
• Changeability: ease of making changes to the product or system
• Flexibility : ease of rearranging or modifying the interrelationships between
different modules to suit the new requirements
• Extensibility : ability of the architecture to support new functions and changes
• Enhanceability: ease of incorporating new functionalities into the existing
architecture

91
In separate study, Fricke and Schulz expanded the changeability definition of physical
product design into its basic principles of simplicity, independence and modularity [138].
Simplicity or ideality of a product architecture design is measured by its number of
interfaces, secondary functions and types of resources required, whereby the simplest one
corresponds to the minimum values for each of them [35]. Conversely, the highest level
of architecture independence is present in the products with minimum affected design
parameters during the change implementation whereas the highest modularity measure is
linked to the minimum number of couplings between different product subsystems [286].
It can be inferred from these definitions that the preferred redesign process affects the
smallest number of parts or subsystems, requires the least amount of new subsystems or
interrelationships and has the lowest development risks and costs. While these criteria are
clearly recognized, no structured measurement technique that properly relates them to the
product architecture is found.
Based on this realization, as well as the presented arguments in previous two chapters,
several criteria are outlined to compare the advantages and disadvantages of the identified
methods for baseline assessment. They are listed as follows:
(i) Provide a structured baseline evaluation scheme
a. Clearly define evaluation metrics to assess the suitability of product
with regards to the required changes
b. Assist the assignment of values for these metrics
(ii) Suitable for considered scope of redesign process
a. Provide evaluation metrics that capture the essences of product
redesign process during its conceptual and preliminary stages
b. Include consideration of engineering change process
(iii) Scalable to specific engineering change evaluation
a. Allow the evaluation focus on specific engineering change situation

92
3.1.1 Quantitative System Evolvability
According to Christian and Olds, all engineering systems can accommodate their required
changes either statically or dynamically [75]. In separate works by Saleh et al., these two
categories of product’s evolvability characteristics are designated as robust and flexible,
respectively [277]. These system characteristics can be further decomposed as shown in
Figure 35, which is closely tailored to the taxonomy of change that have been proposed
by Rowe et al. [272]. These four classes of system evolvability correspond to different
ways that the new requirements can be satisfied by the baseline design, which are briefly
described in Table 13.
EVOLVABILITY
STATIC DYNAMIC
GENERALITY ADAPTABILITY SCALABILITY EXTENSIBILITY
Figure 35: Functional Breakdown of System Evolvability [75]
Table 13: Classes of System Evolvability [74, 75] Evolvability
Class Description
Generality
The capacity of a system to accommodate a change in requirements without altering the existing architectural design or implementation strategy
Adaptability
The capacity of a system to accommodate a change in requirements through rearranging existing system components within the current architecture without changing other components or their integration solution
Scalability
The capacity of a system to accommodate a change in requirements by increasing the size of architectural components to accommodate increased loads
Extensibility
The capacity of a system to accommodate a change in requirements through adding new components or through a major change in the architecture or implementation strategy

93
Based on this definition, product evolvability is an aggregate quantity that combines the
measures of how well it can accommodate the required modification in accordance to its
generality, adaptability, scalability, and extensibility capabilities. For this assessment
scheme, the system is measured by its difficulty level to be modified to achieve the target
requirements. The quantitative measure is tailored to a qualitative rating scale known as
Difficulty Scale of Evolvability Analysis (DSEA), which is presented in Table 14.
Table 14: Difficulty Scale for Evolvability Analysis [75]
Rating Explanation
1
Easy – Requires little effort to evolve. Some new technologies might be implemented but the functionality of most system components remains unchanged. The complexity level of the system also remains almost the same.
3
Moderate – Requires moderate effort to evolve. Some new technologies might be implemented and the functionality of some system components is changed. The complexity level of the system increases a little.
9 Difficult – Requires large effort to evolve. Many new technologies are required and the functionality of most system components is changed. The complexity level of the system substantially increases.
27
Very Difficult – Requires very large effort to evolve. Many new technologies are required and the functionality of most system components is significantly changed. The complexity level of the system greatly increases.
Before the individual ratings are combined into a single evolvability metric, they are
normalized using standard scoring functions. The proposed scoring function is introduced
by Wymore [346] and it comprises 12 basic Wymorian shapes of the family function.
The full description of these functions is available in [100] and the ones applied in this
measurement scheme are SSF1 and SSF7, which refer to “the larger the better” and “the
smaller the better” cases, respectively. These functions enable a combination or
comparison of metrics that lack a common basis [100]. For instance, in a case of “smaller
the better”, a saving of 20 kg can be of less significance to product designers when their

94
total product weight is already more than 100 kg but the same amount of weight savings
is a significant improvement when the total weight is below 100 kg. In other words, these
Wymorian functions allow the definition of a threshold where data difference matters
more than when they are located outside the range. This differs from most measurement
techniques that normalize data to maximum or minimum value and ignore the underlying
weights for each data value against each other. The SSF1 and SSF7 scoring functions are
depicted in Figure 36 and their mathematical representations follow.
Figure 36: Plots of Wymorian Standard Scoring Functions SSF1 and SSF7 [74]
( ) ( )( ) ( )L2vBS2Lv/LB1
1Score)D,S,B,L(1SSF −+−−+
= Equation 1 [74]
( ) ( )( ) ( )L2vBS2Lv/LB1
11Score)D,S,B,L(7SSF −+−−+
−= Equation 2 [74]
where: =v input value for the metric =Score output of the scoring function =L lower threshold of the input value =B baseline value for the metric [by definition, this is always defined as a
score of 0.5] =S slope of tangent to the scoring function at the baseline value, which
represents the maximum incremental change in the user quantitative judgment
=D domain of definition of the scoring function
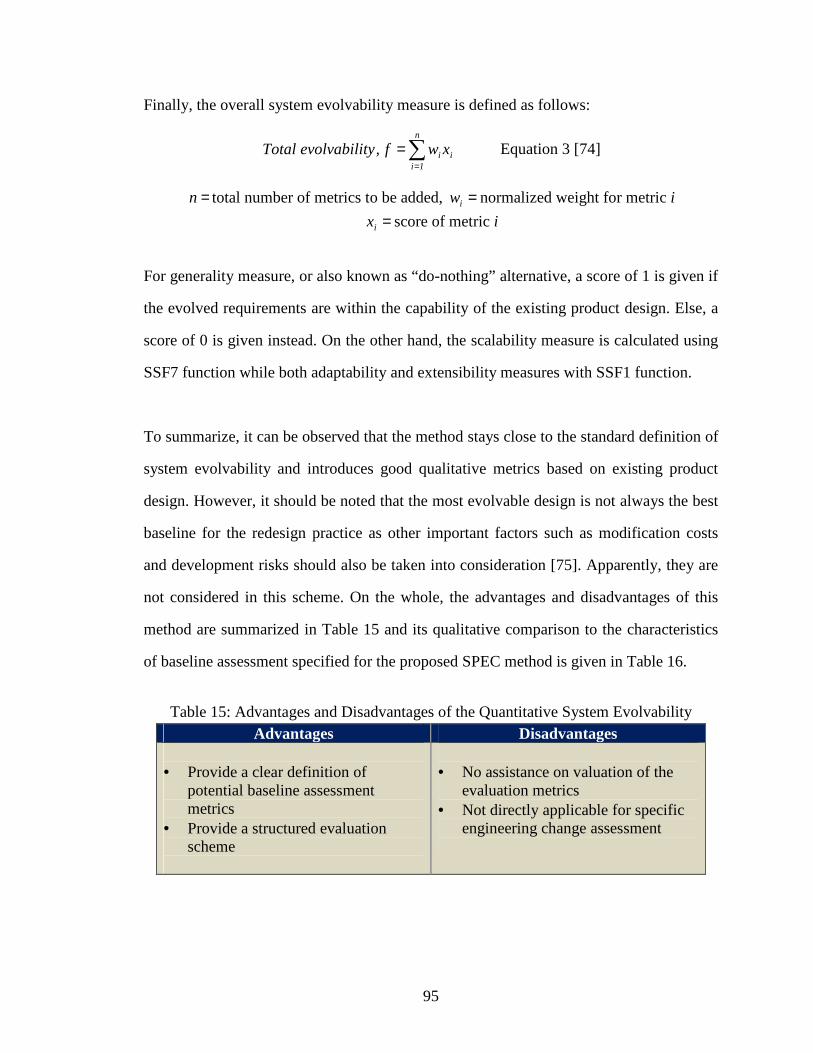
95
Finally, the overall system evolvability measure is defined as follows:
∑=
=n
1iii xwf,tyevolvabiliTotal Equation 3 [74]
=n total number of metrics to be added, =iw normalized weight for metric i
=ix score of metric i
For generality measure, or also known as “do-nothing” alternative, a score of 1 is given if
the evolved requirements are within the capability of the existing product design. Else, a
score of 0 is given instead. On the other hand, the scalability measure is calculated using
SSF7 function while both adaptability and extensibility measures with SSF1 function.
To summarize, it can be observed that the method stays close to the standard definition of
system evolvability and introduces good qualitative metrics based on existing product
design. However, it should be noted that the most evolvable design is not always the best
baseline for the redesign practice as other important factors such as modification costs
and development risks should also be taken into consideration [75]. Apparently, they are
not considered in this scheme. On the whole, the advantages and disadvantages of this
method are summarized in Table 15 and its qualitative comparison to the characteristics
of baseline assessment specified for the proposed SPEC method is given in Table 16.
Table 15: Advantages and Disadvantages of the Quantitative System Evolvability
Advantages Disadvantages
• Provide a clear definition of potential baseline assessment metrics
• Provide a structured evaluation scheme
• No assistance on valuation of the
evaluation metrics • Not directly applicable for specific
engineering change assessment

96
Table 16: Qualitative Comparison of Quantitative System Evolvability
Required SPEC Characteristics Quantitative System Evolvability
Provide a structured baseline evaluation scheme
Suitable for considered scope of redesign process
Scalable to specific engineering change evaluation
LEGEND:
3.1.2 System Adaptability Factor (SAF)
Engel and Browning proposed an extension to the Standard ISO/IEC 9126-1 for software
engineering qualities to be the essential measures for evaluating product architecture
flexibility [125]. Although these standard quality assessment measures have been tailored
towards software systems, they can also pertain to hardware products due to their generic
definitions [125, 136]. The six categories of these factors are listed in Table 17.
Table 17: ISO/IEC 9126-1 Characteristics and Sub-characteristics [136]
Characteristics Sub-Characteristics
Functionality Suitability, Accuracy, Interoperability, Security, Functionality
Compliance
Reliability Maturity, Fault Tolerance, Recoverability, Reliability
Compliance
Usability Understandability, Learnability, Operability, Attractiveness,
Usability Compliance Efficiency Time Behavior, Resource Utilization, Efficiency Compliance
Maintainability Analyzability, Changeability, Stability
Testability, Maintainability Compliance
Portability Adaptability, Installability, Coexistence, Replaceability,
Portability Compliance
Accordingly, the quantification of measure for product design flexibility, which is known
as System Adaptability Factor (SAF), is further described in Table 18. Derivation of the
metric measurement can be referenced to its sub-characteristics in Table 17. None of the
Do Not Support Fair Good Excellent

97
standard sub-characteristics is compulsory and their choices depend on engineering
system under interest. A weighting factor for each metric is allocated within a qualitative
scale of [0,1], which is assigned to indicate their significance level in affecting the system
adaptability criteria [125]. Mathematically, the weights have to satisfy following
conditions:
1},,,,,{
=∑= PMEURFi
iW Equation 4 [125]
Table 18: Adaptability Metrics Description [125]
Metric Variable Weight Description
Functionality F FW
Capability of the system to provide functions that meet the requirements when used under specified working environment
Reliability R RW Capability of the system to maintain its level of performance when used under specified working environment
Usability U UW
Capability of the system to be understood, learned, used and liked by the user when applied under specified working environment
Efficiency E EW Capability of the system to provide the required performance relative to the amount of resources used
Maintainability M MW
Capability of the system to be modified, which may include corrections, improvements and adaptation to changes in environment, requirements and functional specifications
Portability P PW Capability of the system to be transferred from one environment to another
Finally, model for the overall SAF measurement is defined as the weighted average of the
six adaptability metrics:
PWMWEWUWRWFWSAF PMEURF +++++= Equation 5 [125]
The main emphasis of this assessment is for a new product design development. While
these SAF metrics can be influential for product success, some of them are not effective

98
in evaluating baseline suitability for the redesign process such as portability criterion.
From their description in Table 18, the only metric that is directly related to redesign
process is maintainability criterion. However, no guideline for its evaluation with regards
to existing product architecture is provided in this method.
On the whole, the advantages and disadvantages of this method are summarized in Table
19 and its qualitative comparison to the desired characteristics of baseline assessment for
the proposed SPEC methodology is given in Table 20.
Table 19: Advantages and Disadvantages of SAF
Advantages Disadvantages
• Provide a clear definition of potential baseline assessment metrics
• Provide a structured evaluation scheme
• No assistance on valuation of the
evaluation metrics • Not directly applicable for specific
engineering change assessment
Table 20: Qualitative Comparison of SAF
Required SPEC Characteristics SAF
Provide a structured baseline evaluation scheme
Suitable for considered scope of redesign process
Scalable to specific engineering change evaluation
LEGEND:
3.1.3 Methodology for Assessing the Adaptability of Products (MAAP)
According to Willems et al., the main pre-requisite for reusing or redesigning an existing
product is the feasibility of its adaptation process, which is influenced by its design [339].
In other words, the extent on how a product system can be redesigned or reused depends
on its current architectural build-up [340]. Acknowledging this fact, Methodology for
Do Not Support Fair Good Excellent
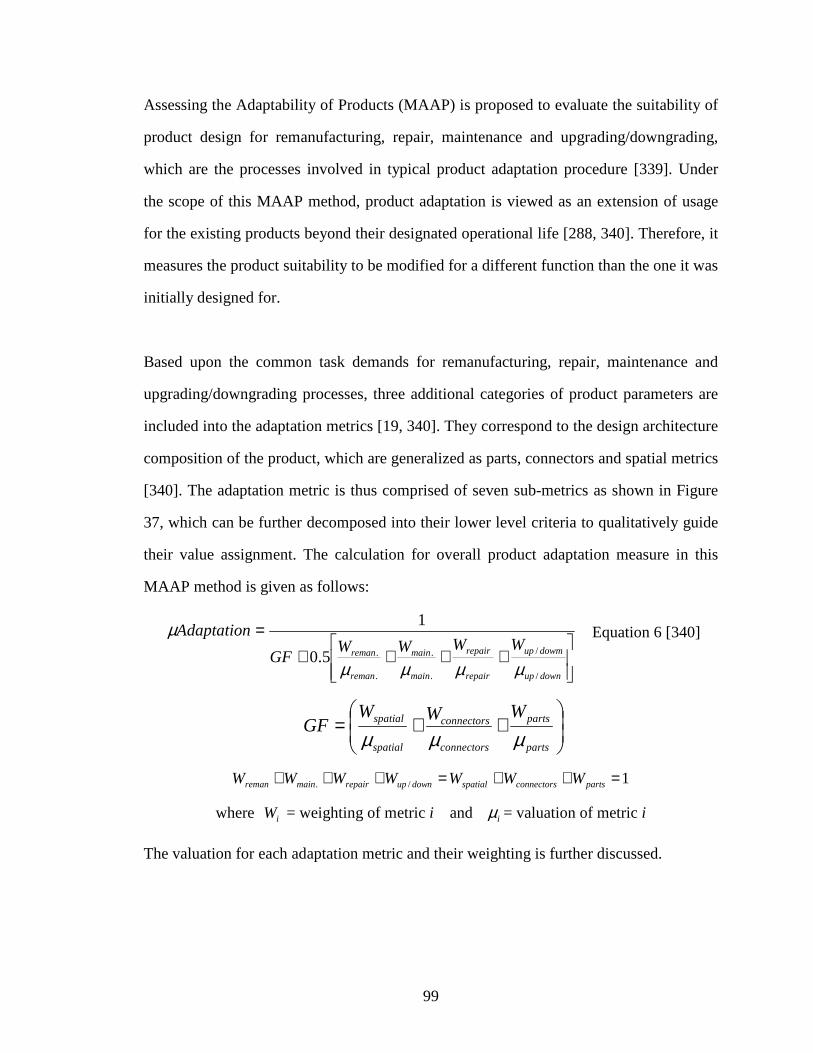
99
Assessing the Adaptability of Products (MAAP) is proposed to evaluate the suitability of
product design for remanufacturing, repair, maintenance and upgrading/downgrading,
which are the processes involved in typical product adaptation procedure [339]. Under
the scope of this MAAP method, product adaptation is viewed as an extension of usage
for the existing products beyond their designated operational life [288, 340]. Therefore, it
measures the product suitability to be modified for a different function than the one it was
initially designed for.
Based upon the common task demands for remanufacturing, repair, maintenance and
upgrading/downgrading processes, three additional categories of product parameters are
included into the adaptation metrics [19, 340]. They correspond to the design architecture
composition of the product, which are generalized as parts, connectors and spatial metrics
[340]. The adaptation metric is thus comprised of seven sub-metrics as shown in Figure
37, which can be further decomposed into their lower level criteria to qualitatively guide
their value assignment. The calculation for overall product adaptation measure in this
MAAP method is given as follows:
++++
=
downup
dowmup
repair
repair
main
main
reman
remanWWWW
GF
Adaptation
/
/
.
.
.
.5.0
1
µµµµ
µ Equation 6 [340]
++=
parts
parts
connectors
connectors
spatial
spatial WWWGF
µµµ
1/. =++=+++ partsconnectorsspatialdownuprepairmainreman WWWWWWW
where iW = weighting of metric i and iµ = valuation of metric i
The valuation for each adaptation metric and their weighting is further discussed.

100
µComponents
µRemoval Directions
µDiff. Con. Types in 1 Group
µ#Diff. Con. Groups
µ#Connectors
µTools
µVisibility
µReachability
µIdentifiability
µDisassembly Directions
µInterfacing
µQuality Assurance
µDamage Correction
µCleaning
µDisassembly Maintenance
µAssembly Maintenance
µArchitectural Struc. Main.
µDisassembly Repair
µAssembly Repair
µArchitectural Struc. Repair
µFunctional Decoupling
µInterfacial Decoupling
µParts
µConnections
µSpatial
µRemanufacturing
µMaintenance
µRepair
µUp/Downgrading
µAdaptability
Figure 37: Structure of the Adaptation Metric [339]
Despite the subjectivities surrounding the metric values [147], the general guide for their
valuation has been suggested based on Design for Assembly (DFA) methods [52, 340].
For parts, connectors and spatial metrics, they are specified by the ratio of their
theoretical minimum to their actual present value. For example, from the viewpoint of its
parts composition, the level of product adaptability is measured by the ratio of minimum
number of parts that it theoretically could have to the existing parts that it currently has.
The closer this measure is to 1, the better the product is perceived for adaptation.
Evidently, this valuation assumes that a less complex product design is easier to adapt to
the new environment. Mathematical representation for this computation is as follows:
=
parametertheforreal
parametertheforidealparameter #
#µ Equation 7 [340]

101
In addition, for upgrading/downgrading metric, the focus is placed on the efficiency of
the product composition in executing its intended functions. The closer its architecture is
to modularity, the better equipped the product is for adaptation. In this MAAP method,
this evaluation is tailored to the requirements for product modularity that are outlined by
Ulrich [326], which emphasize on the decoupling of product functions and interfacial
relationships. The corresponding relationships are given as follows:
+
=
functionperParts
Functions
partperFunctions
PartsDecouplingFunctional
#
#
#
#µ
Equation 8 [340]
=
linksdecoupledofideal
linksdecoupledofrealglDecouplinInterfacia
#
#µ Equation 9 [340]
The suggested evaluation schemes for remaining metrics: remanufacturing, repair and
maintenance; have also been detailed out in [339]. In short, these valuations are based on
the work by Hammond and Bras [151] and the Pareto rule [330, 339]. Finally, each of the
metrics is assigned with a weighting scale that indicates their relative importance to each
other. The determination of this weighting value is done through the prioritization matrix
that is depicted in Figure 38 for an example weighting case. This comparison is usually
decided based on literature data or expert opinion [339].
Figure 38: Assignment of MAAP Metric Weightings [339]

102
All in all, this MAAP method evaluates the aptness of product adaptation process in
relation to its design architecture, where the main emphasis is on direct product reuse at
the end of its operational lifecycle [147, 339]. It hypothetically covers all the important
aspects of design adaptability but it should be realized that the metric values are best used
in relative manner instead of taken as absolute [339]. Overall, this method is aligned with
the scope of product redesign approach but it covers several aspects of product reuse that
are unrelated to the conceptual redesign process. The repair and maintenance metrics, for
instance, correspond to problems of broken or ineffective parts but such situation is not
within the scope of the proposed SPEC method. Moreover, while it provides a good
insight on how existing product design influences its adaptability, more consideration on
how it performs for specific case of changes is required. The summarized advantages and
disadvantages of this method are presented in Table 21 and its qualitative comparison to
the desired characteristics for the proposed SPEC method is given in Table 22.
Table 21: Advantages and Disadvantages of MAAP
Advantages Disadvantages
• Provide a clear definition of potential baseline assessment metrics
• Assist the valuation of evaluation metrics
• Provide a structured evaluation scheme
• Not directly applicable for specific
engineering change assessment
Table 22: Qualitative Comparison of MAAP Required SPEC Characteristics MAAP
Provide a structured baseline evaluation scheme
Suitable for considered scope of redesign process
Scalable to specific engineering change evaluation
LEGEND:
Do Not Support Fair Good Excellent

103
3.1.4 Summarized Review of Baseline Assessment Methods
From this literature study, product evolvability criterion defined in the quantitative
system evolvability method is taken as the best general measure for redesign. While there
are several alternative definitions and various characteristics decomposition that can be
linked to this characteristic, they essentially share a common basis. Overall, this criterion
in the scope of product redesign can be described as its ability to be adapted towards new
requirements, which will enable its prolonged service life or an extended application into
new operational territories [147].
The potential competitive value and the importance in choosing the right baseline design,
hence the capability to judge product suitability prior to its redesign development, has
been clarified and supported by this literature review. The identified methods highlight
various aspects that are useful in evaluating baseline evolvability characteristics. Even
though none of them matches the desired functionalities to be directly applied in the
proposed SPEC methodology, as indicated in Table 23, they nonetheless provide a good
basis for the development of a structured guideline to measure product suitability for the
redesign process.
Table 23: Qualitative Comparison of Identified Baseline Assessment Methods
Required SPEC Characteristics Quantitative
System Evolvability
SAF
MAAP
Provide a structured baseline evaluation scheme
Suitable for considered scope of redesign process
Scalable to specific engineering change evaluation
LEGEND:
Do Not Support Fair Good Excellent
Best per criterion

104
From the qualitative comparison presented in Table 23, MAAP is shown to have the best
evaluation scheme. In fact, it is the only one among the identified methods that provides a
structured assistance on the assignment of values for the evaluation metrics. However, the
evaluation metrics proposed in the quantitative system evolvability method better capture
the essences of redesign process considered in the scope of this thesis study. In terms of
applying their evaluation procedure to the specific engineering change implementation
case, all three methods perform comparatively at a similar level. The quantitative system
evolvability method is given the extra edge since its evaluation metrics are closer to that
considered for the redesign case.
3.2 Change Propagation Modeling
One of the main points that are deduced from the discussion in previous chapters is the
importance for the product model to capture the essences of its change propagation
potential. The planning for engineering changes during product redesign can benefit from
a good understanding on how its realization affects other parts in the product architecture.
Interrelationships between various product design elements have been recognized as the
primary medium for change propagation [109, 116] and their identification is imperative
for better coordination during product development [257, 273].
For any cases of redesign changes, interdependencies between product sub-modules that
are either required, introduced or maintained during the process must be properly mapped
out to locate exactly the initial modification and to track the likely paths of its effects
propagation [152]. It is also essential to understand the behaviors of these direct or
indirect links as the scale of required rework and cost for the development process highly
depend on the propagated change effects [80, 187]. All things considered, an accurate
depiction of product design architecture in terms of its change properties is necessary to

105
estimate the side effects of its modification [259]. It was suggested that no matter how
good the engineering change analysis is, its overall performance and accuracy heavily
depends on the goodness of product change model [174].
From the outlined research questions in previous chapter, the literature review in this
section is governed by the following subjects:
1) How engineering change effects propagate from one architecture locality to
another?
2) What are control parameters of change propagation?
3) How to properly model aircraft system in order to predict change
propagation?
Several modeling techniques have been developed in software engineering field for an
automated tracking of program changes throughout its evolution, which normally involve
breaking the computer program into manageable pieces and links them together through
propagation graph [261, 281]. However, these methods are fairly inadequate for hardware
product designs because the parametric links between physical parts are less explicit than
those in computer program modules [80]. Unlike software products, change propagation
in hardware products depends on the type of dependencies [273] and thus the necessary
information about the interconnection needs to be included into the model. Despite the
modeling phase being the most influential step in determining the overall efficiency of
the process, it is preferred not to require too much commitment from product designers
[165]. There has to be a well-balanced trade-off between the level of details and the cost
of modeling [81]. In case of highly complex products like aircraft system, this balance
between level of decomposition and amount of details is even more necessary [34].

106
Based on these arguments, several criteria have been outlined to compare the advantages
and disadvantages of the identified system modeling methods for engineering change
study. They are listed as follows:
(i) Provide a good change propagation tracking scheme
a. Clearly define parameters involved in identifying potential change
propagation paths
b. Provide the means to predict and track change propagation paths
(ii) Provide a balance between level of details and cost of modeling
a. Capture the essences of change propagation phenomenon in the model
without imposing too much modeling commitment
3.2.1 Functional Change Modeling
Every product exists to accomplish a set of functions required by the customers and their
raising expectations translates into improvement or creation of new product functions
[347]. Accordingly, product design architecture can be perceived as an arrangement of
functional elements in physical chunks that act as their building blocks [327]. The focus
on design functions is suggested to be better for studying product variants development
and reduced time-to-market production [282]. This is primarily because it enables a more
flexible framework for exploring innovative design alternatives [257] and embodies a
wide range of assumptions with respect to physical realization of the product [326].
In general, product functional modeling or else known as functional decomposition is the
process of hierarchically breaking down high-level product functions into their lower
sub-functions [192, 312]. This is “an abstract, yet direct, method for understanding and
representing an overall product or artifact function” [159]. In many development cases,
especially for complex engineered systems, this allows easier and manageable design

107
analysis [196, 257]. The constructed functional platform is used as a basis for selecting
physical product components and in redesign process, this platform is often established in
the initial “reverse engineering” step. There are many available methods that can be used
to model a product from its functional perspective. One of the identified modeling
approaches is outlined by Stone et al. [312], which is illustrated in Figure 39 for a power
screwdriver unit.
Figure 39: Functional Modeling of a Power Screwdriver [312]
From the standpoint of change study, the primary benefit offered by this functional model
is the added information regarding interconnections between design parts that are often
ignored by other methods. Apart from how the modification is realized, change effects
propagation depends on the nature of the dependency between the affected design parts
[273]. This information is helpful to predict the risk and level of the change impacts. In
this model, the links are categorized into three classes of “flow”: energy, material and
signal, which is passed throughout the product to form its functional structure [252, 312].
Nevertheless, the functional decomposition process is currently not uniquely defined and
several different functional models could be created for the same product [192]. This is
among the main reasons why functional modeling techniques are not widely utilized in
product development process as it is hard to resolve any modeling conflicts without a
definitive guideline [174]. To date, several works have been done to alleviate this issue,
including hierarchical functional modeling technique by Bell [46] and identification of
the best functional decomposition by Krishnamachari [192]. For this particular method by

108
Stone et al., a standard vocabulary known as “functional basis” has been specifically
developed for the functional decomposition process [205]. This set of design language is
aimed to regulate the model structure and to facilitate the streamlining of functional
representation in order to resolve the inherent model inconsistencies. A full description of
this “functional basis” is available in [159, 310]. Despite its introduction, this issue
largely remains because “functional basis” is not yet taken as the universal standard for
functional decomposition process.
Furthermore, since this functional model is not developed for engineering change study,
it lacks the capability to directly support the assessment of propagated change effects or
the implementation planning for required modification. Its main objective is focused on
exploring different conceptual product architectures rather than working around a fixed
baseline design [174]. In addition, its model representation rapidly grows for complex
systems, which seriously hinders designers from tracking and analyzing potential change
propagation paths. Additional efforts are also required for its graphical representation but
they add nothing to the model applicability and efficiency for change process analysis.
On the whole, the advantages and disadvantages of this method are summarized in Table
24. Its qualitative comparison to the desired characteristics of product change modeling
for the proposed SPEC methodology is given in Table 25.
Table 24: Advantages and Disadvantages of Functional Change Modeling
Advantages Disadvantages
• Highlight potential change propagation paths through “flow” definitions
• Too much modeling efforts for
features that do not help change study
• Highly inconsistent process • Not readily usable for change study

109
Table 25: Qualitative Comparison of Functional Change Modeling
Required SPEC Characteristics Functional Change Modeling
Provide change propagation tracking scheme
Balanced model details and modeling efforts
LEGEND:
3.2.2 Component-Function Propagation Model
In contrast to previous functional modeling, matrix-based modeling methods have the
advantages of being more intuitive and require less effort in their model development [59,
174]. By far, these methods have gained a huge popularity in facilitating the analysis of
relations for complex engineering systems. Different classifications of their application
are discussed in [219]. The most common matrix-based modeling method is design
structure matrix (DSM), which essentially originates from N2 chart method [148].
DSM is traditionally applied to analyze project tasks and organizational development
[219]. For this application, all activities, information exchanges and task dependencies in
the project are translated into an interrelationship matrix [148] that is used to identify the
personnel to be consulted or informed when any elements of the project has been changed
[309]. The use of DSM is later extended to include product modeling and analysis;
predominantly within the modular and platform design researches [125, 265]. At present,
it has become a standard tool to model direct linkages or connections between two design
elements [177]. So far, DSM models have been used in diverse industrial practices such
as automotive, aerospace, telecom, electronics and other product industries [59].
Do Not Support Fair Good Excellent

110
The difference between N2 chart and DSM model is mainly due to the fact that the latter
representation includes the interdependencies of various subsystems beyond the physical
interfaces. Depending on the intended level of model abstraction, the links could signify
process characteristics, design parameters, and operational and functional dependencies
[148]. The matrix configuration for product architecture representation in DSM modeling
approach is illustrated in Figure 40 and it is crucial to understand the convention used for
its construction. In short, any off-diagonal marks in the matrix signify that the element of
the row is receiving input(s) from that designated by the column.
Figure 40: DSM Configuration for System Representation [148]
As can be observed from Figure 40, DSM model provides a simple and clear means to
assess how change effects might propagate throughout the product architecture [81, 265].
Within the square matrix representation, product components or subsystems are identified
by the headings of each row and column, and their dependencies are indicated by the off-
diagonal marks [133]. It is assumed that these interrelationships are known prior to the
initiation of this modeling process [64], which suits product redesign approach due to the
well-defined state of the chosen baseline design. All in all, this DSM modeling is a well-
established method that can provide a good aid in planning for product redesign process
[60].
However, since the scope of interdependencies is broadened in this modeling technique,
there are several key issues regarding the lack of guidance in the matrix construction for
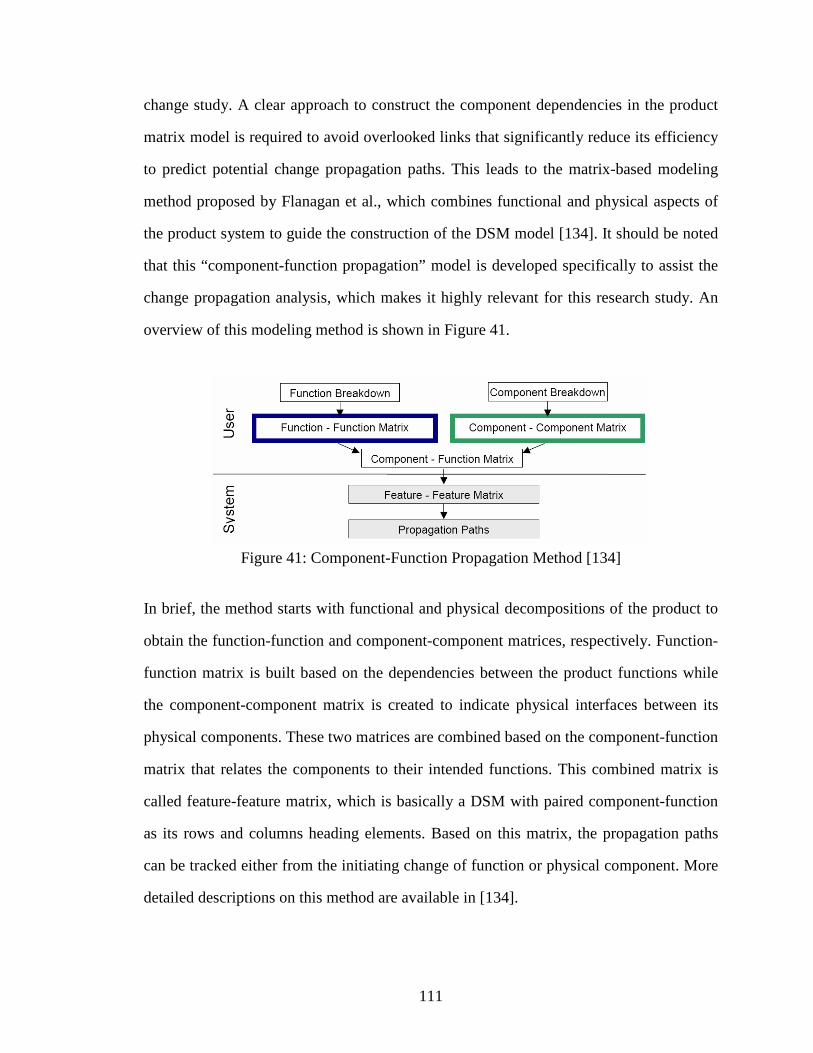
111
change study. A clear approach to construct the component dependencies in the product
matrix model is required to avoid overlooked links that significantly reduce its efficiency
to predict potential change propagation paths. This leads to the matrix-based modeling
method proposed by Flanagan et al., which combines functional and physical aspects of
the product system to guide the construction of the DSM model [134]. It should be noted
that this “component-function propagation” model is developed specifically to assist the
change propagation analysis, which makes it highly relevant for this research study. An
overview of this modeling method is shown in Figure 41.
Figure 41: Component-Function Propagation Method [134]
In brief, the method starts with functional and physical decompositions of the product to
obtain the function-function and component-component matrices, respectively. Function-
function matrix is built based on the dependencies between the product functions while
the component-component matrix is created to indicate physical interfaces between its
physical components. These two matrices are combined based on the component-function
matrix that relates the components to their intended functions. This combined matrix is
called feature-feature matrix, which is basically a DSM with paired component-function
as its rows and columns heading elements. Based on this matrix, the propagation paths
can be tracked either from the initiating change of function or physical component. More
detailed descriptions on this method are available in [134].

112
For this DSM modeling, the indication of interrelationships between the different parts or
systems is not tailored to the directional flows of their inputs and outputs. This diverges
from the traditional matrix-based modeling methods that have been previously discussed.
Instead, each off-diagonal mark within this component-function propagation DSM model
signifies an existing functional or physical connection between the system elements and it
is assumed that this change relationship works in both directions. The latter criterion can
be implied from the symmetric nature of the resultant feature-feature matrix. An example
feature-feature matrix for a digger is shown in Figure 42. For this example, the shunting
function of the bucket is the initiating change and the blue arrows show how one of the
potential change propagation paths can be traced to the other affected parts.
Figure 42: Propagation Path Determination in Feature-Feature Matrix [134]

113
It can be observed that this component-function propagation model provides a simple, yet
clear and systematic visualization to track potential change propagation paths. This is a
powerful aid for the change implementation planning. The model creation might be a
time-consuming task [174] but it immensely assists in identifying all propagated effects
from modifying any component within the architecture [265]. Moreover, from the way
the model is constructed, the initiating change component can be identified by either its
function or physical aspects.
On the other hand, one of the primary problems for this technique is the inconsistency of
functional product decomposition [174]. The separately executed physical breakdown can
lead to different level of details, which can cause problems during the combination of the
function-function and component-component matrices. There has to be coordination
between the two decomposition processes such that they both arrive at similar level of
interrelationship details, which is not discussed in the reference sources. Furthermore, the
deduction that any functional or physical link automatically represents a dual-way change
relationship between the product components is misleading. In real product development
practice, this is not always the case. Though a group of components might be responsible
for the same high-level product function together, it is possible that the required changes
only affect one of them. Similarly, the modification made in one component does not
necessarily mean that all its other physically connected components also need to be
changed. Hence the existing physical or functional relationship does not necessarily
signify that the change effects will propagate from or to both components. Moreover,
although the product model systematically helps to identify the potential propagation
paths, it contains no additional information about the connection that can be used for
change impact analysis. This omission becomes more crucial given the assumption of an
automatic dual-way change relationship.

114
To summarize, the advantages and disadvantages of this method are summarized in Table
26. Its qualitative comparison to the desired characteristics of product change modeling
for the proposed SPEC methodology is given in Table 27.
Table 26: Advantages and Disadvantages of Component-Function Propagation
Advantages Disadvantages
• Clear and systematic change propagation tracking
• Manageable modeling efforts
• Can be an inconsistent process
without proper coordination between decomposition processes
• Misleading assumption of change interrelationships
• Not readily usable for change study
Table 27: Qualitative Comparison of Component-Function Propagation
Required SPEC Characteristics Component-Function
Propagation
Provide change propagation tracking scheme
Balanced model details and modeling efforts
LEGEND:
3.2.3 Component Linkage Model
In an effort to avoid the issues associated with inconsistent functional decomposition
process, Jarratt proposed a modeling technique based on the observed links between parts
of the product [174]. These links, or better known as component linkages in this method,
are defined as a direct relationship or connection between two individual parts, sub-
assemblies or modules of the product [176]. They can be a physical connection or a
functional association [176], and their interrelationships can be symmetrical or one-way
directional [174].
Do Not Support Fair Good Excellent

115
The main difference between component linkage analysis and functional analysis is that
the former method starts with physical product decomposition. By knowing the specific
physical components, their relationships can be deduced in a broader scope than just the
functional connections. For instance, the connection between two parts due to a shared
manufacturing process can also be represented in this model [176]. The heart of this
modeling method is essentially the DSM representation and the steps involved in its
execution are depicted in Figure 43.
Figure 43: Product Linkage Modeling Method [174]
In short, the interested product is first physically decomposed until the required level of
details is reached. Next, types of linkages related to the interested product analysis are
identified. Besides the product operational or architectural dependencies, any issues or
problems from the past change process can also be considered [174]. Finally, the last step
is to identify the interconnections between the components for each type of linkages.
Additional information on the type, likelihood of change propagation and level of change
impacts can be included later into the model. The process can also be reiterated to re-
decompose the product for a better illustration or to include additional linkage types to
increase the details of the resultant DSM model.

116
To illustrate this method, an example of linkage modeling for a ball point pen is shown in
Figure 44. As can be observed, four types of linkages are defined for the model. Based on
information in Figure 44, the pen model can be constructed. This is shown in Figure 45,
where each linkage type is represented by a separate DSM model. In typical change
process analysis, a combined DSM model is often used with the change likelihood and
impact values inserted in place of the “X” marks. It is proposed that these values are
tailored to the modified FMEA scheme as tabulated in Table 28.
Figure 44: Ball Point Pen Linkage Modeling [174]
Figure 45: DSM Representation for Linkage Models [174]

117
Table 28: Modified FMEA Rating for Change Likelihood and Impact Measure [176] Likelihood of Change Propagating Impact if Change Propagates
0: No Propagation 1: Very Low
2/3: Low 4/5: Moderate
6/7: High 8/9: Very High
10: Propagation Inevitable
0: No Impact 1: Very Minor
2/3: Minor 4/5: Moderate
6/7: High 8/9: Very High
10: Complete Redesign Required
By including the linkage types and the measures of change likelihood and impact level,
this linkage modeling provides additional information that is useful for change impact
analysis. The use of DSM model representation enables this method to obtain the benefits
of a matrix-based model. Moreover, as the method focuses on existing components and
builds the relationships around them, it is highly applicable to product redesign process
[174]. The linkage definition can be easily tailored to the required information for the
subsequent change impact analysis, which increases its application flexibility.
Nevertheless, while the component linkage model includes change propagation likelihood
and impact measures into its combined DSM representation, information on the type of
linkages or the current change situation is not considered in populating these measures.
Instead, their values are often derived based on previous product modification [174].
Since these measures are not tailored to current product redesign process, their values can
mislead the subsequent analysis process. In other words, if these values are used to
evaluate the overall risk for the proposed changes, the analysis is readily biased towards
past change targets and ignores the effects of change type and level that currently have to
be handled [273]. A more level and unbiased method to populate these change likelihood
and impact values is thus required.

118
On the whole, the advantages and disadvantages of this method are summarized in Table
29. Its qualitative comparison to the desired characteristics of product change model for
the proposed SPEC methodology is given in Table 30.
Table 29: Advantages and Disadvantages of Component Linkage Model
Advantages Disadvantages
• Clear and systematic change propagation tracking
• Manageable modeling efforts • Include useful change information
for impact analysis • Readily usable for change study
• Information included is based on
past change data
Table 30: Qualitative Comparison of Component Linkage Model
Required SPEC Characteristics Component Linkage
Model
Provide change propagation tracking scheme
Balanced model details and modeling efforts
LEGEND:
3.2.4 Change Favorable Representation (C-FAR)
Recognizing that the change propagation depends on the type of changes made on the
initiating part, Cohen et al. introduced change favorable representation (C-FAR). Its main
objective is to set up a data representation that aids designers in making product
modification and tracking its propagated effects [83]. The modeling process is done in
EXPRESS, a programming language that assist product definition through its in-built
modeling schema [11, 83]. An overview of the relationships between this C-FAR method
and EXPRESS is available in [82].
Do Not Support Fair Good Excellent

119
In short, C-FAR aims at tracing and predicting change propagation by identifying the
interactions between the attributes of the product elements [80, 176, 273]. Each physical
part of the product is modeled as a vector and their attributes are taken as components of
that vector [83]. The influence of a change made on one component attribute to that of
others is captured in the C-FAR matrix. This change interrelationship is supplemented by
the scale of their strength (i.e. high, medium or low) based on expert opinions [42, 45,
106]. An example model is shown in Figure 46.
Figure 46: C-FAR Product Representation [83]
In this sample case, two interested entities involved in the design of a bottle are the liquid
and the bottle itself. Both are supplemented with two attributes each, which are related to
each other in the C-FAR matrix. The rows represent the attributes of the liquid while the
columns refer to those of the bottle. Value for the first matrix element corresponds to the
influence strength of the liquid attributes on those of the bottle whereas the second value
indicates the reverse. For instance, the second row and first column element of the full C-
FAR matrix shows the connection between liquid quantity and bottle size. The “H/H”
entry implies that the liquid quantity highly influences the bottle size and vice versa. Note
that the matrix can also be reduced into a semi C-FAR matrix representation, which only
shows one way relationship. Component attribute that initiates a change is identified
along with the interested target attribute and the change propagation path from the former
120
to the latter is derived based on the populated C-FAR matrix. A numerical scale is used to
represent the level of connection strength during the calculation of propagated effects,
which is detailed in [83].
Overall, this modeling method captures the necessary factors to predict propagated
change effects; which are change type and magnitude. This is a big improvement over
other modeling approaches for change process. However, it does not provide a structured
plan on how these measures should be derived. The likelihood of change propagation and
the required amount of redesigning efforts are often assigned with the average over their
past occurrences regardless of the actual change made in the initiating component [273],
which can lead to inaccurate change propagation analysis. The main focus of this method
is the representation of product data information rather than change implementation [82]
and this explains the lack of emphasis on the valuation of its measures.
In addition, its model build-up is rather complex and subjective, where the identification
of component attributes that can influence and be influenced by others appears to be
rather time-consuming, especially for complex products. Since the propagation path is
automatically generated based on C-FAR matrices, any overlooked attributes could affect
the overall evaluation. On opposite side of the argument, too many attribute declarations
lead towards heavy calculation. Its computational complexity and required modeling
efforts makes the application of this method only appropriate for small and relatively
simple products [80, 184]. Furthermore, this method only supports the analysis of change
propagation from one attribute to the specified other. This restricted capability makes it
inefficient to handle the product redesign process, where multiple initiating changes are
usually defined and their propagated effects can interact with each other. Due to its model
definition up to component attribute levels, it is possible that a required change will affect

121
more than one attribute of the same component but this condition is not captured by the
C-FAR matrix.
The advantages and disadvantages of this method are tabulated in Table 31. Its qualitative
comparison to the desired characteristics of product change modeling for the proposed
SPEC methodology is given in Table 32.
Table 31: Advantages and Disadvantages of C-FAR
Advantages Disadvantages
• Clear and systematic change propagation tracking
• Include useful change information for impact analysis
• Readily usable for change study
• Modeling efforts can be rather
tedious for complex products • Information included is based on
past change data
Table 32: Qualitative Comparison of C-FAR
Required SPEC Characteristics C-FAR
Provide change propagation tracking scheme
Balanced model details and modeling efforts
LEGEND:
3.2.5 Product Dependency Model
In similar principle to previous C-FAR modeling method, Rutka et al. proposed product
dependency model. However, instead of the complicated model build-up like the former
method, this product dependency model uses DSM representation structure. Its scope of
application is also expanded to include other development process characteristics apart
from the product design.
Do Not Support Fair Good Excellent
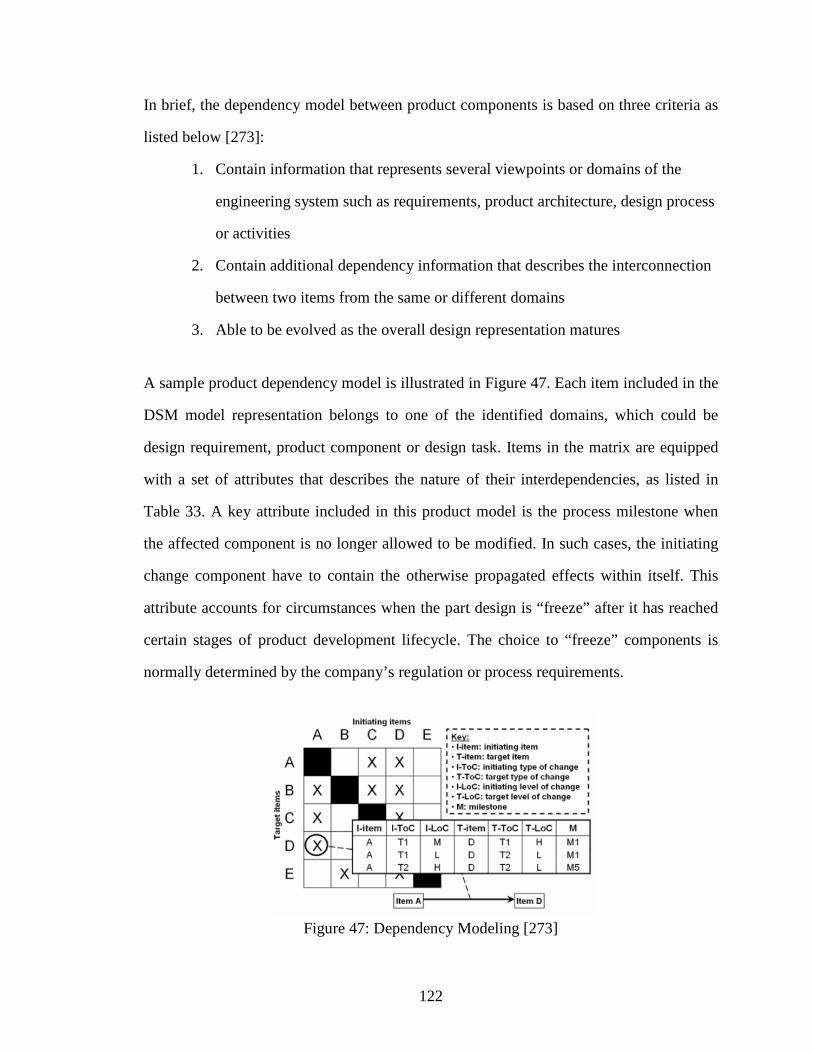
122
In brief, the dependency model between product components is based on three criteria as
listed below [273]:
1. Contain information that represents several viewpoints or domains of the
engineering system such as requirements, product architecture, design process
or activities
2. Contain additional dependency information that describes the interconnection
between two items from the same or different domains
3. Able to be evolved as the overall design representation matures
A sample product dependency model is illustrated in Figure 47. Each item included in the
DSM model representation belongs to one of the identified domains, which could be
design requirement, product component or design task. Items in the matrix are equipped
with a set of attributes that describes the nature of their interdependencies, as listed in
Table 33. A key attribute included in this product model is the process milestone when
the affected component is no longer allowed to be modified. In such cases, the initiating
change component have to contain the otherwise propagated effects within itself. This
attribute accounts for circumstances when the part design is “freeze” after it has reached
certain stages of product development lifecycle. The choice to “freeze” components is
normally determined by the company’s regulation or process requirements.
Figure 47: Dependency Modeling [273]
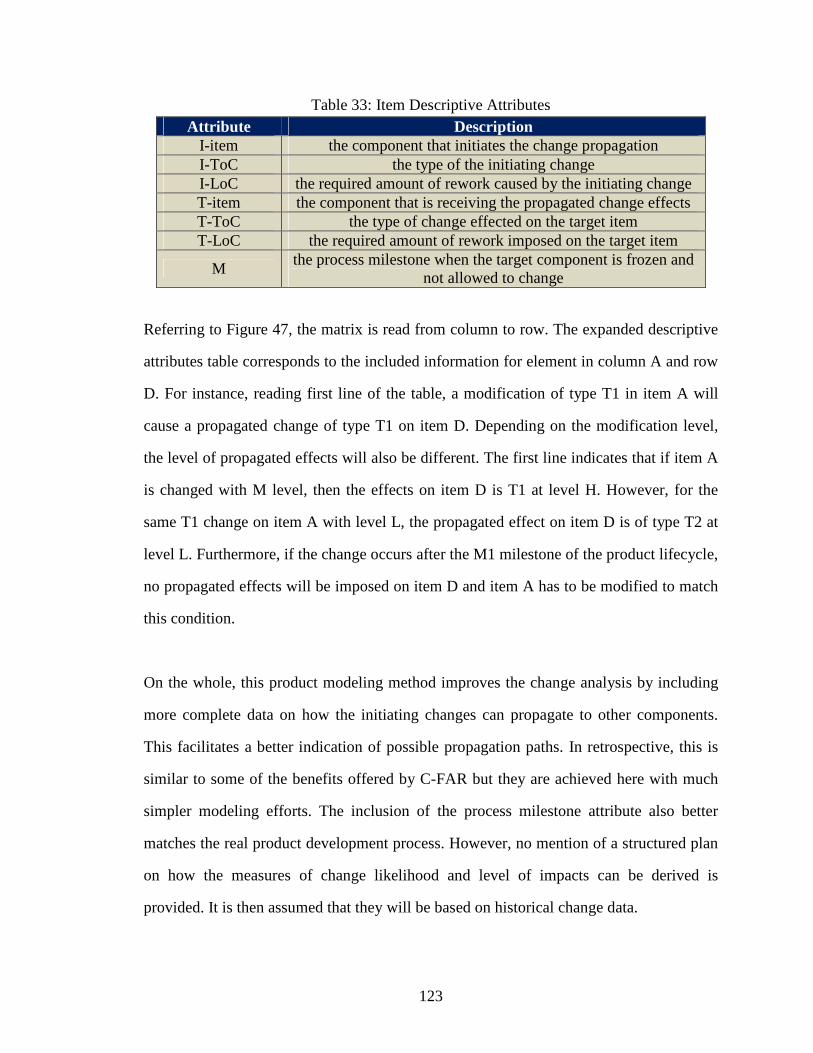
123
Table 33: Item Descriptive Attributes Attribute Description
I-item the component that initiates the change propagation I-ToC the type of the initiating change I-LoC the required amount of rework caused by the initiating change T-item the component that is receiving the propagated change effects T-ToC the type of change effected on the target item T-LoC the required amount of rework imposed on the target item
M the process milestone when the target component is frozen and
not allowed to change
Referring to Figure 47, the matrix is read from column to row. The expanded descriptive
attributes table corresponds to the included information for element in column A and row
D. For instance, reading first line of the table, a modification of type T1 in item A will
cause a propagated change of type T1 on item D. Depending on the modification level,
the level of propagated effects will also be different. The first line indicates that if item A
is changed with M level, then the effects on item D is T1 at level H. However, for the
same T1 change on item A with level L, the propagated effect on item D is of type T2 at
level L. Furthermore, if the change occurs after the M1 milestone of the product lifecycle,
no propagated effects will be imposed on item D and item A has to be modified to match
this condition.
On the whole, this product modeling method improves the change analysis by including
more complete data on how the initiating changes can propagate to other components.
This facilitates a better indication of possible propagation paths. In retrospective, this is
similar to some of the benefits offered by C-FAR but they are achieved here with much
simpler modeling efforts. The inclusion of the process milestone attribute also better
matches the real product development process. However, no mention of a structured plan
on how the measures of change likelihood and level of impacts can be derived is
provided. It is then assumed that they will be based on historical change data.
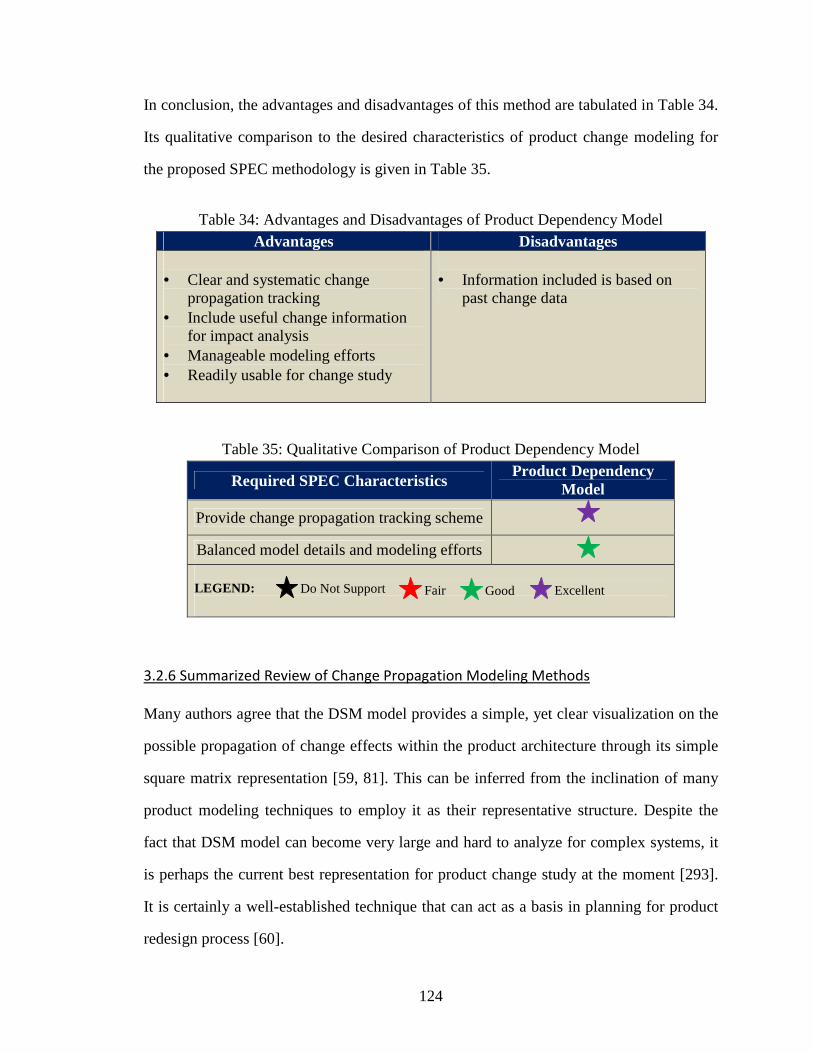
124
In conclusion, the advantages and disadvantages of this method are tabulated in Table 34.
Its qualitative comparison to the desired characteristics of product change modeling for
the proposed SPEC methodology is given in Table 35.
Table 34: Advantages and Disadvantages of Product Dependency Model
Advantages Disadvantages
• Clear and systematic change propagation tracking
• Include useful change information for impact analysis
• Manageable modeling efforts • Readily usable for change study
• Information included is based on
past change data
Table 35: Qualitative Comparison of Product Dependency Model
Required SPEC Characteristics Product Dependency
Model
Provide change propagation tracking scheme
Balanced model details and modeling efforts
LEGEND:
3.2.6 Summarized Review of Change Propagation Modeling Methods
Many authors agree that the DSM model provides a simple, yet clear visualization on the
possible propagation of change effects within the product architecture through its simple
square matrix representation [59, 81]. This can be inferred from the inclination of many
product modeling techniques to employ it as their representative structure. Despite the
fact that DSM model can become very large and hard to analyze for complex systems, it
is perhaps the current best representation for product change study at the moment [293].
It is certainly a well-established technique that can act as a basis in planning for product
redesign process [60].
Do Not Support Fair Good Excellent

125
Through their works, Pimmler and Eppinger demonstrated that a complete interaction
pattern for system architectures can be adequately illustrated using these matrix-based
methods [257]. Although the basic DSM model does not include any information on the
propagation likelihood or the level of change effects, these values can be easily added
once the interconnections between the parts have been established. It should be noted that
good redesign decisions require an understanding of the process risks and opportunities
[97] but it has been argued that the current valuation scheme for these parameters is often
biased towards past changes and thus can be misleading. Since designers can be pushed
into a specific decision space by the biasness of their methods and tools [306], a proper
care must be taken to improve the way these measures are derived.
On the other hand, there also seems to be a disagreement as to how the modeling process
is better approached. Authors such as Schaz [282] and Pimmler and Eppinger [257] had
advised that the functional approach is more suitable but Jarratt disagreed and proposed
that the focus is put instead on physical components [174]. In general, all engineering
design involves form and function: “there is no form without function and no function
without physical manifestation” [134] and their interaction actually prompts the change
propagation [298]. Depending on the problem interest, functional approach can be a
better choice than physical approach, and vice versa. For product redesign, the available
knowledge about the baseline should be exploited as maximum as possible to guide the
change planning. Because the existing physical components indicate available redesign
freedom, the physical approach by Jarratt is more reasonable for this study. However,
another main problem that exists in current product modeling for the engineering change
study is the absence of a proper guideline on the balance between the development efforts
and the level of details to be included in the model [34, 81]. Not all product components
or aspects is necessary for change propagation analysis [174] and it is important to have
the right set of information for manageable model size, especially for complex products.

126
Depending on the requirements of analysis tasks, the level of product details and hence
the model size need to be aptly controlled.
Based on this literature study, summary assessment of the identified product modeling
techniques to the desired criteria for the proposed SPEC method is shown in Table 36.
Table 36: Qualitative Comparison of Identified Change Propagation Models
Required SPEC Characteristics
Functional Change
Modeling
Component-Function
Propagation
Component Linkage Model
C-FAR
Product Dependency
Model Provide change
propagation tracking scheme
Balanced model details and
modeling efforts
LEGEND:
From the qualitative comparison presented in Table 36, product dependency model is
shown to have the overall best characteristics among other identified product models for
the scope of change study covered in the proposed method. This is mainly due to its
simple construction and complete change information for the impact analysis.
3.3 Change Impact Analysis
The most critical phase of engineering change process is the impact evaluation for the
implemented product modification [176]. This can be implied from the emphasis of many
available standards in product manufacturing industries. Unfortunately, none of these
standards provides change impact analysis method or tool as part of their guidelines
[273]. Before the modification can be analyzed to decide whether their implementation is
Do Not Support Fair Good Excellent
Best per criterion

127
acceptable, their system-wide effects such as total efforts in planning, scheduling and
resourcing have to be predicted [152].
In general, this section is focused on addressing the following research questions:
1) What are characteristics of an aircraft and its development process that can be
affected by engineering changes?
2) How to sufficiently measure change impacts on these characteristics?
3) How to manage overall aircraft redesign risks?
From this literature study, available methods and tools for change impact analysis in
software engineering are found to be arguably more advanced than those in other product
fields. Nonetheless, the key difference between software and mechanical products is that
the latter performance is highly influenced by the geometries of their physical parts [232].
The parametric links between their parts are less explicit [80] and the propagation of their
change effects highly depends on the type of interdependencies [273]. This condition
makes most methods and tools in software development rather inappropriate for use in
hardware development. Nevertheless, while they cannot be directly applied to analyze the
change impacts on hardware products, their process frameworks can be a good reference.
The dynamic requirements and the fast advancement pace of software market subject
most computer programs to frequent modification [336]. Similar to hardware product
industries, more software programs are being redesigned than newly developed and this
is indicated by the usual 70-30 ratio of maintenance-to-development research expenditure
within the software community [201]. The “maintenance” here refers to the necessary
changes on existing computer programs. In view of this, the importance of change impact
process is shared between the software and hardware product development. Based on his
research in Butler Cox Productivity Enhancement Program (PEP), Moreton outlined the

128
general process framework for change management in software engineering [237]. This
workflow ranges from identifying the change needs, analyzing its full impacts on the
system, implementing it once approved and updating the associated documentation [216],
as illustrated in Figure 48. From this framework, the main elements of change impact that
need to be focused on are costs and amount of reworks required by the modification.
Review
Change Request
Determine
Impact/ Scope of Change
Develop Cost
& Resource Estimates
Perform
Cost/ Benefit Analysis
Discuss
Implication with Customer
Document
Impact, Cost & Decisions
Reject
Request
Reject
RequestContinue
System Release
Single Change
Request
Figure 48: General Impact Analysis Step in Software Change Management [237]
The change impact analysis is undeniably a crucial step to the effectiveness of the overall
change planning process. Making strategic planning decision requires the overall problem
outlook as change effects for the product sub-areas might be connected to each other
[334], which depends on the applied methods or tools to provide the required information
for the assessment purposes [211]. Generally, the primary goals here are to trace and
analyze the dependencies involved during change propagation [41]. Based on knowledge
gained up until at this point, several essential criteria of the methods or tools that properly
capture engineering change impact analysis as intended for the SPEC method can be
outlined as follows:
(i) Capture the essences of possible change impacts
a. Clearly define evaluation metrics to assess change impacts
b. Simultaneously cover both product and process impacts
(ii) Provide a structured evaluation scheme for change impact assessment
a. Provide a clear evaluation method for identified metrics
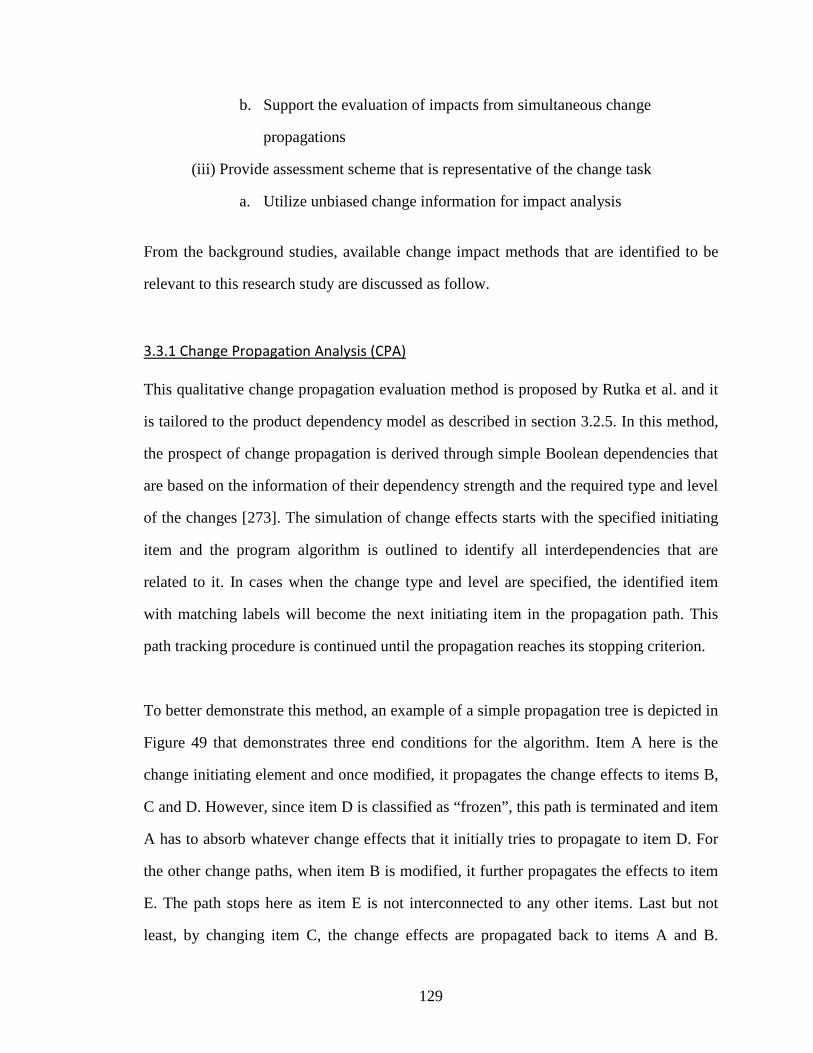
129
b. Support the evaluation of impacts from simultaneous change
propagations
(iii) Provide assessment scheme that is representative of the change task
a. Utilize unbiased change information for impact analysis
From the background studies, available change impact methods that are identified to be
relevant to this research study are discussed as follow.
3.3.1 Change Propagation Analysis (CPA)
This qualitative change propagation evaluation method is proposed by Rutka et al. and it
is tailored to the product dependency model as described in section 3.2.5. In this method,
the prospect of change propagation is derived through simple Boolean dependencies that
are based on the information of their dependency strength and the required type and level
of the changes [273]. The simulation of change effects starts with the specified initiating
item and the program algorithm is outlined to identify all interdependencies that are
related to it. In cases when the change type and level are specified, the identified item
with matching labels will become the next initiating item in the propagation path. This
path tracking procedure is continued until the propagation reaches its stopping criterion.
To better demonstrate this method, an example of a simple propagation tree is depicted in
Figure 49 that demonstrates three end conditions for the algorithm. Item A here is the
change initiating element and once modified, it propagates the change effects to items B,
C and D. However, since item D is classified as “frozen”, this path is terminated and item
A has to absorb whatever change effects that it initially tries to propagate to item D. For
the other change paths, when item B is modified, it further propagates the effects to item
E. The path stops here as item E is not interconnected to any other items. Last but not
least, by changing item C, the change effects are propagated back to items A and B.

130
However, since item B has already been affected by item A at a higher level of impact, it
will not be allowed to change again if the type of change is similar to that previously
imposed. For this algorithm, a lower or similar level of the same type of modification is
assumed to be covered by the previously imposed higher level change. On the other hand,
by changing item A again, it will trigger the same propagation tree all over again. To
avoid endless change effects propagation, the computing algorithm is set with a stopping
criterion when a previously changed item is encountered again. Alternatively, an external
counter can also be set to limit the number of allowable propagation steps.
Figure 49: Simple Change Propagation Tree [273]
Once all propagation paths have been mapped out, the risks related to the decision criteria
such as cost, time and other is analyzed. In this method, the final level of change defined
for all affected items in the propagation tree dictates the maximum value for their specific
type of change and the risk calculation is dependent on this change impact level and its
likelihood [273]. A combined risk value for the decision criteria, also called global risk,
is then derived by combining that of the individual item.

131
Overall, this method provides a clear scheme on how the propagated change impacts can
be mapped and evaluated. The use of product dependency model allows an accurate and
efficient tracking of the propagation paths, and the stopping criteria applied in the change
propagation algorithm highlights the various component roles in the propagation tree. In
addition, the risk analysis is done as a post-processing step after the paths have been
determined and this allows it to require minimal computational power as opposed to
include the analysis into the main algorithm itself [273]. The downsides of this method
are the facts that it does not detail the specific way to evaluate the measures of the risks
and does not consider the process with simultaneous initiating changes.
To summarize, the advantages and disadvantages of this method are tabulated in Table
37. Its qualitative comparison to the desired criteria of change impact analysis for the
proposed SPEC methodology is given in Table 38.
Table 37: Advantages and Disadvantages of CPA
Advantages Disadvantages
• Capture complete essences of change impact factors
• Allows consideration of both product and process parameters
• No assistance on assignment or
evaluation of change impacts
Table 38: Qualitative Comparison of CPA
Required SPEC Characteristics CPA
Capture the main essences of change impacts
Clear evaluation scheme for impact assessment
Representative of the change task at hand
LEGEND:
Do Not Support Fair Good Excellent

132
3.3.2 Progressive Change Probabilities
An identified disadvantage of many change propagation techniques is their assumption of
constant probability across the propagation tree. Since the propagated change effect also
depends on change likelihood of previous component in the tree, its probability should be
cascading from top to bottom of the product structure [160]. Alternatively said, in a
multi-level product structure, component commonalities have the potential to affect the
change likelihood for lower-level items depending on how they are interconnected to the
initiating part or component [160]. This change likelihood estimate is used to calculate
the measure of change risks, which makes it important to have a reasonable prediction of
its value. In the product risk management field, the risk model is estimated as the product
of change likelihood and scale of impacts that the change will produce [80, 176].
Ho and Li proposed an analytical procedure to calculate the progressive probability of an
engineering change for a part or component within multi-level product structures. Their
computation is based on several assumptions on the change propagation [160]:
• Lower level parts or components will not cause obsolescence or propagate change
effects upstream
• The need for propagated changes from multiple higher level component are
independent to each other
In general, computation for the progressive change probabilities is given as follows:
∑−
−×+= 1
1)()(
j
i jiECjEC PiPPjP Equation 10 [160]
<<=
10,
0
0
jiji
ji
CotherwiseC
jitemonchangescausenotwilliitemofchangegengineerinif
jitemofparentimmediateannotisiitemif
P

133
where: )( jPEC the probability of engineering changes imposed on
item njj ,,2,1, K=
jP the probability of engineering changes for item j
without considering engineering changes of higher
level items
jiji CP , the conditional probability of engineering changes for
item j resulted from engineering changes in item i
An example case is presented to illustrate this computation, which is shown in Figure 50.
Figure 50: Example Product Structure for Progressive Change Probabilities [160]
Based on the governing assumptions, change propagation flows only from top to bottom
of the tree structure. Furthermore, item 5 has three different immediate parents: items 1, 2
and 3. Following the second assumption, the change propagation effects from all of them
are taken to be independent of each other. The calculation of change likelihood on item 5
is then given as follows:
( ) ( ) ( )[ ]522535115 )3()5( PPPPPPPP ECEC ×+×+×+=
Overall, this method only outlines the analytical computation of the progressive change
likelihood. There are no other elements to assist the change impact analysis is included or
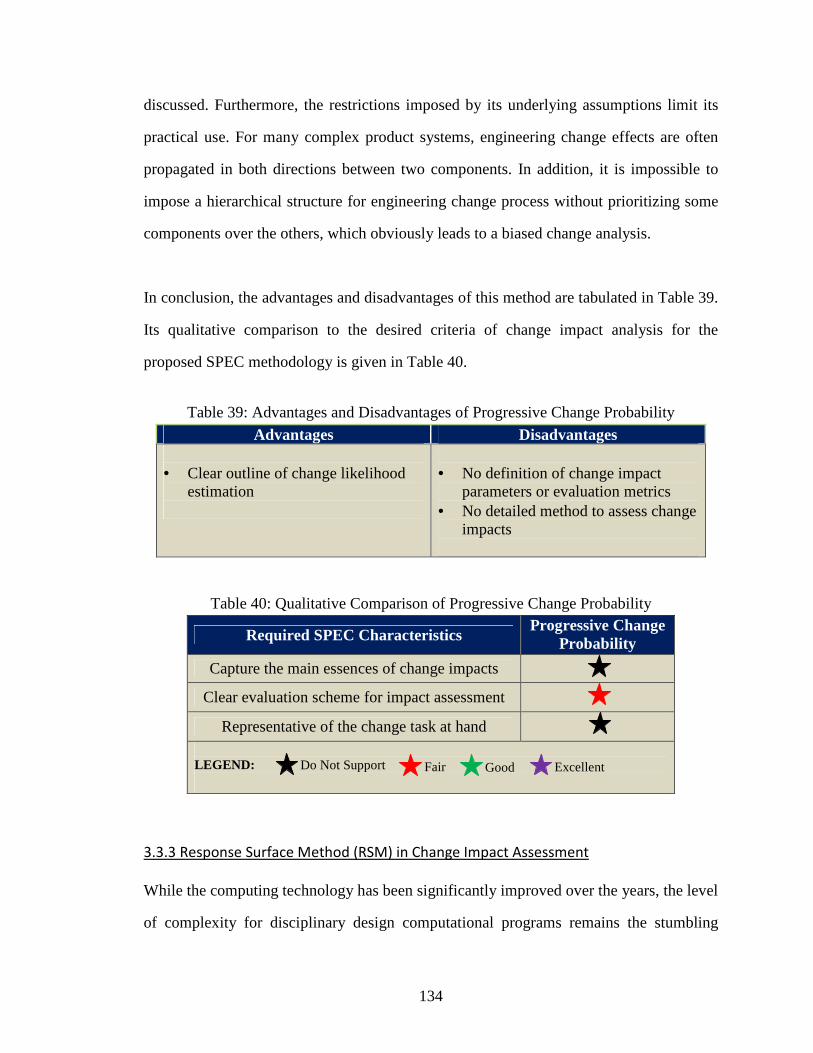
134
discussed. Furthermore, the restrictions imposed by its underlying assumptions limit its
practical use. For many complex product systems, engineering change effects are often
propagated in both directions between two components. In addition, it is impossible to
impose a hierarchical structure for engineering change process without prioritizing some
components over the others, which obviously leads to a biased change analysis.
In conclusion, the advantages and disadvantages of this method are tabulated in Table 39.
Its qualitative comparison to the desired criteria of change impact analysis for the
proposed SPEC methodology is given in Table 40.
Table 39: Advantages and Disadvantages of Progressive Change Probability
Advantages Disadvantages
• Clear outline of change likelihood estimation
• No definition of change impact
parameters or evaluation metrics • No detailed method to assess change
impacts
Table 40: Qualitative Comparison of Progressive Change Probability
Required SPEC Characteristics Progressive Change
Probability
Capture the main essences of change impacts
Clear evaluation scheme for impact assessment
Representative of the change task at hand
LEGEND:
3.3.3 Response Surface Method (RSM) in Change Impact Assessment
While the computing technology has been significantly improved over the years, the level
of complexity for disciplinary design computational programs remains the stumbling
Do Not Support Fair Good Excellent

135
block for a faster design evaluation or verification. The required high computation times
for these design models restrict the amount of program evaluations that can be fit into the
available timeframe during the early phases of design process [265]. In similar fashion,
the initial evaluation on the effects of product modification can take a long time when the
planning of the changes is being constructed. Since the change effects can determine the
success or failure of a product redesign development, it is rather imperative to be able to
estimate their potential impacts during the redesign planning to identify all design trade-
offs that are involved [314].
In their quantitative requirements traceability method, which establishes the connections
between product requirements and their inflicted design changes, Sutinen et al. used
response surface method (RSM) to quantify the estimated change effects early in the
development process [265]. In short, RSM is applied to approximate complex
computational design model by creating a simpler empirical meta-model of the process
that allows a faster change impact evaluation procedure. The meta-model is statistically
developed from relative contribution of the input variables to the interested system
response, and this knowledge is obtained from analyzing the experiments or simulations
that have been constructed from design of experiments (DoE) technique [191].
The meta-model from this RSM method is known as response surface equation (RSE)
and it is often taken to be of a second order polynomial shown as follows:
ε++++= ∑ ∑∑∑−
= +===
1k
1i
k
1ijjiij
k
1i
2iii
k
1iii0 xxbxbxbbR Equation 11 [191, 265]
where R= response of interest, 0b = intercept term, ib = regressed coefficient term for
linear terms, iib = regressed coefficient term for pure quadratic terms, ijb = regressed
coefficient term for cross-product terms, ji x,x = input variables of interest, ε = error term
associated with the second order approximation

136
Once the RSE is available, it can be used in place of complex analysis codes to study the
quantitative engineering change impacts from the proposed modification. It should be
noted that this method is extremely useful when the change impact analysis is backed by
several simulation studies [265]. For aircraft system design application, this method has
been demonstrated in several works, most prominently to this change study is its use in
Technology Identification, Evaluation and Selection (TIES) method by Mavris et al.
[228]. In that application, the RSEs are used to quantify different impacts of technology
implementation on aircraft performance properties.
On the whole, RSM can be taken as a powerful method to quantitatively estimate change
impacts during product redesign planning. The estimation of possible impacts from the
changed design is supported by the determination of relative contribution of the modified
parameters to the interested metrics. Its applications in product development process such
as TIES for aircraft system demonstrates its capability to capture the change effects on
redesigned product performances, instead of just the development process characteristics
like most change impact analysis methods. However, it should be noted that the accuracy
of its prediction depends on the approximation errors of the RSE that must be kept very
small to have meaningful impact estimation. The meta-model development can be very
time-consuming if the computer-based analysis or simulation codes are unavailable and
the application of each model is limited within the defined output and inputs boundaries
[265]. The advantages and disadvantages of this method are presented in Table 41 and its
qualitative comparison to the criteria of change impact analysis for the proposed SPEC
method is given in Table 42.

137
Table 41: Advantages and Disadvantages of RSM in Change Impact Assessment Advantages Disadvantages
• Provide means to quantitatively
estimate change impacts • Assist screening of impact
parameters based on their relative contributions on evaluation metric
• Development of meta-model can
require significant efforts • Need to be aligned with change
process to have meaningful results
Table 42: Qualitative Comparison of RSM in Change Impact Assessment
Required SPEC Characteristics RSM in Change
Impact Assessment
Capture the main essences of change impacts
Clear evaluation scheme for impact assessment
Representative of the change task at hand
LEGEND:
3.3.4 Summarized Review of Change Impact Analysis Methods
Engineering changes can simultaneously affect both product and its development process.
Having this in mind, it is essential to have proper means to predict these two categories of
change effects. In general, the main objective of change impact analysis is to estimate the
extent of effects from the proposed product changes, which can help in deciding the most
proper redesign plan [170].
In many change support methods and tools that have been identified during this literature
study, change impacts are often measured in terms of the process risks involved. By the
definition from risk management field, change risk is qualitatively estimated as a product
of change likelihood and scale of impacts that it will produce [80, 176]. Nonetheless,
very few studies are focused on examining change effects on the product, especially for
complex, multi-level product structure [160]. It is known that the modification affects the
Do Not Support Fair Good Excellent

138
product performance and the exclusion of this aspect from the impact analysis is a serious
oversight. Typical change methods only consider the impact of changes on cost factors
but not so much on time, solution flexibility or quality of the redesigned product [142].
This situation is mainly due to the fact that the disciplinary evaluations are usually very
time-consuming and require tremendous efforts to be executed during the change analysis
process. One promising method to cope with this problem is RSM. By approximating the
meta-model that represents the high-fidelity analysis codes, computation can be made in
a faster pace than having to run the simulation study every time a product element is
changed. Bear in mind that if the meta-model has to be constructed through manual
experimentation, it might still take too much time and efforts. Nonetheless, there is a high
need to ensure that the changes do not affect the product’s capability to perform to its
operational requirements, both new and existing ones.
Moreover, an unbiased scheme to account for the possibilities of propagated changes and
their impacts is required. In general, their measure can be made either qualitatively or
quantitatively. Although the qualitative approach is generally less precise, its results can
be obtained much faster than the parametric formulas in quantitative approach [273]. This
choice basically depends on the assessment objective. For the proposed SPEC method, its
main objective is to compare and select the best change implementation plan among the
potential alternatives. It is clear that this is a relative assessment problem and qualitative
measurement is rather adequate for this method.
To summarize, although none of the identified change impact analysis methods perfectly
matches the outlined functionalities to be directly applied in the proposed SPEC method
as indicated by Table 43, they provide invaluable information for the construction of a
better method to assess the consequences of engineering changes.

139
Table 43: Qualitative Comparison of Identified Change Impact Analysis Methods
Required SPEC Characteristics CPA
Progressive Change
Probabilities
RSM in Change Impact
Analysis Capture the main essences of
change impacts
Clear evaluation scheme for impact assessment
Representative of the change task at hand
LEGEND:
From the qualitative comparison in Table 43, CPA has the better method that captures the
essences of change effects and its definition of evaluation metrics considers both product
and its development process. However, it lacks a structured guidance on how the metrics
should be evaluated. On contrary, while the use of RSM for prediction of change impacts
needs to be tailored to the change process characteristics, it offers a straightforward
scheme on how to appropriately calculate the evaluation metrics. Therefore, it is taken to
have the best evaluation scheme among the identified methods, assuming the appropriate
simulation analysis tools are available.
3.4 Change Implementation Planning
At first glance, the implementation of a product modification might deceptively seem like
a simple task. However it often ends up being more complicated once the actual redesign
process is executed. The study in Westland Helicopters revealed that their most difficult
and costly redesign projects are actually those associated with design retrofits, which
often appear rather straightforward during the initial planning [80]. It is very rare that the
changes made on one component does not affect the others [267], especially for complex
Do Not Support Fair Good Excellent
Best per criterion

140
products [273]. Hence the change initiator or implementer is responsible to be aware of
all potential propagated effects to decide on the right trade-offs during planning of the
modification [83]. In addition, many redesign cases involve several initiating changes and
their effects can be interconnected [67, 174, 218]. According to Han, changes can be
implemented independently or concurrently only if their driving factors have been clearly
outlined [152]. Prioritization for these changes can also be predetermined [134].
On the whole, based on these various elements of change implementation process, a good
redesign strategy is required as to how the knowledge of possible risks and impacts can
be used to create a better product modification plan. In general, this section is focused on
addressing the following research questions:
1) What are important criteria for a good change implementation plan?
2) What are control parameters that are available in change planning?
3) How to generate implementation plan for the required changes?
4) How to select the best change implementation plan among possible
alternatives?
The importance of change propagation and impact analyses has been emphasized by the
discussion from previous sections. A reliable change propagation tracking is key to the
success of product redesign planning [187] as it requires full knowledge of the possible
downstream process [78]. Nevertheless, because engineering change has been perceived
negatively within the design process, there is a clear lack of support tools and methods
when it comes to assisting designers in strategically planning for the best change
implementation. Even if the management of the driving requirements and the derivation
of the proper product model have been accomplished, there is often little or no support at
all for generating the change implementation alternatives and selecting the best proposal
[36]. The information obtained from the change propagation and impact analyses is often

141
only applied to assess redesign risks at the high process level. Jarratt stated that many
research efforts in this engineering change field have been individually pursued and thus
the application of resultant methods and tools have yet to be streamlined together [174].
This situation needs to be resolved to enable a better product redesign planning solution,
which is important because the decisions made during early design stages, for example,
can determine as much as 70% of the overall product costs [318].
Based on this realization, as well as the arguments made in previous chapters, several
criteria are outlined to compare the advantages and disadvantages of the identified tools
and methods for redesign planning. They are listed as follows:
(i) Provide a structured redesign strategy
a. Proper use of change information in planning
b. Include proper expert interactions in the process
(ii) Provide a proper redesign plan assessment scheme
a. Define proper metrics to evaluate alternative plans
b. Define a structured scheme for plan selection
(iii) Scalable to simultaneous initiating changes case
a. Allow concurrent planning of several change implementations
3.4.1 RedesignIT
RedesignIT is essentially a computer-based tool that is constructed based on the concept
of model-based reasoning to generate and evaluate product redesign proposals [246]. The
causal reasoning defined between identified physical quantities of the product design is
the main element that is used to plan for its modification [176]. In general, the primary
application of this RedesignIT tool is to help product designers plan for required changes
during the initial stages of the redesign process. Based on the inputs of performance

142
targets by the user, it will automatically generate the best modification plan in accordance
to the change interrelationships defined in the product model [247].
Operating principles of RedesignIT tool can be briefly described as follows. First of all,
the product model is constructed. Design parameters in the model are divided into two
categories: target quantities and exogenous quantities. The setting of the target quantities,
which is allowed to either be maximized or minimized, is the translation of the design
goals that need to be accomplished [246]. To achieve specified redesign goals, the setting
for exogenous quantities is varied accordingly to generate possible combination of
change plans. These potential design change plans are ranked based on their degree of
accomplishing the goals, nature and severity of the side effects to aid designer in making
the selection. To better illustrate the concept behind this tool, an example case of a four-
stroke, turbocharged diesel engine is shown in Figure 51. Note that this representation
details have been reduced for better illustration.
Figure 51: A Four-Stroke, Turbocharged Diesel Engine Model [247]

143
Assume that the main goal for the engine redesign is to have a larger output torque. When
initiated, the program will search for all possible ways to achieve this target. This leads to
the increment of piston stroke, intercooler size or area of intake ducts, as can be observed
in Figure 51. However, the latter two options have a constraint condition that opposes the
intended modification and therefore, the piston stroke is selected as the initial change. By
increasing the piston stroke, it also causes changes to several other quantities such as an
increase in fuel/air mixture and a reduction of engine durability. The program algorithm
then automatically searches for the necessary changes to counter these undesirable side
effects. This process will eventually be terminated when there is no more exogenous
quantity that could be changed, even if the undesired side effects are not yet entirely
eliminated.
It can be seen that the concept behind its execution really takes into account the strategic
redesign planning. Product model to be used with this tool does not require accurate
numerical inputs but instead, it qualitatively works with information regarding the nature
of the causal relationship, the direction of the monotonic relationship and the qualitative
magnitude of the association [247]. It can be noted that the principles of causal reasoning
is applied to generate the behavior of possible change propagation [247, 289]. In addition,
the notion of exogenous quantities is based on Keller et al. [188, 247] while the concept
of qualitative simulation is based on Kuiper et al. [194, 247].
On the other hand, although the product model does not entail numerical input values, it
requires a thorough understanding of the physics behind the product design construction.
It is rare that “design rationale” information is properly documented in available PDM or
PLM packages [36]. This could be a problematic situation as designers are required to
have thorough understanding of overall product aspects, which is impossible for complex
products like an aircraft system. The situation can be remedied by having the inputs from

144
related experts across the development process but that increases the required modeling
time and efforts. In addition, to allow for a better assessment of change likelihood, it is
necessary to include an indication of the magnitude for the causal relationship on top of
their monotonic direction [247]. This is emphasized during the discussion on available
change propagation modeling techniques.
In addition, the model also limits the application of redesign process since it assumes that
the product architecture will essentially remains the same after the redesigning effort.
This can be implied by the way the exogenous quantities are defined in the model, which
is static throughout the process. This restriction is a big disadvantage and needs to be
improved as most redesign projects often involve notable design deviations from the
baseline product architecture. As stated by Han, change methods should consider the
possibility that the applied engineering changes will introduce new sub-modules into the
architecture instead of limiting their analysis capability on only changes that can be made
to static product modules [152]. Moreover, the causal reasoning algorithm can also lead
towards unnecessary changes while trying to counter the emerging side effects from the
primary modification. There is no “check and balance” process to analyze the trade-offs
between accepting the negative side effects that might not even be significant enough to
cause the product to fail its performance constraints and incorporating additional changes
to resolve them. This drawback goes back to the limitations due to product model and
change propagation tracking. Ultimately, this creates a high possibility that the added
costs and efforts could exceed those that would have been incurred by directly fixing the
affected component.
Finally, the concept behind this redesign strategy is goal-directed. This indicates that the
redesign objective has to be translated into available target quantities within the product
model before the process can be executed. However, the redesign process involves more

145
than just high-level system performance requirements. The cases of specific component
replacement due to new technology implementation based on customer preferences are
not applicable for this tool since no target quantities in the product model directly capture
this kind of change motivation. Plus, the automated generation of redesign plans has no
interaction with designers and the redesign planning decision is solely based on the goal
of satisfying all target quantities regardless of the risks or efforts involved.
To summarize, the advantages and disadvantages of this method are tabulated in Table 44
and its qualitative comparison to the desired criteria of change planning analysis for the
proposed SPEC methodology is given in Table 45.
Table 44: Advantages and Disadvantages of RedesignIT Advantages Disadvantages
• Provide a structured and automated
redesign planning strategy • Works without requiring an
accurately numerical change model • Generate best redesign plan that
satisfies target goals • Consider simultaneous change
implementations
• No experts interaction • Do not consider redesign risks
involved with proposed modifications
• Potentially entail extra modeling efforts
Table 45: Qualitative Comparison of RedesignIT
Required SPEC Characteristics RedesignIT
Provide a structured redesign strategy
Provide a proper redesign plan assessment scheme
Scalable to simultaneous initiating changes case LEGEND:
Do Not Support Fair Good Excellent
146
3.4.2 KRITIK
KRITIK (a Sanskrit word that can be translated as “the designer”) is a design support tool
that contains 17 processing modules that correspond to typical tasks involved during the
product development process [143]. These include procedures for design retrieval, design
adaptation, design storage, candidate-design selection and others. It integrates case-based
and model-based reasoning principles to derive a new product by adapting the existing
design that has the closest characteristics to the target requirements [145]. In KRITIK, the
design modification process is taken as a task of gathering necessary information
regarding the deficiencies of the baseline design in comparison to the target specifications
and based on the differences, changes on some parts of its structure that could make its
performance closer to the desired target are proposed [69]. According to Goel and Craw,
KRITIK was the first autonomous design system that fully addressed case-based design
tasks [144].
The heart of this KRITIK program is the structure-behavior-function (SBF) model that is
constructed from the knowledge of causal behaviors that map the product structure to its
intended functions [145]. In this perspective, a product system will be represented by the
components, the substances (i.e. energy and material flow) and the relationships between
them, which describe the specific behavioral state of the product design. Moreover, the
function is treated as a transformation link from one behavioral state to another that
explains how physical elements of the product achieve their designated functions [217].
This information is utilized by KRITIK to plan for the required changes when the output
of the behavioral state (i.e. current product capability) differs from the target [68]. In
brief, KRITIK’s modification-generation procedure is illustrated as in Figure 52.

147
Define Redesign Targets
Identify and Define the
Corresponding Functional
Difference
Ranking of Redesign Cases
All Redesign
Cases Resolved?
Identify Potential
Redesign Solutions
Ranking of Redesign
Solutions
Select the Current
Highest-Ranked Case
Select the Current
Highest-Ranked Solution
Solution Case
Available?
YES
NO
NO
Detailed Redesign Plan
YES
Update Model with
Selected Solution
Figure 52: Summarized Redesign Procedure in KRITIK
The process starts with a clear definition of the desired functionalities or the modified
target requirements. Based on the product’s SBF model, its affected functions that will be
considered for the modification process are identified. Next, the differences of its current
functional metrics to the targets are established. In cases where more than one functional
difference needs to be considered, they are ranked based on their difficulty level, with the
most difficult one to be resolved is given the highest priority and considered first. Based
on the underlying causal reasoning for the function in SBF model, possible modifications
to achieve the specific target can be derived. If more than one possible way to redesign
the product is available, the potential modifications are heuristically ranked according to
their execution difficulty. The program then searches through its database to find whether
a known solution that matches the proposed change is available. If not, this program will
abandon the candidate modification and pursue the subsequent highest-ranked alternative
plan. Before the start of next redesign cycle for the subsequent functional difference case,
the model states are updated with the selected modification. The process ends when all
functional differences have been resolved.

148
On the whole, this tool captures many essences of a strategic product redesign planning
particularly the concurrent initiating changes situation. By ranking the required redesign
tasks according to their difficulties and updating the system model before a new cycle of
modification planning is executed, it provides a structured scheme to simultaneously plan
for the necessary changes and avoid major conflicting effects.
Nevertheless, there are also a few setbacks that can be associated with this method. Due
to its case-based nature, the redesign plans are constrained by known solutions that are
available in the database. The basic principle behind case-based design methods is to
solve the current problem by retrieving and adapting the closest past solution [143]. It
relies on the analogy to the past problem that can provide some insights on how to solve
it [217]. Accordingly, the pool of possible change solution is limited to the stored cases.
Moreover, the redesign process is executed here with the assumption that each function
can be localized to certain parts of the product, which corresponds to a specific design
case. However, this concept of design case is hardly applicable to many complex product
structures as it is difficult to isolate the designs into totally independent areas of decision-
making [217]. In such cases, the existing relationships between different “case” plans are
overlooked during their individual planning process and this situation can affect the
overall performance metrics. Generally, this makes its application rather limited to small,
simple engineering devices [144]. Additionally, its redesign focus on the functions might
be a problem to accommodate physically-motivated changes and it also ignores other
essential evaluation metrics for change plan such as its risks and costs. Finally, with
similar argument to the modeling disadvantages of RedesignIT, the SBF model requires
thorough understanding of the physic-based principles behind the product design in order
to extract all causal relationships between its components. This require high modeling
efforts since most PDM or PLM systems are not equipped with such information storage
[217].

149
On the whole, the advantages and disadvantages of this method are tabulated in Table 46
and its qualitative comparison to the desired criteria of change planning analysis for the
proposed SPEC methodology is given in Table 47.
Table 46: Advantages and Disadvantages of KRITIK
Advantages Disadvantages
• Provide a structured and automated redesign planning
• Do not require an accurately numerical change model
• Generate best redesign plan that satisfies the target goals
• Consider simultaneous changes implementation
• No experts interaction • Do not consider redesign risks
involved with proposed modifications
• Constrained by the efficiency of the case database
• Potentially entail extra modeling efforts
Table 47: Qualitative Comparison of KRITIK
Required SPEC Characteristics KRITIK
Provide a structured redesign strategy
Provide a proper redesign plan assessment scheme
Scalable to simultaneous initiating changes case
LEGEND:
3.4.3 Change Prediction Method (CPM)
This Change Prediction Method (CPM) is conceived to assist designers in planning their
product redesign development process and incorporating the assessment of change effects
propagation into consideration [80, 176]. Through its procedures, the redesign decision-
making process is supported by the provision of estimated risks that the modification in
one component will affect the others within the existing design architecture [187]. Based
on two numerical DSMs that contain the measures of change likelihood and impact for
Do Not Support Fair Good Excellent
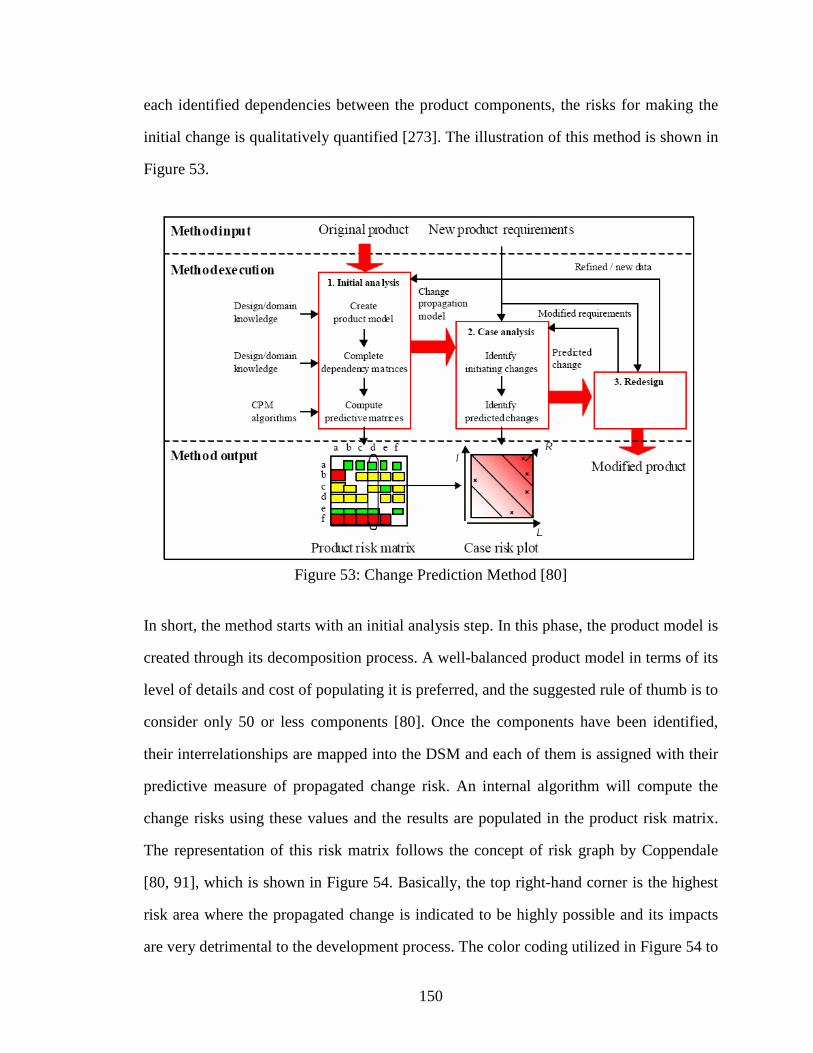
150
each identified dependencies between the product components, the risks for making the
initial change is qualitatively quantified [273]. The illustration of this method is shown in
Figure 53.
Figure 53: Change Prediction Method [80]
In short, the method starts with an initial analysis step. In this phase, the product model is
created through its decomposition process. A well-balanced product model in terms of its
level of details and cost of populating it is preferred, and the suggested rule of thumb is to
consider only 50 or less components [80]. Once the components have been identified,
their interrelationships are mapped into the DSM and each of them is assigned with their
predictive measure of propagated change risk. An internal algorithm will compute the
change risks using these values and the results are populated in the product risk matrix.
The representation of this risk matrix follows the concept of risk graph by Coppendale
[80, 91], which is shown in Figure 54. Basically, the top right-hand corner is the highest
risk area where the propagated change is indicated to be highly possible and its impacts
are very detrimental to the development process. The color coding utilized in Figure 54 to
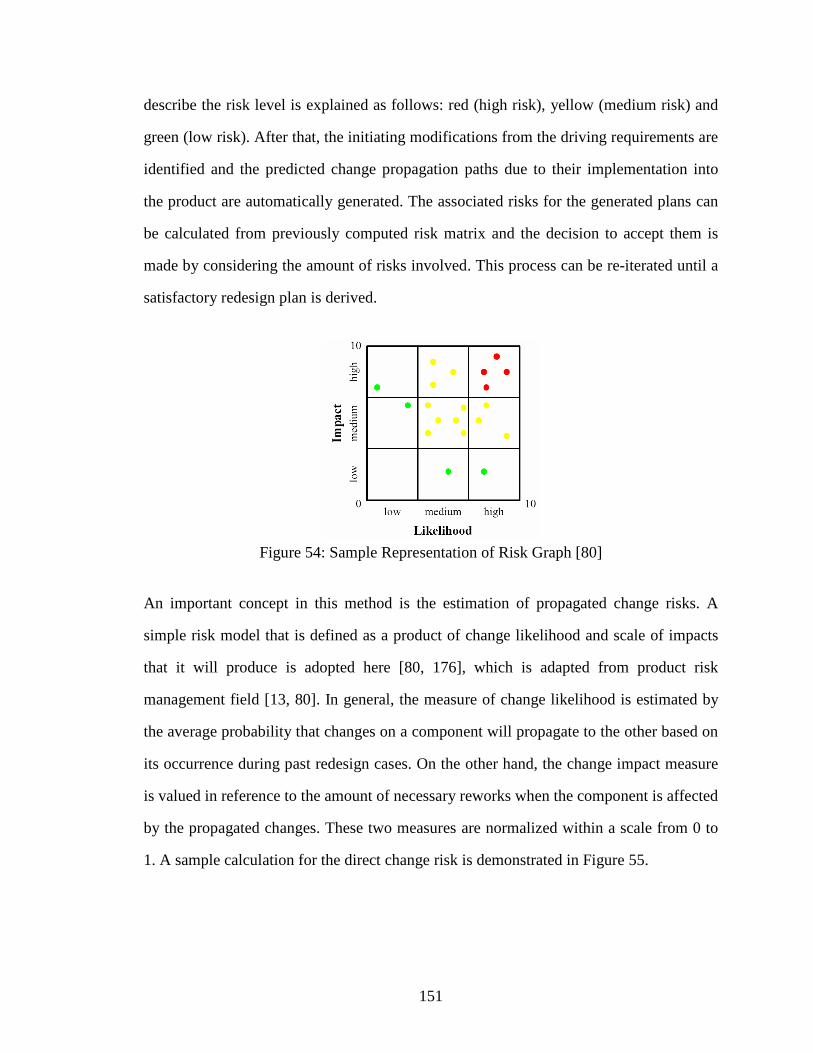
151
describe the risk level is explained as follows: red (high risk), yellow (medium risk) and
green (low risk). After that, the initiating modifications from the driving requirements are
identified and the predicted change propagation paths due to their implementation into
the product are automatically generated. The associated risks for the generated plans can
be calculated from previously computed risk matrix and the decision to accept them is
made by considering the amount of risks involved. This process can be re-iterated until a
satisfactory redesign plan is derived.
Figure 54: Sample Representation of Risk Graph [80]
An important concept in this method is the estimation of propagated change risks. A
simple risk model that is defined as a product of change likelihood and scale of impacts
that it will produce is adopted here [80, 176], which is adapted from product risk
management field [13, 80]. In general, the measure of change likelihood is estimated by
the average probability that changes on a component will propagate to the other based on
its occurrence during past redesign cases. On the other hand, the change impact measure
is valued in reference to the amount of necessary reworks when the component is affected
by the propagated changes. These two measures are normalized within a scale from 0 to
1. A sample calculation for the direct change risk is demonstrated in Figure 55.

152
Figure 55: Direct Propagated Change Risk Calculation [80]
Besides the direct effects, there are also indirect change impacts. It is of high interest to
be able to evaluate the total risks from both direct and indirect propagated change effects
during redesign planning process. Here, the calculation of combined change risk is
described using an example case shown in Figure 56, which is assumed to represent all
possible change propagation paths in the sample product design architecture.
Figure 56: Example Case for Combined Change Propagation Risk Calculation [80]
To calculate the combined risk for change propagating from component a to b:
( )∏ −−= ubabR ,, 11 ρ Equation 12 [80]
ububauub il ,,,, σρ = Equation 13 [80]
where: abR , combined risk of change propagation from a to b
ub,ρ direct risk of change propagating from all intermediate
components u that link between b to a

153
au,σ likelihood of change propagation from a to u
ubl , direct likelihood of change propagating from u to b
ubi , direct impact of change propagating from u to b
Therefore, based on Figure 56:
( ) ( )( )( )[ ]fbdbabubabR ,,,,, 111111 ρρρρ −−−−=−−= ∏
( )( )( )[ ]fbfbafdbdbadababab ilililR ,,,,,,,,, 1111 σσ −−−−=
( )( )( )[ ]fbfbafdbdbadababab illillilR ,,,,,,,,, 1111 −−−−=
It was suggested by Rutka et al. that CPM is evidently one of the most advanced change
propagation method that is presently available [273]. The output of this method can be
used to aid designers in planning for the least risky product modification to satisfy the
imposed requirements. According to Clarkson et al., the relative success of this method in
the industry lies in its use of only generic information but the powerful application of its
outcomes [80]. It should be known that several assumptions have been incorporated into
the computing algorithm for the combined change risk. Since the propagated engineering
change effects can return back to the initial modified component and thus creates possible
endless loops of propagated effects, the limit is set to three or four propagation steps [80].
This simplification is backed by the notion that change probability rapidly decreases with
propagation steps and thus will not have significant impacts in comparison to the ones
calculated in earlier steps. This has been demonstrated to be a valid assumption with a
sample application on a helicopter redesign process [80].
However, even with this simplification, the amount of required computational efforts can
rapidly increase for large product model [175, 273]. A Monte Carlo-based calculation
method is proposed to remedy this problem. In this new estimation approach, the problem

154
is further simplified. The probability of change propagating from one component to the
other connected components is assumed to be mutually exclusive to each other, which
means that only one propagation path can be selected. This turns the change propagation
problem into a series of “random walk” [175]. To ensure that the probability is mutually
exclusive to each other, the probability of selecting none of the potential propagated paths
is added and they are all normalize to the total probability. It has been demonstrated that
this probabilistic approach arrived to mostly the same conclusive results as the ones
obtained from the original CPM but with much less computational time [175].
Despite its usefulness in assisting product designers in planning the engineering change
implementation, there are also several drawbacks of this method. First of all, although it
highlights the propagation paths and the risks associated with them, no direct redesign
planning strategy is involved during the automated generation of redesign plan [120]. The
complete specification of the change plan is automatically generated by a computer
algorithm based on the predicted change propagation tree without any decision inputs
from designers. Furthermore, the change likelihood and risk definitions used in this
method are too broad to capture the essences of change propagation. How a component is
affected by the changes will depend on the modification of the preceding component in
the propagation path [80]. However, the automated change propagation algorithm in this
method does not formally consider such details [265, 273]. It relies heavily on the
estimated inputs based on previous change experiences [120, 175, 265], which can lead to
a biased evaluation of the process. Moreover, according to the reference literature, the
required changes are independently analyzed in this method [265] and hence the decision
to implement them is based on separate tradeoffs that could easily overlook their possible
interactions. Many product redesign problems deal with more than one required initiating
change and their effects are interconnected with each other [120, 272, 332]. However, it
should be noted that not all change processes need to be considered simultaneously when

155
they are totally independent of each other. Last but not least, this method also requires a
high computational effort for the analysis of large, complex products. Though the Monte
Carlo-based approach has been introduced to alleviate some of these problems, its
probabilistic calculation still need a much clearer guidance on how certain parameters are
being defined. For instance, the distribution for change propagation likelihood or that for
the change risks needs to have a good basis of definition, which is not clearly outlined in
the reference literature.
Overall, the advantages and disadvantages of this method are tabulated in Table 48 and
its qualitative comparison to the criteria of change planning analysis for the proposed
SPEC methodology is given in Table 49.
Table 48: Advantages and Disadvantages of CPM
Advantages Disadvantages
• Provide a structured and automated redesign planning
• Works with a simple risk model • Provide selection of change plans
based on their risks
• No experts interaction during
generation of the change plans • Risk evaluation can be misleading
due to high reliance on past change data
• Consider initiating changes separately during planning
• Can be computationally expensive
Table 49: Qualitative Comparison of CPM to Desired Criteria
Required SPEC Characteristics CPM
Provide a structured redesign strategy
Provide a proper redesign plan assessment scheme
Scalable to simultaneous initiating changes case
LEGEND:
Do Not Support Fair Good Excellent

156
3.4.4 Summarized Review of Change Planning Methods
Based on above discussion, it can be seen that most change methods do not include any
implementation strategy in their routines. As stated by Clarkson et al., a high reliance is
put on the past experiences of product design experts to manually try to minimize the
change effects [79]. In addition, most available methods rely heavily on historical data
that can lead to a biased change propagation analysis. Since the characteristics of
engineering changes can differ from case to case, taking the average historical measure to
estimate the change likelihood and impact metrics without considering the differences in
change problem scenarios can mislead the overall risk evaluation. Depending on the type
and level of executed changes, the probability for change propagation phenomenon can
be affected differently. In decision-making process, the information provided through
computer tools highly influences user’s choice of action [305]. Thus it needs to be
ensured that the provided decision aids are truly reflective of the actual process.
Han suggested that an automated change propagation analysis should be applied only in
cases with well-defined and static product structures [152]. As can be observed, most
automatically generated change plans assume that physical product components in the
existing architecture will remain the same as it is before the proposed initial modification.
This is not always true as some revolutionary changes can take place and consequently
modify the dynamics between the components. For instance, if a pump unit is modified,
the automated redesign algorithm can only capture the changes in the magnitudes of its
already defined parameters. To change from a pneumatic pump to an electrical pump, for
instance, is definitely out of its capability as to predict the subsequent propagation paths.
Also, most of these algorithms do not take into account the concurrent handling of the
initiating engineering changes. Unless the effects on the various initiating components are
completely independent such that their propagation paths will never cross each other,
their interactions have to be considered during planning. By evaluating them separately,

157
their combined effects can be overlooked and this can be a crucial omission during risk
analysis.
To summarize, although none of the identified change implementation planning methods
exactly matches the outlined functionalities to be directly applied in the proposed SPEC
method as indicated by Table 50, all of them can be used as solid references.
Table 50: Qualitative Comparison of Change Implementation Planning Methods
Required SPEC Characteristics
RedesignIT KRITIK CPM
Provide a structured redesign strategy
Provide a proper redesign plan assessment scheme
Scalable to simultaneous initiating changes case
LEGEND:
From the qualitative comparison in Table 50, CPM is evaluated to have a slightly better
method in exploiting the proper change information to generate and evaluate plans for
change implementation. Their use of risks measure is considered the most relevant to
decide on redesign plans, even though the risks in terms of product performances should
be added for a complete assessment. It should also be stressed that none of these methods
includes any interaction with designers while generating the change plans and this is the
main deficiency that needs to be improved. For concurrent handling of initiating changes,
the ranking scheme in KRITIK is considered as the most structured procedure.
Do Not Support Fair Good Excellent
Best per criterion

158
3.5 Other Enabling Techniques and Definitions
Based on previous discussion on available change methods and tools, several areas of
improvements to match their capabilities to the intended characteristics of the proposed
SPEC methodology have been recognized. Further literature reviews have been done to
discover several enabling techniques or standard definitions that are well-recognized in
the industry to close these gaps. Improvements that are considered as urgent for this
research study can be categorized into following areas of concentration:
• Derivation of a change impact assessment scheme
• Derivation of a change propagation prediction scheme
As can be concluded from previous sections, an unbiased scheme to account for the
possibilities of propagated changes and their impacts is required. This is important to
ensure the integrity of the assessment results, which will also affect the redesign decision
made based on them. The measures can be assigned either qualitatively or quantitatively.
Although qualitative approaches are less precise, their results can be obtained much faster
than the parametric formulas in quantitative approaches [273]. This choice basically
depends on the assessment objective. For the proposed SPEC method, its main goal is to
compare and select the best change implementation plans among the possible ones. It is
apparent that the assessment is comparative in nature, which indicates that the qualitative
measurement is also adequate for the process.
3.5.1 Qualitative Change Impact Measurement
To enable change impact analysis, the measure of predicted level of effects from the
modification has to be included into the product change model. However, during this
modeling stage, no information is yet available on the required modification. Without any
information on the specific change type and level that will be made, the assignment of
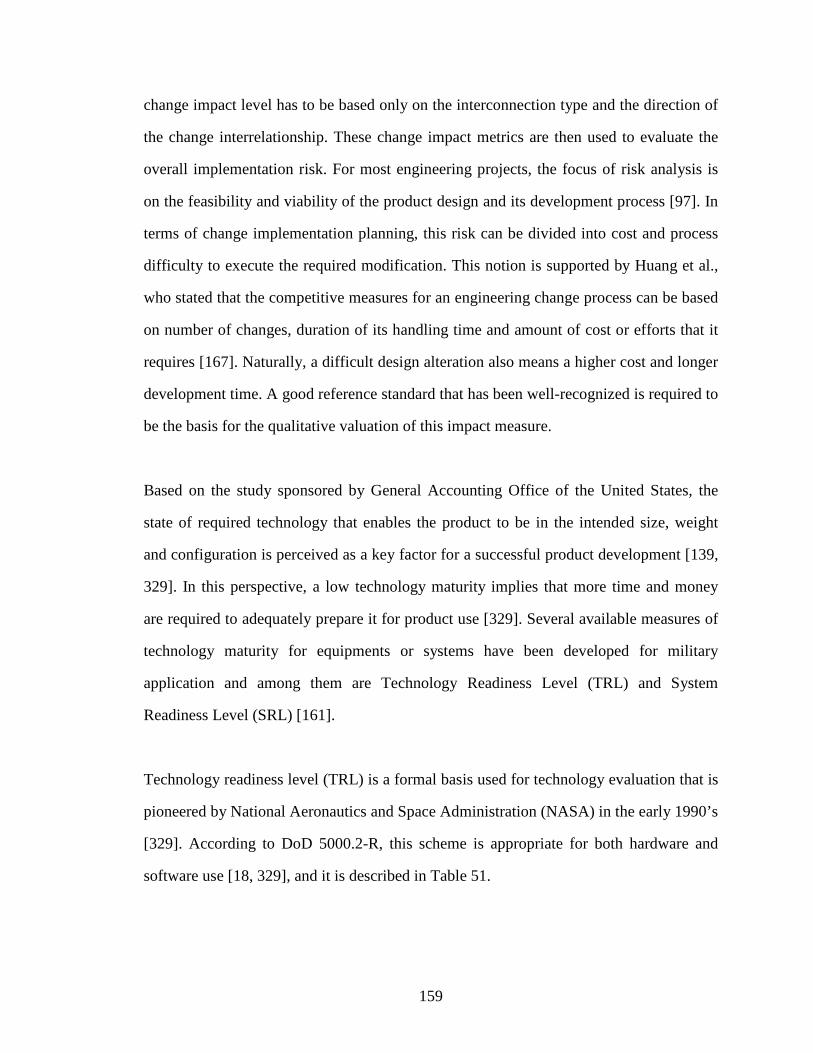
159
change impact level has to be based only on the interconnection type and the direction of
the change interrelationship. These change impact metrics are then used to evaluate the
overall implementation risk. For most engineering projects, the focus of risk analysis is
on the feasibility and viability of the product design and its development process [97]. In
terms of change implementation planning, this risk can be divided into cost and process
difficulty to execute the required modification. This notion is supported by Huang et al.,
who stated that the competitive measures for an engineering change process can be based
on number of changes, duration of its handling time and amount of cost or efforts that it
requires [167]. Naturally, a difficult design alteration also means a higher cost and longer
development time. A good reference standard that has been well-recognized is required to
be the basis for the qualitative valuation of this impact measure.
Based on the study sponsored by General Accounting Office of the United States, the
state of required technology that enables the product to be in the intended size, weight
and configuration is perceived as a key factor for a successful product development [139,
329]. In this perspective, a low technology maturity implies that more time and money
are required to adequately prepare it for product use [329]. Several available measures of
technology maturity for equipments or systems have been developed for military
application and among them are Technology Readiness Level (TRL) and System
Readiness Level (SRL) [161].
Technology readiness level (TRL) is a formal basis used for technology evaluation that is
pioneered by National Aeronautics and Space Administration (NASA) in the early 1990’s
[329]. According to DoD 5000.2-R, this scheme is appropriate for both hardware and
software use [18, 329], and it is described in Table 51.
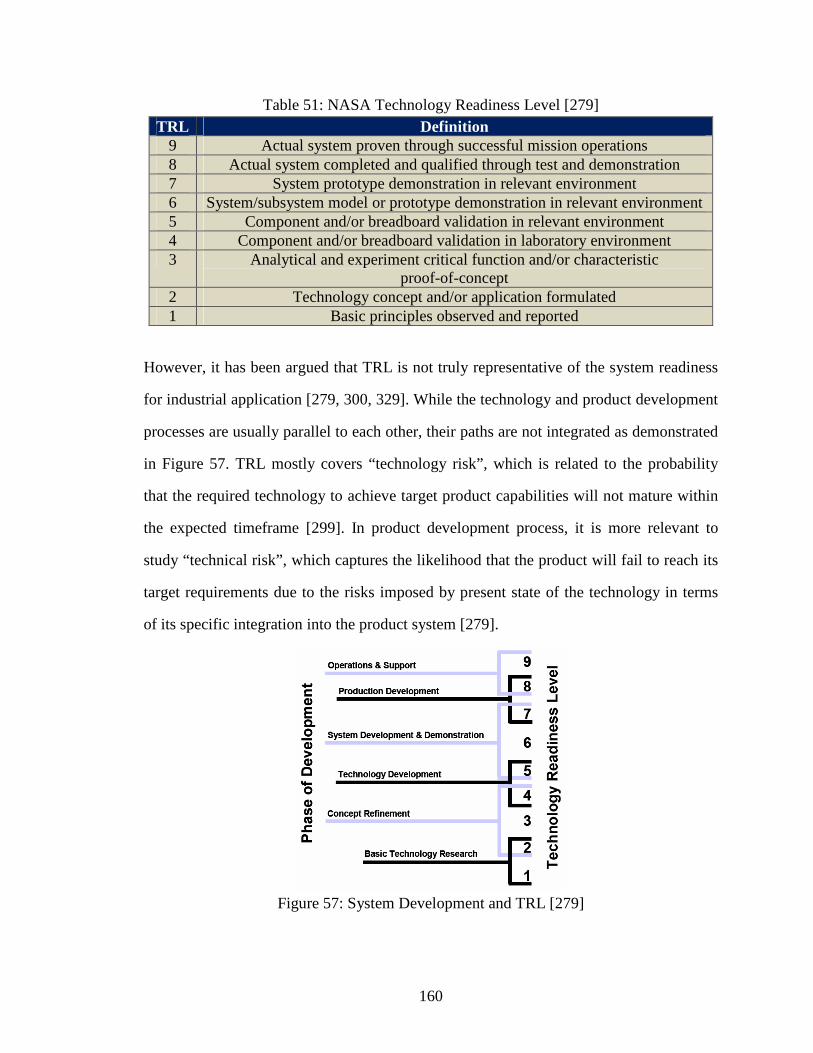
160
Table 51: NASA Technology Readiness Level [279] TRL Definition
9 Actual system proven through successful mission operations 8 Actual system completed and qualified through test and demonstration 7 System prototype demonstration in relevant environment 6 System/subsystem model or prototype demonstration in relevant environment 5 Component and/or breadboard validation in relevant environment 4 Component and/or breadboard validation in laboratory environment 3 Analytical and experiment critical function and/or characteristic
proof-of-concept 2 Technology concept and/or application formulated 1 Basic principles observed and reported
However, it has been argued that TRL is not truly representative of the system readiness
for industrial application [279, 300, 329]. While the technology and product development
processes are usually parallel to each other, their paths are not integrated as demonstrated
in Figure 57. TRL mostly covers “technology risk”, which is related to the probability
that the required technology to achieve target product capabilities will not mature within
the expected timeframe [299]. In product development process, it is more relevant to
study “technical risk”, which captures the likelihood that the product will fail to reach its
target requirements due to the risks imposed by present state of the technology in terms
of its specific integration into the product system [279].
Figure 57: System Development and TRL [279]
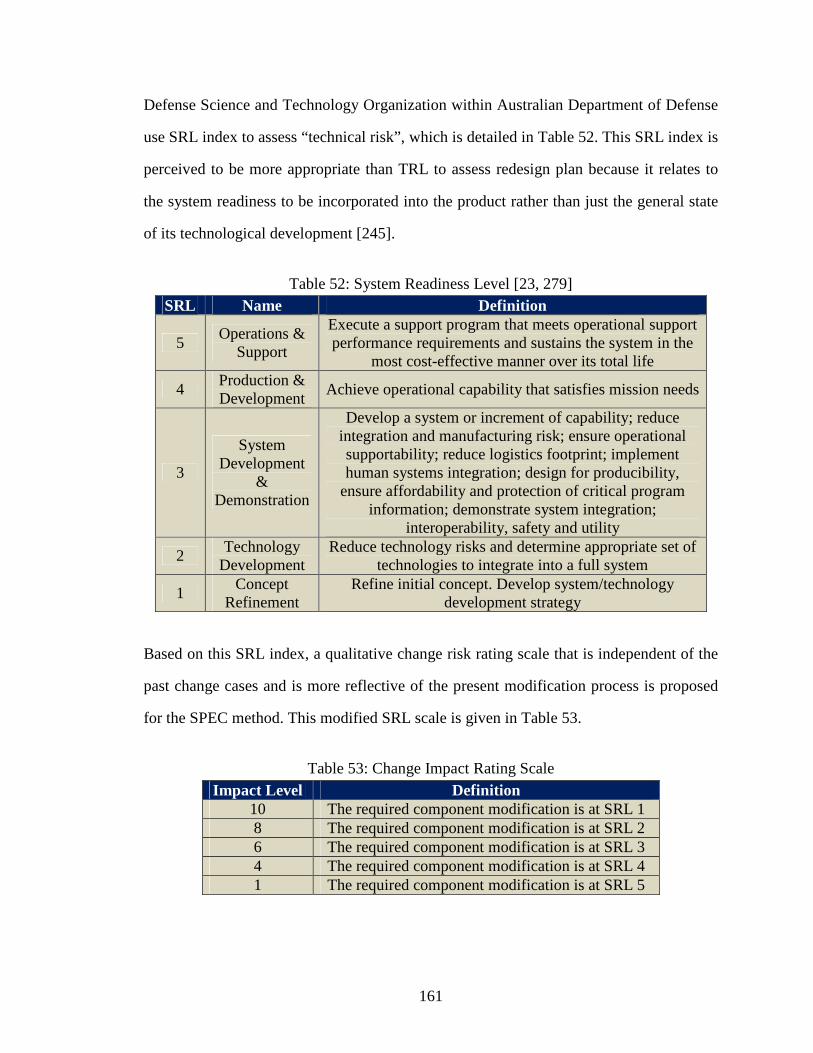
161
Defense Science and Technology Organization within Australian Department of Defense
use SRL index to assess “technical risk”, which is detailed in Table 52. This SRL index is
perceived to be more appropriate than TRL to assess redesign plan because it relates to
the system readiness to be incorporated into the product rather than just the general state
of its technological development [245].
Table 52: System Readiness Level [23, 279]
SRL Name Definition
5 Operations &
Support
Execute a support program that meets operational support performance requirements and sustains the system in the
most cost-effective manner over its total life
4 Production & Development
Achieve operational capability that satisfies mission needs
3
System Development
& Demonstration
Develop a system or increment of capability; reduce integration and manufacturing risk; ensure operational supportability; reduce logistics footprint; implement human systems integration; design for producibility,
ensure affordability and protection of critical program information; demonstrate system integration;
interoperability, safety and utility
2 Technology
Development Reduce technology risks and determine appropriate set of
technologies to integrate into a full system
1 Concept
Refinement Refine initial concept. Develop system/technology
development strategy
Based on this SRL index, a qualitative change risk rating scale that is independent of the
past change cases and is more reflective of the present modification process is proposed
for the SPEC method. This modified SRL scale is given in Table 53.
Table 53: Change Impact Rating Scale
Impact Level Definition 10 The required component modification is at SRL 1 8 The required component modification is at SRL 2 6 The required component modification is at SRL 3 4 The required component modification is at SRL 4 1 The required component modification is at SRL 5

162
It can be noted that the modified SRL scale only covers process difficulty associated with
the proposed changes. However, it is intuitive that one product component can have a
different cost with respect to the others and therefore, even when two components have a
similar level of change impact, their incurred costs can be significantly different. This is
an essential criterion to be accounted while comparing different change plans. To
consider this situation, impact rating for each change effect should also be accompanied
by a cost rating. A simple qualitative change cost scale is proposed for this purpose and it
is defined in Table 54.
Table 54: Change Cost Rating Scale
Cost Level Definition 1 Very Low Cost 4 Low Cost 6 Medium Cost 8 High Cost 10 Very High Cost
3.5.2 Taxonomy for Change Propagation Prediction
In addition to change impact risks, there is also a need for a standard guideline in the
prediction of change propagation paths. This is closely related to the identification of the
underlying change interrelationships between different parts of the product, which often
of different types and strength [257]. Nevertheless, not all information about the product
is required for change propagation analysis [174]. To have a manageable model size, it is
essential to select the right set of information based on the requirements of the analysis
tasks in hand. In the application scope of SPEC method, the main analysis requirement is
to accurately and efficiently track possible change propagation paths between the product
components. Rouibah and Caskey stated that it is easier to assess engineering changes
from the product viewpoint because designers perceive the change process as a decision

163
procedure to alter its component parameters [270]. This is supported by Flanagan et al.,
who stated that designers tasks are often expressed in terms of the parameters [133].
However, the derivation of very detail component attributes demands a tedious modeling
effort. It is believed that the routine can be simplified without losing its credibility by
using an appropriate taxonomy that can categorize the attributes into their general types
of links. In view of this, Pimmler and Eppinger proposed taxonomy for design elements
interaction that is described in Table 55.
Table 55: Taxonomy of System Element Interactions [257, 293] Type of Links
Description
Spatial The needs for physical space and alignment and adjacency or
orientation between two elements Energy The needs for energy transfer or exchange between two elements
Information The needs for information or signal exchange between two elements Material The needs for material exchange between two elements
On the whole, this taxonomy considers both fundamental and incidental interactions
between the components. The fundamental interactions are the functional relationships
that can be in the form of energy, material and signal interchange [126]. Conversely, the
incidental interactions are those that result from the translation of the functions into their
physical realization [126]. In view of this, the scheme adequately captures all links that
exist between two product components as it takes into account both their functional and
physical aspects. Moreover, any factors that could affect the change propagation can be
easily classified into one of these four categories. By only considering this link definition,
the model size is controlled from growing too large while still having adequate details for
change process analysis.
Nonetheless, recognizing the type of component interrelationship is only half of the work
in predicting change propagation. The possibility of change propagation also depends on

164
in-built design tolerances of the components [142]. For instance, a small level of change
effects can be “absorbed” by the component without requiring any modification if they
fall within its design tolerance. To account for this condition, the inclusion of change
tolerance scale (i.e. high (H), medium (M) and low (L)) for each change relationship is
proposed.
3.6 Chapter Summary
Relevance of the proposed SPEC method in the current product development process is
further validated and supported from the findings of this literature review. According to
Advance Manufacturing Research Newsletter, many product manufacturing companies
still typically take weeks or months to get their new product changes into production and
the subsequent delays mean financial losses that can exceed the allocated budget [264]. In
addition, there have been many redesign cases with a seemingly innocuous change that
suddenly blossomed into a series of costly impacts. All these signify the urgent need for a
better product redesign planning. Although there is an increasing level of interest in the
field of study for engineering change, very few research efforts directly address the issue
of change management in product redesign development [117]. In spite of the substantial
increase in research activities, the field is still academically under-developed with many
researches are individually pursued and fragmented without proper collaboration to each
other [174].
The focus of literature study presented in this chapter is based on the identified key areas
for the proposed SPEC methodology: baseline assessment, change propagation modeling,
change impact analysis and change implementation planning. The methods and tools that
have been discussed throughout this review are listed again in Table 56.

165
Table 56: Tools and Methods in Literature Review Identified Tools and Methods
Research Areas 1 2 3 4 5
Baseline Assessment
Quantitative System
Evolvability
System Adaptability Factor (SAF)
Method for Assessing the Adaptability of Product (MAAP)
Change Propagation
Modeling
Functional Change
Modeling
Component-Function
Propagation Model
Component Linkage Model
Change Favorable
Representation (C-FAR)
Product Dependency
Model
Change Impact Analysis
Change Propagation
Analysis
Progressive Probabilities of Changes
Response Surface Method
(RSM) in Change Impact
Assessment
Change Implementation
Planning Redesign-IT KRITIK
Change Prediction Method (CPM)
LEGEND:
All of them have been qualitatively compared with the required characteristics for use in
the proposed methodology, which are outlined based on the identified gaps in aircraft
redesign process in Chapter 2 and the research objectives in Chapter 1. Although none of
them entirely matches the desired characteristics for their respective area of application,
there exists a big potential when their best elements are combined. The perceptively best
method for each research area according to the qualitative assessment is highlighted in
Table 56 and they are used as the basic building blocks for the proposed SPEC method.
This is discussed in following chapter.
Furthermore, based on the general deficiencies that have been identified in the qualitative
measurement of change impact, an impact scale rating based on SRL and a simple cost
rating have been proposed. Similarly, for the prediction of change propagation path, the
Considered the best per research area

166
taxonomy of system element interactions by Pimmler and Eppinger is suggested for use
along with a simple rating for the component change tolerance level.
Using the knowledge gained from this literature review, several research hypotheses are
formulated to address the research questions in Chapter 2. These hypotheses, which later
become the main basis in the formulation of the proposed SPEC method, are discussed in
next chapter.

167
CHAPTER 4
RESEARCH HYPOTHESES AND PROPOSED METHODOLOGY
“…engineering change is not the problem. How we handle
change, our change proficiency behavior, is the problem.”
- Ring and Fricke (1998)
Based on the literature study presented in preceding chapters, it can be concluded that no
known approach that completely addresses identified gaps in the scope of this research is
currently available. The review also highlights the urgent needs and potential competitive
benefits for aircraft manufacturers to resolve these redesign process deficiencies. Several
promising methods and tools for each area of the proposed method have been identified
in Chapter 3. The knowledge from the assessment of these methods and tools is valuable
in the formulation of research hypotheses for this thesis study.
The first portion of this chapter is allocated to the formulation of the research hypotheses.
Based on information obtained from the literature review, these hypotheses are derived to
answer the research questions that have been outlined in Chapter 2. For remaining part of
this chapter, a detailed explanation of the proposed SPEC methodology is presented. As
concluded at the end of Chapter 3, some of the identified methods and tools can either be
adapted or combined to create the approaches for each step of the proposed method. A
supplementary computer-based support tool is developed to aid in the demonstration of
this method. Towards the conclusion of this chapter, the proposed SPEC methodology is
compared to the methods and tools that are referenced for its step formulation.

168
4.1 Research Questions and Hypotheses
Recall the constructed relationships between observations in aerospace industry, research
questions and formulated steps of the proposed SPEC methodology in Chapter 2. This is
reproduced here in Figure 58.
Figure 58: Observations, Research Questions and Proposed Method
Product redesign and change management processes start off with a well-defined baseline
[256]. Since the degree of freedom in planning for the required change implementation is
dictated and constrained by the existing baseline architecture [326], the redesign process
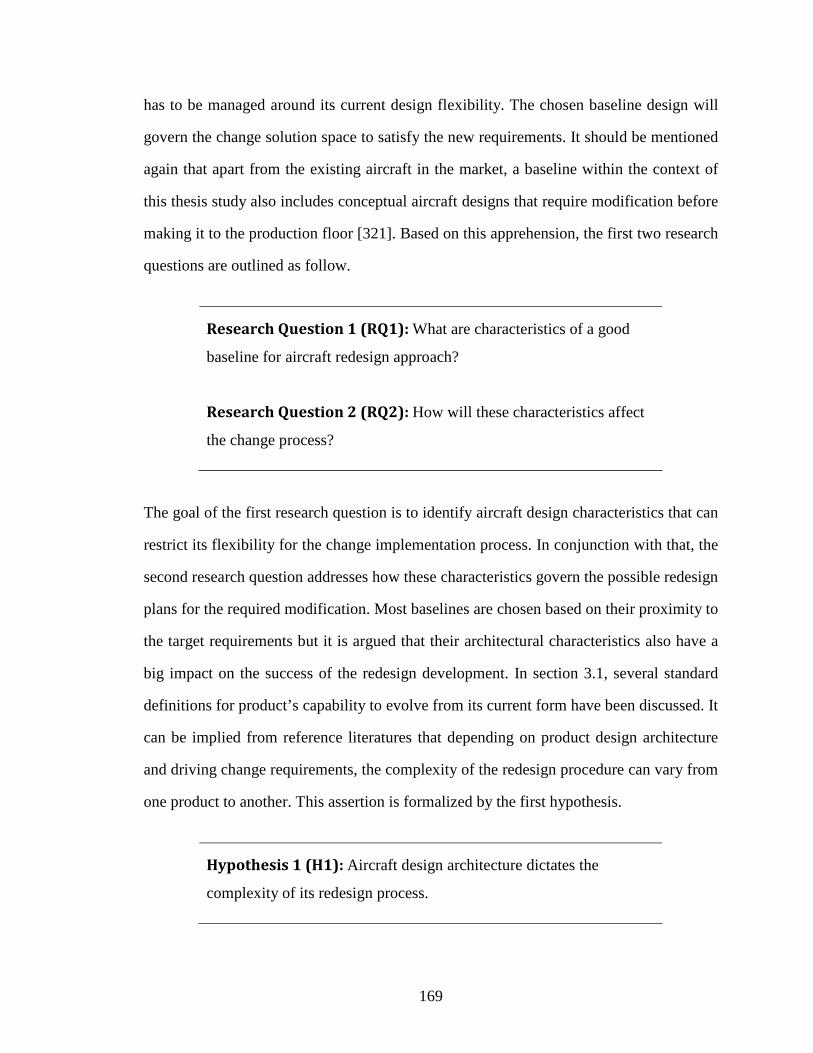
169
has to be managed around its current design flexibility. The chosen baseline design will
govern the change solution space to satisfy the new requirements. It should be mentioned
again that apart from the existing aircraft in the market, a baseline within the context of
this thesis study also includes conceptual aircraft designs that require modification before
making it to the production floor [321]. Based on this apprehension, the first two research
questions are outlined as follow.
Research Question 1 (RQ1): What are characteristics of a good
baseline for aircraft redesign approach?
Research Question 2 (RQ2): How will these characteristics affect
the change process?
The goal of the first research question is to identify aircraft design characteristics that can
restrict its flexibility for the change implementation process. In conjunction with that, the
second research question addresses how these characteristics govern the possible redesign
plans for the required modification. Most baselines are chosen based on their proximity to
the target requirements but it is argued that their architectural characteristics also have a
big impact on the success of the redesign development. In section 3.1, several standard
definitions for product’s capability to evolve from its current form have been discussed. It
can be implied from reference literatures that depending on product design architecture
and driving change requirements, the complexity of the redesign procedure can vary from
one product to another. This assertion is formalized by the first hypothesis.
Hypothesis 1 (H1): Aircraft design architecture dictates the
complexity of its redesign process.

170
Each component within the aircraft design has their own functional role in achieving the
high-level system performances. If the aircraft performance requirements are modified or
newly available technologies are to be incorporated into it, the baseline design has to be
changed accordingly. Since each part generally has different manufacturing difficulty, the
complexity of the redesign process is greatly influenced by which aircraft components are
affected by the proposed changes and the level of impacts imposed on them. Based on
this understanding, the baseline suitability for the redesign case is indicated by how well
its design architecture can cope with the driving requirements, which is affirmed by this
hypothesis 1. In order to prove this notion, redesign process complexity for a few aircraft
systems with different architectural designs has to be compared based on the same set of
initiating change requirements.
Furthermore, extending from hypothesis 1, the complexity of the redesign process can be
strongly associated with the number of affected parts, and the types and levels of change
effects that are imposed on them. For the same aircraft, there are different ways that the
change requirements can be realized and this condition relates to the change propagation
phenomenon. Due to the range of change behaviors that each aircraft part can have, there
are some trade-offs while deciding whether the change effects should be transmitted to
the next component in the propagation tree or not. This means that the overall change
impacts, hence aircraft redesign risks, can be managed by controlling change propagation
path. The research questions to address this notion are outlined as follow.
Research Question 3 (RQ3): How engineering change effects
propagate from one architecture locality to another?
Research Question 4 (RQ4): What are control parameters of
change propagation?

171
The main objective of the third research question is to recognize the enabling means for
change propagation. By knowing how change effects can be transferred from one part to
another, the next question is how they can be controlled and this is the goal of the fourth
research question. With the understanding on how the change effects can be managed and
contained, designers can recognize the existing flexibility that they have while planning
for aircraft redesign goals. In current “as necessary” redesign practices, expected change
effects propagation is always perceived to be necessary. But as discussed in section 3.4.3,
the change roles of each component can vary in different redesign situations and this can
lead to different change propagation paths. Each component can have one of the general
types of change roles that are described as follow [115]:
• Absorbers – propagate no further changes after being changed
• Carriers – transferring change to others after being changed but neither
reduce nor add to the complexity of the change problem
• Multipliers – expand the change problem further by making it more complex
• Constants – not affected and not causing changes
It is believed that the paths of change propagation tree can be managed by assigning the
aircraft components with their favored change role. This particular notion is emphasized
by the second hypothesis.
Hypothesis 2 (H2): Engineering change propagation in aircraft
redesign development process can be managed by dictating the
change role of its components.
Because each component can introduce different level of change effects, several trade-
offs are involved while making the decision to change one component over the others or
to impose a higher or lower change level on it instead of the others. If the component
172
poses a high development risk when it is modified and propagates its change effects to
other high-risk components, its change role can be designated as a “constant”. In product
manufacturing industry, some of these “constants” have been pre-determined before the
redesign process is initiated due to company’s policy or business strategy. To corroborate
hypothesis 2, potential propagation paths that are constructed by varying the component
change role in response to the same initiating changes for the same aircraft design need to
be compared.
In conjunction to hypothesis 2, assignment of component change role affects the change
propagation tree by varying the measure of its change-related parameters. To accurately
predict the change propagation paths, information of these related parameters should be
included into the aircraft change model. However, several issues regarding the trade-offs
between the level of details for the model and the extent of its modeling effort have been
prominently raised in literatures, apart from the model effectiveness to capture the change
propagation phenomenon. This matter is the goal for the following research question.
Research Question 5 (RQ5): How to properly model the aircraft
system to track the potential change propagation?
This fifth research question aims to outline the required characteristics of aircraft model
to enable an accurate prediction of the change effects propagation. Based on the literature
review in section 3.2, it has been established that the change effects are transmitted from
one component to another according to their type of relationship and their level of design
change tolerance. In view of that, if the modification does not affect their functional or
physical interrelationship, no effect is propagated from the initiating component to them.
Moreover, most components are developed with some degree of design tolerances. If the
propagated change effects fall within its design tolerance, the component can absorb

173
them without requiring any modification and this ends the change propagation tree. These
situations need to be captured by the model through proper definition of its parameters.
To control the complexity of aircraft change model without reducing its competency to
predict the potential change effects propagation paths, a standard modeling guideline is
necessary. Rationally, a parameter can be explicitly defined for the change tolerance level
of each aircraft component but the same cannot be applied to capture the essences of the
change propagation. An appropriate taxonomy for existing interconnections is required to
enable correct prediction of the propagation tree. This notion is reflected in the following
third hypothesis.
Hypothesis 3 (H3): Potential change propagation tree within an
aircraft design can be predicted by using the taxonomy of system
element interactions and the level of its component’s change tolerance.
In section 3.5.2, the taxonomy of system element interactions proposed by Pimmler and
Eppinger is considered to be the best reference that captures the prediction of the change
propagation due to the type of the component interconnections. Its application with the
change tolerance level is perceived as the best foundation in balancing the details and the
modeling efforts for the aircraft change model. Although many existing change modeling
techniques recognize the needs to categorize the types of interrelationships, they do not
formally employ a standard taxonomy. This leads to much unnecessary information being
included into the model and wasting valuable modeling and computational efforts. On the
other hand, while there are also methods that apply this particular taxonomy of system
element interactions or the change tolerance parameter separately, no reference is found
in the literature that formally utilized both of them together for the aircraft change model.
To prove hypothesis 3, this scheme needs to be applied in an aircraft redesign problem to
demonstrate its structured modeling approach for a manageable model complexity and its

174
capability to predict change effects propagation. A comparison with other modeling
techniques can also be done to further supplement this assertion.
Using both hypotheses 2 and 3, alternative change propagation paths can be mapped out
and their corresponding set of affected components can be identified. The next step is to
evaluate the development risks for these different redesign plans. The following research
questions are outlined to gather the necessary change information and to find the best
approach to assess the level of change risks.
Research Question 6 (RQ6): What are characteristics of an aircraft
and its development process that can be affected by engineering
changes?
Research Question 7 (RQ7): How to sufficiently measure change
impacts on these characteristics?
Research Question 8 (RQ8): How to manage overall aircraft
redesign risks?
At this point of discussion, it can be inferred that the effects of engineering changes will
not only affect the aircraft architecture but also its development process characteristics. It
is imperative for designers to be able to distinguish all redesign trade-offs during their
decision-making process, especially those with regards to the negative change effects. In
view of that, the sixth research question is focused on identifying the aspects of aircraft
design and its development process that can be affected by engineering changes. Once
they are identified, the seventh research question addresses how they can be appropriately
evaluated to accurately reflect on their level of intensity and urgency during the decision-
making process. Their combined effects indicate the overall redesign risks for the change

175
plan. In section 2.1.1, the utmost value for manufacturers to consider redesign approach
is the capability to produce derivative aircraft that can satisfy the new requirements with
a cheaper and shorter development process than it will take them to produce new original
aircraft. Though this can lead to sub-optimal derivative designs, most redesign decisions
are often tailored to the estimated risks based on redesign development costs and amount
of reworks involved [116]. The eighth research question is designated to resolve how the
overall risks for the change plan can be managed accordingly. Due to emphasis of change
effects on costs and amount of reworks, redesign risks can be associated with the affected
components and the cumulative handling time, cost and efforts required for their entailed
modification [167]. These factors have been linked to the change propagation path and it
can be implied that the level of redesign risks can be managed through proper planning of
the change propagation tree. This impression is avowed by the following hypothesis.
Hypothesis 4 (H4): Associated risks of aircraft redesign
development process can be controlled by managing change
propagation paths.
From hypothesis 2, the management of change propagation paths can be accomplished
with the assignment of component change role. Based on the decision to either absorb or
propagate the changes, the aircraft components will be affected differently. This situation
subsequently leads to different cases of development risks. In other words, by choosing
whether the component should absorb or propagate the change effects that are imposed
on it, designers are effectively managing the risks of aircraft redesign process. To attest
this hypothesis 4, redesign risks associated with at least two change effects propagation
paths due to the same set of change requirements on the same aircraft design needs to be
compared.

176
In relation to hypothesis 4, apparently there is a big misconception that the redesign plan
with the smallest number of affected components always corresponds to the lowest
development risks [344]. For instance, the computer-based change tool by Lin et al. aims
to modify a product design to meet its new requirements with minimum changes [202].
However, based on hypotheses 2 and 4, this perception is rather misleading and this view
is further emphasized by the following hypothesis 5.
Hypothesis 5 (H5): Aircraft redesign plan with minimum number
of modified components does not automatically mean minimum
development risks.
The proof for hypothesis 5 can be accomplished in combination with that of hypothesis 4.
In this case, the risks for different redesign plans can be compared with the number of
components that are affected by them.
Last but not the least, the main objective for the proposed redesign method is to generate
and select the best aircraft redesign plan in response to the driving change requirements.
As the ultimate tie-in for previous hypotheses and research questions, there needs to be
an appropriate procedure on how the knowledge obtained so far can be used to generate
and select the best aircraft redesign plan. This is the objective for the following research
questions.
Research Question 9 (RQ9): What are important criteria for a good
change implementation plan?
Research Question 10 (RQ10): What are control parameters that
are available in change planning?

177
Research Question 11 (RQ11): How to generate implementation
plan for the required changes?
Research Question 12 (RQ12): How to select the best change
implementation plan among the possible alternatives?
Research question 9 is aimed at extracting the important criteria of the aircraft and its
development process that ought to be considered during its redesign planning. In general,
the essences of redesign risks can be broken into the performance and process risks. The
performance risks correspond to the possibility that the aircraft modifications will fail to
satisfy the performance constraints while the process risks cover the likelihood of failure
to execute the aircraft redesign process within the development constraints. These risks
can be used as an indicator for the goodness of the redesign plan. By knowing important
metrics to compare different change plans, the next thing is to identify the change process
parameters that enable designers to manage them. This is addressed by research question
10. These parameters later become the primary means to generate the redesign plans and
their proper use for this purpose is explored through research question 11. Subsequently,
research question 12 seeks the best approach to select the best among the generated plans.
Redesign risks are closely linked to the change effects and following hypothesis 4, the
implementation plans are derived by managing their paths of change effects propagation.
In addition, there are commonly several initiating changes that have to be handled in the
beginning of the redesign process. Most methods or tools found in reference literatures
plan for the changes separately. However, it is acknowledged that their effects can be
interrelated when these independently planned change propagation paths affect the same
components [120, 272, 332]. This leads to the notion that lower redesign risks could be

178
obtained if the implementation of all initiating changes is planned concurrently, which is
affirmed by following hypothesis.
Hypothesis 6 (H6): Change implementation risks can be
minimized by simultaneously planning for all initiating changes
in aircraft redesign process.
If the implementation of the initiating changes is independently planned into the aircraft,
there are potential redesign conflicts when the same components are affected by several
of them. This is mainly due to the fact that the characteristics of those components will be
altered for one change plan and their new condition is not considered during the planning
for the other initiating changes. Therefore, the estimated risks from this “one-at-a-time”
redesign planning approach can be misleading as it does not capture the correct level of
effects imposed on the components. In contrast, by simultaneously consider the initiating
changes; the redesign planning benefits from the updated components state if they are
affected by another initiating change. This condition enables a better estimation of the
overall redesign risks and helps in making better redesign decisions regarding the change
propagation paths. To prove hypothesis 6, redesign risks for the change plan that is
derived by ‘one-at-a-time’ approach needs to be compared with that developed through
simultaneous consideration of the initiating changes.
To summarize, the flow of research questions and hypotheses for this thesis study is
illustrated in Figure 59.

179
Fig
ure
59: S
umm
ary
of R
esea
rch
Que
stio
ns a
nd H
ypot
hes
es

180
4.2 Proposed Methodology
Recall the initial formulation of the proposed SPEC method, which has been constructed
based on the assessment results of six available product redesign and change management
frameworks in Chapter 2. From the same assessment process, several gaps to the required
characteristics of the proposed method have been identified and this knowledge is used to
drive the scope of literature review study in preceding Chapter 3. Several methods and
tools that are presently available are identified and compared to the required criteria for
the proposed methodology, and they become the main basis in bridging the identified
gaps in this research study.
The objective of this section is to apply the knowledge gained from the literature study in
formulating the steps for the proposed SPEC methodology. In addition, an accompanying
computer-based tool to support its implementation is developed and this prototype Excel-
based tool is discussed through a simple demonstration case of electrical power system.
The sequence of steps for the proposed SPEC methodology has been outlined in Chapter
2 and is reproduced here in Figure 60. Each of its steps is detailed in this section.
Figure 60: Proposed Framework for SPEC Methodology

181
As mentioned, a complementary Excel-based aircraft redesign support tool is developed
to facilitate the demonstration of the proposed SPEC method. The snapshot of the main
program interface of this support tool is depicted in Figure 61. Intuitively, each step in
the proposed SPEC methodology corresponds to an individual step in this tool.
Figure 61: SPEC Support Tool Main Program Interface
4.2.1 Step 1: Aircraft Change Modeling
The objective of Step 1 is to produce a well-balanced aircraft change model for predicting
change effects propagation and analyzing change impacts to support the decision-making
process during change implementation planning. From literature study in section 3.2, the
problems with available change modeling methods have been discussed. Subsequently,
they characterize the challenges in developing the aircraft change model for the proposed
SPEC method. Based on previous reviews, it has been established that the construction of
a good change model must include following considerations:
• A functional or physical interconnection between two components does not
automatically mean that they are change-related to each other

182
• A change interrelationship between two components does not always work in
both directions
• Change effects are propagated only when the type of changes made in the
initiating component matches the type of links it has with the other component
• A change that is imposed on one attribute of the component might also affect
its own other attributes
The aircraft change modeling procedure for this Step 1 takes into account all these points.
It is prominently based on Product Dependency Model (detailed in section 3.2.5), which
has been assessed as the best product system change model from the literature review.
Firstly, DSM representation has been chosen for the aircraft change model. This decision
is based on its highly advertised efficiency and versatility in aiding the analysis of inter-
relationships between product elements. As concluded in section 3.2.6, DSM is possibly
the best model representation for product engineering change study at the moment [293].
Secondly, change modeling process can be approached either from functional or physical
aspects of the aircraft design, which are complementary to each other. It has been argued
that one of the main emphases in aircraft redesign planning is to establish the degree of
flexibility for the baseline design since change implementation process is significantly
constrained by its existing architecture. In section 3.2.3, Jarratt suggested that the most
suitable approach to properly capture existing design change constraints is by identifying
physical components in the product architecture and observing how they are interrelated
to one another [174]. The understanding of these interrelationships influences the ability
and efficiency of manufacturers to undertake and manage the modification made on their
product, particularly in predicting potential change effects propagation [81]. In section
3.5.2, it has been discussed that the prediction of change effects propagation can be

183
effectively made by modeling the aircraft using taxonomy of system element interactions
by Pimmler and Eppinger [257] and with supplementary information of its component
change tolerance level.
Considering these arguments, construction of the aircraft change model is approached
from its physical system decomposition and the interrelationships that exist between its
components are identified based on the taxonomy of system elements interactions that is
reproduced in Table 57. In addition, information regarding the change tolerance level for
each component is also included in the aircraft change model and this is defined in Table
58, which is loosely based on Product Dependency Model scheme.
Table 57: Taxonomy of System Element Interactions [257, 293]
Type of Links
Description
Spatial The needs for physical space and alignment and adjacency or
orientation between two elements Energy The needs for energy transfer or exchange between two elements
Information The needs for information or signal exchange between two elements Material The needs for material exchange between two elements
Table 58: Change Tolerance Level Definition Type of
Information Definition
Scale Description
Increase The increment in the related attribute level Decrease The reduction in the related attribute level Attribute Change
Direction Either Way Both increment and reduction in the related attribute level
None Have no tolerance and always be modified if the change effects are propagated
Low Can tolerate low level of propagated change effects without requiring any modification to itself
Medium Can tolerate medium level of propagated change effects without requiring any modification to itself
Tolerance Level
High Can tolerate high level of propagated change effects without requiring any modification to itself

184
According to Pimmler and Eppinger, it is suggested that the details of the system model
is at least a level down than that required for its subsequent analysis study [257]. From
observation made on past aircraft derivative initiatives, most aircraft design variants were
derived through incremental subsystems development. Based on this notation, the aircraft
change model needs to at least capture the major components of its subsystems. This is to
ensure that sufficient information is available and basis for impending change analysis is
appropriately covered.
Moreover, in order for the proposed SPEC methodology to be in line with real industrial
practices, physical decomposition of the aircraft system is tailored to the standard ATA
Specification 100 (ATA-100). ATA-100 is introduced by Air Transportation Association
of America (ATA) as a guideline for aircraft service and maintenance documentation. It
covers various types of air transportation vehicle such as turbofan-powered and propeller-
driven aircraft, with each chapter corresponds to a specific subsystem. Due to its wide
coverage of different air vehicle types, not all ATA-100 chapters are always applicable
for the task at hand. The focus in this research study is on commercial transport aircraft
type and in view of this, ATA chapters 46 and 47 for instances can be excluded because
they respectively correspond to the armament and weapons electronics.
A complete ATA-100 breakdown is available on ATA official website [2]. ATA chapters
included for aircraft change model in the proposed SPEC method are depicted in Figure
62, which is taken from the program snapshot of the developed SPEC tool. It should be
noted that Federal Aviation Administration (FAA) has produced their version of ATA-
100, which is known as Joint Aircraft System/Component (JASC) [8]. Both standards are
very much similar to each other but JASC provides more information concerning details
of the subsystem breakdown process. Therefore, while ATA-100 is the main reference in
outlining the breakdown procedure, JASC is used as its complementary reference.

185
Figure 62: Considered ATA-100 Chapters for Aircraft Change Model
On the whole, the sequence of phases for this first step of the proposed SPEC method is
presented in Figure 63. This step begins with the physical decomposition of the candidate
baseline aircraft. It is assumed that these baseline candidates have been identified prior to
the initiation of this step and their available data in the company’s PDM or PLM systems
can be used accordingly for this modeling process. The identified major components for
each aircraft subsystem are represented in the DSM model, which is then populated with
their existing design interconnections that are identified based on the taxonomy of system
elements interaction. Each of these links is also furnished with the information regarding
their change tolerance level. In the end, the main output from this Step 1 is the completed
aircraft change interrelationship matrix (CIM).
To demonstrate the execution of this Step 1, consider the modeling example of electrical
power subsystem onboard Boeing B737-200 aircraft design. In reference to its schematic
presented in [180], the simplified block diagram that highlights its major components is
depicted in Figure 64.

186
Figure 63: Overall Workflow for Step 1
Generator
Drive 1ATA 72
Electrical
Generator 1
Electrical
Generator 2
Generator
Drive 2ATA 72
AC Bus 1 AC Bus 2
ATA 49
Main Bus 1 Transfer Bus 1Ground
Service Bus
Main Bus 2Transfer Bus 2
Battery
Charger
Aircraft
Battery
Battery Bus
TR 1 TR 2 TR 3
DC Bus 1
DC Bus 2
AC Standby
Bus
DC Standby Bus
Static
Inverter
External of Subsystem Internal of Subsystem
LEGEND:
Mechanical Electrical Figure 64: Block Diagram Representation of B737-200 Electrical Power Subsystem
Referring back to Figure 63, the subsequent step after the physical decomposition process
is to list the identified major components into DSM format. Once this task is completed,
their intra-relationships are identified in accordance to the taxonomy of system elements
interaction and assigned with respective change tolerance level. Interrelationship between
the components of different subsystems is then identified in similar manner and ideally,
this is done once all aircraft subsystems have been modeled internally. This is to ensure

187
consistency of the aircraft change model where any discrepancies that exist can be easily
noted when connecting components for any expected interrelationships are missing from
the aircraft change model. The resultant change model for the electrical power subsystem
is shown in Figure 65. To conclude, summary of this step-by-step procedure is depicted
in Figure 66.
Figure 65: Sample Change Model for B737-200 Electrical Power Subsystem
Figure 66: Aircraft Change Modeling by SPEC Support Tool
188
4.2.2 Step 2: Baseline Assessment
With the aircraft change model already constructed in Step 1, primary goal of this second
step in the proposed SPEC method is to evaluate the selected baseline aircraft suitability
to undergo its redesign changes. In cases when there is more than one baseline candidate,
this step becomes the process to select the most appropriate baseline aircraft with regards
to the driving change requirements.
In previous literature study, several definitions and related metrics regarding product
design adaptability characteristics have been identified. Despite their different terms, they
essentially share similar basis and are easily related to each other. For the proposed SPEC
method, the main emphasis is on the planning of engineering change implementation. In
view of this, the focus of baseline aircraft assessment process should consider the existing
design architecture since it is known to dictate the available degree of design flexibility
for the proposed modification. From the perspective of product system design, potential
change impacts are closely related to its complexity, architecture build-ups and degree of
innovation [174]. The complexity over product design generations can be measured by
the number of decomposed elements and the connectivity between them [127, 179, 313].
In theory, a product is more difficult to be redesigned when its parts to be modified are
highly dependent on its other parts [221]. Nevertheless, it should be realized that the most
evolvable design candidate is not always the best option for the change implementation
task at hand because it is possible that the process can still be too costly or risky [75].
Hence apart from the usual baseline selection based on the proximity of its performances
to the driving requirements, development risks should also be an evaluation criterion to
select the right baseline design. Overall, the preferred redesign plan is concluded to be the
one that involves a small number of parts, requires less new parts and interrelationships,
and can be accomplished with a low risk and cost [138]. All these characteristics have to
be measured in the baseline candidate.

189
Based on above arguments and the conclusions made from the assessment of methods in
section 3.1.4, evaluation metrics from quantitative system evolvability method are taken
to be reference measures for the baseline aircraft assessment with regards to the proposed
redesign changes. However, their definition has to be slightly adjusted to match the scope
of product redesign process instead of new product development that they are originally
developed for. The modified definition for the metrics is tabulated in Table 59.
Table 59: Modified Aircraft System Evolvability Metrics
Evolvability Metric Description
Generality The capacity of the aircraft system to accommodate the changed or new requirements without requiring any changes to its design
Scalability The capacity of the aircraft system to accommodate the required change by the scaling of its existing design without requiring any new components
Adaptability The capacity of the aircraft system to accommodate the required change without propagating the change effects beyond the initiating components
Extensibility The capacity of the aircraft system to accommodate the required change with the effects propagation allowed
Complexity The capacity of the aircraft system to accommodate the required change without increasing its design complexity level
In addition, recall that it is favorable to have minimum affected parts and interfaces, and
it is also essential to evaluate whether the derivative aircraft will maintain the same level
of design flexibility as its baseline. In general, a less complex system design minimizes
the risks of propagated change effects because its components or parts are not intricately
interlinked to each other. Plus, if the baseline design is theoretically flexible, changeable
and enhanceable, its complexity will not markedly increase after it has been modified. In
section 3.1.3, this aspect of product adaptability is stressed by MAAP through its “parts”
and “connectors” metrics. Since derivative development approach is dominant in aircraft
industry, it is essential for the derivatives to have only a little change in complexity to
allow further incremental development. To account for this condition, system complexity
criterion is added into the evolvability metrics for this SPEC method.

190
As discussed in section 3.1.1, quantitative system evolvability method does not provide a
structured approach on how these assessment metrics should be measured apart from its
proposed DSEA rating scale. Unfortunately, this scale is focused on high-level system
change assessment and does not directly consider the specific state of baseline design
architecture. In section 3.1.4, it has been concluded that MAAP is equipped with the best
evaluation scheme that is more transparent for its adaptability metrics. The adaptability
criteria used in MAAP can be easily associated with aircraft system evolvability metrics
defined in Table 59. Based on this, several measurement procedures in MAAP are used
as the reference to derive proper evaluation scheme for the aircraft system evolvability
metrics.
For generality criterion, there are only two possibilities: whether the requirements can be
satisfied without requiring any changes on the existing aircraft system architecture or not.
A rating of 0 is given in the former condition while the latter case corresponds to a rating
of 100. This rating assessment is done for each requirement and their total becomes the
overall generality risk measure. Similarly, there are only two possibilities for scalability
metric. The baseline aircraft needs to be assessed whether it can meet the requirements
through the scaling of its existing design without requiring additional new components
and interfaces or not. Accordingly, a rating of 0 is given in the former scenario to indicate
a low risk level while the latter case corresponds to a penalty rating of 100. This is done
for each requirement case separately and their total becomes the overall scalability risk
measure.
For adaptability criterion, the baseline aircraft design has to be evaluated in terms of its
capability to contain the initiating changes within the directly affected design architecture
locality. It should be noted that the proposed initiating changes are assumed to be known
prior to the initiation of this step and the evaluation is executed with respect to specific

191
change accommodation tasks from that redesign decision. As established in section 3.5.1,
the measures for engineering change process can be based on amount of cost and efforts
that it requires, which translates into its risks if the process fail to meet the requirements
even after the changes have been made. Based on CPM in section 3.4.3, the risk metric
can be evaluated as the product of change likelihood and change impact ratings, which is
associated to the scheme that has been widely used in product risk management field [13,
80]. For this proposed SPEC method, the focus is on assessment of the different potential
change plans. If a component is considered for modification, then its change likelihood is
1. Accordingly, its probability is 0 if it is not included in the change plan. On the other
hand, the change impact in this proposed method is measured from two primary aspects
of redesign process that have been established from literature study: expected cost and
process difficulty to execute the redesign development. In view of this, the adaptability
risk is measured by Equation 14 and is evaluated for each individual change requirement.
Note that if the adaptability is not possible, the highest penalty score of 100 is assigned.
[ ] ×
=possiblenotif100
possibleifLevelImpactCostiskRty Adaptabili npropagatiowithoutii
Equation 14
where iCost = change cost metric for initiating component i
iLevelImpact = change impact level metric for initiating component i
In contrast to adaptability criterion, the change effects are allowed to propagate from the
initiating components to other parts of the baseline aircraft architecture during assessment
for its extensibility characteristic. With the same arguments that have been presented for
the calculation of adaptability score, the mathematical equation for extensibility risk is
given by Equation 15 and is separately calculated for each change requirement case.

192
[ ] ×
=possiblenotif100
possibleifLevelImpactCostiskRity Extensibil npropagatiowithii
Equation 15
where iCost = change cost metric for initiating component i
iLevelImpact = change impact level metric for initiating component i
Based on the above equations for change adaptability and extensibility characteristics, the
cost and impact levels of the required modification on the affected component need to be
established for the evaluation. In general, change risk analysis is focused on feasibility
and viability of the product design and its development process [97], which is translated
into the levels of difficulty and cost to realize the required modification. In section 3.5.1,
SRL index (as defined in Table 52) has been recognized as a proper reference for the
qualitative change risk rating that is independent of historical change cases while at the
same time provides a good reflection of the current change process at hand. All in all, the
change impact and qualitative cost rating scales to be applied in this proposed method are
presented in Table 60 and Table 61, respectively.
Table 60: Change Impact Rating Scale
Impact Level Definition 10 The required component modification is at SRL 1 8 The required component modification is at SRL 2 6 The required component modification is at SRL 3 4 The required component modification is at SRL 4 1 The required component modification is at SRL 5
Table 61: Change Cost Rating Scale Cost Level Definition
1 Very Low Cost 4 Low Cost 6 Medium Cost 8 High Cost 10 Very High Cost

193
The above computation for adaptability and extensibility change risks only focuses on the
initiating change components and does not include the potential others in overall change
propagation tree. The main reason for this is because the complete redesign plan is yet to
be determined. Even so, the initiating components are sufficient to derive a conservative
estimate of the development risk. If the extensibility risk is calculated to be higher than
the adaptability risk, this implies that change effects propagation is not desirable and that
measure of adaptability risk is likely to be the best possible level of redesign risk that can
be expected for the baseline with respect to the particular change requirement. The level
of difference between adaptability and extensibility risks can be perceived as a qualitative
measure of possible reduction or increment of the redesign development risks that can be
gained by purposely propagating the change effects to other components instead of totally
absorbed by the initiating components.
Last but not least, in reference to DFA method, the following equation is used to assess
the relative complexity of the modified aircraft design to its baseline.
+
=
shipserrelationintof#existing
shipserrelationintof#new
partsof#existing
partsof#newScoreComplexity Equation 16
The interrelationships refer to connections that exist between the subsystems and within
each individual subsystem. As aircraft subsystems are usually developed independently,
the design complexity level arises when various subsystems have to be coordinated by
their separate manufacturers. The higher the complexity score is; the more complex the
levels of the redesigned system design and its development process are expected to be in
comparison to its baseline. A highly complex system design is also more susceptible to
the high risks of change effects propagation [115]. Using the same reasons as before, this
complexity measure for baseline assessment process is also focused only on the proposed
changes for the initiating change components.

194
Finally, the overall measure of baseline aircraft suitability with regards to the change task
is defined in the following Equation 17.
∑= ii xwf,RisktyEvolvabiliOverall Equation 17
=iw weighting for evolvability metric i
=ix normalized risk score of evolvability metric i
i = evolvability metric as tabulated in Table 59 The normalization of risk score for each metric is derived by dividing the computed value
with their corresponding worst case scenario. For generality or scalability assessment, the
worst case is when all driving change requirements are given a score of 100 that implies
they cannot be accomplished with little or no modification of the baseline candidate. On
the other hand, for adaptability and extensibility metrics, their worst condition is for each
initiating change component to be assigned with a risk score of 100. When more than one
baseline candidate are under evaluation, this normalization procedure will involve the
worst case scenario among them. By doing this, it gives a meaningful risk comparison
between them and properly penalizes the candidate with a higher number of initiating
components. Note that from Equation 16, the ideal score for the complexity metric of a
single design is taken as 2, which refers to the case where no significant change in the
complexity level of the derivative design in relative to its baseline is expected. However,
the normalization of this complexity metric is done with reference to the most complex
system architecture if more than one candidate is considered. The resultant complexity
metric value can thus be interpreted as the relative level of design intricacy between the
candidates. After all these assessments have been completed, the baseline candidate with
the lowest overall evolvability risk measure can be perceived as the best for the required
change tasks at hand. Overall, the sequence of phases for this step in the proposed SPEC
method is illustrated in Figure 67.

195
Figure 67: Overall Workflow for Step 2
In brief, the process starts with the identification of baseline aircraft candidates and it is
assumed that they have been modeled in preceding Step 1. The requirements analysis is
not part of the proposed SPEC method and is presumed to have been done prior to its
initiation. Based on the pre-defined change requirements, the baseline aircraft candidates
are independently assessed to identify their corresponding initiating change components
and to establish the score for their system evolvability metrics. Once this is completed for
all baseline candidates, the next phase is to compare them and select the best baseline for
the redesign task. During this phase, the evolvability metrics are weighted to reflect their
relative importance, which corresponds to manufacturer’s preferences in completing their
redesign task. If the manufacturer prefers to have minimum affected components and
interfaces, a relatively low weighting can be assigned for the extensibility metric. Finally,
candidate with the lowest evolvability risk score is taken as the best baseline with regards
to the change requirements.

196
To demonstrate the execution of this Step 2, consider back the previous electrical power
subsystem example. Let assume that the driving requirements for its redesign process are
as tabulated in Table 62 and Boeing B737-200 has been chosen as one of the interested
baseline candidates. For simplicity, this demonstration example is restricted to only the
change effects on electrical power subsystem.
Table 62: Example Change Requirements
Change Requirements Target /
Constraint
B737-200 Adv Performance
[338]
Performance Requirements 1. Flight Range 2. Gross Weight
1750 nmi 114,000 lb
2000 nmi 116,000 lb
Based on information in Table 62, generality and scalability scores for Boeing B737-200
aircraft against the requirements can be made. Because its current flight range capability
exceeds that of the driving requirement, it earns a generality risk score of 0. For the same
reason, a scalability risk score of 0 is assigned for this requirement. In contrast, since its
current gross weight is larger than required, a generality score of 100 is assigned. For the
scalability risk score of this requirement, it is predicted that the design could be slightly
scaled down to improve on its weight characteristics and thus given a score of 0. Note
that each driving requirement is independently assessed. Although it is possible that the
scaling of the design architecture for one requirement negatively affects its performance
with regards to the other driving requirement, those conflicts can be taken to be resolved
by further system modifications that are considered in adaptability and extensibility risks
assessment. Overall, the generality and scalability risks scoring process for this example
case is summarized in Table 63.

197
Table 63: Example Calculation of Generality and Scalability Scores
Requirement Generality Assessment
Scalability Assessment
Flight Range 0 0 Gross Weight 100 0
TOTAL 100 0 “Worst Case Scenario” 2*100 = 200 2*100 = 200
Normalized Score ½ = 0.50 0
While the aircraft design can be sized down to reduce its gross weight, such scaling down
process can also affect its range capability with the downsizing of the onboard fuel tanks.
To ensure that the penalty does not violate its range requirement, further weight reduction
is sought through several other alternative system design changes. From the requirement
analysis done prior to the initiation of this method (which is not covered in this proposed
method), it is assumed that this issue is decided to be resolved by the implementation of
electrical starter-generator. As shown in Figure 64, power generation mechanism in the
current electrical power subsystem is accomplished through the use of a generator drive
and electrical generator assembly, which can be expensive, heavy and inefficient [260].
The application of an electrical starter-generator technology in its place can improve the
overall weight characteristic of the aircraft system, especially with additional elimination
of conventional pneumatic air starter unit for the engines. This proposed redesign change
to cope with the gross weight requirement will require substitution and elimination of the
existing electrical AC generator and its drive unit.
It should be emphasized again that this example limits the change assessment only on the
electrical power subsystem. In reality, implementation of starter-generator unit in place of
conventional constant-speed drive (CSD) and AC generator assembly affects more than
just the electrical power subsystem. The initiating changes to be made can be identified
from the simplified illustration in Figure 68, which is based on the description of variable
speed constant frequency (VSCF) starter-generator unit in [124].

198
Aircraft Engine
Generator Drive
Electrical Generator
Electrical Distribution
Aircraft Engine
VSCF Starter-Generator
Electrical Distribution
BEFORE
AFTER Figure 68: Required Changes for Starter-Generator Implementation
In this demonstration example, the effects are very much simplified but a more elaborate
discussion on the installation impacts of starter-generator unit on current aircraft system
architecture is presented in following Chapter 5. For the time being, based on Figure 68,
initiating change components can be identified as generator drive unit and AC generator
assembly. Because these components are interconnected to each other, they can either be
assessed together or individually. For this example, they are considered together and the
adaptability, extensibility and complexity risks are tabulated in Table 64 and Table 65.
Table 64: Example Calculation of Adaptability and Extensibility Risks
Adaptability Assessment
Extensibility Assessment Proposed Redesign
Change Initiating Change
Component Impact Cost Impact Cost
Electrical Starter-Generator
Generator Drive + Electrical Generator
Assembly 6 8 1 6
TOTAL 6*8 = 48 1*6 = 6 “Worst Case Scenario” 1*100 =100 1*100 = 100
Normalized Score 48/100 = 0.48 6/100 = 0.06
Table 65: Example Calculation of Complexity Risk
Proposed Redesign Change
Initiating Change Component
Parts Balance
Interface Balance
Electrical Starter-Generator
Generator Drive + Electrical Generator
Assembly -2 +2
TOTAL (*speculated total parts & interfaces)
20/22* = 0.91 6/4* =1.5
Ideal Score 2 Normalized Score (0.91+1.5)/2 =1.21

199
If the change effects were to be contained within the locality of the initiating components
without affecting the power distribution network that they are connected to, then a power
converter unit have to be installed to regulate the generated electrical power to match the
characteristics of the existing distribution network [49]. To date, technologies for VSCF
starter-generator and power converter unit have already been developed [124]. Therefore,
for adaptability assessment, the system modification is taken to be at SRL level 3 (based
on Table 52), which corresponds to a risk rating of 6 as defined in Table 60. As for
extensibility assessment, the effects are allowed to be propagated to electrical distribution
network. This implies that the power converter does not have to be installed since the
distribution wirings can be modified to match the generated power characteristics from
the starter-generator instead. Because VSCF technology has been used and demonstrated
on several transport aircraft systems like B737s and MD-90s [235], its SRL level for the
extensibility assessment is given as 5 and this translates into a rating score of 1. For the
cost rating, both adaptability and extensibility change cases seem to be a significant
departure from current B737-200 aircraft system design. This is perceived to inflict
notable changes to manufacturer’s production and supplier networks, and the cost ratings
are assigned to reflect this discernment. Because the adaptability situation involves the
installation of a power converter unit, it is assigned with a higher cost assessment than the
extensibility condition. It should be noted that the expected effects from the modification
to the electrical distribution network is not taken into account because the focus is on the
initiating change components and not the propagated ones.
On the other hand, considering the proposed substitution of generator drive and electrical
generator units (for both left and right systems) with starter-generator units, the number
of total parts is reduced by two. Because the starter-generator unit also introduces new
interlink within the aircraft engine unit (in both engines) for its starting mechanism, the
interrelationship balance is a +2. Note that if the overall aircraft system is considered, the

200
subsequent elimination of the existing pneumatic air starter mechanism for instance will
also be factored in the overall interrelationship balance.
The plot of normalized evolvability metrics for the sample electrical power subsystem,
with an equal weighting of 0.2 for each of them, is shown in Figure 69. In this weighting
scenario, the overall evolvability risk is computed as 0.45.
Figure 69: Evolvability Assessment for Equal Weightings
In general, Figure 69 can be interpreted as follows. First, a generality risk measure that is
close to 0 indicates that most of the driving change requirements are expected to be met
without modifying the existing design. For this example, the gross weight requirement is
violated and this condition is reflected by the non-zero generality measure. On the other
hand, it is possible to scale down the aircraft system design accordingly to satisfy each of
the requirements independently and this is reflected by the zero scalability metric. Since
this scalability measure is much lower than that of the generality metric, the redesign risk
can be taken to be highly manageable. This indirectly indicates that the existing design is
generally not overly inflexible to accommodate the required changes based on the notion
that the system design scaling approach is the simplest form of product redesign efforts.
In addition, based on the general practices of aircraft derivative development, the design

201
scaling is often the first type of redesign approach that is considered when designers try
to redesign the baseline aircraft to satisfy new driving requirements [296]. On the other
hand, the adaptability risk measure is shown to be much higher than that for extensibility
condition. This is a highly favorable change situation since it indicates that the redesign
risk can be potentially reduced by propagating some change effects from the initiating
components to the other components that is of lower redesign cost and difficulty. Last but
not least, the complexity is assessed to imply whether the derivative design complexity is
comparable to the existing baseline design. Since its value is above 1, it indicates that the
complexity of the derivative design has increased from the original baseline. This is not a
favorable situation but it should be noted that the elimination of several other parts and
interfaces external to the electrical power subsystem is not accounted here, which should
otherwise improve the complexity score.
In contrast, if the manufacturer highly favors minimum amount of changes, the weighting
scenario can be modified accordingly. The assessment results shown in Figure 70 refers
to the case where the weighting for the generality, adaptability and complexity metrics is
assigned as 0.3 while the other system evolvability metrics are each assigned with a 0.05
weighting. In general, this weighting scenario indicates that it is highly preferred that the
redesign process affects the lowest number of system components. As a result, the overall
evolvability risk score has increased to 0.66, which reflects that the redesign risk level
under such process preference is much higher than that under previous redesign scenario.
This significant jump indicates that this might not be the most suitable baseline candidate
if such redesign process preference is strictly imposed.
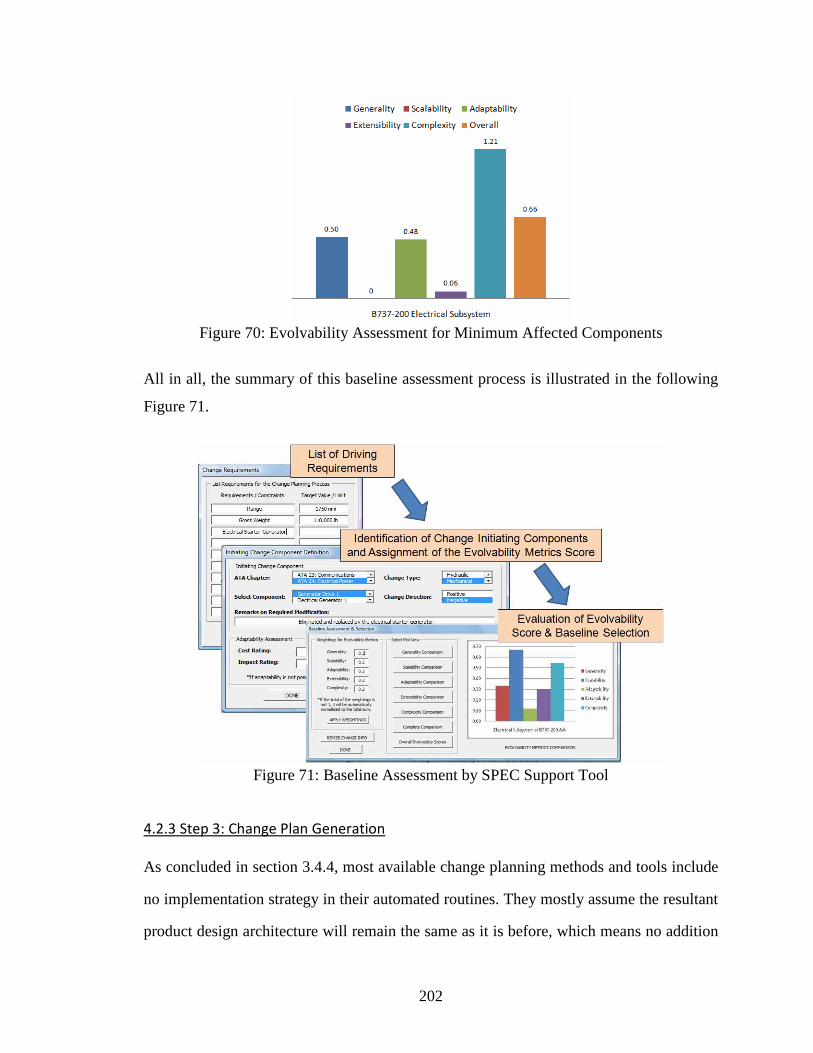
202
Figure 70: Evolvability Assessment for Minimum Affected Components
All in all, the summary of this baseline assessment process is illustrated in the following
Figure 71.
Figure 71: Baseline Assessment by SPEC Support Tool
4.2.3 Step 3: Change Plan Generation
As concluded in section 3.4.4, most available change planning methods and tools include
no implementation strategy in their automated routines. They mostly assume the resultant
product design architecture will remain the same as it is before, which means no addition

203
or substitution of parts is allowed except for the initiating components. This is not always
true as some revolutionary changes can take place and consequently modify the dynamics
of interrelationships between the components. In addition, their program algorithms do
not consider concurrent handling of the initiating engineering changes. Unless the effects
from initiating change components are totally independent of each other, their interaction
has to be considered during the planning process. By evaluating them separately, their
combined effects are easily overlooked and end up being a crucial omission in reflecting
the real extent of impacts from the proposed change implementation plan.
It can be implied from previous discussion that engineering change planning process for
many complex products can be an overwhelming task. As suggested in the literatures, the
potential change propagation paths in a product design is a factorial function of its
number of elements [134], which can be extremely high for many complex products. Due
to the numerous possible change propagation paths, it can consume a tremendous amount
of time and efforts to generate all possible change plans. However, it has been observed
in real industrial practices that the solution space for product redesign planning is often
constrained by manufacturers, where some subsystems are not allowed to be modified
due to company’s management policy because they cost too much or their adaptation is
too risky [115]. For instance, while developing their engine variants, designers in Perkins
Engines Company reserved several parts of the baseline engine from being modified as
their redesign was anticipated to cause significant increase in the development efforts and
costs beyond the preferred limit [118]. This kind of resolution effectively reduces the
amount of potential change propagation paths, hence the possible change plans.
From the understanding of this situation, a considerable amount of redesign planning
efforts could be saved if designers are assisted with a proper scheme to reduce their
product change solution space into a more manageable size for the practicality of their

204
redesign analysis. In other words, the redesign planning can be made more efficient if all
highly risky modifications are screened out early in the process. By doing so, valuable
computational efforts could be saved from being spent on those risky change plans that
would be eventually eliminated. In previous section 3.4.3, it has been discussed that the
change role of each component can vary in different change situations and this leads to
dissimilar change propagation paths. This means that a component does not have a pre-
determined change behavior [115]. It can swap roles during engineering change process
depending on the nature and magnitude of the propagated change effects, and its role in
the integrated product architecture [175]. In general, four types of component change role
are described as follow [115]:
• Absorbers – propagate no further changes after being changed
• Carriers – transferring change to others after being changed but neither
reduce nor add to the complexity of the change problem
• Multipliers – expand the change problem further by making it more complex
• Constants – not affected and not causing changes
During redesign planning, designers have the choice to pass on the change effects from
one component to another [116]. How a component within the product architecture is
affected by the proposed changes depends on the way they are implemented [81]. With
respect to different component change roles, the propagation path will be truncated when
it reaches either a “constant” or an “absorber”. Since the least risky implementation plan
is highly preferred, this knowledge is applied to determine the effective change solution
space by “freezing” risky parts from being subjected to changes by the proposed redesign
plan. This decision influences the ability of system components to accept and propagate
engineering change effects, which can be exploited to control and reduce the likelihood
of further propagated changes [121]. For instance, the components that are classified as
risky will be assigned the role of a “constant”.

205
To decide whether a component is risky enough to be screened out from the change plan,
it is evaluated from two aspects of redesign development risks. If the component has a
high risk when being changed and at the same time propagates its change effects to other
risky components, then it should not be changed. This decision is practically based on the
objective to avoid unending change propagation, which is discussed in section 1.2.2 to be
detrimental to the success of the redesign process. However, if the component has been
determined to be the change initiating component, then it should not be designated as a
“constant” or otherwise the redesign goals might not be able to be successfully achieved.
Observing the change decision-making process, it can be principally broken into several
smaller “pairwise change comparison” sub-tasks where the decision to either propagate
the change effects to the following component in the propagation tree or have the current
component absorbs the impacts to itself is made based on the perception of which option
leads to a better change risk situation. In other words, this relates to the causal influences
of the change decision and its level of impacts. According to Saaty, one way to resolve
this decision-making problem is the holistic approach where the factors and criteria that
are involved in the procedure are identified and hierarchically ranked to highlight their
transparent dependencies [276]. From this, their relative influence on the overall solution
can be estimated and be used to aid the decision maker. The derivation of a prioritization
ranking through pairwise comparison has been proposed in MAAP procedure in section
3.1.3, which is applied in the determination of relative importance for the metrics in its
assessment process [339].
Based on observation of industrial practices, the change solution space for the proposed
SPEC method is established by evaluating the relative change preferences of the aircraft
subsystems and their relative potential of being affected by changes on other subsystems.
This assessment should be made at the subsystems level instead of at the components

206
level because the subsystems are mostly designed and developed independently by the
various suppliers instead of solely by the primary aircraft manufacturer. It is unrealistic to
ask them to “freeze” several of their product parts while changing the others since each
supplier or subcontractor has their own design optimization scheme. Assuming that each
subsystem comes as a single package from the supplier, it is more reasonable to decide if
the subsystem as a whole should be considered for modification or not.
Coming back to the pairwise comparison problem, the relative ranking of the elements is
derived through a prioritization matrix and to ensure the accuracy and consistency of the
assessment (if it is done subjectively), the matrix should be reciprocal [275]. To generate
and establish the priorities of the elements that have been measured based on the same
rating scheme, their normalized ratio scale is used. As stated by Saaty, “ratio scales are
the only means to generalize a decision theory into a case of dependence and feedback”
[274]. In MAAP procedure, the normalized ratio scale is derived by dividing the score of
each element to the overall sum [339], which can be seen as a slightly simplified version
of Analytical Hierarchy Process (AHP) [274]. An example to highlight this procedure is
depicted in following Table 66.
Table 66: Sample Calculation to Establish Relative Priorities
Component A B C Total Score Normalized Ratio Score
Rank
A 1 5 0.2 6.2 6.2/23.5 = 0.26 2 B 0.2 1 0.1 1.3 1.3/23.5 = 0.06 3 C 5 10 1 16.0 16.0/23.5 = 0.68 1
TOTAL 23.5 1.00
For the proposed SPEC methodology, the first prioritization matrix is applied to establish
change preference between a pair of subsystems. This pairwise comparison answers the
question of how preferable it is to change one particular subsystem against the other. This
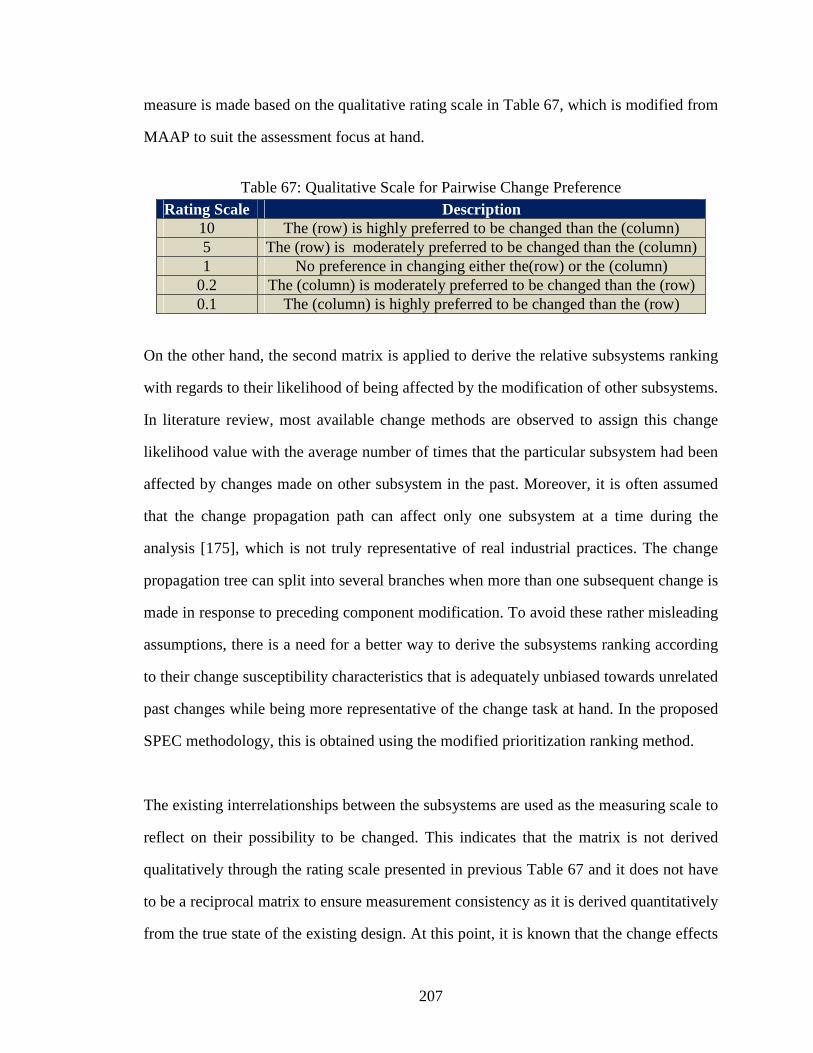
207
measure is made based on the qualitative rating scale in Table 67, which is modified from
MAAP to suit the assessment focus at hand.
Table 67: Qualitative Scale for Pairwise Change Preference
Rating Scale Description 10 The (row) is highly preferred to be changed than the (column) 5 The (row) is moderately preferred to be changed than the (column) 1 No preference in changing either the(row) or the (column)
0.2 The (column) is moderately preferred to be changed than the (row) 0.1 The (column) is highly preferred to be changed than the (row)
On the other hand, the second matrix is applied to derive the relative subsystems ranking
with regards to their likelihood of being affected by the modification of other subsystems.
In literature review, most available change methods are observed to assign this change
likelihood value with the average number of times that the particular subsystem had been
affected by changes made on other subsystem in the past. Moreover, it is often assumed
that the change propagation path can affect only one subsystem at a time during the
analysis [175], which is not truly representative of real industrial practices. The change
propagation tree can split into several branches when more than one subsequent change is
made in response to preceding component modification. To avoid these rather misleading
assumptions, there is a need for a better way to derive the subsystems ranking according
to their change susceptibility characteristics that is adequately unbiased towards unrelated
past changes while being more representative of the change task at hand. In the proposed
SPEC methodology, this is obtained using the modified prioritization ranking method.
The existing interrelationships between the subsystems are used as the measuring scale to
reflect on their possibility to be changed. This indicates that the matrix is not derived
qualitatively through the rating scale presented in previous Table 67 and it does not have
to be a reciprocal matrix to ensure measurement consistency as it is derived quantitatively
from the true state of the existing design. At this point, it is known that the change effects

208
can propagate between two components if and only if they are interrelated to each other
[174]. Based on this notion, an appropriate relative measure of their change relationship
strength is the ratio of how many potential propagation links exist between them to their
respective total of change links with others. If they are interconnected in so many ways to
each other, it is highly likely that the modification made in either one of them will also
affect the other. In contrast, the change effects are certainly not propagated if they have
no interconnection at all between each other.
Once the rankings of the subsystems change likelihood and change preference have been
derived, they are mapped together in the same plot that indirectly represents the available
change solution space. Based on the standard or allowable limit set by designers, the
subsystems that have a low change preference level but a high change potential rank can
be classified as a “constant” for the change plan. It should be cautioned that proper care
must be taken to not over-constrain the change alternatives by freezing unnecessarily too
many components from being modified.
After the change solution space has been defined, all possible implementation alternative
plans are extracted by going through the “reduced” CIM aircraft model. Several limiting
algorithms have been proposed by available change propagation methods from previous
background studies in section 3.4. By considering them and the objective of the proposed
SPEC method, two change propagation guidelines are suggested as follows:
• If changes imposed on the same change attribute of a component come from the
same initiating component twice, then the propagation is blocked. This is to avoid
the propagation tree from going into the same loop over and over again.
• If changes imposed on an aspect of a component are conflicting with its previous
effected changes, then the propagation is blocked. This is to avoid having infeasible
change plan with respect to all governing requirements.

209
With these applied guidelines, the order of execution for each change requirement can be
a significant factor in shaping up the change planning process. In typical product redesign
development, several initiating engineering changes are often required and their effects
are interconnected [120, 272, 332]. To fully explore the implementation planning, the
process must be executed in all possible execution orders unless a priority order has been
pre-set beforehand. In view of this, the maximum number of execution order is estimated
as the factorial of the initiating components. If there are two initiating components A and
B, then the first planning process is executed by considering A first and then B. In return,
for the second process, B should be considered first. Similar action is also taken when the
change effects propagation branches out into more than one path.
It is clear that this emphasis on execution orders greatly increases the amount of required
computational efforts for the redesign planning process. The effects of execution order
only become a factor during planning if different propagation paths cross each other. To
avoid unnecessary computational efforts, incompatible change solutions should be first
identified. If the change propagation trees from different initiating components are totally
independent of each other, their execution order does not matter to the overall risks of the
change plans. The full propagation trees are derived by assuming that no component will
absorb the change effects imposed on them by preceding component. Hence the effects
propagation will only stop when it encounters a “constant” that has been determined from
the reduced change solution space or when it violates the previously defined propagation
guidelines. If the proposed redesign changes from different sources on a component are
found to be incompatible, only the execution order for those requirements is varied from
their first point of conflict. Once all the change propagations have been mapped out, the
change roles of the affected system components are varied to derive all possible change
plans. In order to better illustrate this step of the proposed SPEC method, its sequence of
phases is presented in Figure 72.

210
Figure 72: Overall Workflow for Step 3
To demonstrate this Step 3, consider again electrical power subsystem of Boeing B737-
200 example. To further simplify the matter, the construction of prioritization matrices
for change likelihood and preference is focused only on three subsystems in Figure 64:
electrical power (ATA 24), auxiliary power (ATA 49) and turbine engine (ATA 72). It
can be concluded from Figure 64 that the electrical power subsystem has one connection
to APU where the auxiliary electrical power is supplied and one link each with the two
engines that supply mechanical inputs to the generator drives. No interrelationship exists
between the auxiliary power unit and the turbine engines. Furthermore, suppose that their
total relationships with the other aircraft subsystems is known (which is hypothesized for
the sake of the calculation). The prioritization matrix for change likelihood is constructed
as in Table 68.
Table 68: Example Evaluation of Subsystem Change Likelihood Score
Electrical Power
Auxiliary Power
Turbine Engine
Total Connection
(*speculated)
Total Score
Normalized Score
Electrical Power
1 1/6 = 0.17 2/11 = 0.18 30* 1.35 0.39
Auxiliary Power
1/31 =0.03 1 0 5* 1.03 0.30
Turbine Engine
2/31 = 0.06 0 1 10* 1.06 0.31
TOTAL 3.44 1.00

211
Based on Table 68, a higher total score means that the corresponding subsystem is more
susceptible to be changed. For instance, the first row of the matrix corresponding to the
electrical power subsystem can be interpreted as follows. The measurement value of 1 is
assigned in the first column to signify that any proposed change on the electrical power
subsystem (column 1) will undoubtedly affect its current design. On the other hand, if the
current auxiliary power unit (column 2) requires modification, the measurement value of
0.17 implies an estimated 17% chance that the change will also affect the electrical power
subsystem (row 1). This is based on the assumption that the auxiliary power unit has five
distinct interlinks with other subsystems and one of them is linking to the electrical power
subsystem. An extra value is added to the total number of links for the change likelihood
estimation to represent the possibility of no propagated change. This extra “link” measure
ensures that the derived change likelihood is mutually exclusive [175]. While the actual
modification cannot be specified at this point as the change plan is not yet available, this
estimation is based on the notion that if the change effects are to be propagated, they will
have to be made through the existing interconnections that the subsystems have with each
other. A higher amount of interrelationships with other subsystems means higher chances
for the change effects to be passed through the subsystem.
Meanwhile, the ranking of subsystems change preference is derived through prioritization
matrix in Table 69. Recall that the qualitative change preference for the subsystems pair
is assigned based on the rating scale defined in previous Table 67.
Table 69: Example Evaluation of Subsystem Change Preference Score
Electrical Power
Auxiliary Power
Turbine Engine
Total Score
Normalized Score
Electrical Power 1 5 10 16.0 0.56 Auxiliary Power 1/5 = 0.2 1 10 11.2 0.39 Turbine Engine 1/10 = 0.1 1/10 = 0.1 1 1.2 0.04
TOTAL 28.4 1.00

212
Based on Table 69, a higher total score means the subsystem is preferred to be changed in
comparison to other subsystems. For instance, the first row of the matrix corresponding
to the electrical power subsystem can be interpreted as follows. Referring to Table 67, a
value of 1 is given to the first column to indicate a similar level of change preference of
the electrical power subsystem to itself. Conversely, the value of 5 in the second column
indicates a moderate change preference for the electrical power system over the auxiliary
power unit. This indicates that given a choice, designers moderately prefer to modify the
electrical power subsystem rather than the auxiliary power.
A simultaneous mapping of the subsystems change likelihood and preference scores is
depicted in Figure 73. The change role for turbine engine is designated as a “constant”
because its level of change preference is extremely low, indicating its perceptively high
change risk in relative to the others. These measures are not to be taken as “absolute” but
should be treated as a relative comparison among considered subsystems or components.
With this decision, possible change plan alternatives that have been generated based on
the initiating changes identified in Step 2 are presented in Table 70. Notice the difference
in the component change roles for the different change alternative plans.
Figure 73: Example Subsystem Change Likelihood-Change Preference Mapping

213
Table 70: Example Generated Change Plans
Plan Modified
Component Change
Role Change Remarks
1 Generator Drive (1 and 2) + Electrical Generator (1 and 2)
Absorber
Combined into a starter-generator unit. Because the turbine engine is “freeze”
from being modified, the starter-generator has to fit the current mechanical drive input requirement and still produce the
same required amount of electrical power supply.
Generator Drive (1 and 2) + Electrical Generator (1 and 2)
Carrier
Combined into a starter-generator unit. Produce electrical power supply based on
the existing amount of available mechanical input from the turbine engine. 2
AC Bus (1 and 2) Absorber Include a power converter unit to match the characteristics of the electrical-based
components.
Generator Drive (1 and 2) + Electrical Generator (1 and 2)
Carrier
Combined into a starter-generator unit. Produce electrical power supply based on
the existing amount of available mechanical input from the turbine engine.
AC Bus (1 and 2) Carrier Changed to match the characteristics of the
produced electrical power supply.
3
Affected electrical-based components
Absorber Changed to match the characteristics of the
distributed electrical power supply.
The summarized illustration of this change plan generation process is shown in Figure 74.
Change Likelihood &
Preference Assessment
Change Solution Space Definition
Change Plan Generation
Figure 74: Change Plan Generation by SPEC Support Tool

214
4.2.4 Step 4: Change Impact Assessment
Up until this point, the possible change implementation alternative plans have been made
available from Step 3. The main objective for this step is therefore to assess their possible
impacts on both the development process and the performance capabilities of the product.
In general, before any modifications can be properly decided to be acceptable, its overall
effects including required efforts in redesign planning, scheduling and resourcing have to
be estimated [152]. In view of this, designer who is the change initiator or implementer is
responsible to consider all possible propagated effects before deciding the right trade-offs
during change planning [83]. As emphasized by available standards in product industries,
the most critical part of change planning process is the impact prediction [176]. However,
none of them outlines the suggested change impact analysis methods or tools as part of
their guidelines [273].
Based on literature review, the analysis of change effects from the perspective of product
development process can be approached from the level of development risks associated
with the implementation plan. In section 3.4.4, CPM has been selected as the best change
method with the most proper impact assessment scheme. It uses a simple redesign change
risk calculation that is widely applied within the product risk management field [81]. In
reference to this CPM evaluation scheme, the measure of redesign development risks is
calculated as follows:
[ ]
Risk Process Calculated Maximum
Cost Level Impact
Index Risk Process componenttaffected∑ ×
= Equation 18
In this case, all components within each implementation plan can be perceived as already
being “chosen” for modification and hence their change likelihood is taken as 1. It should
be noted that this scheme is closely similar to the one applied to estimate adaptability and
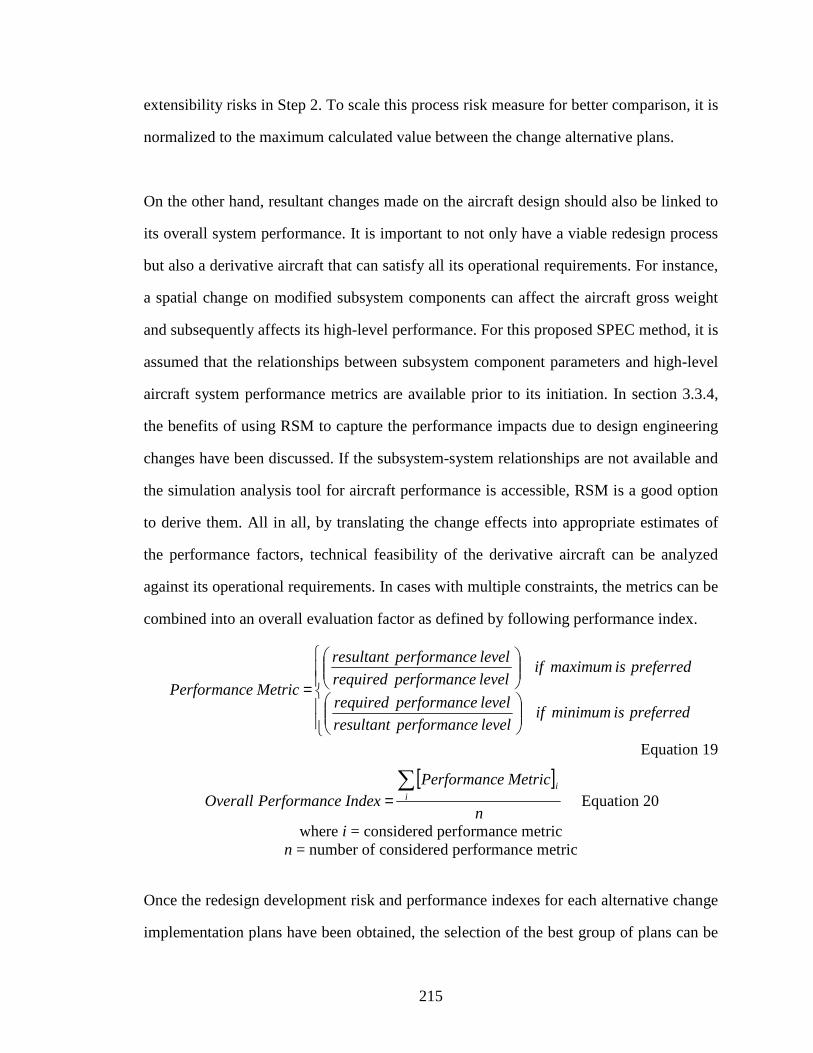
215
extensibility risks in Step 2. To scale this process risk measure for better comparison, it is
normalized to the maximum calculated value between the change alternative plans.
On the other hand, resultant changes made on the aircraft design should also be linked to
its overall system performance. It is important to not only have a viable redesign process
but also a derivative aircraft that can satisfy all its operational requirements. For instance,
a spatial change on modified subsystem components can affect the aircraft gross weight
and subsequently affects its high-level performance. For this proposed SPEC method, it is
assumed that the relationships between subsystem component parameters and high-level
aircraft system performance metrics are available prior to its initiation. In section 3.3.4,
the benefits of using RSM to capture the performance impacts due to design engineering
changes have been discussed. If the subsystem-system relationships are not available and
the simulation analysis tool for aircraft performance is accessible, RSM is a good option
to derive them. All in all, by translating the change effects into appropriate estimates of
the performance factors, technical feasibility of the derivative aircraft can be analyzed
against its operational requirements. In cases with multiple constraints, the metrics can be
combined into an overall evaluation factor as defined by following performance index.
=preferred is minimum if
leveleperformancresultant
leveleperformancrequired
preferred is maximum ifleveleperformancrequired
leveleperformancresultant
MetricePerformanc
Equation 19
[ ]n
MetricePerformancIndexePerformancOverall i
i∑= Equation 20
where i = considered performance metric n = number of considered performance metric
Once the redesign development risk and performance indexes for each alternative change
implementation plans have been obtained, the selection of the best group of plans can be

216
made. All in all, the tasks involved in this change impact analysis phase of the proposed
SPEC method are summarized in Figure 75.
Figure 75: Overall Workflow for Step 4
To demonstrate the procedures involved in this Step 4, the generated change alternative
plans for the example electrical power subsystem of B737-200 aircraft that are tabulated
in Table 70 are analyzed. Calculation for the process risk and performance indexes that
are associated with them is presented as follows. This sample calculation is formulated
purely by intuition and should not be taken as a true representation of the present state of
industry. Instead, the main goal here is to simply demonstrate the procedures in this Step
4. With that in mind, the process risk evaluation is presented in Table 71.
Table 71: Example Process Risk Calculation for Alternative Change Plans
Plan Modified Component Change Role
Process Risk Calculation
Process Risk Index
1 Generator Drive (1 and 2) +
Electrical Generator (1 and 2) Absorber 6*8 = 48 48
Generator Drive (1 and 2) + Electrical Generator (1 and 2)
Carrier 1*6 = 6 2
AC Bus (1 and 2) Absorber 6*6 = 36 42
Generator Drive (1 and 2) + Electrical Generator (1 and 2)
Carrier 1*6 = 6
AC Bus (1 and 2) Carrier 1*6 = 6 3 Affected electrical-based
components Absorber 3*10= 30
42

217
From Table 71, the estimated redesign process risk for plan 1 should be similar to that
calculated for adaptability risk in Step 2. This is because for that particular change plan,
the change role of the combined “generator drives and AC generators” is assigned to be
an absorber. This indicates that the initiating changes have to be accommodated within
these parts only, which matches the condition for adaptability. On the contrary, for plans
2 and 3, their role is switched to a “carrier” and the propagation of their change effects is
allowed to other components. This condition is similar to extensibility characteristic for
system evolvability measure and hence it can be observed that the estimated process risk
in this case is the same as the valuation of extensibility risk in Step 2. Another highlight
of Table 71 is the fact that the average process risk for plans 2 and 3 are equal to each
other although the former involves less affected components. If the process redesign risk
is the sole selection criterion, plan 2 is generally the most preferable change proposal
amongst the three options because it is less risky than plan 1 and requires relatively less
redesign efforts than plan 3. However, it should be noted that the process risk evaluation
for plan 3 in this example has been highly simplified (especially with regards to affected
electrical-based subsystems) in order to better demonstrate the calculation procedure.
On the other hand, the calculation of aircraft performance impacts that are caused by the
design modification requires the established relationships between the affected subsystem
parameters and the high-level system performance metrics under interest. Recall driving
requirements that are defined for this example in Table 62. Let’s just focus on the gross
weight requirement for this demonstration purpose and the speculated weight effects for
each of change implementation plan are presented in Table 72. Again, these estimated
values are purely derived based on speculation.
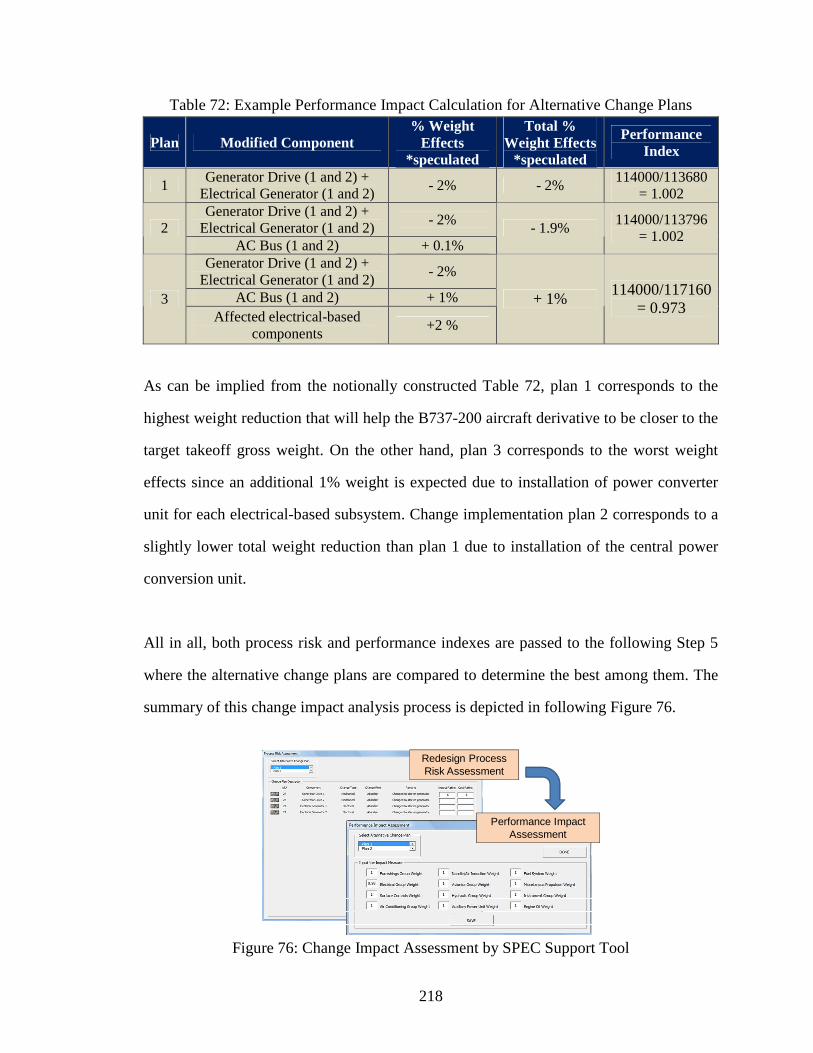
218
Table 72: Example Performance Impact Calculation for Alternative Change Plans
Plan Modified Component % Weight
Effects *speculated
Total % Weight Effects
*speculated
Performance Index
1 Generator Drive (1 and 2) +
Electrical Generator (1 and 2) - 2% - 2%
114000/113680 = 1.002
Generator Drive (1 and 2) + Electrical Generator (1 and 2)
- 2% 2
AC Bus (1 and 2) + 0.1% - 1.9% 114000/113796
= 1.002
Generator Drive (1 and 2) + Electrical Generator (1 and 2)
- 2%
AC Bus (1 and 2) + 1% 3 Affected electrical-based
components +2 %
+ 1% 114000/117160
= 0.973
As can be implied from the notionally constructed Table 72, plan 1 corresponds to the
highest weight reduction that will help the B737-200 aircraft derivative to be closer to the
target takeoff gross weight. On the other hand, plan 3 corresponds to the worst weight
effects since an additional 1% weight is expected due to installation of power converter
unit for each electrical-based subsystem. Change implementation plan 2 corresponds to a
slightly lower total weight reduction than plan 1 due to installation of the central power
conversion unit.
All in all, both process risk and performance indexes are passed to the following Step 5
where the alternative change plans are compared to determine the best among them. The
summary of this change impact analysis process is depicted in following Figure 76.
Redesign Process Risk Assessment
Performance Impact Assessment
Figure 76: Change Impact Assessment by SPEC Support Tool

219
4.2.5 Step 5: Change Plan Selection
So far, the alternative change implementation plans that can possibly satisfy the driving
requirements have been derived back in Step 3. For this Step 5, the main focus is to select
the best among the possible redesign plans and this decision is made based on the results
of the change impact analysis done in Step 4.
It is known from the literature study that the choice of redesign plan is highly influenced
by its potential consequences [39]. As argued before, the decision-making process should
consider the estimated effects from both the process and product performance viewpoints.
Unfortunately, the available change methods that have been identified in the literature do
not directly discuss or emphasize on the latter aspect of the redesign effects. In general,
the development process risk is preferred to be as low as possible while the performance
of the resultant design needs to be as close as possible to the target requirements. For the
proposed SPEC method, these preferences correspond to the highest value for the process
risk and performance indexes that are defined in previous Step 4. Moreover, the change
plan selection process can be visually aided by the redesign performance-risk plot. It is
suffice to say that the group of the change implementation plans that is contained within
the pre-set limits of the development process risk and performance constraints will make
up the potential change proposals for the required modification.
Coming back to the electrical power subsystem example, the corresponding performance-
risk plot for its generated change alternative plans is presented in Figure 77. As can be
observed from the figure, the weight performance of the redesigned aircraft in plan 3 fails
the performance constraint since it has a performance index less than 1 (if multiple target
performance metrics are combined into this index, care must be taken before making this
conclusion) although its process risk is more favorable than plan 1. On the whole, plan 2
seems to be the best option due to its comparable weight benefits but significantly lower

220
process risk to those of plan 1. In addition, from the assessment of this plot, the possible
redesign trade-offs can be identified and formulated to improve the generated plans in the
case when none of them is perceived as acceptable.
Figure 77: Sample Performance-Risk Plot
In summary, the tasks involved in this final selection step for the proposed SPEC method
are depicted in Figure 78.
Figure 78: Change Plan Selection Step in Proposed SPEC Method

221
The depiction of this selection in the SPEC support tool is shown in Figure 79.
Figure 79: Change Plan Selection Environment by SPEC Support Tool
4.3 Summary of Proposed Methodology Activities
With the steps of the proposed SPEC methodology have been detailed out, their summary
of activities is presented in Figure 80.
Figure 80: Activities in Strategic Planning of Engineering Changes (SPEC) Method
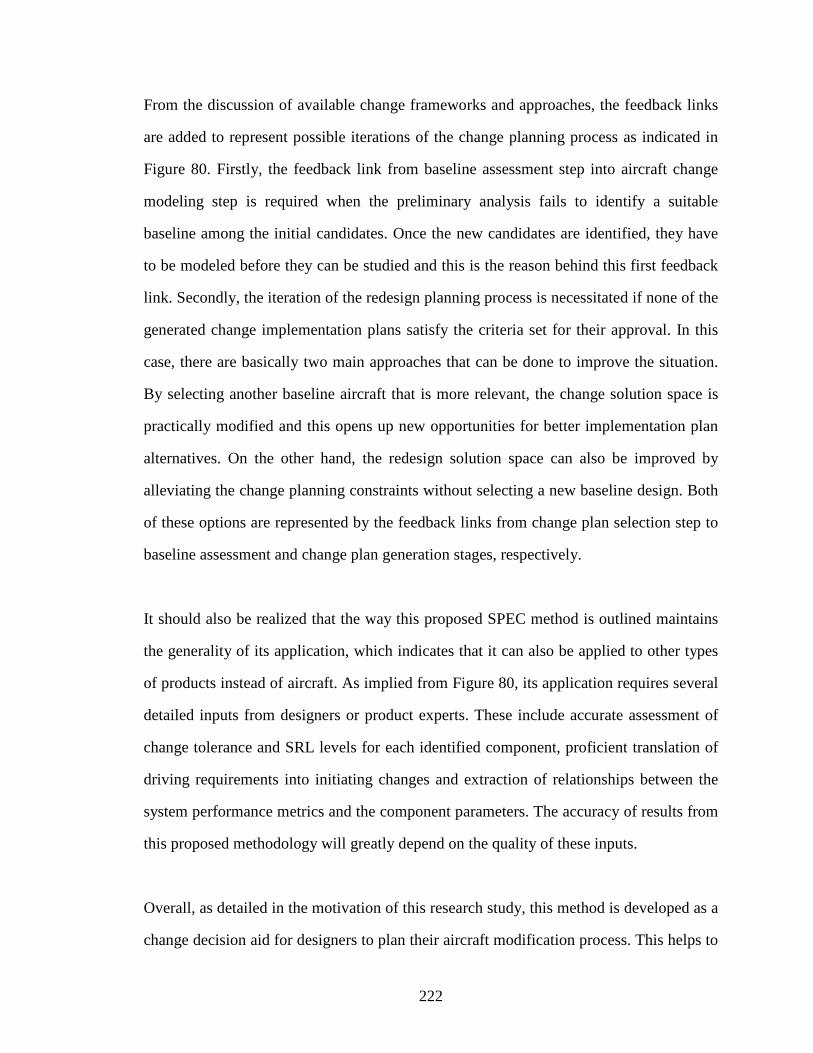
222
From the discussion of available change frameworks and approaches, the feedback links
are added to represent possible iterations of the change planning process as indicated in
Figure 80. Firstly, the feedback link from baseline assessment step into aircraft change
modeling step is required when the preliminary analysis fails to identify a suitable
baseline among the initial candidates. Once the new candidates are identified, they have
to be modeled before they can be studied and this is the reason behind this first feedback
link. Secondly, the iteration of the redesign planning process is necessitated if none of the
generated change implementation plans satisfy the criteria set for their approval. In this
case, there are basically two main approaches that can be done to improve the situation.
By selecting another baseline aircraft that is more relevant, the change solution space is
practically modified and this opens up new opportunities for better implementation plan
alternatives. On the other hand, the redesign solution space can also be improved by
alleviating the change planning constraints without selecting a new baseline design. Both
of these options are represented by the feedback links from change plan selection step to
baseline assessment and change plan generation stages, respectively.
It should also be realized that the way this proposed SPEC method is outlined maintains
the generality of its application, which indicates that it can also be applied to other types
of products instead of aircraft. As implied from Figure 80, its application requires several
detailed inputs from designers or product experts. These include accurate assessment of
change tolerance and SRL levels for each identified component, proficient translation of
driving requirements into initiating changes and extraction of relationships between the
system performance metrics and the component parameters. The accuracy of results from
this proposed methodology will greatly depend on the quality of these inputs.
Overall, as detailed in the motivation of this research study, this method is developed as a
change decision aid for designers to plan their aircraft modification process. This helps to

223
fill the current absence of change planning methods and tools, and in the bigger picture it
also helps manufacturers to identify related development risks and required processes
with their sub-contractors. By knowing more details about their aircraft redesign aspects,
manufacturers can have a better control of their designs by providing more complete
specification to their sub-contractors and avoid any system integration problems later on.
The knowledge gained from this planning process enables the return of the design control
to the primary aircraft manufacturers rather than letting their designated sub-contractors
or suppliers control and dictate their design evolutionary paths.
4.4 Comparison to Existing Methods and Tools
From the above discussion, the procedure for each step of the proposed SPEC method has
been formulated in reference to several existing methods that are identified in Chapter 3.
This section is intended to discuss the similarities and differences of these methods to the
final procedures in the proposed SPEC method. The objectives for this discussion are to
highlight the improvements that are achieved to address the previously identified gaps in
aircraft redesign process and to distinguish the contributions of this proposed method.
In section 2.3.7, “change planning process” method has been evaluated to be the current
best among the identified existing product redesign and engineering change management
methods. A high-level comparison between its procedures and those of SPEC method is
depicted in Figure 81. Furthermore, the offered advantages and identified shortcomings
for the change planning process, which are discussed in Chapter 1, are listed again in
Table 73.

224
Fig
ure
81: C
ompa
rison
of C
hang
e P
roce
ss P
lann
ing
to S
PE
C M
etho
dolo
gy

225
Table 73: Advantages and Disadvantages of Change Planning Process Advantages Disadvantages
• Provide a structured workflow for
redesign planning process • Provide structured means to track
change propagation and analyze the impacts on development process
• Lack emphasis on strategic redesign
decision-making • Lack emphasis change impact
analysis on product performances • Do not support baseline assessment • Do not support simultaneous
changes planning
As implied from Figure 81, the proposed SPEC method maintains a structured workflow
for the redesign planning process. As described in previous section 4.2.3, the generation
of alternative change plans in SPEC method involves proper tracking of potential change
propagation paths and analysis of their impacts. On the other hand, the implementation of
SPEC method is supported by a strategic redesign approach that considers the effects on
both development process and performance metrics of the derivative aircraft, which has
been identified to be missing from procedures of the “change planning process” method.
Furthermore, the baseline assessment and the simultaneous change planning capabilities
are also incorporated into the procedures of the proposed method, which further improves
its application for the intended objective of this study. All in all, the improvements that
have been made for the proposed SPEC method resolve the identified disadvantages of
the “change planning process” method for the aircraft redesign process.
The comparison between the reference methods or tools and the proposed SPEC method
in several of its main application areas is further presented in the following sections.

226
4.4.1 Aircraft Change Modeling
Based on assessment in section 3.2.6, product dependency model by Rutka et al. [273] is
taken as the current best approach to be the main reference in the development of aircraft
change model for the proposed SPEC method. From discussion in section 3.2.5, its model
construction is mainly intended for automated change propagation prediction and
tracking. Using the defined set of attributes in Table 33 for each component, the potential
change propagation paths are identified. However, because the SPEC method is not
intended to be an automated change plan generator like most available change support
methods and tools, the scope of its modeling procedure is not required to be as extensive
as that of the product dependency model. Based on this realization, some elements of the
product dependency model are appropriately modified to fit the purpose of the proposed
method.
An aspect that is of significant concern for the change modeling procedure is the balance
between model details and required amount of efforts for the model construction. Recall
that the main goal of the proposed SPEC method is to be a decision-making aid for
designers while planning for their product redesign. Therefore, its application will be
interactive to their inputs. Instead of trying to create an extensive database of change
effects propagation that covers all possible change situations as supposed by the product
dependency model, it is adequate for the aircraft change modeling procedure in the SPEC
method to highlight the existing interconnections between the components without really
specifying their type or level of change impacts. Such change details are expected to be
input by designers or system experts during its run-time, which will better reflect on the
present situation of the change tasks at hand rather than pre-defined database that might
be inaccurately derived from historical change data. To ensure all possible means of the
change propagation are covered, the aircraft model is constructed based on the taxonomy
of system element interactions that is discussed in section 3.5.2. In addition, from the

227
product dependency model, the component change tolerance is also an important attribute
that will indicate whether the engineering change effects can be propagated between the
interconnected components. The taxonomy of system element interactions has already
been used in several product modeling approaches, albeit indirectly. The inclusion of
change tolerance level is clearly one of the criteria that make product dependency model
the better approach in accurate prediction of change effects propagation in comparison to
other identified methods. By combining these two model attributes, the aircraft change
modeling procedure for the SPEC methodology is accomplished with considerably less
amount of efforts and manageable model size but without sacrificing its accuracy to
predict the change effects propagation. To conclude, the comparison between the aircraft
change modeling approach that is used for SPEC method and the product dependency
model is presented in Table 74.
Table 74: Summarized Comparison of the Change Modeling Procedure
Required SPEC
Characteristics
Product Dependency Model
Change Modeling Step in SPEC Remarks
Provide change propagation
tracking scheme
Predict and track the change effects propagation mainly through the type and the level of the modification
Predict and track the change effects propagation mainly through the type and the level of the modification
The aircraft change modeling approach in SPEC follows the basic notion of the change effects propagation in the product dependency model
Balanced model details and modeling
efforts
The model size might be too large with the extensive change database definition and the amount of the required modeling efforts can be high. The accuracy of the change propagation can be compromised by the pre-defined change database
The model size and the amount of required modeling efforts are controlled through the use of the taxonomy of system element interactions and the change tolerance level without compromising the accuracy of the change propagation prediction
The use of taxonomy of system element interactions and the inclusion of the change tolerance level for each component ensure a manageable model size. It suits the interactive application of the proposed SPEC method

228
4.4.2 Baseline Assessment
In previous literature review, no known formal method is found to be directly focused on
the assessment of baseline suitability for redesign, particularly from the viewpoint of its
architecture. There are nonetheless several standard definitions that are proposed to guide
the evaluation process but it is acknowledged that having a structured, quantitative means
to select the product baseline is more beneficial [311]. With respect to the characteristics
outlined for the SPEC method based on the recognized gaps of current redesign practices,
quantitative system evolvability is perceived as the best available method in section 3.1.4.
In section 3.1.1, the quantitative system evolvability method has been discussed to offer a
structured evaluation scheme for the system redesign through its definition of four main
evolvability metrics: generality, scalability, adaptability and extensibility. The definition
for these metrics, as presented in previous Table 13, is closely related to the capability of
existing system architecture to accommodate the required changes. However, the missing
aspect that is essential in evaluating the incremental design efforts is the relative measure
of the resultant design complexity in comparison to its predecessor baseline. In theory, if
the baseline system is highly flexible, changeable and enhanceable, its design complexity
will not drastically increase after its modification. Furthermore, the proposed evaluation
metrics in this method is mainly focused on high system level. This can potentially lead
to misleading conclusions as the generalization of required redesign costs and efforts to
those at the higher system level does not appropriately capture the full extent of their
characteristics.
In the SPEC methodology, the four assessment metrics defined in the quantitative system
evolvability method are maintained due to their goodness in capturing the essences of the
redesign approach from the perspective of existing system architecture. However, to cope
with its inherent deficiencies regarding the resultant design complexity and the absence

229
of proper evaluation scheme for its metrics, the formulation of the baseline assessment
step for the proposed SPEC methodology also includes some elements of MAAP method,
which has been discussed in section 3.1.3. Specifically, an additional system evolvability
metric called “complexity” is introduced and a more structured calculation suggested in
MAAP is referenced for the metrics evaluation. While the system metrics in MAAP are
not directly similar to those defined in the quantitative system evolvability method, they
can be easily associated to each other and this enables the tailoring of evaluation scheme
based on the suggested MAAP approach. By doing so, the final baseline assessment step
in SPEC method can be perceived as a combination of quantitative system evolvability
and MAAP methods, which inherits the offered advantages from both methods but at a
much improved performance than that of their individual application. On the whole, the
key comparison of the baseline assessment procedure in the proposed SPEC method and
the quantitative system evolvability method is summarized in Table 75.
Table 75: Summarized Comparison of the Baseline Assessment Procedure
Required SPEC Characteristics
Quantitative System Evolvability
Baseline Assessment Step in SPEC Remarks
Provide a structured baseline
evaluation scheme
Evaluate the suitability of the aircraft system for redesign based on four evolvability metrics: generality, scalability, adaptability and extensibility
Evaluate the suitability of the aircraft system for redesign based on five evolvability metrics: generality, scalability, adaptability, extensibility and complexity
The inclusion of complexity metric based on MAAP method enables the evaluation of relative design complexity between the derivative aircraft and its baseline
Suitable for considered scope
of redesign process
The metrics evaluation is made at the high system level through the suggested DSEA qualitative rating scale
The metrics evaluation is made directly at the system level where the changes are being made using the evaluation scheme proposed by MAAP
The evaluation focus on directly affected aircraft components and the application of calculation scheme based on accepted standards in the industry provide more reliable assessment results

230
Table 75: Summarized Comparison of the Baseline Assessment Procedure (cont.)
Required SPEC Characteristics
Quantitative System Evolvability
Baseline Assessment Step in SPEC Remarks
Scalable to specific
engineering change
evaluation
The method is originally intended for the new product development efforts
The definition of the evolvability metrics has been modified to suit the application for the aircraft redesign process based on the available system standards
The modified definition of the metrics enables them to be properly used to assess the suitability of the aircraft design to undergo the proposed modification
4.4.3 Change Plan Generation
Most available change methods have been found to lack any implementation strategy and
this situation is mainly due to the fact that their application scope does not include being
a decision-making aid for designers. In other words, their application is more focused on
documenting the redesign plans that have been manually determined by designers rather
than aiding them to decide on the best way to implement the required modification into
the product system. A high reliance is put on the experiences of product design experts to
manually try to minimize the change effects [79].
On the other extreme, several change methods and tools are developed as an automated
change plan generator. In this application, no interaction with designers or experts is
involved during the generation of the change implementation plans. The planning is
automatically done based on the product change database. It appears that these methods
rely heavily on historical data that tends to lead to a biased change propagation analysis.
As the characteristics of the engineering changes often differ from case to case, taking the
average historical measure to estimate the change likelihood and impact metrics without
considering the differences in the actual situation of the change problems can mislead the
overall risk evaluation. It is suggested that the automated change propagation analysis is

231
applied only in cases with well-defined and static product structures [152] since most of
the automatically generated change plans assume that the physical product components in
existing architecture will remain the same as it is before the proposed initial modification.
This is not always true as some revolutionary changes can take place and consequently
modify the dynamics between the product components.
In section 3.4.4, change prediction method (CPM) has been evaluated as the current best
to be applied in generating and assessing possible change implementation plans. It was
suggested that CPM is one of the most advanced change propagation method that is
presently available [273]. From its description in section 3.4.3, CPM predicts potential
change propagation paths based on the constructed product DSM model that contains the
information on its components interconnections. In short, the method assumes that any
existing connection indicates that the change effects will be propagated between the two
interlinked components. However, it has been argued that this is not always the case since
change propagation also depends on the type and level of the modification. On the other
hand, once change propagation paths have been mapped out, the overall risk is estimated
by CPM using the risk calculation scheme that is widely used in product risk assessment
field. Briefly, the redesign risk is measured as the product of change likelihood and
change impact level. Even though the risk estimation scheme is widely accepted in the
field, problem arises when the measures for change likelihood and impact level are
derived through historical change data. Due to the fact that the condition of change task at
hand might easily be different than previous change cases, the analysis results can be
misleading and hardly representative of the present change problem. Last but not least,
because CPM is not developed to be a change plan generator, it is not equipped with the
ability to explore change solution space or to simultaneously analyze different initiating
changes at a time.

232
For the change implementation planning procedure in the proposed SPEC methodology,
the main interest is to be able to fully explore the change solution space and extract all
possible change implementation plans for the required modification. To accomplish this,
the appropriate change solution space must be defined. In theory, the solution space is
made up by the decision to either allow a component design to be affected by the
initiating changes or not. While this practice is evident in the industry, no known method
is found to formalize this idea. From the understanding that such decision is often made
by designers based on the business aspects of product manufacturing rather than the
design technical aspects, the change solution space defined in the proposed SPEC method
is constructed based on change likelihood and preference measures. Change likelihood
corresponds to the measure on how likely a component will need to be modified from the
changes made in others. Because it is known that the primary means for change effects
propagation is the connection between the components, which has been acknowledged by
many available change methods or tools, the component that has many links to the others
will have a higher possibility to be affected by any modification. Moreover, to capture the
preference of designers (or the company’s policy) in modifying the product components,
their inputs are used to sort the components based their change preference. Overall, these
two relative rankings are derived using the concept of ratio scales that has been suggested
for similar type of assessment problems [274]. This information helps to aid designers in
deriving the change solution space to be considered for the implementation planning.
Based on the defined change solution space, the possible change implementation plans
can be generated without increasing too much computational efforts by eliminating the
infeasible or unfavorable alternatives. While the core idea in CPM to predict the change
propagation through existing interconnections between the product components is good,
its execution is improved for the SPEC methodology by considering the change type and
level. This is formulated in reference to CPA method, which is discussed in section 3.3.1.
233
With the inclusion of these propagation criteria, the prediction accuracy is improved. To
fully explore the change solution space in order to generate change plan alternatives, the
component change roles can be varied. Although it is acknowledged that the component’s
change role can be different in different change propagation situations [115], no known
formal method is found to take full advantage of this conception to study the possible
implementation plans. By allowing the change roles to vary, several alternative redesign
plans can be generated. This generation of change implementation plans should be made
simultaneously for all initiating changes to avoid conflicts during the implementation into
the product. In reference to KRITIK method, which is described in section 3.4.2, a
priority order for the initiating changes can be defined. Else, the planning order for the
driving change requirements can be varied accordingly when no priority is specified.
On the other hand, it is known that CPM estimates the impacts of the proposed product
modification through the product risk measurement used in risk management field. This
scheme is well-recognized and hence it is applied for SPEC method as well. However,
the identified issue with CPM is how the change likelihood and impact measures are
derived from past change data. The analysis results by using such data might mislead the
conclusion because the present change situation can be greatly different than those
encountered in the past. Plus, in the presence of newly-available technologies, the current
change impacts can be different for the same modification that is made in the past. To
avoid such misleading circumstances, the SPEC methodology interacts with designers to
determine those measures based SRL and cost rating scales. By doing so, the inputs into
the analysis are more reflective of the present change task at hand.
Overall, the comparison of the change plan generation procedure in the proposed SPEC
method and CPM is summarized in Table 76.

234
Table 76: Summarized Comparison of the Change Plan Generation Procedure
Required SPEC Characteristics CPM
Change Plan Generation Step in
SPEC Remarks
Provide a structured
redesign strategy
Predict the change effects propagation through any existing interconnections between the components without considering the change type or level
Derive the possible modification plans by varying the change roles of the aircraft components based on the defined change solution space. The change propagation is predicted through existing connections between the components, the change type and level
The consideration of the change type and level improves the accuracy of the change propagation prediction. In addition, the full exploration of the change solution space is made possible by varying the components’ change role
Provide a proper redesign plan assessment
scheme
Estimate the redesign risk as a product of the change likelihood and the change impact level, which are pre-defined in the model database
Estimate the redesign risk as a product of the change likelihood and the change impact level, which are interactively defined by the designers in real-time
The interaction with the designers allows a more representative definition of the measures that is reflecting the present change task at hand
Scalable to simultaneous
initiating changes case
Does not support simultaneous change planning
Include the change priority definition or in cases when no priority is defined, the order is varied accordingly
The simultaneous planning is important to avoid any implementation conflicts and to allow full exploration of the change solution space
4.5 Chapter Summary
Based on the gained knowledge from the literature review that is presented in Chapter 3,
several research hypotheses have been derived to help address the research questions. In
addition, the literature study also highlights the absence of available methods or tools that
fully capture the essences of aircraft redesign process. This supports the basic motivation
for this research study that there currently exists an urgent need for a strategic redesign
planning method that not only enables existing product designs to satisfy the new market

235
requirements and demands, but also realizes them in the most efficient manner possible.
Complete formulation of the proposed SPEC method has been explained in this chapter
and while several available methods or tools have been used as the main references in its
development, most of them are not directly applied within the method. Instead, some of
their elements and underlying principles have been combined to resolve their identified
deficiencies and improve their performance for application within the proposed method.
This has been highlighted through the comparison of the formulated SPEC methodology
with the referenced methods and tools.
In following Chapter 5, the anticipated capabilities from this proposed SPEC method are
further demonstrated through two sample implementation case studies. The results from
these studies are used to support the research hypotheses made in this chapter.

236
CHAPTER 5
IMPLEMENTATION OF PROPOSED METHODOLOGY
“Organization’s efficiency can only be gained if its methods,
techniques and process are aimed at serving competitive
strategies for engineering change management.”
- Riviere, DaCunha, Tollenaere (2002)
The proposed SPEC methodology has been thoroughly explained in preceding Chapter 4.
In this chapter, two notional aircraft redesign studies are discussed to address the research
questions and to verify the proposed research hypotheses. The main goal of these sample
case studies is not to comprehensively design a derivative aircraft system but to highlight
the capabilities of proposed redesign method with regards to outlined research questions
and hypotheses.
For the first case study, the proposed methodology is applied to select a suitable baseline
aircraft for a sample redesign task. To demonstrate the influence of design architecture in
dictating suitability of a system to be adapted for its change requirements, three potential
baseline candidates are evaluated against each other. Meanwhile, second implementation
case study is aimed to demonstrate full range of formulated redesign planning procedures
within the proposed SPEC method. In this example study, transparency of the decision-
making process from initiating change requirements up to selection of the best redesign
plan is shown through a notional aircraft system redesign scenario. For both case studies,
the devised scenario for change requirements are tailored to more-electric aircraft (MEA)
initiatives.

237
Before the sample case studies, first part of this chapter presents a general description of
MEA initiatives that are considered as sample change requirements. The purpose for their
explanation is to provide some insights on the type and level of system modification that
should be expected from their implementation into an existing aircraft. This background
knowledge is also useful for the following qualitative assessment of technology readiness
and cost to be realized in aircraft subsystems.
5.1 More Electric Aircraft (MEA) Initiatives
In present aviation industry, there is an ongoing revolution by designers towards an all-
electric aircraft (AEA) design. A study by Lockheed Corporation projected a savings of
nine billion dollars over 16 years of AEA ownership for airlines in comparison to that of
electrical-hydraulic-pneumatic-mechanical aircraft [95]. Note that this estimation is based
on a fleet of 300 all-electric, 500-passenger aircraft. Although AEA remains a future goal
within aircraft industry, several more-electric aircraft (MEA) ventures have already been
initiated including those by US Air Force in the early 1990s [335]. This is perceived as a
progressive step towards AEA with technologies to support an all electrically-operated
aircraft are being developed step by step.
In general, the pursuit for AEA design aims to replace conventional aircraft accessories
like high-pressure hydraulics, engine bleed air, pneumatics and non-electric engine-start
systems with electric generators for a simpler and more reliable secondary power system
[94, 99]. Instead of having subsystems powered by mechanical, hydraulic or pneumatic
means, efforts are being made to have them all electrically-powered. This enables several
value-added advantages in aircraft operation including reduction in subsystem weight and
size, higher reliability and lower maintenance cost [49, 99]. The notion of future AEA is
not entirely far-fetched since most modern aircraft systems are already designed with as

238
much as 92% of electric/electronic operation [95]. Boeing B787 aircraft is Boeing’s first
MEA, which is equipped with ice and rain protection, landing gear, flight control, cabin
pressurization and engine starting systems that are fully electrically-operated for the first
time [49]. Cutts reported that although amount of research activities to advance electrical
equipment and subsystems for aircraft application have notably increased in recent years,
much of the efforts have been limited to a stand-alone demonstrator or simulation within
existing electrical architectures [99].
For sample redesign case studies in this chapter, the focus is placed on MEA technologies
that have been developed for flight controls, in-flight entertainment and electrical power
distribution.
5.1.1 Electrical-based Flight Controls
In concert with MEA concept, there is a significant progression throughout the aerospace
industry regarding fly-by-wire (FBW) system. Primary drivers behind this development
are offered advantages of electronic flight controls against heavy maintenance-intensive
hydraulic, pneumatic or mechanical systems [49]. Due to technological advancements in
FBW field, electronic flight controls have become a standard in commercial and military
aircraft system [53]. Available options for electrical actuation include electro-mechanical
actuation (EMA) and electro-hydrostatic actuation (EHA). EMA uses an electric motor to
directly drive actuator output through a mechanical gearing mechanism while EHA uses
an electric motor to drive a dedicated hydraulic pump that provides hydraulic power for
actuator output [99]. Though EHA reintroduces hydraulic elements in its operation, they
are self-contained and do not involve the main aircraft hydraulic power subsystem. In the
following sample case studies, the focus is put on EMA that is categorized under power-
by-wire (PBW) approach. Thus far, it appears that electrical actuation systems are likely

239
to require a 270V DC power supply. In the absence of a new electrical power generation
and distribution scheme, power conversion units (PCUs) are installed to rectify existing
three-phase, 115V AC power supply into 270V DC power [183]. Block diagram for PBW
architecture of electromechanical actuator (EMA) is depicted in Figure 82.
Vehicle Management
Computer
Actuator Control & Power
Electronics
Motor----------------
ClutchGearbox
RAM
Electrical Power
Electrical Power
RAM Position EMA
Figure 82: Basic Configuration for EMA Implementation [322]
In general, EMA consists of a servo-controlled, variable “speed and direction” electrical
motor, a high-speed gearbox with gear reduction mechanism and a geared rotary actuator
or a linear ballscrew [93]. For flight control application, primary elements of EMA are
actuator module (AM) and electronic control unit (ECU). AM takes care of electrical-to-
mechanical power conversion and mechanical transmission drive to control surfaces. In
the meantime, ECU is responsible for EMA position control and loop closure, and control
of its electric motor [93]. This is depicted in Figure 83.
Figure 83: EMA Functional Diagram [93]

240
The maturity of PBW technology is lagging behind FBW. While its EMA configuration,
electric motors and high-power electronic drives have been successfully demonstrated in
test flights, their development has yet to be fully accepted within the aviation field [53].
An example illustration of the expected system integration for electrical power and flight
controls subsystems in AEA concept is shown in Figure 84.
Figure 84: Integrated Electrical Power and Control of Elevator for AEA [132]
For system architecture in Figure 84, four control computers and electrical power buses
are used to provide independent power and signaling for elevator actuators. Among the
highlights of this expected architecture change are its features such as electrical actuator,
intelligent power controller (IPC) and integrated power and signal cable. IPC exchanges
and monitors load current data, which it then supplies to power management center and
primary flight control computer (PFCC). Other flight control surfaces are also anticipated
to be connected in a similar system architecture design and therefore, their actuation will
benefit through cabling standardization [132]. Figure 84 also shows other system changes
that might need to be made during implementation of EMA into an existing aircraft.

241
It can be concluded that EMA technology has already matured based on its application in
many areas of aerospace designs, particularly missile design [93]. Moreover, it has been
applied for secondary flight controls on commercial aircraft system but its application on
primary flight controls has so far been limited to sample prototype demonstration due to
safety concerns [93, 269]. Despite its potential to be the simplest and the most compact
actuator, its operational reliability is a main issue for wider application. Recent research
efforts are looking at several EMA design options for better load carrying, jam-resistant
and fault tolerant capabilities [49].
5.1.2 Context-Aware In-Flight Entertainment System
Air traveling can cause some degrees of physiological and psychological discomfort, and
subsequently introduce negative stress to aircraft passengers. Common means to relieve
this situation during flight is by relaxing to movies or music that are available through in-
flight entertainment (IFE) system [207]. IFE has become one of the competitive features
to capture passengers market. It has been observed that airlines with a great service and
favorable IFE features on their fleet often get the upper hand from passengers when they
select their air travel options [198, 235]. This argument is echoed by Francois Quentin,
senior vice president of Thales’ aerospace, who said that IFE investment was among the
first things that was considered by many airlines in their efforts to be more competitive
when the aviation industry emerged from the downturn crisis of 2001-03 [317]. To date,
progression of cabin IFE features is illustrated in Figure 85.
It can be noted that present in-flight entertainment systems are designed and implemented
as an adaptive system, where entertainment services are personalized to user’s selection
[119]. For instance, many commercial airlines including Delta, Lufthansa, Air France and
British Airways have their aircraft cabin furnished with a personalized entertainment unit
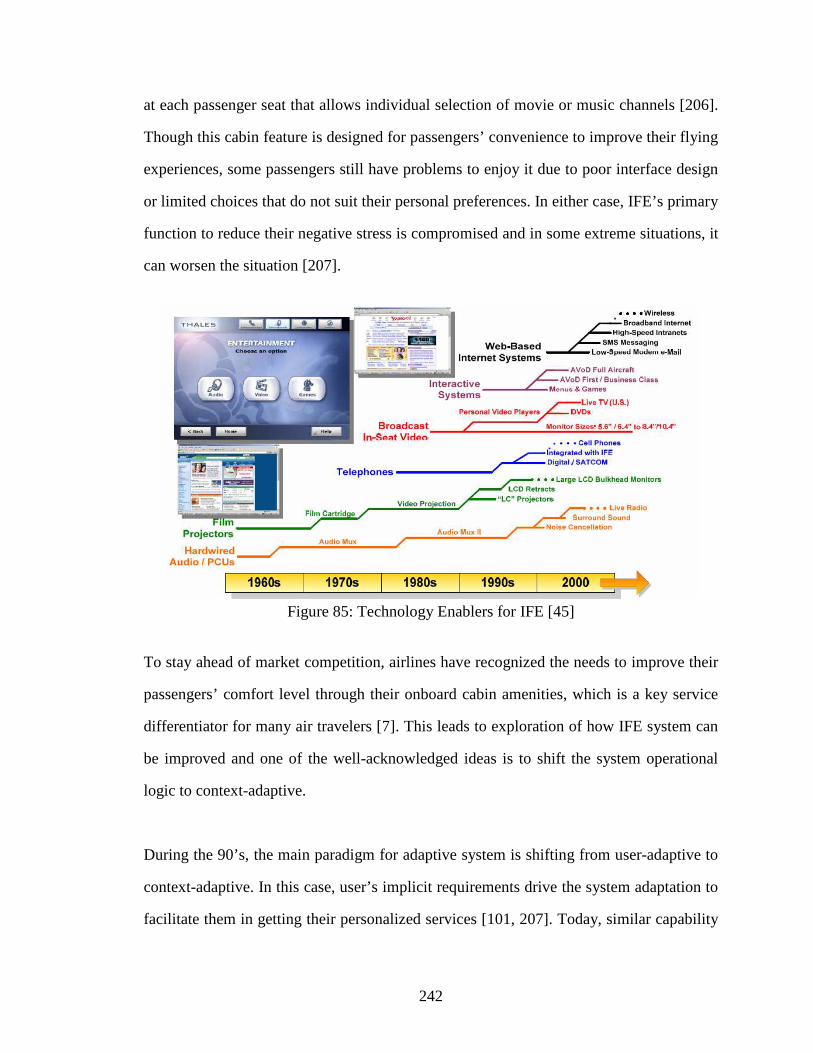
242
at each passenger seat that allows individual selection of movie or music channels [206].
Though this cabin feature is designed for passengers’ convenience to improve their flying
experiences, some passengers still have problems to enjoy it due to poor interface design
or limited choices that do not suit their personal preferences. In either case, IFE’s primary
function to reduce their negative stress is compromised and in some extreme situations, it
can worsen the situation [207].
Figure 85: Technology Enablers for IFE [45]
To stay ahead of market competition, airlines have recognized the needs to improve their
passengers’ comfort level through their onboard cabin amenities, which is a key service
differentiator for many air travelers [7]. This leads to exploration of how IFE system can
be improved and one of the well-acknowledged ideas is to shift the system operational
logic to context-adaptive.
During the 90’s, the main paradigm for adaptive system is shifting from user-adaptive to
context-adaptive. In this case, user’s implicit requirements drive the system adaptation to
facilitate them in getting their personalized services [101, 207]. Today, similar capability

243
is proposed for IFE system to improve its functional efficiency with passengers. This is
described as “Event-Control-Action” coordinated mechanism [208]. If a psychologically-
stressed passenger is detected not doing anything substantial to cope with his stress level,
IFE inference engine automatically plays a personalized “calming” music playlist that is
based on his available information in the system database. To implement this operational
logic, several changes have to be made to current IFE system architecture. The primary
elements of this proposed context-aware IFE system are highlighted in Figure 86.
Figure 86: Architecture for Context-Aware In-Flight Entertainment System [208]
Main functions of entertainment service management unit are to register and categorize
all available in-flight entertainment services. On the other hand, user-context manager is
responsible to monitor passenger’s activity, physical and physiological states [208]. IFE
database is updated with this information and combined with personal data collected from
passengers prior to their flight such as their demographic background. Inference engine
system moderates user-context management and entertainment services with intelligent
selection stress-reducing entertainment options depending on physical and physiological
state of individual passengers. Thus far, it has been reported that an experimental study

244
on a passenger demonstrated potential improvements of his physical and psychological
comfort through application of context-aware IFE system [208].
Provision of high-quality entertainment in aircraft cabin environment presents significant
engineering challenges as passenger expectations can be very demanding and constraints
of power, size, weight and maintainability imposed by aircraft design can be restrictive.
For instance, individual flat panel display and input/output controls for each passenger in
existing aircraft system designs have to consume no more than 25 watts [135]. For many
advanced IFE concepts, electrical loads have been projected to approach nearly 100 watts
per seat and future 600-seat Airbus A380 is expected to require 360kVa of total electrical
power for passenger loads alone [235]. As suggested by Lee from Boeing Cabin Systems
Enabling Technology, technologies behind many installed IFE equipment are usually not
fully matured when they are implemented and this results in several last minute aircraft
redesign efforts [198]. All in all, Figure 86 hints at some of the modifications that have to
be made on current aircraft to implement context-aware IFE technology.
Thus far, literature references for this context-aware IFE technology seem to indicate that
it is still predominantly in conceptual stage. While its implementation might benefit from
matured technologies in other engineering fields like computing and electronics, it can be
safely concluded that its implementation into an aircraft system has yet to be successfully
demonstrated.
5.1.3 Advanced Electrical Power Generation and Networking
In general, many modern aircraft system designs employ subsystems that require either
115V AC or 28V DC supply for their operation. Consequently, different power electronic
converters such as AC/DC rectifiers, DC/AC inverters and DC/DC choppers are required.

245
For MEA, the transition of more subsystems into electrical-based operation is expected to
necessitate a multi-voltage level, hybrid DC and AC power supply network that should be
able to convert one form of electrical power to the other and also its power level [124].
To successfully achieve MEA goals through electrical power generation and distribution
system, several new technologies have been pursued including engine starter-generator
and electrical power loads control and management [72].
Many aircraft systems currently generate their onboard electrical power supply using a
machine/drive mechanism called constant speed drive (CSD) [122]. However, the future
needs for various power types and increased loads are among the main challenges that
this conventional mechanism has to face for MEA application. It is predicted that future
electrical power demands will exceed 500kW per engine as a result of improved in-flight
entertainment, information service and passenger comfort, and additional electrical load
demands from major subsystems like flight controls and landing gear actuation [260]. In
general, the projected electrical power demand increase is illustrated in Figure 87.
Figure 87: Estimates for Connected Electrical Loads in Future AEA [131]

246
Generator technology that is applied on existing commercial transport aircraft is a 3-stage
wound-field synchronous generator that produces a constant-frequency 400Hz electrical
power supply. In order to cope with varying engine speed, a variable-ratio transmission is
needed between the engine and the generator. This transmission unit is expensive, heavy
and inefficient, and affects the reliability of power generation mechanism [260]. In MEA
initiatives, several power types that have been considered for electrical subsystem include
constant-frequency 115V AC, variable-frequency 115V AC, variable-frequency 230V
AC, 270V DC and hybrid architectures [99]. So far, experimental results indicates that
the significant increase in electrical power demands for MEA may only be economically
achieved by using reasonably high voltages AC and DC distribution schemes [183]. This
realization leads to the implementation of variable-frequency 360-720Hz system such as
on Bombardier Global Express and Airbus A380 aircraft [260]. The use of VSCF-based
aircraft electric power systems offers the benefits of increased reliability, lower recurring
costs and shorter mission cycle times in comparison to conventional CSDs [122].
With the notion of total hydraulic and pneumatic power systems elimination, another area
that has a high development interest is the replacement of conventional engine air starter.
In this case, engine starting mechanism is to be electrically executed by using the electric
power generator as a motor [260]. With the advancements in power electronics, control
electronics, electric motor drives and electric machines, VSCF electrical starter-generator
technology emerges as the best replacement to conventional CSD and pneumatic engine
starter mechanisms [124]. It is expected that a single channel of 180-kVA capacity will
be required for engine starting [132] and a typical integration of VSCF starter-generator
technology into an aircraft system is illustrated in Figure 88.

247
Figure 88: Typical VSCF Starter/Generator System [122]
In its motoring mode, a starter-generator provides power to aircraft engine but in reverse,
it receives variable-speed load inputs from the engine during its generating mode. This
mode switching is controlled by a designated controller unit. For most part, this VSCF
technology has matured and already been used in several aircraft applications, although
in a much smaller operational scale than expected in AEA [235]. There are some issues
that need to be resolved before its full application in aircraft system, including a cooling
scheme for starter-generator unit and changes to engine structure for its accommodation
[260].
Once electrical power has been generated, it needs to be distributed to various onboard
aircraft subsystems. Electrical power distribution within current aircraft system designs is
accomplished without the need for power electronics [131]. For instance, simple on/off
relays or switches have been used to control the operation of fans and pumps. However,
the move towards AEA creates urgent needs for improvements in power electronics and
their controls [269]. In Figure 89, a study on AEA design indicates a potential increase in
variety of electrical load demands from future electrical-based aircraft subsystems, which
then translates into an increase in required load distribution groupings.
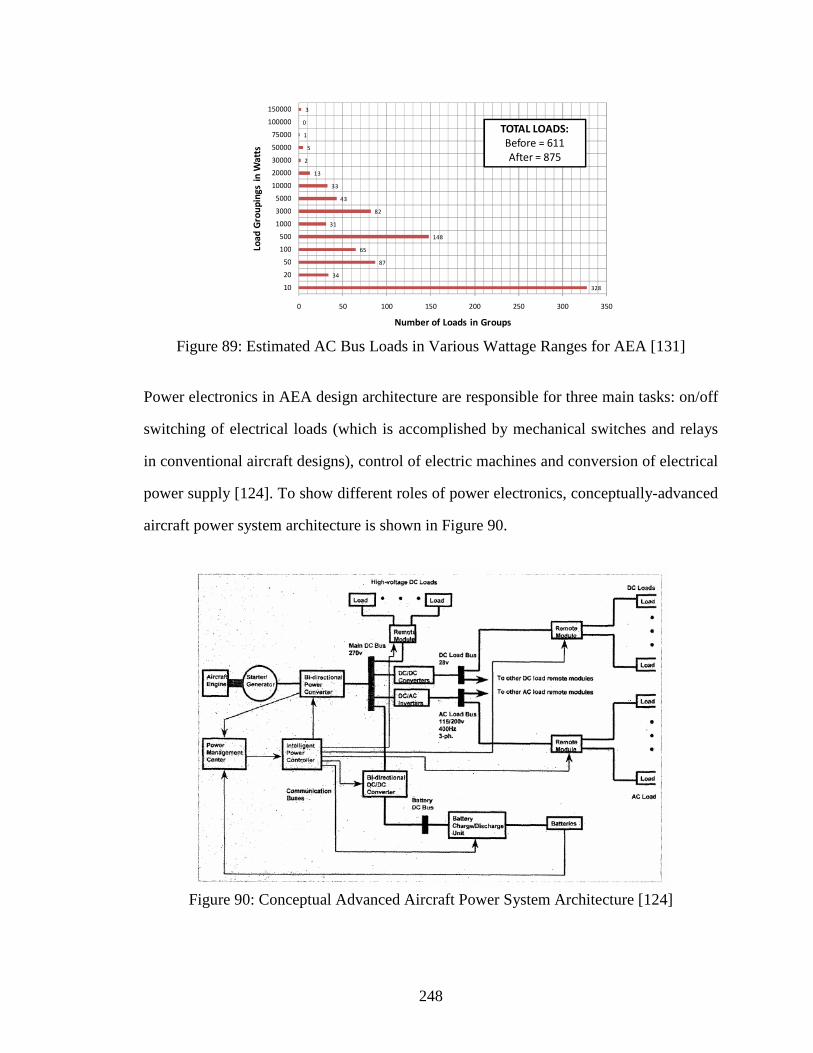
248
328
34
87
65
148
31
82
43
33
13
2
5
1
0
3
0 50 100 150 200 250 300 350
10
20
50
100
500
1000
3000
5000
10000
20000
30000
50000
75000
100000
150000
Number of Loads in Groups
Lo
ad
Gro
up
ing
s in
Wa
tts
TOTAL LOADS:
Before = 611
After = 875
Figure 89: Estimated AC Bus Loads in Various Wattage Ranges for AEA [131]
Power electronics in AEA design architecture are responsible for three main tasks: on/off
switching of electrical loads (which is accomplished by mechanical switches and relays
in conventional aircraft designs), control of electric machines and conversion of electrical
power supply [124]. To show different roles of power electronics, conceptually-advanced
aircraft power system architecture is shown in Figure 90.
Figure 90: Conceptual Advanced Aircraft Power System Architecture [124]

249
In Figure 90, VSCF starter/generator system supplies variable frequency AC power to a
bi-directional power converter unit, which converts it into AC constant frequency voltage
for main electrical distribution bus. For this advanced electrical power architecture, the
number and length of electrical wires are minimized by using intelligent remote modules
to control the loads. Moreover, power management system (PMS) will take advantages of
interconnections between remote modules to reduce peak power demand by time-phasing
the duty-cycle of different loads. It also acts as an overall management unit for electrical
power supply and starter/generator systems.
It is concluded based on available reference literatures that power electronics to support
implementation of high-power electrical power aircraft subsystem is not fully matured as
yet. Though several new technologies have been successfully demonstrated, such as solid
state power electronics for converting high-level electrical power from variable frequency
to constant frequency, several issues still need to be resolved before this advanced power
architecture can be fully implemented into an aircraft [99]. Among others, these include
concerns over the weight, size, electromagnetic interference and thermal management of
power converters [260]. On a positive note, several new emerging technologies have been
shown to be encouraging including improvements in capacitor technology and design of
motors and controllers, which can eliminate the weight, size and reliability issues [122].
5.1.4 Summary of Considered MEA Initiatives
The current state of considered MEA technologies can be measured based on SRL scale,
which is summarized in Table 77. This information can be used to assess redesign risks
and impacts, and to evaluate baseline design adaptability and extensibility characteristics
with regards to required changes. Individual assessment for components that are involved
in implementation of these technologies can be made based on previous discussion.

250
Table 77: Summarized State of Considered MEA Technologies
MEA Technology SRL Level
Main Literature References
Electro-Mechanical Actuator (EMA) 4 [37, 49, 93, 99, 269, 322]
VSFC High Power Starter-Generator 4 [123, 260]
Power Electronics for Advanced Electrical Networking
4 [49, 123, 124, 269]
Context-Aware IFE Systems 3 [198, 207, 208]
5.2 Case Study 1: Derivative Aircraft with Electrical Flight Controls
The focus of this experiment is to demonstrate the competency of SPEC method to assist
aircraft designers in making their decision on baseline selection with respect to redesign
suitability and risk, apart from the usual emphasis on proximity of existing capabilities to
driving requirements. Outputs from this assessment can be used to reflect on whether the
decision to redesign an existing aircraft system is justified against developing an original
design altogether. As discussed before, if the development of derivative aircraft requires
similar amount of costs and market lead times with that of original aircraft (for the same
requirements), it will be hard to justify the redesign investment. In perspective, research
questions and hypothesis that are directly addressed by this first experiment are depicted
in Figure 91.
Figure 91: First Experiment – Influence of Baseline Architecture

251
One of the main differences between aircraft system designs that are available in current
market is their flight control architecture. Though many aircraft can comparably perform
similar flight missions, their subsystems are designed differently. In this example case
study, three potential candidates are considered for the baseline design. As suggested in
Chapter 2, the competitiveness of aircraft design from airlines’ viewpoint is measured by
its capacity and range [88, 266]. Taking this into account, change requirements for this
sample redesign scenario are presented in Table 78.
Table 78: Driving Change Requirements for Case Study 1
Baseline Candidate Requirements Target /
Constraints Airbus A320 [1]
Lockheed L-1011 [9]
Boeing B727-100 [3]
Flight Range >= 3900 nmi 3000 nmi 4003 nmi 2700 nmi
Maximum Capacity >= 234 180 263 149
Gross Weight <= 255,000 lb 169,000 lb 466,000 lb 169,000 lb
As indicated in Table 78, the considered baseline candidates are Airbus A320, Lockheed
L-1011 and Boeing B727-100 aircraft. The settings for driving change requirements are
made in reference to Boeing B757-200 [5], which ensures that they are reasonable to be
achieved in real practices. To date, the tendency is to choose a baseline design based on
the closeness of its performances to the driving requirements. To illustrate this approach,
consider the application of Pugh Evaluation Matrix in Table 79. For information, this is a
simple but well-recognized multi-criteria decision-making method that aids the selection
of the best alternative with respect to established datum point. In this case, the datum for
each performance requirement is taken from their formulated target value.
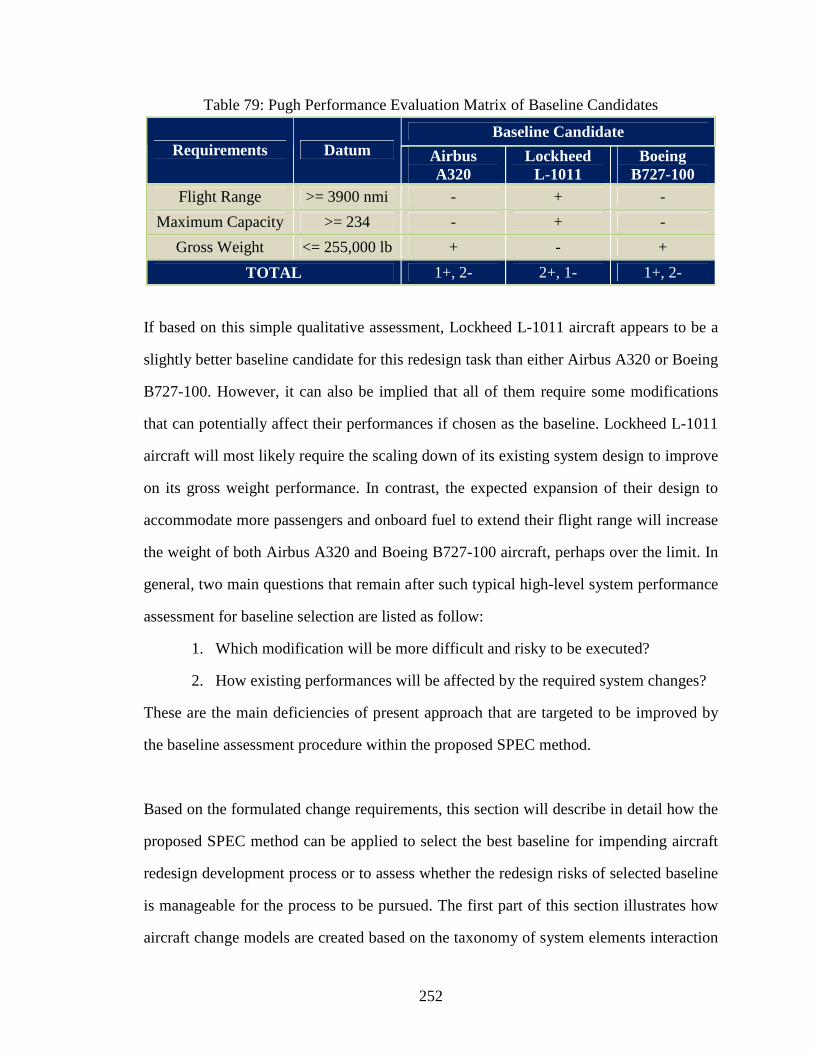
252
Table 79: Pugh Performance Evaluation Matrix of Baseline Candidates
Baseline Candidate Requirements Datum Airbus
A320 Lockheed
L-1011 Boeing
B727-100 Flight Range >= 3900 nmi - + -
Maximum Capacity >= 234 - + -
Gross Weight <= 255,000 lb + - +
TOTAL 1+, 2- 2+, 1- 1+, 2-
If based on this simple qualitative assessment, Lockheed L-1011 aircraft appears to be a
slightly better baseline candidate for this redesign task than either Airbus A320 or Boeing
B727-100. However, it can also be implied that all of them require some modifications
that can potentially affect their performances if chosen as the baseline. Lockheed L-1011
aircraft will most likely require the scaling down of its existing system design to improve
on its gross weight performance. In contrast, the expected expansion of their design to
accommodate more passengers and onboard fuel to extend their flight range will increase
the weight of both Airbus A320 and Boeing B727-100 aircraft, perhaps over the limit. In
general, two main questions that remain after such typical high-level system performance
assessment for baseline selection are listed as follow:
1. Which modification will be more difficult and risky to be executed?
2. How existing performances will be affected by the required system changes?
These are the main deficiencies of present approach that are targeted to be improved by
the baseline assessment procedure within the proposed SPEC method.
Based on the formulated change requirements, this section will describe in detail how the
proposed SPEC method can be applied to select the best baseline for impending aircraft
redesign development process or to assess whether the redesign risks of selected baseline
is manageable for the process to be pursued. The first part of this section illustrates how
aircraft change models are created based on the taxonomy of system elements interaction

253
proposed by Pimmler and Eppinger [257]. Next, using these system models, the baseline
assessment process is executed to identify and select the best one among the considered
candidates. In order to control the problem size for a more transparent demonstration of
this baseline assessment procedure, it is assumed that expected gross weight problems for
each baseline candidate (if they were eventually chosen to be the baseline) will be coped
with EMA implementation in their primary roll control mechanism. While there might be
other necessary changes depending on their system architecture, this narrowed scope is
perceived as adequate to demonstrate the full capacity of baseline assessment procedure
in the proposed SPEC method. It should also be noted that it is highly possible for the
proposed design changes on each baseline candidate to be different from each other since
they correspond to different levels of performance deficiencies to the target requirements.
For the proposed EMA implementation in this sample case study, none of the candidate
aircraft designs was originally equipped with such technology and their roll control was
accomplished using hydraulically-operated actuators [338].
5.2.1 Creation of Change Models
To identify initiating change components, each baseline candidate has to be appropriately
modeled. Since the problem scope has been narrowed down to only redesign changes in
primary roll control mechanism, the construction of change model for this first case study
can be focused on aileron control. The models are developed based on available reference
literatures and their full discussion is presented in Appendix A. In summary, all processes
involved in the change model construction for primary roll control mechanism in baseline
candidates are listed as follow:
1. Identify baseline aircraft candidates
2. Search available reference literatures subsystems description for each candidate
3. Decompose baseline candidates based on their physical system description

254
4. Construct DSM change model for each candidate based on their physical system
decomposition according to taxonomy of system element interactions
The DSM model for each baseline candidate is presented in following Figure 92, Figure
93 and Figure 94.
Figure 92: DSM Change Model for Primary Roll Control of Airbus A320
Figure 93: DSM Change Model for Primary Roll Control of Lockheed L-1011

255
Figure 94: DSM Change Model for Primary Roll Control of Boeing B727
5.2.2 Assessment of Baseline Candidates
It should be emphasized again that main objectives of this procedure are to aid designers
in selecting the best baseline for their redesign approach and in evaluating whether their
associated redesign risks is reasonable to further pursue the derivative development.
Recall conceptual electrical-based flight controls architecture depicted in Figure 84 and
discussion of its related technologies back in section 5.1. This is taken to be the eventual
primary roll control system architecture that results from EMA implementation. Based on
this, initiating change components for each baseline candidate can be identified and they
are listed in Table 80. These components are directly affected by EMA implementation,
either through replacement with a new unit or installation of additional unit to match the
operational requirements of the new system architecture.
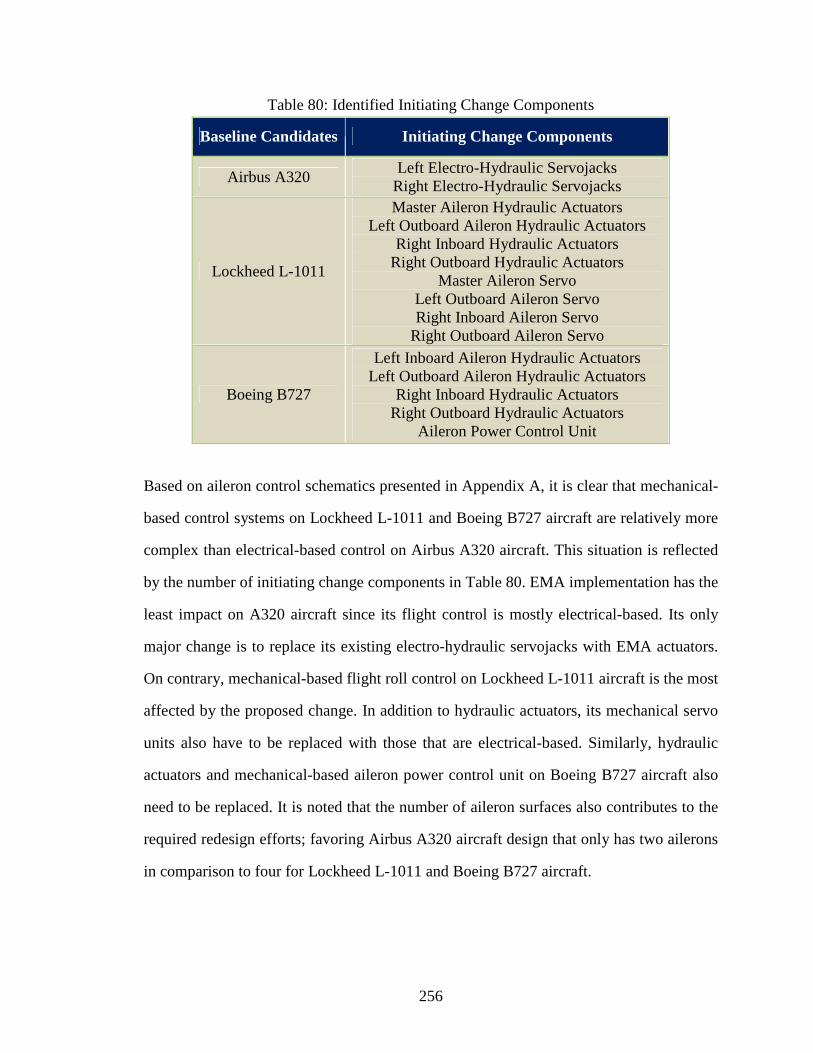
256
Table 80: Identified Initiating Change Components
Baseline Candidates Initiating Change Components
Airbus A320 Left Electro-Hydraulic Servojacks
Right Electro-Hydraulic Servojacks
Lockheed L-1011
Master Aileron Hydraulic Actuators Left Outboard Aileron Hydraulic Actuators
Right Inboard Hydraulic Actuators Right Outboard Hydraulic Actuators
Master Aileron Servo Left Outboard Aileron Servo Right Inboard Aileron Servo
Right Outboard Aileron Servo
Boeing B727
Left Inboard Aileron Hydraulic Actuators Left Outboard Aileron Hydraulic Actuators
Right Inboard Hydraulic Actuators Right Outboard Hydraulic Actuators
Aileron Power Control Unit
Based on aileron control schematics presented in Appendix A, it is clear that mechanical-
based control systems on Lockheed L-1011 and Boeing B727 aircraft are relatively more
complex than electrical-based control on Airbus A320 aircraft. This situation is reflected
by the number of initiating change components in Table 80. EMA implementation has the
least impact on A320 aircraft since its flight control is mostly electrical-based. Its only
major change is to replace its existing electro-hydraulic servojacks with EMA actuators.
On contrary, mechanical-based flight roll control on Lockheed L-1011 aircraft is the most
affected by the proposed change. In addition to hydraulic actuators, its mechanical servo
units also have to be replaced with those that are electrical-based. Similarly, hydraulic
actuators and mechanical-based aileron power control unit on Boeing B727 aircraft also
need to be replaced. It is noted that the number of aileron surfaces also contributes to the
required redesign efforts; favoring Airbus A320 aircraft design that only has two ailerons
in comparison to four for Lockheed L-1011 and Boeing B727 aircraft.

257
Once all initiating change components are identified, the following step is to evaluate the
redesign risks that are associated with their modification. Generality and scalability risk
assessments can be made based on the candidate’s performance characteristics as listed in
Table 78. The risk scores are tabulated in Table 81.
Table 81: Generality and Scalability Scores for Case Study 1
Airbus A320 Lockheed L-1011 Boeing B727 Requirements
Generality Scalability Generality Scalability Generality Scalability
Flight Range 100 0 0 0 100 0
Maximum Capacity
100 0 0 0 100 0
Takeoff Gross Weight
0 0 100 0 0 0
TOTAL 200 0 100 0 200 0
Normalized Score
2/3 = 0.67 0 1/3 = 0.33 0 2/3 = 0.67 0
With regards to Table 81, Lockheed L-1011 appears to be a better candidate based on the
proximity of its existing performances to the driving requirements compared to the other
two candidates. It can be implied that the assessment of these two redesign risk metrics is
reminiscence of typical baseline selection approach based on proximity of performance
characteristics to target requirements. Although it is known at this point that the primary
roll control mechanism on all candidates is not equipped with EMA implementation, it is
hard to identify which one is better suit for the redesign approach from that perspective
based on high system-level information in Table 81. One might ask if Lockheed L-1011
is really the best baseline candidate since it has the highest number of initiating change
components for its EMA implementation. In similar fashion, despite the fact that Airbus
A320 and Boeing B727 aircraft have the same generality and scalability risk scores, do
they correspond to similar level of redesign risks? In the proposed SPEC method, these
aspects are captured using extensibility, adaptability and complexity system evolvability

258
metrics. The following assignment of change impact and cost measures is made based on
the description in previous section 5.1.
Table 82 lists the adaptability and extensibility risks for Airbus A320 primary roll control
in relation to EMA implementation. Assessment of adaptability risk is based on whether
the change effects due to installation of the electrical-based actuators can be contained
without affecting other components. In Airbus A320 design, this containment is possible
if the EMA can operate with similar amount of electrical power that is presently passed to
its servojacks. Based on previous description of EMA, its development is focused on a
270V DC power supply that is not a common attribute of present aircraft electrical power
system. This implies that the current power supply is lower than that expected for EMA
and hence the adaptability risk here relates to the possibility that EMA can be made to
perform with a lower power supply. Since current EMA development is taken to be at
SRL level 4 in previous Table 77, this additional operational constraint on its application
is assumed to be at lower maturity of SRL level 3. SRL level for current development of
EMA is considered for extensibility assessment. In addition, measure of change cost is
assigned according to the predicted extent that the manufacturing process will have to be
changed to accommodate the implementation of proposed design changes. For the Airbus
A320 manufacturing process, the cost is not expected to differ much because its current
design is already highly electrical-based.
Table 82: Adaptability and Extensibility Risk Assessment for Airbus A320
Adaptability Assessment
Extensibility Assessment
Proposed Redesign Changes
Initiating Change
Component
Change Remarks
Impact Cost Impact Cost Left Electro-
Hydraulic Servojacks
Changed to EMA
6 4 4 4 EMA Primary Roll Control Mechanism Right Electro-
Hydraulic Servojacks
Changed to EMA
6 4 4 4
TOTAL 48 32

259
With similar arguments, Table 83 and Table 84 list the adaptability and extensibility risks
assessment for Lockheed L-1011 and Boeing B727 aircraft candidates, respectively, with
regards to EMA implementation. Adaptability risk scores for both Lockheed L-1011 and
Boeing B727 aircraft are given the maximum 100 for each initiating change component.
This reflects the relatively high inflexibility of mechanical-based control scheme onboard
these two aircraft with respect to proposed changes. For instance, in order for the existing
aileron servo to contain the change effects within its architecture locality, its modification
needs to include a mechanism that can convert incoming mechanical control inputs into
electrical inputs for the EMAs. It is highly infeasible to realize this without affecting the
electrical power system and their assigned adaptability risk scores reflect this condition.
On the other hand, reasons behind their extensibility assessment are mostly similar to that
explained for Airbus A320.
Table 83: Adaptability and Extensibility Risk Assessment for Lockheed L-1011
Adaptability Assessment
Extensibility Assessment
Proposed Redesign Changes
Initiating Change Component
Change Remarks
Impact Cost Impact Cost Master Aileron
Hydraulic Actuators Changed to
EMA 10 10 4 6
Left Outboard Aileron Hydraulic
Actuators
Changed to EMA
10 10 4 6
Right Inboard Aileron Hydraulic
Actuators
Changed to EMA
10 10 4 6
Right Outboard Aileron Hydraulic
Actuators
Changed to EMA
10 10 4 6
Master Outboard Aileron Servo
Changed to electrical
10 10 1 4
Left Outboard Aileron Servo
Changed to electrical
10 10 1 4
Right Outboard Aileron Servo
Changed to electrical
10 10 1 4
EMA Primary
Roll Control
Mechanism
Right Inboard Aileron Servo
Changed to electrical
10 10 1 4
TOTAL 800 112

260
Table 84: Adaptability and Extensibility Risk Assessment for Boeing B727 Adaptability Assessment
Extensibility Assessment
Proposed Redesign Changes
Initiating Change Component
Change Remarks
Impact Cost Impact Cost Left Inboard Aileron Hydraulic Actuators
Changed to EMA
10 10 4 6
Left Outboard Aileron Hydraulic
Actuators
Changed to EMA
10 10 4 6
Right Inboard Aileron Hydraulic
Actuators
Changed to EMA
10 10 4 6
Right Outboard Aileron Hydraulic
Actuators
Changed to EMA
10 10 4 6
EMA Primary
Roll Control
Mechanism
Aileron Power Control Unit
Changed to electrical
10 10 1 4
TOTAL 500 100
In terms of complexity assessment, replacement of parts and interfaces associated with
initiating change components is expected to be made in a one-to-one condition. Each of
hydraulic-based actuators is replaced with an electrical-based actuator and new electrical
interfaces requirement is cancelled out by the elimination of hydraulic power lines to the
actuation control unit. Thus no significant change in design complexity is anticipated for
the baseline candidates. Nonetheless, according to previously constructed system models,
roll control system for Lockheed L-1011 aircraft is perceptively the most complex among
the candidates. Hence the normalization of complexity metric will be made in reference
to its total amount of parts and interfaces. In real aircraft assessment study, total number
of parts and interfaces refers to the overall aircraft system but in this case, it is referenced
only to the primary roll control system due to lack of data to construct a complete aircraft
model for each candidate.
To highlight the execution of this baseline assessment procedure using the SPEC support
tool, the program snapshot that depicts measurement inputs for Lockheed L-1011 aircraft
(as previously tabulated in Table 81 and Table 83) is shown in Figure 95.

261
Figure 95: SPEC Program Snapshot of Baseline Assessment Input Interface
Individual comparison of system evolvability metrics for baseline candidates is presented
in Figure 96. As discussed before, if the baseline assessment process is solely based on
generality and scalability risks, Lockheed L-1011 appears to be the best candidate since
its present capabilities satisfies two out of three formulated requirements. In comparison,
both Airbus A320 and Boeing B727 only satisfy one target requirement. This situation is
reminiscence to the practice of baseline selection based on proximity of its performances
to the requirements. When risks regarding adaptability and extensibility redesign efforts
are evaluated, they highlight a different story. From Figure 96, Airbus A320 visibly has
the best adaptability and extensibility risk scores that imply its proposed redesign changes
are easier to be implemented than for other candidates. In addition, derivative design for
A320 is perceptively less complex than that of the others, which is favorable in terms of
minimizing risks of change effects propagation [115]. If an equal importance weighting is
assigned to these system evolvability metrics, the overall evolvability risk score for the
baseline candidates is shown in Figure 97.

262
0.33
0.67 0.67
0.0
0.2
0.4
0.6
0.8
1.0
1.2
Primary
Roll
Control L-
1011
Primary
Roll
Control
A320
Primary
Roll
Control
B727
Normalized Generality Risk
0.00 0.00 0.000.0
0.2
0.4
0.6
0.8
1.0
1.2
Primary
Roll
Control L-
1011
Primary
Roll
Control
A320
Primary
Roll
Control
B727
Normalized Scalability Risk
1.00
0.06
0.63
0.0
0.2
0.4
0.6
0.8
1.0
1.2
Primary
Roll
Control L-
1011
Primary
Roll
Control
A320
Primary
Roll
Control
B727
Normalized Adaptability Risk
0.140.04
0.13
0.0
0.2
0.4
0.6
0.8
1.0
1.2
Primary
Roll
Control L-
1011
Primary
Roll
Control
A320
Primary
Roll
Control
B727
Normalized Extensibility Risk
1.00
0.63 0.67
0.0
0.2
0.4
0.6
0.8
1.0
1.2
Primary
Roll
Control L-
1011
Primary
Roll
Control
A320
Primary
Roll
Control
B727
Normalized Complexity Risk Assessment
0.49
0.28
0.42
0.0
0.2
0.4
0.6
0.8
1.0
Primary
Roll
Control L-
1011
Primary
Roll
Control
A320
Primary
Roll
Control
B727
Overall System Evolvability Risk
Figure 96: Comparisons of System Evolvability Metrics
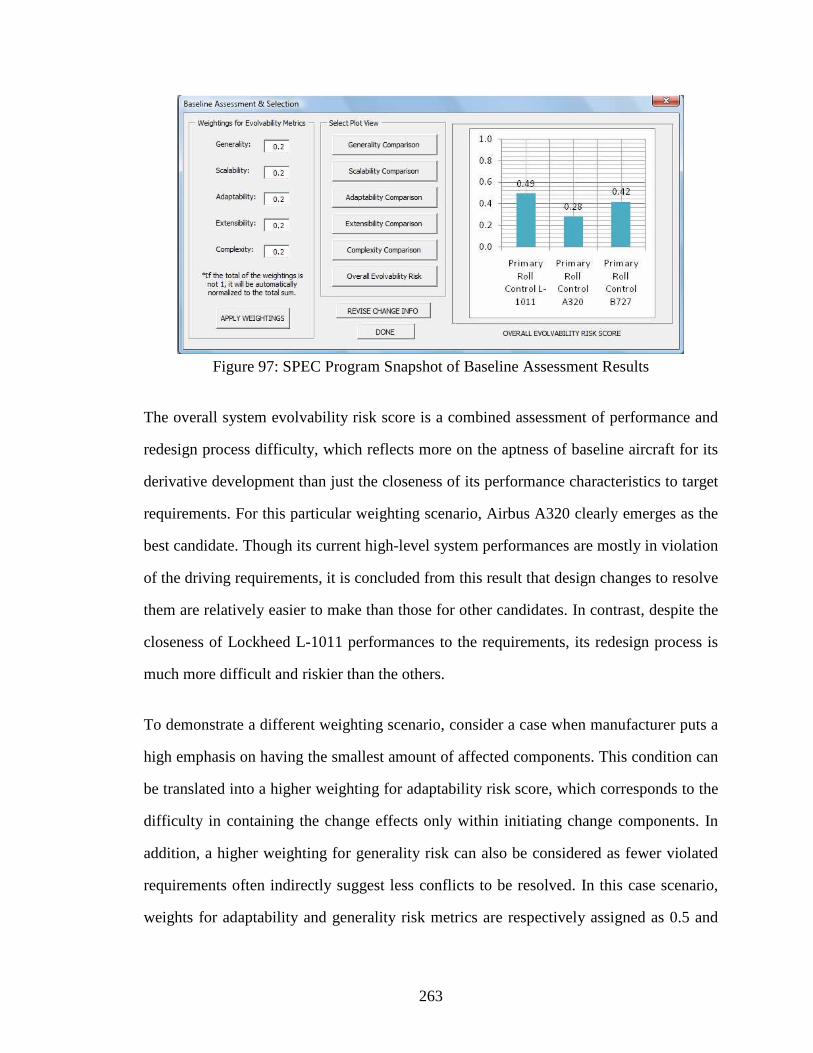
263
Figure 97: SPEC Program Snapshot of Baseline Assessment Results
The overall system evolvability risk score is a combined assessment of performance and
redesign process difficulty, which reflects more on the aptness of baseline aircraft for its
derivative development than just the closeness of its performance characteristics to target
requirements. For this particular weighting scenario, Airbus A320 clearly emerges as the
best candidate. Though its current high-level system performances are mostly in violation
of the driving requirements, it is concluded from this result that design changes to resolve
them are relatively easier to make than those for other candidates. In contrast, despite the
closeness of Lockheed L-1011 performances to the requirements, its redesign process is
much more difficult and riskier than the others.
To demonstrate a different weighting scenario, consider a case when manufacturer puts a
high emphasis on having the smallest amount of affected components. This condition can
be translated into a higher weighting for adaptability risk score, which corresponds to the
difficulty in containing the change effects only within initiating change components. In
addition, a higher weighting for generality risk can also be considered as fewer violated
requirements often indirectly suggest less conflicts to be resolved. In this case scenario,
weights for adaptability and generality risk metrics are respectively assigned as 0.5 and

264
0.2 while other aircraft system evolvability metrics are equally assigned with a weighting
of 0.1. Baseline assessment results for this redesign scenario are presented in Figure 98.
Figure 98: Baseline Assessment Results for Modified Weighting Scenario
As should be expected, the difference of overall evolvability risk score for Airbus A320
to other baseline candidates becomes more pronounced for this weighting case scenario.
This condition is primarily because its number of initiating change components is much
smaller than other candidates, which is exactly the main objective behind this weighting
scenario. In addition, adaptability risks associated with their modifications are relatively
lower than for other candidates.
5.2.3 Conclusion from Case Study 1
This first implementation case study is concentrated mainly on one main research area of
the proposed SPEC methodology, which is baseline assessment procedure. Due to limited
availability of full subsystems design information in public domain, it is hard to create an
accurate representation of existing aircraft designs. For that reason, this study is narrowed
down to redesign comparison of primary roll control system in three aircraft candidates:
Airbus A320, Boeing B727 and Lockheed L-1011.

265
Referring to Figure 91, hypothesis 1 suggests that redesign process complexity is dictated
by the characteristics of aircraft architecture. This conception is generally in conflict with
common approach in baseline selection, which favors candidates with close performance
capabilities to the driving change requirements since this condition is assumed to assure
minimum and less risky redesign efforts. As demonstrated with a simple Pugh Evaluation
Matrix procedure, Lockheed L-1011 is probably chosen as the baseline according to such
notion. However, it is highlighted by results from this case study that such proposition is
not always true because the flexibility of its design architecture also dictates how difficult
it is to alter the baseline. For instance, roll control architecture onboard Lockheed L-1011
is relatively complicated and inflexible to accommodate the proposed realization of EMA
technology. While sometimes it is true that fewer change requirements might induce less
required changes, inflexibility of baseline design can still make the modification process
very costly and risky even with minimum changes. Thus the measure of redesign process
complexity based only on amount of required system modifications is indeed misleading
and this will be further addressed by second case study.
As indicated by the baseline assessment results, Airbus A320 is evaluated as the overall
best candidate with respect to formulated redesign scenario. While its current capabilities
are a little short from the governing requirements in comparison to other candidates, its
design architecture is more flexible to cope with proposed initiating changes to resolve its
performance deficiencies. A different conclusion could be derived for the same group of
candidates in different redesign circumstances, which implies that this result is scenario-
based. For instance, instead of EMA technology incorporation, the weight savings could
be accomplished through installation of a better power-to-weight-ratio propulsion system
and this redesign scenario might result in a different best baseline candidate. Required
system design changes for each baseline to resolve their performance deficiencies to the
same target requirements can also be different from each other.
266
To summarize, overall system evolvability risk metric in this baseline assessment can be
viewed as a compromised balance between typical baseline selection approach and high
influence of design complexity on redesign process risk. Coming back to hypothesis 1, it
can be observed in Appendix A that primary flight roll control system architecture on the
baseline candidates is of different complexity level to each other. Lockheed L-1011 has
the most complex control architecture and consequently has the highest level of redesign
risks associated with EMA implementation. In contrast, for the same EMA requirements,
Airbus A320 design has the lowest level of redesign risks since its control architecture is
the least complex among the candidates. Overall, this result supports the proposition of
hypothesis 1 that redesign process complexity is influenced by system design architecture
characteristics.
5.3 Case Study 2: Notional Aircraft Redesign for MEA
The main goal of this second implementation case study is to demonstrate the full range
of proposed SPEC methodology in supporting aircraft designers in their decision-making
process during early redesign. In this case, a complete notional aircraft model is subjected
to more than one design change, which is a common scenario in aircraft manufacturing.
In real practice, this whole process involves several subsystem design teams. This second
case study is also intended to address the research hypotheses in previous Chapter 4.
For this case study, it is assumed that the designers have decided from their requirements
analysis process to implement EMA and context-aware IFE technologies into the notional
aircraft. These change requirements can induce conflicting change effects propagation to
other components in the aircraft system architecture. This condition provides the perfect
setting to test the applicability of proposed SPEC method in aircraft redesign process.
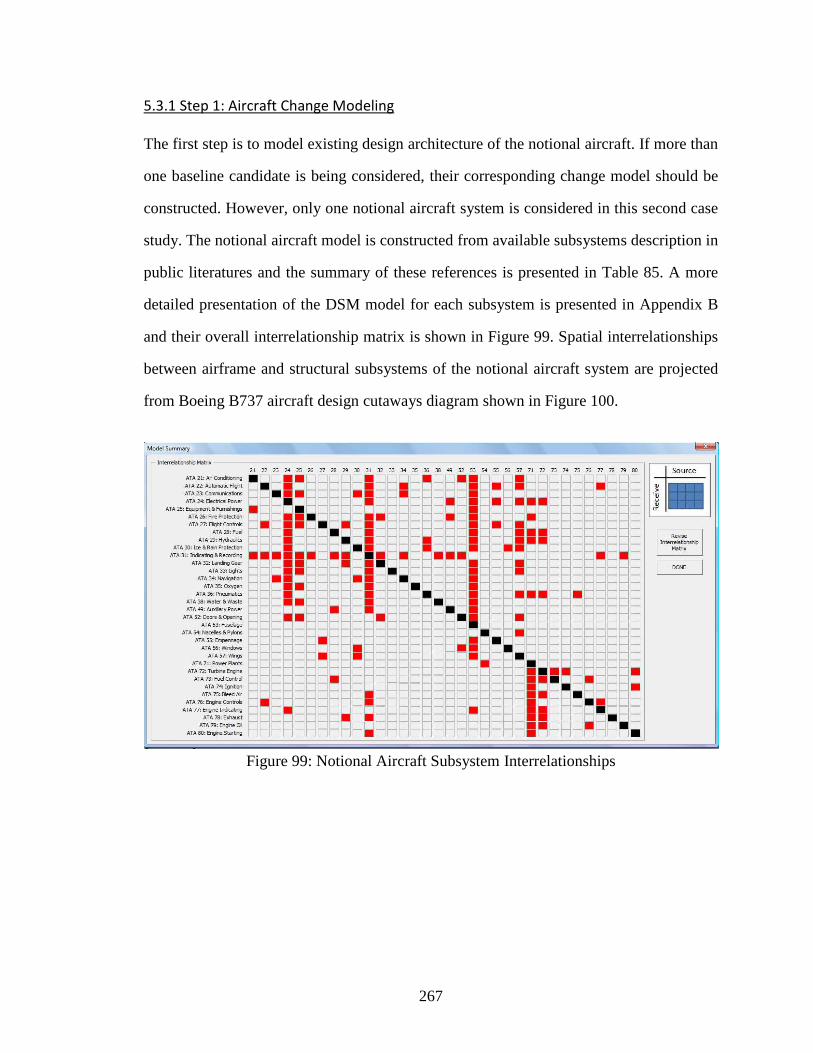
267
5.3.1 Step 1: Aircraft Change Modeling
The first step is to model existing design architecture of the notional aircraft. If more than
one baseline candidate is being considered, their corresponding change model should be
constructed. However, only one notional aircraft system is considered in this second case
study. The notional aircraft model is constructed from available subsystems description in
public literatures and the summary of these references is presented in Table 85. A more
detailed presentation of the DSM model for each subsystem is presented in Appendix B
and their overall interrelationship matrix is shown in Figure 99. Spatial interrelationships
between airframe and structural subsystems of the notional aircraft system are projected
from Boeing B737 aircraft design cutaways diagram shown in Figure 100.
Figure 99: Notional Aircraft Subsystem Interrelationships

268
Table 85: Summary of Notional Aircraft Subsystems Model Build-Up
ATA Chapter General Aircraft System Reference
Main Reference Literatures
ATA 21: Air Conditioning B737
ATA 22: Automatic Flight B737
ATA 23: Communications B757/B737
ATA 24: Electrical Power B737
ATA 25: Equipment & Furnishings General
ATA 26: Fire Protection B737
ATA 27: Flight Controls B727/B737
ATA 28: Fuel B737
ATA 29: Hydraulics B737
ATA 30: Ice & Rain Protection B757
ATA 31: Indicating & Recording B737
ATA 32: Landing Gear B757
ATA 33: Lights B757/B737
ATA 34: Navigation B757/B737
ATA 35: Oxygen B737
ATA 36: Pneumatic B737
ATA 38: Water & Waste L-1011/B757
ATA 49: Auxiliary Power Unit General
ATA 52: Doors & Openings B737
ATA 53: Fuselage B737
ATA 54: Nacelles – Pylons B737
ATA 55: Stabilizers – Tail Units B737
ATA 56: Windows B737
ATA 57: Wings B737
ATA 71: Power Plants General
ATA 72: Turbine Engine General
ATA 73: Fuel Control General
ATA 74: Ignition General
ATA 75: Bleed Air General
ATA 76: Engine Controls General
ATA 77: Engine Indicating General
ATA 78: Exhaust General
ATA 79: Engine Oil General
ATA 80: Engine Starting General
[17], [22], [42], [51], [55], [140],
[180], [213], [225], [236],
[338]

269
Fig
ure
100:
Boe
ing
737-
800
Airc
raft
Des
ign
Cut
aw
ays
Dia
gram
[42]

270
5.3.2 Step 2: Baseline Assessment
It is of high interest to explore suitability of the notional aircraft to undergo the proposed
redesign changes. As can be implied from Table 85 and Figure 100, the notional aircraft
model for this sample case is mostly tailored to variants of Boeing B737 aircraft design.
Therefore, it is fair to assume that the notional aircraft system has similar performance
characteristics to Boeing B737. This assumption is considered while setting up plausible
redesign scenario for this second example case study.
One of the main market factors that contribute to the prominence of derivative designs in
aircraft industry is its high market competition. An example of a highly contested market
segment is reflected in the competition between Airbus A320 aircraft family and Boeing
B737 aircraft series. In July 2008, Bombardier joined the competition with their C-series
aircraft line [149]. If the past trend of market competition between Airbus and Boeing is
an indication of future aircraft offerings in this particular market segment, the increased
competition level will introduce more derivative aircraft. As the notional aircraft system
is argued to be closest to Boeing B737, the development perspective for this second case
study will adopt that of its manufacturer.
General comparison of characteristics between competing aircraft models for this market
segment is presented in Table 86. As discussed in Chapter 2, range and capacity are two
important assessment criteria considered by airlines in their aircraft purchases [88, 266].
Based on Table 86, although passenger capacity and range characteristics of the notional
aircraft are competitively similar to its competition, its gross weight is perceptively much
higher. This condition seems to imply that the present notional aircraft system performs
its flight mission with lower operational efficiency. Despite having comparable passenger
capacity and a shorter flight range, its gross weight is much higher than the other aircraft
designs.

271
Table 86: Comparison of Competing Aircraft Characteristics
Characteristics A320 [1]
C130-ER [6]
Notional Aircraft*
Passenger Capacity 180 149 177
Range 3000 nmi 2950 nmi 2700 nmi
Takeoff Gross Weight 169,000 lb 139,100 lb 187,700 lb
*Based on Boeing B737-900 aircraft performance [4]
To ensure that the notional aircraft system maintains its market competitiveness, a new
redesign is considered for its derivative. Although it is possible to scale down its current
subsystems to improve on its gross weight while extending its flight range, the increased
competition suggests that its derivative design has to be furnished with new features that
can offer an extra edge against competing aircraft. For this example case study, it is taken
that the designers have decided to pursue more competitive cabin features.
Parallel with recent focus of technological advancement in aircraft design field, takeoff
gross weight can be reduced by converting conventional subsystems into electrical-based.
In view of that, this study involves a redesign of current electrical-mechanical-hydraulic
flight control subsystem into full EMA implementation. Based on results from a study by
NASA and Lockheed Corporation on a 500-passenger transport aircraft, all-electric flight
control system is projected to save as much as 28% of its weight in comparison to that of
conventional hydraulic-based system [94]. The main breakdown of overall aircraft weight
savings projected from this study is illustrated in Figure 101. It should be noted that this
study was made during the early 1980’s. Since then, more competitive MEA technologies
have been researched and made available that can increase the advantages of all-electric
aircraft system.

272
Figure 101: Weight Savings for All-Electric 500-Pax Transport Aircraft [94]
At this point, weight reduction for the notional aircraft system can be achieved with EMA
technologies. For this case study, EMA is implemented on its primary flight controls for
aileron, elevator and rudder control surfaces, and its flight range is extended to match that
of Bombardier C130-ER. In addition, its derivative is to be furnished with context-aware
IFE, which is a step forward ahead of current market competition. All initiating change
components for the notional aircraft regarding these proposed redesign changes are listed
in Table 87. Note that the adaptability and extensibility risks assessments are made based
on present MEA description in section 5.1 and the measures for EMA implementation are
under similar reasoning to that assigned in first case study for Boeing B727 aircraft.
Subsequently, baseline assessment process is executed and its result is depicted in Figure
102. Primary interest here is relative comparison between adaptability and extensibility
risk scores. It can be observed in Figure 102 that redesign process risk score dramatically
drops from adaptability approach to that of extensibility, indicating that the redesign risks
can be possibly reduced through change propagation. This is a highly favorable condition
that greatly supports the redesign decision of the notional aircraft.
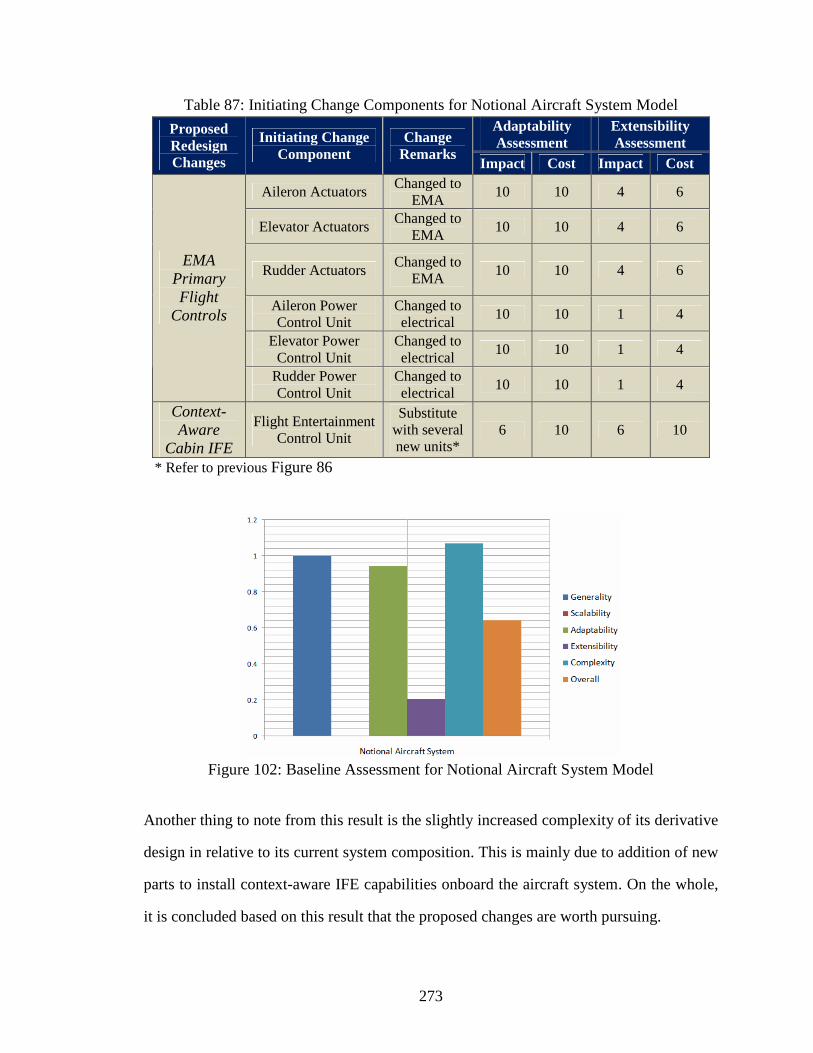
273
Table 87: Initiating Change Components for Notional Aircraft System Model Adaptability Assessment
Extensibility Assessment
Proposed Redesign Changes
Initiating Change Component
Change Remarks
Impact Cost Impact Cost
Aileron Actuators Changed to
EMA 10 10 4 6
Elevator Actuators Changed to
EMA 10 10 4 6
Rudder Actuators Changed to
EMA 10 10 4 6
Aileron Power Control Unit
Changed to electrical
10 10 1 4
Elevator Power Control Unit
Changed to electrical
10 10 1 4
EMA Primary Flight
Controls
Rudder Power Control Unit
Changed to electrical
10 10 1 4
Context-Aware
Cabin IFE
Flight Entertainment Control Unit
Substitute with several new units*
6 10 6 10
* Refer to previous Figure 86
Figure 102: Baseline Assessment for Notional Aircraft System Model
Another thing to note from this result is the slightly increased complexity of its derivative
design in relative to its current system composition. This is mainly due to addition of new
parts to install context-aware IFE capabilities onboard the aircraft system. On the whole,
it is concluded based on this result that the proposed changes are worth pursuing.

274
5.3.3 Step 3: Change Plan Generation
Once risks associated with the redesign proposal have been concluded to be manageable
and competitive enough against pursuing original aircraft development, the next step is to
generate possible ways to implement the proposed changes into the baseline design. This
basically explores how the current baseline system design architecture can accommodate
suggested modification to accomplish the target requirements. The first procedure for this
third step of SPEC method is to define change solution space for the redesign problem at
hand. In order to establish this, change likelihood and change preference matrices for the
notional aircraft system have to be constructed.
As indicated in previous Chapter 4, change likelihood matrix is directly derived based on
design characteristics of the notional aircraft. Instead of using historical change data, the
likelihood of having to change one subsystem as a result of modification made on another
is aptly reflected by the level of interconnectivities that exist between them. For this case
study, this matrix is automatically generated from its model and is shown in Figure 103.
Figure 103: Change Likelihood Matrix for Notional Aircraft System

275
The change likelihood matrix in Figure 103 can be read as follows. Each value represents
estimated probability that subsystem in the corresponding row will need to be changed if
subsystem in the column has been modified. For instance, value in fourth column of the
first row indicates that, if electrical power subsystem is modified, there is a 2% chance
that air conditioning subsystem will be subsequently changed. This estimation is based on
the fact that 2% of total interconnections that electrical power subsystem has with other
subsystems are linked to air conditioning subsystem.
Resultant subsystem change likelihood ranking is depicted in Figure 104. As expected,
the high-ranked subsystems are those heavily interconnected with other subsystems. For
instance, fuselage is the highest-ranked subsystem and this indicates that changes made
on any aircraft subsystems have a big potential to also impact the fuselage. This condition
is primarily based on fuselage’s role to house and protect airframe subsystems, requiring
it to provide sufficient onboard volumetric space for them. Power plant subsystem, which
also has a similar role to fuselage but for propulsion system, has been ranked second on
the list. Based on knowledge of subsystems interconnection within the notional aircraft
system design, it is concluded that this likelihood ranking correctly predicts the order of
subsystems that are most likely to be modified in any redesign case.
Figure 104: Subsystem Change Likelihood Ranking for Notional Aircraft System

276
On the other hand, subsystem change preference matrix is to be defined by designers in
accordance to their company’s inclination or management policy. This matrix is intended
to weigh in such considerations into decision-making process for change solution space.
In this example case study, change preference ranking is determined based on subsystem
costs. It is simply assumed that the higher the subsystem cost is, the less preferable it is to
be modified. According to Cronin, costs for conventional aircraft system can be broken
down as presented in Figure 105.
Figure 105: Estimated System Cost Breakdown for Conventional Aircraft [94]
Using information in Figure 105 as the basis for subsystem pairwise comparison, change
preference matrix in Figure 106 is derived for the notional aircraft system. The qualitative
measurement of change preference between paired subsystems is assigned according to
the rating scale defined in Table 67. This change preference matrix is a reciprocal matrix.
Based on the assigned value in Figure 106 between air conditioning and automatic flight
subsystems, for instance, the latter is the more preferred choice whenever designers have
to propagate the change effects to either one of them. This assumption is made based on
the higher cost of air conditioning subsystem in relative to automatic flight control, as can
be inferred from Figure 105. Overall subsystem change preference ranking is depicted in
Figure 107.

277
Figure 106: Change Preference Matrix for Notional Aircraft System
Figure 107: Subsystem Change Preference Ranking for Notional Aircraft System
In Figure 107, major structural and propulsion subsystems have been ranked at bottom of
this change preference list. This is in line with provided cost information in Figure 105,
which implies that they are the costliest among other aircraft subsystems and therefore
are less preferred to be modified. While fuselage topped the change likelihood list, it is
however the lowest ranked subsystem in terms of change preference. This means that it is
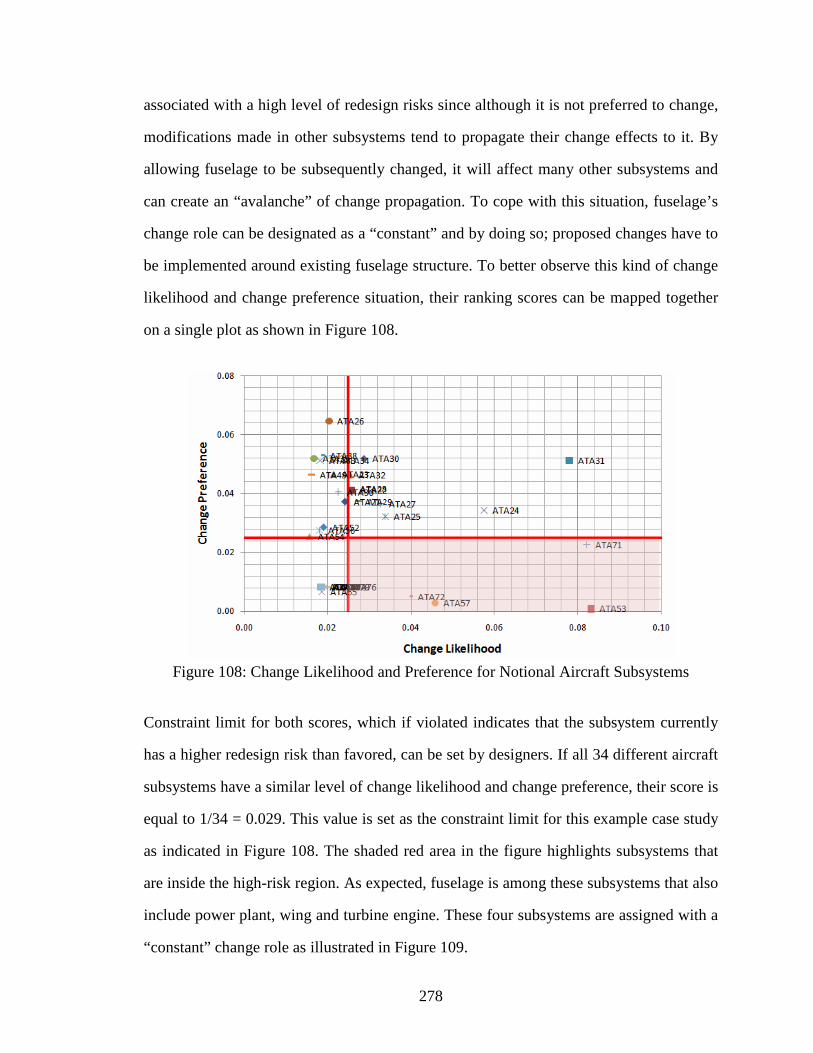
278
associated with a high level of redesign risks since although it is not preferred to change,
modifications made in other subsystems tend to propagate their change effects to it. By
allowing fuselage to be subsequently changed, it will affect many other subsystems and
can create an “avalanche” of change propagation. To cope with this situation, fuselage’s
change role can be designated as a “constant” and by doing so; proposed changes have to
be implemented around existing fuselage structure. To better observe this kind of change
likelihood and change preference situation, their ranking scores can be mapped together
on a single plot as shown in Figure 108.
Figure 108: Change Likelihood and Preference for Notional Aircraft Subsystems
Constraint limit for both scores, which if violated indicates that the subsystem currently
has a higher redesign risk than favored, can be set by designers. If all 34 different aircraft
subsystems have a similar level of change likelihood and change preference, their score is
equal to 1/34 = 0.029. This value is set as the constraint limit for this example case study
as indicated in Figure 108. The shaded red area in the figure highlights subsystems that
are inside the high-risk region. As expected, fuselage is among these subsystems that also
include power plant, wing and turbine engine. These four subsystems are assigned with a
“constant” change role as illustrated in Figure 109.

279
Figure 109: “Constant” Change Role Assignment in SPEC Support Tool
With selection of “constant” subsystems, change solution space for generating alternative
change implementation plans is now set. The implementation of proposed modification is
not allowed to affect “constant” subsystems, which effectively limits propagation paths of
change effects. The change plan generation interface is shown in Figure 110.
Figure 110: Change Plan Generation Environment in SPEC Support Tool
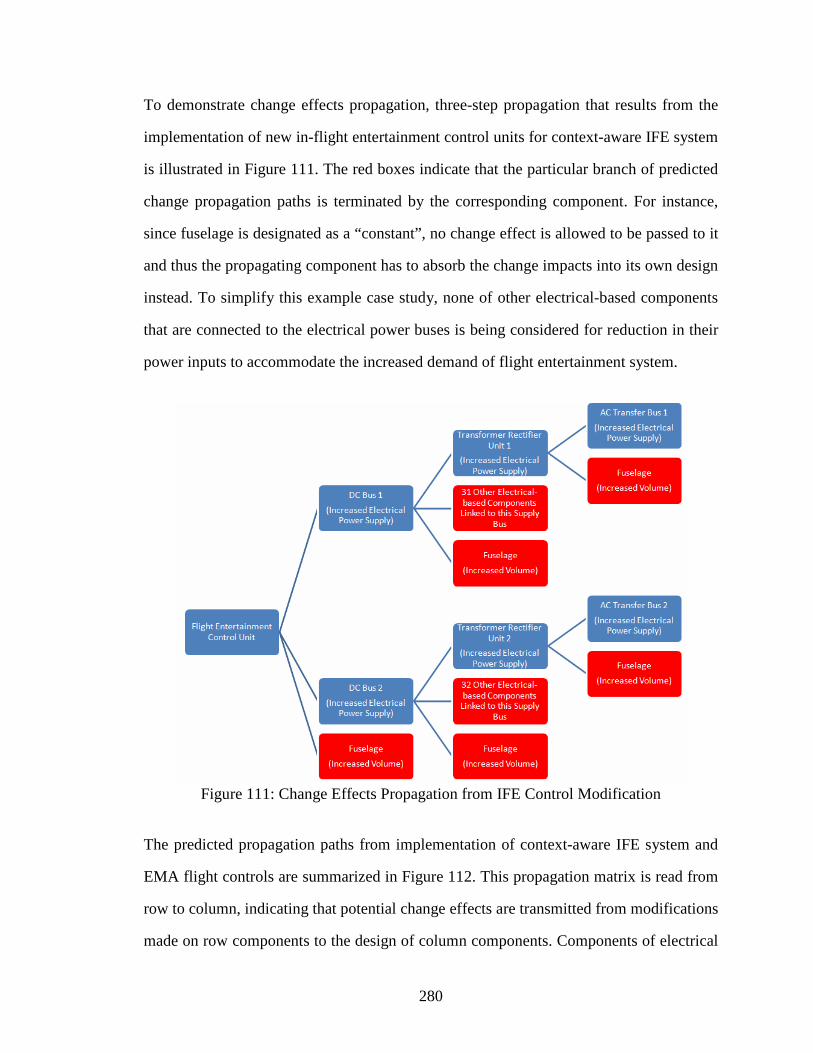
280
To demonstrate change effects propagation, three-step propagation that results from the
implementation of new in-flight entertainment control units for context-aware IFE system
is illustrated in Figure 111. The red boxes indicate that the particular branch of predicted
change propagation paths is terminated by the corresponding component. For instance,
since fuselage is designated as a “constant”, no change effect is allowed to be passed to it
and thus the propagating component has to absorb the change impacts into its own design
instead. To simplify this example case study, none of other electrical-based components
that are connected to the electrical power buses is being considered for reduction in their
power inputs to accommodate the increased demand of flight entertainment system.
Figure 111: Change Effects Propagation from IFE Control Modification
The predicted propagation paths from implementation of context-aware IFE system and
EMA flight controls are summarized in Figure 112. This propagation matrix is read from
row to column, indicating that potential change effects are transmitted from modifications
made on row components to the design of column components. Components of electrical

281
power distribution and generation are affected by both initiating system design changes.
If their implementation is individually planned as suggested by several change methods,
their cumulative effects on these components might not be realized until later stages. This
overlooked condition can induce redesign iterations that prolong the development process
and increase its costs.
Figure 112: Summary of Predicted Potential Change Effects Propagation Paths
By varying the change roles for affected components in Figure 112, several change plans
can be generated. Four different change plans have been effectively constructed for this
example case study and they are described in Table 88. Notice different change roles that
are assigned for the components, which are a key element that distinguish the alternative
plans. This role assignment dictates the control of change effects propagation and hence
the amount of affected components within each plan. For instance, by changing the role
of aileron power unit from “absorber” to “carrier” with regards to electrical signal inputs
for aileron control (from Plan 1 to Plan 2), it propagates the change effects to aileron feel
and centering mechanism, and flight control wheels. Accordingly, aileron power control
unit no longer needs to be equipped with mechanical-to-electrical transducer capability.
Instead, supply of roll control inputs from the cockpit flight control wheels should readily
be converted into an electrical-based mechanism.

282
Table 88: Change Alternative Plans for Notional Aircraft
Plan Modified Component Affected Change
Attribute Change Role
Change Level
Volume Absorber - IFE Control Unit
Electrical Absorber -
Volume Absorber - Aileron Actuators Elevator Actuators Rudder Actuators Electrical Carrier Medium
Volume Absorber - Electrical Carrier Medium
Aileron Power Control Unit Elevator Power Control Unit Rudder Power Control Unit Electrical Signal Absorber -
Volume Absorber - Autopilot Aileron Actuators A Autopilot Aileron Actuators B Autopilot Elevator Actuators A Autopilot Elevator Actuators B
Electrical Absorber -
Volume Absorber -
DC Bus 1 DC Bus 2
TRU 1 TRU 2
AC Bus 1 AC Bus 2
Circuit Breaker 1 Circuit Breaker 2
Electrical Carrier Medium
Volume Absorber -
1
Left AC Generator Right AC Generator Mechanical/Force Absorber Medium
Volume Absorber - IFE Control Unit
Electrical Carrier Low Volume Absorber - Aileron Actuators
Elevator Actuators Rudder Actuators Electrical Carrier Medium
Volume Absorber - Electrical Carrier Medium
Aileron Power Control Unit Elevator Power Control Unit Rudder Power Control Unit Electrical Signal Carrier Low Aileron Feel & Centering Rudder Feel & Centering
Captain Flight Control Wheel F/O Flight Control Wheel
Electrical Signal Absorber -
Volume Absorber - Autopilot Aileron Actuators A Autopilot Aileron Actuators B Autopilot Elevator Actuators A Autopilot Elevator Actuators B Electrical Carrier Medium
Volume Absorber -
DC Bus 1 DC Bus 2
TRU 1 TRU 2
AC Bus 1 AC Bus 2
Circuit Breaker 1 Circuit Breaker 2
Electrical Carrier High
Volume Absorber -
2
Left AC Generator Right AC Generator Mechanical/Force Absorber High

283
Table 88: Change Alternative Plans for Notional Aircraft (cont.)
Plan Modified Component Affected Change
Attribute Change Role
Change Level
Volume Absorber - IFE Control Unit
Electrical Carrier Low
Volume Absorber - Aileron Actuators Elevator Actuators Rudder Actuators Electrical Carrier Medium
Volume Absorber - Electrical Carrier Medium
Aileron Power Control Unit Elevator Power Control Unit Rudder Power Control Unit Electrical Signal Absorber -
Volume Absorber - Autopilot Aileron Actuators A Autopilot Aileron Actuators B Autopilot Elevator Actuators A Autopilot Elevator Actuators B
Electrical Absorber -
Volume Absorber -
DC Bus 1 DC Bus 2
TRU 1 TRU 2
AC Bus 1 AC Bus 2
Circuit Breaker 1 Circuit Breaker 2
Electrical Carrier Medium
Volume Absorber -
3
Left AC Generator Right AC Generator Left Generator Drive Right Generator Drive
Mechanical/Force Absorber Medium
Volume Absorber - IFE Control Unit
Electrical Absorber - Volume Absorber - Aileron Actuators
Elevator Actuators Rudder Actuators Electrical Carrier Medium
Volume Absorber - Electrical Carrier Medium
Aileron Power Control Unit Elevator Power Control Unit Rudder Power Control Unit Electrical Signal Carrier Low Aileron Feel & Centering Rudder Feel & Centering
Captain Flight Control Wheel F/O Flight Control Wheel
Electrical Signal Absorber -
Volume Absorber - Autopilot Aileron Actuators A Autopilot Aileron Actuators B Autopilot Elevator Actuators A Autopilot Elevator Actuators B Electrical Carrier Medium
Volume Absorber -
DC Bus 1 DC Bus 2
TRU 1 TRU 2
AC Bus 1 AC Bus 2
Circuit Breaker 1 Circuit Breaker 2
Electrical Carrier High
Volume Absorber -
4
Left AC Generator Right AC Generator Mechanical/Force Absorber -
284
5.3.4 Step 4: Change Impact Assessment
For each generated change implementation plan outlined in Table 88, their process risks
and impacts on performance of the notional aircraft have to be investigated. Firstly, the
assessment of process risks for each alternative plan is made based on the explanation of
MEA technologies in section 5.1, as summarized in Table 89. Its change process impact
rating is tailored to current SRL level of related technologies and assigned based on the
change impact and cost rating scales in Table 60 and Table 61, respectively.
As can be observed in Table 89, process risk for the alternative change plans is different
to each other. By controlling change effects propagation with assignment of component’s
change role, redesign process risk can be effectively managed. In addition, by comparing
Plan 1 and Plan 2, the number of affected components in former change implementation
plan is slightly less than the latter. But even though Plan 2 affects four more components
than Plan 1, its overall score for process risk is notably less than Plan 1. This observation
shows that minimum number of affected components, which is the common measure of
redesign effectiveness in many available methods; do not guarantee the lowest process
risks or the easiest change implementation process. The normalized process risks for the
change implementation alternative plans to the maximum score among them are shown in
Figure 113 and if solely based on the process risk, Plan 2 appears to be the best possible
way to implement both context-aware IFE system and EMA primary flight controls into
the notional aircraft system.

285
Table 89: Process Risks Assessment for Change Alternative Plans
Plan Modified Component Impact Rating
Cost Rating
Reference Technology
Total Risk
IFE Control Unit 8 10 Context-Aware IFE 80 Aileron Actuators 4 6 24 Elevator Actuators 4 6 24 Rudder Actuators 4 6 24
Aileron Power Control Unit 6 10 60 Elevator Power Control Unit 6 10 60 Rudder Power Control Unit 6 10 60
Autopilot Aileron Actuators A 6 6 36 Autopilot Aileron Actuators B 6 6 36 Autopilot Elevator Actuators A 6 6 36 Autopilot Elevator Actuators B 6 6
EMA Implementation
36 DC Bus 1 1 4 4 DC Bus 2 1 4 4
TRU 1 4 4 16 TRU 2 4 4 16
AC Bus 1 1 4 4 AC Bus 2 1 4 4
Circuit Breaker 1 4 4 16 Circuit Breaker 2 4 4
Power Electronics for Advanced
Electrical Networking
16 Left AC Generator 4 10 40
1
Right AC Generator 4 10 VSFC High Power Starter-Generator 40
TOTAL 636 IFE Control Unit 4 10 Context-Aware IFE 40 Aileron Actuators 4 6 24 Elevator Actuators 4 6 24 Rudder Actuators 4 6 24
Aileron Power Control Unit 4 6 24 Elevator Power Control Unit 4 6 24 Rudder Power Control Unit 4 6
EMA Implementation
24 Aileron Feel & Centering 1 1 1 Rudder Feel & Centering 1 1 1
Captain Flight Control Wheel 1 1 1 F/O Flight Control Wheel 1 1
Flight-by-Wire Flight Controls
1 Autopilot Aileron Actuators A 4 6 24 Autopilot Aileron Actuators B 4 6 24 Autopilot Elevator Actuators A 4 6 24 Autopilot Elevator Actuators B 4 6
EMA Implementation
24 DC Bus 1 4 4 16 DC Bus 2 4 4 16
TRU 1 4 4 16 TRU 2 4 4 16
AC Bus 1 4 4 16 AC Bus 2 4 4 16
Circuit Breaker 1 4 4 16 Circuit Breaker 2 4 4
Power Electronics for Advanced
Electrical Networking
16 Left AC Generator 6 10 60
2
Right AC Generator 6 10 VSFC High Power Starter-Generator 60
TOTAL 532

286
Table 89: Process Risks Assessment for Change Alternative Plans (cont.)
Plan Modified Component Impact Rating
Cost Rating
Reference Technology
Total Risk
IFE Control Unit 4 10 Context-Aware IFE 40 Aileron Actuators 4 6 24 Elevator Actuators 4 6 24 Rudder Actuators 4 6 24
Aileron Power Control Unit 6 10 60 Elevator Power Control Unit 6 10 60 Rudder Power Control Unit 6 10 60
Autopilot Aileron Actuators A 6 6 36 Autopilot Aileron Actuators B 6 6 36 Autopilot Elevator Actuators A 6 6 36 Autopilot Elevator Actuators B 6 6
EMA Implementation
36 DC Bus 1 1 4 4 DC Bus 2 1 4 4
TRU 1 4 4 16 TRU 2 4 4 16
AC Bus 1 1 4 4 AC Bus 2 1 4 4
Circuit Breaker 1 4 4 16 Circuit Breaker 2 4 4
Power Electronics for Advanced
Electrical Networking
16 Left AC Generator 4 10 40
3
Right AC Generator 4 10 VSFC High Power Starter-Generator 40
TOTAL 596 IFE Control Unit 8 10 Context-Aware IFE 80 Aileron Actuators 4 6 24 Elevator Actuators 4 6 24 Rudder Actuators 4 6 24
Aileron Power Control Unit 4 6 24 Elevator Power Control Unit 4 6 24 Rudder Power Control Unit 4 6
EMA Implementation
24 Aileron Feel & Centering 1 1 1 Rudder Feel & Centering 1 1 1
Captain Flight Control Wheel 1 1 1 F/O Flight Control Wheel 1 1
Flight-by-Wire Flight Controls
1 Autopilot Aileron Actuators A 4 6 24 Autopilot Aileron Actuators B 4 6 24 Autopilot Elevator Actuators A 4 6 24 Autopilot Elevator Actuators B 4 6
EMA Implementation
24 DC Bus 1 4 4 16 DC Bus 2 4 4 16
TRU 1 4 4 16 TRU 2 4 4 16
AC Bus 1 4 4 16 AC Bus 2 4 4 16
Circuit Breaker 1 4 4 16 Circuit Breaker 2 4 4
Power Electronics for Advanced
Electrical Networking
16 Left AC Generator 6 10 60
4
Right AC Generator 6 10 VSFC High Power Starter-Generator 60
TOTAL 572

287
Figure 113: Comparison of Process Risk Scores for Change Alternative Plans
Nonetheless, it is important to study the extent of effects that these design modifications
have on the derivative aircraft performance. To assess this aspect of change impacts, the
underlying relationships between affected subsystem parameters and interested high-level
aircraft system metrics are required. In application of proposed SPEC methodology, it is
assumed that these relationships are known and available to designers, and the procedure
for this methodology does not cover their establishment. For this case study, an estimated
relationship is constructed using Flight Optimization System (FLOPS) software package
and details for its build-up are presented in Appendix C. Only one system level metric is
considered here, which is gross weight.
Another system level metric that is of high interest in this redesign case is flight range.
Although change plans derived in previous step do not include any scaling up or down of
subsystems to extend the derivative aircraft range, this is automatically done in FLOPS.
While creating input file for FLOPS, the desired flight range is set to 2950 nmi and all
design characteristics for “constant” subsystems are frozen by using override parameters.
It is assumed that the automated design scaling of subsystems is made without changing
their architectural composition or affecting “constant” subsystems. Gross weight effects

288
from this automated design scaling are taken to be the same for each change alternative
plan and thus could be safely omitted from the change plans for simplicity.
The constructed subsystem-system weight relationship is presented as follows:
203.6WOIL792.7WIN817.8WPMSCS1187.2WFSY
1696.7WAPU1775.9WHYDNC2353.1WAVO 2370.5FRNA 2679.3WAC
FRSC 2708.1C3190.3WELEWFURN25317146487 (lb) Weight Gross
+++++++++
+++=
Equation 21
weightoil EngineWOIL weight,group InstrumentWIN
systemspropulsion ousmiscellane of WeightWPMSC
systemfuel of WeightWFSYS weight,unit powerAuxiliary WAPU
weightgroup HydraulicsWHYD weight,group AvionicsWAVONC
systeminduction air and/or nacelles of weightTotalFRNA
weightgroup ngconditioni Air WAC weight,controls Surface FRSC
weightgroup ElectricalWELEC weight,group sFurnishingWFURN:where
===
====
===
==
Using this subsystem-system relationship, impending effects of each alternative change
plan on the overall aircraft system weight can be estimated. The projected weight effects
from affected components are based on provided information in reference literatures and
they are tabulated in Table 90.
Accordingly, gross weight for the derivative aircraft that results from each change plan is
shown in Table 91. The variation of change roles for components of flight control system
seems to have a more significant impact on gross weight based on the estimated effects.
When conventional mechanical-based flight controls input mechanism is substituted with
electrical wirings, the weight savings simply outweigh the smaller weight increment on
electrical power subsystem. On contrary, a computing unit that operates with different
level of electrical power inputs does not necessarily vary much in terms of weights based
on current state of electronics technology. This is apparent by comparing the estimated
gross weight for Plan 1 and Plan 3 with that of Plan 2 and Plan 4 in Table 91.

289
Table 90: Weight Impact Assessment for Change Alternative Plans
Plan Modified Component Estimated Weight
Effects Main
Reference IFE Control Unit +2% of WIN [207, 208] Aileron Actuators Elevator Actuators Rudder Actuators
Aileron Power Control Unit Elevator Power Control Unit Rudder Power Control Unit
Autopilot Aileron Actuators A Autopilot Aileron Actuators B Autopilot Elevator Actuators A Autopilot Elevator Actuators B
-5% of FRSC
-70% of WHYD
[37, 49, 93, 94, 99, 269, 322]
DC Bus 1 DC Bus 2
TRU 1 TRU 2
AC Bus 1 AC Bus 2
Circuit Breaker 1 Circuit Breaker 2
Left AC Generator
1
Right AC Generator
-40% WELEC [17, 49, 123,
124, 260, 269]
IFE Control Unit +2% of WIN [207, 208] Aileron Actuators Elevator Actuators Rudder Actuators
Aileron Power Control Unit Elevator Power Control Unit Rudder Power Control Unit Aileron Feel & Centering Rudder Feel & Centering
Captain Flight Control Wheel F/O Flight Control Wheel
Autopilot Aileron Actuators A Autopilot Aileron Actuators B Autopilot Elevator Actuators A Autopilot Elevator Actuators B
-33% of FRSC
-70% of WHYD
[37, 49, 93, 94, 99, 269, 322]
DC Bus 1 DC Bus 2
TRU 1 TRU 2
AC Bus 1 AC Bus 2
Circuit Breaker 1 Circuit Breaker 2
Left AC Generator
2
Right AC Generator
-30% WELEC [17, 49, 123,
124, 260, 269]

290
Table 90: Weight Impact Assessment for Change Alternative Plans (cont.)
Plan Modified Component Estimated Weight
Effects Main
Reference IFE Control Unit +2% of WIN [207, 208] Aileron Actuators Elevator Actuators Rudder Actuators
Aileron Power Control Unit Elevator Power Control Unit Rudder Power Control Unit
Autopilot Aileron Actuators A Autopilot Aileron Actuators B Autopilot Elevator Actuators A Autopilot Elevator Actuators B
-5% of FRSC
-70% of WHYD
[37, 49, 93, 94, 99, 269, 322]
DC Bus 1 DC Bus 2
TRU 1 TRU 2
AC Bus 1 AC Bus 2
Circuit Breaker 1 Circuit Breaker 2
Left AC Generator
3
Right AC Generator
-40% WELEC [17, 49, 123,
124, 260, 269]
IFE Control Unit +2% of WIN [207, 208] Aileron Actuators Elevator Actuators Rudder Actuators
Aileron Power Control Unit Elevator Power Control Unit Rudder Power Control Unit Aileron Feel & Centering Rudder Feel & Centering
Captain Flight Control Wheel F/O Flight Control Wheel
Autopilot Aileron Actuators A Autopilot Aileron Actuators B Autopilot Elevator Actuators A Autopilot Elevator Actuators B
-33% of FRSC
-70% of WHYD
[37, 49, 93, 94, 99, 269, 322]
DC Bus 1 DC Bus 2
TRU 1 TRU 2
AC Bus 1 AC Bus 2
Circuit Breaker 1 Circuit Breaker 2
Left AC Generator
4
Right AC Generator
-30% WELEC [17, 49, 123,
124, 260, 269]
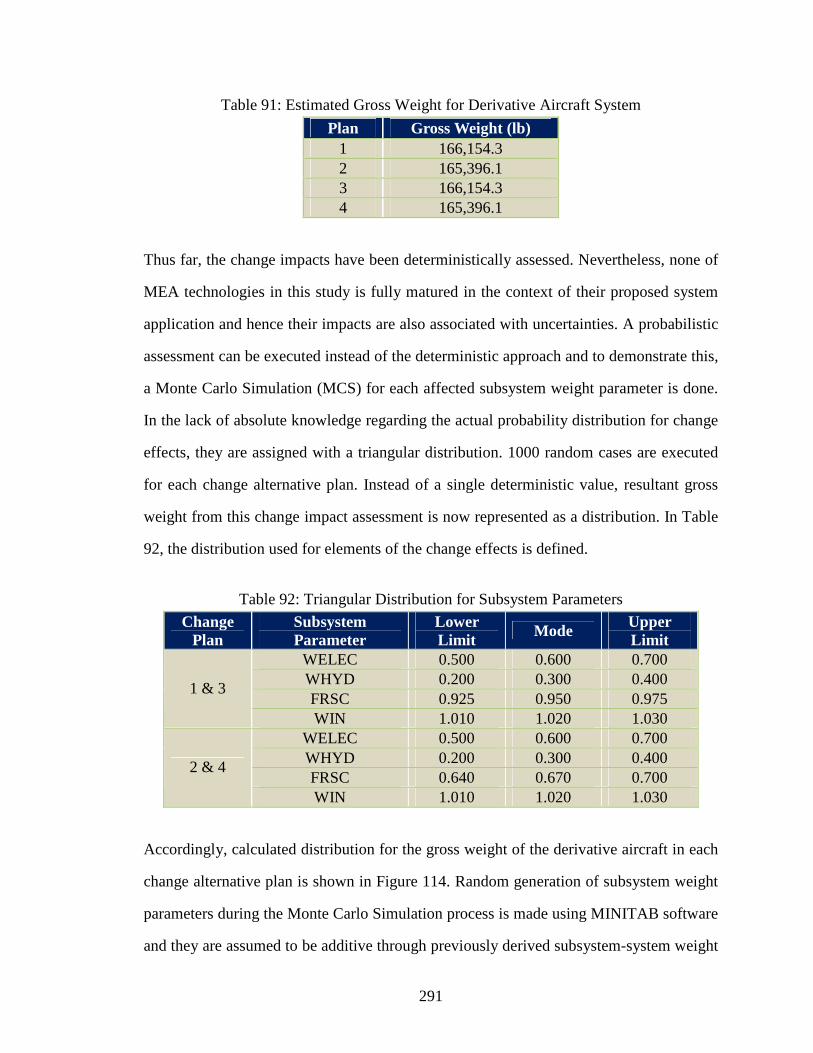
291
Table 91: Estimated Gross Weight for Derivative Aircraft System
Plan Gross Weight (lb) 1 166,154.3 2 165,396.1 3 166,154.3 4 165,396.1
Thus far, the change impacts have been deterministically assessed. Nevertheless, none of
MEA technologies in this study is fully matured in the context of their proposed system
application and hence their impacts are also associated with uncertainties. A probabilistic
assessment can be executed instead of the deterministic approach and to demonstrate this,
a Monte Carlo Simulation (MCS) for each affected subsystem weight parameter is done.
In the lack of absolute knowledge regarding the actual probability distribution for change
effects, they are assigned with a triangular distribution. 1000 random cases are executed
for each change alternative plan. Instead of a single deterministic value, resultant gross
weight from this change impact assessment is now represented as a distribution. In Table
92, the distribution used for elements of the change effects is defined.
Table 92: Triangular Distribution for Subsystem Parameters
Change Plan
Subsystem Parameter
Lower Limit
Mode Upper Limit
WELEC 0.500 0.600 0.700 WHYD 0.200 0.300 0.400 FRSC 0.925 0.950 0.975
1 & 3
WIN 1.010 1.020 1.030 WELEC 0.500 0.600 0.700 WHYD 0.200 0.300 0.400 FRSC 0.640 0.670 0.700
2 & 4
WIN 1.010 1.020 1.030
Accordingly, calculated distribution for the gross weight of the derivative aircraft in each
change alternative plan is shown in Figure 114. Random generation of subsystem weight
parameters during the Monte Carlo Simulation process is made using MINITAB software
and they are assumed to be additive through previously derived subsystem-system weight

292
relationship from FLOPS. For this probabilistic change impact assessment, the selection
process for different change plans can be made at a specified confidence level.
Calculated Gross Weight for Plan 1
Calculated Gross Weight for Plan 2
Calculated Gross Weight for Plan 3
Calculated Gross Weight for Plan 4
Figure 114: Gross Weight Distribution in Probabilistic Change Impact Assessment
5.3.5 Step 5: Change Plan Selection
Back in Step 2, it is assumed that the pursuit of this derivative redesign approach for the
notional aircraft system is intended to improve its market competitiveness. This has been
proposed to be accomplished by reducing its gross weight while extending its flight range
through installation of EMA flight controls, and offering a competitive cabin service with
installation of context-aware IFE. To finalize the selection of change alternative plans,
subsequent effects from their proposed changes should be weighed if they are justifiable
to be further pursued. With target range of the derivative aircraft is set to match the new

293
Bombardier C130-ER aircraft, comparable gross weight to Airbus A320 (shown in Table
86) is taken as another target requirement considering passenger capacity of the notional
aircraft. The deterministic performance and process risk indexes for each change plan are
listed in Table 93 and the performance-risk plot is constructed in Figure 115. In addition,
to observe if the conclusion from probabilistic change impact assessment will vary from
that of the deterministic assessment, calculated indexes from probabilistic assessment at
95% confidence level are also depicted in Figure 115.
Table 93: Deterministic Performance and Process Indexes
Plan Performance Metric
Target Estimated Value
Performance Index
Process Index
Range 2950 nmi 2950 nmi 1
Gross Weight 169,000 lb 166,154.3 lb 1.008 1.000
Range 2950 nmi 2950 nmi 2
Gross Weight 169,000 lb 165,396.1 lb 1.011 0.836
Range 2950 nmi 2950 nmi 3
Gross Weight 169,000 lb 166,154.3 lb 1.008 0.937
Range 2950 nmi 2950 nmi 4
Gross Weight 169,000 lb 165,396.1 lb 1.011 0.899
Figure 115: Performance-Risk Plot for Sample Case Study 2

294
It can be concluded that both deterministic and probabilistic change impact assessments
point to the same conclusion for this sample case study. All change alternative plans have
a performance index that is above 1. This is an encouraging situation, indicating that they
can potentially meet all driving requirements; which is supported by the tabulated data in
Table 93. Among them, plan 2 appears to have the lowest risk for its redesign process and
shares the best performance index with plan 4. Thus it can be perceived as the best way to
redesign the notional aircraft system to satisfy the formulated requirements. On the other
hand, plan 4 can be a back-up redesign plan if for some reasons plan 2 is rejected during
formal engineering change management process adopted in the company. With available
back-up plans, designers do not need to start redesign process from scratch and this can
save overall development time.
5.3.6 Conclusion from Case Study 2
This second case study is intended to highlight the overall range of procedures within the
proposed SPEC method. Though a complete aircraft system model that is representative
of an existing one is difficult to be precisely built with limited data in public domain, the
constructed notional aircraft model in this sample case study is believed to be appropriate
in capturing the essences of complexity in actual aircraft redesign process. Results from
this case study can thus be applied to demonstrate following research hypotheses.
Hypothesis 2 for this thesis study is re-presented in Figure 116. It puts forward the notion
that change effects propagation can be effectively managed and controlled through proper
assignment of component change role. In this second case study, this condition has been
shown and manipulated during the third step of the proposed SPEC methodology.

295
Figure 116: Step 3 and Hypothesis 2
During third step of the case study, components of several aircraft subsystems have been
designated as “constants”, which indicates that they are not allowed to be affected by the
change effects. While generating possible change implementation alternative plans, this
“constraint” has its effects on controlling the change effects propagation paths. Consider
the potential change effects propagation paths due to modification of IFE control unit to
accommodate the new context-aware entertainment system as shown in Figure 117.
Figure 117: Effect of Component’s Change Role in Change Effects Propagation
Because fuselage has been designated as a “constant” in the change solution space, all its
main components are not allowed to change. Subsequent to this decision, possible change
propagation from IFE control unit to the fuselage with regards to its onboard volumetric

296
space increase is not permitted. By axing this potential change propagation path, other
subsystems such as wing and propulsion system are spared from being affected since they
are very likely to require modification if the fuselage structure is altered. This observation
supports the idea put forth by hypothesis 2, which indicates that it is possible to manage
change propagation paths by controlling the assignment of component change roles. With
this knowledge, designers can effectively define their solution space and generate change
plan alternatives that will not violate their solution boundaries.
On the other hand, hypothesis 3 is related to first step of proposed SPEC method where
aircraft system change model is being constructed. Based on literature review study, there
appears to be a reasonable concern with regards to finding the right balance between level
of details for the model and required amount of efforts for its construction. With tighter
budget and development timeframe than original product development, designers cannot
afford to allocate too much time for redesign planning. However, failure to identify the
right change effects propagation can also be detrimental to the overall process. As evident
in helicopter design process in Westland Helicopters Company, about 50% of their total
helicopter modifications were overlooked during initial change assessment stage and had
to be abruptly handled [81]. Regarding the change model size, Clarkson et al. suggested a
change model composition of fewer than 50 components in their method, which is hardly
an appropriate size for a complex product system such as an aircraft [80]. Moreover, none
of identified product modeling methodologies during the literature review study exercises
a formal, standard taxonomy for model construction. This realization leads to hypothesis
3 as presented in Figure 118. In proposed SPEC methodology, the aircraft system change
model is tailored to the taxonomy of system element interactions [257] and equipped with
supplementary information about its components change tolerance level. Accuracy of the
suggested model and its capability to predict change propagation have been demonstrated
in the sample case study.

297
Figure 118: Step 1 and Hypothesis 3
The support for hypothesis 3 is follows. Consider an example case of change propagation
for a left air cycle machine unit of air conditioning subsystem. A modification is made on
the unit that increases its required electrical power for operation. Using the SPEC support
tool, possible propagation paths for any changes made on the air cycle machine unit are
shown in Figure 119.
Figure 119: All Possible Change Propagation Paths for Air Cycle Machine

298
By screening the possible change propagation paths based on their type (i.e. taxonomy of
system elements interaction) and modification level, the amount of paths is reduced from
six to only one as highlighted in Figure 120. This corresponds to significant reduction in
computational efforts for the redesign process and demonstrates possible savings in terms
of time and resources when change propagation is correctly predicted. It is concluded that
taxonomy of system elements interaction and change tolerance level enables the system
change model to be constructed with a manageable size but without sacrificing its level of
effectiveness in change propagation prediction. This condition highlights the applicability
of the formulated research hypothesis 3.
Figure 120: Change Propagation Paths for Air Cycle Machine after Screening
Results of sample implementation case study also demonstrate that the generated change
plans correspond to different redesign process risks from each other. Since these change
alternative plans are derived by varying the change role of affected components, hence by
managing the propagation paths, this can be seen to support the notion of hypothesis 4.
Moreover, different change plans also involve different number of affected components.
While most available redesign methods seem to focus on minimizing the number affected

299
components to minimize redesign risks, it has been shown from the results of this sample
case study that such proposition is not always true. This condition has been emphasized
by research hypothesis 5. The ties of research hypotheses 4 and 5 to SPEC methodology
can be summarized as depicted in Figure 121.
Figure 121: Step 4 and Hypotheses 4 and 5
During change impact assessment in the example case study, the generated change plans
have been evaluated with different level of redesign risks. The results are summarized in
Figure 122. As indicated, each change plan has a different value of process risk index and
this implies that they do not correspond to the same process difficulty. This observation
demonstrates the correctness of hypothesis 4 as the change plan alternatives were derived
through management of change propagation paths by varying the affected components’
change role whenever applicable.
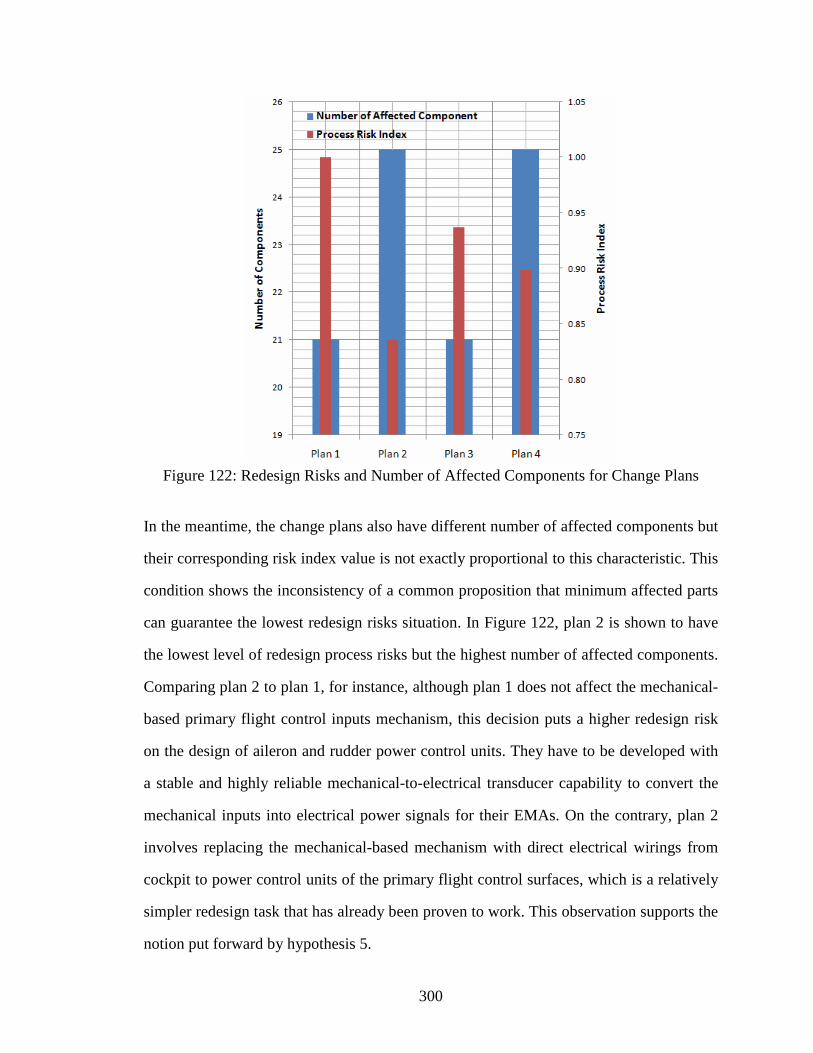
300
Figure 122: Redesign Risks and Number of Affected Components for Change Plans
In the meantime, the change plans also have different number of affected components but
their corresponding risk index value is not exactly proportional to this characteristic. This
condition shows the inconsistency of a common proposition that minimum affected parts
can guarantee the lowest redesign risks situation. In Figure 122, plan 2 is shown to have
the lowest level of redesign process risks but the highest number of affected components.
Comparing plan 2 to plan 1, for instance, although plan 1 does not affect the mechanical-
based primary flight control inputs mechanism, this decision puts a higher redesign risk
on the design of aileron and rudder power control units. They have to be developed with
a stable and highly reliable mechanical-to-electrical transducer capability to convert the
mechanical inputs into electrical power signals for their EMAs. On the contrary, plan 2
involves replacing the mechanical-based mechanism with direct electrical wirings from
cockpit to power control units of the primary flight control surfaces, which is a relatively
simpler redesign task that has already been proven to work. This observation supports the
notion put forward by hypothesis 5.
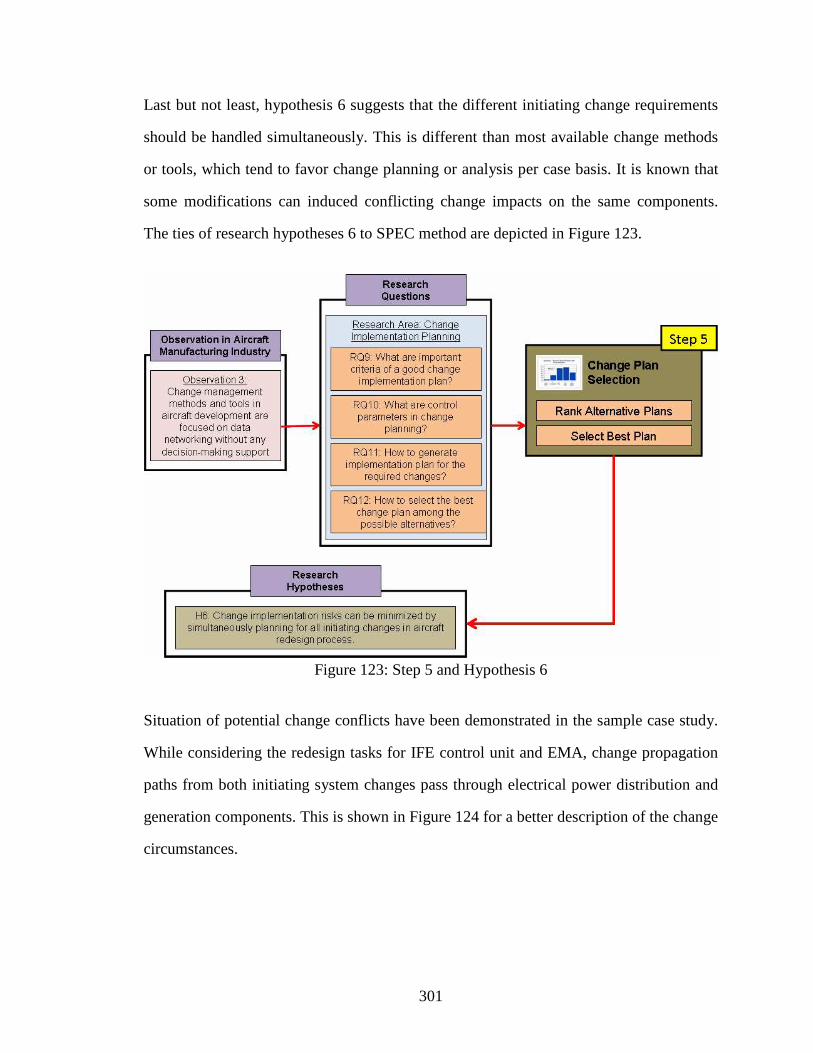
301
Last but not least, hypothesis 6 suggests that the different initiating change requirements
should be handled simultaneously. This is different than most available change methods
or tools, which tend to favor change planning or analysis per case basis. It is known that
some modifications can induced conflicting change impacts on the same components.
The ties of research hypotheses 6 to SPEC method are depicted in Figure 123.
Figure 123: Step 5 and Hypothesis 6
Situation of potential change conflicts have been demonstrated in the sample case study.
While considering the redesign tasks for IFE control unit and EMA, change propagation
paths from both initiating system changes pass through electrical power distribution and
generation components. This is shown in Figure 124 for a better description of the change
circumstances.

302
Both propagation paths go through the DC Buses 1 & 2
Figure 124: Projected Conflicting Change Propagation Paths for Sample Case Study
If change implementation of context-aware IFE system and EMA are separately planned,
it is highly possible that the components of electrical power distribution and generation
have to be redesigned more than once. This is because the required power supply increase
from both implementations are considered separately and any conflicting or mismatched
redesign requirements for electrical power subsystem are usually only recognized during
later redesign stages. Once this problem is identified, another round of redesign planning
is required. However, if both changes are simultaneously considered from the beginning,
these conflicts can be recognized and resolved during the first redesign planning cycle.
Though the complexity of the redesign planning process usually increases tremendously
by considering simultaneous initiating design changes, its offered benefit of not having to
reiterate the whole redesign cycle can be taken to outweigh the increase in computational
difficulty. By avoiding the need to reiterate the entire redesign cycle, the process risks are
also reduced. This realization effectively supports hypothesis 6.
In summary, results of this sample case study help to demonstrate the formulated research
hypotheses for this thesis study.

303
5.4 Contributions of the Proposed SPEC Methodology
The intellectual contributions that are presented in this thesis study have been introduced
in the first two chapters of this thesis but thus far, they have been realized throughout the
research works without a proper mention. Recall that the main purpose of this research is
to develop a methodology that supports designers in making their decisions regarding the
planning of their aircraft redesign. In view of that, this section intends to highlight and
discuss the values of contributions from the proposed SPEC methodology in addressing
the identified challenges in aircraft redesign planning process. To summarize, primary
contributions of this proposed SPEC methodology are listed as follow:
1. A decision-making aid for aircraft redesign planning
2. A structured baseline assessment and selection scheme
3. A structured method to define change solution space
4. A structured and unbiased analysis of redesign risks
5.4.1 Decision-making Aid for Aircraft Redesign
As discussed in Chapter 1 and Chapter 2, the prominence of aircraft redesign process is
gaining momentum with the shift towards a customer-driven market environment. The
rise of redesign approaches has led to the increase of engineering change volumes during
product development process but this subject has been relatively under-researched [174].
Most redesign process is presently executed in “as necessary” manner without a proper
strategic planning and the main focus has always been on “damage control” rather than
product improvement [30]. This is an unfortunate situation given the potential benefits
that could be gained by manufacturers if their derivative development is strategically
planned. It has been argued throughout this thesis that if the redesign process is correctly

304
approached, the change effects can be appreciably minimized and competitive advantages
of the resultant derivative design can also be maximized.
Without proper assistance from change support methods or tools, aircraft designers have
to manually plan the whole redesign process based on their past experiences. In many
instances, they tend to follow available methods that are meant for original development
[104] and this often results in overlooked change effects that have to be unexpectedly
handled in late development stages. A case study in Westland Helicopters showed that
about 50% of their total helicopter modifications were overlooked during initial change
assessment stage and had to be abruptly handled [81]. Since redesign strategy is common
in aircraft manufacturing, the utmost advantage is obtained by the fastest manufacturers
to develop their range of aircraft options without making any costly errors. This relates to
the current “Better, Faster, Cheaper” goal in aerospace industry [239], which stresses on
redesign planning efficiency.
Moreover, the capability of aircraft manufacturers to address change requests from their
customer airlines as early as during their negotiation process is important for their market
competitiveness [268]. The same study in Westland Helicopters showed that 10% to 15%
of their helicopter redesign costs occurred before the sales contract was signed and it was
used for planning required design changes and predicting their effects [81]. This insight
puts a big emphasis on the efficiency of redesign planning, which can only be achieved if
the engineering change process is executed in good synergy with the aircraft development
process. It has been suggested that no ready-to-use software package that fully supports
all aspects of change management process is currently available [259] and this is a key
absence considering its prominence in today’s market.

305
To compare the foundation of available redesign methods and tools with the basis for the
proposed SPEC method, one can ask this question: how the process of implementing the
required modification on the aircraft design is approached? For many available methods,
this situation is coped by simply applying the modification and implementing subsequent
changes that are required for its accommodation. Every projected design change is taken
as necessary and they are implemented in an “as necessary” manner. But there is another
key question to aircraft designers during their redesign planning process: what is the best
way to implement the required changes such that the process risks are minimized and the
competitiveness of the resultant derivative is maximized? The answer to this question is
the groundwork for the proposed SPEC method. Having said that, the key contribution of
this proposed method is the offered capability to designers to properly and structurally
plan the implementation of any required aircraft design changes with the goal of having a
minimum development risk, yet still has a competitive product for the market.
A major difference that sets this proposed redesign method apart from the available ones
is how it treats engineering changes. Instead of perceiving all predicted design changes as
necessary, the change roles of affected components in the propagation paths are varied to
derive alternative redesign scenarios that could potentially be of different risks level. By
exploring the full extent of the specified change solution space, the best redesign plan can
be efficiently and effectively identified. These differences have been indirectly discussed
through comparison of the SPEC method with existing redesign and engineering change
methods in section 4.4. As demonstrated by the second sample case study, several change
implementation plans can be derived for the same set of required modifications. Because
they often correspond to different risks level to each other, the best implementation plan
could be overlooked if no thorough redesign assessment is made during planning. In the
same case study, it is shown that “one-at-a-time” redesign approach that is reminiscent of
typical “as necessary” manner often results in an overworked redesign plan. Due to this

306
situation, it often ends up being less efficient and less competitive, not to mention costly.
In contrast, by strategically plan the required change implementation, development risks
are minimized while producing a competitive derivative design that satisfies the driving
requirements. This capability is the main contribution and advantage that is offered by the
proposed SPEC methodology for aircraft redesign process.
In accomplishing this goal, several process elements in the proposed SPEC method also
stand out on their own as a significant contribution within their application scope. Their
individual advantages are worth mentioning and they are discussed in following sections.
5.4.2 Baseline Assessment and Selection Scheme
Redesign process takes place against the rich background of knowledge and experience
that is embodied within the current design, which is the starting point for change process
[109]. According to EIA649 Standard, the baseline design acts as a known configuration
basis to which any proposed modification is being addressed and planned [297], and this
supports the notion that the state of product architecture will influence how the required
engineering change can be implemented into it [332]. One of the identified drawbacks for
current redesign practices lies in baseline selection process, which is always either taken
too lightly or focused solely on existing design capabilities. At present, baseline designs
are mostly chosen based on the proximity of their capabilities to the target requirements
or simply because they are the natural choice for incremental progression in the product
family [105].
As demonstrated by the first sample case study, sole focus on design performances might
not completely reflect the suitability of a baseline candidate with regards to the required
design reworks. Such high-level approach does not consider the existing state of baseline

307
architecture. Working with existing or finished product designs, even at conceptual level,
often comes with less flexibility in terms of the available degree of freedom to implement
design changes [115]. This underlines the limitations imposed by baseline design on the
redesign approach and the challenges to select the most suitable design for the adaptation
or customization tasks [117]. It has been suggested that an effective baseline possesses a
highly evolvable design architecture [74]. In support of this idea, Pimmler and Eppinger
emphasized on choosing the baseline based on its capability to be modified [257]. Taking
this argument into account, it appears that the typical baseline selection for redesign lacks
consideration of design architecture influences on complexity and competitiveness of the
development approach. It is projected in a product study that 80% of the total design and
manufacturing cost for the development process is dictated by the baseline choice [343].
In view of this, the selection procedure should also consider redesign cost-effectiveness
and required amount of reworks [178].
In the proposed SPEC methodology, baseline assessment is done through the evaluation
of system evolvability metrics as defined in Table 59. This assessment scheme, which is
derived based on quantitative system evolvability and MAAP methods, enables designers
to not only assess the redesign suitability of a baseline candidate from the viewpoint of its
current performances but also the aptness of its existing design architecture. This offers a
balanced measurement of baseline suitability with respect to the actual redesign tasks at
hand. Moreover, weighting scenario for the evolvability metrics can be varied to match
the underlying preference of manufacturers in pursuing their derivative aircraft process.
Instead of focusing only high system-level performance evaluation like most available
methods, this scheme is more reflective of the redesign development characteristics.
Overall, this baseline assessment procedure aids designers in choosing the best baseline
design for the redesign process and in evaluating whether the estimated redesign risks can
308
be competitively justified. In view of the latter condition, redesign development approach
has to be more cost-effective than building a new product for similar purpose [74]. The
offered capability for designers to either select the best baseline design for the redesign
tasks or evaluate the appropriateness of the redesign development risks is an advantage
that is not available in any of the identified redesign methods. A good baseline is vital in
having an efficient redesign process and the offered capability by the proposed baseline
assessment scheme has been highlighted in the first case study.
5.4.3 Definition of Change Solution Space
The planning process for the required change implementation into its baseline design can
be an overwhelming task, especially when the design complexity is high and the amount
of initiating changes is abundant. As suggested in reference literatures, estimated change
propagation paths in a product is a factorial function of its elements [134], which can be
extremely high for complex products such as aircraft. Due to numerous possible change
propagation paths, tremendous amount of time and efforts is usually required to generate
all possible change plans. This situation can reduce the competitiveness of the redesign
process, which is often constrained by limited development timeframe and lower budgets
and resources than those allocated for new product development.
Many available change methods and tools try to address this issue by simplifying their
change propagation algorithm. The original CPM method, for instance, effectively limits
its prediction of change effects propagation to only three or four steps after the initiating
component [80]. This simplification is made based on the assumption that the probability
of change rapidly decreases with each propagation step and becomes too insignificant to
be considered. On the other hand, the Monte-Carlo version of CPM further simplifies the
propagation path tracking by assuming change propagation likelihood from any product

309
component to be mutually exclusive. This turns the change propagation problem into a
series of “random walk”. It is concluded that this assumption does not significantly affect
the analysis results in comparison to the original CPM and they are achieved with much
less computational time [175]. However, these assumptions are still a main concern since
they do not represent real practices in the industry and are in great conflicts with the true
characteristics of change propagation phenomenon.
At this point, one might ask if there is a proper way to reduce the required computational
efforts in redesign planning while still maintain the process integrity with regards to real
industrial practices and change propagation phenomenon. In the proposed SPEC method,
this issue is tackled by taking advantage of industrial trend in product redesign process.
In general, the available change solution space for redesign planning is governed by the
change roles for each of the product components. Some subsystems are not allowed to be
modified due to company’s policy because they cost too much or their adaptation is taken
as too risky [115]. During the development of their engine variants, designers in Perkins
Engines reserved several parts of the baseline engine from being modified because their
redesign was anticipated to cause a significant increase in development efforts and costs
[118]. This kind of resolution effectively reduces the potential change propagation paths,
hence the possible change plans. Taking this observation into consideration, considerable
redesign planning efforts could be saved if designers are assisted with a proper scheme to
reduce their product change solution space into a manageable size for the practicality of
their redesign analysis. In other words, the redesign planning can be made more efficient
if all risky modifications are screened out early in the process. Valuable computational
efforts could be saved from being spent on those change plans that would be eventually
eliminated regardless.

310
During redesign planning, designers have a choice to pass on the change effects from one
component to another [116]. How a component within the product architecture is affected
by the proposed changes will depend on their implementation [81]. The most significant
effects on change solution space are made when a component is not allowed to change at
any circumstances. As the least risky change implementation plan is preferred, effective
change solution space can be derived by “freezing” risky product components from being
subjected to any changes by the proposed redesign plan in order to control and reduce the
likelihood of further propagated changes [121].
To decide whether a component is risky enough to warrant it to be screened out from the
change plans, its evaluation can be made from two aspects of redesign development risks.
If the component has a high risk when being changed and at the same time propagates its
change effects to other risky components, then it should not be changed. This decision is
made to avoid unending change propagation, which has been discussed in section 1.2.2 to
be potentially detrimental for the redesign success. However, if the component has been
determined as a change initiating component, it should not be designated as a “constant”
or otherwise the redesign goals might not be able to be successfully achieved.
In the proposed SPEC method, definition of the change solution space is supported by the
measures of change likelihood and change preference for each component. Its application
has been demonstrated in the second sample case study, which shows its offered benefits
and efficiency in assisting designers to determine a proper solution space for their aircraft
redesign planning. Subsequently, the redesign planning efforts can benefit from a better-
defined solution space. This enables designers to efficiently explore the available change
solution space while keeping their redesign efforts at minimum level.

311
5.4.4 Redesign Risks Analysis
The most critical phase in engineering change process is change impact evaluation [176].
This can be implied from the emphasis of available standards in manufacturing industries
[273]. Before a product change is decided as acceptable, its system-wide effects including
the total required efforts for its planning, scheduling and resourcing have to be estimated
[152]. A strategic planning decision requires an overall problem outlook since the change
effects for the product sub-areas might be connected to each other [334], which depends
on applied methods and tools to provide the required information for assessment purposes
[211]. The main objective of change impact analysis is to estimate the extent of effects
from the proposed product changes, which can help in deciding the most proper redesign
plan [170].
Engineering changes can simultaneously affect the product and its development process.
It is essential to have proper means to estimate these two types of change effects. In many
available change support methods and tools, change impacts are often measured only in
terms of process risks. By definition from the risk management field, change risks can be
estimated as a product of change likelihood and scale of impacts that it will produce [80,
176]. Few methods include the examination of engineering change effects on the product,
especially for complex, multi-level product design structure [160]. It is known that design
modification will affect product performance and its exclusion from the change impact
analysis should be taken a serious oversight. An incomplete redesign risk assessment can
mislead the selection of change plan since it is possible that the plan with the lowest risk
level might produce a derivative product that does not satisfy the driving requirements.
In addition, redesign risk evaluation in available change methods and tools often depends
on historical product change data. This situation is probably due to the fact that most of
them are developed as a data storage system and have limited operational capability. The

312
use of historical data can mislead the conclusion made based on results from the change
analysis process since the current change situation and characteristics of the redesign task
at hand might significantly differ from those executed in the past.
In summation, there is a need for a change risk analysis scheme that is unbiased and truly
representative of redesign task at hand. The analysis should also consider change effects
on the derivative product performance. To address this situation, change analysis process
in the proposed SPEC methodology refers to the SRL rating scale. This enables a better
assessment of change impacts that is not tied to historical change data, which might be
outdated or wrongly represent the criteria of present redesign task. The combination of
process and performance risks is applied to select the best change implementation, which
improves the lack of product consideration in available change methods. As demonstrated
in sample case study, this allows designers to have a complete picture with regards to the
development risks that are anticipated for the change plan and its effects on the derivative
product performance capabilities.
5.5 Chapter Summary
In this chapter, full application range of formulated steps for the proposed SPEC method
has been aptly demonstrated. Based on the results from two sample implementation case
studies, research hypotheses for this thesis study have been properly demonstrated and
validated. This strengthens the case made for the development of this proposed redesign
method and supports its applicability within the present aircraft manufacturing industry.
Moreover, the new contributions from this proposed SPEC method have been discussed
and outlined, which highlight the suggested values of this research work to engineering
community in general.

313
CHAPTER 6
DISCUSSIONS AND CONCLUSION
“Changes are a vital part for the engineering of successful
systems, and it is necessary to understand changes and to have a
good grip on them, as the entire product development process
can be described as a continuous change management process.”
- Fricke, Gebhard, Negele and Igenbergs (2000)
As outlined in the first chapter of this thesis, the focal point of this research is to develop
a methodology that supports the decision-making process in aircraft redesign through an
efficient engineering change implementation planning. With the increased prominence of
aircraft derivative strategy and the progressively complex aircraft design, redesign tasks
become very difficult to be efficiently executed by designers without a proper decision-
making aid. The proposed method addresses this growing need that is also recognized by
many product companies and academic institutions to be very important in surviving the
competitive customer-driven market environment today. Among the reference literatures
that also highlight this issue include Eckert, Pulm and Jarratt [117], Rouibah and Caskey
[270] and Eckert, Clarkson and Zanker [115].
To support this primary research goal, four major research objectives have been outlined
in Chapter 1. They are derived based on observation of industrial practices within general
product manufacturing regarding redesign process. These objectives are recalled here as
follow.
Research Objective 1: Reduce risks of product redesign process by
incorporating changeability assessment on baseline design in early stages

314
Research Objective 2: Improve identification of potential change effects by
incorporating analysis of direct and indirect change propagation
Research Objective 3: Improve product change implementation planning by
aiding designers in defining appropriate change solution space and supporting
their change decision-making process
Research Objective 4: Reduce costs and time delays of product redesign
process by generating competitive change implementation proposals
Based on these research objectives, the scope of this thesis work is further refined by the
observation in present aircraft industry and by the general review on methods and tools
available for the redesign process. This is discussed throughout Chapter 1 and Chapter 2,
which identifies four main areas of study in the product design field as the current gaps in
aircraft redesign process and 12 research questions to address them. The proposed SPEC
methodology is developed based on the needs to resolve these redesign gaps. In view of
this, literature review of existing methods and tools that could potentially be integrated
into the proposed method are presented in Chapter 3. Based on the knowledge of current
state-of-the-art methods and tools, six research hypotheses are derived to help answer the
governing research questions in Chapter 4. The implementation of the hypotheses and the
demonstration of their effectiveness are presented in Chapter 5.
To conclude this thesis study, this chapter is intended to highlight the research work done
with regards to the outlined research questions and hypotheses, and to recapitulate their
contributions. In addition, several recommendations with regards to future research work
based on this study are also discussed.

315
6.1 Revisiting Research Questions and Hypotheses
Based on the outlined research motivation and the identified research needs in the early
chapters of this thesis, research objectives that have to be resolved by this thesis work are
established. To accomplish them, several research questions are defined and addressed by
the literature study. Based on the knowledge gained from this review, the solution paths
for the research questions are supported with the formulated research hypotheses, which
are incorporated into the procedures of proposed SPEC method. This section is intended
to reflect on the research questions and how they are treated by the hypotheses.
6.1.1 Baseline Assessment
Product redesign process is started with a well-defined baseline [256]. Since the available
degree of freedom in planning for the required change implementation is highly dictated
and constrained by the choice of baseline, the redesign process has to be managed around
its existing design flexibility. Alternatively said, the baseline design governs the available
change solution space to satisfy the driving requirements and hence a proper care should
be taken while selecting the baseline for redesign approach. To assess whether a baseline
candidate is suitable for proposed redesign changes, the criteria of a good baseline design
has to be determined. This need is addressed by the first two research questions.
Research Question 1 (RQ1): What are characteristics of a good
baseline for aircraft redesign approach?
Research Question 2 (RQ2): How will these characteristics affect
the change process?
316
In section 3.1, some standard definitions for product capability to evolve from its current
form have been discussed. It can be implied from reference literatures that the complexity
of the redesign procedure can vary from one product to another depending on its design
architecture and driving change requirements. Based on this knowledge, it can be inferred
that the state of existing aircraft system architecture design has a notable influence on the
risk and complexity levels of its required redesign process. This assertion is formalized
by the first hypothesis.
Hypothesis 1 (H1): Aircraft design architecture dictates the
complexity of its redesign process.
This hypothesis emphasizes the significance of design architecture considerations while
selecting the suitable baseline for derivative aircraft approach. So far, most baselines are
chosen based on their proximity to the target requirements but their architectural design
characteristics also have significant effects on the success of their redesign development.
In Chapter 5, the proposed baseline assessment procedure is applied on three candidates:
Airbus A320, Lockheed L-1011 and Boeing B727 based on the formulated design change
requirements. From this experiment, it has been shown that the baseline aircraft selection
that is based solely on the immediacy of its current capabilities to the requirements does
not always result in the best redesign risk conditions. This condition is due to the fact that
the amount of required redesign efforts and the cost and difficulty of the process cannot
be properly reflected by the high-level aircraft performance characteristics.

317
6.1.2 Change Propagation
The planning for engineering changes can benefit from a good understanding on how its
implementation into the product architecture will affect the other parts. Even for similar
aircraft design, there are several ways that the change requirements can be realized. Some
trade-offs are involved in deciding whether the change effects should be transmitted to
the following component in the propagation tree or not. This also implies that the change
impacts, hence the aircraft redesign risks, can be managed by controlling the propagation
path. In order to accomplish this, the essential criteria of engineering change propagation
need to be well-recognized to enable a better prediction of its likelihood and an accurate
assessment of its impacts on the chosen baseline aircraft design. The following research
questions are outlined to address this notion.
Research Question 3 (RQ3): How engineering change effects
propagate from one architecture locality to another?
Research Question 4 (RQ4): What are control parameters of
change propagation?
In section 3.2, relationships between product design elements have been acknowledged as
the principal medium for propagation of change effects [109, 116]. Their identification is
imperative for a better process coordination during product redesign development [257,
273]. In the reference literatures, change role for the components is observed to vary in
different change implementation situations, which correspond to different change effects
propagation paths and different level of change impacts. This leads to the belief that the
paths of change propagation tree can be controlled and managed by assigning the aircraft
components with their preferred change role. This notion is emphasized by the second
hypothesis.
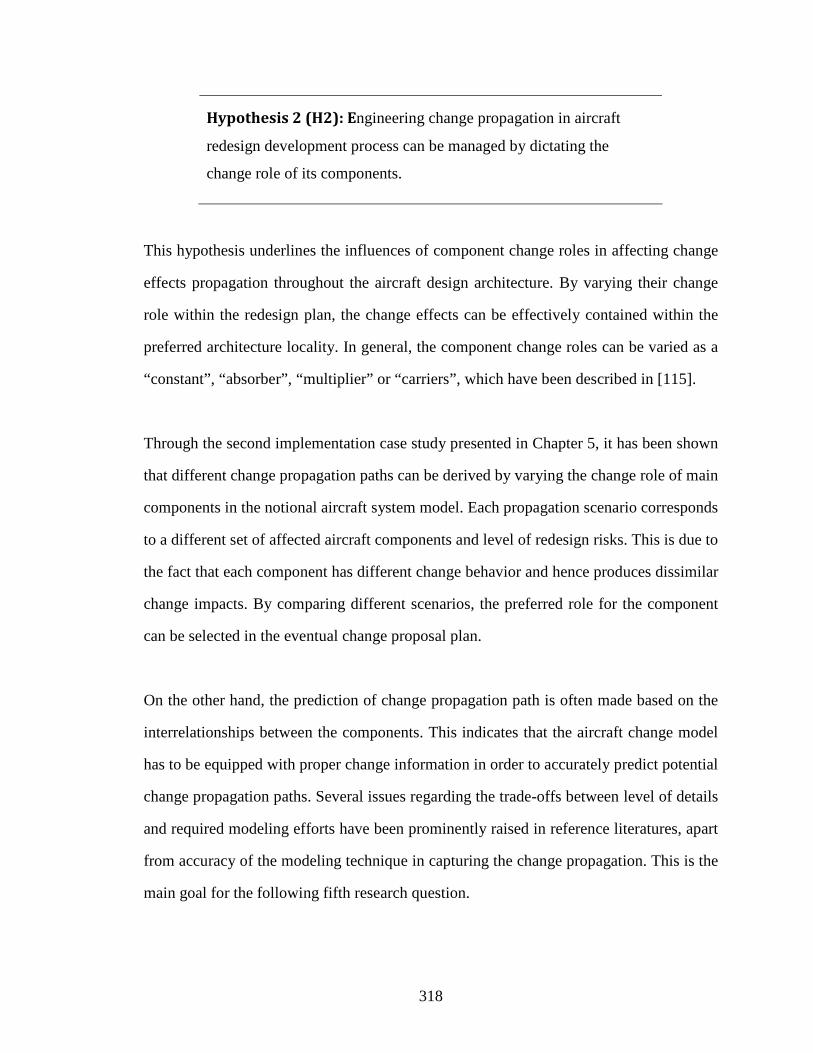
318
Hypothesis 2 (H2): Engineering change propagation in aircraft
redesign development process can be managed by dictating the
change role of its components.
This hypothesis underlines the influences of component change roles in affecting change
effects propagation throughout the aircraft design architecture. By varying their change
role within the redesign plan, the change effects can be effectively contained within the
preferred architecture locality. In general, the component change roles can be varied as a
“constant”, “absorber”, “multiplier” or “carriers”, which have been described in [115].
Through the second implementation case study presented in Chapter 5, it has been shown
that different change propagation paths can be derived by varying the change role of main
components in the notional aircraft system model. Each propagation scenario corresponds
to a different set of affected aircraft components and level of redesign risks. This is due to
the fact that each component has different change behavior and hence produces dissimilar
change impacts. By comparing different scenarios, the preferred role for the component
can be selected in the eventual change proposal plan.
On the other hand, the prediction of change propagation path is often made based on the
interrelationships between the components. This indicates that the aircraft change model
has to be equipped with proper change information in order to accurately predict potential
change propagation paths. Several issues regarding the trade-offs between level of details
and required modeling efforts have been prominently raised in reference literatures, apart
from accuracy of the modeling technique in capturing the change propagation. This is the
main goal for the following fifth research question.

319
Research Question 5 (RQ5): How to properly model the aircraft
system to track potential change propagation?
Based on literature review in section 3.2, engineering change effects are transmitted from
one component to another according to their type of interrelationship and level of design
change tolerance. Engineering change effects can propagate from one component to the
other within the product architecture if and only if there is an interconnection between
them [174]. Moreover, if the propagated change effects fall within the component design
tolerance, it can absorb them without requiring any modification. These conditions need
to be captured by the aircraft change model through proper definition of its parameters.
Although many change modeling techniques recognize this need, they do not formally
employ a standard taxonomy. This leads to unnecessary information being included into
the model and valuable modeling and computational efforts become wasted. A standard
modeling guideline is required to control the change model complexity without reducing
its competency to predict potential change propagation paths. This notion is reflected in
the following third hypothesis.
Hypothesis 3 (H3): Potential change propagation tree within an
aircraft design can be predicted by using the taxonomy of system
element interactions and the level of its component’s change tolerance.
In section 3.5.2, the taxonomy of system element interactions proposed by Pimmler and
Eppinger has been considered as the best modeling guideline to capture the prediction of
change propagation based on type of component interconnections. Its application with the
information of change tolerance level is found to be the best foundation in balancing the

320
details and modeling efforts for the aircraft change model without depreciating its ability
to accurately predict potential change propagation paths.
Based on the notional aircraft redesign case study in Chapter 5, it has been shown that the
predicted change propagation paths using the taxonomy of system element interactions
and the level of component’s change tolerance is as good as those made by several other
available change modeling, if not better, but with considerably less modeling efforts.
6.1.3 Change Impact Analysis
From the emphasis of many available standards in product manufacturing industries, it
can be inferred that the most critical part of change process is its impact evaluation [176].
One of the main difficulties in redesigning a product is to capture its undesirable side
effects [247], which often do not only affect the targeted properties but also other product
characteristics [314]. To decide whether a proposed change implementation plan is
acceptable, its system-wide effects including the required efforts for planning, scheduling
and resourcing the redesign development have to be estimated [152]. It is important to
have the overall problem outlook while making strategic redesign planning decisions as
the change effects for product sub-areas might be connected to each other [334]. The
following research questions are outlined to address this issue.
Research Question 6 (RQ6): What are characteristics of aircraft
and its development process that can be affected by engineering
changes?
Research Question 7 (RQ7): How to sufficiently measure change
impacts on these characteristics?

321
Research Question 8 (RQ8): How to manage overall aircraft
redesign risks?
It has been established in reference literatures that engineering changes affect not only
the aircraft architecture but also its development process characteristics. It is imperative
for designers to be able to distinguish all redesign trade-offs during their decision-making
process, especially those with regards to negative change effects. In section 2.1.1, the
utmost value for aircraft manufacturers in considering redesign approach is the capability
to produce derivative aircraft design that satisfies the new requirements with a cheaper
and shorter development process than it will take them to produce a new original aircraft.
Although this can also lead to sub-optimal derivative designs, most redesign decisions are
often tailored to the estimated risks based on redesign development costs and amount of
reworks [116]. In view of this, redesign risks can be related to the affected components
and the cumulative handling time, cost and efforts that is required for their modification
[167]. This is related back to the management of change propagation paths, which can be
controlled in order to manage the overall aircraft redesign risk. The following hypothesis
avows this perception.
Hypothesis 4 (H4): Associated risks of aircraft redesign
development process can be controlled by managing change
propagation paths.
As discussed before, different change propagation paths can have different set of affected
components and because they usually have different change behaviors, change effects on
different components can vary from each other. This leads to a different level of overall
aircraft redesign risk. As stressed by this hypothesis, the redesign risk can be managed by
selecting change propagation paths with the lowest overall risk.
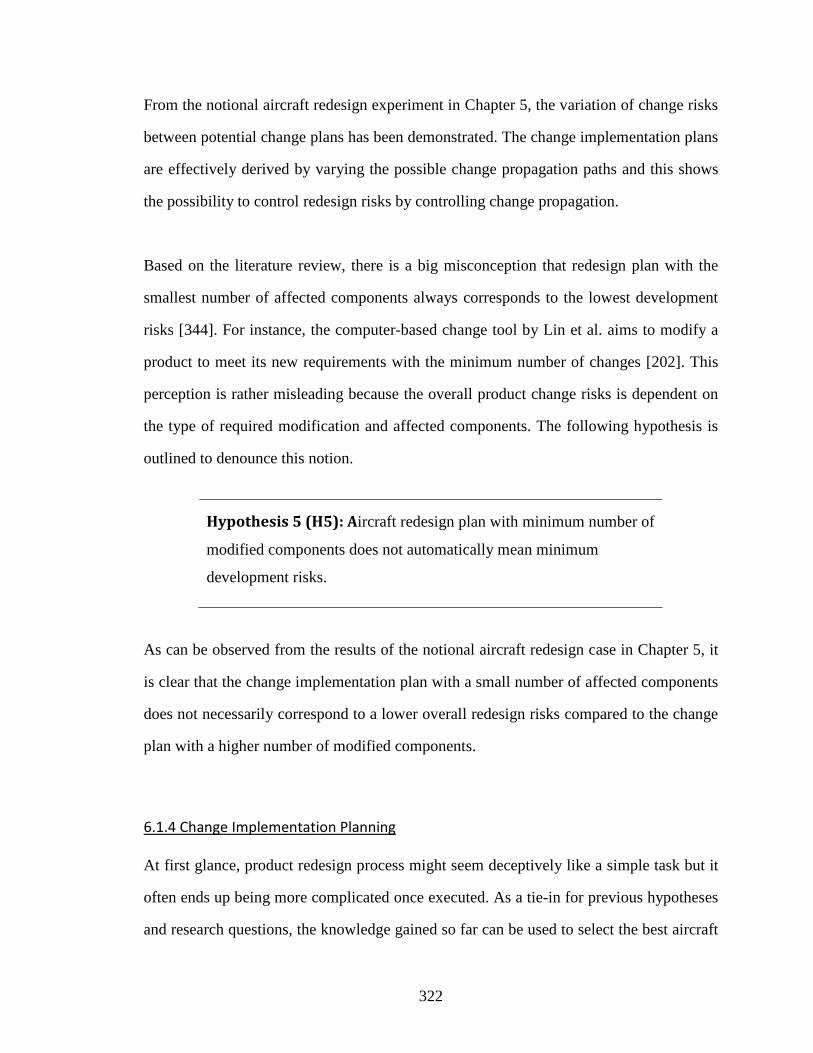
322
From the notional aircraft redesign experiment in Chapter 5, the variation of change risks
between potential change plans has been demonstrated. The change implementation plans
are effectively derived by varying the possible change propagation paths and this shows
the possibility to control redesign risks by controlling change propagation.
Based on the literature review, there is a big misconception that redesign plan with the
smallest number of affected components always corresponds to the lowest development
risks [344]. For instance, the computer-based change tool by Lin et al. aims to modify a
product to meet its new requirements with the minimum number of changes [202]. This
perception is rather misleading because the overall product change risks is dependent on
the type of required modification and affected components. The following hypothesis is
outlined to denounce this notion.
Hypothesis 5 (H5): Aircraft redesign plan with minimum number of
modified components does not automatically mean minimum
development risks.
As can be observed from the results of the notional aircraft redesign case in Chapter 5, it
is clear that the change implementation plan with a small number of affected components
does not necessarily correspond to a lower overall redesign risks compared to the change
plan with a higher number of modified components.
6.1.4 Change Implementation Planning
At first glance, product redesign process might seem deceptively like a simple task but it
often ends up being more complicated once executed. As a tie-in for previous hypotheses
and research questions, the knowledge gained so far can be used to select the best aircraft

323
redesign plan among the possible ones. Based on the elements of change implementation
process, a good redesign strategy is required to guide the product modification planning.
This is the main intention for the following research questions.
Research Question 9 (RQ9): What are important criteria for a good
change implementation plan?
Research Question 10 (RQ10): What are control parameters that
are available in change planning?
Research Question 11 (RQ11): How to generate implementation
plan for required changes?
Research Question 12 (RQ12): How to select the best change
implementation plan among possible alternatives?
Redesign risks can be broken into performance and process risks. Performance risk refers
to the possibility that the aircraft modification will fail to satisfy performance constraints
while process risk covers the likelihood of failure to execute aircraft redesign procedure
within the allocated development constraints. These risks can be used as an indicator for
the goodness of a redesign plan. In addition, many product redesign cases involve several
initiating changes and their effects can be interconnected [67, 174, 218]. Many available
methods or tools cope with this situation by planning for the changes separately in order
to minimize computational efforts. However, it is acknowledged that their effects can be
interrelated [120, 272, 332]. Overlooked interactions between the proposed change plans
for different change requirements can cause undesirable change effects that increase the
redesign risks when they are implemented into the aircraft. This leads to the notion that a

324
lower redesign risk is possible if all initiating changes are concurrently planned, which is
affirmed by the following hypothesis.
Hypothesis 6 (H6): Change implementation risks can be
minimized by simultaneous planning of all initiating changes in
the aircraft redesign process.
In Chapter 5, the projected redesign risks for change plans that are derived concurrently
and separately for all initiating changes have been discussed through the notional aircraft
redesign experiment. As emphasized by this hypothesis, change plans that are constructed
by considering the change requirements simultaneously tend to have a lower likelihood of
requiring iterations and redesign risks.
6.2 Summary of Research Contributions
The main contribution from this thesis research work is the development of the proposed
SPEC methodology, which is expected to improve the efficiency and quality of derivative
aircraft planning process. By being an effective decision-making support for designers, it
helps to guide them in planning for the best possible redesign scenario in accordance to
their company’s capability. It starts with the assessment of baseline candidates on which
the redesign changes will be applied and ends with the selection of the perceptively best
plan on how the modification could be realized into the chosen baseline design.
Another main contribution from this thesis is the formulation of the baseline assessment
procedure. To fill the identified gaps in baseline selection practices, the proposed process
provides a more thorough outlook on suitability of the baseline candidate to undergo the
proposed redesign changes. In addition to the focus on the closeness of performances to

325
the target requirements, it allows designers to gain insights about the risks and difficulty
level associated with the redesign process if the candidate design is indeed chosen to be
the baseline. This is made possible by having the assessment efforts to focus also on the
existing system architecture characteristics, which have a big influence on the flexibility
to accommodate the suggested changes. With the importance of a suitable baseline, this
process helps to reduce the overall complexity and costs of the redesign process.
Furthermore, the definition of change solution space is the third main contribution of this
research. By exploiting the general trend of redesign practices in the product industry, the
proposed procedure enables designers to efficiently construct the available solution space
for their redesign planning process. This allows the full exploration of possible change
plan alternatives without wasting costly computational efforts on analyzing plans that
will be discarded due to known preferences of the designers’ or company’s policy. In
other words, by having the change solution space defined and mapped out, designers can
focus their redesign efforts more efficiently on planning the alternative change plans that
have a higher possibility to be selected.
Last but not least, the fourth contribution from this research is the redesign risk analysis
procedure. While the traditional change analysis often relies heavily on historical data to
measure the level of propagated change impacts and its likelihood, it is suggested that the
analysis is based more on the current change scenario at hand. Instead of relying on the
past data that can mislead the entire analysis conclusion, the assessment is based on SRL
rating scale for the suggested design changes. This is taken to be more representative of
the risks involved in the present redesign task. Furthermore, the impact analysis focuses
on both the process and product, in which the latter aspect is notably missing from many
available change methods and tools. The proposed procedure resolves this situation and
allows designers to have a complete picture of the risks involved for each generated

326
alternative change plan. This aids them in making a better change plan selection and also
increases their understanding of the overall redesign process situation.
6.3 Avenues of Future Works
From one perspective, the work that has been done in this thesis research can be treated
as the beginning of a much larger effort to improve aircraft redesign process, or product
redesign process in general. Within this section, several ideas on how the results from this
study can be further used in future works are shared.
6.3.1 Extension of Example Problems
The sample problems presented in this dissertation are intentionally made simple, as the
main goal here is to demonstrate the capabilities of the proposed SPEC methodology. In
view of that, the application of this method on an actual aircraft redesign problem is seen
as the natural way forward. To accomplish that, the required inputs into the method have
to be established first and among others, these include accurate subsystems model for the
baseline candidates and underlying relationships between aircraft component parameters
and its system-level metrics.
6.3.2 Exploring New Application Territories
Since there are many interesting factors that are acting as the driving sources for the need
of aircraft redesign approach, it is foreseen that this proposed SPEC method can also be
applied with several different objectives instead of a redesign planning support tool. For
instance, newly available or emerging subsystem technologies are among the drivers for
derivative aircraft development but implementing them for certain aircraft components or

327
subsystems is not always a “plug-and-play” matter. Most of the times, implementation of
the new technologies require other system modifications that can also point to other new
technologies. In view of this, the proposed method can be used as a technology planning
support, in which the decision to pursue a new technology can be thoroughly assessed in
regards to its impacts on the current aircraft system design due to integration issues and
identification of other related technologies that are favorable to be simultaneously
pursued for the future development process. Accordingly, the technology implementation
into the aircraft system can be made in the most effective manner without having to wait
for another cycle of technology development for the other required technologies.
Furthermore, because of its generic nature, the proposed SPEC methodology can also be
applied to other product types apart from aircraft system. A slight modification to some
of its procedures might be necessary to better match the characteristics of the various
product redesign processes but it is not expected to be a huge variation from the one
formulated in this study.
6.3.3 Application with Modeling and Simulation Environment
The description of the proposed method indicates that its application can highly benefit
from the use with a modeling and simulation environment. Instead of having a static
evaluation of aircraft performance metrics based on defined RSEs whenever a subsystem
parameter is modified as a result of the proposed redesign changes (as demonstrated in
the second implementation case study), a more interactive decision-making environment
can be made available if the programmed SPEC support tool is executed in a real-time
connection to the aircraft performance analysis tool. This situation is expected to allow a
better understanding of the change situation and perhaps improve the screening procedure
of the potential change alternative plans for a more efficient change planning process.

328
6.4 Personal Note
It should be noted that more than half of the efforts involved in realizing this thesis study
have been focused on the development of the Excel-based SPEC support tool. Despite the
fact that this support tool is not the main objective of this research, it is nevertheless the
most essential element that enables the successful demonstration of this proposed SPEC
methodology. The reason for this situation is the high level of aircraft design complexity.
Although the components for each of its subsystem models have been limited to only 30,
the resultant subsystems interrelationship DSM is still very large to be assessed manually.
In this case, considering each subsystem has 30 components, the size of overall aircraft
DSM model is 1020 x 1020. With such big matrix, the model construction and the change
effects propagation tracking are not an easy task to be manually executed. On one hand,
this experience further solidifies the belief of the existing urgent need for a better product
redesign method and tool to aid designers in planning for changes. On the other hand, the
development of SPEC support tool has been limited by the time constraints and the focus
on aircraft redesign problem. This means a lot more improvements can be made to better
its future execution and application.
Another part of this research that is worth mentioning is the interesting side fields of
study that keep presenting themselves throughout this thesis research. Some of them have
been incorporated into this study to some extent but due to the high interest of having a
manageable research size and scope, several of these areas of study have to be left behind
for future exploration. For instance, a more elegant methodology to identify and resolve
the potential change propagation conflict between different initiating change paths is an
exemplary aspect of product redesign study that is not included. Another example is the
redesign trade-offs during product requirements analysis to assist designers in selecting
the best possible system modification to satisfy the requirements. The identification of

329
many interesting areas in the product redesign study that have yet to be fully explored
supports the notion put forth by Jarratt [174] and Wright [344] that this product redesign
field has more to be developed unlike the original product development.

330
APPENDIX A
FLIGHT ROLL CONTROL MODELS FOR CASE STUDY 1
A.1 Primary Roll Control Mechanism on Airbus A320
Primary flight roll control on Airbus A320 is achieved through the deflection of available
aileron surface on each wing. These control surfaces are actuated by electro-hydraulic
servojacks and their position is determined through the processed signals from sidestick
controllers by elevator and aileron computers. Overall, the schematic of this roll control
mechanism is depicted in Figure A.1.
Figure A.1: A320 Roll Control System [338]
The corresponding DSM system change model for this primary roll control mechanism of
Airbus A320 aircraft is constructed through physical decomposition process of the above
system. This is presented in Figure A.2, which is output from Excel-based SPEC support
tool. It should be noted that the modeling process is only focused on primary roll control,
which involves position control of aileron surfaces.
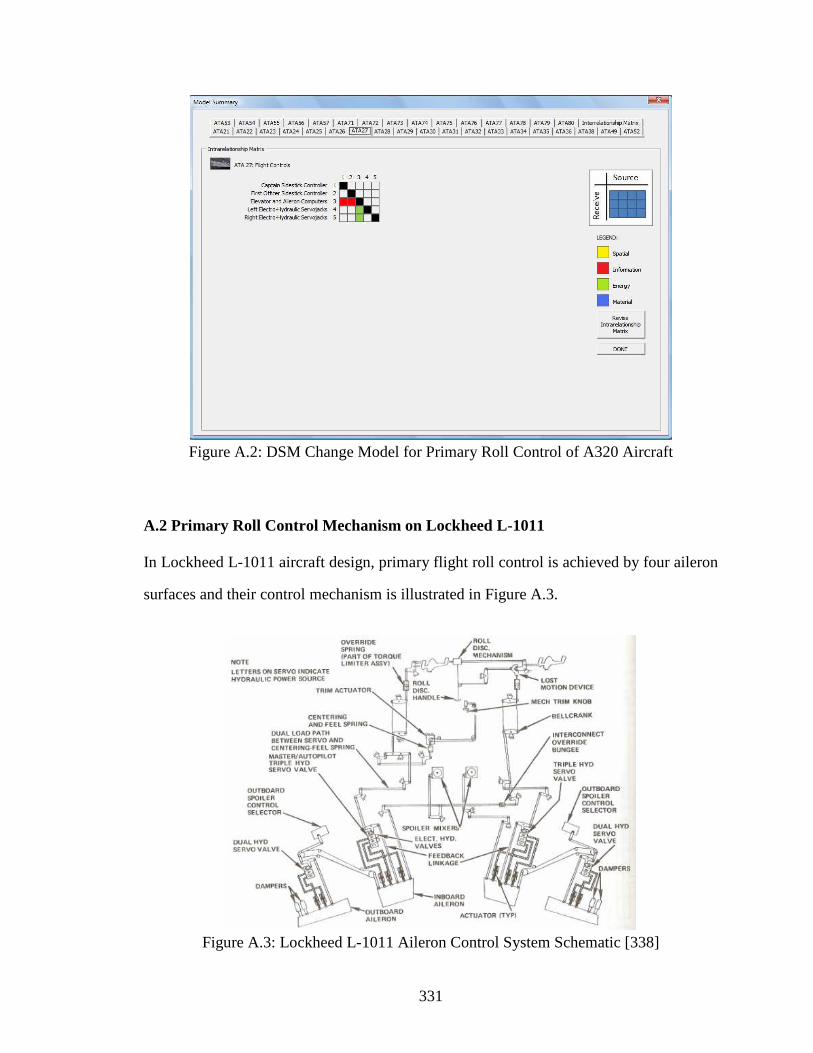
331
Figure A.2: DSM Change Model for Primary Roll Control of A320 Aircraft
A.2 Primary Roll Control Mechanism on Lockheed L-1011
In Lockheed L-1011 aircraft design, primary flight roll control is achieved by four aileron
surfaces and their control mechanism is illustrated in Figure A.3.
Figure A.3: Lockheed L-1011 Aileron Control System Schematic [338]

332
In short, control inputs are supplied by the captain or first officer from either one of the
control wheels. These inputs are passed through a combination of cables and pushrods to
master aileron servo, which is located at left inboard aileron. Through mechanical links,
other aileron servos receive their respective positioning inputs from the action of master
servo.
The corresponding DSM system change model for primary roll control mechanism of the
Lockheed L-1011 aircraft is constructed through physical decomposition process of the
above system. This is presented in Figure A.4, which is output from Excel-based SPEC
support tool. It should be noted that the modeling process is only focused on primary roll
control, which involves position control of the aileron surfaces.
Figure A.4: DSM Change Model for Primary Roll Control of L-1011 Aircraft

333
A.3 Primary Roll Control Mechanism on Boeing B727
Primary roll control of Boeing B727 aircraft is achieved by the positioning of four aileron
surfaces, two for each wing. Control inputs are initiated through either one of the control
wheels, which are then mechanically passed to aileron power control unit. In summation,
this roll control scheme is depicted in Figure A.5.
Figure A.5: Roll Control Aileron System on Boeing B727 [338]
The corresponding DSM system change model for primary roll control mechanism of the
Boeing B727 aircraft is constructed through physical decomposition of the above system.
This is depicted in Figure A.6, which is output from the Excel-based SPEC support tool.
Once again, note that the modeling process is only focused on primary roll control, which
involves the position control of aileron surfaces.
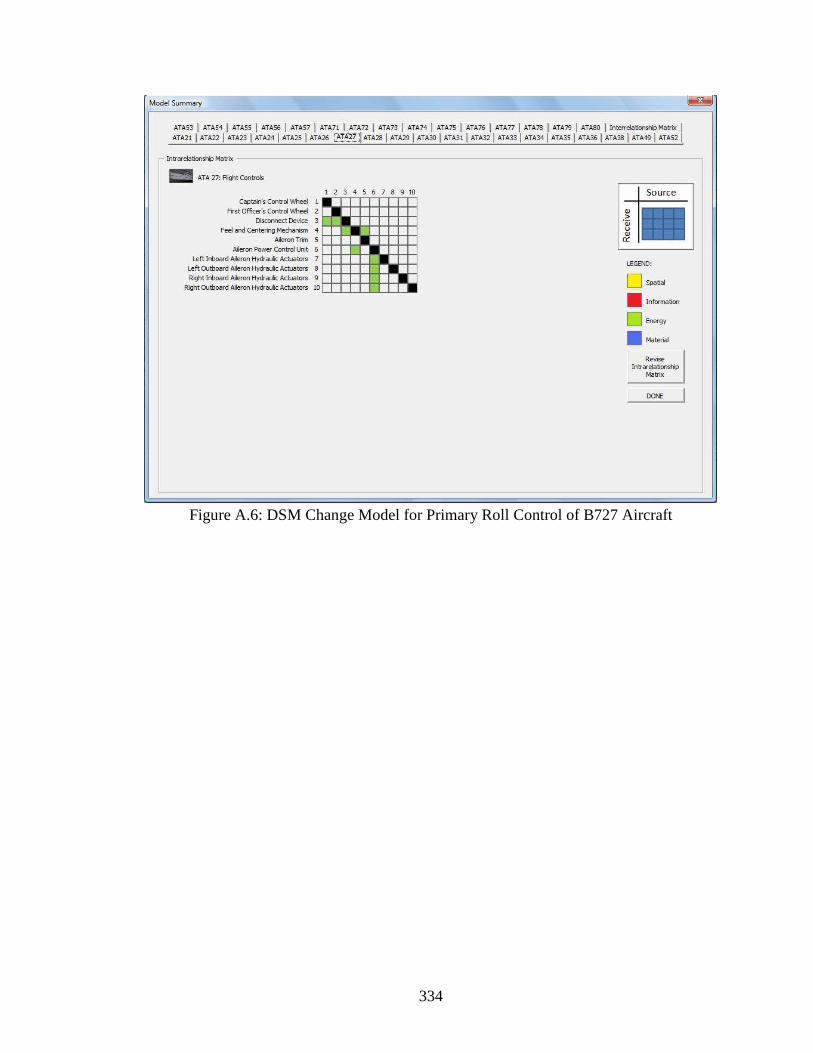
334
Figure A.6: DSM Change Model for Primary Roll Control of B727 Aircraft

335
APPENDIX B
AIRCRAFT SUBSYSTEMS MODEL FOR CASE STUDY 2
Figure B.1: DSM Model for ATA21 Subsystem of the Notional Aircraft System
Figure B.2: DSM Model for ATA22 Subsystem of the Notional Aircraft System

336
Figure B.3: DSM Model for ATA23 Subsystem of the Notional Aircraft System
Figure B.4: DSM Model for ATA24 Subsystem of the Notional Aircraft System
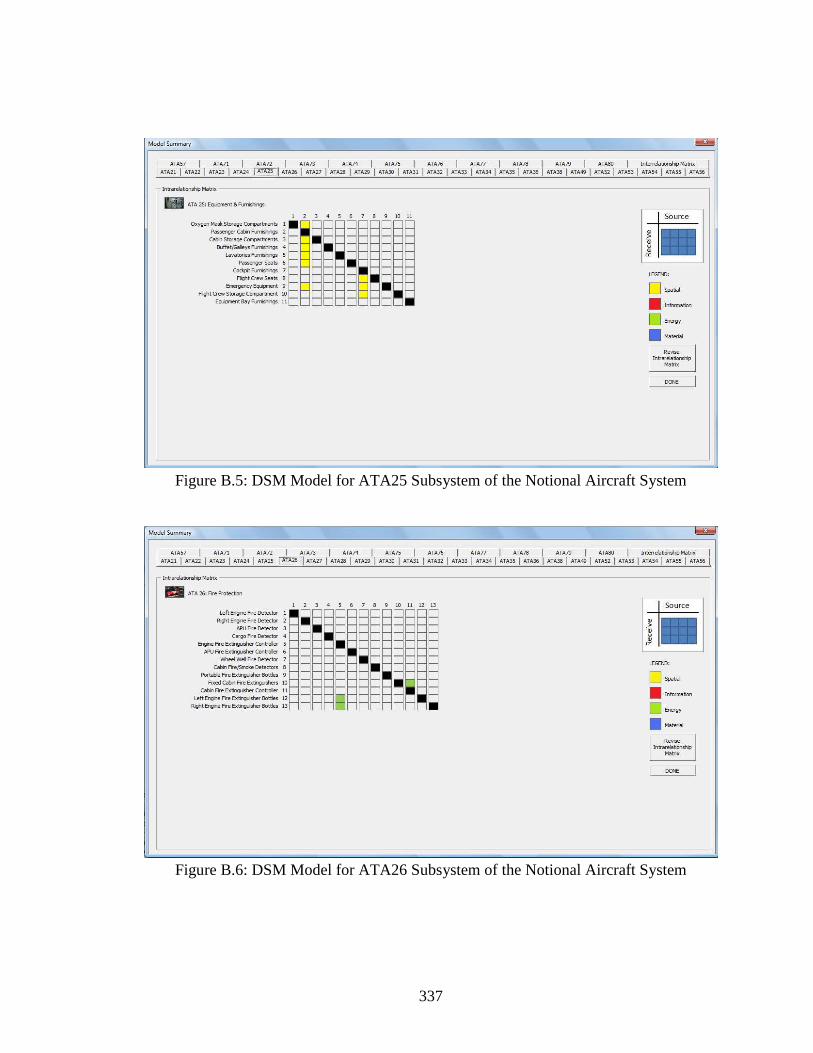
337
Figure B.5: DSM Model for ATA25 Subsystem of the Notional Aircraft System
Figure B.6: DSM Model for ATA26 Subsystem of the Notional Aircraft System

338
Figure B.7: DSM Model for ATA27 Subsystem of the Notional Aircraft System
Figure B.8: DSM Model for ATA26 Subsystem of the Notional Aircraft System

339
Figure B.9: DSM Model for ATA29 Subsystem of the Notional Aircraft System
Figure B.10: DSM Model for ATA30 Subsystem of the Notional Aircraft System

340
Figure B.11: DSM Model for ATA31 Subsystem of the Notional Aircraft System
Figure B.12: DSM Model for ATA32 Subsystem of the Notional Aircraft System

341
Figure B.13: DSM Model for ATA33 Subsystem of the Notional Aircraft System
Figure B.14: DSM Model for ATA34 Subsystem of the Notional Aircraft System

342
Figure B.15: DSM Model for ATA35 Subsystem of the Notional Aircraft System
Figure B.16: DSM Model for ATA36 Subsystem of the Notional Aircraft System

343
Figure B.17: DSM Model for ATA38 Subsystem of the Notional Aircraft System
Figure B.18: DSM Model for ATA49 Subsystem of the Notional Aircraft System

344
Figure B.19: DSM Model for ATA52 Subsystem of the Notional Aircraft System
Figure B.20: DSM Model for ATA53 Subsystem of the Notional Aircraft System

345
Figure B.21: DSM Model for ATA54 Subsystem of the Notional Aircraft System
Figure B.22: DSM Model for ATA55 Subsystem of the Notional Aircraft System

346
Figure B.23: DSM Model for ATA56 Subsystem of the Notional Aircraft System
Figure B.24: DSM Model for ATA57 Subsystem of the Notional Aircraft System
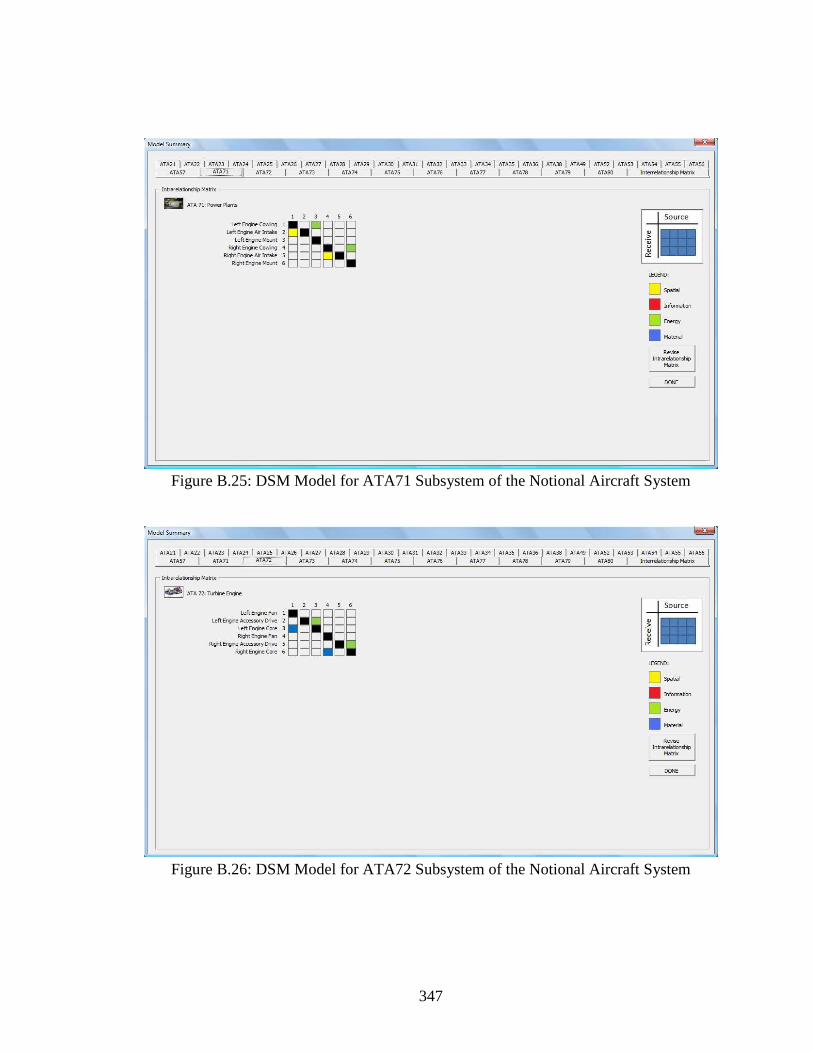
347
Figure B.25: DSM Model for ATA71 Subsystem of the Notional Aircraft System
Figure B.26: DSM Model for ATA72 Subsystem of the Notional Aircraft System

348
Figure B.27: DSM Model for ATA73 Subsystem of the Notional Aircraft System
Figure B.28: DSM Model for ATA74 Subsystem of the Notional Aircraft System

349
Figure B.29: DSM Model for ATA75 Subsystem of the Notional Aircraft System
Figure B.30: DSM Model for ATA76 Subsystem of the Notional Aircraft System

350
Figure B.31: DSM Model for ATA77 Subsystem of the Notional Aircraft System
Figure B.32: DSM Model for ATA78 Subsystem of the Notional Aircraft System
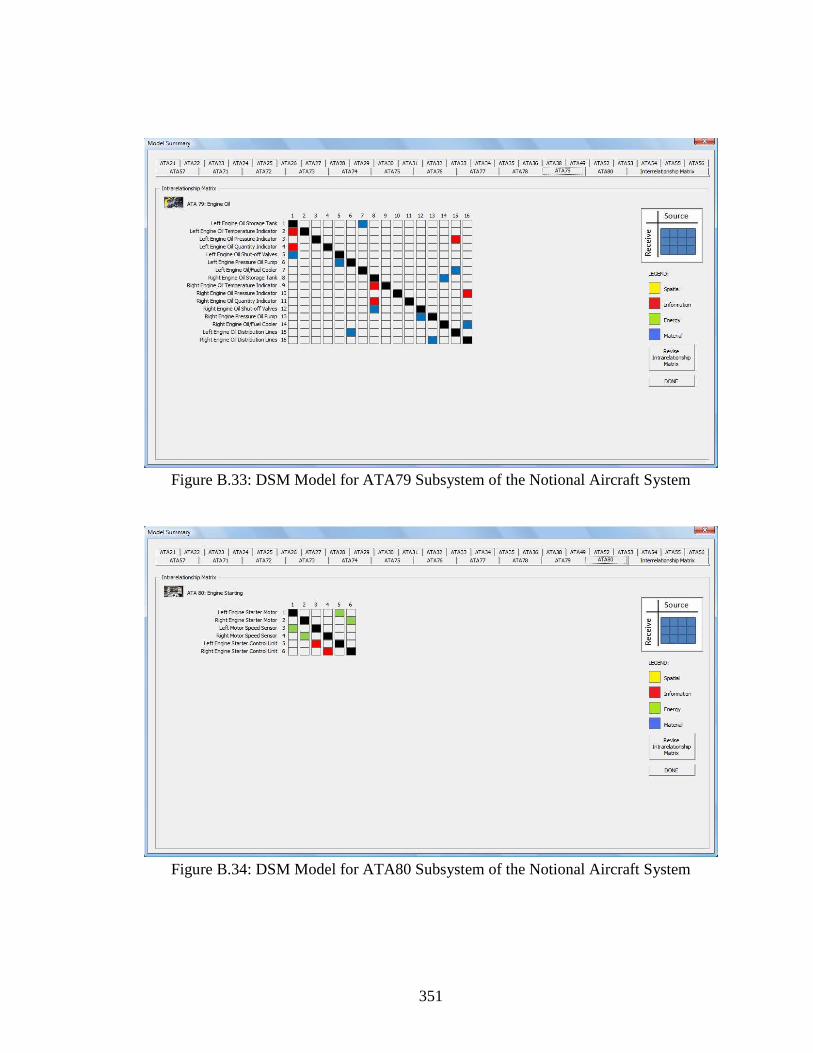
351
Figure B.33: DSM Model for ATA79 Subsystem of the Notional Aircraft System
Figure B.34: DSM Model for ATA80 Subsystem of the Notional Aircraft System

352
APPENDIX C
APPROXIMATED SUBSYSTEM-SYSTEM INTERRELATIONSHIP
MODEL FOR CASE STUDY 2
The aircraft subsystem-system interrelationships are approximated through application of
Flight Optimization System (FLOPS), which is a public domain synthesis and sizing tool
for aircraft system design. For additional information, this FLOPS tool is developed by
NASA Langley Research Center and is taken as a fairly robust modeling and simulation
code for subsonic commercial transport aircraft types [191]. However, it is good to note
that FLOPS is not developed for engineering change analysis and its design parameters
are mostly not allocated at the subsystem components level.
For the sample demonstration case study, the interested aircraft system level performance
metric to be considered is takeoff gross weight of the notional aircraft system, which is a
formulated driving redesign requirement. The input aircraft system model into FLOPS is
tailored to design characteristics of Boeing B737-800 aircraft that has been validated by
the EDS design team in ASDL. This is taken to be an appropriate model to estimate real
performance of the notional aircraft system design since its subsystem models have been
mostly constructed based on Boeing B737 design variants.
As can be implied, there are too many subsystem parameters that can be used to construct
this relationship. Nevertheless, most design parameters in FLOPS that can be specifically
used for a particular aircraft subsystem have been the ones regarding their weights. These

353
available weight correction factors can be used to induce the change effects on the overall
aircraft system weight. To further simplify the construction of system-subsystem weight
relationship, the weight parameters have been screened down to the ones that are taken to
be most likely affected by the initiating design changes. The list of considered subsystem
parameters is tabulated in Table C.1.
Table C.1: Considered Subsystem Weight Parameters in FLOPS
Design Parameters Description [230]
FRNA Total weight of nacelles and/or air
induction system
WPMSC Weight of miscellaneous propulsion
systems such as engine controls, starter and wiring
FRSC Surface controls weight WFURN Furnishings group weight WHYD Hydraulics group weight
WAVONC Avionics group weight WELEC Electrical group weight WFSYS Weight of fuel system WAPU Auxiliary power unit weight WIN Instrument group weight WAC Air conditioning group weight WOIL Engine oil weight
Effects of these 12 design parameters on overall aircraft system gross weight are studied
through set-up experimental cases based on design of experiments (DoE) principle. Using
MINITAB, fractional factorial experimental design of 128 runs (212-5) is constructed and
each parameter is taken as 2-level with values of 0.75 and 1.25 for the lower and upper
level, respectively. Because these parameters act as a weighting factor to the internally
computed subsystem weights in FLOPS, it is known that they have a linear relationship
with the overall aircraft system. The flight range for the experiments is set to 2950 nmi,

354
which is taken as the desired range capability that will make the notional aircraft system
derivative more competitive in comparison to its currently “estimated” 2700 nmi in Table
86. Based on the experimental results, the following simple stepwise regression process is
done in MINITAB.
Stepwise Regression: GW versus FRNA, WPMSC, ... Alpha-to-Enter: 0.15 Alpha-to-Remove: 0.15 Response is GW on 12 predictors, with N = 128 Step 1 2 3 4 5 6 Constant 166263 163072 160364 157685 155314 152961 WFURN 25317 25317 25317 25317 25317 25317 T-Value 42.54 48.22 54.14 62.88 73.89 93.96 P-Value 0.000 0.000 0.000 0.000 0.000 0.000 WELEC 3190 3190 3190 3190 3190 T-Value 6.08 6.82 7.92 9.31 11.84 P-Value 0.000 0.000 0.000 0.000 0.000 FRSC 2708 2708 2708 2708 T-Value 5.79 6.73 7.90 10.05 P-Value 0.000 0.000 0.000 0.000 WAC 2679 2679 2679 T-Value 6.65 7.82 9.94 P-Value 0.000 0.000 0.000 FRNA 2371 2371 T-Value 6.92 8.80 P-Value 0.000 0.000 WAVONC 2353 T-Value 8.73 P-Value 0.000 S 1683 1485 1323 1139 969 762 R-Sq 93.49 94.97 96.04 97.09 97.91 98.72 R-Sq(adj) 93.44 94.89 95.95 97.00 97.83 98.66 Mallows C-p 1477998.5 1140906.8 898027.9 660285.4 474183.3 290810.1 PRESS 368471906 289009159 231174294 172756394 126115329 78640087 R-Sq(pred) 93.28 94.73 95.79 96.85 97.70 98.57

355
Step 7 8 9 10 11 12 Constant 151185 149489 148301 147484 146691 146487 WFURN 25317.0 25317.0 25317.0 25317.0 25317.0 25317.0 T-Value 116.88 166.49 237.39 333.73 1286.22 4607.34 P-Value 0.000 0.000 0.000 0.000 0.000 0.000 WELEC 3190.3 3190.3 3190.3 3190.3 3190.3 3190.3 T-Value 14.73 20.98 29.92 42.05 162.08 580.60 P-Value 0.000 0.000 0.000 0.000 0.000 0.000 FRSC 2708.1 2708.1 2708.1 2708.1 2708.1 2708.1 T-Value 12.50 17.81 25.39 35.70 137.58 492.83 P-Value 0.000 0.000 0.000 0.000 0.000 0.000 WAC 2679.3 2679.3 2679.3 2679.3 2679.3 2679.3 T-Value 12.37 17.62 25.12 35.32 136.12 487.59 P-Value 0.000 0.000 0.000 0.000 0.000 0.000 FRNA 2370.5 2370.5 2370.5 2370.5 2370.5 2370.5 T-Value 10.94 15.59 22.23 31.25 120.43 431.40 P-Value 0.000 0.000 0.000 0.000 0.000 0.000 WAVONC 2353.1 2353.1 2353.1 2353.1 2353.1 2353.1 T-Value 10.86 15.47 22.06 31.02 119.55 428.22 P-Value 0.000 0.000 0.000 0.000 0.000 0.000 WHYD 1775.9 1775.9 1775.9 1775.9 1775.9 1775.9 T-Value 8.20 11.68 16.65 23.41 90.22 323.19 P-Value 0.000 0.000 0.000 0.000 0.000 0.000 WAPU 1696.7 1696.7 1696.7 1696.7 1696.7 T-Value 11.16 15.91 22.37 86.20 308.78 P-Value 0.000 0.000 0.000 0.000 0.000 WFSYS 1187.2 1187.2 1187.2 1187.2 T-Value 11.13 15.65 60.32 216.05 P-Value 0.000 0.000 0.000 0.000 WPMSC 817.8 817.8 817.8 T-Value 10.78 41.55 148.82 P-Value 0.000 0.000 0.000 WIN 792.7 792.7 T-Value 40.27 144.26 P-Value 0.000 0.000 WOIL 203.6 T-Value 37.06 P-Value 0.000 S 613 430 302 215 55.7 15.5 R-Sq 99.18 99.60 99.80 99.90 99.99 100.00 R-Sq(adj) 99.13 99.57 99.79 99.89 99.99 100.00 Mallows C-p 186359.4 91017.5 44340.1 22193.9 1384.4 13.0 PRESS 51248934 25467751 12633526 6447126 437769 34414.2 R-Sq(pred) 99.07 99.54 99.77 99.88 99.99 100.00
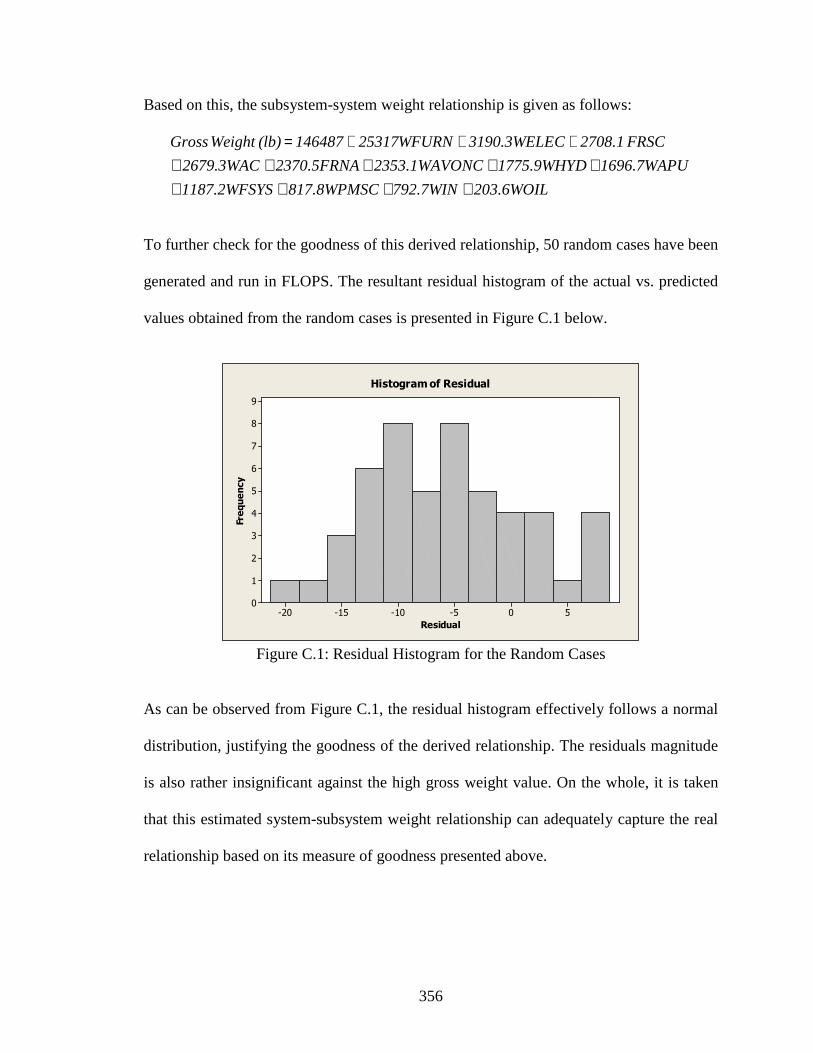
356
Based on this, the subsystem-system weight relationship is given as follows:
203.6WOIL792.7WIN817.8WPMSCS1187.2WFSY
1696.7WAPU1775.9WHYDNC2353.1WAVO 2370.5FRNA 2679.3WAC
FRSC 2708.1C3190.3WELEWFURN25317146487 (lb) Weight Gross
+++++++++
+++=
To further check for the goodness of this derived relationship, 50 random cases have been
generated and run in FLOPS. The resultant residual histogram of the actual vs. predicted
values obtained from the random cases is presented in Figure C.1 below.
Residual
Frequency
50-5-10-15-20
9
8
7
6
5
4
3
2
1
0
Histogram of Residual
Figure C.1: Residual Histogram for the Random Cases
As can be observed from Figure C.1, the residual histogram effectively follows a normal
distribution, justifying the goodness of the derived relationship. The residuals magnitude
is also rather insignificant against the high gross weight value. On the whole, it is taken
that this estimated system-subsystem weight relationship can adequately capture the real
relationship based on its measure of goodness presented above.

357
REFERENCES
[1] Airbus A320 Family. [cited December 2008]; http://en.wikipedia.org/wiki/Aibus_A320
[2] ATA Official Website. [cited September 2005]; http://www.airlines.org [3] Boeing 727. [cited December 2008]; http://en.wikipedia.org/wiki/Boeing_727 [4] Boeing 737. [cited; http://en.wikipedia.org/wiki/Boeing_737 [5] Boeing 757. [cited December 2008]; http://en.wikipedia.org/wiki/Boeing_757 [6] Bombardier C-Series. [cited December 2008];
http://en.wikipedia.org/wiki/Bombardier_CSeries [7] Emirates Sweeps Top Three In-Flight Entertainment Awards. Airline Industry
September 25, 2007 [cited December 2008]; www.forimmediaterelease.net/pm/672.html
[8] Federal Aviation Administration Joint Aircraft System/Component Code. [cited
September 2005]; http://av-info.faa.gov/sdrx/documents/JASC_Code.pdf] [9] Lockheed L-1011. [cited December 2008];
http://en.wikipedia.org/wiki/Lockheed_L-1011 [10] "Configuration Control - Engineering Changes, Derivations and Waivers (MIL-
STD-480B)." 1988. [11] "STEP Part 11," in EXPRESS Language. ISO-10303-11. 1992. [12] "Successful Product Development (Technical Report)." 1994, Department of
Trade and Industry (DTI), HMSO. [13] "Defense Standard 00-56 (Part 1): Safety Management Requirements for Defense
Systems." 2. 1996, UK Ministry of Defense: Glasgow, UK. [14] "DoD Guide to Integrated Product and Process Development (Version 1.0)."
1996, Office of the Under Secretary of Defense. [15] "Framework for the Application of Systems Engineering in the Commercial
Aircraft Domain," Systems Engineering Applications Technical Committee. 2000, International Council on Systems Engineering (INCOSE).
[16] "European Aeronautics: A Vision for 2020," in Report of the Group of
Personalities. 2001.

358
[17] Jane's Aircraft Component Manufacturers, ed. P. Butterworth-Hayes. 2002,
Virginia, USA: Jane's Information Group Limited. [18] "Mandatory Procedures for Major Defense Acquisition Programs (MDAPS) and
Major Automated Information Systems (MAIS) Acquisition Programs." DoD 5000.2-R. 2002.
[19] "Recycling-Oriented Product Development," in VDI 2243. 2002, Beuth Verlag:
Berlin, Germany. [20] "The Long March of the A320 Family," in Interavia Business and Technology.
673. 2003. [21] "Airbus Paves Way for its Giant Contender: Competition in a Volatile Industry,"
in Strategic Direction. 5. 2004. [22] Aircraft System Maintenance, ed. D. Hurst. 2004, Weyers Cave, Virginia: Avotek
Information Resources. [23] "DoD Directive 5000.1." 2005, Department of Defense. [24] "Airbus Boss Contrite over A380 Delays," in Professional Engineering. 2006. [25] "Change Management: Best Practices White Paper." Document ID: 22852. 2006,
Cisco Systems Inc. [26] "What Does the Passenger Really Want?," in Interavia Business and Technology.
684. 2006. [27] "Will Size Matter for Boeing and Airbus?," in Strategic Direction. 6. 2006. [28] "B787 Delays Continue to Favor A350," in Aircraft Value News. 2008 p. 7. [29] "Financial Results, New Deals and Reports from Every Corner of the Globe:
Third 787 Delays Pushes First Flight to Autumn," in Air Transport World. May 2008, Penton Publishing.
[30] Acar, B.S., Benedetto-Neto, H. and Wright, I.C. "Design Change: Problem or
Opportunity." in Engineering Design Conference. 1998. London, UK. [31] Acha, V., Brusoni, S. and Prencipe, A., "Exploring the Miracle: The Knowledge
Base in the Aeronautics Industry," in Deliverable WP2.2 of the Technological Knowledge and Localized Learning (TELL) Project. HPSE-CT2001-00051. 2001.

359
[32] Ahmad, R., Yuqing, F., Chaudhry, I. and Hamidullah. "Collaborative Product Development in Extended Enterprise." in 9th International Multitopic Conference. 2005. Karachi, Pakistan.
[33] Airbus, "Requirements for System and Equipment Development." AP2288. 2003,
Airbus Industrie. [34] Alexander, C., Notes on the Synthesis of Form. 1964, Cambridge, MA: Harvard
University Press. [35] Altshuller, G.S., Creativity as an Exact Science. 1988: Gordon & Breach. [36] Andersson, F., Sutinen, K. and Malmqvist, J., "Product Model for Requirements
and Design Concept Management: Representing Design Alternatives and Rationale," in Annual International Symposium of the International Council on Systems Engineering (INCOSE). 2003: Washington, USA.
[37] Andersson, J., Krus, P. and Nilsson, K., "Optimization as a Support for Selection
and Design of Aircraft Actuation Systems," in 7th AIAA/USAF/NASA/ISSMO Symposium on Multidisciplinary Analysis and Optimization. 1998: St. Louis, MO, USA.
[38] Arango, G., Schoen, E. and Pettengill, R. "Design as Evolution and Reuse." in
2nd International Workshop on Software Reusability. 1993. Lucca, Italy. [39] Arnold, R.S. and Bohner, S.A. "Impact Analysis - Towards a Framework for
Comparison." in Proceedings of Conference on Software Maintenance. 1993. Montreal, Canada.
[40] Aurich, J.C. and RoBing, M., "Engineering Change Impact Analysis in
Production Using VR", in Digital Enterprise Technology. 2007, Springer US. [41] Badri, L., Badri, M. and St-Yves, D., "Supporting Predictive Change Impact
Analysis: A Control Call Graph Based Technique," in 12th Asia-Pacific Software Engineering Conference (APSEC). 2005: Taipei, Taiwan.
[42] Badrocke, M. and Gunston, B., Boeing Aircraft Cutaways: The History of Boeing
Aircraft Company. 1998, Botley, Oxford: Osprey Publishing. [43] Bar-Yam, Y., "When Systems Engineering Fails - Toward Complex System
Engineering," in IEEE International Conference on Systems, Man and Cybernetics. 2003: Washington DC, USA.
[44] Bateman, L.F., "System Design Trends in Commercial Transport Aircraft -
Evolution or Revolution?," in AIAA/AHS/ASEE Aircraft Systems, Design and Technology Meeting. 1986: Ohio, USA.

360
[45] Beaumont, A., "IFE - A Marketing Differentiator and Branding for the Airlines,"
in Aircraft Interiors Expo Asia. 2006: Hong Kong. [46] Bell, J., "Hierarchy and Function," in SoftFMEA Document. SD/TR/FR/12. 2004. [47] Bhuiyan, N., Gatard, G. and Thompson, V., "Engineering Change Request
Management in a New Product Development Process," European Journal of Innovation Management, 2006. 9(1): p. 5-19.
[48] Blackburn, J.D., "New Product Development: The New Time Wars", in Time-
Based Competition. 1991, Business One Irwin: Homewood, IL. [49] Blanding, D., "Subsystem Design and Integration for the More Electric Aircraft,"
in 5th International Energy Conversion Engineering Conference and Exhibit (IECEC). 2007: St. Louis, MO, USA.
[50] Bock, G.E., "Dassault Aviation: Using A Collaborative Workspace to Design and
Develop the Falcon 7x Business Jet." 2004, Patricia Seybold Group. [51] Boone, P., Boeing 737: Management Reference Guide. 2005, Belgium. [52] Boothroyd, G. and Dewhurst, P., Design for Assembly: A Designer's Handbook.
1983, Wakefield, Rhode Island: Boothroyd and Dewhurst Inc. [53] Botten, S.L., Whitley, C.R. and King, A.D., "Flight Control Actuation
Technology for Next-Generation All-Electric Aircraft," Technology Review Journal (Millennium Issue), 2000. Fall/Winter: p. 55-68.
[54] Boznak, R.G., Competitive Product Development. 1993: Business One
Orwin/Quality Press. [55] Brady, C., The Boeing 737 Technical Guide. 46 ed. 2008, UK: Tech Pilot
Services Ltd. [56] Brooks, B. and Schofield, N., "Time-to-Market: Time Equals Money," World
Class Design to Manufacture, 1995. 143(5). [57] Brown, C.L. and Lattin, J.M., "Investigating the Relationship between Time in
Market and Pioneering Advantage," Management Science, 1994. 40(10): p. 1361-1369.
[58] Brown, S.F., "How to Build A Really, Really, Really Big Plane," in Fortune. 5.
2001.

361
[59] Browning, T.R., "Applying the Design Structure Matrix to System Decomposition and Integration Problems: A Review and New Directions," IEEE Transactions on Engineering Management, 2001. 48(3): p. 292-306.
[60] Browning, T.R. and Eppinger, S.D., "Modeling Impacts of Process Architecture
on Cost and Schedule Risk in Product Development," IEEE Transactions on Engineering Management, 2002. 49(4): p. 428-442.
[61] Buonanno, M.A. and Mavris, D.N., "Aerospace Vehicle Concept Selection Using
Parallel, Variable Fidelity Genetic Algorithm," in 10th AIAA/ISSMO Multidisciplinary Analysis and Optimization Conference. 2004: Albany, NY.
[62] Buonanno, M.A. and Mavris, D.N., "A Method for Aircraft Concept Selection
using Multicriteria Interactive Genetic Algorithms," in Final Report for GSRP Grant NGT-1-02006. 2005, Aerospace Systems Design Laboratory (ASDL), Georgia Institute of Technology.
[63] Busch, D.A. and Aldana, J.F. "An Approach to Aircraft Subsystems Design and
Integration." in 12th Digital Avionics Systems Conference. 1993. Fort Worth, USA.
[64] Bustnay, T. and Ben-Asher, J.Z., "How Many Systems Are There? - Using the N2
Method for Systems Partitioning," Systems Engineering, 2005. 8(2): p. 109-118. [65] Carter, D.E. and Baker, B.S., Concurrent Engineering: The Product Development
Environment for the 1990s. 1992: Addison-Wesley Publishing Company. [66] Carubba, E.R. and Gordon, R.D., Product Assurance principles: Integrating
Design Assurance and Quality Assurance. 1988, New York: McGraw-Hill. [67] Cavusoglu, H., Cavusoglu, H. and Raghunathan, S., "Selecting a Customization
Strategy under Competition: Mass Customization, Targeted Mass Customization and Product Proliferation," IEEE Transactions on Engineering Management, 2007. 54(1): p. 12-28.
[68] Chamberlain, M.K., "An Approach to Decision Support for Strategic Redesign,"
in School of Mechanical Engineering. 2007, Georgia Institute of Technology. [69] Chandrasekaran, B., "Design Problem Solving: A Task Analysis," in AI
Magazine. 4. 1990, American Association for Artificial Intelligence p. 59-71. [70] Chang, C.W. and Van, Y.T., "Researching Design Trends for the Redesign of
Product Form," Design Studies, 2003. 24: p. 173-180.

362
[71] Chen, Y., Shir, W. and Shen, C., "Distributed Engineering Change Management for Allied Concurrent Engineering," International Journal of Computer Integrated Manufacturing, 2002. 15(2): p. 127-151.
[72] Cheng, K.W.E., "Comparative Study of AC/DC Converters for More Electric
Aircraft," in Proceedings of the 7th International Conference on Power Electronics and Variable Speed Drives. 1998: London, UK.
[73] Chikofsky, E.J., "Reverse Engineering and Design Recovery: A Taxonomy,"
IEEE Software, 1990. 7(1). [74] Christian, J.A., "A Quantitative Approach to Assessing System Evolvability."
20060021531. 2004, NASA Johnson Space Center p. 16. [75] Christian, J.A. and Olds, J.R., "A Quantitative Methodology for Identifying
Evolvable Space Systems," in 1st Space Exploration Conference: Continuing the Voyage of Discovery. 2005: Orlando, FL.
[76] Clark, K.B. and Fujimoto, T., Product Development Performance, Strategy,
Organization and Management in the World Auto Industries. 1991: Harvard Business School.
[77] Clarkson, P.J. and Hamilton, J.R., "Signposting: A Parameter-driven Task-based
Model of the Design Process," Research in Engineering Design, 2000. 12(1): p. 18-38.
[78] Clarkson, P.J., Melo, A. and Eckert, C., "Visualization Techniques to Assist
Design Process Planning," in International Conference on Engineering Design. 2001: Glasgow, UK.
[79] Clarkson, P.J., Simons, C. and Eckert, C., "Change Prediction for Product
Redesign," in International Conference on Engineering Design. 2001: Glasgow, UK.
[80] Clarkson, P.J., Simons, C. and Eckert, C. "Predicting Change Propagation in
Complex Design." in ASME Design Engineering Technical Conferences and Computers and Information in Engineering Conference. 2001. Pittsburgh, USA.
[81] Clarkson, P.J., Simons, C. and Eckert, C., "Predicting Change Propagation in
Complex Design," Journal of Mechanical Design, 2004. 126(5). [82] Cohen, T. and Fulton, R.E. "A Data Approach to Tracking and Evaluating
Engineering Changes." in Proceedings of ASME Design Engineering Technical Conferences. 1998. Atlanta, USA.

363
[83] Cohen, T., Navathe, S.B. and Fulton, R.E., "C-FAR: Change Favorable Representation," Computer Aided Design, 2000. 32(5): p. 321-338.
[84] Collaine, A., Lutz, P. and Lesage, J., "A Method for Assessing the Impact of
Product Development on the Company," International Journal of Production Research, 2002. 40(14).
[85] Condom, P., "Airbus Fills Out Its Product Line," in Interavia Business and
Technology. 607. 1997. [86] Condom, P., "Derivative Strategy Show Its Limits," in Interavia Business and
Technology. 607. 1997. [87] Condom, P., "7E7 Dreamliner: Boeing's New Paradigm," in Interavia Business
and Technology. 677. 2004. [88] Condom, P., "Airbus Still Playing the Family Game," in Interavia Business and
Technology. 679. 2005. [89] Condom, P., "One Market, Two Visions," in Interavia Business and Technology.
680. 2005. [90] Condom, P., "Can Airbus Upstage the Boeing 787?," in Interavia Business and
Technology. 684. 2006. [91] Coppendale, J., "Manage Risk in Product and Process Development and Avoid
Unpleasant Surprises," Engineering Management Journal, 1995. 5(1): p. 35-38. [92] Coughlan, P.D., "Engineering Change and Manufacturing Engineering
Deployment in New Product Development", in Integrating Design and Manufacturing for Competitive Advantage. 1992, Oxford University Press: New York.
[93] Croke, S. and Herrenschmidt, J., "More Electric Initiative: Power-by-Wire
Actuation Alternatives," in Proceedings of the IEEE National Aerospace and Electronics Conference (NAECON). 1994: Dayton, OH.
[94] Cronin, M.J.J., "All-Electric vs Conventional Aircraft: The
Production/Operational Aspects," Journal of Aircraft, 1983. 20(6): p. 481-486. [95] Cronin, M.J.J., "The All-Electric Aircraft," IEE Review, 1990. 36(8): p. 309-311. [96] Cross, N., Engineering Design Methods. 1989: John Wiley & Sons.
364
[97] Crossland, R., Sims Williams, J. and McMahon, C., "The Practical Application of Design Risk Assessment Models," Journal of Engineering Manufacture, 2003. 217(2): p. 227-234.
[98] Crow, K. Configuration Management and Engineering Change Control. 2002
[cited May 2006]; www.npd-solutions.com/configmgt.html [99] Cutts, S.J., "A Collaborative Approach to the More Electric Aircraft," in
International Conference on Power Electronics, Machines and Drives. 2002: Bath, UK.
[100] Daniels, J., Werner, P.W. and Bahill, A.T., "Quantitative Methods for Tradeoff
Analyses," Systems Engineering, 2001. 4(3): p. 190-211. [101] Dey, A.K. and Abowd, G.D., "Towards a Better Understanding of Context and
Con-text-Awareness." 1999, College of Computing, Georgia Institute of Technology.
[102] Dieter, G.E., Engineering Design: A Materials and Processing Approach. 2000:
McGraw-Hill Companies, Inc. [103] DiPrima, M., "Engineering Change Control and Implementation Considerations,"
Production and Inventory Management Journal, 1982. 23(1). [104] Dixon, L.A. and Colton, J.S., "A Process Management Strategy for Re-design: An
Anchoring Adjustment Approach," Journal of Engineering Design, 2000. 11(2): p. 159 -173.
[105] Domeshek, E.A., Herndon, M.F., Bennett, A.W. and Kolodner, J.L. "Case-Based
Design Aid for Conceptual Design of Aircraft Subsystems." in Conference on Artificial Intelligence Applications. 1994. San Antonio, TX, USA.
[106] Done, K., "Boeing Steps Up Dreamliner Spending," in Financial Times. 2007:
London, UK p. 22. [107] Du, X., Jiao, J. and Tseng, M.M., "Architecture of Product Family: Fundamentals
and Methodology," Concurrent Engineering: Research and Application, 2001. 9(4): p. 309-325.
[108] Duhovnik, J. and Tavcar, J. "Reengineering with Rapid Prototyping." in 4th
International Symposium on Tools and Methods of Competitive Engineering. 2002. Wuhan, China.
[109] Earl, C., Eckert, C. and Clarkson, P.J., "Design Change and Complexity," in 2nd
Workshop on Complexity in Design and Engineering. 2005, University of Glasgow.
365
[110] Earl, C., Eckert, C. and Johnson, J. "Complexity in Planning Design Processes."
in International Conference on Engineering Design. 2001. Glasgow, UK. [111] Earl, C., Eckert, C. and Johnson, J. "Complexity of Planning in Design." in
Proceedings of the ASME Design Engineering Technical Conference 2001. Pittsburgh, USA.
[112] Earl, C., Eckert, C. and Johnson, J., "Complexity", in Design Process
Improvement - A Review of Current Practice. 2005, Springer-Verlag UK. [113] Eckert, C. and Clarkson, P.J., "The Reality of Design Process Planning," in
International Conference on Engineering Design. 2003: Stockholm, Sweden. [114] Eckert, C., Clarkson, P.J. and Zanker, W. "Aspects of a Better Understanding of
Changes." in International Conference on Engineering Design. 2001. Glasgow, Scotland.
[115] Eckert, C., Clarkson, P.J. and Zanker, W., "Change and Customization in
Complex Engineering Domains," Research in Engineering Design, 2004. 15(1): p. 1-21.
[116] Eckert, C., Keller, R., Earl, C. and Clarkson, P.J., "Supporting Change Processes
in Design: Complexity, Prediction and Reliability," Reliability Engineering and System Safety, 2006. 91(12): p. 1521-1534.
[117] Eckert, C., Pulm, U. and Jarratt, T. "Mass Customization, Change and Inspiration:
Changing Designs to Meet New Needs." in International Conference on Engineering Design. 2003. Stockholm, Sweden.
[118] Eckert, C., Stacey, M. and Earl, C., "References to Past Designs", in Studying
Designers '05. 2005, Key Centre of Design Computing and Cognition: Sydney, Australia.
[119] Edmonds, E.A., "Adaptive Man-Computer Interfaces", in Computing Skills and
the User Interface. 1981, Academic Press: London, UK. p. 4-10. [120] Eger, T., Eckert, C. and Clarkson, P.J. "Towards A Change Process Planning
Tool." in International Conference on Engineering Design. 2003. Stockholm, Sweden.
[121] Eger, T., Eckert, C. and Clarkson, P.J., "The Role of Design Freeze in Product
Development," in International Conference on Engineering Design. 2005: Melbourne, Australia.

366
[122] Elbuluk, M.E. and Kankam, M.D., "Potential Starter/Generator Technologies for Future Aerospace Applications," IEEE Aerospace and Electronic Systems Magazine, 1996. 11(10): p. 17-24.
[123] Elbuluk, M.E. and Kankam, M.D., "Potential Starter/Generator Technologies for
Future Aerospace Applications," IEEE Aerospace and Electronic Systems Magazine, 1997. 12(5): p. 24-31.
[124] Emadi, A. and Ehsani, M., "Aircraft Power Systems: Technology, State-of-the-
Art and Future Trends," IEEE Aerospace and Electronic Systems Magazine, 2000. 15(1): p. 28-32.
[125] Engel, A. and Browning, T.R. "Designing Systems for Adaptability by Means of
Architecture Options." in 16th Annual International Symposium Proceedings for INCOSE. 2006. Florida, USA.
[126] Eppinger, S.D., "A Planning Method for Integration of Large-Scale Engineering
Systems," in International Conference on Engineering Design. 1997: Tampere, Finland.
[127] Eppinger, S.D. and Salminen, V., "Patterns of Product Development Interactions,"
in International Conference on Engineering Design. 2001: Glasgow, UK. [128] Erens, F., McKay, A. and Bloor, S., "Product Modeling using Multiple Levels of
Abstraction Instances as Types," Computers in Industry, 1994. 24(1). [129] Ericsson, A. and Erixon, G., Controlling Design Variants: Modular Product
Platforms. 1999, New York: ASME Press. [130] Fan, I., Russell, S. and Lunn, R., "Supplier Knowledge Exchange in Aerospace
Product Engineering," Aircraft Engineering and Aerospace Technology: An International Journal, 2000. 72(1): p. 14-17.
[131] Feiner, L.J. "Power Electronics for Transport Aircraft Application." in
Proceedings of the International Conference on Industrial Electronics, Control and Instrumentation. 1993. Hawaii, USA.
[132] Feiner, L.J. "Power Electronics Transforms Aircraft Systems." in Proceedings of
the Wescon Conference. 1994. Anaheim, CA, USA. [133] Flanagan, T.L., Eckert, C. and Clarkson, P.J., "Parameter Trails," in International
Conference on Engineering Design. 2003: Stockholm, Sweden. [134] Flanagan, T.L., Eckert, C., Smith, J., Eger, T. and Clarkson, P.J. "A Functional
Analysis of Change Propagation." in International Conference on Engineering Design. 2003. Stockholm, Sweden.

367
[135] Folden, D., Jackson, T., Panique, M., Tiensvvold, R., Wolff, R.S., Howard, T.,
Julian, E., Junkert, L., Lopez, D. and Oudshoorn, M.J., "An Aircraft Cabin Wireless System for Games and Video Entertainment," Computers in Entertainment, 2007. 5(1): p. 1-17.
[136] Franch, X. and Carvallo, J.P., "Using Quality Models in Software Package
Selection," IEEE Software, 2003. 20(1): p. 34-41. [137] Fricke, E., Gebhard, B., Negele, H. and Igenbergs, E., "Coping with Changes:
Causes, Findings and Strategies," Systems Engineering, 2000. 3(4). [138] Fricke, E. and Schulz, A.P., "Design for Changeability: Principles to Enable
Changes in Systems throughout Their Entire Lifecycle," Systems Engineering, 2005. 8(4): p. 342-359.
[139] GAO, "Joint Strike Fighter Acquisition - Mature Critical Technologies Needed to
Reduce Risks." GAO-02-39. 2001. [140] Garrett, D.F., Aircraft Systems and Components. 1991, Englewood, CO: Jeppesen
Sanderson Inc. pp. 320. [141] Gartz, P.E., "Commercial Systems Development in A Changed World," IEEE
Transactions on Aerospace and Electronic Systems, 1997. 33(2): p. 632-636. [142] Gerst, M., Eckert, C., Clarkson, P.J. and Lindemann, U. "Innovation in the
Tension of Change and Reuse." in International Conference on Engineering Design. 2001. Glasgow, Scotland.
[143] Goel, A.K. and Chandrasekaran, B., "A Task Structure for Case-Based Design,"
in IEEE International Conference on Systems, Man and Cybernetics. 1990: Los Angeles, CA.
[144] Goel, A.K. and Craw, S., "Design, Innovation and Case-Based Reasoning,"
Knowledge Engineering Review, 2005. 20(3): p. 271-276. [145] Goel, A.K. and Prabhakar, S., "A Control Architecture for Redesign and Design
Verification," in 2nd Australian and New Zealand Conference on Intelligent Information Systems. 1994: Brisbane, Australia.
[146] Gonzales-Zugasti, J.P., Otto, K.N. and Baker, J.D., "Assessing Value in
Platformed Product Family Design," Research in Engineering Design 2001. 13(1).
[147] Gu, P., Hashemian, M. and Nee, A.Y.C., "Adaptable Design," CIRP Annals -
Manufacturing Technology, 2004. 53(2): p. 539-557.

368
[148] Guenov, M.D. and Barker, S.G., "Application of Axiomatic Design and Design
Structure Matrix to the Decomposition of Engineering Systems," Systems Engineering, 2005. 8(1): p. 29-40.
[149] Gutschi, M., "Corporate News: Bombardier Turns Profits on Jet Demand," in The
Wall Street Journal (Eastern Edition). 2008: New York. [150] Hammond, R., "The Development of Design Metrics for Remanufacturing," in
School of Mechanical Engineering. 1996, Georgia Institute of Technology. [151] Hammond, R. and Bras, B.A. "Design for Remanufacturing Metrics." in
Proceedings of the 1st International Workshop on Reuse. 1996. Eindhoven, the Netherlands.
[152] Han, J. "Supporting Impact Analysis and Change Propagation in Software
Engineering Environments." in 8th IEEE International Workshop on Software Technology and Engineering Practice (STEP). 1997. London, UK.
[153] Harman, A.J., "Analysis of Aircraft Development," in 15th Annual Israel
Conference on Aviation and Astronautics. 1973: Tel Aviv, Israel. [154] Harris, S.B., "Business Strategy and the Role of Engineering Product Data
Management: A Literature Review and Summary of the Emerging Research Questions," Journal of Engineering Manufacture, 1996. 210(3): p. 201-220.
[155] Hegde, H.H., Kekre, S. and Kekre, S., "Engineering Changes and Time Delays: A
Field Investigation," International Journal of Production Economics, 1992. 28(3): p. 341-352.
[156] Hicks, B., Riggs, L.H., McDaniel, L. and Sanner, J., "Managing Change through
Roadmapping," in IEEE Aerospace and Electronic Systems Magazine. 5. 2004, Institute of Electrical and Electronics Engineers Inc. p. 9-15.
[157] Hill, T., Manufacturing Strategy: The Strategic Management of the
Manufacturing Function. 1993: Macmillan Press Ltd. [158] Hilliard, R.F., Kurland, M.J. and Litvintchouk, S.D., "MITRE's Architecture
Quality Assessment," in Software Engineering and Economics Conference. 1997: McLean, USA.
[159] Hirtz, J.M., Stone, R.B., McAdams, D., Szykman, S. and Wood, K.L. "Evolving a
Functional Basis for Engineering Design." in Proceedings of the ASME Design Engineering Technical Conference. 2001. Pittsburgh, USA.

369
[160] Ho, C.J. and Li, J., "Progressive Engineering Changes in Multi-Level Product Structures," International Journal of Management Science, 1997. 25(5): p. 585-594.
[161] Hobson, B., "A Technology Maturity Measurement System for the Department of
National Defense: The TML System." DRDC Atlantic CR 2005-279. 2006, Defense R&D Canada - Atlantic.
[162] Houben, G., Lenie, K. and Vanhoof, K., "A Knowledge-based SWOT Analysis
System as an Instrument for Strategic Planning in Small and Medium Sized Enterprises," Decision Support Systems, 1999. 26(2): p. 125-135.
[163] Hsu, H.-Y. and Lin, G.C.I., "A Design-for-Assembly-based Product Redesign
Approach," Journal of Engineering Design, 1998. 9(2): p. 171-195. [164] Hsu, T., "Causes and Impacts of Class One Engineering Changes: An Exploratory
Study based on Three Defense Aircraft Acquisition Programs," in Department of Aeronautics and Astronautics. 1999, Massachusetts Institute of Technology
[165] Huang, G.Q. and Mak, K.L., "Computer Aids for Engineering Change Control,"
Journal of Materials Processing Technology, 1998. 76(1-3): p. 187-191. [166] Huang, G.Q. and Mak, K.L., "Current Practices of Engineering Change
Management in UK Manufacturing Industries," International Journal of Operations and Production Management, 1999. 19(1): p. 21-37.
[167] Huang, G.Q. and Mak, K.L., Internet Applications in Product Design and
Manufacturing. 2003, Berlin, Germany: Springer. [168] Huang, G.Q., Yee, W.Y. and Mak, K.L., "Development of a Web-based System
for Engineering Change Management," Robotics and Computer-Integrated Manufacturing, 2001. 17(3): p. 255-267.
[169] Iansiti, M., Technology Insertion. 1998, Boston: Harvard Business School Press. [170] Ibrahim, S., Idris, N.B., Munro, M. and Deraman, A., "A Requirements
Traceability to Support Change Impact Analysis," Asian Journal of Information Technology, 2005. 4(4): p. 335-344.
[171] Ingle, K., Reverse Engineering. 1994, New York: McGraw-Hill. [172] Inness, J., Achieving Successful Product Change. 1994, London: Pitman
Publishing.

370
[173] Ishii, K., "Modularity: A Key Concept in Product Life-Cycle Engineering", in Handbook of Life Cycle Engineering. 1998, Kluwer Academic Publishers: Dordrecht, The Netherlands. p. 511-531.
[174] Jarratt, T., "A Model-Based Approach to Support the Management of Engineering
Change," in Engineering Department. 2004, Cambridge University. [175] Jarratt, T., Clarkson, P.J., Parks, G. and Eckert, C., "Use of Monte Carlo Methods
in the Prediction of Change Propagation," in Engineering Design Conference. 2002: London.
[176] Jarratt, T., Eckert, C. and Clarkson, P.J. "Development of A Product Model to
Support Engineering Change Management." in Tools and Methods of Competitive Engineering (TMCE) Conference. 2004. Lausanne, Switzerland.
[177] Jarratt, T., Keller, R., Nair, S., Eckert, C. and Clarkson, P.J., "Visualization
Techniques for Product Change and Product Modeling in Complex Design", in Diagrammatic Representation and Inference. 2004, Springer Berlin Heidelberg. p. 388-391.
[178] Jiao, J., Kumar, A. and Lim, C.M., "Flexibility Valuation of Product Family
Architecture: A Real-Option Approach," International Journal of Advanced Manufacturing Technology, 2006. 30(1-2): p. 1-9.
[179] Johnson, J.H., "The Multidimensional Networks of Complex Systems", in
Networks in Action. 1995, Springer-Verlag: Berlin. p. 49-79. [180] Jordaan, A. B737-200 Adv Study Notes. [cited December 2008];
www.b737.org.uk/pilotnotes.htm [181] Jouannet, C. and Krus, P., "Direct Simulation Based Optimization for Aircraft
Conceptual Design," in 7th AIAA Aviation Technology, Integration and Operations Conference. 2007: Belfast, Ireland.
[182] Kamrani, A.K. "Product Design for Modularity: QFD Approach." in World
Automation Congress. 2002. [183] Karimi, K., "Electric Power System Design," in Boeing MEA Seminar Series
(Power Quality). 2005. [184] Keller, R., Alink, T., Pfeifer, C., Eckert, C., Clarkson, P.J. and Albers, A.,
"Product Models in Design: A Combined Use of Two Models to Assess Change Risks," in International Conference on Engineering Design. 2007: Paris, France.
[185] Keller, R., Eckert, C. and Clarkson, P.J. "Multiple Views to Support Engineering
Change Management for Complex Products." in 3rd International Conference on

371
Coordinated and Multiple Views in Exploratory Visualization. 2005. London, UK.
[186] Keller, R., Eckert, C. and Clarkson, P.J., "Viewpoints and Views in Engineering
Change Management," in 2nd Workshop on Complexity in Design and Engineering. 2005: Glasgow, UK.
[187] Keller, R., Eger, T., Eckert, C. and Clarkson, P.J., "Visualizing Change
Propagation," in International Conference on Engineering Design. 2005: Melbourne, Australia.
[188] Keller, R.M., Baudin, C., Iwasaki, Y., Nayak, P. and Tanaka, K., "Compiling
Redesign Plans and Diagnosis Rules from a Structure/Behavior Device Model." NASA-TM-111477. 1990, NASA Ames Research Center.
[189] Kidd, C., "The Case for Configuration Management," IEE Review, 2001. 47(5). [190] Kidd, M.W. and Thompson, G., "Engineering Design Change Management,"
Integrated Manufacturing Systems, 2000. 11(1): p. 74-77. [191] Kirby, M., "A Methodology for Technology Identification, Evaluation and
Selection in Conceptual and Preliminary Aircraft Design," in School of Aerospace Engineering. 2001, Georgia Institute of Technology.
[192] Krishnamachari, R.S. "Reconfiguring Functional Decomposition of Systems." in
7th AIAA/USAF/NASA/ISSMO Symposium on Multidisciplinary Analysis and Optimization. 1998. St. Louis, MO.
[193] Krishnan, V., "Managing the Simultaneous Execution of Coupled Phases in
Concurrent Product Development," IEEE Transactions on Engineering Management, 1996. 43(2): p. 210-217.
[194] Kuipers, B.J., Qualitative Reasoning: Modeling and Simulation with Incomplete
Knowledge. 1994, Cambridge, MA: MIT Press. [195] Kuo-liang, L. and Shu-chen, L., "A Fuzzy Quantified SWOT Procedure for
Environmental Evaluation of an International Distribution Center," Information Sciences, 2008. 178(2): p. 531-549.
[196] Kusiak, A., Engineering Design: Products, Processes and Systems. 1999, San
Diego, CA: Academic Press. [197] Kusiak, A. and He, D.W., "Design for Agility: A Scheduling Perspective,"
Robotics and Computer-Integrated Manufacturing, 1998. 14(5): p. 415-427.

372
[198] Lee, D.B., "In-Flight Entertainment - Getting from Wishlist to Reality," IEEE Aerospace and Electronic Systems Magazine, 1999. 14(8): p. 37-43.
[199] Lee, H.J., Ahn, H.J., Kim, J.W. and Park, S.J., "Capturing and Reusing
Knowledge in Engineering Change Management: A Case of Automobile Development," Information Systems Frontiers, 2006. 8(5): p. 375-394.
[200] Lefever, D. and Wood, K.L. "Design for Assembly Techniques in Reverse
Engineering and Redesign." in ASME Design Theory and Methodology Conference. 1996. Irvine, CA.
[201] Lehman, M.M., "Program, Lifecycles and Laws of Software Evolution," IEEE
Transactions on Software Engineering, 1980. 68(9): p. 1060-1076. [202] Lin, C., Chen, K. and Marek-Sadowska, M., "Logic Synthesis for Engineering
Change," IEEE Transactions on Computer-Aided Design of Integrated Circuits and Systems, 1999. 18(3): p. 282-291.
[203] Lin, J., Fox, M.S. and Bilgic, T., "A Requirement Ontology for Engineering
Design," Concurrent Engineering, 1996. 4(3): p. 279-291. [204] Lindemann, U., Kleedorfer, R. and Gerst, M., "The Development Department and
Engineering Change Management", in Designers: The Key to Successful Product Development. 1998, Springer-Verlag UK.
[205] Little, A., Wood, K.L. and McAdams, D. "Functional Analysis: A Fundamental
Empirical Study for Reverse Engineering, Benchmarking and Redesign." in Proceedings of the Design Engineering Technical Conferences. 1997. Sacramento, USA.
[206] Liu, H., "State-of-the-Art In-flight Entertainment Systems and Office Work
Infrastructure," in Deliverable for European Project Smart Technologies for Stress Free Air Travel. 2006, Technical University of Eindhoven.
[207] Liu, H., "In-flight Entertainment System: State-of-the-art and Research
Directions," in 2nd International Workshop on Semantic Media Adaptation and Personalization. 2007: London, UK.
[208] Liu, H. and Rauterberg, M., "Context-Aware In-Flight Entertainment System", in
Proceedings of Posters at HCI International: Part X (Lecture Notes in Computer Science). 2007, Springer: Berlin. p. 1249-1254.
[209] Loch, C.H. and Terwiesch, C., "Communication and Uncertainty in Concurrent
Engineering," Management Science, 1998. 44(8): p. 1032-1048.

373
[210] Loch, C.H. and Terwiesch, C., "Accelerating the Process of Engineering Change Orders: Capacity and Congestion Effects," Journal of Product Innovation Management, 1999. 16(2): p. 145-159.
[211] Lock, S. and Kotonya, G. "An Integrated Framework for Requirement Change
Impact Analysis." in 4th Australian Conference on Requirements Engineering. 1999. Sydney, Australia.
[212] Lockwood, R., "Goal-directed Development of New Products," World Class
Design to Manufacture, 1995. 2(1): p. 34-37. [213] Lombardo, D., Advanced Aircraft Systems. 1993, New York, USA: McGraw-Hill
Professional Publishing. [214] Lopez, D.A., "Quality Planning in Aerospace Manufacturing: A Fundamental
Change," Total Quality Management, 1996. 7(3). [215] Lynch, M., "Engineering Change Improves Quality, Reduces Cost," in Computer-
Aided Engineering. 2. 1993 p. 64, 68. [216] Madhavji, N.H., "Environment Evolution: The Prism Model of Changes," IEEE
Transactions on Software Engineering, 1992. 18(5). [217] Maher, M.L. and Gomez de Silva Garza, A., "Case-based Reasoning in Design,"
IEEE Expert, 1997. 12(2): p. 34-41. [218] Maier, A.M., Hepperle, C., Kreimeyer, M., Eckert, C., Lindemann, U. and
Clarkson, P.J., "Associations between Factors Influencing Engineering Design Communication," in International Conference on Engineering Design. 2007: Paris, France.
[219] Malmqvist, J. "A Classification of Matrix-based Methods for Product Modeling."
in International Design Conference. 2002. Dubrovnik, Croatia. [220] Markish, J., "Valuation Techniques for Commercial Aircraft Program Design," in
Department of Aeronautics and Astronautics. 2000, Massachusetts Institute of Technology.
[221] Martin, R.C. (1994) Object Oriented Design Quality Metrics: An Analysis of
Dependencies. http://www.objectmentor.com/resources/articles/oodmetrc.pdf [222] Mason, J.J. and Jablokow, K.W. "Innovation and Change as Competitive Tools in
Manufacturing Operations." in 4th International Conference on Control and Automation. 2003. Montreal, Canada.
[223] Matlack, C., "Airbus Gains Altitude," in Business Week Online. 2008 p. 6.
374
[224] Matlack, C., "What Airbus Learned From the Dreamliner," in Business Week.
4081. 2008 p. 92. [225] Mattingly, J.D., Elements of Gas Turbine Propulsion. 1996: McGraw-Hill
(International Edition). [226] Maull, R., Hughes, D. and Bennett, J., "The Role of Bill-of-Materials as a
CAD/CAPM Interface and the Key Importance of Engineering Change Control," Computing and Control Engineering Journal, 1992. 3(2).
[227] Mavris, D.N., Baker, A.P. and Schrage, D.P. "IPPD Through Robust Design
Simulation for An Affordable Short Haul Civil Tiltrotor." in 53rd Annual Forum of American Helicopter Society (AHS). 1997. Virginia Beach, VA.
[228] Mavris, D.N. and Kirby, M., "Technology Identification, Evaluation and
Selection for Commercial Transport Aircraft," in 58th Annual Conference of Society of Allied Weight Engineers, Inc. 1999: San Jose, California.
[229] Mavris, D.N., Phan, L.L. and Garcia, E., "Formulation and Implementation of an
Aircraft - System - Subsystem Interrelationship Model for Technology Evaluation," in 25th International Congress of the Aeronautical Sciences. 2006: Hamburg, Germany.
[230] McCullers, L.A., "FLOPS: Flight Optimization System (User's Guide)." 2001,
NASA Langley Research Center: Hampton, VA. [231] McIntosh, K.G., Engineering Data Management: A Guide to Successful
Implementations. 1995, New York: McGraw-Hill. [232] McKay, A., De Pennington, A. and Baxter, J., "Requirements Management: A
Representation Scheme for Product Specifications," Computer Aided Design, 2001. 33(7): p. 511-520.
[233] McWha, J., "Development of the 777 Flight Control System," in AIAA Guidance,
Navigation and Control Conference and Exhibit. 2003: Austin, Texas, USA. [234] Meyer, M.H. and Lehnerd, A.P., The Power of Product Platforms. 1997, New
York: The Free Press. [235] Moir, I. "The All-Electric Aircraft - Major Challenges." in Proceedings of IEE
Colloquium on All Electric Aircraft. 1998. London, UK. [236] Moir, I. and Seabridge, A.G., Aircraft Systems. 1992, Essex, UK: Longman
Scientific and Technical.
375
[237] Moreton, R., "A Process Model for Software Maintenance", in Software Change Impact Analysis, R. Arnold and S. Bohner, Editors. 1996, Wiley-IEEE Computer Society Press.
[238] Muffatto, M. and Roveda, M., "Developing Product Platforms: Analysis of the
Development Process," Technovation, 2000. 20(11): p. 617-630. [239] Murman, E.M., Walton, M. and Rebentisch, E., "Challenges in the Better, Faster,
Cheaper Era of Aeronautical Design, Engineering and Manufacturing," in The Lean Aerospace Initiative Report Series. RP00-02. 2000, Massachusetts Institute of Technology: Cambridge, MA.
[240] Mutty, M.S., "A Comparison of Military and Commercial Aircraft Development."
ADA276830. 1993, Industrial College of the Armed Forces: Washington DC. [241] Nayak, R.U., Chen, W. and Simpson, T.W., "A Variation-based Method for
Product Family Design," Engineering Optimization, 2002. 34(1): p. 65-81. [242] Nichols, K., "Getting Engineering Changes under Control," Journal of
Engineering Design, 1990. 1(1): p. 5-15. [243] Nightingale, P., "The Product-Process-Organization Relationship in Complex
Development Projects," Research Policy, 2000. 29(7-8): p. 913-930. [244] O'Donovan, B.D., Clarkson, P.J. and Eckert, C., "Signposting: Modeling
Uncertainty in Design Process," in International Conference on Engineering Design. 2003: Stockholm, Sweden.
[245] O'Neill, J., Thakur, N. and Duus, A., "Technical Risk Assessment: A
Practitioner's Guide," Australian Department of Defense. 2007. DSTO-GD-0493 [246] Ollinger, G.A. and Stahovich, T.F. "RedesignIT: A Constraint-Based Tool for
Managing Design Changes." in ASME Design Engineering Technical Conferences and Computers and Information in Engineering Conference. 2001. Pittsburg, USA.
[247] Ollinger, G.A. and Stahovich, T.F., "RedesignIT: A Model-Based Tool for
Managing Design Changes," Journal of Mechanical Design, 2004. 126. [248] Otto, K.N. and Wood, K.L., "A Reverse Engineering and Redesign Methodology
for Product Evolution," in ASME Design Engineering Technical Conferences and Design Theory and Methodology Conference. 1996: Irvine, California, USA.
[249] Otto, K.N. and Wood, K.L., "Product Evolution: A Reverse Engineering and
Redesign Methodology," Research in Engineering Design, 1998. 10(4).
376
[250] Ou-Yang, C. and Chang, C.W., "Developing an Integrated Intelligent Framework to Support an Engineering Change Process for an Axial Piston Pump," International Journal of Advanced Manufacturing Technology, 1999. 15(5): p. 345-355.
[251] Ou-Yang, C. and Pei, H.N., "Developing a STEP-based Integration Environment
to Evaluate the Impact of an Engineering Change on MRP," International Journal of Advanced Manufacturing Technology, 1999. 15(11): p. 769-779.
[252] Pahl, G. and Beitz, W., Engineering Design: A Systematic Approach. 2nd ed.
1996, London: Springer-Verlag. [253] Pardessus, T., "The Multi-Site Extended Enterprise Concept in the Aeronautical
Industry," Air & Space Europe, 2001. 3(3): p. 46-48. [254] Phillips, C., "Controlling and Managing Engineering Changes," in Manufacturing
Systems. 12. 1987 p. 40-42. [255] Phillips, M., "Agile Manufacturing in the Aerospace Industry: An Industrial
Viewpoint," International Journal of Agile Management Systems, 1999. 1(1): p. 17-22.
[256] Pikosz, P. and Malmqvist, J. "A Comparative Study of Engineering Change
Management in Three Swedish Engineering Companies." in ASME Design Engineering Technical Conference. 1998. Atlanta, USA.
[257] Pimmler, T.U. and Eppinger, S.D., "Integration Analysis of Product
Decompositions," in Proceedings of ASME Design Technical Conferences. 1994: Minneapolis, USA.
[258] Proctor, P., "Boeing's Upgrades Target Niche Markets," in Aviation Week and
Space Technology. 24. 1998. [259] Raffaeli, R., Germani, M., Graziosi, S. and Mandorli, F., "Development of a
Multilayer Change Propagation Tool for Modular Products," in International Conference on Engineering Design. 2007: Paris, France.
[260] Raimondi, G.M., Sawata, T., Holme, M., Barton, A., White, G., Coles, J., Mellor,
P.H. and Sidell, N., "Aircraft Embedded Generation Systems," in International Conference on Power Electronics, Machines and Drives. 2002: Bath, UK.
[261] Rajlich, V., "Modeling Software Evolution by Evolving Interoperation Graphs,"
Annals of Software Engineering, 2000. 9: p. 235-248.

377
[262] Reed, J.A., Follen, G.J. and Afjeh, A.A., "Improving the Aircraft Design Process Using Web-Based Modeling and Simulation," ACM Transactions on Modeling and Computer Simulation, 2000. 10(1): p. 58-83.
[263] Reidelbach, P.E., "Engineering Change Management for Long Lead-Time
Production Environments," Production and Inventory Management Journal, 1991. 32(2): p. 84-88.
[264] Ring, J. and Fricke, E. "Rapid Evolutions of All Your Systems - Problem or
Opportunity?." in IEEE 17th Digital Avionics Systems Conference. 1998. Seattle, USA.
[265] Riviere, A., "Aircraft Components Impact Analysis: State of the Art." 2004,
VIVACE Consortium. [266] Riviere, A., "Gestion de configuration et des modifications lors du developpement
de grands produits complexes en ingenierie concourante - Cas d'application Aeronautique." 2004, National Polytechnic Institute of Grenoble.
[267] Riviere, A., DaCunha, C. and Tollenaere, M., "Performances in Engineering
Changes Management," in 4th International Conference on Integrated Design and Manufacturing in Mechanical Engineering (IDMME). 2002: Clermont-Ferrand, France.
[268] Riviere, A., Feru, F. and Tollenaere, M. "Controlling Product Related Engineering
Changes in the Aircraft Industry." in International Conference on Engineering Design. 2003. Stockholm, Sweden.
[269] Rosero, J.A., Ortega, J.A., Aldabas, E. and Romeral, L., "Moving Towards A
More Electric Aircraft," IEEE Aerospace and Electronic Systems Magazine, 2007. 22(3): p. 3-9.
[270] Rouibah, K. and Caskey, K.R., "Change Management in Concurrent Engineering
from A Parameter Perspective," Computers in Industry, 2003. 50. [271] Rowe, D. and Leaney, J. "Evaluating Evolvability of Computer-based Systems
Architecture - An Ontological Approach." in International Symposium and Workshop on Engineering of Computer-based Systems. 1997. Monterey, USA.
[272] Rowe, D., Leaney, J. and Lowe, D., "Defining Systems Architecture Evolvability
- A Taxonomy of Change," in International Conference and Workshop on Engineering of Computer Based Systems. 1998: Jerusalem, Israel.
[273] Rutka, A., Guenov, M., Lemmens, Y., Schmidt-Schaffer, Coleman, P. and
Riviere, A., "Methods for Engineering Change Propagation Analysis," in 25th International Congress of the Aeronautical Sciences. 2006: Hamburg, Germany.

378
[274] Saaty, T.L., "The Seven Pillars of the Analytic Hierarchy Process", in Multiple
Criteria Decision Making in the New Millenium. 2000. [275] Saaty, T.L., "The Analytic Hierarchy and Analytic Network Processes for the
Measurement of Intangible Criteria and for Decision Making", in Multiple Criteria Decision Analysis: State-of-the-Art Surveys. 2005, Springer: New York. p. 345-407.
[276] Saaty, T.L., "The Analytic Network Process", in Decision Making with the
Analytic Network Process. 2006, Springer US. p. 1-26. [277] Saleh, J.H., Hastings, D.E. and Newman, D.J. "Extracting the Essence of
Flexibility in System Design." in 3rd NASA/DoD Workshop on Evolvable Hardware. 2001. Long Beach, CA.
[278] Samaras, T.T. and Czerwinski, F.L., Fundamentals of Configuration
Management. 1971: John Wiley & Sons Inc. [279] Sauser, B., Verma, D., Ramirez-Marquez, J. and Gove, R., "From TRL to SRL:
The Concept of Systems Readiness Level," in Conference on Systems Engineering Research. 2006: Los Angeles, CA.
[280] Sawhney, M.S., "Leveraged High-Variety Strategies: From Portfolio Thinking to
Platform Thinking," Journal of the Academy of Marketing Science, 1998. 26(1): p. 54-61.
[281] Schach, S.R. and Tomer, A., "A Maintenance-oriented Approach to Software
Construction," Journal of Software Maintenance - Research and Practice, 2000. 12(1): p. 25-45.
[282] Schaz, B., "Building Components from Functions," Electronic Notes in
Theoretical Computer Science, 2006. 160(1): p. 321-334. [283] Schmidt, B.C., Kanitz, F. and Masan, G. ""Co-Operative Product Engineering
(CPE): A New Approach for an Integrated Planning of Strategic Business Planning, Product Design and Production Process." in International CIRP Design Seminar on Design with Manufacturing: Intelligent Concepts, Methods and Algorithm. 2000. Haifa, Israel.
[284] Schmidt, W. "Airplane Design - Evolution or Change in Paradigm." in 39th AIAA
Aerospace Sciences Meeting and Exhibit. 2001. Reno, NV. [285] Schmitt, R.W. and Gomory, R.E., "Competition from Japan," in MIT Report
(December/January). 1989.

379
[286] Schulz, A.P., Fricke, E. and Igenbergs, E. "Enabling Changes in Systems throughout the Entire Life Cycle - Key to Success?." in 10th Annual International Council on Systems Engineering (INCOSE) Conference. 2000. Minneapolis, USA.
[287] Seepersad, C.C., Cowan, F.S., Chamberlain, M.K. and Mistree, F., "Strategic
Design: Leveraging and Innovation for a Changing Marketplace," in Computer-Based Design: Engineering Design Conference. 2002: London, UK.
[288] Seliger, G., Grudzien, W. and Muller, K. "The Acquiring and Handling of
Devaluation." in 5th CIRP International Seminar on Life Cycle Engineering. 1998. Stockholm, Sweden.
[289] Sembugamoorthy, V. and Chandrasekaran, B., "Functional Representation of
Devices and Compilation of Diagnostic Problem-Solving Systems", in Experience, Memory and Reasoning. 1986, Lawrence Erlbaum Associates: Hillsdale, NJ.
[290] Sethi, A.K. and Sethi, S.P., "Flexibility in Manufacturing: A Survey,"
International Journal of Flexible Manufacturing Systems, 1990. 2(4). [291] Sferro, P., Bolling, G. and Crawford, R., "Omni-Engineer," Manufacturing
Engineering, 1993. [292] Sharma, J.R., Sharma, D.K. and Rawani, A.M., "Quality Driven Product
Development," Manufacturing Engineering, 2006. 85(3): p. 38-41. [293] Sharman, D.M. and Yassine, A.A., "Characterizing Complex Product
Architectures," Systems Engineering, 2004. 7(1): p. 35-60. [294] Sieger, D.B., Badiru, A.B. and Milatovic, M., "A Metric for Agility Measurement
in Product Development," IIE Transactions, 2000. 32(7): p. 637-645. [295] Simon, H.A., The Sciences of the Artificial. 1996: The MIT Press. [296] Simpson, T.W., "Product Families and Platform Leveraging Strategies," in
ME579 Class Notes. 2007, Pennsylvania State University. [297] Smith, B., "Configuration Management for Transportation Management
Systems." FHWA-OP-04-013. 2003, Federal Highway Administration. [298] Smith, J., "A Functional Analysis of Change Propagation," in Cambridge EDC
Technical Report. 2002.

380
[299] Smith, J., Egglestone, G., Farr, P., Moon, T., Saunders, D., Shoubridge, P., Thalassoudis, K. and Wallace, T., "Technical Risk Assessment of Australian Defense Projects," Australian Department of Defense. 2004. DSTO-TR-1656
[300] Smith, J.D., "An Alternative to Technology Readiness Levels for Non-
Developmental Item (NDI) Software," in International Conference on System Sciences. 2005: Hawaii.
[301] Soderberg, L.G., "Facing Up to the Engineering Gap," in McKinsey Quarterly.
Spring. 1989 p. 3-23. [302] Sokovic, M. and Kopac, J., "Reverse Engineering (RE) as Necessary Phase by
Rapid Product Development," Journal of Materials Processing Technology, 2006. 175(1-3).
[303] Sparaco, P., "Airbus to Cut Cycle Time, Stabilize Production," in Aviation Week
and Space Technology. 25. 1994. [304] Stacey, M., Clarkson, P.J. and Eckert, C. "Signposting: An AI Approach to
Supporting Human Decision Making in Design." in Proceedings of ASME Design Engineering Technical Conferences and Computers and Information in Engineering Conference. 2000. Baltimore, MD.
[305] Stacey, M. and Eckert, C., "CAD System Bias in Engineering Design," in
International Conference on Engineering Design. 1999: Munich, Germany. [306] Stacey, M., Petre, M., Rzevski, G., Sharp, H. and Buckland, R., "Beyond
Engineering Bias: Designing A Tool to Liberate Conceptual Design", in Adjunct Proceedings to People and Computers XII. 1996, Cambridge University Press: London, UK.
[307] Stalk, G., "Time - The Next Source of Competitive Advantage," Quality
Progress, 1989. 22(6). [308] Steiner, R. "System Architectures and Evolvability: Definitions and Perspective."
in 8th Annual Symposium of INCOSE. 1998. Vancouver, Canada. [309] Steward, D.V. "Re-engineering the Design Process." in Proceedings of 2nd
Workshop on Enabling Technologies: Infrastructure for Collaborative Enterprises. 1993. Morgantown, WV.
[310] Stone, R.B. and Wood, K.L., "Development of a Functional Basis for Design,"
Journal of Mechanical Design, 2000. 122(4): p. 359-370.

381
[311] Stone, R.B., Wood, K.L. and Crawford, R., "Using Quantitative Functional Models to Develop Product Architectures," Design Studies, 2000. 21(3): p. 239-260.
[312] Stone, R.B., Wood, K.L. and Crawford, R.H., "A Heuristic Method for
Identifying Modules for Product Architectures," Design Studies, 2000. 21(1): p. 5-31.
[313] Suh, N.P., The Principles of Design. 1990, New York: Oxford University Press. [314] Sutinen, K., Almefelt, L. and Malmqvist, J. "Supporting Concept Development
using Quantitative Requirements Traceability." in 12th Annual International Symposium of the International Council on Systems Engineering (INCOSE). 2002. Las Vegas, USA.
[315] Tan, K.C., Kannan, V.R. and Handfield, R.B., "Quality, Manufacturing Strategy
and Global Competition: An Empirical Analysis," Benchmarking: An International Journal, 2000. 7(3).
[316] Tavcar, J. and Duhovnik, J., "Engineering Change Management in Individual and
Mass Production," Robotics and Computer-Integrated Manufacturing, 2005. 2(3): p. 205-215.
[317] Taverna, M.A., "IFE Taking Flight: Thales Sales Surge Signals Rebound in In-
flight Entertainment Market," in Aviation Week & Space Technology. 14. 2005: New York p. 60-61.
[318] Tay, F.E.H. and Gu, J., "A Methodology for Evolutionary Product Design,"
Engineering with Computers, 2003. 19(2-3): p. 160-173. [319] Tellier, P., "Flying into Battle," in Economist. 8374. 2004 p. 60. [320] Tersine, R.J. and Hummingbird, E.A., "Lead-Time Reduction: The Search for
Competitive Advantage," International Journal of Operations and Production Management, 1995. 15(2): p. 8-18.
[321] Terwiesch, C. and Loch, C.H., "Managing the Process of Engineering Change
Orders: The Case of the Climate Control System in Automobile Development," Journal of Product Innovation Management, 1999. 16(2).
[322] Todd, J.R., Hay, J.A. and Dinh, T., "Integrating Fly-by-Light/Power-by-Wire
Flight Control System on Transport Aircraft," in Proceedings of the IEEE/AIAA 12th Digital Avionics Systems Conference. 1993: Fort Worth, Texas, USA.
[323] Tseng, M.M., Jiao, J. and Merchant, M.E., "Design for Mass Customization,"
CIRP Annals - Manufacturing Technology, 1996. 45(1): p. 153-156.

382
[324] Tu, Y.L., Xie, S.Q. and Fung, R.Y.K., "Product Development Cost Estimation in
Mass Customization," IEEE Transactions on Engineering Management, 2007. 54(1): p. 29-40.
[325] Tvete, B. "Introducing Efficient Requirements Management." in Proceedings of
10th International Workshop on Database and Expert Systems Applications. 1999. Florence, Italy.
[326] Ulrich, K., "The Role of Product Architecture in the Manufacturing Firm,"
Research Policy, 1995. 24: p. 419-440. [327] Ulrich, K.T. and Eppinger, S.D., Product Design and Development. 2000, Boston:
McGraw-Hill. [328] Utterback, J., Mastering the Dynamics of Innovation. 1996, Boston, MA: Harvard
Business School Press. [329] Valerdi, R. and Kohl, R.J., "An Approach to Technology Risk Management," in
Engineering Systems Division Symposium. 2004: Cambridge, MA. [330] Villacourt, M., "Failure Modes and Effect Analysis (FMEA): A Guide for
Continuous Improvement for the Semi-Conductor Equipment." 1992, International Sematech Inc.
[331] Wang, Q. and Schmidlin, M., "Factors Influencing a Firm's Decision-Making on
the Introduction of New Services: A Case Study of Airbus Industrie," in IEEE International Engineering Management Conference. 1995: Singapore.
[332] Wanstrom, C. and Jonsson, P., "The Impact of Engineering Changes on Materials
Planning," Journal of Manufacturing Technology Management, 2006. 17(5): p. 561-584.
[333] Weber, N.O., "Product Development Teams and Tools Applied to the Aircraft
Industry," World Class Design to Manufacture, 1994. 1(6). [334] Weimer-Jehle, W., "Cross-Impact Balances: A System-Theoretical Approach to
Cross-Impact Analysis," Technological Forecasting and Social Change, 2006. 73(4): p. 334-361.
[335] Weimer, J.A., "The Role of Electric Machines and Drives in the More Electric
Aircraft," IEEE International Conference of Electric Machines and Drives, 2003. 1: p. 11-15.

383
[336] Wen, L. and Dromey, R.G. "From Requirements Change to Design Change: A Formal Path." in 2nd International Conference on Software Engineering and Formal Methods. 2004. Beijing, China.
[337] Wheelwright, S. and Clark, K., Revolutionizing Product Development. 1992, New
York: Free Press. [338] Wild, T.W., Transport Category Aircraft Systems. 1996, Englewood, CO:
Jeppesen Sanderson Inc. pp. 396. [339] Willems, B., Dufluo, J., Dewulf, W., Seliger, G. and Basdere, B. "MAAP: A
Method to Assess the Adaptability of Products." in Proceedings of 3rd International Conference on Design and Manufacture of Sustainable Development. 2004. Loughborough, UK.
[340] Willems, B., Seliger, G., Dufluo, J. and Basdere, B. "Contribution to Design for
Adaptation: Method to Assess the Adaptability of Products (MAAP)." in Proceedings of the 3rd International Symposium on Environmentally Conscious Design and Inverse Manufacturing. 2003. Tokyo, Japan.
[341] Williams, C.B., Allen, J.K., Rosen, D.W. and Mistree, F. "Designing Platforms
For Customizable Products in Markets With Non-Uniform Demand." in ASME Design Engineering Technical Conferences and Computer and Information in Engineering Conference. 2004. Salt Lake City, USA.
[342] Williams, C.B., Panchal, J.H. and Rosen, D.W. "A General Decision-Making
Method for the Rapid Manufacturing of Customized Parts." in ASME Design Engineering Technical Conferences and Computer and Information in Engineering Conference. 2003. Chicago, USA.
[343] Wood, W.H. and Agogino, A.M., "Case-based Conceptual Design Information
Server for Concurrent Engineering," CAD Computer Aided Design, 1996. 28(5). [344] Wright, I.C., "A Review of Research into Engineering Change Management:
Implications for Product Design," Design Studies, 1997. 18(1): p. 33-42. [345] Wright, I.C., Duckworth, A.P., Jebb, A. and Dickerson, D.B. "Research into the
Process of Engineering Change within Incremental Product Design." in Engineering Design Conference. 2000. Brunel University, UK: Professional Engineering Publishing.
[346] Wymore, A.W., Model-based Systems Engineering. 1993, Boca Raton, FL: CRC
Press.

384
[347] Yamashina, H., Ito, T. and Kawada, H., "Innovative Product Development Process by Integrating QFD and TRIZ," International Journal of Production Research, 2002. 40(5): p. 1031-1050.
[348] You, C. and Yeh, S., "Engineering Change Propagation System using STEP,"
Concurrent Engineering, 2002. 10(4): p. 349-356.

385
VITA
Fairuz Izzuddin Romli was born on July 27th, 1978 in Kangar, Perlis, Malaysia. He went
to study Aerospace Engineering at Universiti Putra Malaysia and received his Bachelor’s
Degree in Aerospace Engineering in 2001. Shortly after finishing his last semester as an
undergraduate student, he joined the Department of Aerospace Engineering at Universiti
Putra Malaysia and was given the responsibility to conduct Aircraft Design Lab sessions
while waiting to further his graduate study.
In the fall of 2002, Mr. Romli enrolled at Georgia Institute of Technology and graduated
with a Master’s Degree in Aerospace Engineering in December 2003. He continued to
pursue his PhD in Aerospace Engineering at Georgia Institute of Technology and during
this period, he also earned his Master’s Degree in Statistics from the School of Industrial
System Engineering in 2008. Upon graduating with his PhD, he will continue to serve in
Department of Aerospace Engineering at Universiti Putra Malaysia, Malaysia.