Sermayenin Vergilendirilmesinde Adaletten Etkinliğe Doğru Yaşanan Kayma: Türkiye’deki Durum
Upload
independentCategory
view
0download
0
Gn
Ra
b
c
a
ARRAA
KDGPPSW
1
tcHesaiu
edlu
oT
(
h0
Field Crops Research 171 (2015) 23–31
Contents lists available at ScienceDirect
Field Crops Research
jou rn al hom epage: www.elsev ier .com/ locate / fc r
rain filling duration and glutenin polymerization under variableitrogen supply and environmental conditions for durum wheat
oberto Ferrisea, Marco Bindia, Pierre Martreb,c,∗
Department of Agri-food Production and Environmental Sciences, University of Florence, Piazzale delle Cascine 18, 50144 Florence, ItalyINRA, UMR1095 Genetics, Diversity and Ecophysiology of Cereals, 5 Chemin de Beaulieu, F-63 039 Clermont-Ferrand, Cedex 02, FranceBlaise Pascal University, UMR1095 Genetics, Diversity and Ecophysiology of Cereals, F-63 177 Aubière, France
r t i c l e i n f o
rticle history:eceived 4 July 2014eceived in revised form 28 October 2014ccepted 28 October 2014vailable online 29 November 2014
eywords:urum wheatluteninolymeric proteinrotein compositionize-exclusion HPLC
a b s t r a c t
The end-use value of durum wheat (Triticum turgidum L. subsp. durum (Desf.) Husn.) is mainly governed byits grain protein concentration and composition. Adjustment of variables to compensate for inter-annualand location variations in semolina quality leads to high cost for processors in the wheat industry. A betterunderstanding of the mechanisms governing environmental variations of grain protein composition isthus required. Here, a field experiment was setup in a Mediterranean environment with the aim to analyzethe effect of sowing date and nitrogen (N) fertilization on the dynamics of grain dry mass, water, proteincomposition and glutenin polymer size distribution for durum wheat cv. Creso. The results indicatedthat (1) grain dry mass accumulation was related to grain water concentration and stopped at 44.9%independently of the growing conditions and N supply; (2) during the grain filling period as well asat ripeness maturity, the quantity of the different protein fractions scaled with the quantity of N pergrain; (3) SDS-extractable glutenin polymers were produced continuously until the same grain water
heat quality concentration as the dry mass deposition was reached; (4) SDS-unextractable polymeric proteins werefound as early as 7 days after anthesis and their rate of accumulation increased sharply when grain drymass was 60% of its final value and proceeded at a constant rate until ripeness maturity, thus suggestingthat the insolubilization of glutenin polymers is not directly related to the rapid loss of water after
ut rat
physiological maturity, b. Introduction
In contrast with other cereals, most of the wheat produc-ion is used after processing, mainly by the pasta industry in thease of durum wheat (Triticum turgidum L. subsp. durum (Desf.)usn.), which require specific functional properties. These prop-rties largely depend on structures and interactions of the graintorage proteins gliadin and glutenin (Gras et al., 2001; Shewry
nd Halford, 2002). Customers are becoming more discriminatingn their quality requirements and inter-annual variability in prod-ct quality is becoming less acceptable, particularly for premiumAbbreviations: DAA, days after anthesis; DM, dry mass; EPP, total SDS-xtractable polymeric proteins; GWM, mass of water per grain; SD, sowingate; SDS, sodium dodecyl sulfate; SPP, small-size polymeric proteins; LPP,
arge-size polymeric proteins; N, nitrogen; TPP, total polymeric proteins; UPP, SDS-nextractable polymeric proteins; %GWC, percent grain water concentration.∗ Corresponding author at: INRA, UMR1095 Genetics, Diversity and Ecophysiologyf Cereals, 5 Chemin de Beaulieu, Cedex 02, F-63 039 Clermont-Ferrand, France.el.: +33 473 624 351; fax: +33 473 624 457.
E-mail addresses: [email protected] (R. Ferrise), [email protected]. Bindi), [email protected] (P. Martre).
ttp://dx.doi.org/10.1016/j.fcr.2014.10.016378-4290/© 2014 Elsevier B.V. All rights reserved.
her to the continuous dehydration of the grain.© 2014 Elsevier B.V. All rights reserved.
products (Marchylo et al., 2001). Therefore, adjustment of variablesto compensate for inter-annual and location variations in semolinaquality lead to high cost for processors in the wheat industry. Abetter understanding of the mechanisms governing environmentalvariations of grain protein composition is thus required.
The gliadin fraction accounts for 20% to 30% of total grain pro-tein content and consists mainly of single chain polypeptides withmolecular mass (Mr) ranging from 15 to 60 × 103, but most are inthe narrow range 25 to 40 × 103 (Bunce et al., 1985; Wieser, 2007).The glutenin fraction accounts for 30% to 45% of total grain proteincontent and consists of very high Mr polymers (5 × 10⁵ to more than1 × 107) stabilized by inter-chain disulfide bonds and are partiallyinsoluble in denaturing sodium dodecyl sulfate (SDS) solutions(Wieser et al., 2006). Glutenin polymers are made of low (LMW-GS;Mr 32 to 35 × 103; D‘Ovidio and Masci, 2004) and high (HMW-GS;Mr 67 to 88 × 103; Gao et al., 2010) molecular mass subunits andaccount for 5% to 10% and 20% to 30% of total grain protein content,respectively. The rheological properties of wheat gluten and doughdepend on the balance between monomeric gliadins and polymeric
glutenins and most importantly on the Mr distribution of the latter(Weegels et al., 1996; MacRitchie, 1999; Don et al., 2003). The ratioof SDS-unextractable polymeric proteins (UPP) to total polymeric
2 ps Res
poBr2
dpwebip12ttpJiphwv
dtsaotJc(pt%mipge
dtatehssotrre
2
2m
o2
4 R. Ferrise et al. / Field Cro
roteins (TPP) has often been used as a measure of the distributionf the Mr of glutenin polymers (e.g. Gupta et al., 1993; Larroque andekes, 2000) and has consistently been linked to dough and glutenheological properties (Southan and MacRitchie, 1999; Morel et al.,000; Ohm et al., 2009).
Extended periods of high temperature are common in mosturum wheat-growing areas of the world and above optimal tem-erature is one of the major environmental factors affecting durumheat yield and quality. Weaker dough from grains that experi-
nce one or several days of very high temperature (>30 ◦C) haseen related to a marked decrease in the proportion of UPP,
ndependently of changes in total grain protein concentration orroportions of gliadin classes or glutenin subunits (Ciaffi et al.,996; Corbellini et al., 1998; Wardlaw et al., 2002; Don et al.,005). Nitrogen (N) supply has strong effect on both grain pro-ein concentration and composition. Higher rate of N applicationend to increase the gliadin-to-glutenin ratio and to decrease theroportion of UPP, resulting in higher dough extensibility (e.g.
ohansson et al., 2004, 2005; Godfrey et al., 2010). Significantnteractions between growing temperature and N supply in grainrotein composition and the size distribution of glutenin polymersave been reported (Johansson et al., 2005; Malik et al., 2011),hich complicate the interpretation of their own effects under
ariable environmental conditions.Some studies have suggested that the formation of UPP in both
urum and bread wheat (T. aestivum L.) may also be controlled byhe water status of critical grain structures and is triggered by theharp increase in grain water loss at physiological maturity (Stonend Nicolas, 1996; Carceller and Aussenac, 1999, 2001). In contrast,ther studies have suggested that the formation of UPP start duringhe grain filling period (Zhu and Khan, 1999; Panozzo et al., 2001;ohansson et al., 2005; Jia et al., 2012), maybe when a threshold con-entration of monomer subunits or small-size polymers is reachedGupta et al., 1996). Moreover, how growing conditions and N sup-ly affect the dynamics of glutenin polymer formation in relationo the cessation of grain dry mass accumulation and changes inGWC is largely unknown. These aspects of glutenin polymer for-ation (i.e. rate and duration of the accumulation) are particularly
mportant to understand how the environment modifies the grainrotein composition and to develop a phenomenological model ofrain protein accumulation and polymer formation in response tonvironmental variations.
The aim of this work was thus to study the effect of sowingate and N fertilization, two important management practices, onhe dynamics of grain dry mass, water mass and concentration,nd protein composition and glutenin polymer size distribution forhe durum wheat cv. Creso grown in the field in a Mediterraneannvironment. In particular, we aimed at testing the followingypothesis: (1) the quantity of the different grain protein fractionscales with the quantity of N per grain and the scaling relation-hips are independent of the growth conditions; (2) the formationf glutenin polymers is related to changes in grain water concen-ration; (3) the insolubilization of glutenin polymers is not directlyelated to the rapid loss of water after physiological maturity, butather to the continuous dehydration of the grain and thus startsarly during the grain-filling period.
. Materials and methods
.1. Experiment set up, plant sampling and grain dry mass, waterass and nitrogen determination
Rain-fed field experiments were carried out at the Universityf Florence, Italy (11◦13′E, 43◦46′N; 42 m elevation) during the002–2003 and 2004–2005 growing seasons (hereafter referred
earch 171 (2015) 23–31
as 2003 and 2005, respectively). Seeds of the durum wheat (T.turgidum L. subsp. durum (Desf.) Husn.) cultivar Creso were sownon 11 December 2002 and 05 November 2004 (normal sowing,treatments termed 03SD1 and 05SD1, respectively), and 27 January2003 and 18 January 2005 (late sowing, hereafter 03SD2 and 05SD2,respectively). Creso is a semi-dwarf Italian durum wheat cultivar,characterised by very limited cold requirements and a high sensi-tivity to photoperiod (Motzo and Giunta, 2007). Due to its moderatebut constant yield and its great adaptability to Italian environmen-tal conditions, it has been widely cultivated during past decadesand is still in use (Arduini et al., 2006).
Three N treatments were applied with a total of 0, 6, and18 g N m−2 (hereafter N0, N6, and N18, respectively). The treat-ments were arranged in a split-plot design with three blocks, wherethe main plots corresponded to the sowing dates. For a detaileddescription of the experiment set up and data collection the readeris referred to Ferrise et al. (2010). Daily weather data were recordedon a weather station adjacent to the field plots. Thermal time wascalculated by summing daily degree-days, which were calculatedas the daily mean air temperatures above a base temperature of0 ◦C (Cao and Moss, 1989).
Within each subplot, 20 plants were randomly tagged and theirphenological development determined as described in Tottman(1987) by daily inspections in the field. For each treatment, 16mainstems were randomly collected at 5–7 days intervals start-ing at growth stage (GS) 71 (grain water ripe) in 2003 and at GS65 (anthesis) in 2005. Spikes were hand threshed and grains werecounted. Grain dry mass (DM) was determined on subsamples (ca.one-third of the whole sample weight) after oven drying at 80 ◦Cfor 48 h. Average single grain water mass (GWM) was calculated asthe difference between fresh mass and DM divided by the numberof grains of the subsample.
The remaining grains were freeze-dried and milled to wholeflour using a rotor mill (Cyclomill, PBI, UK). Grain total N concen-tration was determined with the Dumas method (AOAC method no.7.024) using a FlashEA 1112 NC Analyzer (Thermo Electron Corp.,Waltham, MA, USA) and was expressed on a DM basis. Grain proteinconcentration was calculated by multiplying grain N concentrationby 5.62 (Tkachuk, 1966; Mossé et al., 1985).
2.2. Protein extraction
Whole flour samples (75 mg) were stirred for 2 h at 60 ◦C inthe presence of 7.5 mL of a 0.1 M sodium phosphate buffer (pH6.9) containing 2% (v/v) sodium dodecyl sulfate (SDS), and werethen centrifuged for 30 min at 37.5 × 10³ × g at 20 ◦C (Dachkevitchand Autran, 1989) to obtain a supernatant (SDS-extractable pro-tein fractions). The Pellets were then stirred for 10 min at roomtemperature in the presence of 7.5 mL of the same extractant, andthe resulting dispersion was sonicated for 30 s at 10 W and 22.5 kHz(Daniel and Triboi, 2002), using a 3-mm diameter probe mountedon a XL—MicrosonTM ultrasonic cell disruptor (Misonic Inc., NY,USA). After centrifugation (30 min, 37.5 × 10³ × g, 20 ◦C), the super-natants (SDS-unextractable protein fractions) were collected. Bothextracts were filtered through 0.20 �m regenerated cellulose fil-ters (Titan2 HPLC filtration systems, Sun SRi, TN, USA) and storedat −20 ◦C in sealed HPLC vials until analysis.
2.3. Protein fractionation and quantification by size-exclusionhigh performance liquid chromatography
Proteins in the SDS-extractable and -unextractable frac-
tions were fractionated by size-exclusion high performanceliquid chromatography (SE-HPLC) using a Bio-Tek Kontron HPLC(Bio-Tek Instruments, Inc., VT, USA). A Kroma System 2000V1.83 was used to control the pump and for acquisition and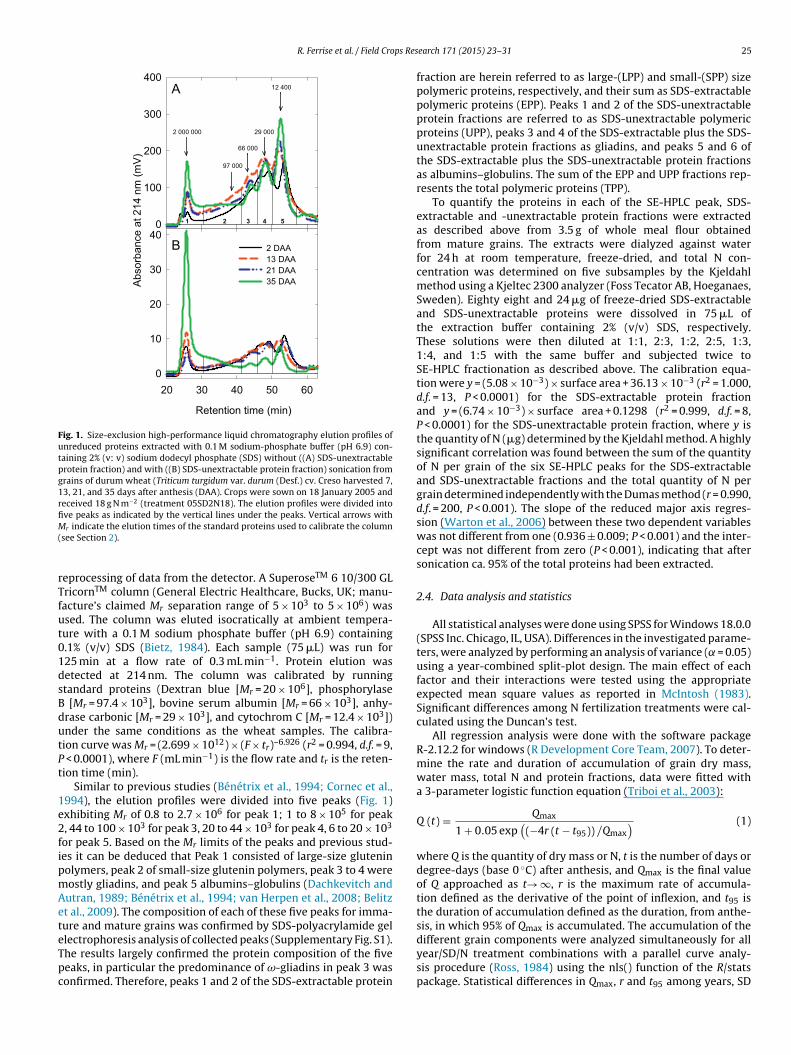
R. Ferrise et al. / Field Crops Res
Retent ion time ( min)
20 30 40 50 600
10
20
30
40
Abs
orba
nce
at 2
14 n
m (m
V)
0
100
200
300
400
2 DAA13 DAA21 DAA35 DAA
A
B
1 2 3 4 5
2 000 00 0
97 000
66 000
29 00 0
12 400
Fig. 1. Size-exclusion high-performance liquid chromatography elution profiles ofunreduced proteins extracted with 0.1 M sodium-phosphate buffer (pH 6.9) con-taining 2% (v: v) sodium dodecyl phosphate (SDS) without ((A) SDS-unextractableprotein fraction) and with ((B) SDS-unextractable protein fraction) sonication fromgrains of durum wheat (Triticum turgidum var. durum (Desf.) cv. Creso harvested 7,13, 21, and 35 days after anthesis (DAA). Crops were sown on 18 January 2005 andreceived 18 g N m−2 (treatment 05SD2N18). The elution profiles were divided intofive peaks as indicated by the vertical lines under the peaks. Vertical arrows withM(
rTfut01dsBdutPt
1e2fipmAeteTpc
different grain components were analyzed simultaneously for all
r indicate the elution times of the standard proteins used to calibrate the columnsee Section 2).
eprocessing of data from the detector. A SuperoseTM 6 10/300 GLricornTM column (General Electric Healthcare, Bucks, UK; manu-acture’s claimed Mr separation range of 5 × 10³ to 5 × 10⁶) wassed. The column was eluted isocratically at ambient tempera-ure with a 0.1 M sodium phosphate buffer (pH 6.9) containing.1% (v/v) SDS (Bietz, 1984). Each sample (75 �L) was run for25 min at a flow rate of 0.3 mL min−1. Protein elution wasetected at 214 nm. The column was calibrated by runningtandard proteins (Dextran blue [Mr = 20 × 106], phosphorylase
[Mr = 97.4 × 10³], bovine serum albumin [Mr = 66 × 103], anhy-rase carbonic [Mr = 29 × 103], and cytochrom C [Mr = 12.4 × 10³])nder the same conditions as the wheat samples. The calibra-ion curve was Mr = (2.699 × 10¹²) × (F × tr)–6.926 (r2 = 0.994, d.f. = 9,
< 0.0001), where F (mL min−1) is the flow rate and tr is the reten-ion time (min).
Similar to previous studies (Bénétrix et al., 1994; Cornec et al.,994), the elution profiles were divided into five peaks (Fig. 1)xhibiting Mr of 0.8 to 2.7 × 10⁶ for peak 1; 1 to 8 × 10⁵ for peak, 44 to 100 × 103 for peak 3, 20 to 44 × 103 for peak 4, 6 to 20 × 103
or peak 5. Based on the Mr limits of the peaks and previous stud-es it can be deduced that Peak 1 consisted of large-size gluteninolymers, peak 2 of small-size glutenin polymers, peak 3 to 4 wereostly gliadins, and peak 5 albumins–globulins (Dachkevitch andutran, 1989; Bénétrix et al., 1994; van Herpen et al., 2008; Belitzt al., 2009). The composition of each of these five peaks for imma-ure and mature grains was confirmed by SDS-polyacrylamide gellectrophoresis analysis of collected peaks (Supplementary Fig. S1).
he results largely confirmed the protein composition of the fiveeaks, in particular the predominance of ω-gliadins in peak 3 wasonfirmed. Therefore, peaks 1 and 2 of the SDS-extractable proteinearch 171 (2015) 23–31 25
fraction are herein referred to as large-(LPP) and small-(SPP) sizepolymeric proteins, respectively, and their sum as SDS-extractablepolymeric proteins (EPP). Peaks 1 and 2 of the SDS-unextractableprotein fractions are referred to as SDS-unextractable polymericproteins (UPP), peaks 3 and 4 of the SDS-extractable plus the SDS-unextractable protein fractions as gliadins, and peaks 5 and 6 ofthe SDS-extractable plus the SDS-unextractable protein fractionsas albumins–globulins. The sum of the EPP and UPP fractions rep-resents the total polymeric proteins (TPP).
To quantify the proteins in each of the SE-HPLC peak, SDS-extractable and -unextractable protein fractions were extractedas described above from 3.5 g of whole meal flour obtainedfrom mature grains. The extracts were dialyzed against waterfor 24 h at room temperature, freeze-dried, and total N con-centration was determined on five subsamples by the Kjeldahlmethod using a Kjeltec 2300 analyzer (Foss Tecator AB, Hoeganaes,Sweden). Eighty eight and 24 �g of freeze-dried SDS-extractableand SDS-unextractable proteins were dissolved in 75 �L ofthe extraction buffer containing 2% (v/v) SDS, respectively.These solutions were then diluted at 1:1, 2:3, 1:2, 2:5, 1:3,1:4, and 1:5 with the same buffer and subjected twice toSE-HPLC fractionation as described above. The calibration equa-tion were y = (5.08 × 10⁻³) × surface area + 36.13 × 10⁻³ (r2 = 1.000,d.f. = 13, P < 0.0001) for the SDS-extractable protein fractionand y = (6.74 × 10⁻³) × surface area + 0.1298 (r2 = 0.999, d.f. = 8,P < 0.0001) for the SDS-unextractable protein fraction, where y isthe quantity of N (�g) determined by the Kjeldahl method. A highlysignificant correlation was found between the sum of the quantityof N per grain of the six SE-HPLC peaks for the SDS-extractableand SDS-unextractable fractions and the total quantity of N pergrain determined independently with the Dumas method (r = 0.990,d.f. = 200, P < 0.001). The slope of the reduced major axis regres-sion (Warton et al., 2006) between these two dependent variableswas not different from one (0.936 ± 0.009; P < 0.001) and the inter-cept was not different from zero (P < 0.001), indicating that aftersonication ca. 95% of the total proteins had been extracted.
2.4. Data analysis and statistics
All statistical analyses were done using SPSS for Windows 18.0.0(SPSS Inc. Chicago, IL, USA). Differences in the investigated parame-ters, were analyzed by performing an analysis of variance ( ̨ = 0.05)using a year-combined split-plot design. The main effect of eachfactor and their interactions were tested using the appropriateexpected mean square values as reported in McIntosh (1983).Significant differences among N fertilization treatments were cal-culated using the Duncan’s test.
All regression analysis were done with the software packageR-2.12.2 for windows (R Development Core Team, 2007). To deter-mine the rate and duration of accumulation of grain dry mass,water mass, total N and protein fractions, data were fitted witha 3-parameter logistic function equation (Triboi et al., 2003):
Q (t) = Qmax
1 + 0.05 exp(
(−4r (t − t95)) /Qmax) (1)
where Q is the quantity of dry mass or N, t is the number of days ordegree-days (base 0 ◦C) after anthesis, and Qmax is the final valueof Q approached as t→ ∞, r is the maximum rate of accumula-tion defined as the derivative of the point of inflexion, and t95 isthe duration of accumulation defined as the duration, from anthe-sis, in which 95% of Qmax is accumulated. The accumulation of the
year/SD/N treatment combinations with a parallel curve analy-sis procedure (Ross, 1984) using the nls() function of the R/statspackage. Statistical differences in Qmax, r and t95 among years, SD

2 ps Research 171 (2015) 23–31
adctl2iwigr
3
3
tasw2i2wmi(dfod
3
Dat2Aalf
adD2(
rla(iTmgs
3
t
Days after anthes is
0 10 20 30 40 50
Gra
in w
ater
(mg
H2O
gra
in-1
)
0
10
20
30
40
50
Gra
in to
tal N
(mg
N g
rain
-1)
0.0
0.3
0.6
0.9
1.2
1.5
Gra
in d
ry m
ass
(mg
DM
gra
in-1
)
0
10
20
30
40
50
60A
B
C
2003 2005 SD1 SD2 SD1 SD2
N0N6N18
Fig. 2. Grain dry mass (A), total nitrogen (B), and water content (C) versus daysafter anthesis for durum wheat cv. Creso grown in the field at Florence, Italy, duringthe 2002–2003 (03) and 2004–2005 (05) growing seasons. The crops were sownin October/November (normal sowing, SD1) or in January (late sowing, SD2) andreceived either 0, 6, or 18 g N m−2 (N0, N6, and N18, respectively). Data are means±1 s.e. for n = 3 independent replicates.
6 R. Ferrise et al. / Field Cro
nd N treatments were judged by comparing the eight models pro-uced by the parallel curve analysis by ANOVA analyses and byalculating the second-order corrected Akaike’s information cri-erion using the ACIc() function of the R/qpcR package. Piecewiseinear models were fitted using the R/segmented package (Muggeo,003). Differences in grain water concentration at which grain fill-
ng ceased and the rate of polymeric protein fractions changedere considered as significantly different when the 95% confidence
nterval (CI95%) of their difference did not contain zero. Allometricrain N allocation relationships were fitted by reduced major axisegression using the R/smatr package (Warton et al., 2012).
. Results
.1. Weather conditions
The two seasons differed greatly in the amount and distribu-ion of rainfall and temperature (Supplementaty Table S1 availablet JXB online; Ferrise et al., 2010). Weather in 2005 was moreimilar to the climatology of the area, while 2003 was drier andarmer than usual. During the wheat growing season, rainfalls in
003 were halved compared to 2005 (205 mm in 2003 vs 417 mmn 2005). In particular during grain filling, rainfalls in 2003 were5 mm for 03SD1 and only 8 mm for 03SD2, whilst in 2005 rainfallsere 75 and 30 mm for 05SD1 and 05SD2, respectively (Supple-entary Table S1). Average daily temperature was ca. 1 ◦C higher
n 2003 than in 2005 and for the late (SD2) than for the normalSD1) sowing date. During the post-anthesis period, the number ofays with maximum daily temperature (Tmax) above 30 ◦C rangedrom 17 days in 05SD1 to 30 days in 03SD2. During the same period,n average, Tmax exceeded 35 ◦C in 10 days during 2003 and in 2ays in 2005.
.2. Dynamics of single grain dry mass, nitrogen and water
Year and SD affected the rate but not the duration of grainM accumulation (Fig. 2A). The differences were almost entirelyscribed to the mean daily maximum temperature calculated forhe 15 days prior to anthesis (r = −0.99; P = 0.002; Ferrise et al.,010). The kinetics of grain DM was not modified by N treatments.lthough more evident in 2005 than in 2003, SD and N treatmentsffected both the rate and the duration of grain N accumulationeading to higher quantity of N per grain for SD2 and with higher Nertilization rates (Fig. 2B; Supplementary Table S2).
The mass of water per grain (GWM) increased gradually fromnthesis until 21 days later and then remained constant until 30ays after anthesis (DAA; Fig. 2C). GWM decreased sharply after 30AA. Although statistically significant, maximum GWM was only% and 6% lower for N6 and N18 compared with N0, respectivelySupplementary Table S2).
Plotting grain DM normalized by final grain DM versus %GWC,evealed a unique relationship (Fig. 3A). Grain DM increasedinearly with respect to %GWC and regardless of the year, SDnd N treatment the maximum grain DM was reached at 44.9%CI95% = 43.3–46.4%). In Fig. 3B the GWM normalized by the max-mum GWM was plotted versus the percentage of final grain DM.he results indicated that, regardless of the year, SD or N treat-ent, grain DM accumulation continued up to the beginning of the
rain dehydration phase, suggesting that the end of grain filling isynchronous with the end of the water plateau.
.3. Dynamics of grain protein fractions
In both years, the final quantity per grain of the different pro-ein fractions was strongly modified by the SD and N treatments
(Fig. 4 and Supplementary Table S3). Year × SD and year × N inter-actions were significant for all the protein fractions except foralbumin–globulin, for which only the year × SD interaction wassignificant. Higher final quantities per grain of the three proteinfractions were found in 2005 than in 2003, for SD2 compared to SD1and at higher N fertilization rates. Due to the interactions betweenthe main factors, the effects of SD and N were larger in 2005 thanin 2003.
The kinetics of the different protein fractions reflected thedynamics of total grain N, but the rate of accumulation ofalbumin–globulin increased before that of gliadin and TPP and therate of accumulation of TPP increased after that of gliadin (Fig. 4).When averaged over the two years and SD and N treatments, themaximum rate of accumulation was similar for the albumins–
globulins (0.020 ± 0.001 mg N grain−1 d−1) and the gliadin(0.021 ± 0.001 mg N grain−1 d−1) but was slightly higher for TPP(0.023 ± 0.001 mg N grain−1 d−1). On average, albumin–globulin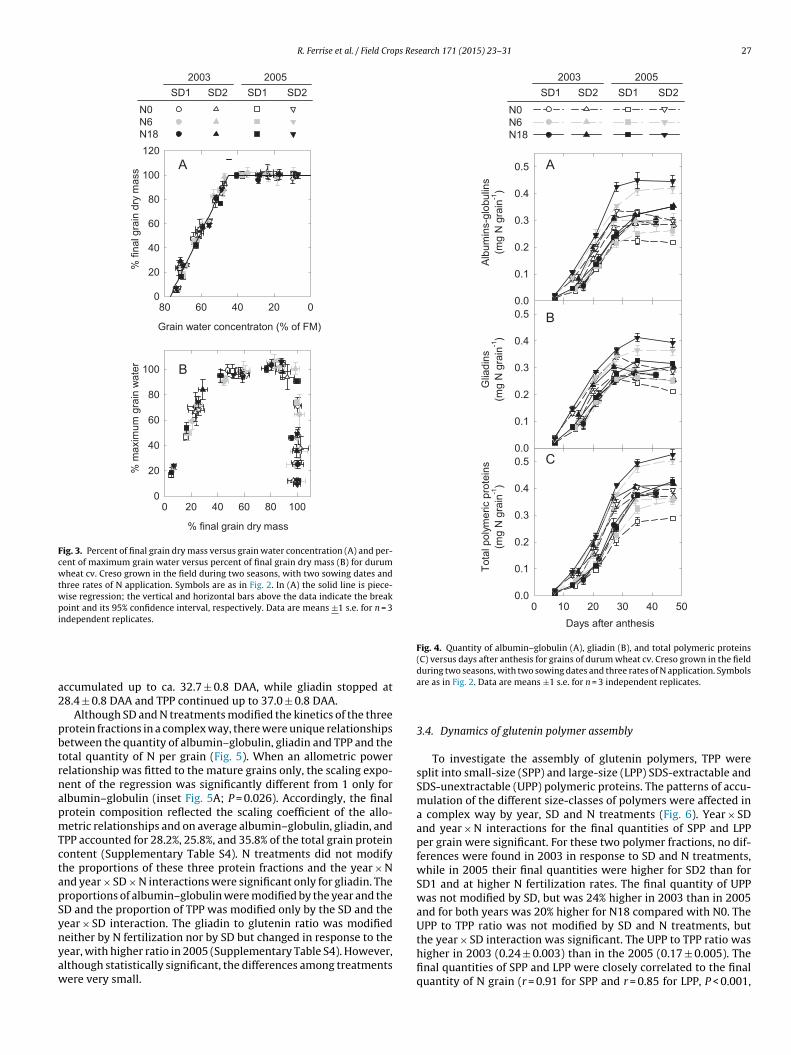
R. Ferrise et al. / Field Crops Research 171 (2015) 23–31 27
Grain water concentraton (% of FM)
020406080
% fi
nal g
rain
dry
mas
s
0
20
40
60
80
100
120
% final grain dr y mass
0 20 40 60 80 100
% m
axim
um g
rain
wat
er
0
20
40
60
80
100 B
2003 2005 SD1 SD2 SD1 SD2
N0N6N18
A
Fig. 3. Percent of final grain dry mass versus grain water concentration (A) and per-cent of maximum grain water versus percent of final grain dry mass (B) for durumwheat cv. Creso grown in the field during two seasons, with two sowing dates andthree rates of N application. Symbols are as in Fig. 2. In (A) the solid line is piece-wise regression; the vertical and horizontal bars above the data indicate the breakpoint and its 95% confidence interval, respectively. Data are means ±1 s.e. for n = 3independent replicates.
a2
pbtrnapmTctapSynyaw
Days after anthes is0 10 20 30 40 50
Tota
l pol
ymer
ic p
rote
ins
(mg
N g
rain
-1)
0.0
0.1
0.2
0.3
0.4
0.5
Glia
dins
(mg
N g
rain
-1)
0.0
0.1
0.2
0.3
0.4
0.5
Alb
umin
s-gl
obul
ins
(mg
N g
rain
-1)
0.0
0.1
0.2
0.3
0.4
0.5 A
B
C
2003 2005 SD1 SD2 SD1 SD2
N0N6N18
Fig. 4. Quantity of albumin–globulin (A), gliadin (B), and total polymeric proteins(C) versus days after anthesis for grains of durum wheat cv. Creso grown in the fieldduring two seasons, with two sowing dates and three rates of N application. Symbols
higher in 2003 (0.24 ± 0.003) than in the 2005 (0.17 ± 0.005). Thefinal quantities of SPP and LPP were closely correlated to the final
ccumulated up to ca. 32.7 ± 0.8 DAA, while gliadin stopped at8.4 ± 0.8 DAA and TPP continued up to 37.0 ± 0.8 DAA.
Although SD and N treatments modified the kinetics of the threerotein fractions in a complex way, there were unique relationshipsetween the quantity of albumin–globulin, gliadin and TPP and theotal quantity of N per grain (Fig. 5). When an allometric powerelationship was fitted to the mature grains only, the scaling expo-ent of the regression was significantly different from 1 only forlbumin–globulin (inset Fig. 5A; P = 0.026). Accordingly, the finalrotein composition reflected the scaling coefficient of the allo-etric relationships and on average albumin–globulin, gliadin, and
PP accounted for 28.2%, 25.8%, and 35.8% of the total grain proteinontent (Supplementary Table S4). N treatments did not modifyhe proportions of these three protein fractions and the year × Nnd year × SD × N interactions were significant only for gliadin. Theroportions of albumin–globulin were modified by the year and theD and the proportion of TPP was modified only by the SD and theear × SD interaction. The gliadin to glutenin ratio was modifiedeither by N fertilization nor by SD but changed in response to theear, with higher ratio in 2005 (Supplementary Table S4). However,lthough statistically significant, the differences among treatments
ere very small.are as in Fig. 2. Data are means ±1 s.e. for n = 3 independent replicates.
3.4. Dynamics of glutenin polymer assembly
To investigate the assembly of glutenin polymers, TPP weresplit into small-size (SPP) and large-size (LPP) SDS-extractable andSDS-unextractable (UPP) polymeric proteins. The patterns of accu-mulation of the different size-classes of polymers were affected ina complex way by year, SD and N treatments (Fig. 6). Year × SDand year × N interactions for the final quantities of SPP and LPPper grain were significant. For these two polymer fractions, no dif-ferences were found in 2003 in response to SD and N treatments,while in 2005 their final quantities were higher for SD2 than forSD1 and at higher N fertilization rates. The final quantity of UPPwas not modified by SD, but was 24% higher in 2003 than in 2005and for both years was 20% higher for N18 compared with N0. TheUPP to TPP ratio was not modified by SD and N treatments, butthe year × SD interaction was significant. The UPP to TPP ratio was
quantity of N grain (r = 0.91 for SPP and r = 0.85 for LPP, P < 0.001,

28 R. Ferrise et al. / Field Crops Research 171 (2015) 23–31
Grain tota l N (mg N grain-1 )
0.0 0.3 0.6 0.9 1.2 1.5
Tota
l pol
ymer
ic p
rote
ins
(mg
N g
rain
-1)
0.0
0.1
0.2
0.3
0.4
0.5
Glia
dins
(mg
N g
rain
-1)
0.0
0.1
0.2
0.3
0.4
0.5
Alb
umin
s-gl
obul
ins
(mg
N g
rain
-1)
0.0
0.1
0.2
0.3
0.4
0.5 A
B
C
20 03 2005 SD1 SD2 SD1 SD2
N0N6N18
Y = 0.27 X1.25
Y = 0.25 X1.06
Y = 0.35 X1.01
Fig. 5. Quantity of albumin–globulin (A), gliadin (B), and total polymeric proteins(C) versus total grain nitrogen for developing and mature grains of durum wheatcv. Creso grown in the field during two seasons and with two sowing dates andthree rates of N applications. Symbols are as in Fig. 2. Inset show mature grain onlyand solid lines are power regressions fitted on Log transformed data (all r2 < 0.918;d(m
dU
i%tiStw(oebie
Days after anthes is0 10 20 30 40 50
UP
P (m
g N
gra
in-1
)
0.00
0.03
0.06
0.09LP
P (m
g N
gra
in-1
)
0.00
0.05
0.10
0.15
SP
P (m
g N
gra
in-1
)
0.0
0.1
0.2
0.3A
B
C
2003 2005 SD1 SD2 SD1 SD2
N0N6N18
Fig. 6. Quantity of small-size (A) and large-size (B) SDS-extractable polymeric pro-teins and SDS-unextractable polymeric proteins (C) versus days after anthesis for
.f. = 10; and P < 0.001), the scaling exponent was significantly different from oneP = 0.026) only for the albumins–globulins—total nitrogen relationship. Data are
eans ±1 s.e. for n = 3 independent replicates.
.f. = 11), while no correlation were found for the final quantity ofPP (r = 0.26, P = 0.42, d.f. = 11).
The accumulation of the polymeric protein fractions (normal-zed by their maximum value) was analyzed with respect toGWC. Since no significant differences were found among thereatments, piecewise regression analyses were performed pool-ng the data from all the treatments. The normalized quantity ofPP increased linearly up to 47.2% (CI95% = 45.4–49.0%) %GWC andhen decreased slightly (Fig. 7A). For LPP, two distinct break-pointsere clearly detectable (Fig. 7B). The first break-point, at 55.0%
CI95% = 50.3–59.8%), marked a sharp increase of the accumulationf LPP, the second one, at 43.0% (CI95% = 39.4–46.7%), marked the
nd of LPP accumulation. Therefore, the end of the accumulation ofoth SPP and LPP was concomitant with the end of the grain fill-ng. The accumulation of the normalized quantity of UPP started asarly as the first sampling date (7 DAA), progressed slowly up to
grains of durum wheat cv. Creso grown in the field during two seasons and withtwo sowing dates and three rates of N applications. Symbols are as in Fig. 2. Dataare means ±1 s.e. for n = 3 independent replicates.
59.5% (CI95% = 52.6–66.4%), then continued linearly with a markedincrease of the rate of accumulation until grain harvest ripeness(%GWC < 15%).
4. Discussion
In good agreement with previous studies on maize (Saini andWestgate, 2000; Borras and Wesgate, 2006), sorghum (Gambin andBorras, 2005), soybean (Swank et al., 1987), sunflower (Rondaniniet al., 2007), castor bean (Vallejos et al., 2011) and wheat (Schnyderand Baum, 1992; Calderini et al., 2000; Ferreira et al., 2012a) wefound close synchronisms between the dynamics of grain DM andwater during grain development. Regardless of the year, sowingdate and N fertilization rate, the accumulation of DM in the grainproceeded linearly as the %GWC decreased up to a critical value,suggesting the presence of regulatory mechanisms internal tothe grain independent on the environmental conditions. Slafer
et al. (2009) proposed an explanation of such patterns accordingto which reserves replace water into the grain until a criticalminimum content is reached. In our study, the end of grain fillingoccurred at 44.8% of grain moisture. This value is in line with those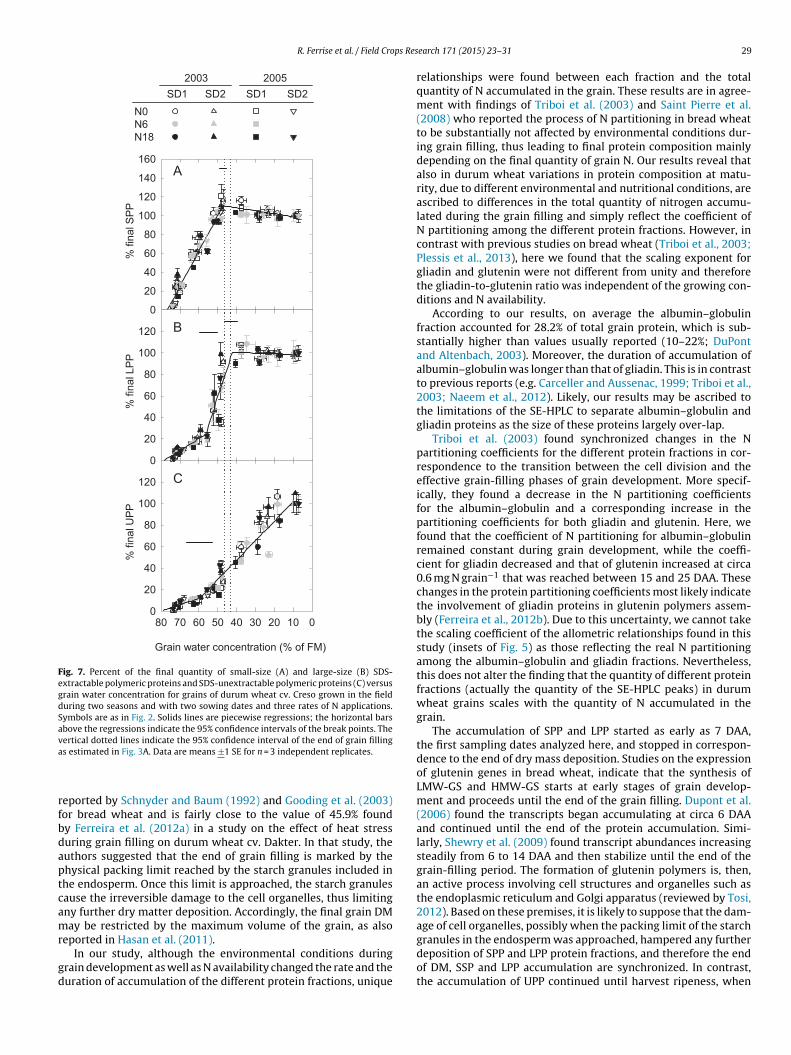
R. Ferrise et al. / Field Crops Res
% fi
nal S
PP
0
20
40
60
80
100
120
140
160
Grain water concen tratio n (% of FM)
01020304050607080
% fi
nal U
PP
0
20
40
60
80
100
120
% fi
nal L
PP
0
20
40
60
80
100
120
A
B
20 03 2005 SD1 SD2 SD1 SD2
N0N6N18
C
Fig. 7. Percent of the final quantity of small-size (A) and large-size (B) SDS-extractable polymeric proteins and SDS-unextractable polymeric proteins (C) versusgrain water concentration for grains of durum wheat cv. Creso grown in the fieldduring two seasons and with two sowing dates and three rates of N applications.Symbols are as in Fig. 2. Solids lines are piecewise regressions; the horizontal barsabove the regressions indicate the 95% confidence intervals of the break points. Thevertical dotted lines indicate the 95% confidence interval of the end of grain fillinga
rfbdaptcamr
gd
granules in the endosperm was approached, hampered any further
s estimated in Fig. 3A. Data are means ±1 SE for n = 3 independent replicates.
eported by Schnyder and Baum (1992) and Gooding et al. (2003)or bread wheat and is fairly close to the value of 45.9% foundy Ferreira et al. (2012a) in a study on the effect of heat stressuring grain filling on durum wheat cv. Dakter. In that study, theuthors suggested that the end of grain filling is marked by thehysical packing limit reached by the starch granules included inhe endosperm. Once this limit is approached, the starch granulesause the irreversible damage to the cell organelles, thus limitingny further dry matter deposition. Accordingly, the final grain DMay be restricted by the maximum volume of the grain, as also
eported in Hasan et al. (2011).
In our study, although the environmental conditions duringrain development as well as N availability changed the rate and theuration of accumulation of the different protein fractions, unique
earch 171 (2015) 23–31 29
relationships were found between each fraction and the totalquantity of N accumulated in the grain. These results are in agree-ment with findings of Triboi et al. (2003) and Saint Pierre et al.(2008) who reported the process of N partitioning in bread wheatto be substantially not affected by environmental conditions dur-ing grain filling, thus leading to final protein composition mainlydepending on the final quantity of grain N. Our results reveal thatalso in durum wheat variations in protein composition at matu-rity, due to different environmental and nutritional conditions, areascribed to differences in the total quantity of nitrogen accumu-lated during the grain filling and simply reflect the coefficient ofN partitioning among the different protein fractions. However, incontrast with previous studies on bread wheat (Triboi et al., 2003;Plessis et al., 2013), here we found that the scaling exponent forgliadin and glutenin were not different from unity and thereforethe gliadin-to-glutenin ratio was independent of the growing con-ditions and N availability.
According to our results, on average the albumin–globulinfraction accounted for 28.2% of total grain protein, which is sub-stantially higher than values usually reported (10–22%; DuPontand Altenbach, 2003). Moreover, the duration of accumulation ofalbumin–globulin was longer than that of gliadin. This is in contrastto previous reports (e.g. Carceller and Aussenac, 1999; Triboi et al.,2003; Naeem et al., 2012). Likely, our results may be ascribed tothe limitations of the SE-HPLC to separate albumin–globulin andgliadin proteins as the size of these proteins largely over-lap.
Triboi et al. (2003) found synchronized changes in the Npartitioning coefficients for the different protein fractions in cor-respondence to the transition between the cell division and theeffective grain-filling phases of grain development. More specif-ically, they found a decrease in the N partitioning coefficientsfor the albumin–globulin and a corresponding increase in thepartitioning coefficients for both gliadin and glutenin. Here, wefound that the coefficient of N partitioning for albumin–globulinremained constant during grain development, while the coeffi-cient for gliadin decreased and that of glutenin increased at circa0.6 mg N grain−1 that was reached between 15 and 25 DAA. Thesechanges in the protein partitioning coefficients most likely indicatethe involvement of gliadin proteins in glutenin polymers assem-bly (Ferreira et al., 2012b). Due to this uncertainty, we cannot takethe scaling coefficient of the allometric relationships found in thisstudy (insets of Fig. 5) as those reflecting the real N partitioningamong the albumin–globulin and gliadin fractions. Nevertheless,this does not alter the finding that the quantity of different proteinfractions (actually the quantity of the SE-HPLC peaks) in durumwheat grains scales with the quantity of N accumulated in thegrain.
The accumulation of SPP and LPP started as early as 7 DAA,the first sampling dates analyzed here, and stopped in correspon-dence to the end of dry mass deposition. Studies on the expressionof glutenin genes in bread wheat, indicate that the synthesis ofLMW-GS and HMW-GS starts at early stages of grain develop-ment and proceeds until the end of the grain filling. Dupont et al.(2006) found the transcripts began accumulating at circa 6 DAAand continued until the end of the protein accumulation. Simi-larly, Shewry et al. (2009) found transcript abundances increasingsteadily from 6 to 14 DAA and then stabilize until the end of thegrain-filling period. The formation of glutenin polymers is, then,an active process involving cell structures and organelles such asthe endoplasmic reticulum and Golgi apparatus (reviewed by Tosi,2012). Based on these premises, it is likely to suppose that the dam-age of cell organelles, possibly when the packing limit of the starch
deposition of SPP and LPP protein fractions, and therefore the endof DM, SSP and LPP accumulation are synchronized. In contrast,the accumulation of UPP continued until harvest ripeness, when

3 ps Res
%cni
%roT2tgptt(tpog(p(ptatpcttttr
5
tcsiidammsmilNftalg
dn(csr
0 R. Ferrise et al. / Field Cro
GWC was close to 10%, well after the end of grain filling and of anyellular activity. This suggests that the assembly of UPP is a sponta-eous process that can take place even when the “cell machinery”
s not functioning.In this study, UPP accumulation increased markedly at 59.5%
GWC, when grain dry mass was only 60% of its final value. Theelative rate of UPP accumulation was constant and independentf the growing conditions and N supply until harvest maturity.his is in contrast with findings of Carceller and Aussenac (1999,001) on bread wheat, who reported that the rapid increase ofhe UPP fraction is concomitant with the rapid water loss duringrain desiccation. They attributed this dynamic to the increasedrotein interactions consequent to the disruption of protein bodieshat would increase the molecular density and facilitate the forma-ion of inter-chain disulphide bonds. Likewise, Daniel and Triboi2002) found similar dynamics and reported of earlier insolubiliza-ion under drought conditions. They related the insolubilization ofroteins to the polimerization of smaller size proteins into largernes and suggested that this process is related to the changes inrain water and redox status. Based on these findings, Shewry et al.2009) implied a possible influence of grain dehydration on proteinolymerization. On the contrary, in durum wheat, Ferreira et al.2012a) demonstrated the glutenin polymer assembly to be inde-endent on the loss of integrity of protein bodies. Furthermore,hey report accumulation UPP from the early phase of grain fillingnd did not record any change in the rate of accumulation duringhe desiccation phase. They ascribed the formation of UPP to therogressive polymerization of EPP and related this dynamic to theontinuous decrease of the cellular redox status observed duringhe grain filling. Our results reinforce this hypothesis and suggesthat the insolubilization of glutenin polymers is not directly relatedo the rapid loss of water after physiological maturity, but rathero the continuous dehydration of the grain and the change in theedox conditions.
. Conclusion
With the aim to explore the kinetics of grain dry mass and pro-ein accumulation and glutenin polymer assembly as affected byrop management practices, crops of durum wheat cv. Creso wereown at two different sowing dates and fertilized with increas-ng doses of N. We show that (1) the accumulation of dry massn the grain is associated by %GWC and stopped at 44.9% indepen-ently of the growing conditions and N supply; (2) the quantity oflbumin–globulin, gliadin and glutenin per grain in immature andature grains scales with the quantity of N per grain; (3) the for-ation of SPP and LPP is a continuous process that ceases at the
ame %GWC as dry mass deposition; and (4) the rate of UPP accu-ulation increases sharply at 59.5% %GWC, when grain dry mass
s only 60% of its final value and the relative rate of UPP accumu-ation is constant and independent of the growing conditions and
supply until harvest ripeness when %GWC is close to 10%. There-ore, in contrast with previous findings, our results suggest thathe insolubilization of glutenin polymers starts as early as 7 DAAnd is not directly related to the rapid loss of water after physio-ogical maturity, but rather to the continuous dehydration of therain.
The findings discussed in this paper are relevant to a singleurum wheat cultivar. Consequently, any generalization mighteed caution. In particular, thresholds values found in this study
e.g. the %GWC at which UPP start to accumulate rapidly) mayhange depending on the cultivar considered. Accordingly, furthertudies analyzing the genetic variability of these parameters areequired.earch 171 (2015) 23–31
Acknowledgements
The authors thank Jean-Luc Ollier and Vitalie Samoil for theirassistance with SE-HPLC analysis and gratefully acknowledge theINRA Environment & Agronomy division for supporting VS througha post-doctoral fellowship. This work was supported by a GalileoFrench/Italian bilateral project (grant no. 08418ZJ).
Appendix A. Supplementary data
Supplementary data associated with this article can be found, inthe online version, at http://dx.doi.org/10.1016/j.fcr.2014.10.016.
References
Arduini, I., Masoni, A., Ercoli, L., Mariotti, M., 2006. Grain yield, and dry matter andnitrogen accumulation and remobilization in durum wheat as affected by varietyand seeding rate. Eur. J. Agron. 25, 309–318.
Belitz, H.D., Grosch, W., Schieberle, P., 2009. Cereals and Cereal Products. Food Chem-istry. Springer-Verlag, Berlin, pp. 670–745 (4th revised and extended edition).
Bénétrix, F., Kaan, F., Autran, J.-C., 1994. Changes in protein complexes of durumwheat in developing seed. Crop Sci. 34, 462–468.
Bietz, J.A., 1984. Analysis of wheat gluten proteins by high-performance liquid chro-matography. Baker’s Dig. 58, 2.
Borras, L., Wesgate, M.E., 2006. Predicting maize kernel sink capacity early in devel-opment. Field Crops Res. 95, 223–233.
Bunce, N.A.C., White, R.P., Shewry, P.R., 1985. Variation in estimates of molecularweights of cereal prolamins by SDS-PAGE. J. Cereal Sci. 3, 131–142.
Calderini, D.F., Abeledo, L.G., Slafer, G.A., 2000. Physiological maturity in wheat basedon kernel water and dry matter. Agron. J. 92, 895–901.
Cao, W.X., Moss, D.N., 1989. Temperature effect on leaf emergence and phyllochronin wheat and barley. Crop Sci. 29, 1018–1021.
Carceller, J.L., Aussenac, T., 1999. Accumulation and changes in molecular size dis-tribution of polymeric proteins in developing grains of hexaploid wheats: roleof the desiccation phase. Aust. J. Plant Physiol. 26, 301–310.
Carceller, J.L., Aussenac, T., 2001. SDS-insoluble glutenin polymer formation in devel-oping grains of hexaploid wheat: the role of the ratio of high to low molecularweight glutenin subunits and drying rate during ripening. Aust. J. Plant Physiol.28, 193–201.
Ciaffi, M., Tozzi, L., Borghi, B., Corbellini, M., Lafiandra, D., 1996. Effect of heat shockduring grain filling on the gluten protein composition of bread wheat. J. CerealSci. 24, 91–100.
Corbellini, M., Mazza, L., Ciaffi, M., Lafiandra, D., Borghi, B., 1998. Effect of heat shockduring grain filling on protein composition and technological quality of wheats.Euphytica 100, 147–154.
Cornec, M., Popineau, Y., Lefebvre, J., 1994. Characterization of gluten subfractionsby SE-HPLC and dynamic rheological analysis in shear. J. Cereal Sci. 19, 131–139.
D‘Ovidio, R., Masci, S., 2004. The low-molecular-weight glutenin subunits of wheatgluten. J. Cereal Sci. 39, 321–339.
Dachkevitch, T., Autran, J.C., 1989. Prediction of baking quality of bread wheats inbreeding programs by size-exclusion high-performance liquid chromatography.Cereal Chem. 66, 448–456.
Daniel, C., Triboi, E., 2002. Changes in wheat protein aggregation during grain devel-opment: effects of temperatures and water stress. Eur. J. Agron. 16, 1–12.
Don, C., Lichtendonk, W.J., Plijter, J.J., Hamer, R.J., 2003. Understanding the linkbetween GMP and dough: from glutenin particles in flour towards developeddough. J. Cereal Sci. 38, 157–165.
Don, C., Lookhart, G., Naeem, H., MacRitchie, F., Hamer, R.J., 2005. Heat stress andgenotype affect the glutenin particles of the glutenin macropolymer-gel fraction.J. Cereal Sci. 42, 69–80.
DuPont, F.M., Altenbach, S.B., 2003. Molecular and biochemical impacts of environ-mental factors on wheat grain development and protein synthesis. J. Cereal Sci.38, 133–146.
Dupont, F.M., Hurkman, W.J., Vensel, W.H., Tanaka, C., Kothari, K.M., Chung, O.K.,Altenbach, S.B., 2006. Protein accumulation and composition in wheat grains:effects of mineral nutrients and high temperature. Eur. J. Agron. 25, 96–107.
Ferreira, M.S.L., Martre, P., Mangavel, C., Girousse, C., Rosa, N.N., Samson, M.-F., Morel,M.-H., 2012a. Physicochemical control of durum wheat grain filling and gluteninpolymer assembly under different temperature regimes. J. Cereal Sci. 56, 58–66.
Ferreira, M.S.L., Samson, M.-F., Bonicel, J., Morel, M.-H., 2012b. Relationship betweenendosperm cells redox homeostasis and glutenin polymers assembly in devel-oping durum wheat grain. Plant Physiol. Biochem. 61, 36–45.
Ferrise, R., Triossi, A., Stratonovitch, P., Bindi, M., Martre, P., 2010. Sowing date andnitrogen fertilisation effects on dry matter and nitrogen dynamics for durumwheat: an experimental and simulation study. Field Crops Res. 117, 245–257.
Gambin, B.L., Borras, L., 2005. Sorghum kernel weight: growth patterns from differ-
ent positions within the panicle. Crop Sci. 45, 553–561.Gao, L., Ma, W., Chen, J., Wang, K., Li, J., Wang, S., Bekes, F., Appels, R., Yan, Y., 2010.Characterization and comparative analysis of wheat high molecular weightglutenin subunits by SDS-PAGE, RP-HPLC, HPCE, and MALDI–TOF–MS. J. Agric.Food Chem. 58, 2777–2786.

ps Res
G
G
G
G
G
H
J
J
J
L
M
M
M
M
M
M
M
M
N
O
P
P
R. Ferrise et al. / Field Cro
odfrey, D., Hawkesford, M.J., Powers, S.J., Millar, S., Shewry, P.R., 2010. Effects ofcrop nutrition on wheat grain composition and end use quality. J. Agric. FoodChem. 58, 3012–3021.
ooding, M.J., Ellis, R.H., Shewry, P.R., Schofield, J.D., 2003. Effects of restricted wateravailability and increased temperature on the grain filling, drying and quality ofwinter wheat. J. Cereal Sci. 37, 295–309.
ras, P.W., Anderssen, R.S., Keentok, M., Békés, F., Appels, R., 2001. Gluten pro-tein functionality in wheat flour processing: a review. Aust. J. Agric. Res. 52,1311–1323.
upta, R.B., Khan, K., MacRitchie, F., 1993. Biochemical basis of flour propertiesin bread wheats. I. Effects of variation in the quantity and size distribution ofpolymeric protein. J. Cereal Sci. 18, 23–41.
upta, R.B., Masci, S., Lafiandra, D., Bariana, H.S., MacRitchie, F., 1996. Accumulationof protein subunits and their polymers in developing grains of hexaploid wheats.J. Exp. Bot. 47, 1377–1385.
asan, A.K., Herrera, J., Lizana, C., Calderini, D.F., 2011. Carpel weight, grain lengthand stabilized grain water content are physiological drivers of grain weightdetermination of wheat. Field Crops Res. 123, 241–247.
ia, D., Dai, X., He, M., 2012. Polymerization of glutenin during grain developmentand quality expression in winter wheat in response to irrigation levels. Crop Sci.52, 1816–1827.
ohansson, E., Kuktaite, R., Andersson, A., Prieto-Linde, M.L., 2005. Protein poly-mer build-up during wheat grain development: influences of temperature andnitrogen timing. J. Sci. Food Agric. 85, 473–479.
ohansson, E., Prieto-Linde, M.L., Svensson, G., 2004. Influence of nitrogen applicationrate and timing on grain protein composition and gluten strength in Swedishwheat cultivars. J. Plant Nutr. Soil Sci. 167, 345–350.
arroque, O.R., Bekes, F., 2000. Rapid size-exclusion chromatography analysis ofmolecular zie distribution for wheat endosperm protein. Cereal Chem. 77,451–453.
acRitchie, F., 1999. Wheat proteins: characterization and role in flour functionality.Cereal Foods World 44, 188–193.
alik, A.H., Prieto-Linde, M.L., Kuktaite, R., Andersson, A., Johansson, E., 2011. Indi-vidual and interactive effects of cultivar maturation time, nitrogen regime andtemperature level on accumulation of wheat grain proteins. J. Sci. Food Agric.91, 2192–2200.
archylo, B.A., Dexter, J.E., Clarke, F.R., Clarke, J.M., Preston, K.R., 2001. Relationshipsamong bread-making quality, gluten strength, physical dough properties, andpasta cooking quality for some Canadian durum wheat genotypes. Can. J. PlantSci. 81, 611–620.
cIntosh, M.S., 1983. Analysis of combined experiments. Agron. J. 153–155,153–155.
orel, M.-H., Dehlon, P., Autran, J.C., Leygue, J.P., L.H.h., C.B., 2000. Effects of temper-ature, sonication time, and power settings on size distribution and extractabilityof total wheat flour proteins as determined by size-exclusion high-performanceliquid chromatography. Cereal Chem. 77, 685–691.
ossé, J., Huet, J.C., Baudet, J., 1985. The amino acid composition of wheat grain asa function of nitrogen content. J. Cereal Sci. 3, 115–130.
otzo, R., Giunta, F., 2007. The effect of breeding on the phenology of Italian durumwheats: from landraces to modern cultivars. Eur. J. Agron. 26, 462–470.
uggeo, V.M.R., 2003. Estimating regression models with unknown break-points.Stat. Med., 22.
aeem, H.A., Paulon, D., Irmak, S., MacRitchie, F., 2012. Developmental and environ-mental effects on the assembly of glutenin polymers and the impact on grainquality of wheat. J. Cereal Sci. 56, 51–57.
hm, J.B., Hareland, G., Simsek, S., Seabourn, B., 2009. Size-exclusion HPLC of pro-tein using a narrow-bore column for evaluation of breadmaking quality of hardspring wheat flours. Cereal Chem. 86, 463–469.
anozzo, J.F., Eagles, H.A., Wootton, M., 2001. Changes in protein composition during
grain development in wheat. Aust. J. Agric. Res. 52, 485–493.lessis, A., Ravel, C., Bordes, J., Balfourier, F., Martre, P., 2013. Association studyof wheat grain protein composition reveals that gliadin and glutenin compo-sition are trans-regulated by different chromosome regions. J. Exp. Bot. 64,3627–3644.
earch 171 (2015) 23–31 31
R Development Core Team, 2007. A Language and Environment for Statistical Com-puting. R Foundation for Statistical Computing, Vienna, Austria.
Rondanini, D.P., Savin, R., Hall, A.J., 2007. Estimation of physiological maturity insunflower as a function of fruit water concentration. Eur. J. Agron. 26, 295–309.
Ross, G.J.S., 1984. Parallel model analysis: fitting non-linear models to several setsof data. In: COMPSTAT 1984—Sixth Symposium on Computational Statistics, pp.458–463.
Saini, H.S., Westgate, M.E., 2000. Reproductive development in grain crops duringdrought. Adv. Agron. 68, 59–96.
Saint Pierre, C., Peterson, C.J., Ross, A.S., Ohm, J.B., Verhoeven, M.C., Larson, M., Hoefer,B., 2008. Winter wheat genotypes under different levels of nitrogen and waterstress: changes in grain protein composition. J. Cereal Sci. 47, 407–416.
Schnyder, H., Baum, U., 1992. Growth of the grain of wheat (Triticum aestivum L.).The relationship between water content and dry matter accumulation. Eur. J.Agron. 1, 51–57.
Shewry, P.R., Halford, N.G., 2002. Cereal seed storage proteins: structures, propertiesand role in grain utilization. J. Exp. Bot. 53, 947–958.
Shewry, P.R., Underwood, C., Wan, Y., Lovegrove, A., Bhandari, D., Toole, G., Mills,E.N.C., Denyer, K., Mitchell, R.A.C., 2009. Storage product synthesis and accumu-lation in developing grains of wheat. J. Cereal Sci. 50, 106–112.
Slafer, G.A., Kantolic, A.G., Appendino, M.L., Miralles, D.J., Savin, R., 2009. Crop devel-opment: genetic control, environmental modulation and relevance for geneticimprovement of crop yield. In: Sadras, V.O., Miralles, D.J. (Eds.), Crop Physiol-ogy. Applications for Genetic Improvement and Agronomy Academic Press, SanDiego, CA, pp. 277–308.
Southan, M., MacRitchie, F., 1999. Molecular weight distribution of wheat proteins.Cereal Chem. 76, 827–836.
Stone, P.J., Nicolas, M.E., 1996. Varietal differences in mature protein compositionof wheat resulted from different rates of polymer accumulation during grainfilling. Aust. J. Plant Physiol. 23, 727–737.
Swank, J.C., Egli, D.B., Pfeiffer, T.W., 1987. Seed growth characterisitcs of soybeangenotypes differing in duration of seed fill. Crop Sci. 27, 85–889.
Tkachuk, R., 1966. Note on the nitrogen-to-protein conversion factor for wheat flour.Cereal Chem. 43, 223–225.
Tosi, P., 2012. Trafficking and deposition of prolamins in wheat. J. Cereal Sci. 56,81–90.
Tottman, D.R., 1987. The decimal code for the growth stages of cereals, with illus-trations. Ann. Appl. Biol. 110, 441–454.
Triboi, E., Martre, P., Triboi-Blondel, A.-M., 2003. Environmentally-induced changesof protein composition for developing grains of wheat are related to changes intotal protein content. J. Exp. Bot. 54, 1731–1742.
Vallejos, M., Rondanini, D., Wassner, D.F., 2011. Water relationships of castor bean(Ricinus communis L.) seeds related to final seed dry weight and physiologicalmaturity. Eur. J. Agron. 35, 93–101.
van Herpen, T.W.J.M., Cordewener, J.H.G., Klok, H.J., Freeman, J., America, A.H.P.,Bosch, D., Smulders, M.J.M., Gilissen, L.J.W.J., Shewry, P.R., Hamer, R.J., 2008.The origin and early development of wheat glutenin particles. J. Cereal Sci. 48,870–877.
Wardlaw, I.F., Blumenthal, C., Larroque, O., Wrigley, C.W., 2002. Contrasting effectsof chronic heat stress and heat shock on kernel weight and flour quality in wheat.Funct. Plant Biol. 29, 25–34.
Warton, D.I., Duursma, R.A., Falster, D.S., Taskinen, S., 2012. Smatr 3- an R package forestimation and inference about allometric lines. Methods Ecol. Evol. 3, 257–259.
Warton, D.I., Wright, I.J., Falster, D.S., Westoby, M., 2006. Bivariate line-fitting meth-ods for allometry. Biol. Rev. 81, 259–291.
Weegels, P.L., Hamer, R.J., Schofield, J.D., 1996. Critical review: functional propertiesof wheat glutenin. J. Cereal Sci. 23, 1–18.
Wieser, H., 2007. Chemistry of gluten proteins. Food Microbiol. 24, 115–119.Wieser, H., Bushuk, W., MacRitchie, F., 2006. The polymeric glutenins. In: Wrigley, C.,
Bekes, F., Bushuk, W. (Eds.), Gliadin and Glutenin: the Unique Balance of WheatQuality. American Association of Cereal Chemistry, St Paul, MN, pp. 213–240.
Zhu, J., Khan, K., 1999. Characterization of monomeric and glutenin polymeric pro-teins of hard red spring wheats during grain development by multistackingSDS-PAGE and capillary zone electrophoresis. Cereal Chem. 76, 261–269.

1
Field Crops Research
Supplementary data
Grain filling duration and glutenin polymerization under variable nitrogen
supply and environmental conditions for durum wheat
Roberto Ferrise, Marco Bindi, Pierre Martre

2
Supplementary Fig. S1. SDS-PAGE of albumin-globulin, gliadin, and glutenin protein fractions
and SDS-extractable and -unextractable SE-HPLC peaks obtained from mature grains of durum
wheat cv. Creso. Albumin-globulin proteins were extracted in a 50 mM phosphate buffer
containing 0.1 M NaCl (Marion et al., 1994), gliadin proteins with propanol-1 50%, and glutenin
proteins as described in Singh et al. (1991). The acrylamide gel concentration was 12.5%. The
electrophoresis conditions were as described in Branlard et al. (2003). Gels were stained with
Coomassie Blue (A) or AgNO3 (B). SE-HPLC peaks are numbered as indicated in Figure 1. The
distortion of the electrophoretic bands is due to the high salt concentration of the SE-HPLC
protein fractions.

3 S
uppl
emen
tary
Tab
le S
1: S
umm
ary
stat
isti
cs o
f th
e w
eath
er c
ondi
tion
s fo
r th
e tw
o ye
ars
and
sow
ing
date
s.
Tab
le S
1
Sow
ing,
ant
hesi
s an
d ph
ysio
logi
cal m
atur
ity d
ates
, cum
ulat
ive
glob
al r
adia
tion
(R
g) a
nd r
ainf
all a
nd a
vera
ge d
aily
tem
pera
ture
(T m
ean)
for
the
emer
genc
e to
ant
hesi
s an
d th
e an
thes
is to
phy
siol
ogic
al
mat
urit
y (e
nd o
f gr
ain
fill
ing)
per
iods
, and
num
ber
of d
ays
wit
h m
axim
um d
aily
tem
pera
ture
(T m
ax)
abov
e 30
°C
and
35
°C (
in b
rack
ets)
for
the
anth
esis
to p
hysi
olog
ical
mat
urit
y an
d to
har
vest
rip
enes
s
(10-
12%
%G
WC
) fo
r th
e tw
o gr
owin
g se
ason
s an
d tw
o so
win
g da
tes.
Yea
r S
owin
g
trea
mte
nt
Sow
ing
dat
e A
nth
esis
dat
e
Ph
isio
logi
cal
mat
uri
ty
dat
e
Em
erge
nce
to a
nthe
sis
A
nthe
sis
to p
hysi
olog
ical
mat
urit
y
phys
iolo
gica
l mat
urit
y
to h
arve
st r
ipen
ess
R
g
(MJ
m-2
)
Rai
nfa
ll
(mm
)
Ave
rage
T mea
n
(°C
)
R
g
(MJ
m-2
)
Rai
nfa
ll
(mm
)
Ave
rage
T mea
n
(°C
)
Num
ber
of
day
s w
ith
T max
> 3
0 °C
A
vera
ge
T mea
n
(°C
)
Num
ber
of
day
s w
ith
T max
> 3
0 °C
2003
S
D1
11 D
ec 2
002
07 M
ay 2
003
11 J
un 2
003
1,80
3 29
0 9.
9
840
25
21.8
11
(2)
27.9
15
(8)
S
D2
27 J
an 2
003
14 M
ay 2
003
13 J
un 2
003
1,72
6 15
9 11
.5
75
5 8
22.8
12
(4)
27.8
18
(7)
2005
S
D1
05 N
ov 2
004
09 M
ay 2
005
16 J
un 2
005
1,95
0 53
0 9.
2
909
75
20.8
7
(0)
27
.0
10 (
1)
S
D2
18 J
an 2
005
18 M
ay 2
005
21 J
un 2
005
1,66
3 30
4 10
.3
88
2 30
22
.2
11 (
0)
27
.4
13 (
3)

4 S
uppl
emen
tary
Tab
le S
2: F
inal
gra
in d
ry m
ass,
max
imum
wat
er m
ass,
N m
ass,
and
pro
tein
con
cent
rati
on.
Tab
le S
2
Fina
l gra
in d
ry m
ass,
N m
ass,
max
imum
wat
er m
ass
and
prot
ein
conc
entr
atio
n fo
r no
rmal
(SD
1) a
nd la
te (
SD
2) s
own
crop
s of
dur
um w
heat
cv.
Cre
so g
row
n in
the
fiel
d w
ith
thre
e ra
tes
of N
sup
ply.
Dat
a ar
e m
eans
± 1
s.e
. for
n =
3 r
eplic
ates
. P-v
alue
s of
the
mai
n ef
fect
s an
d in
tera
ctio
ns o
f a
spli
t-pl
ot d
esig
n A
NO
VA
are
giv
en. n
s, n
ot s
igni
fica
nt a
t =
0.0
5.
Yea
r/so
win
g d
ate
N s
up
ply
(g N
m-2
)
Dry
mas
s
(mg
DM
gra
in-1
)
Max
imu
m w
ater
mas
s
(mg
H2O
gra
in-1
)
N m
ass
(mg
N g
rain
-1)
Pro
tein
con
cent
rati
on
(% o
f gr
ain
DM
) 20
03
SD
1 0
50.0
± 1
.0
42.7
± 0
.9
1.09
± 0
.03
12.2
± 0
.4
6
45.5
± 1
.9
40.2
± 1
.5
1.13
± 0
.05
13.9
± 0
.2
18
44
.8 ±
1.0
37
.6 ±
1.2
1.
16 ±
0.0
3 14
.5 ±
0.5
SD
2 0
45.1
± 1
.6
39.9
± 1
.3
1.01
± 0
.02
12.7
± 0
.5
6
44.8
± 1
.5
39.0
± 1
.4
1.07
± 0
.05
13.4
± 0
.4
18
45
.2 ±
1.0
38
.3 ±
0.8
1.
16 ±
0.0
1 14
.5 ±
0.3
2005
SD
1 0
50.9
± 0
.4
41.0
± 1
.2
0.79
± 0
.02
8.8
± 0.
2
6
50.9
± 0
.4
41.2
± 1
.3
0.89
± 0
.03
9.9
± 0.
3
18
50
.0 ±
0.7
37
.5 ±
0.7
1.
11 ±
0.0
4 12
.5 ±
0.4
SD
2 0
57.0
± 0
.6
45.7
± 1
.0
1.10
± 0
.06
10.8
± 0
.5
6
58.0
± 0
.3
45.1
± 1
.2
1.36
± 0
.03
13.2
± 0
.3
18
57
.2 ±
0.7
45
.2 ±
1.6
1.
43 ±
0.0
4 14
.1 ±
0.3
Mai
n ef
fect
s
Yea
r (Y
) 0.
002
0.00
2 ns
0.
002
Sow
ing
date
(S
D)
ns
ns
0.00
3 0.
025
N f
erti
lize
r (N
) ns
0.
017
<0.
001
<0.
001
Inte
ract
ions
Y ×
SD
0.
015
0.01
8 0.
001
0.02
2
Y ×
N
0.04
5 ns
<
0.00
1 0.
031
N ×
SD
0.
038
ns
ns
ns
Y ×
SD
× N
ns
ns
ns
0.
036

5 S
uppl
emen
tary
Tab
le S
3: F
inal
qua
ntit
y of
pro
tein
fra
ctio
ns p
er g
rain
.
Tab
le S
3
Fin
al q
uant
ity
per
grai
n of
alb
umin
-glo
buli
n, g
liad
in, s
mal
l-si
ze (
SP
P)
and
larg
e-si
ze (
LP
P)
SD
S-e
xtra
ctab
le p
olym
eric
pro
tein
s, S
DS
-une
xtra
ctab
le p
olym
eric
pro
tein
s (U
PP
), a
nd to
tal p
olym
eric
prot
eins
(T
PP
), f
or n
orm
al (
SD
1) a
nd la
te (
SD
2) s
own
crop
s of
dur
um w
heat
cv.
Cre
so g
row
n in
the
fiel
d w
ith
thre
e ra
tes
of N
sup
ply.
Dat
a ar
e m
eans
± 1
s.e
. for
n =
3 r
epli
cate
s. P
-val
ues
of th
e
mai
n ef
fect
s an
d in
tera
ctio
ns o
f a
spli
t-pl
ot d
esig
n A
NO
VA
are
giv
en. n
s, n
ot s
igni
fica
nt a
t =
0.0
5.
Yea
r/so
win
g d
ate
N s
up
ply
(g N
m-2
)
Pro
tein
fra
ctio
ns (
mg
N g
rain
-1)
Alb
um
in-g
lob
uli
n
Gli
adin
S
PP
L
PP
U
PP
T
PP
2003
SD
1 0
0.26
6 ±
0.02
5 0.
254
± 0.
013
0.15
8 ±
0.01
2 0.
115
± 0.
006
0.08
7 ±
0.00
4 0.
361
± 0.
013
6
0.29
9 ±
0.03
1 0.
275
± 0.
025
0.16
6 ±
0.01
2 0.
125
± 0.
012
0.08
8 ±
0.00
8 0.
378
± 0.
031
18
0.
310
± 0.
010
0.27
6 ±
0.00
9 0.
171
± 0.
005
0.12
9 ±
0.00
7 0.
102
± 0.
003
0.40
2 ±
0.01
1
SD
2 0
0.28
3 ±
0.01
0 0.
253
± 0.
009
0.15
5 ±
0.00
1 0.
120
± 0.
004
0.09
3 ±
0.00
8 0.
368
± 0.
011
6
0.30
1 ±
0.02
5 0.
288
± 0.
024
0.17
3 ±
0.01
1 0.
127
± 0.
013
0.09
0 ±
0.00
5 0.
362
± 0.
030
18
0.
354
± 0.
027
0.30
4 ±
0.01
3 0.
176
± 0.
012
0.13
9 ±
0.01
5 0.
101
± 0.
008
0.41
6 ±
0.03
1
2005
SD
1 0
0.21
8 ±
0.00
1 0.
211
± 0.
004
0.13
3 ±
0.00
4 0.
107
± 0.
004
0.05
0 ±
0.00
1 0.
287
± 0.
008
6
0.26
1 ±
0.01
8 0.
251
± 0.
010
0.15
0 ±
0.00
4 0.
139
± 0.
009
0.06
5 ±
0.00
1 0.
355
± 0.
014
18
0.
350
± 0.
010
0.31
5 ±
0.00
8 0.
194
± 0.
005
0.15
6 ±
0.00
3 0.
076
± 0.
008
0.42
5 ±
0.01
5
SD
2 0
0.29
9 ±
0.01
3 0.
286
± 0.
011
0.18
7 ±
0.00
4 0.
138
± 0.
001
0.06
8 ±
0.00
2 0.
393
± 0.
005
6
0.41
9 ±
0.02
0 0.
363
± 0.
018
0.23
1 ±
0.00
4 0.
187
± 0.
007
0.08
7 ±
0.00
6 0.
504
± 0.
015
18
0.
447
± 0.
021
0.39
4 ±
0.01
7 0.
255
± 0.
011
0.19
2 ±
0.00
6 0.
079
± 0.
003
0.52
6 ±
0.01
9
Mai
n ef
fect
s
Yea
r (Y
) ns
0.
025
0.00
2 0.
010
0.00
3 0.
022
Sow
ing
date
(S
D)
0.01
2 0.
024
0.00
9 0.
003
ns
0.01
2
N f
erti
lize
r (N
) <
0.00
1 <
0.00
1 <
0.00
1 <
0.00
1 0.
019
<0.
001
Inte
ract
ions
Y ×
SD
0.
032
0.04
2 0.
010
0.00
5 ns
0.
016
Y ×
N
ns
0.02
9 0.
002
0.01
1 ns
0.
016
N ×
SD
ns
ns
ns
ns
ns
ns
Y ×
SD
× N
ns
ns
ns
ns
ns
ns

6 S
uppl
emen
tary
Tab
le S
4: P
erce
ntag
e of
pro
tein
fra
ctio
ns a
nd U
PP
to T
PP
and
gli
adin
s to
glu
teni
ns r
atio
s.
Tab
le S
4
Per
cent
age
of a
lbum
in-g
lobu
lin,
gli
adin
, tot
al p
olym
eric
pro
tein
s (T
PP
), s
mal
l-si
ze (
SS
P)
and
larg
e-si
ze (
LP
P)
SD
S-e
xtra
ctab
le p
olym
eric
pro
tein
s, S
DS
- un
extr
acta
ble
poly
mer
ic p
rote
ins
(UP
P),
the
rati
os o
f U
PP
to T
PP
and
glia
din
to g
lute
nin
at m
atur
ity
for
norm
al (
SD1)
and
late
(SD
2) s
own
crop
s of
dur
um w
heat
cv.
Cre
so g
row
n in
the
fiel
d w
ith
thre
e ra
tes
of N
sup
ply.
Dat
a ar
e m
eans
± 1
s.e.
for
n =
3 r
eplic
ates
. P-v
alue
s of
the
mai
n ef
fect
s an
d in
tera
ctio
ns o
f a
spli
t-pl
ot d
esig
n A
NO
VA
are
giv
en. n
s, n
ot s
igni
fica
nt a
t =
0.0
5.
Yea
r S
owin
g d
ate
trea
tmen
t
N s
up
ply
(g N
m-2
)
Pro
tein
fra
ctio
ns (
% o
f to
tal g
rain
pro
tein
s)
UP
P /
TP
P
Gli
adin
/ gl
ute
nin
Alb
um
in-g
lob
uli
n
Gli
adin
T
PP
S
PP
L
PP
U
PP
2003
S
D1
0 25
.2 ±
1.5
24
.1 ±
0.4
34
.3 ±
0.3
15
.0 ±
0.5
11
.0 ±
0.8
8.
3 ±
0.2
0.24
± 0
.006
0.
70 ±
0.0
1
6 26
.0 ±
0.5
24
.0 ±
0.2
33
.0 ±
0.3
14
.5 ±
0.3
10
.9 ±
0.1
7.
7 ±
0.1
0.23
± 0
.003
0.
73 ±
0.0
1
18
26.7
± 0
.6
23.7
± 0
.5
34.5
± 0
.5
14.7
± 0
.3
11.1
± 0
.2
8.8
± 0.
5 0.
25 ±
0.0
11
0.69
± 0
.02
S
D2
0 28
.9 ±
0.3
25
.8 ±
0.6
37
.6 ±
0.9
15
.9 ±
0.5
12
.2 ±
0.1
9.
5 ±
0.7
0.25
± 0
.014
0.
69 ±
0.0
1
6 28
.6 ±
0.3
27
.3 ±
0.6
36
.5 ±
1.2
16
.6 ±
1.1
12
.0 ±
0.3
9.
0 ±
0.7
0.25
± 0
.018
0.
72 ±
0.0
4
18
30.1
± 0
.7
25.9
± 0
.6
35.4
± 1
.1
15.0
± 0
.5
11.8
± 1
.0
8.6
± 0.
8 0.
24 ±
0.0
20
0.73
± 0
.03
2005
S
D1
0 26
.9 ±
0.1
26
.0 ±
0.4
35
.4 ±
1.2
16
.3 ±
0.3
13
.1 ±
0.6
6.
2 ±
0.1
0.18
± 0
.004
0.
74 ±
0.0
4
6 27
.6 ±
1.1
26
.5 ±
0.3
37
.5 ±
0.8
15
.9 ±
0.3
14
.7 ±
0.7
6.
9 ±
0.1
0.18
± 0
.004
0.
71 ±
0.0
2
18
29.5
± 0
.2
26.6
± 0
.4
35.9
± 0
.9
16.3
± 0
.2
13.2
± 0
.3
6.4
± 0.
6 0.
18 ±
0.0
13
0.74
± 0
.03
S
D2
0 28
.5 ±
0.1
27
.3 ±
0.2
37
.5 ±
1.3
17
.8 ±
0.5
13
.2 ±
0.7
6.
5 ±
0.1
0.17
± 0
.003
0.
73 ±
0.0
2
6 29
.8 ±
0.7
25
.8 ±
0.4
35
.9 ±
0.7
16
.5 ±
0.3
13
.3 ±
0.4
6.
2 ±
0.4
0.17
± 0
.008
0.
72 ±
0.0
2
18
30.5
± 1
.1
26.9
± 0
.9
35.9
± 0
.9
17.4
± 0
.5
13.1
± 0
.3
5.4
± 0.
2 0.
15 ±
0.0
03
0.75
± 0
.01
Mai
n ef
fect
s
Yea
r (Y
) 0.
032
0.00
9 ns
0.
012
0.00
1 0.
004
0.00
1 0.
032
Sow
ing
date
(S
D)
0.01
0 ns
0.
002
0.03
7 ns
ns
ns
ns
N f
erti
lize
r (N
) ns
ns
ns
ns
ns
ns
ns
ns
Inte
ract
ions
Y ×
SD
ns
ns
0.
006
ns
0.00
6 0.
020
0.04
6 ns
Y ×
N
ns
0.01
2 ns
ns
ns
ns
ns
ns
N ×
SD
ns
ns
ns
ns
ns
ns
ns
ns
Y ×
SD
× N
ns
0.
003
ns
ns
ns
ns
ns
ns

7
References
Branlard, G., Dardevet, M., Amiour, N., Igrejas, G., 2003. Allelic diversity of HMW and LMW glutenin subunits and
omega-gliadins in French bread wheat (Triticum aestivum L.). Genet. Resour. Crop Evol. 50, 669-679.
Marion, D., Nicolas, Y., Popineau, Y., Branlard, G., Landry, J., 1994. A new and improved sequential extraction
procedure of wheat proteins. Wheat kernel proteins-molecular and functional aspects. Università Degli Studi della
Tuscia, Viterbo, Italy, pp. 197-199.
Singh, N.K., Shepherd, K.W., Cornish, G.B., 1991. A simplified SDS-PAGE procedure for separating LMW subunits
of glutenin. J. Cereal Sci. 14, 203-208.
Copyright © 2022 FDOKUMEN