Grain and shoot zinc accumulation in winter wheat affected by nitrogen management
11
REGULAR ARTICLE Grain and shoot zinc accumulation in winter wheat affected by nitrogen management Yan-Fang Xue & Shan-Chao Yue & Yue-Qiang Zhang & Zhen-Ling Cui & Xin-Ping Chen & Fu-Chun Yang & Ismail Cakmak & Steve P. McGrath & Fu-Suo Zhang & Chun-Qin Zou Received: 20 March 2012 / Accepted: 22 October 2012 / Published online: 31 October 2012 # Springer Science+Business Media Dordrecht 2012 Abstract Background and aims Nitrogen (N) nutrition is a crit- ical factor in zinc (Zn) acquisition and its allocation into grain of wheat (Triticum aestivum L.). Most of the information collected about this topic is, however, derived from the pot experiments. It is also not known whether optimal N management by decreasing N input could affect the Zn status in grain and plant in the field. The aim of this research is to investigate the impact of N management on grain and shoot Zn status of winter wheat. Methods Field experiments were conducted in two cropping seasons. Results Results showed applying N at optimal rate (198 kgN ha -1 in 2007–2008 and 195 kgN ha -1 in 2008–2009) maintained or resulted in significantly higher grain Zn concentration and especially grain content of Zn compared to no or lower N treatments. For example, grain Zn concentration increased from 21.5 mgkg -1 in the control to 30.9 mgkg -1 with optimized N supply in 2007–2008 and from 24.7 mg kg -1 in the control to 29.1 mgkg -1 with optimized N supply in 2008–2009. Further increasing N supply from optimal to excessive N supply resulted in non- significant increases in grain Zn concentration and content. Generally, similar trends were also found in shoot Zn. Moreover, 72 % to 100 % of the shoot Zn requirement had been accumulated at anthesis, and accordingly 67 % to 100 % of grain Zn content was provided by Zn remobilization from pre-anthesis Zn uptake with N supply. Grain Zn accumulation mainly originates from Zn remobilization and the optimal N management would ensure better shoot Zn nutrition to contribute to increasing Zn remobilization from vege- tative tissues and to maintain relatively higher grain Zn for better human nutrition. Keywords Grain zinc . Optimized nitrogen management . Winter wheat . Zinc remobilization Introduction Zinc (Zn) deficiency represents an important global common nutritional disorder, affecting 1/3 of people worldwide, mainly in developing countries where Plant Soil (2012) 361:153–163 DOI 10.1007/s11104-012-1510-2 Responsible Editor: Hans Lambers. Y.-F. Xue : S.-C. Yue : Y.-Q. Zhang : Z.-L. Cui : X.-P. Chen : F.-C. Yang : F.-S. Zhang : C.-Q. Zou (*) Key Laboratory of Plant-Soil Interactions, Ministry of Education, Center for Resources, Environment and Food Security, China Agricultural University, Beijing 100193, People’ s Republic of China e-mail: [email protected] I. Cakmak Faculty of Engineering and Natural Sciences, Sabanci University, Istanbul 34956, Turkey S. P. McGrath Rothamsted Research, Harpenden, Hertfordshire AL5 2JQ, UK
Transcript of Grain and shoot zinc accumulation in winter wheat affected by nitrogen management
REGULAR ARTICLE
Grain and shoot zinc accumulation in winter wheat affectedby nitrogen management
Yan-Fang Xue & Shan-ChaoYue & Yue-Qiang Zhang &
Zhen-Ling Cui & Xin-Ping Chen & Fu-Chun Yang &
Ismail Cakmak & Steve P. McGrath & Fu-Suo Zhang &
Chun-Qin Zou
Received: 20 March 2012 /Accepted: 22 October 2012 /Published online: 31 October 2012# Springer Science+Business Media Dordrecht 2012
AbstractBackground and aims Nitrogen (N) nutrition is a crit-ical factor in zinc (Zn) acquisition and its allocationinto grain of wheat (Triticum aestivum L.). Most of theinformation collected about this topic is, however,derived from the pot experiments. It is also not knownwhether optimal N management by decreasing N inputcould affect the Zn status in grain and plant in thefield. The aim of this research is to investigate theimpact of N management on grain and shoot Zn statusof winter wheat.Methods Field experiments were conducted in twocropping seasons.Results Results showed applying N at optimal rate(198 kgN ha−1 in 2007–2008 and 195 kgN ha−1 in
2008–2009) maintained or resulted in significantlyhigher grain Zn concentration and especially graincontent of Zn compared to no or lower N treatments.For example, grain Zn concentration increased from21.5 mgkg−1 in the control to 30.9 mgkg−1 withoptimized N supply in 2007–2008 and from 24.7 mgkg−1 in the control to 29.1 mgkg−1 with optimized Nsupply in 2008–2009. Further increasing N supplyfrom optimal to excessive N supply resulted in non-significant increases in grain Zn concentration andcontent. Generally, similar trends were also found inshoot Zn. Moreover, 72 % to 100 % of the shoot Znrequirement had been accumulated at anthesis, andaccordingly 67 % to 100 % of grain Zn content wasprovided by Zn remobilization from pre-anthesis Znuptake with N supply. Grain Zn accumulation mainlyoriginates from Zn remobilization and the optimal Nmanagement would ensure better shoot Zn nutrition tocontribute to increasing Zn remobilization from vege-tative tissues and to maintain relatively higher grainZn for better human nutrition.
Keywords Grain zinc . Optimized nitrogenmanagement .Winter wheat . Zinc remobilization
Introduction
Zinc (Zn) deficiency represents an important globalcommon nutritional disorder, affecting 1/3 of peopleworldwide, mainly in developing countries where
Plant Soil (2012) 361:153–163DOI 10.1007/s11104-012-1510-2
Responsible Editor: Hans Lambers.
Y.-F. Xue : S.-C. Yue :Y.-Q. Zhang : Z.-L. Cui :X.-P. Chen : F.-C. Yang : F.-S. Zhang : C.-Q. Zou (*)Key Laboratory of Plant-Soil Interactions, Ministry ofEducation, Center for Resources, Environment and FoodSecurity, China Agricultural University,Beijing 100193, People’s Republic of Chinae-mail: [email protected]
I. CakmakFaculty of Engineering and Natural Sciences,Sabanci University,Istanbul 34956, Turkey
S. P. McGrathRothamsted Research,Harpenden, Hertfordshire AL5 2JQ, UK
cereals constitute the major part of the diet (Hotz andBrown 2004; Stein et al. 2007; Welch and Graham2004). For example in China, approximately 100 mil-lion people are affected by Zn deficiency, and most ofthem are living in rural areas, especially children (Ma etal. 2008). As the fifth leading cause of disease in low-income countries according to the World Health Orga-nization (WHO 2002), Zn deficiency is responsible formany severe health complications, including physicalgrowth, immune competence, reproductive function andneuro-behavioural development (Gibson 2006).
Wheat is one of the most important staple food cropsand the cheapest source of calories and protein for localinhabitants in China, where the Northern China WinterWheat Region contributes about 70 % of the nationalwheat production (Zhuang 2003). Wheat-based foodproducts supply more than 20 % of the daily Zn intake,especially in rural areas (Ma et al. 2008). Wheat, how-ever, is inherently too low grain Zn to meet daily humanrequirement, particularly when grown on Zn deficientsoils. In addition, wheat is rich in anti-nutritional com-pounds such as phytic acid and phenolic compoundsthat reduce biological availability of Zn in the humandigestive tract (Welch and Graham 2004). Furthermore,the processing wheat in ways that remove Zn-rich outerparts of the grain results in reduced Zn nutritional value(Cakmak 2008; Kutman et al. 2011b).
Zn shows high phloem mobility in wheat plant(Erenoglu et al. 2011; Haslett et al. 2001), and inagreement with this, foliar Zn application alone or incombination with soil Zn application significantly in-creased wheat grain Zn concentration (Cakmak et al.2010a; Zhang et al. 2010, 2012). Further studiesshowed that improving nitrogen (N) supply to plantsmaximized grain Zn accumulation when Zn supplywas not limited (Kutman et al. 2010). These resultsclearly indicate that an effective biofortification ofwheat grain with Zn depends greatly on sufficient Nsupply (Kutman et al. 2011a, b; Shi et al. 2010).
There is an increasing concern that excessive N fer-tilization in intensive agricultural areas of China resultsin serious environmental problems such as eutrophica-tion (Le et al. 2010), greenhouse gas emissions (Zhenget al. 2004) and soil acidification (Guo et al. 2010).Currently, improving N management and developmentrelated policies are major issues in crop production andenvironmental protection in China. It is, therefore, im-portant to examine whether changes in N management
will affect Zn nutrition of wheat plants and Zn accumu-lation in grain. As highlighted above, N nutritionalstatus of wheat plants affects major steps in the routeof Zn from the growthmedium to the grain, including itsuptake, xylem transport and remobilization via phloem(Cakmak et al. 2010b; Erenoglu et al. 2011).
Genetic studies revealed the existence of a close link-age between remobilization of Zn and N from senescingleaf tissue into grain in durum wheat. The NAM-B1 genelocated in the Gpc-B1 locus on the short arm of chromo-some 6B was shown to accelerate leaf senescence duringgrain filling and to be responsible for a higher Zn and Nremobilization and a better partitioning of Zn and N to thegrain (Distelfeld et al. 2007; Uauy et al. 2006;Waters et al.2009). There is some controversy about this issue. Forexample, high N supply has been found to delay senes-cence and thereby a poor remobilization and partitioningof assimilates into the grain (Yang and Zhang 2006). Onthe other hand, extended leaf greenness through improvedN nutrition during the grain formation period may allowmore nutrient transport into grain such as nitrogen(Bogard et al. 2011; Borrell et al. 2001).
The aim of this work was to re-examine the relativerole of Zn remobilization from vegetative tissues to thegrains versus post-anthesis Zn uptake under different Napplication rates under field conditions. Previous datacollected on the impact of N nutrition on Zn allocationfrom vegetative tissues into grain was obtained fromstudies under greenhouse or growth chamber conditions(Erenoglu et al. 2011; Kutman et al. 2010, 2011a). Thisstudy also investigated whether optimized Nmanagementby decreasing excessive N supply rates would result inany negative impact on Zn nutrition of wheat plants andZn allocation into grain under field conditions.
Materials and methods
Field locations
The field experiments were conducted at Quzhou exper-imental station in Hebei province (36.9°N, 115.0°E) dur-ing the 2007–2008 and 2008–2009 cropping seasons. Thesoil characteristics were calcareous alluvial soil typical ofthe North Plain of China, pH 8.3 (1:2.5 w/v in water) and1.4 % organic matter. The soil DTPA-extractable Zn con-centrations before sowing in the first season averaged0.5 mgkg−1 which indicated Zn deficiency.
154 Plant Soil (2012) 361:153–163
Experimental design
Winter wheat (Triticumaestivum L., var. Kenong 9204)was planted in two cropping seasons and a randomizedcomplete block experimental design was used with fourreplicate plots (300m2 plot−1). Four N application levelsas urea were used in these field trails as follows: no Napplication (recorded as N0, control), half or less thanhalf of optimal N application (recorded as N1), optimalN application (recorded as N2), one and a half times ofoptimal N application (recorded as N3). The optimal(N2) treatment was based on the determination of soilmineral N (Nmin) of 0–90 cm at sowing, regreening(GS25, Zadocks) and joining (GS31) stages as previ-ously described by Chen et al. (2006). The four rates ofN applied in form of urea were as follows: 0 (N0), 99(N1), 198 (N2) and 297 (N3) kgNha−1 in 2007–2008 and0 (N0), 82.5 (N1), 195 (N2) and 292.5 (N3) kgNha−1 in2008–2009. Nitrogen fertilizer was supplied in splitdoses as described in Table 1. For N1 treatment(82.5 kgN ha−1) in 2008–2009, N was not applied atregreening stage because the amount of N applied (50 %of N2 rate) was too little to apply evenly. In addition,120 kg of P2O5 ha
−1 as superphosphate and 100 kg ofK2O ha−1 as potassium chloride were applied beforesowing. Because the experimental soil had a lowDTPA-extractable Zn (see above), 30 kg ha−1
ZnSO4·7H2O was applied as the basal fertilizer in eachcropping season. After the fertilizer was broadcast, thefield plots were irrigated immediately with sprinklers.The fields were also irrigated before winter and at stemelongation stage in the first and second cropping sea-sons, respectively. The irrigation required was based onthe soil water content.
Sample preparation and nutrients analysis
Whole shoot samples were randomly taken from four0.5 m lengths of row from four adjacent rows in eachplot at 148 days after sowing (DAS), 177 DAS, 204DAS, 214 DAS and 239 DAS in 2007–2008 and 147DAS, 176 DAS, 200 DAS, 215 DAS and 236 DAS in2008–2009, which corresponded to regreening (GS25),jointing (GS31), flowering (GS65), filling (GS71) andmaturity (GS92, separated into grain and straw) stages,respectively. In addition, another sampling at 194 DASin 2008–2009 was collected, which corresponded to theheading stage (GS55). Before sowing and after harvest-ing, soil was sampled to 30 cm depth for analysingDTPA-extractable Zn concentration.
In this paper, the term “shoot” referred all above-ground parts of wheat plants including the grains andthe term “straw” referred the shoot excluding thegrains. After being washed rapidly with deionizedwater, all plant materials were dried at 60–65 °C for72 h and dry weight (DM) was recorded. Plant sam-ples were ground with a steel stainless grinder (modelHY-04B, Beijing, China) and digested with HNO3-H2O2 in a microwave accelerated reaction system(CEM, Matthews, NC, USA). The concentrations ofZn in the digested solutions were determined by in-ductively coupled plasma optical emission spectrosco-py (ICP-AES, OPTIMA 3300 DV, Perkin-Elmer,USA). IPE556 grain and IPE883 straw (WageningenUniversity, The Netherlands) were used as referencematerials. N concentration in the samples was ana-lysed by the micro-Kjeldahl procedure after digestionwith H2SO4–H2O2. All results were expressed on aDM basis.
Calculations and statistical analysis
Post�anthesis Zn uptake ¼ shoot Zn content at maturity�shoot Zn content at anthesisZn remobilization to the grain ¼ shoot Zn content at anthesis� straw Zn content at maturityZn remobilization efficiency ¼ Zn remobilization=shoot Zn content at anthesisPercentage of pre�anthesis Zn accumulation ¼ shoot Zn content at anthesis=shoot Zn content at maturityPercentage of post� anthesis Zn accumulation ¼ post�anthesis Zn uptake=shoot Zn content at maturityShare of grain Zn provided by remobilization of pre� anthesis Zn stores ¼ Zn remobilization to the grain
=grain Zn content at maturityShare of grain Zn provided by post� anthesis shoot Zn uptake ¼ grain Zn content at maturity� Zn remobilizationð Þ
=grain Zn content at maturityZn harvest index ZnHIð Þ ¼ grain Zn content=shoot Zn content at maturity
Plant Soil (2012) 361:153–163 155
These above formulas were also applied to N calcu-lations. All the above calculations refer to Bogard etal. (2010) and Kutman et al. (2011a).
Statistical analysis
The effects of N fertilization treatments on the depen-dent variables were determined using one-wayANOVA and SAS software (SAS 8.0, USA). Whenthe effects were significant, treatment means werecompared by the least significant difference (LSD) testat P<0.05.
Results
Shoot biomass production
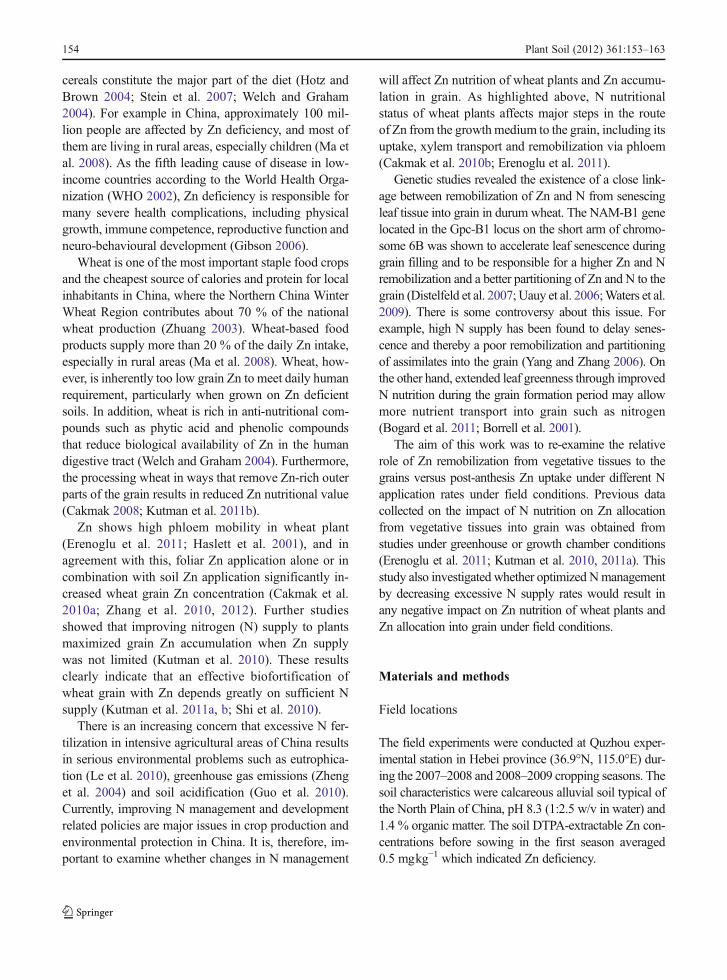
Shoot biomass gradually increased with the increaseof N application rates from N0 to N2 at all growthstages after regreening in both cropping seasons, butshoot biomass slightly decreased when the N applica-tion was increased from N2 to N3, and only signifi-cantly at maturity in 2008–2009 (Fig. 1).
Shoot N concentration
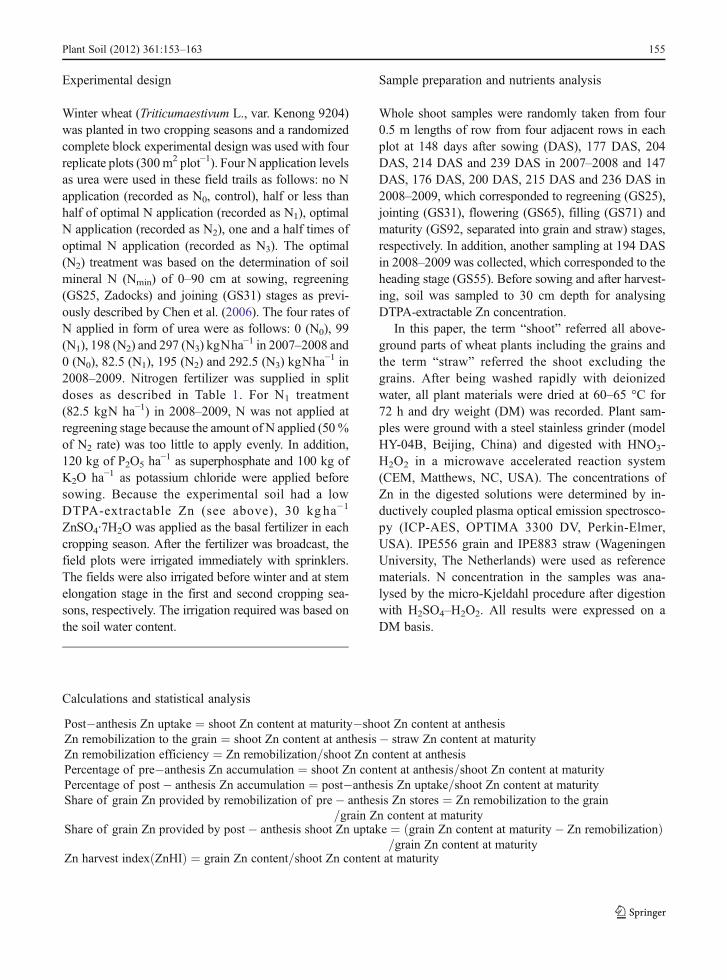
The shoot N concentration showed progressiveincreases with the increasing N supply from N0 toN2 at flowering and filling stages in 2007–2008, andat almost growth stages in 2008–2009. Further in-creasing N supply from N2 to N3 resulted in a signif-icant increase in shoot N concentration at jointing andheading stages only in 2008–2009 (Fig. 2).
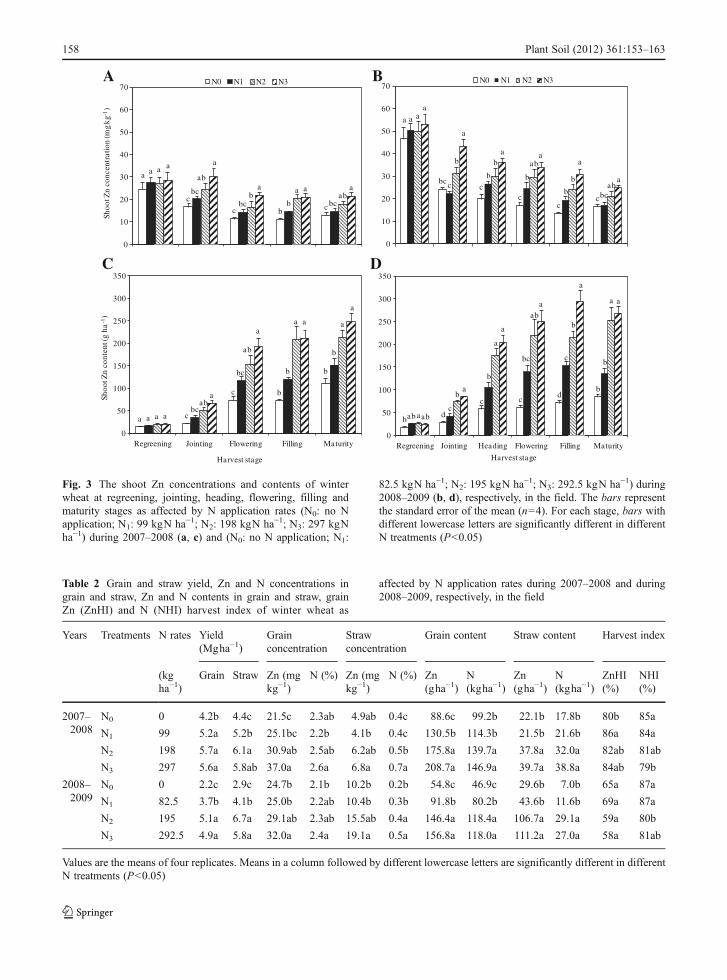
Shoot Zn concentration and content
As shown in Fig. 3a and b, a significant increase inshoot Zn concentration was observed between N0 andN2 treatments at all growth stages after regreening inthe first cropping season and after joining stage in thesecond cropping season, while N1 treatment resultedin intermediate shoot Zn concentration, not differingfrom either N0 or N2 treatment. Further increasing Napplication rates from N2 to N3 still resulted in anincreasing trend or sometimes a significant enhance-ment in shoot Zn concentration at flowering stageduring 2007–2008 and at jointing, heading and grainfilling stages during 2008–2009. Similar trends, gen-erally, were also observed in shoot Zn contents(Fig. 3c and d). A significant and positive relationshipwas found between shoot Zn and N concentration atalmost growth stages with an exception of jointing andmaturity stages (Table 3).
Grain and straw yield, grain and straw Zn and Nconcentration and content
Compared to the N0 rate, any other N supply resultedin significantly higher grain yield but there were nodifferences among N1, N2 and N3 rates in 2007–2008;in 2008–2009 there was a progressive increase in grainyield with the increasing N supply from N0 to N2
while further increasing the N supply from N2 to N3
did not affect grain yield (Table 2). The straw yieldwas also significantly increased by increasing N sup-ply from N0 to N2, but slightly decreased by furtherincreased N supply from N2 to N3 in both croppingseasons (Table 2).
Table 1 N split supply as ureaduring the vegetative period ofwinter wheat during 2007–2008and 2008–2009 based on deter-mination of soil mineral N(Nmin) of 0–90 cm at sowing,regreening and jointing stages inthe field
Years Treatments N rates(kgha−1)
N amount used (kgha−1)
Base fertilizer Regreening stage Jointing stage
2007–2008 N0 0 0 0 0
N1 99 35 0 64
N2 198 70 0 128
N3 297 105 0 192
2008–2009 N0 0 0 0 0
N1 82.5 17.5 0 65
N2 195 35 30 130
N3 292.5 52.5 45 195
156 Plant Soil (2012) 361:153–163
In 2007–2008, there was a significant increase ingrain Zn concentration with increasing N applicationrates from N0 to N2. When the N application wasfurther increased from N2 to N3, approximately 20 %but no statistically significant increase in grain Znconcentration was observed. A significant differencein both grain N concentration and straw Zn concen-tration was only found between N1 and N3 (Table 2).In 2008–2009, increasing the N rates from N0 to N3
showed an increasing trend for grain Zn concentration;
the N2 treatment resulted in intermediate improvementin grain Zn concentration, but did not differ signifi-cantly from the other three N treatments. The similarresults were also found in grain N concentration andstraw Zn concentration (Table 2). A significant andpositive relationship was found between grain Zn andN concentration but not between straw Zn and Nconcentration (Table 3).
Grain Zn content was gradually increased withincreasing N application rates from N0 to N2 in both
ac
c c
c
a
b
b b
b
a
ab
a
a
a
a
a
ab
a
ab
0
2
4
6
8
10
12
14
Regreening Jointing Flowering Filling Maturity
Bio
mas
s (
Mg
ha-1
)
Harvest stage
N0 N1 N2 N3A
bc
c c
c d
a
b
b
b
b c
a
a
a
a
ab
a
ab
ab
a
a
a
b
0
2
4
6
8
10
12
14
Regreening Jointing Heading Flowering Filling Maturity
Harvest stage
N0 N1 N2 N3B
Fig. 1 The shoot-above biomass production of winter wheat atregreening, jointing, heading, flowering, filling and maturitystages as affected by N application rates (N0: no N application;N1: 99 kgN ha−1; N2: 198 kgN ha−1; N3: 297 kgN ha−1) during2007–2008 (a) and (N0: no N application; N1: 82.5 kgN ha−1; N2:
195 kgN ha−1; N3: 292.5 kgN ha−1) during 2008–2009 (b),respectively, in the field. The bars represent the standard error ofthe mean (n04). For each stage, bars with different lowercaseletters are significantly different in different N treatments (P<0.05)
bc b
c
c
b
c
a
b
bb
ab
a
a
a ab
a
a
a
aa
0.0
0.5
1.0
1.5
2.0
2.5
3.0
3.5
4.0
4.5
5.0
Regreening Jointing Flowering Filling Maturity
Shoo
t N c
once
ntra
tion
(%)
Harvest stage
N0 N1 N2 N3A
c
c
dc c
b
b
c c
b
b ab
a
b
b
a
a
ab
a
a
a
a
aa
0.0
0.5
1.0
1.5
2.0
2.5
3.0
3.5
4.0
4.5
5.0
Regreening Jointing Heading Flowering Filling Maturity
Harvest stage
N0 N1 N2 N3B
Fig. 2 The shoot N concentrations of winter wheat at regreening,jointing, heading, flowering, filling and maturity stages as affectedby N application rates (N0: no N application; N1: 99 kgN ha−1; N2:198 kgN ha−1; N3: 297 kgN ha−1) during 2007–2008 (a) and (N0:no N application; N1: 82.5 kgN ha−1; N2: 195 kgN ha−1; N3:
292.5 kgN ha−1) during 2008–2009 (b), respectively, in the field.The bars represent the standard error of the mean (n04). For eachstage, bars with different lowercase letters are significantly differ-ent in different N treatments (P<0.05)
Plant Soil (2012) 361:153–163 157
a
c
c b c
a
bc
bc b bc
aab
ba
ab
a a
a a a
0
10
20
30
40
50
60
70
Shoo
t Zn
conc
entr
atio
n (m
g kg
-1)
N0 N1 N2 N3A
a
bc c
cc
c
a
cb b
b bc
a
b b ab
bab
a
a
a aa
a
0
10
20
30
40
50
60
70N0 N1 N2 N3B
bd
c cd
b
abc
b
bc c b
a
b
a
abb
a
ab
a
a
a
a
a
0
50
100
150
200
250
300
350
Regreening Jointing Heading Flowering Filling Maturity
Harvest stage
a c
c b
b
abc
bc b
b
a
ab
ab
a a
a
a
aa
a
0
50
100
150
200
250
300
350
Regreening Jointing Flowering Filling Maturity
Shoo
t Zn
cont
ent (
g ha
- 1)
Harvest stage
C D
Fig. 3 The shoot Zn concentrations and contents of winterwheat at regreening, jointing, heading, flowering, filling andmaturity stages as affected by N application rates (N0: no Napplication; N1: 99 kgN ha−1; N2: 198 kgN ha−1; N3: 297 kgNha−1) during 2007–2008 (a, c) and (N0: no N application; N1:
82.5 kgN ha−1; N2: 195 kgN ha−1; N3: 292.5 kgN ha−1) during2008–2009 (b, d), respectively, in the field. The bars representthe standard error of the mean (n04). For each stage, bars withdifferent lowercase letters are significantly different in differentN treatments (P<0.05)
Table 2 Grain and straw yield, Zn and N concentrations ingrain and straw, Zn and N contents in grain and straw, grainZn (ZnHI) and N (NHI) harvest index of winter wheat as
affected by N application rates during 2007–2008 and during2008–2009, respectively, in the field
Years Treatments N rates Yield(Mgha−1)
Grainconcentration
Strawconcentration
Grain content Straw content Harvest index
(kgha−1)
Grain Straw Zn (mgkg−1)
N (%) Zn (mgkg−1)
N (%) Zn(gha−1)
N(kgha−1)
Zn(gha−1)
N(kgha−1)
ZnHI(%)
NHI(%)
2007–2008
N0 0 4.2b 4.4c 21.5c 2.3ab 4.9ab 0.4c 88.6c 99.2b 22.1b 17.8b 80b 85a
N1 99 5.2a 5.2b 25.1bc 2.2b 4.1b 0.4c 130.5b 114.3b 21.5b 21.6b 86a 84a
N2 198 5.7a 6.1a 30.9ab 2.5ab 6.2ab 0.5b 175.8a 139.7a 37.8a 32.0a 82ab 81ab
N3 297 5.6a 5.8ab 37.0a 2.6a 6.8a 0.7a 208.7a 146.9a 39.7a 38.8a 84ab 79b
2008–2009
N0 0 2.2c 2.9c 24.7b 2.1b 10.2b 0.2b 54.8c 46.9c 29.6b 7.0b 65a 87a
N1 82.5 3.7b 4.1b 25.0b 2.2ab 10.4b 0.3b 91.8b 80.2b 43.6b 11.6b 69a 87a
N2 195 5.1a 6.7a 29.1ab 2.3ab 15.5ab 0.4a 146.4a 118.4a 106.7a 29.1a 59a 80b
N3 292.5 4.9a 5.8a 32.0a 2.4a 19.1a 0.5a 156.8a 118.0a 111.2a 27.0a 58a 81ab
Values are the means of four replicates. Means in a column followed by different lowercase letters are significantly different in differentN treatments (P<0.05)
158 Plant Soil (2012) 361:153–163
cropping seasons, but there was no significant increasewith the increasing N application rates from N2 to N3.Straw Zn content was significantly increased by N2
treatment compared to N0 or N1, but did not differsignificantly from N3 treatment in both growing sea-sons (Table 2). Similar results were also found in grainand straw N content (Table 2).
The Zn harvest index (ZnHI) was less affected by Napplication rates in two cropping seasons and aver-aged 83 % and 64 % in the first and second croppingseasons, respectively. In the second cropping season,the average ZnHI was much lower than that in the firstcropping season (Table 2). The N harvest index (NHI),generally, tended to decline as the rate of N applicationwas increased in both years (Table 2).
Shoot Zn uptake and Zn remobilizationduring the grain-filling period
As shown in Table 4, during grain-filling period, post-anthesis Zn uptake among the four N rates rangedfrom 35 gha−1 to 60 gha−1 and from 0 gha−1 to 35 gha−1 in the first and second cropping seasons, respec-tively, which correspondingly accounted for 23 % to33 % and 0 % to 28 % of total shoot Zn content atmaturity. By contrast, 67 % to 77 % and 72 % to100 % of the shoot Zn have been accumulated atanthesis in the first and second cropping seasons,respectively. During grain-filling period, Zn remobili-zation into grain showed an increasing trend withincreasing N supply from N0 to N3. For example, Znremobilization ranged from 52 gha−1 at N0 rate to152 gha−1 at N3 rate in the first cropping season andfrom 32 gha−1 at N0 rate to 138 gha−1 at N3 rate in thesecond cropping season. Furthermore, straw Zn
remobilization was significantly correlated with strawN remobilization to grains (Fig. 4a). Correspondingly,the share (percentage) of grain Zn provided by remo-bilization of the pre-anthesis Zn stores accounted for61 % to 75 % in the first cropping season and 59 %to100% in the second cropping season. The Zn remo-bilization efficiency was not consistently affected byN levels and fluctuated from 69 % to 81 % in the firstcropping season and from 50 % to 69 % in the secondcropping season (Table 4).
Soil DTPA-extractable Zn concentration
N application rates did not significantly affect the soilDTPA-extractable Zn concentration in both croppingseasons. Soil DTPA-extractable Zn concentrationswere higher in 2008–2009 than that in 2007–2008regardless of N rates (Table 5).
Discussion
Shoot biomass was significantly enhanced by increas-ing N supply from N0 to N2 treatment at almost thegrowing stages, while N1 treatment resulted in inter-mediate values (Fig. 1). Further increasing N supplyfrom N2 to N3 did not make an extra contribution togrowth, even resulted in slight decline in grain andstraw yield at maturity (Fig. 1; Table 2). These resultsindicated that the N2 rates applied in 2007–2008 (e.g.198 kgN ha−1) and in 2008–2009 (e.g. 195 kgN ha−1)were already sufficient to maintain plant growth.
Improving N nutritional status of plants greatlycontributed to grain Zn accumulation. Approximately72 % and 30 % of increases in grain Zn concentration
Table 3 Pearson relationshipsbetween shoot N and Zn con-centrations at regreening, joint-ing, heading, flowering, fillingand maturity (straw and grain)stages in 2007–2008 and in2008–2009 (n032)
*, *** and n.s. indicate correla-tion coefficient significantly dif-ferent at P<0.05, 0.001 or non-significant effect, respectivelyaPlant samples were collected atheading stage only in 2008–2009
Growth stage N concentration Zn concentration
Shoot Straw Grain
Regreening Shoot 0.591*** – –
Jointing Shoot 0.228, n.s. – –
Heading a Shoot 0.779 *** – –
Flowering Shoot 0.611*** – –
Filling Shoot 0.893*** – –
Maturity Shoot 0.159, n.s. – –
Maturity Straw – −0.089, n.s. –
Maturity Grain – – 0.403*
Plant Soil (2012) 361:153–163 159

were achieved by increasing N supply from N0 to N3
in the first and second cropping seasons, respectively(Table 2). Such significant increases in Zn concentra-tions were also found for shoot tissue (Fig. 3).
Enhancement in Zn and Fe tissue concentrations byincreasing N supply has been suggested, at leastin part, due to a growth enhancement effect of N(Aciksoz et al. 2011a). Besides its effect on growth,
Table 4 Post-anthesis Zn uptake, percentage of pre-anthesisand post-anthsis Zn uptake to total Zn uptake at maturity, Znremobilization to the grain, Zn remobilization efficiency andcontributions of remobilization of pre-anthesis Zn stores andpost-anthesis shoot Zn uptake to grain Zn accumulation ofwinter wheat as affected by N application rates (N0: no N
application; N1: 99 kgN ha−1; N2: 198 kgN ha−1; N3: 297 kgN ha−1) during 2007–2008 and (N0: no N application; N1:82.5 kgN ha−1; N2: 195 kgN ha−1; N3: 292.5 kgN ha−1) during2008–2009, respectively, in the field. Values are the means offour replicates
Years Parameters N application rates
N0 N1 N2 N3
2007–2008 Post-anthesis Zn uptake a (gha−1) 37 35 60 56
Percentage of post-anthesis Zn accumulation (%) 33 23 28 23
Percentage of pre-anthesis Zn accumulation (%) 67 77 72 77
Zn remobilization to the grain b (gha−1) 52 95 116 152
Zn remobilization efficiency (%) 69 81 74 79
Share of grain Zn provided by:
Remobilization of pre-anthesis Zn (%) 61 73 67 75
Post-anthesis shoot Zn uptake (%) 39 27 33 25
2008–2009 Post-anthesis Zn uptake a (gha−1) 23 0 35 19
Percentage of post-anthesis Zn accumulation (%) 28 0 14 7
Percentage of pre-anthesis Zn accumulation (%) 72 100 86 93
Zn remobilization to the grain b (gha−1) 32 96 111 138
Zn remobilization efficiency (%) 52 69 50 54
Share of grain Zn provided by:
Remobilization of pre-anthesis Zn (%) 59 100 75 88
Post-anthesis shoot Zn uptake (%) 41 0 25 12
a Assume: ~100 % of post-anthesis Zn uptake from soil absorbed by rootsb Assume: ~100 % of Zn remobilized from the straw is translocated to grains
y = 0.9403x + 6.025R² = 0.5911***
0
50
100
150
200
250
0 50 100 150 200
Zn
rem
obili
zatio
n (g
ha-1
)
Zn
rem
obili
zatio
n (g
ha-1
)
N remobilization (kg ha-1)
y = 4.1937x - 18.706R² = 0.2958**
0
50
100
150
200
250
0 10 20 30 40 50
Grain Zn concentration (mg kg-1)
A B
Fig. 4 Pearson relationships between straw N and Zn remobilization to the grains (a) and grain Zn concentration and straw Znremobilization to the grains (b), ** and *** indicate correlation coefficient significantly different at P<0.01 and 0.001, respectively
160 Plant Soil (2012) 361:153–163
increasing N supply may also have positive impacts onshoot Zn accumulation. For example, in the presentstudy here, compared to the control in 2007–2008, therelative increase in shoot Zn content at anthesis amongN1, N2 and N3 rate was 58 %, 108 % and 160 %,respectively (Fig. 3), whereas their correspondingincreases in shoot dry matter production under N1, N2
and N3 treatment were only 26 %, 45 % and 35 %(Fig. 1). Similar results were also found at almost othergrowing stages in both cropping seasons (Figs. 1 and 3),suggesting that increases in shoot growth caused byincreased N application cannot be a major reason forincreased shoot Zn content, which was agreement withothers (Aciksoz et al. 2011a; Kutman et al. 2010). Asignificant positive relationship was found betweenshoot N and Zn concentration at almost growing stages(Table 3), suggesting that mechanisms contributing toroot uptake and root-to-shoot transport of Zn are posi-tively affected by improving N supply. In good agree-ment with this suggestion, evidence from Erenoglu et al.(2011) using 65Zn-labeling studies indicated that im-proved N supply significantly enhanced the rate of rootZn uptake and more evidently the root-to-shoot trans-port of Zn, probably due to N-enhanced abundance ofroot Zn uptake transporters, including ZIPs such asIRT1 (Guerinot 2000; Hall andWilliams 2003; Ishimaruet al. 2005). Cakmak et al. (2010b) discussed positiveimpacts of N nutrition on root uptake and grain accu-mulation of Zn in relation to N-promoted activities oftransporter proteins involving in xylem loading andunloading of Zn and N-induced production of nitroge-nous compounds facilitating Zn transport in plants such
as nicotianamine and deoxymugineic acid. The roles oftransporter proteins and nitrogenous compounds (e.g.nicotianamine) in root uptake, shoot transport and seeddeposition of Zn and other metals such as Fe have beenreviewed by others (Curie et al. 2009; Haydon andCobbett 2007; Palmer and Guerinot 2009).
Previous studies suggested that increased N supplymay stimulate microbial activity, enhance root exuda-tion and elevate release of organic compounds fromthe roots (Liljeroth et al. 1990; Paterson et al. 2006),resulting in release micronutrients (e.g. Zn) chelatedby soil organic matter. Recently, it has been reportedthat improving N nutritional status of wheat plantsresulted in substantial increases in root release ofphytosiderophores (Aciksoz et al. 2011b), which areof great importance for mobilization and root uptakeof Zn and Fe, especially in calcareous soils (Treeby etal. 1989). In the present study, the soil effect on grainZn accumulation has been excluded because the soilDTPA-extractable Zn concentrations before sowingand after harvest were both slightly affected by theN fertilization rates in the two cropping seasons(Table 5). However, soil DTPA-extractable Zn con-centrations significantly increased with growingseasons (Table 5), indicating a residual effect ofZn fertilization application.
Zn remobilization from vegetative tissues into grainmight be an important process for grain Zn accumula-tion under field conditions such as in North ChinaPlain. This plain has mainly calcareous soils withlimited soil moisture and is exposed to continentalhot, dry wind, high temperature and water deficiencyduring grain filling (Yang et al. 2000; Zhou et al.2007). Consequently, a limited root uptake of Zn canbe expected during grain filling. Under such condi-tions, grains Zn rely mostly on export of Zn fromvegetative parts during grain formation. The resultsobtained in this study under field conditions supportthis statement (Table 4). The present study furthershowed that there was significant positive correlationbetween straw Zn and N remobilization to grainsduring grain filling stage (Fig. 4a). Straw Zn remobi-lization was also significantly correlated with grain Znconcentration (Fig. 4b). These results suggest thatincreasing N supply mainly enhanced Zn remobiliza-tion during grain filling period and most of the grainZn originates mainly from Zn remobilization fromvegetative tissues under field conditions. This findingis in agreement with the suggestions made before in
Table 5 Soil DTPA-extractable Zn concentration affected by Napplication after harvesting (a) during 2007–2008 (N0: no Napplication; N1: 99 kgN ha−1; N2: 198 kgN ha−1; N3: 297 kgNha−1) and before sowing (b) and after harvesting (c) during2008–2009 (N0: no N application; N1: 82.5 kgN ha−1; N2:195 kgN ha−1; N3: 292.5 kgN ha−1), in the fields
Treatment DTPA Zn concentration (mgkg−1)
2007–2008a 2008–2009b 2008–2009c
N0 1.1a 2.6a 2.3a
N1 1.2a 2.0a 2.3a
N2 0.9a 2.3a 2.7a
N3 1.1a 1.7a 2.6a
Means of four replications in a column followed by differentlowercase letters are significantly different in different N treat-ments (P<0.05)
Plant Soil (2012) 361:153–163 161
greenhouse studies (Cakmak et al. 2010a; Kutman etal. 2011a; Waters and Grusak 2008). In agreementwith the present results, very recent research alsoreported that compared to post-pollination root ab-sorption of Zn, Zn remobilization became the domi-nating source of grain Zn in barley plants even withmedium and high Zn status under nutrient solution(Hegelund et al. 2012).
In this study, compared with N3 treatment, optimalN management (N2 treatment) by reasonably decreas-ing N input did not result in any significant decrease ingrain Zn as well as grain penalties in both croppingseasons (Table 2). It seems that the N2 treatment used(e.g. optimal N management) is already enough tosatisfy shoot Zn accumulation and maintain Zn remo-bilization from vegetative tissues into grains.
For wheat, increasing Zn supply through foliarspray of Zn fertilizers seems to be adequate to increasegrain Zn concentrations (Cakmak 2008; Cakmak et al.2010a; Kutman et al. 2010), implying that grain sinkstrength or Zn translocation to grains are not limitingfactors (Waters and Sankaran 2011). These observa-tions suggest that improving Zn uptake by sufficient Nsupply during vegetative growth period with foliar Znspray under field conditions may maximize Zn accu-mulation in grain due to a possible high sink activityfor Zn during grain-filling period.
Acknowledgements This research was supported by the 973project (No.2009CB18606), the National Natural Science Foun-dation of China (30871592), the Innovative Group Grant ofNSFC (31121062), the Innovation Fund for Graduate Studentof China Agricultural University (KYCX2010072). The authorsare also grateful to Mr Haiyong Xia from CAU for his assistingto this work.
References
Aciksoz S, Yazici A, Ozturk L, Cakmak I (2011a) Biofortifica-tion of wheat with iron through soil and foliar applicationof nitrogen and iron fertilizers. Plant Soil 349:215–225
Aciksoz SB, Ozturk L, Gokmen OO, Römheld V, Cakmak I(2011b) Effect of nitrogen on root release of phytosidero-phores and root uptake of Fe(III)-phytosiderophore in Fe-deficient wheat plants. Physiol Plant 142:287–296
Bogard M, Allard V, Brancourt-Hulmel M, Heumez E, MachetJM, Jeuffroy MH, Gate P, Martre P, Le Gouis J (2010)Deviation from the grain protein concentration–grain yieldnegative relationship is highly correlated to post-anthesis Nuptake in winter wheat. J Exp Bot 61:4303–4312
BogardM, JourdanM, Allard V, Martre P, Perretant MR, Ravel C,Heumez E, Orford S, Snape J, Griffiths S, Gaju O, Foulkes J,Le Gouis J (2011) Anthesis date mainly explained correla-tions between post-anthesis leaf senescence, grain yield, andgrain protein concentration in a winter wheat populationsegregating for flowering time QTLs. J Exp Bot 62:3621–3636
Borrell A, Hammer G, Van Oosterom E (2001) Stay-green: aconsequence of the balance between supply and demandfor nitrogen during grain filling? Ann Appl Biol 138:91–95
Cakmak I (2008) Enrichment of cereal grains with zinc: agro-nomic or genetic biofortification? Plant Soil 302:1–17
Cakmak I, Kalayci M, Kaya Y, Torun AA, Aydin N, Wang Y,Arisoy Z, Erdem H, Yazici A, Gokmen O, Ozturk L, HorstWJ (2010a) Biofortification and localization of zinc inwheat grain. J Agric Food Chem 58:9092–9102
Cakmak I, Pfeiffer WH, McClafferty B (2010b) Biofortificationof durum wheat with zinc and iron. Cereal Chem 87:10–20
Chen X, Zhang F, Römheld V, Horlacher D, Schulz R, Böning-Zilkens M, Wang P, Claupein W (2006) Synchronizing Nsupply from soil and fertilizer and N demand of winter wheatby an improvedNminmethod. Nutr Cycl Agroecosyst 74:91–98
Curie C, Cassin G, Couch D, Divol F, Higuchi K, Jean ML,Misson J, Schikora A, Czernic P, Mari S (2009) Metalmovement within the plant: contribution of nicotianamineand yellow stripe 1-like transporters. Ann Bot 103:1–11
Distelfeld A, Cakmak I, Peleg Z, Ozturk L, Yazici AM, BudakH, Saranga Y, Fahima T (2007) Multiple QTL-effects ofwheat Gpc-B1 locus on grain protein and micronutrientconcentrations. Physiol Plant 129:635–643
Erenoglu EB, Kutman UB, Ceylan Y, Yildiz B, Cakmak I (2011)Improved nitrogen nutrition enhances root uptake, root-to-shoot translocation and remobilization of zinc (65Zn) inwheat. New Phytol 189:438–448
Gibson RS (2006) Zinc: the missing link in combating micro-nutrient malnutrition in developing countries. Proc NutrSoc 65:51–60
Guerinot ML (2000) The ZIP family of metal transporters.Biochim Biophys Acta 1465:190–198
Guo JH, Liu XJ, Zhang Y, Shen JL, Han WX, Zhang WF,Christie P, Goulding KWT, Vitousek PM, Zhang FS(2010) Significant acidification in major Chinese crop-lands. Science 327:1008–1010
Hall JL, Williams LE (2003) Transition metal transporters inplants. J Exp Bot 54:2601–2613
Haslett BS, Reid RJ, Rengel Z (2001) Zinc mobility in wheat:uptake and distribution of zinc applied to leaves or roots.Ann Bot 87:379–386
Haydon MJ, Cobbett CS (2007) Transporters of ligands foressential metal ions in plants. New Phytol 174:499–506
Hegelund J, Pedas P, Husted S, Schiller M, Schjoerring J (2012)Zinc fluxes into developing barley grains: use of stable Znisotopes to separate root uptake from remobilization inplants with contrasting Zn status. Plant Soil 1–10
Hotz C, Brown KH (2004) Assessment of the risk of zincdeficiency in populations and options for its control. FoodNutr Bull 25:S94–S203
Ishimaru Y, Suzuki M, Kobayashi T, Takahashi M, Nakanishi H,Mori S, Nishizawa NK (2005) OsZIP4, a novel zinc-regulated zinc transporter in rice. J Exp Bot 56:3207–3214
162 Plant Soil (2012) 361:153–163
Kutman UB, Yildiz B, Ozturk L, Cakmak I (2010) Biofortifica-tion of durum wheat with zinc through soil and foliarapplications of nitrogen. Cereal Chem 87:1–9
Kutman U, Yildiz B, Cakmak I (2011a) Effect of nitrogen onuptake, remobilization and partitioning of zinc and ironthroughout the development of durum wheat. Plant Soil342:149–164
Kutman UB, Yildiz B, Cakmak I (2011b) Improved nitrogen statusenhances zinc and iron concentrations both in the whole grainand the endosperm fraction of wheat. J Cereal Sci 53:118–125
Le C, Zha Y, Li Y, Sun D, Lu H, Yin B (2010) Eutrophication oflake waters in China: cost, causes, and control. EnvironManage 45:662–668
Liljeroth E, Van Veen JA, Miller HJ (1990) Assimilate translo-cation to the rhizosphere of two wheat lines and subsequentutilization by rhizosphere microorganisms at two soil ni-trogen concentrations. Soil Biol Biochem 22:1015–1021
Ma GS, Jin Y, Li YP, Zhai FY, Kok FJ, Jacobsen E, Yang XG(2008) Iron and zinc deficiencies in China: what is a feasibleand cost-effective strategy? Public Health Nutr 11:632–638
Palmer CM, Guerinot ML (2009) Facing the challenges of Cu, Feand Zn homeostasis in plants. Nat Chem Biol 5:333–340
Paterson E, Sim A, Standing D, Dorward M, McDonald AJS(2006) Root exudation from Hordeum vulgare in responseto localized nitrate supply. J Exp Bot 57:2413–2420
Shi RL, Zhang YQ, Chen XP, Sun QP, Zhang FS, Römheld V,Zou CQ (2010) Influence of long-term nitrogen fertiliza-tion on micronutrient density in grain of winter wheat(Triticum aestivum L.). J Cereal Sci 51:165–170
Stein AJ, Nestel P, Meenakshi J, Qaim M, Sachdev H, BhuttaZA (2007) Plant breeding to control zinc deficiency inIndia: how cost-effective is biofortification? Public HealthNutr 10:492–501
Treeby M, Marschner H, Römheld V (1989) Mobilization ofiron and other micronutrient cations from a calcareous soilby plant-borne, microbial, and synthetic metal chelators.Plant Soil 114:217–226
Uauy C, Distelfeld A, Fahima T, Blechl A, Dubcovsky J (2006)A NAC gene regulating senescence improves grain protein,zinc, and iron content in wheat. Science 314:1298–1301
Waters BM, Grusak MA (2008) Whole-plant mineral partition-ing throughout the life cycle in Arabidopsis thaliana eco-types Columbia, Landsberg erecta, Cape Verde Islands, andthe mutant line ysl1ysl3. New Phytol 177:389–405
Waters BM, Sankaran RP (2011) Moving micronutrients fromthe soil to the seeds: genes and physiological processesfrom a biofortification perspective. Plant Sci 180:562–574
Waters BM, Uauy C, Dubcovsky J, Grusak MA (2009) Wheat(Triticum aestivum) NAM proteins regulate the transloca-tion of iron, zinc, and nitrogen compounds from vegetativetissues to grain. J Exp Bot 60:4263–4274
Welch RM, Graham RD (2004) Breeding for micronutrients instaple food crops from a human nutrition perspective. JExp Bot 55:353–364
World Health Organization (WHO) (2002) The World HealthReport 2002. WHO, Geneva
Yang JC, Zhang JH (2006) Grain filling of cereals under soildrying. New Phytol 169:223–236
Yang JC, Zhang JH, Huang ZL, Zhu QS, Wang L (2000)Remobilization of carbon reserves is improved by con-trolled soil-drying during grain filling of wheat. Crop Sci40:1645–1655
Zhang YQ, Shi L, Rezaul KM, Zhang FS, Zou CQ (2010) Ironand zinc concentrations in grain and flour of winter wheatas affected by foliar application. J Agric Food Chem58:12268–12274
Zhang YQ, Sun YX, Ye YL, Karim MR, Xue YF, Yan P, MengQF, Cui ZL, Cakmak I, Zhang FS, Zou CQ (2012) Zincbiofortification of wheat through fertilizer applications indifferent locations of China. Field Crop Res 125:1–7
Zheng XH, Han SH, Huang Y, Wang YS, Wang MX (2004) Re-quantifying the emission factors based on field measure-ments and estimating the direct N2O emission from Chi-nese croplands. Glob Biogeochem Cycles 18
Zhou Y, He ZH, Sui XX, Xia XC, Zhang XK, Zhang GS (2007)Genetic improvement of grain yield and associated traits inthe Northern China winter wheat region from 1960 to2000. Crop Sci 47:245–253
Zhuang QS (2003) Chinese wheat improvement and pedigreeanalysis. China Agriculture Press, Beijing
Plant Soil (2012) 361:153–163 163