Grain Transportation Report - Agricultural Marketing Service
Upload
independentCategory
view
1download
0
ARTICLE IN PRESS
0961-9534/$ - se
doi:10.1016/j.bi
�CorrespondE-mail addr
Biomass and Bioenergy 31 (2007) 416–425
www.elsevier.com/locate/biombioe
Grain and cellulosic ethanol: History, economics, and energy policy
Barry D. Solomon�, Justin R. Barnes, Kathleen E. Halvorsen
Environmental Policy Program, Department of Social Sciences, Michigan Technological University, 1400 Townsend Drive, Houghton, MI 49931-1295, USA
Received 27 April 2006; received in revised form 14 November 2006; accepted 30 January 2007
Available online 13 March 2007
Abstract
The United States (US) and Brazil have been the two leading producers of fuel ethanol since the 1970s. National policies have
supported the production and use of ethanol from corn and sugarcane. US support in particular has included exemption from federal
gasoline excise taxes, whole or partial exemption from road use (sales) taxes in nine states, a federal production tax credit, and a federal
blender’s credit. In the last decade the subsidization of grain-based ethanol has been increasingly criticized as economically inefficient and
of questionable social benefit. In addition, much greater production of ethanol from corn may conflict with food production needs. A
promising development is the acceleration of the technical readiness of cellulosic alcohol fuels, which can be produced from the woody
parts of trees and plants, perennial grasses, or residues. This technology is now being commercialized and has greater long-term potential
than grain ethanol. Cellulosic ethanol is projected to be much more cost-effective, environmentally beneficial, and have a greater energy
output to input ratio than grain ethanol. The technology is being developed in North America, Brazil, Japan and Europe. In this paper,
we will review the historical evolution of US federal and state energy policy support for and the currently attractive economics of the
production and use of ethanol from biomass. The various energy and economic policies will be reviewed and assessed for their potential
effects on cellulosic ethanol development relative to gasoline in the US.
r 2007 Elsevier Ltd. All rights reserved.
Keywords: Biomass; Cellulosic ethanol; Corn; Energy Policy Act; Excise tax; Gasohol; MTBE
1. Introduction
While US interest in fuel ethanol has grown since the oilcrises of the 1970s, its use in gasoline blends accounted foronly 2.8 percent of total fuel use in motor vehicles in 2005[1]. Although ethanol (i.e., ethyl alcohol) has the advantageof being derived from domestic resources, its use for fuelhas often been criticized as technically, economically andenvironmentally undesirable (see e.g., [2]). Even so, interestin alternative transportation fuels is growing for two mainreasons: oil supply insecurity and its impending peak, andthe imperative to lower carbon dioxide (CO2) emissionsfrom fossil fuel use in order to stave off adverse globalclimatic change [3,4].
Several alternative fuels and engines for the transportsector have been assessed in detail in recent years [5]. Theseinclude electric and hybrid-electric vehicles (HEVs),
e front matter r 2007 Elsevier Ltd. All rights reserved.
ombioe.2007.01.023
ing author. Tel.: +1906 487 1791; fax: +1 906 487 2468.
ess: [email protected] (B.D. Solomon).
compressed natural gas (CNG), hydrogen-fuel cells, andbiomass fuels. While electric and CNG vehicles areavailable on a small scale their driving range is limited,severely restricting their consumer appeal. Hydrogen-fuelcell vehicles exist as prototypes, but they are extremelyexpensive and will be impractical for a decade or more [6].This leaves HEVs and biomass fuels as the most cost-effective alternatives to oil in the near term (Table 1 belowlists the various acronyms used in this paper and explainswhat each stands for). HEVs are attractive, as they increasefuel use efficiency and thus help to stretch petroleumresources and lower CO2 emissions. Only sustainablebiomass fuels however, such as ethanol and bio-diesel,can directly decrease oil reliance.There are several ways to make biomass fuels, as well as
alternative alcohol products. For example, in the 1970smethyl alcohol (methanol) received as much considerationas ethanol. Both fuels can be produced from food cropsand biomass, as well as from fossil fuels [7]. Whilemethanol can be made at a lower cost than ethanol, some
ARTICLE IN PRESS
Table 1
Explanation of acronyms used within text
Acronym Explanation of acronym
$ United States dollars
ADM Archer Daniels Midland Company
c l�1 Cents per litre
c gal�1 Cents per US gallon
CAFE Corporate average fuel economy
CNG Compressed natural gas
CO2 Carbon dioxide
DDGS Distiller’s dried grains with solubles
E20, E85, E95 Volume percentage ethanol in fuel
EPA United States Environmental Protection Agency
EPAct United States Energy Policy Act of 2005
ETA United States Energy Tax Act of 1978
ETBE Ethyl tertiary butyl ether
Gal US gallon ¼ 3.7854 l
HEVs Hybrid-electric vehicles
Kg Kilogram
L Litre
Mg 106 g or 1 tonne
MTBE Methyl tertiary butyl ether
RFS Renewable fuel standard
VEETC Volumetric ethanol excise tax credit
B.D. Solomon et al. / Biomass and Bioenergy 31 (2007) 416–425 417
refiners over-blended or used improper blending andhandling techniques. This led to consumer and mediaproblems and the eventual phase-out of almost allmethanol/gasoline blends, with its use largely restricted toseveral auto races. Even here, the Indy Racing Leagueannounced in March 2005 that the Indianapolis 500 autorace plans to switch its cars from methanol to 100 percentethanol fuel by 2007 [8]. Similarly, methanol caught on as afeedstock for production of methyl tertiary butyl ether(MTBE) under Clean Air Act requirements for 2.0–2.7percent oxygen blends in ozone and carbon monoxide non-attainment areas. However, MTBE has been at leastpartially banned in half of the US states in the last severalyears because of groundwater toxicity problems, althoughover half of these states never used it [9,10]. Alternatively,interest has grown in coupling methanol with fuel cells as atransitional fuel until sufficient hydrogen productioncapacity becomes available [5]. Nonetheless, the mainmarkets for methanol are for formaldehyde, acetic acid andother chemicals. Another promising option is biodiesel(FAME fatty acid methyl esters), which is made fromvegetable oil or animal fats. Biodiesel has similar benefitsas cellulosic ethanol, as noted below, but is limited to dieselengines.
There are two primary technologies to make ethanolfuel. The first option, in wide use today, is to convert thestarchy part of foods such as corn into ethanol through thefollowing seven steps: milling, liquefaction, saccharifica-tion, fermentation, distillation, dehydration and denatur-ing. When sugarcane is used (e.g. in Brazil) only four or fivesteps are required: milling, pressing, fermentation anddistillation, plus dehydration in the case of alcohol blends.The other option is lignocellulosic or cellulosic ethanol,
which is currently being commercialized. This processconverts the woody part of trees, plants, grasses or residuesinto sugars and then ferments the sugars into ethanol.Over 95 percent of ethanol production in the US comes
from corn, with the rest made from wheat, barley, milo,cheese whey, and beverage residues [11]. This path toethanol production has been criticized, often erroneously,for having an unfavorable net energy balance andsignificant arable land and water requirements [12]. Whilecorn-based ethanol has several important environmentalimpacts, including soil erosion, loss of biodiversity, andhigher volatile organic compound and NOx pollution, itdoes result in a positive energy return on investment and a10–15 percent reduction in CO2 emissions (cf. [2,4,12–14]).These results are more favorable for sugarcane-basedethanol in Brazil [15]. Given land use concerns it is unlikelythat grain ethanol can grow from its current US output of19 hm3 (5.1Ggal (Giga ¼ 109)) year�1 to much more thanthree times that level, even with increased agriculturalproductivity [11]. For one thing, over half of the US corncrop is needed as feed grain for livestock as compared to 17percent for ethanol [16].Fortunately cellulosic ethanol has the potential to be
superior on all of these dimensions except for conventionalair pollution. Its advantages are that it can reduce net CO2
emissions to almost zero, and that it can be derived from adiverse, widespread resource base (see e.g., [3]). Forinstance, it can be made from tree species such as hybridpoplar, willow, silver maple and black locust; woodresidues including chips and sawdust; construction siteresidues, municipal residues (MSW), paper and sewagesludge; corn stover, corn and sugarcane processingresidues; cereal straws such as wheat, oat, barley and rice;and grasses such as switchgrass, sorghum, reed canarygrass, and miscanthus.The purpose of this paper is to assess the progress and
evolution of the ethanol industry from one based largely oncorn and sugarcane to one that we expect will beincreasingly based on cellulosic materials, and trackingethanol’s position in the US relative to gasoline. The nextsection traces the development of ethanol fuel from itsconsideration in the early stages of the automobile industryto its use as a substitute liquid fuel today in the US, Braziland elsewhere. This will be followed by a review of thesimple economics of ethanol fuel production. The nextsection will consider several federal and state policyinstruments that have been used in the ethanol industry,including a variety of tax credits and the newly enacted USRenewable Fuel Standard. The paper will close with somepreliminary conclusions about the future of ethanoldevelopment and use and the efficacy of public policies.
2. Historical development
Ethanol and ethanol–gasoline blends have a long historyas automotive fuels [17,18]. In the late 1800s for example,Henry Ford, Nicholas Otto and others built engines and
ARTICLE IN PRESSB.D. Solomon et al. / Biomass and Bioenergy 31 (2007) 416–425418
cars that could run on ethanol. Ford equipped his Model Tin 1908 as a flexible fuel vehicle, with carburetors thatcould be adjusted to use alcohol, gasoline, or a ‘‘gasohol’’mix. The need for fuel during World War I increased thedemand for ethanol in the US to 0.19–0.23 hm3
(550–60Mgal) year�1. Demand decreased after the Warbecause gasoline became the motor fuel of choice, but therewas a continued interest (e.g., from General MotorsCorporation and DuPont) in ethanol as both an anti-knock agent (i.e., octane enhancer) and as a possiblereplacement for petroleum fuels. The discovery of the anti-knock properties of tetraethyl lead in 1921 dampened someof the enthusiasm for ethanol, and despite persistent healthconcerns, sales of leaded gasoline increased dramatically insubsequent years. Alcohol blended fuels enjoyed a briefresurgence in the mid 1930s as falling corn prices promptedMidwestern states to seek alternative uses for their farmproducts. During this period, various alcohol–gasolineblends were marketed under trademarked names such asAlcolene and Agrol. The latter brand, with blends rangingfrom 5 to 17.5 percent alcohol, was sold in over 2000 retailsoutlets from Indiana to South Dakota during the late1930s. After World War II however, interest in ethanolwaned because leaded gasoline proved cheaper and easierto produce while new oil discoveries reduced the perceivedurgency of finding petroleum substitutes [18].
The fuel ethanol market was revived in the 1970s. First,Brazil developed a crash ‘‘Proalcool’’ Program in 1975based on sugarcane in response to the 1973 OPEC Arab oilembargo. Over half of the cars in Brazil ran on 95 percentanhydrous ethanol (E95) in the late 1980s, though a late1980s sugar shortage and price hikes have reduced thatfigure to where it is today, at 20 percent of flex-fuel cars.Still, all of the gasoline sold in Brazil today must have atleast a 25 percent anhydrous alcohol blend (E20). Ethanolcurrently comprises about 40 percent of the total vehiclefuel used within the country [19]. Brazil also exported over0.38 hm3 (100Mgal) of ethanol to both India and the US in2005 [20].
Although the US rebuilt its fuel ethanol industry moregradually than Brazil, the two nations are today the worldleaders in its production and usage (Table 2). The US
Table 2
Top ten ethanol producing nations capacity in hm3 (Ggal) year�1
Nation 2004 2005
Brazil 15 (4) 16 (4.2)
US 13 (3.4) 15 (3.9)
China 3.7 (0.96) 3.8 (1.0)
India 1.8 (0.46) 1.7 (0.45)
France 0.84 (0.22) 0.91 (0.24)
Russia 0.76 (0.2) 0.76 (0.2)
Germany 0.27 (0.07) 0.43 (0.11)
South Africa 0.42 (0.11) 0.38 (0.10)
Spain 0.30 (0.08) 0.35 (0.09)
UK 0.42 (0.08) 0.35 (0.09)
Source: [21].
Energy Tax Act of 1978 (ETA) officially defined gasohol asa blend of gasoline with at least 10 percent non-fossil fuelbased ethanol by volume. The ETA exempted ethanol fromthe 1.1 c l�1 (4.0 c gal�1) excise tax on gasoline, whichequaled a 10.5 c l�1 (40.0 c gal�1) subsidy for ethanol [7].After peaking at 15.8 c l�1 (60.0 c gal�1) in the mid to late1980s, this excise tax exemption was reduced to 13.4 c l�1
(51.0 c gal�1) of ethanol in 2005 [22].After the 1980s leaded gasoline phase-out by the US
Environmental Protection Agency (EPA), interest in-creased in using ethanol as an octane booster and volumeextender. However, MTBE dominated most oxygenatedgasoline markets over ethyl tertiary butyl ether (ETBE)throughout the 1990s. While the commercial ethanolindustry was small at this time, in 1980 Congress approvedseveral more tax benefits, as well as loan and priceguarantees, to support ethanol producers and blenders.The growth of this industry was again stymied by lowgasoline prices following the oil price collapse of the mid1980s.The Energy Policy Act of 1992 contributed to increased
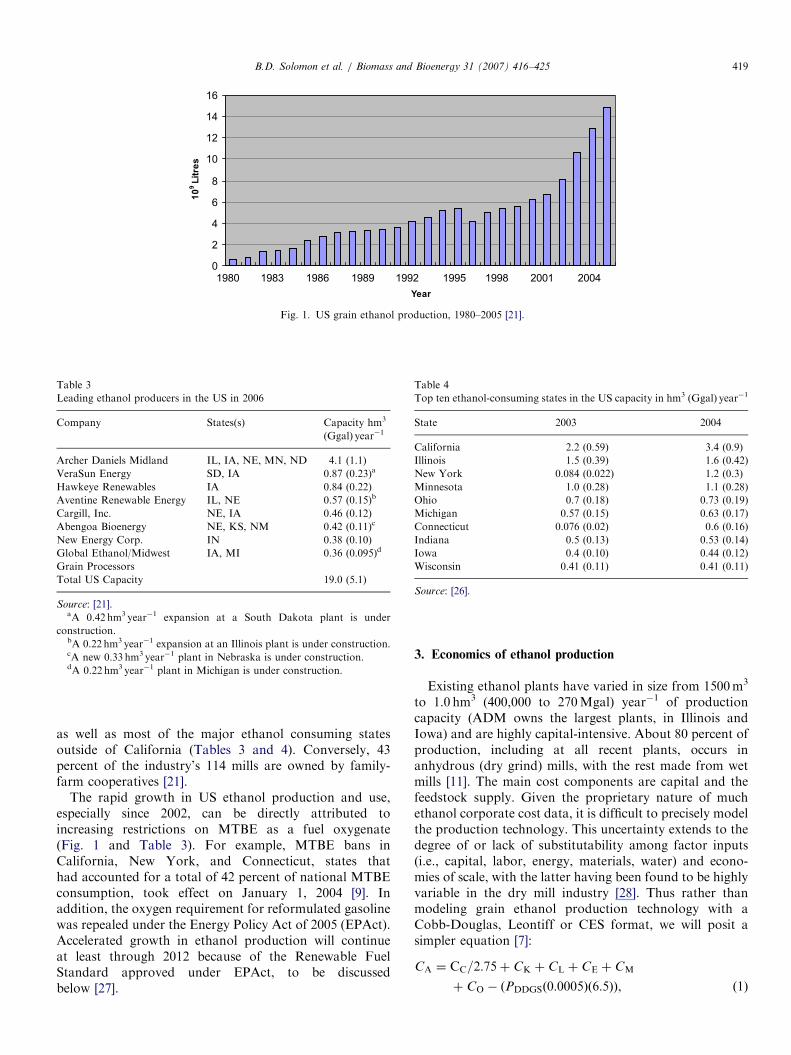
usage of ethanol blends by requiring specified (primarilygovernment-owned) car fleets to begin purchasing alter-native fuel and flex-fuel vehicles. Such vehicles had to becapable of operating on E85, which is a blend of 85 percentethanol and 15 percent gasoline. In the private sector, theproduction of alternative fuel vehicles was promoted by theAlternative Motor Fuels of Act of 1988, which providedauto companies with credits against their compliancerequirements under the Corporate Average Fuel Economy(CAFE) standards for each flex-fuel or alternative fuelvehicle they produced [22]. In reality, the initiative had littleeffect on the use of alternative fuels because at the time fewfuel retailers offered E85. For this reason, the program wasfrequently criticized as a mechanism for automakers toavoid CAFE requirements while being ineffective atsupporting purchases of E85 [23]. Even today, theestimated five million of such vehicles on the road relyprimarily on gasoline alone because only one thousand USretail outlets sell E85 [24]. Even so, US annual ethanolproduction passed the 3.8 hm3 (1.0 billion gallon) mark in1992 (Fig. 1). Continued low gasoline prices in the early1990s, coupled with weak corn harvests and the doublingof corn prices, led several Midwestern states to approvenew subsidies to keep the struggling ethanol industrysolvent. In 1996 total ethanol production nonethelessdeclined by 1.1 hm3 from the 1995 level, reducing outputback to the 1992 level [25].For the US ethanol industry the last decade has been far
different. Ethanol production recovered, consolidated,and grew rapidly, with total 2005 output triple that of1997 (Fig. 1). The industry today has a low four-firmconcentration ratio of 32 percent although one firm,Archer Daniels Midland (ADM), accounts for 19 percentof total production (down from 75 percent in 1990). ADMoperates distilleries in several Great Plains and NorthCentral states. The facilities are close to large corn farms,
ARTICLE IN PRESS
Fig. 1. US grain ethanol production, 1980–2005 [21].
Table 3
Leading ethanol producers in the US in 2006
Company States(s) Capacity hm3
(Ggal) year�1
Archer Daniels Midland IL, IA, NE, MN, ND 4.1 (1.1)
VeraSun Energy SD, IA 0.87 (0.23)a
Hawkeye Renewables IA 0.84 (0.22)
Aventine Renewable Energy IL, NE 0.57 (0.15)b
Cargill, Inc. NE, IA 0.46 (0.12)
Abengoa Bioenergy NE, KS, NM 0.42 (0.11)c
New Energy Corp. IN 0.38 (0.10)
Global Ethanol/Midwest
Grain Processors
IA, MI 0.36 (0.095)d
Total US Capacity 19.0 (5.1)
Source: [21].aA 0.42 hm3 year�1 expansion at a South Dakota plant is under
construction.bA 0.22 hm3 year�1 expansion at an Illinois plant is under construction.cA new 0.33 hm3 year�1 plant in Nebraska is under construction.dA 0.22 hm3 year�1 plant in Michigan is under construction.
Table 4
Top ten ethanol-consuming states in the US capacity in hm3 (Ggal) year�1
State 2003 2004
California 2.2 (0.59) 3.4 (0.9)
Illinois 1.5 (0.39) 1.6 (0.42)
New York 0.084 (0.022) 1.2 (0.3)
Minnesota 1.0 (0.28) 1.1 (0.28)
Ohio 0.7 (0.18) 0.73 (0.19)
Michigan 0.57 (0.15) 0.63 (0.17)
Connecticut 0.076 (0.02) 0.6 (0.16)
Indiana 0.5 (0.13) 0.53 (0.14)
Iowa 0.4 (0.10) 0.44 (0.12)
Wisconsin 0.41 (0.11) 0.41 (0.11)
Source: [26].
B.D. Solomon et al. / Biomass and Bioenergy 31 (2007) 416–425 419
as well as most of the major ethanol consuming statesoutside of California (Tables 3 and 4). Conversely, 43percent of the industry’s 114 mills are owned by family-farm cooperatives [21].
The rapid growth in US ethanol production and use,especially since 2002, can be directly attributed toincreasing restrictions on MTBE as a fuel oxygenate(Fig. 1 and Table 3). For example, MTBE bans inCalifornia, New York, and Connecticut, states thathad accounted for a total of 42 percent of national MTBEconsumption, took effect on January 1, 2004 [9]. Inaddition, the oxygen requirement for reformulated gasolinewas repealed under the Energy Policy Act of 2005 (EPAct).Accelerated growth in ethanol production will continueat least through 2012 because of the Renewable FuelStandard approved under EPAct, to be discussedbelow [27].
3. Economics of ethanol production
Existing ethanol plants have varied in size from 1500m3
to 1.0 hm3 (400,000 to 270Mgal) year�1 of productioncapacity (ADM owns the largest plants, in Illinois andIowa) and are highly capital-intensive. About 80 percent ofproduction, including at all recent plants, occurs inanhydrous (dry grind) mills, with the rest made from wetmills [11]. The main cost components are capital and thefeedstock supply. Given the proprietary nature of muchethanol corporate cost data, it is difficult to precisely modelthe production technology. This uncertainty extends to thedegree of or lack of substitutability among factor inputs(i.e., capital, labor, energy, materials, water) and econo-mies of scale, with the latter having been found to be highlyvariable in the dry mill industry [28]. Thus rather thanmodeling grain ethanol production technology with aCobb-Douglas, Leontiff or CES format, we will posit asimpler equation [7]:
CA ¼ CC=2:75þ CK þ CL þ CE þ CM
þ CO � ðPDDGSð0:0005Þð6:5ÞÞ, ð1Þ
ARTICLE IN PRESSB.D. Solomon et al. / Biomass and Bioenergy 31 (2007) 416–425420
where CA is the cost of ethyl alcohol production ($ gal�1);CC the cost of corn ($ bushel�1); CK the cost of capitalinvestment; CL the cost of labor; CE the cost of energy; CM
the cost of raw materials; CO the other costs, includingmaintenance, overhead, water, residue disposal, insurance,taxes, regulatory compliance; and PDDGS the price ofdistiller’s dried grains with solubles (DDGS) co-product tobe sold ($ short-ton�1); and assuming 2.75 gal bushel�1
ethanol yield, i.e. 410 l t�1 for an anhydrous grain ethanolplant, with the coproduction of 0.8 kg l�1 (6.5 lb gal�1)dried distillers grains and solubles (DDGS).
An average size, dry mill ethanol plant of 0.19 hm3
(50Mgal) year�1 requires about $65–$100 million in capitalcosts, employs 30–50 people and has $45–60 million inannual operating costs [11]. The average wholesale, spotmarket price for grain ethanol in Illinois was 0.63 $ l�1
($2.40 gal�1) in August 2006 [29]. While this was 4.2 c l�1
(16.0 c gal�1) higher than the August 2006 average oilrefiner sales price of 0.59 $ l�1 ($2.24 gal�1) for gasoline inthe US [30], over 90 percent of ethanol production is soldunder much lower long-term contract prices of around0.37–0.39 $ l�1 ($1.40–1.50 gal�1) [21]. Ethanol productionin Brazil has been generally less expensive than in the USsince the 1970s given the more simplified processing ofsugarcane vs. grain, and the availability of free fuel in theform of bagasse (see e.g., [31]). The importation of cheapethanol from Brazil into the US has been restricted since1980, however, by a 14 c l�1 (54 c gal�1) tariff on imports of
Table 5
Cellulosic ethanol pilot and demonstration plants
Company Location Feedstock
Pilot plants
Iogen Ottawa, Canada Wood chi
Iogen Ottawa, Canada Wheat str
Masada/TVA Muscle Shoals, AL Wood
SunOpta Norval, Canada Various (n
Arkenol Orange, CA Various
Bioengineering Resources Fayetteville, AR Softwood
NREL/DOE Golden, CO Corn stov
Pearson Technologies Aberdeen, MS Wood resi
NEDO Izumi, Japan Wood chi
Dedini Pirassununga, Brazil Bagasse
Tsukishima Kikai Co. Ichikawa, Chiba, Japan Wood resi
Etek EtanolTeknik Ornskoldsvik, Sweden Spruce saw
PureVision Ft. Lupton, CO Corn stov
Universal Entech Phoenix, AZ Municipal
Sicco A/S Odense, Denmark Wheat str
Abengoa Bioenergy York, NE Corn stov
grain etha
Demonstration plants
Iogen Ottawa, Canada Wheat, oa
ClearFuels Technology Kauai, HI Bagasse an
Celunol Jennings, LA Bagasse, r
with grain
Etek EtanolTeknik Sweden Softwood
pine)
Source: [37].
foreign-produced ethanol. Even so, Brazil accounted foralmost 90 percent of the ethanol imported into the US in2005, most of it indirectly through Central American andCaribbean nations [21].The potential supply of lignocellulosic biomass sources
for ethanol is far greater than that of food crops, butdevelopment has been impeded by the greater recalcitranceof biomass materials to be hydrolyzed into sugars.However, recent developments by Genencor Internationaland Novozymes Biotech have resulted in up to a 30-folddrop in the cost of enzymes for hydrolysis, to 2.6–5.3 c l�1
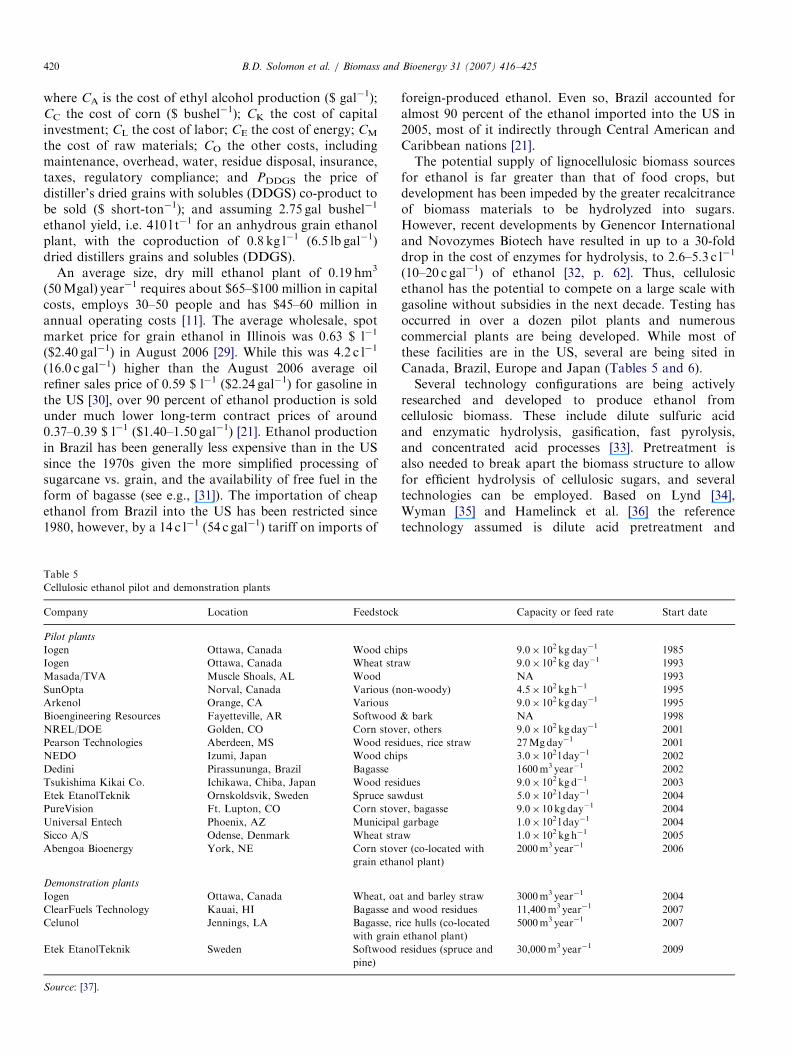
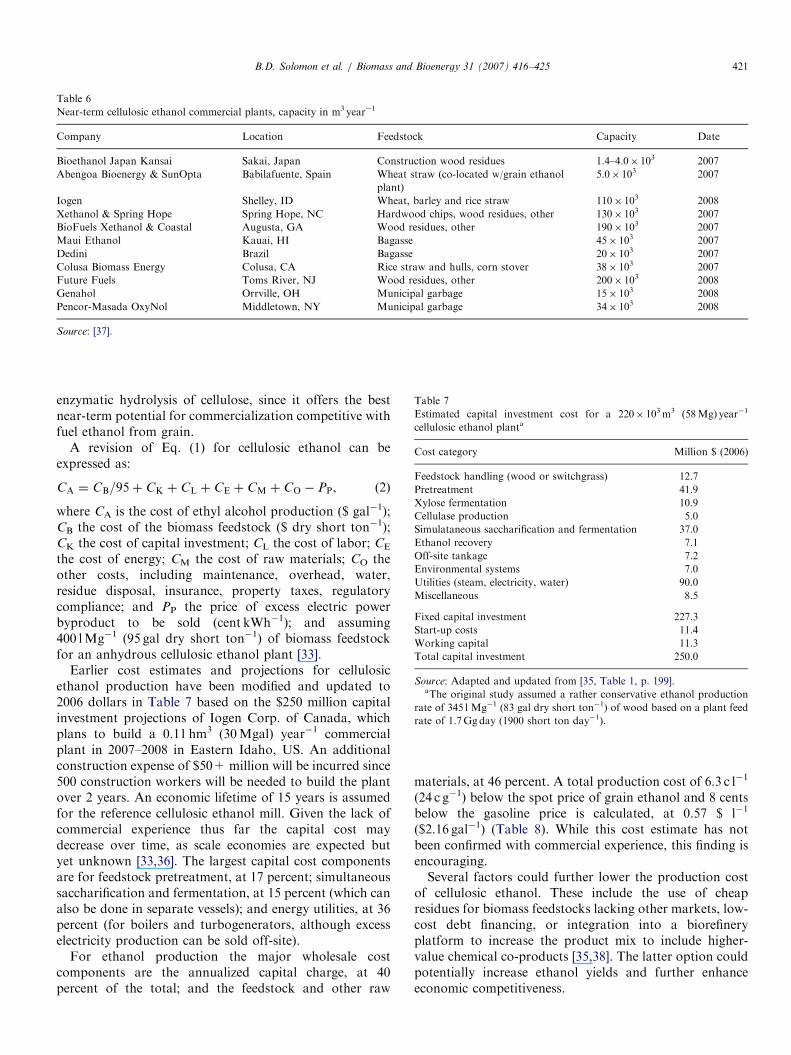
(10–20 c gal�1) of ethanol [32, p. 62]. Thus, cellulosicethanol has the potential to compete on a large scale withgasoline without subsidies in the next decade. Testing hasoccurred in over a dozen pilot plants and numerouscommercial plants are being developed. While most ofthese facilities are in the US, several are being sited inCanada, Brazil, Europe and Japan (Tables 5 and 6).Several technology configurations are being actively
researched and developed to produce ethanol fromcellulosic biomass. These include dilute sulfuric acidand enzymatic hydrolysis, gasification, fast pyrolysis,and concentrated acid processes [33]. Pretreatment isalso needed to break apart the biomass structure to allowfor efficient hydrolysis of cellulosic sugars, and severaltechnologies can be employed. Based on Lynd [34],Wyman [35] and Hamelinck et al. [36] the referencetechnology assumed is dilute acid pretreatment and
Capacity or feed rate Start date
ps 9.0� 102 kg day�1 1985
aw 9.0� 102 kg day�1 1993
NA 1993
on-woody) 4.5� 102 kg h�1 1995
9.0� 102 kg day�1 1995
& bark NA 1998
er, others 9.0� 102 kg day�1 2001
dues, rice straw 27Mgday�1 2001
ps 3.0� 102 l day�1 2002
1600m3 year�1 2002
dues 9.0� 102 kg d�1 2003
dust 5.0� 102 l day�1 2004
er, bagasse 9.0� 10 kg day�1 2004
garbage 1.0� 102 l day�1 2004
aw 1.0� 102 kg h�1 2005
er (co-located with
nol plant)
2000m3 year�1 2006
t and barley straw 3000m3 year�1 2004
d wood residues 11,400m3 year�1 2007
ice hulls (co-located
ethanol plant)
5000m3 year�1 2007
residues (spruce and 30,000m3 year�1 2009
ARTICLE IN PRESS
Table 6
Near-term cellulosic ethanol commercial plants, capacity in m3 year�1
Company Location Feedstock Capacity Date
Bioethanol Japan Kansai Sakai, Japan Construction wood residues 1.4–4.0� 103 2007
Abengoa Bioenergy & SunOpta Babilafuente, Spain Wheat straw (co-located w/grain ethanol
plant)
5.0� 103 2007
Iogen Shelley, ID Wheat, barley and rice straw 110� 103 2008
Xethanol & Spring Hope Spring Hope, NC Hardwood chips, wood residues, other 130� 103 2007
BioFuels Xethanol & Coastal Augusta, GA Wood residues, other 190� 103 2007
Maui Ethanol Kauai, HI Bagasse 45� 103 2007
Dedini Brazil Bagasse 20� 103 2007
Colusa Biomass Energy Colusa, CA Rice straw and hulls, corn stover 38� 103 2007
Future Fuels Toms River, NJ Wood residues, other 200� 103 2008
Genahol Orrville, OH Municipal garbage 15� 103 2008
Pencor-Masada OxyNol Middletown, NY Municipal garbage 34� 103 2008
Source: [37].
Table 7
Estimated capital investment cost for a 220� 103m3 (58Mg) year�1
cellulosic ethanol planta
Cost category Million $ (2006)
Feedstock handling (wood or switchgrass) 12.7
Pretreatment 41.9
Xylose fermentation 10.9
Cellulase production 5.0
Simulataneous saccharification and fermentation 37.0
Ethanol recovery 7.1
Off-site tankage 7.2
Environmental systems 7.0
Utilities (steam, electricity, water) 90.0
Miscellaneous 8.5
Fixed capital investment 227.3
Start-up costs 11.4
Working capital 11.3
Total capital investment 250.0
Source: Adapted and updated from [35, Table 1, p. 199].aThe original study assumed a rather conservative ethanol production
rate of 345 l Mg�1 (83 gal dry short ton�1) of wood based on a plant feed
rate of 1.7Ggday (1900 short ton day�1).
B.D. Solomon et al. / Biomass and Bioenergy 31 (2007) 416–425 421
enzymatic hydrolysis of cellulose, since it offers the bestnear-term potential for commercialization competitive withfuel ethanol from grain.
A revision of Eq. (1) for cellulosic ethanol can beexpressed as:
CA ¼ CB=95þ CK þ CL þ CE þ CM þ CO � PP, (2)
where CA is the cost of ethyl alcohol production ($ gal�1);CB the cost of the biomass feedstock ($ dry short ton�1);CK the cost of capital investment; CL the cost of labor; CE
the cost of energy; CM the cost of raw materials; CO theother costs, including maintenance, overhead, water,residue disposal, insurance, property taxes, regulatorycompliance; and PP the price of excess electric powerbyproduct to be sold (cent kWh�1); and assuming400 lMg�1 (95 gal dry short ton�1) of biomass feedstockfor an anhydrous cellulosic ethanol plant [33].
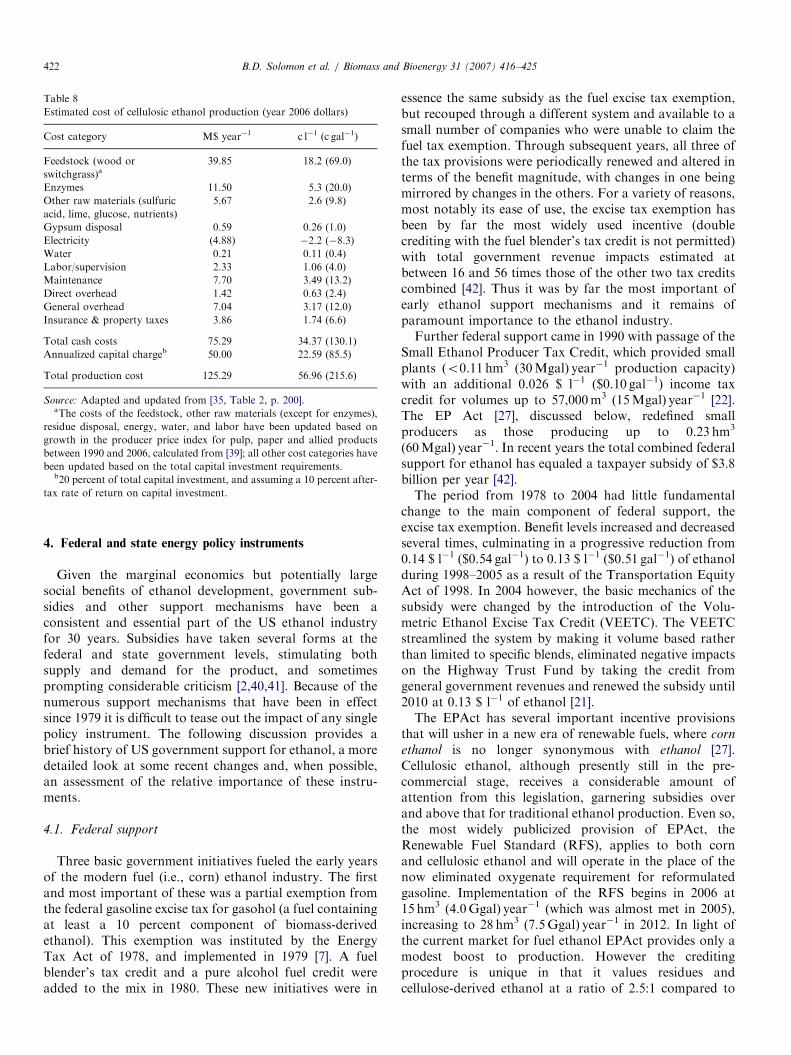
Earlier cost estimates and projections for cellulosicethanol production have been modified and updated to2006 dollars in Table 7 based on the $250 million capitalinvestment projections of Iogen Corp. of Canada, whichplans to build a 0.11 hm3 (30Mgal) year�1 commercialplant in 2007–2008 in Eastern Idaho, US. An additionalconstruction expense of $50+ million will be incurred since500 construction workers will be needed to build the plantover 2 years. An economic lifetime of 15 years is assumedfor the reference cellulosic ethanol mill. Given the lack ofcommercial experience thus far the capital cost maydecrease over time, as scale economies are expected butyet unknown [33,36]. The largest capital cost componentsare for feedstock pretreatment, at 17 percent; simultaneoussaccharification and fermentation, at 15 percent (which canalso be done in separate vessels); and energy utilities, at 36percent (for boilers and turbogenerators, although excesselectricity production can be sold off-site).
For ethanol production the major wholesale costcomponents are the annualized capital charge, at 40percent of the total; and the feedstock and other raw
materials, at 46 percent. A total production cost of 6.3 c l�1
(24 c g�1) below the spot price of grain ethanol and 8 centsbelow the gasoline price is calculated, at 0.57 $ l�1
($2.16 gal�1) (Table 8). While this cost estimate has notbeen confirmed with commercial experience, this finding isencouraging.Several factors could further lower the production cost
of cellulosic ethanol. These include the use of cheapresidues for biomass feedstocks lacking other markets, low-cost debt financing, or integration into a biorefineryplatform to increase the product mix to include higher-value chemical co-products [35,38]. The latter option couldpotentially increase ethanol yields and further enhanceeconomic competitiveness.
ARTICLE IN PRESS
Table 8
Estimated cost of cellulosic ethanol production (year 2006 dollars)
Cost category M$ year�1 c l�1 (c gal�1)
Feedstock (wood or
switchgrass)a39.85 18.2 (69.0)
Enzymes 11.50 5.3 (20.0)
Other raw materials (sulfuric
acid, lime, glucose, nutrients)
5.67 2.6 (9.8)
Gypsum disposal 0.59 0.26 (1.0)
Electricity (4.88) �2.2 (�8.3)
Water 0.21 0.11 (0.4)
Labor/supervision 2.33 1.06 (4.0)
Maintenance 7.70 3.49 (13.2)
Direct overhead 1.42 0.63 (2.4)
General overhead 7.04 3.17 (12.0)
Insurance & property taxes 3.86 1.74 (6.6)
Total cash costs 75.29 34.37 (130.1)
Annualized capital chargeb 50.00 22.59 (85.5)
Total production cost 125.29 56.96 (215.6)
Source: Adapted and updated from [35, Table 2, p. 200].aThe costs of the feedstock, other raw materials (except for enzymes),
residue disposal, energy, water, and labor have been updated based on
growth in the producer price index for pulp, paper and allied products
between 1990 and 2006, calculated from [39]; all other cost categories have
been updated based on the total capital investment requirements.b20 percent of total capital investment, and assuming a 10 percent after-
tax rate of return on capital investment.
B.D. Solomon et al. / Biomass and Bioenergy 31 (2007) 416–425422
4. Federal and state energy policy instruments
Given the marginal economics but potentially largesocial benefits of ethanol development, government sub-sidies and other support mechanisms have been aconsistent and essential part of the US ethanol industryfor 30 years. Subsidies have taken several forms at thefederal and state government levels, stimulating bothsupply and demand for the product, and sometimesprompting considerable criticism [2,40,41]. Because of thenumerous support mechanisms that have been in effectsince 1979 it is difficult to tease out the impact of any singlepolicy instrument. The following discussion provides abrief history of US government support for ethanol, a moredetailed look at some recent changes and, when possible,an assessment of the relative importance of these instru-ments.
4.1. Federal support
Three basic government initiatives fueled the early yearsof the modern fuel (i.e., corn) ethanol industry. The firstand most important of these was a partial exemption fromthe federal gasoline excise tax for gasohol (a fuel containingat least a 10 percent component of biomass-derivedethanol). This exemption was instituted by the EnergyTax Act of 1978, and implemented in 1979 [7]. A fuelblender’s tax credit and a pure alcohol fuel credit wereadded to the mix in 1980. These new initiatives were in
essence the same subsidy as the fuel excise tax exemption,but recouped through a different system and available to asmall number of companies who were unable to claim thefuel tax exemption. Through subsequent years, all three ofthe tax provisions were periodically renewed and altered interms of the benefit magnitude, with changes in one beingmirrored by changes in the others. For a variety of reasons,most notably its ease of use, the excise tax exemption hasbeen by far the most widely used incentive (doublecrediting with the fuel blender’s tax credit is not permitted)with total government revenue impacts estimated atbetween 16 and 56 times those of the other two tax creditscombined [42]. Thus it was by far the most important ofearly ethanol support mechanisms and it remains ofparamount importance to the ethanol industry.Further federal support came in 1990 with passage of the
Small Ethanol Producer Tax Credit, which provided smallplants (o0.11 hm3 (30Mgal) year�1 production capacity)with an additional 0.026 $ l�1 ($0.10 gal�1) income taxcredit for volumes up to 57,000m3 (15Mgal) year�1 [22].The EP Act [27], discussed below, redefined smallproducers as those producing up to 0.23 hm3
(60Mgal) year�1. In recent years the total combined federalsupport for ethanol has equaled a taxpayer subsidy of $3.8billion per year [42].The period from 1978 to 2004 had little fundamental
change to the main component of federal support, theexcise tax exemption. Benefit levels increased and decreasedseveral times, culminating in a progressive reduction from0.14 $ l�1 ($0.54 gal�1) to 0.13 $ l�1 ($0.51 gal�1) of ethanolduring 1998–2005 as a result of the Transportation EquityAct of 1998. In 2004 however, the basic mechanics of thesubsidy were changed by the introduction of the Volu-metric Ethanol Excise Tax Credit (VEETC). The VEETCstreamlined the system by making it volume based ratherthan limited to specific blends, eliminated negative impactson the Highway Trust Fund by taking the credit fromgeneral government revenues and renewed the subsidy until2010 at 0.13 $ l�1 of ethanol [21].The EPAct has several important incentive provisions
that will usher in a new era of renewable fuels, where corn
ethanol is no longer synonymous with ethanol [27].Cellulosic ethanol, although presently still in the pre-commercial stage, receives a considerable amount ofattention from this legislation, garnering subsidies overand above that for traditional ethanol production. Even so,the most widely publicized provision of EPAct, theRenewable Fuel Standard (RFS), applies to both cornand cellulosic ethanol and will operate in the place of thenow eliminated oxygenate requirement for reformulatedgasoline. Implementation of the RFS begins in 2006 at15 hm3 (4.0Ggal) year�1 (which was almost met in 2005),increasing to 28 hm3 (7.5Ggal) year�1 in 2012. In light ofthe current market for fuel ethanol EPAct provides only amodest boost to production. However the creditingprocedure is unique in that it values residues andcellulose-derived ethanol at a ratio of 2.5:1 compared to
ARTICLE IN PRESSB.D. Solomon et al. / Biomass and Bioenergy 31 (2007) 416–425 423
corn ethanol, and requires a minimum of 0.95 hm3
(250Mgal) of the total be derived from cellulosic sourcesin 2013. Furthermore, the EPAct sets an annual productiongoal of 3.8 hm3 of cellulosic ethanol by 2015, to be broughtabout in part by an additional production incentive (as yetundefined) separate from the VEETC [27].
Additional provisions are designed to improve commer-cialization prospects for the new technology throughincreased R&D funding in all aspects of the industry,including feedstock development, processing technology,co-product production, and systems optimization [43].Project financing and funding, considered by many to bea major bottleneck [34,36,44], receives attention as wellthrough a series of grants and loan guarantees forbiorefinery development and commercialization [27]. Theoverall effect of the legislation is manifold, providing anessential short-term boost to accelerate commercializationand technological development, while also attempting tocement a place for the new technology in the longer-termethanol market. Implicit in this is the assumption thatcellulosic ethanol is capable of providing larger societalbenefits than corn ethanol, although in the near future,corn ethanol will still dominate the market.
4.2. State support
During the revival of the US ethanol industry in the late1970s over a dozen state governments were quick toapprove partial or total gasohol exemptions from stateroad use taxes. These included producer states in theMidwest such as Iowa, but also southern states such asLouisiana, Arkansas and Oklahoma (Louisiana repealedits tax exemption in 1989). These state programs aregenerally similar to the federal programs, and as of 2004thirty-six states were supporting ethanol development [22].By 2005, nine states had some level of excise tax exemption(including Minnesota, which only offers the exemption for85 percent fuel blends) [44]. Producer credits were offeredin eleven additional states: a $2 million payment per plantis offered in Montana if state grains are used; and several
Table 9
Summary of current federal and state ethanol policy support mechanisms
Support mechanism Description of subsidy
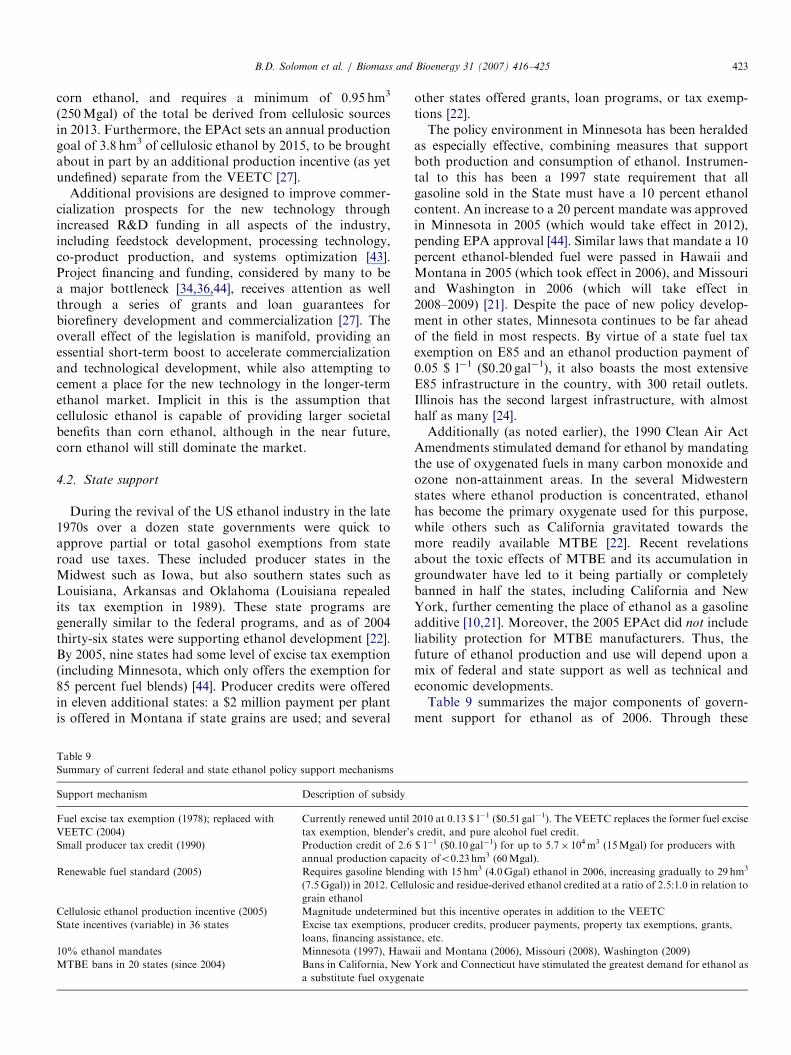
Fuel excise tax exemption (1978); replaced with
VEETC (2004)
Currently renewed until
tax exemption, blender’s
Small producer tax credit (1990) Production credit of 2.6
annual production capa
Renewable fuel standard (2005) Requires gasoline blendi
(7.5Ggal)) in 2012. Cellu
grain ethanol
Cellulosic ethanol production incentive (2005) Magnitude undetermine
State incentives (variable) in 36 states Excise tax exemptions, p
loans, financing assistan
10% ethanol mandates Minnesota (1997), Hawa
MTBE bans in 20 states (since 2004) Bans in California, New
a substitute fuel oxygena
other states offered grants, loan programs, or tax exemp-tions [22].The policy environment in Minnesota has been heralded
as especially effective, combining measures that supportboth production and consumption of ethanol. Instrumen-tal to this has been a 1997 state requirement that allgasoline sold in the State must have a 10 percent ethanolcontent. An increase to a 20 percent mandate was approvedin Minnesota in 2005 (which would take effect in 2012),pending EPA approval [44]. Similar laws that mandate a 10percent ethanol-blended fuel were passed in Hawaii andMontana in 2005 (which took effect in 2006), and Missouriand Washington in 2006 (which will take effect in2008–2009) [21]. Despite the pace of new policy develop-ment in other states, Minnesota continues to be far aheadof the field in most respects. By virtue of a state fuel taxexemption on E85 and an ethanol production payment of0.05 $ l�1 ($0.20 gal�1), it also boasts the most extensiveE85 infrastructure in the country, with 300 retail outlets.Illinois has the second largest infrastructure, with almosthalf as many [24].Additionally (as noted earlier), the 1990 Clean Air Act
Amendments stimulated demand for ethanol by mandatingthe use of oxygenated fuels in many carbon monoxide andozone non-attainment areas. In the several Midwesternstates where ethanol production is concentrated, ethanolhas become the primary oxygenate used for this purpose,while others such as California gravitated towards themore readily available MTBE [22]. Recent revelationsabout the toxic effects of MTBE and its accumulation ingroundwater have led to it being partially or completelybanned in half the states, including California and NewYork, further cementing the place of ethanol as a gasolineadditive [10,21]. Moreover, the 2005 EPAct did not includeliability protection for MTBE manufacturers. Thus, thefuture of ethanol production and use will depend upon amix of federal and state support as well as technical andeconomic developments.Table 9 summarizes the major components of govern-
ment support for ethanol as of 2006. Through these
2010 at 0.13 $ l�1 ($0.51 gal�1). The VEETC replaces the former fuel excise
credit, and pure alcohol fuel credit.
$ l�1 ($0.10 gal�1) for up to 5.7� 104m3 (15Mgal) for producers with
city ofo0.23 hm3 (60Mgal).
ng with 15 hm3 (4.0Ggal) ethanol in 2006, increasing gradually to 29 hm3
losic and residue-derived ethanol credited at a ratio of 2.5:1.0 in relation to
d but this incentive operates in addition to the VEETC
roducer credits, producer payments, property tax exemptions, grants,
ce, etc.
ii and Montana (2006), Missouri (2008), Washington (2009)
York and Connecticut have stimulated the greatest demand for ethanol as
te
ARTICLE IN PRESSB.D. Solomon et al. / Biomass and Bioenergy 31 (2007) 416–425424
programs ethanol producers receive an indirect subsidy of0.13 $ l�1 ($0.51 gal�1) on all ethanol production; a 0.03 $l�1 ($0.10 gal�1) subsidy on a portion of their production ifthey meet the small producer’s criteria; an additional as yetunspecified production incentive if they use residues orcellulosic feedstocks; and they may be eligible for stateincentives depending on their location. The effect of theRFS is difficult to monetize, but by stimulating ethanoldemand, it provides an additional subsidy in the form ofincreased ethanol sale prices. Again, cellulosic ethanolproducers will benefit more than corn ethanol producers byvirtue of its higher crediting ratio under the RFS.
5. Conclusions
Ethanol production has a long history. During this time,production has had many peaks and valleys, although it iscurrently at the highest ever production levels. Each timeproduction rose or fell it responded to complex combina-tions of changes in demand for competing products,incentive programs, and government mandated productionlevels. Current production is highest in Brazil and the US.Brazil’s experience illustrates that it is possible to success-fully mandate large-scale shifts to ethanol use. MTBE bansin half the US states, including the major markets ofCalifornia, New York and Connecticut, are contributingsignificantly to record demand for ethanol (Table 4 andFig. 1).
The fuel is also experiencing unprecedented levels ofattention due to its value as an alternative to gasoline, withits problematic links to climate change, peak oil supply,rising oil prices, and Middle Eastern political instability.Cellulosic ethanol production, in particular, can result in afuel with a net energy yield that is close to CO2 neutral [45].This makes it increasingly desirable as a gasoline alter-native. We therefore expect demand for ethanol tosubstantially grow in future years, but do not expect cornalone to meet this demand.
Corn remains the largest source of US ethanol produc-tion, however this is likely to change as demand for thisfeedstock is expected to exceed supply and technologicalimprovements in processing converge to lower the cost ofcellulosic ethanol production [46]. In some ways, thegrowth in grain ethanol production has laid the ground-work for a shift into cellulosic ethanol production. Forinstance, the political power of US farm interests has builtsupport for ongoing state and federal subsidies of grainethanol. These supports are currently in place for allfeedstocks, and there will be additional federal support foremergent cellulosic ethanol production.
Our analysis estimates that cellulosic ethanol productioncosts could be 6.3 c l�1 (24 c gal�1) lower than gasoline.Thus while cellulosic ethanol production is not yetcommercial (due to higher capital costs and immaturetechnology) its potential price would be competitive today.The technology may thus become especially attractive inthe coastal states that produce only small corn or other
grain crops. Moreover, cellulosic ethanol may experiencefurther cost decreases due to the use of inexpensive farmand forestry residue feedstocks. Even so, it is important toemphasize that price supports remain critical. Subsidiesthat recognize the social value of grain and cellulosicethanol as alternatives to gasoline and as a domesticproduct will be essential to market success, along with theneed to substitute for MTBE. Additional policy solutionsaimed at discouraging reliance on gasoline might similarlyincrease the competitiveness of both corn and cellulosicethanol.
Acknowledgments
This research was supported by the BiocomplexityProgram of the National Science Foundation under Grant#BE/MUSES-0524872.
References
[1] Energy Information Administration. Annual energy review 2005,
DOE/EIA-0384. US Department of Energy, Washington, DC, 2006.
[2] Pimental D, Patzek TW. Ethanol production using corn, switchgrass
and wood. Natural Resources Research 2005;14(1):65–76.
[3] Berndes G, Azar C, Kaberger T, Abrahamson D. The feasibility of
large-scale lignocellulose-based bioenergy production. Biomass and
Bioenergy 2001; 20(5): 371–83.
[4] Farrell AE, Plevin RJ, Turner BT, Jones AD, O’Hare M, Kammen
DM. Ethanol can contribute to energy and environmental goals.
Science 2006;311(5760):506–8.
[5] Ogden JM, Williams RH, Larson ED. Societal lifecycle costs of cars
with alternative fuels/engines. Energy Policy 2004;32(1):7–27.
[6] Solomon BD, Banerjee A. A global survey of hydrogen energy
research, development and policy. Energy Policy 2006;34(7):781–92.
[7] Solomon BD. Gasohol, economics, and passenger transportation
policy. Transportation Journal 1980;20(1):57–64.
[8] Bayh E. Bayh joins Indy Racing League to promote greater ethanol
use. Press release from US Senator Evan Bayh, Washington, DC, 3
March 2005.
[9] Energy Information Administration. Status and impact of state
MTBE ban, 2003. Available at: /http://www.eia.doe.gov/oiaf/
servicerpt/mtbeban/S.
[10] Renewable Fuels Association. New Jersey becomes 25th state to ban
MTBE. Press release, Renewable Fuels Association, Washington,
DC, 19 August 2005.
[11] Urbanchuk JM. Contribution of the ethanol industry to the economy
of the United States. Prepared for the Renewable Fuels Association,
Washington, DC, 2006.
[12] Giampietro M, Ulgiati S, Pimental D. Feasibility of large-scale
biofuel production. BioScience 1997;47(9):587–600.
[13] Solomon BD. Agricultural energy: debunking the net energy loss
myth. The Environmental Professional 1980;2(3/4):292–5.
[14] Hammerschlag R. Ethanol’s return on investment: a survey of the
literature 1990–present. Environmental Science and Technology
2006;40(6):1744–50.
[15] De Oliveira MED, Vaughan BE, Rykiel EJ. Ethanol as fuels: energy,
carbon dioxide balances, and ecological footprint. BioScience
2005;55(7):593–602.
[16] US Department of Agriculture, Economic Research Service. USDA
feed grains baseline, 2005-14. USDA, Washington, DC, May 3, 2005.
[17] Hunt DV. The gasohol handbook. New York, NY: Industrial Press;
1981 580pp.
[18] Kovarik B. Henry Ford, Charles Kettering and the ‘‘fuel of the
future’’. Automotive History Review 1998;32:7–27.
ARTICLE IN PRESSB.D. Solomon et al. / Biomass and Bioenergy 31 (2007) 416–425 425
[19] Knight P. Sugar and ethanol in Brazil and South America.
International Sugar Journal 2006;108(1293):472.
[20] FO Licht’s. FO Licht’s world ethanol & biofuels report, vol. 4,
January 2006.
[21] Renewable Fuels Association, 25 February 2007. Web-site. /http://
www.ethanolrfa.org/S.
[22] California Energy Commission. Ethanol fuel incentives applied in the
US, reviewed from California’s perspective. CEC staff report P600-
04-001, Sacramento, California, January 2004.
[23] Duffield JA, Collins K. Evolution of renewable energy policy.
Choices 2006;21(1):9–14.
[24] National Ethanol Vehicle Coalition. Press release, E-85 stations
exceed 1000. Available at: /http://www.e85fuel.com/news/
100606_1000_station_release.htmS (January 28, 2007).
[25] Warren WD, Ryan S. Temporal patterns of ethanol use in the United
States: 1981–1998. Transportation Quarterly 2001;55(4):25–39.
[26] Federal Highway Administration. Highway statistics 2004, Table
MF-33E, estimated use of gasohol—2004. US Department of
Transportation, Washington, DC, 2006; /http://www.fhwa.dot.gov/
policy/ohim/hs04/htm/mf33e.htmS (28 January 2007).
[27] US House of Representatives, Committee Print of the Energy Policy
Act of 2005. /http://energycommerce.house.gov/108/ener-
gy_pdfs_2.htmS (20 October 2006).
[28] Gallagher PW, Brubaker H, Shapouri H. Plant size: capital cost
relationships in the dry mill ethanol industry. Biomass and Bioenergy
2005;28(6):565–71.
[29] Ethanol & Biodiesel News. Houston, TX, USA: Hart Energy
Publishing, October 23, 2006.
[30] Energy Information Administration. Wholesale price of motor
gasoline. /http://tonto.eia.doe.gov/steo_query/app/priceresult.aspS(31 October 2006).
[31] Moreira JR. Sugarcane for energy—recent results and progress in
Brazil. Energy for Sustainable Development 2000;4(3):43–54.
[32] Greer D. Creating cellulosic ethanol: spinning straw into fuel.
BioCycle 2005;46(4):61–5.
[33] So KS, Brown RC. Economic analysis of selected lignocellulosic-to-
ethanol conversion technologies. Applied Biochemistry and Biotech-
nology 1999;79(1–3):633–40.
[34] Lynd LR. Overview and evaluation of fuel ethanol from cellulosic
biomass: technology, economics, the environment, and policy.
Annual Review of Energy and the Environment 1996;21:403–65.
[35] Wyman CE. Biomass ethanol: technical progress, opportunities, and
commercial challenges. Annual Review of Energy and the Environ-
ment 1999;24:189–226.
[36] Hamelinck CN, van Hooijdonk G, Faaij APC. Ethanol from
lignocellulosic biomass: techno-economic performance in short-,
middle- and long-term. Biomass and Bioenergy 2005;28(4):384–410.
[37] Ethanol Producer Magazine. Grand Forks, ND, USA: Bryan &
Bryan International, various issues. 1996–2006.
[38] Ragauskas AJ, Williams CK, Davison BH, Britovsek G, Cairney J,
Eckert CA, et al. The path forward for biofuels and biomaterials.
Science 2006;311(5760):484–9.
[39] Bureau of Labor Statistics, US Department of Labor. Producer price
indexes. /http://www.bls.gov/ppiS (24 April 2006).
[40] Libecap GD. Who really benefits from ethanol? Consumers’
Research Magazine 2003;86(8):20–1.
[41] Taylor J, Becker D. A complete waste of energy. Los Angeles Times,
October 29, 2003.
[42] US General Accounting Office. Resources, Community, and Eco-
nomic Development Division. RCED-00-301R, petroleum and
ethanol fuels: tax incentives and related GAO work. GAO,
Washington, DC, September 2000.
[43] Wyman CE. Potential synergies and challenges in refining cellulosic
biomass to fuels, chemicals, and power. Biotechnology Progress
2003;19(2):254–62.
[44] National Conference of State Legislators (NCSL). Ethanol produc-
tion incentives, 2005. Available at: /http://www.ncsl.org/programs/
energy/ethinc.htmS.
[45] Worldwatch Institute. Biofuels for transportation. Prepared for the
German Federal Ministry of Food, Agriculture and Consumer
Protection, Washington, DC, June 2006.
[46] Perlack RD, Wright LL, Turhollow AF, Graham RL, Stokes BJ,
Erbach DC. Biomass as feedstock for a bioenergy and bioproducts
industry. DOE/GO-102005-2135/ORNL/TM-2005/66. Prepared by
Oak Ridge National Laboratory for the US Department of Energy
and US Department of Agriculture, Washington, DC, April 2005.
Copyright © 2022 FDOKUMEN