GPR investigations on active faults in urban areas: the Georisc-NZ project in Wellington, New...
8
C. R. Acad. Sci. Paris, Sciences de la Terre et des planètes / Earth and Planetary Sciences 333 (2001) 447–454 2001 Académie des sciences / Éditions scientifiques et médicales Elsevier SAS. Tous droits réservés S1251-8050(01)01663-9/FLA Tectonics / Tectonique GPR investigations on active faults in urban areas: the Georisc-NZ project in Wellington, New Zealand Jean-Christophe Audru a,∗ , Maksim Bano b , John Begg c , Kelvin Berryman c , Stuart Henrys c , Bertrand Nivière a a Bureau de recherches géologiques et minières, BP 6009, 45060 Orléans cedex 2, France b Institut de physique du Globe de Strasbourg, 5 rue Descartes, 67084 Strasbourg cedex, France c Institute of Geological and Nuclear Sciences, 69 Gracefield Road, PO Box 31-312, Lower Hutt, New Zealand Received 12 June 2001; accepted 21 August 2001 Communicated by Paul Tapponnier Abstract – This paper presents preliminary results for three GPR profiles acquired across the Wellington active strike-slip fault within the Wellington urban area. In this sector, itis suggested that the subsurface geometry (8–10 m) of the fault comprises two main deforming strands that bound narrow transpressive and transtensive sections. The location of fault planes interpreted from radargrams closely corresponds with the inferred location of the main fault at the ground surface. Despite noise due to the urban settings, GPR proved to be a technique capable of locating fault strands, thus potentially providing useful data in targeting areas for palaeoseismic studies, such as trenching. 2001 Académie des sciences / Éditions scientifiques et médicales Elsevier SAS georadar / GPR / active faults / urban areas / seismic hazard / New Zealand / Wellington Résumé – Reconnaissance des failles actives en site urbain par imagerie géoradar : le projet Georisc-NZ à Wellington, Nouvelle-Zélande. Nous présentons trois profils géoradar, qui recoupent le décrochement actif de Wellington dans le centre-ville de Wellington (Nouvelle- Zélande). L’imagerie géoradar montre qu’en sub-surface (8–10 m), ce décrochement se divise en deux branches principales, formant une structure en fleur. Cette structure détermine une alternance de secteurs transpressifs et transtensifs, étroits de quelques dizaines de mètres. Malgré un signal bruité par le mobilier urbain, la faille principale imagée par le géoradar est proche de sa position supposée en surface. La technique du géoradar s’avère donc particulièrement utile pour guider la suite des études conventionnelles de paléosismicité (tranchées) en site urbain. 2001 Académie des sciences / Éditions scientifiques et médicales Elsevier SAS géoradar / GPR / failles actives / site urbain / aléa sismique / Nouvelle-Zélande / Wellington Version abrégée 1. Introduction et cadre géologique Nous avons appliqué la technique du géoradar (ou Ground penetrating radar, GPR) à la recherche de failles actives en site urbain (risque sismique fort), afin de guider ∗ Correspondence and reprints. E-mail address: [email protected] (J.-C. Audru). des études conventionnelles de paléosismicité (tranchées par exemple). Cette opération a été réalisée dans le cadre du projet de coopération Georisc-NZ entre la France et la Nouvelle-Zélande en 1998 ; nous présentons ici trois profils acquis sur la faille de Wellington, dans Wellington. La faille de Wellington est un décrochement dextre seg- menté, reconnu sur environ 150 km dans l’île nord de 447
-
Upload
independent -
Category
Documents
-
view
3 -
download
0
Transcript of GPR investigations on active faults in urban areas: the Georisc-NZ project in Wellington, New...
C. R. Acad. Sci. Paris, Sciences de la Terre et des planètes / Earth and Planetary Sciences 333 (2001) 447–454 2001 Académie des sciences / Éditions scientifiques et médicales Elsevier SAS. Tous droits réservésS1251-8050(01)01663-9/FLA
Tectonics / Tectonique
GPR investigations on active faults in urban areas: theGeorisc-NZ project in Wellington, New Zealand
Jean-Christophe Audrua,∗, Maksim Banob, John Beggc, Kelvin Berrymanc,Stuart Henrysc, Bertrand Nivièrea
a Bureau de recherches géologiques et minières, BP 6009, 45060 Orléans cedex 2, Franceb Institut de physique du Globe de Strasbourg, 5 rue Descartes, 67084 Strasbourg cedex, Francec Institute of Geological and Nuclear Sciences, 69 Gracefield Road, PO Box 31-312, Lower Hutt, New Zealand
Received 12 June 2001; accepted 21 August 2001
Communicated by Paul Tapponnier
Abstract – This paper presents preliminary results for three GPR profiles acquired acrossthe Wellington active strike-slip fault within the Wellington urban area. In this sector, it issuggested that the subsurface geometry (8–10 m) of the fault comprises two main deformingstrands that bound narrow transpressive and transtensive sections. The location of faultplanes interpreted from radargrams closely corresponds with the inferred location of themain fault at the ground surface. Despite noise due to the urban settings, GPR proved tobe a technique capable of locating fault strands, thus potentially providing useful data intargeting areas for palaeoseismic studies, such as trenching. 2001 Académie des sciences /Éditions scientifiques et médicales Elsevier SAS
georadar / GPR / active faults / urban areas / seismic hazard / New Zealand / Wellington
Résumé – Reconnaissance des failles actives en site urbain par imagerie géoradar : leprojet Georisc-NZ à Wellington, Nouvelle-Zélande. Nous présentons trois profils géoradar, quirecoupent le décrochement actif de Wellington dans le centre-ville de Wellington (Nouvelle-Zélande). L’imagerie géoradar montre qu’en sub-surface (8–10 m), ce décrochement se divise endeux branches principales, formant une structure en fleur. Cette structure détermine une alternancede secteurs transpressifs et transtensifs, étroits de quelques dizaines de mètres. Malgré un signalbruité par le mobilier urbain, la faille principale imagée par le géoradar est proche de sa positionsupposée en surface. La technique du géoradar s’avère donc particulièrement utile pour guider lasuite des études conventionnelles de paléosismicité (tranchées) en site urbain. 2001 Académie dessciences / Éditions scientifiques et médicales Elsevier SAS
géoradar / GPR / failles actives / site urbain / aléa sismique / Nouvelle-Zélande / Wellington
Version abrégée
1. Introduction et cadre géologique
Nous avons appliqué la technique du géoradar (ouGround penetrating radar, GPR) à la recherche de faillesactives en site urbain (risque sismique fort), afin de guider
∗ Correspondence and reprints.E-mail address: [email protected] (J.-C. Audru).
des études conventionnelles de paléosismicité (tranchéespar exemple). Cette opération a été réalisée dans le cadredu projet de coopération Georisc-NZ entre la France et laNouvelle-Zélande en 1998 ; nous présentons ici trois profilsacquis sur la faille de Wellington, dans Wellington.
La faille de Wellington est un décrochement dextre seg-menté, reconnu sur environ 150 km dans l’île nord de
447
J.-C. Audru et al. / C. R. Acad. Sci. Paris, Sciences de la Terre et des planètes / Earth and Planetary Sciences 333 (2001) 447–454
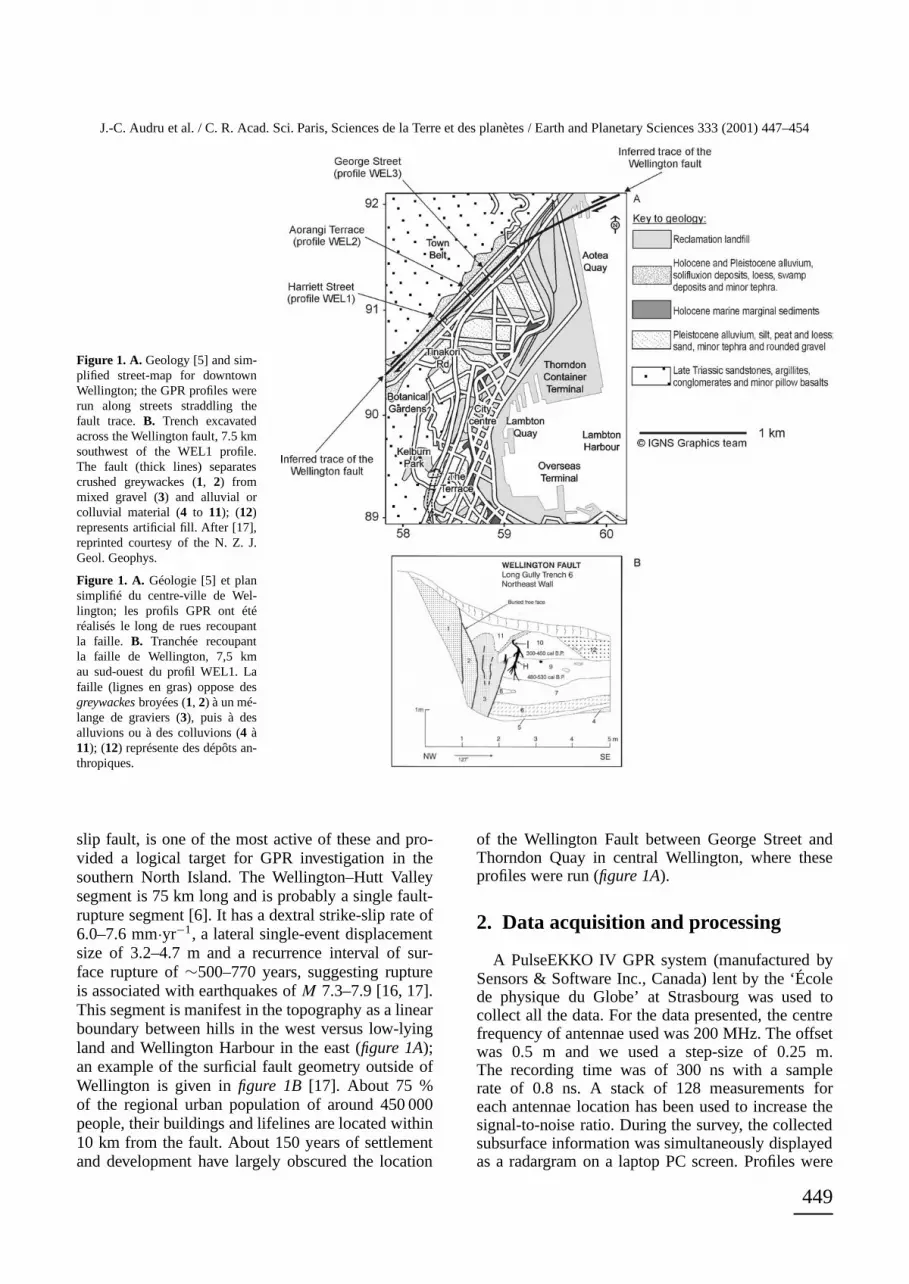
Nouvelle-Zélande. Le segment sud de cette faille traversela capitale, Wellington (figure 1A), où la population ur-baine est d’environ 450 000 personnes. Ce segment, quirésulte d’une seule rupture de surface [6], mesure 75 kmde longueur, a un taux de décrochement dextre moyen de6,0–7,6 mm·an−1, une valeur de déplacement latéral cosis-mique de 3,2–4,7 m et un intervalle de récurrence de rup-ture de surface de 500–770 ans pour des séismes de ma-gnitudeM 7,3–7,9 [16, 17]. À l’extérieur de la ville, latrace de la faille est calée par des tranchées (exemple surla figure 1B) [6, 17]. En centre-ville, la zone de faille estsoulignée par un escarpement 5 à 10 m de hauteur, maiscet escarpement a été fortement anthropisé (remodelageset remblaiements successifs depuis 150 ans). Comme destranchées ne peuvent y être faites aisément, la zone de pas-sage de la faille par rapport à l’escarpement actuel n’estpas connue avec précision. L’acquisition des profils a étéeffectuée grâce à un système GPR de type PulseEKKOIV (fabriqué par Sensors & Software Inc., Canada) prêtépar l’École de physique du Globe de Strasbourg. Les pa-ramètres d’acquisition et de traitement figurent au completdans la version anglaise de la note. Sous l’asphalte et le re-vêtement drainant des rues et des trottoirs, la coupe géolo-gique théorique est la suivante [5] : des remblais de sable etgraviers, des colluvions quaternaires dérivées de grès et delœss, des formations de marais plus ou moins solifluées et,enfin, la roche formée de grès et degrauwackes triasiques,fracturés ou broyés. Les épaisseurs ne sont pas connues.
2. Interprétation des données et discussion
Les câbles et tubes souterrains inhérents au milieu ur-bain sont repérés par des apex d’hyperboles de diffraction,individualisés au sommet des profils. Dans l’axe du pro-fil, les unités lithologiques sont imagées comme des do-maines de réflexion identiques : les réflecteurs sont homo-gènes et continus, à l’image des stratifications sédimen-taires à cette échelle d’observation. Les variations de dis-persion avec la profondeur sont attribuées au caractère in-
cohérent (remblais, colluvions) ou cohérent (grès) des ma-tériaux. Ainsi, les réflecteurs obliques observés dans la par-tie supérieure des profils illustrent les interfaces entre cesmilieux différents (remblais sur les colluvions puis les grèspar exemple). Les failles sont déduites de trois types designatures : elles déforment des réflecteurs continus (fi-gure 4) ou bien les tronquent (figure 3) ; elles limitent desdomaines de forts contrastes de réflectivité (figure 2) ouencore génèrent de nombreuses diffractions (figure 3). Cesdiffractions spécifiques sont liées aux argiles et fragments[3, 11] des gouges de faille. Sur deux profils (figures 2et 3), les surfaces de failles sont sub-verticales et semblentconverger en profondeur ; elles amorcent une structure enfleur, analogue à celle qui est observée sur le troisième pro-fil (figure 4).
Notre interprétation de ces trois profils montre que, versla surface libre, le segment sud de la faille de Wellington sedivise en deux branches principales, organisées en structurede fleur. La structure transtensive (petit fossé de 27 mde largeur) du profil central est relayée par une structuretranspressive (bourrelet compressif ?) au sud-ouest et aunord-est. Ce type de dispositif s’observe également surdes tranchées sériées (exemple sur lafigure 1B) [6, 16,17] ainsi que sur d’autres profils GPR réalisés dans leNord-Est de Wellington [2]. L’analyse des profils WEL1et WEL2 montre aussi qu’il existe un décalage entrela zone de faille principale imagée par le GPR et sonemplacement déduit à la surface ; seul le profil WEL3image la faille à sa position supposée en surface. Enfin,dans la mesure où les formations superficielles ne sontpas strictement datées, on ne peut pas quantifier l’activitédes failles d’après les seuls profils GPR («activité » ausens néotectonique, c’est-à-dire depuis 125 000 ans enNouvelle-Zélande). On comprend ici les limites du GPRpour cet usage ; c’est cependant un outil primordial, enparticulier en contexte urbain, pour cibler des zones oùles méthodes destructives (tranchées) ne peuvent pas êtremises en œuvre aisément.
1. Introduction
Georadar or Ground Penetrating Radar (GPR) is anon-destructive geophysical method that produces across-sectional image of the shallow subsurface pro-file (from 0 to 50 m depth); the resulting image (calledradargram) is very similar in style to seismic pro-files. GPR acquisition is based on the propagation,reflection and scattering of high frequency (from 10to 1 000 MHz) electromagnetic waves in the soil [9,10]. The penetration depth varies from 0 to 50 m, de-pending on the frequency and on the medium atten-uation. The equipment required is compact and eas-ily transportable. Surveys are widely used for hydro-logical, geotechnical, environmental and forensic pur-poses; geological applications include the imaging of
near-surface sedimentary structures [1, 4, 7, 13] usefulin imaging active tectonic structures [8, 12, 15, 19].Our survey applies these GPR techniques in urban set-tings. Georisc-NZ was a joint French–New Zealandproject investigating the value of GPR imagery in lo-cating active faults in central New Zealand towns.A set of 75 profiles was collected in March 1998 inseveral towns, testing GPR in a variety of soil condi-tions and tectonic environments.
Beneath the North Island of New Zealand, theoceanic crust of the Pacific plate is obliquely sub-ducting beneath the continental crust of the Australianplate. At the latitude of Wellington, the relative platemotion is about 40 mm·yr−1 [18]. Onshore, activefaults develop in the upper plate, many more than100 km long. The Wellington Fault, a dextral strike-
448
J.-C. Audru et al. / C. R. Acad. Sci. Paris, Sciences de la Terre et des planètes / Earth and Planetary Sciences 333 (2001) 447–454
Figure 1. A. Geology [5] and sim-plified street-map for downtownWellington; the GPR profiles wererun along streets straddling thefault trace. B. Trench excavatedacross the Wellington fault, 7.5 kmsouthwest of the WEL1 profile.The fault (thick lines) separatescrushed greywackes (1, 2) frommixed gravel (3) and alluvial orcolluvial material (4 to 11); (12)represents artificial fill. After [17],reprinted courtesy of the N. Z. J.Geol. Geophys.
Figure 1. A. Géologie [5] et plansimplifié du centre-ville de Wel-lington; les profils GPR ont étéréalisés le long de rues recoupantla faille. B. Tranchée recoupantla faille de Wellington, 7,5 kmau sud-ouest du profil WEL1. Lafaille (lignes en gras) oppose desgreywackes broyées (1, 2) à un mé-lange de graviers (3), puis à desalluvions ou à des colluvions (4 à11); (12) représente des dépôts an-thropiques.
slip fault, is one of the most active of these and pro-vided a logical target for GPR investigation in thesouthern North Island. The Wellington–Hutt Valleysegment is 75 km long and is probably a single fault-rupture segment [6]. It has a dextral strike-slip rate of6.0–7.6 mm·yr−1, a lateral single-event displacementsize of 3.2–4.7 m and a recurrence interval of sur-face rupture of∼500–770 years, suggesting ruptureis associated with earthquakes ofM 7.3–7.9 [16, 17].This segment is manifest in the topography as a linearboundary between hills in the west versus low-lyingland and Wellington Harbour in the east (figure 1A);an example of the surficial fault geometry outside ofWellington is given infigure 1B [17]. About 75 %of the regional urban population of around 450 000people, their buildings and lifelines are located within10 km from the fault. About 150 years of settlementand development have largely obscured the location
of the Wellington Fault between George Street andThorndon Quay in central Wellington, where theseprofiles were run (figure 1A).
2. Data acquisition and processing
A PulseEKKO IV GPR system (manufactured bySensors & Software Inc., Canada) lent by the ‘Écolede physique du Globe’ at Strasbourg was used tocollect all the data. For the data presented, the centrefrequency of antennae used was 200 MHz. The offsetwas 0.5 m and we used a step-size of 0.25 m.The recording time was of 300 ns with a samplerate of 0.8 ns. A stack of 128 measurements foreach antennae location has been used to increase thesignal-to-noise ratio. During the survey, the collectedsubsurface information was simultaneously displayedas a radargram on a laptop PC screen. Profiles were
449
J.-C. Audru et al. / C. R. Acad. Sci. Paris, Sciences de la Terre et des planètes / Earth and Planetary Sciences 333 (2001) 447–454
run along streets perpendicular to the inferred faultstrike and were located to minimise the impact ofsurface and subsurface infrastructural elements (e.g.,power poles, sewer and water mains) and traffic.These utilities are identifiable on the raw GPR dataas continuous flat reflections or ‘ringing’, inherent inthe hardware (unshielded antennae) [3, 14]. Antennaewere placed in direct contact with the street paving(commonly asphalt). Each profile was levelled usinga Leica–Wild theodolite.
Radargram processing was performed using IPGin-house interactive PC-based radar software. The se-quence of the processing used was as follows: time-zero correction, running average filter in order to re-move the DC component, filtering of the ‘ringing’by running an average filter, adaptive gain functionbased on the envelopes of the traces, band-pass filter-ing, topographic corrections (using the levelling pro-files) and finally plotting. For the Wellington profiles,the conversion of time axis (two-way time in ns) intodepth axis is performed using a constant propagationvelocity of 0.12 m·ns−1, which is estimated from themodelling of subsurface scattering diffractions pre-sented on the raw data; these velocities are typical forthe basement rocks underlying the soils. The lengthof the profiles varied from 60 to 80 m and the pene-tration depth varied from 8 to 10 m, depending on thepermittivity and conductivity of the soils and rocks.Beneath the street paving, soil includes artificial sandand gravel fill over little consolidated Quaternary sed-iments (loess or sandstones colluvium) and shearedor crushed greywacke sandstones [5]. Thicknesses areunknown.
3. Data interpretation
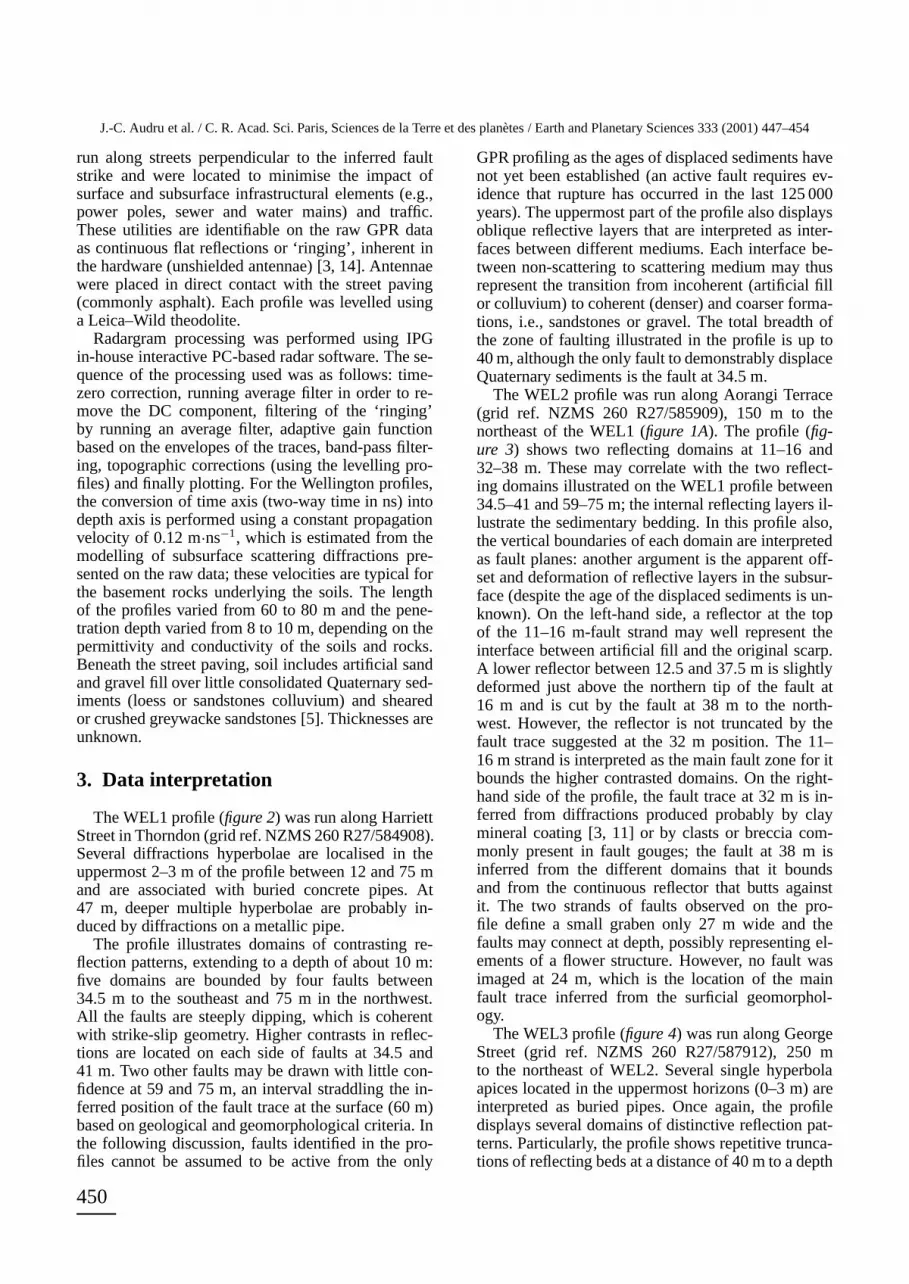
The WEL1 profile (figure 2) was run along HarriettStreet in Thorndon (grid ref. NZMS 260 R27/584908).Several diffractions hyperbolae are localised in theuppermost 2–3 m of the profile between 12 and 75 mand are associated with buried concrete pipes. At47 m, deeper multiple hyperbolae are probably in-duced by diffractions on a metallic pipe.
The profile illustrates domains of contrasting re-flection patterns, extending to a depth of about 10 m:five domains are bounded by four faults between34.5 m to the southeast and 75 m in the northwest.All the faults are steeply dipping, which is coherentwith strike-slip geometry. Higher contrasts in reflec-tions are located on each side of faults at 34.5 and41 m. Two other faults may be drawn with little con-fidence at 59 and 75 m, an interval straddling the in-ferred position of the fault trace at the surface (60 m)based on geological and geomorphological criteria. Inthe following discussion, faults identified in the pro-files cannot be assumed to be active from the only
GPR profiling as the ages of displaced sediments havenot yet been established (an active fault requires ev-idence that rupture has occurred in the last 125 000years). The uppermost part of the profile also displaysoblique reflective layers that are interpreted as inter-faces between different mediums. Each interface be-tween non-scattering to scattering medium may thusrepresent the transition from incoherent (artificial fillor colluvium) to coherent (denser) and coarser forma-tions, i.e., sandstones or gravel. The total breadth ofthe zone of faulting illustrated in the profile is up to40 m, although the only fault to demonstrably displaceQuaternary sediments is the fault at 34.5 m.
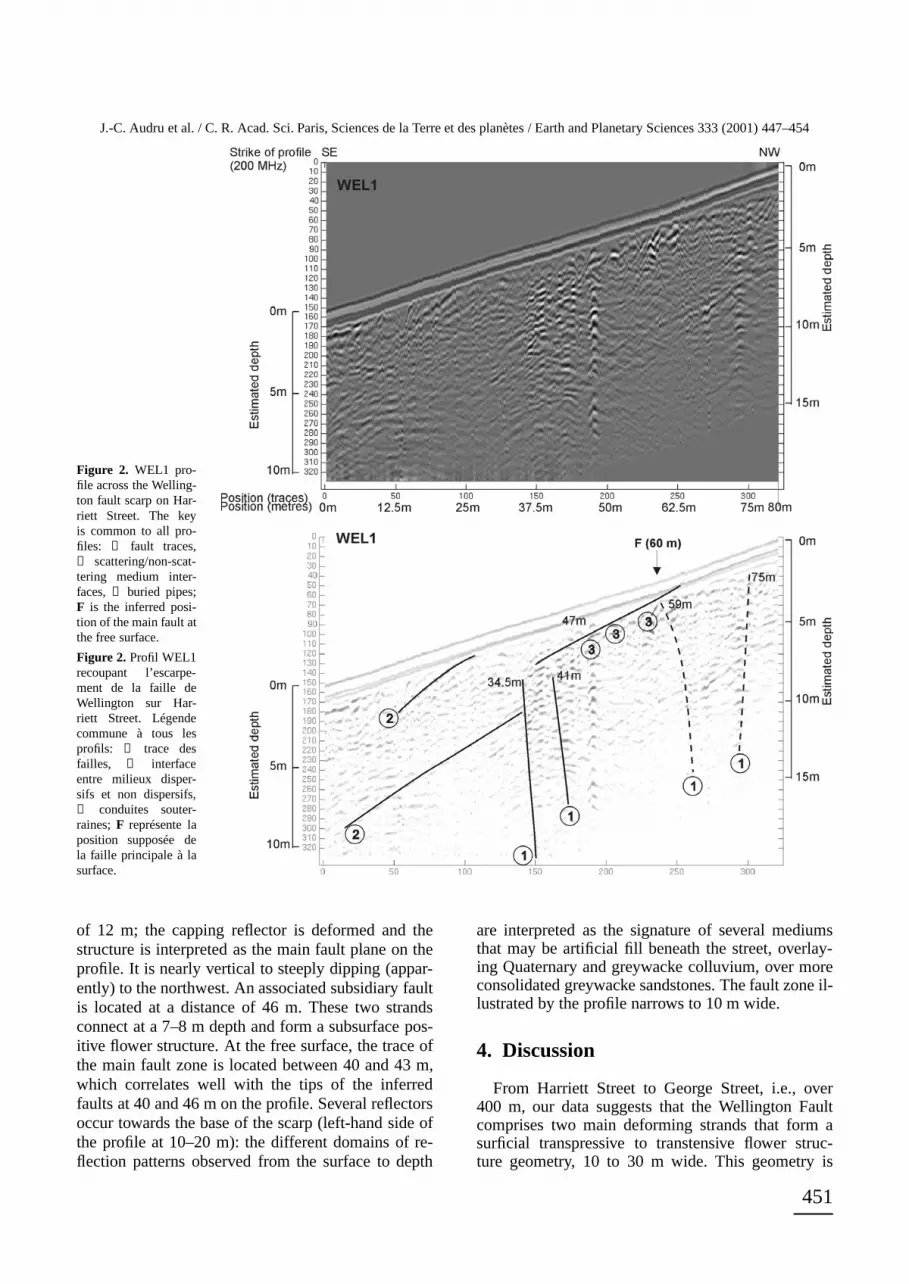
The WEL2 profile was run along Aorangi Terrace(grid ref. NZMS 260 R27/585909), 150 m to thenortheast of the WEL1 (figure 1A). The profile (fig-ure 3) shows two reflecting domains at 11–16 and32–38 m. These may correlate with the two reflect-ing domains illustrated on the WEL1 profile between34.5–41 and 59–75 m; the internal reflecting layers il-lustrate the sedimentary bedding. In this profile also,the vertical boundaries of each domain are interpretedas fault planes: another argument is the apparent off-set and deformation of reflective layers in the subsur-face (despite the age of the displaced sediments is un-known). On the left-hand side, a reflector at the topof the 11–16 m-fault strand may well represent theinterface between artificial fill and the original scarp.A lower reflector between 12.5 and 37.5 m is slightlydeformed just above the northern tip of the fault at16 m and is cut by the fault at 38 m to the north-west. However, the reflector is not truncated by thefault trace suggested at the 32 m position. The 11–16 m strand is interpreted as the main fault zone for itbounds the higher contrasted domains. On the right-hand side of the profile, the fault trace at 32 m is in-ferred from diffractions produced probably by claymineral coating [3, 11] or by clasts or breccia com-monly present in fault gouges; the fault at 38 m isinferred from the different domains that it boundsand from the continuous reflector that butts againstit. The two strands of faults observed on the pro-file define a small graben only 27 m wide and thefaults may connect at depth, possibly representing el-ements of a flower structure. However, no fault wasimaged at 24 m, which is the location of the mainfault trace inferred from the surficial geomorphol-ogy.
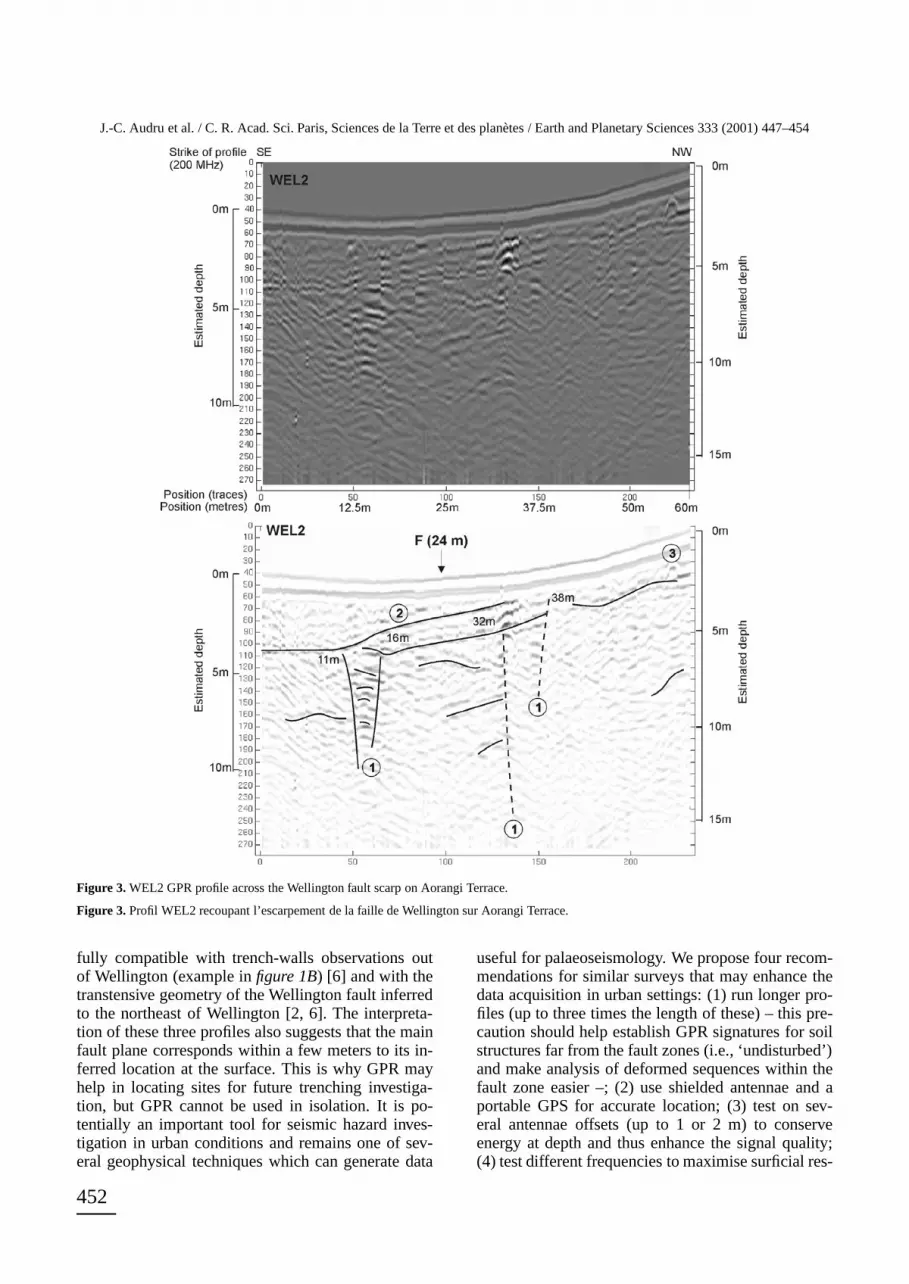
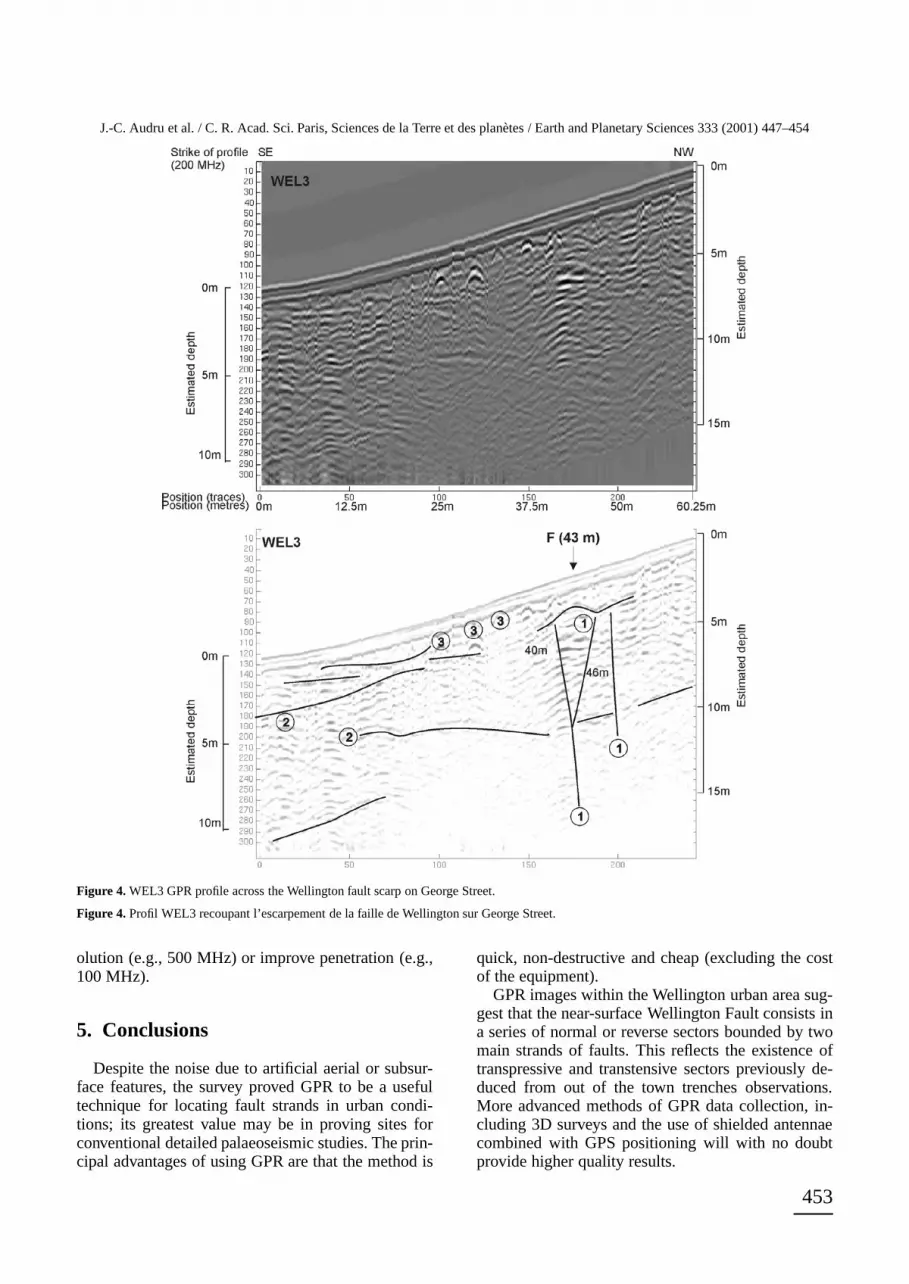
The WEL3 profile (figure 4) was run along GeorgeStreet (grid ref. NZMS 260 R27/587912), 250 mto the northeast of WEL2. Several single hyperbolaapices located in the uppermost horizons (0–3 m) areinterpreted as buried pipes. Once again, the profiledisplays several domains of distinctive reflection pat-terns. Particularly, the profile shows repetitive trunca-tions of reflecting beds at a distance of 40 m to a depth
450
J.-C. Audru et al. / C. R. Acad. Sci. Paris, Sciences de la Terre et des planètes / Earth and Planetary Sciences 333 (2001) 447–454
Figure 2. WEL1 pro-file across the Welling-ton fault scarp on Har-riett Street. The keyis common to all pro-files: ① fault traces,② scattering/non-scat-tering medium inter-faces, ③ buried pipes;F is the inferred posi-tion of the main fault atthe free surface.
Figure 2. Profil WEL1recoupant l’escarpe-ment de la faille deWellington sur Har-riett Street. Légendecommune à tous lesprofils: ① trace desfailles, ② interfaceentre milieux disper-sifs et non dispersifs,③ conduites souter-raines;F représente laposition supposée dela faille principale à lasurface.
of 12 m; the capping reflector is deformed and thestructure is interpreted as the main fault plane on theprofile. It is nearly vertical to steeply dipping (appar-ently) to the northwest. An associated subsidiary faultis located at a distance of 46 m. These two strandsconnect at a 7–8 m depth and form a subsurface pos-itive flower structure. At the free surface, the trace ofthe main fault zone is located between 40 and 43 m,which correlates well with the tips of the inferredfaults at 40 and 46 m on the profile. Several reflectorsoccur towards the base of the scarp (left-hand side ofthe profile at 10–20 m): the different domains of re-flection patterns observed from the surface to depth
are interpreted as the signature of several mediumsthat may be artificial fill beneath the street, overlay-ing Quaternary and greywacke colluvium, over moreconsolidated greywacke sandstones. The fault zone il-lustrated by the profile narrows to 10 m wide.
4. Discussion
From Harriett Street to George Street, i.e., over400 m, our data suggests that the Wellington Faultcomprises two main deforming strands that form asurficial transpressive to transtensive flower struc-ture geometry, 10 to 30 m wide. This geometry is
451
J.-C. Audru et al. / C. R. Acad. Sci. Paris, Sciences de la Terre et des planètes / Earth and Planetary Sciences 333 (2001) 447–454
Figure 3. WEL2 GPR profile across the Wellington fault scarp on Aorangi Terrace.
Figure 3. Profil WEL2 recoupant l’escarpement de la faille de Wellington sur Aorangi Terrace.
fully compatible with trench-walls observations outof Wellington (example infigure 1B) [6] and with thetranstensive geometry of the Wellington fault inferredto the northeast of Wellington [2, 6]. The interpreta-tion of these three profiles also suggests that the mainfault plane corresponds within a few meters to its in-ferred location at the surface. This is why GPR mayhelp in locating sites for future trenching investiga-tion, but GPR cannot be used in isolation. It is po-tentially an important tool for seismic hazard inves-tigation in urban conditions and remains one of sev-eral geophysical techniques which can generate data
useful for palaeoseismology. We propose four recom-mendations for similar surveys that may enhance thedata acquisition in urban settings: (1) run longer pro-files (up to three times the length of these) – this pre-caution should help establish GPR signatures for soilstructures far from the fault zones (i.e., ‘undisturbed’)and make analysis of deformed sequences within thefault zone easier –; (2) use shielded antennae and aportable GPS for accurate location; (3) test on sev-eral antennae offsets (up to 1 or 2 m) to conserveenergy at depth and thus enhance the signal quality;(4) test different frequencies to maximise surficial res-
452
J.-C. Audru et al. / C. R. Acad. Sci. Paris, Sciences de la Terre et des planètes / Earth and Planetary Sciences 333 (2001) 447–454
Figure 4. WEL3 GPR profile across the Wellington fault scarp on George Street.
Figure 4. Profil WEL3 recoupant l’escarpement de la faille de Wellington sur George Street.
olution (e.g., 500 MHz) or improve penetration (e.g.,100 MHz).
5. Conclusions
Despite the noise due to artificial aerial or subsur-face features, the survey proved GPR to be a usefultechnique for locating fault strands in urban condi-tions; its greatest value may be in proving sites forconventional detailed palaeoseismic studies. The prin-cipal advantages of using GPR are that the method is
quick, non-destructive and cheap (excluding the costof the equipment).
GPR images within the Wellington urban area sug-gest that the near-surface Wellington Fault consists ina series of normal or reverse sectors bounded by twomain strands of faults. This reflects the existence oftranspressive and transtensive sectors previously de-duced from out of the town trenches observations.More advanced methods of GPR data collection, in-cluding 3D surveys and the use of shielded antennaecombined with GPS positioning will with no doubtprovide higher quality results.
453
J.-C. Audru et al. / C. R. Acad. Sci. Paris, Sciences de la Terre et des planètes / Earth and Planetary Sciences 333 (2001) 447–454
Acknowledgements. The Georisc-NZ team is very grateful to the Institute of Geological and Nuclear Sciences at Lower Hutt (New Zealand),the French Embassy at Wellington (New Zealand) and the ‘Institut de physique du Globe’ at Strasbourg (France) for funding the project, toJ.-C. Gourry (BRGM), M. Park (IGNS) and J.-F. Girard (EPGS) for their comments and contribution to the paper.
References
[1] Asprion U., Aigner T., Towards realistic aquifer models: three-dimensional georadar surveys of Quaternary gravel deltas (SingenBasin, SW Germany), Sediment. Geol. 129 (3–4) (1999) 281–297.
[2] Audru J.C., Begg J., Bano M., Henrys S., Berryman K., Ni-vière B., GPR profiling across the Wellington–Hutt Valley segmentof the Wellington fault, New Zealand, N. Z. J. Geol. Geophys. (inpreparation).
[3] Bano M., Pivot F., Marthelot J.-M., Modelling and filter-ing of surface scattering in ground-penetrating radar waves, FirstBreak 17 (6) (1999) 215–222.
[4] Bano M., Marquis G., Nivière B., Maurin J.-C., Cushing M.,Investigating alluvial and tectonic features with ground-penetratingradar and analysing diffraction patterns, J. Appl. Geophys. 43 (2000)33–41.
[5] Begg J.G., Mazengarb C., Geology of the Wellington area,1:50 000, in: Geological Map 22, Institute of Geological and NuclearSciences, 1996, 128 p., 1 sheet.
[6] Berryman K.R., Late Quaternary movement on the Wellingtonfault in the Upper Hutt area, New Zealand, N. Z. J. Geol. Geophys. 33(1990) 257–270.
[7] Bridge J.S., Alexander J., Collier R.E.L., Gawthorpe R.L.,Jarvis J., Ground penetrating radar and coring used to study thelarge-scale structures of point bar deposits in three dimensions,Sedimentology 42 (1995) 839–852.
[8] Cai J., McMechan G.A., Fisher M.A., Application of ground-penetrating radar to investigation of near-surface fault properties inthe San Francisco bay region, Bull. Seismol. Soc. Am. 86 (5) (1996)1459–1470.
[9] Daniels D.J., Gunton D.J., Scott H.F., Introduction to subsur-face radar, IEE Proc. 135 (1988) 278–320.
[10] Davis J.L., Annan A.P., Ground penetrating radar for high res-olution mapping of soil and rock stratigraphy, Geophys. Prospect. 37(1989) 531–551.
[11] Liner C.L., Liner J.L., Application of GPR to a site investi-gation involving shallow faults, The Leading Edge 16 (1997) 1649–1651.
[12] Meschede M., Asprion U., Reicherter K., Visualisation of tec-tonic structures in shallow-depth high-resolution ground-penetratingradar profiles, Terra Nova 9 (1997) 167–170.
[13] Meyers R.A., Smith D.G., Jol H.M., Peterson C.D., Evidencefor eight great earthquake-subsidence events detected with ground-penetrating radar, Willapa Barrier, Washington, Geology 14 (1996)99–102.
[14] Nobes D.C., Geophysical surveys of burial sites: a case studyof the Oaro urupa, Geophysics 64 (2) (1999) 357–367.
[15] Smith D.G., Jol H.M., Wasatch Fault (Utah) detected anddisplacement characterised by ground penetrating radar, Bull. Ass.Eng. Geol. 1 (1995) 489–496.
[16] Van Dissen R.J., Berryman K.R., Surface rupture earthquakesover the last∼1 000 years in the Wellington region, New Zealand,and implications for ground shaking hazard, J. Geophys. Res. 101 B3(1996) 5999–6019.
[17] Van Dissen R.J., Berryman K.R., Pettinga J.R., Hill N.L., Pa-leoseismicity of the Wellington–Hutt Valley Segment of the Welling-ton fault, North Island, New Zealand, N. Z. J. Geol. Geophys. 35(1992) 165–176.
[18] Walcott R.I., Present tectonics and Late Cenozoic evolutionof New Zealand, Geophys. J. R. Astr. Soc. 52 (1978) 137–164.
[19] Yetton M.D., Nobes D.C., Recent vertical offset and near-surface structure of the Alpine fault in Westland, New Zealand, fromground penetrating radar profiling, N. Z. J. Geol. Geophys. 41 (1998)485–492.
454