Review Article Camels, Camel Milk, and Camel Milk Product ...
Upload
khangminh22Category
view
3download
0
nutrients
Article
Got Mylk? The Emerging Role of AustralianPlant-Based Milk Alternatives as A Cow’sMilk Substitute
Yianna Y. Zhang 1,2 , Jaimee Hughes 3 and Sara Grafenauer 3,4,*1 School of Agriculture and Food, Faculty of Veterinary and Agricultural Sciences,
The University of Melbourne, Parkville, VIC 3052, Australia; [email protected] CSIRO Agriculture & Food, 671 Sneydes Road, Werribee, VIC 3030, Australia3 Grains & Legumes Nutrition Council, Mount Street, North Sydney, NSW 2060, Australia;
[email protected] School of Medicine, University of Wollongong, Northfields Avenue, Wollongong, NSW 2522, Australia* Correspondence: [email protected]; Tel.: +61-2-9394-8662
Received: 18 March 2020; Accepted: 26 April 2020; Published: 28 April 2020
Abstract: Growing ethical, environmental and health concerns have encouraged demand for novelplant-based milk alternatives, yet it remains nebulous whether these products are nutritionallyadequate as cow’s milk replacements. The aim of this study was to conduct a cross-sectional surveyof plant-based milk alternatives available in major Australian supermarkets and selected niche foodretailers from November 2019 to January 2020 and assess two dietary scenarios (adolescents andolder women) where dairy serves were substituted for plant-based alternatives against AustralianEstimated Average Requirements (EAR). We collected compositional data from nutrition panels injuxtaposition with derivatives from the Australian Food Composition database, with a total of 115products, including tree nuts and seeds (n = 48), legumes (n = 27), coconut (n = 10), grains (n = 19)and mixed sources (n = 10). Just over 50% of products were fortified, but only 1/3 contained similarcalcium content to cow’s milk. Indiscriminate substitutions might reduce intakes of protein andmicronutrients, particularly vitamin A, B2, B12, iodine and zinc, and lead to reductions >50% of theEARs for protein, zinc and calcium in the chosen dietary scenarios. To avoid unintended dietaryoutcomes, it is vital that consumers make pragmatic decisions regarding dietary replacements forcow’s milk.
Keywords: plant-based alternatives; milk; milk alternatives; nutrient composition; vegetarian;fortification
1. Introduction
The consumption of cow’s milk can be traced back to the 7th century BC, with a definitive role infood production and cultures worldwide [1,2]. Against a backdrop of ethical, environmental and healthconcerns, there has been a surge of consumer interest in milk alternative beverages (also termed ‘mylk’),derived from aqueous extracts of plant ingredients, including nuts, legumes and grains [3]. Australia iswitnessing significant growth in the plant-based milk alternatives market, with products accounting for~7% of all milk consumed and estimated value of $230 million [4]. By virtue of their positive perceptionand high sensory acceptance [5,6], plant-based milk alternatives broaden avenues for serving the needsof diverse populations that harbour concerns associated with dairy. Its consumption coheres with thegrowing prevalence of health conditions, including milk protein allergy and lactose intolerance [7,8],consumer demand for vegan/vegetarian foods [9,10] and concerns with animal welfare [11]. Moreover,the resource and waste-intensive nature of industrial dairy production are indisputable [12,13], leading
Nutrients 2020, 12, 1254; doi:10.3390/nu12051254 www.mdpi.com/journal/nutrients
Nutrients 2020, 12, 1254 2 of 18
many consumers to perceive plant-based milk alternatives as being expedient over cow’s milk inenvironmental sustainability [14,15]. There have been multiple comparative life cycle assessments(LCAs) suggesting substantially fewer greenhouse gas emissions, eutrophication, water and land useduring production [16–18], although some plant-based milks can have a higher ecological impact basedon per kg of protein produced (e.g. almond [17]).
Besides environmental quandaries, nutritional adequacy is also an important dimension ofsustainable diets worldwide [19,20]. Cow’s milk is an economical yet nutrient-dense source ofenergy, containing highly bioavailable proteins with essential vitamins and minerals, as well asbioactive compounds, such as peptides and lipids [21]. An irrefutable diet staple, the averageAustralian reportedly consumes approximately 100 litres annually, constituting 62% of the total dairyintake [22,23]. The latest representative Australian nutrition survey (National Nutrition and PhysicalActivity Survey, 2011−12) demonstrated that milk ingestion constituted for ~20% of total calcium,8.7% of phosphorous, 17.3% of iodine, 5.2% of vitamin A, 4.6% of B6 and 17.5% of B12 intake inthe general population [24], a finding also replicated in a Canadian cohort [25]. Observational anddietary modelling studies have shown cow’s milk consumption to be a reliable indicator of dietaryquality across multiple age groups, with consumers more likely to meet their requirements of protein,essential minerals and vitamins A, B2, B6 and B12 [26–31]. An ideal alternative would providecomparable levels of these nutrients, without the need to elicit major changes in dietary patterns tomeet requirements. However, there appears to be a general consumer mistrust of the food supply [32]and public misconceptions over plant-based beverages and their nutrition credentials as ‘healthier’alternatives [4].
Cow’s milk is commonly featured in dietary guidelines as a multifaceted contributor to nutrients,promoting bone health (e.g. in the USA [33] and Canada [25]). It offers a valuable supply of highlymetabolisable calcium, protein and zinc, which are synergistic contributors to bone tissue and collagensynthesis [34,35]. The physiological requirements for these nutrients are at a pinnacle during criticalstages of life. This includes children and adolescents, where 40% of an individual’s total bone massbegins to progressively accrue until peak mass is reached later in life [36]. Another is the expandingaging population, where diminishing bone density becomes common in individuals reaching 40,leading to elevated risks of osteoporosis and subsequent fractures [37,38]. Menopausal women, inparticular, experience hormone-related changes that accelerate bone loss, such as in estrogen andFollicle Stimulating Hormone [39,40]. Eschewing cow’s milk for alternative plant-based sources arethus particularly relevant for these age groups to help ensure sufficient nutrient intakes. However,current Food Standards Australia and New Zealand (FSANZ) legislations only require a mandatoryadvisory warning on plant-based beverages as a milk substitution for children aged 5 and under [41].
Despite possessing functional properties in their own right, the composition inventories in thescientific literature highlight the inadequacies of unfortified plant-based milk alternatives in comparisonto cow’s milk [42–45]. Milk alternatives occupy compositional flexibility, the formulation of which aregoverned under legislations distinct to cow’s milk [46,47]. Food legislations possess a country-leveldependence, indicating that data generalisation across geographical locations may not be prudent,with differences in the ingredients and fortificants permitted. Little has been reported in relation to thestate of Australian products, despite FSANZ making further approvals for voluntary fortification inplant-based milks in recent years [48]. The market availability of food products is a compelling driverunderpinning consumer access and consumption [49,50]. Beyond a direct beverage, cow’s milk is animportant culinary constituent, with 14% of its total ingestion in Australia originating from café stylecoffee [24]. The juxtaposition of these factors necessitates an evaluation of products available fromsupermarkets, cafés and health food stores.
The aim of this study was to conduct a cross-sectional survey of plant-based milk alternativesavailable in Australian major supermarkets and selected niche food retailers (café’s and health foodstores) from November 2019 to January 2020, collecting compositional data from nutrition panelsin comparison to cow’s milk. This study helped to identify potential nutritional ramifications of

Nutrients 2020, 12, 1254 3 of 18
replacing cow’s milk with plant-based milk alternatives through dietary modelling in adolescents(aged 12–18 years of age) and older women (aged 51+ years), in line with the Nutrient ReferenceValues [51]. Strategies to mitigate the nutritional gaps identified during our analyses were discussedwith reference to some health-promoting constituents of cow’s milk.
2. Materials and Methods
A cross-sectional survey of plant-based milk alternatives was conducted between November2019 and January 2020 in Metropolitan areas of Melbourne and Sydney. The data collection processreplicated a previously recognised procedure [10,52]; however, the examination included three marketcategories: retail supermarkets, health food stores and local independent cafes with non-dairy milkofferings. The following major supermarkets were surveyed: Woolworths Group, Coles, Aldi andIndependent Grocers of Australia (IGA), which collectively constitute 80.1% of the Australian grocerymarket share [53]. For each supermarket, a minimum of three stores within 30 km of each city’s CentralBusiness District (CBD) were visited. A total of six independent health food stores, three from each city,and ten local café retailers, five from each city were also visited within the CBD. With permission fromstore managers, smartphones were used to collect on-pack nutrition information, including nutritioninformation panels (NIP) and ingredient lists. Plant-based milk alternatives from both refrigerated andlong-life sections were included in the audit, where their intended use and quantity were reasonablypresumed to be similar to cow’s milk (i.e. the product is displayed in juxtaposition to cow’s milk andcan be directly consumed as a beverage). Products excluded from the auditing process included tinnedcoconut milks that were clearly intended for culinary use, and coconut water, a beverage composed ofcoconut liquid endosperm. Flavoured plant-based milk alternative products were also excluded, astheir dairy-based counterparts are considered discretionary [54]. Data collected from all stores werescreened to avoid product duplication. Collected nutritional information was validated using onlinedata provided by the retailer or manufacturer’s website.
To capture nutrition composition data for individual plant-based milk alternative products,three sources of nutrition information were referenced to. Where available, values were directlyobtained from the NIP during the auditing process, as provided by the manufacturer of each product.Where insufficient data was available from the NIP, such as for some micronutrients in non-fortifiedproducts, values were factorially derived based on a percentage of the characterising ingredient, usingcomposition data from the FSANZ Food Composition Database [55]. The latter option was madefeasible by legal requirements of FSANZ Act 1991 that the characterising ingredient must be declaredon products as a percentage of the final food product [56]. This percentage was then used to computenutritional values per 100 grams. For example, a product containing 3% almonds, without additionalfortificants, was considered to be nutritionally equivalent to 3 grams of unprocessed almonds per100 mL of beverage. A list of the ingredient accession numbers used for calculations are provided inAppendix A. For vitamin A, retinol equivalents were used for standard comparison between sources,as milk is a source of both preformed vitamin A and carotenoids [57]. Nutrient values for dairyproducts were obtained from the Food Composition Database as controls (See Appendix A for accessionnumbers).
Data entries were transcribed from photographs, collated into a Microsoft Excel spreadsheet(Redmond, WA, USA) as Pivot tables and categorised by botanical source (Table 1). The datatransfer process was cross-validated by a separate researcher. For each group, the total solids contentwas approximated by adding the macro- and micro-nutritional constituents per 100 mL, after unitadjustments. The products were also categorised based on whether they were sweetened or fortified(Table 2).
Nutrients 2020, 12, 1254 4 of 18
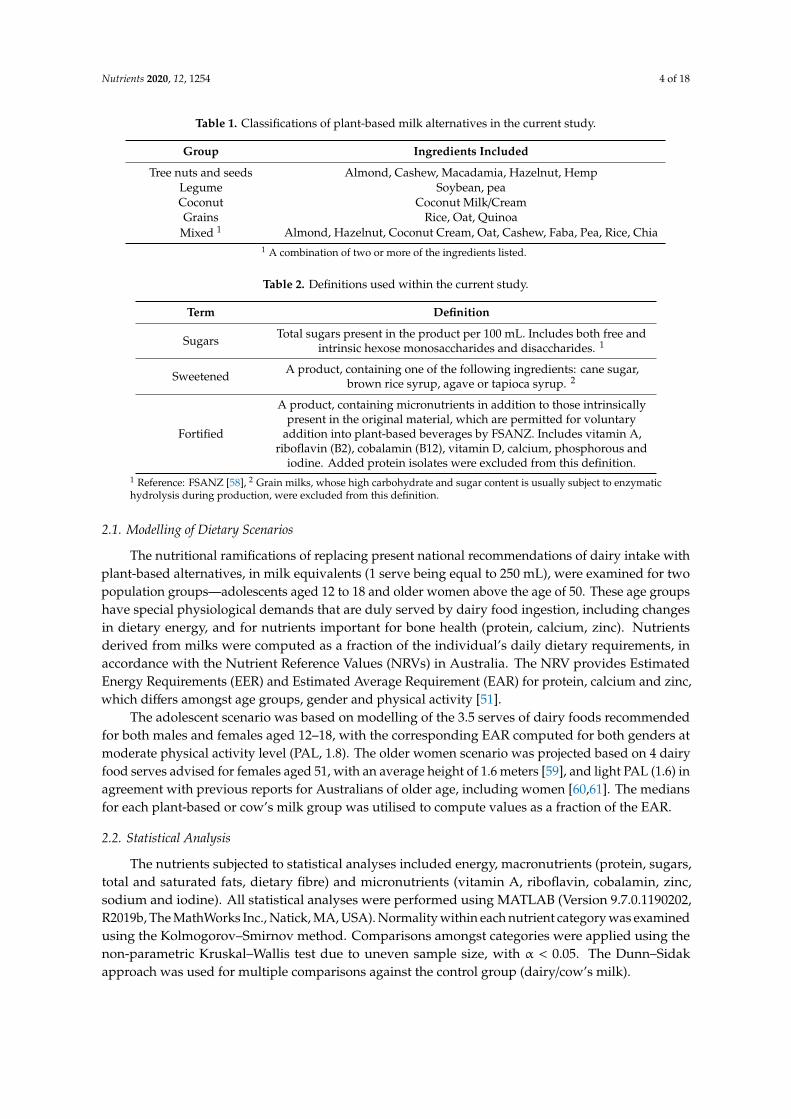
Table 1. Classifications of plant-based milk alternatives in the current study.
Group Ingredients Included
Tree nuts and seeds Almond, Cashew, Macadamia, Hazelnut, HempLegume Soybean, peaCoconut Coconut Milk/CreamGrains Rice, Oat, Quinoa
Mixed 1 Almond, Hazelnut, Coconut Cream, Oat, Cashew, Faba, Pea, Rice, Chia1 A combination of two or more of the ingredients listed.
Table 2. Definitions used within the current study.
Term Definition
Sugars Total sugars present in the product per 100 mL. Includes both free andintrinsic hexose monosaccharides and disaccharides. 1
Sweetened A product, containing one of the following ingredients: cane sugar,brown rice syrup, agave or tapioca syrup. 2
Fortified
A product, containing micronutrients in addition to those intrinsicallypresent in the original material, which are permitted for voluntary
addition into plant-based beverages by FSANZ. Includes vitamin A,riboflavin (B2), cobalamin (B12), vitamin D, calcium, phosphorous and
iodine. Added protein isolates were excluded from this definition.1 Reference: FSANZ [58], 2 Grain milks, whose high carbohydrate and sugar content is usually subject to enzymatichydrolysis during production, were excluded from this definition.
2.1. Modelling of Dietary Scenarios
The nutritional ramifications of replacing present national recommendations of dairy intake withplant-based alternatives, in milk equivalents (1 serve being equal to 250 mL), were examined for twopopulation groups—adolescents aged 12 to 18 and older women above the age of 50. These age groupshave special physiological demands that are duly served by dairy food ingestion, including changesin dietary energy, and for nutrients important for bone health (protein, calcium, zinc). Nutrientsderived from milks were computed as a fraction of the individual’s daily dietary requirements, inaccordance with the Nutrient Reference Values (NRVs) in Australia. The NRV provides EstimatedEnergy Requirements (EER) and Estimated Average Requirement (EAR) for protein, calcium and zinc,which differs amongst age groups, gender and physical activity [51].
The adolescent scenario was based on modelling of the 3.5 serves of dairy foods recommendedfor both males and females aged 12–18, with the corresponding EAR computed for both genders atmoderate physical activity level (PAL, 1.8). The older women scenario was projected based on 4 dairyfood serves advised for females aged 51, with an average height of 1.6 meters [59], and light PAL (1.6) inagreement with previous reports for Australians of older age, including women [60,61]. The mediansfor each plant-based or cow’s milk group was utilised to compute values as a fraction of the EAR.
2.2. Statistical Analysis
The nutrients subjected to statistical analyses included energy, macronutrients (protein, sugars,total and saturated fats, dietary fibre) and micronutrients (vitamin A, riboflavin, cobalamin, zinc,sodium and iodine). All statistical analyses were performed using MATLAB (Version 9.7.0.1190202,R2019b, The MathWorks Inc., Natick, MA, USA). Normality within each nutrient category was examinedusing the Kolmogorov–Smirnov method. Comparisons amongst categories were applied using thenon-parametric Kruskal–Wallis test due to uneven sample size, with α < 0.05. The Dunn–Sidakapproach was used for multiple comparisons against the control group (dairy/cow’s milk).
Nutrients 2020, 12, 1254 5 of 18
3. Results
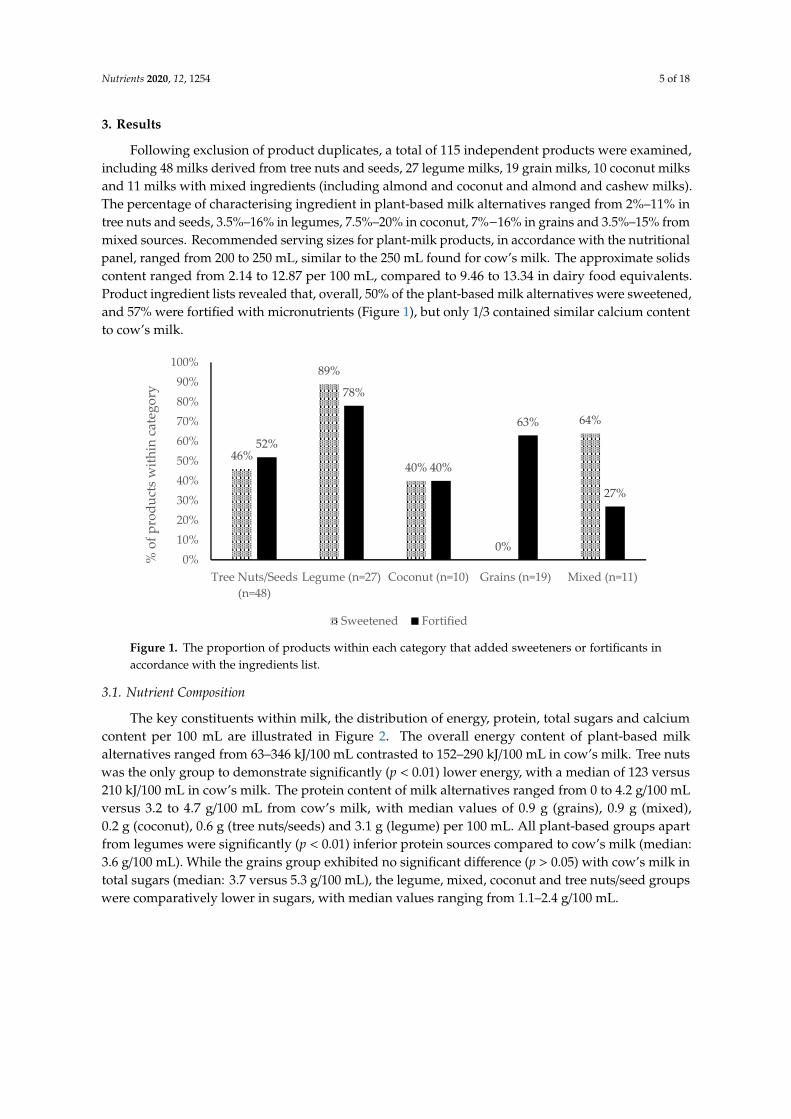
Following exclusion of product duplicates, a total of 115 independent products were examined,including 48 milks derived from tree nuts and seeds, 27 legume milks, 19 grain milks, 10 coconut milksand 11 milks with mixed ingredients (including almond and coconut and almond and cashew milks).The percentage of characterising ingredient in plant-based milk alternatives ranged from 2%–11% intree nuts and seeds, 3.5%–16% in legumes, 7.5%–20% in coconut, 7%−16% in grains and 3.5%–15% frommixed sources. Recommended serving sizes for plant-milk products, in accordance with the nutritionalpanel, ranged from 200 to 250 mL, similar to the 250 mL found for cow’s milk. The approximate solidscontent ranged from 2.14 to 12.87 per 100 mL, compared to 9.46 to 13.34 in dairy food equivalents.Product ingredient lists revealed that, overall, 50% of the plant-based milk alternatives were sweetened,and 57% were fortified with micronutrients (Figure 1), but only 1/3 contained similar calcium contentto cow’s milk.
Nutrients 2020, 12, x FOR PEER REVIEW 5 of 19
11% in tree nuts and seeds, 3.5%–16% in legumes, 7.5%–20% in coconut, 7%−16% in grains and 3.5%–15% from mixed sources. Recommended serving sizes for plant-milk products, in accordance with the nutritional panel, ranged from 200 to 250 mL, similar to the 250 mL found for cow’s milk. The approximate solids content ranged from 2.14 to 12.87 per 100 mL, compared to 9.46 to 13.34 in dairy food equivalents. Product ingredient lists revealed that, overall, 50% of the plant-based milk alternatives were sweetened, and 57% were fortified with micronutrients (Figure 1), but only 1/3 contained similar calcium content to cow’s milk.
Figure 1. The proportion of products within each category that added sweeteners or fortificants in accordance with the ingredients list.
3.1. Nutrient Composition
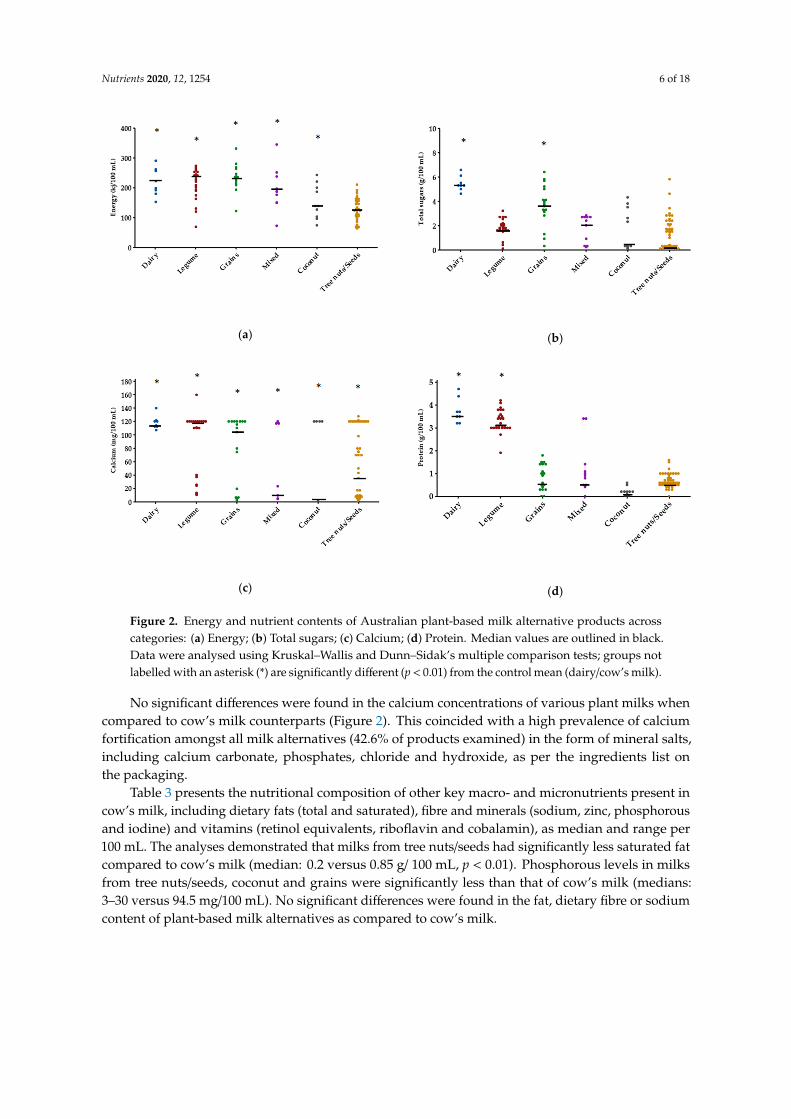
The key constituents within milk, the distribution of energy, protein, total sugars and calcium content per 100 mL are illustrated in Figure 2. The overall energy content of plant-based milk alternatives ranged from 63–346 kJ/100 mL contrasted to 152–290 kJ/100 mL in cow’s milk. Tree nuts was the only group to demonstrate significantly (p < 0.01) lower energy, with a median of 123 versus 210 kJ/100 mL in cow’s milk. The protein content of milk alternatives ranged from 0 to 4.2 g/100 mL versus 3.2 to 4.7 g/100 mL from cow’s milk, with median values of 0.9 g (grains), 0.9 g (mixed), 0.2 g (coconut), 0.6 g (tree nuts/seeds) and 3.1 g (legume) per 100 mL. All plant-based groups apart from legumes were significantly (p < 0.01) inferior protein sources compared to cow’s milk (median: 3.6 g/100 mL). While the grains group exhibited no significant difference (p > 0.05) with cow’s milk in total sugars (median: 3.7 versus 5.3 g/100 mL), the legume, mixed, coconut and tree nuts/seed groups were comparatively lower in sugars, with median values ranging from 1.1–2.4 g/100 mL.
No significant differences were found in the calcium concentrations of various plant milks when compared to cow’s milk counterparts (Figure 2). This coincided with a high prevalence of calcium fortification amongst all milk alternatives (42.6% of products examined) in the form of mineral salts, including calcium carbonate, phosphates, chloride and hydroxide, as per the ingredients list on the packaging.
46%
89%
40%
0%
64%
52%
78%
40%
63%
27%
0%10%20%30%40%50%60%70%80%90%
100%
Tree Nuts/Seeds(n=48)
Legume (n=27) Coconut (n=10) Grains (n=19) Mixed (n=11)
% o
f pro
duct
s with
in c
ateg
ory
Sweetened Fortified
Figure 1. The proportion of products within each category that added sweeteners or fortificants inaccordance with the ingredients list.
3.1. Nutrient Composition
The key constituents within milk, the distribution of energy, protein, total sugars and calciumcontent per 100 mL are illustrated in Figure 2. The overall energy content of plant-based milkalternatives ranged from 63–346 kJ/100 mL contrasted to 152–290 kJ/100 mL in cow’s milk. Tree nutswas the only group to demonstrate significantly (p < 0.01) lower energy, with a median of 123 versus210 kJ/100 mL in cow’s milk. The protein content of milk alternatives ranged from 0 to 4.2 g/100 mLversus 3.2 to 4.7 g/100 mL from cow’s milk, with median values of 0.9 g (grains), 0.9 g (mixed),0.2 g (coconut), 0.6 g (tree nuts/seeds) and 3.1 g (legume) per 100 mL. All plant-based groups apartfrom legumes were significantly (p < 0.01) inferior protein sources compared to cow’s milk (median:3.6 g/100 mL). While the grains group exhibited no significant difference (p > 0.05) with cow’s milk intotal sugars (median: 3.7 versus 5.3 g/100 mL), the legume, mixed, coconut and tree nuts/seed groupswere comparatively lower in sugars, with median values ranging from 1.1–2.4 g/100 mL.
Nutrients 2020, 12, 1254 6 of 18Nutrients 2020, 12, x FOR PEER REVIEW 6 of 19
(a)
(b)
(c)
(d)
Figure 2. Energy and nutrient contents of Australian plant-based milk alternative products across categories: (a) Energy; (b) Total sugars; (c) Calcium; (d) Protein. Median values are outlined in black. Data were analysed using Kruskal–Wallis and Dunn–Sidak’s multiple comparison tests; groups not labelled with an asterisk (*) are significantly different (p < 0.01) from the control mean (dairy/cow’s milk).
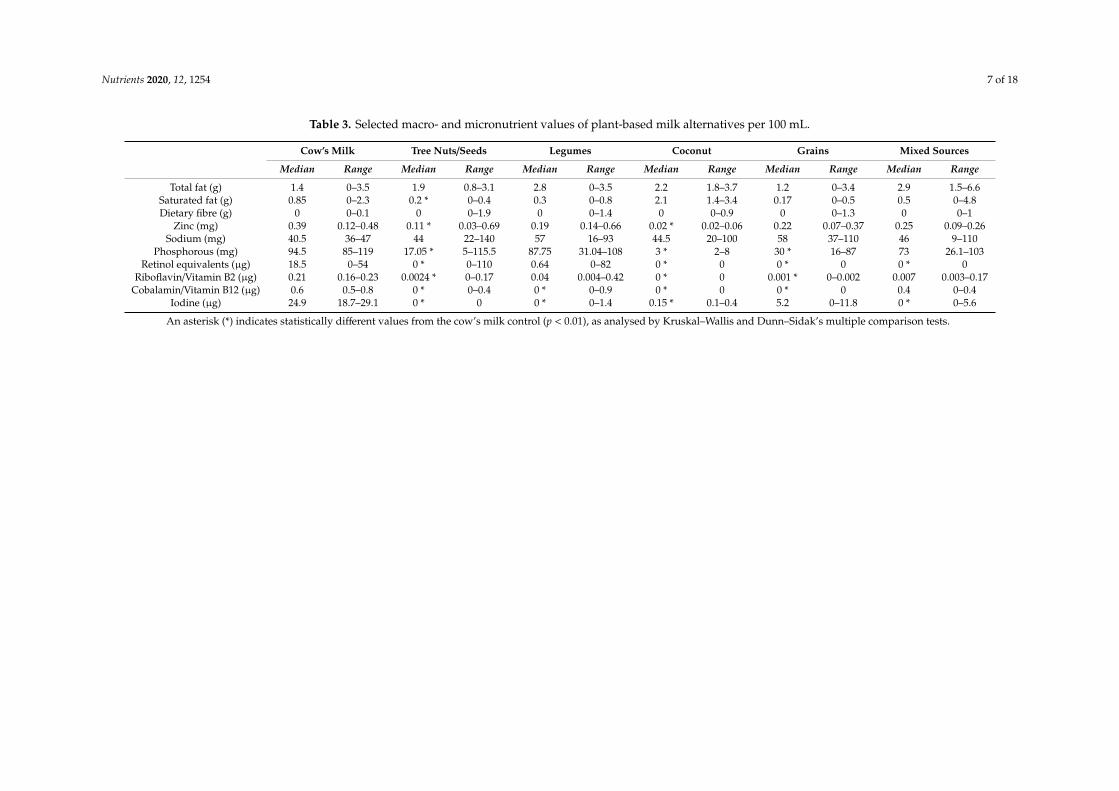
Table 3 presents the nutritional composition of other key macro- and micronutrients present in cow’s milk, including dietary fats (total and saturated), fibre and minerals (sodium, zinc, phosphorous and iodine) and vitamins (retinol equivalents, riboflavin and cobalamin), as median and range per 100 mL. The analyses demonstrated that milks from tree nuts/seeds had significantly less saturated fat compared to cow’s milk (median: 0.2 versus 0.85 g/ 100 mL, p < 0.01). Phosphorous levels in milks from tree nuts/seeds, coconut and grains were significantly less than that of cow’s milk (medians: 3–30 versus 94.5 mg/100 mL). No significant differences were found in the fat, dietary fibre or sodium content of plant-based milk alternatives as compared to cow’s milk.
Despite the fortification of some products, plant-based milk alternatives were found to be poor sources of some micronutrients. Milks derived from tree nuts/seeds, coconut and grains showed significantly lower levels of retinol equivalents compared to cow’s milk (median: 0 versus 18.5 µg/100 mL). All groups contained little to no vitamin B12, except for mixed sources (median: 0.4 µg/100 mL). In relation to zinc, tree nuts/seeds and coconut milks were substandard sources versus cow’s milk (medians: 0.02–0.109 versus 0.39 mg/100 mL). Grain milks were the only source with iodine levels statistically comparable to cow’s milk, although a reduction was still observed (median 5.2 versus
Figure 2. Energy and nutrient contents of Australian plant-based milk alternative products acrosscategories: (a) Energy; (b) Total sugars; (c) Calcium; (d) Protein. Median values are outlined in black.Data were analysed using Kruskal–Wallis and Dunn–Sidak’s multiple comparison tests; groups notlabelled with an asterisk (*) are significantly different (p < 0.01) from the control mean (dairy/cow’s milk).
No significant differences were found in the calcium concentrations of various plant milks whencompared to cow’s milk counterparts (Figure 2). This coincided with a high prevalence of calciumfortification amongst all milk alternatives (42.6% of products examined) in the form of mineral salts,including calcium carbonate, phosphates, chloride and hydroxide, as per the ingredients list onthe packaging.
Table 3 presents the nutritional composition of other key macro- and micronutrients present incow’s milk, including dietary fats (total and saturated), fibre and minerals (sodium, zinc, phosphorousand iodine) and vitamins (retinol equivalents, riboflavin and cobalamin), as median and range per100 mL. The analyses demonstrated that milks from tree nuts/seeds had significantly less saturated fatcompared to cow’s milk (median: 0.2 versus 0.85 g/ 100 mL, p < 0.01). Phosphorous levels in milksfrom tree nuts/seeds, coconut and grains were significantly less than that of cow’s milk (medians:3–30 versus 94.5 mg/100 mL). No significant differences were found in the fat, dietary fibre or sodiumcontent of plant-based milk alternatives as compared to cow’s milk.
Nutrients 2020, 12, 1254 7 of 18
Table 3. Selected macro- and micronutrient values of plant-based milk alternatives per 100 mL.
Cow’s Milk Tree Nuts/Seeds Legumes Coconut Grains Mixed Sources
Median Range Median Range Median Range Median Range Median Range Median Range
Total fat (g) 1.4 0–3.5 1.9 0.8–3.1 2.8 0–3.5 2.2 1.8–3.7 1.2 0–3.4 2.9 1.5–6.6Saturated fat (g) 0.85 0–2.3 0.2 * 0–0.4 0.3 0–0.8 2.1 1.4–3.4 0.17 0–0.5 0.5 0–4.8Dietary fibre (g) 0 0–0.1 0 0–1.9 0 0–1.4 0 0–0.9 0 0–1.3 0 0–1
Zinc (mg) 0.39 0.12–0.48 0.11 * 0.03–0.69 0.19 0.14–0.66 0.02 * 0.02–0.06 0.22 0.07–0.37 0.25 0.09–0.26Sodium (mg) 40.5 36–47 44 22–140 57 16–93 44.5 20–100 58 37–110 46 9–110
Phosphorous (mg) 94.5 85–119 17.05 * 5–115.5 87.75 31.04–108 3 * 2–8 30 * 16–87 73 26.1–103Retinol equivalents (µg) 18.5 0–54 0 * 0–110 0.64 0–82 0 * 0 0 * 0 0 * 0
Riboflavin/Vitamin B2 (µg) 0.21 0.16–0.23 0.0024 * 0–0.17 0.04 0.004–0.42 0 * 0 0.001 * 0–0.002 0.007 0.003–0.17Cobalamin/Vitamin B12 (µg) 0.6 0.5–0.8 0 * 0–0.4 0 * 0–0.9 0 * 0 0 * 0 0.4 0–0.4
Iodine (µg) 24.9 18.7–29.1 0 * 0 0 * 0–1.4 0.15 * 0.1–0.4 5.2 0–11.8 0 * 0–5.6
An asterisk (*) indicates statistically different values from the cow’s milk control (p < 0.01), as analysed by Kruskal–Wallis and Dunn–Sidak’s multiple comparison tests.

Nutrients 2020, 12, 1254 8 of 18
Despite the fortification of some products, plant-based milk alternatives were found to bepoor sources of some micronutrients. Milks derived from tree nuts/seeds, coconut and grainsshowed significantly lower levels of retinol equivalents compared to cow’s milk (median: 0 versus18.5 µg/100 mL). All groups contained little to no vitamin B12, except for mixed sources (median:0.4 µg/100 mL). In relation to zinc, tree nuts/seeds and coconut milks were substandard sources versuscow’s milk (medians: 0.02–0.109 versus 0.39 mg/100 mL). Grain milks were the only source with iodinelevels statistically comparable to cow’s milk, although a reduction was still observed (median 5.2versus 24.85 µg/100 mL). None of the products examined was fortified with zinc or iodine, althoughone legume-based product contained kelp, a rich source of iodine.
Comparisons with Cow’s Milk Under Australian Legislations
In accordance with FSANZ regulations, plant-based beverages that contain lower levels of proteinthan milk (≤3%) are unsuitable as a complete replacement for children under five years of age, whilebeverages with adequate protein but comparatively lower fat than cow’s milk (≤3.2%) are deemedinappropriate for children under the age of two [56]. Of the plant-based alternatives examined, only 27(23.48% of total) contained the minimum protein concentration, 25 of which originated from legumes.Only 14 (12.17%) products contained fat concentrations equivalent to cow’s milk, and nine products(7.8%) met the criteria for both protein and fat concentrations.
3.2. Projected Dietary Scenarios
Tables 4 and 5 present the changes in energy, protein, sugars, calcium and zinc intake associatedwith substituting cow’s milk with plant-based sources in the context of the overall diet, assumingthe recommended intakes for cow’s milk are met. Our modelling suggested that cow’s milk was asignificant source of protein, calcium and zinc in adolescents and older women, providing 50% or overof the daily recommended intake in both population groups.
Table 4. Projected dietary scenarios of cow’s and plant-based milk consumption, based on currentAustralian guidelines of 3.5 dairy food serves for adolescents (both male and female, aged 12−18). Oneserving is equivalent to 250 mL.
Energy(kJ) % EER 1 Protein
(g) % EAR Sugars(g)
%Energy
Calcium(mg) % EAR Zinc
(mg) % EAR
Cow’s milk 1838 13–17 32 64–90 46 0.3–7 1024 98 3.5 31–58Tree
nuts/Seeds 1076 8–10 5.3 11–15 9.6 0.1–2 407 39 1 9–16
Legumes 2004 14–18 27 55–78 16 0.1–2 1033 98 1.7 15–28Grains 2021 14–19 7.9 16–23 32 0.2–5 910 87 1.9 18–32
Coconut 1216 9–11 1.8 4–5 11 0.1–2 5.3 0.5 0.2 2–3Mixed 1689 12–15 7.9 16–23 21 0.2–3 82 8 2 20–36
1 EER = Estimated Energy Requirements, EAR = Estimated Average Requirements.
Table 5. Projected dietary scenarios of cow’s and plant-based milk consumption, based on currentAustralian guidelines of 4 dairy food serves for older women (aged 51 and above). One serving isequivalent to 250 mL.
Energy(kJ) % EER 1 Protein
(g) % EAR Sugars(g)
%Energy
Calcium(mg) % EAR Zinc
(mg) % EAR
Cow’s milk 2100 27 36 97 53 11 1170 106 3.95 61Tree
nuts/Seeds 1230 16 6 16 11 2 465 42 1.09 17
Legumes 2290 29 31 84 18 4 1180 107 1.9 29Grains 2310 29 9 24 37 8 1040 95 2.2 34
Coconut 1390 18 2 5 13 3 6 0.6 0.2 3Mixed 1930 24 9 24 24 5 94 9 2.5 38
1 EER = Estimated Energy Requirements, EAR = Estimated Average Requirements.
Nutrients 2020, 12, 1254 9 of 18
In adolescents, the replacement of plant-based milk alternatives from legume, grains and mixedsources provided similar energy compared to cow’s milk (range: 12%−19% versus 13%−17% ofEER), while tree nuts/seeds and coconut milks delivered less (range: 8%−11% of EER). Cow’s milkconsumption provided 64%−90% of the protein EAR in this age group, which was similar to that fromlegumes (range: 55%−78%) but considerably higher than other plant sources (4%−23%). The sametrend was observed for calcium, where legumes were the only comparable source to cow’s milk (98%EAR for both). Legume, grain and mixed milks provided slightly lesser zinc compared to cow’s milk(range: 15−36 versus 31%−58%), while milks derived from tree nuts/seeds and coconut were inadequatesources (2%−16% EAR). Regardless of the source, the sugars associated with milk ingestion constitutedless than 5% of total energy in adolescents. This was well within the World Health Organization(WHO) guidelines of <10% of total energy coming from added sugars [62].
In older women, legume, grain and mixed milks provided similar quantities of energy to cow’smilk (range: 24−29 versus 27% of EER), while milks from tree nuts/seeds and coconut were lesser(16%−18%). Findings for protein and zinc were aligned with those from adolescents, with legumesbeing the only comparable protein source to cow’s milk (84% versus 97% EAR), and plant sourcesproviding lesser quantities of zinc (3%−38% versus 61% EAR). Plant-based milk alternatives offeredreduced sugars as a fraction of the total energy required for this age group (2−8 versus 11% in cow’smilk). Older women were likely to meet their calcium intake by selecting legume or grain-based drinks,which provided over 100% of the EAR, similar to in cow’s milk.
4. Discussion
Bovine milk is known to be a nutrient-dense food with vast cultural acceptance, which isaccompanied by a highly bioavailable delivery matrix. Although numerous plant-based replacementproducts are available, our study demonstrated considerable variation between sources, particularlyin relation to protein, vitamin A, riboflavin, cobalamin, iodine and zinc. These findings reiteratedthose previously reported regarding the composition of plant-based milk alternatives from Spain [63],USA [44], Canada [43], Switzerland [64] and India [65], where legume-based (soy) were the onlybeverages that provided comparable values of protein to cow’s milk (approximately 3%). However,some demonstrated disparity in fortification patterns, supporting our hypothesis of possible geographicdependency on the composition of plant-derived milks. For example, a cohort of Spanish and Italianplant milks showed complete absence of fortification [63]. Fortification status is a significant determinantof micronutrient composition, as many plant-derived ingredients are endogenously low in nutrients,such as iodine and cobalamin [66].
Despite several successful nutrition interventions through mandatory fortification (e.g. withfolate [67]), micronutrient deficiencies remain a contemporary public health issue in Australia [68,69],with prevalence up to 25% in some areas [70]. As a staple food, the substitution of cow’s milk withnon-fortified plant-based alternatives may thus pose micronutrient displacement in populations withsuboptimal dietary intake. These high-risk subgroups include those with restricted income andgeographical access to food, such as in indigenous Australians [71,72] and rural/remote residents [73].For example, inadequate zinc intake has been reported in these high-risk groups [74], which can leadto impairments in immunity and cognitive development even at mild levels [75]. Similarly, althoughthe iodine status of Australians has generally improved following the mandatory use of iodised saltin flour for bread making [76], disparities in intake still exist between populations [72,73]. Iodine isimperative in thyroid hormone production and neurodevelopment, and its deficiency is a risk factor formental impairment and birth defects [77]. In the current analysis, we were unable to identify productsfortified with iodine apart from one product, indicating that there is only endogenous iodine presentfrom the characterising ingredient. Low endogenous iodine levels in non-fortified products werepoignantly highlighted in a study of products available in the UK [78]. However, the Australian case islikely associated with a previous public health issue in 2008, where numerous consumers had reportedthyroid dysfunction associated with soy milk enriched with seaweed as a source of iodine [79].
Nutrients 2020, 12, 1254 10 of 18
Dairy food consumption during childhood and adolescence has been linked to increased bonedensity in adulthood [80], while effectively helping to decrease bone loss in pre- and post-menopausalwomen [40]. Results of our dietary modelling highlighted that by substituting cow’s milk with someplant-based beverages in these age groups, the intake of some bone-health promoting nutrients,including protein, calcium and zinc, could be reduced. This is a disconcerting discovery, as consumersreportedly perceive plant-based milk alternatives to be mineral-rich and good for bones [5,6,81].The benefits derived from cow’s milk are likely attributable to the complex interactions betweennutrients that synergistically promote bone and muscle anabolism, rather than solely as a sourceof essential minerals in bone formation itself [82], for example, calcium and Vitamin D. Duringstages of growth, the accrual of bone density is closely correlated with muscle mass [83], and musclecontraction is involved in maintaining bone density throughout life. Inadequate consumption ofprotein, calcium, zinc and possibly other nutrients, when substituting plant-derived products, maybeconcerning in relation to both muscle and bone mass accrual in vulnerable age groups. Given thatAustralians currently obtain 7.1% of their protein intake from dairy foods [84], substitution withplant-derived proteins, even at the same quantity, may impact anabolic effects compared to thosederived from animal sources [85,86]; however, these dietary components may be made up fromother foods provided within the whole diet. Furthermore, plant-based milk alternatives may belimited in certain amino acids compared to bovine milk, which has a high biological value. In olderwomen, where musculoskeletal aging is characterised by progressive, elevated obligatory losses inmuscle and bone density [39,87], reduced calcium absorption efficiency may be more problematic [88].Insufficient dietary intake to meet increased physiological demands can thus pose significant risks tothe development of osteosarcopenia (co-occurrence of osteoporosis and sarcopenia), a chronic geriatricsyndrome associated with increased mortality and morbidity [89,90], particularly as overall energyneeds are lower at this stage of life. As specific health-promoting features of cow’s milk begin tounravel, they can be applied to plant milk matrices in the design of more nutritionally comparablesubstitutes for these consumers. Examples include the prospective role of cholecalciferol (vitamin D),medium-chain fatty acids and branched-chain amino acids in muscle anabolism [91–93].
Plant-based milk alternatives have long been designed to meet the needs of specialised populations,such as consumers avoiding lactose, saturated fats and cholesterol [94,95]. However, it is critical thatconsumers with pre-existing health conditions are made aware of the limitations associated withsubstitution. For example, nut-based beverages have minimal protein but are a source of phosphorousdue to the natural occurrence in addition to as a food additive. The presence of highly bioavailablephosphate additives, as well as the high phosphorous-to-protein ratio, may not be ideal in the dietsof individuals with chronic renal disease [96,97], a condition affecting 1.7 million Australians [98].While grain-based milks, such as from rice, have been demonstrated to have a high glycaemic indexdue to enzymatic hydrolysis during production [99], making these products potentially unsuitablefor diabetics. In previous studies, the lower energy and fat content relative to cow’s milk have beenfound to be triggers for plant milk consumption [6,81]. Indeed, we found some beverages to havelow approximate solids content, which likely translated to lower energy, but potentially at the costof reduced satiety relative to cow’s milk. This could lead to unwarranted energy compensation withdiscretionary foods [100], a finding previously observed in Australian young adults with poor calciumintake [101].
Fortification appears to be a promising strategy to mitigate the limitations in the micronutrientcomposition of plant-based milks, which we have in this range of products. However, food matrixinteractions should be systematically studied to augment the concentrations of these nutrients, notablyto levels present in cow’s milk. In cow’s milk, many micronutrients are present in a delivery matrixthat is bioavailable during human digestion [21,102], in contrast to plant-derived matrices [103].For example, the plant-based milk alternatives in our study predominantly contained comparableconcentrations of calcium to cow’s milk, but the bioavailability of this calcium is not well understood.Minerals, such as calcium, possess a maximum concentration in which it stays soluble in a liquid
Nutrients 2020, 12, 1254 11 of 18
medium, which is important for intestinal absorption as the excess tends to form non-bioaccessibleprecipitates. However, calcium concentrations in cow’s milk can exceed its maximum solubility due totheir sequestration in casein phosphopeptides, a micellar protein absent in non-dairy products [104].The high concentrations of calcium from milk can thus remain soluble during digestion for uptake,being progressively released for absorption as the casein slowly hydrolyses [105]. Plant-based milks,which provide varying food matrices, may not provide this advantage. Nascent investigations in vitrohave displayed broad disparity in the levels of bioaccessible calcium found in fortified plant-basedmilks from rice, cashew, almond, peanut, coconut, oat and soy, likely due to the various types offortificants used and the presence of inhibitory compounds [106–108]. Early isotope human studiesdemonstrated that soy milk fortified with calcium carbonate led to similar absorption levels fromcow’s milk, although this was lower when tricalcium phosphate was used [109]. This demonstratesthat bioavailability is likely dependent on both the food matrix and the type of fortificants used.Although no other human studies have been conducted on plant-based milk matrices, to the best ofour knowledge, a recent rodent study showed that supplementation with bovine or soy milk led topositive effects on bone health, while consumption of an almond beverage led to detrimental effectsdespite containing the equivalence of calcium [110]. These preliminary findings highlight the need forfurther evaluations of different plant matrices that, in combination with suitable fortificants, provideefficient, bioavailable delivery of key nutrients.
A series of approaches can be exploited by food technologists to compensate for some nutritionallimitations identified in our study. This is particularly vital for milks, such as coconut, in our study,which was the least nutritionally adequate plant-based milk alternative, containing significantlyless zinc, phosphorous, vitamin A, B2, B12 and iodine compared with cow’s milk. In addition tofortification, microbial synthesis of plant-based milks can effectively acquire selected B-group vitaminsand, principally, in the chemically unbound form where high bioavailability is anticipated [111,112].As examples, fermentation of soy by Rhizopus spp. and wheat by Lactococcus spp. has been shown toproduce a minimum two-fold increase in riboflavin [113,114]; while many strains of genus Lactobacillihave been identified as cobalamin producers [115]. To address low levels of lipophilic nutrients, such asvitamin A, encapsulation using lipid-based nano-emulsions has been demonstrated to be bioavailabledelivery systems [116,117]. Such an approach allows retinols and carotenoids to be solubilised in thesame manner as they occur in the dairy lipid fraction [57]. Proteins are generally lower in plant-basedmilks, with crude nuts, seeds, grains and legumes, and possess limiting amino acid profiles, as well asrestricted digestibility [118,119]. This can be ameliorated by complementing plant protein varieties toachieve a balanced amino acid profile [120], attempts of which we observed in the ‘mixed’ category ofour study.
Our cross-sectional evaluation was the first to be exclusively conducted on plant-based milkalternatives in Australia, a growing segment of the market with rising positive perception over theirputative health and ecological benefits. Although we attempted to capture the litany of productsavailable to Australian consumers, including those found in cafes, it would be worthwhile monitoringthis product segment for new products or line extensions as it might have implications for theway such products are named and regulated. This study was limited by the use of predominantlymanufacturer-supplied information and modelling, the accuracy of which could be validated in futureby independent laboratory analyses. It is also likely that values of phosphorous were underestimatedby modelling due to its frequent presence as a food additive (e.g. as dipotassium phosphate,pyrophosphates and phosphoric acid).
5. Conclusions
This cross-sectional survey of plant-based milk alternatives found substantial variability in thenutritional content of plant-based milk alternatives compared with cow’s milk, supporting previousworks from other geographical locations. Based on the nutrients we examined, legume-based (peaand soy) milks were the most nutritionally sound when compared to other varieties. In the absence of

Nutrients 2020, 12, 1254 12 of 18
mandatory fortification, prudent consumer selection of appropriately formulated products, regardlessof the ingredient categories, is vital to avoid potential issues with reduced nutrient intake associatedwith substitution of cow’s milk. This includes not only nutritional inadequacies commensurate tolower intake and/or bioavailability but also the casual consequences linked to displacement of dietaryenergy. Due to the high proportion of consumers selecting plant-based milk alternatives for non-dietaryreasons, it is recommended that current legislations implement further advisory labelling, particularlyfor older women and adolescents. Additional formulations should target these age groups, takinginto account protein content and quality, among adequate quantities of micronutrients, such as zincand calcium. Nonetheless, in an age of plant substitution over animal products, prospective gapsin the nutritional value of plant-based milk alternatives must not be overlooked, particularly wherebioavailability remains equivocal.
Author Contributions: Conceptualization and methodology, Y.Y.Z and S.G.; data collection and validation, Y.Y.Z.and J.H.; formal analysis, Y.Y.Z; writing—original draft preparation, Y.Y.Z.; writing—review and editing, S.G. andJ.H. All authors have read and agreed to the published version of the manuscript.
Funding: This research received no external funding but was supported by the Grains and Legumes NutritionCouncil, a non-profit charity. Y.Y.Z. is a recipient of CSIRO Postgraduate Scholarship and Melbourne ResearchScholarship at the University of Melbourne.
Conflicts of Interest: S.G. and J.H. are employed by the Grains and Legumes Nutrition Council, anot-for-profit charity.
Appendix A
Table A1. List of ingredients’ accession numbers used for modelling from the Australian FoodComposition Database.
Ingredient Number
F006081 Nut, almond, with skin, raw, unsaltedF006088 Nut, cashew, raw, unsaltedF006099 Nut, macadamia, raw, unsaltedF006098 Nut, hazelnut, raw, unsaltedF004002 Flour, soyaF002982 Coconut, cream, regular fatF002991 Coconut, milk, canned, regular fatF003998 Flour, riceF006136 Oats, hulled, uncookedF007598 Quinoa, uncookedF008209 Seed, chia, driedF005638 Milk, cow, fluid, skim (0.15% fat), added milk solidsF005637 Milk, cow, fluid, skim (0.15% fat)F005598 Milk, cow, fluid, lactose-free, reduced-fat (1% fat)F005614 Milk, cow, fluid, reduced-fat (1% fat)F005621 Milk, cow, fluid, reduced-fat (1.5% fat), added omega 3 polyunsaturatesF005599 Milk, cow, fluid, lactose-free, regular fat (3.5% fat)F005634 Milk, cow, fluid, regular fat (3.5% fat)12012 1 Seeds, hemp seed, hulled1 Values for hemp were derived from the USDA Food database due to lack of availability.
References
1. Evershed, R.P.; Payne, S.; Sherratt, A.G.; Copley, M.S.; Coolidge, J.; Urem-Kotsu, D.; Kotsakis, K.; Özdogan, M.;Özdogan, A.E.; Nieuwenhuyse, O.; et al. Earliest date for milk use in the Near East and southeastern Europelinked to cattle herding. Nature 2008, 455, 528–531. [CrossRef]
2. Muehlhoff, E.; Bennett, A.; McMahon, D. Milk and Dairy Products in Human Nutrition; Food and AgricultureOrganization of the United Nations (FAO): Rome, Italy, 2013.
3. Mylan, J.; Morris, C.; Beech, E.; Geels, F.W. Rage against the regime: Niche-regime interactions in the societalembedding of plant-based milk. Environ. Innov. Soc. Transit. 2019, 31, 233–247. [CrossRef]
Nutrients 2020, 12, 1254 13 of 18
4. IBISWorld. Soy and Almond Milk Production in Australia—Market Research Report; IBISWorld Pty Ltd.: Canberra,Australia, 2020.
5. McCarthy, K.S.; Parker, M.; Ameerally, A.; Drake, S.L.; Drake, M.A. Drivers of choice for fluid milk versusplant-based alternatives: What are consumer perceptions of fluid milk? J. Dairy Sci. 2017, 100, 6125–6138.[CrossRef] [PubMed]
6. Haas, R.; Schnepps, A.; Pichler, A.; Meixner, O. Cow Milk versus Plant-Based Milk Substitutes: A Comparisonof Product Image and Motivational Structure of Consumption. Sustainability 2019, 11, 5046. [CrossRef]
7. Abbring, S.; Hols, G.; Garssen, J.; van Esch, B.C.A.M. Raw cow’s milk consumption and allergic diseases—Thepotential role of bioactive whey proteins. Eur. J. Pharmacol. 2019, 843, 55–65. [CrossRef] [PubMed]
8. Hodges, J.K.; Cao, S.; Cladis, D.P.; Weaver, C.M. Lactose intolerance and bone health: The challenge ofensuring adequate calcium intake. Nutrients 2019, 11, 718. [CrossRef] [PubMed]
9. Rizzo, G.; Laganà, S.A.; Rapisarda, M.A.; La Ferrera, M.G.; Buscema, M.; Rossetti, P.; Nigro, A.; Muscia, V.;Valenti, G.; Sapia, F.; et al. Vitamin B12 among Vegetarians: Status, Assessment and Supplementation.Nutrients 2016, 8, 767. [CrossRef] [PubMed]
10. Curtain, F.; Grafenauer, S. Plant-Based Meat Substitutes in the Flexitarian Age: An Audit of Products onSupermarket Shelves. Nutrients 2019, 11, 2603. [CrossRef]
11. Tsakiridou, E.; Tsakiridou, H.; Mattas, K.; Arvaniti, E. Effects of animal welfare standards on consumers’food choices. Acta Agric. Scand. Sect. C Food Econ. 2010, 7, 234–244. [CrossRef]
12. Holden, L.A. Understanding the environmental impact of global dairy production. J. Anim. Sci. 2020, 98.[CrossRef]
13. Ritchie, H.; Reay, D.S.; Higgins, P. The impact of global dietary guidelines on climate change. Glob. Environ.Chang. 2018, 49, 46–55. [CrossRef]
14. National Dairy Council. Consumer Perceptions of Dairy milk and Plant-Based Milk Alternatives; Vermont GeneralAssembly: Montpelier, Vermont, 2018.
15. McClements, D.J.; Newman, E.; McClements, I.F. Plant-based Milks: A Review of the Science UnderpinningTheir Design, Fabrication, and Performance. Compr. Rev. Food Sci. Food Saf. 2019, 18, 2047–2067. [CrossRef]
16. Poore, J.; Nemecek, T. Reducing food’s environmental impacts through producers and consumers. Science2018, 360, 987–992. [CrossRef] [PubMed]
17. Grant, C.A.; Hicks, A.L. Comparative Life Cycle Assessment of Milk and Plant-Based Alternatives. Environ.Eng. Sci. 2018, 35, 1235–1247. [CrossRef]
18. Wenzel, P.; Jungbluth, N. The Environmental Impact of Vegan Drinks Compared to Whole Milk; ESU-Services Ltd.:Schaffhausen, Switzerland, 2017.
19. Gazan, R.; Brouzes, C.M.C.; Vieux, F.; Maillot, M.; Lluch, A.; Darmon, N. Mathematical Optimization toExplore Tomorrow’s Sustainable Diets: A Narrative Review. Adv. Nutr. 2018, 9, 602–616. [CrossRef]
20. Perignon, M.; Sinfort, C.; El Ati, J.; Traissac, P.; Drogué, S.; Darmon, N.; Amiot, M.-J.; Amiot, M.J.; Achir, N.;Alouane, L.; et al. How to meet nutritional recommendations and reduce diet environmental impact in theMediterranean region? An optimization study to identify more sustainable diets in Tunisia. Glob. Food Secur.2019, 23, 227–235. [CrossRef]
21. Shingfield, K.J.; Chilliard, Y.; Toivonen, V.; Kairenius, P.; Givens, D.I. Trans fatty acids and bioactive lipids inruminant milk. In Bioactive Components of Milk; Springer: New York, NY, USA, 2008; pp. 3–65.
22. Australian Bureau of Statistics. 4364.0.55.007-National Nutrition and Physical Activity Survey, 2011–2012.Available online: https://www.abs.gov.au/ausstats/[email protected]/Lookup/by%20Subject/4364.0.55.012~2011-12~Main%20Features~Key%20Findings~1 (accessed on 5 January 2020).
23. Dairy Australia. Consumption Summary. Available online: https://www.dairyaustralia.com.au/industry/
production-and-sales/consumption-summary (accessed on 22 February 2020).24. Bureau of Statistics. 4364.0.55.008-Australian Health Survey: Usual Nutrient Intakes, 2011–2012. Available
online: https://www.abs.gov.au/ausstats/[email protected]/mf/4364.0.55.008 (accessed on 6 November 2019).25. Auclair, O.; Han, Y.; Burgos, S.A. Consumption of Milk and Alternatives and Their Contribution to Nutrient
Intakes among Canadian Adults: Evidence from the 2015 Canadian Community Health Survey—Nutrition.Nutrients 2019, 11, 1948. [CrossRef]
26. Saito, A.; Okada, E.; Tarui, I.; Matsumoto, M.; Takimoto, H. The Association between Milk and Dairy ProductsConsumption and Nutrient Intake Adequacy among Japanese Adults: Analysis of the 2016 National Healthand Nutrition Survey. Nutrients 2019, 11, 2361. [CrossRef]

Nutrients 2020, 12, 1254 14 of 18
27. Murphy, M.M.; Douglass, J.S.; Johnson, R.K.; Spence, L.A. Drinking flavored or plain milk is positivelyassociated with nutrient intake and is not associated with adverse effects on weight status in US childrenand adolescents. J. Am. Diet. Assoc. 2008, 108, 631–639. [CrossRef]
28. Fayet, F.; Ridges, L.A.; Wright, J.K.; Petocz, P. Australian children who drink milk (plain or flavored) havehigher milk and micronutrient intakes but similar body mass index to those who do not drink milk. Nutr.Res. 2013, 33, 95–102. [CrossRef]
29. Cifelli, C.J.; Houchins, J.A.; Demmer, E.; Fulgoni, V.L. Increasing plant based foods or dairy foods differentiallyaffects nutrient intakes: Dietary scenarios using NHANES 2007–2010. Nutrients 2016, 8, 422. [CrossRef][PubMed]
30. Parker, C.E.; Vivian, W.J.; Oddy, W.H.; Beilin, L.J.; Mori, T.A.; O’Sullivan, T.A. Changes in dairy food andnutrient intakes in Australian adolescents. Nutrients 2012, 4, 1794–1811. [CrossRef] [PubMed]
31. Rangan, A.M.; Flood, V.M.; Denyer, G.; Webb, K.; Marks, G.B.; Gill, T.P. Dairy consumption and diet qualityin a sample of Australian children. J. Am. Coll. Nutr. 2012, 31, 185–193. [CrossRef] [PubMed]
32. Meyer, S.B.; Coveney, J.; Henderson, J.; Ward, P.R.; Taylor, A.W. Reconnecting Australian consumers andproducers: Identifying problems of distrust. Food Policy 2012, 37, 634–640. [CrossRef]
33. Jacobs, E.T.; Foote, J.A.; Kohler, L.N.; Skiba, M.B.; Thomson, C.A. Re-examination of dairy as a singlecommodity in US dietary guidance. Nutr. Rev. 2020, 78, 225–234. [CrossRef]
34. Seo, H.-J.; Cho, Y.-E.; Kim, T.; Shin, H.-I.; Kwun, I.-S. Zinc may increase bone formation through stimulatingcell proliferation, alkaline phosphatase activity and collagen synthesis in osteoblastic MC3T3-E1 cells. Nutr.Res. Pract. 2010, 4, 356–361. [CrossRef]
35. Allgrove, J. Physiology of calcium, phosphate, magnesium and vitamin D. In Calcium and Bone Disorders inChildren and Adolescents; Karger Publishers: Basel, Switzerland, 2015; Volume 28, pp. 7–32.
36. Baroncelli, G.I.; Bertelloni, S.; Sodini, F.; Saggese, G. Osteoporosis in Children and Adolescents. PediatricDrugs 2005, 7, 295–323. [CrossRef]
37. Unni, J.; Garg, R.; Pawar, R. Bone mineral density in women above 40 years. J. Midlife Health 2010, 1, 19–22.[CrossRef]
38. Demontiero, O.; Vidal, C.; Duque, G. Aging and bone loss: New insights for the clinician. Ther. Adv.Musculoskelet Dis. 2012, 4, 61–76. [CrossRef]
39. Rizzoli, R.; Bischoff-Ferrari, H.; Dawson-Hughes, B.; Weaver, C. Nutrition and bone health in women afterthe menopause. Women’s Health 2014, 10, 599–608. [CrossRef]
40. Ji, M.-X.; Yu, Q. Primary osteoporosis in postmenopausal women. Chronic Dis. Transl. Med. 2015, 1, 9–13.[CrossRef]
41. Food Standards Australia New Zealand. Plant-based Milk Alternatives. Available online: https://www.foodstandards.gov.au/consumer/nutrition/milkaltern/Pages/default.aspx (accessed on 20 February 2020).
42. Scholz-Ahrens, K.E.; Ahrens, F.; Barth, C.A. Nutritional and health attributes of milk and milk imitations.Eur. J. Nutr. 2019, 59, 1–16. [CrossRef] [PubMed]
43. Chalupa-Krebzdak, S.; Long, C.J.; Bohrer, B.M. Nutrient density and nutritional value of milk and plant-basedmilk alternatives. Int. Dairy J. 2018, 87, 84–92. [CrossRef]
44. Singhal, S.; Baker, R.D.; Baker, S.S. A Comparison of the Nutritional Value of Cow’s Milk and NondairyBeverages. J. Pediatric Gastroenterol. Nutr. 2017, 64, 799–805. [CrossRef] [PubMed]
45. Paul, A.A.; Kumar, S.; Kumar, V.; Sharma, R. Milk Analog: Plant based alternatives to conventional milk,production, potential and health concerns. Crit. Rev. Food Sci. Nutr. 2019, 16, 1–19. [CrossRef] [PubMed]
46. Sethi, S.; Tyagi, S.K.; Anurag, R.K. Plant-based milk alternatives an emerging segment of functional beverages:A review. J. Food Sci. Technol. 2016, 53, 3408–3423. [CrossRef]
47. Jeske, S.; Zannini, E.; Arendt, E.K. Past, present and future: The strength of plant-based dairy substitutesbased on gluten-free raw materials. Food Res. Int. 2018, 110, 42–51. [CrossRef]
48. Food Standards Australia New Zealand. Voluntary Addition of Vitamins & Minerals to Nut-andSeed-Based Beverages. Available online: https://www.foodstandards.gov.au/code/applications/Pages/A1104-VitsMinsNutSeedBevs.aspx (accessed on 6 January 2020).
49. Banwell, C.; Broom, D.; Davies, A.; Dixon, J. How Convenience Is Shaping Australian Diets: The DisappearingDessert. In Weight of Modernity: An Intergenerational Study of the Rise of Obesity; Springer: Dordrecht, TheNetherlands, 2012; pp. 41–58. [CrossRef]

Nutrients 2020, 12, 1254 15 of 18
50. Shaw, M.; Nugent, A.P.; McNulty, B.A.; Walton, J.; McHugh, M.; Kane, A.; Heslin, A.M.; Morrissey, E.;Mullan, K.; Woodside, J.V. What is the availability of iodised salt in supermarkets on the Island of Ireland?Eur. J. Clin. Nutr. 2019, 73, 1636–1638. [CrossRef]
51. National Health and Medical Research Council, New Zealand Ministry of Health. Nutrient Reference Valuesfor Australia and New Zealand; National Health and Medical Research Council: Canberra, Australia, 2017.
52. Curtain, F.; Grafenauer, S. Comprehensive nutrition review of grain-based muesli bars in Australia: An auditof supermarket products. Foods 2019, 8, 370. [CrossRef]
53. Roy Morgan. Woolworths and Aldi Grow Grocery Market Share in 2018–2019. Available online: http://www.roymorgan.com/findings/7936-australian-grocery-market-december-2018-201904050426 (accessed on2 February 2020).
54. Food Standards Australia New Zealand. Application of Discretionary Foods Flag. Available online: https://www.foodstandards.gov.au/science/monitoringnutrients/australianhealthsurveyandaustraliandietaryguidelines/applicationofdiscretionary/Pages/default.aspx (accessed on 2 February 2020).
55. Food Standards Australia New Zealand. Australian Food Composition Database. Available online: https://www.foodstandards.gov.au/science/monitoringnutrients/afcd/Pages/default.aspx (accessed on 2 February 2020).
56. Food Standards Australia New Zealand. User Guide to Standard 1.2.8—Nutrition Information Requirements.Available online: https://www.foodstandards.gov.au/code/userguide/Documents/Userguide_Prescribed%20Nutrition%20Information%20Nov%2013%20Dec%202013.pdf (accessed on 2 February 2020).
57. Baldi, A.; Pinotti, L. Lipophilic microconstituents of milk. In Bioactive Components of Milk; Springer: NewYork, NY, USA, 2008; pp. 109–125.
58. Food Standards Australia New Zealand. Definitions used throughout the Code. In Standard 1.1.2, FoodStandards Code Australia New Zealand. Available online: https://www.legislation.gov.au/Details/F2015L00385/
Explanatory%20Statement/Text (accessed on 28 April 2020).59. Burton, N.W.; Brown, W.; Dobson, A. Accuracy of body mass index estimated from self-reported height and
weight in mid-aged Australian women. Aust. N. Z. J. Public Health 2010, 34, 620–623. [CrossRef]60. Boehm, J.; Franklin, R.C.; Newitt, R.; McFarlane, K.; Grant, T.; Kurkowski, B. Barriers and motivators to
exercise for older adults: A focus on those living in rural and remote areas of Australia. Aust. J. Rural Health2013, 21, 141–149. [CrossRef] [PubMed]
61. Hill, R.L.; Brown, W.J. Older Australians and physical activity levels: Do we know how many are meetingguidelines? Australas. J. Ageing 2012, 31, 208–217. [CrossRef] [PubMed]
62. Breda, J.; Jewell, J.; Keller, A. The importance of the World Health Organization sugar guidelines for dentalhealth and obesity prevention. Caries Res. 2019, 53, 149–152. [CrossRef] [PubMed]
63. Bernat, N.; Cháfer, M.; Chiralt, A.; González-Martinez, C. Vegetable milks and their fermented derivativeproducts. Int. J. Food Stud. 2014, 3, 93–124. [CrossRef]
64. Sousa, A.; Kopf-Bolanz, K. Nutritional implications of an increasing consumption of non-dairy plant-basedbeverages instead of cow’s milk in Switzerland. J. Adv. Dairy Res. 2017, 5, 2. [CrossRef]
65. Vanga, S.K.; Raghavan, V. How well do plant based alternatives fare nutritionally compared to cow’s milk? J.Food Sci. Technol. 2018, 55, 10–20. [CrossRef]
66. Pistollato, F.; Sumalla Cano, S.; Elio, I.; Masias Vergara, M.; Giampieri, F.; Battino, M. Plant-based andplant-rich diet patterns during gestation: Beneficial effects and possible shortcomings. Adv. Nutr. 2015, 6,581–591. [CrossRef]
67. Slagman, A.; Harriss, L.; Campbell, S.; Muller, R.; McDermott, R. Folic acid deficiency declined substantiallyafter introduction of the mandatory fortification programme in Queensland, Australia: A secondary healthdata analysis. Public Health Nutr. 2019, 22, 3426–3434. [CrossRef]
68. Gallagher, C.M.; Black, L.J.; Oddy, W.H. Micronutrient intakes from food and supplements in Australianadolescents. Nutrients 2014, 6, 342–354. [CrossRef]
69. Chiu, M.; Dillon, A.; Watson, S. Vitamin A deficiency and xerophthalmia in children of a developed country.J. Paediatr. Child Health 2016, 52, 699–703. [CrossRef]
70. Gallegos, D.; Booth, S.; Kleve, S.; McKenchie, R.; Lindberg, R. Food insecurity in Australian households:From charity to entitlement. In A Sociology of Food and Nutrition: The Social Appetite; Oxford University Press:Oxford, UK, 2017; pp. 55–74.
Nutrients 2020, 12, 1254 16 of 18
71. Gwynn, J.; Sim, K.; Searle, T.; Senior, A.; Lee, A.; Brimblecombe, J. Effect of nutrition interventions ondiet-related and health outcomes of Aboriginal and Torres Strait Islander Australians: A systematic review.BMJ Open 2019, 9, e025291. [CrossRef] [PubMed]
72. Singh, G.R.; Davison, B.; Ma, G.Y.; Eastman, C.J.; Mackerras, D.E. Iodine status of Indigenous andnon-Indigenous young adults in the Top End, before and after mandatory fortification. Med J. Aust. 2019,210, 121–125. [CrossRef] [PubMed]
73. Charlton, K.; Probst, Y.; Kiene, G. Dietary Iodine Intake of the Australian Population after Introduction of aMandatory Iodine Fortification Programme. Nutrients 2016, 8, 701. [CrossRef] [PubMed]
74. Gibson, R.; Heath, A.-L. Population groups at risk of zinc deficiency in Australia and New Zealand. Nutr.Diet. 2011, 68, 97–108. [CrossRef]
75. Rosado, J.; Caamano, M.; Montoya, Y.; de Lourdes Solano, M.; Santos, J.; Long, K. Interaction of zinc orvitamin A supplementation and specific parasite infections on Mexican infants’ growth: A randomizedclinical trial. Eur. J. Clin. Nutr. 2009, 63, 1176–1184. [CrossRef]
76. Grafenauer, S.; Curtain, F. An audit of Australian bread with a focus on loaf breads and whole grain. Nutrients2018, 10, 1106. [CrossRef]
77. Bouga, M.; Lean, M.E.; Combet, E. Iodine and pregnancy—A qualitative study focusing on dietary guidanceand information. Nutrients 2018, 10, 408. [CrossRef]
78. Bath, S.C.; Hill, S.; Infante, H.G.; Elghul, S.; Nezianya, C.J.; Rayman, M.P. Iodine concentration ofmilk-alternative drinks available in the UK in comparison with cows’ milk. Br. J. Nutr. 2017, 118,525–532. [CrossRef]
79. Crawford, B.A.; Cowell, C.T.; Emder, P.J.; Learoyd, D.L.; Chua, E.L.; Sinn, J.; Jack, M.M. Iodine toxicity fromsoy milk and seaweed ingestion is associated with serious thyroid dysfunction. Med. J. Aust. 2010, 193,413–415. [CrossRef]
80. Kalkwarf, H.J.; Khoury, J.C.; Lanphear, B.P. Milk intake during childhood and adolescence, adult bonedensity, and osteoporotic fractures in US women. Am. J. Clin. Nutr. 2003, 77, 257–265. [CrossRef]
81. Bus, A.; Worsley, A. Consumers’ sensory and nutritional perceptions of three types of milk. Public HealthNutr. 2003, 6, 201–208. [CrossRef] [PubMed]
82. Burrow, K.; Young, W.; McConnell, M.; Carne, A.; Bekhit, A.E.-D. Do Dairy Minerals Have a Positive Effecton Bone Health? Compr. Rev. Food Sci. Food Saf. 2018, 17, 989–1005. [CrossRef]
83. Dawson, A.; Dennison, E. Measuring the musculoskeletal aging phenotype. Maturitas 2016, 93, 13–17.[CrossRef]
84. CSIRO. Protein Balance: New Concepts for Protein in Weight Management; Commonwealth Scientific andIndustrial Research Organisation: Canberra, Australia, 2018.
85. Berrazaga, I.; Micard, V.; Gueugneau, M.; Walrand, S. The Role of the Anabolic Properties of Plant- versusAnimal-Based Protein Sources in Supporting Muscle Mass Maintenance: A Critical Review. Nutrients 2019,11, 1825. [CrossRef]
86. van Vliet, S.; Burd, N.A.; van Loon, L.J. The skeletal muscle anabolic response to plant-versus animal-basedprotein consumption. J. Nutr. 2015, 145, 1981–1991. [CrossRef]
87. Nowson, C.; O’Connell, S. Protein requirements and recommendations for older people: A review. Nutrients2015, 7, 6874–6899. [CrossRef] [PubMed]
88. Nordin, B.C.; Need, A.G.; Morris, H.A.; O’Loughlin, P.D.; Horowitz, M. Effect of age on calcium absorptionin postmenopausal women. Am. J. Clin. Nutr. 2004, 80, 998–1002. [CrossRef]
89. Sepúlveda-Loyola, W.; Phu, S.; Bani Hassan, E.; Brennan-Olsen, S.L.; Zanker, J.; Vogrin, S.; Conzade, R.;Kirk, B.; Al Saedi, A.; Probst, V.; et al. The Joint Occurrence of Osteoporosis and Sarcopenia (Osteosarcopenia):Definitions and Characteristics. J. Am. Med Dir. Assoc. 2020, 21, 220–225. [CrossRef]
90. Reginster, J.-Y.; Beaudart, C.; Buckinx, F.; Bruyère, O. Osteoporosis and sarcopenia: Two diseases or one?Curr. Opin. Clin. Nutr. Metab. Care 2016, 19, 31–36. [CrossRef]
91. Abe, S.; Ezaki, O.; Suzuki, M. Medium-chain triglycerides (8: 0 and 10: 0) are promising nutrients forsarcopenia: A randomized controlled trial. Am. J. Clin. Nutr. 2019, 110, 652–665. [CrossRef]
92. Abe, S.; Ezaki, O.; Suzuki, M. Medium-Chain Triglycerides in Combination with Leucine and Vitamin DIncrease Muscle Strength and Function in Frail Elderly Adults in a Randomized Controlled Trial. The J. Nutr.2016, 146, 1017–1026. [CrossRef] [PubMed]

Nutrients 2020, 12, 1254 17 of 18
93. Fuchs, C.J.; Hermans, W.J.H.; Holwerda, A.M.; Smeets, J.S.J.; Senden, J.M.; van Kranenburg, J.; Gijsen, A.P.;Wodzig, W.K.H.W.; Schierbeek, H.; Verdijk, L.B.; et al. Branched-chain amino acid and branched-chainketoacid ingestion increases muscle protein synthesis rates in vivo in older adults: A double-blind,randomized trial. Am. J. Clin. Nutr. 2019, 110, 862–872. [CrossRef]
94. Gobbi, L.; Ciano, S.; Rapa, M.; Ruggieri, R. Biogenic Amines Determination in “Plant Milks”. Beverages 2019,5, 40. [CrossRef]
95. Schuster, M.J.; Wang, X.; Hawkins, T.; Painter, J.E. Comparison of the Nutrient Content of Cow’s Milk andNondairy Milk Alternatives: What’s the Difference? Nutr. Today 2018, 53, 153–159. [CrossRef]
96. Ritz, E.; Hahn, K.; Ketteler, M.; Kuhlmann, M.K.; Mann, J. Phosphate additives in food—A health risk. DtschArztebl. Int. 2012, 109, 49–55. [CrossRef]
97. D’Alessandro, C.; Piccoli, G.B.; Cupisti, A. The “phosphorus pyramid”: A visual tool for dietary phosphatemanagement in dialysis and CKD patients. BMC Nephrol. 2015, 16, 9. [CrossRef] [PubMed]
98. Australian Institute of Health Welfare. Chronic Kidney Disease; AIHW: Canberra, Australia, 2019.99. Jeske, S.; Zannini, E.; Arendt, E.K. Evaluation of physicochemical and glycaemic properties of commercial
plant-based milk substitutes. Plant Foods Hum. Nutr. 2017, 72, 26–33. [CrossRef] [PubMed]100. Grieger, J.A.; Johnson, B.J.; Wycherley, T.P.; Golley, R.K. Comparing the nutritional impact of dietary strategies
to reduce discretionary choice intake in the Australian adult population: A simulation modelling study.Nutrients 2017, 9, 442. [CrossRef]
101. Rouf, A.S.; Sui, Z.; Rangan, A.; Grech, A.; Allman-Farinelli, M. Low calcium intakes among Australianadolescents and young adults are associated with higher consumption of discretionary foods and beverages.Nutrition 2018, 55, 146–153. [CrossRef]
102. Fardet, A.; Dupont, D.; Rioux, L.-E.; Turgeon, S.L. Influence of food structure on dairy protein, lipid andcalcium bioavailability: A narrative review of evidence. Crit. Rev. Food Sci. Nutr. 2019, 59, 1987–2010.[CrossRef]
103. Platel, K.; Srinivasan, K. Bioavailability of Micronutrients from Plant Foods: An Update. Crit. Rev. Food Sci.Nutr. 2016, 56, 1608–1619. [CrossRef] [PubMed]
104. Lenton, S.; Nylander, T.; Teixeira, S.C.M.; Holt, C. A review of the biology of calcium phosphate sequestrationwith special reference to milk. Dairy Sci. Technol. 2015, 95, 3–14. [CrossRef] [PubMed]
105. Mulet-Cabero, A.-I.; Torcello-Gómez, A.; Saha, S.; Mackie, A.R.; Wilde, P.J.; Brodkorb, A. Impact of caseinsand whey proteins ratio and lipid content on in vitro digestion and ex vivo absorption. Food Chem. 2020.[CrossRef] [PubMed]
106. Grazielle Siqueira Silva, J.; Paula Rebellato, A.; Tamirys dos Santos Caramês, E.; Greiner, R.; Azevedo LimaPallone, J. In vitro digestion effect on mineral bioaccessibility and antioxidant bioactive compounds ofplant-based beverages. Food Res. Int. 2020. [CrossRef]
107. Theodoropoulos, V.C.T.; Turatti, M.A.; Greiner, R.; Macedo, G.A.; Pallone, J.A.L. Effect of enzymatic treatmenton phytate content and mineral bioacessability in soy drink. Food Res. Int. 2018, 108, 68–73. [CrossRef]
108. Lacerda Sanches, V.; Alves Peixoto, R.R.; Cadore, S. Phosphorus and zinc are less bioaccessible in soy-basedbeverages in comparison to bovine milk. J. Funct. Foods 2020, 65, 103728. [CrossRef]
109. Zhao, Y.; Martin, B.R.; Weaver, C.M. Calcium Bioavailability of Calcium Carbonate Fortified Soymilk IsEquivalent to Cow’s Milk in Young Women. J. Nutr. 2005, 135, 2379–2382. [CrossRef]
110. Cakebread, J.A.; Wallace, O.A.M.; Kruger, M.C.; Vickers, M.H.; Hodgkinson, A.J. Supplementation withBovine Milk or Soy Beverages Recovers Bone Mineralization in Young Growing Rats Fed an Insufficient Diet,in Contrast to an Almond Beverage. Curr. Dev. Nutr. 2019, 3. [CrossRef]
111. Rao, V.; Rao, L. Probiotics and Prebiotics in Human Nutrition and Health; IntechOpen: Rijeka, Croatia, 2016.112. Wallig, M.A.; Keenan, K.P. Chapter 36—Nutritional Toxicologic Pathology. In Haschek and Rousseaux’s
Handbook of Toxicologic Pathology, 3rd ed.; Haschek, W.M., Rousseaux, C.G., Wallig, M.A., Eds.; AcademicPress: Boston, MA, USA, 2013; pp. 1077–1121.
113. van der Riet, W.B.; Wight, A.W.; Cilliers, J.J.L.; Datel, J.M. Food chemical analysis of tempeh prepared fromSouth African-grown soybeans. Food Chem. 1987, 25, 197–206. [CrossRef]
114. LeBlanc, J.G.; Laiño, J.E.; del Valle, M.J.; Vannini, V.; van Sinderen, D.; Taranto, M.P.; de Valdez, G.F.; deGiori, G.S.; Sesma, F. B-Group vitamin production by lactic acid bacteria-current knowledge and potentialapplications. J. Appl. Microbiol. 2011, 111, 1297–1309. [CrossRef]
Nutrients 2020, 12, 1254 18 of 18
115. De Angelis, M.; Bottacini, F.; Fosso, B.; Kelleher, P.; Calasso, M.; Di Cagno, R.; Ventura, M.; Picardi, E.; vanSinderen, D.; Gobbetti, M. Lactobacillus rossiae, a vitamin B12 producer, represents a metabolically versatilespecies within the Genus Lactobacillus. PLoS ONE 2014, 9, e107232. [CrossRef] [PubMed]
116. Öztürk, B. Nanoemulsions for food fortification with lipophilic vitamins: Production challenges, stability,and bioavailability. Eur. J. Lipid Sci. Technol. 2017, 119, 1500539. [CrossRef]
117. Rovoli, M.; Pappas, I.; Lalas, S.; Gortzi, O.; Kontopidis, G. In vitro and in vivo assessment of vitamin Aencapsulation in a liposome–protein delivery system. J. Liposome Res. 2019, 29, 142–152. [CrossRef] [PubMed]
118. Joye, I. Protein digestibility of cereal products. Foods 2019, 8, 199. [CrossRef] [PubMed]119. Bessada, S.M.; Barreira, J.C.; Oliveira, M.B.P. Pulses and food security: Dietary protein, digestibility, bioactive
and functional properties. Trends Food Sci. Technol. 2019. [CrossRef]120. Sá, A.G.A.; Moreno, Y.M.F.; Carciofi, B.A.M. Food processing for the improvement of plant proteins
digestibility. Crit. Rev. Food Sci. Nutr. 2019, 1–20, Epub ahead of print.
© 2020 by the authors. Licensee MDPI, Basel, Switzerland. This article is an open accessarticle distributed under the terms and conditions of the Creative Commons Attribution(CC BY) license (http://creativecommons.org/licenses/by/4.0/).
Copyright © 2022 FDOKUMEN