Golf Study Final Report - Ramsey County
552
Keller Golf Course The Ponds at Battle Creek Manitou Ridge Island Lake Golf Course Goodrich Golf Course Goodrich Golf Dome Golf Study Final Report For Presented to: Sara Ackmann Director of Operations – Arenas and Golf Courses Parks and Recreation Department Ramsey County Presented by Columbus, Georgia * Dallas, Texas * Detroit, Michigan January 15, 2019
-
Upload
khangminh22 -
Category
Documents
-
view
1 -
download
0
Transcript of Golf Study Final Report - Ramsey County
Keller Golf Course
The Ponds at Battle Creek
Manitou Ridge
Island Lake Golf Course
Goodrich Golf Course
Goodrich Golf Dome
Golf Study
Final Report
For
Presented to:
Sara Ackmann Director of Operations – Arenas and Golf Courses
Parks and Recreation Department Ramsey County
Presented by
Columbus, Georgia * Dallas, Texas * Detroit, Michigan
January 15, 2019

Ramsey County Golf Study Table of Contents
Sirius Golf Advisors, LLC i
Table of Contents Executive Summary 1
Philosophical Direction 1
Overview 2
Note of Appreciation 3
Improving Profitability 3
Current Situation 4
Market Conditions 4
Performance 5
Management 6
Customer Feedback 6
Impediments to Profitability - Major Issues 7
Philosophical Direction 7
Deteriorating Infrastructure 8
Market Overlap 8
Operator Contracts 8
Marketing 9
Pricing Policy 9
Keller’s Food and Beverage Operation 9
Manitou’s Decline 10
Battle Creek 10
Neglected Markets 10
Improving Profitability - Major Recommendations 11
Diversify Market Placement 11
Operator Contracts 11
Marketing 12
Pricing Policy 13
Keller 13
Manitou 13
Battle Creek 13
Recommended Capital Improvements 14
Keller 14
Manitou 14
Goodrich 15
Battle Creek 15

Ramsey County Golf Study Table of Contents
Sirius Golf Advisors, LLC ii
Projections 16
Keller 16
Manitou 17
Goodrich 18
Battle Creek 19
Discussion 20
Introduction 24
Procedure 25
Overview 25
Market Conditions 27
National Trends 27
Participation 27
Rounds 30
Number of Facilities 30
Renovations 33
Key Trends in Demand 34
Other Measures of Health 34
Municipal Golf 35
Conclusion 35
Demographic Profiles 36
Market Definition 36
Neighborhood Markets 36
Local Area Markets 37
Regional Area Markets 38
Golf Demand 38
Neighborhood Golf Demand 39
Local Golf Demand 40
Latent Demand 40
Other Demand Drivers 41
Supply and Demand 41
Local Golf Supply 42
Golf Course Market Supply / Demand Summary 42
Supply vs. Demand 43
Rounds Predictions 44
Take-Aways 44
Competition 46

Ramsey County Golf Study Table of Contents
Sirius Golf Advisors, LLC iii
The Psychology of Golf 46
Overall Market 47
Course Closings 47
Local Market 48
18-Hole Regulation Courses 51
Characteristics 52
Fees 55
Performance 59
Price Point Comparisons 60
Food & Beverage 61
Alternative Courses 63
9-Hole Regulation 63
Executive Courses 63
Par 3 Courses 63
Ratings 64
Impact of Renovations 64
Takeaways 65
Performance 66
Cash Flow 66
Rounds 68
Revenue 69
Other Golf Revenue 70
Green Fees 72
Other Revenue Sources 76
County Expenses 77
Course Maintenance 80
Operating Expenses 80
Takeaways 81
Customer Feedback 82
Demographics 82
Customer Origin 83
Overall Satisfaction 83
Loyalty Index 84
Individual Factors 85
Keller 86
Goodrich 86
Ramsey County Golf Study Table of Contents
Sirius Golf Advisors, LLC iv
Battle Creek 87
Manitou 87
Loyalty Driver 88
Keller 89
Goodrich 90
Battle Creek 91
Manitou 91
Loyalty Factor Influence Comparison 92
Customer Profile 95
Spending and Wallet Share 95
Rounds Played 95
Gender 96
Age 100
Customer Segment 102
Like Most 109
Needs Improvement 110
Custom Questions 112
Bunkers 113
Beverage Cart Service 113
Booking On-line 113
Choosing Where to Play 114
Lessons 115
Preferred Tees 116
Mobile Aps 117
On Line Content 117
Marketing Efforts 119
Keller 120
Satisfaction Measures 120
Competition 120
Goodrich 121
Satisfaction Measures 121
Competition 122
Custom Questions 123
Battle Creek 123
Satisfaction Measures 123
Competition 124

Ramsey County Golf Study Table of Contents
Sirius Golf Advisors, LLC v
Custom Questions 124
Manitou 125
Satisfaction Measures 125
Competition 126
Custom Questions 126
Golf Dome 127
Demographics 128
Customer Origin 128
Agronomic Practices 129
General Findings 129
Keller Golf Course - Existing 129
Greens 129
Tees 130
Bunkers 131
Fairways 131
Rough 131
Trees 131
Equipment 132
Staff 132
Relationship with the golf shop staff 132
Budgets 132
Superintendent Qualifications 132
Manitou Ridge Golf Course 132
History 132
Greens 133
Tees 134
Bunkers 134
Fairways 134
Rough 134
Practice Areas 135
Equipment 135
Cultural Practices 135
Staff 135
Relationship with the golf shop staff – 135
Budgets 136
Goodrich Golf Course 136

Ramsey County Golf Study Table of Contents
Sirius Golf Advisors, LLC vi
Course History 136
Greens 136
Tees 137
Bunkers 137
Fairways 138
Rough 138
Practice Areas 138
Equipment – 138
Cultural Practices – 138
Staff 138
Relationship with the golf shop staff 139
Budgets 139
Superintendent Qualifications – 139
Ponds at Battle Lake Golf Course 139
Course Description 139
Play Levels 139
Routing Issues 139
Feature Design 139
Infrastructure 140
Greens 140
Tees 140
Bunkers 140
Fairways 141
Rough 141
Trees affecting turf 141
Equipment 141
Cultural Practices – 141
Staff 142
Relationship with the golf shop staff 142
Budgets 142
Superintendent Qualifications 142
Rough Mowing 142
Infrastructure 142
Irrigation System Analysis 144
Keller Golf Course 144
History 144
Ramsey County Golf Study Table of Contents
Sirius Golf Advisors, LLC vii
Pump station 144
Piping and hydraulics 145
Central/Satellite Control System 145
Sprinkler Coverage 146
Complete Summary of Irrigation Findings 146
Manitou Ridge 147
History 147
Pump station 147
Water Source 147
Piping and hydraulics 148
Central/Satellite Control System 148
Sprinkler Coverage 149
Complete Summary of Irrigation Findings 149
Goodrich Golf Course 150
History 150
Pump station 150
Water Source 150
Piping and hydraulics 151
Central/Satellite Control System 151
Sprinkler Coverage 152
Complete Summary of Irrigation Findings 152
Ponds at Battle Creek Golf Course 153
History 153
Pump station 153
Piping and hydraulics 154
Central Control System 154
Sprinkler Coverage 155
Complete Summary of Irrigation Findings 155
Island Lake Golf Course 155
History 155
Pump station 156
Water Source & Pump Station Summary of Findings: 156
Piping and hydraulics 157
Central/Satellite Control System 157
Sprinkler Coverage 158
Complete Summary of Irrigation Findings 158
Ramsey County Golf Study Table of Contents
Sirius Golf Advisors, LLC viii
Architect’s Report 159
Goals and Objectives 159
Design Evaluation - Routing 159
Par 160
Length 160
Width 162
Playability for All Levels of Golfers 162
Visibility 162
Safety 163
Fits Natural Topography Attractively 163
Variety and Sequence (or Rhythm) 163
Drains Well 164
Receptive Targets 164
Good Circulation/Speed of Play 164
Sun Orientation 164
Design Evaluation - Golf Features 164
Greens 165
Tees 170
Sand Bunkers 177
Fairway and Rough 182
Trees 183
Cart Paths 184
Drainage 188
Design Needs/Improvement Proposals 190
Keller Golf Course 190
Manitou Ridge Golf Course 194
Goodrich Golf Course 197
Routing 198
Features Analysis 198
Infrastructure 199
Ponds of Battle Creek Golf Course 201
Routing 202
Recommended Improvements 204
Island Lake 210
Routing 210
Features and Infrastructure 211

Ramsey County Golf Study Table of Contents
Sirius Golf Advisors, LLC ix
Implementation Plan 211
Basic Implementation Methods 214
Implementation Recommendations for Ramsey County 216
Cost Estimates 217
Golf Operations 220
Administration 220
Signage 221
Communications 221
Financial Accounting 221
Programming 221
Point of Sale 222
Common Issues 223
Teetime Maximization 223
Pace of Play 224
Weekend Teetimes 235
Merchandise 236
Food & Beverage 237
Drinking Water 239
County IT 240
Golf Dome 240
Issue 241
Opportunities 242
Island Lake 243
Strengths 243
Issues and Opportunities 244
Opportunities 246
Battle Creek 247
Strengths 247
Concerns 248
Opportunities 249
Goodrich 250
Strengths 250
Weaknesses 250
Concerns 251
Opportunities 252
Manitou 252
Ramsey County Golf Study Table of Contents
Sirius Golf Advisors, LLC x
Strengths 252
Weaknesses 253
Concerns 253
Opportunities 254
Keller 255
Strengths 255
Weaknesses 256
Concerns 257
Opportunities 257
Major Issues 259
Philosophical Direction 259
Market Overlap 259
Operator Contracts 260
Marketing 261
Pricing Policy 264
Process 264
Men’s and Women’s Clubs 264
Fixed Fees 265
Rigidity 265
New Rate Structure 265
Keller Food & Beverage 266
Manitou Performance 267
Target Markets 267
Women 267
New Golfers 269
Capital Improvement Needs 270
Infrastructure Needs 270
Keller 271
Manitou 272
Goodrich 272
Battle Creek 273
Performance Enhancers 274
Keller 274
Manitou 275
Goodrich 275
Battle Creek 276

Ramsey County Golf Study Table of Contents
Sirius Golf Advisors, LLC xi
Major Recommendations 278
Philosophical Direction 278
Market Overlap 278
Operator Contracts 279
Single Operator 279
Course Maintenance 279
Recommended Contracts 283
Marketing 284
Marketing vs. Advertising 285
Marketing Strategy 286
Media 288
Tracking 291
Pricing Policy 292
Clubs 292
Weekend Rates 293
Recommended Fees 293
Keller 295
Manitou 296
Battle Creek 297
Scenario One: “Elite Nine” 297
Scenario Two: “Par 34” 297
Scenario Three: “18-hole” 298
Expanding Market 299
Women 299
Diverse Populations 300
Latent Golfers 300
Visitors 301
Capital Improvement Scenarios 303
Keller 303
Manitou 304
Scenario One: Priority Fixes Only 304
Scenario Two: Major Renovation 305
Goodrich 306
Scenario One: Priority Only 306
Scenario Two: Modest Renovations 307
Battle Creek 308

Ramsey County Golf Study Table of Contents
Sirius Golf Advisors, LLC xii
Scenario 1: “Elite Nine” 308
Scenario 2: Par 34 309
Scenario 3: 18 Holes 310
Projections 312
Assumptions: 312
Operating Contracts 313
Keller 313
Scenario 0: Status Quo 314
Scenario 1a: Priority Fixes 315
Scenario 1b: Hybrid Model 316
Discussion 317
Manitou 317
Scenario 0: Status Quo 317
Scenario 1: Priority Improvements 318
Scenario Two: Major Renovation 320
Discussion 321
Goodrich 322
Scenario 0: Status Quo 322
Scenario One: Priority Fixes 323
Scenario One A: Hybrid 325
Scenario Two: Modest Renovation 326
Scenario 2A: Hybrid 327
Discussion 328
Battle Creek 328
Scenario 0: Status Quo 329
Scenario 1: “Elite” Nine 329
Scenario 1a: Elite with Hybrid 331
Scenario 2: Par 34 332
Scenario 2a: Par 34 with Hybrid 334
Scenario 3: 18 Holes 334
Scenario 3a: 18 Holes with Hybrid Contract 337
Discussion 337
Combined Impact 338
Discussion 339
Philosophical Direction 339
Recommended Scenarios 340

Ramsey County Golf Study Table of Contents
Sirius Golf Advisors, LLC xiii
Changing Demographics 341
Demographic Shift 342
Minority Participation 342
Management Options 343
Self-Managed 345
Leasing 347
Outside Management 350
Discussion and Recommendation 356
Importance of Golf 363
Role of Municipal Golf 364
Economic Impact 364
Other Considerations 365
Goodrich as a Loss-Leader 365
Facility-Specific Projections 366
Island Lake 366
When a Loss is a Gain 366
Debt Financing 367
Pavilions 367
Rounds Reports 367
Covered Stalls 368
Golf Surf Boards 368
Foot Golf 368
Golf Simulators, Winter Activity 369
When to Close a Course 369
Appendices 371
Appendix A: Trends 372
Appendix B: Summary Demographics 374
Appendix C: Golf Demand Analysis 376
Goodrich Golf Course 381
Island Lake Golf Course & Training Center 384
Keller Golf Course 387
Manitou Ridge Golf Course 390
The Pond at Battle Creek Golf Course 393
Appendix D: Competition 396
Metro 18-Hole Regulation 396
Metro 9-Hole Regulation 400
Ramsey County Golf Study Table of Contents
Sirius Golf Advisors, LLC xiv
Metro Executive Courses 401
Metro Par 3 402
Comps: 18-Hole Regulation 403
9-Hole Regulation 418
Appendix E: Performance 421
Rounds History 1982-2017 421
Goodrich 3-year Historical Performance 422
Keller 3-year Historical Performance 425

Ramsey County Golf Study Table of Contents
Sirius Golf Advisors, LLC xv
Manitou 3-year Historical Performance
427
Year Qty Value Avg Price Rev/Rnd % rounds
Advanced GFCards
Patron Card
2017 36 $2,688 $74.67 $0.09 0.12%
2016 44 $3,080 $70.01 $0.09 0.13%
2015 23 $1,610 $70.01 $0.04 0.06%
Subtotal 103 $7,379 $71.64 $0.07 0.10%
Annual Pass
2017 44 $50,735 $1,153.07 $1.67 0.14%
2016 50 $57,549 $1,150.99 $1.69 0.15%
2015 3,651 $52,882 $14.48 $1.32 9.09%
Subtotal 3,745 $161,166 $43.04 $1.54 3.58%
Total Prepaid
2017 80 $53,423 $667.79 $1.76 0.26%
2016 94 $60,630 $645.00 $1.78 0.28%
2015 3,674 $54,492 $14.83 $1.36 9.14%
Subtotal 3,848 $168,545 $43.80 $1.61 3.68%
Driving RangeBuckets
2017 4,300 $23,140 $5.38 $0.76 14.17%
2016 4,529 $22,599 $4.99 $0.66 13.26%
2015 4,757 $24,142 $5.08 $0.60 11.84%
Subtotal 13,586 $69,881.26 $5.14 $0.67 12.98%
Passes2017 599 $16,214 $27.07 $0.53 1.97%
2016 626 $14,605 $23.33 $0.43 1.83%
2015 538 $12,552 $23.33 $0.31 1.34%
Subtotal 1,763 $43,370.28 $24.60 $0.41 1.68%
Total2017 4,899 $39,354 $8.03 $1.30 16.14%
2016 5,155 $37,203 $7.22 $1.09 15.10%
2015 5,295 $36,694 $6.93 $0.91 13.18%
Subtotal 15,349 $113,251.54 $7.38 $1.08 14.66%
CartsTOTAL
2017 20,642 $225,419 $10.92 $7.43 68.01%
2016 20,275 $208,624 $10.29 $6.11 59.38%
2015 18,905 $198,383 $10.49 $4.94 47.05%
59,822 $632,426 $10.57 $6.04 57.15%

Ramsey County Golf Study Table of Contents
Sirius Golf Advisors, LLC xvi
Battle
Green FeesPass
2017 3,533 $0 $0.00 $0.00 11.64%
2016 3,888 $0.00 $0.00 11.39%
2015 3,601 $0.00 $0.00 8.96%
Subtotal 11,022 $0 $0.00 $0.00 10.53%
Senior
2017 14,771 $233,112 $15.78 $7.68 48.67%
2016 12,296 $244,377 $19.87 $7.16 36.01%
2015 8,668 $189,676 $21.88 $4.72 21.57%
Subtotal 35,735 $667,164 $18.67 $6.37 34.14%
Total 18 hole
2017 16,286 $404,938 $24.86 $13.34 53.66%
2016 18,263 $421,676 $23.09 $12.35 53.48%
2015 18,762 $400,187 $21.33 $9.96 46.69%
Subtotal 53,311 $1,226,801 $23.01 $11.72 50.93%
Total 9 hole
2017 11,208 $205,745 $18.36 $6.78 36.93%
2016 10,784 $192,269 $17.83 $5.63 31.58%
2015 11,981 $216,242 $18.05 $5.38 29.82%
Subtotal 33,973 $614,256 $18.08 $5.87 32.45%
Total Twilight
2017 3,510 $65,468 $18.65 $2.16 11.57%
2016 5,223 $97,461 $18.66 $2.85 15.30%
2015 3,021 $44,085 $14.59 $1.10 7.52%
Subtotal 11,754 $207,014 $17.61 $1.98 11.23%
Total Weekday
2017 21,220 $476,834 $22.47 $15.71 69.92%
2016 23,759 $478,412 $20.14 $14.01 69.58%
2015 23,224 $453,136 $19.51 $11.28 57.80%
Subtotal 68,203 $1,408,382 $20.65 $13.45 65.15%
Total Weekend
2017 2,047 $59,684 $29.16 $1.97 6.74%
2016 4,339 $125,797 $28.99 $3.68 12.71%
2015 4,317 $122,430 $28.36 $3.05 10.74%
Subtotal 10,703 $307,911 $28.77 $2.94 10.22%
Total Green Fee, Cart Fee, Range and Pass
2017 30,350 $865,544 $28.52 $28.52 100.00%
2016 34,147 $923,897 $27.06 $27.06 100.00%
2015 40,183 $914,134 $22.75 $22.75 100.00%
Subtotal 104,680 $2,703,575 $25.83 $25.83 100.00%

Ramsey County Golf Study Table of Contents
Sirius Golf Advisors, LLC xvii
Creek 3-year Historical Performance 429
Appendix F: Customer Survey 433
Survey Questions 433
Customer Profile 438
Goodrich 439
Battle Creek 440
Manitou 441
Appendix G: Infrastructure Life Expectancies 442
Goodrich 442
Manitou Ridge 445
Appendix H: Cost Estimates 448
Infrastructure 448
Appendix I: Course Routing Proposals 464
Keller 465
Manitou Ridge: Scenario 1 466
Manitou Ridge: Scenario 2 467
Goodrich Scenario 1 468
Goodrich Scenario 2 469
Battle Creek Scenario 1 470
Battle Creek Scenario 2 471
Battle Creek Scenario 3 472
Appendix J: Cash Flow Projections 473
Keller 474
Manitou Ridge 483
Goodrich 496
Battle Creek 512

Ramsey County Golf Study Executive Summary
Sirius Golf Advisors, LLC 1
Ramsey County (“County”) hired Sirius Golf Advisors, LLC (“Sirius”) to provide a thorough analysis of its golf operations, with recommendations regarding improvements and long-term planning. Sirius’ team included John Wait, President of Sirius, a specialist in municipal golf consulting; Jeffrey D. Brauer, noted golf course architect; Erik Christensen, certified irrigation designer; and David S. Downing, nationally prominent agronomist. The National Golf Foundation also assisted.
The evaluation process included numerous site visits and facility inspections, interviews with County and golf staff, an extensive survey of area competition, a thorough review of performance data, a detailed customer survey, and an area golf demand analysis.
The emphasis in this report was on the four main golf facilities: Goodrich Golf Course (“Goodrich”), Manitou Ridge Golf Course (“Manitou”), Keller Golf Course (“Keller”), and The Ponds at Battle Creek (“Ponds”). These are the facilities where the County has the greatest risk and exposure as the other two properties, Island Lake Golf Facility and Practice Center (“Island Lake”) and the Goodrich Golf Dome, dba Midwest Golf Dome (“Golf Dome”) are under long-term capital leases where the operator is responsible for all expenses, including capital improvements.
For simplicity, throughout this report we refer to the County’s golf operations as “RC Golf.”
Philosophical Direction In our interview for this job, we asked a simple question, “What is the Philosophical Direction for the golf operations?” While the question itself is simple, the answer rarely is. Yet it is exceedingly important in determining the appropriate strategy to reach the County’s objective.
The main axis of consideration is whether to emphasize the courses as an amenity to the citizens of the County, or to maximize profitability. While there is no “right” or “wrong” answer to this issue, it does have profound implications as to how the facilities should be operated. For example, if the goal is to emphasize being an amenity, then the golf operations would likely resemble those of other County owned amenities such as parks, swimming pools, tennis courts and arenas. This, in turn, means there should be no expectation of profitability since the purpose is to make the amenities as accessible to all citizens as possible. This normally requires keeping the prices artificially low, resulting in insufficient revenue to support operations and, ultimately, the County subsidizing the golf operation – just as it does with parks, pools, etc.
Yet, to the degree that profitability is a concern, one must realize that each golf course is a business. Further, these golf courses are businesses operating in a highly competitive environment. To succeed in such an environment, that is to become more profitable, requires taking a business approach. The more profitable the goal, the more the golf operation must adopt sound business principals. However, such an approach is very, very different than a typical municipal operation.
In a municipal approach, decisions are based on making the amenity more accessible and more valuable to the citizens of the municipality, within a specified cost allowance. But in a business approach, the goal is to maximize profitability, both in the short- and especially the long-term. It means controlling costs, marketing effectively, responding quickly to competitive pressures. It also means a different approach to personnel and decision-making. And it also means minimizing political influence in many areas – especially pricing. The municipalities that adopt this approach feel it is better for all their citizens, not just the golfers, as it both helps ensure the long-term viability of the asset, without possibly diverting funds that could go to support other programs and amenities.

Ramsey County Golf Study Executive Summary
Sirius Golf Advisors, LLC 2
Our position was and is neutral to this question. Some municipalities are very amenity oriented. They often end up subsidizing their golf operations to a significant degree but understand that this is a consequence to that approach. Other municipalities are profit oriented. They feel it is important to preserve the amenity for its citizens but realize that they cannot afford to continue subsidizing the operations. This often means privatizing the golf courses to a great degree in order to enable the operations to adopt sound business practices.
In looking at how RC Golf was operating when we first came in, it was also not clear as to which direction the County wanted to take. There were clear elements of both approaches. On the profitability side was the fact that the golf and food and beverage operations had been privatized by hiring a management entity where their employees and management handle the operations. Two facilities, Island Lake and the Golf Dome, were completely privatized with capital leases. The County had no responsibilities other than clear the parking lots and collect rent. The operators are responsible for every aspect of the operation, including maintenance and capital improvements.
But on the amenity side is the fact that the County still did the course maintenance at three of the facilities (Goodrich, Manitou and Keller), using its own employees. The County also controls all pricing. Yet, there is virtually no County programming, which would normally be evident in an amenity approach.
During the presentation of our Executive Report to the Commissioners on October 8th, 2018, we put forth this issue. The Commissioners then took a vote during our meeting and decided to emphasize profitability. As a result, our recommendations in this report are largely designed to improve the financial performance of the facilities.
Overview The County has six golf facilities: Keller Golf Course (Keller), Goodrich Golf Course (Goodrich), Manitou Ridge Golf Course (Manitou), Ponds at Battle Creek (Battle Creek), Island Lake Golf Facility (Island Lake) and the Goodrich Golf Dome (Golf Dome). Keller, Goodrich and Manitou are 18-hole regulation golf courses. Battle Creek is a nine-hole regulation course and Island Lake is an executive, 9-hole Par 28 golf course and practice facility.
Two of the facilities, Island Lake and the Golf Dome, are operated on long-term capital leases. Manitou has an operating lease, where the operator pays for all operating expenses, including maintenance, but the County remains responsible for the improvements. Keller, Goodrich and Battle Creek have management contracts, but the County still maintains the courses.
One of the issues we had to confront in doing this study was simply getting all the needed information. One of the reasons why this was so difficult is that there are no consolidated financials for the golf operations. This is because several entities are involved in their operation – even on the County side. While Parks has the biggest role, other County departments are involved as well, in addition to the private operators. And while Parks, who commissioned this study, was very cooperative, we were not able to get information from other departments. Most notably, we were only able to get cursory information from Fleet Services, which is responsible for all the acquisition and maintenance of all maintenance equipment as well as the cart fleet. They also pay for the fuel. This is a major expense area for the golf operation. Unfortunately, we were not able to get any information until after our Executive Report was turned in and our presentation was made to the Commissioners on October 8th. The information we did receive was barebones. We were only given a total amount spent at each course and that only for one year (2017).
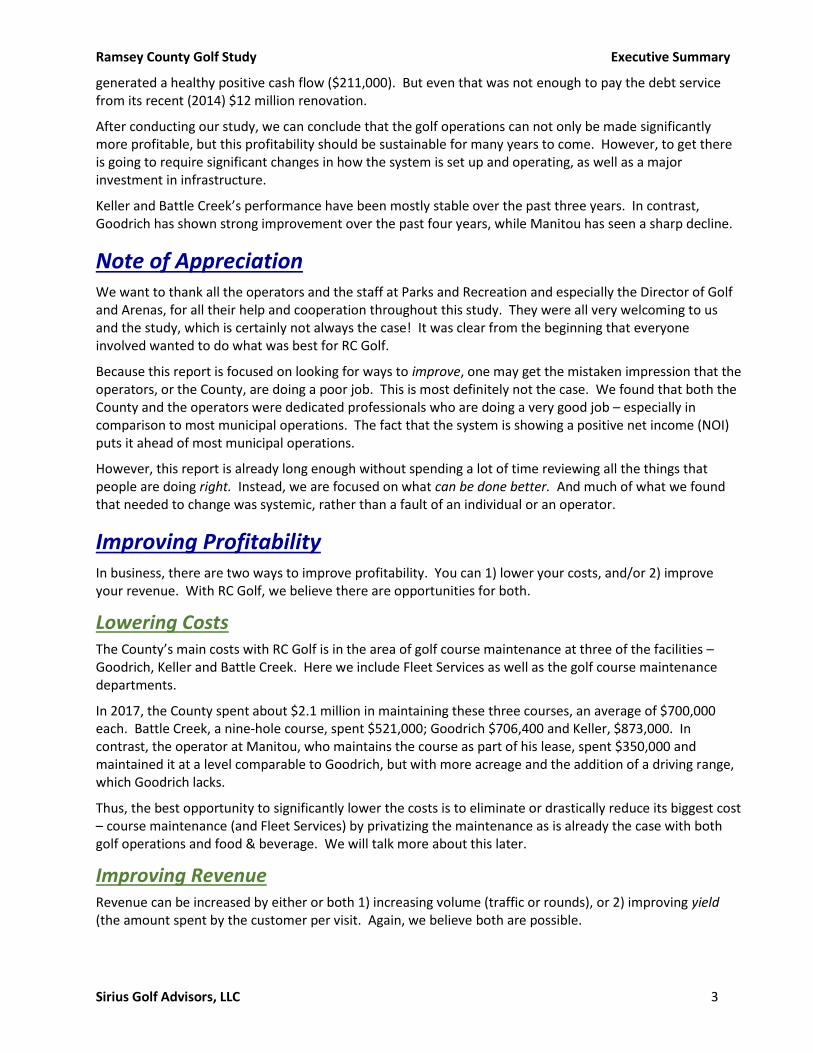
When we did get these figures and added them to the expenses already provided by Parks, we found that overall, the golf operations showed a positive cash flow. But the amount was just a little over $86,000 last year. Two of the six facilities showed a negative cash flow (Goodrich and Battle Creek). One facility, Keller,
Ramsey County Golf Study Executive Summary
Sirius Golf Advisors, LLC 3
generated a healthy positive cash flow ($211,000). But even that was not enough to pay the debt service from its recent (2014) $12 million renovation.
After conducting our study, we can conclude that the golf operations can not only be made significantly more profitable, but this profitability should be sustainable for many years to come. However, to get there is going to require significant changes in how the system is set up and operating, as well as a major investment in infrastructure.
Keller and Battle Creek’s performance have been mostly stable over the past three years. In contrast, Goodrich has shown strong improvement over the past four years, while Manitou has seen a sharp decline.
Note of Appreciation We want to thank all the operators and the staff at Parks and Recreation and especially the Director of Golf and Arenas, for all their help and cooperation throughout this study. They were all very welcoming to us and the study, which is certainly not always the case! It was clear from the beginning that everyone involved wanted to do what was best for RC Golf.
Because this report is focused on looking for ways to improve, one may get the mistaken impression that the operators, or the County, are doing a poor job. This is most definitely not the case. We found that both the County and the operators were dedicated professionals who are doing a very good job – especially in comparison to most municipal operations. The fact that the system is showing a positive net income (NOI) puts it ahead of most municipal operations.
However, this report is already long enough without spending a lot of time reviewing all the things that people are doing right. Instead, we are focused on what can be done better. And much of what we found that needed to change was systemic, rather than a fault of an individual or an operator.
Improving Profitability In business, there are two ways to improve profitability. You can 1) lower your costs, and/or 2) improve your revenue. With RC Golf, we believe there are opportunities for both.
Lowering Costs The County’s main costs with RC Golf is in the area of golf course maintenance at three of the facilities – Goodrich, Keller and Battle Creek. Here we include Fleet Services as well as the golf course maintenance departments.
In 2017, the County spent about $2.1 million in maintaining these three courses, an average of $700,000 each. Battle Creek, a nine-hole course, spent $521,000; Goodrich $706,400 and Keller, $873,000. In contrast, the operator at Manitou, who maintains the course as part of his lease, spent $350,000 and maintained it at a level comparable to Goodrich, but with more acreage and the addition of a driving range, which Goodrich lacks.
Thus, the best opportunity to significantly lower the costs is to eliminate or drastically reduce its biggest cost – course maintenance (and Fleet Services) by privatizing the maintenance as is already the case with both golf operations and food & beverage. We will talk more about this later.
Improving Revenue Revenue can be increased by either or both 1) increasing volume (traffic or rounds), or 2) improving yield (the amount spent by the customer per visit. Again, we believe both are possible.

Ramsey County Golf Study Executive Summary
Sirius Golf Advisors, LLC 4
Current Situation Before talking about where we need to go, lets discuss where we are.
Market Conditions
Golf Demand The National Golf Foundation (NGF) does an annual survey in which they assess golf participation across the US. They can then use this data to accurately project golf participation and rounds on a local level. We used their services in accessing the local market.
Local (10-Mile) Golf Demand
Golf Course
No. of Golfers within 10 mi
Rounds Potential (10 mi)
Golfer / Rounds Index
(US=100)
No. of Golf
Facilities (10 Mi.)
Golfing Households
per 18 holes
(Supply Ratio)
Golfing Households
per 18 holes Index (US = 100)
Potential Rounds per 18 Holes
Keller GC 86,163 1,587,497 151 / 128 31 2,613 211 58,796
Goodrich GC 75,728 1,407,118 157 / 136 30 2,315 187 53,099
Manitou Ridge GC 63,932 1,182,368 161 / 139 24 2,284 185 52,550
Battle Creek GC 66,526 1,191,742 150 / 125 24 2,465 199 55,430
Island Lake Golf 97,602 1,744,418 140 / 117 23 3,754 304 83,068
Ramsey County 52,036 973,682 148 / 129 16 3,191 258 72,125
The results show that the Local Markets (defined as a 10-mile radius around each facility) around each golf facility have a golf participation rate that ranges from 1.8 (Manitou and Goodrich) to over three (Island Lake) times the national average. Further, the golfers play about 1.5 times as many rounds as the average golfer in the country, despite the much shortened season.
When the number of facilities in each area is factored in, we find that there is more than enough demand to support each of the facilities and that each facility may, in fact, be under-performing based on this demand.
The NGF report goes on to state that there are more Latent golfers than actual golfers. Latent golfers are people who have expressed a desire to play golf, but who currently do not play. Thus, pointing out that programs designed to facilitate transitioning Latent golfers into actual golfers, could have a significant impact on performance.
Competition There are 168 public golf courses in the metropolitan area. Two-thirds of these are 18-hole regulation courses. Our primary interest, though, is on the 92 courses that are within a 20-mile radius of an RC Golf facility. These are the ones that are most competitive with the RC Golf facilities.
MSP Public Golf Courses
Metro Local RC Golf % Local
18-hole Regulation 112 58 3 52%
9-hole Regulation 15 5 1 33%
18-hole Executive 3 2
67%
9-hole Executive 24 14 1 58%
Par 3 courses 14 13 93%
Total 168 92 5 55%
Ramsey County Golf Study Executive Summary
Sirius Golf Advisors, LLC 5
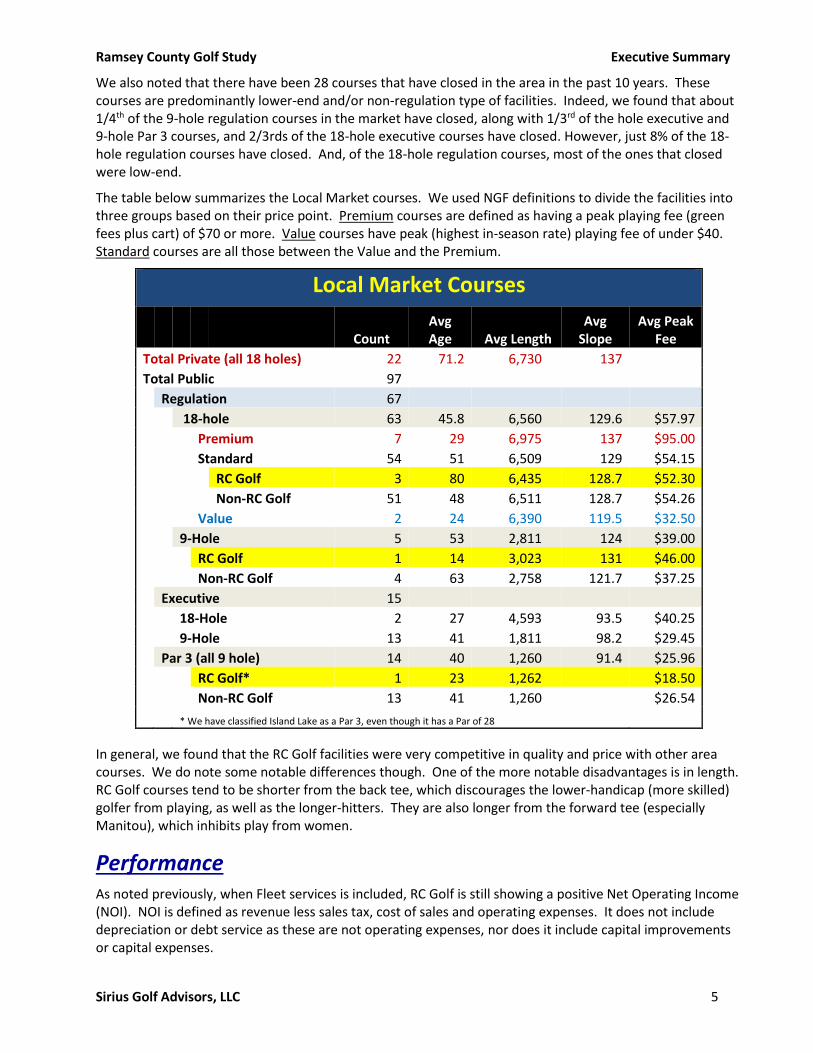
We also noted that there have been 28 courses that have closed in the area in the past 10 years. These courses are predominantly lower-end and/or non-regulation type of facilities. Indeed, we found that about 1/4th of the 9-hole regulation courses in the market have closed, along with 1/3rd of the hole executive and 9-hole Par 3 courses, and 2/3rds of the 18-hole executive courses have closed. However, just 8% of the 18-hole regulation courses have closed. And, of the 18-hole regulation courses, most of the ones that closed were low-end.
The table below summarizes the Local Market courses. We used NGF definitions to divide the facilities into three groups based on their price point. Premium courses are defined as having a peak playing fee (green fees plus cart) of $70 or more. Value courses have peak (highest in-season rate) playing fee of under $40. Standard courses are all those between the Value and the Premium.
Local Market Courses
Count Avg Age Avg Length
Avg Slope
Avg Peak Fee
Total Private (all 18 holes) 22 71.2 6,730 137
Total Public 97
Regulation 67
18-hole 63 45.8 6,560 129.6 $57.97
Premium 7 29 6,975 137 $95.00
Standard 54 51 6,509 129 $54.15
RC Golf 3 80 6,435 128.7 $52.30
Non-RC Golf 51 48 6,511 128.7 $54.26
Value 2 24 6,390 119.5 $32.50
9-Hole 5 53 2,811 124 $39.00
RC Golf 1 14 3,023 131 $46.00
Non-RC Golf 4 63 2,758 121.7 $37.25
Executive 15
18-Hole 2 27 4,593 93.5 $40.25
9-Hole 13 41 1,811 98.2 $29.45
Par 3 (all 9 hole) 14 40 1,260 91.4 $25.96
RC Golf* 1 23 1,262 $18.50
Non-RC Golf 13 41 1,260 $26.54
* We have classified Island Lake as a Par 3, even though it has a Par of 28
In general, we found that the RC Golf facilities were very competitive in quality and price with other area courses. We do note some notable differences though. One of the more notable disadvantages is in length. RC Golf courses tend to be shorter from the back tee, which discourages the lower-handicap (more skilled) golfer from playing, as well as the longer-hitters. They are also longer from the forward tee (especially Manitou), which inhibits play from women.
Performance As noted previously, when Fleet services is included, RC Golf is still showing a positive Net Operating Income (NOI). NOI is defined as revenue less sales tax, cost of sales and operating expenses. It does not include depreciation or debt service as these are not operating expenses, nor does it include capital improvements or capital expenses.

Ramsey County Golf Study Executive Summary
Sirius Golf Advisors, LLC 6
Two facilities, Island Lake and Golf Dome, are under capital leases, guaranteeing their profitability to the County. Manitou is under an operating lease, where the operator is responsible for all operating expenses, thus also guaranteeing a positive cash flow to the county.
Two of the remaining three facilities (Goodrich and Battle Creek) are showing an operating loss. The combine for a negative NOI of $346,500, which is over 1.5 times as much as the remaining facility’s (Keller) positive NOI ($211,000). So, without the leases, RC Golf is losing money.
Over the past few years, Keller and Battle Creek’s performance has been mostly steady. Goodrich, though, has seen a dramatic improvement. However, Manitou has shown a significant decline.
Management With a few exceptions, we found the facilities to be both well-managed and well-maintained. Customer service is a point of emphasis at all five golf courses.
Customer Feedback We surveyed existing customers for each facility using NGF’s customer survey. In addition to being very thorough, this survey allows us to compare our results to their national database. This eliminates the natural bias people have with rating scales and provides a truer picture of how the target facility compares to the competition. NGF compares the target facility’s ratings with both the total database and with the database of just those courses in the same price point category.
0
10,000
20,000
30,000
40,000
Keller Goodrich Maintou Ponds
Rounds 2014-2017
2014 2015 2016 2017

Ramsey County Golf Study Executive Summary
Sirius Golf Advisors, LLC 7
The results showed strong customer satisfaction at three of the facilities: Keller, Goodrich and Battle Creek. Indeed, both Goodrich and Battle Creek placed in the top 10% of all facilities in the database. Keller might have except for the exceptionally low scores (bottom ½ of 1% of all facilities) given to the food and beverage operation.
More concerning were the ratings for Manitou. Their overall score placed them in the bottom 12% of all facilities. Several individual factor ratings were in the bottom 5% and even some in the bottom 1%. These low ratings may help explain the decline in performance. The also indicate that Manitou may be vulnerable to further decline in performance if things are not improved.
Impediments to Profitability - Major Issues In looking at ways of improving and sustaining profitability, we found several major issues that serve as impediments to profitability. Some of these are likely to further degrade performance if not addressed.
The major areas of concern noted included:
• Lack of a Philosophical Direction for RC Golf by the County
• Deteriorating Infrastructure, especially at Goodrich and Manitou
• Market Overlap
• Operator Contracts
• Marketing
• Pricing Policy
• Keller’s Food and Beverage Operation
• Manitou’s Decline
• Battle Creek
• Neglected Markets
Below is a discussion of each issue in turn.
Philosophical Direction There was no clearly defined Philosophical Direction for RC Golf. Yet this is very important as it provides guidance as to what RC Golf believes in and how the facilities should be operated.
The most important question is “what is more important: Being an amenity to the citizens of the County or being a profit center, supporting other valuable programs?” With municipal golf courses, amenity-oriented facilities are typically operated like other recreation assets, such as parks and swimming pools. There is no expectation for profit, indeed, it is normal for them to be heavily subsidized.
On the other hand, to the degree that profitability is desired (even just breaking-even), then the operation must operate more like a business. Moreover, it is a business that is operating in a highly-competitive environment.
Overall Satisfaction Ratings
# Resp Average
Score Price Pt % National %
Keller 97 8.4 82 74
Goodrich 107 8.7 97 90
Manitou 145 7.5 28 12
Battle Creek 94 8.8 98 94
Island Lake 15 7.8 46 28
Ramsey County Golf Study Executive Summary
Sirius Golf Advisors, LLC 8
Some of the facilities are fully privatized, indicating a profit-center approach. Yet others are not. And the county’s pricing policy is decidedly amenity-based. The conflicting approaches mean that neither potential goal is being fully realized.
➢ Profitability Impact: Affects everything
Deteriorating Infrastructure Most of the infrastructure, such as irrigation system, greens, tees, fairways, etc., at Goodrich and Manitou have greatly exceeded their life expectancies. Consequently, maintenance costs will continue to rise more than normal. Further, course conditions will deteriorate. This will lead directly to poorer performance. Thus, profitability is adversely affected by both rising costs and lower revenue.
We also found lesser, but still important, issues at both Keller and Battle Creek.
Unfortunately, infrastructure repairs with golf courses, especially irrigation and greens, require major investments. On the other hand, assuming these major areas are being addressed, it is often a small incremental cost to do other improvements that can have a significant positive impact on performance, as has been seen at Keller.
➢ Profitability Impact: Affects everything as well. Without fixing, maintenance costs increase, rounds (volume) decreases, and prices (yield) goes down.
Market Overlap All four of the main courses (Keller, Goodrich, Manitou and Battle Creek) are priced within a relatively narrow price range ($13 spread), compared to a $107 spread in the local market. All four are considered “Standard” or “Mid-Fee” facilities. The narrow spread for RC Golf has two consequences:
1. Each course’s primary competition are the other three County courses.
2. RC Golf is not serving either the lower- or higher- ends of the marketplace.
As a result, RC Golf, as an entity, is not maximizing its share of the local golf market.
➢ Profitability Impact: Affects both volume and yield. If fixed, the yield at Keller should increase, as should the volume. Manitou should see improvements in both areas. Goodrich will have higher volume, but lower yield.
Operator Contracts There are six golf facilities within RC Golf. These six facilities have six different operators and seven different contracts (there are two operators at Keller, and one operator manages both Goodrich and Battle Creek). Issues include:
• Administrative: Obviously, with multiple contracts and multiple vendors, it is more difficult (and more expensive) to administer.
• Potential Conflicts of Interest: With the management contracts at Keller, Goodrich and Battle Creek, operator compensation varies depending on the revenue stream. The County gets the biggest share of green and cart fees. But the operator gets most (or all) of the range, food & beverage and merchandise sales. This can lead to the operators wanting to discount green and cart fees to increase volume, thus increasing their revenue at the possible cost to the County. It also makes it very difficult (in fact, it’s not being done) to do promotions involving multiple revenue
Ramsey County Golf Study Executive Summary
Sirius Golf Advisors, LLC 9
streams, such as including a free lunch with green fees; or negotiating tournaments and outings that utilize most or all the above services.
• Not Enforced: Some important parts of the current contracts are not being enforced, such as the requirement to provide an annual marketing plan or provide rangers.
• Does not include maintenance (Keller, Battle Creek, Manitou)
➢ Profitability Impact: Affects everything as well, but the biggest impact is on cost.
Marketing Simply put, there is almost no proactive marketing being done. Yet marketing is the lifeblood for most businesses, especially those in highly competitive industries, such as golf. And what little marketing being done (e.g. the websites) is sub-standard and ineffective.
Not only is this a budget issue, but there is confusion as to who is responsible – the County or the operators. The result is that no one is assuming responsibility. Further, there is a concern about expertise with regards to golf course marketing. What little marketing is being done (including the websites) does not appear to be effective, including poorly designed websites.
➢ Profitability Impact: Currently it has a negative impact on revenue. Fixing will lead to increasing costs to cover the marketing. However, volume should dramatically increase. It can also improve yield, especially in conjunction with other proposed changes.
Pricing Policy The current pricing policy is strongly amenity-based, which means that it is hampering the facilities’ ability to make a profit.
The fact that the County sets the prices for all cart and green fees, makes them much more vulnerable to political pressures from special interest groups. This may explain why senior rates are discounted much more heavily with RC golf than other area golf facilities. Overall, it helps suppress prices, which can adversely affect profitability.
Even worse is the fact that the County only adjusts the rates every two years. Golf is a highly competitive industry, where prices fluctuate continuously. Having your prices fixed puts the RC Golf facilities at a major competitive disadvantage.
➢ Profitability Impact: Currently it has a negative impact on revenue. Fixing will lead to higher volumes at the facilities. Can also impact yield.
Keller’s Food and Beverage Operation This is a big issue, whether you are amenity oriented or profit oriented. Lancer, Keller’s food and beverage operator, does a great job with banquets, but shows a disdain for servicing golfers.
In our customer survey, Keller’s customers rated the food and beverage service in the bottom 0.5% of all golf courses in its price range. We can personally corroborate some of the feedback with our own observations.
The beverage cart service is inconsistent and not even present much of the time. (Facilities in this price range typically offer beverage cart service all day, every day). Further, customer service in the restaurant can be lacking and does not seem oriented to the needs of the golfer.
➢ Profitability Impact: Currently it has a negative impact on revenue. Fixing will lead greater customer satisfaction at Keller which will impact both volume (make the course more popular)

Ramsey County Golf Study Executive Summary
Sirius Golf Advisors, LLC 10
and yield (more F&B sales). It can also lead to the facility being repositioned as a Premium course, increasing yield further.
Manitou’s Decline Manitou’s performance has declined sharply since 2014. Further, customer survey results rated the course well below average (the other three main courses received mostly positive results). The poor survey results covered most aspects of the operation.
As noted before, Manitou’s infrastructure is in decline, which may be affecting performance. But there are clearly other issues as well.
From a current financial standpoint, the County is not being heavily impacted by this decline as the operator pays for all operating expenses. But it raises concerns as to what state the facility will be in when the current operating lease expires.
➢ Profitability Impact: Currently it has a negative impact on revenue. Fixing will lead to both higher volume and better yield at Manitou.
Battle Creek Battle Creek is one of two facilities currently losing money within RC Golf. This loss is due mostly to the golf course, as the range operation at Battle Creek is highly popular and profitable.
The problem stems from the nature of the golf course. Battle Creek is a very challenging, nine-hole golf course. From a quality standpoint, it rivals Keller. The problem is that golfers expect nine-hole courses to be low-end, very playable and affordable courses – and Battle Creek is not.
Thus, golfers who might be attracted to Battle Creek because of its quality, never try it because they expect it to be low-end. Meanwhile, those who come to Battle Creek because it’s a nine-hole course come away dissatisfied because they wanted a low-end, very playable course.
➢ Profitability Impact: Currently it has a negative impact on revenue. Depending on the solution chosen, it could increase or decrease costs (especially if a different type of contract). But the solution should create both higher volume and better yields.
Neglected Markets Neglected markets are potential customers that are not currently being targeted by the RC Golf facilities, or for whom the facilities are currently not well-suited. This is an issue that straddles both ends of the amenity/profit center continuum as more customers means potentially more profits, but they also represent citizens whose needs are currently not being met by the County’s facilities.
In addition to not reaching premium or value-oriented golfers as noted previously, other neglected markets include women and latent golfers. It should be noted that RC Golf is not alone in neglecting these markets. They are often ignored within the industry.

Ramsey County Golf Study Executive Summary
Sirius Golf Advisors, LLC 11
Women With women, it’s the facilities that are inhospitable. All the courses play much longer for women than for men. This is particularly true at Manitou, where it is the equivalent of a nearly 8,000 yard course for women. This not only makes it extremely difficult (impairing popularity as most golfers do not want to play extremely difficult courses on a regular basis), but it also has a significant impact on the pace of play given it takes much longer to play from 8,000 yards than 6,000.
In addition, outside of Keller, none of the facilities offer healthy choices on their menus, an important consideration for women. Further, the facilities lack on-course restrooms. Women typically hate using porta-pottys, which are what are provided.
In the US, women represent just under a quarter of all golfers. And they represent nearly 40% of beginners. Yet we are not seeing nearly that level of participation at the RC Courses.
Latent Golfers Latent golfers are defined as people who would like to play golf, but who currently do not. According to the National Golf Foundation (NGF), there are more latent golfers than actual golfers in this area.
Aside from Island Lake, which does a respectable job, RC Golf does a relatively poorly in going after the wanna-be golfer. This is a fault of both marketing and programming.
➢ Profitability Impact: Currently neglected markets has a negative impact on revenue. Fixing will lead to increasing costs to cover the programming. However, volume should significantly increase. It can also improve yield, especially in conjunction with other proposed changes. Even if the programs are established at just one or two of the facilities, it can lead to increased use of all the facilities – especially in conjunction with branding and other marketing programs.
Improving Profitability - Major Recommendations This section will cover the non-capital recommendations. Capital improvements will be addressed in the following section.
Diversify Market Placement We recommend that RC Golf cover a wider spectrum of the market. This can most easily be done by making Keller a “Premium” facility (it is now considered “mid-fee”), and Goodrich a “Value” facility. NGF’s market demand analysis shows that there is a strong need in the Ramsey County marketplace for facilities at both ends of the spectrum – Premium and Value.
There is no doubt that Keller’s golf course and clubhouse fit the profile of a “premium” facility and are market competitive with area premium courses. Indeed, its history as a two-time PGA Championship course gives Keller a significant market advantage. However, its current food and beverage operation, as it relates to golf, would need to be upgraded before such a move is made since the F&B is not consistent with a “premium experience.”
Goodrich, on the other hand, strongly fits the profile of a “Value” facility, of which there is a strong need in the area marketplace. Indeed, the operator is currently effectively discounting the fees to the point where it is consistent with value courses. But the marketed fee structure is still mid-fee.
Operator Contracts We recommend that the contracts be restructured so that all revenue streams are treated equally (after accounting for inventory costs). This will eliminate any potential conflict of interest. Doing this will it allow

Ramsey County Golf Study Executive Summary
Sirius Golf Advisors, LLC 12
the County to place more faith in the operator having much greater control over fees, as what is good for them, will be good for the County and vice-versa.
We also recommend having the contracts expire at the same time. This will allow the County to then post an RFP whereby companies can bid on one, two or all the facilities. At that time, based on the proposals, the County can make the decision whether a single operator is best.
The biggest proposed change, though, is converting the contract to a different model – Hybrid (similar to Manitou, with modifications). Under this type of contract, the operator is responsible for all operating expenses including course maintenance. Because we believe each facility can generate a positive NOI under this format, there is no need for a subsidy or base payment. Instead, the operator and County have a revenue share program. The split is based on Gross Profit – which is defined as gross revenue less sales tax and cost of sales (inventory).
Our preferred contract has a breakpoint that is designed to be approximately where the operator can expect to “break-even.” Below this breakpoint, the operator gets most of the revenue (80-95% depending). Above this breakpoint, the County gets the majority (50-70% depending). In the text, and in our projections, we have calculated potential breakpoints and splits based on current volume and operator’s revenue.
The goal is to create a “win-win” scenario where both the operator and County have aligned interests. What is good for the operator is good for the County and vice-versa. This is not the case now.
Privatizing the course maintenance will have a dramatic impact on the overall operating costs for the facility – and especially the County’s costs. It virtually guarantees a positive cash flow to the County at each facility.
It should be noted that when we talked to the operators, there was a willingness to discuss converting to the hybrid concept. This would not require waiting until the end of the current contracts. (It should also be noted that all the current contracts are cancellable by the County at any time.)
Marketing Effective marketing can overcome a lot of weaknesses. It is critical, if the County wants the facilities to be break-even or better. There is no expense that has a higher degree of correlation to performance than marketing.
Our recommendations include:
1. Budget: The county should put 2.5% of its revenue from the golf courses toward marketing. This would have generated around $66,000 last year. In addition, the operators at each facility (two at Keller) would contribute $3,000 each. Combined, this provides a budget of over $80,000, which can have a significant impact. (If the contracts are converted to Hybrid, then both the County and the Operators should be putting in at least 2% of their respective gross revenue into marketing).
2. Management: We recommend the County hire a marketing firm, preferably one with golf course experience, to handle the marketing needs for RC Golf and for all the facilities.
3. Marketing: The marketing effort should include:
a. Planning: A detailed marketing plan should be prepared annually.
b. Web: New websites should be created for each facility.
c. Social Media: The courses need to be proactive in major social media. This will require someone (likely from the marketing company) to do regular postings – preferably daily.
d. Email: The email database should be mailed to at least on a weekly basis.
Ramsey County Golf Study Executive Summary
Sirius Golf Advisors, LLC 13
e. Public Relations: A PR effort should be implemented, especially when it comes to new programming and major capital improvements.
f. Media Advertising: A comprehensive media campaign should be implemented. This will include advertising on social media platforms, golf publications, etc. It may include spot TV ads, redemption advertising and billboards.
4. Branding: As RC Golf begins implementing the proposed improvements to operations and facilities, the County should strongly consider a branding campaign, bringing all the facilities under a common brand identification (such as “RC Golf”). This would include a logo that hopefully would have merchandising value as well.
Pricing Policy At the very minimum, the County needs to revise prices annually. Given increased profitability is a goal, then it also needs to reduce political influence and make the decisions based on business principles. The best way to do this is to allow the operators to set the pricing (as is currently the case with the capital leases). However, to do so with confidence, will require modifying the contracts as noted above.
Our report contains recommended fees for all four courses, as well as recommended modifications, including a revised Patron program and facility-specific annual passes.
Keller The main issue at Keller is the food and beverage operation as it relates to golf. The county has already made a step towards correcting this issue, as a new General Manager was hired by Lancer for Keller in early August. However, it remains to be seen if this resolves all the problems. Beverage Cart service needs to be prioritized and required every day, all day. It is an important customer service, especially if the desire is to convert Keller to a Premium class facility.
Manitou The operator has expressed concern over the survey findings and does appear motivated to address the issues. But progress needs to be closely monitored. Based on feedback, Manitou is at risk of losing several of its leagues, which would have devastating impact to its performance. We recommend conducting annual surveys to monitor progress. (Best choice is to use the same survey so that valid comparisons can be made.)
Spreading the market out by elevating Keller to be a Premium facility, and Goodrich a Value facility, will greatly benefit Manitou.
Manitou is also in critical need of capital improvements, which we will discuss in the next section.
Battle Creek We examined three different possible strategies on how to make Battle Creek successful. All of them require capital investment to varying degrees, and strong marketing. The scenarios are:
• “Elite” Nine: This is a marketing-heavy solution. The idea is to try and create an awareness of the facility with those golfers who would most appreciate it. The pitch would essentially be: “Do you want the golf experience of a Keller or Prestwick, but only have a couple of hours? Then try Battle Creek – the ‘best nine-hole golf course’ in Minnesota!’ The fee structure would also have to be adjusted as golfers, like most consumers, strongly associate price with quality. You want your pricing to reflect the desired perception of quality.

Ramsey County Golf Study Executive Summary
Sirius Golf Advisors, LLC 14
• Maximize Range: The range at Battle Creek is arguably the best in the County. It is extremely popular, with frequent waiting lines. This scenario takes advantage of its popularity by prioritizing the range. The range tee is doubled in size, doubling the range’s capacity. Target greens are added to increase its appeal. However, expanding the range comes at a cost to the golf course. It will require the course being reduced from a Par 35 (considered standard), to a Par 34 (considered sub-standard by most golfers). The hope is that the range’s increased performance would compensate for the course decrease in desirability.
• 18-holes: One way of eliminating problems associated with being a nine-hole course is to make it an 18-hole course. In the case of Battle Creek, that is possible as there is land available across the street at the correctional facility.
Recommended Capital Improvements With golf courses, there are two basic types of capital improvements:
• Those that are designed to maintain performance, and
• Those that are designed to improve performance.
Improvements of the first type normally refer to deferred maintenance items. In other words, repairing or replacing infrastructure items such as irrigation, greens, tees, etc. But the improvements do not alter the course’s routing or basic characteristics.
Improvements of the second type may upgrade the infrastructure, but their primary goal is to significantly improve a course’s performance. This can be done by either lowering maintenance costs and/or improving a course’s appeal and thereby increasing revenue.
All the courses have capital improvement needs. To make it easier to evaluate, we combined various improvement choices into “scenarios” for each course. For each course, Scenario 0 is “Status Quo,” meaning no changes to the operation nor are any capital improvements made.
Cost estimates were developed using recent construction pricing from Minnesota and adjusted for the proposed scope of work and local material costs. An inflation factor was also added to account for later start dates. A “soft cost” contingency was also added to provide a comprehensive estimated budget and minimize “surprises.”
Keller Keller’s primary needs are to correct issues relating to cost-cutting measures during recent renovation construction. The major issue being lining the bunkers. We are also recommending some additional tees to make the course friendlier to women and seniors, and to try to increase length to make it more appealing to lower handicap golfers.
The proposed timetable is 2021, with projected 2021 costs between $686,000 and $860,000 (we use $774,000 in our projections).
Manitou We developed two improvement scenarios for Manitou:
• Scenario 1: Priority Fixes Only – This focuses only on those issues already identified by the County, such as irrigation and bunkers, plus a few other priority items that we identified, including new

Ramsey County Golf Study Executive Summary
Sirius Golf Advisors, LLC 15
forward tees, adding an on-course restroom, and some renovation of the driving range. The purpose is primarily to sustain current performance.
• Scenario 2: Major Renovation – There is a need to rebuild all the infrastructure at Manitou. Such major work provides the opportunity to make significant improvements in the design. These renovations would provide a significant upgrade to the course’s quality. It also includes an expansion of the clubhouse to provide for a full grill operation. The range is relocated and expanded. These improvements are designed to dramatically improve performance.
Scenario 1’s renovations would start in 2020 with the building of a temporary hole and be completed in 2021. Excepted cost should be between $2.6 million and $3.3 million, adjusted for inflation. We use $2.96 million in our projections.
Scenario 2 will require the course be reduced to 9 holes during the renovation, which would likely last two to two and a half years, starting in 2021. The anticipated cost should be between $7.4 million and $10 million. We use $8.6 million in our projections.
Goodrich Like Manitou, we developed two scenarios. Positioning Goodrich as a value facility lessens the urgency of the repairs.
• Scenario 1: Priority Only – only the most pressing items is addressed but would include new forward tees. The purpose is primarily to sustain current performance.
• Scenario 2: Modest Renovation – this will be the rebuilding or renovation of all major course components, including irrigation, greens, tees and fairways. It does not include significant rerouting or expansion of the clubhouse as we anticipate the facility remaining a value course. These improvements are designed to dramatically improve performance.
Scenario One can be done in a year and would cost between $2.2 and $2.7 million, assuming a 2023 construction date. We use $2.45 million.
Scenario Two, like Scenario Two for Manitou, would require reducing the course to nine holes during construction. We anticipate a 2024 start date, with completion in 2026. Total Cost should be between $4 and $5.5 million. We use $4.77 million in our projections.
Battle Creek We developed three scenarios for Battle Creek, each taking the facility in an entirely different direction. All three are designed to improve performance.
• Scenario One: “Elite 9” – The course remains a challenging nine-hole course, but improvements are made to enhance performance and repair infrastructure. Enhanced performance will be realized with new tees on a couple of holes and adding target greens to the range.
• Scenario Two: Par 34 – We reduce the Par from 35 to 34 which will enable us to expand the range, essentially doubling the size of the tee, thus maximizing its potential. Parking would also be expanded. Will require some rerouting of the course.
• Scenario Three: 18 -holes – There is land potentially available across the street at the Corrections facility that would allow a second nine to be built, allowing Battle Creek to become a mid-fee 18-hole course. The new nine would also include a new clubhouse and range. This allows the existing range to become a stand-alone facility, thereby increasing its potential. It also allows for new revenue streams from a restaurant and banquet facilities. A tunnel is needed to go under Lower Afton Road.

Ramsey County Golf Study Executive Summary
Sirius Golf Advisors, LLC 16
Scenario One construction would occur in 2021. It should cost between $1,460,000 and $1,750,000. We use $1.6 million in our estimates.
Scenario Two, unlike One and Three, will require closing the facility for a year. In our model, that year is 2022, but it may need to be moved, if Manitou or Goodrich is being reduced to nine holes at that time. The estimated cost is between $2.7 million and $3.15 million. Our estimates assume $2,900,000.
One nice advantage of Scenario Three is that the existing facility would remain open while the new nine, clubhouse and range are built. When they are completed, the existing course can be closed for renovation. Thus, performance should not be adversely impacted during construction.
Scenario Three not only adds nine holes, it also adds a 6,000 sf clubhouse with restaurant and banquet seating for at least 150 guests. A second range is also added to service the golf course, allowing the existing facility to become a stand-alone range.
We have construction starting in 2021. The new nine would open in 2022, at which time the existing facility is renovated. The completed facility would open in 2024. The expected cost is between $9,200,000 and $11,130,000. $10,185,000 is used in our projections.
Projections We have tried to be conservative in our projections, keeping rounds projections well below course performance levels seen just five to ten years ago. The Status Quo scenarios all assume there are no major changes to operations, contracts, pricing philosophy or facilities. With the improvement scenarios, we assume that marketing, contract and operational changes begin in 2019. Our projections cover 2019-2028.
For each of the improvement scenarios (except Manitou), we developed two alternatives. One was to go with an Equalized Revenue contract that has the County continuing to maintain the course, and the other assumes a Hybrid contract, with the operator maintaining the course. We assumed that this would not affect revenue (although it might), but that the main impact is on the County’s costs. The splits and breakeven points were determined to keep the net revenue to the operator equivalent in the first year under the two options (hybrid vs. equalized revenue). We did not develop a separate Hybrid scenario for Manitou as its current contract is similar. The Hybrid contracts would not be in place for 2019.
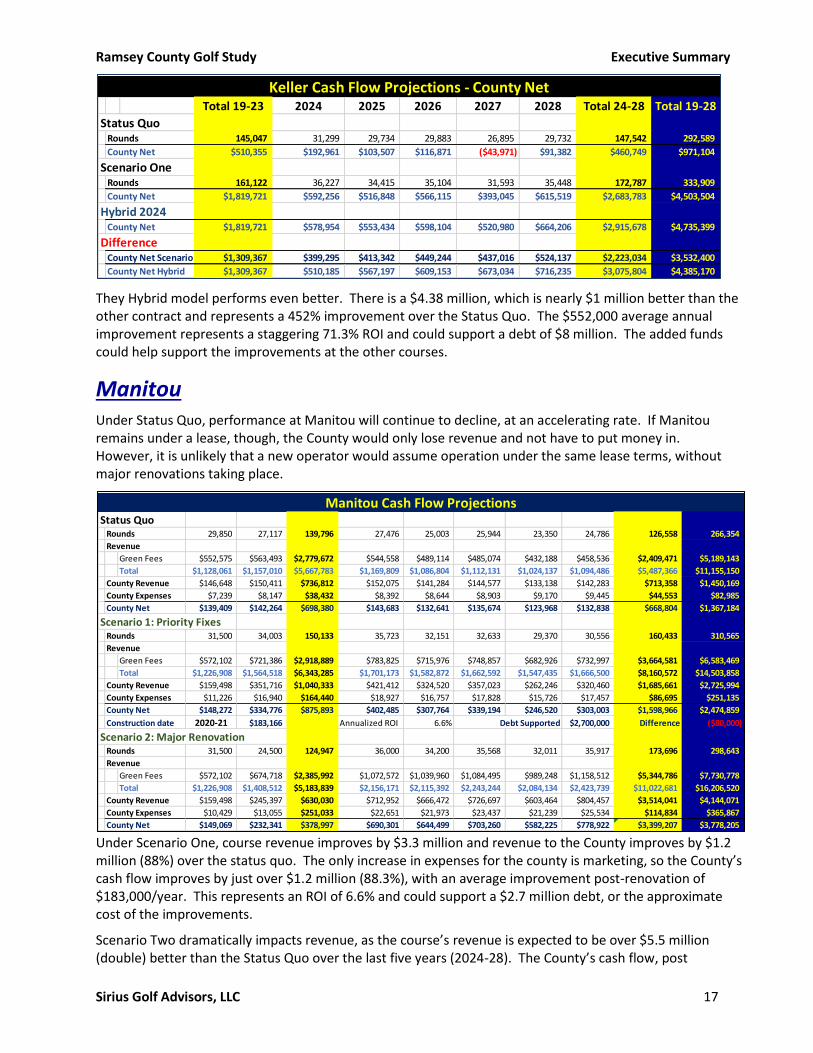
Keller Even with Status Quo, Keller will continue to be operationally profitable, although not enough that it covers the $800,000 debt payment from the 2014 construction. The one year we have it creating a negative cash flow is in the assumed bad weather year of 2027.
Under the improvement scenario, we are projecting an increase of $3,500,000 (360%) in net revenue (Net Operating Income or NOI) to the County over the 10-year period. Post-renovation cash flow to the County should improve an average of $421,000/year, providing a 54.41% annualized return on investment (ROI). The estimated $775,000 in construction costs would be paid back in 1.8 years. Alternatively, the improved cash flow can sustain a debt of $6,100,000.
Ramsey County Golf Study Executive Summary
Sirius Golf Advisors, LLC 17
They Hybrid model performs even better. There is a $4.38 million, which is nearly $1 million better than the other contract and represents a 452% improvement over the Status Quo. The $552,000 average annual improvement represents a staggering 71.3% ROI and could support a debt of $8 million. The added funds could help support the improvements at the other courses.
Manitou Under Status Quo, performance at Manitou will continue to decline, at an accelerating rate. If Manitou remains under a lease, though, the County would only lose revenue and not have to put money in. However, it is unlikely that a new operator would assume operation under the same lease terms, without major renovations taking place.
Under Scenario One, course revenue improves by $3.3 million and revenue to the County improves by $1.2 million (88%) over the status quo. The only increase in expenses for the county is marketing, so the County’s cash flow improves by just over $1.2 million (88.3%), with an average improvement post-renovation of $183,000/year. This represents an ROI of 6.6% and could support a $2.7 million debt, or the approximate cost of the improvements.
Scenario Two dramatically impacts revenue, as the course’s revenue is expected to be over $5.5 million (double) better than the Status Quo over the last five years (2024-28). The County’s cash flow, post
Total 19-23 2024 2025 2026 2027 2028 Total 24-28 Total 19-28
Status QuoRounds 145,047 31,299 29,734 29,883 26,895 29,732 147,542 292,589
County Net $510,355 $192,961 $103,507 $116,871 ($43,971) $91,382 $460,749 $971,104
Scenario OneRounds 161,122 36,227 34,415 35,104 31,593 35,448 172,787 333,909
County Net $1,819,721 $592,256 $516,848 $566,115 $393,045 $615,519 $2,683,783 $4,503,504
Hybrid 2024County Net $1,819,721 $578,954 $553,434 $598,104 $520,980 $664,206 $2,915,678 $4,735,399
DifferenceCounty Net Scenario 1 $1,309,367 $399,295 $413,342 $449,244 $437,016 $524,137 $2,223,034 $3,532,400
County Net Hybrid $1,309,367 $510,185 $567,197 $609,153 $673,034 $716,235 $3,075,804 $4,385,170
Keller Cash Flow Projections - County Net
Status QuoRounds 29,850 27,117 139,796 27,476 25,003 25,944 23,350 24,786 126,558 266,354
Revenue
Green Fees $552,575 $563,493 $2,779,672 $544,558 $489,114 $485,074 $432,188 $458,536 $2,409,471 $5,189,143
Total $1,128,061 $1,157,010 $5,667,783 $1,169,809 $1,086,804 $1,112,131 $1,024,137 $1,094,486 $5,487,366 $11,155,150
County Revenue $146,648 $150,411 $736,812 $152,075 $141,284 $144,577 $133,138 $142,283 $713,358 $1,450,169
County Expenses $7,239 $8,147 $38,432 $8,392 $8,644 $8,903 $9,170 $9,445 $44,553 $82,985
County Net $139,409 $142,264 $698,380 $143,683 $132,641 $135,674 $123,968 $132,838 $668,804 $1,367,184
Scenario 1: Priority FixesRounds 31,500 34,003 150,133 35,723 32,151 32,633 29,370 30,556 160,433 310,565
Revenue
Green Fees $572,102 $721,386 $2,918,889 $783,825 $715,976 $748,857 $682,926 $732,997 $3,664,581 $6,583,469
Total $1,226,908 $1,564,518 $6,343,285 $1,701,173 $1,582,872 $1,662,592 $1,547,435 $1,666,500 $8,160,572 $14,503,858
County Revenue $159,498 $351,716 $1,040,333 $421,412 $324,520 $357,023 $262,246 $320,460 $1,685,661 $2,725,994
County Expenses $11,226 $16,940 $164,440 $18,927 $16,757 $17,828 $15,726 $17,457 $86,695 $251,135
County Net $148,272 $334,776 $875,893 $402,485 $307,764 $339,194 $246,520 $303,003 $1,598,966 $2,474,859
Construction date 2020-21 $183,166 Annualized ROI 6.6% Debt Supported $2,700,000 Difference ($80,000)
Scenario 2: Major RenovationRounds 31,500 24,500 124,947 36,000 34,200 35,568 32,011 35,917 173,696 298,643
Revenue
Green Fees $572,102 $674,718 $2,385,992 $1,072,572 $1,039,960 $1,084,495 $989,248 $1,158,512 $5,344,786 $7,730,778
Total $1,226,908 $1,408,512 $5,183,839 $2,156,171 $2,115,392 $2,243,244 $2,084,134 $2,423,739 $11,022,681 $16,206,520
County Revenue $159,498 $245,397 $630,030 $712,952 $666,472 $726,697 $603,464 $804,457 $3,514,041 $4,144,071
County Expenses $10,429 $13,055 $251,033 $22,651 $21,973 $23,437 $21,239 $25,534 $114,834 $365,867
County Net $149,069 $232,341 $378,997 $690,301 $644,499 $703,260 $582,225 $778,922 $3,399,207 $3,778,205
Manitou Cash Flow Projections
Ramsey County Golf Study Executive Summary
Sirius Golf Advisors, LLC 18
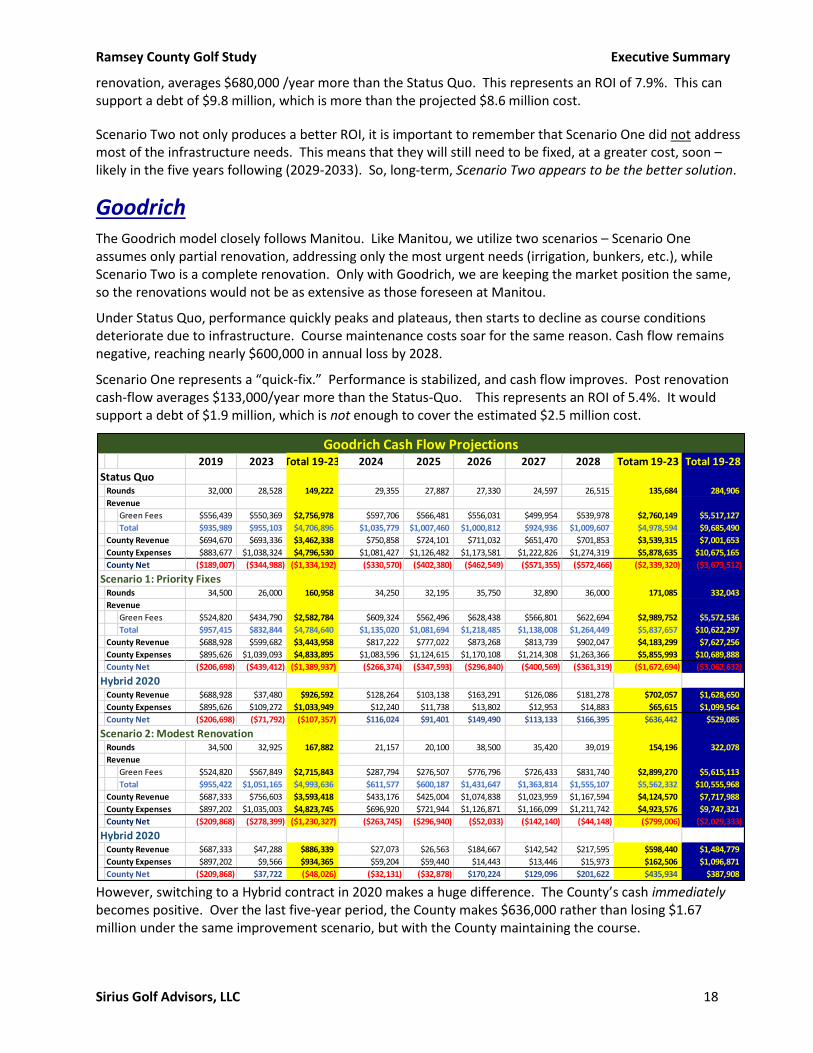
renovation, averages $680,000 /year more than the Status Quo. This represents an ROI of 7.9%. This can support a debt of $9.8 million, which is more than the projected $8.6 million cost.
Scenario Two not only produces a better ROI, it is important to remember that Scenario One did not address most of the infrastructure needs. This means that they will still need to be fixed, at a greater cost, soon – likely in the five years following (2029-2033). So, long-term, Scenario Two appears to be the better solution.
Goodrich The Goodrich model closely follows Manitou. Like Manitou, we utilize two scenarios – Scenario One assumes only partial renovation, addressing only the most urgent needs (irrigation, bunkers, etc.), while Scenario Two is a complete renovation. Only with Goodrich, we are keeping the market position the same, so the renovations would not be as extensive as those foreseen at Manitou.
Under Status Quo, performance quickly peaks and plateaus, then starts to decline as course conditions deteriorate due to infrastructure. Course maintenance costs soar for the same reason. Cash flow remains negative, reaching nearly $600,000 in annual loss by 2028.
Scenario One represents a “quick-fix.” Performance is stabilized, and cash flow improves. Post renovation cash-flow averages $133,000/year more than the Status-Quo. This represents an ROI of 5.4%. It would support a debt of $1.9 million, which is not enough to cover the estimated $2.5 million cost.
However, switching to a Hybrid contract in 2020 makes a huge difference. The County’s cash immediately becomes positive. Over the last five-year period, the County makes $636,000 rather than losing $1.67 million under the same improvement scenario, but with the County maintaining the course.
2019 2023 Total 19-23 2024 2025 2026 2027 2028 Totam 19-23 Total 19-28
Status QuoRounds 32,000 28,528 149,222 29,355 27,887 27,330 24,597 26,515 135,684 284,906
Revenue
Green Fees $556,439 $550,369 $2,756,978 $597,706 $566,481 $556,031 $499,954 $539,978 $2,760,149 $5,517,127
Total $935,989 $955,103 $4,706,896 $1,035,779 $1,007,460 $1,000,812 $924,936 $1,009,607 $4,978,594 $9,685,490
County Revenue $694,670 $693,336 $3,462,338 $750,858 $724,101 $711,032 $651,470 $701,853 $3,539,315 $7,001,653
County Expenses $883,677 $1,038,324 $4,796,530 $1,081,427 $1,126,482 $1,173,581 $1,222,826 $1,274,319 $5,878,635 $10,675,165
County Net ($189,007) ($344,988) ($1,334,192) ($330,570) ($402,380) ($462,549) ($571,355) ($572,466) ($2,339,320) ($3,673,512)
Scenario 1: Priority FixesRounds 34,500 26,000 160,958 34,250 32,195 35,750 32,890 36,000 171,085 332,043
Revenue
Green Fees $524,820 $434,790 $2,582,784 $609,324 $562,496 $628,438 $566,801 $622,694 $2,989,752 $5,572,536
Total $957,415 $832,844 $4,784,640 $1,135,020 $1,081,694 $1,218,485 $1,138,008 $1,264,449 $5,837,657 $10,622,297
County Revenue $688,928 $599,682 $3,443,958 $817,222 $777,022 $873,268 $813,739 $902,047 $4,183,299 $7,627,256
County Expenses $895,626 $1,039,093 $4,833,895 $1,083,596 $1,124,615 $1,170,108 $1,214,308 $1,263,366 $5,855,993 $10,689,888
County Net ($206,698) ($439,412) ($1,389,937) ($266,374) ($347,593) ($296,840) ($400,569) ($361,319) ($1,672,694) ($3,062,632)
Hybrid 2020County Revenue $688,928 $37,480 $926,592 $128,264 $103,138 $163,291 $126,086 $181,278 $702,057 $1,628,650
County Expenses $895,626 $109,272 $1,033,949 $12,240 $11,738 $13,802 $12,953 $14,883 $65,615 $1,099,564
County Net ($206,698) ($71,792) ($107,357) $116,024 $91,401 $149,490 $113,133 $166,395 $636,442 $529,085
Scenario 2: Modest RenovationRounds 34,500 32,925 167,882 21,157 20,100 38,500 35,420 39,019 154,196 322,078
Revenue
Green Fees $524,820 $567,849 $2,715,843 $287,794 $276,507 $776,796 $726,433 $831,740 $2,899,270 $5,615,113
Total $955,422 $1,051,165 $4,993,636 $611,577 $600,187 $1,431,647 $1,363,814 $1,555,107 $5,562,332 $10,555,968
County Revenue $687,333 $756,603 $3,593,418 $433,176 $425,004 $1,074,838 $1,023,959 $1,167,594 $4,124,570 $7,717,988
County Expenses $897,202 $1,035,003 $4,823,745 $696,920 $721,944 $1,126,871 $1,166,099 $1,211,742 $4,923,576 $9,747,321
County Net ($209,868) ($278,399) ($1,230,327) ($263,745) ($296,940) ($52,033) ($142,140) ($44,148) ($799,006) ($2,029,333)
Hybrid 2020County Revenue $687,333 $47,288 $886,339 $27,073 $26,563 $184,667 $142,542 $217,595 $598,440 $1,484,779
County Expenses $897,202 $9,566 $934,365 $59,204 $59,440 $14,443 $13,446 $15,973 $162,506 $1,096,871
County Net ($209,868) $37,722 ($48,026) ($32,131) ($32,878) $170,224 $129,096 $201,622 $435,934 $387,908
Goodrich Cash Flow Projections

Ramsey County Golf Study Executive Summary
Sirius Golf Advisors, LLC 19
The post improvement cash flow is $608,000 per year better than the Status Quo, representing an ROI of 23.8%. It could support an $8.8 million debt.
Cash flow is even stronger under Scenario Two, even making up for the year it was reduced for construction. The average post-renovation cash flow averages $456,000/year better than the Status Quo, enough to generate a strong 9.6% ROI. The improvement in cash flow would support a %.5 million debt, well in excess of the projected $4.77 million cost. However, the county’s cash flow remains negative.
Switching to a Hybrid contract changes everything. Now the cash flow is positive every year. The post-renovation cash-flow averages $702,000 over Status Quo, representing an ROI of 14.4% and able to support a $10,200,000 debt – more than double the projected cost.
Like Manitou, Scenario Two has the advantage as it represents a long-term solution to the infrastructure needs, while Scenario One only delays expensive renovations by several years. In either case, though, the hybrid contract is the biggest difference maker.
Battle Creek Under the Status Quo, Battle Creek is expected to continue to lose money. The amount of loss will increase as infrastructure needs start to impact performance. Over the next ten-years, we are projecting a loss of ($3,970,000).
The “Elite Nine” (Scenario One) option puts immediate breaks on the slide, but the facility is still expected to lose money. We project a ten-year cash flow of ($2,800,000), which is $1.1 million better than the Status Quo. The average improvement after renovation is $149,000, generating an ROI of 9.2%, and able to support $2.2 million in debt, more than enough to cover the projected $1.6 million cost.
Once again, though, converting to a Hybrid (1a) changes the operation from a money-loser to a money maker. Over the ten-year period, we project a positive cash flow of $208,000, which is $4.1 million better than the status quo, and about $3 million better than under the current style contract. The average improvement over status quo after renovation is $494,000, for a 29.6% ROI and enough to support a $7.1 million debt.
The big issue with Scenario Two is that, while it will maximize range performance, the course is expected to do worse than under Scenario One because a Par 34 is a lot less popular than a Par 35, especially among more affluent or lower-handicap golfers. It also requires the facility to be closed an entire year (2022) for construction. Overall, though, we expect better performance, with a post-renovation cash flow averaging about $193,000 more per year than the Status Quo and $44,000 better than Scenario One A. However, the cost is more and the return less (6.7% ROI). The difference in cash flow from the Status Quo would cover a $2.8 million debt, about $100,000 short of the projected cost.
The Hybrid version (2a), though, is profitable throughout, except for the construction year, when a subsidy to the operator is required. The 10-year total cash flow is expected to be a positive $3,080,000 – or $4.2 million better than the Status Quo. The average improvement is $502,000 after renovation, producing a 16.4% ROI and able to support a $7.3 million debt, more than twice as much as needed ($3,060,000).
Naturally, Scenario Three generates a lot more revenue post renovation than any of the other three scenarios. In the five years post renovation, the facility is expected to generate $9 million more in revenue than the Status Quo and $7.8 million more than Scenarios 1 and 2.
County Cash Flow is also dramatically improved. In fact, cash flow becomes positive after construction. With a $1.5 million positive cash flow over the last five years. Post-renovation cash flow is projected to average $753,000 more per year than the Status Quo. This generates an ROI of 7.4%, and can support $10.9 million in debt, enough to cover the projected $10.2 million cost.

Ramsey County Golf Study Executive Summary
Sirius Golf Advisors, LLC 20
When we add the Hybrid contract to Scenario 3, we find that cash flow is positive every year except 2019 (before the Hybrid contract) and 2022 (due to construction). The post construction cash flow is expected to be $3.8 million to the County, or more than double that with Scenario 3a. The difference in cash flow post construction between this scenario and the Status Quo averages $1.15 million/year. This generates a strong 11% ROI and can support a $16.6 million debt, or about 1.5 times more than needed to cover the cost.
Regardless of the preferred improvement scenario, clearly converting to a Hybrid contract makes the biggest improvement in the County’s cash flow. However, Scenario 3 maximizes the profitability potential of the facility – both as a practice facility and as a golf course. The improvement in cash flow more than covers the cost.
Discussion On October 8th, 2018, the County took a major step towards improving its golf facilities by declaring the direction they want for them. It is not so much that the decision was made to maximize profitability that mattered the most, but that a clear direction was established. Part of the issue today is that the operations
Battle Creek 2019 2023 Total 19-23 2024 2025 2026 2027 2028 Totam 19-23 Total 19-28
Status QuoRounds 18,150 18,239 89,195 18,880 17,936 17,757 15,981 16,864 87,420 176,615
Revenue
Green Fees $202,188 $225,937 $1,060,281 $249,234 $236,333 $246,722 $219,422 $246,708 $1,198,418 $2,258,698
Total $598,674 $676,458 $3,142,288 $732,367 $714,871 $731,780 $676,877 $738,251 $3,594,146 $6,736,434
County Revenue $407,271 $457,287 $2,135,816 $495,610 $483,924 $495,441 $459,564 $499,823 $2,434,362 $4,570,177
County Expenses $714,905 $824,996 $3,844,630 $855,182 $895,167 $937,164 $981,280 $1,027,628 $4,696,420 $8,541,050
County Net ($307,635) ($367,709) ($1,708,814) ($359,572) ($411,243) ($441,723) ($521,716) ($527,805) ($2,262,058) ($3,970,873)
Scenario 1: "Elite" 9Rounds 19,500 20,458 99,033 21,910 20,814 21,000 18,900 20,627 103,252 202,284
Revenue
Green Fees $249,419 $310,789 $1,389,571 $345,847 $333,970 $346,939 $313,187 $356,330 $1,696,272 $3,085,843
Total $720,818 $889,858 $3,928,585 $986,629 $968,810 $1,011,449 $940,872 $1,063,361 $4,971,121 $8,899,705
County Revenue $491,232 $608,497 $2,676,820 $674,691 $662,389 $691,522 $643,152 $726,932 $3,398,686 $6,075,507
County Expenses $750,185 $866,834 $4,035,767 $899,506 $931,804 $966,177 $1,000,293 $1,038,398 $4,836,179 $8,871,946
County Net ($258,953) ($258,337) ($1,358,947) ($224,814) ($269,416) ($274,654) ($357,142) ($311,466) ($1,437,492) ($2,796,439)
Hybrid 2020County Revenue $491,232 $64,979 $687,582 $98,910 $82,197 $92,218 $52,236 $97,514 $423,076 $1,110,657
County Expenses $750,185 $9,951 $848,284 $10,250 $10,557 $10,874 $11,200 $11,536 $54,416 $902,700
County Net ($258,953) $55,028 ($160,702) $88,660 $71,640 $81,345 $41,037 $85,978 $368,660 $207,958
Scenario 2: Par 34, Expanded RangeRounds 19,500 19,000 76,700 19,768 18,779 19,372 17,435 19,029 94,383 171,083
Revenue
Green Fees $249,419 $216,024 $985,467 $231,921 $227,668 $241,925 $217,207 $247,659 $1,166,381 $2,151,848
Total $720,818 $843,484 $3,146,118 $953,201 $939,395 $1,003,076 $933,180 $1,054,564 $4,883,416 $8,029,534
County Revenue $491,232 $578,339 $2,093,027 $657,580 $648,240 $692,192 $643,858 $727,646 $3,369,516 $5,462,542
County Expenses $750,185 $823,196 $3,616,472 $854,455 $885,072 $917,929 $950,162 $986,306 $4,593,925 $8,210,397
County Net ($258,953) ($244,858) ($1,523,445) ($196,875) ($236,832) ($225,737) ($306,304) ($258,660) ($1,224,410) ($2,747,855)
Hybrid 2023County Revenue $491,232 $45,522 $1,560,210 $87,870 $73,069 $92,650 $52,692 $97,974 $404,256 $1,964,466
County Expenses $750,185 $9,647 $2,802,923 $9,937 $10,235 $10,542 $10,858 $11,184 $52,756 $2,855,678
County Net ($258,953) $35,874 ($1,242,713) $77,933 $62,834 $82,109 $41,834 $86,790 $351,500 ($891,213)
Scenario 3: 18 HolesRounds 19,500 22,750 100,700 32,000 30,400 31,008 27,907 31,312 152,627 253,327
Revenue
Green Fees $249,419 $347,682 $1,414,456 $840,545 $816,449 $860,082 $784,652 $919,155 $4,220,883 $5,635,339
Total $720,818 $1,260,634 $4,325,359 $2,533,485 $2,496,273 $2,631,949 $2,465,459 $2,844,365 $12,971,532 $17,296,891
County Revenue $491,232 $745,421 $2,836,289 $1,639,892 $1,607,658 $1,705,317 $1,575,807 $1,855,897 $8,384,571 $11,220,859
County Expenses $750,185 $931,876 $4,101,260 $1,240,494 $1,284,807 $1,333,460 $1,379,381 $1,435,378 $6,673,520 $10,774,780
County Net ($258,953) ($186,455) ($1,264,971) $399,398 $322,850 $371,857 $196,427 $420,519 $1,711,051 $446,080
Hybrid 2020County Revenue $491,232 $220,817 $855,084 $728,845 $697,278 $759,642 $658,062 $852,433 $3,696,260 $4,551,344
County Expenses $750,185 $35,131 $1,023,464 $10,467 $10,781 $11,105 $11,438 $11,781 $55,573 $1,079,037
County Net ($258,953) $185,686 ($168,380) $718,378 $686,496 $748,537 $646,624 $840,651 $3,640,687 $3,472,306
Battle Creek Cash Flow Projections

Ramsey County Golf Study Executive Summary
Sirius Golf Advisors, LLC 21
have no real direction. In some respects, they are being operated as an amenity – like a park, but without the willingness to subsidize to a great degree. In other ways, they are taking a more for-profit approach by privatizing to a degree. The mixed bag of directions results in the facilities not doing well either as an amenity or a profit center.
Now that the direction has been established, there are many more tough decisions ahead in order to really move strongly in the preferred direction. In our minds, the most important decisions to make are:
• Contracts: Revising the operator contracts. The biggest issue being whether to include course maintenance. But there is more than one concern. They include:
o Maintenance: Do you include course maintenance? If the goal is to maximize profitability and reduce risk to the county, the answer is clearly a “yes”. This would then trigger other questions such as “when?” and “what do you do with current employees?” In our Discussion section, we deal with these and other related issues.
o Type of Contract: Our preference is for a Hybrid contract, where the operator is responsible for all operating expenses and the County responsible for capital improvements. It also has a breakpoint that is established to help the operator cover the operating expenses. The breakpoint is established at a point where the operation should become profitable for the operator (break-even). Below this number, the operator gets the lion share of the revenue. Above, the County does. We give a detailed discussion of the pros and cons of various types of contracts in the Discussion section.
o Single Operator: There are a lot of reasons why a single operator is better – improves efficiency, better marketing, better cooperation, easier to administer, etc. But that is only if a good operator is selected. On the other hand, the existing operators have proven quite capable. Our recommendation is that the County allow for the possibility of a single operator by having all existing contracts terminate at the same time. Then with the next RFP, allow respondents to bid on managing one, two or all the facilities. The County can then judge what is best for them at that time.
• Capital Improvements: There are several considerations here, including:
o Courses: What courses should be prioritized? We have Manitou as being the top priority and Goodrich the lowest because we recommend reducing the fees at Goodrich, which makes course conditions less of a concern. Battle Creek is our next priority.
o Scenario: What scenario, of the ones we presented, should be followed for each facility? We recommend Scenario 1b for Keller, 2b for Manitou and Goodrich and 3b for Battle Creek.
o Modifications: How should the recommended scenarios be modified to best meet the needs of the County at the time of improvements? There are likely some individual items that may need to be added, and others that may be removed or modified.
o Budget: How much is the County willing to invest and over what period? How are the improvements to be financed? A word of caution – using tax-free bonds can trigger IRS regulations that impact the nature of the operator contracts and how they are incentivized.
o Timing: What courses, when? We do recommend that the improvements be timed so that there aren’t two or more of the facilities closed or reduced to 9 holes at the same time.
In several ways, the County faces a “Pay now, or Pay Much More Later” situation with its golf facilities, especially Manitou, Goodrich and Battle Creek. They are all in need of significant capital improvements or a change in direction, or both. Construction costs are increasing at a rate much higher than inflation, so the sooner the better as far as minimizing costs are concerned.

Ramsey County Golf Study Executive Summary
Sirius Golf Advisors, LLC 22
• Market Positioning: We recommend that Keller, Goodrich and Battle Creek be repositioned in order to maximize the County’s overall reach into the marketplace and reduce the competition among RC Golf facilities with themselves. We feel Keller should be repositioned as a Premium facility, with a modest price increase (assuming the Food and Beverage situation is fixed in relation to golf), and Goodrich should be repositioned as a Value facility, lowering its fees. We also feel that the “Elite Nine” option is the best short-term solution for Battle Creek, which means not only greatly improved marketing, but also increasing its fee structure.
• Pricing: Along with market positioning, there is the need for a new pricing philosophy. We have provided recommendations for fees for the 2019 season. They include a significantly revamped Patron program and a return to Weekend rates. Going forward and assuming revised contracts with the operators that provide, at a minimum, an equitable split of revenue and the elimination of potential conflicts of interest, we recommend that the operators be given much more control over pricing, with the County providing only a range for the fees. Fees should then be able to be adjusted as needed, rather than every other year.
• Marketing: If you are looking for the one thing that would have the most immediate impact, it is to dramatically improve marketing. This is going to require a major commitment, not only in terms of budget (we are recommending that at least 2% of the total gross revenue from the facilities be dedicated to marketing), but also expertise. We feel the best solution is to bring in an outside firm with experience in golf course marketing, to manage the marketing program. Part of our recommended marketing strategy is to develop programs to reach new golfers, as well as to target specific groups such as women.
• Accessibility and Appeal: We feel it is important to develop programming (including pricing strategies) that make the facilities more accessible to golfers of all income brackets, as well as to make the sport more attractive to the women and to the Latent market. Specifically:
o Latent Golfers: Develop a beginner’s package that includes free rental clubs, lessons, range balls, green and cart fees, etc. Provide more free or low-cost clinics for those who want to learn but are not currently playing.
o Women: All of the facilities need to do a better job with women golfers. Changes needed include:
▪ Forward Tees: The courses are too long for women, especially Manitou. Ideally, the forward tee should be no more than 4,500 to 4,600 yards to make it the equivalent of the most preferred tee yardage for men.
▪ Staff: Golfers want to see people behind the counter that resemble them. This applies to gender as well as other demographics such as age and race.
▪ Food & Beverage: Menus need to have healthier choices such as wraps, salads and fruit.
▪ Merchandise: There needs to be more and higher quality goods for women.
• Keller Food and Beverage: During our inspection, the Keller food and beverage operation, as it related to golf, was terrible. This was addressed to a degree by Lancer towards the end of our study with the hiring of a new General Manager for Keller. However, it remains to be seen whether this will be sufficient. It is essential that customer service be improved for golfers – both in the grill and especially with the beverage cart. The beverage cart should be a standard service offering to ALL golfers who play. It should not be restricted to hours that are most profitable for the vendor. It needs to be part of the overall golf experience. Our recommendation is that beverage cart service, at a minimum, be from two hours after first teetime to two hours before dusk. High demand times

Ramsey County Golf Study Executive Summary
Sirius Golf Advisors, LLC 23
will require two beverage carts in order to best service the golfers. The goal should be to see each group at least twice per nine holes.
The impact of the combination of recommended improvements along with converting to hybrid contracts, is dramatic. Assuming the optimal improvement scenario for all four courses, over the next ten years we anticipate an $18 million improvement over the Status Quo. Moreover, the improvements made should minimize the need for any other major improvements for the following 10 years as well. Thus, putting RC Golf on a strong and stable financial footing for at least the next two decades.
We believe that RC Golf has a very bright future. It has an opportunity to not only be profitable, but also be a better amenity to its citizens by reaching more of them. RC Golf can indeed become a model for all municipal operations. The County has already taken the first important step.
2019 2023 Total 19-23 2024 2027 2028 Totam 19-23 Total 19-28
Combined
Status QuoRounds 109,515 103,544 523,261 107,010 90,822 97,897 497,204 1,020,465
Revenue
Green Fees $2,151,156 $2,279,956 $11,006,583 $2,450,257 $2,093,983 $2,365,258 $11,551,336 $22,557,919
Total $5,353,466 $5,830,529 $27,722,663 $6,229,808 $5,865,074 $6,429,023 $30,823,564 $58,546,227
County Revenue $2,433,516 $2,628,524 $12,564,976 $2,865,773 $2,622,276 $2,910,555 $14,011,941 $26,576,917
County Expenses $2,668,197 $3,100,092 $14,399,247 $3,219,270 $3,635,351 $3,786,606 $17,483,767 $31,883,014
County Net ($234,681) ($471,568) ($1,834,271) ($353,497) ($1,013,075) ($876,051) ($3,471,825) ($5,306,097)
Recommended (Goodrich Opt 2; Manitou Opt 2; BC Opt 3)Rounds 117,000 114,995 554,651 125,384 126,932 141,695 653,305 1,207,957
Revenue
Green Fees $2,330,448 $2,817,636 $11,857,818 $3,520,595 $3,728,125 $4,347,519 $19,076,638 $30,934,457
Total $5,921,186 $7,429,005 $30,943,950 $9,249,165 $9,876,104 $11,272,249 $49,978,807 $80,922,756
County Revenue $2,744,311 $2,279,106 $10,068,878 $2,181,830 $2,043,681 $2,693,137 $11,397,114 $21,465,992
County Expenses $2,755,348 $1,312,946 $8,086,566 $102,136 $56,674 $64,325 $384,734 $8,471,299
County Net ($11,037) $966,160 $1,982,312 $2,079,694 $1,987,008 $2,628,812 $11,012,381 $12,994,693
DifferenceRounds 7,485 11,451 31,391 18,374 36,110 43,798 156,101 187,492
Revenue
Green Fees $179,292 $537,679 $851,235 $1,070,337 $1,634,142 $1,982,262 $7,525,302 $8,376,538
Total $567,719 $1,598,476 $3,221,287 $3,019,357 $4,011,029 $4,843,226 $19,155,242 $22,376,529
County Revenue $310,795 ($349,418) ($2,496,098) ($683,943) ($578,595) ($217,418) ($2,614,827) ($5,110,925)
County Expenses $87,151 ($1,787,146) ($6,312,681) ($3,117,134) ($3,578,677) ($3,722,281) ($17,099,033) ($23,411,714)
County Net $223,644 $1,437,728 $3,816,584 $2,433,191 $3,000,082 $3,504,863 $14,484,206 $18,300,790
Combined Cash Flow Projections - Receommended Scenarios
Ramsey County Golf Study Introduction
Sirius Golf Advisors, LLC 24
Sirius Golf Advisors, LLC was retained by the Parks Department of Ramsey County to do a thorough review of its golf operation. This review was to cover the following:
• Financial Review
• Facility Review
• Capital Improvements Assessment
• Operations
• Competition
• Market Analysis
• Agronomy
• National Trends
• Contracts
• Fees
• Marketing
In short, it was to cover virtually every aspect of the golf operations and related facilities with the goal to provide an objective assessment of its current situation, with regards to the physical amenities, performance, operations, operators, and their current relative position in the marketplace. And then to use this information to make recommendations as to how to improve performance and to lay out a plan for success over the next decade.
Sirius Golf Advisors, LLC is a golf course consulting firm, head-quartered in Columbus, Georgia. It specializes in working with municipal facilities, and over the last 22 years, has worked with 54 different municipal entities, ranging in size from communities of a few thousand people, to entire states and to the US Air Force. Many of these studies have been as a subcontractor to the National Golf Foundation.
This study was led by the President of Sirius Golf, John S. Wait, who served as both principal investigator and primary author. Assisting him were:
• Jeffrey D Brauer, ASGCA – Golf Course Architect
o Jeff is one of the leading golf course architects in the country. He is a past president of the American Golf Course Superintendent’s Association and has several courses listed among the top 100 public courses in the country. He is one of a few architects to win Golf Digest’s prestigious “Best New Public Golf Course” award. Notably, he designed three of the top four in Minnesota – The Quarry, The Legend and The Wilderness at Fortune’s Bay
• David S. Downing II, CGCS – Agronomist
o David is a past president of the Golf Course Superintendent’s Association. In addition to his experience as a course superintendent, he has built golf courses from the ground up, and has operating experience.
• Erik Christensen, TCEQ, ASIC – Certified Irrigation Designer
o Erik is familiar with the courses, having consulted with the county in years past.
• The National Golf Foundation, Jupiter, Florida
o The National Golf Foundation (NGF), a non-profit organization funded by the golf industry, is known as the leading disseminator of statistics in the golf industry. Their annual survey of golfers provides a rich field of information.

Ramsey County Golf Study Introduction
Sirius Golf Advisors, LLC 25
Procedure Over the summer, our team conducted six site visits. During these visits we:
• Examined the Facilities: Did a thorough examination of the physical facilities, concentrating mostly on issues relating to the golf courses.
• Interviewed:
o Operators, superintendents, and key personnel at each facility
o Parks Staff
o County Commissioners
o Members of the Parks and Recreation Commission
• Took Soil Samples
• Observed operations
• Surveyed Competition
o Personally visited all public courses within 20 miles of an RGC facility
In addition, we:
• Conducted Detailed Customer Survey
o We utilized NGF’s golf course survey, which allowed us to compare our results to the national database
o Collected key demographic information
o Determined primary competitors for each facility
o Added custom questions
• Analyzed Financial Records
o Did thorough review of records from the past three years
• Gathered Market Data
o Did demographic analysis for state, metro area and 5, 10, and 20-mile radii from each facility
o Used NGF to:
▪ Assess Golf Demand in each of the above areas
▪ Predict number of golfers in each area
▪ Predict number of rounds produced in each area
o Collected information on all golf facilities in the metropolitan area
o Reviewed information on golf facilities that have closed in last 10 years in the metro area.
o Examined national trends
• Reviewed Operator Contracts with the County
Overview The county has six golf facilities – five golf courses and a golf dome. The facilities are spread across the County, although none are in the County’s largest city, St. Paul, which has its own municipal golf system.

Ramsey County Golf Study Introduction
Sirius Golf Advisors, LLC 26
The five golf courses include three regulation 18-hole courses – Keller Golf Course (“Keller”), Manitou Ridge Golf Course (“Manitou”) and Goodrich Golf Course (“Goodrich”). Keller and Goodrich have management contracts where the operator is responsible for golf operations and related expenses, while the county maintains the course and is responsible for capital improvements. Manitou is under a short-term lease, recently renewed, whereby the operator is responsible for all operating expenses, including course maintenance, and the County is responsible for all capital improvements.
Keller has a rich history that includes hosting two PGA championships golf tournaments. It was recently completely renovated in 2014 at a cost of $12 million. The renovation included a new clubhouse and banquet center. The clubhouse, along with the food and beverage operation, is operated under a separate management contract and a different vendor than the golf operation. Keller is the most expensive of the RC Golf facilities to play, followed by Manitou than Goodrich (of the 18-hole courses). Goodrich and Keller are both in Maplewood, while Manitou is in White Bear Lake.
Ponds at Battle Creek (“Battle Creek”) is a nine-hole regulation golf course located across from the County’s detention center in Maplewood. It is the newest of the courses, having opened in 2004. It features a practice facility that is arguably the best in the county. It is managed by the same operator as Goodrich under a similar, but not the same, contract.
The fifth golf course is Island Lake Golf Course (“Island”) located in Shoreview. It is a Par 28 executive course with a large driving range. It also has a dormant miniature golf course that has been closed for several years. Island Lake is operated under a capital lease, with the operator responsible for all expenses, including capital improvements. The operator built the facility on County land.
Midwest Golf Dome (“MGD”) is located across the street from Goodrich and shares the parking lot with Aldrich Arena. It is also operated under a long-term lease where the operator is responsible for all operating and capital improvement expenses. The operator built the structure.
While we do cover both Island Lake and Goodrich Golf Dome in this report, our emphasis is on the other facilities. This is because both Island Lake and the Golf Dome are under long-term capital leases under which the county has no expenses, including capital improvements. Further, the County has little influence over the operation of these facilities.

Ramsey County Golf Study Market Conditions
Sirius Golf Advisors, LLC 27
In this section, we will talk about market conditions that affect performance. This includes demographics, both present and future; trends in golf; and golf demand.
National Trends The golf industry has certainly slowed down as compared to the golden days from the 1980s through the turn of the 20th century, and especially the years 1993-2001.
There are three basic measures commonly examined with regards to the popularity of golf:
• Golf Participation: How many people are playing golf
• Number of Rounds: How many rounds of golf are being played
• Number of Facilities: How many golf facilities there are.
All three of these measures peaked during the first decade of this century and have been declining, more or less, since then. This decline has led many Chicken Little wannabes to shout, “the sky is falling” or rather “golf is dying.” However, to paraphrase Mark Twain, “the news of (golf’s) death is greatly exaggerated”—as a closer examination of the facts will reveal.
For one thing, golf has been around for 500 years. It is not likely to disappear overnight. In fact, world-wide, the sport is growing as its inclusion in the most recent Olympics illustrates. Economically, golf’s influence in the U.S. is huge. The industry generates over $70 billion, employs nearly 2 million people and produces about $55.6 billion in wage income. An estimated 81 million people, including 62 million non-golfers, watched golf on TV last year, while 27 million read about golf. In total, an estimated 97.6 million Americans – one out of three – either played golf, watched golf or read about golf last year, this is up 2.6 million from just two years prior. So, interest in golf is still strong.
It is true that golf participation, rounds, and number of facilities have declined over the past 10 years. However, they are still higher than at any time in history prior to 1995. It is also important to note that there are as many people who express an interest in taking up golf but who do not currently play as there are current players.
While socio-demographic, financial and cultural headwinds certainly persist for golf, the industry continued its macro trend toward stabilization in 2015-2017. The game remains popular and is fortunate to have a deep well of interested prospects. While golf’s pay-for-play green fee revenues and other spending will always be vulnerable to outside forces such as weather and the economy, its chief challenge remains getting more of those non-golfers who express interest in playing (‘latent demand’) to give golf a try and converting more beginners into committed participants.
Still, some socioeconomic and demographic trends continue to present challenges for golf operators. For instance, golf is having trouble attracting and retaining young adults (i.e., Millennials); though this segment continues to account for a large percentage of annual play and spending, factors such as debt and competing recreational activities have suppressed golf demand from this segment. The smartest, best-managed and most innovative golf facilities will win market share and have the best opportunity for growth.
Participation According to the National Golf Foundation (NGF), which is the acknowledged leader in golf research, 24.1 million Americans played golf last year. (This includes those who played at alternative facilities such as Par 3

Ramsey County Golf Study Market Conditions
Sirius Golf Advisors, LLC 28
courses). This number is down slightly from the 24.7 million estimated in each of the previous two years. It also represents a decline of 21% since the peak, which was 30.5 million in 2003. However, it is also higher than any year prior to 1995.
There certainly are several factors that influence golf participation. Among the most salient are:
• Economy: Golf is not an inexpensive sport. Golf participation is highly correlated to the economy.
• Access: It may be a bit of the “chicken and egg,” but if it is difficult to find a facility where you can play – especially learn to play – then you are less likely to play. Golf participation and the number of facilities are highly correlated. In some cases, it is easy to see that the increase in facilities preceded the increase in participation. This was especially true during the 1960s with the explosive growth in public golf courses. Prior to 1960, most courses were private, which, by definition, have limited access.
• Competition: There are more and more alternatives for one’s leisure time than ever before. This is especially true with the explosion of electronic alternatives.
• Time: A round of golf takes a lot of time (4-5 hours for 18 holes, plus travel time, plus any warm-up time or time spent relaxing after the round). For many, it is simply very difficult to find the time to play. On the other hand, many see the amount of time involved to be an asset rather than a weakness. It provides a wonderful opportunity to escape not only the hustle and bustle of today’s world – but also its electronic envelope.
• Social: While golf is an individual sport, it is also a group activity with a strong social component. One of the biggest reasons given for playing golf is “to socialize with friends.”
• Business: It is often said that there are more deals done on the golf course than in the board room. And there is a lot of truth to this. Being able to entertain clients as well as socialize with coworkers (or the boss) has been a big reason for people to take up golf. Corporate golf outings account typically for at least 10% of the play, and sometimes as much as 50% at higher-end daily fee facilities. Corporate retreats are often held at golf resorts, with golf being a major activity.
• Tiger Woods: While it is difficult to ascertain the exact impact Tiger has had on golf, there is no doubt that it has been tremendous. It is not coincidence that the rise and fall of golf participation in the last 25 years coincides almost exactly with Tiger’s performance (and thus exposure) on the Tour. In fact, golf participation today is almost exactly where it was pre-Tiger.
While the recent decline may be disturbing, there are many reasons for optimism. These include:
• Latent Golfers: Last year the number of non-golfers who say they are “very interested” in playing golf increased to 14.9 million from 12.8 million in 2016. Much of this can be attributed to the dramatic growth in off-course golf participation, where nearly a third (32%) of the participants have expressed a desire to play golf on a course.
• New Golfers: There were 2.6 million new golfers playing last year, which continues a four-year upward trend.
• Beginners: Beginners are much more diverse than other golfers. For example, 35% of beginners are women, compared to 24% of all golfers. Beginners are more likely to be non-Caucasian (26% compared to 18%), and younger, with 70% of them aged between 18 and 34, compared to 37% of all golfers. This diversity speaks well for the future of golf. It also sends a message to operators to be more open to diverse populations.
• Youth Movement: The PGA of America has been championing youth golf for the past several years.
• Jordan Spieth, etc.: While Tiger justifiably gets a lot of the credit for golf’s growth from 1995-2004, Arnold Palmer, Jack Nicklaus and to a lesser extent Lee Trevino and Gary Player, helped spur the dramatic growth in the game during the 1960s. Today, the Tour is blessed with many young guns, such as Jordan Spieth, who have shown the potential to similarly capture the public’s imagination.

Ramsey County Golf Study Market Conditions
Sirius Golf Advisors, LLC 29
• Off Course Participation (Top Golf): Golf participation, as the NGF defines it, is limited to those who played a round of golf. Historically, this definition made sense as very few people would practice a game they did not actually play. However, Top Golf has forever changed this reality. In case you are not familiar with Top Golf, it is a unique company and experience that has seen explosive growth over the past ten-years. A Top Golf facility is basically the marriage of a golf course driving range to an electronic game within a bar environment. A Top Golf facility will have a multi-story tee that fronts a driving range. The range features several target greens and a pair of goal posts at the end. Inside each “range” ball is a microchip that tracks that ball. An electronic “game board” adjoins each tee station. This allows for several “games” to be played. Basically, each target green is assigned a point value as are the goal posts. A player is given a set number of balls to play (depending on how much they pay). They can shoot at any target. The further the target is away, the higher the point value. But there is also a target right in front that virtually anyone can hit by simply dribbling the ball off the tee. At the same time, wait staff come by to keep the players supplied with the beverages (and food) of their choice. The average Top Golf facility will cost $15 to $25 million to build. And they make it up in the first year! Each Top Golf facility today generates an average of $20m in revenue a year. (Notably, 50% of the revenue comes from food and beverage). What is amazing is that 95% of the players at Top Golf have never played a round of golf. It remains to be seen how successful the industry will be in transitioning the Top Golf generation into rounds on golf courses, but there are certainly many lessons to be learned. But Top Golf has led a surge in non-course participation that has been increasing dramatic. Last year, NGF estimates that 8.3 million people participated in golf exclusively off-course, increasing the total participation in golf to 32.1 million.
• Counter Revolution: Physics teaches that “for every action, there is an equal and opposite reaction.” Social movements are very much the same way, only the timing is often off. Each generation tends to “push back” against the previous. Thus, as today’s society trends toward electronics and “hyper” environments, the idea of an outdoor environment where one can not only commune with nature, but also socialize and play games, becomes more and more appealing. This, in fact, may pave the way for another growth spike in the game over the next ten-years.
• Revolving Door: Last year about 3.5 million golfers “gave up” the game, while 2 million took it up and another 2 million returned. The main reasons for giving up the game were time, money and difficulty.
• Age: Surprisingly, the highest percentage of “core” golfers (those who play 8 or more rounds a year) are aged 30-39 (18.8% of all golfers), followed by 40-49 (17.6%). There are more golfers under the age of 40 than over 50 (47% to 35%). This speaks well for the future of the game.
It is our belief that golf participation will bottom out in the next few years then begin to gradually increase over the next ten-years.
Participation – The national golfer number (participation) continues to show some net attrition, primarily among occasional/less committed golfers. Overall, NGF survey research indicates that in 2017 there were 23.8 million people in the U.S. that played at least one round of golf in the prior year, about ±1.2 million fewer than in 2012. However, most “core” golfers remain in the game. However, participation in non-course golf activities has skyrocketed in recent years, with Top Golf being a major factor. Over 90% of the players at Top Golf facilities have never played on a golf course. One of today’s challenges is learning how to transition this surge in interest to actual players on the course.
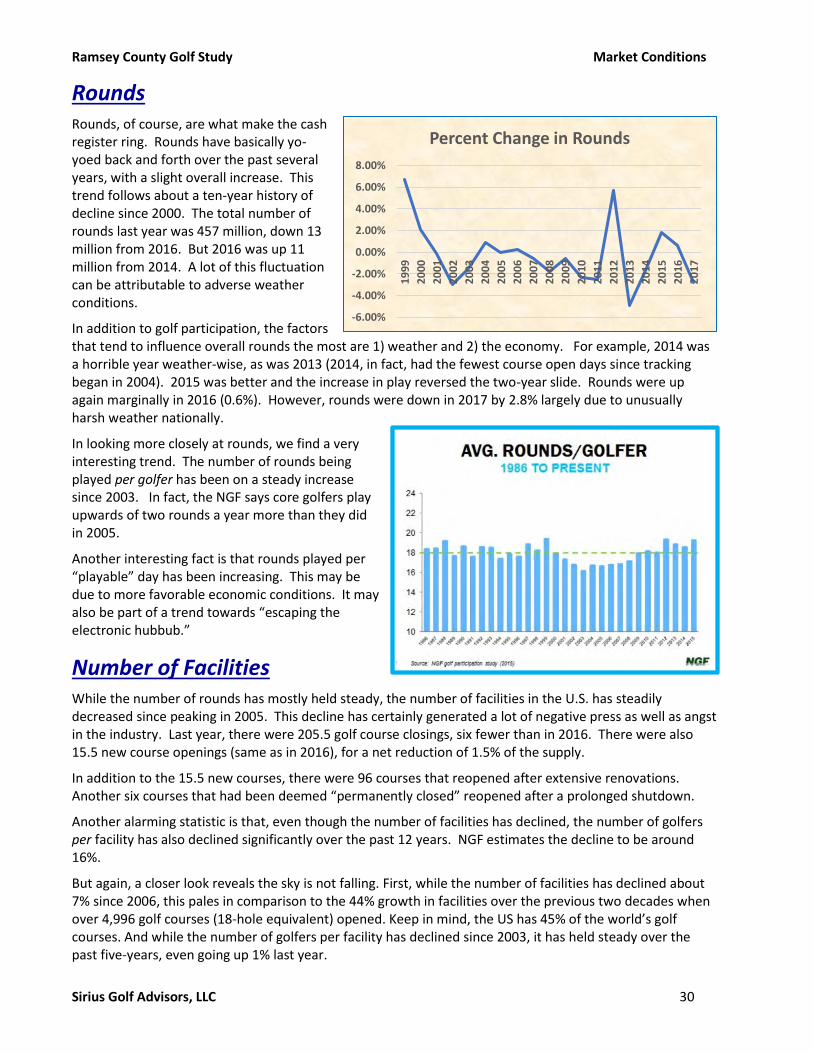
Ramsey County Golf Study Market Conditions
Sirius Golf Advisors, LLC 30
Rounds Rounds, of course, are what make the cash register ring. Rounds have basically yo-yoed back and forth over the past several years, with a slight overall increase. This trend follows about a ten-year history of decline since 2000. The total number of rounds last year was 457 million, down 13 million from 2016. But 2016 was up 11 million from 2014. A lot of this fluctuation can be attributable to adverse weather conditions.
In addition to golf participation, the factors that tend to influence overall rounds the most are 1) weather and 2) the economy. For example, 2014 was a horrible year weather-wise, as was 2013 (2014, in fact, had the fewest course open days since tracking began in 2004). 2015 was better and the increase in play reversed the two-year slide. Rounds were up again marginally in 2016 (0.6%). However, rounds were down in 2017 by 2.8% largely due to unusually harsh weather nationally.
In looking more closely at rounds, we find a very interesting trend. The number of rounds being played per golfer has been on a steady increase since 2003. In fact, the NGF says core golfers play upwards of two rounds a year more than they did in 2005.
Another interesting fact is that rounds played per “playable” day has been increasing. This may be due to more favorable economic conditions. It may also be part of a trend towards “escaping the electronic hubbub.”
Number of Facilities While the number of rounds has mostly held steady, the number of facilities in the U.S. has steadily decreased since peaking in 2005. This decline has certainly generated a lot of negative press as well as angst in the industry. Last year, there were 205.5 golf course closings, six fewer than in 2016. There were also 15.5 new course openings (same as in 2016), for a net reduction of 1.5% of the supply.
In addition to the 15.5 new courses, there were 96 courses that reopened after extensive renovations. Another six courses that had been deemed “permanently closed” reopened after a prolonged shutdown.
Another alarming statistic is that, even though the number of facilities has declined, the number of golfers per facility has also declined significantly over the past 12 years. NGF estimates the decline to be around 16%.
But again, a closer look reveals the sky is not falling. First, while the number of facilities has declined about 7% since 2006, this pales in comparison to the 44% growth in facilities over the previous two decades when over 4,996 golf courses (18-hole equivalent) opened. Keep in mind, the US has 45% of the world’s golf courses. And while the number of golfers per facility has declined since 2003, it has held steady over the past five-years, even going up 1% last year.
-6.00%
-4.00%
-2.00%
0.00%
2.00%
4.00%
6.00%
8.00%
19
99
20
00
20
01
20
02
20
03
20
04
20
05
20
06
20
07
20
08
20
09
20
10
20
11
20
12
20
13
20
14
20
15
20
16
20
17
Percent Change in Rounds
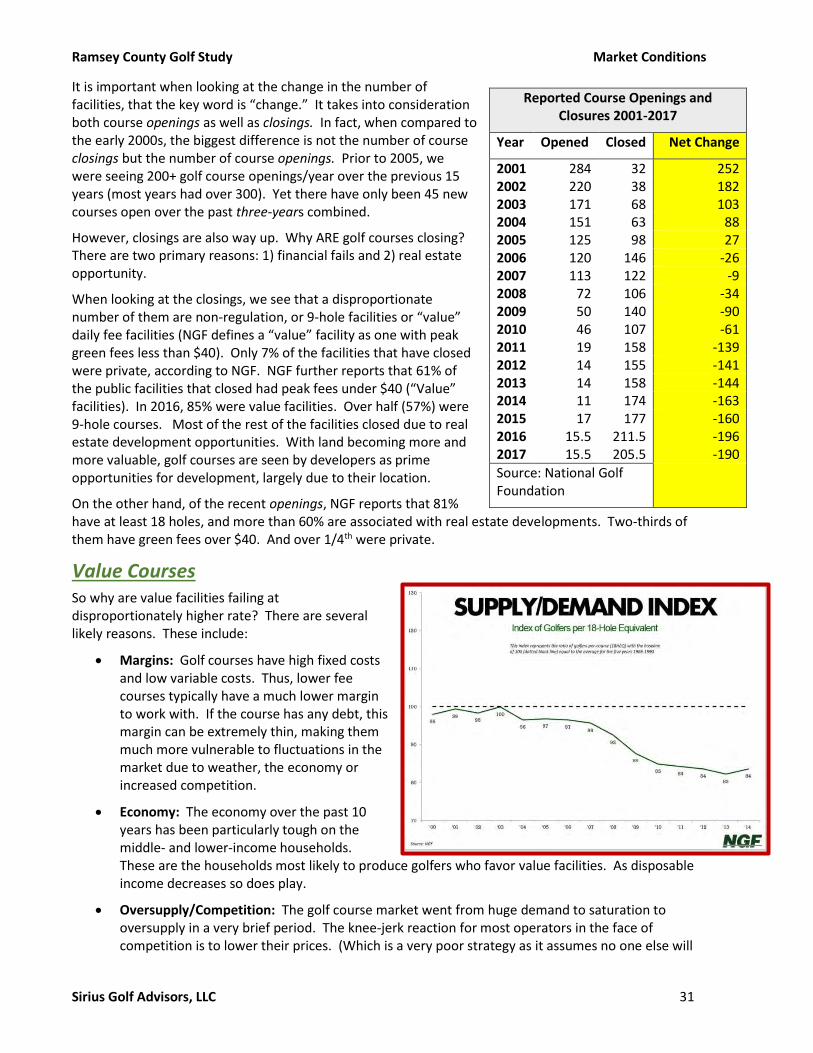
Ramsey County Golf Study Market Conditions
Sirius Golf Advisors, LLC 31
It is important when looking at the change in the number of facilities, that the key word is “change.” It takes into consideration both course openings as well as closings. In fact, when compared to the early 2000s, the biggest difference is not the number of course closings but the number of course openings. Prior to 2005, we were seeing 200+ golf course openings/year over the previous 15 years (most years had over 300). Yet there have only been 45 new courses open over the past three-years combined.
However, closings are also way up. Why ARE golf courses closing? There are two primary reasons: 1) financial fails and 2) real estate opportunity.
When looking at the closings, we see that a disproportionate number of them are non-regulation, or 9-hole facilities or “value” daily fee facilities (NGF defines a “value” facility as one with peak green fees less than $40). Only 7% of the facilities that have closed were private, according to NGF. NGF further reports that 61% of the public facilities that closed had peak fees under $40 (“Value” facilities). In 2016, 85% were value facilities. Over half (57%) were 9-hole courses. Most of the rest of the facilities closed due to real estate development opportunities. With land becoming more and more valuable, golf courses are seen by developers as prime opportunities for development, largely due to their location.
On the other hand, of the recent openings, NGF reports that 81% have at least 18 holes, and more than 60% are associated with real estate developments. Two-thirds of them have green fees over $40. And over 1/4th were private.
Value Courses So why are value facilities failing at disproportionately higher rate? There are several likely reasons. These include:
• Margins: Golf courses have high fixed costs and low variable costs. Thus, lower fee courses typically have a much lower margin to work with. If the course has any debt, this margin can be extremely thin, making them much more vulnerable to fluctuations in the market due to weather, the economy or increased competition.
• Economy: The economy over the past 10 years has been particularly tough on the middle- and lower-income households. These are the households most likely to produce golfers who favor value facilities. As disposable income decreases so does play.
• Oversupply/Competition: The golf course market went from huge demand to saturation to oversupply in a very brief period. The knee-jerk reaction for most operators in the face of competition is to lower their prices. (Which is a very poor strategy as it assumes no one else will
Reported Course Openings and Closures 2001-2017
Year Opened Closed Net Change
2001 284 32 252 2002 220 38 182 2003 171 68 103 2004 151 63 88 2005 125 98 27 2006 120 146 -26 2007 113 122 -9 2008 72 106 -34 2009 50 140 -90 2010 46 107 -61 2011 19 158 -139 2012 14 155 -141 2013 14 158 -144 2014 11 174 -163 2015 17 177 -160 2016 15.5 211.5 -196 2017 15.5 205.5 -190
Source: National Golf Foundation

Ramsey County Golf Study Market Conditions
Sirius Golf Advisors, LLC 32
lower theirs!) What we see happening is that a lot of mid-fee courses lower their prices to the point at which they are competitive with the value facilities. And given that the mid-fee courses typically have better facilities, the value courses suffer more.
• Conditions: Golf courses deteriorate over time. Yet it requires considerable investment to rebuild infrastructure such as irrigation, greens, bunkers, etc. Value courses typically do not generate the revenue necessary to finance these repairs, causing the course conditions to decline. Performance and course conditions are very highly correlated.
• Management: Value courses tend to be owner-operator facilities as opposed to being professionally managed. Many of these operators lack the sophistication, especially with regards to marketing, to compete in a highly competitive industry.
• Real Estate Sales: The biggest push in new golf course construction during the 1990s and continuing today were real estate developments, where the golf course was the featured amenity. However, as the recession led to a reduction in home sales, many of these developments suffered as there were not enough homes to support the course.
• Price Suppression: In many competitive markets, higher quality mid-fee courses have reduced their fees to where they are competitive with many of the value facilities. Because the price difference is small, more players opt for the higher-quality course.
• Developers: Many real estate developers who built golf courses, were very short-sighted, and never considered the long-term health of the golf course and its subsequent impact on real estate sales. For example, If the development had major topographical features, such as a lake or a tremendous vista, they would inevitably take all the land having water frontage, etc., and turn it into featured lots –placing the golf course in the interior with no major feature. This works well in the short-term as these lots sell at a high value. However, because the golf course is less appealing, it holds less value for ALL the other lots and the public in general. So, it does less to enhance the value of the other lots. Instead, if the developer had given the golf course some waterfront (etc.) access, the golf course becomes more popular, has a better prospect for long-term success, and makes it a more valuable amenity for all the other homes, increasing both their value and their velocity (in terms of sales).
• Difficulty/Design: Sadly, many architects (and developers) feel the need to make the golf course as difficult as possible, as if it were a competition and the PGA Tour was going to be knocking on their door. The truth is that most golfers are higher handicap players. And while they enjoy an occasional challenge, they don’t want to be “beat up” every day. On the other hand, the golfing ego demands that there at least be an apparent challenge – that’s why golfers do not all play from the forward tee or play the easiest course. The best (and most successful) courses are those that appear challenging but are fair and playable for the average golfer.
Whatever the reasons, this much-needed move toward supply/demand equilibrium is expected to continue for several years and could positively impact the Ramsey County golf courses. This phenomenon has been a part of Ramsey County golf, as three golf facilities (2.5 18-hole equivalents) have closed in the County since 2004, the most significant of which is the 18-hole Hillcrest Golf Club of St Paul (closed in November 2017).
It’s also notable that real estate was the primary factor in golf course’s explosion in 90’s and early 2000’s. It’s also a major factor in the decrease in numbers of courses, as many operators are cashing in on the land value of their property. This is particularly true in urban and high-growth suburban areas where development land is at a premium.
Another point is that new golf course construction is almost exclusively with higher-end daily fee and private courses.
NGF expects to see 15-25 new course openings this year, with 50-100 major renovations. They also expect there to be another 150-175 course closings.

Ramsey County Golf Study Market Conditions
Sirius Golf Advisors, LLC 33
Impact on Rounds As noted above, the supply of golf courses has shrunk by nearly 6% over the last 12 years. This, no doubt, has an adverse impact on play. While many of these rounds transfer to other courses, a large percentage are just lost for good.
Location (convenience) is a key driver as to where and how many rounds a golfer plays. If the course that is most convenient closes, and especially if another course in that same price range is not convenient, then the number of rounds played by that golfer is going to decrease, if not cease altogether.
And the fact that a disproportionate percentage of course closings are value facilities is important for another reason. It is decreasing the number of affordable places to play. Naturally, if you have $500 of disposable income to dedicate to golf, that equates to 20 rounds at a $25 course or 10 rounds at a $50 course. Take out the lower priced facilities and golfers with limited disposable income are simply going to play fewer rounds, if at all.
But perhaps most dangerous of all is the fact that it can impact the number of people who take up golf. Golf is not a cheap hobby. That is why most golfers tend to learn on lower-priced facilities. Take these away, and fewer are likely to want to invest the money needed to even start playing.
Renovations While we are not seeing nearly the number of new courses opening per year as in the recent past, there is no doubt that the number of major renovations is on a sharp increase. As noted above, NGF expects up to 100 new major renovations to be completed this year alone. Over the past 10 years, over 1,100 golf courses have undergone renovations, with a total investment of $3.25 billion. And that total is only for the major renovation projects.
There are two major reasons for the substantial increase in renovations. The first is that the facilities that were built during the “boom” years of the 1990s are now 20+ years old. As such, much of their infrastructure has gone beyond the expected life cycle.
As these parts wear out, course conditions decline, and maintenance costs increase, hurting profitability on both revenue and expense sides.
The other major reason for renovation is to gain a competitive edge. Golfers tend to like playing on “newer” courses. Major renovations (as opposed to ones that simply upgrade one aspect of the course), typically improve the golf experience significantly with improvements in both playability and aesthetics.
Further, a recent study by Sirius, in conjunction with the NGF, has shown that major renovations, especially when coupled with market repositioning plus increased marketing, can have a dramatic impact on performance. This study examined municipal golf courses in the Dallas-Ft. Worth area. At the time of the study, nineteen of these facilities had undergone renovations in recent years, with six doing major (over $3m) and four doing minor (under $1m).
The two biggest findings were:
• Both minor and major renovations had a significant impact in the first year. However, the improvement tapered off for the courses with minor improvements, while performance continued to increase for the major renovations. Yet, both renovation types paid for themselves over time.
• By far, the biggest improvements were seen by courses that did BOTH major renovations and rebranded themselves. The Rebranders averaged a 65.5% increase in revenue (an average of $699,601) in the first year, compared to an 18.1% increase ($171,780) by the others. In the 2nd year, the Rebranders increased on average an additional $241,352, for a total improvement of 74.3% over base in the 2nd year. This compares to a $252,941 increase and 31.7% by the others.

Ramsey County Golf Study Market Conditions
Sirius Golf Advisors, LLC 34
Key Trends in Demand • Course Correction – While rounds have decreased significantly since peaking in 2001, they are
still ahead of where they were in the mid-1990s. For example, there were an estimated 447 million rounds of golf played last year, compared to 441 million in 1995.
• Rounds Played 2017-18 / Looking Ahead – Nationally, year-to-date rounds played are down 2.7% through August 2018, with a 1.6% loss for the month of August alone (source Golf Datatech – see Appendix A). In Minnesota, 2018 has been a difficult year for golf courses, with rounds down 4.3% year-to-date (through August) in the State (but up 2% in August), and down 6.5% in Metro Minneapolis/St. Paul (but up 4.8% in August). These results are generally worse than other Midwest metro areas, including Detroit (down 0.3% YTD), Cleveland (down 3.2% YTD), and Chicago (Down 3.9% YTD). Weather is a major factor in rounds played, and the weather patterns in the last couple of years has been particularly brutal. When weather conditions are good, rounds performance tends to be about the same or better than the previous year.
• Baby Boomer Effect – As Baby Boomers age and retire over the next 15 years, we expect to see a measurable increase in total rounds played in the U.S. Boomers – born between 1946 and 1964 – are currently 53 to 72 years old. About 6 million of them are golfers; that’s about ¼ of all golfers, and they currently play about 1/3 of all rounds. Boomers started turning 65 in 2011, and already about 1 million golfing Boomers have reached retirement age. The Social Security Administration reports that 10,000 or more Boomers retire every day. And 300,000 Boomer golfers will turn 65 each year for the next 15 years. Retired Boomers (age 65+) also play about twice as much as younger, non-retired Boomers (40 rounds vs 21 rounds).
Other Measures of Health Other perhaps equally important metrics to consider when measuring the health of golf include:
• Golf Participation: While rounds have decreased, the number of golfers in the US has remained steady over the past few years, at 23.8 million. Approximately 1 in 4 are women.
• Investment in Facilities: Investment in major renovation projects has replaced new construction as the largest source of U.S. golf course development activity. NGF tracked just under 1,000 major renovations completed since 2006, representing at least $3 billion. New development activity also remains in the pipeline, with NGF tracking 37 facilities currently under construction and another 55 in planning stages.
• Engagement: Several years ago, NGF developed a scale to gauge engagement / passion for golf. NGF annual golfer survey research indicates that the number of engaged golfers has remained steady at 20 to 21 million for the past four years. But the proportion of engaged golfers has increased from 78% to 85% over this period. These engaged golfers are responsible for ±95% of rounds played, and equipment spend. Those more engaged are significantly more likely to continue playing.
• Increasing Diversity: The junior golf population remains relatively stable at 2.9 million and continues to show a transformation in diversity. One-third of golfers age 6-17 are females, up from 17% in 1995 (in sum, 24% of all golfers are women). Also, 27% of junior golfers are non-Caucasian, up from only 6% in 1995. A similar trend is observed among young adult (18-34) or Millennial golfers, of which 29% are female and 24% non-Caucasian. The highest diversity is among beginning golfers, at 34% female and 32% non-Caucasian.

Ramsey County Golf Study Market Conditions
Sirius Golf Advisors, LLC 35
• Beginners: The number of beginners rose to a record 2.5 million in 2016, surpassing the record set in 2000 when Tiger Woods was in his prime and drawing newcomers to the game in unprecedented numbers. Since 2011, the compound annual growth rate (CAGR) in beginners is an impressive 10.8%.
• Off-Course Participation: Driven primarily by the popularity and growth of Topgolf, a non-traditional form of golf entertainment, there were an estimated 20 million off-course (involves only those activities that involve hitting a ball with a golf club) participants in 2017, about 40% of whom did not play on a golf course.
• Latent Demand: Overall interest in playing golf remains very high. NGF survey research indicates that the number of non-golfers who say they are “very interested” in taking up golf has doubled over the last five years, growing at a CAGR of nearly 15% and now totaling 12.8 million people. There are an additional 40+/- million non-golfers who say they’re “somewhat interested” in taking up the game. Together, these two cohorts represent about 1.7 prospects for every existing golfer.
Municipal Golf Municipal golf is likely to play an increasingly more important role in golf going forward. There are several reasons for this, including:
1) Construction Costs: Construction costs are rising at an alarming rate. One of the consequences of this escalation is that it is becoming harder and harder for private operators to be able to afford making needed renovations to their course. Municipalities are in a better position to make these renovations, providing the golfer with a better experience.
2) New Golfers: For-profit operators have a harder time investing in long-term strategies such as developing new golfers. This is especially true with regards to expanding into new markets, such as minorities. There are a lot of costs involved, including marketing, and teaching (especially in offering low- or no-cost clinics). There is also the risk of an adverse impact on current golfers, such as slowing down the pace of play, etc.
3) Subsidizing: While we find it unnecessary in many cases, and undesirable in most cases, the truth is that municipal courses are in a better position to subsidize operations. While some private operators may cry “foul,” it does allow municipal operators to keep fees low, making golfer more accessible to lower-income golfers.
While the overall number of golf courses has been declining, the number of municipal courses has been increasing. Last year there were 2,497 municipal facilities, an all-time high. Municipal courses now comprise 16.9% of the market, up from 15.9% in 2013. This is due to municipalities acquiring golf courses, because they realize the importance of the amenity to the community. Some of these courses were failing, but others were purchased to avoid them being developed.
Another trend with municipal golf is privatization. With an increased emphasis on profitability, more municipalities are turning towards professional management. Last year, 15% of US facilities were operating with a management company, compared to 10.6% in 2006.
Conclusion All indicators are that the recent decline in golf participation and facilities is more of a “market correction” than it is a foretelling of the future. Indeed, recent indicators are positive. Rounds are up, openings are up, participation among youth is up, etc. Further, while the number of facilities has been shrinking, the number of rounds has remained level or even increased (until last year’s bad weather), thus concentrating the rounds on fewer facilities – making those facilities that much stronger.

Ramsey County Golf Study Market Conditions
Sirius Golf Advisors, LLC 36
There is no doubt that closings will outnumber openings for several more years. As was the case with the growth in the number of facilities, real estate is leading the way. One of the biggest reasons for course closing is that the land has become more valuable for development than for golf. However, the stronger facilities, those that have good layouts, are kept in good condition, and are well-managed, will not only survive, but will likely thrive.
Prudent operators are recognizing this trend, which is one of the reasons we are seeing more and more renovations each year.
Demographic Profiles In this section, we will provide a quick overview of the most relevant market demographics. For a more detailed look, please see tables in Appendix B: Summary Demographics.
According to 2017 census estimates, there are 3,946,533 people living in the Minneapolis-St. Paul Combined Statistical Area. This represents over 70% of the state’s population. And over half of these people live within 20 miles of at least one of the RC Golf facilities. We will look at each market area in turn.
Market Definition In the market analysis, we defined geographical markets for each course as follows:
• Neighborhood: The area within a 5-mile radius of a given facility.
• Local Area: The area within a 10-mile radius of a given facility.
• Regional Area: The area within a 20-mile radius of a given facility.
We looked at the above-mentioned markets as well as Ramsey County and the State.
Neighborhood Markets Typically, the Neighborhood area (5-mile radius) will be where the largest percentage of golfers will come from for a given course. However, this is highly correlated with price point. The higher the price point of a facility, the wider the market area tends to be.
Population Trends
Keller has the largest neighborhood area population, with 293,760, while Manitou, at 160,169, has the smallest. Goodrich is about 20% smaller than Keller, with 259,997, followed by Battle Creek at 209,407 and Island Lake at 177,791.
Keller is also the fastest growing area, with an annualized growth rate of 1.03% since 2010. This compares to the national growth rate of 0.75% and the state’s .6%. Ramsey County is growing at 0.96% by comparison. Goodrich is also growing at a little faster rate than the county (projected at 1% over the next five years. The Manitou neighborhood is showing the slowest growth rate at 0.76%, which is about the national average,
0
500,000
1,000,000
1,500,000
2,000,000
2,500,000
5 M
i
10
Mi
20
Mi
5 M
i
10
Mi
20
Mi
5 M
i
10
Mi
20
Mi
5 M
i
10
Mi
20
Mi
5 M
i
10
Mi
20
Mi
Co
un
ty
Battle Creek Goodrich Island Lake Keller Manitou Ramsey
Population 2017
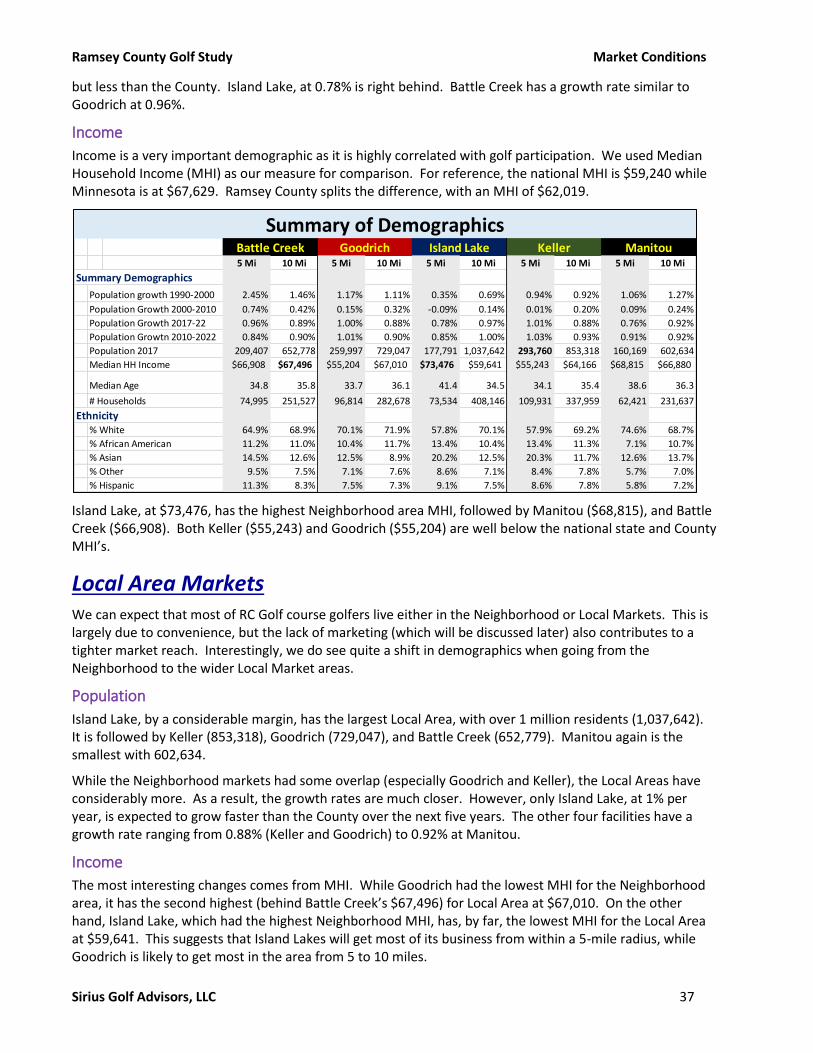
Ramsey County Golf Study Market Conditions
Sirius Golf Advisors, LLC 37
but less than the County. Island Lake, at 0.78% is right behind. Battle Creek has a growth rate similar to Goodrich at 0.96%.
Income
Income is a very important demographic as it is highly correlated with golf participation. We used Median Household Income (MHI) as our measure for comparison. For reference, the national MHI is $59,240 while Minnesota is at $67,629. Ramsey County splits the difference, with an MHI of $62,019.
Island Lake, at $73,476, has the highest Neighborhood area MHI, followed by Manitou ($68,815), and Battle Creek ($66,908). Both Keller ($55,243) and Goodrich ($55,204) are well below the national state and County MHI’s.
Local Area Markets We can expect that most of RC Golf course golfers live either in the Neighborhood or Local Markets. This is largely due to convenience, but the lack of marketing (which will be discussed later) also contributes to a tighter market reach. Interestingly, we do see quite a shift in demographics when going from the Neighborhood to the wider Local Market areas.
Population
Island Lake, by a considerable margin, has the largest Local Area, with over 1 million residents (1,037,642). It is followed by Keller (853,318), Goodrich (729,047), and Battle Creek (652,779). Manitou again is the smallest with 602,634.
While the Neighborhood markets had some overlap (especially Goodrich and Keller), the Local Areas have considerably more. As a result, the growth rates are much closer. However, only Island Lake, at 1% per year, is expected to grow faster than the County over the next five years. The other four facilities have a growth rate ranging from 0.88% (Keller and Goodrich) to 0.92% at Manitou.
Income
The most interesting changes comes from MHI. While Goodrich had the lowest MHI for the Neighborhood area, it has the second highest (behind Battle Creek’s $67,496) for Local Area at $67,010. On the other hand, Island Lake, which had the highest Neighborhood MHI, has, by far, the lowest MHI for the Local Area at $59,641. This suggests that Island Lakes will get most of its business from within a 5-mile radius, while Goodrich is likely to get most in the area from 5 to 10 miles.
5 Mi 10 Mi 5 Mi 10 Mi 5 Mi 10 Mi 5 Mi 10 Mi 5 Mi 10 Mi
Summary Demographics
Population growth 1990-2000 2.45% 1.46% 1.17% 1.11% 0.35% 0.69% 0.94% 0.92% 1.06% 1.27%
Population Growth 2000-2010 0.74% 0.42% 0.15% 0.32% -0.09% 0.14% 0.01% 0.20% 0.09% 0.24%
Population Growth 2017-22 0.96% 0.89% 1.00% 0.88% 0.78% 0.97% 1.01% 0.88% 0.76% 0.92%
Population Growtn 2010-2022 0.84% 0.90% 1.01% 0.90% 0.85% 1.00% 1.03% 0.93% 0.91% 0.92%
Population 2017 209,407 652,778 259,997 729,047 177,791 1,037,642 293,760 853,318 160,169 602,634
Median HH Income $66,908 $67,496 $55,204 $67,010 $73,476 $59,641 $55,243 $64,166 $68,815 $66,880
Median Age 34.8 35.8 33.7 36.1 41.4 34.5 34.1 35.4 38.6 36.3
# Households 74,995 251,527 96,814 282,678 73,534 408,146 109,931 337,959 62,421 231,637
Ethnicity% White 64.9% 68.9% 70.1% 71.9% 57.8% 70.1% 57.9% 69.2% 74.6% 68.7%
% African American 11.2% 11.0% 10.4% 11.7% 13.4% 10.4% 13.4% 11.3% 7.1% 10.7%
% Asian 14.5% 12.6% 12.5% 8.9% 20.2% 12.5% 20.3% 11.7% 12.6% 13.7%
% Other 9.5% 7.5% 7.1% 7.6% 8.6% 7.1% 8.4% 7.8% 5.7% 7.0%
% Hispanic 11.3% 8.3% 7.5% 7.3% 9.1% 7.5% 8.6% 7.8% 5.8% 7.2%
Summary of DemographicsBattle Creek Goodrich Island Lake Keller Manitou
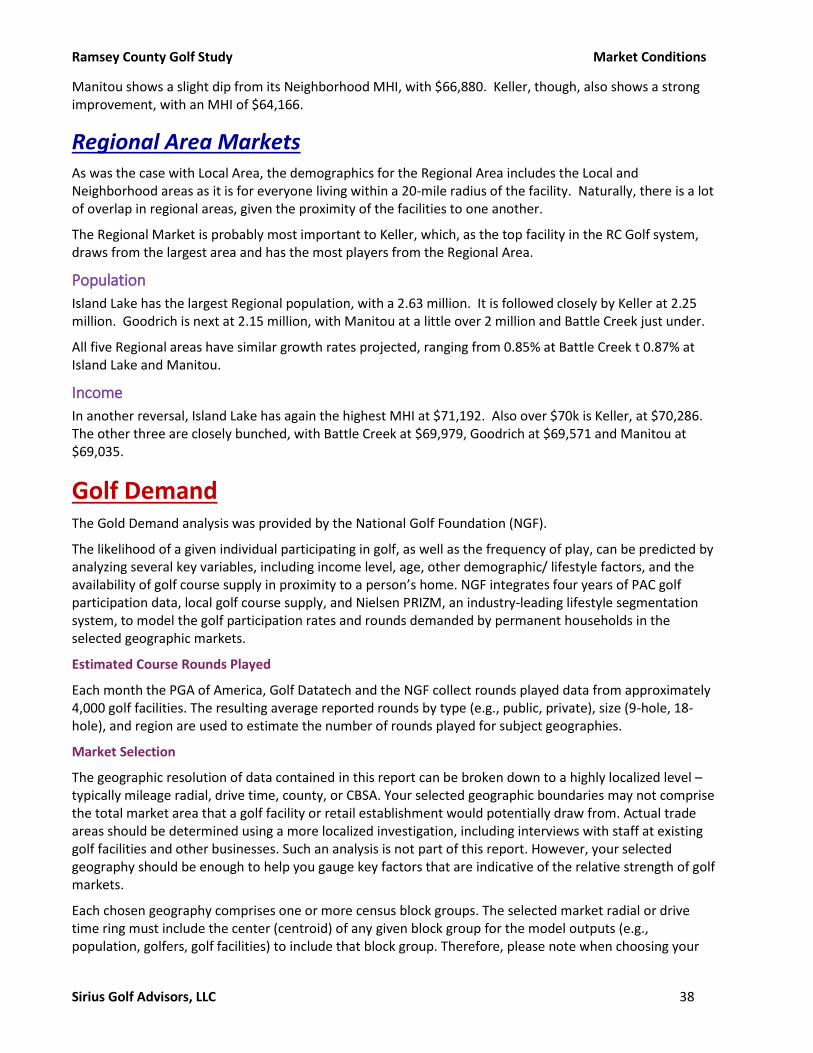
Ramsey County Golf Study Market Conditions
Sirius Golf Advisors, LLC 38
Manitou shows a slight dip from its Neighborhood MHI, with $66,880. Keller, though, also shows a strong improvement, with an MHI of $64,166.
Regional Area Markets As was the case with Local Area, the demographics for the Regional Area includes the Local and Neighborhood areas as it is for everyone living within a 20-mile radius of the facility. Naturally, there is a lot of overlap in regional areas, given the proximity of the facilities to one another.
The Regional Market is probably most important to Keller, which, as the top facility in the RC Golf system, draws from the largest area and has the most players from the Regional Area.
Population
Island Lake has the largest Regional population, with a 2.63 million. It is followed closely by Keller at 2.25 million. Goodrich is next at 2.15 million, with Manitou at a little over 2 million and Battle Creek just under.
All five Regional areas have similar growth rates projected, ranging from 0.85% at Battle Creek t 0.87% at Island Lake and Manitou.
Income
In another reversal, Island Lake has again the highest MHI at $71,192. Also over $70k is Keller, at $70,286. The other three are closely bunched, with Battle Creek at $69,979, Goodrich at $69,571 and Manitou at $69,035.
Golf Demand The Gold Demand analysis was provided by the National Golf Foundation (NGF).
The likelihood of a given individual participating in golf, as well as the frequency of play, can be predicted by analyzing several key variables, including income level, age, other demographic/ lifestyle factors, and the availability of golf course supply in proximity to a person’s home. NGF integrates four years of PAC golf participation data, local golf course supply, and Nielsen PRIZM, an industry-leading lifestyle segmentation system, to model the golf participation rates and rounds demanded by permanent households in the selected geographic markets.
Estimated Course Rounds Played
Each month the PGA of America, Golf Datatech and the NGF collect rounds played data from approximately 4,000 golf facilities. The resulting average reported rounds by type (e.g., public, private), size (9-hole, 18-hole), and region are used to estimate the number of rounds played for subject geographies.
Market Selection
The geographic resolution of data contained in this report can be broken down to a highly localized level – typically mileage radial, drive time, county, or CBSA. Your selected geographic boundaries may not comprise the total market area that a golf facility or retail establishment would potentially draw from. Actual trade areas should be determined using a more localized investigation, including interviews with staff at existing golf facilities and other businesses. Such an analysis is not part of this report. However, your selected geography should be enough to help you gauge key factors that are indicative of the relative strength of golf markets.
Each chosen geography comprises one or more census block groups. The selected market radial or drive time ring must include the center (centroid) of any given block group for the model outputs (e.g., population, golfers, golf facilities) to include that block group. Therefore, please note when choosing your
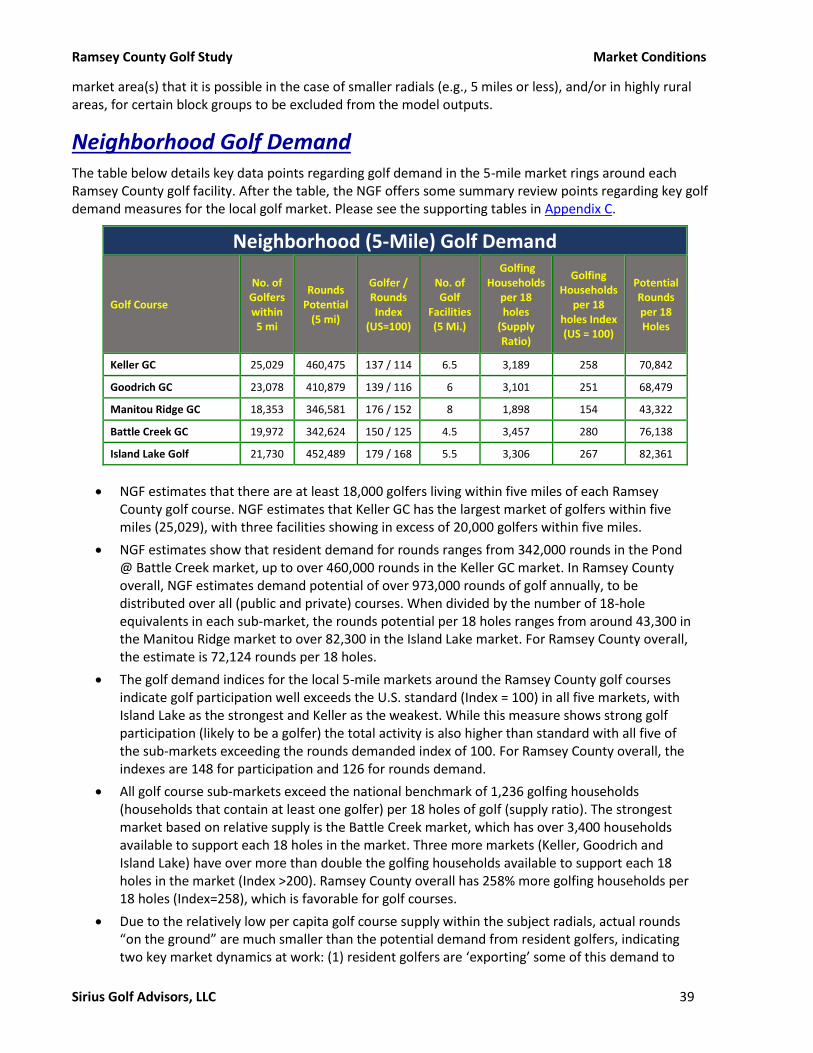
Ramsey County Golf Study Market Conditions
Sirius Golf Advisors, LLC 39
market area(s) that it is possible in the case of smaller radials (e.g., 5 miles or less), and/or in highly rural areas, for certain block groups to be excluded from the model outputs.
Neighborhood Golf Demand The table below details key data points regarding golf demand in the 5-mile market rings around each Ramsey County golf facility. After the table, the NGF offers some summary review points regarding key golf demand measures for the local golf market. Please see the supporting tables in Appendix C.
Neighborhood (5-Mile) Golf Demand
Golf Course
No. of Golfers within 5 mi
Rounds Potential
(5 mi)
Golfer / Rounds Index
(US=100)
No. of Golf
Facilities (5 Mi.)
Golfing Households
per 18 holes
(Supply Ratio)
Golfing Households
per 18 holes Index (US = 100)
Potential Rounds per 18 Holes
Keller GC 25,029 460,475 137 / 114 6.5 3,189 258 70,842
Goodrich GC 23,078 410,879 139 / 116 6 3,101 251 68,479
Manitou Ridge GC 18,353 346,581 176 / 152 8 1,898 154 43,322
Battle Creek GC 19,972 342,624 150 / 125 4.5 3,457 280 76,138
Island Lake Golf 21,730 452,489 179 / 168 5.5 3,306 267 82,361
• NGF estimates that there are at least 18,000 golfers living within five miles of each Ramsey County golf course. NGF estimates that Keller GC has the largest market of golfers within five miles (25,029), with three facilities showing in excess of 20,000 golfers within five miles.
• NGF estimates show that resident demand for rounds ranges from 342,000 rounds in the Pond @ Battle Creek market, up to over 460,000 rounds in the Keller GC market. In Ramsey County overall, NGF estimates demand potential of over 973,000 rounds of golf annually, to be distributed over all (public and private) courses. When divided by the number of 18-hole equivalents in each sub-market, the rounds potential per 18 holes ranges from around 43,300 in the Manitou Ridge market to over 82,300 in the Island Lake market. For Ramsey County overall, the estimate is 72,124 rounds per 18 holes.
• The golf demand indices for the local 5-mile markets around the Ramsey County golf courses indicate golf participation well exceeds the U.S. standard (Index = 100) in all five markets, with Island Lake as the strongest and Keller as the weakest. While this measure shows strong golf participation (likely to be a golfer) the total activity is also higher than standard with all five of the sub-markets exceeding the rounds demanded index of 100. For Ramsey County overall, the indexes are 148 for participation and 126 for rounds demand.
• All golf course sub-markets exceed the national benchmark of 1,236 golfing households (households that contain at least one golfer) per 18 holes of golf (supply ratio). The strongest market based on relative supply is the Battle Creek market, which has over 3,400 households available to support each 18 holes in the market. Three more markets (Keller, Goodrich and Island Lake) have over more than double the golfing households available to support each 18 holes in the market (Index >200). Ramsey County overall has 258% more golfing households per 18 holes (Index=258), which is favorable for golf courses.
• Due to the relatively low per capita golf course supply within the subject radials, actual rounds “on the ground” are much smaller than the potential demand from resident golfers, indicating two key market dynamics at work: (1) resident golfers are ‘exporting’ some of this demand to
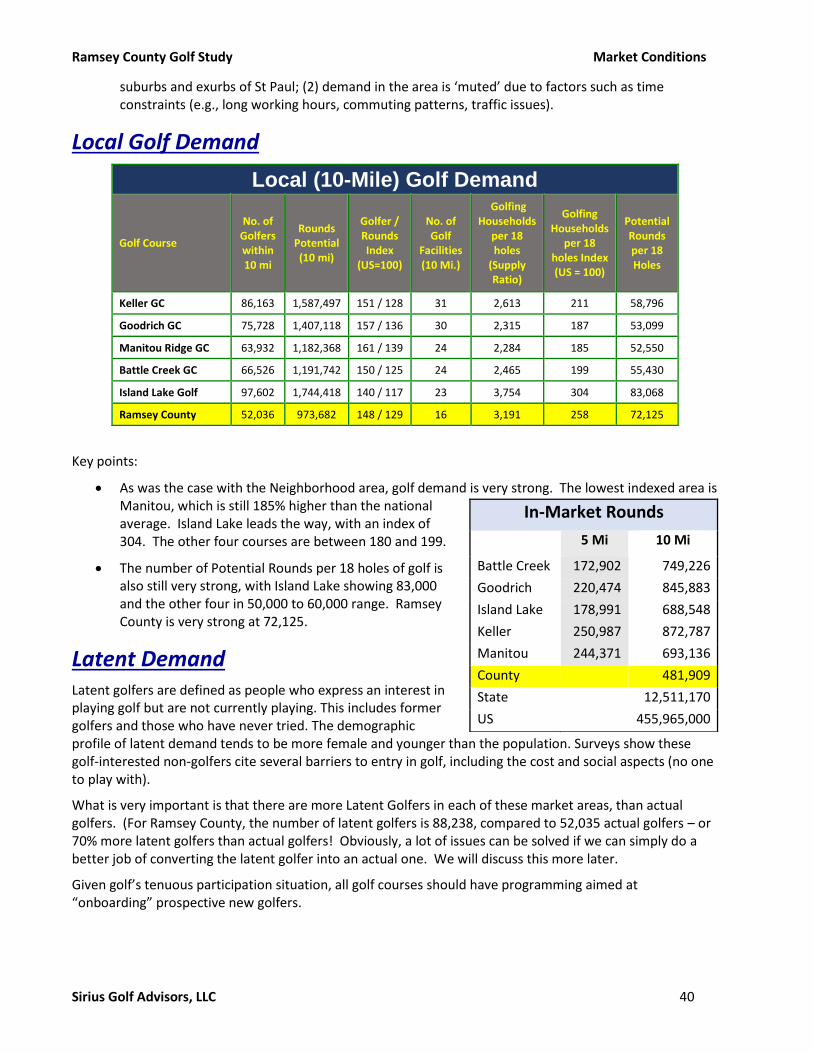
Ramsey County Golf Study Market Conditions
Sirius Golf Advisors, LLC 40
suburbs and exurbs of St Paul; (2) demand in the area is ‘muted’ due to factors such as time constraints (e.g., long working hours, commuting patterns, traffic issues).
Local Golf Demand
Local (10-Mile) Golf Demand
Golf Course
No. of Golfers within 10 mi
Rounds Potential (10 mi)
Golfer / Rounds Index
(US=100)
No. of Golf
Facilities (10 Mi.)
Golfing Households
per 18 holes
(Supply Ratio)
Golfing Households
per 18 holes Index (US = 100)
Potential Rounds per 18 Holes
Keller GC 86,163 1,587,497 151 / 128 31 2,613 211 58,796
Goodrich GC 75,728 1,407,118 157 / 136 30 2,315 187 53,099
Manitou Ridge GC 63,932 1,182,368 161 / 139 24 2,284 185 52,550
Battle Creek GC 66,526 1,191,742 150 / 125 24 2,465 199 55,430
Island Lake Golf 97,602 1,744,418 140 / 117 23 3,754 304 83,068
Ramsey County 52,036 973,682 148 / 129 16 3,191 258 72,125
Key points:
• As was the case with the Neighborhood area, golf demand is very strong. The lowest indexed area is Manitou, which is still 185% higher than the national average. Island Lake leads the way, with an index of 304. The other four courses are between 180 and 199.
• The number of Potential Rounds per 18 holes of golf is also still very strong, with Island Lake showing 83,000 and the other four in 50,000 to 60,000 range. Ramsey County is very strong at 72,125.
Latent Demand Latent golfers are defined as people who express an interest in playing golf but are not currently playing. This includes former golfers and those who have never tried. The demographic profile of latent demand tends to be more female and younger than the population. Surveys show these golf-interested non-golfers cite several barriers to entry in golf, including the cost and social aspects (no one to play with).
What is very important is that there are more Latent Golfers in each of these market areas, than actual golfers. (For Ramsey County, the number of latent golfers is 88,238, compared to 52,035 actual golfers – or 70% more latent golfers than actual golfers! Obviously, a lot of issues can be solved if we can simply do a better job of converting the latent golfer into an actual one. We will discuss this more later.
Given golf’s tenuous participation situation, all golf courses should have programming aimed at “onboarding” prospective new golfers.
In-Market Rounds
5 Mi 10 Mi
Battle Creek 172,902 749,226
Goodrich 220,474 845,883
Island Lake 178,991 688,548
Keller 250,987 872,787
Manitou 244,371 693,136
County
481,909
State 12,511,170
US 455,965,000

Ramsey County Golf Study Market Conditions
Sirius Golf Advisors, LLC 41
Other Demand Drivers Supplementing golf demand from permanent residents are: (1) The area’s large number of major corporate and public employers; and (2) Visitors to the Minneapolis / St Paul area. NGF research shows that roughly one-third of all golfers participate in the activity while traveling, playing 0.557 rounds per day of travel. Though Ramsey County golf courses as presently situated would capture only a small proportion of these incremental rounds from visiting golfers, supplemental play from visitors drawn by a strong marketing program (e.g., through promoted outings) could be an important element in making the Ramsey County golf courses financially viable, assuming the level of quality was appropriate (more later in this report).
Tourists (Visiting Golfers) Other than in resort areas or with resort courses, one of the most overlooked markets is the visiting golfer market. The MSP area gets over 33 million visitors per year according to Meet Minneapolis. Based on these figures, we can provide an estimate of the rounds potential from these golfers.
If we assume that only 40% of these visitors come during times the golf courses are open, and if we conservatively estimate the participation rate for these visitors at 9.5%, we come up with 1,254,000 golfers visiting during the playing season. (In truth, the participation rate is likely much higher as the average income of visitors is higher than the national average for all people in the US.) Using NGF stats, we can then estimate that these visitors can produce a little over 230,000 rounds.
The key question then becomes, “where are they playing.” The answer, unfortunately, is likely “not at RC
Golf facilities.” The reasons for this include pricing and lack of marketing.
First, golfers that play when they travel are rarely looking for the cheapest place to play. Just the opposite, they are much more likely to want to “treat” themselves to a golf experience that is better (or at least unique) from the ones they play at home. That is why the Premium facilities (highest priced) get most of these rounds. The RC Golf facilities are not priced where they would attract traveler’s attention.
Not only do these golfers spend more to play, they will also spend much more on merchandise and food & beverage when they play. In short, these golfers spend much more per round than the average user of a given facility will pay.
However, as we will discuss more later in this report, Keller, with its course quality and especially its history, is able to command a much larger share of this lucrative market.
Supply and Demand While we talked a little in the previous section about demand per 18 holes of golf, this section will take a deeper dive into the topic. Of special interest is looking specifically at public courses, which NGF further breaks down into three types, based on peak fee. Peak fee is the highest published rate for green and cart fees combined, which is usually weekend mornings. The three types are:
• Value: These are facilities whose peak fee is under $40.
• Standard: Also referred to as “Mid-Fee,” these courses charge between $40 and $70.
• Premium: These facilities charge $70 or more, peak fee.
Visitor Golf Market No Visitors 33,000,000
In -season estimate 40%
In season visitors 13,200,000
x Participation rate 9.5%
Est. No. of Golfers 1,254,000
% who play when travel 33%
Est. No. playing golfers 413,820
Avg rnds played per trip 0.557
Estimated Rounds 230,498
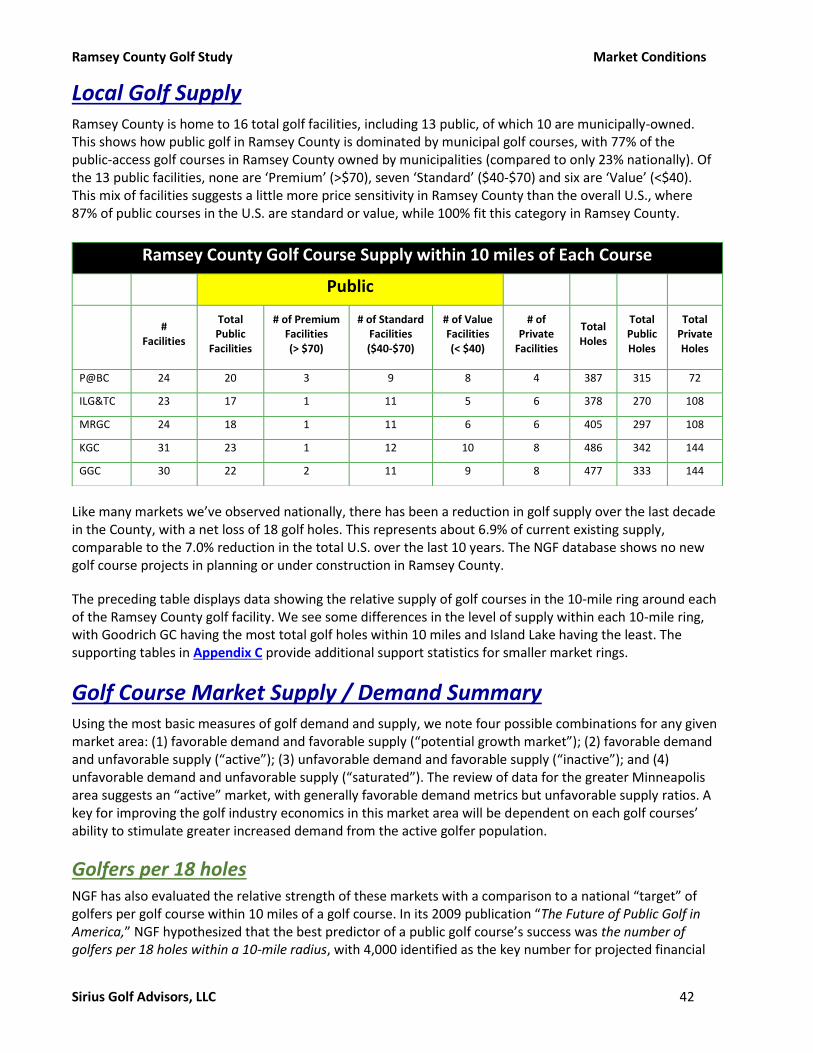
Ramsey County Golf Study Market Conditions
Sirius Golf Advisors, LLC 42
Local Golf Supply Ramsey County is home to 16 total golf facilities, including 13 public, of which 10 are municipally-owned. This shows how public golf in Ramsey County is dominated by municipal golf courses, with 77% of the public-access golf courses in Ramsey County owned by municipalities (compared to only 23% nationally). Of the 13 public facilities, none are ‘Premium’ (>$70), seven ‘Standard’ ($40-$70) and six are ‘Value’ (<$40). This mix of facilities suggests a little more price sensitivity in Ramsey County than the overall U.S., where 87% of public courses in the U.S. are standard or value, while 100% fit this category in Ramsey County.
Like many markets we’ve observed nationally, there has been a reduction in golf supply over the last decade in the County, with a net loss of 18 golf holes. This represents about 6.9% of current existing supply, comparable to the 7.0% reduction in the total U.S. over the last 10 years. The NGF database shows no new golf course projects in planning or under construction in Ramsey County.
The preceding table displays data showing the relative supply of golf courses in the 10-mile ring around each of the Ramsey County golf facility. We see some differences in the level of supply within each 10-mile ring, with Goodrich GC having the most total golf holes within 10 miles and Island Lake having the least. The supporting tables in Appendix C provide additional support statistics for smaller market rings.
Golf Course Market Supply / Demand Summary Using the most basic measures of golf demand and supply, we note four possible combinations for any given market area: (1) favorable demand and favorable supply (“potential growth market”); (2) favorable demand and unfavorable supply (“active”); (3) unfavorable demand and favorable supply (“inactive”); and (4) unfavorable demand and unfavorable supply (“saturated”). The review of data for the greater Minneapolis area suggests an “active” market, with generally favorable demand metrics but unfavorable supply ratios. A key for improving the golf industry economics in this market area will be dependent on each golf courses’ ability to stimulate greater increased demand from the active golfer population.
Golfers per 18 holes NGF has also evaluated the relative strength of these markets with a comparison to a national “target” of golfers per golf course within 10 miles of a golf course. In its 2009 publication “The Future of Public Golf in America,” NGF hypothesized that the best predictor of a public golf course’s success was the number of golfers per 18 holes within a 10-mile radius, with 4,000 identified as the key number for projected financial
Ramsey County Golf Course Supply within 10 miles of Each Course
Public
# Facilities
Total Public
Facilities
# of Premium Facilities (> $70)
# of Standard Facilities ($40-$70)
# of Value Facilities (< $40)
# of Private
Facilities
Total Holes
Total Public Holes
Total Private Holes
P@BC 24 20 3 9 8 4 387 315 72
ILG&TC 23 17 1 11 5 6 378 270 108
MRGC 24 18 1 11 6 6 405 297 108
KGC 31 23 1 12 10 8 486 342 144
GGC 30 22 2 11 9 8 477 333 144

Ramsey County Golf Study Market Conditions
Sirius Golf Advisors, LLC 43
stability. As shown in the table below, only one Ramsey County golf course (Island lake) is in 10-mile markets that has more golfers per golf course than the identified target, while the other four are in markets with fewer than 4,000 golfers per golf course. The importance of this metric is mitigated somewhat in that the overall Ramsey County market is very close to the target, suggesting other site-specific issues (course quality, condition, accessibility, etc.) may be more important to facility success than the golfer/golf course ratio.
10-mile Rings Est. No. of
Golfers Total 18-H Equivalent
Golfers per 18 holes
Total U.S. “Target” for Successful Public Golf 4,000
Exceeds “Target”
Island Lake Golf & TC GC 97,602 21.0 4,648
Below “Target”
Keller GC 86,163 27.0 3,191
The Pond @ Battle Creek GC 66,526 21.5 3,094
Goodrich GC 75,728 26.5 2,858
Manitou Ridge GC 63,932 22.5 2,841
Ramsey County Overall 52,036 13.5 3,854
Source: National Golf Foundation
Supply vs. Demand Taking the number of golf courses in each area, we can calculate the number of golfers and the number of anticipated rounds per golf course. We can then compare these to national averages. NGF has created an index for the ratio of golfing households per 18 holes of golf. The ratio measures the local market versus the national market and is based on percent value. An index value of 110 means 110% of the national average, while and index value of 80 represents 80% of the national average.
NGF further divides public golf courses into three categories based on their peak rate for green fees and cart combined. Facilities that charge $70 or more are considered “Premium,” those charging less than $40 are called “Value,” and the rest are “Standard.” All the Ramsey Golf Facilities (except Island Lake) are considered “Standard” by this definition.
The table below shows these index values by facility type for the local market areas.

Ramsey County Golf Study Market Conditions
Sirius Golf Advisors, LLC 44
There are several salient results to be noted:
• There are no Premium golf facilities within 5 miles of Island Lake, Keller or Manitou
• Except for Premium facilities in Battle Creek’ s immediate area, and Standard facilities within Manitou’s local area, all other index values are over 100 – indicating strong demand.
• Value Facilities: There is a notable lack of value facilities across the board. Of interest is that there is four times the national demand in Goodrich’s immediate area, and nearly three times for the County as a whole.
• Premium Facilities: The index values are non-existent for several immediate areas because there simply are no Premium facilities in the area. But it is especially noteworthy that the index value for the Local (10-mile) radius around Keller is nearly seven times the national average. When taking the quality of the golf course and clubhouse, as well as Keller’s rich history, making it a Premium facility would seem to fit market demand.
• Rounds: The average number of estimated rounds is over 30,000 in all local markets. However, it is especially strong at Goodrich, where the estimated total is 68,480 for the 5-mile and 53,099 for the 10-mile radius. Since the local courses are not seeing this kind of volume, golfers living in this area are playing outside the area. Combined with the high index value for value facilities in the Goodrich market, makes a strong argument that Goodrich should be repositioned as a value facility.
Rounds Predictions NGF has estimated the number of rounds that should be generated per facility, for each of the market areas in question. The table on the right summarizes these predictions.
In this area, performance in the 30,000 to 32,000 rounds is usually enough to produce break-even or better performance. As we can see, the only facility that appears to be in a “danger-zone” is Manitou – yet that facility has historically been the best performing of the RC Golf facilities.
It is also interesting to note that the state average for Minnesota is higher than the national average, despite having such a shortened season.
Goodrich, clearly, has the most “rounds-pressure,” at least in the Neighborhood and Local areas. Both Battle Creek and Keller have the second most in the Neighborhood areas. The five facilities all have similar “rounds-pressure” for the Regional market.
Notably, these projections only consider in-market rounds. They do not consider rounds from outside, such as from tourists or other visitors.
Take-Aways There is little question that the RC Golf facilities are in a high-demand area for golf. Indeed, the entire metropolitan area, and the entire state, have much higher participation rates than the national average.
The only negative statistic found was the number of golfers per 18 holes of golf, which was less than NGF’s optimal number for success. However, this finding is strongly mitigated by other revelations. Most notably,
Estimated In-Market Rounds/Facility Facility 5- Mile 10 - Mile 20- Mile
Battle Creek 38,423 34,848 32,459 Goodrich 68,480 53,099 32,277 Island Lake 32,544 32,788 32,380 Keller 38,613 32,325 32,761 Manitou 30,546 30,806 32,460 Ramsey County 35,697 Minnesota 32,666 United States 32,809

Ramsey County Golf Study Market Conditions
Sirius Golf Advisors, LLC 45
the number of rounds predicted for in-market courses, which show good “rounds pressure” for all the facilities, but especially for Goodrich.
But, to us, one of the most important findings is when we look at demand by type of facility. In looking at these figures, it is important to note that the four main RC Golf facilities (Keller, Goodrich, Manitou and Battle Creek) are all considered “Standard” or “Mid-Fee”. Yet our analysis shows there is very strong demand for both Premium and Value courses, suggesting a good market opportunity for repositioning one or more of the RC Golf facilities.
It is also important to realize that there is a strong correlation between price and market reach. The higher the price point, the wider the market area the facility tends to draw. A value facility will have most of its rounds coming from the Neighborhood area, while a Premium facility will draw a lot of play from both the Local and Regional areas. Thus, the Regional market becomes more important if one is looking at repositioning to the Premium market. Of the 18-hole courses, Keller has the strongest market demand in both the Local and Regional areas.

Ramsey County Golf Study Competition
Sirius Golf Advisors, LLC 46
Our focus in this study were public golf courses, with most of our attention going to those clubs that are within 20-miles of any of the RC Golf facilities, as these are the ones most likely to be competitive with the RC courses. We then studied more closely those courses that were deemed, through location, feedback or nature of the facility, to be most comparable to each of the RC Golf facilities.
As part of this study, we visited all the public golf course facilities that were within a 20-mile radius of any RC Golf facility. We did so without any knowledge or preconception of the nature or price range of that facility. As part of that survey, we rated each course based strictly on its appearance to us at the time of our inspection. It should be noted that our inspection was cursory. We looked at the clubhouse and the few holes located adjacent thereto.
For expediency, we are streamlining our discussion in this Report to only those facts that are most relevant to RC Golf. A detailed summary of the courses can be found in Appendix D.
The Psychology of Golf My professional training was in Psychology. I earned my Master’s degree and was working on my dissertation when I got distracted by the business world. I mention this because one of the things that brought me into the golf business was the Psychology behind the sport. I find golf to be one of, if not the most psychologically interesting sport there is.
For proof, one must look no further then where golfers start. If shooting the best score was the only objective, which tee would all golfers use? The answer – the forward tee, because it is the shortest distance and thus would likely generate the best score. In reality, though, the forward tee is not even the second most popular tee. Many male golfers (especially seniors) refuse to use the forward tee because they still consider it the “Ladies tee,” which again points to the psychology of the sport.
The reason I’m bringing this up is because it is important to gain at least a basic understanding of just how much psychology influences this sport in order to make sense of our findings and recommendations. For example, we make a big deal out of “Par” (which is the “target” score in golf) and length. Why? Because golfers do, either consciously or subconsciously. Same with price, where our preconceptions play such a large role.
For the non-golfer, it may be hard to understand just how traditional golfers are. To most golfers, a “real” golf course should have 18 holes, have a Par of 72 (although 70 and 71 are acceptable) and have a length of at least 6,000 yards. The further you get from these standards, the less popular the course is likely to be, regardless of the quality. Even 9-hole courses, which is the second most common configuration, do substantially worse than comparable 18-hole courses.
This is why alternative configurations, such as 6-hole and 12-holes, rarely succeed unless a more traditional configurations is not available. Some courses, including Battle Creek, even offer shorter “loops” of 3 or 6 holes, for less money. Yet these loops are rarely used.
Today, the media talks a lot about the fact that one of the big problems with golf is that it takes too long to play, four to five hours on most 18-hole courses. As a result, a lot of people have advocated for shorter, Executive Courses, or even the 6 and 12-hole options, as a solution.
Yet, this is not a new issue. Nor are the solutions new. Indeed, a similar movement was very strong in the late 1990s and early 2000s, which saw a significant increase in the number of Executive (courses with pars of 55 to 66) courses being built. But golfers voted with their feet. They still overwhelmingly prefer the traditional golf course over the executive, which helps explain why Executive and Par 3 courses make up a

Ramsey County Golf Study Competition
Sirius Golf Advisors, LLC 47
disproportionately large percentage of course closings. The main exception are those courses that specifically target seniors (such as in a senior community) or juniors.
Psychology plays an important role in how the game is played. In addition to the golfer choosing where he or she wants to play from (except in tournaments), the golfer is also expected to police themselves. The only referee is the golfer him or herself. This is true not only in games between friends, but also in professional tournaments, where major championships have been lost because a player called a penalty on him or herself, even if it was inadvertent (such as accidentally moving the ball before striking it). Strategy often comes into play during a round when a golfer must assess “risk” vs. “reward” in deciding how far to hit or where to aim.
The mental side of golf is a major reason why the sport is popular among business executives who like to take potential employees, partners or customers to the course. Because golf is a true test of character. Not even the best professional golfer will play the perfect shot every time. How one handles the adversity of a bad shot, can be a true test of one’s mental and emotional state. Especially if a second bad shot follows the first! It has often been said that there are more deals made on a golf course than in a board room. I cannot attest to the complete veracity of that statement, but I can tell you there is at least some truth to it.
So, as you go through this section and wonder why it matters if a course is 6,900 or 7,000 yards long, and various other issues, just keep in mind that logic has little to do with it. What’s important is the golfer’s perception.
Overall Market There are 168 public golf courses in the metropolitan area. Two-thirds of these are 18-hole regulation, the most popular type of golf course. Another 9% are nine-hole regulation courses. Executive courses make up another 26%, with most of these being 9-hole; and Par 3 courses total 8%. Notably, there are no 18-hole Par 3 courses in the entire market area.
Of these 168 courses, 92 (55%) are located within 20-miles of an RC Golf facility. What is notable, though, is that 13 of the 14 Par 3 courses are in the Local area (93%).
Island Lake, it should be noted, is listed as an “Executive” course because it has one Par 4 hole. However, it has a lot more in common with the Par 3 courses than the executive courses.
Course Closings Since course closings grab headlines, we decided to take a closer look at the courses that have closed recently in the metro area. We were able to find 28 that have closed in the last 10 years.
When we break these courses down by type, we note that while 18-hole regulation courses make up 67% of the public golf course market in the metro area, they account for only a third of the
MSP Public Golf Courses
Metro Local RC Golf % Local
18-Hole Regulation 112 58 3 52%
9-hole Regulation 15 5 1 33%
18-hole Executive 3 2
67%
9-hole Executive 24 14 1 58%
Par 3 courses 14 13 93%
Total 168 92 5 55%
Course Closings by Type
Type # Closed % of Clsd Existing % Existing
18-hole Reg 9 32% 112 8.0%
9-hole Reg 4 14% 15 26.7%
18 Exec 2 7% 3 66.7%
9-hole exec 8 29% 24 33.3%
9 Par 3 5 18% 14 35.7%

Ramsey County Golf Study Competition
Sirius Golf Advisors, LLC 48
closings. (The percentage is lower if you include private courses). Further, they represent only 8% of the number of existing 18-hole public courses.
In contrast, executive and Par 3 courses take account for a disproportionate share of the closings. Par 3 courses are only 8% of the current market, but account for over a third of the closings. Executive courses account for 16% of the public market, but account for 36% of the closings. Notably, three of the four recent course closings in Ramsey County were Par 3 courses, with the other being an 18-hole private course.
And, a cursory review of the 18-hole regulation courses that closed reveals the clear majority of these were low-end value courses. (We do note that one of them was an 18-hole private course in Ramsey County).
These findings are consistent with NGF data that shows 70% of the course closings in the last 10 years have been Value facilities.
When you look at the distribution of the courses that have closed, as seen on the map above, you will notice that most of the area closing are outside of the heavily populated areas. This, also, is typical. Most of the courses that are in heavily populated areas tend to close because the land is worth so much more as development property than it is as a golf course and not because of poor performance.
Local Market The rest of this section will include only those courses that are within 20-miles of an RCG facility or are otherwise known to be a significant competitor of an RC Course. In addition, we added six courses (Baker National, Chisago Lakes, Crystal Lakes, Cannon Golf Club, The Refuge, and New Richmond), from outside this area that were identified by survey as being competitors of at least one of the RC Golf facilities.
The map above shows the location of all the golf courses that have closed in the area over the past 10 years. Ramsey County is outlined in purple. The circles represent the 20-mile radius (Regional Area) from RC Golf facilities.

Ramsey County Golf Study Competition
Sirius Golf Advisors, LLC 49
The maps that follow show the location of all the courses in the local area. It also shows the 10-mile (Local) and 20-mile (Regional) radii for each of the RC Golf courses. The county borders are outlined, with Ramsey County in purple.

Ramsey County Golf Study Competition
Sirius Golf Advisors, LLC 50

Ramsey County Golf Study Competition
Sirius Golf Advisors, LLC 51
The table below provides a capsule summary of these courses.
The local market has 113 courses, 22 of which are private (all 18-hole regulation). There are 62 regulation courses, of which 57 are 18-holes and five have only nine holes. (We added six 18-hole regulation courses in our analyses for a total of 63). There are also 14 Executive courses (Par 55 to 66), with just two having 18-holes. There are also 15 Par 3 courses, all having nine holes. (Note: We include Island Lake as a Par 3 course, even though technically as a Par 28, it can be considered executive. Yet its characteristics are a lot more in line with the Par 3 courses than the Executive courses).
We further divided the 18-hole regulation courses into three groups based on peak fee pricing (weekend green fee plus cart), based on NGF guidelines. We find that just seven (11%) are considered Premium (fee over $70), and only two (3.2%) are Value (under $40), with the rest being Standard or Mid-Fee. All three of the RC Golf 18-hole courses are Standard as is Battle Creek, which is nine-hole.
18-Hole Regulation Courses These courses represent the primary competition to most of the RC Golf facilities (save the Golf Dome and Island Lake). They are also, by far, the most numerous of the course types.
Local Market Courses
Count Avg Age Avg Length
Avg Slope
Avg Peak Fee
Total Private (all 18 holes) 22 71.2 6,730 137 Total Public 97
Regulation 67
18-hole 63 45.8 6,560 129.6 $57.97
Premium 7 29 6,975 137 $95.00
Standard 54 51 6,509 129 $54.15
RC Golf 3 80 6,435 128.7 $52.30
Non-RC Golf 51 48 6,511 128.7 $54.26
Value 2 24 6,390 119.5 $32.50
9-Hole 5 53 2,811 124 $39.00
RC Golf 1 14 3,023 131 $46.00
Non-RC Golf 4 63 2,758 121.7 $37.25
Executive 15
18-Hole 2 27 4,593 93.5 $40.25
9-Hole 13 41 1,811 98.2 $29.45
Par 3 (all 9-hole) 14 40 1,260 91.4 $25.96
RC Golf* 1 23 1,262 $18.50
Non-RC Golf 13 41 1,260 $26.54
* We have classified Island Lake as a Par 3, even though it has a Par of 28
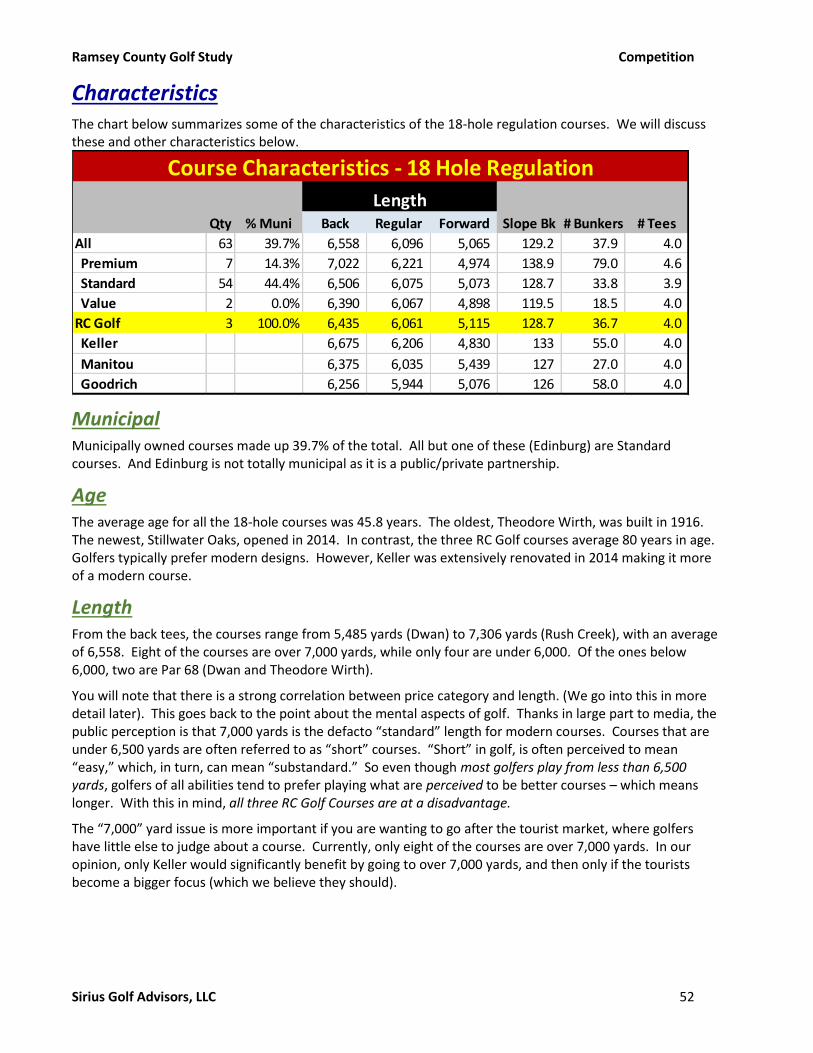
Ramsey County Golf Study Competition
Sirius Golf Advisors, LLC 52
Characteristics The chart below summarizes some of the characteristics of the 18-hole regulation courses. We will discuss these and other characteristics below.
Municipal Municipally owned courses made up 39.7% of the total. All but one of these (Edinburg) are Standard courses. And Edinburg is not totally municipal as it is a public/private partnership.
Age The average age for all the 18-hole courses was 45.8 years. The oldest, Theodore Wirth, was built in 1916. The newest, Stillwater Oaks, opened in 2014. In contrast, the three RC Golf courses average 80 years in age. Golfers typically prefer modern designs. However, Keller was extensively renovated in 2014 making it more of a modern course.
Length From the back tees, the courses range from 5,485 yards (Dwan) to 7,306 yards (Rush Creek), with an average of 6,558. Eight of the courses are over 7,000 yards, while only four are under 6,000. Of the ones below 6,000, two are Par 68 (Dwan and Theodore Wirth).
You will note that there is a strong correlation between price category and length. (We go into this in more detail later). This goes back to the point about the mental aspects of golf. Thanks in large part to media, the public perception is that 7,000 yards is the defacto “standard” length for modern courses. Courses that are under 6,500 yards are often referred to as “short” courses. “Short” in golf, is often perceived to mean “easy,” which, in turn, can mean “substandard.” So even though most golfers play from less than 6,500 yards, golfers of all abilities tend to prefer playing what are perceived to be better courses – which means longer. With this in mind, all three RC Golf Courses are at a disadvantage.
The “7,000” yard issue is more important if you are wanting to go after the tourist market, where golfers have little else to judge about a course. Currently, only eight of the courses are over 7,000 yards. In our opinion, only Keller would significantly benefit by going to over 7,000 yards, and then only if the tourists become a bigger focus (which we believe they should).
Qty % Muni Back Regular Forward Slope Bk # Bunkers # Tees
All 63 39.7% 6,558 6,096 5,065 129.2 37.9 4.0
Premium 7 14.3% 7,022 6,221 4,974 138.9 79.0 4.6
Standard 54 44.4% 6,506 6,075 5,073 128.7 33.8 3.9
Value 2 0.0% 6,390 6,067 4,898 119.5 18.5 4.0
RC Golf 3 100.0% 6,435 6,061 5,115 128.7 36.7 4.0
Keller 6,675 6,206 4,830 133 55.0 4.0
Manitou 6,375 6,035 5,439 127 27.0 4.0
Goodrich 6,256 5,944 5,076 126 58.0 4.0
Length
Course Characteristics - 18 Hole Regulation

Ramsey County Golf Study Competition
Sirius Golf Advisors, LLC 53
The table to the left shows the percentage of golfers who play from various yardages. As can be seen, about 1% play from 7,000 or more. Half play from 6,000 to 6,450. And only 6% play from under 5,000 yards.
But what is misleading in this table is the fact that these yardages are not equally represented across courses. Indeed, few courses are over 7,000 yards long, and less than half (at least locally) have a tee under 5,000 yards.
There is also a bit of a sex bias. Very few men will play from the forward tee. So, if we assume that women account for 80% of the play from the forward tee, and that only 60% of the courses have forward tees under 5,000 yards and women only account for 20% of rounds played, we would find that between 1/3rd and ½ of women prefer to play from under 5,000 yards.
Low Handicap Golfers
Where RC Golf is at a Big disadvantage, though, is with low-handicap golfers. About 26% of players like to play from over 6,500 yards. Yet only Keller is this length. Both Manitou and Goodrich are at a significant competitive disadvantage with regards to lower-handicap golfers.
Women
Women hit the ball about 70% as far as men. As men typically prefer playing from 6,000 to 6,500 yards, the equivalent for women is between 4,200 and 4,550. Yet the average length from the forward tees of these courses is 5,065 yards, which is the equivalent to 7,267 yards for women! This is longer than all but one of the 63 courses. Further, only about 1% of men play from over 7,000 yards, yet this is what is being expected from women at most of the golf courses in the area.
Not only does this make the game less enjoyable for women, but it also means it takes them longer to play, as the added length adds strokes, which adds time. And because a golf course is like a train in that it moves at the speed of the slowest car, this slows the pace of play for everyone on the golf course.
Only 1/3rd of the courses surveyed were under 5,000 yards from the forward tee, and only five were in the desired range of under 4,600 yards.
The Ramsey County courses were particularly bad, averaging 5,115 yards, or the equivalent of 7,376 yards. Keller was the most accommodating, with a length of 4,830 yards (6,900 equivalent). Goodrich, at 5,076 yards, is the equivalent of 7,459 yards. But Manitou was the most unwelcoming at 5,439 yards, the equivalent of a 7,770 yard course for women! Only three other courses in the area are longer.
Clearly, RC Golf is not alone in their disdain for the female player. But this does mean there is a significant market opportunity for RC Golf should it decide to build new forward tees at its facilities. Doing so, could allow RC Golf to dominate the market for women players.
Seniors
As may be obvious from this discussion, there is a wide disparity in the preferred yardage for golfers. It stands to reason, then, that the more tees you have, the more golfers you are able to accommodate at their “preferred” yardage.
Most golf courses today recognize this fact and create a fourth tee that is mostly used by seniors. (The other three: Back tees – for low-handicap players; Middle (white) tees – for the average male player; Forward tees – mostly for women). Indeed, 45 (71%) of the surveyed courses had a “senior” tee, including the three RC Golf facilities. These tees averaged 5,574 yards in length. (The three RC golf courses were very close, averaging 5,548 yards).
Tee Usage by Yardage
7000+ 1%
6500-6950 15%
6000-6450 50%
5500-5950 20%
5000-5450 8%
4000-4950 5%
3000-3950 1%
Ramsey County Golf Study Competition
Sirius Golf Advisors, LLC 54
Number of Tees
As may be obvious from this discussion, there is a wide disparity in the preferred yardage for golfers. It stands to reason, then, that the more tees that you have, the more golfers you are able to accommodate at their “preferred” yardage.
Therefore, you see many modern courses elect to have five or more sets of tees. In this configuration, the back tees are for the lowest handicap players (read “mostly for show”). The next farthest back are the “Championship” tees, typically 6,500 to 6,800 yards, and are for the lower-handicap players. The regular, or white tees are typically around 6,250 yards give or take 200. The senior tees are around 5,000 and the forward tees are hopefully under 5,000 (preferably around 4,500).
In the Local market, only 12 of the courses had more than four sets of tees. The number is highly correlated with peak fee. Four of the seven are Premium courses. Ten of the 12 are priced $59 or more. On the other hand, the ones with just three sets of tees tended to be lower-fee courses.
Slope Slope is a measure of a course’s difficulty. It is determined by a panel of judges, who rate the courses on difficulty from each tee. As such, it is an attempt to objectify what is often very subjective. The average slope for all courses and all tees is 111. The higher the number, the more difficult the course. Courses with slopes below 100 are considered “very easy” while those over 140 are “extremely difficult.”
Slope is one of the few statistics a golfer can use (along with length, par and USGA rating – which is mostly a function of length) to judge a course to determine where they might want to play. Slope is also used in calculating a person’s “handicap,” which is used in competitive golf to help “level the playing field.”
Overall, the surveyed courses had an average slope of 128.7 from the back tee, ranging from 113 (Dwan) to 148 (Rush Creek). About half (30) of the courses had a slope of 130 or more, while only four were less than 120.
Like length, slope is highly correlated with peak fee, at least from the back tee, which is often the only one noted in publications. The Premium courses averaged 138.9, while the value courses averaged just 119.5.
Keller, at 133, is market competitive. However, both Manitou and Goodrich are at a competitive disadvantage, at least with the better golfers.
Bunkers The number of bunkers is not a published stat. However, it is also highly correlated with fee structure. The overall average is 37.9 bunkers. Premium courses, though, averaged 79, the Mid-Fee courses averaged 33.8, and the value courses just 18.5. Goodrich, with 58 bunkers has a lot more bunkers than other courses in its price range. Since value golfers (golfers who prefer low-fee courses) tend to be higher handicap players, having 58 bunkers puts Goodrich at a market disadvantage for the golfers in its price-point.
Driving Range All but nine of the surveyed courses had driving ranges. Ranges are important for several reasons, including:
• Added revenue source.
• Teaching
• Practice
• Tournaments
Goodrich, which has no range, is at a competitive disadvantage.

Ramsey County Golf Study Competition
Sirius Golf Advisors, LLC 55
Fees Before we begin this discussion, it is necessary to define some terms:
• Peak Fee: This is the maximum in-season regular rate for green fee plus cart fee that occurs during the week and on weekends. These peak fees are almost always morning rates from 7 am till noon, although this will vary by facility. We looked at both 9-hole and 18-hole rates.
• Rack Rate: The rack rate is the published rate that appears on the website for peak season play for various types of play (18-hole, 9-hole, senior, twilight, etc.).
Unless otherwise noted, when we discuss playing fees, we are including both green fee and cart fee.
Weekday Rates
18-hole
The average Peak weekday rate was $54.04, ranging from $25 at Badlands to $139 at Rush Creek, a spread of $114. The three RC Golf facilities, in comparison, had just a $15 spread, from $46 at Goodrich to $61 at Keller. Combined, the three courses averaged $52.30, which is just a bit higher than the average for all “Standard” or “Mid-Fee” facilities at $50.31. Manitou, at $50, was right at the average.
There was not a huge difference between municipal and daily fee. The 23 municipal courses averaged $52.04, while the non-municipal averaged $55.19.
9-hole
Fifty-one of the courses (81%) advertised a 9-hole rate. The average nine-hole rate was $32.00, ranging from $20 to $57. However, there is only a three dollar difference between the three RC Golf Courses. This does not make sense, given the $15 spread for 18-holes. As was the case for 18-holes, the RC Golf courses were a little higher than the overall average, with $33.33.
The average discount for 9-holes from 18-holes was 38.3%. The Ramsey County courses were slightly under that at 35.7%. But there was a big difference between the three. Goodrich (31.5%) and Manitou (32%) were lower than the overall average, while Keller, at 43.4%, provided a significantly greater discount for nine-hole play. Keller appears to be underpriced for nine holes relative to their 18-hole rate.
We also noted there was a difference between municipal and non-municipal courses. While the amount of discount was very similar (37.9% vs. 39.2%), all but one of the municipal courses (96%) advertised a nine-hole rate. In contrast, only 67% of the non-municipal courses did.
There was no significant difference based on rate band in terms of the percentage discount.
Peak Playing Fees - 18 Hole Regulation
Weekday Peak Weekend Peak Passes
9 Holes
18 Holes
9 Holes
18 Holes Individual
All $32.00 $54.04 $33.72 $57.97 $1,512
Premium $48.00 $91.43 $48.00 $95.00 $3,361
Standard $30.73 $50.31 $32.61 $54.34 $1,320
Value $28.00 $32.50 $599
RC Golf $33.30 $52.30 $33.30 $52.30 $1,500
Keller $34.50 $61.00 $34.50 $61.00 $1,500
Manitou $34.00 $50.00 $34.00 $50.00 $1,500
Goodrich $31.50 $46.00 $31.50 $46.00 $1,500
Ramsey County Golf Study Competition
Sirius Golf Advisors, LLC 56
Senior Rates
The average playing fee for seniors was $40.05. Ramsey County, though, was almost 5% less at $38.17 compared to the rest of the market at $40.16.
In terms of percentage discount, Ramsey County was significantly more generous that average. The overall average discount was 21.8%. But the three Ramsey County courses averaged 27.3%, while the non-RC Golf courses averaged just 21.5% - a difference of nearly a third (27.3%). Here, Keller was the least generous at 25.4% discount, compared to 29.3% at Goodrich and 27% at Manitou.
Interestingly, the percentage discount was almost the same for Premium (22.6%) and Standard (22.5%) courses. But there is a difference between municipal and non-municipal.
First, again all but one of the municipal courses offered a senior rate (96%) compared to 85% for the non-municipally owned. However, the surprising finding was that the municipal courses gave seniors less of a discount, on average than the non-municipal, despite RC Golf’s high average. The municipal courses averaged 19.7% discount for seniors compared to 23.1% for the non-municipal. In fact, only two municipal courses gave seniors a bigger break than the three RC Golf courses. Ten of the municipal courses gave less than 20%. RC Golf appears to be overly generous to seniors.
Twilight
Twilight rates were originally for play during the late afternoon when a player could easily finish nine holes but might not be able to complete 18. However, it has since morphed into being any discounted afternoon rate and may start as early as 1 pm. A lot of courses now offer a “super-twilight” rate that Is closer to the original “twilight” rate definition.
Overall, the courses average twilight rate was $38.17. But not all courses offer a twilight rate. In fact, just 75% of the ones surveyed had an advertised twilight rate. The RC Golf course were right on the average at $38.00. In terms of discount, the average twilight discount (from rack rate) was 30.5%. RC Golf was a little less generous at 27%.
Weekend Rates Golf pricing is prototypical supply and demand. The price is higher when demand is heavy and often deeply discounted when it is not. As weekend mornings are usually your highest demand times for metropolitan public courses, this is when the fee is highest. It is usually cheapest during the week at late afternoons (Twilight).
Weekend rates are the ones most advertised. It is how NGF and other organizations will group courses. For example, the distinction of Premium vs. Standard vs. Value is based on the weekend rate, not the weekday.
Nationally, most public golf courses in non-resort locations will charge a higher rate on weekends. Locally, we found that 71% of the courses did charge a higher rate on weekends. RC Golf is not among them, however, as they changed their pricing philosophy in 2018 and eliminated the weekend rate.
Municipal courses were much more likely to not charge more on weekends as 43% had the same rates throughout the week. This contrasts with just 20% for the non-municipal courses. It is also highly correlated with price band. Few of the Premium courses (29%) have a weekend rate, while most (78%) of the Standard and both Value courses do.
For the courses that have a higher weekend rate, the average increase over the weekday rate is 11.3%. Several facilities charged weekend rates on Fridays, because demand on Fridays is so much higher than other weekdays. A few facilities charged a rate on Friday that was in-between the Weekday and Weekend rate. Both practices, however, were relatively scarce in this market (although both are very popular in other markets).
Ramsey County Golf Study Competition
Sirius Golf Advisors, LLC 57
The issue for municipalities charging a higher rate on weekends often comes down to whether they are taking an “amenity” approach or a “Profit” approach to their golf operations. The amenity approach will have no rate increase on weekends, while the profit approach is all about supply and demand. If the demand is greater, then the price is higher.
As the County Commissioners on October 8th indicated a desire to increase profitability, we recommend a higher rate structure on weekends, especially at Keller which has very high demand on weekend mornings. Manitou does not appear at this time to have as high a demand, so any increase there is nominal.
9-Hole Rate
The average nine-hole rate was $33.72 on weekends. There was very little difference between the RC Golf Courses ($33.33) and the non-RC Golf courses ($33.75). The average discount off 18-holes was 39.6%. RC Golf courses were a bit less generous at 35.7%. Keller was the most generous at 39.9%.
Seniors
Most facilities do NOT offer a senior rate on weekends. The main reason they offer a senior rate during the week is because seniors are the primary market during the week. But because weekends are so much higher in demand, facilities are much less likely to want to discount play when they know they can get a higher rate from other players. The MSP market is unusual in that so many facilities do offer a discount, although the majority do not.
In this market, we found that 41% of the courses did offer a senior rate. However, almost all of them restricted that rate to weekend afternoons, protecting their highest demand times. The three RC Golf facilities are among those offering a senior rate on weekend afternoons.
For those facilities that offer a senior rate on weekends, the amount of discount averaged 24.0%. RC Golf was a little more generous, offering an average of 27.3% discount compared to 23.5% for the non-RC Golf facilities.
We recommend decreasing or eliminating the senior rate on weekend afternoons at Keller, given the demand there is much greater.
Twilight
The percentage discount for twilight rates on weekends was 34.8% compared to 30.5% on weekdays. The reason for this is that a lot more facilities charge the same twilight rate on weekends as they do during the week, even if they charge more during peak play times. Again, this is a practice we do not often see outside of MSP.
Demand Pricing
We could only find two courses that were offering true demand pricing, where the fee will vary constantly by demand. As you get closer to the teetime, the price goes down if it has not already been booked. Island Lake uses this model.
We are not a big fan of demand pricing. The reason is that it trains your golfers to wait until the last minute to book, because they want the best rate. If you happen to be booked, they will go to another facility. In other words, it is doing the exact opposite of what you want. You would like to have your customer book early, as that not only assures performance, but it allows for more effective planning and staffing.
Demand pricing can work well if you are a facility that is busy and just trying to fill a few gaps in the teesheet. But if customers know there are always teetimes available, then there is no incentive for them to book early. The result is that your yield will suffer greatly, and you risk losing more customers as they go to other facilities when they wait till the last minute and you are booked.
We do NOT recommend demand pricing at any of the RC Golf facilities.

Ramsey County Golf Study Competition
Sirius Golf Advisors, LLC 58
Golf Now/EZ Links (Teetimes.com)
A little over a third (22) of the facilities allow golfers to book teetimes on either or both most popular teetime portals – GolfNow.com (Golf Now) or teetimes.com (EZ Links). These portals usually offer discounted rates. EZ Links is the POS system provider for RC Golf. Manitou was the only RC Golf course to participate, other than the free teetimes the other facilities must provide EZ Links in exchange for the POS system. Some observations:
• Eleven of the facilities (50%) offered a weekday discount with advanced booking more than a day out. The average discount was 14.5%.
• The number increased to 14 facilities (63.6%) for next day bookings during the week, with an average discount of 17.7%.
• Twelve facilities offered a discount for advanced booking on weekends, with an average discount of 13.9%
It is possible that some of the facilities that did not offer a discount were already booked for that time period.
Range The average price for a small bucket of balls was $4.80. A mid-size bucket ran an average of $7.81 and a large $9.54. The two RC Golf facilities were notably less expensive, both cost $4 for a small bucket. Manitou is $7 for a large, while Keller does not sell a large bucket – instead you get double the small buckets (for $8). In contrast, the non-RC golf facilities averaged $4.88 for a small and $9.77 for a large. RC Golf appears to be underpriced.
Season Passes Season passes are essentially prepaid green fees. Most of the courses refer to them as “memberships,” and may include additional benefits such as special events, discounts on merchandise, etc. RC golf has a season pass that is good for all three of its 18-hole facilities. But it does not sell one for each individual course (except Battle Creek, which is a nine-hole facility).
Individual
Forty-eight of the facilities offer an individual season pass (green fee only). The average price was $1,512 for individuals for seven-day-a-week play. At $1,500, RC Golf is very close to the average for non-RC Golf facilities ($1,534).
The value in a season-pass, however, is the “break-even” point for the pass. In other words, how many full-fee rounds would you have to play for the pass to pay for itself. We calculate this simply by taking the cost for the pass and dividing it by the average peak green fee. Average peak green fee is calculated by adding the peak green fee for weekday together with the peak green fee for the weekend and dividing by two. With break-even, the lower the number, the better the value.
With this measure, we find a substantial difference between RC Golf and the competition. The three RC Golf facilities averaged a break-even of 42.48, which is about 25% higher than the break-even for non-RC Golf facilities (35.23). Keller, at 33.33 rounds, is close to the average. But Manitou (44.12) and Goodrich (50) are significantly higher. Just three facilities had a higher break-even than Manitou’s (Sundance at 54.33, Dakota Pines at 56.9, and Southern Hills at 57.68). Manitou and Goodrich are at a significant competitive disadvantage with their high season-pass fee.
There is also a difference based on price point. The break-even for Premium facilities was 39.67 rounds, compared to 35.49 for mid-fee and just 27.15 for value courses. Again, Manitou and Goodrich stand out.
Ramsey County Golf Study Competition
Sirius Golf Advisors, LLC 59
Senior Individual
A little less than half (26) of the facilities offered a senior pass. Ramsey County, at $1,200, was significantly higher than the $1,003 average for the non-RC Golf facilities. In addition, the break-even point of 33.99 for RC Golf was 1.26 times higher the 26.99 for non-RC Golf.
Keller was very close to the average for the non-RC Golf facilities at 26.67 break-even. But Goodrich (35.29) and Manitou (40) were much higher.
Junior Passes
The annual pass for juniors (kids 18 and under) is $400 for RC Golf. This is $61 less than the $461 average for non-RC golf courses. However, their average was greatly distorted by the three facilities charging over $500 (Troy Burne at $2,895, Stoneridge at $2,125 and Rush Creek at $2,000). If these three are removed, the average for non-RC Golf falls to $313.
Couples and Family
RC Golf does not offer couple or family passes. Twenty-three facilities offer a couple season pass or membership, and 22 offer a family one.
Patron Program Forty percent or 25 of the facilities offer a program like the Patron program at the RC Golf courses. Some call it Patron, others call it “VIP,” or various other names. But the program works similarly in each case. The person purchases a card that gives them a discount on the regular green fees at the course. Some, like RC Golf did in 2017 but not this year, include one free green fee with the purchase.
The cost of the card averaged $122.50. Ramsey County’s $25 was the cheapest. The non-RC Golf courses averaged $138. There was a big difference in price point, as Premium course averaged $299, while the Mid-Fee courses averaged $100.
The program is much more prevalent at municipal courses, where 17 of the 23 courses have one, with an average price of $76.47. Only four daily fee courses had a similar program, with an average cost of $249.
The discount received from the card also varied quite a bit. The average during the week was 17.1%. RC Golf courses, though, only gave 10.8%, while non-RC Golf courses provided an 18% discount. The Daily fees offered a better discount (21.7%) than municipal (14.3%) and Premium courses (21%) were more generous than Standard (15.4%).
The discounts were slightly higher on weekends (17.5%), although RC Golf had the same rate (10.8%).
In general, the amount of discount varied in direct relationship with the price of the card.
Performance
Rounds We were able to get rounds counts from 32 of the 63 facilities (but just two of the seven Premium courses). In many cases, the rounds were estimated by the pro, although we did get exact counts on most of the municipal courses.
The average number of rounds for 18-hole regulation courses was 31,391 (2017). The RC Courses averaged 6% less than non-RC Golf courses, averaging 29,665 compared to 31,569 for non-RC Golf. Manitou led the way for RC Golf, with 30,350, followed closely by Goodrich at 29,801 and Keller at 28,972. Troy Burne reported the fewest rounds, at 20,000

Ramsey County Golf Study Competition
Sirius Golf Advisors, LLC 60
For the courses that reported both 2016 and 2017 rounds, there was a downward trend, with an average decline of 3.4%. In contrast, the RC Golf facilities reported a slight decrease (0.2%), while the non-RC Golf facilities had a 4.5% decrease. RC Golf’s increase was due to Goodrich, which had a strong 10.6% increase in play, but it’s gains were balanced by Manitou’s 11.1% decline. Keller was virtually the same both years.
To get a better idea of what might be behind the performance, we grouped courses based on their rounds, then compared various characteristics of these groups. The result is seen in the table below.
• Rounds performance was roughly correlated with price, with the higher-priced facilities out-performing the lower-priced. This was especially true if Troy Burne is not included.
• Similarly, courses that were more difficult (up to a point) tended to have more rounds. Although this is highly correlated with price.
Revenue We were able to get actual revenue numbers from twelve of the facilities – all municipally owned. The average total revenue was $1,938,104. Distorting this figure is Bunker Hill’s $6,689,204, which was well more than double the nearest competitor – Keller, with $2.7 million. Both facilities get a large share of their revenue from their banquet operations, although Bunker Hill’s dwarfs that of Keller’s. Bunker Hill is also a 36-hole facility.
Greenhaven reported the lowest revenue at $974,193. But Goodrich, at $989,296, was not much better.
Perhaps the best indicator of performance is revenue per round. The average for the 12 courses was $50.93. But the range was big, going from $28.69 at Greenhaven to $119.34 at Bunker Hill. Keller’s $93.72 was the next highest. Goodrich’s $33.34 was better than Greenhaven, Dwan ($32.54) and Inver Wood ($33.29). Manitou’s $38.02 was next highest after Goodrich. Brookview, at $51.73, was the only other facility with revenue over $50 per round. Edinburg’s figures, however, only represent the City’s share of the revenue and does not include merchandise or food & beverage sales.
Net Operating Income We have Net Operating Income (NOI) from nine of the municipalities. NOI is calculated by subtracting operating expenses and cost-of-sales from gross revenue. It does not include depreciation, taxes or debt service. We do not have actual NOI figures for the RC Golf facilities as we are lacking information from Fleet Services.
The average NOI was a $355,233 operating loss. Four of the municipalities reported a positive NOI, with Eagle Valley’s $354,354 leading the way. Inver Wood’s $2,215,047 loss was by far the biggest. Edinburg’s ($445,012) was the next highest loss.
Price Point Comparisons We looked at how courses at different price points compare on various characteristics. Below is a table that shows those characteristics that are most highly correlated with price. An important part of this is our
Rounds by Course Characteristics
# Rounds # Courses Peak Fee Back Yard Slope # Bunkers
Over 40k 4 $61.50 6,620 135.8 50.0
34-39k 5 $56.10 6,585 129.4 36.0
30-34k 8 $55.55 6,545 128.6 37.1
25-29k 7 $52.14 6,294 130.3 30.9
< 25 8 $54.63 6,431 126.6 40.6
<25* 7 $47.00 6,353 124.4 27.5
* Excludes Troy Burne
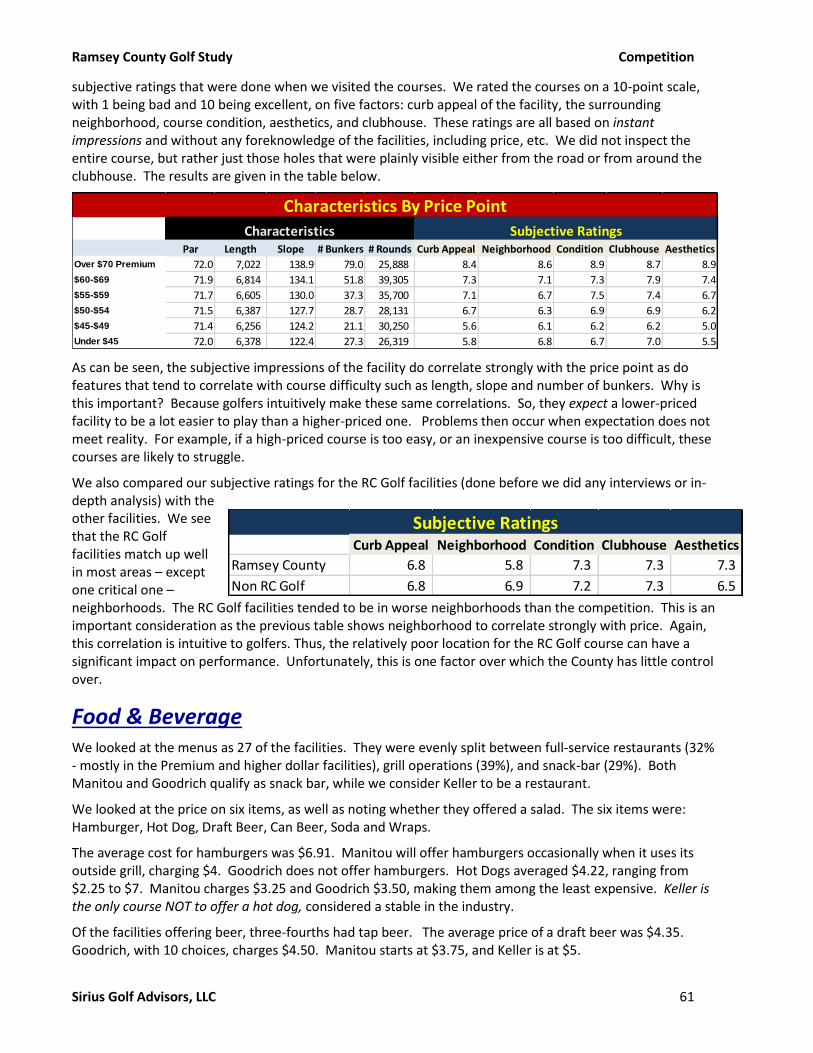
Ramsey County Golf Study Competition
Sirius Golf Advisors, LLC 61
subjective ratings that were done when we visited the courses. We rated the courses on a 10-point scale, with 1 being bad and 10 being excellent, on five factors: curb appeal of the facility, the surrounding neighborhood, course condition, aesthetics, and clubhouse. These ratings are all based on instant impressions and without any foreknowledge of the facilities, including price, etc. We did not inspect the entire course, but rather just those holes that were plainly visible either from the road or from around the clubhouse. The results are given in the table below.
As can be seen, the subjective impressions of the facility do correlate strongly with the price point as do features that tend to correlate with course difficulty such as length, slope and number of bunkers. Why is this important? Because golfers intuitively make these same correlations. So, they expect a lower-priced facility to be a lot easier to play than a higher-priced one. Problems then occur when expectation does not meet reality. For example, if a high-priced course is too easy, or an inexpensive course is too difficult, these courses are likely to struggle.
We also compared our subjective ratings for the RC Golf facilities (done before we did any interviews or in-depth analysis) with the other facilities. We see that the RC Golf facilities match up well in most areas – except one critical one – neighborhoods. The RC Golf facilities tended to be in worse neighborhoods than the competition. This is an important consideration as the previous table shows neighborhood to correlate strongly with price. Again, this correlation is intuitive to golfers. Thus, the relatively poor location for the RC Golf course can have a significant impact on performance. Unfortunately, this is one factor over which the County has little control over.
Food & Beverage We looked at the menus as 27 of the facilities. They were evenly split between full-service restaurants (32% - mostly in the Premium and higher dollar facilities), grill operations (39%), and snack-bar (29%). Both Manitou and Goodrich qualify as snack bar, while we consider Keller to be a restaurant.
We looked at the price on six items, as well as noting whether they offered a salad. The six items were: Hamburger, Hot Dog, Draft Beer, Can Beer, Soda and Wraps.
The average cost for hamburgers was $6.91. Manitou will offer hamburgers occasionally when it uses its outside grill, charging $4. Goodrich does not offer hamburgers. Hot Dogs averaged $4.22, ranging from $2.25 to $7. Manitou charges $3.25 and Goodrich $3.50, making them among the least expensive. Keller is the only course NOT to offer a hot dog, considered a stable in the industry.
Of the facilities offering beer, three-fourths had tap beer. The average price of a draft beer was $4.35. Goodrich, with 10 choices, charges $4.50. Manitou starts at $3.75, and Keller is at $5.
Par Length Slope # Bunkers # Rounds Curb Appeal Neighborhood Condition Clubhouse Aesthetics
Over $70 Premium 72.0 7,022 138.9 79.0 25,888 8.4 8.6 8.9 8.7 8.9
$60-$69 71.9 6,814 134.1 51.8 39,305 7.3 7.1 7.3 7.9 7.4
$55-$59 71.7 6,605 130.0 37.3 35,700 7.1 6.7 7.5 7.4 6.7
$50-$54 71.5 6,387 127.7 28.7 28,131 6.7 6.3 6.9 6.9 6.2
$45-$49 71.4 6,256 124.2 21.1 30,250 5.6 6.1 6.2 6.2 5.0
Under $45 72.0 6,378 122.4 27.3 26,319 5.8 6.8 6.7 7.0 5.5
Subjective Ratings
Characteristics By Price Point
Characteristics
Curb Appeal Neighborhood Condition Clubhouse Aesthetics
Ramsey County 6.8 5.8 7.3 7.3 7.3
Non RC Golf 6.8 6.9 7.2 7.3 6.5
Subjective Ratings

Ramsey County Golf Study Competition
Sirius Golf Advisors, LLC 62
Canned beer ranged from $2.50 to $8.50, averaging $4.51. Manitou was the cheapest of all the courses at $2.50, while Goodrich was in the middle at $4.50. Keller was at $5.50.
Sodas averaging $2.55. Courses offering fountain drinks were usually cheaper. Manitou, at $1.50, was the cheapest, while Goodrich again was in the middle at $2.50. Keller offers a fountain soda at $2.25.
Sadly, only 32% of the facilities offered a wrap. Manitou, which added a wrap this August on our recommendation, was one of them, as is Keller. Goodrich still does not offer one. Wraps averaged $8.22. Manitou, at $4, was again the cheapest. Keller at $9, was towards the high end ($10.25).
Even fewer of the facilities (30%) offered a salad. Keller is the only RC Golf facility to do so.
The lack of wraps and salads again shows the lack of consideration towards women golfers, who tend to prefer more healthy choices than men. Certainly, RC Golf is not alone in this area. However, it does point out the opportunity to potentially dominate the market for women golfers.
Distribution by Price
The map below shows a color and shape coding for each facility based on its price point. It also shows the 10- and 20- mile radii for Keller, Manitou and Battle Creek. (Goodrich’s overlaps so much with Keller and Manitou that we felt it is confusing to include.) Observations include:
• The Premium courses are largely on the periphery. There are no Premium courses in the more densely populated areas.
• Keller, if made premium, is the closest premium facility to downtown St. Paul and second closest to downtown Minneapolis (and probably the fastest to get to). It is also the most accessible from the airport, Mall of America, Bloomington and many of the southern suburbs.
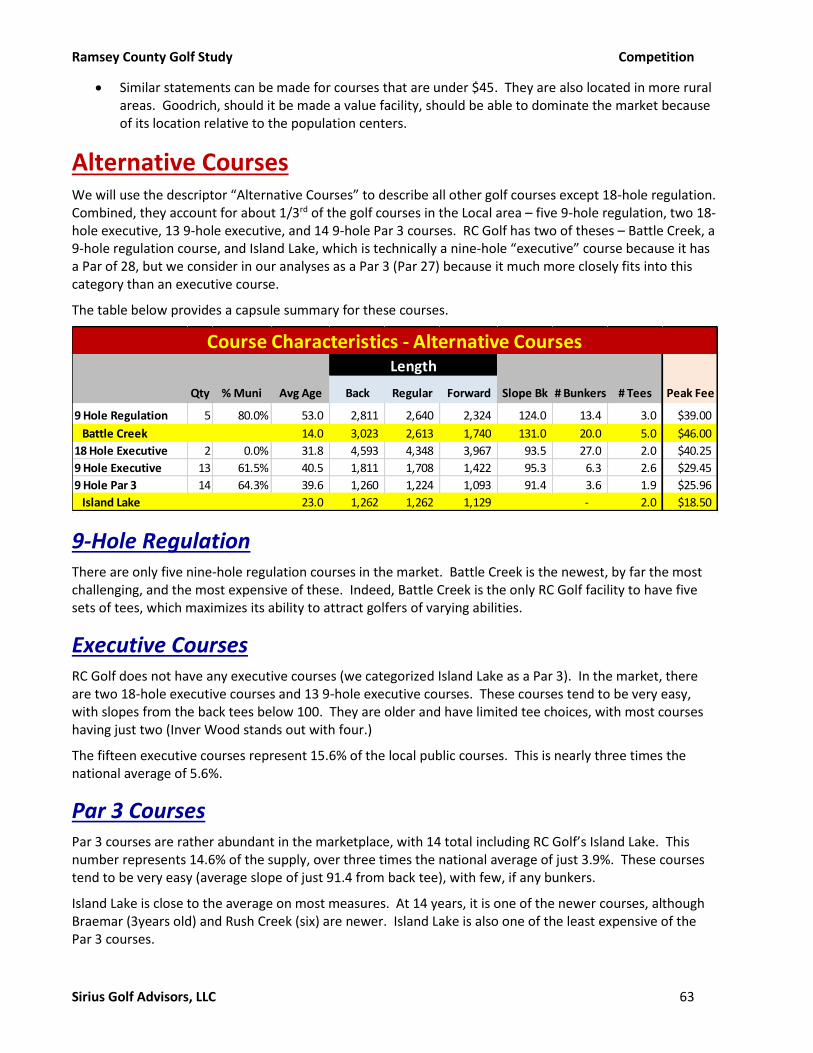
Ramsey County Golf Study Competition
Sirius Golf Advisors, LLC 63
• Similar statements can be made for courses that are under $45. They are also located in more rural areas. Goodrich, should it be made a value facility, should be able to dominate the market because of its location relative to the population centers.
Alternative Courses We will use the descriptor “Alternative Courses” to describe all other golf courses except 18-hole regulation. Combined, they account for about 1/3rd of the golf courses in the Local area – five 9-hole regulation, two 18-hole executive, 13 9-hole executive, and 14 9-hole Par 3 courses. RC Golf has two of theses – Battle Creek, a 9-hole regulation course, and Island Lake, which is technically a nine-hole “executive” course because it has a Par of 28, but we consider in our analyses as a Par 3 (Par 27) because it much more closely fits into this category than an executive course.
The table below provides a capsule summary for these courses.
9-Hole Regulation There are only five nine-hole regulation courses in the market. Battle Creek is the newest, by far the most challenging, and the most expensive of these. Indeed, Battle Creek is the only RC Golf facility to have five sets of tees, which maximizes its ability to attract golfers of varying abilities.
Executive Courses RC Golf does not have any executive courses (we categorized Island Lake as a Par 3). In the market, there are two 18-hole executive courses and 13 9-hole executive courses. These courses tend to be very easy, with slopes from the back tees below 100. They are older and have limited tee choices, with most courses having just two (Inver Wood stands out with four.)
The fifteen executive courses represent 15.6% of the local public courses. This is nearly three times the national average of 5.6%.
Par 3 Courses Par 3 courses are rather abundant in the marketplace, with 14 total including RC Golf’s Island Lake. This number represents 14.6% of the supply, over three times the national average of just 3.9%. These courses tend to be very easy (average slope of just 91.4 from back tee), with few, if any bunkers.
Island Lake is close to the average on most measures. At 14 years, it is one of the newer courses, although Braemar (3years old) and Rush Creek (six) are newer. Island Lake is also one of the least expensive of the Par 3 courses.
Qty % Muni Avg Age Back Regular Forward Slope Bk # Bunkers # Tees Peak Fee
9 Hole Regulation 5 80.0% 53.0 2,811 2,640 2,324 124.0 13.4 3.0 $39.00
Battle Creek 14.0 3,023 2,613 1,740 131.0 20.0 5.0 $46.00
18 Hole Executive 2 0.0% 31.8 4,593 4,348 3,967 93.5 27.0 2.0 $40.25
9 Hole Executive 13 61.5% 40.5 1,811 1,708 1,422 95.3 6.3 2.6 $29.45
9 Hole Par 3 14 64.3% 39.6 1,260 1,224 1,093 91.4 3.6 1.9 $25.96
Island Lake 23.0 1,262 1,262 1,129 - 2.0 $18.50
Course Characteristics - Alternative CoursesLength
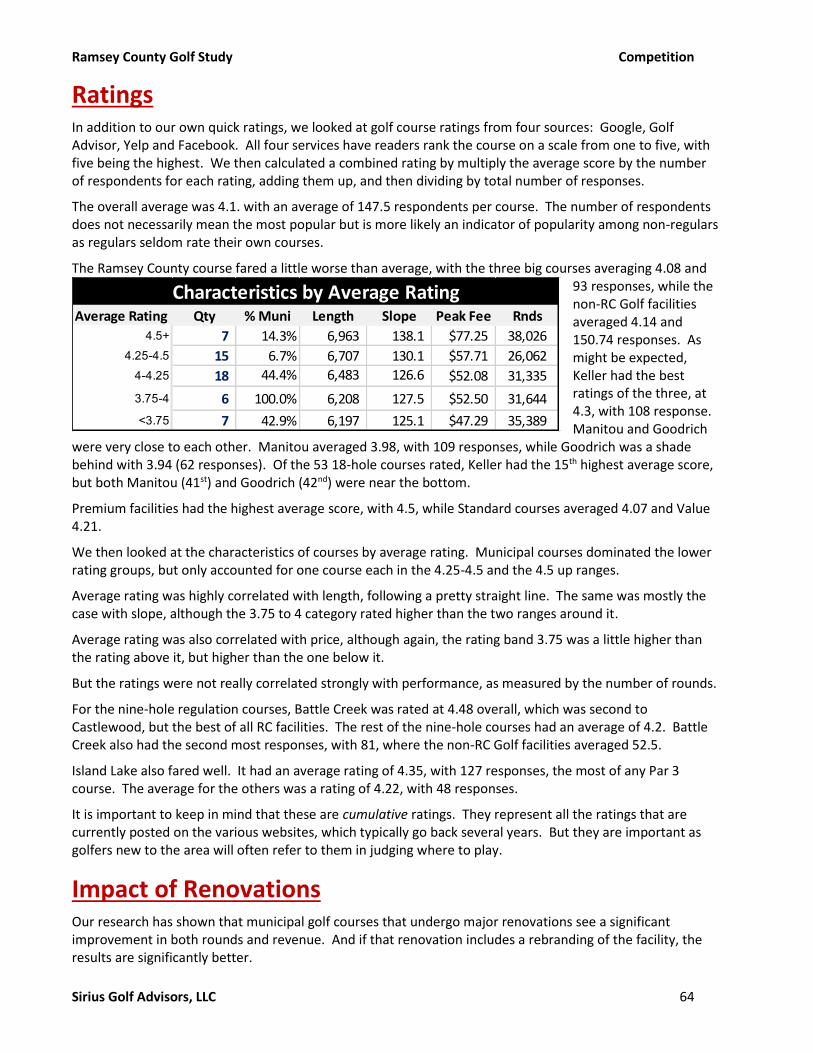
Ramsey County Golf Study Competition
Sirius Golf Advisors, LLC 64
Ratings In addition to our own quick ratings, we looked at golf course ratings from four sources: Google, Golf Advisor, Yelp and Facebook. All four services have readers rank the course on a scale from one to five, with five being the highest. We then calculated a combined rating by multiply the average score by the number of respondents for each rating, adding them up, and then dividing by total number of responses.
The overall average was 4.1. with an average of 147.5 respondents per course. The number of respondents does not necessarily mean the most popular but is more likely an indicator of popularity among non-regulars as regulars seldom rate their own courses.
The Ramsey County course fared a little worse than average, with the three big courses averaging 4.08 and 93 responses, while the non-RC Golf facilities averaged 4.14 and 150.74 responses. As might be expected, Keller had the best ratings of the three, at 4.3, with 108 response. Manitou and Goodrich
were very close to each other. Manitou averaged 3.98, with 109 responses, while Goodrich was a shade behind with 3.94 (62 responses). Of the 53 18-hole courses rated, Keller had the 15th highest average score, but both Manitou (41st) and Goodrich (42nd) were near the bottom.
Premium facilities had the highest average score, with 4.5, while Standard courses averaged 4.07 and Value 4.21.
We then looked at the characteristics of courses by average rating. Municipal courses dominated the lower rating groups, but only accounted for one course each in the 4.25-4.5 and the 4.5 up ranges.
Average rating was highly correlated with length, following a pretty straight line. The same was mostly the case with slope, although the 3.75 to 4 category rated higher than the two ranges around it.
Average rating was also correlated with price, although again, the rating band 3.75 was a little higher than the rating above it, but higher than the one below it.
But the ratings were not really correlated strongly with performance, as measured by the number of rounds.
For the nine-hole regulation courses, Battle Creek was rated at 4.48 overall, which was second to Castlewood, but the best of all RC facilities. The rest of the nine-hole courses had an average of 4.2. Battle Creek also had the second most responses, with 81, where the non-RC Golf facilities averaged 52.5.
Island Lake also fared well. It had an average rating of 4.35, with 127 responses, the most of any Par 3 course. The average for the others was a rating of 4.22, with 48 responses.
It is important to keep in mind that these are cumulative ratings. They represent all the ratings that are currently posted on the various websites, which typically go back several years. But they are important as golfers new to the area will often refer to them in judging where to play.
Impact of Renovations Our research has shown that municipal golf courses that undergo major renovations see a significant improvement in both rounds and revenue. And if that renovation includes a rebranding of the facility, the results are significantly better.
Average Rating Qty % Muni Length Slope Peak Fee Rnds
4.5+ 7 14.3% 6,963 138.1 $77.25 38,026
4.25-4.5 15 6.7% 6,707 130.1 $57.71 26,062
4-4.25 18 44.4% 6,483 126.6 $52.08 31,335
3.75-4 6 100.0% 6,208 127.5 $52.50 31,644
<3.75 7 42.9% 6,197 125.1 $47.29 35,389
Characteristics by Average Rating

Ramsey County Golf Study Competition
Sirius Golf Advisors, LLC 65
A recent study by Sirius Golf Advisors, in conjunction with the NGF, has shown that major renovations, especially when coupled with market repositioning plus increased marketing, can have a dramatic impact on performance. This study examined municipal golf courses in the Dallas-Ft. Worth area. At the time of the study, nineteen of these facilities had undergone renovations in recent years, with six doing major (over $3m) and four doing minor (under $1m).
The two biggest findings were:
• Both minor and major renovations had a significant impact in the first year. However, the improvement tapered off for the courses with minor improvements, while performance continued to increase for the major renovations. However, both renovation types paid for themselves over time.
• By far, the biggest improvements were seen by courses that BOTH did major renovations and rebranded themselves. The Rebranders averaged a 65.5% increase in revenue (an average of $699,601) in the first year, compared to an 18.1% increase ($171,780) by the others. In the 2nd year, the Rebranders increased on average an additional $241,352, for a total improvement of 74.3% over base in the 2nd year. This compares to a $252,941 increase and 31.7% by the others.
In the October 2018 issue of Get the Q, the monthly publication from NGF, NGF reports that facilities are receiving a strong return on investment in renovations and details several case studies. The point out that facilities have invested $3.25 billion in renovations over the past 12 years. This figure only includes major renovations that involved shutting at least nine holes of golf down for a minimum of three months. The article can be found at: https://www.thengfq.com/2018/10/the-roi-on-course-renovations/?utm_source=ngf&utm_medium=Q&utm_campaign=Oct18&ID=1526568 .
So far, though, the renovation fever has not hit the MSP area. Few of the area facilities have had a major renovation in recent years, with Braemar, Keller and Tartan Park (now Royal Club) being the exception. Braemar is set to reopen next year.
Takeaways In general, the RC Golf facilities fare well against the competition in most areas. However, they are underperforming a bit with regards to rounds. But there is a strong case to be made for Keller to be elevated to Premium status and Goodrich to a Value course. In each case, the facility fits the profile for that class, and there is a demonstrable need in the area. This move should help the performance for all three RC Golf facilities as Keller and Goodrich are moving into areas of need, and Manitou is moving away from its two biggest competitors.
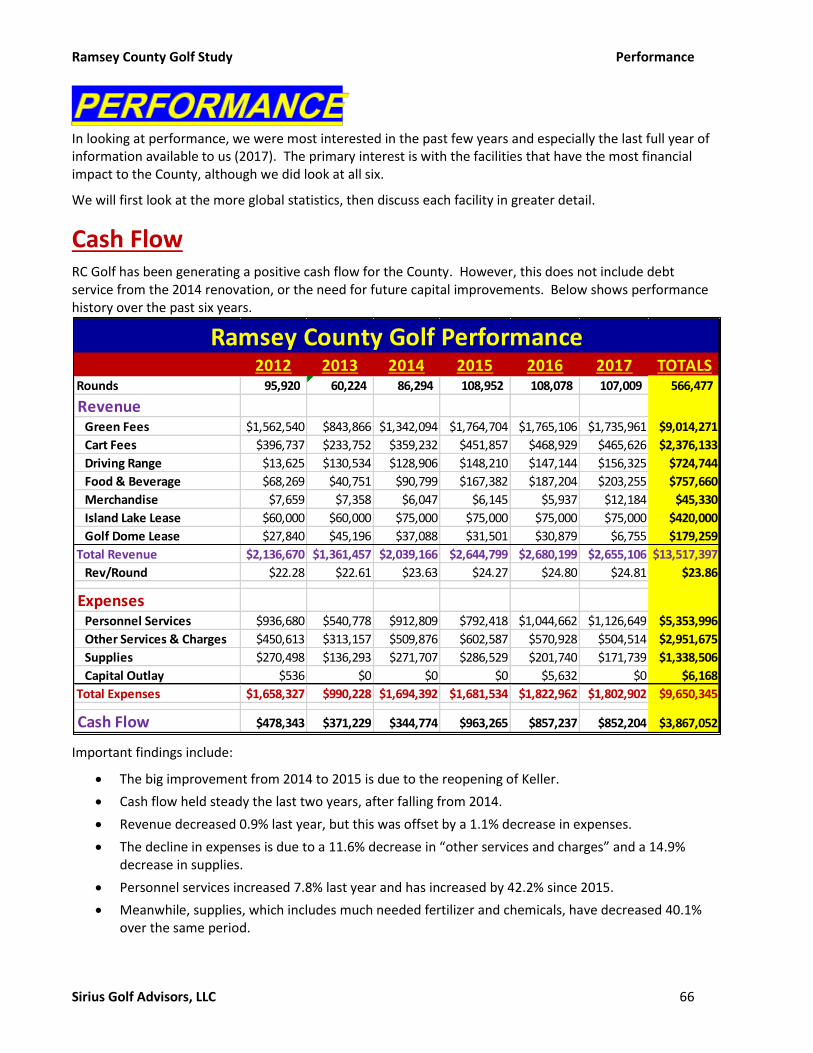
Ramsey County Golf Study Performance
Sirius Golf Advisors, LLC 66
In looking at performance, we were most interested in the past few years and especially the last full year of information available to us (2017). The primary interest is with the facilities that have the most financial impact to the County, although we did look at all six.
We will first look at the more global statistics, then discuss each facility in greater detail.
Cash Flow RC Golf has been generating a positive cash flow for the County. However, this does not include debt service from the 2014 renovation, or the need for future capital improvements. Below shows performance history over the past six years.
Important findings include:
• The big improvement from 2014 to 2015 is due to the reopening of Keller.
• Cash flow held steady the last two years, after falling from 2014.
• Revenue decreased 0.9% last year, but this was offset by a 1.1% decrease in expenses.
• The decline in expenses is due to a 11.6% decrease in “other services and charges” and a 14.9% decrease in supplies.
• Personnel services increased 7.8% last year and has increased by 42.2% since 2015.
• Meanwhile, supplies, which includes much needed fertilizer and chemicals, have decreased 40.1% over the same period.
2012 2013 2014 2015 2016 2017 TOTALSRounds 95,920 60,224 86,294 108,952 108,078 107,009 566,477
Revenue Green Fees $1,562,540 $843,866 $1,342,094 $1,764,704 $1,765,106 $1,735,961 $9,014,271
Cart Fees $396,737 $233,752 $359,232 $451,857 $468,929 $465,626 $2,376,133
Driving Range $13,625 $130,534 $128,906 $148,210 $147,144 $156,325 $724,744
Food & Beverage $68,269 $40,751 $90,799 $167,382 $187,204 $203,255 $757,660
Merchandise $7,659 $7,358 $6,047 $6,145 $5,937 $12,184 $45,330
Island Lake Lease $60,000 $60,000 $75,000 $75,000 $75,000 $75,000 $420,000
Golf Dome Lease $27,840 $45,196 $37,088 $31,501 $30,879 $6,755 $179,259
Total Revenue $2,136,670 $1,361,457 $2,039,166 $2,644,799 $2,680,199 $2,655,106 $13,517,397
Rev/Round $22.28 $22.61 $23.63 $24.27 $24.80 $24.81 $23.86
Expenses Personnel Services $936,680 $540,778 $912,809 $792,418 $1,044,662 $1,126,649 $5,353,996
Other Services & Charges $450,613 $313,157 $509,876 $602,587 $570,928 $504,514 $2,951,675
Supplies $270,498 $136,293 $271,707 $286,529 $201,740 $171,739 $1,338,506
Capital Outlay $536 $0 $0 $0 $5,632 $0 $6,168
Total Expenses $1,658,327 $990,228 $1,694,392 $1,681,534 $1,822,962 $1,802,902 $9,650,345
Cash Flow $478,343 $371,229 $344,774 $963,265 $857,237 $852,204 $3,867,052
Ramsey County Golf Performance
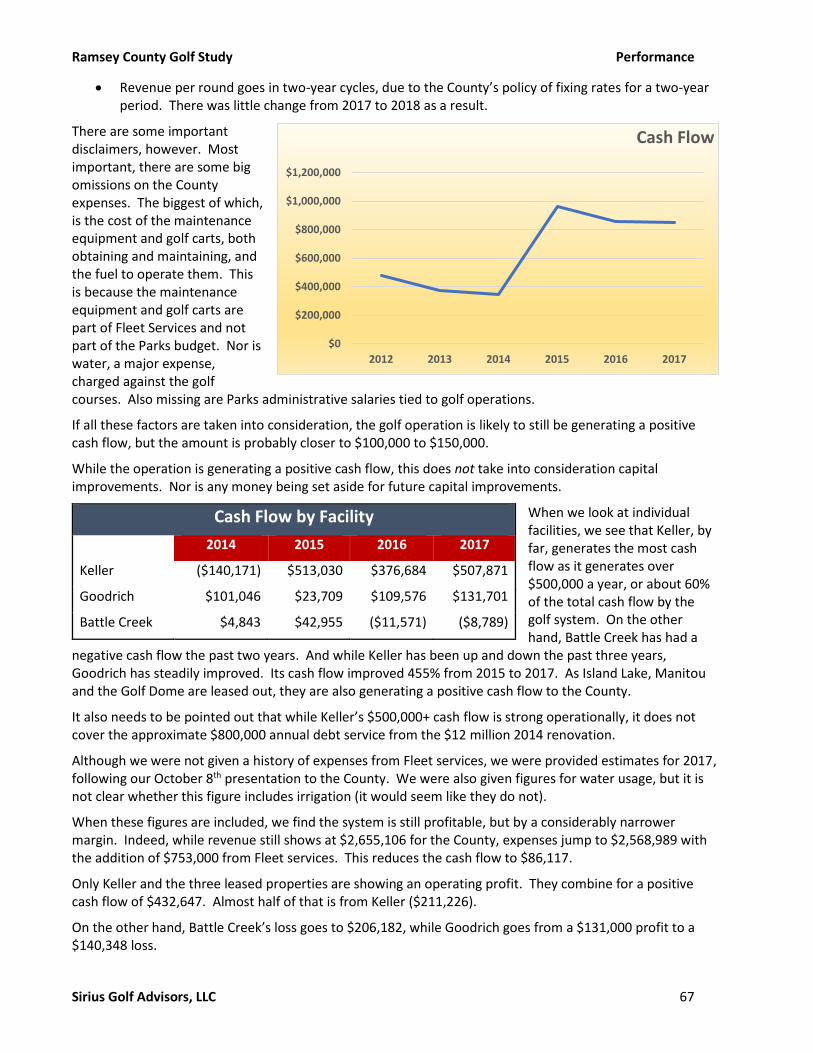
Ramsey County Golf Study Performance
Sirius Golf Advisors, LLC 67
• Revenue per round goes in two-year cycles, due to the County’s policy of fixing rates for a two-year period. There was little change from 2017 to 2018 as a result.
There are some important disclaimers, however. Most important, there are some big omissions on the County expenses. The biggest of which, is the cost of the maintenance equipment and golf carts, both obtaining and maintaining, and the fuel to operate them. This is because the maintenance equipment and golf carts are part of Fleet Services and not part of the Parks budget. Nor is water, a major expense, charged against the golf courses. Also missing are Parks administrative salaries tied to golf operations.
If all these factors are taken into consideration, the golf operation is likely to still be generating a positive cash flow, but the amount is probably closer to $100,000 to $150,000.
While the operation is generating a positive cash flow, this does not take into consideration capital improvements. Nor is any money being set aside for future capital improvements.
When we look at individual facilities, we see that Keller, by far, generates the most cash flow as it generates over $500,000 a year, or about 60% of the total cash flow by the golf system. On the other hand, Battle Creek has had a
negative cash flow the past two years. And while Keller has been up and down the past three years, Goodrich has steadily improved. Its cash flow improved 455% from 2015 to 2017. As Island Lake, Manitou and the Golf Dome are leased out, they are also generating a positive cash flow to the County.
It also needs to be pointed out that while Keller’s $500,000+ cash flow is strong operationally, it does not cover the approximate $800,000 annual debt service from the $12 million 2014 renovation.
Although we were not given a history of expenses from Fleet services, we were provided estimates for 2017, following our October 8th presentation to the County. We were also given figures for water usage, but it is not clear whether this figure includes irrigation (it would seem like they do not).
When these figures are included, we find the system is still profitable, but by a considerably narrower margin. Indeed, while revenue still shows at $2,655,106 for the County, expenses jump to $2,568,989 with the addition of $753,000 from Fleet services. This reduces the cash flow to $86,117.
Only Keller and the three leased properties are showing an operating profit. They combine for a positive cash flow of $432,647. Almost half of that is from Keller ($211,226).
On the other hand, Battle Creek’s loss goes to $206,182, while Goodrich goes from a $131,000 profit to a $140,348 loss.
Cash Flow by Facility
2014 2015 2016 2017
Keller ($140,171) $513,030 $376,684 $507,871
Goodrich $101,046 $23,709 $109,576 $131,701
Battle Creek $4,843 $42,955 ($11,571) ($8,789)
$0
$200,000
$400,000
$600,000
$800,000
$1,000,000
$1,200,000
2012 2013 2014 2015 2016 2017
Cash Flow
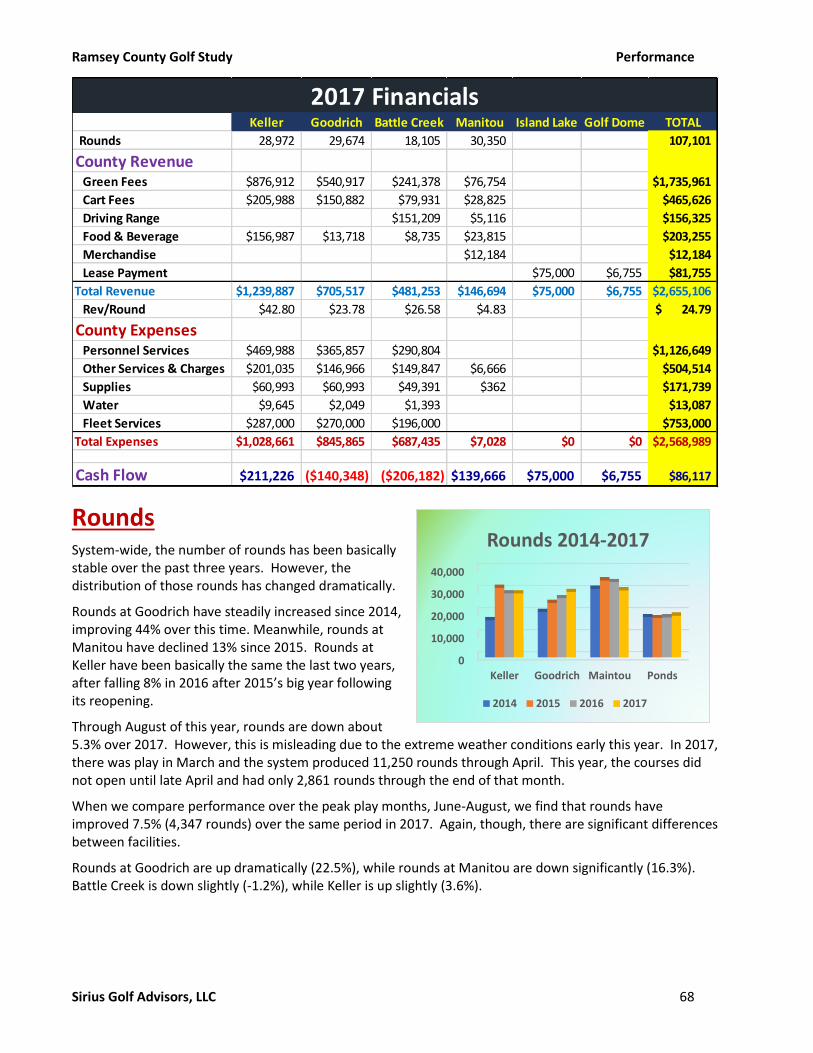
Ramsey County Golf Study Performance
Sirius Golf Advisors, LLC 68
Rounds System-wide, the number of rounds has been basically stable over the past three years. However, the distribution of those rounds has changed dramatically.
Rounds at Goodrich have steadily increased since 2014, improving 44% over this time. Meanwhile, rounds at Manitou have declined 13% since 2015. Rounds at Keller have been basically the same the last two years, after falling 8% in 2016 after 2015’s big year following its reopening.
Through August of this year, rounds are down about 5.3% over 2017. However, this is misleading due to the extreme weather conditions early this year. In 2017, there was play in March and the system produced 11,250 rounds through April. This year, the courses did not open until late April and had only 2,861 rounds through the end of that month.
When we compare performance over the peak play months, June-August, we find that rounds have improved 7.5% (4,347 rounds) over the same period in 2017. Again, though, there are significant differences between facilities.
Rounds at Goodrich are up dramatically (22.5%), while rounds at Manitou are down significantly (16.3%). Battle Creek is down slightly (-1.2%), while Keller is up slightly (3.6%).
Keller Goodrich Battle Creek Manitou Island Lake Golf Dome TOTAL
Rounds 28,972 29,674 18,105 30,350 107,101
County Revenue Green Fees $876,912 $540,917 $241,378 $76,754 $1,735,961
Cart Fees $205,988 $150,882 $79,931 $28,825 $465,626
Driving Range $151,209 $5,116 $156,325
Food & Beverage $156,987 $13,718 $8,735 $23,815 $203,255
Merchandise $12,184 $12,184
Lease Payment $75,000 $6,755 $81,755
Total Revenue $1,239,887 $705,517 $481,253 $146,694 $75,000 $6,755 $2,655,106
Rev/Round $42.80 $23.78 $26.58 $4.83 24.79$
County Expenses Personnel Services $469,988 $365,857 $290,804 $1,126,649
Other Services & Charges $201,035 $146,966 $149,847 $6,666 $504,514
Supplies $60,993 $60,993 $49,391 $362 $171,739
Water $9,645 $2,049 $1,393 $13,087
Fleet Services $287,000 $270,000 $196,000 $753,000
Total Expenses $1,028,661 $845,865 $687,435 $7,028 $0 $0 $2,568,989
Cash Flow $211,226 ($140,348) ($206,182) $139,666 $75,000 $6,755 $86,117
2017 Financials
0
10,000
20,000
30,000
40,000
Keller Goodrich Maintou Ponds
Rounds 2014-2017
2014 2015 2016 2017
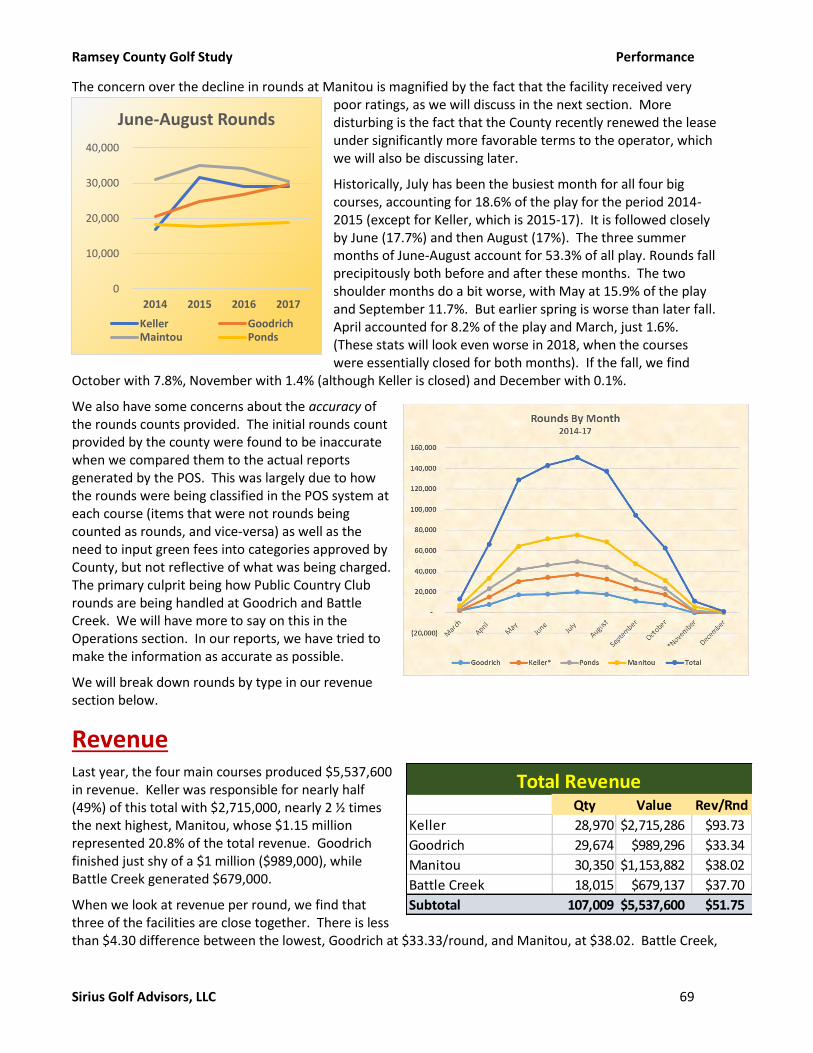
Ramsey County Golf Study Performance
Sirius Golf Advisors, LLC 69
The concern over the decline in rounds at Manitou is magnified by the fact that the facility received very poor ratings, as we will discuss in the next section. More disturbing is the fact that the County recently renewed the lease under significantly more favorable terms to the operator, which we will also be discussing later.
Historically, July has been the busiest month for all four big courses, accounting for 18.6% of the play for the period 2014-2015 (except for Keller, which is 2015-17). It is followed closely by June (17.7%) and then August (17%). The three summer months of June-August account for 53.3% of all play. Rounds fall precipitously both before and after these months. The two shoulder months do a bit worse, with May at 15.9% of the play and September 11.7%. But earlier spring is worse than later fall. April accounted for 8.2% of the play and March, just 1.6%. (These stats will look even worse in 2018, when the courses were essentially closed for both months). If the fall, we find
October with 7.8%, November with 1.4% (although Keller is closed) and December with 0.1%.
We also have some concerns about the accuracy of the rounds counts provided. The initial rounds count provided by the county were found to be inaccurate when we compared them to the actual reports generated by the POS. This was largely due to how the rounds were being classified in the POS system at each course (items that were not rounds being counted as rounds, and vice-versa) as well as the need to input green fees into categories approved by County, but not reflective of what was being charged. The primary culprit being how Public Country Club rounds are being handled at Goodrich and Battle Creek. We will have more to say on this in the Operations section. In our reports, we have tried to make the information as accurate as possible.
We will break down rounds by type in our revenue section below.
Revenue Last year, the four main courses produced $5,537,600 in revenue. Keller was responsible for nearly half (49%) of this total with $2,715,000, nearly 2 ½ times the next highest, Manitou, whose $1.15 million represented 20.8% of the total revenue. Goodrich finished just shy of a $1 million ($989,000), while Battle Creek generated $679,000.
When we look at revenue per round, we find that three of the facilities are close together. There is less than $4.30 difference between the lowest, Goodrich at $33.33/round, and Manitou, at $38.02. Battle Creek,
0
10,000
20,000
30,000
40,000
2014 2015 2016 2017
June-August Rounds
Keller GoodrichMaintou Ponds
Qty Value Rev/Rnd
Keller 28,970 $2,715,286 $93.73
Goodrich 29,674 $989,296 $33.34
Manitou 30,350 $1,153,882 $38.02
Battle Creek 18,015 $679,137 $37.70
Subtotal 107,009 $5,537,600 $51.75
Total Revenue
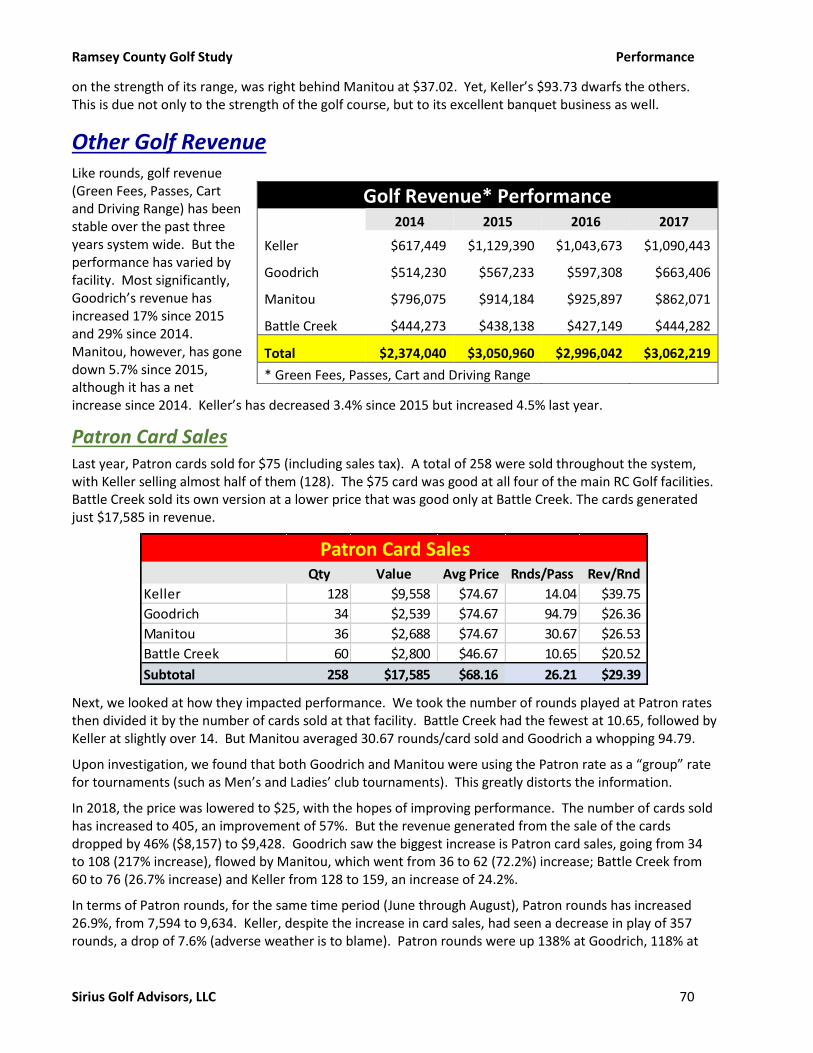
Ramsey County Golf Study Performance
Sirius Golf Advisors, LLC 70
on the strength of its range, was right behind Manitou at $37.02. Yet, Keller’s $93.73 dwarfs the others. This is due not only to the strength of the golf course, but to its excellent banquet business as well.
Other Golf Revenue Like rounds, golf revenue (Green Fees, Passes, Cart and Driving Range) has been stable over the past three years system wide. But the performance has varied by facility. Most significantly, Goodrich’s revenue has increased 17% since 2015 and 29% since 2014. Manitou, however, has gone down 5.7% since 2015, although it has a net increase since 2014. Keller’s has decreased 3.4% since 2015 but increased 4.5% last year.
Patron Card Sales Last year, Patron cards sold for $75 (including sales tax). A total of 258 were sold throughout the system, with Keller selling almost half of them (128). The $75 card was good at all four of the main RC Golf facilities. Battle Creek sold its own version at a lower price that was good only at Battle Creek. The cards generated just $17,585 in revenue.
Next, we looked at how they impacted performance. We took the number of rounds played at Patron rates then divided it by the number of cards sold at that facility. Battle Creek had the fewest at 10.65, followed by Keller at slightly over 14. But Manitou averaged 30.67 rounds/card sold and Goodrich a whopping 94.79.
Upon investigation, we found that both Goodrich and Manitou were using the Patron rate as a “group” rate for tournaments (such as Men’s and Ladies’ club tournaments). This greatly distorts the information.
In 2018, the price was lowered to $25, with the hopes of improving performance. The number of cards sold has increased to 405, an improvement of 57%. But the revenue generated from the sale of the cards dropped by 46% ($8,157) to $9,428. Goodrich saw the biggest increase is Patron card sales, going from 34 to 108 (217% increase), flowed by Manitou, which went from 36 to 62 (72.2%) increase; Battle Creek from 60 to 76 (26.7% increase) and Keller from 128 to 159, an increase of 24.2%.
In terms of Patron rounds, for the same time period (June through August), Patron rounds has increased 26.9%, from 7,594 to 9,634. Keller, despite the increase in card sales, had seen a decrease in play of 357 rounds, a drop of 7.6% (adverse weather is to blame). Patron rounds were up 138% at Goodrich, 118% at
Qty Value Avg Price Rnds/Pass Rev/Rnd
Keller 128 $9,558 $74.67 14.04 $39.75
Goodrich 34 $2,539 $74.67 94.79 $26.36
Manitou 36 $2,688 $74.67 30.67 $26.53
Battle Creek 60 $2,800 $46.67 10.65 $20.52
Subtotal 258 $17,585 $68.16 26.21 $29.39
Patron Card Sales
Golf Revenue* Performance 2014 2015 2016 2017
Keller $617,449 $1,129,390 $1,043,673 $1,090,443
Goodrich $514,230 $567,233 $597,308 $663,406
Manitou $796,075 $914,184 $925,897 $862,071
Battle Creek $444,273 $438,138 $427,149 $444,282
Total $2,374,040 $3,050,960 $2,996,042 $3,062,219
* Green Fees, Passes, Cart and Driving Range

Ramsey County Golf Study Performance
Sirius Golf Advisors, LLC 71
Battle Creek, and 99.9% at Manitou. But again, these increases may be due to the operators using the patron rate for play other than patron cards.
The number of rounds played per card sold dropped from 29.4 to 23.8. The biggest drop was seen at Keller, which went from 55 rounds/card sold to 27. This is more likely how they treat the Public Country Card (PCC) rounds than actual Patron card usage.
Annual Passes As with Patron cards, RC golf had a one-size-fits all season pass for its three big courses. The pass sold for $1,500 and allowed unlimited play at any of the four facilities. Battle Creek also offered a facility-only pass for about half that cost.
A total of 166 passes were sold, generating $173,792 in revenue. Keller, again, led the way with 51 sales, followed by Manitou at 44, Battle Creek with 37 and Goodrich at 34.
Overall, each passholder averaged playing 68.34 rounds. This is very high, and well above the national average of 50. Keller had the fewest at 60.35, followed by Battle Creek at 62.68, Goodrich at 71 and Manitou at a very, very high 80.3. To put that in perspective, Manitou was open for play 191 days last year. That means that EVERY passholder played, on average, once every 2.4 days. We find this to be very high and well beyond expectation.
The vast majority (77.1%) of the passes were sold to seniors. Manitou, with 88.6%, had the highest percentage of senior passholders, while Battle creek, at 56.8%, had the fewest. (Goodrich had 82.4% and Keller 78.4%). The high percentage of senior passholders helps explain the higher average rounds per pass, as seniors will play more rounds.
Driving Range The three ranges produced a total of $254,716 in revenue. Battle Creek, by far, was the top performer with more sales and revenue than the other two combined.
Driving Range Qty Value Avg Price Rev/Rnd % rounds
Keller 6,723 $64,224 $9.55 $2.22 23.21%
Manitou 4,899 $39,354 $8.03 $1.30 16.14%
Battle Creek 11,515 $151,138 $13.13 $8.39 63.92%
Subtotal 23,137 $254,716 $11.01 $2.38 21.62%
Battle Creek had 11,515 sales, producing $151,138 for an average of $13.13 per sale. Keller produced $63,224 in revenue on 6,723 sales, for an average of $9.55. Manitou generated $39,354 on just 4,899 sales for an average of $8.03 per sale. Sales figures include range passes.
Qty Value Avg Price Rnds/Pass Rev/Rnd
Keller 51 $58,366 $1,144.44 60.35 $18.96
Goodrich 34 $39,580 $1,164.11 71.03 $16.39
Manitou 44 $50,735 $1,153.07 80.30 $14.36
Battle Creek 37 $25,111 $678.67 62.68 $10.83
Subtotal 166 $173,792 $1,046.94 68.34 $15.32
Annual Pass Sales

Ramsey County Golf Study Performance
Sirius Golf Advisors, LLC 72
We also looked at the range sales in relation to the golf course. Nationally, golf ranges produce an average of around $1.25/round of golf. All three facilities were above this, although Manitou, at $1.30, was close to average. Battle Creek generated an impressive $8.39 in range revenue per round of golf, indicating that most range users were range-only users of the facility. This is consistent with our observations and interviews.
Another measure is to look at bucket sales versus rounds. Battle Creek averaged just under .64 sales per round of golf. On the other end of the scale, Manitou averaged just .16 bucket sold per round of golf.
Keller’s performance, though, is somewhat impressive given the fact that the range is remote from the clubhouse and that the facility is in a poorer neighborhood, which would hamper range-only use.
Cart Rental Fees Cart rental fees totaled $687,104. Cart rental fees are the same at each facility, so the variables are how many rounds are played at the facility, what percentage of players are riding a cart, and whether they are playing 9 holes (usually league) or 18. The facilities combined for an average cart rental fee of $11.26, and average cart rental revenue of $6.42 (which takes into consideration both usage and percentage of 9-hole rounds), and an average utilization rate of 57.02% (percentage of rounds where a cart was rented).
Manitou generated the most revenue at $225,419, with both the highest number of cart rounds (20,642) and highest utilization rate (68%), even though it was third in average price per rental ($10.92) and second (barely) in cart revenue per round ($7.43).
Keller had the highest average price, thanks to a much higher 18-hole percentage of play, at $12.70. Manitou and Goodrich were both very close at $10.98 and $10.92. Battle Creek, which has mostly 9-hole rounds, had an average price of $9.66.
Battle Creek had the lowest utilization rate at 46%, followed by Goodrich at 50.5%.
Green Fees Green Fees is the single biggest revenue item at most golf courses, and that is certainly the case with RC Golf. It accounts for 38.8% of the combined revenue at the four main facilities. This ranges from 29.8% at Keller, and 30.3% at Battle Creek, to 47.4% at Manitou and 59.5% at Goodrich. Overall, green fees totaled $2,151,242 in revenue in 2017.
Keller led the way with $809,268, even though it had the fewest rounds (28,970). It was followed by Goodrich ($588,753), Manitou ($547,347) and Battle Creek (Just $205,874). This was the same order for the average price, or revenue per
Qty Value Avg Price Rev/Rnd % rounds
Keller 17,080 $216,952 $12.70 $7.49 58.96%
Goodrich 14,990 $164,518 $10.98 $5.54 50.52%
Manitou 20,642 $225,419 $10.92 $7.43 68.01%
Battle Creek 8,305 $80,215 $9.66 $4.45 46.10%
Subtotal 61,017 $687,104 $11.26 $6.42 57.02%
Carts
Total Green Fees Qty Value Avg Price Rev/Rnd
Keller 28,970 $809,268 $27.93 $27.93
Goodrich 29,674 $588,753 $19.84 $19.84
Manitou 30,350 $547,347 $18.03 $18.03
Battle Creek 18,015 $205,874 $11.43 $11.43
Subtotal 107,009 $2,151,242 $20.10 $20.10

Ramsey County Golf Study Performance
Sirius Golf Advisors, LLC 73
round. Keller’s $27.93 was more than 2.5 times that of Battle Creek’s $11.43.
If we add the prepaid green fees (Passes and Patron Cards) to the green fees above, we get a total of $2,343,618 in revenue, with an average of $21.89 per round. Keller’s revenue per round increases to $30.28; Goodrich’s to $21.26; Manitous to $19.79 and Battle Creek’s to $12.98.
Next, we will break the green fee revenue down by type.
Peak Peak revenue rounds are those rounds where the maximum rate for that day is being charged. This would exclude senior rate or any other discounted rate.
Peak Rate Qty Value Avg Price Rev/Rnd % rounds
Keller 8,374 $350,975 $41.91 $12.12 28.91%
Goodrich 4,706 $146,880 $31.21 $4.95 15.86%
Manitou 1,555 $53,863 $34.64 $1.77 5.12%
Battle Creek 200 $6,230 $31.15 $0.35 1.11%
Subtotal 14,835 $557,949 $37.61 $5.21 13.86%
Keller, by far, had the highest utilization of peak rate at 28.91% of their rounds. At the other end, Battle Creek had just 1.11% - largely because few play 18 holes there.
But Manitou was not much better, at just 5.12% of its rounds – or a little over 1 in 20 people paid the peak fee. One of the reasons is because Manitou does so many league rounds, which are 9-holes.
Goodrich was in between Manitou and Keller at 15.86%.
The importance of maximizing Peak fee rounds is found in the fact that while Peak Fee play accounted for just 13.9% of the play overall, it was represented 26% (25.9%) of the green fee revenue.
Seniors Seniors represented nearly 1/3rd of all rounds at the RC Golf facilities. They also represented 30.3% of the green fee plus pass revenue.
Manitou, by far, had the highest rate of senior play – with nearly half of their rounds (48.67%) coming from seniors. This is a bit of a concern, as seniors will “age” out of the market as health begins to limit their play. Further, the average price paid per round for seniors at Manitou was just $15.78, compared to $27.45 at similarly priced Goodrich. Again, this can be attributed to league play, where leagues at Manitou are heavily dominated by seniors, while they are not at Goodrich. Seniors also tend to spend less in the proshop and on food and beverage.
Senior Qty Value Avg Price % GF Rev Rev/Rnd % rounds
Keller 9,209 $256,073 $27.81 29.2% $8.84 31.79%
Goodrich 5,877 $161,342 $27.45 25.6% $5.44 19.81%
Manitou 14,771 $233,112 $15.78 38.8% $7.68 48.67%
Battle Creek 4,542 $59,445 $13.09 25.4% $3.30 25.21%
Subtotal 34,399 $709,972 $20.64 30.3% $6.63 32.15%

Ramsey County Golf Study Performance
Sirius Golf Advisors, LLC 74
Keller had the next highest usage at 31.8%. On the other end, Goodrich had the lowest percentage of senior play at just 19.8%. (At most public courses, seniors typically account for around 30-35% of the play. Seniors will account for a much higher rate at executive courses or courses located in a senior community).
An important note is that at Goodrich, senior play accounted for 25.6% of the golf revenue, but only 19.8% of the rounds. Normally, you expect the percentage of revenue to be less for seniors, than its percentage of rounds as their play is discounted. But at Goodrich (and to a lesser extent, Battle Creek), they have another segment of very heavily discounted play – the Public Country Club (PCC). We will be talking about that more later when we talk about each facility’s performance.
It should be noted that some senior play is not accounted for in the above statistics such as if they play when there is no senior rate available (e.g. weekend mornings). More importantly, many seniors are members of the PCC, but their PCC play would not be counted as “seniors” in the above analysis. This explains the lower percentage of senior play shows above for Goodrich and Battle Creek.
Annual Pass Roughly 10% of the rounds at the four courses came from annual pass holders (10.6%). The percentage was similar across facilities, ranging from a low of 8.1% at Goodrich to a high of 12.9% at Battle Creek. Manitou, though, had the most pass rounds with 3,533, followed by Keller’s 3,078, Goodrich at 2,415 and Battle Creek’s 2,319.
Next, we looked at the value of the pass. First, we took the money generated by pass sales and divided it by the number of pass rounds to get the value of the pass (revenue/pass round). Keller’s pass holders averaged paying the equivalent of $18.96/round, which represents a 45.2% discount off the average peak fee shown above. Goodrich had the next highest value at $16.39 but had the biggest discount off peak at 52.5%. Manitou’s $14.36/round value represents a 41.5% discount off peak, while Battle Creek’s $10.83 was a 34.8% discount. Overall, the system averaged $15.32 per round, with a discount value of 40.7% off peak.
Next, we looked at the impact of pass sales on the total performance by taking the pass sales and dividing by the total number of rounds played. Again, Keller was the highest at $2.01/round, followed by Manitou at $1.67. Battle Creek ($1.39) and Goodrich ($1.33) were very close in value.
Nine-Hole (League) Play As a group, the facilities do not do a good job of tracking league play, which we find problematic. Given the importance of this group, we strongly recommend that each facility keep an accurate count on league play. This will require adjusting the POS system, or tracking them through the tee-sheet.
We can get an idea of the league play, though, from the amount of 9-hole play at each facility (save Battle Creek, which is a nine-hole course). This is true because most nine-hole play at the three 18-hole courses is coming from league play.
Qty Value Rev/Rnd % rounds Rnds/Pass
Keller 3,078 $18.96 $2.01 10.62% 60.4
Goodrich 2,415 $16.39 $1.33 8.14% 71.0
Manitou 3,533 $14.36 $1.67 11.64% 80.3
Battle Creek 2,319 $10.83 $1.39 12.87% 62.7
Subtotal 11,345 $15.32 $0.00 10.60% 68.3
Pass
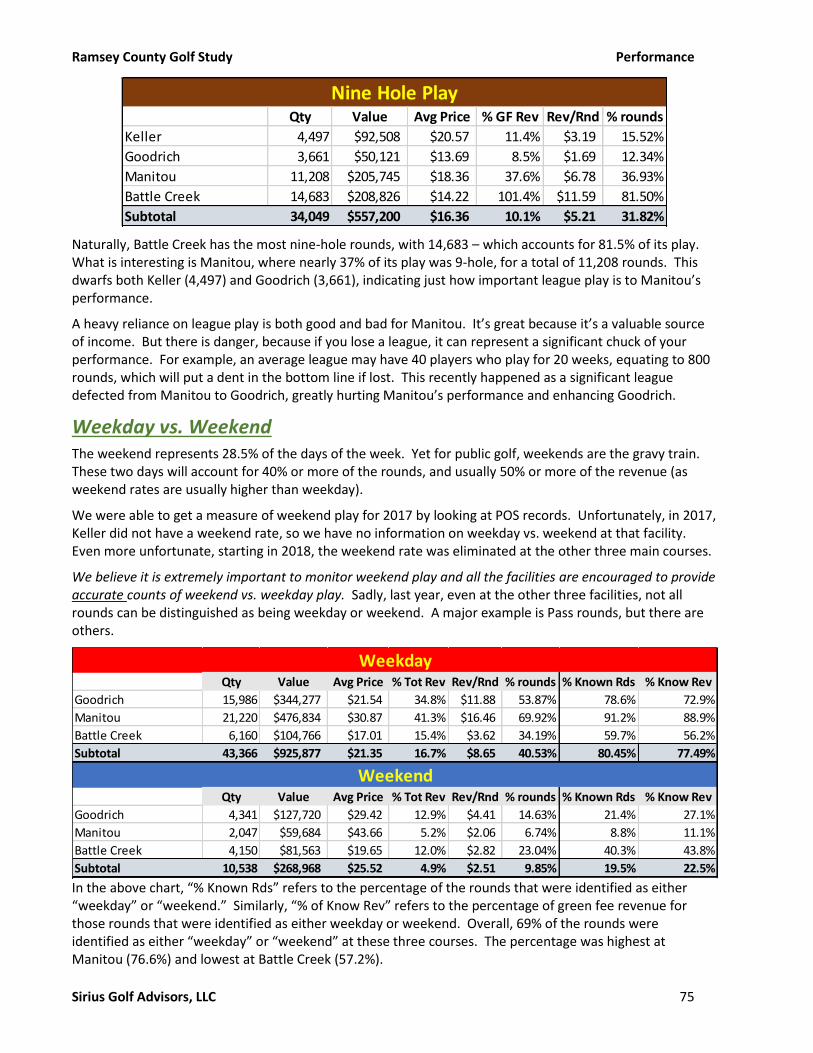
Ramsey County Golf Study Performance
Sirius Golf Advisors, LLC 75
Naturally, Battle Creek has the most nine-hole rounds, with 14,683 – which accounts for 81.5% of its play. What is interesting is Manitou, where nearly 37% of its play was 9-hole, for a total of 11,208 rounds. This dwarfs both Keller (4,497) and Goodrich (3,661), indicating just how important league play is to Manitou’s performance.
A heavy reliance on league play is both good and bad for Manitou. It’s great because it’s a valuable source of income. But there is danger, because if you lose a league, it can represent a significant chuck of your performance. For example, an average league may have 40 players who play for 20 weeks, equating to 800 rounds, which will put a dent in the bottom line if lost. This recently happened as a significant league defected from Manitou to Goodrich, greatly hurting Manitou’s performance and enhancing Goodrich.
Weekday vs. Weekend The weekend represents 28.5% of the days of the week. Yet for public golf, weekends are the gravy train. These two days will account for 40% or more of the rounds, and usually 50% or more of the revenue (as weekend rates are usually higher than weekday).
We were able to get a measure of weekend play for 2017 by looking at POS records. Unfortunately, in 2017, Keller did not have a weekend rate, so we have no information on weekday vs. weekend at that facility. Even more unfortunate, starting in 2018, the weekend rate was eliminated at the other three main courses.
We believe it is extremely important to monitor weekend play and all the facilities are encouraged to provide accurate counts of weekend vs. weekday play. Sadly, last year, even at the other three facilities, not all rounds can be distinguished as being weekday or weekend. A major example is Pass rounds, but there are others.
In the above chart, “% Known Rds” refers to the percentage of the rounds that were identified as either “weekday” or “weekend.” Similarly, “% of Know Rev” refers to the percentage of green fee revenue for those rounds that were identified as either weekday or weekend. Overall, 69% of the rounds were identified as either “weekday” or “weekend” at these three courses. The percentage was highest at Manitou (76.6%) and lowest at Battle Creek (57.2%).
Qty Value Avg Price % GF Rev Rev/Rnd % rounds
Keller 4,497 $92,508 $20.57 11.4% $3.19 15.52%
Goodrich 3,661 $50,121 $13.69 8.5% $1.69 12.34%
Manitou 11,208 $205,745 $18.36 37.6% $6.78 36.93%
Battle Creek 14,683 $208,826 $14.22 101.4% $11.59 81.50%
Subtotal 34,049 $557,200 $16.36 10.1% $5.21 31.82%
Nine Hole Play
Qty Value Avg Price % Tot Rev Rev/Rnd % rounds % Known Rds % Know Rev
Goodrich 15,986 $344,277 $21.54 34.8% $11.88 53.87% 78.6% 72.9%
Manitou 21,220 $476,834 $30.87 41.3% $16.46 69.92% 91.2% 88.9%
Battle Creek 6,160 $104,766 $17.01 15.4% $3.62 34.19% 59.7% 56.2%
Subtotal 43,366 $925,877 $21.35 16.7% $8.65 40.53% 80.45% 77.49%
Qty Value Avg Price % Tot Rev Rev/Rnd % rounds % Known Rds % Know Rev
Goodrich 4,341 $127,720 $29.42 12.9% $4.41 14.63% 21.4% 27.1%
Manitou 2,047 $59,684 $43.66 5.2% $2.06 6.74% 8.8% 11.1%
Battle Creek 4,150 $81,563 $19.65 12.0% $2.82 23.04% 40.3% 43.8%
Subtotal 10,538 $268,968 $25.52 4.9% $2.51 9.85% 19.5% 22.5%
Weekday
Weekend

Ramsey County Golf Study Performance
Sirius Golf Advisors, LLC 76
Battle Creek’s performance is close to expectation, with a little over 40% of the rounds and 43.8% of the known revenue coming on weekends. Manitou, however, stands out with just 8.8% of its play coming on weekends, with 11.1% of the revenue.
When asked about it, the operator mentioned that they did not charge the weekend rate to groups, especially the men’s and women’s clubs, when they played an outing or tournament. Yet, we are doubtful that this alone explains the difference. It is possible that Manitou just does a poor job of attracting weekend play, or an even higher percentage of the weekend rounds were being rung in at weekday rates. Sadly, because of the change in rate structure, we cannot tell if the trend continues this year.
We did ask for a breakdown by day-of-the-week from tee-sheet reports, but that report is apparently unavailable.
Other Revenue Sources Except for Keller, the County realizes little revenue from other activities at the facilities. But as the revenue formula may change, we still investigated each revenue stream.
Food & Beverage Food and Beverage is the next largest profit-center at the golf facilities. It is a huge part of Keller’s operation, accounting for 52% of all revenue. It is a more minor player at the other three. This is because these facilities lack both a grill and a banquet room.
Total Food & Beverage Qty Value Avg Price % Tot Rev Rev/Rnd % rounds
Keller $1,411,556 52.0% $48.72
Goodrich 47,290 $137,182 $2.90 13.9% $4.62 159.37%
Manitou 61,305 $186,836 $3.05 16.2% $6.16 201.99%
Battle Creek 29,801 $87,899 $2.95 12.9% $4.88 165.42%
Subtotal 138,396 $1,823,474 $13.18 32.9% $17.04 129.33%
Keller’s F&B operation, under Lancer, generated $1.4 million in revenue last year. Most of this was in banquet sales as we will discuss in greater detail later. This amount equates to $48.72 per round of golf.
Goodrich and Battle Creek, which have the same operator, produced similar figures for revenue per round. Goodrich was at $4.62 and Battle Creek at $4.88. These are not bad figures, given the lack of a grill or banquet space. But Manitou was better still, at $6.16.
Merchandise System-wide, the average merchandise sales-per-round was a pedestrian $2.64. Goodrich, at just $.88 per round, is well below expectation. Keller, at $4.48/round, fared best. But even its performance is disappointing given its price-point. Manitou, at $2.99, was next best, followed by Battle Creek at $1.97.
Qty Value Avg Price % Tot Rev Rev/Rnd % rounds
Keller 7,438 $129,643 $17.43 4.8% $4.48 25.67%
Goodrich 2,654 $26,209 $9.88 2.6% $0.88 8.94%
Manitou 6,192 $90,855 $14.67 7.9% $2.99 20.40%
Battle Creek 4,419 $35,430 $8.02 5.2% $1.97 24.53%
Subtotal 20,703 $282,137 $13.63 5.1% $2.64 19.35%
Total Merchandise

Ramsey County Golf Study Performance
Sirius Golf Advisors, LLC 77
Combined, the four facilities generated just $282,137 in merchandise sales.
Sales were about evenly distributed between hard goods (equipment, balls, etc.) with $143,754 and soft goods (clothes, towels, etc.) at $138,383. This even split was consistent across the four facilities.
Where we did see a difference was between men’s and women’s clothing sales. Keep in mind that women, nationally, make up 22.5% of the players (which is still too low).
Men’s Soft Qty Value Avg Price % Tot Rev Rev/Rnd % rounds
Keller 1,813 $49,215 $27.15 1.8% $1.70 6.26%
Goodrich 475 $11,430 $24.06 1.2% $0.39 1.60%
Manitou 1341 $32,799 $24.46 2.8% $1.08 4.42%
Battle Creek 624 $14,589 $23.38 2.1% $0.81 3.46%
Subtotal 4,253 $108,033 $25.40 2.0% $1.01 3.97%
Women’s Soft Qty Value Avg Price % Tot Rev Rev/Rnd % rounds
Keller 75 $3,483 $46.44 0.1% $0.12 0.26%
Goodrich 52 $1,181 $22.71 0.1% $0.04 0.18%
Manitou 37 $1,570 $42.43 0.1% $0.05 0.12%
Battle Creek 103 $2,266 $22.00 0.3% $0.13 0.57%
Subtotal 267 $8,500 $31.83 0.2% $0.08 0.25%
System-wide, women’s goods averaged just 5.95% by volume and 7.29% by value of the total sales. This is bad because it shows that the operators are not paying enough attention to women. Further, if there is one stereotype that receives little argument, it’s that women like to shop. Thus, the lack of attention (read “display space” and “lack of sales”) may be perceived as a slight on women, making them feel unwelcome.
Battle Creek, where 13.4% of the clothing sales were women’s, was best – and it’s still well below average. Goodrich was at 9.9%. But the worst offenders were Keller at just 4% and Manitou, where only 2.4% of the clothing sales were for women.
We will talk more extensively about merchandise sales in our Operations section.
County Expenses Overall, County expenses have increased 6.5% ($108,942) since 2014, although down slightly last year. Expenses are almost all from the three courses under management contracts as opposed to leases, as the County is responsible for their maintenance.
Over the past four years, Keller’s expenses have trended downwards, going down 9.5% since 2014 and 5.9% since 2015. Goodrich, on the other hand, has seen a 22.5% increase over the same period, and 6.4% last year. It should be noted, however, that the increase in expenses at Goodrich is highly correlated with the dramatic improvement in revenues and cash flow. It is highly likely that the improved course conditions that are usually associated with increased spending, has had a notable positive impact on performance.
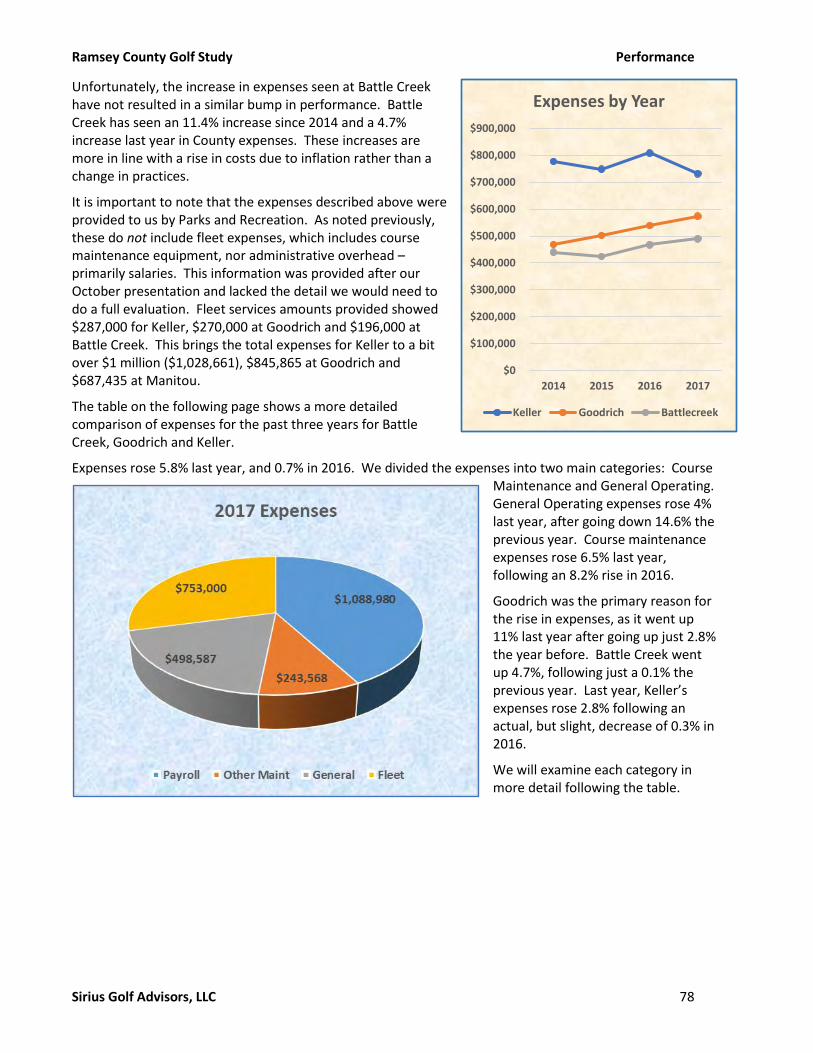
Ramsey County Golf Study Performance
Sirius Golf Advisors, LLC 78
Unfortunately, the increase in expenses seen at Battle Creek have not resulted in a similar bump in performance. Battle Creek has seen an 11.4% increase since 2014 and a 4.7% increase last year in County expenses. These increases are more in line with a rise in costs due to inflation rather than a change in practices.
It is important to note that the expenses described above were provided to us by Parks and Recreation. As noted previously, these do not include fleet expenses, which includes course maintenance equipment, nor administrative overhead – primarily salaries. This information was provided after our October presentation and lacked the detail we would need to do a full evaluation. Fleet services amounts provided showed $287,000 for Keller, $270,000 at Goodrich and $196,000 at Battle Creek. This brings the total expenses for Keller to a bit over $1 million ($1,028,661), $845,865 at Goodrich and $687,435 at Manitou.
The table on the following page shows a more detailed comparison of expenses for the past three years for Battle Creek, Goodrich and Keller.
Expenses rose 5.8% last year, and 0.7% in 2016. We divided the expenses into two main categories: Course Maintenance and General Operating. General Operating expenses rose 4% last year, after going down 14.6% the previous year. Course maintenance expenses rose 6.5% last year, following an 8.2% rise in 2016.
Goodrich was the primary reason for the rise in expenses, as it went up 11% last year after going up just 2.8% the year before. Battle Creek went up 4.7%, following just a 0.1% the previous year. Last year, Keller’s expenses rose 2.8% following an actual, but slight, decrease of 0.3% in 2016.
We will examine each category in more detail following the table.
$0
$100,000
$200,000
$300,000
$400,000
$500,000
$600,000
$700,000
$800,000
$900,000
2014 2015 2016 2017
Expenses by Year
Keller Goodrich Battlecreek

Ramsey County Golf Study Performance
Sirius Golf Advisors, LLC 79
2015 2016 2017 2015 2016 2017 2015 2016 2017 2015 2016 2017Course MaintenancePayroll
Salaries
Salaries Permanent $161,060 $202,488 $210,225 $119,590 $173,438 $187,901 $164,617 $243,000 $260,849 $445,268 $618,926 $658,975
Overtime $239 $1,817 $2,809 $4,046 $33,913 $14,405 $29,691 $26,413 $17,214 $33,976 $62,143
Salaries Temp $15,737 $80,764 $58,943 $63,505 $82,332 $85,396 $78,667 $178,832 $144,339 $142,172
Subtotal Salaries $176,797 $202,728 $212,042 $203,163 $236,428 $285,319 $261,354 $358,086 $365,928 $641,314 $797,242 $863,290
Benefits $33,177 $65,972 $67,565 $47,168 $69,443 $79,425 $51,150 $99,385 $89,338 $131,494 $234,800 $236,328
Subtotal Payroll $209,973 $268,700 $279,607 $250,331 $305,870 $364,744 $312,504 $457,471 $455,266 $772,808 $1,032,041 $1,099,617
Equipment Rental $764 $1,981 $522 $16,231 $16,364 $11,325 $16,856 $13,764 $11,210 $33,851 $32,109 $23,057
Gas $18,702 $28,200 $46,902 $0 $0
Supplies $48,975 $44,848 $45,581 $60,486 $59,890 $58,359 $114,613 $78,440 $89,586 $224,074 $183,178 $193,526
Other Maintenance $36,021 ($1,605) ($662) $12,251 $2,845 $1,985 $26,040 $11,890 $29,708 $74,312 $13,130 $31,031
Total Course Maintenance $295,733 $313,924 $325,048 $358,001 $384,970 $436,413 $498,213 $561,565 $585,770 $1,151,947 $1,260,458 $1,347,231
GeneralProshop Services $79,672 $78,487 $81,270 $107,596 $112,536 $115,396 $150,438 $141,472 $145,393 $337,707 $332,496 $342,059
Advertising & Promotion $3,781 $2,106 $2,081 $2,681 $659 $928 $2,626 $0 $0 $9,089 $2,765 $3,008
Utilities $42,896 $35,618 $38,188 $20,881 $9,399 $11,474 $81,593 $28,991 $27,947 $145,370 $74,008 $77,610
Operating Supplies $17,752 $16,628 $18,795 $6,027 $2,999 $3,769 $5,999 $8,349 $2,707 $29,779 $27,976 $25,271
Other General $27,596 $21,133 $24,652 $7,340 $5,931 $5,383 $8,902 $4,967 $4,730 $43,837 $32,032 $34,765
Total General $171,697 $153,973 $164,985 $144,525 $131,524 $136,949 $249,560 $183,780 $180,778 $565,782 $469,277 $482,713
Total Expenses $467,430 $467,897 $490,033 $502,527 $516,493 $573,362 $747,772 $745,345 $766,548 $1,717,729 $1,729,735 $1,829,944
Fleet Services $196,000 $270,000 $287,000 $753,000
Total Maintenance $521,048 $706,413 $872,770 $2,100,231
Total Expenses $686,033 $843,362 $1,053,548 $2,582,944
Battle Creek Goodrich Keller System
County Golf Expenses

Ramsey County Golf Study Performance
Sirius Golf Advisors, LLC 80
Course Maintenance In a typical operation, course maintenance makes up about ½ of all expenses. So, it is no surprise that course maintenance expenses are much higher for the County than operating expenses as the operations is hired out. Indeed, course maintenance makes up over 80% (81.3%) of the County’s expenses last year.
Of the $1,332,500 total, Keller accounted for 42% ($873,000), Goodrich for 1/3rd ($706,400), and Battle Creek about 1/4th ($521,000). In comparison to expectation, Goodrich and Battle Creek are a bit high. But we will have more to say about the maintenance budgets at each facility in the Course Maintenance Section of this report.
Goodrich had the biggest jump in maintenance costs last year, rising $51,000 (13.4%). This followed 7.5% increase the previous year. Battle Creek went up 3.5% last year ($11,000), following a 6.2% gain last year. Keller’s expenses rose 4.3% last year, following a more dramatic 12.7% gain the year before. However, a big difference between 2015 and 2016 for all the facilities was removing some of the expenses from maintenance and transferring them to fleet – mainly the cost of gasoline and major equipment repair. Combined, these two items added up to more than $100,000 that was removed system-wide from the maintenance budget.
Payroll typically makes up about ½ of the maintenance expenses. When fleet services are included, RC Golf is just slightly above, with payroll making up 53.5%. Benefits make up 23.2% of the total payroll cost. This is not unusual in municipal golf but is a lot higher than what we see in privately-owned public courses (around 15-18%).
Total payroll increased by 7.9% last year, following a dramatic 31.9% increase the previous year. However, there was an 82.9% increase in overtime pay last year. This was primarily due to Goodrich, which went from $4,046 in 2016 to $33,913 last year. We understand that a lot of this was due to a payroll correction from the previous year. (Keller was also very high, with $25,413 – but this was less than the year before).
Wages went up 8.3% last year, while benefits increased 6.6%. However, the year before, wages jumped by nearly a quarter (24.3% or $155,928), while benefits shot up a whopping 64.4% ($95,675).
Last year, Goodrich had the biggest jump in payroll, 19.1%, which followed an 19.3% increase the previous year. Wages shot up 20.7% last year and benefits 14.4%. In 2016, wages increased 16.4%, and benefits by 30.6%.
Battle Creek had the next highest jump in payroll last year, with a modest 4.3% increase, with wages rising 4.6% and benefits 3.4%. The previous year, Battle Creek’s payroll had jumped 31%, mostly due to a dramatic 111.8% increase in benefits, although wages also went up 14.7%
Keller had a very modest 2.4% increase in payroll last year, with a rise of 2.2% in wages and 3.6% in benefits. The previous year, though, saw a substantial 42.4% increase in payroll, with 37% jump in wages and a 66.1% increase in benefits.
All other maintenance expenses combined to have a 2.1% increase last year to $223,500. This followed a 39.5% decrease the previous year – due to the removal of gasoline and major equipment repair from the maintenance budget.
Operating Expenses Operating expenses totaled just under a half of a million ($483,000) last year, a 2.9% increase from 2016. The year before operating expenses had dropped by 17.1%.
Making up, by far, the biggest portion of the operating expenses are Proshop Services, which totaled $342,059 last year. This is the amount the County paid back to the operators from the revenue it collected,

Ramsey County Golf Study Performance
Sirius Golf Advisors, LLC 81
plus any base fees. (The County did not collect food and beverage or merchandise sales, which went straight to the operator). Proshop services rose slightly (2.9%) last year after falling slightly (1.5%) in 2016. Keller, at $145,393, had the largest tab, followed by Goodrich ($115,396) and Battle Creek ($81,270).
Not accounting for much of the operating expenses was advertising and promotion, although it should. (More on that later). Last year saw a 66.9% drop in advertising expenses, to a paltry $3,008. This was higher than the previous year’s $2,765, but less than 1/3rd the amount in 2015. We will have much more to say about this in our Marketing section.
Golf operating supplies are golf operations supplies not picked up by the operator. This includes range balls, scorecards, etc. Last year, this totaled $20,061. Most of this is at Battle Creek ($15,675).
It should be noted that the biggest other operating expense is Electricity, which totaled $60,218 last year. However, this is a bit misleading. A primary user of the electricity are the irrigation pumps. Normally, this expense is part of the course maintenance budget. But the County does not distinguish among sources. It is likely that the Maintenance portion of the electric bill is around $25,000, based on previous experience.
Takeaways RC Golf is among the minority of municipal golf operations that are making an operational profit. The cash flow being generated, however, is not enough to handle the debt for needed capital improvements. As we will discuss in the following sections, there are several things that can be done that can drastically improve performance of these facilities. These improvements will largely come from generating more revenue, although there are some opportunities for reducing costs as well.
Keller, with its recent renovation, is the major bread-winner among the facilities in terms of both revenue generation and cash flow to the County. Goodrich has been improving dramatically over the past few years, while Manitou’s performance has slipped, by almost the same amount.
Given the proximity of the two facilities, both in terms of location and price points, and the fact that customer surveys show that each course is the other’s main competitor, we can assume that a lot of Goodrich’s gains have come at the expenses of Manitou. And while this is good for Goodrich and bad for Manitou, it is also the case that Goodrich’s price point, especially with their discount programs – most notably the PCC – meaning it is ultimately reducing revenue to the County.
Battle Creek is the County’s biggest cash flow drain, with a loss of $206,000 after Fleet services is taken into consideration. Goodrich, despite is growth in revenue, is also losing money, $140,000 last year. Keller is generating a positive $211,226; and Manitou, with its operating lease, is guaranteed to have a positive cash flow. And it is, at $140,000 last year. The other two leases combine for $81,000 in positive cash flow to the County with no capital improvement exposure.

Ramsey County Golf Study Customer Feedback
Sirius Golf Advisors, LLC 82
With help from the County, we administered NGF’s Golfer Satisfaction Survey to customers of RC Golf’s five golf courses. This is a web-based survey that features both standardized and custom questions. The survey gets feedback on several key areas including:
• Demographics: Players gender and age, home zip code, average golf score, type of customer (e.g. league, card holder, pass holder, resident, non-resident)
• Wallet Share: How many rounds of golf the player plays at both the target facility and other area facilities – by name.
• Customer Satisfaction: Ratings on a 10-point scale on overall satisfaction with the target facility, and satisfaction on 23 factors such as course condition, food and beverage, etc.
• Open-Ended Questions: What the customer likes most about the facility and what they would like to see improved.
NGF takes the answers to these questions and others and generates both a loyalty index and a loyalty driver for the target facility. The loyalty index reveals how vulnerable a facility is for customer flight, while the loyalty driver shows what factors are most important to both keeping customers and are major concerns for them leaving.
Because the questionnaire is standardized, it allows for comparisons with survey results from all the courses that have administered the questionnaire. The comparison is made both to all courses in the database and to courses in their price band (Premium, Standard and Value). This comparison is very valuable for two main reasons. First, it tells you how your course stands in relation to other facilities. And second, it eliminates a natural bias in rating scales. For example, on a scale from 1 to 10, where one is poor and 10 in excellent, you would tend to think that an average score of 7.5 is much better than average. But in fact, it may put you in the lower 10%, or worse, of all courses surveyed.
The survey was emailed to customers in the County’s database of RC Golf clients. Each facility mailed a link to the survey to its respective club/league list (except Island Lake and the Golf Dome). It was also mailed out to the EZ Links database (teetimes), as well as to the County’s egov.golf email list, and a link was published on the County’s twitter feed. We received a total of 458 responses. However, we only received 15 for Island Lake, making those results not statistically significant.
In addition, we designed a survey utilizing survey monkey, to resemble the NGF survey, using many of the same questions. This survey was for the Golf Dome.
A detailed breakdown of survey results can be found in Appendix F.
Demographics Below is a breakdown on the customers that took the survey.
We see that 82% of the respondents were male. Goodrich had the lowest percentage of female respondents with 9.5%, followed by Battle Creek at 11.8%. Keller had the highest female participation at 24.2%, followed closely by Manitou at 23.3%.
The majority (57.6%) of the survey takers were seniors, aged 60 or more. Goodrich, again, had the highest percentage of seniors at 65.7%, followed by Manitou at 60.3%. Both Battle Creek (48.4%) and Island Lake (46.7%) had slightly less than half the respondents be seniors.

Ramsey County Golf Study Customer Feedback
Sirius Golf Advisors, LLC 83
It is important to point out that the demographics of the survey respondents do not necessarily mean that this represents the demographics of the customers at the course. Not all demographics are equally likely to take a lengthy survey, for example. Typically, survey takers are the most motivated to complete the survey – often the ones with the strongest opinions, one way or the other.
Customer Origin One survey question asked what zip code the respondent was from. The table below shows the distribution of respondents by county.
Island Lake had the highest percentage of Ramsey County respondents. But this is likely due to sampling error as we did not have access to Island Lake’s complete database. Of the big courses, Manitou had the highest percentage of Ramsey County residents (62.5%), and Battle Creek the least (45.2%). Battle Creek received a large percentage of responses from Washington County (39.8%), which was second overall with 25.6% of all responses. Keller got half from Ramsey County (50.5%), 18.6% from Washington County and 15.4% from Hennepin, which was third overall at 8.8%. Fourth overall was Dakota County (4.5%), followed by Anoka (1.7%).
Overall Satisfaction The results on overall satisfaction, the most important measure, were mixed. Two of the facilities, Goodrich and Battle Creek, received outstanding scores. Both placed in the top 3% of courses in their price band and top 10% of all courses. It is important to note that both courses are managed by the same operator, Brad Behnke.
Qty % Qty % Qty % Qty % Qty % Qty % Qty %
Out of area 0 0.0% 0 0.0% 1 1.1% 1 1.0% 0 0.0% 0 0.0% 2 0.4%
Anoka 3 2.1% 2 1.9% 2 2.2% 1 1.0% 0 0.0% 0 0.0% 8 1.7%
Carver 0 0.0% 0 0.0% 0 0.0% 1 1.0% 0 0.0% 0 0.0% 1 0.2%
Dakota 4 2.8% 8 7.5% 4 4.3% 4 4.1% 0 0.0% 1 6.3% 21 4.5%
Goodhue 0 0.0% 0 0.0% 0 0.0% 1 1.0% 0 0.0% 0 0.0% 1 0.2%
Hennepin 8 5.6% 10 9.3% 5 5.4% 15 15.4% 0 0.0% 3 18.8% 41 8.8%
Ramsey 90 62.5% 62 57.9% 42 45.2% 49 50.5% 15 100.0% 7 43.8% 265 57.1%
Scott 0 0.0% 0 0.0% 1 1.1% 0 0.0% 0 0.0% 0 0.0% 1 0.2%
St. Croix 2 1.4% 2 1.9% 1 1.1% 0 0.0% 0 0.0% 0 0.0% 5 1.1%
Washington 37 25.7% 22 20.6% 37 39.8% 18 18.6% 0 0.0% 5 31.3% 119 25.6%
Customer Origin by CountyManitou Goodrich Battle Creek Keller Island Lake Dome Total
Total Resp Qty % Qty % Over 60 Under 40
Keller 99 75 75.76% 24 24.24% 55.56% 13.13%
Goodrich 105 95 90.48% 10 9.52% 65.71% 3.81%
Manitou 146 112 76.71% 34 23.29% 60.27% 5.48%
Battlecreek 93 82 88.17% 11 11.83% 48.39% 20.43%
Island Lake 15 12 80.00% 3 20.00% 46.67% 26.67%
Total 458 376 82.1% 82 17.9% 57.60% 42.40%
Males Females Age

Ramsey County Golf Study Customer Feedback
Sirius Golf Advisors, LLC 84
Keller’s ratings were also very good. Rating in the top 20% in their class and top 26% overall. As we will discuss, their ratings would have been much higher if not for one factor, food and beverage.
On the other end of the spectrum were Island Lake and Manitou. Island Lake’s class score was very close to the middle. However, with only 15 responses, we cannot assign any real significance to the ratings.
Manitou, though, had both the highest number of responses, 145, and by far the lowest ratings. They placed in the lower 28% of courses in their class, and lowest 12% overall.
Loyalty Index NGF has created a loyalty index based on the overall satisfaction scores. The Loyalty Index in this report is based on a model developed by Frederick F. Reichheld, director emeritus of the consulting firm Bain & Company. We asked respondents how likely they are to recommend the golf course administering the survey, using a scale from 0 to 10. Those answering 0 to 6 are called "Detractors"; 7 to 8 "Passives"; and 9 to 10 "Promoters." Promoters less Detractors equals the Loyalty Index. For example, 40% Promoters minus 10% Detractors equals a 30% Loyalty Index. In some cases, the Loyalty Index may be a negative number.
Loyalty Index Ratings
Promoters Passive Detractors Loyalty
9 & 10 7 & 8 <7 Index National 44.00% 24.10% 36.00% 19.90%
Standard Benchmark 43.70% 25.50% 38.10% 18.20%
Value Benchmark 41.10% 35.90% 23.00% 18.10%
Goodrich Golf Course 56.10% 32.70% 11.20% 44.90%
Keller Golf Course 52.10% 31.30% 16.70% 35.40%
Manitou Ridge 35.20% 33.80% 31.00% 4.20%
Battle Creek 68.80% 21.50% 9.70% 59.10%
Island Lake 40.00% 33.30% 26.70% 13.30%
Golf Dome 32.29% 32.29% 35.42% -3.13%
Overall Satisfaction Ratings
# Resp Average
Score Price Pt % National %
Keller 97 8.4 82 74
Goodrich 107 8.7 97 90
Manitou 145 7.5 28 12
Battle Creek 94 8.8 98 94
Island Lake 15 7.8 46 28

Ramsey County Golf Study Customer Feedback
Sirius Golf Advisors, LLC 85
On this measure, Battle Creek, with an index of 59.1, was, by far, the highest rated with a score a full 40 points better than the national average. Goodrich was next at 44.9, 25 points higher than the national average. Keller also scored very well at 35.4.
Scoring well below average were the other three facilities. Island Lake was at 13.3, six points below the national average and 5 below the rate class average. Manitou was even lower at just 4.2, a full 15 points below the national average and 14 below the rate band. However, as Island Lake had only 15 responses and Golf Dome just 17, neither of their findings can be viewed as necessarily valid. Manitou’s, though, is statistically significant.
Individual Factors The table below shows the percentile ratings for each facility’s rate class for the 23 different satisfaction factors. Percentile ratings in the top 20th percentile are printed in red, while those in the bottom 20 are in blue.
GR K MR BC IL GD
Overall Value 85 48 5 53 88 8
Overall Course Conditions 94 79 44 96 89
Pace of Play 64 26 13 80 77
Friendliness/Helpfulness of Staff 90 80 25 85 93 5
Golf Course Design/Layout 30 49 9 86 5
Convenience of Course Location 65 87 40 86 99
Tee Time Availability 71 37 29 81 97
Condition of Greens 95 72 49 95 79
Scenery and Aesthetics of Course 57 80 13 92 56
Condition of Golf Cars 96 73 33 50 56
Amenities (clubhouse, pro shop, locker
room)76 54 22 74
34 5
Food and Beverage Service 76 0 14 88 39
On-course Services (restrooms,
drinking water)20 1 4 60
14
Overall Experience 87 64 20 91 78
Affordability 58 34 2 30 77
Condition of Tees 66 58 36 98 21
Condition of Bunkers 31 82 21 97 97
Condition of Fairways 95 70 42 93 85
Overall Quality of Practice Facility 57 18 100 97
Overall Quality of Golf Shop 71 91 34 89 51
Overall Quality of Golf Shop Apparel 54 98 29 87 29
Overall Quality of Golf Shop
Merchandise67 94 53 90 53
Average Percentile 69.0 60.6 25.2 81.9 64.3 6.0
Satisfaction Factor Percentile Ratings
Ramsey County Golf Study Customer Feedback
Sirius Golf Advisors, LLC 86
Battle Creek had the highest average rating – 81.9. Goodrich (69), Island Lake (64), and Keller (60.6) all averaged in between the 60th and 70th percentiles. Manitou averaged in the 25th percentile, and the Golf Dome, with limited factors and a small response, averaged in just the 6th percentile.
In the table below, cells with the highest (best) values are highlighted in green, with the lowest in red and in the middle with yellow.
For Battle Creek, 41% of the indicators scored in the 90th percentile or better, 77% in the 80th or better. Island Lake had the next best results, with 23% of the responses in the 90th percentile or better, and 36% in the 80th or better. Goodrich followed with 24% and 33%, respectfully. Keller was next at 14% and 32%. However, neither Manitou or the Golf Dome had any responses in the top 20 percent.
On the other end, 100% of the Golf Dome’s answers were in the bottom 10%. Manitou fared only a bit better. Half of the measures scored in the bottom 25%, and 18% were in the bottom 10th percentile. Island lake had 14% in the bottom quartile, with 5% in the bottom tenth. Keller had 9% of its measures in the bottom 10%. Goodrich had 5% in the bottom quarter, but none in the bottom 10%. Battle Creek did not have any measures in the bottom quartile.
Below, we list the strongest and weakest factors for each facility.
Keller Strengths (top 20 percentile placements) include:
• Friendliness/helpfulness of staff
• Course Location
• Scenery and Aesthetics of course
• Condition of Bunkers
• Overall Quality of Golf Shop
• Quality of Shop Apparel
• Quality of Shop Merchandise
Weaknesses (bottom 25 percent) were:
• On course services (restrooms, drinking water)
• Food and Beverage Service
Both weaknesses were rated in the bottom 5% of courses in its class. Food and Beverage service was rated below the bottom first percentile. Meaning it was among the very worst courses in the entire database.
Goodrich Strengths include:
• Overall value
• Friendliness/helpfulness of staff
• Condition of Greens
• Condition of Golf Carts
• Overall Experience
• Condition of Fairways

Ramsey County Golf Study Customer Feedback
Sirius Golf Advisors, LLC 87
Weaknesses include:
• On course services (restrooms, drinking water)
Battle Creek Strengths include:
• Overall Course Conditions
• Pace of Play
• Friendliness/helpfulness of staff
• Golf Course Design/Layout
• Course Location
• Tee Time Availability
• Condition of Greens
• Scenery and Aesthetics
• Overall Experience
• Condition of Fairways
• Condition of Tees
• Condition of Bunkers
• Overall Quality of Practice Facility
• Overall Quality of Golf Shop
• Quality of Shop Apparel
• Quality of Shop Merchandise
Three things stand out. The Practice facility was given a rating of “100,” meaning it was above the 99.5th percentile of all facilities. Second, all factors relating to golf course conditions were rated in the top 20 percent. Finally, none of the factors rated in the bottom 20%. The lowest rating was for affordability at 30.
Manitou There were no factors rated in the top 20th percentile. The top-rated factor was Overall Quality of Shop Merchandise, at 53rd percentile. No other factors were above 50.
Those factors rating in the bottom 20% were:
• Pace of Play
• Scenery and Aesthetics
• Food and Beverage Service
• Quality of Practice Facility
Those factors rated in the bottom 10% were:
• Golf Course Design
Factors rated in the bottom 5% were:
• Overall Value
• On-Course Services

Ramsey County Golf Study Customer Feedback
Sirius Golf Advisors, LLC 88
• Affordability
Loyalty Driver We asked respondents the overall satisfaction of the golf course using a scale from 1 to 10. The loyalty driver (measured as a correlation coefficient*) indicates the strength of a relationship between several key factors and how satisfied a golfer is to the golf course. In other words, for the people taking the survey, this measures how important an individual factor is likely to be in choosing where they play golf as their satisfaction with this factor directly relates to their overall satisfaction score for the facility. The average (or mean) of the loyalty driver for each key factor is set at the center of the horizontal axis and the loyalty driver scores are plotted accordingly. Satisfaction We asked respondents how satisfied they are on several key factors, using a scale from 1 to 10. These are the satisfaction factors discussed above. Those answering a 10 were very satisfied and those answering a 1 were very dissatisfied. The average (or mean) of the responses from all other courses in the same price-point class is set at the center of the vertical axis and the course satisfaction scores are plotted accordingly. Below are the definitions for each quartile.
I - Strengths These factors are your strengths. Respondents indicated that they have a higher satisfaction with factors located in this quadrant. They also have a strong correlation to how likely a golfer is to recommend the golf course. II - Must Improve Improving factors in this quadrant are likely to have the largest, most immediate impact. Respondents indicated that they have a lower satisfaction for these factors that also have a stronger correlation to how likely a golfer is to recommend the golf course. III - Monitor While respondents indicated that they have a lower satisfaction for these factors the factors are not likely to influence a golfer to recommend the golf course because these factors have a weaker correlation. Improving factors in this quadrant are likely to have a lower yield. IV - Maintain Factors in this quadrant are value adds. Respondents indicated that they have a higher satisfaction with these factors although they do not have a high correlation to how likely a golfer is to recommend the golf course. * The loyalty driver is calculated using the Pearson product-moment correlation coefficient.
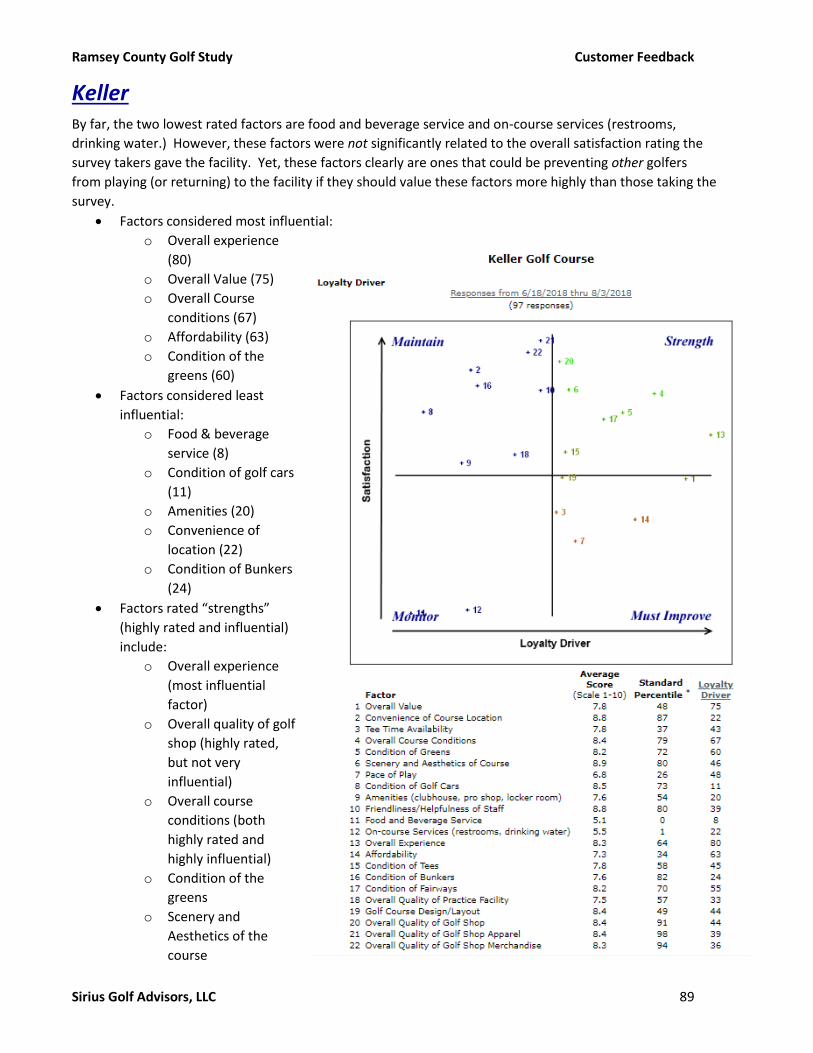
Ramsey County Golf Study Customer Feedback
Sirius Golf Advisors, LLC 89
Keller By far, the two lowest rated factors are food and beverage service and on-course services (restrooms,
drinking water.) However, these factors were not significantly related to the overall satisfaction rating the
survey takers gave the facility. Yet, these factors clearly are ones that could be preventing other golfers
from playing (or returning) to the facility if they should value these factors more highly than those taking the
survey.
• Factors considered most influential:
o Overall experience
(80)
o Overall Value (75)
o Overall Course
conditions (67)
o Affordability (63)
o Condition of the
greens (60)
• Factors considered least
influential:
o Food & beverage
service (8)
o Condition of golf cars
(11)
o Amenities (20)
o Convenience of
location (22)
o Condition of Bunkers
(24)
• Factors rated “strengths”
(highly rated and influential)
include:
o Overall experience
(most influential
factor)
o Overall quality of golf
shop (highly rated,
but not very
influential)
o Overall course
conditions (both
highly rated and
highly influential)
o Condition of the
greens
o Scenery and
Aesthetics of the
course

Ramsey County Golf Study Customer Feedback
Sirius Golf Advisors, LLC 90
o Condition of the fairways
o Condition of the tees
• Factors rated “Must Improve” (poorly rated, yet influential)
o Overall value (barely below the average mark, but highly influential)
o Affordability
o Pace of play (low rated)
o Teetime availability
Goodrich • Factors considered most influential:
o Overall Course conditions (73)
o Overall Experience (60)
o Condition of the Fairways (60)
• Factors considered least influential:
o On course services (18)
o Overall Quality of Merchandise
(22)
o Affordability (22)
o Overall Quality of Apparel (25)
o Amenities (clubhouse, etc.) (26)
o Tee time availability (28)
o Friendliness of staff (28)
o Food & Bev Service (29)
o Condition of golf cars (29)
• Factors rated “strengths” (highly rated
and influential) include:
o Overall Course conditions (most
influential factor)
o Condition of Fairways (highly
rated)
o Condition of Greens (highly
rated)
o Overall experience
o Overall Value
o Condition of Tees
o Course aesthetics (above
average in both rating and
influence)
• Factors rated “Must Improve” (poorly
rated, yet influential)
o Golf course design/layout
o Condition of bunkers
• On course services had the lowest satisfaction but was not that influential.
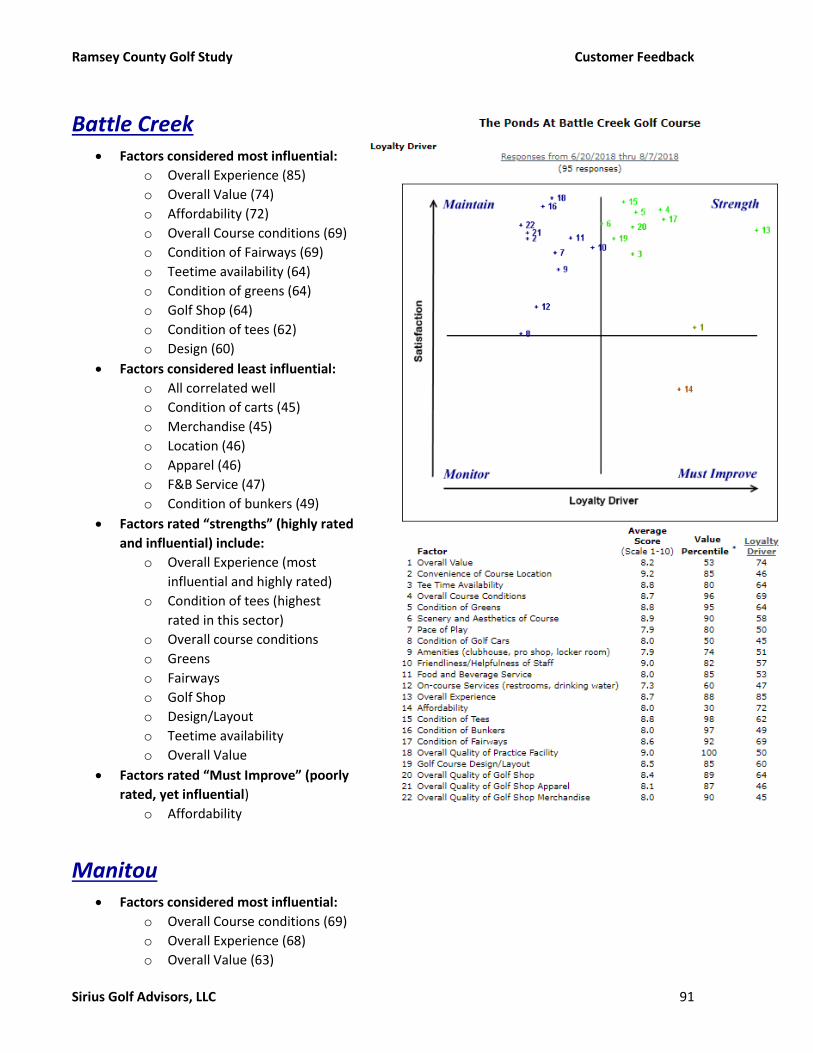
Ramsey County Golf Study Customer Feedback
Sirius Golf Advisors, LLC 91
Battle Creek • Factors considered most influential:
o Overall Experience (85)
o Overall Value (74)
o Affordability (72)
o Overall Course conditions (69)
o Condition of Fairways (69)
o Teetime availability (64)
o Condition of greens (64)
o Golf Shop (64)
o Condition of tees (62)
o Design (60)
• Factors considered least influential:
o All correlated well
o Condition of carts (45)
o Merchandise (45)
o Location (46)
o Apparel (46)
o F&B Service (47)
o Condition of bunkers (49)
• Factors rated “strengths” (highly rated
and influential) include:
o Overall Experience (most
influential and highly rated)
o Condition of tees (highest
rated in this sector)
o Overall course conditions
o Greens
o Fairways
o Golf Shop
o Design/Layout
o Teetime availability
o Overall Value
• Factors rated “Must Improve” (poorly
rated, yet influential)
o Affordability
Manitou • Factors considered most influential:
o Overall Course conditions (69)
o Overall Experience (68)
o Overall Value (63)

Ramsey County Golf Study Customer Feedback
Sirius Golf Advisors, LLC 92
o Friendliness of Staff
(61)
o Aesthetics (59)
o Condition of Tees (59)
o Practice Facility (58)
o Affordability (56)
o Condition of Greens
(55)
o Condition of Fairways
(55)
• Factors considered least
influential:
o Teetime Availability
(23)
o Course Location (31)
• Factors rated “strengths”
(highly rated and influential)
include:
o NONE
• Factors rated “Must Improve”
(poorly rated, yet influential)
o Overall course
conditions (most
influential)
o Affordability (worst
rated)
o Overall value (very low
rated)
o Overall experience
(low rated and
influential)
o Aesthetics
o On course services
o Practice Facility
o Condition of greens
o Friendliness of staff
o Food & Beverage
Service
o Condition of fairways
o Condition of tees
Loyalty Factor Influence Comparison The table below provides a comparison of the various loyalty drivers by facility. Keep in mind that the loyalty driver measures the relationship between a given factor’s satisfaction score and that person’s rating of overall satisfaction. In other words, a low loyalty driver number indicates that this factor did not
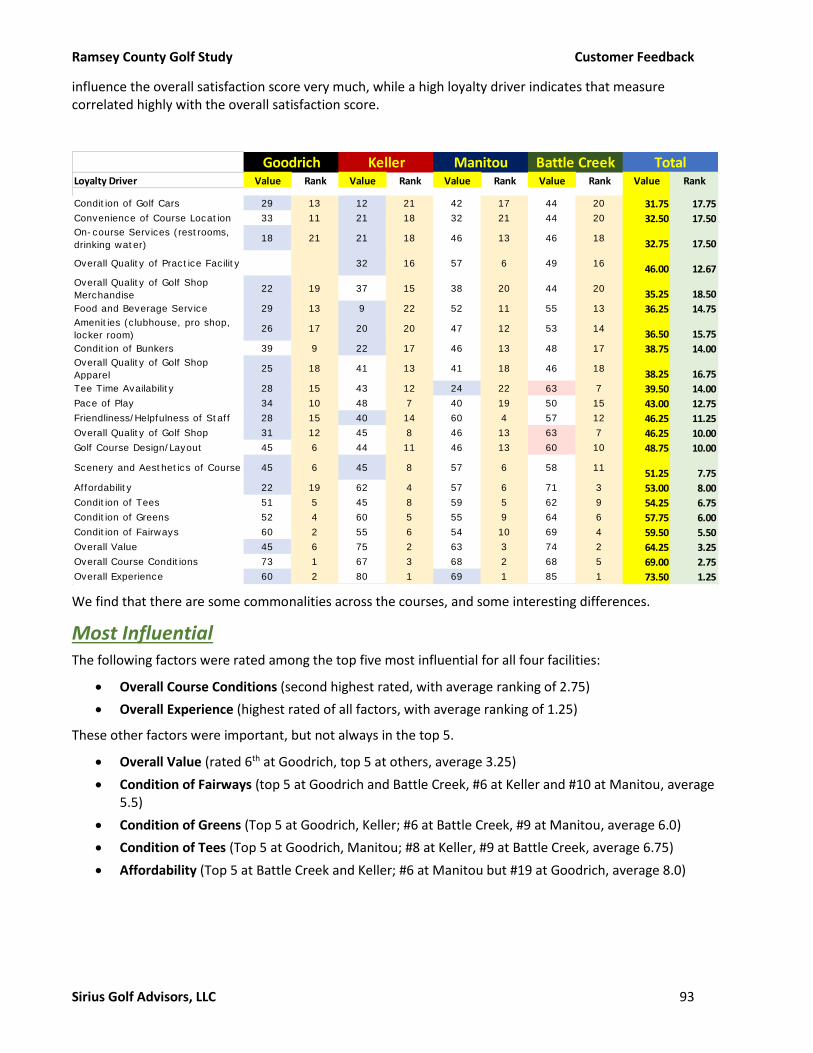
Ramsey County Golf Study Customer Feedback
Sirius Golf Advisors, LLC 93
influence the overall satisfaction score very much, while a high loyalty driver indicates that measure correlated highly with the overall satisfaction score.
We find that there are some commonalities across the courses, and some interesting differences.
Most Influential The following factors were rated among the top five most influential for all four facilities:
• Overall Course Conditions (second highest rated, with average ranking of 2.75)
• Overall Experience (highest rated of all factors, with average ranking of 1.25)
These other factors were important, but not always in the top 5.
• Overall Value (rated 6th at Goodrich, top 5 at others, average 3.25)
• Condition of Fairways (top 5 at Goodrich and Battle Creek, #6 at Keller and #10 at Manitou, average 5.5)
• Condition of Greens (Top 5 at Goodrich, Keller; #6 at Battle Creek, #9 at Manitou, average 6.0)
• Condition of Tees (Top 5 at Goodrich, Manitou; #8 at Keller, #9 at Battle Creek, average 6.75)
• Affordability (Top 5 at Battle Creek and Keller; #6 at Manitou but #19 at Goodrich, average 8.0)
Loyalty Driver Value Rank Value Rank Value Rank Value Rank Value Rank
Condition of Golf Cars 29 13 12 21 42 17 44 20 31.75 17.75
Convenience of Course Location 33 11 21 18 32 21 44 20 32.50 17.50On-course Services (restrooms,
drinking water)18 21 21 18 46 13 46 18
32.75 17.50
Overall Quality of Practice Facility 32 16 57 6 49 1646.00 12.67
Overall Quality of Golf Shop
Merchandise22 19 37 15 38 20 44 20
35.25 18.50
Food and Beverage Service 29 13 9 22 52 11 55 13 36.25 14.75Amenities (clubhouse, pro shop,
locker room)26 17 20 20 47 12 53 14
36.50 15.75
Condition of Bunkers 39 9 22 17 46 13 48 17 38.75 14.00Overall Quality of Golf Shop
Apparel25 18 41 13 41 18 46 18
38.25 16.75
Tee Time Availability 28 15 43 12 24 22 63 7 39.50 14.00
Pace of Play 34 10 48 7 40 19 50 15 43.00 12.75
Friendliness/Helpfulness of Staff 28 15 40 14 60 4 57 12 46.25 11.25
Overall Quality of Golf Shop 31 12 45 8 46 13 63 7 46.25 10.00
Golf Course Design/Layout 45 6 44 11 46 13 60 10 48.75 10.00
Scenery and Aesthetics of Course 45 6 45 8 57 6 58 1151.25 7.75
Affordability 22 19 62 4 57 6 71 3 53.00 8.00
Condition of Tees 51 5 45 8 59 5 62 9 54.25 6.75
Condition of Greens 52 4 60 5 55 9 64 6 57.75 6.00
Condition of Fairways 60 2 55 6 54 10 69 4 59.50 5.50
Overall Value 45 6 75 2 63 3 74 2 64.25 3.25
Overall Course Conditions 73 1 67 3 68 2 68 5 69.00 2.75
Overall Experience 60 2 80 1 69 1 85 1 73.50 1.25
TotalGoodrich Keller Manitou Battle Creek

Ramsey County Golf Study Customer Feedback
Sirius Golf Advisors, LLC 94
Common Least Influential No factor was among the bottom five at all four facilities. The following were rated in the bottom five influential factors at one or more of the facilities:
• Overall Quality of Golf Shop Merchandise (average ranking: 18.5; Bottom five at Goodrich, Manitou and Battle Creek, #15 at Keller)
• On-Course Services (average ranking: 17.5; Bottom five at Goodrich, Keller, Battle Creek; #13 at Manitou)
• Quality of Golf Apparel (average ranking: 16.75; Bottom five at Goodrich, Manitou and Battle Creek, #13 at Keller)
• Amenities (average ranking: 15.75; Bottom five at Goodrich, Keller; #12 at Manitou, #14 at Battle Creek)
• Food & Beverage Service (average ranking: 14.75; Bottom five at Keller (last); #13 at Goodrich and Battle Creek, #11 at Manitou)
• Condition of Bunkers (average ranking: 14.0; Bottom five at Keller and Battle Creek; #9 at Goodrich, #13 at Manitou)
• Tee Time Availability (average ranking: 14.0; Bottom five at Manitou (last); #15 at Goodrich; #12 at Keller and #7 at Battle Creek)
• Pace of Play (average ranking: 12.75; Bottom five at Manitou; #10 at Goodrich, #7 at Keller and #15 at Battle Creek)
What it Means When you see a divergent response – where a factor is either a lot more important or a lot less important at a given facility – it often represents why customers are choosing that facility, or why most golfers do not choose to play there. For example, at Keller we see that Food and Beverage was the least influential factor in the overall satisfaction score. Yet this factor was also rated extremely low. We can assume from this that golfers who do value food and beverage service may be staying away from Keller for that reason. Other examples:
• Condition of Fairways – was very influential at all the courses except Manitou. This suggests that golfer who value fairway conditions may not be playing at Manitou.
• Condition of Greens – same as with condition of fairways.
• Affordability – this was important to the raters everywhere but Goodrich. Yet Goodrich was the most affordable of the courses.
• Tee Time Availability – was dead last at Manitou, but in the middle for the others. This may be because so many of the survey takers at Manitou were league players, where they do not have to fight for tee times. It was also one of the more important influencers at Battle Creek, suggesting that this is one of the main reasons they play there.
• Pace of Play – was third least important at Manitou, but seventh at Keller and in the middle with the others. Pace of play normally ranks high in these surveys. The fact that the survey takers at Manitou rated this so lowly may also be because of the high league play at Manitou. But it also suggests that people who think pace is important are staying away from Manitou.
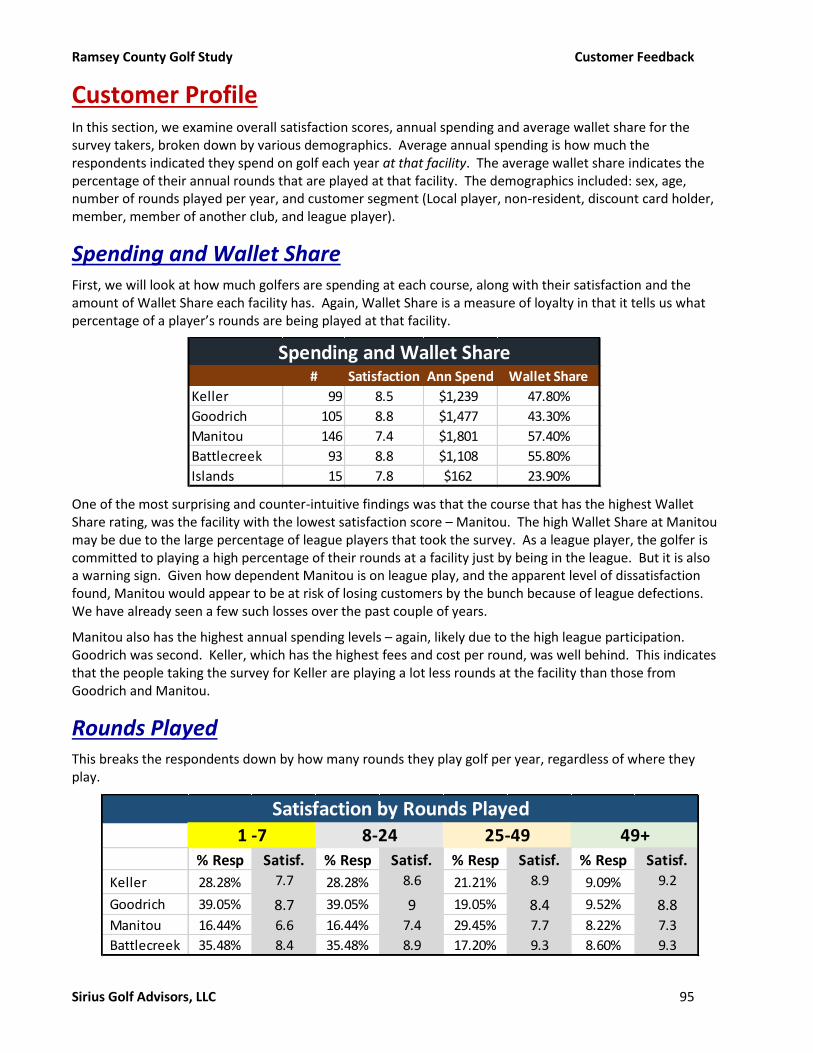
Ramsey County Golf Study Customer Feedback
Sirius Golf Advisors, LLC 95
Customer Profile In this section, we examine overall satisfaction scores, annual spending and average wallet share for the survey takers, broken down by various demographics. Average annual spending is how much the respondents indicated they spend on golf each year at that facility. The average wallet share indicates the percentage of their annual rounds that are played at that facility. The demographics included: sex, age, number of rounds played per year, and customer segment (Local player, non-resident, discount card holder, member, member of another club, and league player).
Spending and Wallet Share First, we will look at how much golfers are spending at each course, along with their satisfaction and the amount of Wallet Share each facility has. Again, Wallet Share is a measure of loyalty in that it tells us what percentage of a player’s rounds are being played at that facility.
One of the most surprising and counter-intuitive findings was that the course that has the highest Wallet Share rating, was the facility with the lowest satisfaction score – Manitou. The high Wallet Share at Manitou may be due to the large percentage of league players that took the survey. As a league player, the golfer is committed to playing a high percentage of their rounds at a facility just by being in the league. But it is also a warning sign. Given how dependent Manitou is on league play, and the apparent level of dissatisfaction found, Manitou would appear to be at risk of losing customers by the bunch because of league defections. We have already seen a few such losses over the past couple of years.
Manitou also has the highest annual spending levels – again, likely due to the high league participation. Goodrich was second. Keller, which has the highest fees and cost per round, was well behind. This indicates that the people taking the survey for Keller are playing a lot less rounds at the facility than those from Goodrich and Manitou.
Rounds Played This breaks the respondents down by how many rounds they play golf per year, regardless of where they play.
# Satisfaction Ann Spend Wallet Share
Keller 99 8.5 $1,239 47.80%
Goodrich 105 8.8 $1,477 43.30%
Manitou 146 7.4 $1,801 57.40%
Battlecreek 93 8.8 $1,108 55.80%
Islands 15 7.8 $162 23.90%
Spending and Wallet Share
% Resp Satisf. % Resp Satisf. % Resp Satisf. % Resp Satisf.
Keller 28.28% 7.7 28.28% 8.6 21.21% 8.9 9.09% 9.2
Goodrich 39.05% 8.7 39.05% 9 19.05% 8.4 9.52% 8.8
Manitou 16.44% 6.6 16.44% 7.4 29.45% 7.7 8.22% 7.3
Battlecreek 35.48% 8.4 35.48% 8.9 17.20% 9.3 8.60% 9.3
49+
Satisfaction by Rounds Played1 -7 8-24 25-49

Ramsey County Golf Study Customer Feedback
Sirius Golf Advisors, LLC 96
Manitou has the most “heavy” users – defined here as golfers who play 25 or more rounds per year. Heavy users accounted for 37.7 of Manitou’s respondents, 30.3 of Keller’s, 28.6% of Goodrich’s and 25.8% of Battle Creek’s.
At Keller, the more rounds a golfer plays, the more likely they were to give Keller a high score. The lowest rating was found with golfers who play seldom. This may reflect the difficulty of the course, where infrequent players are going to have a harder time. But it also means that golfers who play a lot, appreciate the course… which helps long-term as infrequent golfers are more likely to give up the game.
The same trend was found at Battle Creek, which is also a challenging golf course, although the spread was not as great as it was for Keller. Manitou had a U-shaped curve, where infrequent golfers and the heavy users were more dissatisfied than those in the middle.
Gender Females rated the course higher than males at Goodrich and Battle Creek, although the margin was slight. The largest differential was found at Island Lake, where women gave an average satisfaction score of 6 compared to 8.3 from men. However, the small number of respondents makes this unreliable.
The difference at Manitou, though, is more telling. There men gave an overall satisfaction rating of 7.5 (16th percentile nationally), while women rated it a 6.8 (4th percentile nationally). We will have more to say about this when we talk about each facility under operations.
In looking at individual factors, some gender differences stood out at each facility.
Keller Women made up 23.7% of the respondents. Women also had a much lower opinion of the facility, in general, then men. Specific scores:
• Overall Value: Women rated Keller in the 29th percentile, men 57th.
• Course Design: Women rated Keller in the 2nd percentile (bad), men in the 74th. This is a huge differential, and likely indicates that women find Keller to be unfair.
• Tee Time Availability: Women rated Keller in the 69th percentile, men in the 27th. This probably means that most of the women taking the survey were either members of the women’s club or played on a league, where teetimes are guaranteed.
• Condition of the Greens: Women were less happy, placing Keller in the 54th percentile compared to 79th for men.
• Scenery and Aesthetics: Women were much happier, with percentile score in the upper 5% (95th percentile). Men placed Keller in the 75th percentile.
• Amenities: Women were less happy, with a percentile score of 37 compared to 59 for men.
• Overall Experience: Women, again, placed Keller lower at 43rd percentile compared to 71st.
• Affordability: Women placed Keller in the 22nd percentile, men the 42nd.
• Condition of the tees: Women were very happy, with an 85th percentile, compared to 44th for men. This is likely more a reflection of other courses than Keller specifically, as all the tees at Keller were
Rating % Rating %
Keller 8.5 75.76% 8.2 24.24%
Goodrich 8.7 90.48% 9.1 9.52%
Manitou 7.5 76.71% 6.8 23.29%
Battle Creek 8.8 88.17% 9 11.83%
Island Lake 8.3 80.00% 6 20.00%
Males Females

Ramsey County Golf Study Customer Feedback
Sirius Golf Advisors, LLC 97
in the same condition on our inspection. Yet the forward tees at a lot of facilities seem more of an after-thought, located poorly and in worse condition than the tees preferred by men.
• Condition of Bunkers: Women were less impressed, with a 55th percentile compared to 87 for men.
Loyalty Driver
• Females considered significantly MORE important
o Condition of golf carts (52/4)
o Quality of practice tee (73/22)
o Location (53 vs 18)
o On course services (50/11)
o Overall value (89 vs 68)
o Teetime availability (67 vs 43)
o Aesthetics (63/44)
o Affordability (81/55)
o Condition of tees (65/46)
• Females considered significantly less important
o Condition of bunkers (9 vs 22)
Goodrich Goodrich had the lowest female participation of the facilities, with just 10 (9.4%). They had the same Overall Satisfaction rating, but males had a slightly higher percentage of Promoters (57% to 50%) and a much lower percentage of Detractors (10.3% to 20%). Specific factor differences:
• Aesthetics: Women were more impressed, with a percentile score of 88, compared to men’s 55.
• On-Couse Services: This one is a bit hard to understand. Women gave Goodrich a percentile score of 73, compared to 18 for men. Yet Goodrich does not have permanent restrooms on the course – which is a must for many women. This is likely a case where women who want restrooms simply do not play at Goodrich.
• Affordability: Women placed Goodrich in the 92nd percentile, compared to 54th for men. Just the opposite of what we found at Keller.
• Condition of Tees: Women gave a 95th percentile score, compared to 60 for men.
• Condition of Bunkers: Women apparently were not bothered by bunkers at Goodrich, giving it a score of 98th percentile. Men did not appreciate them, with a score in the 20th percentile. Perhaps women simply stay out of them better.
Loyalty Driver
• Females considered significantly MORE influential
o On course services (85 v 14)
o Affordability (86 v 18)
o Overall experience (93 v 58)
o Quality of Golf Shop (60 v 31)
o Overall Value (71 v 44)
o Location (50 v 31)
o Tee time availability (52 v 26)
o Aesthetics (66 v 44)
o Pace of Play (53 v 34)
• Females considered significantly less important

Ramsey County Golf Study Customer Feedback
Sirius Golf Advisors, LLC 98
o Condition of fairways (35 v 61)
o Condition of the tees (35 v 52)
It is interesting that the females gave more importance to the on-course services, which is normal; yet they also rated it much higher – even though these services are notably absent at Goodrich.
Battle Creek There were only 11 female responses (11.7%), which is very low. Both groups rated course high. Females had much higher satisfaction compared to expectations (97 to 74), and higher satisfaction compared to other courses (100 to 88), and significantly higher “likelihood to play more (91 to 46).
• Overall Value: Women put Battle Creek at the 95th percentile, compared to 47th for men.
• Pace of Play: Women placed it at 93rd percentile, men 79th.
• Golf Course Design: Women were less satisfied, with a score of 54, compared to 88.
• Condition of Golf Carts: Women were a lot less impressed, with a score of 27th percentile, compared to 52nd for men.
• On Course Services: As with Goodrich, women were more favorable, 98 vs 52.
• Affordability: Also, like Goodrich, women found Battle Creek very affordable, ranking it in the 84th percentile, while men placed it 23rd.
• Quality of Golf Shop Merchandise: Women were not impressed, with a score of 57, compared to 93rd for men.
Loyalty Driver
While there were no distinguishable differences in the ratings between the sexes, there were considerable
differences in how much each factor influenced the overall rating.
• Females considered significantly MORE important:
o Aesthetics (83 to 58)
o Design/layout (77 to 60)
o Golf Shop Apparel (62 to 47) and Merchandise (83 to 43), but males considered overall
quality of golf shop more important (65 to 47)
• Males considered significantly more important:
o Practice facility (57 to -14)
o On course services (49-0) – surprising, but may be that women who consider these
important do not play here
o Teetime availability (67 to 31)
o Golf Carts (47-23)
o Overall Course conditions (70 to 57)
o Golf Shop (67 to 47)
o Pace of Play (50-32)
o Friendliness of staff (59-40)
o Bunkers (49-33)
o Fairways (70-55)
o Greens (65-54)
Manitou In many ways, Manitou looks to have a sign posted “Women not Welcome”, from yardage from the forward tee, to how women are treated. However, we did have relatively strong female participation in the survey

Ramsey County Golf Study Customer Feedback
Sirius Golf Advisors, LLC 99
(33 or 22.8%). Yet women did have a much lower opinion, with an Overall Satisfaction score of 13th (price point group) compared to men (32nd). But they were similar on Loyalty Index.
Specific factor differences:
• Friendliness of Staff: One of the more troubling findings, women put Manitou in the bottom 2%, while men were more kind, placing it in the 35th. This may indicate that staff (one or more) at Manitou may be treating women differentially.
• Tee Time Availability: Women did not have a problem at Manitou, putting it in the 60th percentile, compared to 20th for men. This is likely due to the women taking the survey were more likely to be league or women’s club members who have preferred teetimes.
• Overall Experience: Women placed Manitou in the 12th percentile, men 22nd.
• Condition of Tees: Women placed Manitou at the 22nd percentile, men 40th. This may be due to the length from the forward tees, even though the question was on “condition.” It stands out because in other areas, women found the course conditions as better than the men did.
• Condition of Bunkers; Women were more favorable, 31 to 18.
• Condition of Fairways: Again, women were more favorable, 57 to 39.
• Quality of Golf Apparel: Biggest difference. Men placed Manitou in the 56th percentile (good), but women had it in the bottom 0.5% of all facilities.
• Overall Quality of Golf Shop: Women were very unimpressed, with a rating in the bottom 5% (4th percentile), while men had it being average (51st percentile).
• Overall Quality of Golf Shop Merchandise: Continuing the theme, women placed Manitou in the bottom 5% (3rd percentile), while men found it favorable (73rd percentile). Clearly there is a big problem at Manitou in the selection of women’s goods compared to men’s.
Loyalty Driver
• Females considered significantly MORE influential
o Condition of tees (83to 46)
o Course design (69to35)
o Friendliness of staff (80 to 48)
o Affordability (76to47)
o Quality of shop (63to 35)
o Condition of greens (74to 47)
o Apparel (54 to 28)
o Overall experience (85to 60)
o Course conditions (84 to 61)
o Pace of Play (52to30)
o Overall Value (77v58)
o Location (43v26)
• Females considered significantly less influential
o Condition of carts (27to50)

Ramsey County Golf Study Customer Feedback
Sirius Golf Advisors, LLC 100
Age The satisfaction scores broken down by age is given below. In general, the younger golfers (under 40) tended to be more satisfied than seniors at all four facilities. The biggest differential being found at Manitou. But even there, the difference is probably not statistically significant.
Keller Seniors (over 60) made up 55.7% of the respondents. There were only two discernable differences between seniors and non-seniors.
• Teetime Availability: Seniors were more favorable (50th percentile compared to 37 overall)
• Course Design: Younger golfers liked the design better than seniors (49th percentile vs. 34th).
Loyalty Driver
• Seniors considered more important
o Location (52 v 21)
o Aesthetics (61 v 45)
o Condition of carts (53 vs 12)
o On course services (38 vs 21)
o Condition of fairways (72 v 55)
o Practice facility (55 v 32)
• None considered significantly less important
Goodrich Seniors were dominant in the survey, with 65% of the respondents. However, seniors and non-seniors rated the course very similarly. Biggest difference is in “Satisfaction compared to other courses”, where seniors rated it in 99th percentile, vs. 85th overall. This would indicate non-seniors think the course is about average. Only two big differences in individual factors, and they are related:
• Golf Shop Apparel: Seniors put Goodrich in the 78th percentile, compared to 54th overall
• Golf Shop Merchandise: Seniors had Goodrich in the 80th percentile, overall 67th.
Loyalty Driver
• Seniors Considered more important:
o Biggest difference was in influence of golf shop
▪ Overall quality 51 v 31
▪ Apparel 67 v 25
▪ Merchandise 50 v 22
o Amenities (43 v 26)
Age % Resp Satisf. % Resp Satisf. % Resp Satisf. % Resp Satisf. % Resp Satisf. % Resp Satisf. % Resp Satisf. % Resp Satisf.
Keller 4.0% 9.3 9.1% 8.9 7.1% 8.9 24.2% 8.2 36.4% 8 19.2% 9.2 13.1% 9.0 55.6% 8.4
Goodrich 1.0% 10 2.9% 8.7 `` 8.7 21.0% 8.5 39.0% 8.7 26.7% 8.9 3.8% 9.0 65.7% 8.8
Manitou 0.7% 10 4.1% 7.7 3.4% 8 30.8% 6.8 42.5% 7.4 17.8% 7.7 5.5% 8.0 60.3% 7.5
Battle Creek 3.2% 8.3 17.2% 9.3 8.6% 8.8 22.6% 8.5 33.3% 8.7 15.1% 9.2 20.4% 9.1 48.4% 8.9
60-69 70+ Under 40 Over 60
Satisfaction Rating by Age18-29 30-39 40-49 50-59

Ramsey County Golf Study Customer Feedback
Sirius Golf Advisors, LLC 101
o F&B service (53 v 29)
• None considered significantly less important
Battle Creek We did see several more, and more pronounced differences at Battle Creek. Seniors made up a little less than half the respondents (47.9%). They did have a little higher Satisfaction Compared to Expectations (88 to 78). Specific factor differences include:
• Overall Value: Seniors had Battle Creek in the 86th percentile compared to 53rd overall.
• Friendliness of Staff: Seniors were at the 93rd percentile, overall 85th.
• On Course Services: Seniors were more tolerant, placing Battle Creek in the 86th percentile (total was 60th).
• Affordability: With their senior discount, seniors were impressed, giving Battle Creek a rating putting them in the 60th percentile. The overall score was 30th.
Loyalty Driver
• Seniors Considered more important
o Location 65 vs 44
o On course services 86 vs 71
o Greens 79 vs 64
o Course design 73 vs 60
o Tees 74 vs 62
o Fairways 81 vs 69
o Overall value 84 vs 74
• Seniors Considered less important
o Golf shop 50 vs 63
o Golf carts 34 vs 44
Manitou Seniors accounted for 60% of the respondents. Only notable difference was in overall experience, where seniors put Manitou in the 32nd percentile, while the overall score was at the 20th.
Loyalty Driver
Not many differences. Biggest ones were all in direction of seniors having the factors as being less
influential in their overall satisfaction.
• Seniors Considered less important
o Overall merchandise (18 to 38)
o Friendliness of staff (41 to 60)
o Apparel (20 to 41)
o Golf shop (28 to 46)
o Course design (32 to 46)
o Amenities (35 to 47)
o Overall Experience (57 to 69)
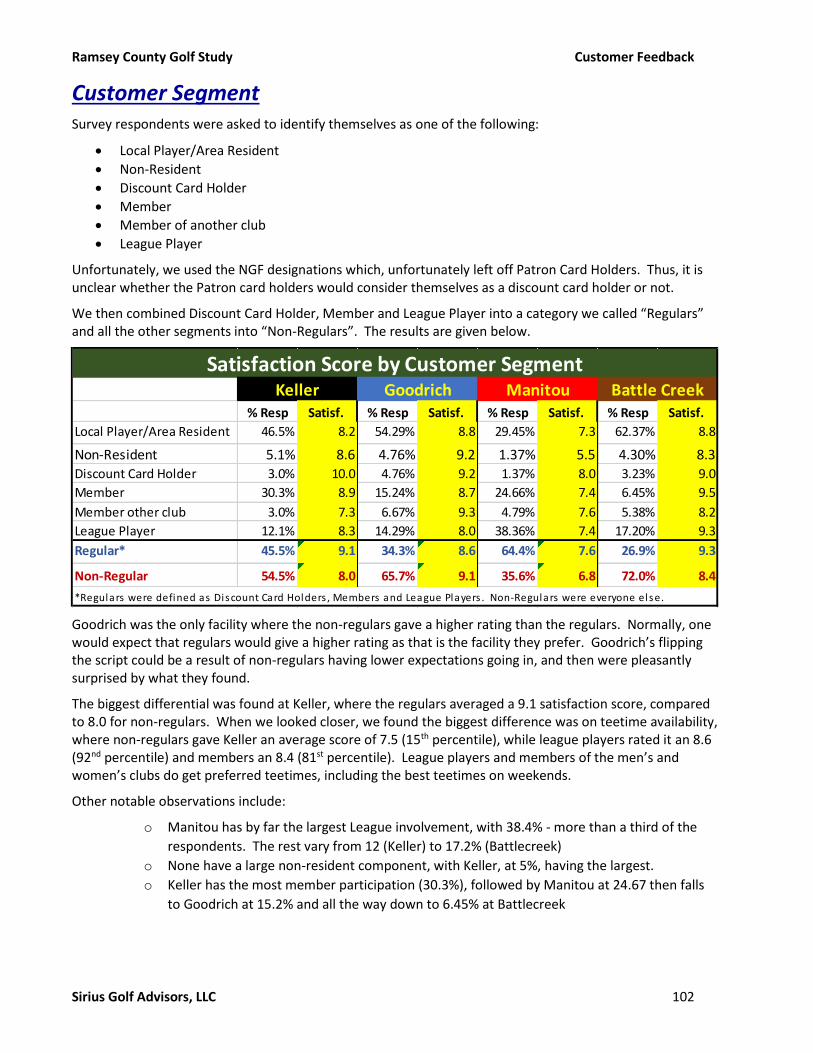
Ramsey County Golf Study Customer Feedback
Sirius Golf Advisors, LLC 102
Customer Segment Survey respondents were asked to identify themselves as one of the following:
• Local Player/Area Resident
• Non-Resident
• Discount Card Holder
• Member
• Member of another club
• League Player
Unfortunately, we used the NGF designations which, unfortunately left off Patron Card Holders. Thus, it is unclear whether the Patron card holders would consider themselves as a discount card holder or not.
We then combined Discount Card Holder, Member and League Player into a category we called “Regulars” and all the other segments into “Non-Regulars”. The results are given below.
Goodrich was the only facility where the non-regulars gave a higher rating than the regulars. Normally, one would expect that regulars would give a higher rating as that is the facility they prefer. Goodrich’s flipping the script could be a result of non-regulars having lower expectations going in, and then were pleasantly surprised by what they found.
The biggest differential was found at Keller, where the regulars averaged a 9.1 satisfaction score, compared to 8.0 for non-regulars. When we looked closer, we found the biggest difference was on teetime availability, where non-regulars gave Keller an average score of 7.5 (15th percentile), while league players rated it an 8.6 (92nd percentile) and members an 8.4 (81st percentile). League players and members of the men’s and women’s clubs do get preferred teetimes, including the best teetimes on weekends.
Other notable observations include:
o Manitou has by far the largest League involvement, with 38.4% - more than a third of the
respondents. The rest vary from 12 (Keller) to 17.2% (Battlecreek)
o None have a large non-resident component, with Keller, at 5%, having the largest.
o Keller has the most member participation (30.3%), followed by Manitou at 24.67 then falls
to Goodrich at 15.2% and all the way down to 6.45% at Battlecreek
% Resp Satisf. % Resp Satisf. % Resp Satisf. % Resp Satisf.
Local Player/Area Resident 46.5% 8.2 54.29% 8.8 29.45% 7.3 62.37% 8.8
Non-Resident 5.1% 8.6 4.76% 9.2 1.37% 5.5 4.30% 8.3Discount Card Holder 3.0% 10.0 4.76% 9.2 1.37% 8.0 3.23% 9.0
Member 30.3% 8.9 15.24% 8.7 24.66% 7.4 6.45% 9.5
Member other club 3.0% 7.3 6.67% 9.3 4.79% 7.6 5.38% 8.2
League Player 12.1% 8.3 14.29% 8.0 38.36% 7.4 17.20% 9.3
Regular* 45.5% 9.1 34.3% 8.6 64.4% 7.6 26.9% 9.3
Non-Regular 54.5% 8.0 65.7% 9.1 35.6% 6.8 72.0% 8.4
*Regulars were defined as Discount Card Holders , Members and League Players . Non-Regulars were everyone else.
Keller Goodrich Manitou Battle Creek
Satisfaction Score by Customer Segment
Ramsey County Golf Study Customer Feedback
Sirius Golf Advisors, LLC 103
o Islands had 93% identify themselves as “Locals”, which is to be expected. The next highest
percentage was at Battlecreek, at 62%, followed by Goodrich 54.3%), Keller (46.5%) and
finally Manitou at just 39%.
o None of the courses had discount card holder as a high percentage, with Goodrich, at 4.76%,
having the highest. It is unclear as to whether the respondents considered a Patron card as
a discount card.
Keller League players had a slightly lower overall score (75 to 82) than the total. They were also lower on “Satisfaction Compared to Other Courses” (45 vs 73); and “Likelihood to Recommend” (52 vs. 69).
Members, on the other hand, had a much higher Overall Satisfaction Score (97 vs. 82). They also scored higher on “Satisfaction Compared to Expectations” (80 to 50); “Satisfaction Compared to Others” (90 vs 73); “Likelihood to Play More” (56 to 19) and “Likelihood to Recommend” (94 to 69).
Non-regulars made up 53.6% of the respondents. They had a much lower Overall Satisfaction Score (63rd percentile compared to 82nd). They were also much lower on “Satisfaction Compared to Expectation” (32 to 50), “Likelihood to Play More” (2 vs 19), and “Likelihood to Recommend” (51 to 69). Concerning is the Likelihood to Play More factor, where non-regulars placed Keller in the bottom 2% of facilities. Given the high satisfaction score, this means that we cannot count on increasing play from these customers, but rather must focus on recruiting new customers. Consequently, Loyalty Programs are not likely to have a great benefit to the facility.
Some interesting observations:
• Overall Value: Overall Value was ranked at the 48th percentile. But there was a lot of variance. Non-regulars had it at the 36th percentile, League players at the 30th, but members had it all the way up to the 70th.
• Overall Course Conditions: League players were also critical here, putting Keller at the 58th percentile (overall grade was 79th). Members placed it at 90th.
• Pace of Play: Again, league players were most critical, with a rating in the 8th percentile, members most favorable at 38th. (Overall was 26th)
• Golf Course Design: Here, the roles were reversed. Members were more critical (24th), compared to League (48th). But non-regulars were most impressed, with a rating of 61st percentile). (49th overall).
• Tee Time Availability: Huge difference between the non-regulars (15th percentile) and everyone else. Especially members, who had Keller at the 92nd percentile. This is all because members of the clubs and league players get preferred teetimes. However, non-regulars pay a higher fee, so this is a bit of a concern. We will talk more about this later.
• Condition of Greens: League raters were very critical (28th percentile), members very favorable (85th), with overall score at 72nd.
• Amenities: Another big spread. League (28th) and Members (28th) were not impressed, but non-regulars (75th) were. Overall rating 54th percentile.
• Overall Experience: Non-regulars had Keller at average (50th percentile) while members (79th) and League (72nd) were favorable (overall 64th). Adversely affecting the non-regulars were food and beverage service, on-course services and teetime availability.
• Affordability: League players were not happy (18th), nr were non-regulars (29th), but members had it close to average (45th). Overall – 34th.
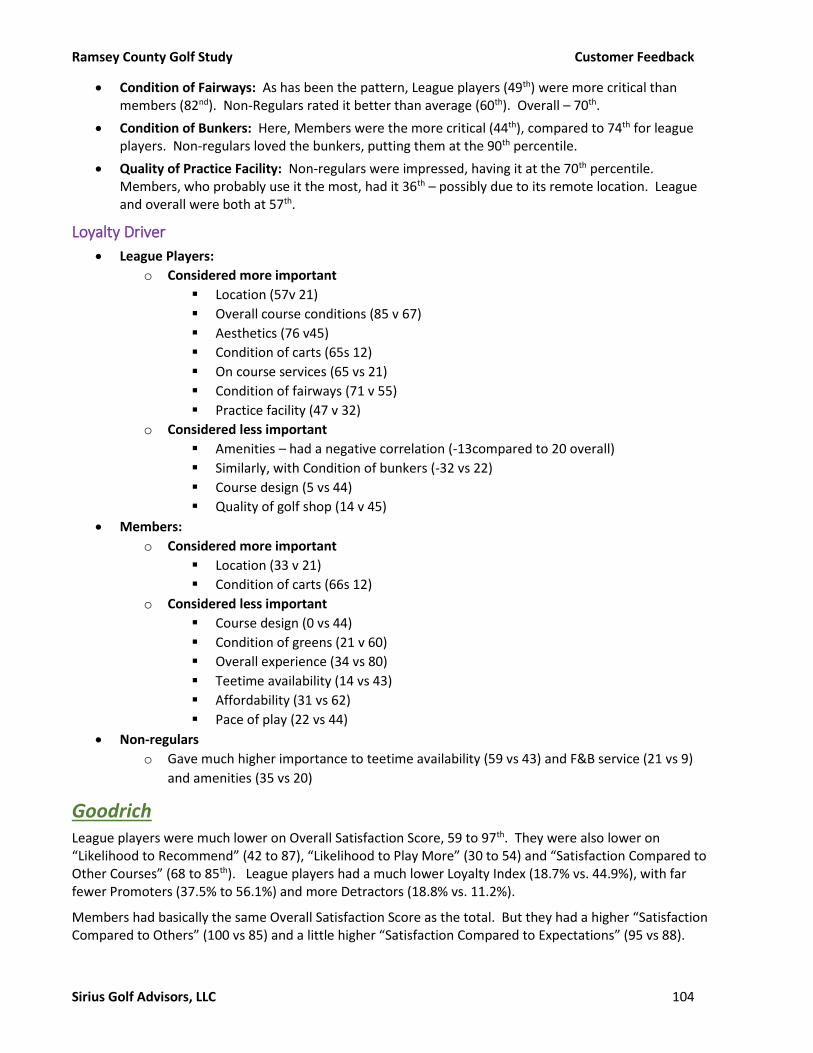
Ramsey County Golf Study Customer Feedback
Sirius Golf Advisors, LLC 104
• Condition of Fairways: As has been the pattern, League players (49th) were more critical than members (82nd). Non-Regulars rated it better than average (60th). Overall – 70th.
• Condition of Bunkers: Here, Members were the more critical (44th), compared to 74th for league players. Non-regulars loved the bunkers, putting them at the 90th percentile.
• Quality of Practice Facility: Non-regulars were impressed, having it at the 70th percentile. Members, who probably use it the most, had it 36th – possibly due to its remote location. League and overall were both at 57th.
Loyalty Driver
• League Players:
o Considered more important
▪ Location (57v 21)
▪ Overall course conditions (85 v 67)
▪ Aesthetics (76 v45)
▪ Condition of carts (65s 12)
▪ On course services (65 vs 21)
▪ Condition of fairways (71 v 55)
▪ Practice facility (47 v 32)
o Considered less important
▪ Amenities – had a negative correlation (-13compared to 20 overall)
▪ Similarly, with Condition of bunkers (-32 vs 22)
▪ Course design (5 vs 44)
▪ Quality of golf shop (14 v 45)
• Members:
o Considered more important
▪ Location (33 v 21)
▪ Condition of carts (66s 12)
o Considered less important
▪ Course design (0 vs 44)
▪ Condition of greens (21 v 60)
▪ Overall experience (34 vs 80)
▪ Teetime availability (14 vs 43)
▪ Affordability (31 vs 62)
▪ Pace of play (22 vs 44)
• Non-regulars
o Gave much higher importance to teetime availability (59 vs 43) and F&B service (21 vs 9)
and amenities (35 vs 20)
Goodrich League players were much lower on Overall Satisfaction Score, 59 to 97th. They were also lower on “Likelihood to Recommend” (42 to 87), “Likelihood to Play More” (30 to 54) and “Satisfaction Compared to Other Courses” (68 to 85th). League players had a much lower Loyalty Index (18.7% vs. 44.9%), with far fewer Promoters (37.5% to 56.1%) and more Detractors (18.8% vs. 11.2%).
Members had basically the same Overall Satisfaction Score as the total. But they had a higher “Satisfaction Compared to Others” (100 vs 85) and a little higher “Satisfaction Compared to Expectations” (95 vs 88).
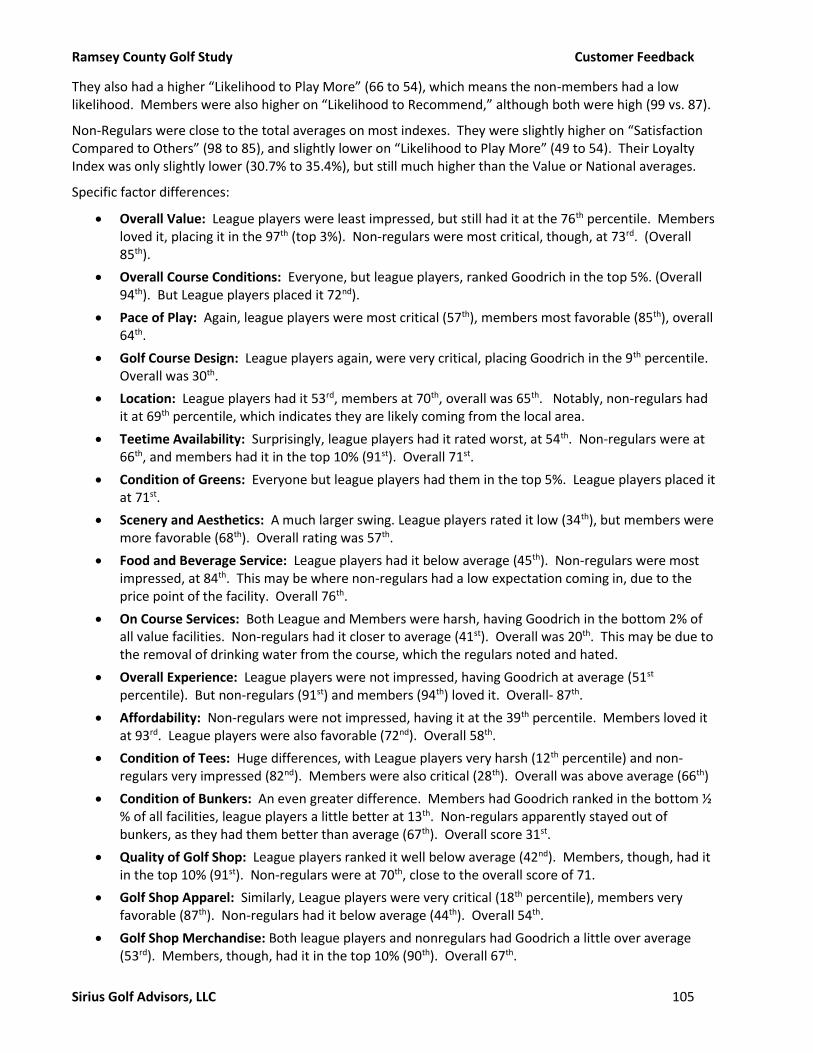
Ramsey County Golf Study Customer Feedback
Sirius Golf Advisors, LLC 105
They also had a higher “Likelihood to Play More” (66 to 54), which means the non-members had a low likelihood. Members were also higher on “Likelihood to Recommend,” although both were high (99 vs. 87).
Non-Regulars were close to the total averages on most indexes. They were slightly higher on “Satisfaction Compared to Others” (98 to 85), and slightly lower on “Likelihood to Play More” (49 to 54). Their Loyalty Index was only slightly lower (30.7% to 35.4%), but still much higher than the Value or National averages.
Specific factor differences:
• Overall Value: League players were least impressed, but still had it at the 76th percentile. Members loved it, placing it in the 97th (top 3%). Non-regulars were most critical, though, at 73rd. (Overall 85th).
• Overall Course Conditions: Everyone, but league players, ranked Goodrich in the top 5%. (Overall 94th). But League players placed it 72nd).
• Pace of Play: Again, league players were most critical (57th), members most favorable (85th), overall 64th.
• Golf Course Design: League players again, were very critical, placing Goodrich in the 9th percentile. Overall was 30th.
• Location: League players had it 53rd, members at 70th, overall was 65th. Notably, non-regulars had it at 69th percentile, which indicates they are likely coming from the local area.
• Teetime Availability: Surprisingly, league players had it rated worst, at 54th. Non-regulars were at 66th, and members had it in the top 10% (91st). Overall 71st.
• Condition of Greens: Everyone but league players had them in the top 5%. League players placed it at 71st.
• Scenery and Aesthetics: A much larger swing. League players rated it low (34th), but members were more favorable (68th). Overall rating was 57th.
• Food and Beverage Service: League players had it below average (45th). Non-regulars were most impressed, at 84th. This may be where non-regulars had a low expectation coming in, due to the price point of the facility. Overall 76th.
• On Course Services: Both League and Members were harsh, having Goodrich in the bottom 2% of all value facilities. Non-regulars had it closer to average (41st). Overall was 20th. This may be due to the removal of drinking water from the course, which the regulars noted and hated.
• Overall Experience: League players were not impressed, having Goodrich at average (51st percentile). But non-regulars (91st) and members (94th) loved it. Overall- 87th.
• Affordability: Non-regulars were not impressed, having it at the 39th percentile. Members loved it at 93rd. League players were also favorable (72nd). Overall 58th.
• Condition of Tees: Huge differences, with League players very harsh (12th percentile) and non-regulars very impressed (82nd). Members were also critical (28th). Overall was above average (66th)
• Condition of Bunkers: An even greater difference. Members had Goodrich ranked in the bottom ½ % of all facilities, league players a little better at 13th. Non-regulars apparently stayed out of bunkers, as they had them better than average (67th). Overall score 31st.
• Quality of Golf Shop: League players ranked it well below average (42nd). Members, though, had it in the top 10% (91st). Non-regulars were at 70th, close to the overall score of 71.
• Golf Shop Apparel: Similarly, League players were very critical (18th percentile), members very favorable (87th). Non-regulars had it below average (44th). Overall 54th.
• Golf Shop Merchandise: Both league players and nonregulars had Goodrich a little over average (53rd). Members, though, had it in the top 10% (90th). Overall 67th.

Ramsey County Golf Study Customer Feedback
Sirius Golf Advisors, LLC 106
Loyalty Driver
• League Players
o Considered more influential
▪ Overall value (71v45)
▪ Location (81v33)
▪ Teetime avail (48v28)
▪ Aesthetics (60v45)
▪ Pace of play (64v34)
▪ Golf carts (62v29)
▪ Amenities (66v26)
▪ Friendliness of staff (60 v 28)
▪ Overall experience (88v60)
▪ Affordability (71v22)
▪ Condition of bunkers (47 v 39)
▪
o Considered less influential
▪ Condition of greens (21 v 52)
▪ Condition of tees (26 v 51)
• Members
o Considered more influential
▪ Merchandise (55v22)
▪ Condition of the greens (69v52)
▪ Apparel (41v25)
▪ Condition of carts (44v29)
o Considered less influential
▪ Aesthetics (13v45)
▪ On course services (2v18)
▪ Condition of bunkers(23v39)
▪ Course conditions (58v73)
▪ Amenities (7v26)
• Non-Regulars
o Again, close
o Considered more influential
▪ Food & Beverage (50 v 29)
▪ Condition of tees (61 v 51)
o Considered less influential
▪ Overall experience (47 v 60)
Battle Creek League players made up 17% of the responses. They had similar overall scores. But they were significantly higher on “Satisfaction Compared to Expectations” (100 vs 78), and much higher “Likelihood to Play More” (91 to 55). They also had an even higher Loyalty Index (81.2% vs. 59.1%), with no detractors.
Non-Regulars made up the rest of the respondents (73.4%).
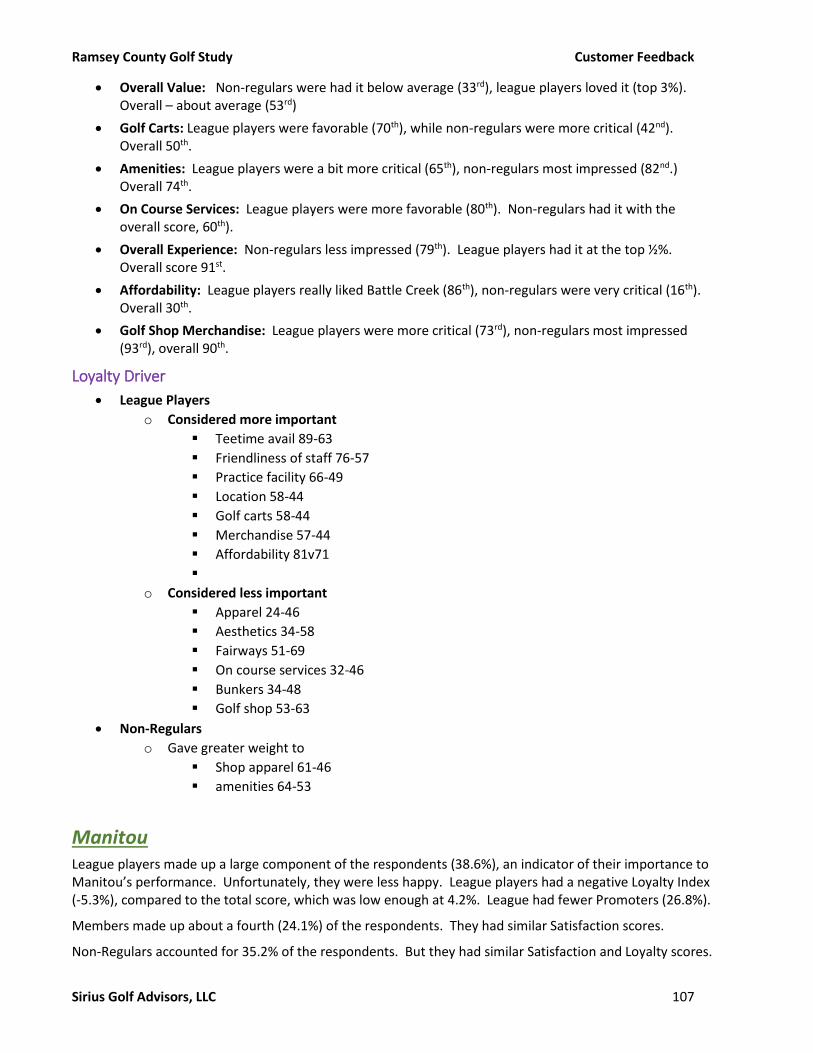
Ramsey County Golf Study Customer Feedback
Sirius Golf Advisors, LLC 107
• Overall Value: Non-regulars were had it below average (33rd), league players loved it (top 3%). Overall – about average (53rd)
• Golf Carts: League players were favorable (70th), while non-regulars were more critical (42nd). Overall 50th.
• Amenities: League players were a bit more critical (65th), non-regulars most impressed (82nd.) Overall 74th.
• On Course Services: League players were more favorable (80th). Non-regulars had it with the overall score, 60th).
• Overall Experience: Non-regulars less impressed (79th). League players had it at the top ½%. Overall score 91st.
• Affordability: League players really liked Battle Creek (86th), non-regulars were very critical (16th). Overall 30th.
• Golf Shop Merchandise: League players were more critical (73rd), non-regulars most impressed (93rd), overall 90th.
Loyalty Driver
• League Players
o Considered more important
▪ Teetime avail 89-63
▪ Friendliness of staff 76-57
▪ Practice facility 66-49
▪ Location 58-44
▪ Golf carts 58-44
▪ Merchandise 57-44
▪ Affordability 81v71
▪
o Considered less important
▪ Apparel 24-46
▪ Aesthetics 34-58
▪ Fairways 51-69
▪ On course services 32-46
▪ Bunkers 34-48
▪ Golf shop 53-63
• Non-Regulars
o Gave greater weight to
▪ Shop apparel 61-46
▪ amenities 64-53
Manitou League players made up a large component of the respondents (38.6%), an indicator of their importance to Manitou’s performance. Unfortunately, they were less happy. League players had a negative Loyalty Index (-5.3%), compared to the total score, which was low enough at 4.2%. League had fewer Promoters (26.8%).
Members made up about a fourth (24.1%) of the respondents. They had similar Satisfaction scores.
Non-Regulars accounted for 35.2% of the respondents. But they had similar Satisfaction and Loyalty scores.

Ramsey County Golf Study Customer Feedback
Sirius Golf Advisors, LLC 108
• Overall Value: Everyone had it in the bottom 10%. But league players rated in the bottom ½%. (Overall 5th percentile).
• Overall Course Conditions: Non-regulars had Manitou above average (60th). But League (38th) and Members (31st) had it well below. Overall 44th.
• Pace of Play: No one liked the pace, but league members especially, placing in the bottom 5% (4th percentile). Members were more favorable at 22nd. Non-regulars had it at the 16th. (Overall 13th).
• Friendliness of Staff: League players rated Manitou harshly, putting it in the bottom 10% (8th percentile). Non-regulars were also not impressed (26th). But members were more favorable, rating it average (50th). Staff may be treating people differentially.
• Golf Course Design: The overall score was in the bottom 10% (9th). League players were most critical (5th). But non-regulars had a more favorable opinion, although still below average (27th)
• Teetime Availability: Members had Manitou above average (60th), but nonregulars were harsh (13th). League players also had it low (20th). Overall 29th.
• Condition of Greens: Non-regulars (60th) had it above average, the rest below. Overall 49th.
• Golf Carts: Members were not impressed, having it at 14th percentile. Everyone else was in the 40s. Overall 33. (Manitou did get new carts this year, so many of these ranking may have been due to past experience.)
• Amenities: Non-regulars rated Manitou a little below average (40th). But both League players and Members were critical (13th). Overall 22nd.
• Condition of Tees: Members were much more critical, rating it at the 11th percentile. Non-regulars had it a little above average (53rd.) League players were close to the overall (37th and 36th respectively).
• Condition of Bunkers: Members, again, were most critical, having Manitou in the bottom 2%. Non-regulars were most favorable (34th), League right behind at 31. Overall – 21st percentile.
• Quality of Golf Shop: Members (who must have been mostly male) rated it at the 83rd percentile. League players (most of the women) had it at the 12th percentile. Non-regulars at 32nd. (Overall 34th).
• Golf Shop Apparel: Similarly, members were favorable (83rd), league most critical (9th), non-regulars at 24th. (Overall 29th).
• Golf Shop Merchandise: Members, again, were impressed (93rd), league players least impressed (30th), non-regulars were at 37th percentile. Overall score 53rd.
Loyalty Driver
• League Players
o No factors really Considered more important
o Considered less important
▪ Teetime availability (9vs24)
▪ Pace of Play (25v40)
• Members
o Considered more important
▪ Teetime availability (46to22)
▪ Overall value (80v63)
▪ Golf carts (56v42)
▪ On course services (59to46)
▪ Practice facility (70to57)

Ramsey County Golf Study Customer Feedback
Sirius Golf Advisors, LLC 109
o Considered less important
▪ none
• Non-Regulars
o Only pace of play rated higher influence (68 to 40)
o Given less influence:
▪ Amenities (27 to 47)
▪ Condition of bunkers (32 to 46)
▪ On course services (36 to 46)
Like Most These were open-ended responses to the question “what do you like most about the facility?” We then took those comments and tallied them by various categories such as “about the course,” “about course conditions,” “about staff and/or customer service,” as well as individual topics within those categories. It is important to note that not all respondents answered this question. Further, a given respondent may have mentioned multiple items. It can be safely assumed that the most frequent responses indicate a course’s strengths. It can also be just as telling as to what is not mentioned.
The table below gives the most frequent responses, by category.
Like Most Comments by Percentage
Keller Goodrich Manitou Battle Creek
Course 42.8% 18.1% 29.6% 32.6%
General 4.8% 1.6% 4.6% 3.3%
Layout 11.5% 0.5% 4.2% 3.3%
Challenge 2.4% 0.5% 5.6% 11.4%
Aesthetics 7.2% 1.0% 0.0% 4.3%
Historic 4.8% 0.5% 0.5% 0.0%
Course Conditions 20.2% 33.2% 16.7% 19.0%
General 13.5% 22.8% 13.4% 17.9%
Greens 1.9% 6.7% 0.5% 1.1% Staff/Customer Service 21.6% 23.3% 18.5% 17.9%
General 8.2% 9.3% 10.2% 6.0%
Friendly 6.7% 11.4% 4.6% 8.2%
Specific staff 5.3% 0.5% 2.3% 1.1%
Value/Price 2.9% 7.3% 5.1% 2.7%
Food & Beverage 1.4% 1.0% 3.2% 1.6%
Leagues/Clubs 2.9% 2.6% 5.6% 1.6%
Clubhouse 1.9% 1.6% 0.0% 0.0%
Teetime Availability 1.4% 3.6% 2.3% 2.7%
Practice Area 2.4% 0.0% 0.9% 12.0%
Location 1.9% 7.3% 10.6% 4.9%
Other 0.5% 2.1% 7.4% 4.9%

Ramsey County Golf Study Customer Feedback
Sirius Golf Advisors, LLC 110
The course itself, was the most mentioned comment for all the courses, except Goodrich, where it was 2nd behind staff/customer service and course conditions. Staff/Customer services was second most mentioned at all four facilities. Course conditions was the most frequent response at Goodrich, third (barely) at the other three.
The practice area stood out at Battle Creek. While location was mentioned a lot for Manitou. This is not necessarily a good thing, when location is what you like most about a facility, as it means the facility lacks the appeal to attract a larger geographical customer base.
Needs Improvement
We did a similar treatment to the open-ended question as to “suggested improvements” to the course. It can be assumed usually that the more frequent responses are weaknesses of the facility and fixing them could lead to improvement in performance.
Needs Improvement Comments by Percentage Keller Goodrich Manitou Battle Creek
None/Nothing 2.2% 5.0% 2.0% 6.4%
Course 15.2% 19.3% 17.3% 21.3%
Greens 2.9% 10.1% 3.5% 1.1%
Too Small 6.7% 0.0% 0.0%
Better Aesthetics 1.7% 6.4% 0.0%
Make 18 holes 6.4%
Course Conditions 10.9% 31.9% 21.3% 4.3%
Bunkers 18.5% 5.0% 2.1%
Teeboxes 1.4% 4.2% 1.0% 1.1%
Rough 0.7% 4.2% 1.5% 0.0%
Trim Trees 3.4% 4.5% 0.0%
Food & Beverage 33.3% 10.9% 16.3% 10.6%
Beverage Cart 4.3% 1.7% 7.4% 1.1%
Price 3.6% 0.0% 1.0% 2.1%
Menu/Selection 0.7% 4.2% 4.0% 6.4%
Customer Service 1.4% 1.7% 4.5% 5.3%
Carts 2.9% 0.8% 2.5% 4.3%
Pace of Play 14.5% 0.0% 11.4% 5.3%
General 8.0% 0.0% 6.4% 4.3%
Add Marshals 5.1% 0.0% 3.5% 1.1%
Price/Value 10.1% 9.2% 12.4% 19.1%
Practice Area 2.9% 5.0% 4.0% 7.4%
Teetime Availability 2.2% 0.0% 0.5% 0.0%
Leagues/Clubs 0.7% 0.0% 1.0% 0.0%
Amenities 3.6% 14.3% 4.5% 10.6%
Add Drinking Water 2.2% 8.4% 2.0% 2.1%
Other - 1.7% 2.5% 5.3%

Ramsey County Golf Study Customer Feedback
Sirius Golf Advisors, LLC 111
It is important to keep in mind that these responses are from the people who took the survey, who are, by definition, already customers of the facility. Thus, while these customers obviously have overlooked these flaws, others may not. That is, golfers who place more value on these factors are not as likely to play this course.
Above is a table of the most frequently mentioned comments about what needs improvement.
When looking at these suggestions, we can divide them roughly into three types: 1) things that can be improved; 2) things that cannot be improved; 3) things that can be improved but are not necessarily bad.
In the latter category are “Pace of Play” and “Teetime Availability,” which are both functions of being busy. Yes, you can improve on them and should; but having them indicates that you are busy to begin with. Price can also be in this category. Most everyone wants to pay less. But that does not mean that they feel they are getting “ripped off” at the current price point. In fact, the absence of complaints about the price may indicate that you are underpriced, as this, along with pace of play, are two of the most commonly mentioned issues on this question.
Location is a great example of an issue that simply cannot reasonably be fixed. Adding a range at Goodrich is another. But adding another 9 holes can be done at Battle Creek, although it would not be cheap.
We do see quite a bit of variability between the facilities.
Issues regarding course conditions was the most mentioned at both Goodrich (31.9%) and Manitou (21.3%), but was fourth at Keller (10.9%), and dead last (tied with “other” at 5.3%) at Battle Creek. At Goodrich, bunkers were specifically mentioned 18.5%, with teeboxes and rough mentioned 3.2% and trim trees 3.4% (although many of these were about a specific tree). At Manitou, bunkers were mentioned 5% of the time, trimming trees 4.3%, rough 1.5% and teeboxes 1%.
Food and Beverage was the favorite target at Keller (33.3%) and was third most at Manitou (16.3%) and Battle Creek (10.6%), and fourth at Goodrich (10.9%). Beverage cart service was singled out by 4.3% at Keller, 1.7% at Goodrich, 7.4% at Manitou and 1.1% at Battle Creek. Price was an issue at Keller (3.6%), and a bit at Battle Creek (2.1%), but not at Manitou (1%) or Goodrich (0). Menu/selection was a topic at Battle Creek (6.4%), Goodrich (4.2%) and Manitou (4%), but not at Keller (0.7%).
Suggestions about the course itself took prominence at Battle Creek, with the most frequent suggesting being “make it 18 holes” (6.4%). Course improvements was the second leading topic at the other three courses. Greens were singled out most at Goodrich (10.1%), where the primary issue was them being too small (6.7%). Greens were also mentioned 3.5% at Manitou, 2.9% at Keller and just 1.1% at Battle Creek. Aesthetics was the primary course concern at Manitou, with 6.4% of the comments. It was also mentioned at Goodrich (1.7%) but was not a concern at Keller or Battle Creek.
Comments about price or value were the second most mentioned at Battle Creek (19.1%), fourth most at Manitou (12.4%) and fifth most at Keller (10.1%) and Goodrich (9.2%).
Amenities was the third most popular comment at both Goodrich (14.3%) and Battle Creek (10.6%) but were not that much mentioned at Manitou (4.5%) or Keller (3.6%). At both Goodrich and Battle Creek, the main problem was not having any drinking water on the course.
Pace of Play was a concern at both Keller (third at 14.5%) and Manitou (fourth at 11.4%), but not at Battle Creek (5.3%) or Goodrich (0). General statements about needing to improve the pace make up 8% of the

Ramsey County Golf Study Customer Feedback
Sirius Golf Advisors, LLC 112
comments at Keller and 6.4% at Manitou. Adding more rangers/marshals was mentioned 5.1% of the time at Keller and 3.5% at Manitou.
Custom Questions We asked several questions that are not part of the standard NGF survey. Many of these questions were asked of the four courses, while some were course-specific. These questions were chosen by the County.
The common questions were:
• Regarding the bunkers at xxx, do you feel:
o There are too many
o There are too few
o The number of bunkers is about right
• How often do you book your tee times online?
o Always
o Most of the time
o Some of the time
o Never
• If you do not always book online, what are the main reasons you don’t? (open-ended)
• Are there any mobile aps that you would like to see at xxx, such as GPS, ordering food, booking
online, etc.? (open-ended)
• Do you follow us online? If so, what sites (website, Facebook, Twitter, etc.) (Open-ended)
• Would you like to see more online content? If so, what? (open-ended)
• What marketing efforts from other courses successfully get you to play there? (open-ended)
• Would you like to see more human-interest stories from the County courses? (open-ended)
• Please rate the three most important factors in determining whether to play a course for the first
time:
o Friend play there
o Quality of the course turf/condition of the turf
o Reputation
o Advertising
o Special promotion
o Coupon
o Referred by friend/family etc.
o Course yardage
o Location
o Price
o Course Architect
o Newness of course
o Recently remodeled
• On a scale from 1 to 10, where one is “awful” and ten is “best ever,” please rate the beverage cart
service at xxx.
Below are the responses.

Ramsey County Golf Study Customer Feedback
Sirius Golf Advisors, LLC 113
Bunkers
In most cases, the customers were happy with the number of bunkers at the course. The main exception was Island Lake, where 64% wanted more bunkers. However, the sample size is small. At Keller, 18% felt there were too many. At Manitou, 7.4% wanted more.
Beverage Cart Service The respondents were asked to rate the beverage cart service on a scale from 1, “Horrible” to 10 “Outstanding.” Keller, by far, received the poorest rating, at 4.6. But all the facilities were under 7.0, which is not good.
At Keller, nearly half (45.7%) gave a rating of 4 or worse, while only 8.6% rated beverage cart service a 9 or a 10. Goodrich had both the highest average score, 6.8, and the highest percentage of 9 or 10s at 22.5%. Battle Creek had the next highest average score, at 6.7, but had more rating 7 or better (65.7%) and fewer rating 4 or worse (11.4%).
How to Improve The next question was open-ended and asked how the beverage cart service could be improved. Unfortunately, this was only asked at Keller.
The top response (50.6%) was to improve the hours of operation, with 42.4% mentioning it needed to be more frequent. The next highest response category was comments regarding customer service (16.5%), with most of those suggesting better training (15.3%). 4.7% of the comments were to “service the entire course” as several referenced that the carts tended to stay in just one or two spots.
Booking On-line
It is surprising how many people are not booking online. At Manitou, most of the customers (69.4%) do not book online. Part of this is a function that so many of the respondents were league players, where the teetimes are set.
Regarding the Bunkers at the course, do you feel there are:Too Many 18 18.2% 4 3.8% 0 0.0% 0 0.0% 0.0% 22 4.8%
Too Few 1 1.0% 7 6.6% 11 7.4% 3 3.2% 9 64.3% 31 6.7%
Just right 80 80.8% 95 89.6% 137 92.6% 91 96.8% 5 35.7% 408 88.5%
Total 99 100.0% 106 100.0% 148 100.0% 94 100.0% 14 100.0% 461 100.0%
AllKeller Goodrich Manitou Battle Creek Island Lake
How often do you book your teetimes online? 0
Always 17 17.3% 20 18.9% 9 6.1% 23 24.2% 2 14.3% 71 15.4%
Most of the time 16 16.3% 16 15.1% 11 7.5% 23 24.2% 2 14.3% 68 14.8%
Some of the time 25 25.5% 28 26.4% 25 17.0% 25 26.3% 5 35.7% 108 23.5%
Never 40 40.8% 42 39.6% 102 69.4% 24 25.3% 5 35.7% 213 46.3%
Total 98 100.0% 106 100.0% 147 100.0% 95 100.0% 14 100.0% 460 100.0%
AllKeller Goodrich Manitou Battle Creek Island Lake
Keller Goodrch Manitou Battle Crk All
Average Rating 4.6 6.8 6.3 6.7 6.1
% 9 or 10 8.6% 22.5% 18.7% 12.9% 16.1%
% 7 or better 24.7% 60.0% 51.2% 65.7% 50.0%
% 4 or worse 45.7% 12.5% 19.5% 11.4% 22.3%
Beverage Cart Service

Ramsey County Golf Study Customer Feedback
Sirius Golf Advisors, LLC 114
Booking online is generally preferred by golf facilities as it greatly reduces staff time and can improve customer service at the counter as the staff person does not have to interrupt a paying customer to take the phone call.
The survey then asked if they did not book online, what was the reason. This was an open-ended question. Below are the most frequently named responses.
Why not book online Keller Goodrch Manitou Battle Crk All
League player 12.3% 12.1% 30.3% 6.3% 17.1%
Do in person 7.0% 4.5% 11.1% 14.1% 9.4%
Men’s/women’s club 15.8% 15.2% 10.1% 1.6% 10.5%
Easier to call 17.5% 15.2% 13.1% 12.5% 14.3%
Personal touch/more info 10.5% 12.1% 10.1% 6.3% 9.8%
Last minute 3.5% 7.6% 1.0% 7.8% 4.5%
Can’t as single 5.3% 4.5% 0.0% 3.1% 2.8%
Another person makes 1.8% 9.1% 6.1% 4.7% 5.6%
Convenience 3.0% 3.0% 6.3% 3.1%
Must use credit card 1.5% 0.0% 10.9% 2.8%
Walk on 0.0% 1.5% 0.0% 10.9% 2.8%
The biggest reason was that they were a league player, which meant that the teetime was already set. The same is true if you are a member of the men’s or women’s club. However, a substantial portion of the respondents simply felt it was easier to call, or that they preferred the personal touch. This is likely a reflection of the fact that well over half the respondents were over 60, and they are used to calling.
At Battle Creek, a large percentage (10.9%) did not book ahead, preferring to simply walk on. Sadly, this may be a reflection on the low volume of rounds as golfers feel they do not need a teetime to play.
Choosing Where to Play
The most commonly mentioned factor was price, given 20.3% of the time (keep in mind, 33% is the highest possible, as respondents were asked to pick three.) Island Lake had it mentioned the most, at 26.8%, followed by Battle Creek (22.1%).
Choose the three most important factors in determining whether to play a course the first time:Friends play there 3 1.2% 55 16.9% 78 17.5% 48 16.8% 5 12.2% 189 14.0%
Quality/condition of turf 49 19.5% 56 17.2% 80 18.0% 0.0% 6 14.6% 191 14.2%
Reputation 41 16.3% 24 7.4% 39 8.8% 27 9.5% 2 4.9% 133 9.9%
Advertising 0 0.0% 1 0.3% 3 0.7% 2 0.7% 0.0% 6 0.4%
Special Promotion 16 6.4% 18 5.5% 27 6.1% 20 7.0% 2 4.9% 83 6.2%
Coupon 7 2.8% 19 5.8% 26 5.8% 23 8.1% 3 7.3% 78 5.8%
Referred by friend/family 23 9.2% 24 7.4% 26 5.8% 21 7.4% 1 2.4% 95 7.1%
Course yardage 7 2.8% 9 2.8% 9 2.0% 12 4.2% 2 4.9% 39 2.9%
Location 41 16.3% 50 15.4% 63 14.2% 56 19.6% 8 19.5% 218 16.2%
Price 49 19.5% 65 20.0% 85 19.1% 63 22.1% 11 26.8% 273 20.3%
Course architect 4 1.6% 1 0.3% 2 0.4% 7 2.5% 0 0.0% 14 1.0%
Newness of course 2 0.8% 2 0.6% 4 0.9% 4 1.4% 1 2.4% 13 1.0%
Recently remodeled 9 3.6% 1 0.3% 3 0.7% 2 0.7% 0.0% 15 1.1%
Total 251 258.8% 325 303.7% 445 306.9% 285 303.2% 41 273.3% 1347 294.1%
AllKeller Goodrich Manitou Battle Creek Island Lake

Ramsey County Golf Study Customer Feedback
Sirius Golf Advisors, LLC 115
Location, with 16.2% of the responses, was second most mentioned overall. However, it was third most at Keller, (16.3%), fourth at Goodrich (15.4%) and Manitou (14.2%). It was second at Battle Creek (19.6%) and Island Lake (19.5%). Again, this is not something we have control over.
Course Conditions was the third most mentioned factor (14.2%), barely beating out “Friends Play There” (14%). It was tied for most important at Keller (19.5%), suggesting a more discriminating customer base. It was second most mentioned at Goodrich (17.2%) and Manitou (18%), fourth at Island Lake (14.6%), but was not mentioned at Battle Creek.
Friends Playing There was third most important at Manitou (17.5%), Goodrich (16.9%), and Battle Creek (16.8%). It was fourth at Island Lake (12.2%). But it was mentioned only by 1.2% at Keller.
Reputation was very important at Keller, tied for third with 16.3%; again, showing a more discriminating golfer. It was fourth most important at Battle Creek (9.5%). It was listed 8.8% at Manitou and 7.4% at Goodrich.
Lessons
While not everyone responded to this question, most did. Less than half (43%) would not consider taking lessons at the facility, about half because they never take lessons. But this varied by facility. At Manitou, 32.9% said "No,” while not indicating they never took lessons. Keller was right behind at 30.9%. But Battle Creek had the lowest percentage at 9.9%, followed by Island Lake at 14.3%. (Goodrich does not have a range, so they were not asked the question.)
Both Battle Creek and Island lake had nearly 30% of the respondents saying they already had taken lessons at the facility, followed by Keller at 14.9% and Manitou at 11%. Battle Creek and Island Lake were also the highest on the “definitely” response with 13.2% and 14.3% respectively.
Combined, over 3/4ths of the respondents at Island Lake (78.6%) and 70.3% at Battle Creek indicated they either had already or would consider taking lessons at the facility. This compares to 56.4% at Keller and 46.6% at Manitou.
Age may be a factor with this question as both Island Lake and Battle Creek had a higher percentage of younger golfers.
To dig further, the next question asked what was important in considering where to take lessons. Again, respondents chose three, so 33.3% is the highest possible score (although not all respondents chose three).
Receiving the most overall was price, with 24.1%. It was mentioned by nearly all the respondents at Island Lake (32.4%), and by about had nearly 25% of the votes at the other three.
Reputation of the Instructor was the second most influential factor, receiving 20.5% of the votes. It was mentioned the most at Keller (24.4%), followed by Manitou (19.7%) and Battle Creek (19.3%). It was listed by 13.5% at Island Lake.
Would you consider taking lessons at the course?Have already 14 14.9% 16 11.0% 27 29.7% 4 28.6% 61 17.7%
Definitely 8 8.5% 3 2.1% 12 13.2% 2 14.3% 25 7.2%
Possibly 31 33.0% 49 33.6% 25 27.5% 5 35.7% 110 31.9%
No 29 30.9% 48 32.9% 9 9.9% 2 14.3% 88 25.5%
Never take lessons 12 12.8% 30 20.5% 18 19.8% 1 7.1% 61 17.7%
Total 94 100.0% 146 100.0% 91 100.0% 14 100.0% 345 100.0%
AllKeller Manitou Battle Creek Island Lake

Ramsey County Golf Study Customer Feedback
Sirius Golf Advisors, LLC 116
Getting a recommendation was next most important, with 12.3%. It was highest at Keller (14.7%), followed by Manitou (13%), Island Lake (10.8%) and Battle Creek (9.4%).
Availability was mentioned 11.4% overall, followed by Professionalism of the instructor. The latter was important at Battle Creek (10.8%) and Manitou (9.4%). (It was left off the survey at Keller).
Preferred Tees
As might be expected, the middle or “white” tee was the most popular choice, with just under 40% (39.9%). The response at Goodrich, Manitou and Battle Creek were close to the expected 50% we see nationally. At Keller, though, the response was 12.9%. This is because the white tee at Keller measures just 5,397 yards. The preferred range for men is 6,000 to 6,500 yards, which is the Blue tee at 6,206 yards. Accordingly, it was the most popular at 35.5%. Keller has added two combo tees this year, where the player plays half the holes from one tee, and half from the other. Keller’s blue/white tee mix, which measure 5,757 yards, has 20.4% of the play. Notably, only one player (1.1%) played from the green forward tee at Keller, which measure 4,830 yards. More popular was the green/white combo tee (21.5%), which is 5,133 yards in length. This may be an example of a psychological barrier for women, where the desire may be to have a “5” as the first digit, thinking it is too short if it doesn’t.
We are also surprised by the low percentage of players from the back tee at Keller, which measures just 6,675 yards. Normally, we would expect at least 15% of the play from here. This may indicate that Keller is not attracting the lower-handicap golfer. Which is surprising.
The same is also true at Battle Creek, where the back tee is only getting 2.2% of the responses. Yet it only measures 6,046 yards, which is usually the most popular length by far. This is perhaps the clearest indication that Battle Creek is not attracting the golfers who are most likely to enjoy the course because of
Choose the three factors most important with regards to taking lessons:Price 50 25.4% 76 23.0% 52 23.3% 12 32.4% 190 24.1%
Availability 18 9.1% 34 10.3% 33 14.8% 5 13.5% 90 11.4%
Reputation of course 1 0.3% 1 0.4% 1 2.7% 3 0.4%
Reputation of Instructor 48 24.4% 65 19.7% 43 19.3% 5 13.5% 161 20.5%
Professionalism of Instructor 31 9.4% 24 10.8% 2 5.4% 57 7.2%
Recommendation 29 14.7% 43 13.0% 21 9.4% 4 10.8% 97 12.3%
Lesson packages 16 8.1% 32 9.7% 21 9.4% 2 5.4% 71 9.0%
Quality of facility 17 8.6% 17 5.2% 10 4.5% 1 2.7% 45 5.7%
Qulaity of balls 1 0.5% 7 2.1% 4 1.8% 1 2.7% 13 1.7%
Location 18 9.1% 24 7.3% 14 6.3% 4 10.8% 60 7.6%
Total 197 203.1% 330 227.6% 223 237.2% 37 246.7% 787 171.8%
AllKeller Manitou Battle Creek Island Lake
What tee do you normally play from?Back 8 8.6% 24 24.0% 31 21.4% 2 2.2% 65 15.2%
Blue 33 35.5% 0.0% 0.0% 25 27.5% 58 13.5%
Blue/white 19 20.4% 0.0% 0.0% 0.0% 19 4.4%
White 12 12.9% 52 52.0% 65 44.8% 42 46.2% 171 39.9%
White/green Senior 20 21.5% 14 14.0% 18 12.4% 14 15.4% 66 15.4%
Forward 1 1.1% 10 10.0% 31 21.4% 8 8.8% 50 11.7%
Total 93 100.0% 100 1 145 100.0% 91 100.0% 429 100.0%
AllKeller Goodrich Manitou Battle Creek

Ramsey County Golf Study Customer Feedback
Sirius Golf Advisors, LLC 117
the challenge it represents. And the main reason is the fact it is just nine holes and golfers expect nine-hole courses to be easy.
Mobile Aps This was an open-ended question asking what golf aps they would like the County to offer for that golf course. The most popular responses are given below. Only about 60% of the people taking the survey answered the question.
Mobile Aps Keller Goodrch Manitou Battle Crk All
None 59.6% 54.7% 59.8% 63.3% 59.8%
GPS 19.3% 20.8% 19.6% 22.4% 19.7%
on carts 5.3% 7.5% 1.1% 4.1% 3.9%
already have Yamatrack 6.5% 0.0% 2.3%
Food 7.0% 5.7% 8.7% 4.1% 6.9%
Booking 8.8% 3.8% 3.3% 4.1% 4.6%
Don't care 0.0% 5.7% 0.0% 0.0% 1.2%
By far, the most popular answer was “none.” The second most popular was GPS, with 19.7% of the responses. However, about a fourth of these wanted the GPS to be on the carts, on as an ap. Ordering food appeared on 6.9% of the responses, followed by online booking with 4.6%.
On Line Content There were two questions dealing with on line content. The first was whether the person followed the course on line, and the second was whether the person wanted more content, and if so, what. Both questions were open-ended.
Online Follow Keller Goodrch Manitou Battle Crk All
No 74.1% 79.3% 70.6% 48.7% 66.9%
Yes 2.9% 5.3% 3.0%
Facebook 1.7% 1.7% 10.8% 11.8% 8.2%
Didn’t know 1.7% 0.0% 0.0% 0.0% 0.3%
Email 2.0% 1.0%
Twitter 1.7% 0.0% 0.0% 9.2% 2.6%
men's/women's club 4.9% 6.6% 3.3%
Website 20.7% 12.1% 8.8% 18.4% 14.1%
TOTAL 59.8% 54.2% 70.3% 80.9%
Again, about 60% answered this question. Battle Creek had the best response rate, at 80.9%, followed by Manitou at 70.3%. Keller was at 59.8% and Goodrich at 54.2%. It is likely that those that did not answer the question are less likely to follow online, which is why they skipped the question as it did not apply to them.

Ramsey County Golf Study Customer Feedback
Sirius Golf Advisors, LLC 118
What’s worse is that of those that did respond, the overwhelming majority answered “No.” We feel this may be an indication of the quality of the current websites and social media content. We will be discussing this a lot more in the Marketing section.
Website was the most frequently mentioned on-line source, with 14.1% overall. Keller had the highest rate (20.7%), followed by Battle Creek at 18.4%. Manitou had the lowest at just 8.8%. Facebook was the second most popular, with 8.2%. It was popular at Battle Creek at 11.8% and Manitou with 10.8% but was not at Keller or Goodrich (1.7%). Of course, neither of these courses maintains an active Facebook account.
Many of the people answering positive to the online content, were not actually following the golf course’s content, but that of their league or men’s or women’s club, which seem to be more active on line.
More Content Even fewer answered the question about what additional online content they would like to see. Manitou, with 62.8%, had the highest response rate, followed by Battle Creek at 42.6%. Only 36.4% answered from Goodrich. The most popular answers are given below:
More online content Keller Goodrch Manitou Battle Crk All
No 89.7% 76.9% 79.1% 67.5% 78.6%
Yes 0.0% 7.7% 1.1% 5.0% 2.8%
General Updates 2.6% 2.6% 0.0% 0.0% 0.9%
Deals 2.6% 5.1% 1.1% 2.5% 2.8%
Better website 10.0% 1.9%
Tournament schedules 2.6% 0.0% 5.5% 0.0% 2.8%
Photos 1.1% 2.5% 0.9%
Stories from courses 2.6% 0.0% 0.0% 0.0% 0.5%
Don't care 2.6% 8.8% 0.0% 4.2%
League/Club info/results 0.0% 2.6% 2.2% 2.5% 1.9%
Again, the disdain for online content was notable as 78.6% answered no, they did not want more content, with the next most popular comment (4.2%) was “don’t care.”
These responses are not typical in today’s market. Again, we feel the quality of the current content is largely responsible for the lack of interest.
Human Interest Stories Another open-ended question was whether the rater would like to see more human-interest stories online. This received an underwhelming response, as only 46% of the respondents even answered the question. Of those that did, 70% said “no” and another 4% said they “didn’t care.”

Ramsey County Golf Study Customer Feedback
Sirius Golf Advisors, LLC 119
For the 23% that answered either “yes” or “maybe,” no suggestion received more than two responses.
Marketing Efforts Another open-ended question asked, “What marketing efforts from other courses successfully get you to play there?”
A little over half the respondents answered this question. But 23% of them answered “none.” Price was mentioned by 50% of those answering the question. Battle Creek had the highest percentage (61.8%), while Keller had the lowest (37%). Having a special was the largest vote getter among the answers relating to price. It had 26.9% of the comments. Surprisingly, Goodrich had the lowest at 16.9%. Battle Creek again had the highest at 32.7%, but that was only slightly higher than for Manitou (31.3%).
Having a coupon was next at 9.1%, followed by general price comments (6.3%), Groupon (2.8%), Birthday specials (2%). Surprisingly, Golf Now was mentioned by only 1.6% of the comments.
Discount cards was the only other response category that received at least 5% of the comments, and that just barely (5.1%).
Keller Goodrch Manitou Battle Crk All
No 62.8% 75.5% 75.4% 68.9% 70.8%
Yes 27.9% 16.3% 15.9% 20.0% 19.8%
Maybe 2.3% 4.1% 2.9% 4.4% 3.3%
Don't care 2.3% 4.1% 2.9% 4.4% 3.8%
TOTAL 44.3% 45.8% 47.6% 47.9%
Human interest stories
Keller Goodrch Manitou Battle Crk All
None 19.6% 23.7% 26.5% 23.6% 22.9%
Price 37.0% 45.8% 51.8% 61.8% 50.2%
General 2.2% 6.8% 6.0% 9.1% 6.3%
Specials 26.1% 16.9% 31.3% 32.7% 26.9%
Coupons 6.5% 10.2% 9.6% 5.5% 9.1%
Groupon 0.0% 3.4% 2.4% 5.5% 2.8%
Birthday special 0.0% 7.3% 2.0%
Golf Now 2.2% 1.7% 2.4% 0.0% 1.6%
Pace of Play 6.5% 0.0% 0.0% 0.0% 1.2%
Loyalty program 2.4% 0.0% 0.8%
Teetime availability 6.5% 1.7% 1.2% 0.0% 2.0%
Golf & Food package 6.5% 3.4% 1.2% 1.8% 2.8%
Reputation/word of mouth 4.3% 3.4% 2.4% 1.8% 3.2%
Website 4.3% 0.0% 0.0% 0.0% 0.8%
Discount cards 4.3% 6.8% 6.0% 0.0% 5.1%
TOTAL 47.4% 55.1% 57.2% 58.5%
Marketing Efforts
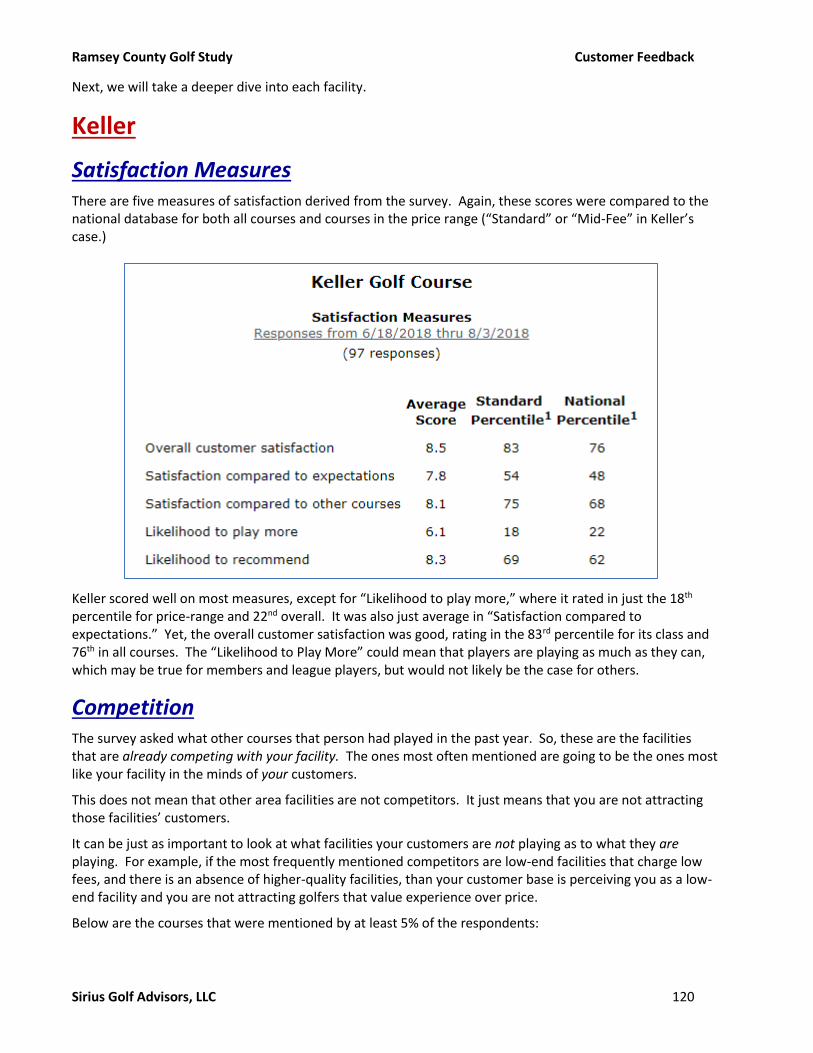
Ramsey County Golf Study Customer Feedback
Sirius Golf Advisors, LLC 120
Next, we will take a deeper dive into each facility.
Keller
Satisfaction Measures There are five measures of satisfaction derived from the survey. Again, these scores were compared to the national database for both all courses and courses in the price range (“Standard” or “Mid-Fee” in Keller’s case.)
Keller scored well on most measures, except for “Likelihood to play more,” where it rated in just the 18th percentile for price-range and 22nd overall. It was also just average in “Satisfaction compared to expectations.” Yet, the overall customer satisfaction was good, rating in the 83rd percentile for its class and 76th in all courses. The “Likelihood to Play More” could mean that players are playing as much as they can, which may be true for members and league players, but would not likely be the case for others.
Competition The survey asked what other courses that person had played in the past year. So, these are the facilities that are already competing with your facility. The ones most often mentioned are going to be the ones most like your facility in the minds of your customers.
This does not mean that other area facilities are not competitors. It just means that you are not attracting those facilities’ customers.
It can be just as important to look at what facilities your customers are not playing as to what they are playing. For example, if the most frequently mentioned competitors are low-end facilities that charge low fees, and there is an absence of higher-quality facilities, than your customer base is perceiving you as a low-end facility and you are not attracting golfers that value experience over price.
Below are the courses that were mentioned by at least 5% of the respondents:
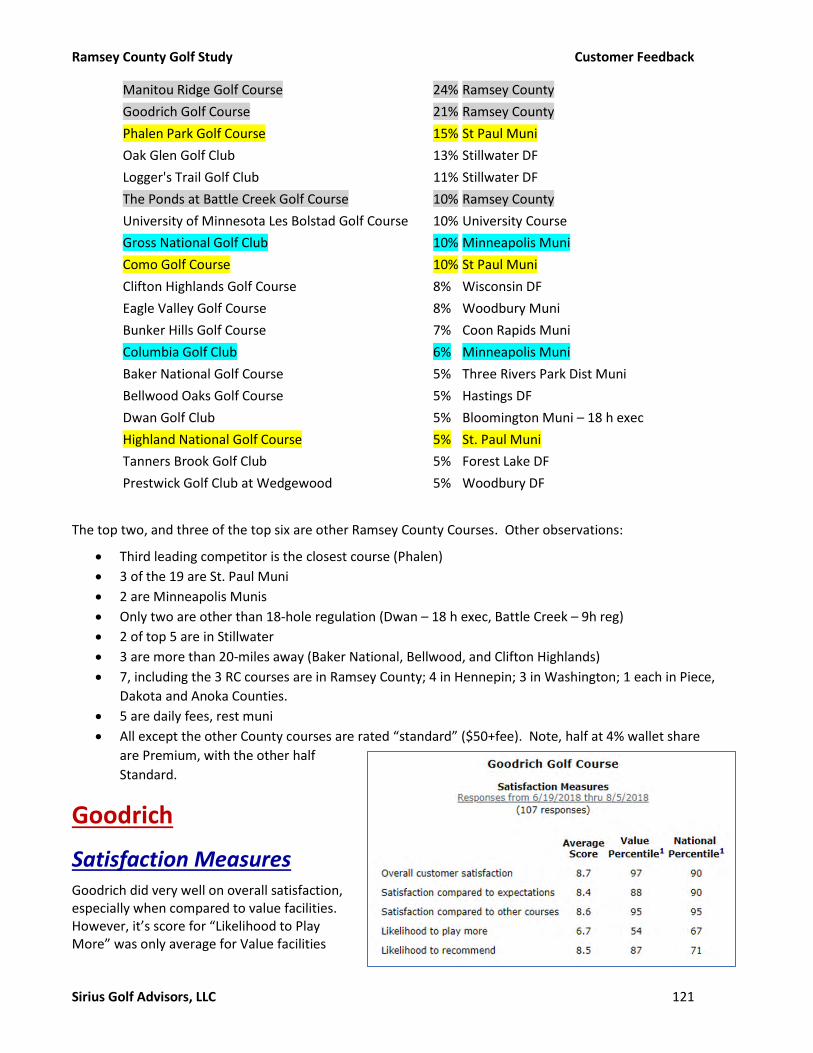
Ramsey County Golf Study Customer Feedback
Sirius Golf Advisors, LLC 121
Manitou Ridge Golf Course 24% Ramsey County
Goodrich Golf Course 21% Ramsey County
Phalen Park Golf Course 15% St Paul Muni
Oak Glen Golf Club 13% Stillwater DF
Logger's Trail Golf Club 11% Stillwater DF
The Ponds at Battle Creek Golf Course 10% Ramsey County
University of Minnesota Les Bolstad Golf Course 10% University Course
Gross National Golf Club 10% Minneapolis Muni
Como Golf Course 10% St Paul Muni
Clifton Highlands Golf Course 8% Wisconsin DF
Eagle Valley Golf Course 8% Woodbury Muni
Bunker Hills Golf Course 7% Coon Rapids Muni
Columbia Golf Club 6% Minneapolis Muni
Baker National Golf Course 5% Three Rivers Park Dist Muni
Bellwood Oaks Golf Course 5% Hastings DF
Dwan Golf Club 5% Bloomington Muni – 18 h exec
Highland National Golf Course 5% St. Paul Muni
Tanners Brook Golf Club 5% Forest Lake DF
Prestwick Golf Club at Wedgewood 5% Woodbury DF
The top two, and three of the top six are other Ramsey County Courses. Other observations:
• Third leading competitor is the closest course (Phalen)
• 3 of the 19 are St. Paul Muni
• 2 are Minneapolis Munis
• Only two are other than 18-hole regulation (Dwan – 18 h exec, Battle Creek – 9h reg)
• 2 of top 5 are in Stillwater
• 3 are more than 20-miles away (Baker National, Bellwood, and Clifton Highlands)
• 7, including the 3 RC courses are in Ramsey County; 4 in Hennepin; 3 in Washington; 1 each in Piece,
Dakota and Anoka Counties.
• 5 are daily fees, rest muni
• All except the other County courses are rated “standard” ($50+fee). Note, half at 4% wallet share
are Premium, with the other half
Standard.
Goodrich
Satisfaction Measures Goodrich did very well on overall satisfaction, especially when compared to value facilities. However, it’s score for “Likelihood to Play More” was only average for Value facilities
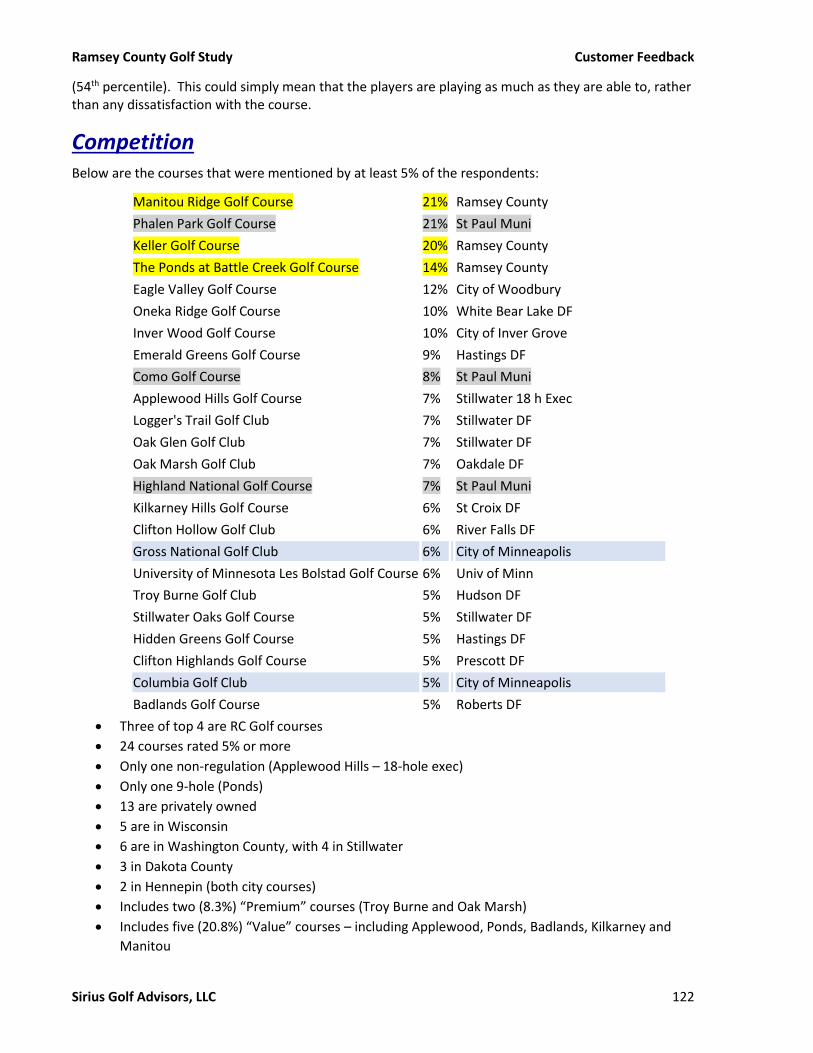
Ramsey County Golf Study Customer Feedback
Sirius Golf Advisors, LLC 122
(54th percentile). This could simply mean that the players are playing as much as they are able to, rather than any dissatisfaction with the course.
Competition Below are the courses that were mentioned by at least 5% of the respondents:
Manitou Ridge Golf Course 21% Ramsey County
Phalen Park Golf Course 21% St Paul Muni
Keller Golf Course 20% Ramsey County
The Ponds at Battle Creek Golf Course 14% Ramsey County
Eagle Valley Golf Course 12% City of Woodbury
Oneka Ridge Golf Course 10% White Bear Lake DF
Inver Wood Golf Course 10% City of Inver Grove
Emerald Greens Golf Course 9% Hastings DF
Como Golf Course 8% St Paul Muni
Applewood Hills Golf Course 7% Stillwater 18 h Exec
Logger's Trail Golf Club 7% Stillwater DF
Oak Glen Golf Club 7% Stillwater DF
Oak Marsh Golf Club 7% Oakdale DF
Highland National Golf Course 7% St Paul Muni
Kilkarney Hills Golf Course 6% St Croix DF
Clifton Hollow Golf Club 6% River Falls DF
Gross National Golf Club 6% City of Minneapolis
University of Minnesota Les Bolstad Golf Course 6% Univ of Minn
Troy Burne Golf Club 5% Hudson DF
Stillwater Oaks Golf Course 5% Stillwater DF
Hidden Greens Golf Course 5% Hastings DF
Clifton Highlands Golf Course 5% Prescott DF
Columbia Golf Club 5% City of Minneapolis
Badlands Golf Course 5% Roberts DF
• Three of top 4 are RC Golf courses
• 24 courses rated 5% or more
• Only one non-regulation (Applewood Hills – 18-hole exec)
• Only one 9-hole (Ponds)
• 13 are privately owned
• 5 are in Wisconsin
• 6 are in Washington County, with 4 in Stillwater
• 3 in Dakota County
• 2 in Hennepin (both city courses)
• Includes two (8.3%) “Premium” courses (Troy Burne and Oak Marsh)
• Includes five (20.8%) “Value” courses – including Applewood, Ponds, Badlands, Kilkarney and
Manitou
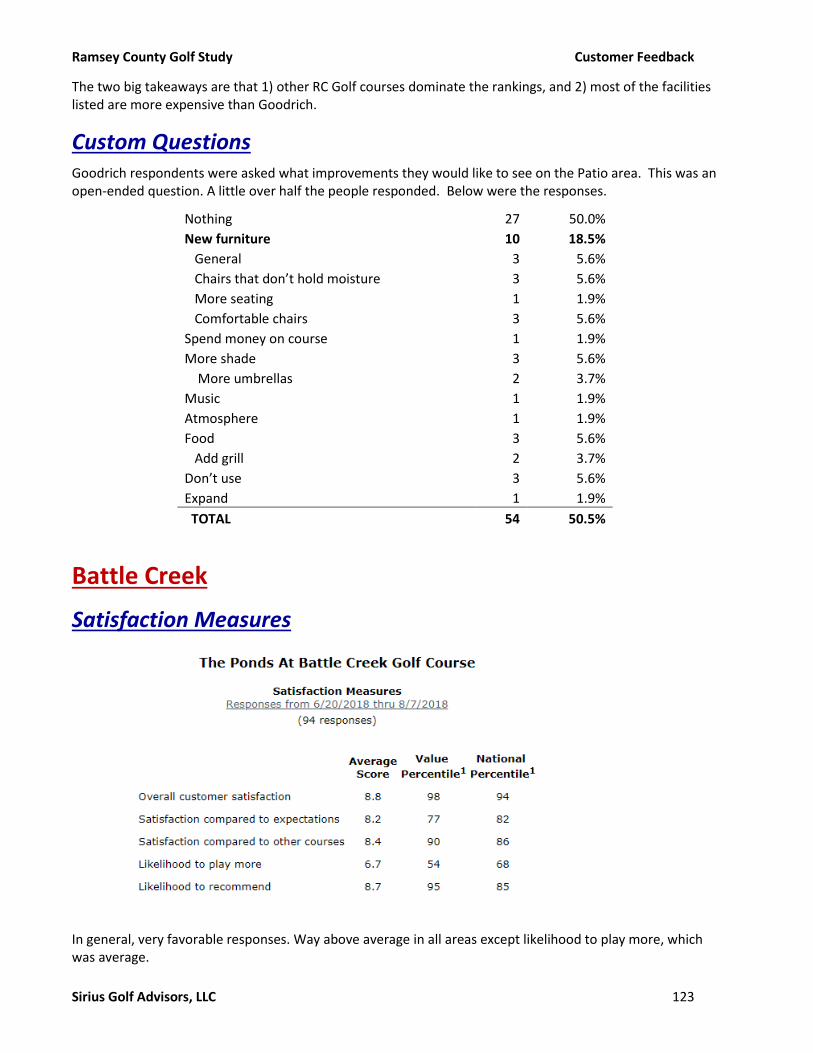
Ramsey County Golf Study Customer Feedback
Sirius Golf Advisors, LLC 123
The two big takeaways are that 1) other RC Golf courses dominate the rankings, and 2) most of the facilities listed are more expensive than Goodrich.
Custom Questions Goodrich respondents were asked what improvements they would like to see on the Patio area. This was an open-ended question. A little over half the people responded. Below were the responses.
Nothing 27 50.0%
New furniture 10 18.5%
General 3 5.6%
Chairs that don’t hold moisture 3 5.6%
More seating 1 1.9%
Comfortable chairs 3 5.6%
Spend money on course 1 1.9%
More shade 3 5.6%
More umbrellas 2 3.7%
Music 1 1.9%
Atmosphere 1 1.9%
Food 3 5.6%
Add grill 2 3.7%
Don’t use 3 5.6%
Expand 1 1.9%
TOTAL 54 50.5%
Battle Creek
Satisfaction Measures
In general, very favorable responses. Way above average in all areas except likelihood to play more, which was average.

Ramsey County Golf Study Customer Feedback
Sirius Golf Advisors, LLC 124
Competition The top competitors were:
• Three of the top four are RC Golf Courses.
• None are 9-hole courses (although Highland Park was mentioned on 2% of the surveys)
• One (Applewood Hills) is an 18-hole executive course. It is also the only non-regulation course.
• None of the courses are Value. Two are Premium (Prestwick and St. Croix).
• 11 (52%) are municipal
• 1/3rd are in Ramsey County
• Six (28.6%) are in Washington County
Custom Questions
Patio Area Battle Creek customers were asked what improvements they would like to see for the Patio area. 45 (47.9%) responded. Below is a summary:
Nothing 19 42.2%
New furniture 0.0%
More seating 2 4.4%
More shade 4 8.9%
More umbrellas 3 6.7%
Music 1 2.2%
More flowers 2 4.4%
Not sure 1 2.2%
Nonsmoking 1 2.2%
Add firepit 1 2.2%
Bug zapper 1 2.2%
Patio heaters 1 2.2%
Food 3 6.7%
Add grill 3 6.7%
Don’t use 2 4.4%
Expand 1 2.2%
TOTAL 45 47.9%
Goodrich Golf Course 29%
Keller Golf Course 16%
Eagle Valley Golf Course 16%
Manitou Ridge Golf Course 12%
Oak Marsh Golf Club 12%
Inver Wood Golf Course 11%
University of Minnesota Les Bolstad Golf Course 8%
Phalen Park Golf Course 6%
Chomonix Golf Course 6%
Applewood Hills Golf Course 6%
Cannon Golf Club, Inc. 5%
Clifton Highlands Golf Course 5%
Logger's Trail Golf Club 5%
Prestwick Golf Club at Wedgewood 5%
River Oaks Municipal Golf Course 4%
St. Croix National Golf Course 4%
Clifton Hollow Golf Club 4%
Como Golf Course 4%
Emerald Greens Golf Course 4%
Gross National Golf Club 4%
Hiawatha Golf Course 4%
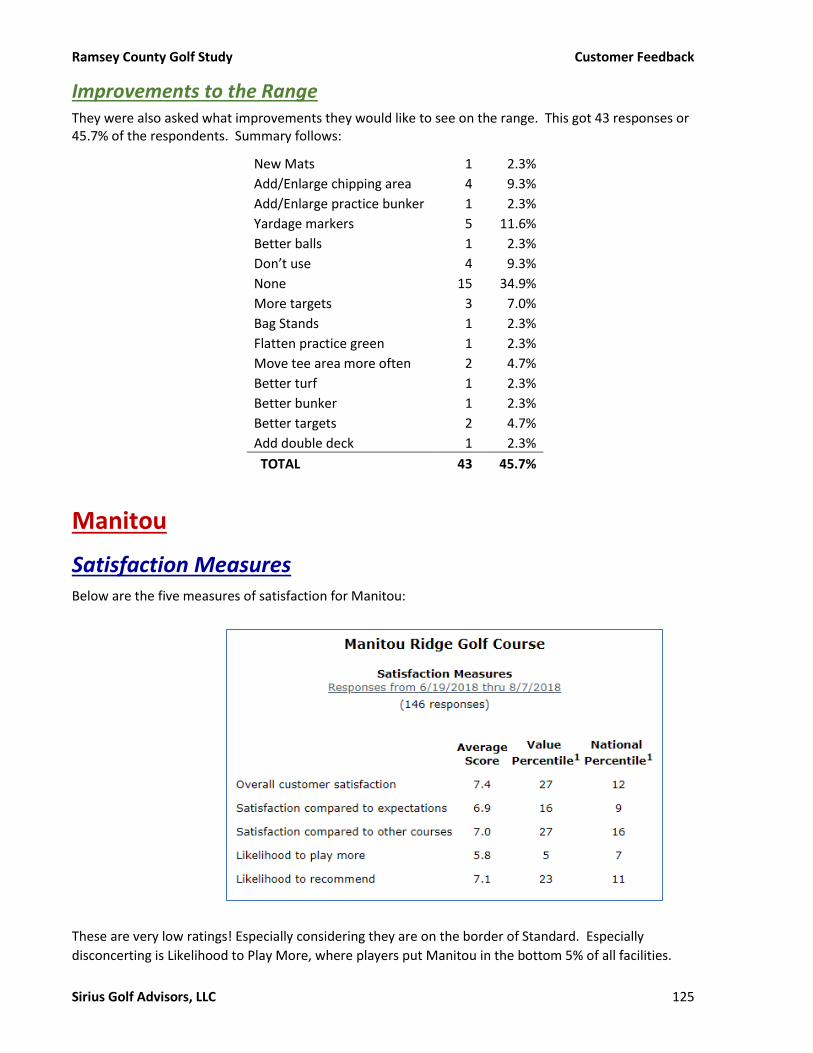
Ramsey County Golf Study Customer Feedback
Sirius Golf Advisors, LLC 125
Improvements to the Range They were also asked what improvements they would like to see on the range. This got 43 responses or 45.7% of the respondents. Summary follows:
New Mats 1 2.3%
Add/Enlarge chipping area 4 9.3%
Add/Enlarge practice bunker 1 2.3%
Yardage markers 5 11.6%
Better balls 1 2.3%
Don’t use 4 9.3%
None 15 34.9%
More targets 3 7.0%
Bag Stands 1 2.3%
Flatten practice green 1 2.3%
Move tee area more often 2 4.7%
Better turf 1 2.3%
Better bunker 1 2.3%
Better targets 2 4.7%
Add double deck 1 2.3%
TOTAL 43 45.7%
Manitou
Satisfaction Measures Below are the five measures of satisfaction for Manitou:
These are very low ratings! Especially considering they are on the border of Standard. Especially
disconcerting is Likelihood to Play More, where players put Manitou in the bottom 5% of all facilities.
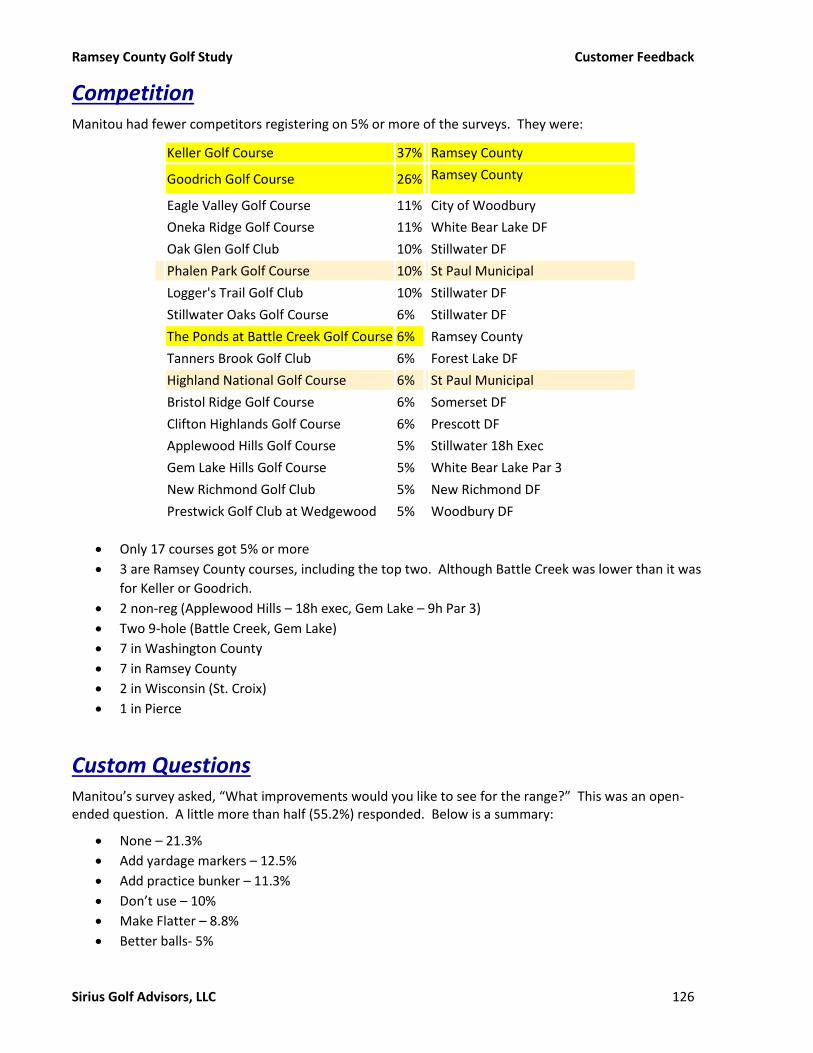
Ramsey County Golf Study Customer Feedback
Sirius Golf Advisors, LLC 126
Competition Manitou had fewer competitors registering on 5% or more of the surveys. They were:
Keller Golf Course 37% Ramsey County
Goodrich Golf Course 26% Ramsey County
Eagle Valley Golf Course 11% City of Woodbury
Oneka Ridge Golf Course 11% White Bear Lake DF
Oak Glen Golf Club 10% Stillwater DF
Phalen Park Golf Course 10% St Paul Municipal
Logger's Trail Golf Club 10% Stillwater DF
Stillwater Oaks Golf Course 6% Stillwater DF
The Ponds at Battle Creek Golf Course 6% Ramsey County
Tanners Brook Golf Club 6% Forest Lake DF
Highland National Golf Course 6% St Paul Municipal
Bristol Ridge Golf Course 6% Somerset DF
Clifton Highlands Golf Course 6% Prescott DF
Applewood Hills Golf Course 5% Stillwater 18h Exec
Gem Lake Hills Golf Course 5% White Bear Lake Par 3
New Richmond Golf Club 5% New Richmond DF
Prestwick Golf Club at Wedgewood 5% Woodbury DF
• Only 17 courses got 5% or more
• 3 are Ramsey County courses, including the top two. Although Battle Creek was lower than it was
for Keller or Goodrich.
• 2 non-reg (Applewood Hills – 18h exec, Gem Lake – 9h Par 3)
• Two 9-hole (Battle Creek, Gem Lake)
• 7 in Washington County
• 7 in Ramsey County
• 2 in Wisconsin (St. Croix)
• 1 in Pierce
Custom Questions Manitou’s survey asked, “What improvements would you like to see for the range?” This was an open-ended question. A little more than half (55.2%) responded. Below is a summary:
• None – 21.3%
• Add yardage markers – 12.5%
• Add practice bunker – 11.3%
• Don’t use – 10%
• Make Flatter – 8.8%
• Better balls- 5%

Ramsey County Golf Study Customer Feedback
Sirius Golf Advisors, LLC 127
• Larger area – 3.8%
• Improve range tee – 3.8%
• Complete renovation – 3.8%
Golf Dome The Golf Dome survey was done using Survey Monkey. There were not enough responses to be considered significant. Below is a summary of the questions and responses.
What is needed to get a “9” or “10”?
Only two things got more than one vote:
• Better Balls
• Better Mats
How many times have you used the Midwest (Goodrich) Golf Dome in the last 12 months?
• Once: 3
• Two to Five: 7
• Six to 10: 3
• 11-15: 2
• More than 15: 2
Do you play Golf at Goodrich?
• Almost Always: 3
• Usually: 1
• Sometimes: 4
• Rarely: 4
• Never: 5
What Facilities do you use at Midwest Golf Dome?
• Only the miniature golf: 1
• Only the range: 11
• Both the range and chipping area: 5
How do you rate the quality of the miniature golf?
• 4 responses. Avg 4.25
How do you rate the quality of the driving range?
• 16 responses, avg 7.5
o 8 were 9 or 10
o 3 were 5 or worse
Satisfaction with:
• Condition of miniature golf course
o 4 responses, avg 4.25
• Condition of range mats
o 15 responses, avg 6.33
• Amenities
o 13 responses, avg 5.54
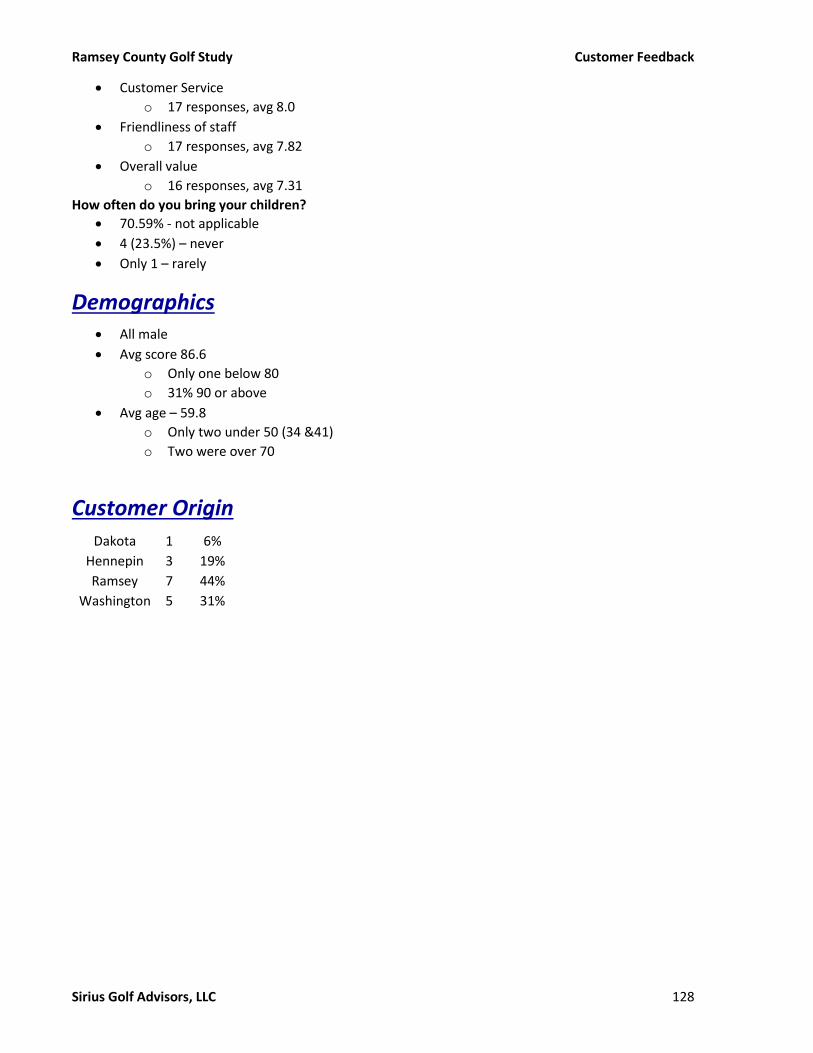
Ramsey County Golf Study Customer Feedback
Sirius Golf Advisors, LLC 128
• Customer Service
o 17 responses, avg 8.0
• Friendliness of staff
o 17 responses, avg 7.82
• Overall value
o 16 responses, avg 7.31
How often do you bring your children?
• 70.59% - not applicable
• 4 (23.5%) – never
• Only 1 – rarely
Demographics • All male
• Avg score 86.6
o Only one below 80
o 31% 90 or above
• Avg age – 59.8
o Only two under 50 (34 &41)
o Two were over 70
Customer Origin
Dakota 1 6%
Hennepin 3 19%
Ramsey 7 44%
Washington 5 31%

Ramsey County Golf Study Agronomic Practices
Sirius Golf Advisors, LLC 129
General Findings All five courses in the Ramsey County system present as well maintained compared to courses of similar stature in the MSP marketplace.
The most consistent potential problem seems to be shallow roots throughout most courses, which might have been a function of visiting early in the year and during a wet period. A slow transition to deep watering less frequently would encourage deeper rooting, as would aerification of tees and fairways. Implementing a higher fertility program also helps roots.
Some common problems are:
1. High pH in irrigation water, which slowly causes problems and should be monitored.
2. Shallow roots throughout most courses, which might have been a function of visiting early in the year
and during a wet period. Cures to encourage deeper rooting include:
a. A slow transition to deep watering, with fewer watering cycles
b. More Frequent Aerification of tees and fairways.
c. Implementing a higher fertility program also helps roots deepen.
3. To differing degrees, golfers complain about high roughs. Lower cutting height, implementation of
“intermediate rough” to reduce penalty on just missed fairways, helps.
4. Tree Trimming and Health – Golfers complain about all the evergreens (and some deciduous) trees
with low branches which causes lost golf balls. Removing limbs up to 3 feet off ground reduces the
number of lost balls. Limbs need to be removed to improve pace of play and improve golfer
satisfaction and aesthetics. Removing them to head height assists in mowing around the trees,
reducing labor costs.
Keller Golf Course - Existing Jeff Brauer toured Keller Golf Course on June 13-14. We met with the superintendent, who supplied most of this information.
Greens These leave a good impression. They are 5 year old USGA Greens, with Plaisteads Mix 85-15%, a long standard mix in the area. They are cut at 0.125”, which is standard, and roll about 9-9.5 on the stimpmeter, also a good range for public courses.
▪ Roll / Firmness / Turf Quality - is good. Thatch is minimal, expected on new greens.
▪ Size / Pin Locations Levelness / - There are some difficult pins on 11 and 17
Cultural
▪ Topdressing – Regular with straight sand
▪ Fertility –
- 2.5 lbs. of N every year, most foliar, some granules
- Low Phosphorus

Ramsey County Golf Study Agronomic Practices
Sirius Golf Advisors, LLC 130
▪ Aerify 2X annually
▪ Spray Program –Implements a regular spray program (typical of older superintendents, while younger ones take a more “as needed, higher threshold” approach to reduce chemical use to be the most environmentally conscious.
▪ Typical green issues include, Take All Patch, Snow Mold and dry spots on knobs, where he uses a wetting agent to help hold water.
He reports that there were some initial turf struggles in grow in 2013-4, which is not unusual when converting to sand greens.
Collars
▪ Good, no drainage blocks
▪ Height of Cut (HOC) – 0.375”
▪ Width – 4 feet
▪ Condition - Good,
▪ Cause drain blocking - None
Tees These also leave a good impression. They are level and have a 4” Sand Cap using old Green Mix, which provides a good growing medium. We did note well-worn areas where the tee markers were located, possibly indicating that the markers are not being moved enough to spread wear across the entire tee.
• Turf Type – Bent with poa infestation, which is common
• HOC – 0.3800” which is acceptable
• Levelness / Turf Quality / Weeds- A few weeds
• Construction – 4” Sand Cap using old Green Mix
• Size – Average – 5,468 S.F. Average
Cultural • Topdressing – Regular with straight sand
• Fertility
o 3.0 lbs. of Nitrogen every year, most foliar, some granules
o Low Phosphorus
• Aerify 2X annually with deep tine, cored once annually or as needed
• Thatch -Not much
• Spray Program –
o Regular Spraying, Curative
o Typical issues, Take All Patch, Snow Mold
Problems
• Hole 4 is far too small, but with little room to expand.
• Hole 6 is well sized.
Ramsey County Golf Study Agronomic Practices
Sirius Golf Advisors, LLC 131
• 13 has good size, with too little distance variation, and perhaps some of the tee used too little because trees block the direct line of play. Probably not worth investing in expansion.
• 15 is just under our size recommendations, (about 6600 S.F. on main tee vs. 7500 S.F. for par 3, bent grass tees) but probably adequate with good cultural practices.
Bunkers Bunkers are new, built without liners, owing to initial budget. Liners and more drainage are recommended, as is an upgrade from buff to white sand.
• Sand Quality/Color/Depth-Use Plaisteads Pro Crush Bunker Sand (buff)
• Drainage –Could be improved with liners, more tile
• Edging- Better than other courses, but could be crisper
• Sand Depth / Eroding - Generally good.
Fairways • Soils – Native Soils, depth not always enough
• Drainage – Generally good. Lower areas on fairways need larger catch basins on holes 3, 5, 12, 16,
• Turf Type - Bent
• Color and density of the turf – good
• Weed pressure – Good
Cultural • Fertility –
o 2.0 lbs. of N every month, granules
o Low Phosphorus
• Aerify- 2X annually with deep tine, cored once annually or as needed
• Thatch -Not much
• Spray Program –
o Regular Preventative
o Typical issues, Take All Patch, Snow Mold
Rough • Drainage – Good
• Turf Type – Blue, Rye. Aerify and fill with seed every fall
• Color and density of the turf – Good
• Weed pressure – Some, spray for broadleaf as required.
Trees • Shade affecting turf – will be noted in design report
• Root systems of trees affecting turf – Some noted in various areas
Ramsey County Golf Study Agronomic Practices
Sirius Golf Advisors, LLC 132
Equipment • Equipment List – Satisfactory
• Overall Quality – Generally good since switch to pool supply
• Preventative Maintenance Program – has mechanic, regular maintenance
• Shared Equipment – None
Most Needed • Most Needed – Hydraulic Dump, Material Handler, some equipment is older
Staff • In season- 20, with 14 seasonal labor. Some retires, some students. Some come from Ramsey
County Pool, limited to six months total time
• Off Season-6
• Assistants-1
• Mechanic-1
• Difficulty in finding help- Has increased as economy improves
• Staff training – Programs in place for equipment, safety and fungicide and herbicide application
Relationship with the golf shop staff • Good communications about events and issues. Hold regular weekly meetings- Yes
Budgets • Total - $745,000, a slight reduction from 2017. About typical for quality courses in the MSP market,
and adequate, and apparently, well spent
Superintendent Qualifications • History/Training – He has 36 years’ experience, being hired right out of college at Keller and is Class
A / Certified. He was on site during the 2013 renovation
Manitou Ridge Golf Course Jeff Brauer, Erik Christiansen and John Wait visited Manitou Ridge on Monday morning, June 11. We met with the operator/superintendent while Erik toured the course with a member of the maintenance staff. We took several soil probes at greens, tees and fairways.
History Manitou Ridge opened in 1928, possibly as a private club that was converted to public in the depression. It was designed by Vincent Feehan, who designed about a half dozen courses in that period, but was mostly a landscape architect, with some distinctive design credits (many for U of Minnesota) in that era.
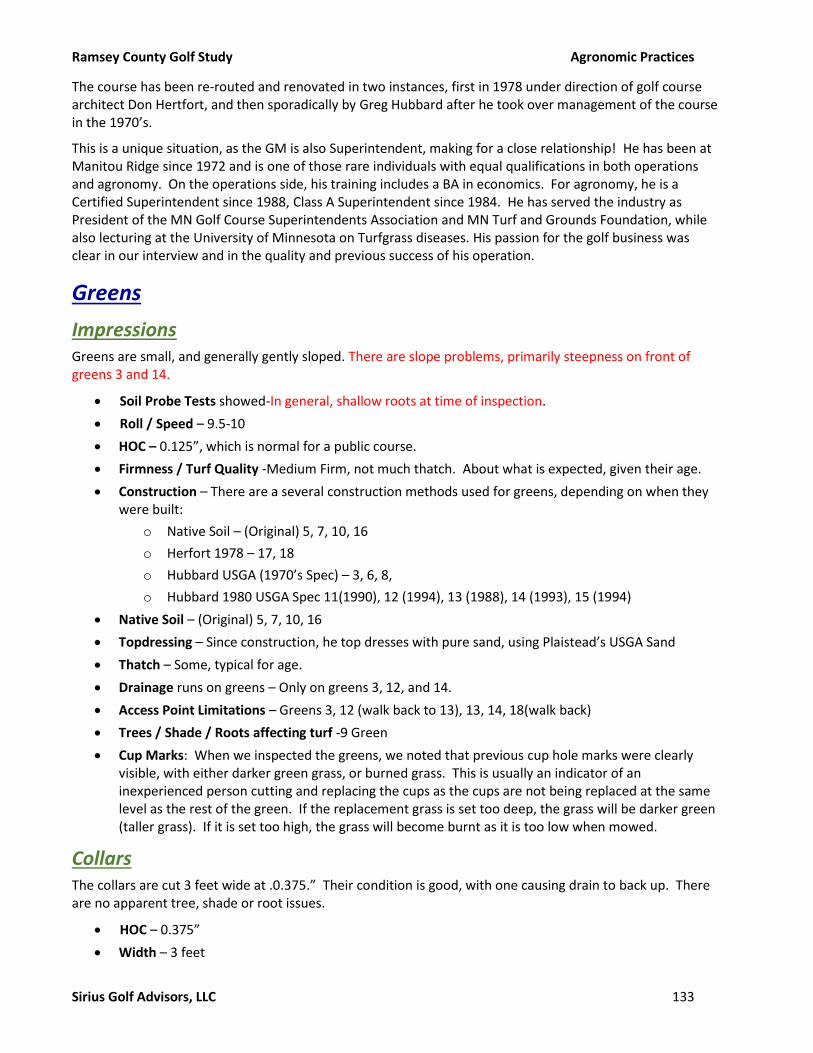
Ramsey County Golf Study Agronomic Practices
Sirius Golf Advisors, LLC 133
The course has been re-routed and renovated in two instances, first in 1978 under direction of golf course architect Don Hertfort, and then sporadically by Greg Hubbard after he took over management of the course in the 1970’s.
This is a unique situation, as the GM is also Superintendent, making for a close relationship! He has been at Manitou Ridge since 1972 and is one of those rare individuals with equal qualifications in both operations and agronomy. On the operations side, his training includes a BA in economics. For agronomy, he is a Certified Superintendent since 1988, Class A Superintendent since 1984. He has served the industry as President of the MN Golf Course Superintendents Association and MN Turf and Grounds Foundation, while also lecturing at the University of Minnesota on Turfgrass diseases. His passion for the golf business was clear in our interview and in the quality and previous success of his operation.
Greens
Impressions Greens are small, and generally gently sloped. There are slope problems, primarily steepness on front of greens 3 and 14.
• Soil Probe Tests showed-In general, shallow roots at time of inspection.
• Roll / Speed – 9.5-10
• HOC – 0.125”, which is normal for a public course.
• Firmness / Turf Quality -Medium Firm, not much thatch. About what is expected, given their age.
• Construction – There are a several construction methods used for greens, depending on when they were built:
o Native Soil – (Original) 5, 7, 10, 16
o Herfort 1978 – 17, 18
o Hubbard USGA (1970’s Spec) – 3, 6, 8,
o Hubbard 1980 USGA Spec 11(1990), 12 (1994), 13 (1988), 14 (1993), 15 (1994)
• Native Soil – (Original) 5, 7, 10, 16
• Topdressing – Since construction, he top dresses with pure sand, using Plaistead’s USGA Sand
• Thatch – Some, typical for age.
• Drainage runs on greens – Only on greens 3, 12, and 14.
• Access Point Limitations – Greens 3, 12 (walk back to 13), 13, 14, 18(walk back)
• Trees / Shade / Roots affecting turf -9 Green
• Cup Marks: When we inspected the greens, we noted that previous cup hole marks were clearly visible, with either darker green grass, or burned grass. This is usually an indicator of an inexperienced person cutting and replacing the cups as the cups are not being replaced at the same level as the rest of the green. If the replacement grass is set too deep, the grass will be darker green (taller grass). If it is set too high, the grass will become burnt as it is too low when mowed.
Collars The collars are cut 3 feet wide at .0.375.” Their condition is good, with one causing drain to back up. There are no apparent tree, shade or root issues.
• HOC – 0.375”
• Width – 3 feet
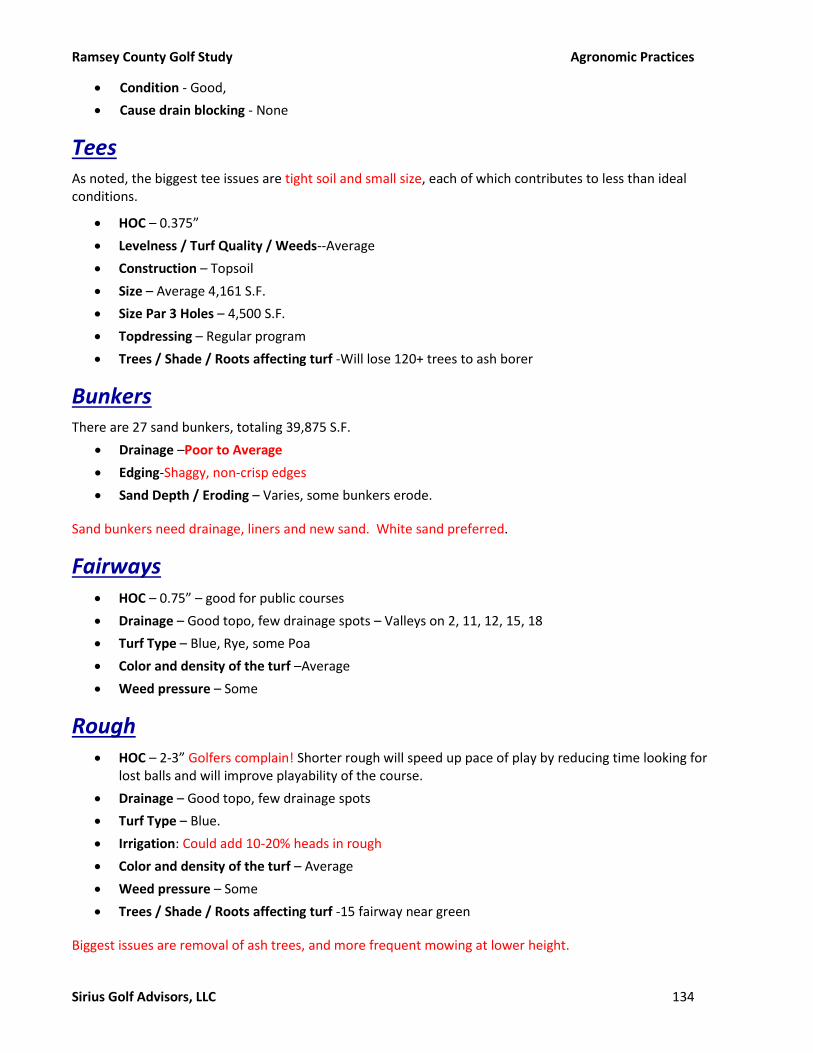
Ramsey County Golf Study Agronomic Practices
Sirius Golf Advisors, LLC 134
• Condition - Good,
• Cause drain blocking - None
Tees As noted, the biggest tee issues are tight soil and small size, each of which contributes to less than ideal conditions.
• HOC – 0.375”
• Levelness / Turf Quality / Weeds--Average
• Construction – Topsoil
• Size – Average 4,161 S.F.
• Size Par 3 Holes – 4,500 S.F.
• Topdressing – Regular program
• Trees / Shade / Roots affecting turf -Will lose 120+ trees to ash borer
Bunkers There are 27 sand bunkers, totaling 39,875 S.F.
• Drainage –Poor to Average
• Edging-Shaggy, non-crisp edges
• Sand Depth / Eroding – Varies, some bunkers erode.
Sand bunkers need drainage, liners and new sand. White sand preferred.
Fairways • HOC – 0.75” – good for public courses
• Drainage – Good topo, few drainage spots – Valleys on 2, 11, 12, 15, 18
• Turf Type – Blue, Rye, some Poa
• Color and density of the turf –Average
• Weed pressure – Some
Rough • HOC – 2-3” Golfers complain! Shorter rough will speed up pace of play by reducing time looking for
lost balls and will improve playability of the course.
• Drainage – Good topo, few drainage spots
• Turf Type – Blue.
• Irrigation: Could add 10-20% heads in rough
• Color and density of the turf – Average
• Weed pressure – Some
• Trees / Shade / Roots affecting turf -15 fairway near green
Biggest issues are removal of ash trees, and more frequent mowing at lower height.

Ramsey County Golf Study Agronomic Practices
Sirius Golf Advisors, LLC 135
Practice Areas
Tees • Size – Too small
• Construction – Topsoil, some topdressing
• Condition – Generally worn
• Landing Zone- Too short, no target greens, some flat areas drain slowly
• Putting Green – Should be bigger
Safety
• Safety issues on both sides, Interstate left, parking lot right. Having to use limited flight balls, which are not popular with the golfers. It will require repositioning the range to solve the safety issues. Larger tee would also help.
Equipment • Equipment List – Not submitted
• Overall Quality – Generally good, some older.
• Most Needed – Needs new Rough Mower @ $35,000 to mow more often. Should start inventory to detail equipment replacement plan.
• Preventative Maintenance Program –yes, superintendent is old school!
• Shared Equipment - None
Cultural Practices • Aerification frequency 1x annually in fall, verti-drains more
• Topdressing - Yes
• Vertical-cutting. - Yes
• Fertility programs – Some granular, some foliar. As needed
• Weed control program – has cut chemical use, has IPM plan. Was a traditional preventative spray program –yes, superintendent is old school, but is changing
Staff • In season- 4 full time, 6 part time
• Off Season-4 full time
• Assistants - 1
• Mechanics-1
• Difficulty in finding help – There is some difficult in finding help. Could use more staff.
• Staff training is in place for equipment, safety and spray application.
Relationship with the golf shop staff – • Good, GM is also Superintendent!

Ramsey County Golf Study Agronomic Practices
Sirius Golf Advisors, LLC 136
Budgets The operator/superintendent reports his maintenance budget is $353,000, with the breakdown shown in the table to the right. This approaches 50-60% of typical area maintenance budgets and cannot be considered totally adequate. He reports “shorting” landscape and the range as a means of coping.
The main area that is seems light in is in fertilizer and chemicals. It also has little expense for equipment, presumably because the equipment is paid for. However, allowing for equipment replacement would add about $80,000 to $100,000/year to the budget.
Still, Manitou can produce comparable results to what is seen at Goodrich, for ½ the cost. We will discuss this more in our Discussion section.
Goodrich Golf Course Jeff Brauer, Erik Christiansen and John Wait visited Goodrich Golf Course on the week of June 10. We met with the GM and Superintendent at the course. Erik toured the course separately.
Course History Designed by Paul Coates, (same as Keller but decades apart near end of his career, 1955-61, not all built to his design. The routing has changed as south side converted to park at some point. Maplewood Park next door has a park master plan.) Some would like to close Goodrich to expand the park.
A review of HistoricAerials.com shows the land was originally a farm field, with low spots and large drain fields running through what is now the southeast portion of the course, including the lake on hole no. 1. The original course included holes 1 (as a par 3) 10, 12, 13, and 18. The course started with no sand bunkers. No clubhouse is present until about 1980.
The current routing fully evolved by 1991. Golfers complain about the back to back par 3 holes at 16-17 owing to re-routing. Other problems include the walk back to 12 tee from 11 green, 1 green being too close to 2 tee and the 10th hole being too close to the road.
The course is short and fun to play, almost perfect for C and D players and beginning golfers. It has a pleasant ambiance. The nines were reversed in 2015, concurrent with the arrival of GM/PGA professional Brad Behnke. Upon Brad’s arrival, golfers noticed upgraded service, and reduced complaints.
Goodrich currently plays 31,000 rounds and maintains a pace of play of 4 to 4.25 hours.
Greens • Soil Probe Tests – Soil probes showed shallow roots at time of inspection
• Roll / Speed – 9 Max, somewhat bumpy
• Firmness / Turf Quality -Medium Firm, some thatch, average quality
• Size / Pin Locations- Small greens, limited pin spots
o Total size: Greens (includes PG@5,916) 58,460 S.F., as measured by aerial photos. This is less than reported by the superintendent, and might result from his inclusion of the collar, slight grow in since his last measurements, and of course, minor scale variations on the
Manitou
Labor $259,927
Benefits $10,000
Fertilizer $9,457
Chemicals $21,045
Seed/sand $3,507
Fuel/supplies $14,389
Repairs $24,072
Equip lease $7,385
Dues $2,237
Education $593
Total $352,612
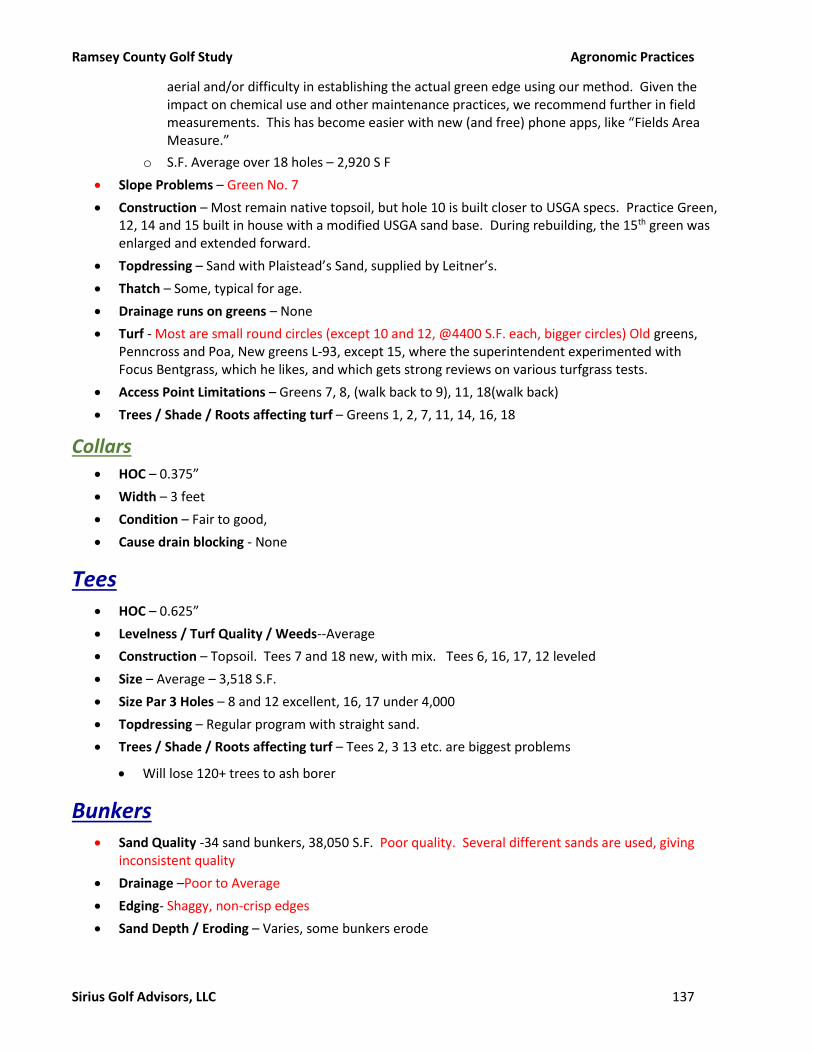
Ramsey County Golf Study Agronomic Practices
Sirius Golf Advisors, LLC 137
aerial and/or difficulty in establishing the actual green edge using our method. Given the impact on chemical use and other maintenance practices, we recommend further in field measurements. This has become easier with new (and free) phone apps, like “Fields Area Measure.”
o S.F. Average over 18 holes – 2,920 S F
• Slope Problems – Green No. 7
• Construction – Most remain native topsoil, but hole 10 is built closer to USGA specs. Practice Green, 12, 14 and 15 built in house with a modified USGA sand base. During rebuilding, the 15th green was enlarged and extended forward.
• Topdressing – Sand with Plaistead’s Sand, supplied by Leitner’s.
• Thatch – Some, typical for age.
• Drainage runs on greens – None
• Turf - Most are small round circles (except 10 and 12, @4400 S.F. each, bigger circles) Old greens, Penncross and Poa, New greens L-93, except 15, where the superintendent experimented with Focus Bentgrass, which he likes, and which gets strong reviews on various turfgrass tests.
• Access Point Limitations – Greens 7, 8, (walk back to 9), 11, 18(walk back)
• Trees / Shade / Roots affecting turf – Greens 1, 2, 7, 11, 14, 16, 18
Collars • HOC – 0.375”
• Width – 3 feet
• Condition – Fair to good,
• Cause drain blocking - None
Tees • HOC – 0.625”
• Levelness / Turf Quality / Weeds--Average
• Construction – Topsoil. Tees 7 and 18 new, with mix. Tees 6, 16, 17, 12 leveled
• Size – Average – 3,518 S.F.
• Size Par 3 Holes – 8 and 12 excellent, 16, 17 under 4,000
• Topdressing – Regular program with straight sand.
• Trees / Shade / Roots affecting turf – Tees 2, 3 13 etc. are biggest problems
• Will lose 120+ trees to ash borer
Bunkers • Sand Quality -34 sand bunkers, 38,050 S.F. Poor quality. Several different sands are used, giving
inconsistent quality
• Drainage –Poor to Average
• Edging- Shaggy, non-crisp edges
• Sand Depth / Eroding – Varies, some bunkers erode
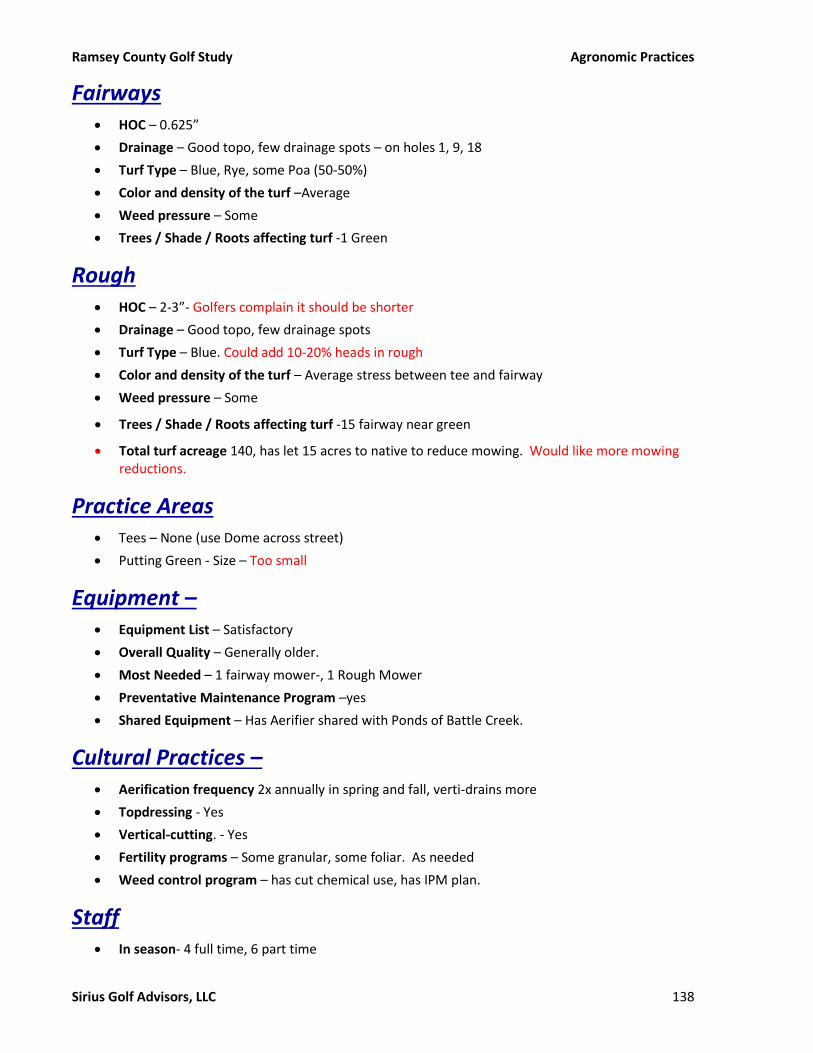
Ramsey County Golf Study Agronomic Practices
Sirius Golf Advisors, LLC 138
Fairways • HOC – 0.625”
• Drainage – Good topo, few drainage spots – on holes 1, 9, 18
• Turf Type – Blue, Rye, some Poa (50-50%)
• Color and density of the turf –Average
• Weed pressure – Some
• Trees / Shade / Roots affecting turf -1 Green
Rough • HOC – 2-3”- Golfers complain it should be shorter
• Drainage – Good topo, few drainage spots
• Turf Type – Blue. Could add 10-20% heads in rough
• Color and density of the turf – Average stress between tee and fairway
• Weed pressure – Some
• Trees / Shade / Roots affecting turf -15 fairway near green
• Total turf acreage 140, has let 15 acres to native to reduce mowing. Would like more mowing reductions.
Practice Areas • Tees – None (use Dome across street)
• Putting Green - Size – Too small
Equipment – • Equipment List – Satisfactory
• Overall Quality – Generally older.
• Most Needed – 1 fairway mower-, 1 Rough Mower
• Preventative Maintenance Program –yes
• Shared Equipment – Has Aerifier shared with Ponds of Battle Creek.
Cultural Practices – • Aerification frequency 2x annually in spring and fall, verti-drains more
• Topdressing - Yes
• Vertical-cutting. - Yes
• Fertility programs – Some granular, some foliar. As needed
• Weed control program – has cut chemical use, has IPM plan.
Staff • In season- 4 full time, 6 part time

Ramsey County Golf Study Agronomic Practices
Sirius Golf Advisors, LLC 139
• Off Season-4 full time
• Assistants - 1
• Mechanics-1
• Difficulty in finding help – Some staff must leave for hockey rinks
• Staff training in place for equipment, safety, fungicide and herbicides.
Relationship with the golf shop staff • Good ties between Brad and Charlie
Budgets • - $537,134
Superintendent Qualifications – • He learned the craft as an apprentice at local clubs. His only responsibility is Goodrich Golf Course.
Been here about 12 years.
Ponds at Battle Lake Golf Course
Course Description One of the best nine-hole courses I have seen, designed by Garret Gill/Paul Miller and opened in 2004, the course has a modern feel and nice amenities.
Problems include the course being too difficult in general, and possibly especially for the typical nine-hole target market, but golfers give the course high ratings for aesthetics. It was obviously a difficult site, with many ponds and wetlands that couldn’t be touched affecting playability.
Play Levels • 15-19,000 annual rounds. It tends to fill up after other, 18-hole courses
• Female play slightly higher than other courses (Probably due to 1773 Yards forward tees). The range is always busy, and the parking lot is often too small.
Routing Issues • Main issues are difficulty of course, much too hard for a nine-hole course, given the number of
forced carries required by natural ponds that couldn’t be altered.
• Circulation is good.
Feature Design As a modern 2003 design, golfers appreciate the general look and feel of the golf features, other than the forced carries previously noted.
Greens and tees are of adequate size for play and maintenance and there are few shade issues (although the Cottonwoods near 3 Tee do shade those.
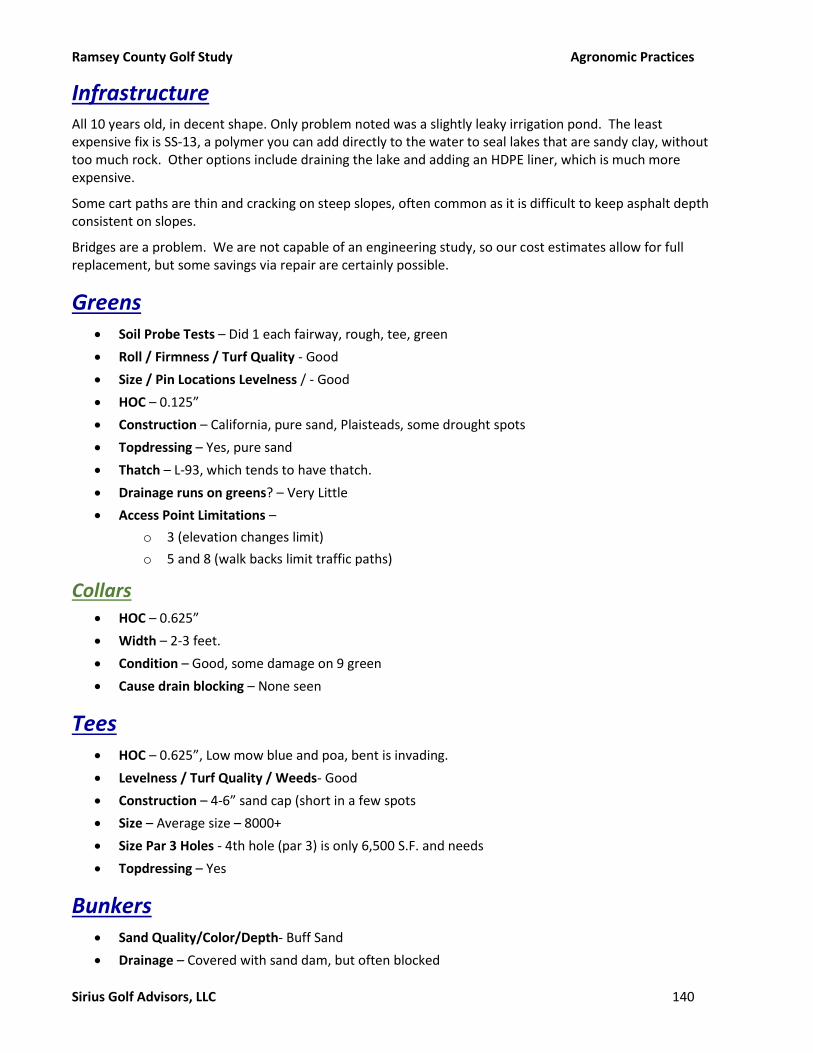
Ramsey County Golf Study Agronomic Practices
Sirius Golf Advisors, LLC 140
Infrastructure All 10 years old, in decent shape. Only problem noted was a slightly leaky irrigation pond. The least expensive fix is SS-13, a polymer you can add directly to the water to seal lakes that are sandy clay, without too much rock. Other options include draining the lake and adding an HDPE liner, which is much more expensive.
Some cart paths are thin and cracking on steep slopes, often common as it is difficult to keep asphalt depth consistent on slopes.
Bridges are a problem. We are not capable of an engineering study, so our cost estimates allow for full replacement, but some savings via repair are certainly possible.
Greens • Soil Probe Tests – Did 1 each fairway, rough, tee, green
• Roll / Firmness / Turf Quality - Good
• Size / Pin Locations Levelness / - Good
• HOC – 0.125”
• Construction – California, pure sand, Plaisteads, some drought spots
• Topdressing – Yes, pure sand
• Thatch – L-93, which tends to have thatch.
• Drainage runs on greens? – Very Little
• Access Point Limitations –
o 3 (elevation changes limit)
o 5 and 8 (walk backs limit traffic paths)
Collars • HOC – 0.625”
• Width – 2-3 feet.
• Condition – Good, some damage on 9 green
• Cause drain blocking – None seen
Tees • HOC – 0.625”, Low mow blue and poa, bent is invading.
• Levelness / Turf Quality / Weeds- Good
• Construction – 4-6” sand cap (short in a few spots
• Size – Average size – 8000+
• Size Par 3 Holes - 4th hole (par 3) is only 6,500 S.F. and needs
• Topdressing – Yes
Bunkers • Sand Quality/Color/Depth- Buff Sand
• Drainage – Covered with sand dam, but often blocked

Ramsey County Golf Study Agronomic Practices
Sirius Golf Advisors, LLC 141
• Edging- slightly ragged
• Sand Depth / Eroding? – holes 5, 6 and 9 green wash out.
Fairways • Drainage – Holes 1 and 7 have slight areas
• Turf Type - Low mow blue and poa
• Color and density of the turf – Good
• Weed pressure – Some
Rough • Drainage – Good
• Turf Type – Straight Bluegrass
• Color and density of the turf –Average to good
• Weed pressure – Yes
Trees affecting turf • Shade or Root systems of trees affecting turf? – Not many, prairie style course, wants more trees
and landscape.
Equipment • Equipment List – nearly full list.
• Most Needed – Dedicated Aerifier
• Preventative Maintenance Program – Regular
• Shared Equipment – Aerifier, also share DNR eradicate invasive species
Cultural Practices – • Aerification frequency – 1X annually, late, shares Aerifier with Goodrich
• Topdressing, - Monthly on green, straight sand
• Vertical-cutting. - Yes
• Fertility programs - Green 1 lb. annual, Fairway Tees, ¾ lb. annual
• Weed control program – Spray as needed, no regular preventative. Spray fairway when clover gets too heavy.
• Height/Quality of Cut –
o Greens – 0.125” o Tees – 0.50” o Fairway - 0.625” o Rough – 2-3”

Ramsey County Golf Study Agronomic Practices
Sirius Golf Advisors, LLC 142
Staff • In season-Formerly used prison inmates, got too expensive. 6 month limit on parks employees.
Gets 3-6 in season.
• Off Season-Limited after hockey season
• Assistants – 1, from county pool, but good hand
• Mechanics? – no full time. County fleet fixes, not always timely
• Difficulty in finding help? – yes per county rules
• Staff training – Yes for equipment, safety, fungicide/herbicide application
Relationship with the golf shop staff • Good, weekly meetings and regular communications.
Budgets • Total - $476.000, doesn’t always spend total allocation, is adequate -
Superintendent Qualifications • History/Training – 3rd Year, UM, will be Class A, but not certified
• Responsibility limited to Ponds of Battle Creek.
Rough Mowing While we were visiting, we happened to notice one of the maintenance crew using a regular residential type walk-behind mower to cut areas of the rough. This was not limited to just under the trees, but, as we watched, included a significant area of the rough between the tree line and fence.
This seems to be an unnecessary waste of manual labor as this could have been done in a fraction of time with a good-quality commercial riding mower. These are not expensive units and would pay for themselves in a single season.
Infrastructure
Cart paths
• Material – Asphalt, cracks on steep hills from being too thin
• Partial paths. Full paths on par 3 holes
• Well routed, come up short and could be extended past forward tees

Ramsey County Golf Study Agronomic Practices
Sirius Golf Advisors, LLC 143
• Route and Location of paths. Forward / seniors Tee access is good
• Green Access is limited only on holes 3, 5, 8 (latter two on walk backs)
Landscaping and Trees
• Trees (General Health) Mostly young planted material, good health.
• Landscaping - Wants more on course
• Clubhouse landscaping is heavier, nice.
Drainage System
▪ Wet Areas – 1 and 7 fairways
▪ Catch Basins – nice, not too small like Keller.
▪ Piping – Didn’t exam drainage plan, but Garret Gill known to be excellent at engineering, believe it is fine.

Ramsey County Golf Study Irrigation System Analysis
Sirius Golf Advisors, LLC 144
The irrigation system analysis was handled by Eric Christensen of EC Design.
Keller Golf Course
History Current irrigation system was renovated in 2012 to a Toro Lynx/OSMAC system. On June 11, 2018 we reviewed the golf course with the superintendent and staff to observe the 18-hole irrigation system. The following are our findings based on the site review broken down by component. After our empirical observation of the system a budgetary analysis section will follow giving the club an estimated cost of what it takes to make upgrades suggested within the report.
Pump station Keller’s pump controls could be upgraded to with current technology to help manage the system.
Older deep well pump in good condition

Ramsey County Golf Study Irrigation System Analysis
Sirius Golf Advisors, LLC 145
Water Source • Type: Wells and irrigation pond @ 1000 GPM
• Quality: Good
• Quantity: One main source (pond)
• SO2 Generator/Injection/Other: None
• Water Test: None
• Water Location: On golf property
Water Source & Pump Station Summary of Findings:
Keller system has a newer Flowtronex pumping station in good condition. Staff stated that everything is operating well at the time of my site visit. With VFD (variable frequency drives) and a vertical turbine pump we feel the station will not need major attention for years to come.
Recommendations: The only item that needs upgrading is the PACE controller which is no longer being supplied. By upgrading the control, the station will not only have current parts but can then communicate with the central controller reducing power and water consumption.
Piping and hydraulics • Good – Keller GC has a newer PVC installation.
Recommendations: None
Central/Satellite Control System Toro Lynx with OSMAC field satellites that are still in good condition. KGC could incorporate a repeater for better signals to the field satellites from the central.
Current weather station in good working condition

Ramsey County Golf Study Irrigation System Analysis
Sirius Golf Advisors, LLC 146
Recommendations: Perform R.F. survey for proper repeater locations.
Sprinkler Coverage • Newer system in good working order … staff is doing a great job
of maintaining the system.
Recommendations: None
Complete Summary of Irrigation Findings • New pump station controls (replace Pace – PLC)
o Estimated Budgetary Cost $25,000.00
• Upgraded repeaters for more consistent maintenance radio operation
o Estimated Budgetary Cost $5,500.00
TOTAL ESTIMATED BUDGET COSTS $30,500.00*
*Note - all figures are purely best-case estimates from today’s bidding environment and will fluctuate in the future. Furthermore, no consideration has been made for rock clauses, pond excavation, electrical upgrades, prevailing and/or union wages, commodity prices and the like. Estimates are to be utilized for ball park figures until final bidding takes place.

Ramsey County Golf Study Irrigation System Analysis
Sirius Golf Advisors, LLC 147
Manitou Ridge
History Current irrigation system was designed by Leroy Young as a double row with PVC mainline and laterals dating back to the late 1970’s. On June 11, 2018 we reviewed the golf course with Greg Hubbard to observe the 18-hole irrigation system. Manitou Ridge had some R.F. (radio frequency) issues over the years and after looking at all 18 holes we were able to get a better idea of the challenges they deal with daily. Based
on the input from the staff, along with our observations, there are several key areas of the irrigation that are reaching the age of needing attention. The following are our findings based on the site review of Manitou Ridge’s irrigation system broken down by component. After our empirical observation of the system a budgetary analysis section will follow giving the club an estimated cost of what it takes to make improvements suggested within the report. Note – systems are rated to last 20-25 years, by industry standards, before needing to be replaced and/or upgraded. All Ramsey County courses need to consider water conservation not only by today’s golf irrigation standards but from issues stemming from White Bear Lake.
Pump station Well pump and system are working well. But the system pump house and controls are much older and are past their useful life expectancy.
Below – Older Pump House and Controls
Water Source • Type: Well (150HP) 1200 GPM
• Quality: Good
• Quantity: One main source
Current system has older sprinklers and upgraded heads that staff believes are functioning properly however, may be difficult to upgrade to efficient distributions
Well pump operating properly will only require minimal upgrades
Staff is keeping system working efficiently – very clean (good job!)

Ramsey County Golf Study Irrigation System Analysis
Sirius Golf Advisors, LLC 148
• SO2 Generator/Injection/Other: None
• Water Test: 7.9 pH (as per staff)
• Water Location: On golf property connected to maintenance facility
Water Source & Pump Station Recommendations: Our recommendation is that Manitou Ridge update current controls and logic to log historical data and operation through computerized central. This will also allow the course to have two-way communication for future irrigation controls.
Piping and hydraulics Manitou Ridge is experiencing, like most courses of its age, aging of the piping infrastructure related to rigid PVC pipe. As stated before, systems are rated to last 20-25 years with newer HDPE piping infrastructure rated for 25-50 years.
Recommendations: Consider HDPE future upgrades with 25-50 year lifespan.
Central/Satellite Control System Toro SitePro 7.0 with Narrow Band OSMAC field satellites located in clubhouse office.
Field controllers in fair condition that could be upgraded from central controller
HDPE vs. PVC
Photo illustrates the pliability of the HDPE pipe (black) vs. the rigidity and use of fittings needed in PVC (blue)
OSMAC and maintenance radios
Toro SitePro 7.0 with NSN

Ramsey County Golf Study Irrigation System Analysis
Sirius Golf Advisors, LLC 149
Recommendations: Manitou Ridge should consider Lynx central upgrade to guarantee support/service will be available for future regulation all while improving the efficient application of water.
Sprinkler Coverage
Tees Tees have double row coverage with upgraded Toro 850 series sprinklers, square spaced at 60-65’. One QCV at each tee complex.
Greens Greens are irrigated with upgraded Toro 850 sprinklers. One QCV on every green.
Fairways Fairways are also double row utilizing Toro 850’s. Do not use QCV’s
Recommendations: We would strongly suggest Manitou Ridge continue to upgrade to Toro’s latest 800 series sprinklers with the highest level of water efficiencies.
Complete Summary of Irrigation Findings • New well station and controls
o Estimated Budgetary Cost $40,000.00*
• New R.F. central control package with hydraulic tree program, local support and parts. System to include all base stations, repeaters, moisture sensors and upgraded field satellites for the automatic operation of irrigation system,
o Estimated Budgetary Cost $180,000.00*
TOTAL ESTIMATED TURN-KEY BUDGET COSTS$220,000.00*
OPTIONAL - Upgrade piping and sprinkler infrastructure with all new sprinklers (approx. 700 heads), mains, laterals and isolation valves for the proper operation of a modified double row system. All sprinklers shall be wired back to field satellite for true individual head control.
o Estimated Turn-key Budgetary Cost $840,000.00*
*Note - all figures are purely best-case estimates from today’s bidding environment and will fluctuate in the future. Furthermore, no consideration has been made for rock clauses, pond excavation, electrical upgrades, prevailing and/or union wages, commodity prices and the like. Estimates are to be utilized for ball park figures until final bidding takes place.

Ramsey County Golf Study Irrigation System Analysis
Sirius Golf Advisors, LLC 150
Goodrich Golf Course
History Current irrigation system has Rain Bird system and was replaced in 1995. On June 11, 2018 we reviewed the golf course with Goodrich staff to observe the 18-hole irrigation system. Goodrich GC (GGC) has struggled with several issues regarding the irrigation system for many years; after looking at all 18 holes we were able to get a better idea of the challenges they deal with daily. Based on the input from the staff, along with our observations, there are several key areas of the irrigation that are extremely deficient and need to be addressed. The following are our findings based on the site review of Goodrich Golf Course’s irrigation system broken down by component. After our empirical observation of the system a budgetary analysis section will follow giving the club an estimated cost of what it takes to make improvements suggested within the report. Note – systems are rated to last 20-25 years, by industry standards, before needing to be replaced.
Pump station Newer pump station house and VFD (variable frequency drive) controls
Water Source • Type: Pond with vertical turbine refill with (2) well pumps
• Quality: Good
• Quantity: Multiple wells
• SO2 Generator/Injection/Other: None
• Water Test: None
• Water Location: On golf property
Current system struggles with poor distribution – typical of an older system and poor sprinkler spacing
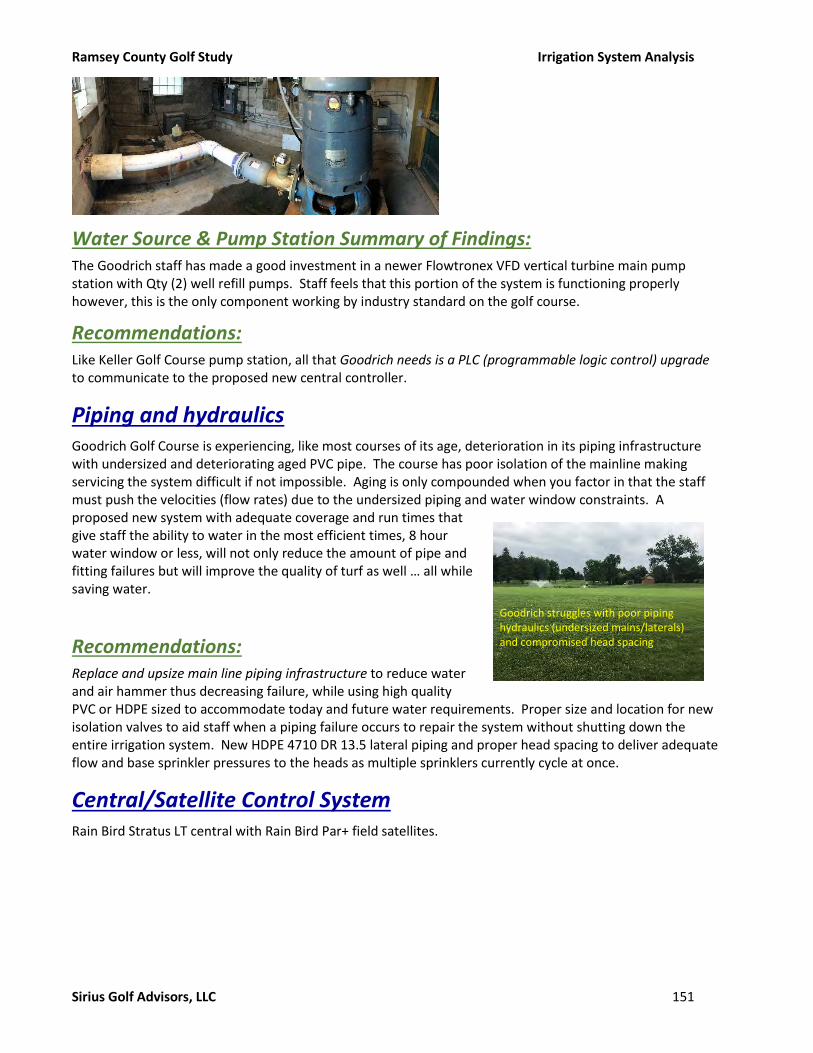
Ramsey County Golf Study Irrigation System Analysis
Sirius Golf Advisors, LLC 151
Water Source & Pump Station Summary of Findings: The Goodrich staff has made a good investment in a newer Flowtronex VFD vertical turbine main pump station with Qty (2) well refill pumps. Staff feels that this portion of the system is functioning properly however, this is the only component working by industry standard on the golf course.
Recommendations: Like Keller Golf Course pump station, all that Goodrich needs is a PLC (programmable logic control) upgrade to communicate to the proposed new central controller.
Piping and hydraulics Goodrich Golf Course is experiencing, like most courses of its age, deterioration in its piping infrastructure with undersized and deteriorating aged PVC pipe. The course has poor isolation of the mainline making servicing the system difficult if not impossible. Aging is only compounded when you factor in that the staff must push the velocities (flow rates) due to the undersized piping and water window constraints. A proposed new system with adequate coverage and run times that give staff the ability to water in the most efficient times, 8 hour water window or less, will not only reduce the amount of pipe and fitting failures but will improve the quality of turf as well … all while saving water.
Recommendations: Replace and upsize main line piping infrastructure to reduce water and air hammer thus decreasing failure, while using high quality PVC or HDPE sized to accommodate today and future water requirements. Proper size and location for new isolation valves to aid staff when a piping failure occurs to repair the system without shutting down the entire irrigation system. New HDPE 4710 DR 13.5 lateral piping and proper head spacing to deliver adequate flow and base sprinkler pressures to the heads as multiple sprinklers currently cycle at once.
Central/Satellite Control System Rain Bird Stratus LT central with Rain Bird Par+ field satellites.
Goodrich struggles with poor piping hydraulics (undersized mains/laterals) and compromised head spacing
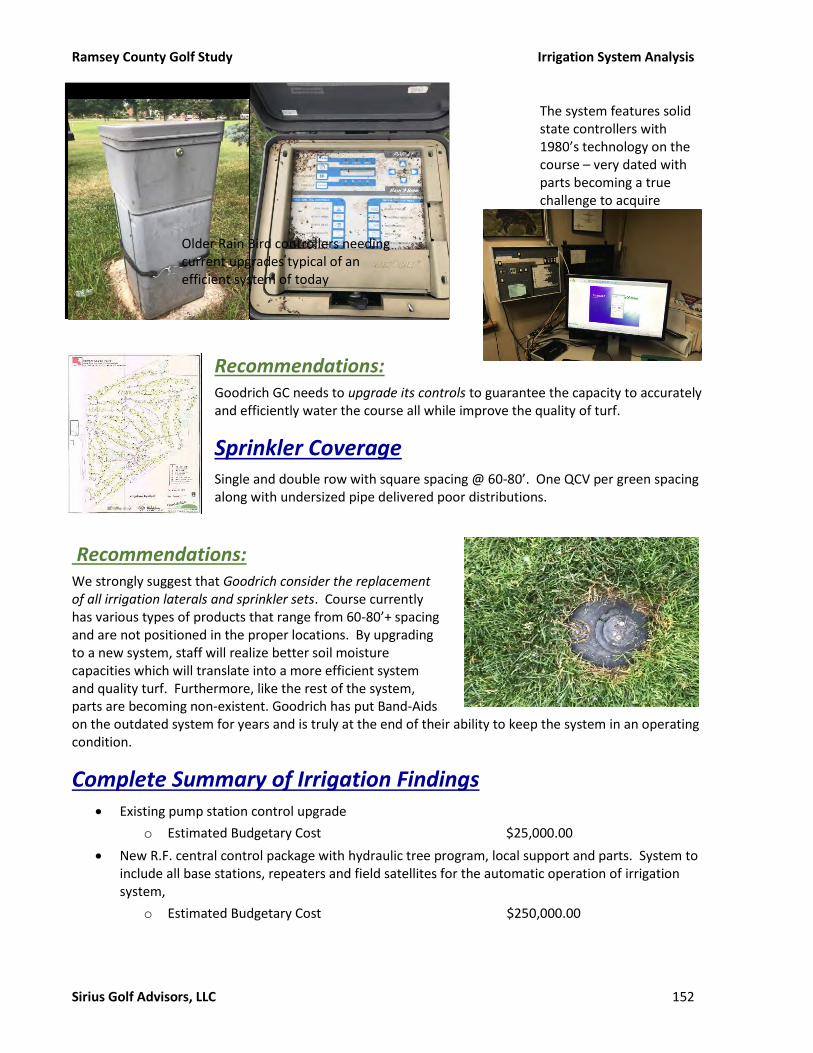
Ramsey County Golf Study Irrigation System Analysis
Sirius Golf Advisors, LLC 152
Recommendations: Goodrich GC needs to upgrade its controls to guarantee the capacity to accurately and efficiently water the course all while improve the quality of turf.
Sprinkler Coverage Single and double row with square spacing @ 60-80’. One QCV per green spacing along with undersized pipe delivered poor distributions.
Recommendations: We strongly suggest that Goodrich consider the replacement of all irrigation laterals and sprinkler sets. Course currently has various types of products that range from 60-80’+ spacing and are not positioned in the proper locations. By upgrading to a new system, staff will realize better soil moisture capacities which will translate into a more efficient system and quality turf. Furthermore, like the rest of the system, parts are becoming non-existent. Goodrich has put Band-Aids on the outdated system for years and is truly at the end of their ability to keep the system in an operating condition.
Complete Summary of Irrigation Findings • Existing pump station control upgrade
o Estimated Budgetary Cost $25,000.00
• New R.F. central control package with hydraulic tree program, local support and parts. System to include all base stations, repeaters and field satellites for the automatic operation of irrigation system,
o Estimated Budgetary Cost $250,000.00
The system features solid state controllers with 1980’s technology on the course – very dated with parts becoming a true challenge to acquire
Older Rain Bird controllers needing current upgrades typical of an efficient system of today

Ramsey County Golf Study Irrigation System Analysis
Sirius Golf Advisors, LLC 153
• Upgrade piping and sprinkler infrastructure with all new sprinklers (approx. 900 heads), mains, laterals and isolation valves for the proper operation of a modified double row system. All sprinklers shall be wired back to field satellite for true individual head control.
o Estimated Budgetary Cost $990,000.00
TOTAL ESTIMATED BUDGET COSTS $1,265,000.00*
*Note - all figures are purely best-case estimates from today’s bidding environment and will fluctuate in the future. Furthermore, no consideration has been made for rock clauses, pond excavation, electrical upgrades, prevailing and/or union wages, commodity prices and the like. Estimates are to be utilized for ball park figures until final bidding takes place.
Ponds at Battle Creek Golf Course
History Current irrigation system is a Rain Bird decoder system installed in 2003-2004. On June 11, 2018 we reviewed the golf course with Justin to observe the 18-hole irrigation system. Ponds at Battle Creek GC (PBC) has struggled with two-wire communication cable issues; after looking at all 18 holes we were able to
get a better idea of the challenges they deal with daily. Based on the input from the staff, along with our observations, there are areas of the irrigation that need to be addressed. The following are our findings based on the site review of Ponds at Battle Creek Golf Course’s irrigation system broken down by component. After our empirical observation of the system a budgetary analysis section will follow giving the club an estimated cost of what it takes to make improvements suggested within the report.
Pump station Ponds at Battle Creek is utilizing a 2014 Flowtronex VFD pump station and (2) 30hp motors and PM pump
Pump house and station controls
Current system struggles with decoder communication – typical of older two-wire systems as lightning protection has improved with today’s systems
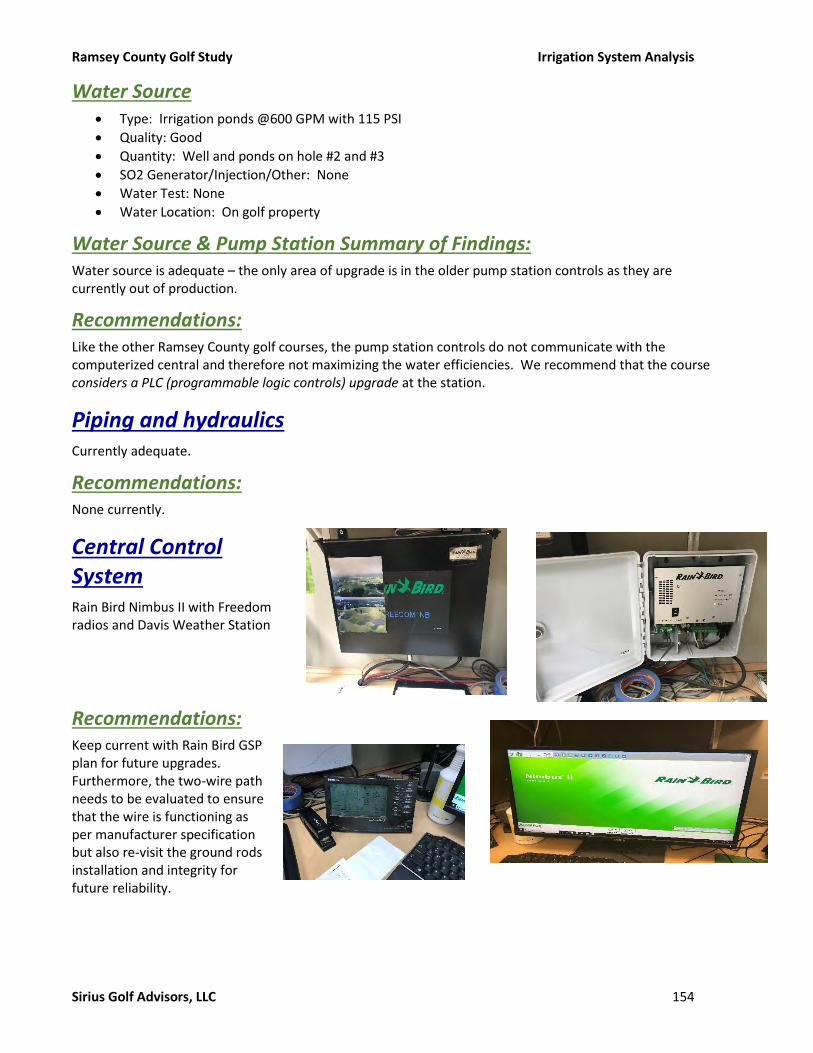
Ramsey County Golf Study Irrigation System Analysis
Sirius Golf Advisors, LLC 154
Water Source • Type: Irrigation ponds @600 GPM with 115 PSI
• Quality: Good
• Quantity: Well and ponds on hole #2 and #3
• SO2 Generator/Injection/Other: None
• Water Test: None
• Water Location: On golf property
Water Source & Pump Station Summary of Findings: Water source is adequate – the only area of upgrade is in the older pump station controls as they are currently out of production.
Recommendations: Like the other Ramsey County golf courses, the pump station controls do not communicate with the computerized central and therefore not maximizing the water efficiencies. We recommend that the course considers a PLC (programmable logic controls) upgrade at the station.
Piping and hydraulics Currently adequate.
Recommendations: None currently.
Central Control System Rain Bird Nimbus II with Freedom radios and Davis Weather Station
Recommendations: Keep current with Rain Bird GSP plan for future upgrades. Furthermore, the two-wire path needs to be evaluated to ensure that the wire is functioning as per manufacturer specification but also re-visit the ground rods installation and integrity for future reliability.

Ramsey County Golf Study Irrigation System Analysis
Sirius Golf Advisors, LLC 155
Sprinkler Coverage • Double row 60-75’ spacing
• QCV’s cannot be found – need to re-visit “as-built” drawing to confirm actual equipment locations.
Recommendations: Optimizing the sprinkler sets and actual locations for better
distribution. This will ultimately create better turf conditions all while saving water and utility costs.
Complete Summary of Irrigation Findings • Station and controls/panel upgrade
o Estimated Budgetary Cost $25,000.00
• Update Rain Bird GSP central support system for the automatic operation of irrigation system
o Estimated Budgetary Cost $8,000.00
• Optimization of sprinkler locations and two-wire communication path/grounding. All sprinklers shall be wired back to field satellite for true individual head control.
o Estimated Budgetary Cost $85,000.00
TOTAL ESTIMATED BUDGET COSTS $118,000.00*
*Note - all figures are purely best-case estimates from today’s bidding environment and will fluctuate in the future. Furthermore, no consideration has been made for rock clauses, pond excavation, electrical upgrades, prevailing and/or union wages, commodity prices and the like. Estimates are to be utilized for ball park figures until final bidding takes place.
Island Lake Golf Course
History Current irrigation system is a Rain Bird system with products dating back to the mid 1980’s; some infrastructure even older. On June 11, 2018 we reviewed the golf course with the superintendent to observe the 9-hole irrigation system. The superintendent stated that he feels comfortable with the operation of the current system; after looking at all 9 holes and training center we were able to get a better idea of the challenges they deal with daily. Based on the input from the staff, along with our observations, there are several key areas of the irrigation that are extremely deficient and need to be addressed. The following are our findings based on the site review of ILGC’s irrigation system broken down by component. After our empirical observation of the system a budgetary analysis section will follow giving the club an estimated cost
Some sprinkler locations are well outside green surround. Watering green surface and covering rough with same sprinkler pattern
Sprinkler sets for the most part are adequate

Ramsey County Golf Study Irrigation System Analysis
Sirius Golf Advisors, LLC 156
of what it takes to make improvements suggested within the report. Note – systems are rated to last 20-25 years, by industry standards, before needing to be replaced.
Pump station Island Lake is utilizing (2) horizontal centrifugal pumps with a transfer pump to fill the pond – more typical of commercial grade systems
Water Source • Type: Pond – 220 GPM; Well @ 120 GPM
• Quality: Good – as per staff
• Quantity: Two ponds
• SO2 Generator/Injection/Other: None
• Water Test: None
• Water Location: On golf property
Water Source & Pump Station Summary of Findings: Although the superintendent spoke highly of his current system, we feel that going forward the course should consider some improvement to the current system to quantify the rebuilding of water supply and piping needs. Currently the station is (2) horizontal centrifugal stations more typical of a commercial system than a golf course. Pump station controls are very basic with minimal feedback of information for the superintendent and their staff.
Older pump house and controls – could use an upgrade of more reliable pump equipment rated for golf applications
Current wet well and intakes

Ramsey County Golf Study Irrigation System Analysis
Sirius Golf Advisors, LLC 157
Recommendations: Our recommendation is that ILGC consider new positive pressure horizontal pumps and floatation intake to ensure the reliable use of water not only today but for future needs of the golf course.
Piping and hydraulics Island Lake Golf Course has undersized mains/laterals – typical of installation 25-30 years ago with aging PVC pipe as well as insert poly laterals - not normally utilized in golf grade systems (residential). Aging is only compounded when you factor in that the staff must push the velocities (flow rates) due to the undersized piping and water window constraints. A proposed new system with adequate coverage and run times that give staff the ability to water in the most efficient times, midnight - 5:00am, will not only reduce the amount of pipe and fitting failures but will improve the quality of turf as well.
Recommendations: Increase main line piping infrastructure to reduce water and air hammer thus decreasing failure, while using high quality PVC and fusion HDPE buried at 36” top cover. Add additional isolation valves to aid staff when a piping failure occurs to repair the system without shutting down the entire irrigation. New lateral piping and proper head spacing to deliver adequate flow and base sprinkler pressures to the heads, as sprinklers are block zone 4+ heads operating per zone. Again, the lateral piping is more commercial/residential in style making it difficult to water the course properly.
Central/Satellite Control System
Older 1970-80’s Rain Bird electro-mechanical stand-alone controllers without a central.
Recommendations: Island Lake GC needs to upgrade its controls to guarantee that parts will be available for future repairs and improving the application of water. Furthermore, like the pump station, a new central will aid the course in quality water applications.
Electro-mechanical controllers with 1970-80’s technology on the course – very dated
Analog flow meter
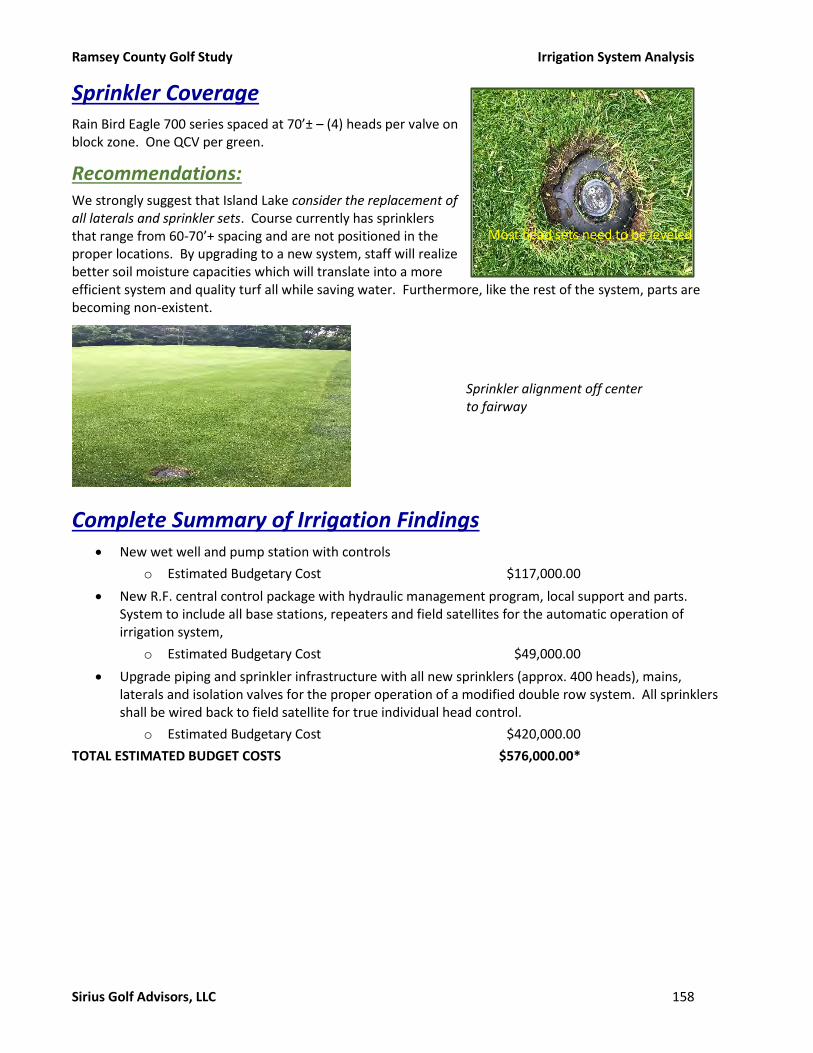
Ramsey County Golf Study Irrigation System Analysis
Sirius Golf Advisors, LLC 158
Sprinkler Coverage Rain Bird Eagle 700 series spaced at 70’± – (4) heads per valve on block zone. One QCV per green.
Recommendations: We strongly suggest that Island Lake consider the replacement of all laterals and sprinkler sets. Course currently has sprinklers that range from 60-70’+ spacing and are not positioned in the proper locations. By upgrading to a new system, staff will realize better soil moisture capacities which will translate into a more efficient system and quality turf all while saving water. Furthermore, like the rest of the system, parts are becoming non-existent.
Complete Summary of Irrigation Findings • New wet well and pump station with controls
o Estimated Budgetary Cost $117,000.00
• New R.F. central control package with hydraulic management program, local support and parts. System to include all base stations, repeaters and field satellites for the automatic operation of irrigation system,
o Estimated Budgetary Cost $49,000.00
• Upgrade piping and sprinkler infrastructure with all new sprinklers (approx. 400 heads), mains, laterals and isolation valves for the proper operation of a modified double row system. All sprinklers shall be wired back to field satellite for true individual head control.
o Estimated Budgetary Cost $420,000.00
TOTAL ESTIMATED BUDGET COSTS $576,000.00*
Sprinkler alignment off center to fairway
Most head sets need to be leveled

Ramsey County Golf Study Architect’s Report
Sirius Golf Advisors, LLC 159
Goals and Objectives Our charge is to support the Sirius Golf Advisors Business Study, which is seeking a financially viable business model for Ramsey County Courses moving forward. Proposed changes must logically and specifically demonstrate ability to improve economic results, by some combination of:
➢ Increase revenue by making the course more attractive overall and it the marketplace. ➢ Decrease costs without affecting the existing or proposed Market Position.
Sirius Golf Advisors will make a wider variety of proposals based on their total findings. It is possible the proposals in this preliminary report may have to be modified considering other findings.
Our evaluation will be in sections, beginning with a general discussion of the design parameters that affect all five courses, including:
• Design
o Routing
o Features
o Safety
• Infrastructure
o Greens, Tees, Fairway, Sand Bunkers, Roughs, Trees
o Irrigation
o Cart Path
o Drainage
o Trees
• Agronomy
• Individual Course Design Needs and Design Proposals
• Implementation Proposals
Design Evaluation - Routing Routing is the footprint or floorplan of your golf course, and no amount of good design features, and infrastructure can offset a poorly routed course in most cases. That said, we strive to avoid re-routing due to its greater renovation cost (rebuilding in place saves some infrastructure and trees, but sometimes, it is the only way to solve basic problems.
So, what is a good routing? In short, it is a golf course with 18 good holes. And what is a good hole? It is one where the routing, design features and infrastructure follow well established design principles to create a functional hole at a minimum and goes beyond that to provide some measure of challenge, fun, and memorability to golfers. Those qualities usually (not always!) stem from these principles:
The routing attributes are:
• Par – (Plays to par of 70-72 for men and women)
• Length (From proper tee, all golfers can hit greens in regulation with good shots)
• Width - (Wide corridors to facilitate “find it, hit it again play”
• Playable by all golfers (With design interest for all, no forced carries)
• Visibility of targets (for strategy, safety, comfortable when planning shot)

Ramsey County Golf Study Architect’s Report
Sirius Golf Advisors, LLC 160
• Safety (Few errant shots hitting golfers or outside property)
• Use of natural topography (The charm of golf design, graceful, not awkward)
• Drains well (Allows play soon after all but “Caddy Shack” storms)
• Presents receptive targets (Targets hold good shots, direct away from hazards)
• Good circulation/Speed of play (Holes arranged to facilitate fast play)
• Good sun orientation (Rarely play into blinding sun))
• Variety and Balance (of hole pars, lengths, wind directions and difficulty)
Par Even though no one knows for sure why:
• Par 72 is considered “standard” for regulation courses.
• Par 70 and 71 are acceptable, but complicate handicaps, double tee starts and are disliked by many
players, especially nine-hole players using two rounds to submit one 18 holes for handicap.
There are some par 70 and 71courses:
• That were converted from par 72 by turning 1 or 2 short par 5’s to long par 4’s.
• With extra par 3 holes, and fewer par 5’s (which golfers like and saves land)
• Par 69 and 73 are rare, and unpopular
• Less than par 68 is considered an executive course.
Length The most popular courses have overall length within the normally expected ranges for various multiple tees. Variations of 150 yards +/- are accepted, as are shorter lengths when par is not 72, up to 150 yards per stroke under 72.
The aging of the golf population, the “Play it Forward” and “Proportional Length/Tee Equity” movement and the new Longleaf Initiative by ASGCA all advocate (with slightly different takes) for shorter courses for everyday play. The ideas are similar – for all middle and forward tees, all good, but shorter hitting players should be able to hit (nearly) every green, and ideally do it using similar clubs as longer hitters. We don’t ask men’s champions to hit par 4 holes with Driver, 3 Wood, 7 Iron, or to play 9,000 yard courses, but routinely ask others to do it every day. Golf is usually more fun when you’re making pars (or birdies)!
A 1990’s era USGA Driving Distance Study (still valid today for all but longest golfers who benefit from technology) shows driving distances across the spectrum, with “cluster points” of 140, 170, 200, 230, 260 and 290 yards. A 2017 study shows top player distance increasing to 294 yards, while others have decreased slightly, possibly due to an aging golf population. Course length and tee design paradigms are changing:
Old Paradigm
Tees 20-35 yards apart to bring all players to the same tee shot landing zone, meaning:
❖ We economically challenge all players with one set of fairway hazards.
❖ 450 yard holes play at 420/390/360 and 330 yards for others.
❖ We accept:
o Equal approach shot length for all players, that are Unequal golf experiences. Specifically, a 200
yard approach is an iron for top players, but unreachable by most others.
New Paradigm

Ramsey County Golf Study Architect’s Report
Sirius Golf Advisors, LLC 161
Placing tees and making total hole lengths proportional to relative tee shot distance, i.e., average men hit tee
shots 230 to 290 yards, or about 80%, meaning:
❖ A 450 yard hole plays at 405/360/315/270 yards for others.
❖ All golfers can hit greens in regulation with good shots and similar clubs
As can been seen below, for Silver and Red tee players, “typical” course length is longer than those players
can handle, whereas White tee players nearly max out, and those playing from longer tees have relatively
comfortable second shots. When Red tees are over 5,000 yards, women play a course that is equivalent to
tour pros playing at 11,542 yards!
Many find true equity course length very, even condescendingly, short compared to traditional lengths, and
prefer to “settle” for a progressive blend that still allows everyone to hit greens without playing over their
maximum “two shots” distance.
Typical, Max, Progressively longer &Equity Course Length
Player Tee Shot
Current
Typical
Length
Max Length 36
Shots Tee/80%
2nd
Progressive
Greater % of
Max Length
True Equity Course
Length (rounded)
(i. e., 260/290 = 90% for using same club)
Top Pro 320 7500 10,368 (70%) -7257 N/A Top Am 290 7150 9396 (75%)-7027 (100%)-7308 Black 260 6800 8424 (80%)-6740 (90%)-6667 Blue 230 6450 7452 (85%)-6335 (80%)-5926 White 200 6100 6400 (90%)-5760 (70%)-5185 W/S Blend 185 5750 5994 (90%)-5545 (65%)-4815 Silver 170 5400 5508 (90%)-4955 (60%)-4445 Red 140 5050 4536 (95%)-4310 (50%)-3700 Junior 110 4700 3564 (100%)-3565 (45%)-2925
Individual Hole Length -While total length is important, it is best achieved when every hole, subject to any
natural limitations, also plays to proportionally appropriate length from each tee. Holes must fall within (or
sometimes below) par guidelines. Many par 5 holes exist already (and appropriately) below 470 yards from-
• Silver tees, where 3 full shots would barely cover the 470 yards.
• Red Tees, where
▪ 3 full shots for 140 yard hitters may reach just short of the 405 minimum par 5 hole
by USGA standards. (405 should be the maximum par 5 from red tees) If m the silver
tees, which is acceptable
▪ 2 Full shots might cover only 252 yards, maxing out par 4 length, and where a
“drivable” par 4 should be under 175 yards, and no par 3 should exceed 140 yards,
and most should be < 100 yards.
Tee sizing is discussed later.
Ramsey County Golf Study Architect’s Report
Sirius Golf Advisors, LLC 162
Width USGA Slope Charts and other research allows us to classify fairway and play corridors between tree lines or native grasses, or even housing corridors as:
Fairways –
▪ Narrow, <30 yards,
▪ Average 30-40,
▪ Wide 40+
Total Play Corridors (between trees or native, with estimates of containment)
▪ Narrow –<200 feet/66 Yards, 25% Tee Shots Outside Corridor
▪ Middle – 225 feet/75 Yards, 17% Tee Shots Outside Corridor
▪ Wide – 250 feet/83 Yards, 12% Tee Shots Outside Corridor
▪ Between Property Lines- 97+ Yards, 8% Tee Shots Outside Corridor
Many older courses have experienced continual corridor narrowing, as extensive tree plantings mature and get wider. And many have play corridors narrower than 64 yards (192 feet) or less from canopy to canopy. Where those can be widened, faster and better play can be re-established.
Playability for All Levels of Golfers Average golfers are the most numerous and play the most rounds, and yet many designs consider the better player first and foremost, with others being nearly afterthoughts. After width and length, these factors affect playability for average golfers the most:
1. Excessive forced carries because average golfers top up to 25% of their shots.
2. Water Hazards and OB, of any type, carry or non-carry, if in normal play zones
3. Excessive Sand Bunkers (more than 2-3 per hole)
4. Excessive Green Contours
5. Downhill Lies (especially with long irons and fairway woods)
Visibility With some exceptions, there are few great (or popular) blind holes. The best holes are arranged with all landing areas and targets visible to golfers, for beauty, safety, and strategy. Visibility aids in fast play and is even more important for resort and public courses with many occasional or first time players unfamiliar with the course.
To aid visibility, most:
❖ Greens and sand bunkers are built sloping towards golfers.
❖ Fairway doglegs are usually higher on the outside to present to golfers.
❖ Water hazards are shaped to be seen from the tee and when in play.
❖ Except on downhill holes, design features are usually progressively higher, so you can see past the
first to see the second one, past the second to the third, etc.
Ramsey County Golf Study Architect’s Report
Sirius Golf Advisors, LLC 163
Safety Golf can never be completely safe, nor is it my understanding that it is legally required to be risk free. However, there is the legal presumption that known (i.e., clearly repetitive) safety issues should be mitigated.
Many older courses, built when hole separation standards, rounds of play and tee shot distances were all less than they are now, have several holes that might fail any modern safety standard. Where it is impractical to reroute to increase space separation, it is possible to implement other mitigation features, especially for these areas of concern.
While there are no widely accepted contemporary hole separation standards, they keep getting wider, a proper response to higher rounds played and longer tee shot distances, as compared to the “old days.” In modern designs, our view is that golf holes should have adequate spacing between:
o Adjacent Tees and Greens –
• 175 feet from green center to tee center laterally
• 150 feet green center to tee center, if behind green
o Adjacent Landing Zones –
• 180 feet centerline to centerline on par 3 holes, with 200 preferred
• 200 feet minimum on long holes, with 225-300 preferred
o Property boundaries (at 180-225 yards off tee)
• 145-165 feet centerline to left property line
• 150 -195 feet centerline to right
In addition, areas with concentrated play (i.e., greens and tees where all 4 golfers gather, which quadruples the minute chance combination of one errant shot and one golfer being in the same place reduce drastically) should be outside a generally recognized “safety cone” of:
▪ at least 15-16.5 degrees left of the intended line of play,
▪ 20-23 degrees right of the intended line of play, to accommodate slices.
Fits Natural Topography Attractively Like art, good course routing is hard to define but we know what we like. Beautiful holes usually (not always) have elevated tees and play downhill, “laying out like a road map” and looking “just right” on the land. Playing through valley fairways to slightly elevated green sites, or ones near water, or framed by trees is always a pleasure. A great routing avoids awkward or steeply uphill holes, and severe, awkward or misplaced slopes.
Variety and Sequence (or Rhythm) Holes should stand out from others around them. A good routing first finds the most good/natural holes, but all things being equal, roughly balances different hole types, including:
• Par Rotation/Sequence – Mixing different hole pars provides variety. While rarely achieved, some
courses have no consecutive holes with the same par, going 4-5-4-3-4-5-4-3-4.
• Length/ Difficulty - Consecutive long/hard or short/easy holes are boring. Good routings mix hole
yardages and natural (or built in) difficulty.

Ramsey County Golf Study Architect’s Report
Sirius Golf Advisors, LLC 164
• Wind – Dating back to the early days of Scotland, wind is a key factor in golf, and holes with similar
winds gets boring, and perhaps favors some golfers. Changing direction of holes makes golfers consider
a different wind direction on every shot.
Drains Well If you can’t play it due to bad drainage, it’s a bad hole! Turf, reputation and revenues suffer on a poorly drained course. Flood plains and soggy low areas should be avoided or designed to mitigate poor drainage and provide fast drainage after floods.
Receptive Targets Only rarely should fairways and greens be crowned, islands surrounded by hazards, or have cross slopes that don’t hold shots. Even a dramatic hole like 16 at Cypress Point would get tiresome if not a singular challenge.
Good Circulation/Speed of Play Slow play reduces participation and enjoyment! Design features (with width, and blind shots already discussed) that affect pace of play at public golf courses also include:
• Course Length and Flexibility – “Crazy length” adds shots and playing time. Ability to move tee markers up on busy days to shorten the course, etc.
• Tight hole spacing/interference from errant shots on parallel holes - Unfortunately, many older courses have tight hole spacing.
• Proximity of Greens and Next Tee – Short distances equals less travel time
• Good Circulation Patterns – Specifically: o No walking back from greens to next tee, holding up the next group. o Indirect Routes (most often caused by “saving” the cost of a bridge) o Cart paths close to greens and tees o No confusion as to where to go
• Par/Length/Difficulty Sequence, Specifically: o Any Par 3 – Never before the 4th hole on each nine (5th or later preferred) o Any short hole after a long hole, or hard hole after an easy one o Par 3, or very short par 4 or par 5 holes at 1 and 10
o Reachable, par 4 or par 5 holes early on either nine
While it counters desire for architectural variety, design for pace of play requires designing all holes with
similar overall difficulty (for public courses, usually by making the hard holes easier.) Management techniques
to increase pace of play involve appropriate rough height, green speeds, hole locations, etc.
Sun Orientation A good routing places the clubhouse from 12 to 6 on the clock face, setting up morning holes that run away from the sun, and later, evening holes running east, also away from the sun. An otherwise good hole can be ruined by looking into the setting sun, so avoiding it is a big priority.
Design Evaluation - Golf Features
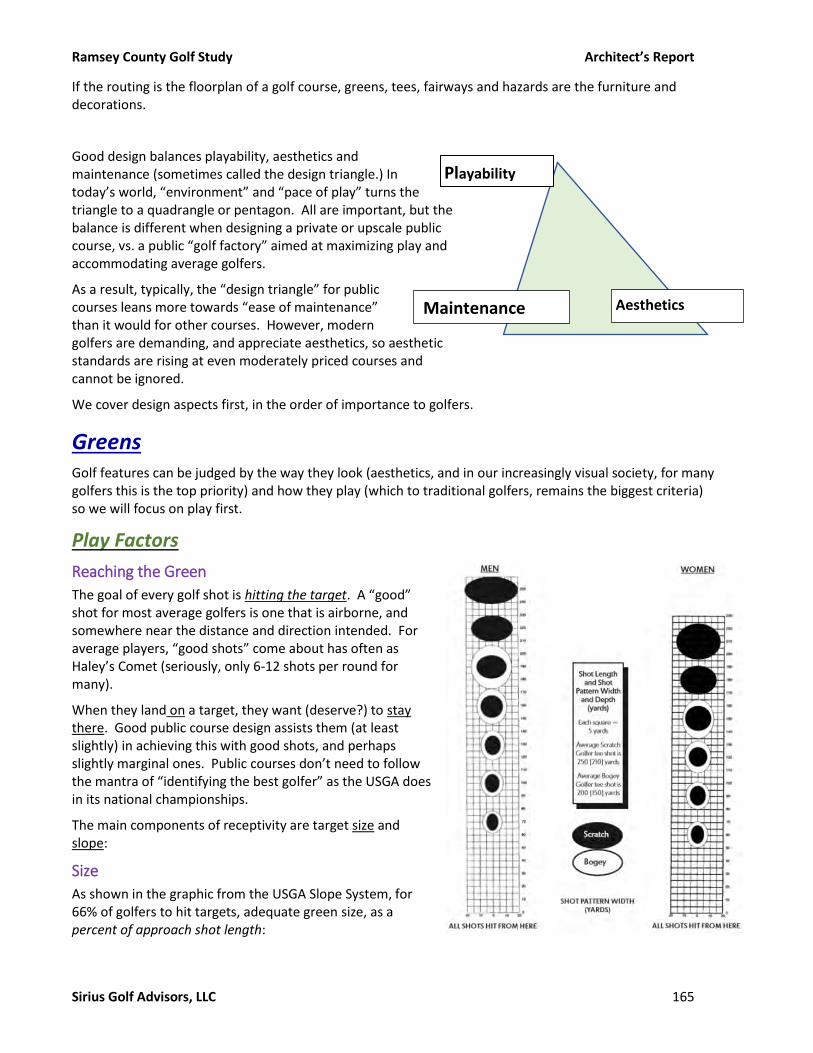
Ramsey County Golf Study Architect’s Report
Sirius Golf Advisors, LLC 165
If the routing is the floorplan of a golf course, greens, tees, fairways and hazards are the furniture and decorations.
Good design balances playability, aesthetics and maintenance (sometimes called the design triangle.) In today’s world, “environment” and “pace of play” turns the triangle to a quadrangle or pentagon. All are important, but the balance is different when designing a private or upscale public course, vs. a public “golf factory” aimed at maximizing play and accommodating average golfers.
As a result, typically, the “design triangle” for public courses leans more towards “ease of maintenance” than it would for other courses. However, modern golfers are demanding, and appreciate aesthetics, so aesthetic standards are rising at even moderately priced courses and cannot be ignored.
We cover design aspects first, in the order of importance to golfers.
Greens Golf features can be judged by the way they look (aesthetics, and in our increasingly visual society, for many golfers this is the top priority) and how they play (which to traditional golfers, remains the biggest criteria) so we will focus on play first.
Play Factors
Reaching the Green
The goal of every golf shot is hitting the target. A “good” shot for most average golfers is one that is airborne, and somewhere near the distance and direction intended. For average players, “good shots” come about has often as Haley’s Comet (seriously, only 6-12 shots per round for many).
When they land on a target, they want (deserve?) to stay there. Good public course design assists them (at least slightly) in achieving this with good shots, and perhaps slightly marginal ones. Public courses don’t need to follow the mantra of “identifying the best golfer” as the USGA does in its national championships.
The main components of receptivity are target size and slope:
Size
As shown in the graphic from the USGA Slope System, for 66% of golfers to hit targets, adequate green size, as a percent of approach shot length:
Playability
Maintenance Aesthetics

Ramsey County Golf Study Architect’s Report
Sirius Golf Advisors, LLC 166
▪ Average Players - Width of 13-16%, Depth of 16-20%, - (I typically use 15%/20% to account for
collars, future grow in, and because it’s easier math in my head) i.e., a 160 yard approach shot needs a
target 24 yards wide by 32 yards deep.
▪ Better players - Width of about 10% depth and width, i.e., from 160 yards, a 16 by 16 yard circle.
Holding Greens
The following practices are almost “standard” in green design to help golfers hold shots on the green:
➢ Upward slope from front to back of at least 1.50%,
which is the minimum for drainage. Our general rule is
to slope greens up 0.01% per yard, or 1.6% for 160
yards, 2.0% for 200 yards, etc.
➢ Concave slope on front portion of green to direct shots
to the middle. How much? About 1/3 to ½ of up slope
works fine.
➢ Limit cross slopes to about 2.25-2.75%.
➢ The green front should be flatter to reduce ball marks
and keep putts from above the hole from running away.
Generally, we design:
o Front drainage swale ranges from 1.75-2.1%
o Back half green drainage swales from 1.75-
2.75%
➢ Hold any reverse slopes under 2%.
o Minimize any interior areas falling away from
golfer.
o Occasionally, entire greens with reverse slope
are acceptable when the natural ground slopes
away, the hole is downhill providing vision, and
there is adequate room to land the approach
shot short of the green.
➢ Add small backing mounds, to hold shots running
through the green near the putting surface.
Maintenance
Size
Greens need adequate green size to move the cup around daily and distribute wear and tear and promote good turf health and putting conditions.
The interval for returning to the same cup locations depends on play intensity, turf type, soil compaction, but it generally takes 14-21 days for the 3-4 foot around a cup to recover well enough to be used again. Aggressive maintenance and low play – both more typical at private country clubs than public courses - can use return in 14 days, but for public courses, 21 days is preferred.
Most greens should:
• Be at least the size required
for the shot as per the chart
at right.
• While the USGA data is
empirical, I also factor in
“effective playing length”
(wind, elevation change, etc.
to further adjust the basic
dimensions.
• Retain an open front and
fairway connection, since
many average players roll the
ball on the green with their
approach shots.
• May have a portion of the
green (, i.e., the “Sunday Pin”)
protected by hazards, and
sized for better players.
• On short shots, where ball
marks are prevalent, it is
practical to make those
greens larger, with multiple
smaller targets. separated by
ridges, tiers, valleys or knobs.

Ramsey County Golf Study Architect’s Report
Sirius Golf Advisors, LLC 167
The chart shows that the minimum green size required to provide 21 separate hole locations is 4,040 S.F. This includes a 2 foot collar and 15 foot minimum distance between cup and green edge, and allows for one small ridge to divide drainage:
Most greens need more size, either because they:
• Need larger sized to accept approach shots as previously
described.
• Have more than minimal contour for putting interest.
• Heavy play requires more space (typically minimum 0.15-
0.20 S.F. per round)
In fact, normal greens are (and need to be) 35-60% larger than the 4,040 S.F. minimum, and a good average size ranges from a minimum of 5,500 to 6,500 S.F.
Like most older courses, the greens at older Ramsey County Golf Courses were built (or have shrunk from their originally designed sizes) smaller than required to handle their now high play volumes.
Course Rounds/Expected
Increase Ex. Ave. Green
Prop Green Size
20 S.F. per 1000
Necessary
Increase
Goodrich 32,000/35,000 2,919 S.F. 5,250 -7,000 S.F. 80-140%
Keller 29,000/32,000 5,282 S.F. 4,800- 6,400 S.F. 0-21%
Manitou Ridge 37,000/41,000 5,716 S.F. 6,150 -8,200 S.F. 8-22%
Ponds 19,000/21,000 5,675 S.F. 3,150 -4,200 S.F. NA
Island Lake 12,500/14,000 3,868 S.F. 4,040-5,050 S.F. 5%
Goodrich is in dire need of bigger greens.
Manitou Ridge should have bigger greens for best maintenance.
Keller would probably have been built with bigger greens except for typical budget constraints but is so new that it is more efficient to struggle slightly than rebuild or extend greens again.
Battle Creek: adequate green size.
Island Lake has small greens, but they seem okay for its play levels.
Soil
The newer courses are sand based (USGA) while the older courses feature topsoil ‘push-up’ greens, with a 6-8” layer of sand on top of the topsoil base, created via long term sand topdressing and aerifying. These provide a passable, but imperfect growing medium where root depth is typically limited to the interface between old and new layers. These type greens usually experience more summer stress and they are more prone to failure in excess heat.
While many fine old country club courses with low annual play do maintain good turf on push up greens, agronomic consultants almost always recommended USGA (or similar) Method for new or renovated greens construction. When greens are rebuilt for any reason, in whole or part, we recommend new greens have USGA recommended construction, or similar.

Ramsey County Golf Study Architect’s Report
Sirius Golf Advisors, LLC 168
We expect that due to soils in the greens at Manitou Ridge and Goodrich, these courses will need total green rebuilding soon.
Green Speed
Putting Slopes
The Stimpmeter was introduced in 1976 as a tool to measure green speed. At that time, the average Stimpmeter reading for all PGA Tour Event courses was 7.6 feet. Private clubs were less, and public courses, mowed at ¼”, were slower still, maybe 5-6. Since then, top clubs have green speeds of 11-14, and the average green speeds at mid-level clubs and public courses is estimated average speed of 9-10.
As green speeds have increased over 40 years, generally acceptable green slope has reduced. At 1970’s green speeds, cup could be cut on slopes as high as 4-6%. Now, the typically recommended cup area slopes are 2-3% on public courses.
The guiding principles for locating holes are (and have always been):
1. No putt should accelerate after leaving the putter (or as one architect said, “run like a swine
possessed by the devil”) and
2. Second putts within 2-4 feet of the hole, should generally be “within the cup” (i.e., relatively flat as a
reward for a good first putt. It also speeds play and minimizes cussing…….
The pro tour uses a complicated two directional measurement system which basically sets their maximum cup location slopes at a maximum of 3.88%. The generally recognized acceptable slopes for cup setting areas on average courses is 2-3%, which a few architects exceed, up to 3.5% of more.
Ramsey County Golf Courses all maintain greens at speeds of 9-10 on the Stimpmeter, right in line with golfer expectations.
According to your golfer surveys, only a few greens give golfers problems:
• Goodrich – No. 7
• Keller – No. 11 (hump in middle) and 17 (front)
• Manitou Ridge – No. 8 and 13
• Ponds at Battle Creek – None
• Island Lake – None reported
We generally recommend that if/when any greens are re-contoured, the maximum new slopes for cupping areas conform to 2-3% standards above. The outer 10-12 feet of greens can roll more, up to 8-9%, because no cups will be cut there. Likewise, with enough green size, there can be areas of greater contour within specific greens.
Turf
The putting greens at Ramsey County Golf Courses are predominantly bent grasses, with infestations (as is typical after even a few years) of poa annua. Collars are 2-3 feet wide.
For any green reconstructed, we recommend a newer variety, and T-1 is currently the best and most popular choice in the region. Switching a limited number of greens to a new turf does cause consistency problems. You may wish to use a late fall season to replant all greens.
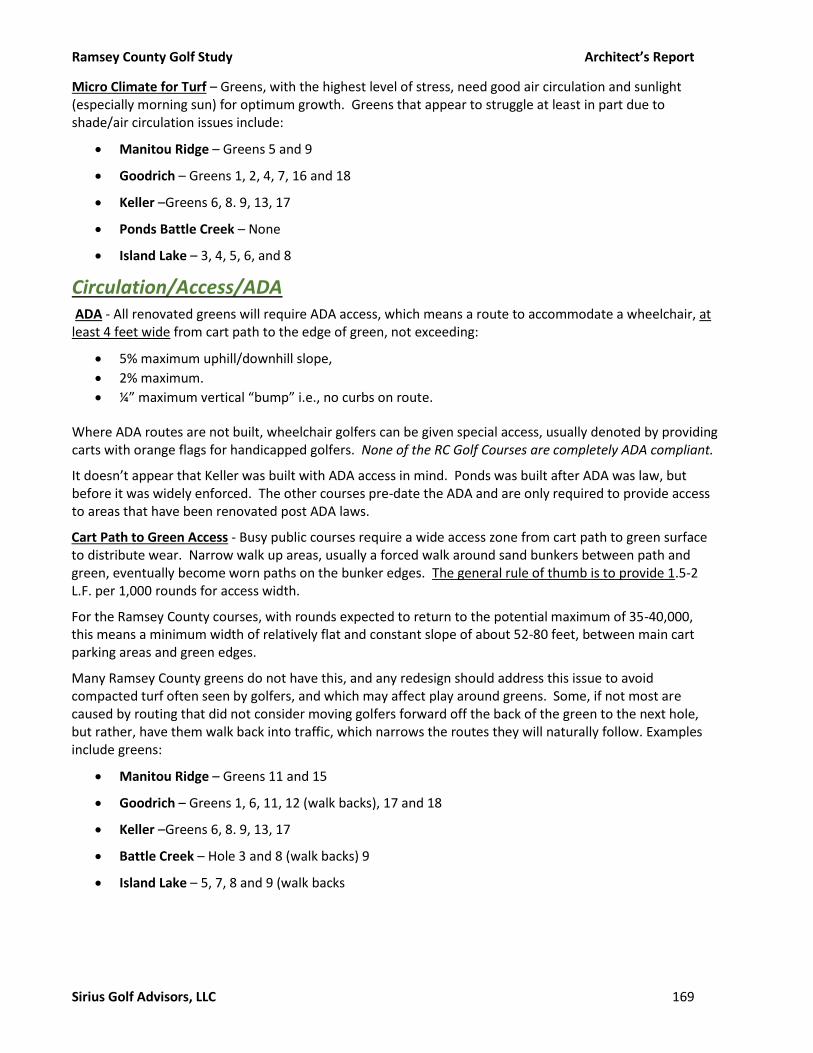
Ramsey County Golf Study Architect’s Report
Sirius Golf Advisors, LLC 169
Micro Climate for Turf – Greens, with the highest level of stress, need good air circulation and sunlight (especially morning sun) for optimum growth. Greens that appear to struggle at least in part due to shade/air circulation issues include:
• Manitou Ridge – Greens 5 and 9
• Goodrich – Greens 1, 2, 4, 7, 16 and 18
• Keller –Greens 6, 8. 9, 13, 17
• Ponds Battle Creek – None
• Island Lake – 3, 4, 5, 6, and 8
Circulation/Access/ADA ADA - All renovated greens will require ADA access, which means a route to accommodate a wheelchair, at least 4 feet wide from cart path to the edge of green, not exceeding:
• 5% maximum uphill/downhill slope,
• 2% maximum.
• ¼” maximum vertical “bump” i.e., no curbs on route.
Where ADA routes are not built, wheelchair golfers can be given special access, usually denoted by providing carts with orange flags for handicapped golfers. None of the RC Golf Courses are completely ADA compliant.
It doesn’t appear that Keller was built with ADA access in mind. Ponds was built after ADA was law, but before it was widely enforced. The other courses pre-date the ADA and are only required to provide access to areas that have been renovated post ADA laws.
Cart Path to Green Access - Busy public courses require a wide access zone from cart path to green surface to distribute wear. Narrow walk up areas, usually a forced walk around sand bunkers between path and green, eventually become worn paths on the bunker edges. The general rule of thumb is to provide 1.5-2 L.F. per 1,000 rounds for access width.
For the Ramsey County courses, with rounds expected to return to the potential maximum of 35-40,000, this means a minimum width of relatively flat and constant slope of about 52-80 feet, between main cart parking areas and green edges.
Many Ramsey County greens do not have this, and any redesign should address this issue to avoid compacted turf often seen by golfers, and which may affect play around greens. Some, if not most are caused by routing that did not consider moving golfers forward off the back of the green to the next hole, but rather, have them walk back into traffic, which narrows the routes they will naturally follow. Examples include greens:
• Manitou Ridge – Greens 11 and 15
• Goodrich – Greens 1, 6, 11, 12 (walk backs), 17 and 18
• Keller –Greens 6, 8. 9, 13, 17
• Battle Creek – Hole 3 and 8 (walk backs) 9
• Island Lake – 5, 7, 8 and 9 (walk backs
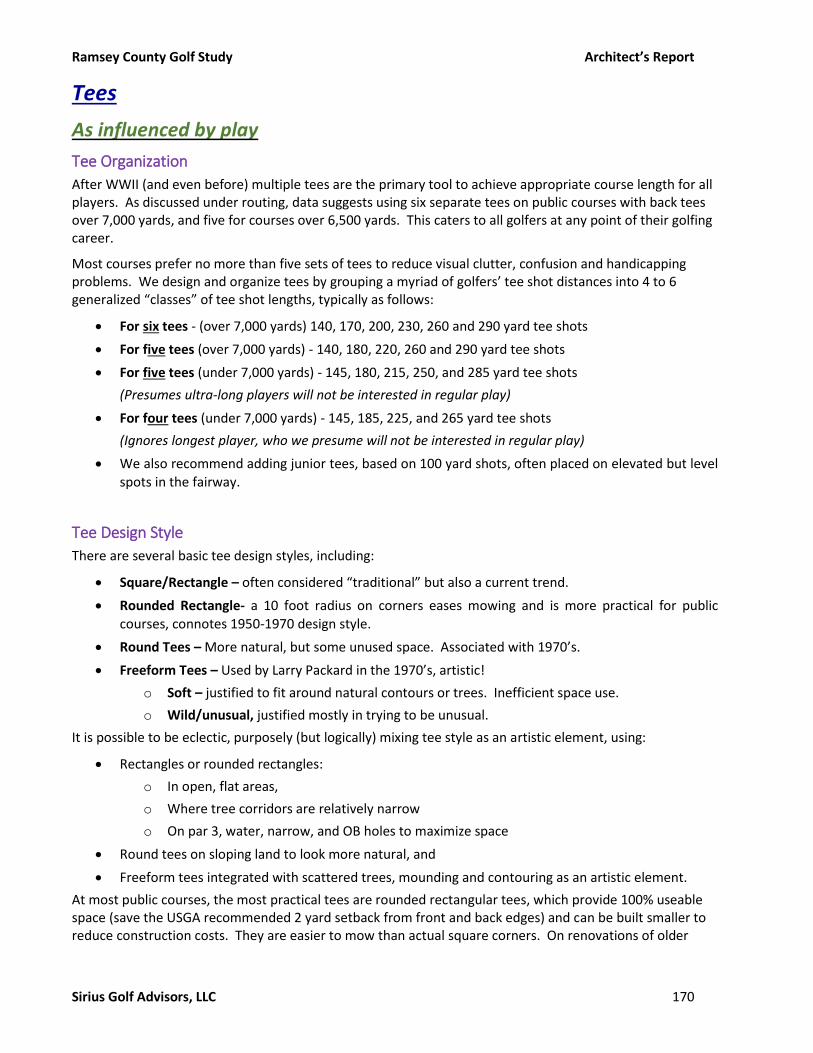
Ramsey County Golf Study Architect’s Report
Sirius Golf Advisors, LLC 170
Tees
As influenced by play
Tee Organization
After WWII (and even before) multiple tees are the primary tool to achieve appropriate course length for all players. As discussed under routing, data suggests using six separate tees on public courses with back tees over 7,000 yards, and five for courses over 6,500 yards. This caters to all golfers at any point of their golfing career.
Most courses prefer no more than five sets of tees to reduce visual clutter, confusion and handicapping problems. We design and organize tees by grouping a myriad of golfers’ tee shot distances into 4 to 6 generalized “classes” of tee shot lengths, typically as follows:
• For six tees - (over 7,000 yards) 140, 170, 200, 230, 260 and 290 yard tee shots
• For five tees (over 7,000 yards) - 140, 180, 220, 260 and 290 yard tee shots
• For five tees (under 7,000 yards) - 145, 180, 215, 250, and 285 yard tee shots
(Presumes ultra-long players will not be interested in regular play)
• For four tees (under 7,000 yards) - 145, 185, 225, and 265 yard tee shots
(Ignores longest player, who we presume will not be interested in regular play)
• We also recommend adding junior tees, based on 100 yard shots, often placed on elevated but level
spots in the fairway.
Tee Design Style
There are several basic tee design styles, including:
• Square/Rectangle – often considered “traditional” but also a current trend.
• Rounded Rectangle- a 10 foot radius on corners eases mowing and is more practical for public courses, connotes 1950-1970 design style.
• Round Tees – More natural, but some unused space. Associated with 1970’s.
• Freeform Tees – Used by Larry Packard in the 1970’s, artistic!
o Soft – justified to fit around natural contours or trees. Inefficient space use.
o Wild/unusual, justified mostly in trying to be unusual.
It is possible to be eclectic, purposely (but logically) mixing tee style as an artistic element, using:
• Rectangles or rounded rectangles:
o In open, flat areas,
o Where tree corridors are relatively narrow
o On par 3, water, narrow, and OB holes to maximize space
• Round tees on sloping land to look more natural, and
• Freeform tees integrated with scattered trees, mounding and contouring as an artistic element.
At most public courses, the most practical tees are rounded rectangular tees, which provide 100% useable space (save the USGA recommended 2 yard setback from front and back edges) and can be built smaller to reduce construction costs. They are easier to mow than actual square corners. On renovations of older

Ramsey County Golf Study Architect’s Report
Sirius Golf Advisors, LLC 171
courses, they connote tradition (not quite as well as square corners, and can fit better in narrow spaces between trees.
As influenced by Maintenance There are some agronomic considerations to tee design:
• Mowing Considerations o Rounded corners are easier to mow than square corners.
o Tee mowers cut 5 foot swaths, so rectangular tees at multiples widths of 5 feet can save
slightly on mowing time.
o Round tees need a minimum of 28-32 feet diameter for turning radius without
mowers “digging in” and damaging turf.
• Sizing Considerations o Round tees lose some useable tee space and should be 10% bigger.
o Free form tees can lose 15-25% useable space and must be sized larger.
o Dividing a tee area adds at least 12 feet length for each tee to accommodate the 2 yard front and back minimum recommended distance.
• Agronomic Considerations o Tee blocks are generally set 5-6 paces wide (15-18 feet) so useable areas of any tee should
generally be minimum 20’ wide, which allows for some grow in.
o Widths of 40/60 feet allow 2-3 different tee settings across for play variation.
o That said, narrow and long tees allow greater flexibility in course set up.
o One large tee is generally quicker to mow, but often not practical when fitting on slopes or
striving for vision down the fairway.
• Cart Path Access Considerations o Walk ups should be as wide as practical – not a single “cow path” which often moves turf wear
from path edge to on the tee at a limited entrance.
o Regardless of tee shape, straighter edges and constant slopes between cart path and tee distribute walk up wear the best.
o Tee shape curves and contouring between tee and path constrict traffic.
o Paths should be:
▪ At least 10 feet from the tee edge (closer proximity causes wear on the tee banks)
▪ Maximum 25 feet (longer encourages short cutting off the path on grass)
o The shortest two tees) require ADA access ramps, from cart path to tee surface, i.e., maximum 5% upslope, 2% cross slope, and no curb blocking the route.
The tee below has many qualities desired in a public course tee – large size, 10 foot wide path, curbs, good sunlight and air circulation, wide turning radius, and despite a free form shape, the tee edge and cart path are parallel, allowing golfers to spread traffic out.
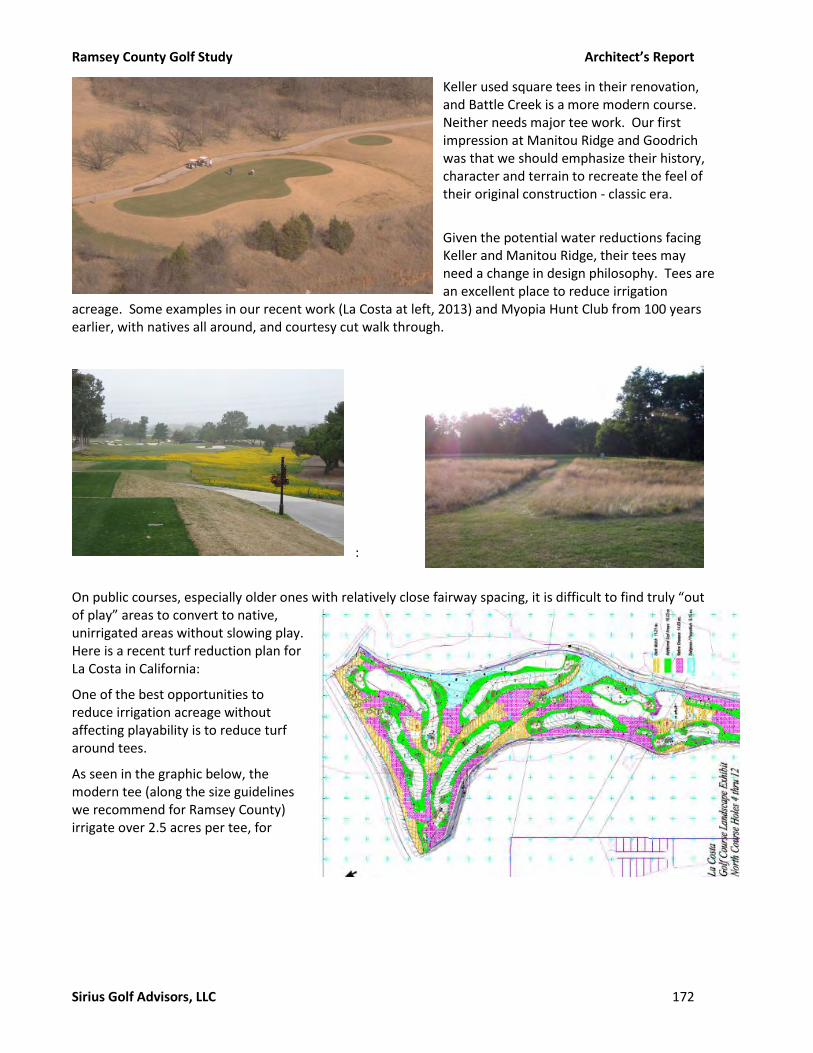
Ramsey County Golf Study Architect’s Report
Sirius Golf Advisors, LLC 172
Keller used square tees in their renovation, and Battle Creek is a more modern course. Neither needs major tee work. Our first impression at Manitou Ridge and Goodrich was that we should emphasize their history, character and terrain to recreate the feel of their original construction - classic era.
Given the potential water reductions facing Keller and Manitou Ridge, their tees may need a change in design philosophy. Tees are an excellent place to reduce irrigation
acreage. Some examples in our recent work (La Costa at left, 2013) and Myopia Hunt Club from 100 years earlier, with natives all around, and courtesy cut walk through.
:
On public courses, especially older ones with relatively close fairway spacing, it is difficult to find truly “out of play” areas to convert to native, unirrigated areas without slowing play. Here is a recent turf reduction plan for La Costa in California:
One of the best opportunities to reduce irrigation acreage without affecting playability is to reduce turf around tees.
As seen in the graphic below, the modern tee (along the size guidelines we recommend for Ramsey County) irrigate over 2.5 acres per tee, for

Ramsey County Golf Study Architect’s Report
Sirius Golf Advisors, LLC 173
about 0.16 acres of actual tee space. This can be reduced by reducing sprinkler spacing and using part circle sprinklers to reduce watered area.
• At many of your courses, with the narrow tree lines, a single row of sprinklers (while old fashioned) reduces watered area to 1.75 Ac.
• Narrowing the spacing to 50 feet and/or using one row of part circle sprinklers reduces watered areas to 69,500 S.F. or 1.6 Acres.
• Bigger savings come from tighter spacing and one side of part circle sprinklers, reducing to 1 Acre, while desert style of only watering tee tops reduces it to one half acre per tee.
• It’s possible to save 1-2 acres of irrigated acreage per hole, or 18-36 acres total, a significant reduction for courses potentially affected by the water reductions from White Bear Lake.
Total Tee Size
The industry recommended standard tees size is 15-20 SF per 1000 annual rounds. The chart below shows current annual rounds:
If the business plan is successful in raising play about 10%, we should consider sizing tees as follows:
Course March April May June July August September October *November December Total
Goodrich 451 3,434 5,991 5,403 6,023 6,080 3,934 2,563 (2,046) - 31,833 Keller 150 2,430 4,205 5,033 5,855 4,672 4,181 2,446 - - 28,972 Ponds 261 2,616 3,009 3,159 3,376 3,145 2,499 1,434 (555) - 18,944 Manitou 514 2,445 6,109 7,013 7,057 6,894 4,433 2,023 596 - 37,084 Total 1,376 10,925 19,314 20,608 22,311 20,791 15,047 8,466 (2,005) - 116,833
2017

Ramsey County Golf Study Architect’s Report
Sirius Golf Advisors, LLC 174
Course Rounds/Expected
Increase Ex. Tee Size
Prop. Tee Size
2 S.F./1000 Increase
Goodrich 32,000/35,000 3,461 S.F. 6,400 S.F. 102%
Keller 29,000/32,000 5,467 S.F. 6,000 S.F. 17%
Manitou Ridge 37,000/41,000 4,169 S.F. 7,400 S.F. 96%
Ponds 19,000/21,000 8,922 S.F. 7,400 S.F. NA
Island Lake 12,000/14,000 2327 S.F. 3,500 S.F. 72%
Ponds – Excellent Tee Size
Keller - Overall size at Keller can be increased by adding new, shorter forward tees, bringing it close to recommended standards. Continue using rectangular tees.
Manitou Ridge and Goodrich - Whenever tee renovations take place, we recommend you double tee sizes, using rounded rectangle tees.
Island Lake -Tees should be enlarged 25% over recommended sizes on all par 3 holes, which is all holes at Island Lake, but only when rebuilt for leveling and other purposes.
At all courses, tees should be 25% larger on:
• Par 3, narrow, water or O.B. holes.
• Holes with multiple levels of tees (to add front and back buffer space)
For Keller and Manitou Ridge, the irrigation design for tees (together with cart path planning, etc. should consider a reduced footprint in case water restrictions are encountered there.
Length and Tee Size Distribution
Research shows the approximate percentage of golfers preferring various course lengths. This typically relates to their tee shot length, as shown in the routing analysis, and we believe in pushing golfers to slightly shorter lengths to make golf more fun for them.
For maintenance, we distribute tee size proportionally to expected play levels at each length, to spread wear, etc. Note we have allowed for the higher than average female golf participation rate in Minnesota, where play distribution should be about:
PLAYER TEE SHOT % PREFERRED
LENGTH
TEE
SIZE
Short Long
Long Pro (If tee is provided) 320 0.1% 7200 7500 300 Ave. PGA Drive/Long Amateur 290 0.9% 7000 7200 300 Low Handicap Men 260 17% 6600 6900 1200 Average Men/Woman Pro 230 50% 6200 6500 3000 Average Senior / Long Women 200 12% 5600 6100 840 Super Senior/Competitive Women 170 10% 5000 5500 700
*Prime consideration is minimum size/turn radius for maintenance.

Ramsey County Golf Study Architect’s Report
Sirius Golf Advisors, LLC 175
**Some shifted to White Tee for blue tee flexibility to shorten on busy days to speed play.
Micro Climate for Turf
Good air circulation and sunlight reduces turf stress and provide (especially morning sun) for optimum growth. Tees that appear to struggle should consider tree and underbrush removal on the east side for sunlight, and south for air circulation. Tees with shade/air circulation issues include:
• Manitou Ridge – Tees 5 and 9
• Goodrich – Tees 1, 2, 4, 7, 16 and 18
• Keller – Tees s 6, 8. 9, 13, 17
• Battle Creek – None
• Island Lake – Tees 3, 4, 5, 6, and 8
Solutions include tree removal or trimming (where not required for safety) or even larger tees!
Soils
At each course, tee construction followed green construction, with Keller and Ponds of Battle Creek having 4-6” of sandy mix, while the older courses have tees originally built solely with topsoil, then top dressed for many years, building up 6-8” of sand for the current tee base.
Due to soils and heavy clay, these tees are compacted due to the soil type, despite aerification over the years. At a minimum, additional aerification and topdressing of the tees would improve the condition and playability of the tees.
Condition, Turf, and Level
Golfers will always complain about unlevel tees, and golfer surveys show your customers are no exception, with complaints higher at the older courses, as you would expect. However, complaints are far fewer than at other courses we have surveyed, meaning either Minnesota golfers don’t complain as much, or the tees are in better condition than expected.
Top dressing should be done at every course as part of the maintenance program.
Turf Types
This varies with the course –
Goodrich – They make a good impression, with a few tees having mottled turf.
o Height of Cut – ½” (good) o Levelness / Turf Quality / -Weeds-Generally good. o -Turf is mix of low mow blue, with bent creeping in. o Construction – 4” Greens Mix on Clay and topsoil. o Size – Adequate, about 80,000 S.F. total over 9 holes, or 9,000 each average o Topdressing – On a program
Keller – They make a good impression o Height of Cut – ½” (good) o Levelness / Turf Quality / -Weeds-Generally good. o -Turf is mix of low mow blue, with bent creeping in. o Construction – 4” Greens Mix on Clay and topsoil. o Size – Adequate, about 80,000 S.F. total over 9 holes, or 9,000 each average o Topdressing – On a program

Ramsey County Golf Study Architect’s Report
Sirius Golf Advisors, LLC 176
Manitou Ridge – They make a good impression, with a few tees having mottled turf.
o Height of Cut – ½” (good) o Levelness / Turf Quality / -Weeds-Generally good. o -Turf is mix of low mow blue, with bent creeping in. o Construction – 4” Greens Mix on Clay and topsoil. o Size – Adequate, about 80,000 S.F. total over 9 holes, or 9,000 each average o Topdressing – On a program
Battle Creek – They make a good impression, with a few tees having mottled turf.
o Height of Cut – ½” (good) o Levelness / Turf Quality / -Weeds-Generally good. o -Turf is mix of low mow blue, with bent creeping in. o Construction – 4” Greens Mix on Clay and topsoil. o Size – Adequate, about 80,000 S.F. total over 9 holes, or 9,000 each average
Island Lake – Tees 3, 4, 5, 6, and 8
Design and Construction Proposals Keller and Ponds - With new tees, they don’t need much work. We do recommend:
• Adding a new forward tee set at each course, at 4,000-4500 yards.
• Consider turf reductions around tees, using smaller sprinklers.
Manitou and Goodrich – These both need larger tees with better distance organization. The size, design, shade and soils at these courses make eventual reconstruction the only viable alternative, and that will include laser leveling, and mix to bring them up to the standards of Keller and Ponds.
Island Lake – As a par 3 course catering to beginners, forward tees are not required. The average tee size needs to be increased. They are unlevel, without mix, etc., making eventual reconstruction the only viable alternative.
Construction and Materials (i.e., sand mix or other)
When tees are rebuilt, we recommend that each get a 6” layer of root-zone mix consisting of Plaistead’s 7-2-1 sand tee mix, or similar. Some drain tiles may be necessary around certain tees. The basic construction method includes:
➢ Strip sod, ➢ Level and compact sub-grade with bulldozers ➢ Add 4-6” of tee sand or mix, ➢ Place occasional 4” drain tiles where required drainage ➢ Laser Level ➢ Sod banks for quick recovery ➢ Seed Tees to an aggressive Bent Grass

Ramsey County Golf Study Architect’s Report
Sirius Golf Advisors, LLC 177
Sand Bunkers
As influenced by Play For sand bunkers, play and maintenance seem to be even more intertwined than other golf elements, given current (and seemingly always growing) golfer demands for “fair” – often defined as “just as easy to play from than the fairway” and attractive, perfectly maintained sand bunkers.
I have never quite understood golfers thought on sand bunker placement, as it seems to be a fair bunker catches your opponent, but an unfair one catches you. Similarly, golf staff tend to recommend removal of sand bunkers that see “too much action” as well as those that see “too little action” as being detrimental to pace of play and maintenance costs. What the “just right amount of action” is, I can’t say.
Number and Type
Sand bunkers are traditional and expected in golf, but public courses can’t have so many as they can slow play excessively.
Over the years, some general guidelines have evolved regarding how many sand bunkers a course “should” have. The advent of costly bunker liners, and associated hand bunker raking required with some of them have worked together to generally reduce the amount of sand on the typical course. Higher maintenance costs have also contributed to both the number and average size reductions since 2006. Average size has dropped from 2,000 S.F. per bunker to 1,500 S.F. per bunker.
Typical number of/S.F. of sand bunkers
Course Type Per Hole Min Max S.F. Min S.F. Max
Muni 0-1 0 18 0 27,000
Upscale Public 1-2 18 36 27,000 54,000
Resort/Mid-Level Club 2-3 36 54 54,000 81,000
Upscale Country Club 3-4 54 72 81,000 108,000
Tournament 4-5 72 90 108,000 135,000
At Ramsey County, each course has about the right amount of sand. Island Lake has no sand bunkers, while the others trend appropriately in the mid-level expectations for upscale public golf. (30,000-40,000 S.F.) You could potentially reduce sand bunkers at Goodrich as it functions as a true municipal level course.
Most public courses in the post 2006 recession consider sand bunker reductions to save on maintenance. There is a careful balance between reductions and course image, especially in cases where we are trying to rebrand or upgrade the image of the course. It is difficult to reduce sand bunkering while simultaneously raising its profile in the market.
However, even on our own designs, we usually find some bunkers can be removed (perhaps replaced by grass bunkers or other grass hazards) while maintaining aesthetics and appearance of challenge. In general, moderate fee public courses can benefit from careful reduction on sand bunker quantity, by making each one count by serving multiple purposes of hazard, directional device, save bunker, etc.

Ramsey County Golf Study Architect’s Report
Sirius Golf Advisors, LLC 178
Sand Quality
Bunker sand quality comprises of both texture and color. Golfers prefer white sand over buff, and angular particles to reduce fried egg lies. The Ramsey County courses have:
• Sand –
o Buff colored sand,
o Slightly Coarse, prone to fired egg lies.
• Liners – None, and in combination with moderately steep slopes that periodically wash out, causing
unscheduled maintenance procedures.
• Aesthetics At your older courses, sand bunkers have little design character. Looking at aerial
photos dating back to 1947:
o Keller had a reasonable compliment of sand bunkers, most plain but some shaped. By the
1990’s, most seem to have been softened, flattened, with some removed.
o Goodrich began with one sand bunker!
Over the years, about a dozen were
added, but were always plain shaped.
Goodrich bunkers are easy to maintain
but have poor aesthetics.
o Manitou Ridge had none as of 1947,
but various renovations in and after
1978 raised that number.
o Island Lake, built in the 1990s as a
beginner facility never had any sand
bunkers, appropriately so.
o Battle Creek, opened in 2004, has a nice compliment of professionally designed sand
bunkers, although design emphasis was on maintainability, not aesthetics, again,
appropriately so for a public course.
Maintenance
Customers complain about the condition of sand bunkers, including playability, sand type and color (to a lesser degree) and raking.
We also note that most bunkers edges aren’t maintained crisply at the Ramsey County courses. Like most courses, sand bunker maintenance takes up a disproportionate amount of staff time, and this is typical at public courses, where they are a lower priority to spend limited funds /manpower.
That said, sand bunker conditions are often a direct result from then standard, but poor construction, specifically no bunker liners and under use of drain tiles. Placing sand directly on clay
soils is a recipe for making bunkers deteriorate over time. Additionally, the bunker banks are planted with a blend of blue and fescue, with the fescues creating a shaggy look some golfers dislike.
Given golfer comments, and the generally fast rising desire for higher quality bunkers, one of the top renovation priorities at all courses is to improve bunkers. We generally propose to reduce sand bunker size to reduce maintenance, as per below:
a. 7% at Keller – (existing 55/33,700 S.F.)

Ramsey County Golf Study Architect’s Report
Sirius Golf Advisors, LLC 179
While there is an excellent design at Keller, if bunker reduction is desired these bunkers are the weakest “philosophically” and can cause problems:
o Right side sand bunker at green 6 – blocks walk up to green o Right side sand bunker at green 8 – blocks walk up to green o Back left bunker at green 9 – limits circulation, steep, small. o Also, on 9 green, could shorten bunker to open front of green more o Fairway sand bunker mid hole on 16, between landing zones o Fairway sand bunker 50 yards in front of 17 green
If adopted, that is a reduction of 2,300 S.F.
b. 22% at Manitou Ridge (existing 28/39,874 S.F.)
At Manitou Ridge, possibilities for sand bunker removal/reduction, including:
o First Green – Remove right sand in favor of grass hazard for circulation o Hole 2 – Shorten right side green bunker for circulation o Hole 9 – Remove or downsize sand bunker far left of green o Hole 17 - Remove or downsize sand bunker far left of green o Hole 18 – Remove left third of left side green sand bunker (out of proportion) o Hole 18 -Shorten back right sand bunker to help circulation
Those six problematic sand bunkers total 9,000 S.F. of potential reductions.
c. 21% Ponds of Battle Creek (22/existing 32,213 S.F.)
At Ponds of Battle Creek with higher number and square footage of sand bunkers, and a reputation for difficulty, some removals are justified.
o First fairway – Convert right side sand bunker to mounds to speed play o Hole 3 – Remove left side bunker (visual sliver, tough hole) and right side green sand bunker
(blind) o Hole 6 – Remove front third of sand bunker (too far from green)
This totals about 7,000 S.F. reduction or removals. This can be revisited depending on the renovation option selected for the course (full 18 might keep more bunkers)
d. 31% at Goodrich (existing 34/38,050 S.F.)
At Goodrich, which caters to average golfers, sand bunker reduction makes sense, and any sand bunker that is not clearly visible, narrowing a fairway, or blocking circulation is a candidate for removal.
o 4 fairway left side short sand bunker o 5 sand bunker short of green and out of play o 7 fairway and green sand bunker (blind, block circulation) o 11 right side fairway (blinded by trees)

Ramsey County Golf Study Architect’s Report
Sirius Golf Advisors, LLC 180
o 11 right side green (blocks circulation o 16 green bunkers (large, blinded by tree (left) and block circulation (right) o 18 left fairway sand bunker (narrows fairway)
This reduces sand bunkers by 12,000 S.F. (Note: Sirius recommends an even greater reduction of bunkers if the course is repositioned as a value facility).
Sand Bunker Liners
In the last 5 years, due to increasing golfer demand, sand bunker liners have become nearly “standard” at even modestly priced courses and are (or soon will be) required just to compete for golfer’s pocketbook share.
Behind irrigation and about equal to better greens, courses of all kinds have found bunker reconstruction cost to be easily justified by higher greens fees and/or play, especially with favorable interest rates. Advantages to sand bunker liners include:
• Reduce sand contamination from rocks and clay below,
• Maintaining color, drainage.
• Holds sand up on banks even after substantial rain storms, reducing shoveling.
• Extends bunker life.
With competition, prices are effectively coming down (after inflation) and installation costs can be justified in both increased revenue potential and maintenance cost savings, by eliminating unscheduled sand wash outs.
There are two basic groups of bunker liners – Fabrics and Hard Surfaces/Soil Binders.
Fabrics - There are a few brands, such as Sand Trapper II which have been used for years. One is Sandtrapper II, (right) their top grade, which now has typical installation cost in the high labor rates in MN of about $2.00 S.F. for labor and materials.
Disadvantages of fabric liners include too many staples used for installation (which rakes can catch) and the need to hand rake bunkers, which is expensive, counteracting the main goal of cost savings.
In the last year, new, potentially stronger and longer lasting fabrics, using minimal staples, have come on the market as viable alternatives:
FlexScape, PolyLast (recycled rubber)

Ramsey County Golf Study Architect’s Report
Sirius Golf Advisors, LLC 181
Polylast products are made from 100% recycled rubber, which is durable, and can be painted buff or white to match sand and disappear if sand thins out. Another standby product is Bunker Solutions, like Astroturf, in white or buff to match your sand color. It’s an excellent, but lesser used product, due to cost. It is flexible (helps in clay soils) and will accept machine raking.
The cost difference between fabrics and hard surface liners is now minimal, suggesting the use of the best material possible. For example, Polylast and Flexscape costs about $2.00 S.F. vs. about $2.25 S.F. for Better Billy Bunker.
Hard Surfaces w/Soil Binders
Hard liners are considered by most to be the “silver bullet” of bunker lining and are currently the most commonly used bunker liners. The solid surface allows machine raking, a longer lifespan, better performance in most situations, and no club snagging on fabric. While they may shift in your clay soils, they are easily repaired.
The current product leader is “Better Billy Bunker.” It uses a 2” layer of gravel, coated with a specialized polymer spray, which hardens into a strong-but-flexible surface. Water drains through it up to 400” per hour, reducing erosive forces under the sand surface, while minimizing sand migration down and soil migration up. If grave is correctly sized, sand and gravel adequately “bridge”, much like the requirements for a USGA green.
In labor cost heavy Minnesota, materials and installation now runs under $3.00 per Sq. Ft. Installation requires using a “licensed” Better Billy Bunker installer which suggests completing large bunker projects at once to attain economies of scale. Most BBB installers won’t look at projects below nine holes at this time.
A similar product is capillary concrete, which cost about $0.50 more per S.F., which also gives excellent results and is preferred by many.
In the last year, manufacturers have begun to address more defined bunker edges – a problem at the Ramsey County courses. New products like “Perma Edge” and “Dura Bunker “help attain a crisp edge. They are artificial turf strips laid around the bunker to provide a 1-2 inch deep lip. 1” lip in combination with Better Billy Bunker shown below right. Perma Edge construction detail for a ½”-2” lip below left.
As noted, the St. Paul area averages 11 rain days per month, and 44 per season, with an average of 0.34” of rainfall each time, which can be enough to wash sand. If:
• 67%, or 29 of those rains wash sand to some degree, and
• Those require a 4-person crew, 8 hours each, to fix, and
• Labor rates of $18 per hour, or approximately $500 per day.
• Annual cost for re-shoveling approaches $20,000. One Nebraska public course superintendent
reduced his maintenance costs by $50,000 annually.

Ramsey County Golf Study Architect’s Report
Sirius Golf Advisors, LLC 182
The cost benefit ratio of renovating sand bunkers, even on public courses, is typically very good. Between the cost savings and appeal to draw new golfers and please existing ones, it should pay off. (details elsewhere in this report) As a county with a high bond rating, Ramsey County has the lowest interest rates possible, which should make the debt payment vs. annual cost come out favorably, even if rates rise slightly in the next year as anticipated. For Ramsey County, we recommend all courses improve sand bunkers by:
• Re-shaping where other redesign/renovation is taking place
• Complete new drainage
• Installing Better Billy Bunker, with fabrics as a lower cost option if cost is an issue.
• Installing a 4”-6” Perma Edge or Dura Bunker lip - (First deduct if cost is an issue)
• Using white bunker sand at Keller and, if major upgrades, at Manitou Ridge)
• Using existing buff bunker sand at Goodrich and Ponds of Battle Creek.
The total cost of renovating sand bunkers, including new drains, prep work, liner and re-establishing the edge runs from $7.10-$9.50 S.F. For each course, with about 30,000-38,000 S.F. of sand bunkers (at present) the construction cost will be for liners about $213,000-$360,000 per course, depending on material choices made.
When also renovating or redesigning green surrounds and in some fairways, there is also re-shaping to solve mowing, slope, size and proximity issues. That cost is included under our “Green Surround” or either of the fairway cost options. We find replacing sand with sod to reduce bunker sizes is about the same cost per square foot, so redesigning for sand reductions isn’t figured separately.
The biggest possible cost savings is replacing potential white sand with the buff color sand used at Keller and elsewhere. Changing to fabric liners and eliminating the bunker edging are also possible, which explains the difference between the $7.10 and $9.50 S.F. Unit costs.
Drainage
Bunker drainage has been a problem at all courses, and while liner reduces drainage problems, we recommend extensive in bunker drainage, and 6” over 4” for major exit pipes to increase capacity.
Reshaping
Many courses install bunker liners without changing any characteristics, but the additional costs are worth it in most cases. This adds a few weeks of dozer time (At least $35,000) and sodding the banks back after reshaping, typically an area equal to the bunkers size itself, but allows you to reduce bunker size, re-position them for a variety of reasons (to make course easier or faster to play, for example.
Sand Type
Sand cost varies depending on choice. White sand is preferred by golfers, but is sometimes a tough choice when finances are tight.
Fairway and Rough Turf Type – Turf type at Keller is a bent mix, while Manitou Ridge and Goodrich have the traditional public course mix of bent and rye. At Ponds of Battle Creek, bent is creeping in, but the superintedent doesn’t mind, believing it is a superior turf under shorter cuts. (We agree)
Width - As shown in the features section, on the USGA Slope Rating Chart, the ideal width for fairways at public is at least 32 yards, with 40 preferred. Most of the Ramsey County fairways are too narrow, compounded by complaints of deep rough.
▪ Manitou Ridge – Average Width – 26 Yards

Ramsey County Golf Study Architect’s Report
Sirius Golf Advisors, LLC 183
▪ Goodrich – Average Width – 22 Yards
▪ Keller – Average Width – 29 Yards
▪ Battle Creek – Average Width – 41 Yards (Hole 5 at 13 yards)
▪ Island Lake – NA
It is easy enough to widen fairway when both it and the rough are varieties of bluegrass, but harder at Keller and Ponds, where there are different turf types. Possible solutions include:
1. Introduction of intermediate cut of rough
2. General reduction in rough mowing height to reduce punitive factor.
Since golfer surveys mention “rough height” as a complaint at all courses, we recommend both an intermediate cut and generally lower rough height for Manitou, Goodrich and Keller.
Trees One of your biggest tree issues is Emerald Ash Borer. Since its first detection in 2002 in Canton, Michigan, it took only as little as two years to reach Minnesota, with definite confirmation occurring in 2009. Nationally, the insect has killed millions of ash trees and is predicted to kill many more.
Several local and state agencies have made recommendations for control. With early identification, manual or chemical insect removal is possible, and onsite inspection of golf course trees may yield some candidates for treatment. However, from all indications, ash trees on your golf courses are most likely going to be removed.
The question is, if each course stands to lose dozens to hundreds of mature trees, how will that potentially affect the character of those courses?
Keller, Manitou Ridge, Island Lake and Goodrich can be described as “Parkland” courses which feature a mix of wooded areas and open fields. Most areas of these courses were originally open fields, with extensive long term planting, including ash trees, eventually creating substantial tree cover. The Ponds of Battle Creek is a links or prairie style course, with some tree planting. Having opened in 2003, years before confirmation of the EAB, it also contains some ash trees.
Once removed, the basic recommendation is to be replaced with better, and more diverse range species.
I believe you might not need to plant trees at all, and don’t need to be worried about one for one replacement. Why?
The last three US Opens have been played at near treeless courses - Chambers Bay, Oakmont and Shinnecock Hills. These courses didn’t play any easier than more tree lined courses. The first two were built on treeless sites, and Oakmont pursued tree removals, turning their heavily wooded course into a more open one. They are the poster child for an emerging “tree removal” trend.
It is catching on, but still far from universal. Golfers like trees, and your older golfers probably recall the years of tree planting that converted former pastures to amply treed courses, only to see a new generation question their thinking.
Thus, we do not recommend opening your courses for purely design reasons and believe you should keep trees that are defining doglegs, separating holes, and providing backdrop, filtered shade, strategy, penalty and character.

Ramsey County Golf Study Architect’s Report
Sirius Golf Advisors, LLC 184
However, like most architects, we agree that some tree removals are good for a variety of reasons, including previous over planting. Your tree planting may have become a classic case of “Too much of a good thing.” Less definitely can be more. Each tree needs to be multi-functional, and not problematic to play, turf or circulation. Aesthetics, views and even playability can be improved by removing trees.
As one superintendent pithily notes, “Which do you want, trees or turf, because you can’t have both!” Heavy woods can cause problems in:
• Pace of play, from lost golf balls. Any trees over 180-200 yards from a green aren’t necessary for
challenge or strategy, since golfers in those locations can’t reach the green anyway and need no
additional architectural punishment. At the same time, challenge for better players is unaffected.
• Agronomics, via their:
o Shade on green and tee surfaces
o Roots underneath green and tee surfaces
o Reduction of air circulation
• Water Use – Tree use more water than turf. Tree reduction can be used at courses affected by
White Bear Lake irrigation reductions.
• Maintenance Costs – Trees need:
o Trimming, leaf and branch pick up, etc.
o Closely spaced trees are mowing problems (although very tight clumps, with mulch beds can
increase mowing production)
o Aesthetics - Random clumps are more natural and attractive than straight lines, which tends
to occur in over planting (i.e., let’s fill in every open area with a tree)
Removing trees for agronomy reasons should be a no brainer. Trees:
➢ Near greens and tees with canopy over (and roots under) that block morning sun and/or air
movement
➢ That restrict or block:
o Cart flow to and from cart path and fairway
o High use walk-up or cart path access routes
➢ Objectionable species, including fast growing, but weak branched species like most maples, willow,
and poplar, or messy trees like Sycamores
➢ Diseased species like the Ash, affected by Emerald Ash Borer.
For each course, we recommend an in house program, focused on:
➢ Removing trees that causes agronomic problems, unless required for safety
➢ Pursue tree removal during any reconstruction (golfers are gone, less likely to notice)
➢ A moratorium on future tree planting
➢ Retaining a local arborist to help you determine tree health to develop a long term tree plan.
Cart Paths The existing cart paths on all courses are primarily located at greens and tees, with some par 3 holes having full paths.
Busy public courses typically prefer “full loop” systems, continuously paved from tee to greens, as moderate and larger rains can sometimes put courses out of play. Even on moderately “damp” days, cart traffic compacts soils, and can cause ruts, which causes drainage problems, which eventually damages turf.

Ramsey County Golf Study Architect’s Report
Sirius Golf Advisors, LLC 185
Some have been “fixed” by additional gravel, constant roping, etc., costing several thousand dollars per year. A few paths curve after extending from tees, shown below, better distributing traffic, but gentler curves would spread traffic more, and is the basis of better cart paths and less wear.
Courses with full loop cart see them as an “insurance policy” to keep tee sheets full on rain days and from ½ to 3 days after each rain, depending on course drainage. Experience shows:
• Days with no carts cuts play to walkers only, reducing play about
60%.
• Days with carts restricted to paths, reduces play up to 30% for cart
golfers not willing to put up with extra walking.
Justifying the investment is harder to calculate, given the rising price of concrete or asphalt (with asphalt being typical in MN).
Another issue with adding full loop, continuous cart paths on older, tighter courses is that you force golfers towards adjacent play corridors, possibly causing safety problems. Without full paths, play spreads out within your fairway, further from the adjacent fairways, which is safer. Thus, adding paths at this time may increase your liability exposure while not significantly adding to revenues.
However, your partial cart paths also cause every day issues due to poor design. They don’t extend as far as they should and “dead end” on a straight line, funneling traffic. That causes excessive compaction and wear, which eventually destroys the turf. As shown below, a partial path system should:
• Extend about 50-75 yards from front of forward tee
• Extend back 50-75 yards from front edge of a green,
• Past any swales or soggy areas
• Curve gently to disperse traffic over a broader area as each golfer exits on a straight line to their tee
shot location.
• Cross in front of the tee at gentle angle, which, while not as aesthetic, is better for traffic
distribution.
Even with these design improvements, path exits in front of tees and entries in front of greens will still need extra aerification, topdressing and fertility to overcome the wear from the carts and remain viable turf. Some roping is still often required, but design should reduce unsightly ropes and the time consuming task of moving those daily.

Ramsey County Golf Study Architect’s Report
Sirius Golf Advisors, LLC 186
This hole at Keller demonstrates the distribution of paths taken by golfers when the path ends on a curve. We believe a gentler curve, keeping the golfer moving more forward than to the side, is even more effective. Note the last tire tracks are at about 45 degrees to line of play.
Many paths end on a straight, dead end like this one. You can already see damage in early season.
With little floodplain, Ramsey County courses don’t seem to have enough maintenance issues or lost play days to merit extending paths to a complete system. Your superintendents (except at Keller) don’t favor the complete loops. We recommend against converting your paths to a full loop system and believe longer extensions out from tees and back from greens, combined with improving drainage will yield the best possible revenue results.
Carts can be dangerous. Consider consulting your insurance carrier for advice.
Material and Construction Most current Ramsey County paths are asphalt, which has been used by most Midwest courses. Options are:
➢ Asphalt-Lowest cost, but shorter life span before requiring topping or rebuilding. Long term costs may be equal or greater than concrete. As a long term owner, building to a higher standard may make sense when considering life cycle costs. Current cost is around $2.75-3.00 S.F. Spending an extra $1 per S.F. for stronger asphalt and regular maintenance pay off long term.
➢ Concrete is more durable, and becoming more common, and sometimes price competitive. When bidding, we recommend
bidding both as alternate bids, as concrete may prove to be the better value choice. For many years, golf courses built paths with only fiber mesh for strength, with mixed results. Now, most use reinforced with steel. Fiber mesh paths cost about $2.75 S.F., but with steel mesh or rebar, they cost about $3.75 S.F
➢ Porous Paving, which is about twice the cost of concrete, at $8.00 S.F., limiting golf course use, even as it is common in other urban landscape architecture to meet stormwater and environmental goals.
➢ Gravel/Decomposed Granite While less expensive than hard surfaces, crushed rock paths have never been stable, especially on slopes, and are rare on golf courses, except in desert climates and as maintenance short cuts, where it is better than dirt.
➢ Other methods have been tried with limited success, including “old driveway style” (right) and plastic honeycombs to support either gravel or grass paths.
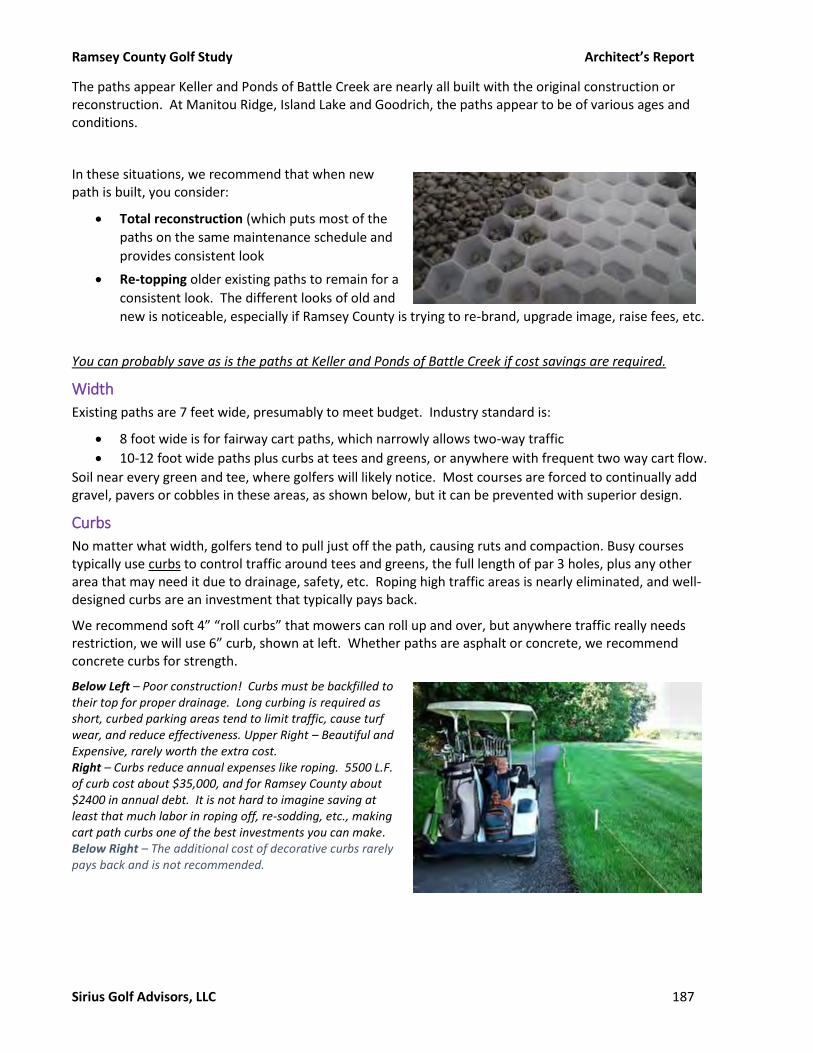
Ramsey County Golf Study Architect’s Report
Sirius Golf Advisors, LLC 187
The paths appear Keller and Ponds of Battle Creek are nearly all built with the original construction or reconstruction. At Manitou Ridge, Island Lake and Goodrich, the paths appear to be of various ages and conditions.
In these situations, we recommend that when new path is built, you consider:
• Total reconstruction (which puts most of the
paths on the same maintenance schedule and
provides consistent look
• Re-topping older existing paths to remain for a
consistent look. The different looks of old and
new is noticeable, especially if Ramsey County is trying to re-brand, upgrade image, raise fees, etc.
You can probably save as is the paths at Keller and Ponds of Battle Creek if cost savings are required.
Width
Existing paths are 7 feet wide, presumably to meet budget. Industry standard is:
• 8 foot wide is for fairway cart paths, which narrowly allows two-way traffic
• 10-12 foot wide paths plus curbs at tees and greens, or anywhere with frequent two way cart flow.
Soil near every green and tee, where golfers will likely notice. Most courses are forced to continually add gravel, pavers or cobbles in these areas, as shown below, but it can be prevented with superior design.
Curbs
No matter what width, golfers tend to pull just off the path, causing ruts and compaction. Busy courses typically use curbs to control traffic around tees and greens, the full length of par 3 holes, plus any other area that may need it due to drainage, safety, etc. Roping high traffic areas is nearly eliminated, and well-designed curbs are an investment that typically pays back.
We recommend soft 4” “roll curbs” that mowers can roll up and over, but anywhere traffic really needs restriction, we will use 6” curb, shown at left. Whether paths are asphalt or concrete, we recommend concrete curbs for strength.
Below Left – Poor construction! Curbs must be backfilled to their top for proper drainage. Long curbing is required as short, curbed parking areas tend to limit traffic, cause turf wear, and reduce effectiveness. Upper Right – Beautiful and Expensive, rarely worth the extra cost. Right – Curbs reduce annual expenses like roping. 5500 L.F. of curb cost about $35,000, and for Ramsey County about $2400 in annual debt. It is not hard to imagine saving at least that much labor in roping off, re-sodding, etc., making cart path curbs one of the best investments you can make. Below Right – The additional cost of decorative curbs rarely pays back and is not recommended.

Ramsey County Golf Study Architect’s Report
Sirius Golf Advisors, LLC 188
High play courses require at least 150-200 LF of curb at each tee and green, plus putting green and practice areas (with gaps for ADA), totaling 5500-8,000 L.F. Curbing only short portions at tees and greens tends to concentrate foot traffic to those parking areas, and longer curbs spread wear out.
Drainage
When retrofitting existing courses, drainage details make the difference. New or over laid paths often trap water if not laid on grade. Our cart path budget allows 5-10% for additional drainage on, near, or under the paths.
Left - Retrofitting cart paths involve restoring shoulders for drainage.
(Right) - Adding drainage via catch basin or slot drain in low spots is often required.
Bridges
Bridges are an integral part of the cart path system, particularly at the Ponds of Battle Creek, where we note many bridges appear to have shifted and settled, as shown below. The course has 3 bridges totaling and over 300 L.F. We did not do an engineering assessment, which could be done by a local engineer or similar bridge builder (like Bridge Builders, Inc. 800-874-9403).
Obviously, the safest recommendation is to replace all bridges with new construction. Typical prices as of 2018 are $500-600 L.F., meaning Ponds of Battle Creek may have to spend about $150-180,000 to replace bridges, if the existing bridges are beyond repair.
Drainage Ramsey County Courses have good topography with very little flood plain, which is good for drainage, but also have clay soils, which can cause problems.

Ramsey County Golf Study Architect’s Report
Sirius Golf Advisors, LLC 189
Complete drainage design is beyond the scope of this report, and it’s also not practical without complete as-builts of the existing drainage. Our recommendations for drainage include:
• Commission a survey of underground drainage system including locations, construction material,
and grades or all existing drain pipes. Include an estimation of condition, age, etc.
• The existing crew should seek out and uncover turf covered catch basins to increase function (and
help the surveyors)
• Retain a golf course architect and/or engineer (not all golf architects are expert at designing
drainage) to assess the system and design replacements, additions and upgrades to allow all holes at
Ramsey County Courses to drain at an equal rate. (If one hole is closed, all will be closed in many
situations)
Drainage is always an ongoing problem at golf courses. As one veteran superintendent notes, “I won’t add drainage to the course every year…. just the years I work there.”
In addition to annual minor drainage projects by in house staff, whenever major construction takes place, we recommend a more intensive look at course drainage. While complete drainage design is beyond the scope of this report, given its importance, I include a few comments on the basics of golf course drainage design.
➢ Take care of surface drainage problems on the surface, with minimum surface pitch of 2-3% to catch basins or inlets, and solid (not perforated) drain pipe. The perfect time to add surface drainage is concurrent with any new irrigation systems, installing the drainage pipe first, since it requires critical grades. Grading around an existing irrigation system is difficult, but not impossible.
➢ Take care of subsurface problems with subsurface drainage, i.e. perforated 4-6” French drains, imbedded in gravel at the seepage location and depth. Many superintendents use tile drains to correct surface problems, only because of on hand machinery but it rarely works well.
➢ Golf courses should drain at the same rate everywhere, since one closed hole closes all 18. Rather than “wing it” use engineering drainage formulas. The Rational Method (Q=CIA) is enough to size drainage pipes on most golf courses.
➢ Only need to drain “every day” storms, Absent property protection, health, safety, and welfare issues, we can choose relatively small “design storm” criteria, typically designing to drain:
o All nuisance water to avoid continuous wet swales and low areas.
o As little as ¼ or ½ inch per hour rains immediately to avoid play delays.
o A 1-2” storm within an hour, accepting short ponding a few times a year to reduce initial cost, and works as a filter and settle out golf course inputs, which is good environmental practice.
o A 100 year, 24-hour storm in less than 72 hours, the time span that submerged turf can die after sweltering summer rain storms.
➢ Avoid Undersized Pipe, which is a mistake for a few reasons:
➢ Value –Pipe price rise with the diameter inch, but pipe capacity rises by the square of the diameter inch (Area=π 𝑟2.) 8” pipe cost 25% more than 6” pipe but carries 78% more flow to increase capacity cheaply.
➢ Minimum/Maximum Slope – Pipes should have enough slope to achieve “self-cleansing velocity” (3 feet/second) to avoid maintenance problems. Larger pipes need flatter grades to attain necessary flow rates. There is also a maximum slope and velocity (usually 5-9 Foot/Second) for each pipe size to avoid exit area erosion problems.
➢ HDPE drain pipe is a construction value, easy to install, and should last forever.

Ramsey County Golf Study Architect’s Report
Sirius Golf Advisors, LLC 190
➢ Avoid Undersized Catch Basins/Inlets –Typical 6-8” diameter basins in play areas, might help aesthetics, but they are the limiting factor for system capacity, and often have reduced capacity caused by clippings blockage.
➢ Once piped, remain piped until out letting into a pond, or larger pipe. Ending pipe anywhere within golf turf leads to soggy golf course turf……
This is particularly evident at Keller, where many small basins appear to drain slowly, affecting golf course turf.
Design Needs/Improvement Proposals
Keller Golf Course 5 year old construction and great design puts Keller in the “Initial Years Renovation” mode, meaning to continue to finish items that may have been left out or underbuilt due to budget reasons in 2013. It is and will remain your flagship course.
Other potential problems and possible (lower priority) proposals:
▪ Feature Design Changes –There are few complaints after this renovation. However, persistent problems include:
▪ Level 14 fairway in landing zone
▪ Remove Tree on 17
▪ Greens – Holes 11 and 17 have areas with too much slope for easy putting, but they are not impossible (based on my trial putts) so no changes should be made until other construction takes place.
The five biggest items to correct: 1. Practice tee needs to curve inward to direct shots away from houses on left. (which is in process
prior to this study)
2. Sand Bunkers – Need to improve play characteristics
a. More tile drainage
b. Bunker liners (Better Billy Bunker or similar preferred)
c. White sand to enhance play and as upscale course.
d. Use Dura Bunker or Perma Edge for more defined edges.
3. Undersized Catch Basins – We recommend larger catch basins in valley fairways to increase capacity.
4. Extend cart path system to a full loop system. (Bentgrass fairways (some in valleys with slower drainage) and partial paths cause turf wear.
5. Irrigation –
a. As per EC recommendations of pump station controls and repeaters for radio control
b. Implement Reduced Turf Area Plans at Tees to reduce future irrigation
6. 14th fairway is too sloped, many balls collect in one spot.
7. Add 6 new forward tees for Tee Equity, to add tee space.

Ramsey County Golf Study Architect’s Report
Sirius Golf Advisors, LLC 191
▪ Tees – The new forward tees will effectively create more tee space on smaller tee holes.
▪ Fairway – Improve drainage on valley fairways, like 3, 7, 16 by increasing catch basin size from 6-8” to 12-24” basins as they are the limiting capacity factor. If those don’t sufficiently improve drainage, do full drainage study to upsize pipes
▪ Rough – None, although shorter cut is always appreciated by golfers.
▪ Sand Bunkers – See Sand bunker section for suggested reductions and improvements. No others need redesign or re-shaping
▪ Drainage – Continue to add small drains in house, as needed.
The driving range issues have been identified previously. In addition to tee-reorientation, we recommend upgrading the amenities in the area. The porta potty and falling down gazebo are not in keeping with the course.
Above - According to most golfers, this tree on 17 doesn’t allow enough room to play! While the tree on hole 4 gets history points, most would prefer this one be cut down.
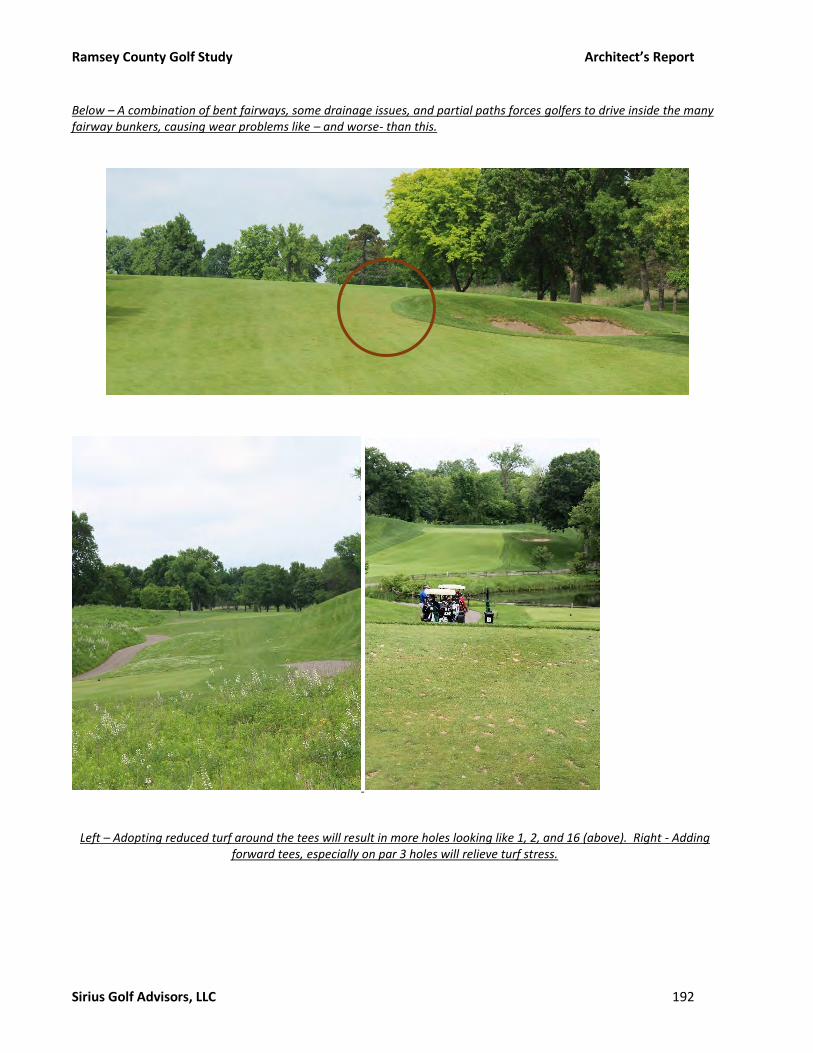
Ramsey County Golf Study Architect’s Report
Sirius Golf Advisors, LLC 192
Below – A combination of bent fairways, some drainage issues, and partial paths forces golfers to drive inside the many fairway bunkers, causing wear problems like – and worse- than this.
Left – Adopting reduced turf around the tees will result in more holes looking like 1, 2, and 16 (above). Right - Adding forward tees, especially on par 3 holes will relieve turf stress.
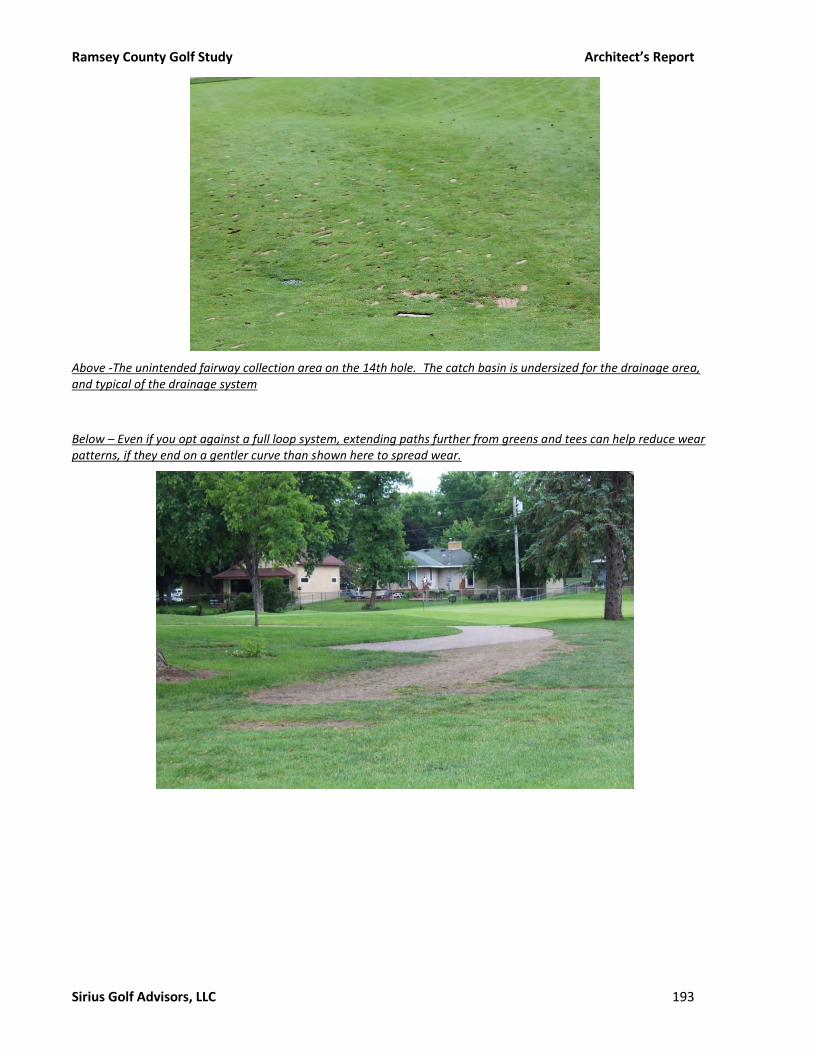
Ramsey County Golf Study Architect’s Report
Sirius Golf Advisors, LLC 193
Above -The unintended fairway collection area on the 14th hole. The catch basin is undersized for the drainage area, and typical of the drainage system
Below – Even if you opt against a full loop system, extending paths further from greens and tees can help reduce wear patterns, if they end on a gentler curve than shown here to spread wear.
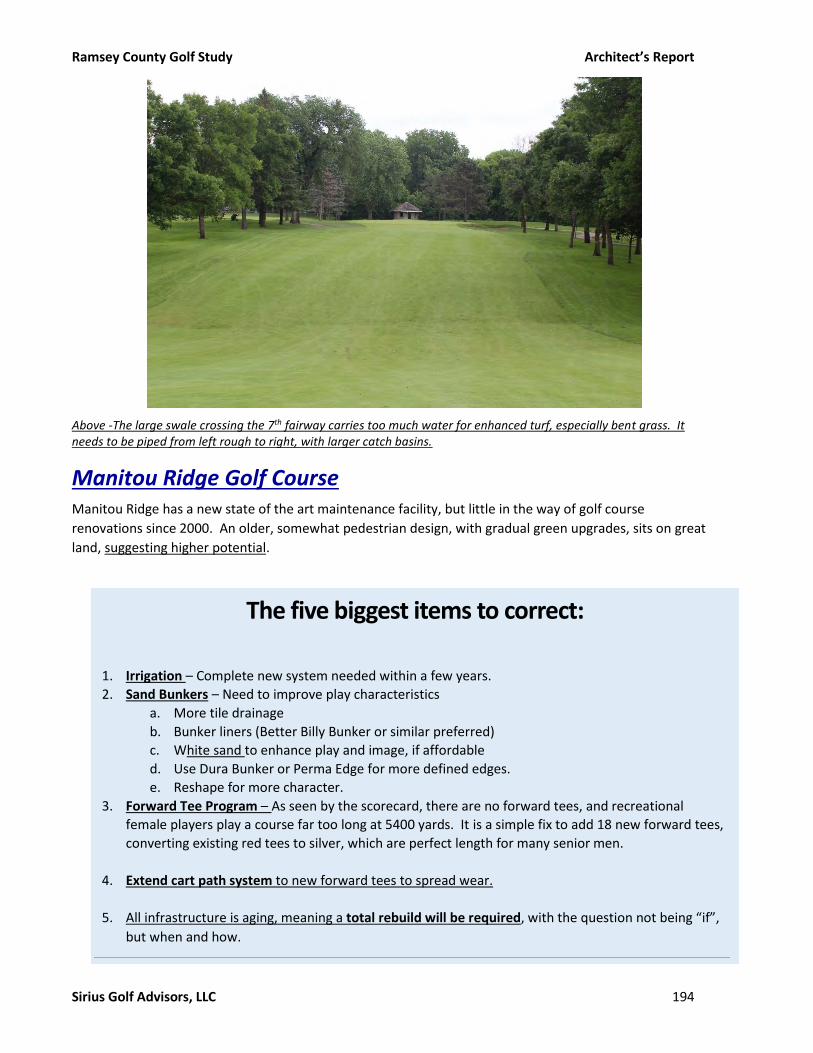
Ramsey County Golf Study Architect’s Report
Sirius Golf Advisors, LLC 194
Above -The large swale crossing the 7th fairway carries too much water for enhanced turf, especially bent grass. It needs to be piped from left rough to right, with larger catch basins.
Manitou Ridge Golf Course Manitou Ridge has a new state of the art maintenance facility, but little in the way of golf course
renovations since 2000. An older, somewhat pedestrian design, with gradual green upgrades, sits on great
land, suggesting higher potential.
The five biggest items to correct: 1. Irrigation – Complete new system needed within a few years.
2. Sand Bunkers – Need to improve play characteristics
a. More tile drainage
b. Bunker liners (Better Billy Bunker or similar preferred)
c. White sand to enhance play and image, if affordable
d. Use Dura Bunker or Perma Edge for more defined edges.
e. Reshape for more character.
3. Forward Tee Program – As seen by the scorecard, there are no forward tees, and recreational
female players play a course far too long at 5400 yards. It is a simple fix to add 18 new forward tees,
converting existing red tees to silver, which are perfect length for many senior men.
4. Extend cart path system to new forward tees to spread wear.
5. All infrastructure is aging, meaning a total rebuild will be required, with the question not being “if”,
but when and how.

Ramsey County Golf Study Architect’s Report
Sirius Golf Advisors, LLC 195
Other potential problems and possible (lower priority) proposals depend on the future vision for the course. It can remain the same, but has potential to be so much more, which would require some re-routing. Re-routing could also solve safety and other problems, as well as extend the currently short course to a back tee yardage of 6,600 yards. This length appeals to approximately 17% of players and might expand your play base.
Manitou Ridge has some safety and circulation problems that can only be addressed by re-routing, including:
• 11 Green in dogleg of hole no. 1
• 3, 6 12 Tees Unsafe due to proximity to other holes.
• 18th hole plays into setting sun.
• Walk backs from green to next tee on holes 2-3, 5-6, 11-12 and 12-13, with safety and slow play problems.
• Long walk from holes 13 to 14, and from 7 to 8.
• Elevated Tee, short driving Range brings highway and parking lot into play (safety)
Re-route to maximize site (see plan)
• Flip 9’s to avoid #18 playing into sun.
• Add length to back tees (from 6,400 to 6,600+ yards, preferable for A and B players)
• Eliminates/reduces safety issues at 11 green, 12 tees,
• Proposed fairway cuts on holes (new numbers, see routing) 1, 3, 6, 10, 13-16 to eliminate blind shots (for safety, speed of play)
• Moving the driving range is optional, but moving range downhill, moving entry road. Has these benefits:
o Some golfers complain about elevated practice tee
o Lowered tee reduces required net height.
o With re-route of existing entry road, extends range to 300 yards.
o Lower tee might reduce sun orientation problems.
o If range moves, first par 3 hole moved back to 7th, for speed of play.
Features Manitou Ridge has some wants, if not needs, improvements including:
• Greens – Complete redesign, to enlarge and enhance quality, USGA specs.
• Tees – Complete redesign, including new forward tees for “tee equity”, to enlarge. Cap with 7-2-1 Mix
• Fairway – None, except for re-routing, potential upgrade to bent grass.
• Rough – Add first cut rough, Add Native areas where possible to reduce mowing.
• Sand Bunkers – This depends somewhat on future course role. If it stays the same, we recommend bunker reductions (see sand bunkers). If it is re-routed, it will become more upscale, and we expect similar or more sand bunker size, with redesign, some relocation.
In either case, we recommend adding Better Billy Bunker or Equal liner, Dura Bunker or Perma Edge to crisp up designed edges, more drainage and new sand:
o Preferred Option - Convert to White sand to connote upscale course.
o Lower cost with buff sand

Ramsey County Golf Study Architect’s Report
Sirius Golf Advisors, LLC 196
• If the Practice Range remains the same, it is still possible to slightly enlarge the tee and add target greens to improve the look. Adding nets to either scheme increases safety.
• Golfers complain about the landscaping as too little and not well maintained. We recommend eliminating most of it, or staffing up to maintain it, to improve image as upscale course.
Infrastructure Analysis • Drainage – Is good, with a few wet spots in valleys that should be corrected on holes like 2, 3, 5,
9, 18, etc. All could be addressed with pipe, even with no re-routing for under $100,000.
• Cart Paths – Recommended option is to keep partial paths, but extend partial system forward from tees, back from greens. An option is to extend to full loop, with curbs at tees and greens
• Irrigation – As per EC recommendations, Entire new system.
• Implement Reduced Turf Area Plans at Tees to reduce future irrigation
Because of its upgrade potential, and potentially highest cost, we consider Manitou Ridge to be your highest priority renovation, to be pursued as quickly as politics and funding allow.
Tree trimming of lower branches will speed play, reduce ball searches.
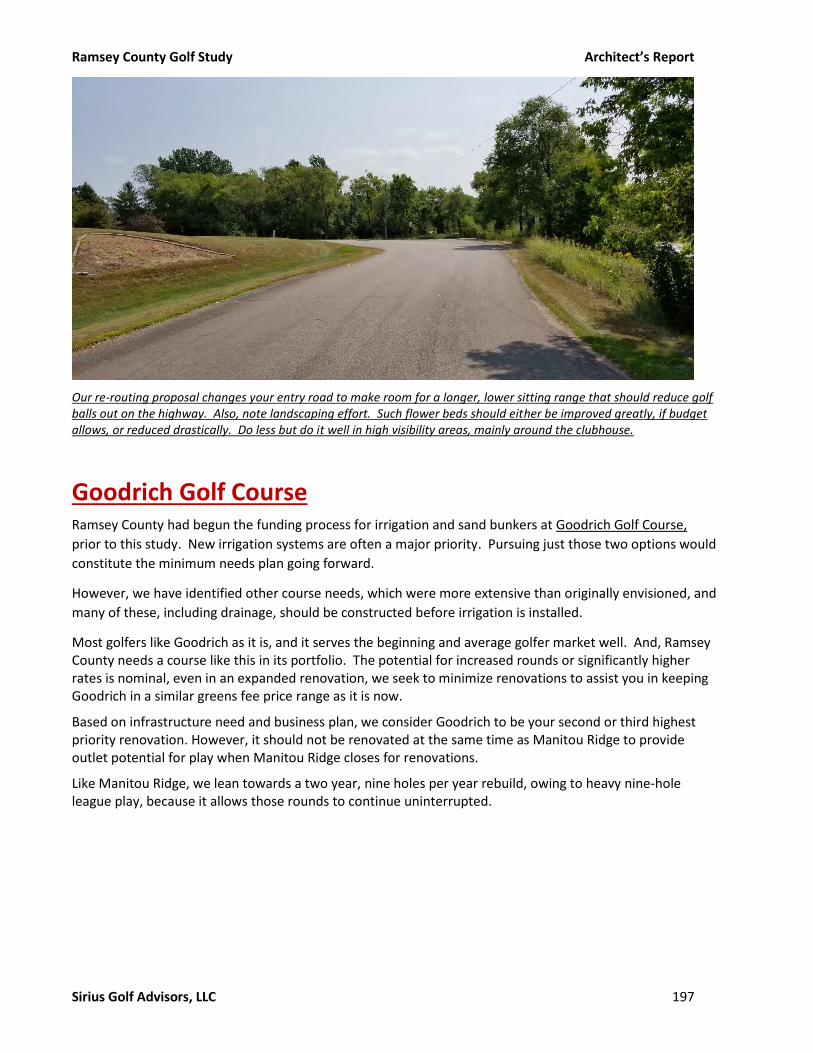
Ramsey County Golf Study Architect’s Report
Sirius Golf Advisors, LLC 197
Our re-routing proposal changes your entry road to make room for a longer, lower sitting range that should reduce golf balls out on the highway. Also, note landscaping effort. Such flower beds should either be improved greatly, if budget allows, or reduced drastically. Do less but do it well in high visibility areas, mainly around the clubhouse.
Goodrich Golf Course Ramsey County had begun the funding process for irrigation and sand bunkers at Goodrich Golf Course,
prior to this study. New irrigation systems are often a major priority. Pursuing just those two options would
constitute the minimum needs plan going forward.
However, we have identified other course needs, which were more extensive than originally envisioned, and
many of these, including drainage, should be constructed before irrigation is installed.
Most golfers like Goodrich as it is, and it serves the beginning and average golfer market well. And, Ramsey County needs a course like this in its portfolio. The potential for increased rounds or significantly higher rates is nominal, even in an expanded renovation, we seek to minimize renovations to assist you in keeping Goodrich in a similar greens fee price range as it is now.
Based on infrastructure need and business plan, we consider Goodrich to be your second or third highest priority renovation. However, it should not be renovated at the same time as Manitou Ridge to provide outlet potential for play when Manitou Ridge closes for renovations.
Like Manitou Ridge, we lean towards a two year, nine holes per year rebuild, owing to heavy nine-hole league play, because it allows those rounds to continue uninterrupted.
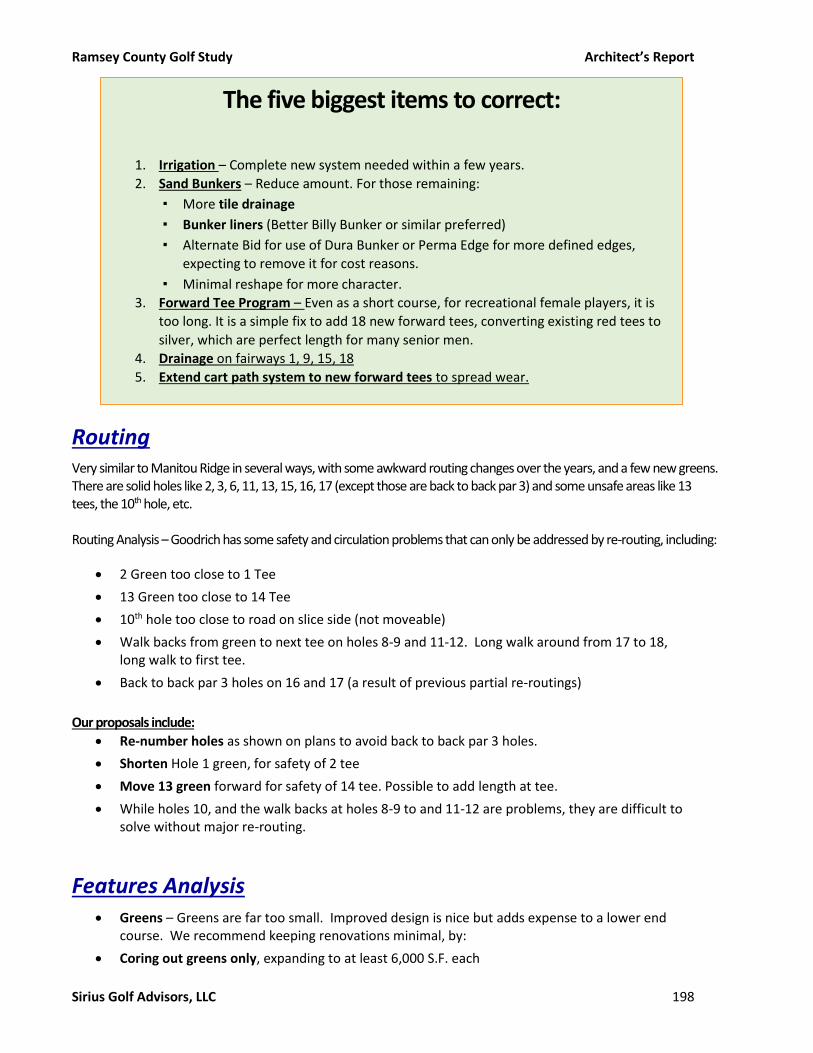
Ramsey County Golf Study Architect’s Report
Sirius Golf Advisors, LLC 198
Routing Very similar to Manitou Ridge in several ways, with some awkward routing changes over the years, and a few new greens. There are solid holes like 2, 3, 6, 11, 13, 15, 16, 17 (except those are back to back par 3) and some unsafe areas like 13 tees, the 10th hole, etc. Routing Analysis – Goodrich has some safety and circulation problems that can only be addressed by re-routing, including:
• 2 Green too close to 1 Tee
• 13 Green too close to 14 Tee
• 10th hole too close to road on slice side (not moveable)
• Walk backs from green to next tee on holes 8-9 and 11-12. Long walk around from 17 to 18, long walk to first tee.
• Back to back par 3 holes on 16 and 17 (a result of previous partial re-routings)
Our proposals include:
• Re-number holes as shown on plans to avoid back to back par 3 holes.
• Shorten Hole 1 green, for safety of 2 tee
• Move 13 green forward for safety of 14 tee. Possible to add length at tee.
• While holes 10, and the walk backs at holes 8-9 to and 11-12 are problems, they are difficult to solve without major re-routing.
Features Analysis • Greens – Greens are far too small. Improved design is nice but adds expense to a lower end
course. We recommend keeping renovations minimal, by:
• Coring out greens only, expanding to at least 6,000 S.F. each
The five biggest items to correct:
1. Irrigation – Complete new system needed within a few years.
2. Sand Bunkers – Reduce amount. For those remaining:
▪ More tile drainage
▪ Bunker liners (Better Billy Bunker or similar preferred)
▪ Alternate Bid for use of Dura Bunker or Perma Edge for more defined edges,
expecting to remove it for cost reasons.
▪ Minimal reshape for more character.
3. Forward Tee Program – Even as a short course, for recreational female players, it is
too long. It is a simple fix to add 18 new forward tees, converting existing red tees to
silver, which are perfect length for many senior men.
4. Drainage on fairways 1, 9, 15, 18
5. Extend cart path system to new forward tees to spread wear.
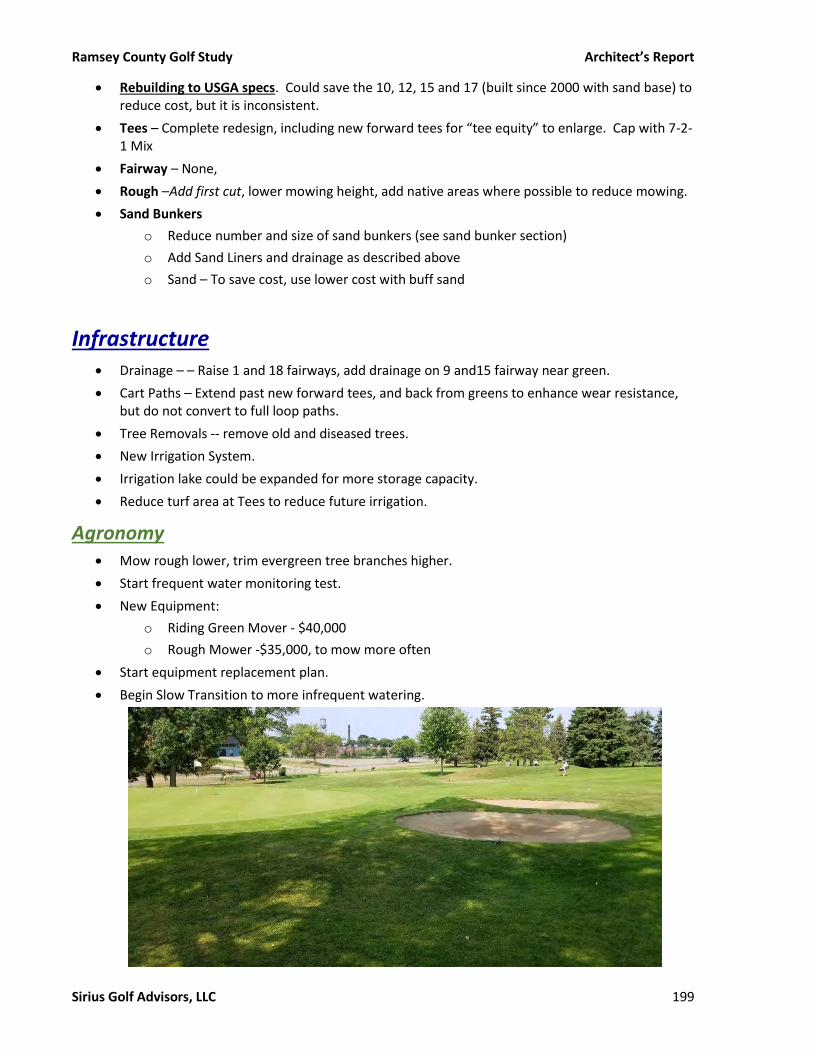
Ramsey County Golf Study Architect’s Report
Sirius Golf Advisors, LLC 199
• Rebuilding to USGA specs. Could save the 10, 12, 15 and 17 (built since 2000 with sand base) to reduce cost, but it is inconsistent.
• Tees – Complete redesign, including new forward tees for “tee equity” to enlarge. Cap with 7-2-1 Mix
• Fairway – None,
• Rough –Add first cut, lower mowing height, add native areas where possible to reduce mowing.
• Sand Bunkers
o Reduce number and size of sand bunkers (see sand bunker section)
o Add Sand Liners and drainage as described above
o Sand – To save cost, use lower cost with buff sand
Infrastructure • Drainage – – Raise 1 and 18 fairways, add drainage on 9 and15 fairway near green.
• Cart Paths – Extend past new forward tees, and back from greens to enhance wear resistance, but do not convert to full loop paths.
• Tree Removals -- remove old and diseased trees.
• New Irrigation System.
• Irrigation lake could be expanded for more storage capacity.
• Reduce turf area at Tees to reduce future irrigation.
Agronomy • Mow rough lower, trim evergreen tree branches higher.
• Start frequent water monitoring test.
• New Equipment:
o Riding Green Mover - $40,000
o Rough Mower -$35,000, to mow more often
• Start equipment replacement plan.
• Begin Slow Transition to more infrequent watering.
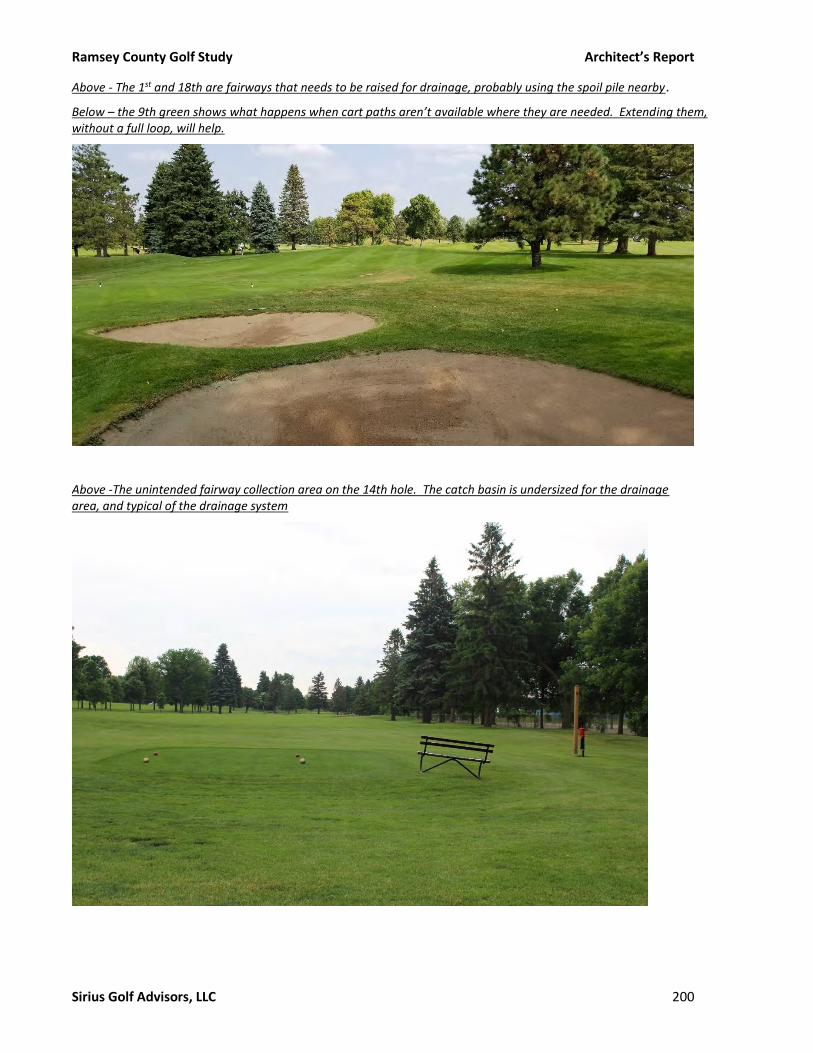
Ramsey County Golf Study Architect’s Report
Sirius Golf Advisors, LLC 200
Above - The 1st and 18th are fairways that needs to be raised for drainage, probably using the spoil pile nearby.
Below – the 9th green shows what happens when cart paths aren’t available where they are needed. Extending them, without a full loop, will help.
Above -The unintended fairway collection area on the 14th hole. The catch basin is undersized for the drainage area, and typical of the drainage system
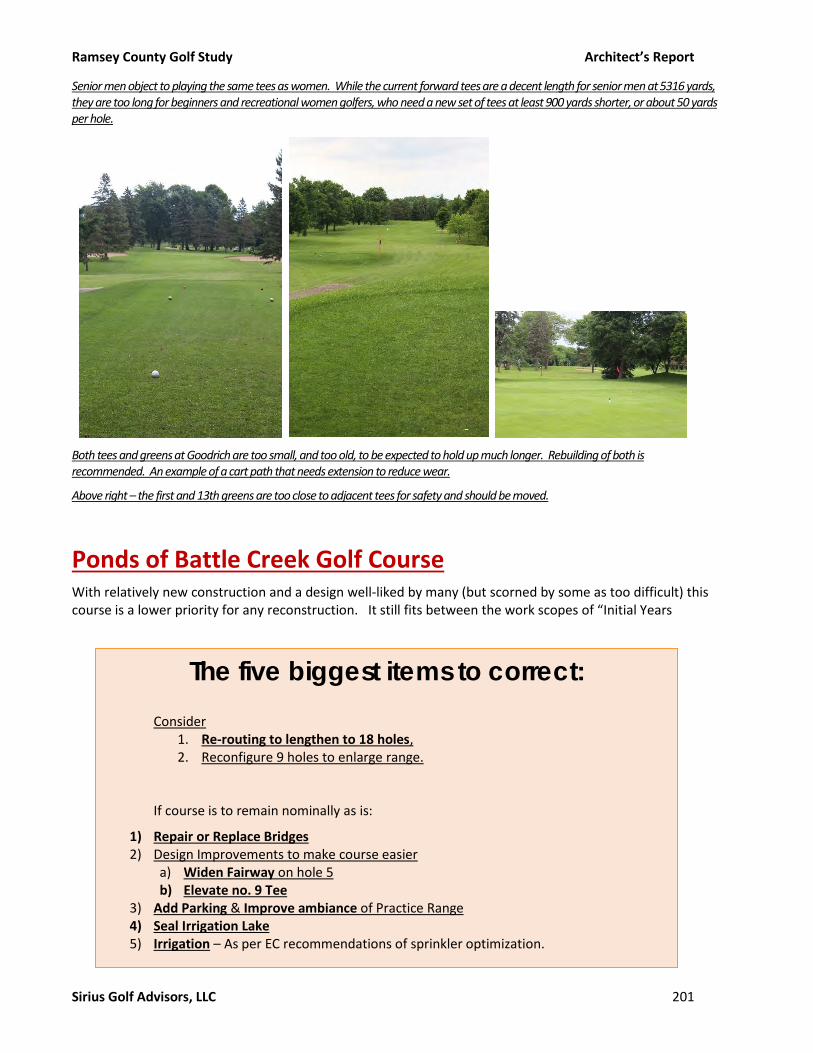
Ramsey County Golf Study Architect’s Report
Sirius Golf Advisors, LLC 201
Senior men object to playing the same tees as women. While the current forward tees are a decent length for senior men at 5316 yards, they are too long for beginners and recreational women golfers, who need a new set of tees at least 900 yards shorter, or about 50 yards per hole.
Both tees and greens at Goodrich are too small, and too old, to be expected to hold up much longer. Rebuilding of both is recommended. An example of a cart path that needs extension to reduce wear.
Above right – the first and 13th greens are too close to adjacent tees for safety and should be moved.
Ponds of Battle Creek Golf Course With relatively new construction and a design well-liked by many (but scorned by some as too difficult) this course is a lower priority for any reconstruction. It still fits between the work scopes of “Initial Years
The five biggest items to correct:
Consider 1. Re-routing to lengthen to 18 holes, 2. Reconfigure 9 holes to enlarge range.
If course is to remain nominally as is:
1) Repair or Replace Bridges 2) Design Improvements to make course easier
a) Widen Fairway on hole 5 b) Elevate no. 9 Tee
3) Add Parking & Improve ambiance of Practice Range 4) Seal Irrigation Lake 5) Irrigation – As per EC recommendations of sprinkler optimization.

Ramsey County Golf Study Architect’s Report
Sirius Golf Advisors, LLC 202
Renovation,” and “Ongoing Renovations” phases. However, at age 15, it has middle age and you should start long term planning for its upgrades.
Routing A unique factor at the Ponds of Battle Creek is that generally, 9-hole courses are easier courses targeted to beginners, but this course is quite difficult, and challenging in the ways average to poor golfers struggle with the most– forced carries.
We looked at three alternate routing options:
1. Leave basically as is. Possible routing changes include:
a. Adding length to the second hole to gain a stroke of par, length
b. Extend 3 tee back behind the cottonwoods to allow two full shots before crossing pond on
this par 5.
2. Expand to 18 holes, using land near prison across Lower Afton Road, which appears to be adequate
for nine holes. (Approx. 90 useable acres) at correctional facility and in regional park to expand to
18 holes if desired. Open, gently rolling. Connection to existing course requires design study.
3. Convert to a shorter executive/par 3 course and double size of range. This:
a. Reduces the impact of forced water carries, narrow fairways etc.
b. Nearly double the size of the profitable range tee
c. Room to add short game teaching facility, and
d. Room to expand parking, a much needed asset.
18-Hole Option On the 18-hole option, please consider:
IF willing to accept non-returning nines, with holes 3-11 north of the road, you can use your existing clubhouse. Given MnDot rules, it is likely that a bridge (hard to approve) or tunnel (more likely) connector between the two nines is required. With such a spread out course, it is possible an auxiliary maintenance storage equipment shed is desired.
IF you wish returning nines, which by many accounts adds over 3,000 rounds of play to the typical public course, that means the clubhouse must be located on new property north of Lower Afton Road, allowing nine holes on each side.
However, the course will be unbalanced, with the back nine shorter and of lesser par. This would make the existing small clubhouse and range basically “stand alone” off the street range, which would work well. However, returning nines also requires a New Clubhouse and Parking, and most likely a new Practice Range and Short Game area for convenience of golfers.
Adopting the 18-hole plan will be expensive, with 9 new holes, road tunnel at a minimum. For returning nines, add the cost of new clubhouse, parking, warm up range, short game area. The extra expense certainly diminishes return.
Executive Option On the 9-hole, shorter executive/par 3 option, slightly varying options are possible, including a 12 hole par 3, or a shorter than present executive course.

Ramsey County Golf Study Architect’s Report
Sirius Golf Advisors, LLC 203
In both cases, changing the course will depend on the market study.
9-hole Option If retaining the existing configuration of nine holes, Battle Creek has needs are like those at Keller:
Routing Analysis
Decent routing, but it has a few problems, including:
• Too many forced carries for the average golfer it is meant to serve.
• A few circulation problems
o Relationship between 5 and 9 greens is probably unsafe
o Green No. 7 is tight to road and takes golf balls.
o Walking golfers use the bridge on 5 as a short cut to 4 green, which provides safety problems.
o No place for carts to go when they cross that same bridge to 5 fairway
Features
There are a few features that could be improved:
• Forced carry on second shot of hole 3
• Narrow landing zone on 5
• Blind fairway from many tees on 9
• Cross slope on hole 7 kicks many shots into pond
We analyzed extending the second hole to a par 4 to add a stroke to par, but it will be difficult to keep lower Afton Road out of play without adding nets. We show it as an expensive option (with net cost).
Infrastructure Analysis
It does have some needs, some previously identified, and including:
• Irrigation System – Add controls, optimize sprinkler spacing
• Sand Bunkers
o Reduce 10%
o Upgrade with Better Billy Bunker, drainage, buff sand.
• Cart Paths – Extend further to enhance wear resistance, but do not convert to full loop paths.
• Enlarge Practice Tee –
o Rebuild Tee
o Improve Targets
o Rebuild Chipping Area
Because its needs are not substantial, we deem this to be third priority, perhaps started as late as 2023 or 2024. Without re-routing, changes could be accomplished in one autumn project.

Ramsey County Golf Study Architect’s Report
Sirius Golf Advisors, LLC 204
Recommended Improvements ➢ Re-routing – Select one of three options listed above.
➢ Feature Design Changes –
o Widen landing zone on hole 5.
o Raise tee on 9 by moving left
➢ Practice Range – (as is)
o Re do AstroTurf at back of tee
o Extend turf tee forward for more space
o Improve targets with real greens, etc.
o Improve sand bunker at west end of tee.
➢ Greens – No changes
➢ Tees – No changes
➢ Fairway - None
➢ Rough - None
➢ Sand Bunkers
o Reduce 5-10% for cost reasons.
o No redesign/Re-shaping
o Add Better Billy Bunker or Equal liner, Dura Bunker or Perma Edge to crisp up designed edges
o Add more tile drainage
o Refill with buff colored sand.
➢ Drainage – Add drainage to fairway no. 1 and 7 as needed
➢ Cart Paths - Option 2 - Extend partial system to new forward tees, back from greens to spread wear
➢ Irrigation –
o Upgrade control package as per EC recommendations
o Line Irrigation Pond to stop leaking
➢ Implement Reduced Turf Area Plans at Tees to reduce future irrigation
➢ Add some trees.
➢ Agronomy
o Start frequent water monitoring test
o Purchase most needed equipment
▪ Aerifier - $30,000
▪ Commercial Riding Mower ($10,000)
o Start equipment replacement plan
o Begin Slow Transition to more infrequent watering

Ramsey County Golf Study Architect’s Report
Sirius Golf Advisors, LLC 205
Hole no. 2 could be extended to a par 4 and would look like this. It requires moving the first green and perhaps the pump house. While it is far from Afton Road, some might argue nets are necessary for an added measure of safety, since the road is on the slice side.
Below – the 9th fairway is mostly blind from the tee, but the tee can be raised by placing in on a mound just left of this photograph. I hear the original designer wanted it that way but was overruled for some reason…. Note the mottled turf. Tees and fairways have bent grass invasion, as it seems to be better adapted. The superintendent is fine with this, as bent really doesn’t cost as much extra to maintain as some think.

Ramsey County Golf Study Architect’s Report
Sirius Golf Advisors, LLC 206
Below – the sand bunkers have crusty sand, due to sand choice and poor drainage. As with the other courses, liners and improved drainage will improve the bunkers. Unlike Keller and Manitou, we cannot justify the extra cost of white sand at a course like Battle Creek.
Below-All the bridges seem to have structural problems. While a bridge engineering study is outside the scope of this report, we have included a substantial budget for repair and at least partial replacement, since it is obvious some work will be necessary.

Ramsey County Golf Study Architect’s Report
Sirius Golf Advisors, LLC 207
Above – the narrow landing zone of the fifth hole should be addressed. It would take significant retaining walls, and elimination of the bunker shown to widen the fairway. Also possible, eliminate, or move it west, the higher 4th tee, allowing fairway expansion to the holes’ left. In the shorter executive scheme, we propose removing the back tees to allow tee shots to carry further up the existing fairway for an easier shot.
Below-In the shorter executive scheme, we propose converting the 3rd hole to a par 4 short of the pond and uphill par 3 over the pond. That makes the forced carry a shorter shot, with an iron, off a tee, rather than a fairway wood off an uneven lie, a much easier shot.

Ramsey County Golf Study Architect’s Report
Sirius Golf Advisors, LLC 208
Below-The range is busy, but lacks details, such as the targets vs. real greens, the cramped nature of the chipping area. In the shorter executive scheme, the range is expanded, and the short game area moved to existing 5 green to create more room. The existing putting green is removed to gain up to 35 more cars of parking.
Below-Future Parking?

Ramsey County Golf Study Architect’s Report
Sirius Golf Advisors, LLC 209
Below-Range tees can always be bigger to spread wear. Extending the tee back to the artificial turf tees would help somewhat.
It is also possible to double deck your range, if the market warrants it, as this public course range demonstrates. Here, you sacrifice turf tees (and their maintenance costs) to give the golfers shade, maybe heat (shown above each stall) and coolers, etc.

Ramsey County Golf Study Architect’s Report
Sirius Golf Advisors, LLC 210
Island Lake Built in 1968 by a road contractor, this facility has two parts – the driving range (biggest revenue source) and a nine-hole learner’s course.
Because of the road contractor, the grading is good, providing excellent drainage in most areas.
While profitable, there is little room to expand revenues on the golf course. Some call for the course to close, as being redundant in a down golf market. If it remains open, we see the basic plan is to “use it up and wear it out” putting off any renovation as long as possible, and minimizing changes made.
Issues include neighbors who complain about algae in the pond on 8, however, it is really a duckweed problem, causes by shallow water and warm temperatures. Excavating and de-mucking the lake would reduce the problem.
Routing A few problems exist, and the routing does not have the feel of one done by a professional golf course architect. It serves its purpose. There is also the opportunity to add slightly to length on holes 8 and 9, if desired. As per above, it is also possible to convert 9 to a par 3 to extend the range tee east for more capacity.
The six biggest items to correct: 1. Practice Range could:
a. Be moved to extend length of range
b. Could stand total rebuild to “freshen up.”
c. Re do astroturf at back of tee
d. Extend turf tee forward for more space
e. If hole 9 is shortened to a par 3, range tee could be extended east to increase
capacity. In any rebuild, needs to remain with inward curve to direct shots to
middle.
f. Improve targets with real greens, etc.
g. Improve sand bunker at west end of tee.
h. Remove mini golf as an eyesore
2. Maintenance Building – It appears substandard in many ways.
3. Irrigation – a. As per EC recommendations, we need a whole new system, including pumps. b. Dredge Irrigation lake to increase storage capacity, limit algae.
4. Duckweed in pond on hole 8 – Dredge to increase depth, remove silt layer. 5. The irrigation lake, with cold water entering, does have an algae problem. 6. Improve shade issues on tees 3 – 6

Ramsey County Golf Study Architect’s Report
Sirius Golf Advisors, LLC 211
Features and Infrastructure ➢ Greens – These are slightly small, but probably adequate for play levels. The 5th green has been rebuilt, the
others are original.
➢ Tees – These are slightly small, (averaging 2333 S.F.) especially for a par 3 course. Rebuild as they require. Use 7-2-1 Mix.
➢ Rough - None
➢ Cart Paths – These (somewhat ironically) are full loop paths. They have obviously been built at various times and sometimes, out of different materials. Some need repairs. The course can continue to patch them in, or at some point, all new paths could be installed, and/or be resurfaced for consistency.
➢ Drainage – No major problems. Continue to add small drains in house as need arises
➢ Trees- Tree removal on the east sides of many tees and greens will assist in turf growth.
➢ Agronomy
o Start frequent water monitoring test
o Purchase most needed equipment. Most seems in disrepair.
o Begin Slow Transition to more infrequent watering
Implementation Plan While many renovation projects occur after sudden turf loss/disasters, (occurring at +/- 1% of US courses annually) caused almost exclusively by regional extreme temperatures, drought or flooding, Ramsey County, this isn’t the case, as two courses have already been rebuilt, and three others are, as a result of this study, under consider consideration for improvements.
While golf courses seem “natural,” they are as constructed as structures and require capital expenditure to maintain functionality and appearance, while combatting slow deterioration (sometimes masked by maturing landscapes and turf.) Deferred investment is often a classic case of “Pay me now or pay me (more) later.”
The ASGCA and USGA and provide guidelines as to the expected lifecycle of golf course infrastructure.

Ramsey County Golf Study Architect’s Report
Sirius Golf Advisors, LLC 212
Many (if not most) courses extend the service life of their infrastructure beyond 30 years out of financial necessity. As infrastructure slowly wears out, course conditions decline, maintenance costs increase, repairs are more frequent, and typically revenues decrease as the course isn’t well conditioned. For all courses, new and improved infrastructure is eventually required.
Long term course owners are usually better off to build well and avoid the temptations of partial or substandard fixes.
Ramsey County has developed its own list based on local conditions, based on work of well-respected agronomist Terry Buchen, accounting for climate zones. I endorse his (and your) life cycle charts as accurate for your region.
Courses also typically find that the extra cost of new design features while the course is down can be beneficial. Studies show that good public course renovations typically pay off. Golfers respond to a better, higher value product offering, which should improve business in most golf markets, with:
➢ Substantial image changing
renovations, sometimes including re-naming and rebranding usually provides the biggest boost in total revenues. However,
➢ Smaller, targeted
improvements, that fix your biggest problems, like improving green surfaces, adding paths, improving bunkers, etc., also tend to bring golfers back. They yield smaller revenue increases, but since they cost less, they tend to produce a higher rate of return.
The “Life Cycle” chart may sound like a course goes on its merry way and needs to start considering renovations after 15-25 years. Not so. Even new courses have some improvement needs, which just increase over time, as described below.
Project Cool-season climates
Rebuild greens/collars/surrounds
USGA/California/sand-based 20 to 35+ years
Push-up 25 to 50+ years
Regrass Greens/collars
USGA/California/sand-based 12 to 25 years
Push-up 12 to 25 years
Rebuild tees/surrounds 15 to 20 years
Regrassing
Tees 12 to 15 years
Fairways 12 to 15 years
Approaches 12 to 15 years
Collection areas 12 to 15 years
Maintained roughs 20 to 25 years
Intermediate roughs 12 to 15 years
Native roughs/natural areas 15 to 25 years
Bunkers
Rebuild bunkers/surrounds 15 to 20 years
Replace sand 8 to 12 years
Replace drainage piping/liners 8 to 12 years
Irrigation system
Replace controllers/wiring/sprinkler heads/swing joints 10 to 12 years
Replace piping/valves/fittings
PVC 27 to 30 years
HDPE 45 to 50+ years
Replace pump station/fertigation 12 to 15 years
Drainage (fairways/roughs)
Replace corrugated metal pipe 25 to 30 years
Replace corrugated single-wall pipe 25 to 30 years
Replace PVC/double-wall pipe 25 to 35 years
Cart paths
Replace asphalt 12 to 15 years
Replace concrete 15 to 20 years
Lakes
Dredging 15 to 20 years
Replace lake liners 20 to 25 years
Rebuild lake edges 15 to 25 years
Bridges
Resurfacing 12 to 15 years
Structural rebuilding 20 to 25 years
Replace bulkheading/retaining walls 20 to 25 years
Tunnels
Replace Tunnels 25 to 30 years
Replace sumps/pipes/grates/lights/mirrors/paths 15 to 20 years
Replace pine straw/wood mulch 12 months
Driving range
Re-level/regrass practice tee 8 to 12 years
Rebuild practice tee 12 to 15 years
Regrass practice fairway/rough 12 to 15 years
Rebuild target greens/target bunkers 12 to 15 years
Short game practice area
Regrass greens 12 to 15 years
Rebuild greens 20 to 35+ years
Regrass tees/fairways/roughs 12 to 15 years
Replace bunker sand 8 to 12 years
Rebuild bunkers/surrounds 15 to 20 years
COOL SEASON GOLF COURSE INFRASTRUCTURE LIFE EXPECTANCIES
Ramsey County Golf Study Architect’s Report
Sirius Golf Advisors, LLC 213
Initial, In-House Renovations (Years 1-5)
Early work usually includes providing numerous “finish” items, whether overlooked or left out of original construction for cost reasons. These typically include additions of:
o Landscape and signage o Full (or paved) paths and/or curbs o Paved parking (or parking additions) o Permanent restrooms and/or shelters o Maintenance area, covered cart storage or clubhouse improvements o Drainage, drainage, drainage (add every year, no kidding) o On occasion, fixing Poorly Designed Holes for Safety, Speed of play, etc.
Ongoing Renovation/Improvements (Years 5-15)
After initial additions/renovations, minor, ongoing repair needs pop up, including replacing bunker sand, sodding dead turf areas, correcting minor drainage problems, etc. as they occur.
Most consultants and course management experts recommend an ongoing capital improvement budget of 6-10% of revenues to keep up. In addition, given eventual renovation is a must, the sooner an Owner begins setting aside money for a “Capital Asset Replacement Fund” the easier it will be to fund future renovations. If such a fund wasn’t started in the course’s early years, it is critical to begin one now.
Major Renovations (Years 15-30)
As a course ages, it is time to consider bigger renovations. Facilities built during the “boom” years of the 1980-1990’s are now 20-30+ years old, with infrastructure approaching the end of its expected life cycle. Courses built in previous boom periods (1950’s and 1970’s) are in their second or third infrastructure cycle!
Renovations should respond to their individual needs, and simultaneously consider the current golf marketplace, including consideration of:
➢ Replace and/or Upgrade Infrastructure – At some point, “patching” becomes ineffective and total
replacement is required. With rising maintenance expectations, quite often, replacing irrigation,
mowers, etc. means not only replacement, but upgrade to new levels to compete.
Subsurface or infrastructure improvements make maintenance easier and better, but since conditioning is usually the number one customer satisfaction driver in golf, can indirectly improve revenues as well.
➢ Replace and/or Upgrade Design to remain competitive, - Since the 2007 recession, the hotel, fast
food, restaurant and many other moderately priced chains businesses, are upgrading designs at
historic rates to attract and retain ever more picky customers. In the case of hotels, Fairfield
Inn/Hamptons now equal – and sometimes better – than their higher priced Courtyard/Garden
Inn relatives. McDonald’s now resemble coffee houses, Chevys have similar amenities to Cadillac,
etc.)
Locally, several competitors have or will be rebuilding “a better mousetrap” and many already have! Continued capital investment to update your look is nearly a must in golf, too.
If you close part or all the course to renovate infrastructure, it can also be time to improve design aspects of your course. This grows revenue as golfers respond to better golf experiences and improved playability and aesthetics.

Ramsey County Golf Study Architect’s Report
Sirius Golf Advisors, LLC 214
In addition to “Keeping up with the Jones’” many courses change roles over time, such as struggling private clubs converting to public courses being typical. Other transformations may occur when courses find the opportunity to move up a niche in the market by making dramatic, image changing renovations, and thus allowing significant revenue additions via round and price increases, etc.
Basic Implementation Methods After determining the answer to “what and how much”, “when and how” becomes the next question. There are three basic approaches to a major renovation of any course:
1) Single Phase/Complete Renovation
2) Two Year Renovation –
a) Complete 9 holes each in two consecutive years
b) Complete 9 holes each in three consecutive years for a 27-hole course)
3) Phased Renovation –
a) Mid Term - 6 holes over 3 years, or tackle major areas over 3 to 5 years
b) Long Term Phased Renovation – 1-2 holes (or equivalent) over 9-18 years)
For most of the post WWII era, clubs were fiscally conservative and long term renovations were common. In good economic times, i.e., prior to 2006-9, an increasing number of courses undertook complete renovations. This was driven by:
• Borrowing at low interest rates made loans more practical (still a positive factor)
• Baby Boomers less patient than previous generation (i.e., Instant gratification)
• Era of architectural Awards, Signature Holes, Photos drive “where to play” decisions
• Increased maintenance levels demanded, requiring better infrastructure
Since 2006, phased renovations are becoming more common again, but the basic math hasn’t changed, and there are advantages and disadvantages to each method.
Single Phase/Complete Renovation Complete renovation entails closing the entire golf course for:
1. 5-8 months of construction,
2. Another 3-12 months for maturation. (3-4 actual growing months, which can take from 3-12 actual months, if winter intervenes.)
3. Completing grassing within prime grassing dates (May/June in the south, July 15-August 15 in northern climates) minimizes down time/revenue loss.
We recommend complete renovation when there is:
• Immediate need due to flooding, freezing or other damage
• Desire to see results quickly
• Unique financing opportunity
• Ability to find other play venues
The major advantages to undertaking larger construction projects in one period include:
• Lower construction costs from economy of scale.
Ramsey County Golf Study Architect’s Report
Sirius Golf Advisors, LLC 215
• The ability to “do it right” without concern for minimizing disruption/golfer inconvenience.
• Construction Consistency You get a consistent look/quality by using one contractor/personnel.
• Material Consistency – Green and Bunker sands can vary over a few years, even from the same supplier/pit.
• Maintenance Consistency - Total rebuilding gives the superintendent the most consistent conditions. Three-year-old greens react quite differently (in both maintenance and play) than new greens, for example)
• More Impact upon Re-opening, as a “brand new” course worthy of playing.
• Long term master plan not required, as construction typically follows preliminary design immediately, saving fees.
• Multiple Course Owners (like Ramsey Co.) can spread play among other facilities
Disadvantages include:
• Financing a large project, usually requiring a loan or bond issue
• Disruption/Cessation of dining room/pro shop cash flow
• Possible loss of members or “regular” users to other courses. Many courses organize alternate golf venues and events, and it becomes a special time to play courses many would otherwise not play!
• Construction Delays can be costly. A week/month early in the project can translate to a month/year until opening.
• Lost revenue can be the biggest line item cost in renovations with construction delays but is not always figured in the total cost.
Phased Renovation (Short and Longer Term) Long term renovations are preferred by some for the following advantages:
• Often, can be cash projects, if kept small.
• More time to raise funds via donations, assessments, partial loans
• Properly planned and timed, cash flow disruption is minimal.
• At most courses, the inconvenience of playing one or two temporary greens will not affect play. (although 2 holes out of play impacts revenues)
• Initial and “Teenage Years” need) are taken care of this way, often in fall to minimize play disruption.
Disadvantages include:
• Continued Funding “Asks”
• Golf course is inconsistent in style, maintenance and play for years.
• Multiple years of disruption/golfer inconvenience (even if limited, still tiresome). Possibility of:
o Resentment towards annual play disruption
o Future Direction Change (new committee or personnel)
o Momentum Loss/Project Abandonment.
• Higher construction costs. Currently, rebuilding 18 greens complexes at once averages about $115,000-$165,000, if part of a full project. However, rebuilding just one or two greens raises that by 30-90% because
o Contractor supervision, move in, etc., not spread out over bigger project.
o No economy of scale
o Your in-house crew can’t aid the Contractor, because it still must maintain course.

Ramsey County Golf Study Architect’s Report
Sirius Golf Advisors, LLC 216
• Construction Inconsistency - You can get different looks/quality using different personnel over multiple years.
• Material Inconsistency – Green and Bunker sands can vary over a few years, even from the same supplier/pit.
• Maintenance Inconsistency – Especially troubling when a major goal is increasing consistency. As noted above, 3-year-old greens play differently than new greens.
• Less marketing impact /membership sales from slow changes.
• Long term master plan is required but may be credited against future fees by some architects.
• Construction Delays cost lost revenues.
2-3 year phasing programs accept some of the advantages and disadvantages of both:
• Makes results visible and appreciated relatively quickly, but with less marketing impact than a total
renovation.
• Multiple Course Owners can spread play among other facilities
• Nine (or 18 on 27 hole facilities) holes open for play while remodeling nine.
• Overall disruption period shortened. “Only” closes course for two years, (with northern climates
grow in time, probably three years total) reducing revenue loss and golfer inconvenience, but
possibly doubling the chances of losing some golfers permanently - over total renovation.
• Pro shop/restaurants maintain some cash flow, but often less than anticipated.
• Construction Material Inconsistency can be reduced by ordering all up front.
• Construction Contract let to same company for both phases, stipulating keeping key personnel, minimizes construction quality differences. Otherwise, two phase construction may yield style, material and quality differences.
• Construction cost is 10-30% higher over one, total renovation.
• Construction Delays cost lost revenues.
Implementation Recommendations for Ramsey County RC Golf courses generally follow two categories – recently built (Keller and Ponds) and older courses (Manitou Ridge, Goodrich, Island Lake) that will require a total (or near total) rebuild at some point due to age and condition of their infrastructure.
With both substantial play and required changes at the latter three courses, including a large percent of league and other nine-hole play, we recommend two-year phased renovations as the best fit for Ramsey County at Goodrich and Manitou Ridge.
Island Lake renovations, centered on the range, could leave the course open, and be accomplished in one year.
The various options for Battle Creek include building a new nine holes, which could be done first to keep the existing course in play until the new nine opens, then closing, to maintain at least existing nine-hole capacity until project completion.
If minimum changes are selected, it would entail a fall project, and more major changes to increase the range while reducing the course length would probably close the course for a year.

Ramsey County Golf Study Architect’s Report
Sirius Golf Advisors, LLC 217
At Keller, the scope of renovations is smaller, and more in line with initial or ongoing renovations. The relatively minor construction proposals at Keller can be done in fall, after prime season. One or more could be done any year funding is available.
Cost Estimates You asked us to anticipate a lengthy funding cycle, so we:
o Estimated work scope and cost based on current 2018 unit prices for similar projects.
o Adjusted for the labor rates and typical materials in MSP area. (about 15% higher)
o Added inflation factor of 3% annually, corresponding with proposed start date.
o Our estimates also include: ▪ Grow in (often overlooked in architect’s estimates at 3%),
▪ Bonds and testing (because many of the current unit prices we used for estimates were on private jobs not requiring bonds at 2%),)
▪ Soft costs, including design at 8%),
▪ Contingency, at 12%
We presume you could fund Keller and Ponds simultaneously with a full project. A look at the average projected costs of typical work items at each course, including.
▪ Improving Green Surfaces
▪ Rebuilding Green Surrounds
▪ Rebuilding Tees (front, middle, back)
▪ Sand Bunkers
▪ Redevelop fairways
▪ Re-route, redevelop fairways
▪ Irrigation (from EC Reports)
Each course summary adds unique elements to that course, like lake dredge, retaining walls entry roads and parking, dredging and/or lining lakes, landscape, etc. After developing those, we provide a summary of the total cost to implement proposed changes. We propose “highest and best” construction methods. However, we also suggest some alternates to reduce cost. Most are based on specific reduction proposals, others assume we can cut about 10% through intense value engineering and work scope reductions.
First, we provide the backup cost estimates per major items. After that, we use those as basic building blocks to establish cost estimates for each course.
Of course, we must offer the standard consultants disclaimer that we have no control over future bids or market conditions, or the eventual scope selections or combinations thereof made by the Owner, or designs by any consultant in the future.
As such, while we used reasonable professional care in preparing these estimates, we cannot or do not warrant that these estimates will match any future construction bids.
Details for the cost estimates can be found in Appendix H.
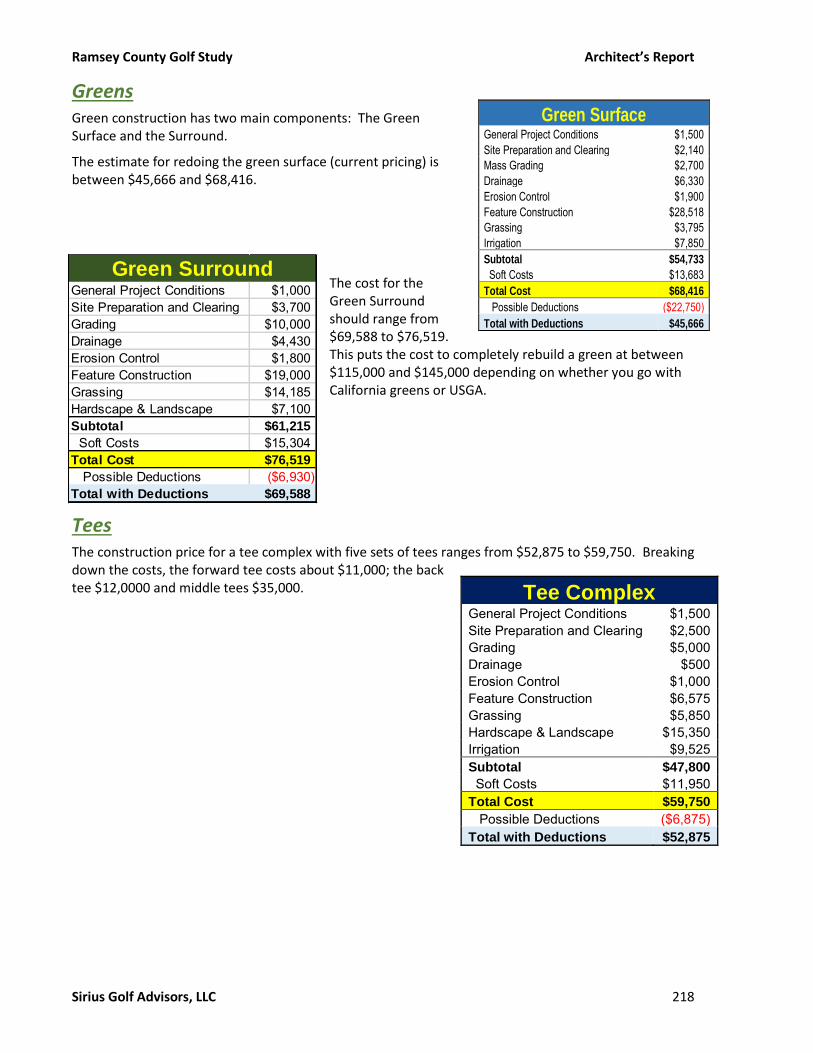
Ramsey County Golf Study Architect’s Report
Sirius Golf Advisors, LLC 218
Greens Green construction has two main components: The Green Surface and the Surround.
The estimate for redoing the green surface (current pricing) is between $45,666 and $68,416.
The cost for the Green Surround should range from $69,588 to $76,519. This puts the cost to completely rebuild a green at between $115,000 and $145,000 depending on whether you go with California greens or USGA.
Tees The construction price for a tee complex with five sets of tees ranges from $52,875 to $59,750. Breaking down the costs, the forward tee costs about $11,000; the back tee $12,0000 and middle tees $35,000.
Tee Complex General Project Conditions $1,500 Site Preparation and Clearing $2,500 Grading $5,000 Drainage $500 Erosion Control $1,000 Feature Construction $6,575 Grassing $5,850 Hardscape & Landscape $15,350 Irrigation $9,525 Subtotal $47,800
Soft Costs $11,950 Total Cost $59,750
Possible Deductions ($6,875) Total with Deductions $52,875
General Project Conditions $1,000Site Preparation and Clearing $3,700Grading $10,000Drainage $4,430Erosion Control $1,800Feature Construction $19,000Grassing $14,185Hardscape & Landscape $7,100Subtotal $61,215
Soft Costs $15,304Total Cost $76,519
Possible Deductions ($6,930)Total with Deductions $69,588
Green Surround
Green Surface General Project Conditions $1,500 Site Preparation and Clearing $2,140 Mass Grading $2,700 Drainage $6,330 Erosion Control $1,900 Feature Construction $28,518 Grassing $3,795 Irrigation $7,850 Subtotal $54,733
Soft Costs $13,683 Total Cost $68,416
Possible Deductions ($22,750) Total with Deductions $45,666
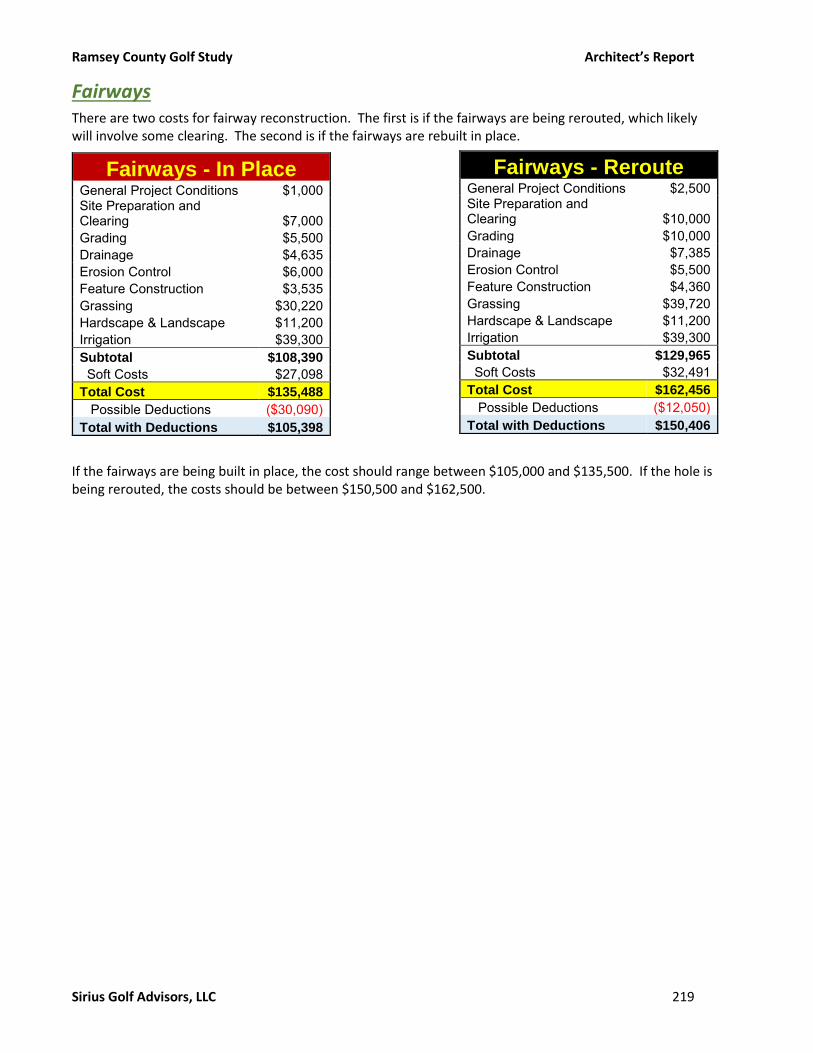
Ramsey County Golf Study Architect’s Report
Sirius Golf Advisors, LLC 219
Fairways There are two costs for fairway reconstruction. The first is if the fairways are being rerouted, which likely will involve some clearing. The second is if the fairways are rebuilt in place.
Fairways - In Place General Project Conditions $1,000 Site Preparation and Clearing $7,000 Grading $5,500 Drainage $4,635 Erosion Control $6,000 Feature Construction $3,535 Grassing $30,220 Hardscape & Landscape $11,200 Irrigation $39,300 Subtotal $108,390
Soft Costs $27,098 Total Cost $135,488
Possible Deductions ($30,090) Total with Deductions $105,398
If the fairways are being built in place, the cost should range between $105,000 and $135,500. If the hole is being rerouted, the costs should be between $150,500 and $162,500.
Fairways - Reroute General Project Conditions $2,500 Site Preparation and Clearing $10,000 Grading $10,000 Drainage $7,385 Erosion Control $5,500 Feature Construction $4,360 Grassing $39,720 Hardscape & Landscape $11,200 Irrigation $39,300 Subtotal $129,965
Soft Costs $32,491 Total Cost $162,456
Possible Deductions ($12,050) Total with Deductions $150,406

Ramsey County Golf Study Golf Operations
Sirius Golf Advisors, LLC 220
Golf operation for each facility is contracted out, and in general, we feel everyone is doing a great job. The operators are all dedicated professionals, passionate about their work and their course(s).
Because most of the operations are in good shape, the focus of this section will be to note areas in need of improvement, rather than a wholesale review of operations policies and procedures that the County does not effectively control, except in a few areas. In the case of areas under operator control, in most situations it is not that the operator is doing anything wrong, but that there may be opportunities to improve performance by doing things differently.
Administration The golf operation is headed by Sara Ackmann, who offices in the Parks and Recreation Building, as does the maintenance operation for Goodrich. In addition to overseeing the golf operations, Sara manages the County’s arenas. There is little overlap in seasons between the two operations.
As noted above, the operation is in good hands, and, in general, appears to run smoothly. Morale was good, which is important since poor morale is closely associated with poor performance.
However, we did see a few impediments to profitability at the County level. Some of these are easily correctible, but some are going to require significant effort, or even a complete revisioning of the operation.
The main issues we found:
• Bureaucracy: There is a lot of bureaucracy involved simply because this is a municipal operation in a large county. The dynamics involved to make major changes or major investment, therefore, require an extended period. This certainly can impede profitability as the business side often requires quick responses. Unfortunately, the only true solution to this is a complete privatization of the golf operation, which is already partially privatized. We will discuss this more in the Discussion section under Management Options.
• Contracts: There are six golf facilities within the division and six different operators with a total of seven contracts. This is an administrative nightmare. We will be discussing this in much greater detail in the Major Issues section.
• Marketing: There are few, if any, aspects in business that correlates more with success than marketing. Yet, the marketing effort for the golf operations is almost completely lacking. We will be discussing this in greater detail in the Major Issues section as well.
• Signage: The entrance signs to most of the facilities leave a lot to be desired.
• Communications: While communications appear excellent in most cases, there are a few notable exceptions.
• Financial Accounting – Throughout this process, we have had difficulty getting complete information about the facilities, especially on the financial side. This is largely because there are several divisions involved and no common accounting.
• Programming – There is a lack of county-wide programming. This is largely because the operations have so many different operators.
• Pricing Policy – The County sets the rates for the golf courses every two years. This puts the facilities in a major competitive disadvantage.
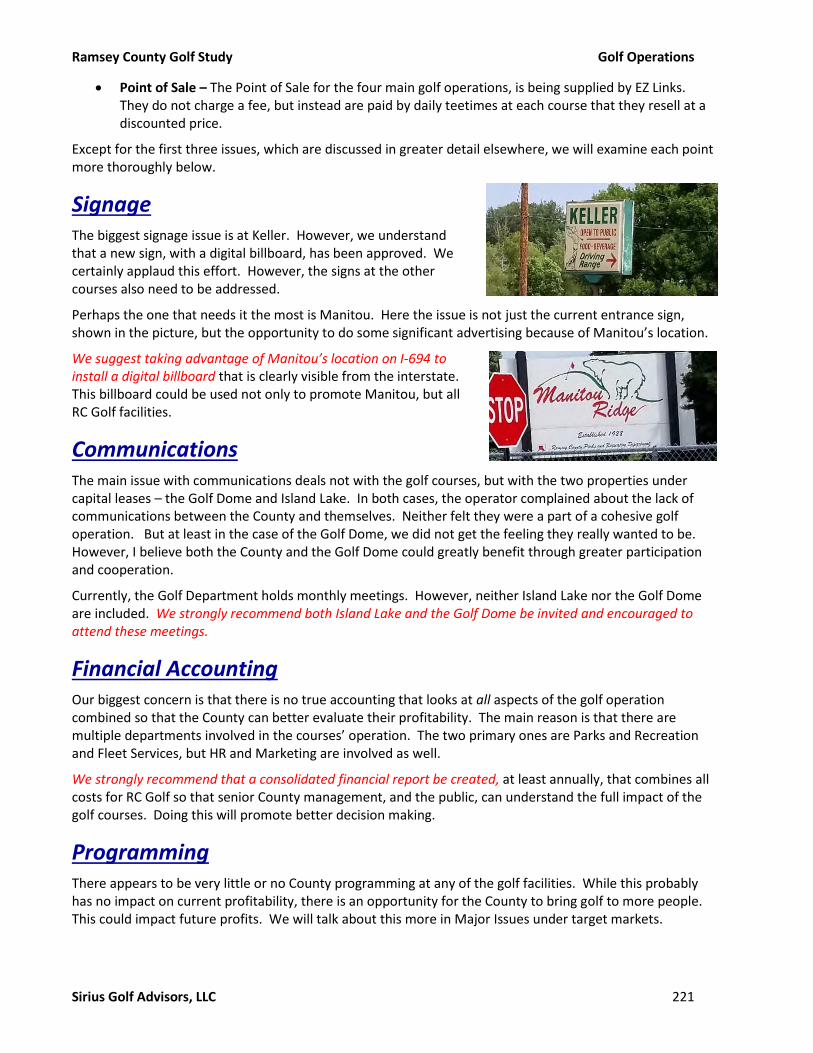
Ramsey County Golf Study Golf Operations
Sirius Golf Advisors, LLC 221
• Point of Sale – The Point of Sale for the four main golf operations, is being supplied by EZ Links. They do not charge a fee, but instead are paid by daily teetimes at each course that they resell at a discounted price.
Except for the first three issues, which are discussed in greater detail elsewhere, we will examine each point more thoroughly below.
Signage The biggest signage issue is at Keller. However, we understand that a new sign, with a digital billboard, has been approved. We certainly applaud this effort. However, the signs at the other courses also need to be addressed.
Perhaps the one that needs it the most is Manitou. Here the issue is not just the current entrance sign, shown in the picture, but the opportunity to do some significant advertising because of Manitou’s location.
We suggest taking advantage of Manitou’s location on I-694 to install a digital billboard that is clearly visible from the interstate. This billboard could be used not only to promote Manitou, but all RC Golf facilities.
Communications The main issue with communications deals not with the golf courses, but with the two properties under capital leases – the Golf Dome and Island Lake. In both cases, the operator complained about the lack of communications between the County and themselves. Neither felt they were a part of a cohesive golf operation. But at least in the case of the Golf Dome, we did not get the feeling they really wanted to be. However, I believe both the County and the Golf Dome could greatly benefit through greater participation and cooperation.
Currently, the Golf Department holds monthly meetings. However, neither Island Lake nor the Golf Dome are included. We strongly recommend both Island Lake and the Golf Dome be invited and encouraged to attend these meetings.
Financial Accounting Our biggest concern is that there is no true accounting that looks at all aspects of the golf operation combined so that the County can better evaluate their profitability. The main reason is that there are multiple departments involved in the courses’ operation. The two primary ones are Parks and Recreation and Fleet Services, but HR and Marketing are involved as well.
We strongly recommend that a consolidated financial report be created, at least annually, that combines all costs for RC Golf so that senior County management, and the public, can understand the full impact of the golf courses. Doing this will promote better decision making.
Programming There appears to be very little or no County programming at any of the golf facilities. While this probably has no impact on current profitability, there is an opportunity for the County to bring golf to more people. This could impact future profits. We will talk about this more in Major Issues under target markets.

Ramsey County Golf Study Golf Operations
Sirius Golf Advisors, LLC 222
Point of Sale The POS system, both software and hardware, is provided by EZ Links. They also manage the online teetime reservation system. In lieu of a fee for these products and services, EZ Links takes teetimes that are then resold to the public – at a significant discount.
On first inspection, this might seem like a good deal for the County. After all, there is no capital outlay or operating expense. But that ignores the opportunity cost of those teetimes.
EZ Links takes one teetime a day from Keller, and two each from the others as its compensation for the POS. It then resells these teetimes and keeps the revenue. Keller’s is at 11 am. The others are between 10 and 11 in the morning and around 1 in the afternoon. While 11 am is not the highest demand time of the day, it certainly is not the lowest demand time. Neither is 1. The operators have been tracking the number of teetimes that have been reserved by EZ Links as part of this program. In 2017, Keller had 400, Goodrich 813, Manitou 515 and Battle Creek 518.
If we assume that all these teetimes were kept by the club and sold at the average realized green fee, it equates to $49,831 in lost revenue, assuming all these times were sold by the club instead. Since the average realized green fee used in this calculation is well below the stated rates for these times, they already represent a heavily discounted rate. It is likely that EZ Links realized at least this much from those times. It is equally likely that the clubs could have realized this much or more if they had kept the times but did their own discounting.
A good POS system will cost $2,000 to $3,000/year. Total hardware cost is around $2,500/facility – and that’s a one-time purchase and should be good for four or five years. If we budget $600/year for equipment and $3,000 for software, we get $14,400/year total cost for four facilities. This represents 28.9% of the projected revenue. In other words, the facilities would have to sell less than one in three of the teetimes at the average realized rate to realize a net gain. To put it differently, the difference between the projected revenue and projected cost is over $35,000/year, representing the opportunity cost of this system.
Nor is opportunity cost the only concern. There are other factors that I feel make this a bad deal for the County.
• Discounted Value: EZ Links is reselling these teetimes at a significant discount. This has the effect of devaluing the prices set by the County. It can look bad if the posted green fee of $40 is being sold for $15 online.
• Marketing Info: Because EZ Links is managing the teetime reservation system, that means it is getting 100% of all the marketing information about the facility’s customers. Keep in mind EZ Links is a discount teetime seller for many facilities in the MSP area. Is it wise to let a competitor have marketing information about your customers? Worse, that they maintain it?
• Inferior Product: In our opinion, the EZ Links system is not the best software on the market. It is hard to use, has less power than many systems, and appears to have some additional issues that the operators are complaining about.
We recommend that the County drop EZ Links and purchase a golf course specific POS system with an integrated teesheet management system.
EZ Links Teetimes Qty Avg Fee Extended
Keller 400 $30.60 $12,240
Goodrich 813 $24.14 $19,623
Manitou 515 $18.35 $9,449
Battle Creek 518 $16.45 $8,519
Subtotal 2,246 $23.21 $49,831
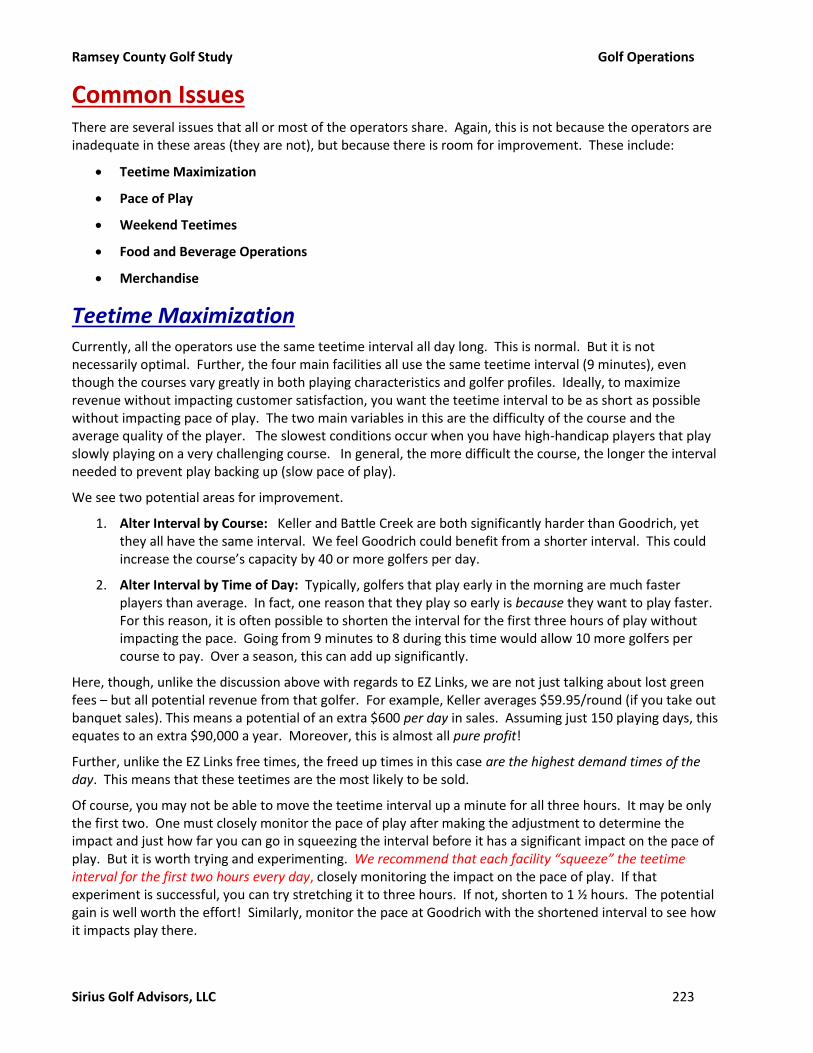
Ramsey County Golf Study Golf Operations
Sirius Golf Advisors, LLC 223
Common Issues There are several issues that all or most of the operators share. Again, this is not because the operators are inadequate in these areas (they are not), but because there is room for improvement. These include:
• Teetime Maximization
• Pace of Play
• Weekend Teetimes
• Food and Beverage Operations
• Merchandise
Teetime Maximization Currently, all the operators use the same teetime interval all day long. This is normal. But it is not necessarily optimal. Further, the four main facilities all use the same teetime interval (9 minutes), even though the courses vary greatly in both playing characteristics and golfer profiles. Ideally, to maximize revenue without impacting customer satisfaction, you want the teetime interval to be as short as possible without impacting pace of play. The two main variables in this are the difficulty of the course and the average quality of the player. The slowest conditions occur when you have high-handicap players that play slowly playing on a very challenging course. In general, the more difficult the course, the longer the interval needed to prevent play backing up (slow pace of play).
We see two potential areas for improvement.
1. Alter Interval by Course: Keller and Battle Creek are both significantly harder than Goodrich, yet they all have the same interval. We feel Goodrich could benefit from a shorter interval. This could increase the course’s capacity by 40 or more golfers per day.
2. Alter Interval by Time of Day: Typically, golfers that play early in the morning are much faster players than average. In fact, one reason that they play so early is because they want to play faster. For this reason, it is often possible to shorten the interval for the first three hours of play without impacting the pace. Going from 9 minutes to 8 during this time would allow 10 more golfers per course to pay. Over a season, this can add up significantly.
Here, though, unlike the discussion above with regards to EZ Links, we are not just talking about lost green fees – but all potential revenue from that golfer. For example, Keller averages $59.95/round (if you take out banquet sales). This means a potential of an extra $600 per day in sales. Assuming just 150 playing days, this equates to an extra $90,000 a year. Moreover, this is almost all pure profit!
Further, unlike the EZ Links free times, the freed up times in this case are the highest demand times of the day. This means that these teetimes are the most likely to be sold.
Of course, you may not be able to move the teetime interval up a minute for all three hours. It may be only the first two. One must closely monitor the pace of play after making the adjustment to determine the impact and just how far you can go in squeezing the interval before it has a significant impact on the pace of play. But it is worth trying and experimenting. We recommend that each facility “squeeze” the teetime interval for the first two hours every day, closely monitoring the impact on the pace of play. If that experiment is successful, you can try stretching it to three hours. If not, shorten to 1 ½ hours. The potential gain is well worth the effort! Similarly, monitor the pace at Goodrich with the shortened interval to see how it impacts play there.
Ramsey County Golf Study Golf Operations
Sirius Golf Advisors, LLC 224
Teeoff.com and Golf Now It is also difficult to understand why the County is not permitting Keller, Goodrich or Battle Creek to allow for booking teetimes on EZ Link’s Teeoff.com website. Currently, only the free teetimes (for EZ Links) are shown on the website. This is another opportunity lost. The reason stated is that EZ Links charges a booking fee for these teetimes, but this fee is paid by the customer. (Most facilities, however, do discount their green fees on these websites so that the customer does not pay more to book online). We recommend the courses participate with both EZ Links and Golf Now (EZ Links’ rival). Further, the green fees should be discounted on these sites so that the customers are not paying more. However, they should opt out of these website’s practice of automatically using dynamic pricing to sell the teetimes. The fees charged on these websites should be controlled by the operators, not the websites.
Pace of Play No golfer likes to wait for the group ahead to clear before they can hit their shot. If this happens frequently, it can have a significant impact on the golfing experience. Therefore, pace of play is one of the two (along with price) most complained about aspects of almost every golf course.
On one hand, it is a good problem to have, because it means you are busy. If there are no other golfers on the course, then you can play as fast or slow as you want. Naturally, the pace slows down the more golfers there are on the course. Because pace around a golf course when the course is full is like a train, it moves at the speed of the slowest car. The more golfers you have, the more likely you are to have a slow group.
However, it is still an issue. For one thing, if the pace gets too slow, it will back up the course to the extent that you may lose some teetimes. But more importantly, if the course is consistently slow, golfers will not want to play it. Which may solve the problem, but not in the way that you want.
Fortunately, none of the courses seems to have a significant issue with pace of play, based on the survey results. But there were some concerns expressed, especially at Keller and Manitou.
There are factors that can influence pace of play.
Let’s break down the time it takes to play golf. Below are the factors that go into the timing of a round of golf, even if no one else is on the course.
▪ Number of strokes: This seems obvious. But the more strokes you play, the longer it will take. Here the main considerations include:
o # Holes: Obviously a nine-hole course is quicker than a comparable 18-hole course.
o Course Par: “Par” refers to the target score for a course. The lower the Par, the fewer the shots that are supposedly needed.
o Skill of the golfer
o Difficulty of the course
o Length of the course
o Course conditions
▪ Shot to Ball: How long does it take the golfer to go from where they are hitting to where the ball ends up. This, in, turn can be affected by the following:
o Distance: How far does the person have to travel to get to the ball? Obviously, in most cases the tee shot will be the longest shot on the hole. It’s also the one most likely to deviate the farthest from the optimal path, because you are hitting it further.
o Walking/Riding: Is the golfer walking, using a caddy, or riding a cart?

Ramsey County Golf Study Golf Operations
Sirius Golf Advisors, LLC 225
o Cart Path Only: If riding, is the golfer able to drive his/her cart to the ball, or must they park it on the path and then walk the remaining distance.
o Number in Group: Tradition dictates that golfers take turns to hit. Thus, the more golfers in the group, the longer it will take for everyone to hit.
o Location of Ball: If the ball is in the fairway, or clearly visible and close to the fairway, it is going to be quicker than if the golfer must look for the ball.
▪ Shot Consideration: Most golfers don’t just walk up to the ball and hit it. They must consider what club to use, where to aim, etc. This involves knowledge of:
o Target: Where do you aim? It’s not always to the green. It may be to a landing area that puts you in the best place for a shot to the green.
o Obstacles: What obstacles are there between you and the target? This could include bunkers, water hazards, or trees, etc.
o Distance: You want to know not only how far to your target, but also how far to potential obstacles, especially if they are significant (such as a water hazard or out-of-bounds that would automatically cost you strokes).
• Putting: It will often take as long to play once you reach a green as it did to get there. Indeed, a Par 72 course consists of 36 shots to get to the green and 36 putts. Players typically take a lot more time to line up their puts than they do considering their shots. So, the more putts, the longer the rounds. Factors that influence include:
o Putter’s skill
o Speed of Green
o Size of Green
o Slope of Green
o Pin location
• Green to Tee: Once you are through with one hole, how long does it take to get to the next tee? In many cases, it may be a matter of just walking a few yards. In other cases, it may be a taxi fare away. Factors include:
o Distance green to tee
o Mode of transportation (walking vs. riding).
• Other Factors: Here are some other factors that can influence how long it takes to play:
o Stops: Golfers may need to take bathroom breaks, or they may choose to stop for refreshments. If there are waits involved in either case, that will add to the length of the round. The biggest road block is often at the turn (after the ninth hole), when golfers frequently will stop in the clubhouse for refreshments. Here the main consideration is how fast they can get serviced, get their food and go.
o Type of Game: What’s at stake? If there are considerable stakes on the line, whether in the form of a competition, larger wagers, and huge egos on the line, it will cause golfers to slow down as they become much more careful in considering their shots. Some competitions, however, speed up play. Most notable is the scramble, where everyone plays off the best shot from the previous spot. This greatly reduces the amount of time as players are mostly playing from favorable spots and less time is spent looking for errant shots.
o Weather: Weather can have a huge impact, from allowing carts on the course, to worsening playing condition and seeking shelter, etc.

Ramsey County Golf Study Golf Operations
Sirius Golf Advisors, LLC 226
The “natural” pace of play will obviously vary from course to course. For most 18-hole par 4s, the natural pace (how long it takes an average foursome to play the course), is usually given at about 4 hours and 15 minutes. But it can range for four to four and a half.
Course Design When looking at the above dissection, we realize that some of these factors are beyond the control of the club or the operator, such as weather and the skill of the golfer. But there are also a lot of factors that are controllable, starting with the very design of the course.
Difficulty
As noted above, the more difficult the course, the more strokes it will likely take to play. It also affects the time between shots, as a golfer is more likely to have to think strategically on a more difficult course, thus taking more time to take the shot.
Golfers generally love a challenge. But they also want to be able to conquer that challenge. Often the most successful courses are those that appear challenging, but offer large landing zones, plays fair (no sloping fairways knocking balls out of play, etc.), has reasonable greens, with bunkers present but positioned strategically so that the average player will not constantly be hitting into them, etc.), so that the player has an excellent chance of scoring his/her “normal” score. Players do not like to be constantly “beat up,” so overly difficult courses struggle to have a large base of returning players.
Features
The more features, such as bunkers, water hazards, etc., the more likely the player is to hit into one. And each of these will cause a slowdown in play. How these features are positioned is critical. If they are located off the fairway so that it takes an errant shot to hit them, they will not be as much of a factor as they will be if they are in the middle of the fairway. (Unless I’m playing, in which case the ones off the fairway are more likely to be hit).
Fairway width
It is always going to be faster playing from the fairway than from the rough. For one, you rarely need to search to find your ball in the fairway. Second, the ball should be in a better position to hit, not having to deal with tall grass, roots or other obstacles more frequently found in the rough. Thus, the wider the fairway, the more likely a player is to hit it.
The width of a fairway is determined by two factors: 1) how the course was designed, and 2) how it is being maintained. Often, the superintendent can increase or decrease the width of the fairway simply by changing mowing patterns.
Length
As is obvious, the longer the course, the more shots are often required to play. While the architect determines the constraints of a course’s length, there are two other factors involved. 1) Tee position: The architect designs the tee boxes, but the superintendent determines where the tees are positioned on that tee box, usually daily. Sometimes, they will even move a tee marker (such as white) onto a different teebox, such as one shared by the blue tee. 2) Player choice: Unless you are playing in a tournament, where the tee location is predetermined, one of the unique aspects of golf is that the player has some control over the course’s difficulty by choosing which tee to play. If they play from the back tee, they are often adding considerable length and increased difficulty. If they play from the forward tee, the course may become significantly easier. The psychology behind this choice one of the fascinating aspects about golf.

Ramsey County Golf Study Golf Operations
Sirius Golf Advisors, LLC 227
Forward Tees
As noted previously, women hit the ball about 70% as far as men. The most preferred distance for men (about 60%), is around 6,200 yards, plus or minus 200 yards. The equivalent distance for women, then, is 4,340 yards, plus or minus about 150. Yet few courses in today’s world have tees at this length. Indeed, the RC Golf courses average the equivalent of 7,376 yards for women from the forward tees. Obviously, this means that women are taking more strokes to play the same course – not because of lack of skill, but because they are playing a course 30% longer. And because the pace of the course moves like a train- at the speed of the slowest car (group), this will slow down the pace for the entire course.
We can have a similar problem with senior men. For them, the preferred distance is around 5,500 yards. But if the only tee around that yardage is the forward tee, the senior men will usually disdain from using it as they still consider that tee the “ladies’ tee.” So, they move back, and as a result, are playing a course that is too long for them, thus adding strokes and slowing the pace.
Target Visibility
It will always slow down play if the golfer is not able to see the target, which is usually the green. It will slow down play even more if it is difficult or impossible to see the group playing ahead, as one would need to check to make sure they are not in danger of being hit.
Out-of-Bounds
Courses that feature a lot of out-of-bounds areas, especially if these are located close to the fairways or on typical flight paths of the balls, will see a slow-down of play. First, if the players are playing by strict rules of golf, then the player must return to the tee (if they did not hit a provisional) and hit the ball again. But even if this rule is not followed, the out-of-bounds may make it much more difficult to find a ball. And if found, may make it more problematic to retrieve it, which, at $3/ball, many players are prone to try.
Green to Tee
How far is it from the green to the next tee? For most courses it is a short walk. But with some, it can be a lengthy journey. The longer the distance, the more time it will take. It also may impact the walkability of a course. If the distances are too long, it makes the course much more difficult to walk. We have seen many examples where the distance was such that golfers walking from one green to the next tee are being passed by one or more groups who played behind them but are riding in carts. Unfortunately, this is not an easy fix as it will require a major rerouting, if it is even possible to fix based on topography.
Slope
How much slope is there in the fairways? Or even the adjoining rough? The more slope, the more challenge, and therefore the increased likelihood for a poor shot and longer round. Fairness also enters the equation. You do not want to have a fairway built on a side of a hill so that balls hit in the middle of the fairway are going to roll into the rough, or worse.
Construction budgets are often a factor in this, as it can be costly to move a lot of dirt in order to soften slopes.
Trees
Trees add beauty to a course. But they also add challenge, by knocking down otherwise good shots, or impeding the path to the target, etc. They also can cause ricochets that make it that much harder to find a ball. And if the trees are not trimmed, especially on the lower branches (e.g. Manitou), then the trees can make it even more difficult to find the ball, and if found, to hit it.
Ramsey County Golf Study Golf Operations
Sirius Golf Advisors, LLC 228
Sun
Most reputable golf course architects know to take the sun into consideration in their designs. You do not want, for example, the first hole to play to the east, where players will face the rising sun. Nor do you want the 18th hole going west, facing the setting sun. Playing into the sun will slow the pace of play as it makes it harder to see targets, track your shot, find your ball, etc.
Sometimes the course is originally designed, but then the operators “flips the nines” for whatever reason, making a course that did not have this problem into one that does.
Greens
The size, shape, location and undulation of greens is another area where pace is affected. Older courses with original greens, will often have ones that have significantly more undulation than modern greens. One of the reasons for this is that the grasses used in those days was a lot “slower” than modern varieties. And if these greens are reseeded with modern grasses, without some leveling, they can become dangerously fast.
If a green is dome-shaped, this will cause more balls to hit it and bounce away, affecting playability and speed. Small greens will hamper speed because more players are hitting off the greens, which will be less accurate than putting.
If there is an obstruction in front of the green, such as water or a bunker, this will impact performance more than obstacles to the side.
Need vs. Speed
Taking all these factors into consideration, we realize that we could build an incredibly fast playing course by having it basically resemble on oversized football field. Completely flat, with no trees, undulation, bunkers, water or other obstacles that could affect the ball. The grass is mowed at fairway height all around.
The problem is this. Such a course would prove to be very unpopular. Ahh … the psychology of golf. Golfers want to be challenged. They also appreciate the aesthetics that come with bunkers, water features, trees and undulating fairways.
It is also true that the lay of the land will dictate some design choices. The presence of natural areas, such as rivers, streams, wetlands, hills, heavily wooded areas, etc., are going to impact course design and, ultimately, course difficulty. But also, its appeal.
There is a balance to be had. Maximize a course’s aesthetic beauty and present a perceived challenge yet be sure the course is playable for the average golfer with a reasonable pace of play. And often, it can simply be a matter of degree.
For example, in the 90s’ and early 2000’s, bunkers were “in.” The more, the larger, the better. But modern designers have realized that we can often reduce these bunkers in both size and number, without affecting the course’s appeal. Not only will this improve the pace of play, but it reduces the maintenance cost, and, because the course is more playable, it can increase the course’s appeal.
Similarly, while you may not want to have a wholesale reduction in trees, a strategic reduction may lead to significant improvements. A single tree (#17, Keller) can have a big impact on play. Or removing a row of trees on an otherwise very narrow hole, can significantly improve performance.
Rebuilding greens, to reduce excessive undulation and increase their size while possibly removing forward “hazards” can greatly improve both pace of play and the appeal of the course.
Course Maintenance How a course is maintained can have a huge impact on pace. Here are some of the common issues:

Ramsey County Golf Study Golf Operations
Sirius Golf Advisors, LLC 229
• Length of Rough: The taller the grass, the harder it is to find the ball, the more time is spent looking. Further, the taller the grass, the harder it is to hit a good shot, possibly adding a stroke and more time to the round. For non-premium public courses, the rough should never be long enough to hide the top third of a ball. Preferably at least half the ball should clearly be visible. We see a strong correlation between price-point and length of rough. Lower-end or value courses, because they see a higher percentage of high-handicap players, should have the shortest roughs. You want enough to show a clear differentiation from the fairway, but not enough to make it difficult to find the ball or even adversely affect the shot.
• Fairway Conditions: The worse the condition of the fairway, the increased likelihood of a poor shot. Further, it greatly diminishes the appeal of a course. Examples include fairways with lots of bare spots, drainage ruts, dead grass, etc., are going to be less popular and cause slower play.
• Fairway Cut: While course design provides a guideline for the fairway width, ultimately the superintendent can control it. They can choose to widen the fairway, especially at critical points, to make the course more playable. They may also introduce a “second cut” between the fairway and the rough. The second cut has higher grass than the fairway, but much shorter than the rough. This not only effectively widens the hittable portion of the course, making it more playable, but it also adds to the aesthetic appeal. We recommend adding a 2nd cut wherever feasible. (Limitations in equipment may make it less practical as it often requires a dedicated tractor).
• Green Speed: Green speed is affected by green undulation, type of grass and height of cut. The superintendent has total control over the last aspect. Green speed preference is highly correlated with the skill of the golfer. Better golfers prefer faster greens as it increases the challenge. Fast greens, though, will frustrate higher-handicap golfers, who may find themselves putting four or five times on one green. Obviously, that greatly shows down the play. Again, we see a direct relationship between price point and height of cut. Keller should have the fastest greens in the system and Goodrich, the slowest. You just must be careful not to be too fast or too slow.
• Green Condition: Greens that have multiple grasses growing on them are going to have inconsistent speeds and breaks, causing more putts and resulting in increased delays. Greens with a lot of ball marks, or bare areas, will also adversely affect putting, thus increasing the amount of time spent on the green, etc.
• Leaves, Limbs, etc.: The more debris on a course, the more likely it is for a golf ball to hide under it. A course full of leaves is going to play significantly slower than one without leaves. Therefore, it so important in the fall to regularly blow the leaves, not just off the greens and fairways, but also in those areas of the rough that see the most play.
• Tee Markers: As noted above, the superintendent’s control where on a teebox the tee markers are placed. Normally, this is balanced (some holes forward, others back). But if they are all back, it is going to slow down play. There is also another factor that is often overlooked. How are the teemarkers aligned? Golfers, often subconsciously, will use the teemarkers to align themselves. Mentally, they will draw a line between the two teemarkers, then set themselves perpendicular to this line. As we see in A below, when the markers are properly aligned, the perpendicular line will
A: Normal Alignment B: Off-Centered

Ramsey County Golf Study Golf Operations
Sirius Golf Advisors, LLC 230
aim you towards the target. But if the tees are off kilter, it can result in the golfer aiming to the left or right of the target, resulting in a poor shot and increased strokes.
• Pin Placement: Where the flag is placed on the green can have a dramatic effect on performance and pace. If the hole is located on a slope, for example, it can make it extremely difficult to hit, or even come close – adding strokes. If the pin is placed on a part of the green that is “protected” by a hazard, it is going to add strokes, etc.
• Cart Usage: The superintendent is normally the one who makes the call whether carts must be restricted to cart paths (not applicable at RC Golf courses where they lack tee to green paths), or not allowed out at all due to course conditions. Some superintendents are very conservative, which protects the fairways, but at the cost of dissatisfied golfers and a much slower pace. Obviously, how well a course drains is a major factor in this decision.
You will often find superintendents setting up the course easier on weekends, when it is busiest, in order to help improve the pace of play. They will do this by moving the tees up and having more favorable pin placements.
Operations Finally, we get to the area that most golfers understand. The impact that operating policies and procedures have on pace of play.
Course Markings
There are two critical types of course markings: 1) direction and 2) distance.
Direction It may seem obvious, but golfers need to know where to go. Unfortunately, this is not always obvious. It is especially problematic on courses lacking cart paths. But even where there are cart paths, it can still be confusing when multiple paths come together. Clear signage at EVERY intersection is needed to insure a faster pace and avoid golfer confusion.
Yardage Golfers want to know how far they are from the target, so they can judge what club to use and how hard to swing. The more information a course can provide to help, the faster the course will likely play. Courses lacking information are going to find more golfers misjudging the distance, and thus taking more strokes to play (and enjoying it less).
In today’s techno-world, there are a lot of GPS golf aps for phones that will help by telling you how far you are from the green, but not necessarily the hole, which changes daily. The problem is that most golfers still do not have these aps, which are not always the easiest to use. Nor are they all equally accurate.
Most courses have a marker of some sort at 150 yards from the green. But these are not always easy to find.
The most powerful tool is a GPS screen on the golf cart. This has been shown to reduce pace of play by 15 minutes or more at most courses. But it is not a cheap fix.
We recommend putting yardage on the sprinkler heads, in addition to markers in the middle of the fairway at 100, 150, 200 and 250 yards from the green. The best markers are poles, which can be clearly seen from a distance and can help golfers quickly identify the middle of the fairway when it is not otherwise clear. It is also helpful to have yardage stripes on the cart path, which really helps if the course ever must go to cart-path only.

Ramsey County Golf Study Golf Operations
Sirius Golf Advisors, LLC 231
If the choice is to mark the sprinkler heads, anything that can be done to make them more visible will greatly reduce the amount of time in having the golfers search for them. Painting the surface white or painting a circle around them with a white stripe, works best.
Teetime Interval
Dictated by the course manager, teetime intervals refer to the amount of time between groups of golfers setting off at the first tee. The shortest commonly found interval is to alternate 7 and 8 minutes between teetimes. This maximizes the number of teetimes available during the day. But it has the effect of greatly slowing the pace as golfers are affected by the group ahead starting with their very first shot. This can lead to a lot of frustration if the golfers are having to wait on the group ahead on every shot.
The longer the interval between groups, the more likely the group ahead will have the time to play their shots and clear the area before you reach your ball. A teetime interval of 10 minutes or more is found to have the most positive impact on play. However, there is a big trade off -- revenue potential.
Let’s say you average $30/round in revenue. If your teetime window is 10 hours, at a 7/8 minute interval, you have 80 possible teetimes, generating $9,600. If your interval is 10 minutes, you only have 60 teetimes available, with a revenue potential of $7,200. This is a $2,400/day difference, or 33% more revenue potential for the shorter interval. That’s a lot! At $50/round, the difference is $4,000/day.
So, we come to a Catch 22. If you shorten the interval, you maximize revenue potential. But golfers don’t enjoy it as much, so they are less likely to return, which will make it less crowded, which will decrease your revenue…. Again, it is rarely a case of one being better than the other. Ideally, you want to have the shortest interval possible that does not greatly adversely impact the pace of play.
Unfortunately, what we see happening – and we believe this to be true with several of the RC Golf facilities – that the interval is being increased simply to improve the pace of play in lieu of taking other proactive measures, such as having rangers/marshals. Even if you are paying a ranger $10/hour, that equates to $100/day in pay versus a potential $2,400 gain in revenue.
We do not necessarily advocate a 7/8 minute interval, but we do believe the interval can be shortened if other pace of play improvements are made, especially the addition of rangers (customer assistants).
On the other hand, while we noted previously that we can shorten the interval in the early part of the day to increase capacity, it may be wise to lengthen the interval during times when you know the course is going to really slow down. For example, at Keller, you may want to have 8 minute intervals for the first two hours on weekends (your busiest day), then go to 9 minutes for two hours, then maybe even 10 minutes when the course starts slowing down, before returning to the normal 9 minutes.
Rangers/Marshals/Player Assistants
The most visible control measure to the golfer is the presence of a Player Assistant (ranger or marshal), whose primary job is to keep the pace of play going smoothly. The Player Assistant does this by moving in reverse direction around the course, starting at the 18th green and going green to tee in reverse order of the holes. This way, the Player Assistant can spot large gaps in play. By referring to the teesheet (which should always be provided), they can determine whether the gap was caused by the trailing group playing slowly, and if there are other groups waiting behind that one. If that group is slowing down play, then the Player Assistant can “encourage” them to pick up the pace.
Considerations include:
• Player Assistants: We strongly recommend that you no longer use the term “rangers” or “marshals” since that has a negative connotation with golfers. It would indicate that their only role is to “police” them. Instead, you want to promote that these staffers are there to improve the overall golf experience by providing outstanding customer service. They are often referred to as “Player

Ramsey County Golf Study Golf Operations
Sirius Golf Advisors, LLC 232
Assistants,” “Customer Service Rep,” course “Ambassadors” and other non-threatening titles. We will refer to them as Player Assistants, or PAs.
• Psychology: Often, the Player Assistant has limited ability to facilitate the pace. But they can still have a significant impact on a player’s mood and satisfaction. Because their presence, at the very least, tells the golfer that the pace is important to the operator¸ and, by extension, that the operator cares about the golfer’s feelings. During slow play, it is reassuring to the golfer to see the Player Assistant go by frequently, because they know the course is doing everything it can to facilitate the pace. (Keep in mind that the golfer usually can only see the group ahead of them. Golfers cannot tell if the entire course is full, or if it’s just the group ahead of them. Some golfers may even get angry enough to hit their balls deliberately into the slow-moving group ahead. Having a Player Assistant available to reassure the golfer that it is not that group can greatly reduce the tension.
• Customer Service: Appreciated or not, the Player Assistants do represent the operation for better or worse. This means it is highly important to hire the right people for the job. They need to be customer service oriented and friendly. They should be greeting each group as they drive by, not looking like a cop out to stop speeders. The best ones go out of their way to do nice things for the golfer, such as helping them find a lost ball, or even providing them with one if they are unable to find it.
• Controlling Access: The Player Assistant is not only responsible for enforcing the pace of play, but also for making sure that there is not unauthorized access to the course. It is quite commonplace to find golfers trying to sneak on to courses to play without paying. Not only does this result in a loss of revenue, but extra players impact the pace of play. The PA, then, just has check the updated teesheet. This way they can simply check how many walkers should be behind cart # X. If there are more than expected, then an inquiry should be made as to whether a group let another group play through. If not, then it would appear one of the groups are interlopers. At that point, the PA should ask for names to check against the teesheet, and/or receipts. While we are not aware of this being a significant issue at any of the courses, it is also likely that it may be occurring without the operator’s knowledge given the lack of PAs.
• Training: Unfortunately, too many operators do not provide significant training, nor are they especially careful in the selection process. This leads to poor customer service and bad job performance. There needs to be a regular staff member who is responsible for the hiring, training and supervision of the PAs. And they need to regularly check to assure that they are being effective and conveying a positive image for the facility.
• Compensation: It is our understanding that in the MSP area, PAs are paid staff. This can be beneficial as it provides a better guarantee that a person will show up for work. Yet it also adds considerably to the payroll. Around the county, it is more common to see these positions held by volunteers who work in exchange for golfing privileges. Typical is that a four hour shift would equal one round of golf. (Note: IRS rules strongly suggest that the PAs receive a 1099 at the end of the year showing the value of their compensation). We were not able to uncover any state or local regulation that would forbid this practice for Ramsey County. However, further investigation is warranted. If it is found there is no legal (or union) reason against the use of volunteers, then we feel this is an appropriate direction (except possibly at Keller, which demands higher standards).
• Improving the Pace: Okay, so how does the PA improve the pace of play? The first step is to identify the “offending group.” That is, the group that is slowing the pace down and that has a gap ahead of them. The second step is to see if it is just one group being held up, or the entire course. Sometimes the case is that a faster group simply catches up to a slower playing group. In this case, the PA asks the slower group to allow the faster to play through. The third step is to observe the group. There may have been a reason for the gap other than slow play (such as an extended search

Ramsey County Golf Study Golf Operations
Sirius Golf Advisors, LLC 233
for a lost ball, etc.). Try to determine if the group has playing habits that are creating slow play, or whether it might have been a bad hole, of if it’s simply several bad golfers. This is important as it impacts how the PA should approach the group. For example, if the group appears to play at a regular pace, but just fell behind, then a simple friendly suggestion for them to try and catch up will likely do the trick, without risk of insulting them. If one observes that they are always waiting for the player furthest away to hit first (as the rules of golf dictate), you can suggest they play “ready golf” where the player plays when they are ready to, not necessarily in a particular order. Often, groups are not aware they are playing slowly. They may be taking an excessive amount of time with practice swings, or lining up putts, etc., which, with proper encouragement, can be shaped. If the golfers are just bad golfers, the PA can ask for them to try and pick up the pace, but if they are unable to do so, suggest picking up their balls and proceeding to the next hole. The worst situation is if they see the golfers are otherwise behaving badly (usually involving excessive drinking). In this case, help from the proshop may be required. At no time do you want your PA to get into an argument with a player. If a situation escalates, the pro staff needs to get involved.
• Trash: Player Assistants should be trained to pick up any trash they see on the course.
• Course Maintenance: Player Assistants should, at a minimum, be trained to fix divots, especially on tees. They can also be trained (and given the proper tools) to fix divots on the greens. These are services that can be done when the course is not busy.
Starters
Starters are responsible for controlling access to the course. They make sure the groups tee off at their designated time. Normally, they also check receipts and write down the cart number(s) for each group.
Like PAs, this is a customer service position, and the person hired must be friendly and customer-service oriented. They also need proper training and supervision. And, as with PAs, this is often staffed by volunteers. Only Keller and Goodrich regularly use starters at the RC Golf facilities.
Starters also have a role to play in managing the Pace of Play. They should be asking whether the golfer had played the course before. If the answer is no, they can offer guidance as to what tee may be appropriate for their game.
Starters also should educate the players about pace of play guidelines, such as maintaining pace with the group ahead, playing “ready golf,” etc. From a customer service standpoint, they should also inform the groups about the status of the beverage cart. Knowing a beverage cart is coming can save a trip to the clubhouse, and thus time.
Phone
The rationale the operators are using for not providing rangers is that they will have two people in the proshop and that customers will call into the shop when there is a problem. There are some issues with this logic:
• Reactive not Proactive: It is normally considered preferable, especially with regards to customer service, to be proactive in preventing problems rather than be reactive; waiting for a problem to occur than try to resolve.
• Customer Blame: You are asking the customer to do what most customers would consider to be your job – which is policing the golf course. Not good customer service.
• Anger Threshold: If a customer makes the effort to look up the number than call the proshop, chances are you have already lost that customer.

Ramsey County Golf Study Golf Operations
Sirius Golf Advisors, LLC 234
• Solitude: A lot of golfers deliberately leave their phones at home, desiring to escape from the hub-bub. Are you going to require golfers carry their phones to ensure they have a good pace of play?
• Willingness: Not everyone wants to complain. In fact, only a small percentage of golfers would make the effort to call the proshop, even if they are upset at the pace. What happens then, is that they continue to simmer about the slow pace, vowing never to return.
• Appearance: It makes the course seem “cheap” and not interested in providing good customer service.
• Convenience: Not every golfer has your phone number memorized. It is going to require effort to find then call the proshop.
• Awareness: If you are going to require customers to police themselves, it might be helpful if you make them aware of this fact by posting signs “If there is a problem on the course, please call the proshop at…”
• Reaction Time: What if the proshop gets busy and for whatever reason, the call is not answered in a timely manner. Now that customer is going to be doubly angry. Also, it may take time for the proshop to dispatch someone to investigate.
• Customer Service: Depriving the proshop of one of its attendants may not be an issue when it’s slow… but then you are not as likely to have a pace of play problem during those periods. Slow pace usually occurs when the course is busy, which means the proshop is busy. If you take one of the attendants away, customer service at the counter is likely to suffer, further compounding the problem.
Fivesomes
Fivesomes are allowed at all the RC Golf facilities except Keller. Obviously, it takes five golfers longer to play, on average, then four. So, adding fivesomes can contribute to a slower pace of play. Further, it adds to the aggravation of the golfers playing behind the fivesome. Instead of directing their anger at the group ahead (which most golfers do), they direct it at the golf course for allowing fivesomes, making it less likely they will return.
The rationale given is that the fivesomes are instructed to “keep pace with the group ahead.” This might work, if there was a way of enforcing it. But the same courses that are allowing fivesomes, are the ones that do not have rangers (player assistants) on the course to monitor them. This just adds to the negative impression. We recommend against fivesomes, unless: 1) the course is mostly empty, and the fivesomes are told to let faster groups play through, or 2) there are rangers/player assistants on the course to monitor their pace.
Monitoring
One of the most important tools in improving pace of play, is to make sure you are aware of the pace of play. The pace of play should be regularly monitored by recording the start and finish times of groups – at least on a sample basis every day. Have the starter record all the start times (which they should be doing). Then have a staffer randomly document the times players come off the 18th green. Match these against their start times, thus providing a pace of play indicator. Of course, this is most important to determine during busy times, but an effort should be made to document it at other times as well.
Recommendations The following recommendations will help the pace of play at all the RC Golf facilities:
• Rough: Keep mowed and at a height where the ball is clearly visible. Goodrich should have the lowest rough, Keller the tallest.

Ramsey County Golf Study Golf Operations
Sirius Golf Advisors, LLC 235
• Add a 2nd cut to the fairway/rough border.
• Yardage Markers: Use poles to mark the yardage at 100, 150, 200 and 250 (on par 5s). Mark yardage on the sprinkler heads, then paint the top white or yellow to make them more noticeable.
• Player Assistants: All courses should have player assistants daily. On most days, they would be employed from two hours after first teetime until the point where filled teetimes are far apart. We recommend using volunteers, if permittable (except at Keller).
• Monitor: Have a regular program to monitor the pace daily, preferably hourly.
• Teetime Interval: With other Pace control measures in place, experiment with short teetime intervals. Compare the impact on pace to revenue gain to decide on permanent strategy.
Weekend Teetimes A practice that seems to be unique to the MSP area, is that the Men’s Club (and Women’s club, if present) have preferred and guaranteed teetimes on weekend mornings, the highest demand times in golf. We do see this practice at semi-private clubs, where there are memberships and members are given priority. But we have not seen it at municipal operations where it is not members of the club, but the members of the Men’s or Women’s club that are given the preference. These players may or may not have annual passes, or even Patron cards. They simply pay the nominal fee (which does not go to the course) to join these clubs then sign up to play on a given weekend.
While this is a fairly common practice with other area municipal courses, it is still problematic… especially at Keller, where these groups take up all the teetimes from 7 am until 10:15 on Saturdays and until 10am on Sundays.
For one thing, being a municipal course, I have an issue where a citizen of the County is essentially told they can NEVER play their municipal course during the most desirable times, unless they join this private club that is NOT run by the County. And at Keller, there is a waiting list to join. Basically, these municipal golf courses are being operated like a private club during the most popular times to play.
There is also the issue of maximizing revenue. Because these are the highest demand times, they can command the highest fees. Yet the club members are typically paying the lowest average fee as they are either pass holders or Patron card holders.
Unfortunately, this is not an easy problem to fix, given the history involved and the fact that the competition does it as well. These players do represent your heaviest users and losing a high percentage of them could have a significant impact on overall performance.
Yet, we also feel that something DOES need to be done. After all, these are municipal courses, not private clubs. We are hopeful that a compromise solution can be found. Our suggestions:
• Shorten reservation time: Club members should only have a one day advantage over the public to book the teetimes. (They currently have three).
• Vary the start times: Instead of the club ALWAYS getting the best teetimes, vary their start time anywhere from 7am to 9am. This will allow the general public (and citizens of the County) to have an opportunity to play during prime time. It will also provide an opportunity to generate more revenue.
• Limit the Number of Tournaments: At Manitou, the men’s club seems to hold a tournament in the afternoon about every other weekend. Not only is this denying the course to others, but they are being given preferred rates to do so. We suggest limiting these outings to no more than one a month.

Ramsey County Golf Study Golf Operations
Sirius Golf Advisors, LLC 236
Merchandise While the county does not currently share in the merchandise sales, that could change if our contract recommendations are adopted. As such, we liketo offer some suggestions as to how this area of the operation can be improved.
None of the operators do a particularly good job at merchandise, especially when it comes to women. At best, we would rate them average. Goodrich, averaging less than a dollar a round, is well below average.
In general, though, golf proshops do a poor job in this area. The reason is that most operators consider the merchandise as an after-thought, more of a convenience item to golfers than a true profit center. The exceptions, though, understand that this can be a true area of opportunity.
Below are some suggestions as to how to significantly improve merchandise sales:
• Attitude: The first step is to change the attitude towards the merchandise operation. Instead of thinking of it as a convenience item, worthy of little attention, treat this area as a retail store.
• Sales: in real estate, they say the three most important items are location, location, location. In retail, it is sales, sales, sales. Especially in today’s online reality, few customers want to pay full retail price. More importantly, the “Sales” sign is like a magnet, always attracting customer’s attention – even if they are not in the market to buy. But it is not enough simply to have a sales rack. Typically, most proshops, including all the RC Golf facilities, reserve the sales rack for merchandise that is old and had they had not been able to sale. However, this is not how successful retail merchants do it. They put current items on sale, items that they know shoppers are going to want. Below are some tips:
o Prominent: Make sure the items on sale are clearly and prominently marked. Have the sales racks/tables in the highest traffic areas.
o Popular: Put items people want on sale, not items they don’t. (Those can go on a “Clearance” table).
o Rotate: Rotate stock in and out of the sales racks. Our recommendation is to keep them on sale for two weeks, before rotating.
o Themes: Consider themes, such as all Nike items, or all Titleist, or all shirts, etc.
o Promote: Don’t rely just on signage in the shop. Remember, “a promotion not promoted is not much of a promotion.” The same can be said of sales. Have signs indicating sales (especially if they are themed) throughout the clubhouse – including on the tables in the grill area, in restrooms, etc. More importantly, have the sale noted prominently on the website. (Of course, this requires updating the website – but more on that later under Marketing). Announce the sale in your email blasts (again, this assumes that you do email blasts, which the operators are not – but again, this will be addressed under Marketing).
• Logo: I see a lot of proshops selling soft goods that do not have the course logo on them. This makes no sense to me. The logo is what makes your merchandise unique. Without the logo, you are competing directly with Target, Walmart, Amazon, etc. But they cannot compete with you on your logo! And if you find customers are not interested in your logo, then consider changing your logo, or adding a second one. There is no law that states you can only have one logo! Adding a second logo will create a new market for you. But make sure the logo is professionally designed.
• Displays: Make sure your displays are neat and well-lit. Try to use modern displays. Keep aisles clean and wide enough for two people to comfortably pass each other.
Ramsey County Golf Study Golf Operations
Sirius Golf Advisors, LLC 237
• Ladies Merchandise: I think it is safe to say that women tend to like to shop more than men. Yet most proshops have a tiny area devoted to women’s merchandise…just the opposite of what you find in retail stores. This not only acts as an insult to women but ignores the fact that women will outspend men on a per capita basis. An expanded women’s section will make your facility feel more welcoming to women and help increase their play.
• Selection: It is important to have a good selection, but not just in volume but in quality. If you are not a great merchandiser, seek out advice on what is popular and selling. Get a women’s perspective on women’s items.
• Rotate Stock: Many proshops buy all their goods, especially soft goods, at the beginning of the year. Then they will have the same merchandise on display all year. Yet most of your customer base is repeat business. Customers not only get tired of seeing the same things repeatedly, but it greatly decreases their motivation to even look at the merchandise. Keep your stock fresh by constantly rotating stock. Once a month or so, take items that haven’t sold off and replace them with fresh ones. The ones removed can be rotated back in later.
• Clubs: Most proshops believe that they cannot compete with big box retailers or the internet with regards to clubs. Successful proshops turn this around. They will tell you that the big boxes and internet cannot compete with them! Why? Because their proshop offers:
o Professional Guidance from a PGA professional. The big boxes offer hourly help. The internet offers no help.
o Real-World Trial: The golf course provides an opportunity to try the clubs in a real-world setting – either on the range or by playing a round. Big boxes offer a net. The internet offers imagination.
The reality, though, is that there is such a large selection out there, that it is not economically feasible to try to stock a wide variety of clubs; especially since the margin is often much smaller on these items. Our recommendation is to pick just one or two manufacturers and display a limited, but representative selection. But make sure (through signage) that you can custom order desired merchandise.
• Junior Clubs: If you have an active junior program (and you should), make sure to stock a selection of junior clubs.
• Incentive: Consider offering an incentive to your staff for merchandise sales. This has an amazing impact on motivation! If you do not want to offer a direct commission, then have a pool that is split at the end of the month, etc.
• Training: Train your staff to sell. They should know to ask if the customer needs any balls or tees. They should be reminding customers about sales items. They should know enough about the merchandise to be able to make good recommendations.
Food & Beverage The Food and Beverage operation is an issue at all the facilities, although not necessarily for the same reason. At Keller, they have a great menu and facility, but their service to the golfers is a huge issue – especially as relates to the beverage cart.
At the other facilities, there are three main concerns:
• Venue
• Menu

Ramsey County Golf Study Golf Operations
Sirius Golf Advisors, LLC 238
• Beverage Cart (could not think of something that rhymed with menu).
Venue None of the facilities (other than Keller) have banquet facilities. Seating capacity is in the 50-60 person range. This puts these facilities at a significant disadvantage in pursuing tournaments and outings, which explains why none of them have many, outside their own men’s and women’s clubs.
The seating that is provided is adequate at best. There are some simple fixes:
• New furniture is welcome at all three (excluding Keller)
• TVs: All of these facilities do a good bar business. Goodrich has made a strong effort by providing 10 different draft beers – a model the others would do well to emulate. But the environment is lacking. We suggest using more of a sport-bar theme, with several big-screen TVs throughout. (They should all be turned to sports channels). Having a great viewing area could make these clubs a preferred stop on fall weekends, where the golfers can play a round of golf in the morning, then enjoy watching football, baseball, golf or hockey in the afternoon.
• Pavilion: Short of a major clubhouse expansion (which we recommend at Manitou), we suggest building a pavilion at both Goodrich and Battle Creek that is able to host 120 to 140 people. This is suitable for tournaments and can also provide a low-cost option for weddings.
Grill
Related to venue is the lack of a grill at all the facilities save Keller. This means they are limited to hot dogs and pre-prepared foods such as frozen pizza, and premade sandwiches. This puts them at a significant disadvantage to most of the other facilities in the market, especially for younger golfers and with women.
Not only does the lack of a grill hamper food sales, but it will affect beverage (beer, liquor) sales as well. The lack of hot foods means the players are not likely to stay as long, which means fewer drink sales.
It also makes the facility less attractive to groups. While large groups can afford catering, it is more difficult with smaller groups.
The lack of a grill probably impacts Manitou the most, as it is positioned more like a mid-fee course where most of the competition has a grill.
Menu Not having a grill certainly has an impact on the menu. But that does not excuse the facilities from not offering healthier choices on the menu. This is certainly a big deal to women golfers, but it is becoming increasingly important with health-conscious male golfers as well.
Manitou has taken our suggestions to heart and is now offering both fruit and wraps. We encourage Goodrich and Battle Creek to follow suit.
Manitou also has compensated for the lack of a grill by using an outdoor grill at peak demand times. We strongly encourage this at Goodrich and Battle Creek as well – using an outdoor grill to cook hamburgers, hot dogs, brats and chicken sandwiches on weekends and league nights.
Beverage Cart The beverage cart can be a significant profit center, generating $5 or $6 per round in revenue. But more importantly, it is also a valuable customer service, especially at higher end courses. It is particularly important, though, at RC Golf facilities because of the lack of drinking water on the courses (see below). To us, the County is risking liability issues by not providing either drinking water or regular beverage cart service, especially on hot days. Dehydration is a serious concern, especially for golfers that walk.

Ramsey County Golf Study Golf Operations
Sirius Golf Advisors, LLC 239
But being successful with a beverage cart is not as easy as simply hiring someone to drive around in a cart filled with food and beverage. There are several important considerations, including:
• Staffing: It starts with hiring the right people for the job. Staff needs to be extremely outgoing and friendly, but considerate.
• Training: Beverage cart workers need to be properly trained and supervised.
o Manager: There should be one person who is responsible for hiring, training, scheduling and supervising the beverage cart staff.
o Food Service: Attendants should be trained on the products they are selling and how to sell them.
o Golf Etiquette: Attendants need to be trained on golf etiquette, knowing when and when not to approach golfers, and how not to move when clearly visible to a golfer in the process of hitting a shot.
o Backwards: The beverage cart should be going in reverse order around the golf course, starting at the 18th (or 9th green) and going green to tee instead of tee to green.
• Consistency: This is extremely important. The beverage cart service needs to be consistent, not only in what they are selling and the level of service, but also when they are in use. The customer (golfers) need to be trained to expect a beverage cart when they play. Otherwise, they will make their own arrangements and the course loses out.
• Frequency: The goal of a beverage cart operation should be to reach every golfer every three to four holes. This means making it around the golf course in about an hour. During heavy demand times, this may require having two carts – one for each nine (at least at Keller).
• Menu: In addition to a wide selection of beverages (the most popular being beer, followed by sports drinks), the beverage cart should offer a variety of snacks. If there is enough storage on the cart, consider adding fruit, wraps and sandwiches (if refrigerated space is available).
• Golf Balls: Some operators have had success carrying sleeves of balls on the cart, especially on courses where lost balls are common.
• Hours: For mid-fee and higher courses (Manitou, Keller and Battle Creek) we recommend having the beverage cart operate every day, starting from two hours after the first teetime to two hours before dusk. This way, the beverage cart becomes part of the golf experience for nearly every golfer that plays and is an important part of the overall customer service. It also trains the golfer to expect to have a beverage cart. With value courses, such as Goodrich, there is a much lower expectation for beverage cart service, and customers are much less likely to utilize them, even if they are present. We do recommend having a beverage cart during peak demand times, such as weekends and holidays. We suggest experimenting during leagues. You will likely find that some leagues are very receptive, and others are not.
Drinking Water There were a lot of complaints in our survey about the lack of drinking water at the RC Golf facilities. Apparently, the County made the decision to eliminate drinking water from the courses a few years ago, mostly from a fear of contamination as we understand it.
We do not agree with this decision. To us, having water on the course is as much a health concern as it is a customer service. It is especially important on hot days, but golfers, especially when they walk, can get dehydrated even on cooler days. We see the risk as being much greater in not having water than it is having
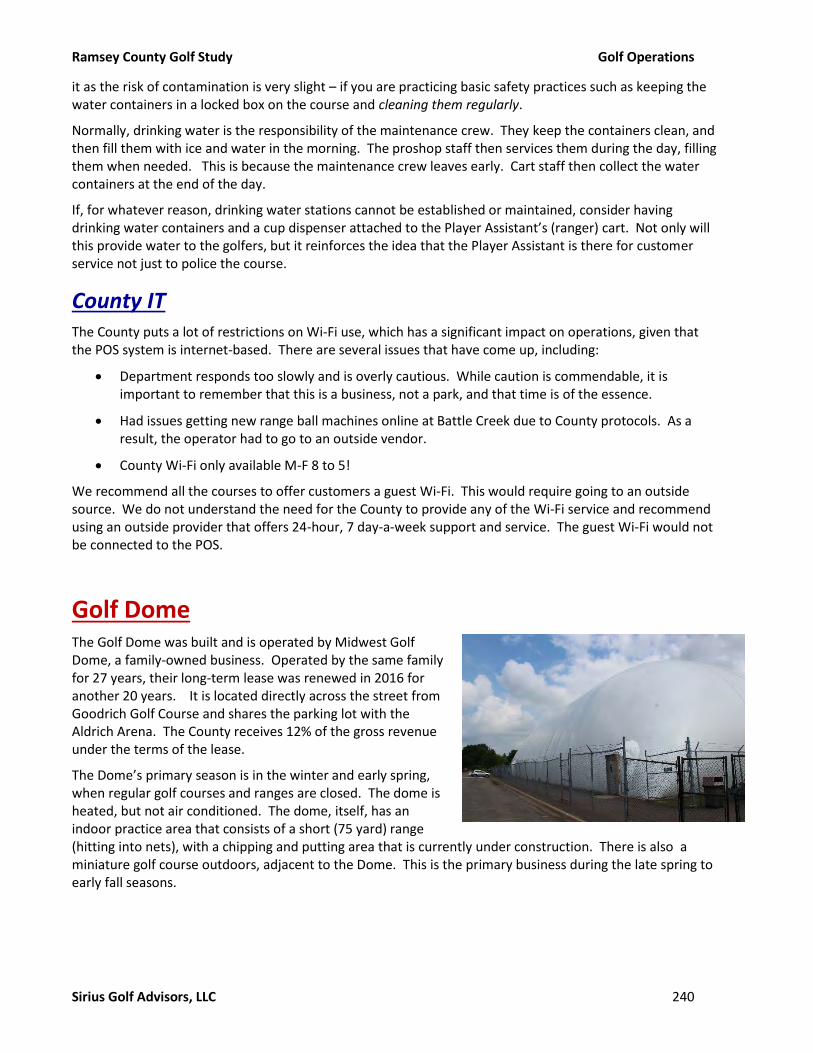
Ramsey County Golf Study Golf Operations
Sirius Golf Advisors, LLC 240
it as the risk of contamination is very slight – if you are practicing basic safety practices such as keeping the water containers in a locked box on the course and cleaning them regularly.
Normally, drinking water is the responsibility of the maintenance crew. They keep the containers clean, and then fill them with ice and water in the morning. The proshop staff then services them during the day, filling them when needed. This is because the maintenance crew leaves early. Cart staff then collect the water containers at the end of the day.
If, for whatever reason, drinking water stations cannot be established or maintained, consider having drinking water containers and a cup dispenser attached to the Player Assistant’s (ranger) cart. Not only will this provide water to the golfers, but it reinforces the idea that the Player Assistant is there for customer service not just to police the course.
County IT The County puts a lot of restrictions on Wi-Fi use, which has a significant impact on operations, given that the POS system is internet-based. There are several issues that have come up, including:
• Department responds too slowly and is overly cautious. While caution is commendable, it is important to remember that this is a business, not a park, and that time is of the essence.
• Had issues getting new range ball machines online at Battle Creek due to County protocols. As a result, the operator had to go to an outside vendor.
• County Wi-Fi only available M-F 8 to 5!
We recommend all the courses to offer customers a guest Wi-Fi. This would require going to an outside source. We do not understand the need for the County to provide any of the Wi-Fi service and recommend using an outside provider that offers 24-hour, 7 day-a-week support and service. The guest Wi-Fi would not be connected to the POS.
Golf Dome The Golf Dome was built and is operated by Midwest Golf Dome, a family-owned business. Operated by the same family for 27 years, their long-term lease was renewed in 2016 for another 20 years. It is located directly across the street from Goodrich Golf Course and shares the parking lot with the Aldrich Arena. The County receives 12% of the gross revenue under the terms of the lease.
The Dome’s primary season is in the winter and early spring, when regular golf courses and ranges are closed. The dome is heated, but not air conditioned. The dome, itself, has an indoor practice area that consists of a short (75 yard) range (hitting into nets), with a chipping and putting area that is currently under construction. There is also a miniature golf course outdoors, adjacent to the Dome. This is the primary business during the late spring to early fall seasons.
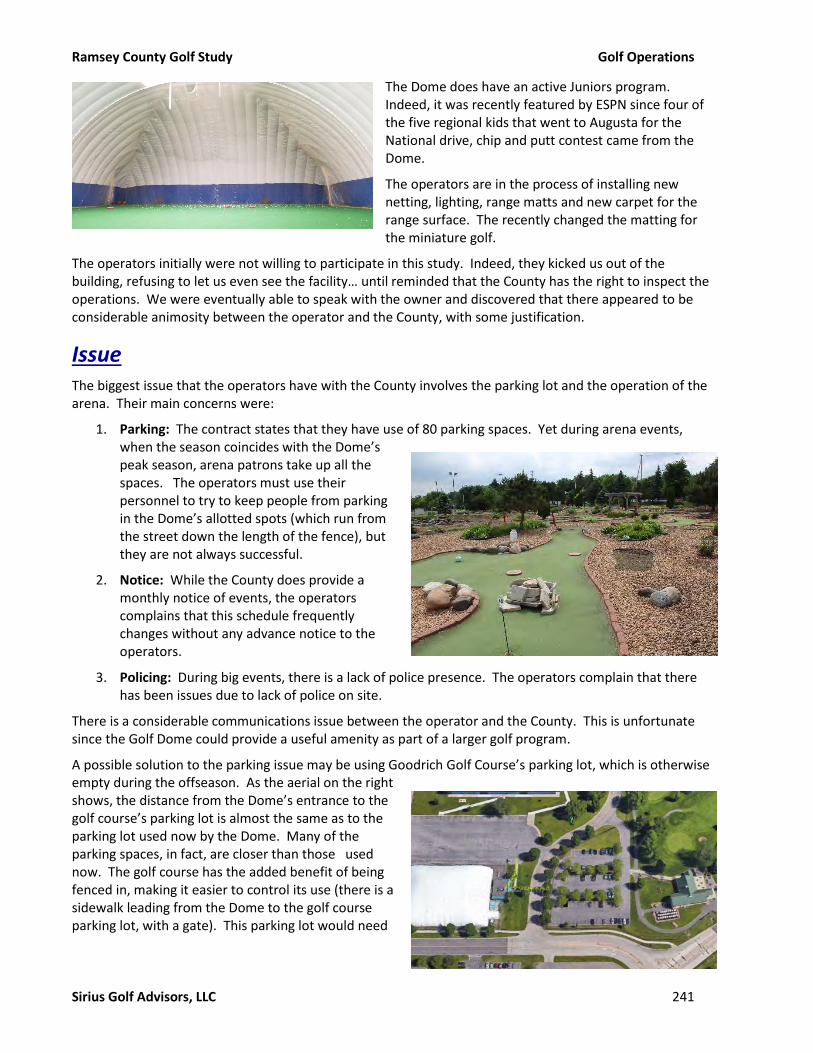
Ramsey County Golf Study Golf Operations
Sirius Golf Advisors, LLC 241
The Dome does have an active Juniors program. Indeed, it was recently featured by ESPN since four of the five regional kids that went to Augusta for the National drive, chip and putt contest came from the Dome.
The operators are in the process of installing new netting, lighting, range matts and new carpet for the range surface. The recently changed the matting for the miniature golf.
The operators initially were not willing to participate in this study. Indeed, they kicked us out of the building, refusing to let us even see the facility… until reminded that the County has the right to inspect the operations. We were eventually able to speak with the owner and discovered that there appeared to be considerable animosity between the operator and the County, with some justification.
Issue The biggest issue that the operators have with the County involves the parking lot and the operation of the arena. Their main concerns were:
1. Parking: The contract states that they have use of 80 parking spaces. Yet during arena events, when the season coincides with the Dome’s peak season, arena patrons take up all the spaces. The operators must use their personnel to try to keep people from parking in the Dome’s allotted spots (which run from the street down the length of the fence), but they are not always successful.
2. Notice: While the County does provide a monthly notice of events, the operators complains that this schedule frequently changes without any advance notice to the operators.
3. Policing: During big events, there is a lack of police presence. The operators complain that there has been issues due to lack of police on site.
There is a considerable communications issue between the operator and the County. This is unfortunate since the Golf Dome could provide a useful amenity as part of a larger golf program.
A possible solution to the parking issue may be using Goodrich Golf Course’s parking lot, which is otherwise empty during the offseason. As the aerial on the right shows, the distance from the Dome’s entrance to the golf course’s parking lot is almost the same as to the parking lot used now by the Dome. Many of the parking spaces, in fact, are closer than those used now. The golf course has the added benefit of being fenced in, making it easier to control its use (there is a sidewalk leading from the Dome to the golf course parking lot, with a gate). This parking lot would need
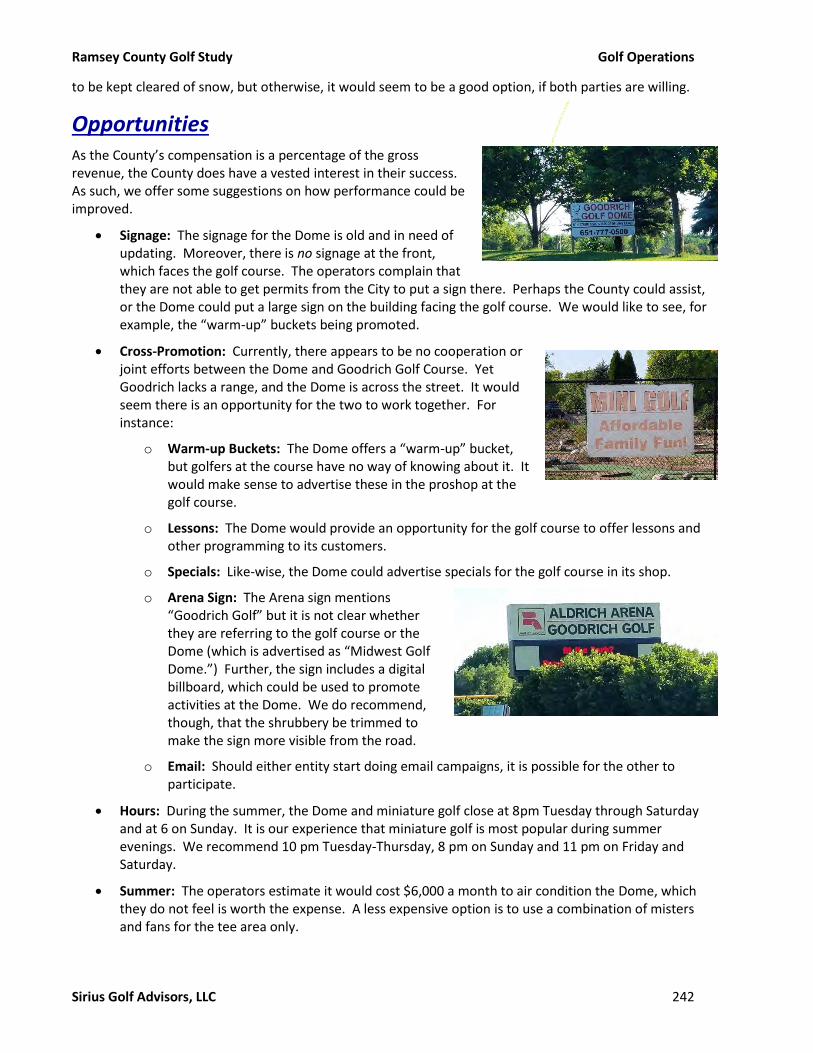
Ramsey County Golf Study Golf Operations
Sirius Golf Advisors, LLC 242
to be kept cleared of snow, but otherwise, it would seem to be a good option, if both parties are willing.
Opportunities As the County’s compensation is a percentage of the gross revenue, the County does have a vested interest in their success. As such, we offer some suggestions on how performance could be improved.
• Signage: The signage for the Dome is old and in need of updating. Moreover, there is no signage at the front, which faces the golf course. The operators complain that they are not able to get permits from the City to put a sign there. Perhaps the County could assist, or the Dome could put a large sign on the building facing the golf course. We would like to see, for example, the “warm-up” buckets being promoted.
• Cross-Promotion: Currently, there appears to be no cooperation or joint efforts between the Dome and Goodrich Golf Course. Yet Goodrich lacks a range, and the Dome is across the street. It would seem there is an opportunity for the two to work together. For instance:
o Warm-up Buckets: The Dome offers a “warm-up” bucket, but golfers at the course have no way of knowing about it. It would make sense to advertise these in the proshop at the golf course.
o Lessons: The Dome would provide an opportunity for the golf course to offer lessons and other programming to its customers.
o Specials: Like-wise, the Dome could advertise specials for the golf course in its shop.
o Arena Sign: The Arena sign mentions “Goodrich Golf” but it is not clear whether they are referring to the golf course or the Dome (which is advertised as “Midwest Golf Dome.”) Further, the sign includes a digital billboard, which could be used to promote activities at the Dome. We do recommend, though, that the shrubbery be trimmed to make the sign more visible from the road.
o Email: Should either entity start doing email campaigns, it is possible for the other to participate.
• Hours: During the summer, the Dome and miniature golf close at 8pm Tuesday through Saturday and at 6 on Sunday. It is our experience that miniature golf is most popular during summer evenings. We recommend 10 pm Tuesday-Thursday, 8 pm on Sunday and 11 pm on Friday and Saturday.
• Summer: The operators estimate it would cost $6,000 a month to air condition the Dome, which they do not feel is worth the expense. A less expensive option is to use a combination of misters and fans for the tee area only.

Ramsey County Golf Study Golf Operations
Sirius Golf Advisors, LLC 243
• Trac Man: Installing trac-man, or similar technology, would make the range a lot more appealing to both Millennials and golfers wanting good feedback. Being just 75 yards long, it can be difficult to determine how the ball is going to react over a longer distance (such as a late hook or slice). Trac man or similar devices can give precise feedback. This would provide an additional revenue stream as the operators would charge extra for using it.
• Marketing: As with the golf courses, the Dome is weak in marketing. We noted even the website was not being kept up-to-date (the hours listed were the winter hours, not the summer, which were not provided). It would benefit from a better website that is kept up-to-date, a strong email program (start asking customers for their email addresses), and a good social media presence that is regularly updated.
• Programming: Should the Parks department start offering golf programming, as recommended, the Dome would be a great addition. It is a natural location for teaching golf to those wanting to learn before the golf season started. The miniature golf course is excellent for junior programming.
• Targets: Consider adding creative targets on the netting in the range to make it more fun.
Island Lake Island Lake, which opened in 1992, has a nice clubhouse (no grill), a good range, and a nine-hole, Par 28 golf course. It also has a miniature golf course that was closed in 2014 because it was unprofitable. The course remains but is in disrepair. Island Lake was built to be a training center and it fulfills this mission nicely. Indeed, its full name is “Island Lake Golf Course and Training Center.” According to Mr. Peebles, the leasee, the mission was to serve as a golf training ground for the County, especially for juniors and seniors, as well as to provide a place to play for kids, who are often not welcome on bigger courses.
As was the case with the Golf Dome, Island Lake is on a capital lease. The current operator (Fore, Inc., owned by David Peebles) designed and built the facility with its own funds and is responsible for all capital improvements. The lease, which expires December 31, 2023, has the operator paying the County the greater of $75,000 or 16% of gross sales for the range, miniature golf and green fees, and 8% on proshop sales, instruction, food and beverage, merchandise, and other activity at the facility. So far, sales have not reached the point where the percentages would kick in.
Last year, the operations were subcontracted out to Ryan McCormick last year, although apparently without the County’s knowledge or permission. Fore continues to maintain the facility.
Strengths The facility appears to be both popular and successful. The owner, David Peebles, maintains it is profitable, despite the lease payment. Last year, with new management, the course saw a significant (20%) increase in revenue. The course at Island Lake is kept in good condition.
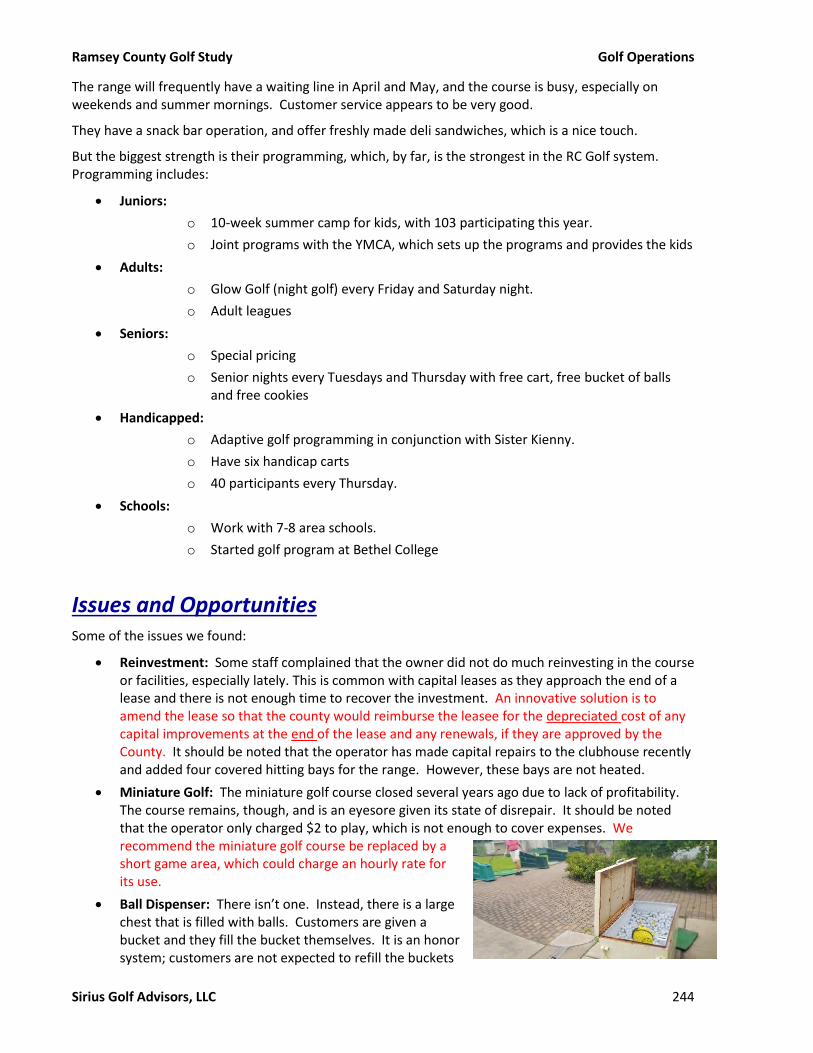
Ramsey County Golf Study Golf Operations
Sirius Golf Advisors, LLC 244
The range will frequently have a waiting line in April and May, and the course is busy, especially on weekends and summer mornings. Customer service appears to be very good.
They have a snack bar operation, and offer freshly made deli sandwiches, which is a nice touch.
But the biggest strength is their programming, which, by far, is the strongest in the RC Golf system. Programming includes:
• Juniors:
o 10-week summer camp for kids, with 103 participating this year.
o Joint programs with the YMCA, which sets up the programs and provides the kids
• Adults:
o Glow Golf (night golf) every Friday and Saturday night.
o Adult leagues
• Seniors:
o Special pricing
o Senior nights every Tuesdays and Thursday with free cart, free bucket of balls and free cookies
• Handicapped:
o Adaptive golf programming in conjunction with Sister Kienny.
o Have six handicap carts
o 40 participants every Thursday.
• Schools:
o Work with 7-8 area schools.
o Started golf program at Bethel College
Issues and Opportunities Some of the issues we found:
• Reinvestment: Some staff complained that the owner did not do much reinvesting in the course or facilities, especially lately. This is common with capital leases as they approach the end of a lease and there is not enough time to recover the investment. An innovative solution is to amend the lease so that the county would reimburse the leasee for the depreciated cost of any capital improvements at the end of the lease and any renewals, if they are approved by the County. It should be noted that the operator has made capital repairs to the clubhouse recently and added four covered hitting bays for the range. However, these bays are not heated.
• Miniature Golf: The miniature golf course closed several years ago due to lack of profitability. The course remains, though, and is an eyesore given its state of disrepair. It should be noted that the operator only charged $2 to play, which is not enough to cover expenses. We recommend the miniature golf course be replaced by a short game area, which could charge an hourly rate for its use.
• Ball Dispenser: There isn’t one. Instead, there is a large chest that is filled with balls. Customers are given a bucket and they fill the bucket themselves. It is an honor system; customers are not expected to refill the buckets

Ramsey County Golf Study Golf Operations
Sirius Golf Advisors, LLC 245
without paying. While this trust is commendable, it may not be good business practice. We recommend using electronic ball dispensers that take both credit cards and an electronic key or card. The electronic key or card works like a debit card. It is preloaded in the proshop with a dollar amount that can then be used in the machines. The big advantages to this system include:
o Self Service: Customers can go straight from their car to the range, which can decrease lines in the proshop, especially during high demand times, thus improving customer service.
o Incentive: The operator can offer discounts, depending on how much the person is willing to put on the card. For example, a $100 would get you $115 worth of balls, $200 would get you $250, etc. This gets the customers to purchase more up front and will increase overall volume.
o Tracking: The dispenser keeps track of all balls, providing an accurate count that can back-up the POS.
o Wear and Tear: The operator can set a precise number for the balls to be dispensed. This will likely result in fewer balls per bucket than when the customer fills it up themselves, resulting in less wear and tear on the balls.
• Tees: There used to be two sets of tees on each hole, with a back tee that is no longer in use. However, the tee signs still show this tee. We assume the tee was taken out primarily as a cost-saving measure. We recommend the back tees be put back in use. The added length will increase the appeal to established golfers, while decreasing the wear and tear on the current tees. The teeboxes are the biggest customer complaint, according to staff.
• Parking Lot: Needs to be restriped.
• Maintenance Building: The maintenance building/cart shed is substandard and too small. The wash area is dirt covered as is access to the course, making it more challenging to keep equipment clean.
• #7 Pond: This pond has apparently been causing issues with the surrounding neighborhood. The home owner’s association has been complaining s the pond overflows into the neighborhood and looks bad. They are also concerned about pollutants. According to the operator, this pond is on County land, with a fence between it and the course. The County is supposed to maintain. The controls for the drainage are not on golf course property that is included in the lease. However, the operator had been maintaining it on his own. This is not without issues as it not only adds expense but requires them getting a ladder to climb over the fence to access the controls. The operator had asked for compensation from the County for maintaining, but the County refused, so the operator stopped maintaining. We are not able to resolve this matter, but strongly suggest that it be resolved as soon as possible. If the operator does become responsible for maintaining, a gate should be installed to provide easier access.
• Other Ponds: There is considerable growth, either duckweed or algae, on all the ponds. It looks horrible. We understand that these ponds have aerators in them, but they were turned off for cost reasons. We strongly recommend that these ponds be aerated and kept clean. Not only will this greatly improve the aesthetics of the facility, but the current condition gives off a very negative image, suggesting financial difficulty, which is never good for business. It also raises more concerns about pollutants.

Ramsey County Golf Study Golf Operations
Sirius Golf Advisors, LLC 246
• Signage: Signage to the course is weak. The course is hidden, being tucked behind a shopping center and not visible from the highway. Better signage would help create an awareness that he facility exists.
• Range Length: The range is only 279’ long (250’ from the grass tee). This is short by modern standards. There is a 50’ netting at the end of the range to contain balls, but that is never a desirable solution as golfers want to see their shots land. This is not an easy fix. The operator has proposed moving the clubhouse, which would allow the range to be extended. But is unlikely to do so with such a short time remaining on his lease.
• Marketing: While Island Lake is a little more proactive than the other facilities, especially with social media, it is still weak. The website is not very good, and they are not spending a lot of money on advertising.
• County Cooperation: To us, this is one of the biggest concerns. It is also perhaps the biggest opportunity. The facility was apparently designed to be a “feeder” course into the RC Golf system. But to do this successfully would require both an identification as being part of the RC Golf system as well as significant cooperation with the County and other operators. None of this is happening. For example:
o Monthly Meetings: Island Lake used to participate in the monthly meetings, but a disagreement resulted in them no longer attending or being invited to attend. With a new operator (subcontractor) we recommend that they once again participate in these meetings.
o County Website: The county website refers customers to Battle Creek for lessons and junior programming. Island Lake is not mentioned. This should be corrected.
o Programming: Island Lake has the best programming in the system. Many of these programs can and should be extended throughout the system and promoted by the County.
Opportunities Below are some areas where we feel could be improved, leading to better performance:
• Range targets: We recommend building target greens and possibly a fairway. This would make the range more attractive and consistent with modern standards.
• Covered, Heated Bays: Add more covered, heated bays. This will extend the season and low range use during inclement weather in-season. These do not need to be completely enclosed.
• Technology: Consider adding technology to the range, such as trac-man. This will not only add a new revenue stream but will make the facility more attractive to millennials and golfers desiring feedback.
• Short Game Area: Remove the miniature golf and construct a short game area, including a practice bunker and target green. This can be a revenue stream as ranger operators typically charge an hourly rate for use. It will also enhance the training ability of the facility.
• Cross Programming: Work with County and other RC Golf courses as noted above.
• Range Expansion: We love the operator’s idea of moving the clubhouse and expanding the range.

Ramsey County Golf Study Golf Operations
Sirius Golf Advisors, LLC 247
Battle Creek The Ponds at Battle Creek is the newest RC Golf facility, with the driving range opening in 2003 and the course a year later. The driving range is arguably the best in the County and is exceeding popular, with frequent waiting lines. The nine-hole championship golf course is a modern design that is both scenic and challenging. It is the only one in the system to have five sets of tees on every hole.
Brad Behnke operates both Battle Creek and Goodrich, although under separate contracts. The contract was recently extended in January 2018 and runs through December 31, 2022, with a five-year renewal option. Under the contract, the operator is responsible for management and staffing of the golf operations, including food and beverage. Compensation includes:
• Annual retainer of $25,000 per year, payable on January 15 of each year of the Agreement.
• 10% of gross revenues (less sales tax) for greens fees up to $225,000 and 15% of gross revenues for green fees (less sales tax) greater than $225,001,
• 10% of gross revenues (less sales tax) for motorized golf cart fees, and wheelage fees up to $65,000 and 15% of all gross revenues (less sales tax) for motorized golf cart fees and wheelage fees over $65,001.
• 20% of gross revenue (less sales tax) from driving range sales up to $135,000 and 25% of gross revenue (less sales tax) from driving range sales above $135,001
• The Contractor shall pay the County the following:
o 5% of gross revenues (less sales tax) for facility rental fees and food and beverage sales
• The contractor keeps all revenue from merchandise sales and lessons.
We will discuss issues with the operator contracts more fully under Major Issues.
The golf course is not typical of nine-hole courses, particularly in this area, as it is very challenging – especially for juniors, women and senior with long forced carries. We talk more about design issues both under the Architect’s Report and under Major Issues. Only about 5% of its play is 18-holes.
A unique characteristic of the course is that there are two greens for hole # 3. The seldom-used alternate green greatly shortens the hole but does allow for a playing a three-hole loop (1,2,3) as the alternate green is close to the clubhouse.
Battle Creek has consistently had a negative cash flow.
Strengths There are a lot of positive aspects to Battle Creek. These include:
• Location: Battle Creek is convenient to downtown and to the suburbs of Woodbury and Oakdale. It is the southernmost of the RC Golf facilities. Notably, it is very close to the 3M International headquarters.
• Design: The course is aesthetically very pleasing. It is challenging and close to Keller in quality.
• Range: The practice facility is excellent and extremely popular.
• Customer Service: Customer service is outstanding and received excellent reviews.
• Customer Satisfaction: Battle Creek received the highest overall satisfaction scores of any RC Golf facility in our customer survey.
• Optional Loops: Battle Creek can offer 3-, 4- and 5-hole loops for golfers wanting a very quick round. (However, these are seldom used).
Ramsey County Golf Study Golf Operations
Sirius Golf Advisors, LLC 248
• In-House Leagues: Battle Creek does a good job with leagues they have organized, including a league for juniors and one for couples.
• Website: Has its own website, pondsatbattlecreek.com. However, it also needs a lot of work. The nice thing they do, though, is maintain league stats, which we applaud.
Concerns The following are some of the main weaknesses or issues at Battle Creek. We have categorized them by area.
Facility These issues are mostly covered elsewhere in the report.
• Golf Course: The biggest problem is that the golf course is not what you expect from a nine-hole course in this area. This means that people who enjoy the challenges seen at Battle Creek are not likely to play here and those that come because it’s a nine-hole course may be disappointed. We talk a lot more about this under the Architect’s Report and under Major Issues. It also has several long, forced carries that add to the difficulty, especially for women, juniors and higher handicap players.
• Parking: The parking lot is too small for the demand, especially during peak periods for the range. This puts an artificial cap on income as there is no other convenient alternative to the existing parking lot.
• Clubhouse: Issues with the clubhouse include:
o No Grill
o Limited storage
o No room for beer taps
o Sound System: Is not very good, making it hard to hear when calling players to the first tee,
• Course Construction:
o Irrigation System: Was substandard when installed and has issues
o Bridges: Were built by correctional staff and likely have long-term issues. Many may need replacement.
o Cart Paths: Have lost some due to erosion, wear.
• Length:
o It appears that the course could be lengthened by 150 to 250 yards by moving some of the tees. It could be longer if Hole #2 is converted to a Par 4, which would also increase the Par to Par 72. The added length would make the course more consistent with its difficulty and may make it more marketable to better players. We recommend lengthening the course from the back tees as much as possible if the “Elite Nine” Scenario is chosen.
Operations • POS:
o Occasionally gets cut off
o Does poor job with inventory control
We recommend and new POS system for all of RC Golf

Ramsey County Golf Study Golf Operations
Sirius Golf Advisors, LLC 249
• Ball Machine: The last ball machine is located too far from Wi-Fi and frequently goes off-line. Should be an easy fix by adding a Wi-Fi extender.
• No rangers: Addressed above under Pace of Play
• Singles/Doubles: We had complaints that the starters (when there are any) and the proshop are doing a poor job of putting singles/doubles together. This will add to pace of play issues and create frustrations as the singles and doubles will want to play through larger groups, who normally have the right-of-way. Need better training.
• Starters: Only used Thursday evening and Friday-Sunday. This may be okay, depending on volume. But it can contribute to a slower pace of play and other issues. As volume grows, the need for a starter becomes more important.
Other • Location: The location also has its problems. The course is directly across the street from a
prison and next door to a police shooting range, with sounds of gunfire constantly reverberating around the course. Not the most welcoming environment.
• Maintenance Equipment: Battle Creeks is at the bottom of the totem pole, getting mostly hand-me-downs from other courses. This can impact both efficiency and quality. This could become a bigger issue, depending on the strategy for Battle Creek going forward.
• Public Country Club (PCC): Participates in PCC. See our discussion below, under Goodrich.
• Name: There is another course called “The Ponds,” which has caused a lot of confusion. Golfers will book their teetimes at that course and show up at Battle Creek, then get upset because there teetime is gone. We recommend dropping “The Ponds at” from the name and going with simply “Battle Creek,” which we believe to be a much stronger name.
Opportunities Many of the opportunities are tied to the development scenarios described later. Below are some that can be implemented immediately and work with any of them.
• Range targets: We recommend building target greens and possibly a fairway on the range. This would make the range more attractive and consistent with modern standards.
• Covered, Heated Bays: Add 10-20 heated bays. These would be located behind the mats. This will extend the season and improve low range use during inclement weather in-season. These do not need to be completely enclosed. One or two bays could be enclosed to allow for video equipment that would be helpful with teaching.
• Technology: Consider adding technology to the range, such as trac-man. This will not only add a new revenue stream but will make the facility more attractive to millennials and golfers desiring feedback.
• Company Leagues: Given the proximity to 3M, it is very surprising that there are no 3M leagues at Battle Creek. This may simply be due to lack of awareness of the quality of the facility. The facility needs to be proactive in talking to area employers.
• Women’s Club: Battle Creek does not have a women’s club. We recommend starting one.
• Outdoor Grill: They utilize an outdoor grill some at Battle Creek, but only on league nights. We want to see this use extended to weekends, from 11-2. It may take time to build up business, but it adds to the overall golf experience. The grill needs to be set-up convenient to both the range and golf course, with signage at the range to indicate its availability.

Ramsey County Golf Study Golf Operations
Sirius Golf Advisors, LLC 250
• In-House Promotion: We talk extensively about outside marketing later. However, Battle Creek has a unique opportunity in that many (if not most) of their range customers do not play the course. We suspect a lot of this is due to the misperception regarding the quality of the course. A lot can be done-in house with more course photos in the clubhouse and signage on the range. Theme would be “Experience the Best 9-hole Course in Minnesota”. Consider promoting a “Trial Package” that would feature the 3-, 4- and or 5-hole loop at a special price.
Goodrich Goodrich currently serves a mostly blue-collar crowd, according to the operator. Very few juniors play the course and the typical customer is not technologically sophisticated, making marketing more challenging.
The course is the least difficult in the RC Golf family, with mostly flat terrain and featuring small, mostly circular greens. It is the only course in the system to not have a driving range, although the Golf Dome is located directly across the street.
As with Battle Creek, Goodrich is operated by Brad Behnke under a management contract. The contract is set to expire in February 2019 but can be renewed for another year. Under the contract, the operator is paid $48,000, part of which is to go to the funding of “rangers and starters,” although Goodrich does not employ any rangers. The operator also gets 10% of the green and cart fees plus $1.50 for each 18-hole cart round and $.75 for each nine-hole round. The contractor pays the County 10% of his revenue from food and beverage sales and 5% of merchandise sales over $50,000. We shall talk more about the Contract under “Major Issues.”
Goodrich’s customer base is largely blue-collar. Few juniors play the course, even though it is a good course for them.
Strengths Among the many strengths of Goodrich are:
• Very playable golf course that is good for higher-handicap players and facilitates a quicker pace of play.
• Yardage well marked.
• Great customer service.
• Excellent bar service, with 10 beer taps and a very popular happy hour featuring 2 for 1 beer.
• Clubhouse has full basement, with plenty of storage.
• Nice patio area around clubhouse.
Weaknesses • No range
• No grill.
• No banquet space.
• Below-average merchandise sales.
• Limited menu.
• Greens are all circular and “boring.”
• Bunkers are inconsistent, with seven different types of sand.

Ramsey County Golf Study Golf Operations
Sirius Golf Advisors, LLC 251
• Back-to-back Par 3s that are nearly identical.
• Maintenance area clearly visible from course, with no screening.
• Parking lot is small.
Concerns
Public Country Club (PCC) Public Country Club: The biggest issue concerns Goodrich’s (as well as Battle Creek’s) participation in a discount program called “Public Country Club.” In this program, participants pay $75 to join, plus $55/month. They get unlimited free green fees at participating golf courses. Participants are required to pay a cart fee, which is $20 for 18 holes at participating facilities and $10 for nine. But carts are not required. Courses can black-out weekends between 7 and 11 am. Customers are limited to 12 rounds per month per course.
The courses are paid a proportional amount of the $55/month fee based on the number of PCC rounds played there.
PCC is enormously popular at Goodrich, accounting for nearly 1/4th of its play (23.2%).
There are several issues surrounding the program. These include:
• Revenue per round: Goodrich received $103,393 for the 6,890 PCC rounds last year. This equates to just $15.01 per round, which is roughly ½ of rack rage. (The PCC players did generate 1,713 cart rounds, good for $28,820). This is not necessarily a bad thing as we feel Goodrich should be repositioned as a value course anyway, in which case this fee is much closer to rack rate.)
• Accounting: PCC pays the clubs on only a few times a year. When the check is received, because there is no procedure in place as to handle the revenue, the revenue is entered as so many 18-hole patron rounds into the POS. Thus, greatly distorting the Patron rounds and, really making it difficult to develop a real understanding. This brings up a couple of concerns – including the rigidity of County procedures. The most obvious solution is to create a customer account for PCC in the POS. Second, you create a PCC rate that is based on what you predict your compensation is (such as $17 for 18-hole rounds and $12 for 9-holes). When a PCC round is played, it is rung in under the PCC round, but the charge would go to the PCC customer, and treated as an Accounts Receivable. At the end of the year, an accounting can be made to adjust for the actual revenue received vs. what was rung in. The advantage to this system is that It maintains an accurate accounting of play within the system.
• Accounting (2): Further, because the allowable cart fee under PCC is different from the County’s cart fees, means that every PCC cart round requires two entries. The first is the regular cart fee, then the 2nd is for the difference – which is an additional $4.50 for the 18-hole round but requires a “coupon” for $1 on the nine-hole cart. Very simple fix. Have a PCC 9- and 18-hole cart fee. Don’t keep trying to force a square peg into a round hole.
• RC Golf Operators: The other operators within the system are crying “foul” about the practice as they feel it is stealing play from their courses. However, if Goodrich was not participating, it is likely that a large percentage of these players are lost entirely from the County courses.
Other Issues • Rangers: The contract appears to call for rangers, but Goodrich does not use them. On the one
hand, pace does not appear to be a major issue, based on survey results. Yet, this is not likely to remain the case as the course gets busier. See our discussion on Pace of Play above.

Ramsey County Golf Study Golf Operations
Sirius Golf Advisors, LLC 252
• Course Signage: There are several areas on the course where it is confusing as to where to go. This would include going to 4th, 12th and 18th tee.
• Entrance Sign: Entrance sign is hard to see, especially from the main roads.
• EAB: Goodrich has several ash trees potentially in danger from EAB. Yet there is no treatment or replacement plan in place. This should be addressed as soon as possible as the loss of trees with affect both the aesthetics of the course and raise safety concerns.
Opportunities • Aesthetics: There are a few things that can improve the aesthetics of the course.
o Maintenance area: We recommend planting trees and shrubs to effectively hide the maintenance area from view. Another option is to use 8’ high wood fence around the maintenance area, which would have the added benefit of improving security.
o Clubhouse: The clubhouse could use new furniture and paint.
• Food and Beverage: Discussed above. However, Goodrich would appear to have the room to add a grill with some minor modifications to the clubhouse. Given the popularity of the bar, this might be a good idea. However, the need for a grill gets diminished if the course is repositioned as a value facility, where grills are not as common. We recommend extensively using an outdoor grill on weekends and league nights. If this proves popular, it could be a good indicator that a grill is a good investment.
Manitou Manitou has traditionally been the busiest of the RC Golf facilities, having had as many as 62,000 rounds, and has played over 50,000 rounds as recently as 2001. It has perhaps the best location of the RC Golf facilities, as it fronts I-694.
Manitou is operated under an operating lease whereby the operator (Golf Services Corporation – owned by Greg Hubbard, who serves as the course’s GM and Superintendent) is responsible for all operating costs, including maintenance and maintenance equipment, while the County is responsible for capital improvements. The new agreement, which dramatically reduced the County’s share of the revenue from 25% to 13%, is for five years, starting in January 2017 and expiring at the end of December 2021, with no renewals. The lease calls for the operator to pay the County 13% of the gross revenue after sales tax. Gross revenue includes cart and green fees, range, food & beverage and merchandise sales.
The County recently built a new maintenance building and cart barn (2017), including a water recycling system for the equipment wash area. But there remains a significant amount of deferred maintenance items on the course, as noted in the Architect’ report. In addition, 120 Ash trees are endangered due to Emerald Ash Borer (EAB), which is also present at other RC Golf courses, but not to the degree seen at Manitou.
Manitou is heavily league dependent, with about half their business coming from leagues.
Strengths • Terrain: Manitou has wonderful land, with excellent elevation changes. However, the current
routing does not take full advantage of the terrain.
• Maintenance Building: The new maintenance and cart buildings are first class.
• Recycling: The maintenance wash area has state-of-the-art recycling system.

Ramsey County Golf Study Golf Operations
Sirius Golf Advisors, LLC 253
• New cart fleet: Manitou introduced a new cart fleet this year, eliminating a problem area.
• Leagues: Manitou probably has more league players than the other three RC Golf facilities combined. Most of these leagues have been playing at the course for many years and have been loyal to the facility. Several of these leagues are “open” leagues managed by the facility that are open to any golfer.
• Juniors: Manitou does offer several junior programs, including a summer camp and a summer league. However, these are not well-publicized or attended.
• Range: Manitou, unlike Goodrich, does have a driving range.
• Location: Manitou is located right on I-694.
• Clubs: Manitou has three active clubs – a men’s club with 150 members (but membership has been declining), 40 in a women’s club and another 100 in a senior’s club.
• Disabled Vets: Manitou provides free lessons and golf for disabled vets. However, it does not have any handicap carts that would facilitate their play. We encourage Manitou to add handicap carts, perhaps in connection with Sister Kenney or various veteran organizations.
Weaknesses • No Grill: Manitou is at a significant competitive disadvantage in not having a grill. To add one
would require an addition to the clubhouse.
• Storage: The clubhouse also lacks storage areas.
• Range: The range is underperforming and is not getting a lot of range-only usage. Safety concerns requires the usage of limited flight balls, which are unpopular with golfers.
• Marketing: As noted previously, marketing is a weakness system wide and Manitou is no exception. However, Manitou has shown some initiative in that it maintains its own webpage, has a Facebook and Twitter presence (first one to do so), and offers the Yamitract mobile ap. We will discuss more in our Marketing section.
• Banquet: There is not enough space to host tournaments or banquets of any size.
• Clubhouse View: The bar area offers no view of the course. The grill area has a very poor view. This makes it less desirable, especially for outings and for women.
• Landscaping: In a word, horrible. We have heard more complaints about landscaping at Manitou than any other course in memory.
Concerns Manitou suffers from all the issues noted above under “Common Issues.” Other issues include:
• Deferred Maintenance: We will discuss this more under Capital Improvement Needs.
• Customer Satisfaction: Manitou scored poorly on our customer survey, suggesting it may be vulnerable to losing even more play. It is already trending downward.
• Women: As noted previously, Manitou figuratively hangs a sign at the entrance saying “women not welcome” as it does its best to make it inhospitable to women. This can be seen in several ways:
o Length: As noted, the course plays the equivalent of over 7,800 yards for women – making it both difficult and time consuming to play. This also slows the pace for all golfers on the course.
Ramsey County Golf Study Golf Operations
Sirius Golf Advisors, LLC 254
o Menu: There were no healthy choices on the menu when we arrived. At our urging, they have expanded the menu to offer both fruit and wraps.
o Customer Service: Women rated the customer service more harshly than men, suggesting differential treatment.
o Merchandise: Women rate the merchandise selection among the worst of courses surveyed.
o Landscaping: Women are perhaps more sensitive to aesthetics as they complained a lot more about the lack of landscaping and the empty flower beds.
• Despite these shortcomings, Manitou had one of the larger percentage of women responding to the survey (23%). However, three-fourths of the women responding were either league players or members of the ladies’ club. And they also rated the course significantly worse at 6.8 (11th percentile) vs. 7.5 (32nd percentile) for men.
• Customer Service: Customer service can be listed as both a strength and a weakness as we had comments on both sides of the ledger. What that indicates to us is that customer service is inconsistent. It may well be that some populations, such as regulars (especially male regulars) are being treated differentially. While this may promote loyalty among the existing clients, it will deter other golfers from returning due to poor treatment. The comments also suggest that the issues may only be limited to one or two staffers, rather than being true for all.
• EAB: Manitou has perhaps most affected of the RC Golf courses with 120 ash trees potentially in danger from EAB. Yet there is no treatment or replacement plan in place. This should be addressed as soon as possible as the loss of trees with affect both the aesthetics of the course and raise safety concerns.
• Weekend Play: Outside of the men’s and women’s clubs, which take up the highest demand teetimes on weekends, Manitou struggles to fill other teetimes on weekends.
• League Dependent: The problem with being so dependent on leagues is that it makes you more vulnerable should they start defecting, which has been happening recently. And given the poor ratings on our survey, Manitou is in danger of losing more leagues.
Opportunities Manitou has proven that it can be a winner and major profit center. We believe it can again, but it will require both capital investment and a retooling of operations, with a special emphasis on women.
Range We will discuss some major capital improvements to the range later in the report. In addition to capital improvements, range performance can be improved with the addition of:
• Matts – to allow for usage in wet weather and to extend the life of the tee turf.
• Dividers – allows more golfers and adds safety. Especially important with mats.
• Netting – The nets need to be higher, to protect the parking lot and entrance road.
• Yardage Markers: There should be several yardage markers placed around the range showing the adjusted yardage to the various targets. By adjusted yardage, we mean taking into consideration the use of limited flight balls so the yardage lines up better with club selection.
• Self-Service: Make the range friendlier to range-only users by making it self-service. We recommend electronic ball dispensers that take both credit cards and electronic keys or cards. By discounting larger prepays onto the cards, it encourages more range use. Self-service allows users to park closer to the range and bypass the proshop.

Ramsey County Golf Study Golf Operations
Sirius Golf Advisors, LLC 255
Food & Beverage • Grill: Manitou would benefit most of the RC Golf facilities by adding a grill (except Keller, which
already has one). They are already doing a higher volume of food and beverage, and with their price point, they need one to remain competitive. However, adding a grill will require expanding the clubhouse. But this could also allow for the potential addition of a banquet room, or at least a private dining area for smaller groups.
• TVs: Add more big-screen TVs throughout the dining and bar areas, to provide more of a sports-bar feel.
• More Taps: Take a cue from Goodrich and add more draft beer options, especially craft beers.
• Beverage Cart: Expand hours and improve service.
Keller There is no doubt that Keller is the Flagship of RC Golf. Its history is unmatched in area public golf, having hosted two different PGA Championships among many other significant events. It’s recent renovations (2014) make it comparable to the best public courses in the area.
One of the unique and problematic aspects of Keller is that there are three different management entities involved in the day-to-day operation. The County maintains the course. Golf Operations is contracted out to Foley Professional Golf Services LLC (Mark Foley, who also serves as Head Professional) and the Food and Beverage and clubhouse operations is contracted out to Lancer Hospitality.
Ramsey County entered into a ten-year agreement with Lancer Hospitality in 2013, prior to the clubhouse opening. The lease expires the end of 2023. Under the agreement, Lancer has the exclusive right to provide food and beverage services, including vending machines, beverage cart, catering, bar and restaurant services. In exchange, the County receives 12% of the net sales, which is defined as gross sales less sales tax, gratuities, etc. The County provides the equipment and furniture in addition to the clubhouse and facilities.
The agreement with Foley was recently renewed in January 2018 and extends through the end of 2022. Under the agreement, Foley provides the staff and oversees all aspects of the golf operation. Foley receives 100% of the income from merchandise sales, lessons and rental equipment (other than power carts). He also receives 85% of range revenue (95% in 2018) up to $40,000 gross, and 100% thereafter; 10% of green fees up to $850,000 and 15% above that amount; $1.50 for each 18-hole cart rental and $.75 for each 9-hole rental; plus, a $46,000 stipend ($41,000 in 2018).
We will discuss the contracts more under “Major Issues.”
Strengths • Excellent golf course that was recently completely renovated (2014), making it one of the
newest courses in the area.
• Outstanding clubhouse that is great for both golf and banquets.
• History: Hosted two PGA Championships, one of the few public courses in the county so honored. It also was the host for the St. Paul Open on the PGA tour for 38 years, the Western Open (1949), the National Publinks Championship in 1931 and the Women’s Patty Berg Golf Classic from 1973-1980. No other public course in the metro area and few in the country can match Keller’s rich history.
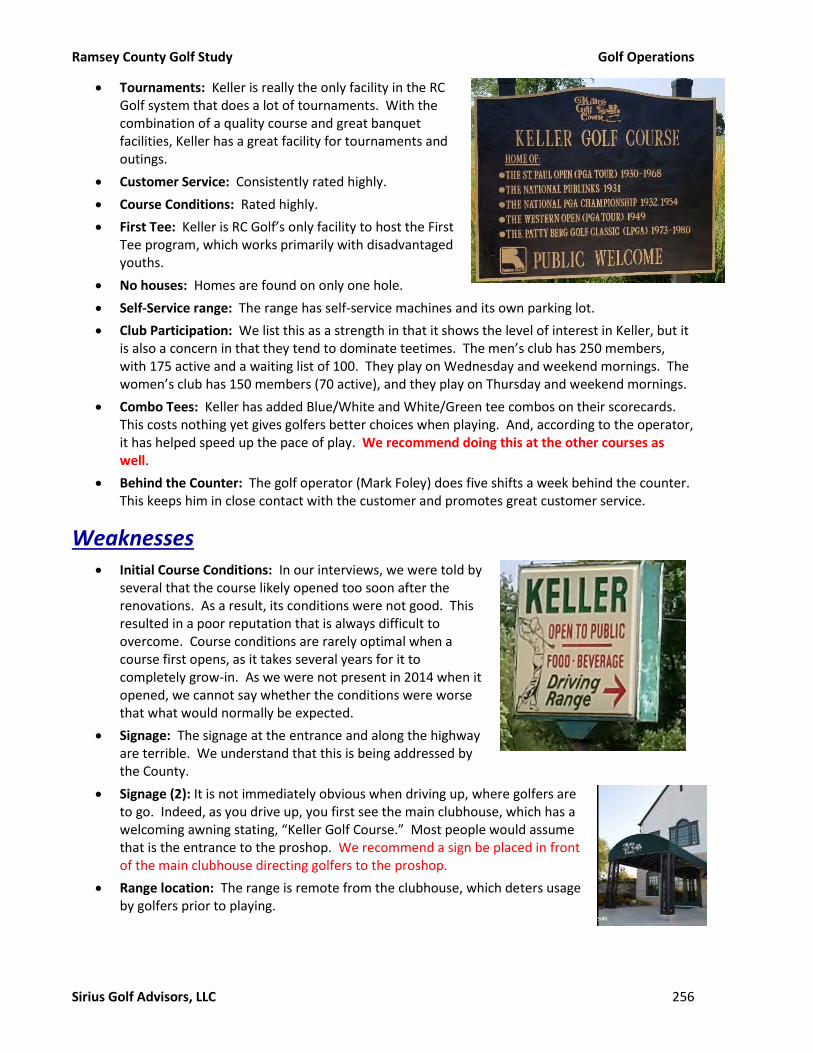
Ramsey County Golf Study Golf Operations
Sirius Golf Advisors, LLC 256
• Tournaments: Keller is really the only facility in the RC Golf system that does a lot of tournaments. With the combination of a quality course and great banquet facilities, Keller has a great facility for tournaments and outings.
• Customer Service: Consistently rated highly.
• Course Conditions: Rated highly.
• First Tee: Keller is RC Golf’s only facility to host the First Tee program, which works primarily with disadvantaged youths.
• No houses: Homes are found on only one hole.
• Self-Service range: The range has self-service machines and its own parking lot.
• Club Participation: We list this as a strength in that it shows the level of interest in Keller, but it is also a concern in that they tend to dominate teetimes. The men’s club has 250 members, with 175 active and a waiting list of 100. They play on Wednesday and weekend mornings. The women’s club has 150 members (70 active), and they play on Thursday and weekend mornings.
• Combo Tees: Keller has added Blue/White and White/Green tee combos on their scorecards. This costs nothing yet gives golfers better choices when playing. And, according to the operator, it has helped speed up the pace of play. We recommend doing this at the other courses as well.
• Behind the Counter: The golf operator (Mark Foley) does five shifts a week behind the counter. This keeps him in close contact with the customer and promotes great customer service.
Weaknesses • Initial Course Conditions: In our interviews, we were told by
several that the course likely opened too soon after the renovations. As a result, its conditions were not good. This resulted in a poor reputation that is always difficult to overcome. Course conditions are rarely optimal when a course first opens, as it takes several years for it to completely grow-in. As we were not present in 2014 when it opened, we cannot say whether the conditions were worse that what would normally be expected.
• Signage: The signage at the entrance and along the highway are terrible. We understand that this is being addressed by the County.
• Signage (2): It is not immediately obvious when driving up, where golfers are to go. Indeed, as you drive up, you first see the main clubhouse, which has a welcoming awning stating, “Keller Golf Course.” Most people would assume that is the entrance to the proshop. We recommend a sign be placed in front of the main clubhouse directing golfers to the proshop.
• Range location: The range is remote from the clubhouse, which deters usage by golfers prior to playing.

Ramsey County Golf Study Golf Operations
Sirius Golf Advisors, LLC 257
Concerns • Food and Beverage: Discussed at length in Major Issues.
• Three Managers: Having three managers reporting to three different entities, can be problematic. It makes it much more difficult to coordinate and there is no one on site that oversees the entire operation. Further, the fact that food and beverage is run by a different company makes it difficult to market golf packages that would include food and beverage, putting Keller at a competitive disadvantage.
• Area Demographics: The immediate area around Keller is not strong for golf participation. However, Keller’s marketing draw should be regional, not local. Especially if it is repositioned.
• Driving range: Neighbors complaining about balls over the fence. Fence was installed 10’ lower
than planned. They will be lowering the range and reorienting the tee as well as moving one of the
practice holes. May trigger ADA compliance which could lead to closing of the parking lot. The range
was closed in August 2018 as this issue is being addressed.
• Maintenance Issues: We heard complaints about the greens not being rolled on a regular basis and
that pin placements are often in unfair locations. We did not observe any issues, other than tee
markers were frequently located in worn spots on the tees, indicating they are not being properly
moved around.
• Clubs: With 400 members combined in the men’s and women’s club, Keller is in danger of looking
more like a private facility than a municipal one, especially on the highest demand times, weekend
mornings. Combined, the two clubs dominate teetimes four mornings a week, including Saturday
and Sunday. Almost all club members are either pass holders or Patrons. The clubs are their own
entity. The course does not get any of the membership dues, nor does the course participate in the
management of the clubs. See below.
• Staff Appearance: Proshop staff were observed wearing jeans and even shorts. They did not have
name tags. This is what we would expect at a Value facility, not at the nicest facility in the County.
While we appreciate the desire to keep it more casual, it is important to remember that Keller gets a
lot of visitor and outing play. Shirts were not logoed. Staff appearance simply is not in-line with
comparable courses. Should Keller be repositioned, as recommended, proshop staff should be
required to wear professional attire, including pants, not jeans or shorts, have a Keller-logoed shirt,
and wear a name-tag. These requirements should be true for all staff that meet customers,
including starters and rangers.
Opportunities Keller is, by far, the best performing facility in the system. Indeed, it makes more money for the County than the others combined. Yet it also has the best potential for improving performance. There are four areas where improvements can lead to a significant improvement. They are:
1. Market Repositioning: Keller should be repositioned as a Premium facility ($70+ green fee). This will not only increase the revenue per round but will likely increase the market reach. We will discuss this more elsewhere in the report.
2. Food and Beverage: The F&B operation, as it relates to golf, is the anchor holding the operation back. This must be fixed for the operation to get close to its potential. This is discussed more under Major Issues.

Ramsey County Golf Study Golf Operations
Sirius Golf Advisors, LLC 258
3. Marketing: Keller would benefit the most from improved marketing. We will discuss this more under Major Issues.
4. Clubs: There is no doubt that the clubs are a mixed blessing. On the one hand, they represent a large chunk of business and represent a strong local base. But on the other hand, they can carry too much influence and are certainly taking the prime teetimes on weekends, which is lowering the revenue potential and leads to situations where citizens of the county are basically being told they can never play their course during the most desirable times. Essentially, Keller looks and acts like a private club on weekend mornings. This can be dangerous as staff can be conditioned to treat members differentially, and members can feel emboldened. Consideration should be given to:
a. Limit the memberships: Reduce the number of members in each club.
b. Raise the membership dues: Increase the dues, with more of the revenue going to the course, or getting the clubs to provide annual gifts to the club – such as needed equipment or help with beautification, etc.
c. Move teetimes around: Don’t always give the clubs the prime weekend times. Move the start times anywhere from 7 am to 9 am. Another option is to block some teetimes during these peak periods for public play (example, two teetimes per hour). Club will resist as they want to be able to have all their members playing together, but it would allow the public access to the prime times and generate more revenue.
d. Reduce lead time: Currently the clubs have three days to reserve teetimes before the excess times are released to the public. Reduce this to one.
e. Take over: This is the extreme option. But the course could bring the clubs in-house, formalizing the memberships. This would give the course complete control over them and would create a new revenue stream to the club (dues). In this case, the operation could alternate teetimes on weekends between those reserved for members and those open to any player.
Tournaments Another area where revenue could be optimized is with tournaments and outings. Current County policy is that tournament and outing participants are charged whatever the regular rate is at the time for the time of the outing. The operators can add a 15% surcharge in the form of merchandise add-ons.
However, Keller is a high-demand outing location. Outings on Fridays and weekends can command a premium price, in excess of regular rates. This is a common practice in the industry as not only do outings require more work and preparation, you are dislodging regular players.
Operators should be given the flexibility of charging a premium for tournament and outings, with the excess fee being split between the operator and the County.

Ramsey County Golf Study Major Issues
Sirius Golf Advisors, LLC 259
This section will discuss the major issues, other than capital improvement needs, that we found during our examination of the RC Golf facilities, their performance and administration. Needed capital improvements will be addressed in the next section.
Philosophical Direction The Philosophical Direction provides guidance as to what is most important for the County with regards to the golf operation. There are many potential objectives. These include:
• Amenity: Serving the needs of the citizens of the County.
• Profit Center: Providing cash flow, not only for its own operation, but to help support other programs.
• Icon: Provide an icon for the community to promote community pride, and to focus outside attention on the asset.
• Economic Benefit: Golf can help attract new businesses and residents to the area and stimulate development, among other benefits.
The first two are two ends of a continuum, as emphasis on one end often comes at the cost of the other.
When we began the study, there was no clearly defined Philosophical Direction for the Golf Division. Why is this important? Because it can have profound implications as to how the golf facilities are operated.
For example, if the primary mission of the golf facilities is to serve as an amenity to the citizens of Ramsey County, then, logically, they would be operated in much the same way as other park amenities. The emphasis would be on service, affordability and programming. There would be no expectation for profit. Indeed, the expectation would be that the facilities would be subsidized in the same manner as other park amenities such as parks, tennis courts and swimming pools.
But to the degree that profitability is a concern, then the operation must be operated more like a business than a park. And not only as a business, but as a business that is operating in a highly competitive environment.
In looking at the current operation, we see a lot of mixed messages. Amenity-weighted actions include the pricing policy, and the fact that the County maintains three of the courses. Yet, the facilities lack the programming normally associated with amenity-oriented facilities.
On the other hand, the fact that the facilities are privatized to varying degrees, show a more business-like (profit) approach. The fact that some facilities are fully privatized, and others are not, shows confusion in the amenity/profit center continuum.
This issue was resolved by Council vote on October 8th when it was decided that RC Golf should move more in the direction of being a profit center rather than an amenity. This change is reflected in our recommendations and discussion.
Market Overlap All four of the “big” golf courses are in the same “Standard” rate band, as defined by NGF. In a market where peak fees (cart and green) vary from $32 to $139, a spread of $107; the four RC Golf facilities range just $15, from $46 (Battle Creek and Goodrich) to $61 (Keller).

Ramsey County Golf Study Major Issues
Sirius Golf Advisors, LLC 260
Moreover, we found from surveys, that three of the top five main competitors, as defined as the courses getting the most rounds from the target facilities customers (highest wallet share), for each of the four main RC Golf facilities were the other RC Golf facilities.
This has two consequences. First, it means that the facilities are competing more with each other than they are with other courses, and two, the facilities are likely not addressing market needs in the community as they are all going after the same golfers.
In the case of RC Golf, there are no facilities at the higher end (although Keller certainly has the facility to attract those golfers), and none at the lower end of the price scale.
Operator Contracts There are four main issues with the operator contracts as we see it.
1. Different contracts: There are six golf facilities within the RC Golf system. There are six different outside operators and seven different contracts. (Keller has two – one for the golf operation and one for the food and beverage). Not only does this create an administrative nightmare, it can create inequities within the system. Three of the contracts are leases, two of which are “capital” leases that include capital improvements, and four are management contracts, but with different compensation schedules.
2. Different termination dates: The contracts expire at different times. This is an issue because it makes it difficult to get a single vendor, should the County choose to have one, to operate all the facilities. And there are many advantages to having a single vendor, including lower operating costs, more consistency in service, and more cost-effective marketing. It also would dramatically reduce the administrative burden on the County.
3. Misaligned Interests: This, perhaps, is the most troubling. For the three golf operations management contracts, the County uses an older model whereby various revenue streams are treated differently. Basically, the County gets its primary revenue from the green fees, while the operator captures most of the food and beverage, merchandise and driving range revenue.
The problem with this model is that it creates an environment whereby what’s best for the operator may not be best for the County (bad optics, if nothing worse). For example, the operator’s main revenue drivers, merchandise, food & beverage and even the range, are primarily a function of volume. Thus, it is in their best interest to have low green fees (and discount them further) in hopes of creating greater volume. Yet the county gets its revenue from the green fees. And a lower rate may not be in the County’s best interests. (It should be pointed out, it’s not just the discounting, but the operators are relied on for their recommendations on the regular green fees as well).
Further, it drastically reduces, if not eliminates, promotions involving multiple revenue streams. For example, a popular promotion in the marketplace is to offer a free meal with a round of golf. But the operators are not going to sacrifice their revenue for the County’s. It also creates conflicts of interest in tournament pricing, which often are bundled green fees, cart fees, food & beverage and merchandise packages.
4. Enforcement: The contracts are not even being enforced as written. Two notable areas are marketing and rangers. The operators, under the management contracts, are supposed to submit an annual marketing plan. This has not been done at least since 2014 or earlier. The operators are also to provide rangers who monitor the pace of play. Only Keller does so. Keller’s food and beverage contract with Lancer calls for the restaurant to open at 6:30, yet they open at 7 am. This is later than the first teetimes on weekends and the same on weekdays, thus depriving the early teetime golfers of getting food, beverages or snacks before playing.

Ramsey County Golf Study Major Issues
Sirius Golf Advisors, LLC 261
The contracts and their status:
• Battle Creek: Management Contract. Brad Behnke Golf Management. Extended on January 1, 2018. Terminates December 31, 2022. Renewable for an additional five years.
• Goodrich: Management Contract. Brad Behnke, operator. Commenced in February 2015. Ends February 2019 but can be renewed for an additional year.
• Goodrich Golf Dome (aka Midwest Golf Dome): Full Lease. Midwest Golf Domes, contractor. Effective June 2016 (original contract 1996) and goes through the end of 2036.
• Island Lake Golf Course: Full Lease. FORE, Inc. (original developer). Started February 1992, ends December 31, 2023.
• Keller: Management Contract for golf operations. Foley Professional Golf Services, LLC. Started 2014, extended in 2018 to December 31, 2022. Renewable for an additional five years.
• Keller (clubhouse): Modified Lease. Lancer Catering. Started 2013. Terminates December 31, 2023. Not renewable.
• Manitou: Modified Lease. Golf Services Corporation. Started January 1, 2017. Ends December 31, 2021.
Marketing Marketing is essential for virtually any business. It is especially vital in very competitive markets, which describes the local golf market. Further, our experience suggests strongly that no other expense item is more highly correlated to revenue than marketing. Thus, if you spend more, you make more. And the revenue should greatly exceed the marketing expense, or the marketing was not very good.
But in the case of RC Golf, marketing is a neglected, if not entirely forgotten entity. The problems are many, but here are the most important.
• Who’s responsible? The operators will argue that marketing is the County’s responsibility – especially since they get most of the revenue (except with the leases). Yet the management contracts specify the operators are supposed to submit an annual marketing plan (they don’t).
• Budget: The operators spend a negligible amount on marketing. The County budgeted only about $9,000 last year – and did not come close to spending it! In the golf industry, the recommended marketing budgets usually range from 2-3% gross revenue. That would put the recommended budget for RC Golf in the $100,000 to $170,000 range.
• Expertise: Even if the County had the budget, they do not have anyone currently on staff with expertise in golf course marketing. The marketing that has been done has been exceptionally weak. This includes the websites for the golf courses, which are below average in quality. Further, none of the operators have shown any marketing wherewithal, either. As an example, one of the best practices in today’s golf course environment is to do regular emails to our customers. This can be done for no cost. All the operators have access to an extensive database through their POS systems. Yet none of them do regular emailings. Further, the social media presence (e.g. Facebook, Twitter, Instagram, etc.) is either non-existent or very weak.
• Overly Protective: Operators suggested that Ramsey County discouraged them from marketing because they did not want to send a “mixed message.” Instead, they are sending no messages.
• Social Media: The social media presence is mostly absent. What little is being done is not being done well. For social media to be effective, it needs to be constantly updated. But none of the

Ramsey County Golf Study Major Issues
Sirius Golf Advisors, LLC 262
operators, nor the County is doing so. Further, the myth about social media is that it is a panacea in marketing. But if all you are doing is posting, the only people you are reaching are those people that are already customers. In order to expand your market, you must use social media’s advertising tools – which are very powerful, but also require investment.
• Email: EZ Links, the POS provider, offers a good email marketing program. Golfers enter their email address when booking online. It costs nothing to do use this system to send out emails. And email marketing is a powerful tool in building customer loyalty. Yet none of the operators do email blasts, and the county does them only on rare occasions. Nor do any of the golf courses try to build an email marketing list by having signup sheets in the proshop or on the websites.
Websites The County maintains a website for the golf system. In addition, there are individual websites for Ponds at Battle Creek and Manitou. (Island Lakes and the Golf Dome also have their own websites.) The County’s website is at https://www.ramseycounty.us/residents/parks-recreation/golf. None of these websites are particularly good. Below are our thoughts:
Common Elements
• Updates: Websites work best if they are continuously updated. That way, customers become engaged and will regularly check back. As it is, the websites just provide basic information.
• Design: The websites lack visual appeal.
• Pictures: As the saying goes, “a picture is worth a 1,000 words.” The websites need more pictures. We especially want them to have pictures featuring a diverse customer base reflecting the demographics of the area. (The County does have a picture window at the bottom of each course’s webpage, but it is not immediately obvious that you can click through for more pictures. And the lead picture is often weak. Further, this should be at the top of the page, not at the bottom – or a link should be offered directing people to additional pictures).
• Drone: Consider adding a drone fly-over for each course. This would be especially helpful for Keller and Battle Creek.
• Newsletter: We would love to see an online newsletter, updated monthly, on each website. This should include updates on schedules (such as when the course is closed for a tournament or league, or when planned maintenance is being conducted). We also recommend having a monthly column from the head pro and course superintendent.
• League Updates: Having a page dedicated to keeping league standings would be a great addition to the course webpages.
• Calendar: There needs to be a calendar showing upcoming events.
• Specials: Webpages are a great place to promote specials. These should not be limited to just green fee specials, but also promote merchandise sales, food specials, etc.
• Searchability: While the County’s website does come up in a search for “Ramsey County Golf” and for “St. Paul Golf”, the individual course websites do not appear on the first couple of pages. You basically must be searching for the course. This makes it difficult to find for golfers looking to play in an area without having a specific course in mind.
County Website
The main page of the website provides a good menu of golf courses and services. However, it does not give you much information. There needs to be a brief description of each course, along with the link. Otherwise

Ramsey County Golf Study Major Issues
Sirius Golf Advisors, LLC 263
the customer is forced to click on each link in order to see what course may be suitable. In addition, we want to see a map showing the location of each facility.
Other comments:
• Layouts: The course webpages should not only have the scorecards, but also a layout.
• Email Sign-up: Each course should offer the ability to sign up for emails.
• Island Lakes: Island Lakes gets slighted in several ways. First, while it is listed on the main page, it is not listed on the drop down list to the left under “Golf Courses”. Second, it is not listed under junior programs and leagues – only Battle Creek.
• Keller: The phone number given for Keller’s proshop instead directs people to Lancer’s clubhouse phone and is answered by “Managed by Lancer Catering,” giving the false impression the entire operation is managed by Lancer. When you press the number for the proshop on their automated system, it directs you to a voicemail instead of redirecting to the actual proshop phone number!
• Pictures: As noted above, there need to be more. In addition, with one exception, the only pictures of golfers found on any of the course websites, are of white adult males. The one exception is at Battle Creek, where there is a picture of a male Caucasian junior.
• Range Hours: Range hours should be posted and kept up-to-date.
• Rates: Seasonal rates are not posted.
Ponds at Battle Creek
http://www.pondsatbattlecreek.com
When we checked, the home page was missing! We assume it is being updated – but this should be noted on the webpage.
The rest of the website is informative, providing the best website in the system.
Lancer Catering
Lancer has more and better pictures of the golf course than the County’s website. Lancer has two webpages for Keller, one for catering and one for the Grille. The website is rather plain. There is no course description. There is no link to the golf course website. The section about the 2014 renovation is at the top of the page on the catering website and makes it appear on first brush that the website has not been updated since 2014.

Ramsey County Golf Study Major Issues
Sirius Golf Advisors, LLC 264
Manitou Ridge
The website looks like it was created on the cheap. It has the least professional appearance as can be seen on the price list to the right. On the other hand, it does feature a drone flyover, but does not have either a scorecard or layout… the two things most golfers seek.
Pricing Policy In this section, we are not discussing the actual fees that have been set. We will be discussing our recommendations for fees under “Major Recommendations.” What our concern is how they are set. We feel there are three significant issues with regards to how the fees are set. They are:
• Politics: The process is subject to political considerations, which are usually to the determent of profitability.
• Two Years: The fees are set for a two-year period, putting the facilities at a major competitive disadvantage.
• Rigidity: There is little flexibility in the system.
Process It is our understanding that rates are set by Parks staff after conferring with the operators and reviewing competitive price information. The prices are then reviewed by the Parks Board and finally approved by the County Commission.
Throughout this process, there are plenty of times where special interest groups, such as members of the courses’ men’s’ and ladies’ clubs, leagues, seniors, etc., can voice their opinion and can often apply significant political pressure to artificially keep rates down.
The issue here goes back to our first point about the amenity/profit center continuum. Keeping prices low for special interests may be politically expedient, but it is often not good business.
Further, while operators may be consulted in the process, it is not clear to what degree they really influence the rates. This is both good and bad. As noted above, the operators’ interest and the county’s are not necessarily aligned. It may be better for them, given how they are compensated, to keep the green fees low to increase the volume. So, there is an inherent conflict of interest. On the other hand, the operators are the ones best positioned to know the market, and thus the most appropriate pricing.
Men’s and Women’s Clubs Related to the issue of pricing is the degree of control that men’s and women’s clubs have over the operations. Of concern is the fact that these club’s control large blocks of teetimes during the highest demand times – weekend mornings. The problem is particularly acute at Keller, where the clubs control the most in-demand times of between 7:45 and 10 every Saturday and Sunday. The clubs can book these times before the general public and can take as many as they want.
This is an issue that concerns both ends of the profit/amenity continuum. On the amenity side, you are essentially turning the county-owned facilities into private clubs on weekend mornings. Tax-paying residents, who are not members of the club, are essentially told “you can never play your municipal golf course at the most popular times unless you join this privately-controlled club.” On the profit side, because these club members are the heaviest users, they also have the biggest discounts. They are all either pass-
Ramsey County Golf Study Major Issues
Sirius Golf Advisors, LLC 265
holders or patron cart members. As a result, these teetimes, which would be sold out regardless of whether the club plays, are generating less revenue than they otherwise could.
We quickly point out that RC Golf is not alone in this practice as other municipal courses in the area have similar practices. However, it is highly unusual from a national perspective.
Fixed Fees As noted several times in this report, golf is a business and is in a highly competitive environment. Yet it is unthinkable in most every business to have your prices fixed for two years. Yet that is exactly what the county is doing with RC Golf.
Not only is golf a highly competitive marketplace, but the prices fluctuate frequently. Having a two-year fixed price puts the golf course at a major competitive disadvantage. Their pricing, especially in the second year, is likely to be either too high or too low, neither of which is good. Nor can they adjust pricing during the season as the market frequently calls for. And the operators have very little flexibility when it comes to negotiating a fee with large groups such as leagues or outings. Again, this puts the facilities at a significant competitive disadvantage.
Put together, these prevent the County from optimizing the profitability of the golf operations.
Rigidity Once the fees are set, apparently the County insists that only the fees set by the County be used in the POS system. Yet, operationally, the County is allowing some discounting – most notably the PCC program at Goodrich and Battle Creek, although there are many other examples. But because of the rigidity, operators are having to used established rate categories to enter information into the POS system. This leads to very misleading data. For example, when Goodrich or Battle Creek receive the payments from PCC, they must enter this as paid green fees, which they do. But this artificially adds a lot of rounds that they then must try and back-out.
Manitou and Goodrich will discount groups to attract business. They will then enter the rounds under “Patron rate,” which gives a misleading impression of Patron card use.
Good management requires good data. This is not happening with RC Golf.
New Rate Structure In 2018, the County implemented a new rate structure. It drastically lowered the Patron fee from $75 to $25. They also eliminated Weekend rates – now charging the same fee seven days a week at all the courses. Rates were also lowered at all courses, except Keller.
We do not agree with all these changes, especially the dropping of the Weekend rates. As pointed out earlier, the operators have an incentive to like the rate reductions as it adds volume, which benefits them more than the County due to their revenue streams. The lower rates have less of an impact on their earnings, but it does have a significant impact on the County’s if the increase in volume fails to make up for the reduction in yield.
One of the reasons we were given for reducing the rates at Goodrich and Manitou was the desire for the facilities to be considered “value” facilities by NGF’s standards. But this is not the case. The breakpoint is $40, not $50. The fee reduction still leaves them as mid-fee facilities. Further, customers do not care about labels, they care about the price.
Ramsey County Golf Study Major Issues
Sirius Golf Advisors, LLC 266
The operators endorsed the changes as they universally claimed it was easier having a simpler rate structure.
The County has approved dynamic pricing, but none of the operators are using this. Dynamic pricing is when the pricing changes based on demand. The price gets lower as you approach the teetime. We are not a fan of dynamic pricing.
Keller Food & Beverage
It is rare where you see such a disparity in operations from one aspect of a golf facility to another. But such is the case at Keller.
Keller’s golf course is competitive with the best public courses in the area. Customer service as related to golf operations is outstanding – based on our interviews and survey results. And the clubhouse is fabulous. Combining these factors with Keller’s unmatched history, would ordinarily make Keller one of the most popular courses in the metro area. But there are two huge things holding it back, marketing and the Food and Beverage Operation.
The food and beverage operation as it relates to golf is nothing short of terrible. While Lancer appears to do a very good job with banquets, this has been their only priority.
The neglect for golf f&b services became apparent, not only from interviews with customers and golf operations staff, and through the customer survey (whose ratings placed the food and beverage service at Keller in the bottom ½% of all golf facilities surveyed by NGF) but was our own personal experience as well.
Food quality is not the problem, although we did hear a few complaints. But service and attitude are.
The beverage cart service at Keller has been sporadic, at best. And the cart attendants were clearly poorly trained for working in a golf course environment. In a higher-end facility, which Keller otherwise is, beverage cart service is considered a basic service. It is expected. Not just some of the time, but ALL the time. It is part of the golf experience. It is even more imperative given the lack of drinking water on the course (which is true for all the RC Golf facilities). In these situations, the lack of service is not only a revenue opportunity lost but can create a health risk.
An extreme example of the poor service was on Memorial Day, when it was 100 degrees outside and the course was packed, but there was no beverage cart. Mark, the golf operator, had to go out and buy water and give it out on the course. At the time of our study, the beverage cart hours were set as 3 pm to dark Monday-Thursday and 9 am to dark Friday- Sunday. But they do not consistently hold to that. However, these hours are sub-standard for a course of Keller’s quality. The beverage cart needs to operate seven days a week, from no later than two hours after the first tee-time until no sooner than an hour before dusk. This is what the competition is doing. Again, the beverage cart should not only be considered a profit center, only operating when it is profitable to do so. It needs to be part of the everyday operation and understood that it is providing a basic, and expected customer service.
The other issue has been service to golfers in the restaurant. We heard and read a lot of complaints about how golfers are treated there. We even observed this ourselves on our visits.
In one case, there was a large tournament at the golf course. Lancer did a nice job (apparently) with the box lunches. The problem was, they did not staff the restaurant/bar. So, when 100+ people showed up before the tournament, many of whom wanted drinks at the bar, there was only one person there to service them, plus the customers dining in the restaurant.
On another occasion, we saw two grill staff taking a break on the patio, smoking and chatting. The issue being that this patio faces the golf course and all the golfers must pass by it to get to the 11th hole. It looked very unprofessional.

Ramsey County Golf Study Major Issues
Sirius Golf Advisors, LLC 267
And it’s not just the service once you get in, but the hours. The grill does not open until 7am. This lines up with the first teetimes during the week but is an hour after the first teetimes on weekends. And even during the week, it means golfers wanting coffee, breakfast or snacks before they tee off are going to be out of luck if they have an early teetime. Notably, the contract calls for Lancer to have the restaurant open at 6:30 am. We also were told stories of golfers going to the grill at 1 for a hotdog, to find none are even on the rollers (Note: hotdogs are not listed on the menu).
We acknowledge that the situation has changed since the beginning of the summer. The general manager assigned by Lancer to Keller that we interviewed is no longer there. A new GM was in place as of August. It remains to be seen how much a difference this makes.
Manitou Performance While the other RC Golf facilities’ performance have held steady or improved over the past few years, one has declined – and at a precipitous rate. That facility is Manitou.
Not coincidentally, Manitou also had, by far, the lowest customer ratings on our survey of the four main RC courses; placing in the bottom 12 percent nationally.
The poor ratings are across the board, including course maintenance, golf operations, customer service, and food & beverage. And the timing is bad, as the operator just recently signed a new contract whereby the county’s percentage of the revenue was cut in half. (The operator needed the extra revenue to purchase new golf carts and make other small improvements).
In our interviews with the operator, he was shocked at the survey results and has expressed genuine concern. He has been at the facility for over 40 years, in one capacity or another.
It needs to be pointed out that the decline in performance affects the operator much more seriously than it does the County, as Manitou is operated on a modified lease. In this arrangement, the operator is responsible for all operating expenses, including maintenance. So, the county’s exposure is minimal.
We are optimistic that the operator will take the recommendations in this report to heart and this will help reverse the trend (along with improved marketing).
Target Markets The last major concern impacts the program significantly, regardless of which side of Amenity / Profit Center continuum you’re on. And that is the system’s weakness with regards to women, as well as to those who want to take up the sport, especially those from more modest income households.
Of course, given the lack of marketing, in general, it probably is not surprising that certain demographics and target markets are being ignored. But it goes beyond marketing and points to 1) physical issues at the facilities; 2) lack of programming; and 3) lack of awareness or effort.
Women Nationally, women make up about 24% of the golfing population, according to the NGF. That percentage is likely higher in Minnesota. Yet, based on observation, testimony from staff, and survey results, women account for 10%-15% of the play … or less… at the County’s golf facilities (except for Island Lake).
With regards to participation by women, there are several reasons for RC Golf’s poor performance. These include:
• Facility: There are physical constraints at the facilities that make them less hospitable to women.

Ramsey County Golf Study Major Issues
Sirius Golf Advisors, LLC 268
• Services: Services at the courses do not cater to needs of women in general.
• Attitude: Staff treating women differentially than men.
• Programming: There is a lack of programming at several of the facilities aimed at women.
Facility There are two major issues at the RC Golf courses that have a negative impact on play from women. They are:
• Forward Tees: The primary problem is the length from the forward tees. But there are other issues as well.
• On Course Services: The lack of restrooms on the courses is a deal-killer for a lot of women, who refuse to use porta-pottys. (This also tends to have a negative impact on senior men as well).
Forward Tees
Women hit the ball on average about 70% as far as men. The most preferred yardage for men is between 6,000 and 6,500 yards. If we take 70% of this, the equivalent yardage for women is between 4,200 and 4,550 yards. Yet the Ramsey County courses are much longer than this from the forward tee. At the extreme, Manitou Ridge measures 5,491 yards from the forward tee. For women, this is the equivalent of a 7,844-yard course for men! Not even the PGA tour professionals play from this yardage! Making women play from such a long distance has several negative consequences. First, by making the course overly difficult for women, you get less female participation, costing you revenue. Second, the women that do play are naturally going to be playing much slower than the men, because they are playing from 7,840 yards, while the men are playing from 6,083! Thus, the pace of play will be slower, not just for the women, but for everyone playing behind them as well! Third, male seniors prefer playing from around 5,500 yards. Yet many will not play from the forward tees as they still consider them “ladies’ tees.” Thus, at Manitou, the seniors are also playing from too far back with the same negative consequences as for women.
Another issue with the forward tees is that they are often built substandard to those mostly used by men, and without the amenities (such as drinking water, ball washer, trash cans, etc.)
Restrooms
Women tend to be much more resistant to using porta-potty’s then men. Yet, the RC Golf Courses lack on-course restrooms. This puts them at a significant disadvantage when it comes to attracting play from this large potential market.
Services There are also more subtle ways in which the operations discriminate against women. Most notable of these is with food and beverage. Women are much more likely to want healthy food choices than are men. Yet only Keller offers any. (This does impact play of all types, but especially from women). (Manitou, to its credit, started offering wraps and fruits after our conversations).
Merchandise sales is another area where the operators discriminate, no doubt unintentionally, against women. One stereotype about women that few tend to argue, is that women, in general, love to shop – much more so then men. That is why, when you go to a department store, there may be a full floor dedicated to women’s clothes, but only a corner of a floor for men’s clothes. Yet when you walk into the golf shop, the reverse is true – only more so. Given that this is something that tends to be more important to women, the lack of merchandise comes across as a snub.
Ramsey County Golf Study Major Issues
Sirius Golf Advisors, LLC 269
Attitude With many golf operations, we find that staff will treat women differentially from men – and usually to the detriment of women. This is most common where the staff are senior men, and often stems from parochial attitudes. The stereotype that women play slower than men may be a contributing factor. (But as pointed out above, they don’t play slower, they play longer because they’re playing from 7,000 yards while the men are playing from 6,000).
With RC Golf, we did not observe this behavior, although survey results from Manitou suggest that it may be present– to an extent (perhaps confined to a single staff member). However, we also saw very few women staffers.
Staffing Customers will always feel more comfortable around staff that look like them. This is true for women as well as other demographics. We noted very few women staffers at any of the facilities – other than on beverage carts or in food and beverage.
Programming Programming, in general, is an issue at all RC Golf Facilities, except for Island Lake. Island Lake appears to do a great job, especially in programming for juniors and the physically disabled. Of course, the lack of programming, in some cases, can also be tied to the lack of marketing. This is particularly true at Battle Creek, where various types of programs to reach out to women, beginners, etc., were tried but failed to attract a lot of participation.
We do note, however, that neither Goodrich, nor Battle Creek, have a women’s club (Manitou and Keller do).
It should be noted that RC Golf is hardly the only golf operation to minimize the female market. It is an industry-wide problem. Yet, given the general population has slightly more women than men, it certainly makes sense to pay more attention to a demographic that could instantly provide a major boost to performance.
New Golfers While Battle Creek has tried to offer some programming, there is still a considerable lack of programming or accommodation to potential or wannabe golfers. And by programming, we mean more than just providing group clinics. It includes outreach programs designed to attract these golfers, and programs designed to make the sport more affordable, especially to those wanting to take up the sport.
As discussed previously, there are, by a considerable margin, more latent golfers (people who do not play golf, but express a desire to do so), than actual golfers in the MSP market. Thus, RC Golf is basically ignoring a market that could more than double our current customer base.
Top Golf, which is opening a facility in the MSP area soon, is a great example of a golf facility that reaches beyond the typical golfer. In fact, over 90% of their customers do not play golf (other than at Top Golf). And since these facilities average over $20m annually each (or roughly four times the four main RC golf courses make, combined!), there are some important lessons to be learned. Chief among these is “making golf fun, again.”

Ramsey County Golf Study Capital Improvement Needs
Sirius Golf Advisors, LLC 270
All four members of Sirius’ team examined the facilities to look at capital needs.
Capital Improvements can be divided into two main categories:
1. Those needed to maintain performance. These are infrastructure repairs or deferred maintenance items. We will refer to these as “Infrastructure” improvements.
2. Those designed to improve performance. These are improvements whose primary purpose is to either reduce maintenance costs and/or enhance revenue. We will call these “Performance Enhancer” improvements.
While the infrastructure repairs may boost performance by lowering costs or improving course conditions, it is clear if they are not done, performance will deteriorate. Items in the second category, on the other hand, may also improve infrastructure, but their main goal is to enhance performance.
A clear example of capital improvement of the first type is replacing the irrigation. Irrigation is the lifeblood of a golf courses. Without it, course conditions are greatly diminished; it is very difficult to maintain good, puttable grass on the greens; and performance is dramatically impaired.
An example of the second type would be installing new forward tees at Manitou, which would greatly improve the course’s appeal to women and seniors.
Infrastructure Needs In Appendix G, we list the life expectancies for various components of the golf course for this area of the country. Along with this, for both Goodrich and Manitou, we list the current age. As will be discussed, most of these components at both courses have greatly exceeded their life expectancy.
When components go beyond their useful life, two things usually occur.
• Maintenance Costs Escalate: This is due to –
o Repair Costs to fix the equipment.
o Additional Labor costs, not just to fix the equipment, but also to repair damage, etc.
o Inefficiency, since older systems are not nearly as efficient as modern systems. With rising utility and labor costs, this can be a significant cost burden (especially with irrigation systems)
• Course Conditions Deteriorate:
o During the period between when a component breaks and when it is fixed, there will be a ground-under-repair area that the golfers will need to avoid. The size of this area will depend on the nature of the problem. It could impact an entire green.
o Large components, such as turf, greens, tees, irrigation, etc. will slowly degrade the quality of the playing conditions as they age. This, in turn, will usually have a dramatic impact on play as course conditions is one of the most important considerations when choosing where to play.
Thus, profitability is adversely affected by both increasing costs and lower revenue.

Ramsey County Golf Study Capital Improvement Needs
Sirius Golf Advisors, LLC 271
In addition to performance and age issues, there can also be safety concerns, such as an increased probability of a golfer or non-player being struck by an errant shot, or a higher risk of property damage, especially to vehicles or neighboring property.
In some cases, we also found where a needed component either was not properly installed or was not a good choice for the course at the time of construction. This can lead to reduced efficiency and increased maintenance costs.
Below is a discussion of the priority capital improvement needs for each course based on poor infrastructure. Many of these were previously discussed in other sections but are summarized here for ease of reference.
Keller Five-year-old construction and great design puts Keller in the “Initial Years Renovation” mode, meaning to continue to finish items that may have been left out or underbuilt due to budget reasons in 2013. It is and will remain your flagship course.
Priority Items 1. Irrigation –
a. As per EC recommendations of pump station controls and repeaters for radio control b. Implement Reduced Turf Area Plans at Tees to reduce future irrigation
2. Sand Bunkers – Need to improve play characteristics
a. More tile drainage
b. Bunker liners (Better Billy Bunker or similar preferred)
3. Undersized Catch Basins – We recommend larger catch basins in valley fairways to increase capacity.

Ramsey County Golf Study Capital Improvement Needs
Sirius Golf Advisors, LLC 272
Manitou Manitou Ridge has a new state-of-the-art maintenance facility, but little in the way of golf course renovations since 2000. An older, somewhat pedestrian design, with gradual green upgrades, sits on great land, suggesting higher potential.
Priority Items 1. Irrigation – Completely new system needed.
2. Sand Bunkers – Need to improve play characteristics
a. More tile drainage
b. Bunker liners (Better Billy Bunker or similar preferred)
3. All infrastructure is aging, meaning a total rebuild will be required, with the question not being “if”, but
when and how.
Other Issues
Layout
Manitou Ridge has some safety and circulation problems that can only be addressed by re-routing, including:
• 11 Green in dogleg of hole no. 1
• 3, 6 and 12 Tees Unsafe due to proximity to other holes.
• 18th hole plays into setting sun.
• Walk backs from green to next tee on holes 2-3, 5-6, 11-12 and 12-13, with safety and slow play
problems.
• Long walk from holes 13 to 14, and from 7 to 8.
• Elevated Tee, short driving Range brings highway and parking lot into play (safety)
• Eliminates/reduces safety issues at 11 green, 12 tees,
Features
• Driving Range: Add nets for safety
Infrastructure
• Drainage: Generally good, with a few wet spots in valleys that should be corrected on holes like 2, 3, 5, 9, 18, etc. All could be addressed with pipe, even with no re-routing for under $100,000.
Goodrich Ramsey County had begun the funding process for irrigation and sand bunkers at Goodrich Golf Course, prior to this study. New irrigation systems are often a major priority. Pursuing just those two options would constitute the minimum needs plan going forward.
However, we have identified other course needs, which were more extensive than originally envisioned, and many of these, including drainage, should be constructed before irrigation is installed.
Priority Items 1. Irrigation – Completely new system needed within a few years.
2. Drainage on fairways 1, 9, 15, 18
Ramsey County Golf Study Capital Improvement Needs
Sirius Golf Advisors, LLC 273
Other Issues Infrastructure: Complete renovation of all major components, including rebuilding greens and tees and regressing fairways. This will also dramatically enhance performance.
Greens: The greens at Goodrich are not only past their useful life and are of a substandard nature, they also lack variety (they are all circular in shape) and too small, especially given the nature of the target market at the facility.
Routing: Very similar to Manitou Ridge in several ways, with some awkward routing changes over the years, and a few new greens. There are solid holes like 2, 3, 6, 11, 13, 15, 16, 17 (except those are back to back par 3) and some unsafe areas like 13 tees, the 10th hole, etc.
Goodrich has some safety and circulation problems that can only be addressed by re-routing, including:
• 2 Green too close to 1 Tee
• 13 Green too close to 14 Tee
• 10th hole too close to road on slice side (not moveable)
• Walk backs from green to next tee on holes 8-9 and 11-12. Long walk around from 17 to 18, long walk to first tee.
• Back to back par 3 holes on 16 and 17 (a result of previous partial re-routings) – this tends to slow down play, causing a “choke point” on the course.
Bunkers – The bunkers are well past their useful life. Many do not drain well. They are also very inconsistent as there appear to be bunkers composed of seven different types of sand.
Drainage – There are some drainage issues, including fairways on 1, 9, 15 and 18.
Trees – there are a lot of dead and diseased trees that need to be removed.
Battle Creek With relatively new construction and a design well-liked by many (but scorned by some as too difficult) this course is a lower priority for any reconstruction. It still fits between the work scopes of “Initial Years Renovation,” and “Ongoing Renovations” phases. However, at age 15, it is middle-aged, and you should start long term planning for its upgrades.
As noted elsewhere, there is also the issue that its design-type, a challenging 9-hole course, has limited market appeal. Generally, 9-hole courses are easier courses targeted to beginners, seniors and higher-handicap players, but this course is quite difficult, and challenging in ways average to poor golfers struggle with the most– forced carries.
Priority Items 1. Bridges – The bridges were not properly engineered and, we understand, built by inmates of the
county correctional facility across the street. We recommend that they be evaluated by an engineering firm to assess their safety and structural integrity. It is likely many will need to be repaired or replaced.
2. Irrigation Lake – leaks badly
3. Irrigation – The irrigation heads were not placed in optimal locations, creating both inefficiency and poor coverage.
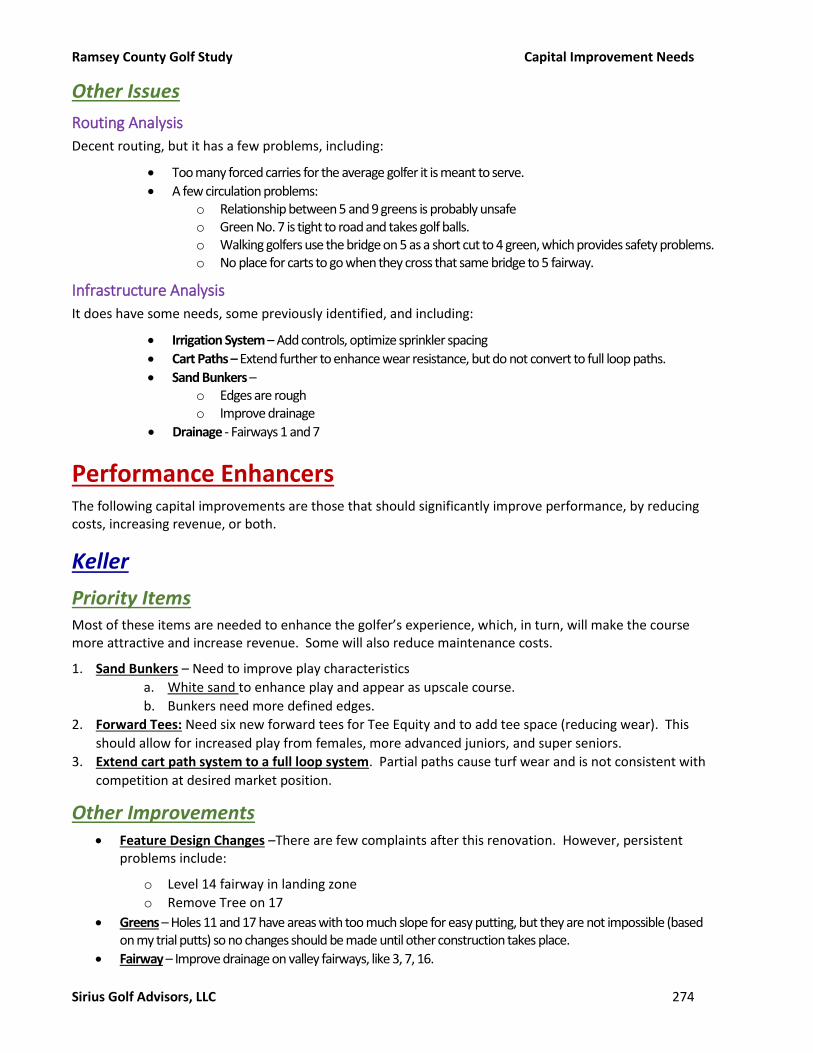
Ramsey County Golf Study Capital Improvement Needs
Sirius Golf Advisors, LLC 274
Other Issues
Routing Analysis
Decent routing, but it has a few problems, including:
• Too many forced carries for the average golfer it is meant to serve.
• A few circulation problems: o Relationship between 5 and 9 greens is probably unsafe o Green No. 7 is tight to road and takes golf balls. o Walking golfers use the bridge on 5 as a short cut to 4 green, which provides safety problems. o No place for carts to go when they cross that same bridge to 5 fairway.
Infrastructure Analysis
It does have some needs, some previously identified, and including:
• Irrigation System – Add controls, optimize sprinkler spacing
• Cart Paths – Extend further to enhance wear resistance, but do not convert to full loop paths.
• Sand Bunkers – o Edges are rough o Improve drainage
• Drainage - Fairways 1 and 7
Performance Enhancers The following capital improvements are those that should significantly improve performance, by reducing costs, increasing revenue, or both.
Keller
Priority Items Most of these items are needed to enhance the golfer’s experience, which, in turn, will make the course more attractive and increase revenue. Some will also reduce maintenance costs.
1. Sand Bunkers – Need to improve play characteristics
a. White sand to enhance play and appear as upscale course.
b. Bunkers need more defined edges.
2. Forward Tees: Need six new forward tees for Tee Equity and to add tee space (reducing wear). This
should allow for increased play from females, more advanced juniors, and super seniors.
3. Extend cart path system to a full loop system. Partial paths cause turf wear and is not consistent with
competition at desired market position.
Other Improvements • Feature Design Changes –There are few complaints after this renovation. However, persistent
problems include:
o Level 14 fairway in landing zone
o Remove Tree on 17
• Greens – Holes 11 and 17 have areas with too much slope for easy putting, but they are not impossible (based on my trial putts) so no changes should be made until other construction takes place.
• Fairway – Improve drainage on valley fairways, like 3, 7, 16.

Ramsey County Golf Study Capital Improvement Needs
Sirius Golf Advisors, LLC 275
• Drainage – Continue to add small drains in house, as needed.
Manitou
Priority Items 1. New Forward Tees – The forward tees are way too long for recreational female players.
2. Extend cart path system to new forward tees to spread wear.
Other Improvements
Rerouting
There are some performance enhancement gains from rerouting, including:
• Market Position: The ability to up-scale the course, if desired
• Enhanced Golf Experience: Would make the course more attractive and challenging
• Improve Pace of Play
Issues to be addressed include:
• 18th hole plays into the sun. Not desirable on last hole
• Length – course is too short from back tees for better players
• Proposed fairway cuts on holes (new numbers, see routing) 1, 3, 6, 10, 13-16 to eliminate blind shots (for safety, speed of play)
• Driving Range o Some golfers complain about elevated practice tee o Lowered tee reduces required net height. o Range is not long enough, requiring netting on the end o Limited capacity o Lower tee might reduce sun orientation problems o Add mats to extend tee wear.
Features
Recommendations include:
• Implement Reduced Turf Area Plans at Tees to reduce future irrigation
• Landscaping: Golfers complain about the landscaping as too little and not well maintained.
Goodrich
Priority Items 1. Sand Bunkers – The number of bunkers can be reduced to improve playability and reduce
maintenance costs.
2. Forward Tee Program – Even as a short course, for recreational female players, it is too long. New forward tees are needed, which will make the course more attractive to women and to higher-handicap players.
Other Improvements 1. Cart Path: Extend cart path system to new forward tees to spread wear.
2. Routing: issues include:

Ramsey County Golf Study Capital Improvement Needs
Sirius Golf Advisors, LLC 276
o Need to shorten Hole 1 green, for safety of 2 tee
o Need to move 13 green forward for safety of 14 tee.
o While holes 10, and the walk backs at holes 8-9 to and 11-12 are problems, they are difficult to
solve without major re-routing.
Battle Creek The main issue is that the course does not fit into a good market niche as a challenging regulation nine-hole course. To fix this will require substantial investment. We will discuss options in our Capital Improvement Recommendations section.
As the driving range is the primary profit center, consideration should be given as to how that can be optimized.
Priority Items 1. Design Improvements to make course more playable:
• Widen Fairway on hole 5
• Elevate and move no. 9 Tee
2. Driving Range: The driving range is the primary profit center at Battle Creek. There are several improvements that can be made to further enhance its appeal and its potential. They include:
• Improve targets with real greens, etc.
• Increase size of tee area: This would enable more golfers to use the range at one time. The problem with this is that it would require changes to the golf course. Further, the limited parking becomes even more problematic.
• Improve ambiance
• Replace Astroturf at back of tee
• Extend turf tee forward for more space
• Improve sand bunker at west end of tee.
2. Ninth hole tee – provides poor view of the hole
Other Improvements 1. Parking: The parking lot is undersized for the volume seen at the facility, especially with the
popularity of the driving range.
2. Features:
• Forced carry on second shot of hole 3
• Narrow landing zone on 5
• Blind fairway from many tees on 9
• Cross slope on hole 7 kicks many shots into pond
3. Sand Bunkers:
• Reduce 10% to reduce maintenance costs (but only if no other changes are being made –
see discussion of options under “Major Recommendations.”)
• Upgrade with Better Billy Bunker, drainage, buff sand.
• Enlarge Practice Tee –
1. Rebuild Tee
2. Improve Targets

Ramsey County Golf Study Capital Improvement Needs
Sirius Golf Advisors, LLC 277
3. Rebuild Chipping Area
Ramsey County Golf Study Major Recommendations
Sirius Golf Advisors, LLC 278
The recommendations in this section address the major issues brought up in the previous sections. Capital Improvement recommendations, however, are presented in the following section.
Philosophical Direction It is not our place to recommend what the Philosophical Direction should be for the County with regards to its golf program. However, we do recommend that a serious discussion take place and a consensus be reached as it will have significant impact on the operations going forward.
In this report, we provide recommendations that help the courses be a better amenity as well as a more profitable operation. However, our focus, with regards to the financial projections, are more focused on profitability, as our interviews with the Commissioners strongly suggested that they wanted the operation to be at least self-supporting.
It should also be noted that many of the capital improvements to the facilities recommended herein both enhance their usefulness as an amenity as well as their profit potential.
This issue was addressed during our presentation on October 8th, 2018 to the County Commissioners. At that meeting, the Commissioners voted to move into a more profitable posture for the golf operations. As such, we have tailored our recommendations as to how to best improve profitability without sacrificing quality or a commitment to the community.
Market Overlap We feel that the market overlap between the facilities is a significant issue as it means that not only are the County’s facilities mostly competing against each other, but also that they are not reaching important market segments within the County and beyond.
Keller, with its design, newly renovated course, and great clubhouse, certainly more resembles a Premium facility than a “Standard” one (by NGF definitions). If the food and beverage operation is fixed (with regards to their approach to golf), then Keller should be “pushed up” and become a Premium facility – likely with a peak fee (cart and green fees) in the $75 range. (We recommend a restructuring of the Patron program that will minimize the impact of these increases on the current customer base. See our pricing recommendations under “Pricing Policy” below).
At the same time, Goodrich more closely resembles, physically, a “value” facility than a “Standard” or mid-fee facility. And the current operator is already significantly discounting the green fees. We are recommending that the advertised rates be dropped significantly, to where the peak fee is around $40 (instead of $46).
Not only will this widen the market for Goodrich, it will make golf more affordable to a large portion of the market and fills a definite need in the marketplace. While Goodrich and Manitou are both in need of extensive renovations, it is unwise to have them both be under construction at the same time. This will allow Goodrich’s renovations to be pushed back until Manitou’s and Battle Creek’s are complete. That way, these facilities will be better positioned to accommodate Goodrich’s customers while it is being renovated.
The repositioning of the facilities will allow RC Golf to appeal to the higher-end golfers (Keller), the value golfers (Goodrich and Island Lake), and golfers in-between (Manitou and Battle Creek).

Ramsey County Golf Study Major Recommendations
Sirius Golf Advisors, LLC 279
Operator Contracts In our Discussion section, we have a thorough review of the type of contracts used in municipal golf, from self-managed to long-term capital leases. For each type, we discuss the pros and cons. Right now, though, the contract situation with RC Golf is chaotic at best. Below are our recommendations, with options.
Single Operator First, we recommend the County position itself for the possibility of having a single operator oversee their entire golf operation. Having a single operator theoretically poses several advantages, including:
• Easier to administer – only dealing with one contract and one operator
• Consistency in service
• Potential savings in maintenance costs
• Marketing
• Cross-promotions
• Programming
• Expertise (assuming a larger company, with more resources, than single-operation operators)
However, a single operator may not necessarily be the best option for the County, especially given the quality of the current operators. But we feel it is an important enough consideration that the County should at least allow for the possibility. This means:
1. Have existing contracts modified so that they all terminate at the same time, and
2. At that time, put out an RFP that allows the responder to bid on operating one, two or all the facilities.
Then the County at that time, can evaluate all the options and make the best decision based on current circumstances and the bids presented.
It is likely that the single operator contract would still not include the Golf Dome, which is under a long-term lease. It is possible that it includes Island Lake, if the RFP is for the 2024 season.
Course Maintenance One of the biggest considerations should be whether to include course maintenance in with the management contracts. In other words, to privatize course maintenance. Below is a discussion of the pros and cons.
Pros The primary reasons for privatizing are:
• Cost Savings
• Labor Management
• Incentive
• Purchasing
• Improved Coordination

Ramsey County Golf Study Major Recommendations
Sirius Golf Advisors, LLC 280
Cost Savings
The biggest reason is cost savings, which goes to increased profitability. And there is no doubt that considerable cost savings can be achieved.
Last year, the County spent $2.1 million on maintaining three courses – Keller, Goodrich and Battle Creek. This can be broken down as $1.83 coming from Parks and $750,000 from Fleet services. Cost for individual facilities were $521,000 at Battle Creek, $706,000 at Goodrich and $873,000 at Keller.
In contrast, the operator at Manitou spent $350,000, including equipment (Fleet) expenses, to maintain that course (half the average spent by the County on a per course basis). And it is being maintained at a level comparable to Goodrich, but with more acreage and a range. To be fair, we don’t think the budget at Manitou is enough. Our recommendations put it at $450,000 to $500,000. But that should also be the case at Goodrich – especially if it is being repositioned as a Value facility. Indeed, the maintenance at Goodrich should be less as there is both less acreage and no range to maintain. And if Goodrich is repositioned as recommended, then the maintenance standards are less as well.
While savings should be realized at all three facilities, Goodrich would appear to be where the savings isthe largest – potentially $200,000 or more. At Battle Creek, the savings would likely be in the $100,000 to $150,000 range. Keller’s budget is close to expectation, with a possible savings in the $50,000 - $75,000 range. Put together and the total savings should be $350,000 to $400,000. Moreover, these savings could be even larger if a single operator were overseeing all the facilities, as this could result in savings in both administrative and equipment costs.
Where are the savings coming from? The two biggest areas are payroll and fleet. With payroll, the main savings is seen from benefits. First, the County benefit package is richer, and much more expensive, than those typically offered by a private operator. Second, a private operator is going to make greater use out of seasonal and part-time help, while the County uses full-time help, with much of the manpower converting over to the arenas at the end of the golf season.
Because we were never given a break-down on Fleet expenses (just the total number), we cannot specifically address where the savings would be realized. We can only state, with confidence, that a private operator would not be spending $750,000 in fleet services (which includes the cost of equipment, equipment repairs and fuel) for the three courses. A more reasonable estimate would put it at $600,000 to $650,000.
Labor Management
With any municipality there are often concerns about labor management, although much of the same arguments apply to unions as well. These include:
• Termination Policy: With most municipal personnel termination policies, it becomes cumbersome to terminate unproductive employees, as the emphasis is on “rehabilitation.” Most municipal systems require a lot of paperwork and intervention by supervisors, who are not always prepared or willing to follow through. As a result, unproductive employees are often retained far longer than they would under a private employer. Unfortunately, the result is a double whammy as not only is that employee costing the municipality money, but these unproductive employees can often be like a “cancer” among the workers. This is because other staff see that the unproductive employee can get away with less work, so why should they work so hard? Further, it can adversely affect their morale as they must work harder to compensate for the unproductive employee.
• Human Resources: Personnel policies, both in hiring and termination, can often lead to the hiring of unqualified individuals and the inability to get rid of them, once hired. It can also lead to costly delays in hiring of help in situations where that help is needed immediately.
Ramsey County Golf Study Major Recommendations
Sirius Golf Advisors, LLC 281
• Work Efficiency: This is related to termination policy above. But with greater job security, there is often a tendency to work less efficiently. We did not see any evidence of this with RC Golf, except for the use of a push lawn mower at Battle Creek as noted previously.
• Employee Classification: Municipalities are often in the habit of classifying employees based on job title rather than taking into consideration the actual nature of the job. The best example is a tractor operator. Municipalities will tend to classify anyone that drives a tractor as having the same job, thus receiving the same pay, regardless of whether they are doing it at a park or at a golf course. Yet the two jobs are very different. For one, the Park employees have much better hours. But more importantly, if a park operator messes up, there may be an ugly area in the park for a bit. But there is rarely any financial impact. But if an operator messes up at a golf course, such a scalping a green, etc., it can have significant financial implications, but in terms of costs to repair and the loss business resulting from poorer playing conditions. Further, the golf course operator often requires more precision, and thus more skill.
Incentive
With job security, there is less incentive to perform, other than pride in what you do. With some municipalities, that can be a huge motivator, especially with the superintendents (and we do see this at RC Golf). But with a private operator, the incentive can also become financial, which is much harder to do in a municipal setting.
Purchasing
Municipal bureaucracy can slow down the purchasing process. And it can often lead to the purchase of inferior products due to an over-emphasis on cost. Both can lead to higher long-term costs and even affect the quality of the course conditions.
Improved Coordination
When you have a situation such as the case with RC Golf, you have at least three different management entities (the operator, Parks and Fleet) involved (four at Keller), with each on-site manager reporting to different people and no one on site, or even at the next level up, coordinating the efforts. This can lead both to confusion and poorer facility performance. For example, a major event requires careful coordination between all aspects of operation – golf operations, course maintenance (including fleet management) and food and beverage. If just one is out-of-sync, it can lead to disruptions or bad experience for the customers. And this, in turn, will adversely affect the long-term success of the facility.
If a private operator is in control of all aspects of the operation (such as is the case at Manitou), there is never concern about miscommunication. Course maintenance and golf operations are always on the same page because they both have the same manager.
Cons The three main arguments against privatizing are:
• Current Employees: What happens to the existing employees? While the new operator is likely to want to hire most, if not all, of the current employees, they are likely to offer less benefits (although they may offer a higher wage to compensate). But some employees, especially those in management, may have to sacrifice significant benefits, to stay with the golf course. And some may be out of a job entirely.
The County can mitigate the impact of privatization to current employees by:
o Offering to transfer some of the current employees to other County departments, such as Parks.

Ramsey County Golf Study Major Recommendations
Sirius Golf Advisors, LLC 282
o Some municipalities have had success by offering the current employees a financial incentive to remain with the facility and go with the new employer. For example, they would take the anticipated first year savings from the privatization and pay it out to the employees as a one-time bonus, payable after x months (usually six) of employment with the new operator.
• Quality Control: Another major concern is quality control. With a private operator, one must be concerned about the operator potentially trying to cut corners (save money), resulting in poorer playing conditions. A municipality can protect themselves against this by having strong contract language that spells out exactly what needs to be done, with financial penalties spelled out. However, as we are seeing with RC Golf, simply having the language is not enough. The contracts need to be enforced, which means that the municipality has the responsibility to regularly check to ensure compliance. The question then becomes whether the municipality has the expertise to do so. There are some potential solutions:
o Part-Time Inspector: There are often qualified superintendents living in the area that are retired, who are happy to work on a part-time basis. Inspections would likely not need to be done more than two or three times a season, unless a problem is found.
o Outside Consultant: There are companies, such as our own, that can perform these inspections.
o Other Municipalities: A creative solution is to work with another municipality who is in the same situation. Their superintendents can perform regular inspections at your facilities and vice-versa. The problem is that superintendents tend to be close-nit and it may be difficult to find ones that are willing to criticize a fellow superintendent.
• Deferred Maintenance: This goes along with quality control but is subtler as the issue may not appear for years. To save costs, an operator may not be motivated to keep permanent equipment, such as the irrigation system, is prime condition – if it is good enough to get by. Same may be true of other issues, such as drainage. This can lead to greater repair costs down the road that the municipality is likely to bear.
Recommendation On October 8th, 2018, the County Commissioners voted the prioritize profitability. If that is the case, then there is no question that course maintenance should be privatized. And our recommendation is to include it under the management contract so that one operator is overseeing both maintenance and golf operations.
Should the current operators not want to take on course maintenance, or a suitable agreement not be reached, there are several companies out there who perform contract maintenance. The County should explore this option, but make sure that the contract expires when the operator contracts expire so that a single operator can be used on the next round.
A good argument could be made to leave Keller out of the privatization as the maintenance expenses there (including Fleet) are reasonable, the quality is good, and the facility is profitable. And there is a strong desire to protect your most valuable asset. Our recommendation is to not include Keller unless the same operator is doing both operations and maintenance.
Ramsey County Golf Study Major Recommendations
Sirius Golf Advisors, LLC 283
Recommended Contracts We will discuss two different contracts. The first would basically be a modification of the existing operator contracts at Keller, Battle Creek and Goodrich. The change would involve how the revenue is being split. All other aspects would remain.
The other type of contract is the Hybrid contract, which is like the one at Manitou (but not the same). This is the type of contract we recommend the County use going forward.
Revenue Equalization This is the simplest modification, and one that may be possible to implement as early as 2019 as the operators had expressed a willingness to do so, pending further discussion.
In this model, all the contract terms would remain except for how the revenue is to be divided. All revenue is treated equally, whether it is green fees, cart fees, range, merchandise or food & beverage. However, with merchandise and food & beverage, the net revenue (gross revenue less cost of sales) is used. The same revenue split would apply to all revenue.
This eliminates the potential conflict of interest that currently exists, whereby the operator has an incentive to decrease green fees in order to maximize volume, where they get the extra revenue from merchandise and Food & beverage.
Hybrid A hybrid contract is a cross between a management contract and a lease. Like a lease, the operator is responsible for all operating expenses, including course maintenance and equipment (fleet services). But like a management contract, the municipality is responsible for capital improvements. It also has a shorter term than most leases and retains more control for the municipality.
The nice thing about Hybrid contracts is that it establishes a floor for the municipality. If no operator subsidy is involved, then the floor is break-even or better, which is the case at Manitou.
The hybrid would also treat all revenue equally in the same manner as described with the Revenue Equalization plan.
In our recommended contracts, we add another feature – a breakpoint. This is done to make sure the operator can cover his/her costs, but then maximizes the return to the County. The way it works is that a breakpoint is established that equals approximately what the operator’s operating expenses are likely to total. Up to that breakpoint, the operator gets most of the revenue (90 to 95%). But above that point, the County gets most of the revenue (e.g. 80%). In cases where the operator’s expenses are not likely to be covered (such as construction years), then a flat subsidy can be added.
We also recommend adding some teeth (protection) to the contract that stipulates certain standards must be maintain (both in terms of maintenance and operations). If the contractor is found in default, they are given a period to correct. If not corrected, then the revenue split is adjusted in favor of the County until it is remedied.
We also recommend that he contracts contain a stipulation that the operator must devote 2% of the net revenue (gross revenue less cost of sales) towards marketing. (The County would also contribute 2% of its revenue).
We recommend transitioning Keller, Battle Creek and Goodrich to a hybrid contract as soon as possible. Manitou would be converted upon the end of the current lease.

Ramsey County Golf Study Major Recommendations
Sirius Golf Advisors, LLC 284
Transitioning Transitioning to the Revenue Equalization plan basically comes down to how to handle the existing inventory (merchandise, food and beverage). As cost of sales is deducted from the gross revenue before the split, an accounting needs to be done with regards to existing inventory that has already been paid for by the operator. Our recommendation is for the County to pay the operator an amount equal to its split of the revenue and based on the actual inventory purchase receipts.
With the hybrid contract, it is a bit more complex. First, the county would have to deal with the labor situation as described above. The other major issue, though, is equipment. The County currently owns all the maintenance equipment as well as the cart fleets.
The solution would likely depend on the chosen operator and when the transition would occur. If we assume the current operators are willing and able to transition to a hybrid contract as early as 2020, then they certainly would need all that equipment as well as the carts. In that case, we recommend negotiating with the operator to take all the existing equipment. The county would likely need to lease the equipment to the operator to make it easier for them to finance.
Keller We strongly feel that Keller is best handled under a single operator that has expertise in both golf course management and banquets. There are several outstanding operators who qualify. (The existing operators may want to bid on doing both as well).
Marketing While some recommendations in this study may take time for the County to implement, this should be one that can be implemented for the 2019 season. Further, no other change will have as much impact as a significant improvement in marketing.
As noted previously, we perceive two main issues with the current marketing: 1) not enough money is being spent (virtually none), and 2) what is spent is not being done so in an effective manner (expertise). Related to this issue is the fact that it is not clear as to who is responsible for marketing – the County or the Operator.
Here is our solution:
1. Budget: We feel that both the County and the operators should participate, with the County taking the lead.
a) We propose that the County set aside 2.5% of its share of the revenue stream for marketing. Last year, the County’s share of the golf course’s revenue was $2,655,106. At 2.5%, this would generate $66,377 for marketing.
b) Each of the main operators would contribute $3,000 per facility. This should equal $15,000 ($3,000 each from Goodrich, Manitou and Battle Creek and $6,000 from Keller).
c) In addition, the operators will have the option to contribute more, with the knowledge that any additional funds they contribute will be spent directly on advertising for their facility. This allows them to take advantage of increased buying power and expertise.
2. Management: We recommend the County hire a marketing firm, with expertise in golf course marketing, to manage the marketing for the County and the four main facilities.
Ramsey County Golf Study Major Recommendations
Sirius Golf Advisors, LLC 285
3. Marketing: The marketing effort should include:
a) Planning: A detailed marketing plan should be prepared annually.
b) Web: New websites should be created for each facility.
c) Social Media: The courses need to be proactive in major social media. This will require someone (likely from the marketing company) to do regular postings – preferably daily.
d) Email: The email database should be mailed to at least on a weekly basis.
e) Public Relations: A PR effort should be implemented, especially when it comes to new programming and major capital improvements.
f) Media Advertising: A comprehensive media campaign should be implemented. This will include advertising on social media platforms, golf publications, etc. It may include spot TV ads, redemption advertising and billboards.
4. Branding: As RC Golf begins implementing the proposed improvements to operations and facilities, the County should strongly consider a branding campaign, bringing all the facilities under a common brand identification (such as “RC Golf”). This would include a logo that hopefully would have merchandising value as well.
Marketing vs. Advertising There is often a lot of confusion in the public between the terms “Marketing” and “Advertising,” with many using the terms interchangeably. The truth, though, is that while all advertising is marketing, not all of marketing is advertising. Advertising is a part of a marketing strategy. But it should be only a part of an overall marketing strategy.
There are many components to marketing. Below are the most important.
• Planning: The first step in marketing is to develop a plan. You must know where you want to go,
then determine the best path to get there. We noted previously that the current operator contracts
require them to prepare an annual plan, but this has not been enforced. A good plan includes the
following:
o Goals: Goals should be specific, measurable and obtainable.
o Strategy: How do you plan on meeting the goals.
o Market Overview: What is the potential market?
o Target Market: Who are you going to be targeting in your campaign(s)?
o Competitive review: Who are you competing against? How are they marketing?
o Market Position: How is the facility being positioned in the marketplace? This should
include both pricing and image.
o Fees: What is your pricing plan?
o Budget: This should be as detailed as possible.
o Media: What media will be used in advertising and communications. How often?
o Pricing
o Public Relations: How and who are you going to use for public relations interactions.
o Promotions: What kind of promotions are you planning, including events, specials, etc.
o Measure: How are you going to measure the effectiveness of your campaign?
• Budget

Ramsey County Golf Study Major Recommendations
Sirius Golf Advisors, LLC 286
• Public Relations: This is often overlooked but can be extremely cost-effective. It is always beneficial
to develop a good relationship with the media, especially the media that covers golf. This includes
not only traditional media, but golf-specific media, web-only media, etc.
• Pricing: Pricing plays a key role in your marketing. It not only determines your market position, but
it is obviously a key driver in attracting a customer base.
• Media: Now we are getting into advertising.
• Analysis: Determining the effectiveness of your marketing campaign. This will help you become
more cost-effective in the future by dropping what was ineffective.
Marketing Strategy The marketing strategy should be divided between marketing the system (branding) and individual course advertising.
System Marketing The main theme for the system marketing should be “something for every golfer” as it highlights the diversity of facilities. The marketing should be inclusive of Island Lake and possibly the Golf Dome. I say possibly, because under the current lease, the county has no vested interest in the Dome’s performance. However, we encourage approaching the Dome’s operators for a contribution to the marketing fund in exchange for participating in the system marketing.
Another important component of the marketing will be the spreading out of the price points – elevating Keller to a Premium course and making Goodrich a value facility. This will further enable RC Golf to reach the widest possible spread of golfers.
Branding
Branding is creating an identity for RC Golf. This makes it much easier to market. However, one of the concerns with branding the facilities at this point of time is that to be successful, it is imperative that there is consistency in the quality of service. This does not appear to be an issue currently as all the operators offer good customer service. Further, there is good communication between the managers as they meet on a monthly basis.
Another concern may be timing. Would it be better to start branding now, or wait until the courses are renovated? Our recommendation is to start the branding operation as soon as the renovation plans are in place. That way, the renovations can become part of the marketing.
There are some key components to branding. They include:
• Name: “Ramsey County Municipal Golf” is not exactly ideal for marketing. Preferably, you develop a
name that is easy to remember, short, and descriptive. In this report, we use “RC Golf,” which is a
potential candidate. But there are a lot of options, including simply “RCG.”
• Logo: The second key is to develop a good logo. This needs to be professionally designed, with the
knowledge that it will be used on everything from golf balls (very small) to billboards. Thus, it
cannot be overly complex. You want the logo to be appealing, so that it can be used to help sell
merchandise.
• Exposure: Of course, the most important component is to get the name in front of the target
market as often and as memorable as possible. It needs to be used in all advertising done for RC
Golf, and be seen all over each facility through both signage and merchandise. It should also be
promoted through both County and Parks marketing information that includes golf.

Ramsey County Golf Study Major Recommendations
Sirius Golf Advisors, LLC 287
Public Relations
Public relations can be one of the most cost-effective marketing strategies. You want to have press releases for all major events. Try to get articles placed with both local media and regional golf publications on RC Golf’s efforts to improve. These can be done when plans are finalized then throughout the renovation process and upon completion. Have more golf stories published on the County-controlled websites and social media.
Another way to generate good publicity is through community involvement. A good example of this is for the County to sponsor a charity golf event at Keller and perhaps other facilities, where the charity itself captures the public interest. An example might be a fund-raiser where all the green fees, or 75% of the proceeds, etc. goes towards disaster relief. Or towards housing for the homeless, etc.
Individual Facilities The three “I’s” identify the main types of marketing that apply to facilities.
• Informational: These are the “blandest” of ads. Their primary purpose is to inform the customer.
These ads may feature course hours or fees, and/or various services found.
• Image: Image building ads are ones that make the facility more desirable to play. They highlight the
quality of the golf experience¸ whether it be the quality of the course, superb course conditions,
great customer service, or a fun, festive environment.
• Incentive: These are ads designed to get the golfer to act now. There are three primary subtypes:
o Redemption: These are ads that can be redeemed for savings, the most common example
being coupons.
o Specials: These are promotional rates that do not require any special action by the golfer
other than make a teetime during the promotional period.
o Event: These are ads promoting a specific event, whether it be a tournament or a “demo-
day,” or some other type of event that is limited time or limited participation.
All three types are needed and play an important role in the overall strategy. However, the mix will vary with the type of facility.
For Keller, the primary marketing should be Image, especially if Keller is marketed as a “Premium” facility. This is because golfers playing premium facilities do so primarily because they are wanting a quality experience and do not have the price sensitive that other golfers may have.
It is also important for Battle Creek to feature predominantly Image ads, because golfers are expecting it to be a low-quality course due to being only nine holes. This can only be overcome through extensive image-building ads, presumably with the tag line “Best Nine-Hole Course in the State.” They also might emphasize “a Premium Experience in half the time.”
At Goodrich, which is targeting the value market, the ads are going to be predominantly Incentive ads, because golfers playing value facilities do so because of price sensitivity.
Manitou will want a more balanced approach as it is in the middle. It needs to have its image built up, but you also want to give the golfers a reason to come now to try it.
A caution needs to be issued with regards to Incentive ads. It is very important to vary the incentive that is being offered. There are several reasons for this. First, if you are offering the same incentive over and over, it will eventually lose its appeal. Golfers get so used to seeing the same offer, that they become attenuated to it, essentially ignoring it because they have seen it so often. Second, if the same special is always offered, it ceases to be “special” and essentially becomes the actual price. Third, by varying the offer, you are more likely to reach a wider segment of the market.

Ramsey County Golf Study Major Recommendations
Sirius Golf Advisors, LLC 288
Media Below, we will discuss various media and the roll they can play in promoting RC Golf and its facilities.
Print To paraphrase Samuel Clemens (Mark Twain), the reports of the death of print media has been greatly exaggerated. First thing to keep in mind that most of the traditional “print” media also have a corresponding web presence. So, you are not exclusively advertising in “print.”
Print media is most popular with seniors, but it does reach other demographics. Print is also ideal for redemption ads (coupons) as you can have a physical proof of the effectiveness of an ad.
Metropolitan newspapers obviously have the widest circulation. But they are also the most expensive, thus using them must be judicious, if at all. In the case of RC Golf, it would mostly likely be used to promote the system, or Keller.
Regional golf publications may be the most targeted as they are only being read by potential customers. But not all publications are equal.
An often overlooked, and cost-effective media, is to advertise in neighborhood or local area papers – particularly those that are close to a given facility. Redemption ads tend to work best as the reader is likely to already be familiar with the course.
Broadcast Broadcast media is usually the most expensive media choice. And while television can be very effective, its cost reduces its cost-effectiveness. What is important to remember is that repetition is the key to effectiveness. This, obviously ads to the cost.
Radio is rarely cost-effective for this reason. Radios reach is becoming more and more limited, for one. And there are so many choices that it is hard to choose the right one. And then you must saturate in order to be effective. We rarely recommend radio. However, there are a couple of exceptions:
1. Golf Shows: Golf shows, like golf publications, have already screened the market so that only
potential customers are listening.
2. Trade: Many radio stations are willing to trade air time for teetimes that they can use to
entertain VIPs or host a tournament.
3. Public Relations: Radio is a great source for public service announcements (PSAs), which are
normally free of charge. These can be used to promote special events.
Email Email marketing is usually the most cost-effective, mainly because there is often no cost involved other than time. But it can also be very effective, especially in building loyalty and retaining current customers.
To be effective, email marketing needs to be consistent and frequent – at least once every other week.
Currently, the only way the email list is being built is through the online teetime reservation system, which is controlled by a third party. We strongly recommend building internal lists through signup notices on the course’s websites as well as a physical sign up at the proshop.
The problem with most email campaigns is that they start and end with your own customers. And by sending them coupons and specials, you may simply be lowering the yield on the rounds that you may have gotten anyway. As a result, we recommend to not just use email to send out coupons. Use them to

Ramsey County Golf Study Major Recommendations
Sirius Golf Advisors, LLC 289
communicate. We recommend creating a monthly Newsletter, which also can be posted on the website. The newsletter should include:
• Calendar of upcoming events
• Tournament/league results
• Article from the pro
• Article form the Superintendent
Ideally, though, you would like to take advantage of the efficient media by promoting to golfers who are not currently your own customers. The question becomes how do you get their emails?
There are several potential sources, including:
• Marketing Companies: There are a lot of companies that market specialized email lists. Some of
these are derived from subscribers to golf publications, others get the names from surveys and
other sources.
• Internal: The County likely has several email lists internally, including employees.
• Trade: Consider trading email lists, or rather access to them. Privacy concerns will likely prevent
exchanging the lists, but other golf companies may be willing to email an ad you create to their
customers in exchange for you emailing one of their ads to yours. Potential targets are other golf
related businesses such as golf retailers.
• Media: A lot of media now offer email campaigns as part of their services. This may or may not be
in conjunction with using their preferred media.
Website The website is the most prominent and perhaps most important aspect of marketing. Used properly, it not only is helpful to current customers (customer service) but can play an essential role in attracting new customers (customer attraction). It is in the latter role that the current websites mostly falls short. And enterprising courses use their website for revenue generation. Key to all of these is the information that is provided and how it is provided.
It is important to give current customers a reason to regularly check the website. This can take several forms, such as offering specials, providing league and tournament results, posting a calendar of events, etc. This also means that is important to constantly be updating the website so that there is something new to see.
Key components of a successful website include:
• Design: The website should feature a professional, modern design. It is essential that key
components be visible at the top of the first page, including a menu, a dramatic picture of the
course, and a highly visible link to online teetime booking.
• Searchability: You can’t attract new customers with your website if they can’t find the website. Do
not depend on people googling the name of your course. You want your course to pop up when
they are searching for any golf course in the area. Make sure your website pops up for searches for
“Golf St. Paul,” “Golf Minneapolis,” “Golf MSP,” “Golf Twin Cities,” etc. This can be done with text
on the website as well as metatags and other techniques.
• Pictures: The website needs to have lots of pictures. You may even want a page dedicated to
pictures of the course. Make sure there are pictures showing happy customers, and make sure they
show a diverse population of customers.
• Course Description: The course description is the first thing a prospective customer is going to read.
Thus, it needs to be good. It not only needs to do a good job in describing the course but do it in a
Ramsey County Golf Study Major Recommendations
Sirius Golf Advisors, LLC 290
way that makes it as appealing as possible. In writing the description, make sure to highlight the
factors that you think are the main reasons golfers would want to play the course. Avoid trying to
make the course something it isn’t. Not all golf courses can be compared to Augusta National. But
keep in mind, not all golfers are looking to play Augusta – at least that may not be what they are
searching for at the time they find your website. Keller, for example, needs to talk about its rich
history as well as its recent renovation and beautiful clubhouse.
• Course Information: Course vitals – Par, length, slope and USGA rating, should be prominently
shown in the upper half of the home page. But there also needs to highly visible links to the
scorecard and layout. If a drone video is available, post that.
• Fees: Fees should be on the first page, or a separate tab that is easily seen. Rates need to be kept
current, including any specials.
• Email Sign Up: There should be a link on the home page to sign up for the in-house email list.
• Promotions/Specials: There should always be an incentive on the home page. This does not
necessarily have to be a discount on playing fees. It can be a merchandise sale (and there should
always be something on sale), or a special in food and beverage. You should also highlight a regular
feature, such as twilight rate at Keller, or the 2 for 1 Happy Hour at Battle Creek, etc.
• Patron Program: The Patron Program should be explained on the home page. Do not just give rates
but explain how it works.
• Profiles: There should be an “About Us” page that provides background information on key staff. It
is also nice to highlight an employee of the month.
• RC Golf: There should be a brief description of the entire RC Golf system, with links. Do not assume
that they came to the course website from the County’s.
• Calendar: There should be a calendar of events. This should not only show upcoming tournaments,
but also maintenance programs that may impact play such as aerating. This needs to be kept up-to-
date.
• Tournaments: Provide information about upcoming tournaments and events. Provide links for
participation if they are open events. An added customer service is to also post results from recent
events. This can help in selling future events as it is a value-added service.
• Leagues: It is also a great value-added feature to provide information about leagues at the course.
Provide links to league organizers for outside leagues and provide sign up options for course-
sponsored leagues. Post league results.
• Clubs: Same as with leagues. Provide contact information, fees, events, and results. If the clubs
maintain a separate website, provide a link.
• Newsletter: We would love to see a monthly newsletter that is not only emailed to customers but is
also posted on the website.
• Merchandise: Consider selling merchandise off the website, especially logoed merchandise. Always
post your weekly featured sales items. It is easier than ever to sell merchandise off a web page.
• Food and Beverage: Have a menu as well as posting any specials. Post hours of operation. Indicate
when the beverage cart service can be expected.
Social Media Like the website, social media plays an important role in both customer retention and attracting new play. The biggest key is keeping the content fresh. You want to post on a regular basis. At a minimum, the social media that you should participate in include Facebook, Twitter, Instagram and You Tube.

Ramsey County Golf Study Major Recommendations
Sirius Golf Advisors, LLC 291
• Facebook: Facebook serves as both a second webpage and a great communications device. The
same recommendations for the website above apply to your Facebook page. Again, update, update,
update.
• Advertise: The real power with social media is not in your postings, which primarily impact current
customers, but in advertising on the sites. These media provide powerful targeting tools that allow
you to pinpoint your audience, making them very cost effective. They also offer click-advertising
that allow you to control your costs. Another benefit to web advertising is that it allows you to track
exposures, so you have a measure of effectiveness.
• You Tube: Have a You Tube channel for each course. Again, make regular postings.
Internet Specialist Because of the importance of internet-based media (email, websites, social media, etc.), the County should consider hiring an internet specialist whose only job is to make regular postings for each course. Ideally, this person should not only have the requisite computer skills but have marketing expertise – with the ability to take good pictures (and video) and write effectively.
Other • Billboard: Consider having at least one seasonal billboard. Our recommendation is to have one for
Keller and have it posted near the Airport or on I-35E near downtown St. Paul.
• Brochure: Develop a brochure for RC Golf and at least Keller, if not for each course. But these
brochures do no good unless they are distributed. The brochures should be designed to fit into
tourist racks and must have “GOLF” prominently displayed in the upper portion so that it is clearly
visible in the rack. Brochures should be placed in tourist racks throughout the metropolitan area.
They also should be given to area Chambers of Commerce, Economic Development Councils, etc. to
be included in information packets.
• Search engines: Search engines are how most golfers find websites when they are searching for a
place to play. Consider paying to have the course placed at the top for various searches (e.g. “Golf
St. Paul”, “Golf Minneapolis”, etc.) These can be budgeted as you pay by the “click” and you can
preset how much you want to pay each month.
Tracking An important component to a successful marketing strategy is in being able to track the success of various marketing campaigns or specific ads. This will allow you to discard those ads and/or strategies that prove unsuccessful, while shaping and expanding those that are.
The question then becomes: “How do you track your ads?” Below are some proven ideas:
• Redemption Ads: (Coupons) This is certainly the easiest and one of the more accurate measures. You simply keep track of the number of coupons that are redeemed for a given campaign. However, keep in mind, the raw numbers do not tell the whole story. A redemption ad can have a positive impact even if the reader (or listener) never utilizes the coupon. The reason is that it does increase exposure. And because it involves savings, the reader is more likely to pay attention to it. The downside is that it can reduce the value of the product – especially if overdone. It is most effective when done strategically. In the old days, you simply counted the physical coupons. However, physical coupons are much less used today. You still want to do a physical count if a physical media is used, but the best way is to create a special “key” on the POS for each promotion. This provides an accurate count, although you need to do spot checks to make sure your cashiers are not giving the coupon rate to customers who did not provide the coupon. If different media are used for the

Ramsey County Golf Study Major Recommendations
Sirius Golf Advisors, LLC 292
same ad, make sure the media is coded so that you can get a count for each. Some operators will use QR or bar codes that can be displayed on a cell phone. This is ideal, but requires a POS sophisticated enough to read and record them. Another method, when using different media sources for the same coupon, is to have a different POS key for each media. The cashier then needs to be trained to make sure they use the right key for each media.
• Before and After: Another good measure is to track performance before, during and after a particular ad campaign. The time frames need to the same (i.e., same days of the week, etc.). The problem, though, is that weather can have a big impact. If adverse weather intervenes during any of the measurement periods, it can distort the results.
• Internet: Most internet-based advertising, including social media, provide excellent tracking tools. You can see your exposure (how many people see the ad) and click-through rate (how many actually click on the ad to get more information.)
• Survey: If you are running an “image” campaign, there are no coupons to count. However, it is possible to get an objective measure. You simply ask the customer, “how did you hear about us?” or “did you see x ad.” This can be done both online, when the customer is booking teetimes, or in the proshop, when a customer is booking or when checking in. The latter requires the cashier to be trained both to ask the questions, and then to record the response on a running tab set up for that purpose.
• Clicks: You should have a digital counter on your website and on each page, that counts the number of times it is accessed. Even if an ad does not direct the customer to the website, they are likely to do so if they are interested, or if they are thinking about booking a teetime. Again, you can compare the before and after. You can also get counts from search engines to see how many people are inquiring about your golf course, both before and after.
We have more to say about marketing below under “Expanding Market.”
Pricing Policy To what degree you want to change the pricing philosophy depends largely on where you want to be on the amenity / profitability continuum. Current policy is very much amenity-oriented. If profitability is important (even just to break-even), then certain changes should be strongly considered.
At the very least, the County should be reviewing the pricing schedule on an annual basis, not every two years. If the contracts with the operators are reworked so there is a stronger alignment of interests and potential conflicts of interest are eliminated, than the operators should be given greater control over the golf fees. This should greatly diminish undue political influence and place more emphasis on making business it a business decision based on the current market conditions. After all, they are the ones that are in the business and are dealing directly with the customers and competition. In this case, the County could provide a fee range and structure (annual passes, patron program, etc.), but allow the individual operators to set the exact rates, which they could modify as market conditions change.
Clubs The situation with the men’s and women’s clubs, especially at Keller, is a difficult one. Not only do these clubs represent the heaviest users of the facility, but they also tend to be politically active. But I do think there are reasonable options to consider making the facilities more accessible to the general public during these peak demand times. Possible solutions include:
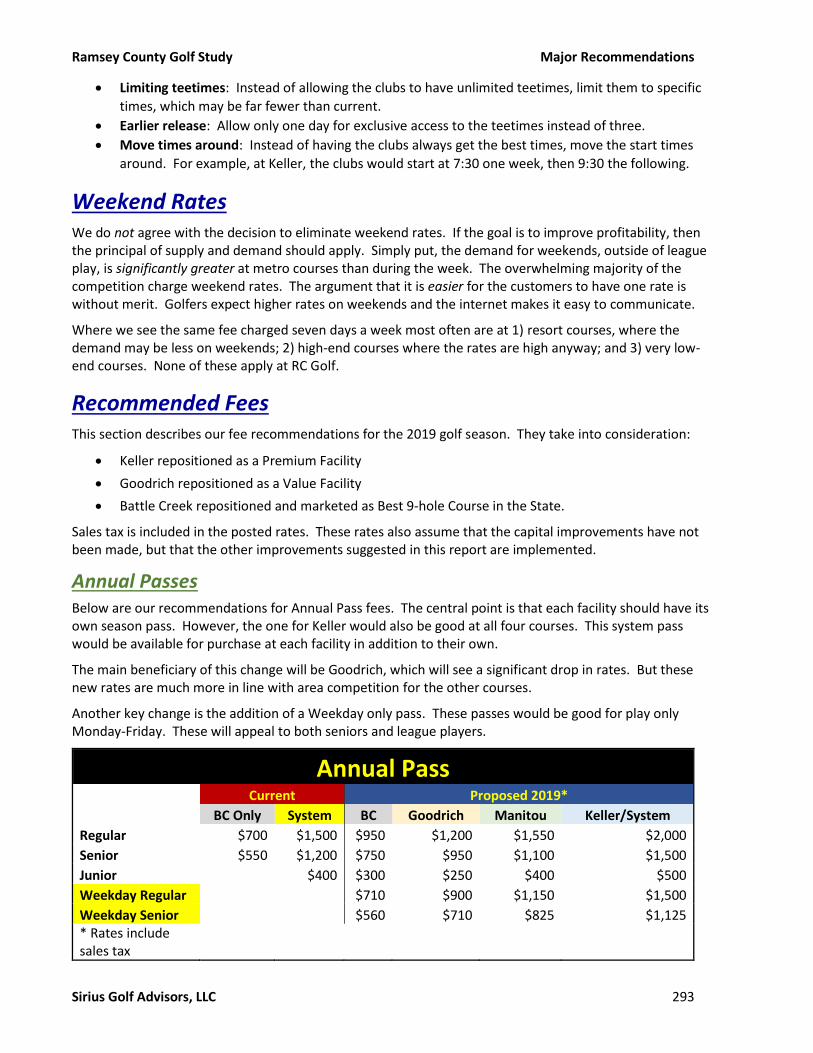
Ramsey County Golf Study Major Recommendations
Sirius Golf Advisors, LLC 293
• Limiting teetimes: Instead of allowing the clubs to have unlimited teetimes, limit them to specific
times, which may be far fewer than current.
• Earlier release: Allow only one day for exclusive access to the teetimes instead of three.
• Move times around: Instead of having the clubs always get the best times, move the start times
around. For example, at Keller, the clubs would start at 7:30 one week, then 9:30 the following.
Weekend Rates We do not agree with the decision to eliminate weekend rates. If the goal is to improve profitability, then the principal of supply and demand should apply. Simply put, the demand for weekends, outside of league play, is significantly greater at metro courses than during the week. The overwhelming majority of the competition charge weekend rates. The argument that it is easier for the customers to have one rate is without merit. Golfers expect higher rates on weekends and the internet makes it easy to communicate.
Where we see the same fee charged seven days a week most often are at 1) resort courses, where the demand may be less on weekends; 2) high-end courses where the rates are high anyway; and 3) very low-end courses. None of these apply at RC Golf.
Recommended Fees This section describes our fee recommendations for the 2019 golf season. They take into consideration:
• Keller repositioned as a Premium Facility
• Goodrich repositioned as a Value Facility
• Battle Creek repositioned and marketed as Best 9-hole Course in the State.
Sales tax is included in the posted rates. These rates also assume that the capital improvements have not been made, but that the other improvements suggested in this report are implemented.
Annual Passes Below are our recommendations for Annual Pass fees. The central point is that each facility should have its own season pass. However, the one for Keller would also be good at all four courses. This system pass would be available for purchase at each facility in addition to their own.
The main beneficiary of this change will be Goodrich, which will see a significant drop in rates. But these new rates are much more in line with area competition for the other courses.
Another key change is the addition of a Weekday only pass. These passes would be good for play only Monday-Friday. These will appeal to both seniors and league players.
Annual Pass Current Proposed 2019*
BC Only System BC Goodrich Manitou Keller/System
Regular $700 $1,500 $950 $1,200 $1,550 $2,000
Senior $550 $1,200 $750 $950 $1,100 $1,500
Junior $400 $300 $250 $400 $500
Weekday Regular $710 $900 $1,150 $1,500
Weekday Senior $560 $710 $825 $1,125 * Rates include sales tax

Ramsey County Golf Study Major Recommendations
Sirius Golf Advisors, LLC 294
We also recommend putting a limit on the number of season passes sold. At this point, it is not a concern due to the low volume, but with the revised pricing it can be. Too many pass holders can reduce the overall yield as they dominate the teetimes with an effectively lower yield per round. Our recommendation is to limit the seven-day passes to 75 at each facility combined regular and senior.
Patron Program We are recommending a major restructuring of the Patron Program. The changes include:
• Non-Resident Rates: Residents of Ramsey County pay a lower fee for a Patron card than non-residents.
• Premium: We recommend introducing a deluxe or Premium Patron card. In addition to the benefits of the Patron card, Premium members will be allowed to get twilight rates one hour earlier than other golfers. They also get a discount on the cart fee.
• Seniors: Seniors receive a discount on both resident and non-resident cards, as well as both Premium cards.
We also feel that the current rate is too low.
Another recommendation is that golfers must provide contact information to receive the card, including email address. The County should assure them that their email address will not be supplied to any third party. They will also be given the ability to opt out of receiving regular emails from the golf programs.
Green and Cart Fees Below are the current and proposed green and cart fees for each course. Keller and Battle Creek’s fees are going up, Goodrich’s down and Manitou remains mostly stable. We are also introducing the proposed new Patron programs.
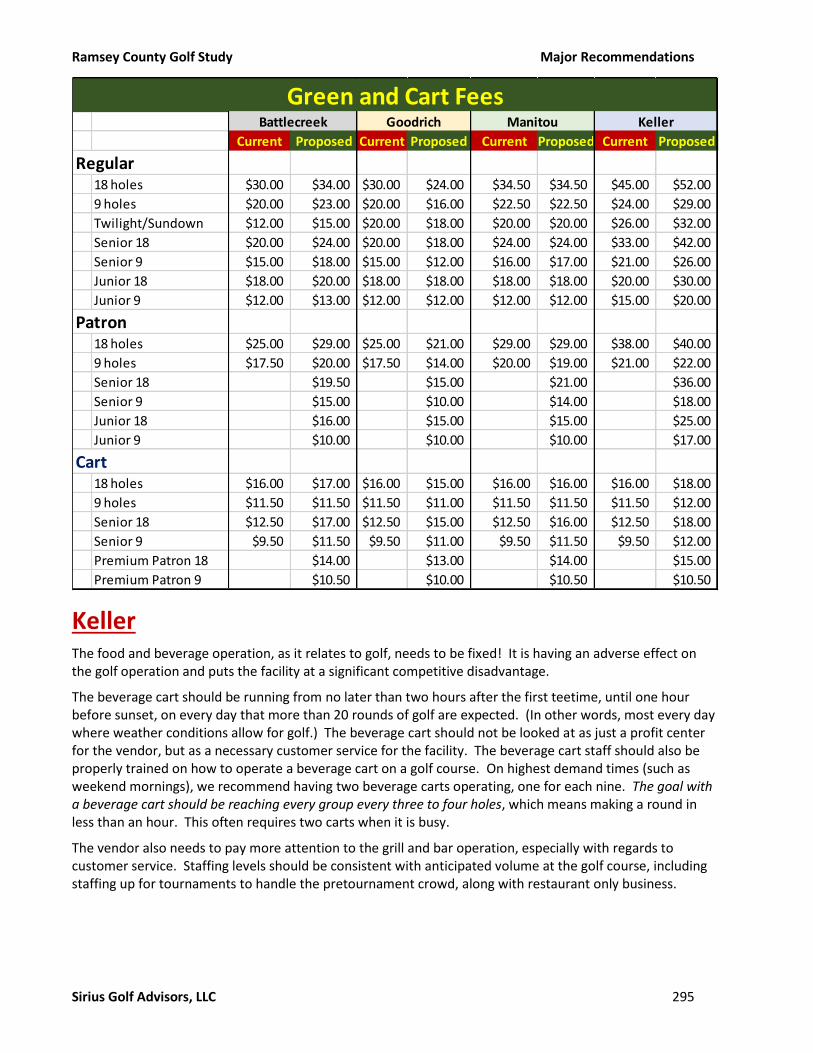
Ramsey County Golf Study Major Recommendations
Sirius Golf Advisors, LLC 295
Keller The food and beverage operation, as it relates to golf, needs to be fixed! It is having an adverse effect on the golf operation and puts the facility at a significant competitive disadvantage.
The beverage cart should be running from no later than two hours after the first teetime, until one hour before sunset, on every day that more than 20 rounds of golf are expected. (In other words, most every day where weather conditions allow for golf.) The beverage cart should not be looked at as just a profit center for the vendor, but as a necessary customer service for the facility. The beverage cart staff should also be properly trained on how to operate a beverage cart on a golf course. On highest demand times (such as weekend mornings), we recommend having two beverage carts operating, one for each nine. The goal with a beverage cart should be reaching every group every three to four holes, which means making a round in less than an hour. This often requires two carts when it is busy.
The vendor also needs to pay more attention to the grill and bar operation, especially with regards to customer service. Staffing levels should be consistent with anticipated volume at the golf course, including staffing up for tournaments to handle the pretournament crowd, along with restaurant only business.
Current Proposed Current Proposed Current Proposed Current Proposed
Regular18 holes $30.00 $34.00 $30.00 $24.00 $34.50 $34.50 $45.00 $52.00
9 holes $20.00 $23.00 $20.00 $16.00 $22.50 $22.50 $24.00 $29.00
Twilight/Sundown $12.00 $15.00 $20.00 $18.00 $20.00 $20.00 $26.00 $32.00
Senior 18 $20.00 $24.00 $20.00 $18.00 $24.00 $24.00 $33.00 $42.00
Senior 9 $15.00 $18.00 $15.00 $12.00 $16.00 $17.00 $21.00 $26.00
Junior 18 $18.00 $20.00 $18.00 $18.00 $18.00 $18.00 $20.00 $30.00
Junior 9 $12.00 $13.00 $12.00 $12.00 $12.00 $12.00 $15.00 $20.00
Patron18 holes $25.00 $29.00 $25.00 $21.00 $29.00 $29.00 $38.00 $40.00
9 holes $17.50 $20.00 $17.50 $14.00 $20.00 $19.00 $21.00 $22.00
Senior 18 $19.50 $15.00 $21.00 $36.00
Senior 9 $15.00 $10.00 $14.00 $18.00
Junior 18 $16.00 $15.00 $15.00 $25.00
Junior 9 $10.00 $10.00 $10.00 $17.00
Cart18 holes $16.00 $17.00 $16.00 $15.00 $16.00 $16.00 $16.00 $18.00
9 holes $11.50 $11.50 $11.50 $11.00 $11.50 $11.50 $11.50 $12.00
Senior 18 $12.50 $17.00 $12.50 $15.00 $12.50 $16.00 $12.50 $18.00
Senior 9 $9.50 $11.50 $9.50 $11.00 $9.50 $11.50 $9.50 $12.00
Premium Patron 18 $14.00 $13.00 $14.00 $15.00
Premium Patron 9 $10.50 $10.00 $10.50 $10.50
Green and Cart FeesBattlecreek Goodrich Manitou Keller
Ramsey County Golf Study Major Recommendations
Sirius Golf Advisors, LLC 296
Manitou Historically, Manitou has been the best-performing facility within the RC Golf system. However, its performance has been declining significantly over the past several years. Like Goodrich, Manitou is dealing with a rapidly deteriorating infrastructure that has long outlasted its anticipated and recommended life-cycle. Unlike Goodrich, Manitou received very poor ratings from its customers in the administered NGF survey, especially in its loyalty index. If trends continue, Manitou is at serious risk of a further deterioration of its customer base. Manitou is largely dependent on its league income, having more league participation than the other courses in the system, combined. In this case, losing just one league can mean a significant drop in play. In our opinion, especially after review survey responses, Manitou appears to be at risk of losing several leagues.
On the other hand, because Manitou is managed under an operating lease, whereby the operator is responsible for all operating expenses, including maintenance, the County has little exposure. But it does remain responsible for capital improvements.
This operating agreement expires at the end of 2021, with no option for renewal. If current trends continue, the County will be taking over a facility in crisis, with major capital needs and a significantly reduced customer base. At that time, it is difficult to imagine being able to attract an operator under a similar lease agreement, without major improvements having been made. Without major changes, but in operation and with regards to capital improvements, the County is at risk of turning what has historically been its most profitable golf operation into its biggest cash loser.
To address this situation, we have developed a couple of scenarios for capital improvements. One addresses just the most pressing infrastructure repairs needs, while the other is a complete renovation.
• Scenario One: Priority Repairs – This addresses the most urgent infrastructure repairs, including replacing irrigation, rebuilding the oldest greens, and rebuilding the bunkers. We also recommend putting in new forward tees and adding an on-course restroom. However, it does not address a lot of the significant infrastructure concerns.
• Scenario Two: Major Renovation – under this scenario, not only are all infrastructure repairs addressed, but significant improvements are made, including expanding the clubhouse and relocating the range to make it larger and more appealing.
These scenarios will be discussed in greater detail under the capital improvement recommendations. However, we strongly encourage the County to decide as soon as possible on what direction to take, and then bring in an Architect for actual plans. The reason is that we want to see new forward tees added as soon as possible. But it would not make sense to add new tees, if they are going to be moved a few years later as part of a major renovation.
In addition, based on the survey results, it appears that improvements need to be made with regards to customer service and the food and beverage operation. Closer attention needs to be paid to the maintenance issues raised by the survey and addressed in our main report. We recommend increasing the maintenance budget by at least $50,000 to $75,000 with more spending on fertilizer, increase tree-trimming, and make sure the fairways and rough are being mowed frequently enough that they are not adversely affecting play. Mow the rough lower to improve playability and Pace of Play.
Manitou also needs to be paying more attention to women. In addition to new forward tees, pay more attention to how they are being treated by staff. Add more healthy choices to the menu. And increase the quality and quantity of the women’s merchandise selection. (And remember Sales, Sales, Sales).

Ramsey County Golf Study Major Recommendations
Sirius Golf Advisors, LLC 297
We also encourage improved beverage cart service. As with Keller, we believe the beverage cart should be operated daily from two hours after the first teetime until two hours before dusk. It should be considered an important part of customer service, rather than just a profit center.
Battle Creek Battle Creek is the only RC Golf operation that currently has a negative cash flow to the County. As noted previously, this is largely because it has a narrow market niche, being a challenging nine-hole golf course.
We looked at three possible options:
• Scenario One: “Elite Nine” – in this option, we keep the facility mostly as-is, but market the heck out of it as “the best nine-hole golf course in the state” (which is likely true).
• Scenario Two: Par 34 – This scenario maximizes the range but doubling the size of the teeing area at the cost of reducing the golf course from a Par 35 to a Par 34.
• Scenario Three: 18 holes – This scenario takes advantage of the fact that there is land available across the street to build a 2nd nine and make Battle Creek a challenging 18-hole regulation facility, which is the most popular type of golf course.
We will talk about each of these scenarios in greater detail in both the Capital Improvement and the Projections sections. Below are some of the pros and cons, before costs and projections are taken into consideration.
Scenario One: “Elite Nine” In this scenario, we simply try to take what is currently a weakness – the fact the course is a challenging nine-hole course – and turn it into a strength. The main aspect of this approach is how the facility is marketed. The goal is to attract golfers, such as those that appreciate higher quality courses, that are currently avoiding the course because they believe, as a nine-hole course, it is certainly either an executive course, or low-end.
The marketing approach is something like “do you like the quality of Keller, or Prestwick, but don’t have five hours to play? Then come and experience Battle Creek… The Best Nine-hole Course in the State!”
Pros • Requires significantly less capital investment than the other improvement scenarios.
• Does not require major changes to how the facility is operated.
• Improves the golf experience on both the range and golf course
• Increases capacity by adding more parking
Cons • To our knowledge, this has not been done before, so there is no way of knowing how successful the
strategy will be.
• Requires both marketing expertise and a significant marketing budget.
Scenario Two: “Par 34” This scenario emphasizes the range, which has been highly successful, over the golf course. The range is effectively doubled in size, but at the cost of reducing the Par on the golf course from 35 to 34.

Ramsey County Golf Study Major Recommendations
Sirius Golf Advisors, LLC 298
The latter is a “big deal” to golfers, who tend to be extremely traditional. Traditional golf courses have a par ranging from 70 to 72 (35 or 36 for nine holes). Going higher or lower, even by one stroke, will greatly impact performance.
This is further amplified by the fact that courses with a lower par (such as Par 34) are highly associated with lower-end facilities. Thus, by being both a nine-hole course and being a Par 34, will make it even more difficult for Battle Creek to avoid being mischaracterized. This means that golfers who would otherwise enjoy it, will never think to play it, while golfers who are play it because they expect it to be a very playable low-end course, are going to be very disappointed.
Pros • Doubles the size of the range, which is the most profitable aspect of the facility and appears to have
the demand to support such an expansion.
• Less expensive than a complete renovation
• There are some Par 68 courses in the market that are successful, or at least well known (Dwan, Theodore Wirth). Thus, a Par 34 may be better received in this market than others.
Cons • As noted above, this combination further amplifies the weaknesses of the existing golf course
• Non-standard courses (such as Par 34) make up a disproportionate amount of the course closings (2/3rds) in the area.
• Does not appear to have a strong demand in market place for such a facility.
• It is very difficult, and expensive, to try and “dumb-down” the course to make it consistent with expectation.
Scenario Three: “18-hole” The 18-hole scenario utilizes the property across the street from Battle Creek, surrounding the Correction facility, to build a second nine holes that would allow Battle Creek to become a full 18-hole championship course.
To avoid a non-returning nine course, which would not perform nearly as well, a 2nd clubhouse complex needs be built across the street with the new nine holes. In our proposal, the new clubhouse is at least 6,000 sf in size, which can accommodate both a full restaurant and a banquet room capable of hosting at least 125 people. This will allow the new facility to host tournaments and banquets.
In addition, a new range would be built adjoining the new clubhouse. This allows the current range and clubhouse to become a practice-only facility.
Pros • Eliminates the issue with parking at the current clubhouse at the facility as golfers who want to play
the course would park at the new clubhouse.
• Maximizes range income as there would now be two ranges available, one for range-only use, and one that is shared with golfers warming-up.
• Creates new revenue streams with banquet and grill sales.
• Makes Battle Creek a high-quality 18-hole championship course, consistent with the most popular facilities in the area.

Ramsey County Golf Study Major Recommendations
Sirius Golf Advisors, LLC 299
• Allows for more league play – especially important given its proximity to 3M.
• Could be good target for tourist play, given its proximity to downtown and 3M, and the anticipated quality of the course.
• Potentially takes the one facility in the system currently experiencing a negative cash flow and turn it into a positive cash flow.
Cons • Cost. While this would not cost as much as building a new 18-hole course, it still may approach the
cost of the recent renovation of Keller.
Expanding Market There are several significant markets where RC Golf’s market share could be dramatically increased. These are:
• Women
• Diverse Populations
• Latent Golfers
• Traveling Golfers
Women Women make up slightly over 50% of the general population, and, according to NGF, about 24% of golfers. Yet, by operator estimates, none of the RC Golf facilities are getting over 15% female participation, while most estimate 10% or less.
Clearly, this is an area where significant improvement could be realized.
Our recommendations to attract more play from women include:
• New Forward Tees: At all four of the big courses, with Manitou being the most urgent. The goal is to have the course yardage from the forward tee in the 4,200 to 4,500-yard range. This will not only help attract and retain play from women, but also super seniors, and beginners. It will also help the pace of play, which affects all the golfers on the course.
• Menu: Healthy choices need to be added at Manitou, Goodrich and Battle Creek, including salads, wraps and fruit.
• Merchandise: Dedicate more space and carry more inventory devoted to women.
• Attitude: The only facility where a negative attitude towards women was reported, was at Manitou (which may be attributable to just a single staff person). But all should be aware of the potential danger.
• Staffing: Try to have more women behind the counter.
• Marketing: Women should be included in any customer photos displayed in ads, on the web, etc.
• Programming:
o Add women’s clubs to Battle Creek and Goodrich
o Develop free or low-cost group clinics aimed at women

Ramsey County Golf Study Major Recommendations
Sirius Golf Advisors, LLC 300
Diverse Populations As demographics continue to shift, we can expect an ever-increasing diverse population in Ramsey County. From both an amenity and profit perspectives, it is imperative that we do a better job of attracting minorities to the game, in general, and to RC Golf facilities.
There are several ways in which we can reach out to these demographics and help increase participation in golf at the RC Golf facilities. Here are a few:
• Cost: Need to address the cost barrier to starting golf, as noted above. Strategies include:
o Trial Packages: Develop a golf “trial” program that would include group clinics, range balls, real balls, free rental clubs, and three or more rounds of golf.
o Opportunity Zones: create more “opportunity zones” where the price to play is reduced. These may be limited in scope to those times that are otherwise hard to fill. For example, Monday afternoons before leagues, etc.
o Free Rental Clubs: Provide free rental clubs at the ranges. One can ask for a driver’s license or credit card to hold for security.
• Staff (1): Start with your own staff, especially with maintenance crews that tend to be more minority. Create programs to encourage your staff to take up golf, and then provide incentives for them to bring their families with them when they play. Similar programs can be extended throughout the Parks Department and not limited to golf courses.
• Staff (2): The golf operations staff that we saw at all the facilities was 100% white (and predominantly male). If you want people to participate, it is important that they see staff “that look like them” working at the course. This helps make them feel welcome.
• Community Outreach: You need to be proactive within the minority communities. This takes several forms, including:
o Churches, Schools, Civic Groups – make presentations, hold clinics, and provide special programming to minority dominated organizations.
o Sponsorships: Show the community you care by having the golf courses sponsor minority community activities. This can take the form of being a financial sponsor or hosting events.
• Marketing: Make sure you are directing some of your marketing budget to the demographics you are targeting, using sources that they are most likely to respond to. It is important that all your advertising include pictures of a diverse customer base.
Latent Golfers Latent golfers are defined as non-golfers who are interested in taking up the game. As noted previously, there are a lot of more latent golfers than actual golfers in the MSP area. Not only does this represent a significant market for the present, but studies have shown that golfers tend to be loyal to the facility where they learn the game, so it not only can help with current performance, but have a sustainable impact on future performance as well.
In planning to reach out to potential new golfers, one must first appreciate the barriers they face in taking up the game. The most obvious is cost. Golf is not a cheap sport in general. But the initial investment is especially daunting if you’re not sure you’re even going to like it. First, there is the cost of the equipment – golf bag, clubs, balls, shoes (although you can play in sneakers) and tacky pants. This alone can cost several hundred to over $1,000.

Ramsey County Golf Study Major Recommendations
Sirius Golf Advisors, LLC 301
Then, assuming you want to do well, is the cost of lessons. Golf is not an easy sport to master. So, it is likely going to require several lessons before you’re even comfortable going out on the course. Cha ching.
Then there is the actual cost to play. And the cost for more balls to replace the ones you will no doubt lose to the woods, lakes and elves.
There is also a hidden cost – time. The general population is under the impression that it takes four to five hours or more to play a round of golf. Most are not aware of alternatives that are of much shorter duration.
To be successful in penetrating this potentially very lucrative market, we must first develop strategies to reduce these costs, real or perceived.
Our recommendations include:
• Clinics: Conduct more free or low-cost clinics for beginners. Ideally, these clinics should be aimed at various target markets such as juniors, women, seniors, adult males, couples, families, etc.
• Trial Packages as described previously.
• System Integration: There needs to be more cooperation within the RC Golf system. In particular, Island Lake is ideally suited to train beginners. We recommend more cross-facility programming that utilize all the resources within the RC Golf system.
• Beginners Leagues: Leagues are huge business in the metro area and especially with the RC Golf facilities. Consider setting up leagues aimed strictly for those learning the game. These leagues should be operated under relaxed rules – such as using a “scramble” format. The emphasis needs to be “fun” not on the competition.
• Promotion: Having the above programs in place are good, but they are only effective if the potential customers know about them. There needs to be a marketing campaign aimed specifically at people who may want to try golf, but for whatever reason, have not made the move. Sometimes, all they need is a reason why to start now.
Visitors The MSP area sees over 30 million visitors a year. This is an often-overlooked market by all but a few golf operators, yet it represents a significant potential market.
Using information from the NGF, we can estimate that at least 12% of these visitors are golfers. The actual percentage may be much higher, as business travelers, which make up a substantial percentage of these visitors, tend to be from higher income households, and thus more likely to be golfers.
NGF estimates that about 46% of golfers will play golf at least occasionally when they travel. They further estimate that they produce about .245 rounds per trip. Taken together, we can conservatively estimate that these visitors account for at least 400,000 rounds of golf.
Further, when golfers play golf when traveling, they tend to want to experience something different then what they see at home. Because it is considered a “treat”, price is less of a consideration than when at home.
Keller, both because of its amenities and especially because of its history, as well as its proximity to the state capital, greatly fits the profile of a course these visitors are expected to play. It makes great sense, then, for Keller to target visitors in its marketing efforts.
Visitor Golf Market
No Visitors 30,000,000
x Participation rate 12%
Est. No. of Golfers 3,600,000
% who play when travel 46%
Est. No. playing golfers 1,656,000
Avg rnds played per trip 0.245
Estimated Rounds 405,720

Ramsey County Golf Study Major Recommendations
Sirius Golf Advisors, LLC 302
Key to these marketing efforts are:
• Brochures distributed at tourist racks throughout the metropolitan area, as well as rest stops throughout the state.
• Billboard that is highly visible along one or major routes likely to be traveled by visitors. We recommend either close to the airport and Mall of America or close to downtown St. Paul.
• Hotels: Contact area hotels, especially those with concierge service. Make sure they know about Keller and have brochures and other relevant information.
• Airport Ads: Consider placing ad signs at MSP.
• Website: This is the most important as golfers coming to the area are likely to check on facilities in the area through a web search. Make sure to highlight the unique features of Keller – especially its history and its recent renovation.

Ramsey County Golf Study Capital Improvement Scenarios
Sirius Golf Advisors, LLC 303
In general, we recommend implementing fixes to all the priority items listed in Capital Improvement Needs section, as well as for most of the other issues discussed.
However, not all improvements are equally important. And many depend on the desired market position for the facility. Further, we wanted to be able to look at the impact of these improvements on performance.
To make the comparisons easier to examine, we developed multiple scenarios for each facility. With all facilities, status quo was considered as one possibility. The impact of these renovation scenarios will be discussed in the Projections section of this report.
The timetable for the improvements is important as we do not recommend having more than 9 holes out of play at any one time, due to heavy demand from leagues. As we are recommending repositioning Goodrich as a Value facility, its improvements become the lowest priority.
Cost estimates were developed using recent construction pricing from Minnesota and adjusted for the proposed scope of work and local material costs. An inflation factor was also added to account for later start dates. A “soft cost” contingency was also added to provide a comprehensive estimated budget and minimize “surprises.”
Below are the scenarios, along with the improvements associated with each. We also discuss timing. Detailed cost estimates can be found in Appendix H.
Keller With Keller, we only developed one improvement scenario, since the amount of improvements are far less than with the other courses. Most of these improvements are to fix issues resulting from cost-cutting measures during the renovation.
Improvements • Drainage: Improve fairway drainage
• Bunkers:
o Add lining
o Add more drainage
o Use White Sand to maximize appeal
• New Forward Tees: Add six new forward tees for Tee Equity, to add tee space. This should allow for increased play from females, more advanced juniors, and super seniors.
• Cart Paths: Full extension
• Fairways: Level hole 14
• Irrigation – As per EC recommendations of pump station controls and repeaters for radio control
• Implement Reduced Turf Area Plans at Tees to reduce future irrigation
Proposed Timing The improvements can be done at any time. In our projections, we assumed starting in August of 2021. The improvements should be completed by the end of the season, with the facility able to open on time the following year.

Ramsey County Golf Study Capital Improvement Scenarios
Sirius Golf Advisors, LLC 304
Construction Impact There should be minimal impact to play, except for leveling 14 fairway. This will likely require either or both temporary tees or a temporary green. During this time, expect play to be reduced and a lower fee charged.
Cost Cost adjusted for inflation should range from $700,000 to $860,000. We use $775,000 in our projections.
Manitou We looked at two improvement scenarios for Manitou:
1. Scenario 1: Priority Fixes Only – this focuses only on those issues already identified by the County, such as irrigation and bunkers, plus a few other priority items that we identified. Most important of which is new forward tees and an on-course restroom.
2. Scenario 2: Major Renovation – There is a need to rebuild all the infrastructure at Manitou. Such major work provides the opportunity to make significant improvements in the design. This renovation would provide a significant upgrade to the course’s quality. It also includes an expansion of the clubhouse to provide for a full grill operation.
Scenario One: Priority Fixes Only This scenario focuses only on fixing the highest priority items. It does include rebuilding the oldest greens, but not the newer ones. It delays addressing other major infrastructure needs, such as the rest of the greens, tees and fairways. It is highly likely that these would need to be addressed, most certainly within the next twenty years. However, we have delayed them past the next ten years.
Improvements • Irrigation: Complete replacement
• Greens: Rebuilding the push-up greens only
• Tees: New forward tees
• On course restroom added – This can either be a fully plumbed system, costing about $200,000, or a compositing system for around $60,000.
• Fairways: Combine seven and eight
• Bunkers: Rebuilding all bunkers and adding liners.
• Driving Range: Renovate in place.
Proposed Timing Because of the decline in Manitou’s performance, we view it as a priority. Recognizing that the County moves slowly on major renovations, we have the project starting in 2020 with the building of a temporary hole. This is needed as the renovations will be proceeding a hole at a time. The main construction would take place during the 2021 season. The finished product should be ready for opening of the 2022 season.
Construction Impact Because at least eight of the greens are being completely rebuilt, the course will be operating as an awkwardly routed nine-hole course during the construction. Further, as these holes will also be subject to construction, a temporary hole will be needed so that work can be done one hole at-a-time.
Ramsey County Golf Study Capital Improvement Scenarios
Sirius Golf Advisors, LLC 305
Cost Construction costs, adjusted for inflation, are expected to run between $2,500,000 and $3,100,000. We use $2,800,000 in our estimates.
Scenario Two: Major Renovation Scenario Two recognizes the “pay me now then pay me again later” nature of Scenario One and does all the infrastructure repair at one time. This should delay the need for any other significant infrastructure improvements for twenty- to twenty-five years or more. It also maximizes the opportunity presented by Manitou’s favorable location.
At the same time, we propose making improvements to the layout and range that will allow the facility to be repositioned, should that be desired at that time. It certainly will make the course more appealing and improve its profit-making potential. The range is moved, allowing for a modern, larger, and much more enticing practice facility to be built.
We are also including expanding the current clubhouse and adding a grill operation. This will greatly enhance the food and beverage operation and make the course more attractive to a wider market of golfers.
Improvements A complete rebuild of all course assets, including new irrigation, greens, tees and fairways. It also includes rerouting of several holes to take advantage of dramatic elevation changes and other outstanding characteristics of the land.
Not only will the golf course become much more appealing, but it maximizes other revenue streams as the expanded clubhouse will greatly improve food and beverage revenue. A new, modern range that is substantially larger, will not only increase usage among golfers playing the course, but should draw significant usage from practice-only players, as we see currently at Battle Creek.
The new range will require moving the entrance road.
Proposed Timing There are two options to consider as far as construction. The first is to build nine holes at-a-time. This will keep some revenue coming in while the construction is on-going. The second is to close the entire facility while the renovation occurs.
There are good arguments pro- and con- for both methods.
Phased Method
The first option is to do nine holes at a time. The obvious appeal to this is that it allows the facility to remain open throughout the renovation. Unlike with option 1, the nine holes that are open is intact, without needing a temporary hole. Having the facility open does three things. It provides some revenue, it helps retain customers… especially leagues (which have been vital to Manitou’s success), and it helps the operator, who otherwise would have no revenue during this time. (It may require either terminating the existing contract or delaying until it terminates after 2021).
The cons to this method are that it requires restaging, which can increase construction costs on the 2nd nine by 10-20%. Further, it means that the facility will be substandard for at least two years while the renovation takes place.
Ramsey County Golf Study Capital Improvement Scenarios
Sirius Golf Advisors, LLC 306
Closing
The two biggest benefits to doing the renovation all at once are that 1) it decreases the overall cost of the project, and 2) it maximizes the marketing impact of the reopening. As we saw with Keller, a grand reopening is likely to lead to a significant increase in play, at least for that first year.
This would likely be the preferred method if 1) the desire is to reposition the course in the marketplace, and/or 2) a new operator is being brought in and the entire operation is being revitalized.
In our projections, we have assumed that the Phased option is utilized. However, our recommendation is for the second method, if the facility is being repositioned and, especially if a new operator will be involved (particularly if that operator is also contributing to the improvements).
Timing
As Manitou should be the County’s highest priority in terms of need, we have the renovation starting in 2021 (phased approach). If the County elects the closing option, then it makes sense to wait until 2022 to begin construction as the current operating lease expires after 2021.
Construction Impact The impact obviously depends on the construction phasing – 9 holes at a time or doing all 18. In the phased approach, the facility will be a nine-hole course for at least two full years. Under the second option, the facility will be entirely closed for at least a year, and possibly a year-and-a-half.
Cost The cost is not cheap, as we saw with Keller. Of course, we are not talking about building a $6 million new clubhouse, but rather a $400,000 extension to the existing one. But the work to the course is similar. With adjustments for inflation, we anticipate project costs between $6.7 and $9.1 million. In our projections, we assume $7,900,000.
Goodrich In addition to the status quo, we developed two improvement scenarios for Goodrich.
• Scenario 1: Priority Only – only the most pressing items are addressed
• Scenario 2: Modest Renovation – this will be the rebuilding or renovation of all major course components, including irrigation, greens, tees and fairways.
Scenario One: Priority Only As we anticipate repositioning Goodrich as a value facility, the need to make major improvements immediately decreases. In this scenario, we primarily address those items the County has already advanced preliminary plans for, which are to replace irrigation and rebuild the bunkers. Other significant needs remain, primarily greens and tees. But it is anticipated that these could be put off until after 2028.
Improvements • Irrigation: Complete replacement
• Bunkers: Complete rebuild, with liner
• Tees: Add new forward tee

Ramsey County Golf Study Capital Improvement Scenarios
Sirius Golf Advisors, LLC 307
Proposed Timing Because Goodrich is anticipated to be repositioned as a value course, it becomes the lowest priority for significant renovations. In out proposed timetable, a temporary hole is constructed in 2022 to allow for one at a time hole closures the following year. The main renovations then take place in 2023.
Construction Impact Goodrich will be able to remain open throughout the construction process. However, its appeal will be diminished as a temporary hole will need to be utilized for the entire season as construction progresses on a hole-by-hole basis. We anticipate fewer rounds at a lower price point for the year.
Cost The projected cost with inflation is anticipated to be from $2.2 million to $2.7 million. We use $2.4 million in our projections.
Scenario Two: Modest Renovations In this scenario, Goodrich most of the course’s infrastructure is rebuilt in-place, with only minor adjustments that need rerouting. The renovation is not meant to reposition the facility, although some modest price increase can be expected following the renovation.
Improvements This is a complete rebuild of the major components of the course, including
• Irrigation (completely new system)
• Greens (which will be enlarged)
• Bunkers (including adding lining)
• Tees (including new forward tees)
• Some fairway
Proposed Timing The project will be done nine holes at a time, starting in 2024. The second nine would begin in the fall of 2025, with the project completed in 2026. With no expectation of repositioning, a phased approach is likely the preferred choice.
Construction Impact Goodrich will essentially be operating as a nine-hole course for two -years. While it costs 10-20% more for the second nine, when done this way, we felt it was important for two main reasons.
1. Impact on Customers, primarily leagues. If the course is completely closed, the customers will naturally be seeking other places to play. The biggest concern is the leagues. Should they leave, three is a bigger risk that they would not return.
2. Impact on Operator – Unless the improvements are timed to coincide with the end of the operator’s contract, the complete loss of revenue from the facility would have a significant impact on the operator.
Further, it is more likely that the RC Golf system can accommodate the players lost due to the reduction from 18 to 9 holes, than it could all the players.

Ramsey County Golf Study Capital Improvement Scenarios
Sirius Golf Advisors, LLC 308
Cost Anticipated cost for the project, adjusted for inflation, is between $3.9 million and $5.1 million. We use $4.5 million in our projections.
Battle Creek We looked at three improvement scenarios:
• Scenario One: “Elite 9” – the course remains a challenging nine-hole course, but improvements are made to enhance performance and repair priority needs with infrastructure.
• Scenario Two: Par 34 – We reduce the Par from 35 to 34. This will enable us to expand the range, thus maximizing its potential. Will require some rerouting of the course.
• Scenario Three: 18 -holes – We were made aware that there was potentially land available across the street at the Corrections facility that would allow a second nine to be built.
As the range is currently the main profit center at Battle Creek, we looked at various ways of maximizing its utilization by increasing the number of hitting stations. This can be accomplished by either widening the tee area (which would require adjusting the course) or adding a double deck to the existing tee.
When we looked at the preliminary cost for doing a double deck, we felt it is cheaper to widen the range (Scenario Two) or build a second range (Scenario Three) then adding a second deck. Further, parking limitations make it difficult to add any more capacity to the range under Scenario One without expanding parking.
Scenario 1: “Elite Nine” In Scenario One, the facility remains a nine-hole Par 35 course, and the range remains the same size it is now. However, we do make a few improvements. These changes should:
• Improve the golf experience on the golf course
• Improve range performance and experience by replacing tacky targets with target greens
We did look at possibly going to a Par 36, which would have improved its marketability, by lengthening hole 2 to a Par 4. But upon further examination, we viewed this as being impractical as it would require netting along the street, moving the first green, and other factors.
Improvements • Irrigation
o Seal irrigation lake to prevent leaks
o Install new controls to improve efficiency
o Reposition some sprinkler heads to maximize coverage and improve efficiency
o Relocate pump house
• Layout
o Extend 3rd tee back behind the cottonwoods to allow two full shots before crossing pond on this par 5.
o New tee complexes on holes 2, 4, 5 and 9
• Bridges: Repair/replace as needed
• Bunkers: Rebuild in place

Ramsey County Golf Study Capital Improvement Scenarios
Sirius Golf Advisors, LLC 309
• Fairways:
o Widen 5, 9
o Possibly extend hole 2
• Retaining walls
o Four tee
o Five Fairway
• Range
o Add target greens
• Other
o Add more trees
o Expand Parking (this requires moving the practice putting green)
Proposed Timing The improvements can be done at any time. In our projections, we assumed starting in August 2021. The reason for starting in August is to minimize the impact of closing the range. The improvements should be completed by the end of the season, with the facility able to open on time the following year.
Construction Impact The main impact will be in closing the range to make needed range improvements. Most of the other improvements can be made without closing the course. When a hole needs to be closed, a new hole can easily be added by using the existing second green on hole 3 and building temporary tees to create a new hole going from that second green to the main green.
Cost Estimated Cost (2021 dollars) – between $1,575,000 and $1,850,000 (estimate used $1,700,000).
Scenario 2: Par 34 In this option, we place the priority on the range, doubling its size. To accommodate this expansion, the course must be reconfigured into a Par 34. But this also allows for the construction of an extensive short-game area and increased parking capacity.
Improvements • Irrigation
o Seal irrigation lake to prevent leaks
o Install new controls to improve efficiency
o Reposition some sprinkler heads to maximize coverage and improve efficiency
o Relocate pump house
• Bridges: Repair/replace as needed
• Greens – construct two new greens
• Tee Complexes – Requires rebuilding the equivalent of seven and half tee complexes
• Fairways – three fairways rebuilt in place and one relocated
• Cart Path Extensions – 1,000 lineal feet
• Bunkers – reduce number, rebuild as needed

Ramsey County Golf Study Capital Improvement Scenarios
Sirius Golf Advisors, LLC 310
• Retaining Walls – on 4 tee and 5 fairways
• Driving Range
o Extend range tee (doubling its width)
o Add target greens, etc.
o Replace Astroturf tee
o Consider adding covered, heated stalls to extend use and add teaching bays
• Relocate Practice Green and extend parking
• Construct short game area (where existing hole six is).
Proposed Timing Because these changes would have a significant impact on the existing course and range, we felt it important to delay until improvements could be made at Manitou. Our proposed timetable has the construction taking place in 2022. Construction will likely take a full season. However, this timetable may need to be pushed back, depending on what course of action is being taken at Manitou and Goodrich. Ideally, you would not want more than nine holes total taken out of play at any one time. So, if Manitou or Goodrich are being renovated and require going to nine holes during that time, Battle Creek’s renovation should be pushed back.
Construction Impact The entire facility will need to be closed, for most, if not all the season. The range may be able to be kept open through its highest demand times – spring and early summer, before being closed for the rest of the year. It may be possible to keep the course open by constructing temporary holes. But this may extend construction time and increase costs.
Cost Estimated Cost (2022 dollars) – between $2,700,000 and $3,150,000 (estimate used $2,900,000).
Scenario 3: 18 Holes In this scenario, a second nine is built across the street, making Battle Creek a regulation 18-hole course. In such a case, we anticipate the facility is market-positioned between Keller and Manitou – unless the full renovation option is taken at Manitou. In that case, Battle Creek is positioned between Manitou and Goodrich.
There are two possibilities:
• Non-returning Nines, meaning the golfers do not return to the clubhouse after nine holes.
• Returning Nines.
We recommend the returning nines option, necessitating a new clubhouse and range be built on the site of the new nine.
Improvements
Existing Facility
• All the items listed under Scenario 1, above
New Nine
• Tunnel under Lower Afton Road

Ramsey County Golf Study Capital Improvement Scenarios
Sirius Golf Advisors, LLC 311
• New nine-hole regulation golf course
• New 6,000 sf clubhouse
• On Course restroom facility
• New driving range
Proposed Timing We anticipate doing some priority fixes to the existing nine, those that would not impact play, in 2020. Then the construction of the new nine holes would begin in 2021 and is expected to last until mid-summer 2022. At that time, the new nine holes (and range) would open and the existing nine closed for renovations. We anticipate the Grand Opening of the new facility to be in 2024.
Construction Impact As we are doing nine holes at a time, there will always be an unimpeded nine holes and range open throughout the process. This will maximize revenue during the construction period.
Cost The projected cost, after adjusting for inflation, is expected to be between $9 million and $10,650,000. We will use $9.83 million in our projections.
Ramsey County Golf Study Projections
Sirius Golf Advisors, LLC 312
We are limiting the projections to the four main facilities as the others are operating under a full lease, where the County has little influence.
Sirius did 10-year cash flows for each facility and for each of the previously described scenarios, including the “Status Quo.”
Assumptions: The following assumptions were used in our projections:
• Conservative: We believe the projections to be conservative in nature. We fully anticipate better performance under the improvement scenarios than what we show in these projections, if our main recommendations are adopted.
• County Expenses: County expenses are as reported by Parks and Recreation. They do include the amount given to us for Fleet Services, but they do not include depreciation, capital improvements other than those recommended, or administrative salary expenses. We are assuming that the Fleet Services costs include equipment replacement.
• Status Quo Scenarios: Assumed the facilities are operated under the same contracts and in the same manner as currently, with no marketing, same fee structure and two-year fixed pricing, and no capital improvements. We also assumed:
o Where the infrastructure was seen to be declining significantly, maintenance costs are anticipated to go up at a higher rate than inflation, with rounds play starting to decline.
o Where we anticipated a steady decline in play, we assumed that fees would initially be held steady (instead of going up with inflation) and then eventually reduced to try to attract more play.
• All other Scenarios: Assume not only the stated capital improvements for that scenario, but that all our major recommendations are implemented, including:
o Revised contracts: We assume our recommendations regarding contracts are adopted, with the elimination of potential conflicts of interest. See below for discussion.
o Marketing: A combined marketing budget more than $75,000, being managed by a marketing company with golf course expertise.
o Rates: We assume adoption of the recommended rates for 2019. These rates will go up annually by inflation. They will also change depending on the impact of major construction – going down during the construction, then going up upon its completion.
o Market Positioning: Keller is pushed up to a “premium” facility (with F&B fixed) and Goodrich down to a “Value” facility, meeting apparent local demand opportunities.
o Operations: We assume that our recommendations for operations and maintenance are adopted.
o Revised Pricing: More operator influence, not fixed for two years, etc. We are also assuming our recommended fee schedule is adopted.
o Women friendly: Making all the facilities friendlier to women, including:
▪ New forward tees
▪ Heathier Menu

Ramsey County Golf Study Projections
Sirius Golf Advisors, LLC 313
o Course Maintenance (except Manitou): We looked at both continuing with County maintenance (a) or adopting a hybrid contract that included maintenance (b).
o Construction: We take into consideration the impact of construction in progress on performance.
• Inflation: Overall inflation rate of 3%, with higher amounts for payroll.
• Financing: Assuming debt financing is used to finance capital improvement projects, we use a conservative 3.3% interest rate over 20 years.
• Weather: We have no illusions as to projecting weather patterns, other than to know they will vary. To help illustrate the impact of weather fluctuations, we assumed unusually poor weather for 2021 and 2027, and unusually good weather in 2024. All other years assumed average weather conditions.
Detailed Projection tables can be found in Appendix J. In the Appendix, we also show the expected net for the Operators.
Operating Contracts For Goodrich, Keller and Battle Creek, our projections have the contracts being modified as recommended. This means that all revenue is being treated equally. Revenue is defined as the gross revenue less the cost of sales for merchandise and food & beverage.
For simplicity, we used a straight percentage. The percentage we used in our projections was designed so to be revenue neutral to the operator. In other words, the operator would have netted at least as much under our proposed agreement as he did under the old one for 2019. We also assumed that any base payments remain the same.
We further examined the impact of converting to hybrid model for these courses. In these instances, maintenance is included in the contract. While this might have an impact on revenue (presumably positive), we assumed the same performance, but adjusted on the County revenue and expenses based on the hybrid model.
We do assume adoption of this “hybrid” model for Manitou in both improvement models. We set a “breakpoint” of $1,000,000. Up to that amount, the operator receives 90% of the revenue (as defined above). Above that amount, the County receives 80% of the revenue. The purpose of the breakpoint is to give the operator a better chance to recover their operating expenses, which should do by the time the breakpoint is reached. (Keep in mind that maintenance, including equipment replacement, is included as the operator’s responsibility). After the breakpoint, the County gets the lion’s share to recover their investment in capital improvements. But the operator still is getting a strong incentive to perform. Of course, the breakpoint and the amounts of the splits are subject to negotiation. Our breakpoint and splits were chosen as they would result in the early years, with about the same revenue to the operator as under the current agreement.
In all hybrid models, we increased the breakpoint by 3% of the original amount each year. The splits varied by club.
Keller With Keller, as a reminder, we looked at three scenarios:
• Scenario 0: Status Quo – no major changes

Ramsey County Golf Study Projections
Sirius Golf Advisors, LLC 314
• Scenario 1a: Recommended Improvements – Recommended capital improvements, most to correct issues related to construction cut-backs, are implemented in 2021. Contract model is equalized revenue, with still three operators.
• Scenario 1b: Same as above but converting to hybrid model in 2024.
Scenario 0: Status Quo As stated above, the Status Quo scenario for all courses assumes no major changes to the golf facility or to its operations.
Keller’s infrastructure is new, and maintenance practices are excellent. The golf operations are also very well run, with outstanding customer service. The main limiting factors are the food and beverage operation with relation to golf, and, of course, the lack of marketing.
Rounds We anticipate steady rounds performance, with most years in the 29,000 to 30,000 range. With good weather, rounds should reach 31,000 or more (31,299 in 2024 in our projections). Bad weather may cause rounds to dip to 26,500 or so (26,696 in 2021 in our projections).
Revenue With rounds steady, and the same fee structure in place, green fee revenue and overall revenue will both rise mostly as a factor of inflation. We expect green fee revenue to rise slowly, but steadily from $840,000 in 2019 to $1,120,000 in 2028. Over the ten-year period, green fees are expected to total $9,600,000. Over the 10-year period, the average green fee yield (green fee/rounds) is $32.79 ($28.46 in 2019)
Total revenue (including food and beverage), is projected at just under $2,700,000 in 2019; rising to $3,600,000 in 2028. Over 10-years, total revenue should reach close to $31,000,000.
County Revenue Using the same compensation schedules that are in place today, Ramsey County’s share of revenue in 2019 is $1,184,000. This is less than the $1.24 million the county received in 2017 on fewer rounds due to changes made to the contract when it was renewed in 2018. County revenue reaches $1,567,000 in 2028. Over 10 years, it totals $13,550,000.
County Expenses Unfortunately, golf course expenses tend to rise faster than inflation. This is especially true with payroll, but it also is true for other maintenance items, such as fertilizer.
In 2019, the expenses are anticipated to be $1,060,000. Expenses are not as impacted by the weather as revenue, so expenses do not vary as much year-to-year. With inflation being the main factor, expenses

Ramsey County Golf Study Projections
Sirius Golf Advisors, LLC 315
reach $1,475,000 by 2028. Over 10 years, expenses total $12,583,000.
County Cash Flow Cash flow is expected to remain positive, although the trend will be slightly downward as inflation impacts expenses more so than revenue. Poor weather will cause the cash flow to dip close to or beyond the break-even point. We show breaking-even in 2021, and a slight loss ($44,00) in 2027.
Over the 10 years, the total cash flow is projected at $971,104. While this is good, it is not enough to cover the debt service for the 2014 renovations, which we are assuming is around $320,000 per year.
Scenario 1a: Priority Fixes The priority fixes will reduce maintenance expenses slightly, but also help improve the course’s appeal. Meanwhile, repositioning the facility, along with improved food and beverage and good marketing combine to have a positive impact on performance.
The capital improvements are anticipated to take place in 2021. Construction should have a minimal impact on performance that year.
In our projections, we assume the same basic contract situation as exists today, with a separate operator for the food and beverage and the County maintaining the course. We do assume that the current golf operation contract be converted to a revenue equalization model.
Rounds The improvements in food and beverage and the addition of marketing, should have an immediate impact as we project 31,500 rounds in 2019. We project Keller reaches a little over 36,000 rounds in the good weather year of 2024.
Over the 10-year period, rounds should show an upward trend, with 2028 rounds reaching 35,400. Over 10 years, rounds should total around 333,900, an average of 33,400 per year. This represents an improvement of 41,300 or 14.1% over the status quo.
Revenue Green fee revenue in 2019, is projected at $984,108 – or nearly $150,000 more than the status quo. By 2028, green fee revenue reaches $1,440,000. Green fee yield rises from $31.24 in 2019 to $40.57 in 2028. Over 10 years, green fees total $11,950,000, an improvement of $2.36 million (24.6%) over the Status Quo. Green fee revenue is rising faster than rounds due to the repositioning of Keller and the higher fee structure resulting from this move.
Total revenue is projected at a bit over $3 million in 2019. This will rise steadily, reaching $4.4 million in 2028. Over 10 years, total revenue reaches nearly $36,860,000. This represents an increase of $5.9 million,
2019 2020 2021 2022 2023 Total 19-23 Total 24-28 Total 19-28
Status QuoRounds 29,515 29,663 26,696 29,513 29,660 145,047 147,542 292,589
Revenue
Green Fees $839,955 $895,248 $792,935 $941,357 $940,157 $4,409,652 $5,183,298 $9,592,951
Total $2,690,742 $2,816,874 $2,675,422 $2,980,699 $3,041,958 $14,205,695 $16,763,458 $30,969,153
County Revenue $1,184,928 $1,253,199 $1,146,066 $1,318,327 $1,327,490 $6,230,010 $7,324,907 $13,554,917
County Expenses $1,062,376 $1,101,615 $1,142,362 $1,184,678 $1,228,625 $5,719,655 $6,864,158 $12,583,813
County Net $122,551 $151,584 $3,705 $133,649 $98,865 $510,355 $460,749 $971,104
Cash Flow Projections

Ramsey County Golf Study Projections
Sirius Golf Advisors, LLC 316
or 19% over status quo.
County Revenue County revenue is positively impacted by both the course’s performance and the restructuring of the contract. County revenue goes from $1.4 million in 2019 to over $2.1 million in 2028. Over 10 years, county revenue totals $17,400,000, an increase of $3.8 million or 28.3% over the Status Quo.
County Expenses With the improvements in 2021, maintenance expenses do not rise as fast as under the Status Quo. Offsetting this, though, is the anticipated marketing expense (at 2.5% of county revenue). For 2019, expenses total just under $1.1 million. They will increase to $1.5 million by 2028. For the 10-year period, expenses are expected to total $12,900,000, or $299,000 (2.4%) more than under the Status Quo.
County Cash Flow The County should realize $308,000 in 2019, an increase of $186,000 over the Status Quo. The cash flow should improve, reaching $615,000 by 2028. Over 10 years, the County should realize a total positive cash flow of $4.5 million. This is 4.5 times the amount in the Status Quo. The total improvement is $3.53 million or 360% increase.
The improvement costs are expected to total $775,000. Even if this is subtracted, we still have a positive gain of nearly $2.8 million.
The average improvement in cash flow, following the improvements, is $421,000 per year. This would support debt services of $6.1 million at a conservatively estimated 3.3% interest. If the work is not financed, it would take 1.8 years to pay back. The annualized rate of return on the capital improvements (calculated by taking the average cash flow improvement and dividing by the cost of the improvements) is a 54.4%.
Scenario 1b: Hybrid Model This scenario is the same as above, with one big difference. We assume a hybrid model with one operator responsible for not only the golf operations, but course maintenance and food & beverage as well. We assume this takes place in 2024.
2019 2020 2021 2022 2023 Total 19-23 Total 24-28 Total 19-28
RecommendedRounds 31,500 33,000 28,050 33,752 34,820 161,122 172,787 333,909
Revenue
Green Fees $984,108 $1,064,832 $912,566 $1,152,635 $1,227,387 $5,341,528 $6,611,699 $11,953,227
Total $3,018,038 $3,225,468 $2,982,848 $3,506,070 $3,708,693 $16,441,116 $20,422,262 $36,863,378
County Revenue $1,406,247 $1,518,886 $1,348,791 $1,657,896 $1,765,604 $7,697,425 $9,689,729 $17,387,154
County Expenses $1,097,532 $1,139,587 $1,176,081 $1,209,310 $1,255,193 $5,877,704 $7,005,946 $12,883,650
County Net $308,715 $379,300 $172,710 $448,586 $510,411 $1,819,721 $2,683,783 $4,503,504
Cash Flow Projections

Ramsey County Golf Study Projections
Sirius Golf Advisors, LLC 317
In our model, we used an initial breakpoint of $1,840,000 (in 2024). The operator receives 95% of the net revenue below this amount, and the County receives 50% above. County expenses drop to around $10,000.
Under this model, the County should net $3,536,000 in the five year period 2024-28. This is a 31.8% improvement over Scenario 1. It is also $3,075,000 better than the Status Quo. In increases the ROI to 71.3% and the amount of supportable debt to $8 million.
Discussion Keller is in good shape, no matter what. But with the recommended improvements, Keller can perform at a much higher level. There is no question that the improvements will pay for themselves. We recommend full implementation of the Scenario One changes, including the market repositioning, food and beverage, fees, and capital improvements.
We also recommend adopting the Hybrid model, with one operator responsible for all aspects of the operation. Not only does this drastically decrease the County’s risk and expenses, but also significantly improves its net income. But it should improve performance as well as it will provide for better coordination between various aspects of the operation, and more consistent customer service. It will also make it much easier for the County to oversee.
Manitou With Manitou, we looked at two improvement scenarios in addition to the Status Quo. The improvement models assume a switch to the hybrid model.
• Scenario 0: Status Quo – no major changes.
• Scenario 1: Priority Changes – recommended changes to operations, marketing, and contract plus priority capital improvements such as new irrigation, new forward tees, bunker renovation and improvements to the range. Capital improvements start in 2021.
• Scenario 2: Major Renovations – all the improvements in Scenario 1, plus major capital improvements, including total rebuilding of infrastructure, a new routing, and a new range. First nine improvements start in 2021. Completion sometime in 2023.
Scenario 0: Status Quo In the status quo scenario, the downward trend in performance continues. As the decline lengthens, pressure mounts to decrease fees. Maintenance costs escalate as operator struggles to keep course in
Total 19-23 2024 2025 2026 2027 2028 Total 24-28 Total 19-28
Status QuoRounds 145,047 31,299 29,734 29,883 26,895 29,732 147,542 292,589
County Net $510,355 $192,961 $103,507 $116,871 ($43,971) $91,382 $460,749 $971,104
Scenario OneRounds 161,122 36,227 34,415 35,104 31,593 35,448 172,787 333,909
County Net $1,819,721 $592,256 $516,848 $566,115 $393,045 $615,519 $2,683,783 $4,503,504
Hybrid 2024County Net $1,819,721 $578,954 $553,434 $598,104 $520,980 $664,206 $2,915,678 $4,735,399
DifferenceCounty Net Scenario 1 $1,309,367 $399,295 $413,342 $449,244 $437,016 $524,137 $2,223,034 $3,532,400
County Net Hybrid $1,309,367 $510,185 $567,197 $609,153 $673,034 $716,235 $3,075,804 $4,385,170
Keller Cash Flow Projections - County Net
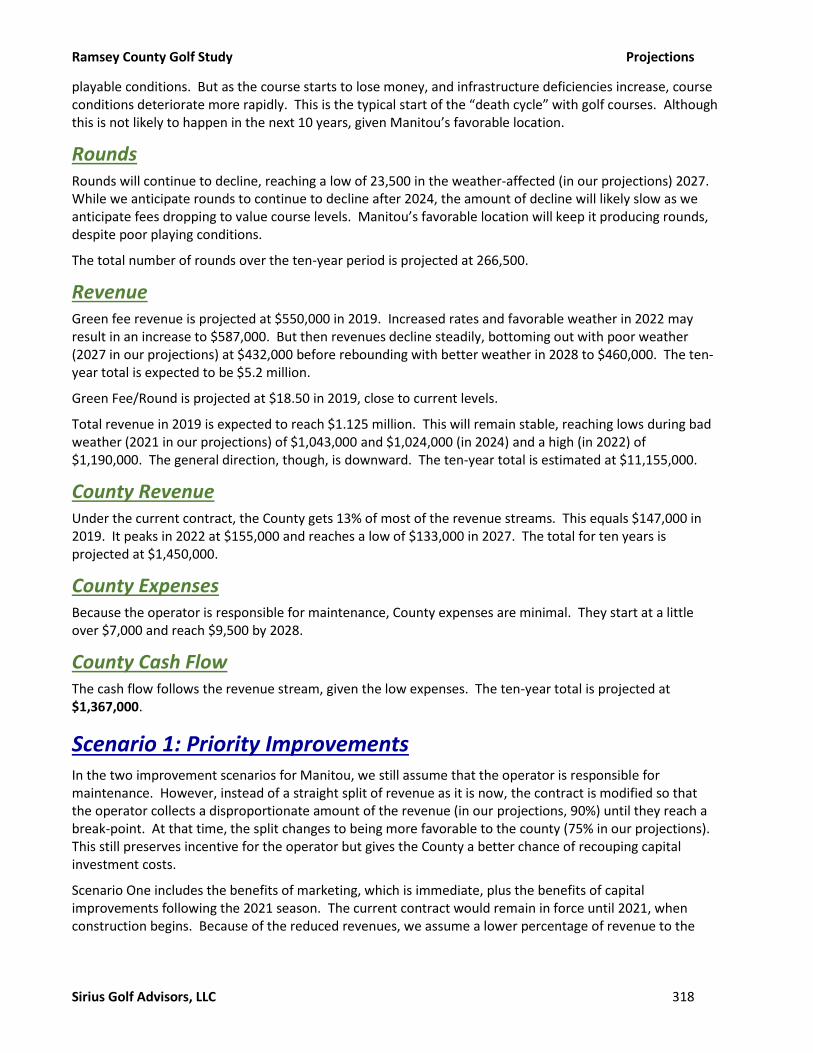
Ramsey County Golf Study Projections
Sirius Golf Advisors, LLC 318
playable conditions. But as the course starts to lose money, and infrastructure deficiencies increase, course conditions deteriorate more rapidly. This is the typical start of the “death cycle” with golf courses. Although this is not likely to happen in the next 10 years, given Manitou’s favorable location.
Rounds Rounds will continue to decline, reaching a low of 23,500 in the weather-affected (in our projections) 2027. While we anticipate rounds to continue to decline after 2024, the amount of decline will likely slow as we anticipate fees dropping to value course levels. Manitou’s favorable location will keep it producing rounds, despite poor playing conditions.
The total number of rounds over the ten-year period is projected at 266,500.
Revenue Green fee revenue is projected at $550,000 in 2019. Increased rates and favorable weather in 2022 may result in an increase to $587,000. But then revenues decline steadily, bottoming out with poor weather (2027 in our projections) at $432,000 before rebounding with better weather in 2028 to $460,000. The ten-year total is expected to be $5.2 million.
Green Fee/Round is projected at $18.50 in 2019, close to current levels.
Total revenue in 2019 is expected to reach $1.125 million. This will remain stable, reaching lows during bad weather (2021 in our projections) of $1,043,000 and $1,024,000 (in 2024) and a high (in 2022) of $1,190,000. The general direction, though, is downward. The ten-year total is estimated at $11,155,000.
County Revenue Under the current contract, the County gets 13% of most of the revenue streams. This equals $147,000 in 2019. It peaks in 2022 at $155,000 and reaches a low of $133,000 in 2027. The total for ten years is projected at $1,450,000.
County Expenses Because the operator is responsible for maintenance, County expenses are minimal. They start at a little over $7,000 and reach $9,500 by 2028.
County Cash Flow The cash flow follows the revenue stream, given the low expenses. The ten-year total is projected at $1,367,000.
Scenario 1: Priority Improvements In the two improvement scenarios for Manitou, we still assume that the operator is responsible for maintenance. However, instead of a straight split of revenue as it is now, the contract is modified so that the operator collects a disproportionate amount of the revenue (in our projections, 90%) until they reach a break-point. At that time, the split changes to being more favorable to the county (75% in our projections). This still preserves incentive for the operator but gives the County a better chance of recouping capital investment costs.
Scenario One includes the benefits of marketing, which is immediate, plus the benefits of capital improvements following the 2021 season. The current contract would remain in force until 2021, when construction begins. Because of the reduced revenues, we assume a lower percentage of revenue to the

Ramsey County Golf Study Projections
Sirius Golf Advisors, LLC 319
County (5%). The hybrid contract would kick in for 2022. We assume that a $100,000 supplement would need to be paid to the operator in 2021 due to construction.
Rounds We project 31,500 rounds in 2019, which is a modest improvement over the Status Quo prediction, but in-line with recent performance. Here, improved marketing helps overcome declining course conditions.
2021’s performance dips to 19,000 due both to poor weather and to construction, as the course will likely be reduced to 9 holes. But, improved weather and buzz about improved course conditions should cause performance to dramatically improve in 2022 to 33,500 (conservative). Rounds continue to improve annually, reaching 35,700 in 2024 (helped by good weather). However, the deterioration of the infrastructure not addressed in 2021, will start to have an impact as rounds drop to the 32,000 round range, then start to decline again in 2027.
Over 10-years, the number of rounds is expected to total 310,500. This is an improvement of 44,000 rounds (16.6%) over the Status Quo.
Revenue Green fee revenue in 2019 is anticipated to be $572,000. This will increase in 2022, following the renovations, to $690,00. It will peak in 2024, helped by assumed good weather, at $784,000, before declining again. The ten-year total is $6,583,000, or $1.4 million better than the status quo – a 26.9% improvement.
Green fee per rounds starts only slightly better than the Status Quo. But it improves to $23.99 by 2028, nearly $5.50 higher than the Status Quo.
Total revenue is projected to go from $1.225 million in 2019 to $1.7 million in 2024, with a big dip to $765,000 in 2021. It will decrease slightly over the next few years. The ten-year total is $14,500,000 or $3,350,000 (30%) more than the Status Quo.
County Revenue With the change in contract, starting in 2020, County revenue increases slightly from $159,500 in 2019 to $169,000 in 2020. It drops to $38,000 in 2021 with the impact of construction, before jumping to $351,000 in 2023. It reaches $420,000 in 2024 before declining. The ten-year total of $2,725,000 is over $1,270,000 (88.0%) more than the Status Quo.
2019 2020 2021 2022 2023 Total 19-23 Total 24-28 Total 19-28
Status QuoRounds 29,850 28,805 25,925 28,100 27,117 139,796 126,558 266,354
Revenue $1,128,061 $1,149,937 $1,043,493 $1,189,282 $1,157,010 $5,667,783 $5,487,366 $11,155,150
County Net $139,409 $142,036 $127,974 $146,697 $142,264 $698,380 $668,804 $1,367,184
Scenario 1 Priority FixesRounds 31,500 32,130 19,000 33,500 34,003 150,133 160,433 310,565
Revenue $1,226,908 $1,298,029 $764,490 $1,489,340 $1,564,518 $6,343,285 $8,160,572 $14,503,858
County Net $148,272 $157,069 ($70,411) $306,187 $334,776 $875,893 $1,598,966 $2,474,859
Difference $8,863 $15,033 ($198,385) $159,490 $192,512 $177,513 $930,162 $1,107,675
Manitou Cash Flow Projections
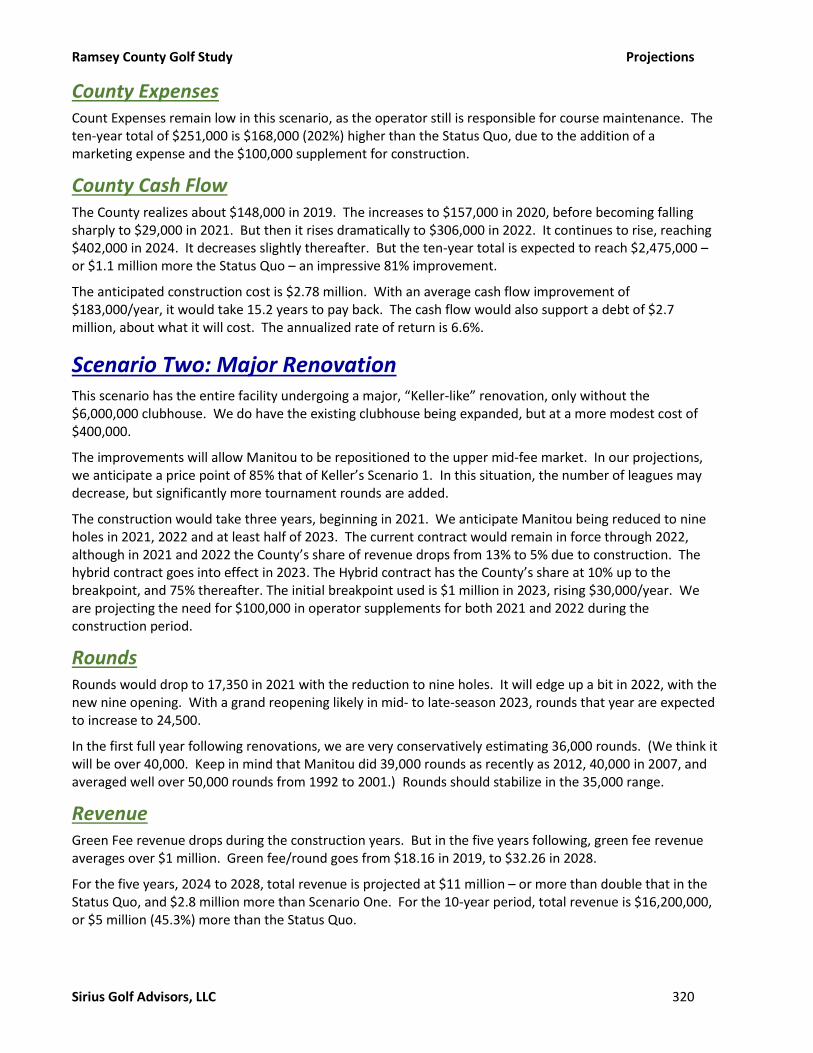
Ramsey County Golf Study Projections
Sirius Golf Advisors, LLC 320
County Expenses Count Expenses remain low in this scenario, as the operator still is responsible for course maintenance. The ten-year total of $251,000 is $168,000 (202%) higher than the Status Quo, due to the addition of a marketing expense and the $100,000 supplement for construction.
County Cash Flow The County realizes about $148,000 in 2019. The increases to $157,000 in 2020, before becoming falling sharply to $29,000 in 2021. But then it rises dramatically to $306,000 in 2022. It continues to rise, reaching $402,000 in 2024. It decreases slightly thereafter. But the ten-year total is expected to reach $2,475,000 – or $1.1 million more the Status Quo – an impressive 81% improvement.
The anticipated construction cost is $2.78 million. With an average cash flow improvement of $183,000/year, it would take 15.2 years to pay back. The cash flow would also support a debt of $2.7 million, about what it will cost. The annualized rate of return is 6.6%.
Scenario Two: Major Renovation This scenario has the entire facility undergoing a major, “Keller-like” renovation, only without the $6,000,000 clubhouse. We do have the existing clubhouse being expanded, but at a more modest cost of $400,000.
The improvements will allow Manitou to be repositioned to the upper mid-fee market. In our projections, we anticipate a price point of 85% that of Keller’s Scenario 1. In this situation, the number of leagues may decrease, but significantly more tournament rounds are added.
The construction would take three years, beginning in 2021. We anticipate Manitou being reduced to nine holes in 2021, 2022 and at least half of 2023. The current contract would remain in force through 2022, although in 2021 and 2022 the County’s share of revenue drops from 13% to 5% due to construction. The hybrid contract goes into effect in 2023. The Hybrid contract has the County’s share at 10% up to the breakpoint, and 75% thereafter. The initial breakpoint used is $1 million in 2023, rising $30,000/year. We are projecting the need for $100,000 in operator supplements for both 2021 and 2022 during the construction period.
Rounds Rounds would drop to 17,350 in 2021 with the reduction to nine holes. It will edge up a bit in 2022, with the new nine opening. With a grand reopening likely in mid- to late-season 2023, rounds that year are expected to increase to 24,500.
In the first full year following renovations, we are very conservatively estimating 36,000 rounds. (We think it will be over 40,000. Keep in mind that Manitou did 39,000 rounds as recently as 2012, 40,000 in 2007, and averaged well over 50,000 rounds from 1992 to 2001.) Rounds should stabilize in the 35,000 range.
Revenue Green Fee revenue drops during the construction years. But in the five years following, green fee revenue averages over $1 million. Green fee/round goes from $18.16 in 2019, to $32.26 in 2028.
For the five years, 2024 to 2028, total revenue is projected at $11 million – or more than double that in the Status Quo, and $2.8 million more than Scenario One. For the 10-year period, total revenue is $16,200,000, or $5 million (45.3%) more than the Status Quo.

Ramsey County Golf Study Projections
Sirius Golf Advisors, LLC 321
County Revenue As with the Status Quo, County Revenue follows closely to the course revenue. The post-renovation total (2024-28) is expected to be $3,500,000 or $2.8 million higher (nearly than four times) than under the Status Quo. The ten-year period, which includes the down construction years, totals $4.1 million, which is still $2.7 million (185.8%) better than the Status Quo.
County Expenses County expenses under this scenario should be essentially the same as under Scenario 1. The only difference is a higher marketing cost as it varies as a function of revenue, and an additional $100,000 in supplement. The ten-year total is $365,500.
County Cash Flow Even in the construction years, the county maintains a positive cash flow (assuming the operator is maintaining the course). When the facility reopens, cash flow jumps from $27,600 in 2022 to $232,000 in 2023 and then to $690,000 in 2024. It further increases to $779,000 in 2028. The ten-year cash flow total of $3,778,000 is $2.4 million higher (176%) than the Status Quo. The cash flow for the final five years is $2,700,000 more than the Status Quo (about four times or 408%), but it is also $1.8 million more than Scenario 1.
For the five-years following the reopening, the County’s cash flow averages $680,000 compared to $133,000 in the Status Quo. In 2028, the difference is $646,000 and is $475,000 more than Scenario 1. This will support a debt of $9,800,000 at 3.3% interest, which is more than the anticipated $8.6 million cost. The annualized rate of return is 7.9%, slightly more than under Scenario 1.
Discussion It should be clear that the Status Quo is not a good option. While the current contract isolates the County from realizing a financial loss with the operation, it is unlikely that similar terms can be negotiated when the contract expires after 2021. It is further unreasonable that a new operator (or even the current one) would renew under similar terms, without the County committing to considerable capital improvements.
One of the big differences between Scenarios 1 and 2, is that with 1, only some of the infrastructure needs are addressed. This means that over the following 10 years (more likely 5), they will have to be addressed –
2019 2020 2021 2022 2023 Total 19-23 Total 24-28 Total 19-28
Status QuoRounds 29,850 28,805 25,925 28,100 27,117 139,796 126,558 266,354
Revenue $1,128,061 $1,149,937 $1,043,493 $1,189,282 $1,157,010 $5,667,783 $5,487,366 $11,155,150
County Net $139,409 $142,036 $127,974 $146,697 $142,264 $698,380 $668,804 $1,367,184
Scenario 1 Priority FixesRounds 31,500 32,130 19,000 33,500 34,003 150,133 160,433 310,565
Revenue $1,226,908 $1,298,029 $764,490 $1,489,340 $1,564,518 $6,343,285 $8,160,572 $14,503,858
County Net $148,272 $157,069 ($70,411) $306,187 $334,776 $875,893 $1,598,966 $2,474,859
Difference $8,863 $15,033 ($198,385) $159,490 $192,512 $177,513 $930,162 $1,107,675
Scenario 2 Major RenovationRounds 31,500 32,130 17,350 19,467 24,500 124,947 173,696 298,643
Revenue $1,226,908 $1,221,428 $601,979 $725,011 $1,408,512 $5,183,839 $11,022,681 $16,206,520
County Net $149,069 $148,154 ($78,183) ($72,385) $232,341 $378,997 $3,399,207 $3,778,205
Difference $9,660 $6,118 ($206,157) ($219,081) $90,078 ($319,382) $2,820,481 $2,501,098
Manitou Cash Flow Projections

Ramsey County Golf Study Projections
Sirius Golf Advisors, LLC 322
at a much greater cost. Further, those improvements would likely lack the marketing punch that doing them all at once will create under Scenario Two.
The market analysis also suggested that Manitou’s demographics were more favorable for golf than Keller’s and the Premium market demand was almost as high. This suggests that repositioning it, following a major renovation, towards the upper end of the mid-fee market (Keller would be in the Premium market) would pay off.
Manitou, following renovations, could rival or even surpass Keller in terms of course quality. But Keller’s history coupled with its wonderful clubhouse, strongly indicate it is the best choice for the premium market and we are very reluctant to recommend RC Golf have two courses in that market. Essentially, under this scenario, Manitou is positioned where Keller is today, while Keller assumes a Premium position.
We recommend implementation of Scenario Two changes, due both to the increased cash flow and to the fact that Scenario One does not fully address the infrastructure needs, but rather delays their fixes. This not only increases costs but diminishes the impact of the Scenario One improvements.
Goodrich Goodrich is in similar position to Manitou in that most of its infrastructure is overdue for replacement. And like Manitou, we have two improvement scenarios – a partial rebuild and a more complete one.
The biggest differences between the two are:
1. With Goodrich, we plan on targeting the Value customer, while Manitou remains in the mid-fee range.
2. Because of that, the planned renovations are designed to reposition the facility in a major way (although a very modest price increase is likely and would not impact rounds performance). As a result,
3. The renovations will be a lot more modest than those suggested for Manitou, with minimal rerouting.
4. We also have two versions of each scenario. One uses the equalized revenue model, with the County still maintaining the course, and the other the Hybrid model where the operator is maintaining the course.
Scenario 0: Status Quo Goodrich has been a rising star over the past three years, seeing a dramatic increase in rounds. But this increase has largely come about due to a big drop in the realized green fee rate… mainly through the participation in the “Public Country Club” program.
However, Goodrich’s infrastructure needs are many. Eventually they will extract a bigger toll – both increasing maintenance costs and eventually a decline in performance.
When rounds begin to decline, there will be increased pressure to reduce rates from current levels. But, as with Manitou, it is likely maintenance practices will be reduced to save money, which will exacerbate the situation and hurt rounds performance and profitability even more.

Ramsey County Golf Study Projections
Sirius Golf Advisors, LLC 323
Rounds We foresee rounds increasing to 32,000 in 2019, before dropping slightly in 2020. Bad weather (assumed in 2021 in our projections) will further drop rounds to 28,200. By now, though, the poor playing conditions will start to have a toll. Rounds are not seen to reach 30,000 again. They are projected to fall as low as 24,600 in a bad weather year (2027 in our projections).
The ten-year total is anticipated at 284,900.
Revenue Green fee revenue/round is already low. In 2019, it is expected to be about the same as now, $17.40. In 2020, the County is due for another rate change. Because performance has been strong, the County will be strongly tempted to increase rates, at least by inflation. Another increase is anticipated in 2022, before declining rounds force rates to stabilize.
Green fee revenue in 2019 is projected to be $556,000. It will max out in the anticipated good weather year (2024) at just under $600,000. A bad weather year, though, coupled with declining conditions, will lead to revenues falling under $500,000 (projected 2027). The ten-year total is expected to be $5,500,000.
Total revenue for 2019 is projected to be $936,000. It peaks in 2024 at $1,036,000. It should stabilize at that point, due mostly to better food & beverage sales making up for some of the decline in green fees. The ten-year total is expected to be $9,685,000.
County Revenue Assuming the current formulas remain intact, the county’s share of the revenue in 2019 is $695,000. Over the ten years, it will vary from a low of $650,000 (2021 bad weather) to a high of $750,000 (2024 great weather). The ten-year total is projected at $7 million.
County Expenses County expenses (most course maintenance) is expected to be $895,000 in 2019. However, maintenance costs will rise at a rate much higher than inflation due to increased payroll costs and the impact of the deteriorating infrastructure. Maintenance costs do not fluctuate very much due to course volume, so even though revenues rise and fall, maintenance cost tend to only go in one direction – up.
We project the expenses to reach $1,270,000 by 2028. The ten-year total would be $10,675,000.
County Cash Flow The County will have a negative cash flow from Goodrich. We expect the loss to be $213,000 in 2019 and reach ($572,500) by 2028. Over the ten-year period, the county will see a loss of $3,674,000.
Scenario One: Priority Fixes Initially, the primary changes are operational, marketing, and a major change in market position achieved by significantly lowering the fee structure. This will allow the facility to survive while the capital improvements are made at Manitou. (We strongly recommend against major renovations occurring simultaneously at the two facilities).
As with Scenario One for Manitou, we anticipate needing a temporary hole to allow for 18-holes of play during the construction. The temporary hole is expected to be built in 2022, without impacting play. The renovation would occur in 2023. Again, the main needs addressed are confined primarily to irrigation, bunkers and new forward tees.
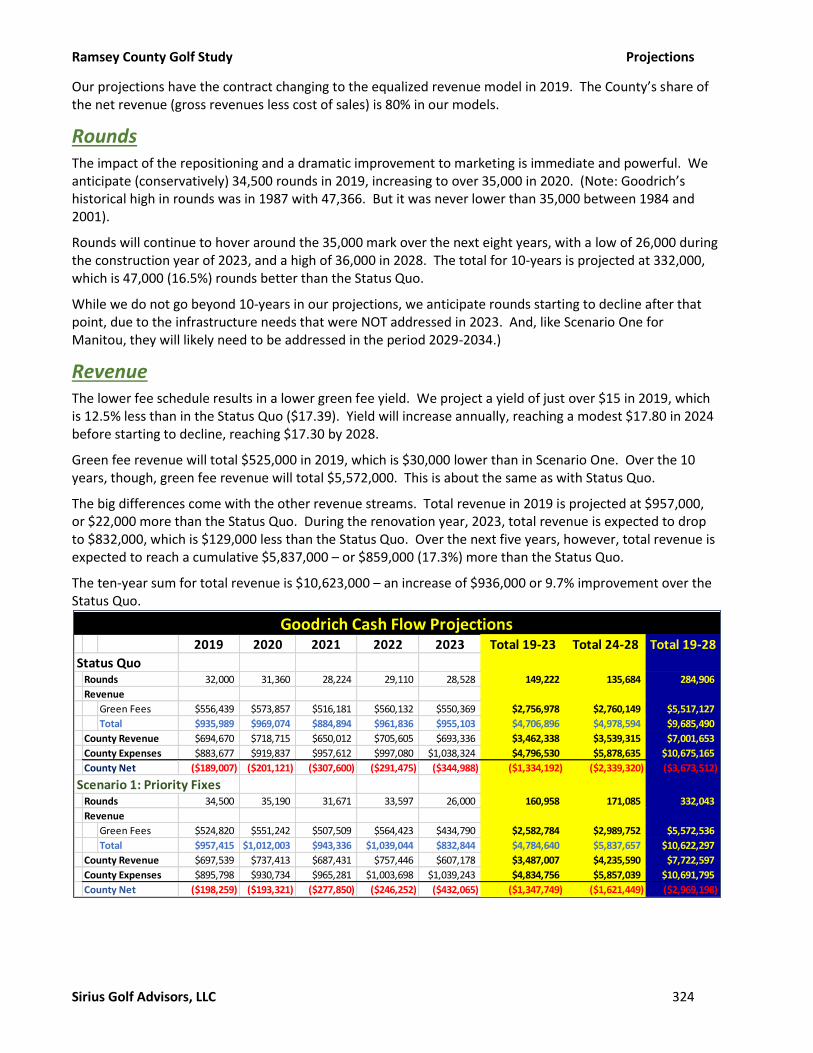
Ramsey County Golf Study Projections
Sirius Golf Advisors, LLC 324
Our projections have the contract changing to the equalized revenue model in 2019. The County’s share of the net revenue (gross revenues less cost of sales) is 80% in our models.
Rounds The impact of the repositioning and a dramatic improvement to marketing is immediate and powerful. We anticipate (conservatively) 34,500 rounds in 2019, increasing to over 35,000 in 2020. (Note: Goodrich’s historical high in rounds was in 1987 with 47,366. But it was never lower than 35,000 between 1984 and 2001).
Rounds will continue to hover around the 35,000 mark over the next eight years, with a low of 26,000 during the construction year of 2023, and a high of 36,000 in 2028. The total for 10-years is projected at 332,000, which is 47,000 (16.5%) rounds better than the Status Quo.
While we do not go beyond 10-years in our projections, we anticipate rounds starting to decline after that point, due to the infrastructure needs that were NOT addressed in 2023. And, like Scenario One for Manitou, they will likely need to be addressed in the period 2029-2034.)
Revenue The lower fee schedule results in a lower green fee yield. We project a yield of just over $15 in 2019, which is 12.5% less than in the Status Quo ($17.39). Yield will increase annually, reaching a modest $17.80 in 2024 before starting to decline, reaching $17.30 by 2028.
Green fee revenue will total $525,000 in 2019, which is $30,000 lower than in Scenario One. Over the 10 years, though, green fee revenue will total $5,572,000. This is about the same as with Status Quo.
The big differences come with the other revenue streams. Total revenue in 2019 is projected at $957,000, or $22,000 more than the Status Quo. During the renovation year, 2023, total revenue is expected to drop to $832,000, which is $129,000 less than the Status Quo. Over the next five years, however, total revenue is expected to reach a cumulative $5,837,000 – or $859,000 (17.3%) more than the Status Quo.
The ten-year sum for total revenue is $10,623,000 – an increase of $936,000 or 9.7% improvement over the Status Quo.
2019 2020 2021 2022 2023 Total 19-23 Total 24-28 Total 19-28
Status QuoRounds 32,000 31,360 28,224 29,110 28,528 149,222 135,684 284,906
Revenue
Green Fees $556,439 $573,857 $516,181 $560,132 $550,369 $2,756,978 $2,760,149 $5,517,127
Total $935,989 $969,074 $884,894 $961,836 $955,103 $4,706,896 $4,978,594 $9,685,490
County Revenue $694,670 $718,715 $650,012 $705,605 $693,336 $3,462,338 $3,539,315 $7,001,653
County Expenses $883,677 $919,837 $957,612 $997,080 $1,038,324 $4,796,530 $5,878,635 $10,675,165
County Net ($189,007) ($201,121) ($307,600) ($291,475) ($344,988) ($1,334,192) ($2,339,320) ($3,673,512)
Scenario 1: Priority FixesRounds 34,500 35,190 31,671 33,597 26,000 160,958 171,085 332,043
Revenue
Green Fees $524,820 $551,242 $507,509 $564,423 $434,790 $2,582,784 $2,989,752 $5,572,536
Total $957,415 $1,012,003 $943,336 $1,039,044 $832,844 $4,784,640 $5,837,657 $10,622,297
County Revenue $697,539 $737,413 $687,431 $757,446 $607,178 $3,487,007 $4,235,590 $7,722,597
County Expenses $895,798 $930,734 $965,281 $1,003,698 $1,039,243 $4,834,756 $5,857,039 $10,691,795
County Net ($198,259) ($193,321) ($277,850) ($246,252) ($432,065) ($1,347,749) ($1,621,449) ($2,969,198)
Goodrich Cash Flow Projections

Ramsey County Golf Study Projections
Sirius Golf Advisors, LLC 325
County Revenue County revenue for 2019 is projected at $697,000, a slight decrease of $2,900 over the Status Quo. The decrease is more than made up the next year, when county revenue should be $18,000 more than Status Quo. County revenue will be substantially less ($122,000) during the construction year of 2023. From that point on, County revenue surges. For 10-years the County’s revenue totals $7,720,000, an increase of $720,000 (10.3%) over the Status Quo.
County Expenses County expenses do increase in this model, due both to inflation and the addition of marketing expense. But the increase is only slight.
Over the ten years, expenses are expected to reach $1,264,000 in 2028 and total $10,692,000. This is just $16,000 more than the Status Quo model.
County Cash Flow County’s cash flow remains negative throughout the 10-years in this scenario. However, except for in 2019 and the construction year of 2023, it is better than under the Status Quo. The total loss over 10 years is $2,969,000, representing a 19.2% improvement over the Status Quo.
The average improvement in cash flow in the five years following renovation is $143,000. At that rate, the anticipate $2.45 million construction cost would be paid back in 17.1 years. If the cash flow is used to finance debt, it would support a bond of $2.1 million, which is less than the cost of construction. The annualized return on investment (ROI) is 5.8%.
Scenario One A: Hybrid This uses the same assumptions and revenue streams as above. However, the contract is changed in 2020 to a Hybrid model, with the operator taking over the maintenance. We anticipate a breakpoint initially of $850,000, below which the County gets 5% of the net revenue and above which it gets 50%.
The difference is immediate and dramatic. In the first year, 2020, the County goes from $193,000 loss under Scenario One to a net profit of $63,000 using the Hybrid model. The only year from that point forward where the County shows a loss is 2023, the construction year, where we show the County providing a subsidy of $100,000 to the operator to make up for the loss in revenue.
Over the 10-year period, the Hybrid model shows the County having a positive NOI of just under $1 million ($987,000), which is $4.66 million better than the Status Quo and about $4 million better than the Equalized Revenue model.
Total 19-23 2024 2025 2026 2027 2028 Total 24-28 Total 19-28
Status QuoCounty Net ($1,334,192) ($330,570) ($402,380) ($462,549) ($571,355) ($572,466) ($2,339,320) ($3,673,512)
Scenario 1: Priority FixesCounty Net ($1,347,749) ($256,363) ($338,074) ($286,143) ($390,600) ($350,269) ($1,621,449) ($2,969,198)
Hybrid 2020County Revenue $935,204 $128,264 $103,138 $163,291 $126,086 $181,278 $702,057 $1,637,261
County Expenses $1,034,121 $12,240 $11,738 $13,802 $12,953 $14,883 $65,615 $1,099,736
County Net ($98,918) $116,024 $91,401 $149,490 $113,133 $166,395 $636,442 $537,525
DifferenceCounty Net ($13,557) $74,207 $64,306 $176,406 $180,755 $222,197 $717,871 $704,314
County Net Hybrid $1,235,274 $446,594 $493,781 $612,039 $684,488 $738,860 $2,975,763 $4,211,037
Goodrich Cash Flow Projections

Ramsey County Golf Study Projections
Sirius Golf Advisors, LLC 326
Scenario Two: Modest Renovation In this scenario, most major infrastructure needs are addressed. This will result in a golf course that plays like a new one.
However, because there is a strong need within the county for an affordable (value) golf course, the renovations are not designed to reposition the golf course. While a modest price increase is anticipated, it should not adversely affect rounds play. Instead, the dramatically improved conditions should result in the best rounds play performance in 20 years.
As noted above, because we recommend that Goodrich become a value facility, and because we strongly believe that Manitou and Goodrich should not be renovated at the same time, we anticipate the construction to begin in 2024 and be completed by 2026. In both 2024 and 2025, Goodrich is reduced to 9 holes.
Until the renovation starts, this model will follow that of Scenario One above. When the facility reopens, County’s share of the revenue increases to 83%.
Rounds Until 2023, the rounds (and revenue) are the same as with Scenario One. Rounds drop dramatically in 2024, as the facility goes nine holes. However, we anticipate strong nine-hole play, with total rounds being 21,157 in 2024 and 20,100 in 2025.
The renovated course should open with a bang, reaching 37,000 rounds in 2026 and again in 2028. Following this 10-year period, we anticipate rounds continuing to grow, likely reaching the 40,000 mark by 2030 or 31.
This model has 108,538 rounds in the three years following renovations. This compares to 104,640 for the same period in Scenario 1 and just 78,441 under Status Quo.
The ten-year total is 332,000 rounds, or 47,000 (16.5%) more than the Status Quo, despite being just nine holes for two years.
Revenue We anticipate a $2 increase in green fee yield following renovations. This will result in $2,334,000 in green fee revenues over the three years 2026-28, with all three years being over $700,000 and 2028 over $800,000. The three-year total compares to $1.81 million under Scenario 1 and $1.6 million under Status Quo.
The difference in total revenue is even more dramatic. In this scenario, the three-year period produces $4.35 million. On the other hand, Scenario One produced $3.6 million and the Status Quo just $2.9 million.
County Revenue There is a huge, $1.2 million difference in the revenue the county receives over the last three years (26-28) in this model compared to the Status Quo. And there is nearly $500,000 difference between it and Scenario One.
Over the ten-year period, we expect County revenue to be $7.7 million. This is $870,000 (9%) more than Status Quo. There was over $600,000 negative difference during the two years of construction.
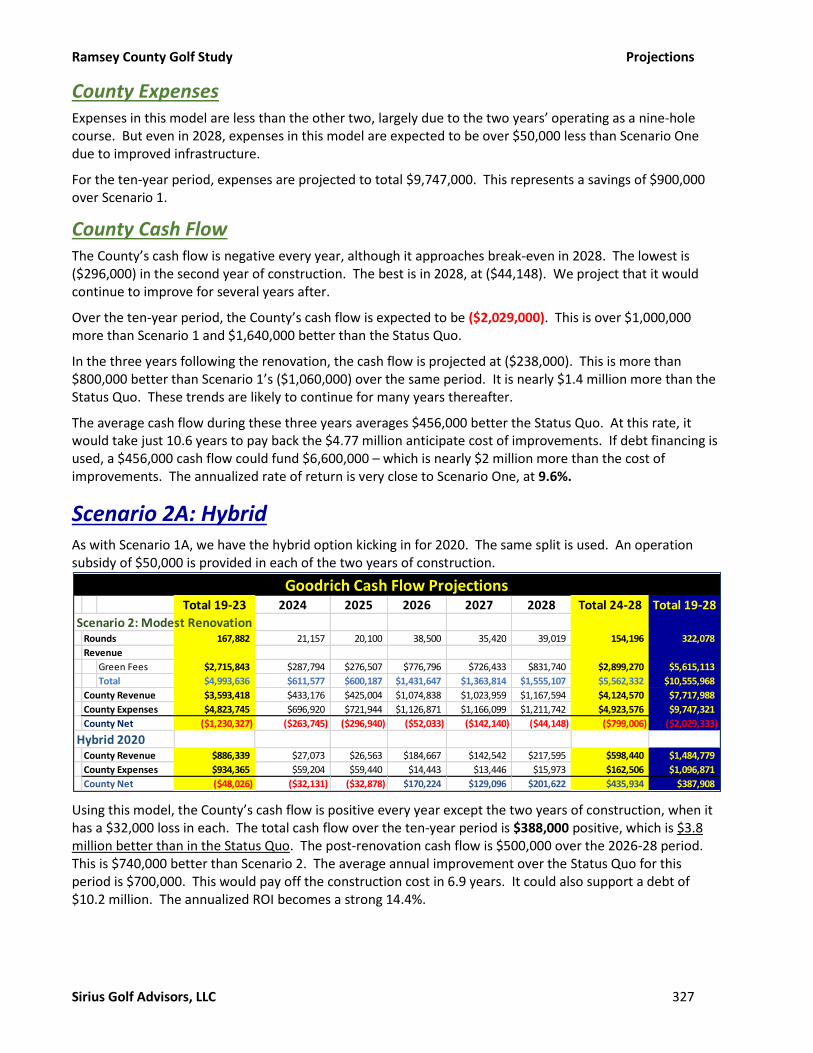
Ramsey County Golf Study Projections
Sirius Golf Advisors, LLC 327
County Expenses Expenses in this model are less than the other two, largely due to the two years’ operating as a nine-hole course. But even in 2028, expenses in this model are expected to be over $50,000 less than Scenario One due to improved infrastructure.
For the ten-year period, expenses are projected to total $9,747,000. This represents a savings of $900,000 over Scenario 1.
County Cash Flow The County’s cash flow is negative every year, although it approaches break-even in 2028. The lowest is ($296,000) in the second year of construction. The best is in 2028, at ($44,148). We project that it would continue to improve for several years after.
Over the ten-year period, the County’s cash flow is expected to be ($2,029,000). This is over $1,000,000 more than Scenario 1 and $1,640,000 better than the Status Quo.
In the three years following the renovation, the cash flow is projected at ($238,000). This is more than $800,000 better than Scenario 1’s ($1,060,000) over the same period. It is nearly $1.4 million more than the Status Quo. These trends are likely to continue for many years thereafter.
The average cash flow during these three years averages $456,000 better the Status Quo. At this rate, it would take just 10.6 years to pay back the $4.77 million anticipate cost of improvements. If debt financing is used, a $456,000 cash flow could fund $6,600,000 – which is nearly $2 million more than the cost of improvements. The annualized rate of return is very close to Scenario One, at 9.6%.
Scenario 2A: Hybrid As with Scenario 1A, we have the hybrid option kicking in for 2020. The same split is used. An operation subsidy of $50,000 is provided in each of the two years of construction.
Using this model, the County’s cash flow is positive every year except the two years of construction, when it has a $32,000 loss in each. The total cash flow over the ten-year period is $388,000 positive, which is $3.8 million better than in the Status Quo. The post-renovation cash flow is $500,000 over the 2026-28 period. This is $740,000 better than Scenario 2. The average annual improvement over the Status Quo for this period is $700,000. This would pay off the construction cost in 6.9 years. It could also support a debt of $10.2 million. The annualized ROI becomes a strong 14.4%.
Total 19-23 2024 2025 2026 2027 2028 Total 24-28 Total 19-28
Scenario 2: Modest RenovationRounds 167,882 21,157 20,100 38,500 35,420 39,019 154,196 322,078
Revenue
Green Fees $2,715,843 $287,794 $276,507 $776,796 $726,433 $831,740 $2,899,270 $5,615,113
Total $4,993,636 $611,577 $600,187 $1,431,647 $1,363,814 $1,555,107 $5,562,332 $10,555,968
County Revenue $3,593,418 $433,176 $425,004 $1,074,838 $1,023,959 $1,167,594 $4,124,570 $7,717,988
County Expenses $4,823,745 $696,920 $721,944 $1,126,871 $1,166,099 $1,211,742 $4,923,576 $9,747,321
County Net ($1,230,327) ($263,745) ($296,940) ($52,033) ($142,140) ($44,148) ($799,006) ($2,029,333)
Hybrid 2020County Revenue $886,339 $27,073 $26,563 $184,667 $142,542 $217,595 $598,440 $1,484,779
County Expenses $934,365 $59,204 $59,440 $14,443 $13,446 $15,973 $162,506 $1,096,871
County Net ($48,026) ($32,131) ($32,878) $170,224 $129,096 $201,622 $435,934 $387,908
Goodrich Cash Flow Projections
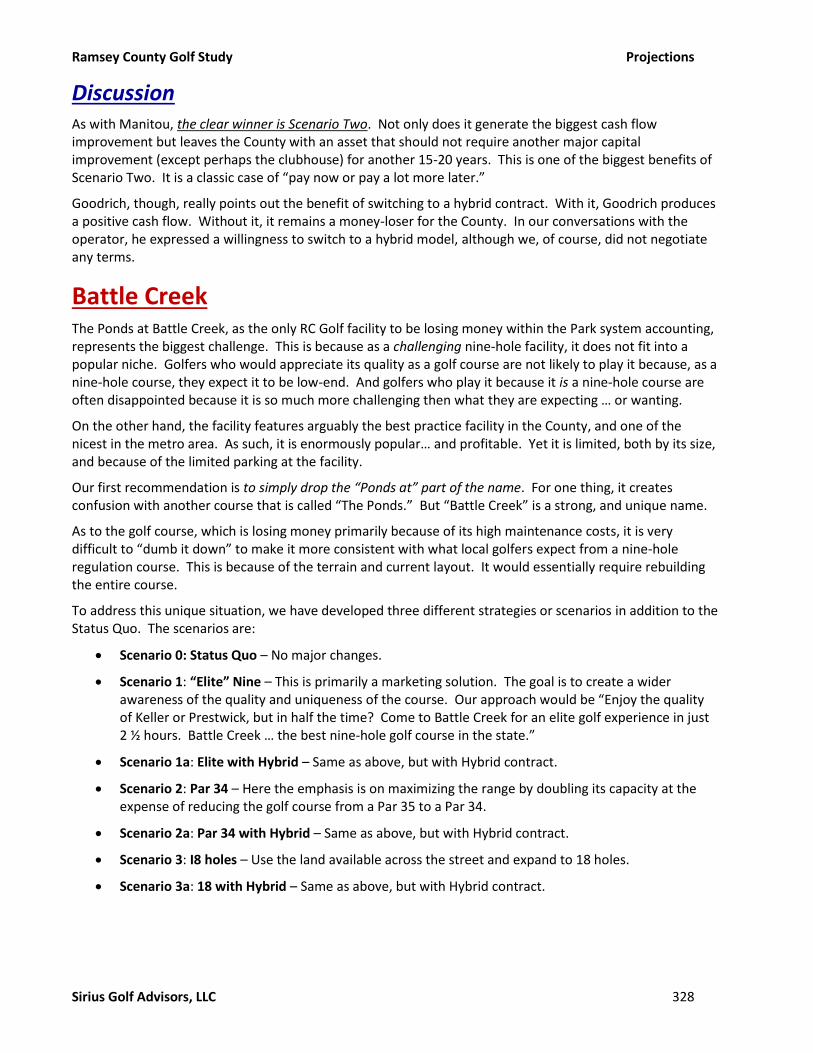
Ramsey County Golf Study Projections
Sirius Golf Advisors, LLC 328
Discussion As with Manitou, the clear winner is Scenario Two. Not only does it generate the biggest cash flow improvement but leaves the County with an asset that should not require another major capital improvement (except perhaps the clubhouse) for another 15-20 years. This is one of the biggest benefits of Scenario Two. It is a classic case of “pay now or pay a lot more later.”
Goodrich, though, really points out the benefit of switching to a hybrid contract. With it, Goodrich produces a positive cash flow. Without it, it remains a money-loser for the County. In our conversations with the operator, he expressed a willingness to switch to a hybrid model, although we, of course, did not negotiate any terms.
Battle Creek The Ponds at Battle Creek, as the only RC Golf facility to be losing money within the Park system accounting, represents the biggest challenge. This is because as a challenging nine-hole facility, it does not fit into a popular niche. Golfers who would appreciate its quality as a golf course are not likely to play it because, as a nine-hole course, they expect it to be low-end. And golfers who play it because it is a nine-hole course are often disappointed because it is so much more challenging then what they are expecting … or wanting.
On the other hand, the facility features arguably the best practice facility in the County, and one of the nicest in the metro area. As such, it is enormously popular… and profitable. Yet it is limited, both by its size, and because of the limited parking at the facility.
Our first recommendation is to simply drop the “Ponds at” part of the name. For one thing, it creates confusion with another course that is called “The Ponds.” But “Battle Creek” is a strong, and unique name.
As to the golf course, which is losing money primarily because of its high maintenance costs, it is very difficult to “dumb it down” to make it more consistent with what local golfers expect from a nine-hole regulation course. This is because of the terrain and current layout. It would essentially require rebuilding the entire course.
To address this unique situation, we have developed three different strategies or scenarios in addition to the Status Quo. The scenarios are:
• Scenario 0: Status Quo – No major changes.
• Scenario 1: “Elite” Nine – This is primarily a marketing solution. The goal is to create a wider awareness of the quality and uniqueness of the course. Our approach would be “Enjoy the quality of Keller or Prestwick, but in half the time? Come to Battle Creek for an elite golf experience in just 2 ½ hours. Battle Creek … the best nine-hole golf course in the state.”
• Scenario 1a: Elite with Hybrid – Same as above, but with Hybrid contract.
• Scenario 2: Par 34 – Here the emphasis is on maximizing the range by doubling its capacity at the expense of reducing the golf course from a Par 35 to a Par 34.
• Scenario 2a: Par 34 with Hybrid – Same as above, but with Hybrid contract.
• Scenario 3: I8 holes – Use the land available across the street and expand to 18 holes.
• Scenario 3a: 18 with Hybrid – Same as above, but with Hybrid contract.

Ramsey County Golf Study Projections
Sirius Golf Advisors, LLC 329
Scenario 0: Status Quo Even though Battle Creek is the newest of RC Golf’s facilities, it is still 14 years old. So, over the next ten years, most of the course’s infrastructure will reach and exceed its life expectancy. Further, since the facility is currently losing money, keeping things the same would only likely continue this trend.
Play should continue at current levels, at least through 2024. However, the age of the course will start to have an impact on performance… either with a significant increase in maintenance costs and/or deterioration of course conditions, leading to fewer rounds.
It is important to note that, while we do not include any capital improvements in this scenario, some are likely to be required. There is some concern about the safety of the bridges, which should be examined by a structural engineer.
Rounds Rounds for 2019 are projected to be 18,150. Rounds should stay at this level, with perhaps a slight upward trend, through 2024. But then they are likely to start to decrease (unless a lot more money is put into maintenance to counter the decline in infrastructure). Over the ten-year period, rounds are expected to be 187,420.
Revenue Green fee revenue for 2019 is anticipated to be a little over $200,000. We do not foresee it going below this mark, except for one year (2021 in our projections) due to unusually bad weather. Fee increases due to inflation, will help keep it above $200,000. We expect it to stay in the $200,000 to $250,000 range. Over 10 years, we project a total of $2.26 million in green fee revenue.
Green fee yield for 2019 should be around $11.14. Increases in fees due to inflation, will cause this to rise over the 10-year period, reaching $14.63 by 2028.
Total revenue for 2019 is anticipated to be $599,000. Total revenue will increase to $738,000 by 2028. Over 10 years, revenue is projected to total $6,736,000.
County Revenue With the current compensation model in place, County Revenue for 2019 calculates to be $407,000. This will increase over time to $499,000 to 2028. For the 10-year period, county revenue is anticipated to total $4,570,000.
County Expenses As noted, maintenance costs will likely exceed price inflation. We project $715,000 for 2019 and a total of $8,541,000 for the 10-year period. These figures include Fleet.
County Cash Flow The course will continue to lose money throughout the 10-year period. The Net Loss for 2019 projects to be ($308,000). This loss will increase, reaching ($528,000) by 2028. Over the 10-year period, the total loss will reach ($3,971,000).
Scenario 1: “Elite” Nine In this scenario, the biggest changes are with regards to marketing, fee structure and the contract. The fee structure is increased in this scenario, as golfers, like most consumers, associate price with quality. Thus, to

Ramsey County Golf Study Projections
Sirius Golf Advisors, LLC 330
drive home the point that this is an elite nine-hole course, the fee structure needs to consistent with the image we are trying to project. Priority improvements are made in 2021, which should boost performance. The addition of target greens to the practice range should further heighten its appeal. The contract is changed to one equalizing revenue.
Rounds The marketing changes have an immediate impact, with 19,500 rounds projected for 2019. We see 20,000 rounds as capacity with the current parking constraints. Construction in 2021 will limit rounds to 16,000. With expanded parking, capacity should improve to 22,000 (more in good weather years), which we expect to reach the year following renovations (2022). Rounds will peak in 2024 (assumed good weather year) at 22,000. For the 10 years, the total number of rounds will be 200,000. This represents an improvement of nearly 24,000 rounds over Status Quo.
Revenue With the new pricing structure, green fee yield in 2019 is projected to be $12.90, or $1.76 more than with the Status Quo. Another jump should occur in 2022, following the renovations, when it reaches $14.88. With inflation, it reaches $17.45 by 2028.
Green fee revenue is projected at $249,000 and total revenue at $720,000 for 2019. These will reach $356,000 and $1,063,000, respectively, by 2028. This is $109,000 more in green fee revenue and $325,000 in total revenue than under the Status Quo. For the 10-year period, green fees total $3,086,000 – an increase of $827,000 or 41.5%. Total revenue is expected to increase by $2,163,000 (38.3%) to $8,900,000.
County Revenue County revenue would be $491,000 in 2019. It then falls to $447,000 in 2020, with the construction. But then it jumps to $527,000 the following year. County revenue would increase to $726,000 by 2028. Over the ten-year period, County revenue is expected to total $6,075,000. This represents a 39.6% improvement or $1.5 million, over the Status Quo.
County Expenses County expenses in 2019 are projected at $750,000. This will increase, mostly due to inflation, to $1,038,000 in 2028. Over 10 years, expenses will total over $8.87 million.
County Cash Flow We expect the cash flow to be negative every year, except for the construction year. It will peak in the good weather year (assumed 2024) at ($225,000). Over ten years, the total projects to a total loss of ($2,796,000). This is $1.1 million better than in the status quo.
Construction costs are estimated at $1.61 million. With an expected average improvement in cash flow of $148,000 per year, the improvements would pay back in 10.8 years. The ROI is 9.2%. The cash flow improvement could support a debt of $2.2 million.

Ramsey County Golf Study Projections
Sirius Golf Advisors, LLC 331
Discussion This is clearly superior to doing nothing, even though it is a bit of a gamble. We are assuming that golfers who desire playing nicer courses will be open to playing a nine-hole course if they are assured the experience is comparable to what they have on their preferred 18-hole course.
If it does not work, nothing in this scenario would preclude from County from implementing Scenario 2 or 3 down the road. Most of the capital improvements shown in this scenario are used in those as well.
While we did not include expanding the parking lot in this scenario, we do recommend considering it to be included. In this case, the practice putting green is relocated, allowing for up to 36 additional parking spots to be in front of the clubhouse. This will permit greater utilization of the practice facility and golf course. Estimated cost is under $200,000.
Scenario 1a: Elite with Hybrid As with Goodrich, we have the Hybrid model taking effect in 2020. As this is a construction year, we are adding a projected $60,000 subsidy. The breakpoint starts at $650,000 and increases by $19,500 each year. The County’s share is 5% below the breakpoint and 50% above. Again, these splits were calculated to be revenue neutral to the operator based on current revenue but are subject to negotiation.
With the Hybrid model, the County’s expenses drop to around $10,000. As a result, it realizes a profit every year, except for 2020, when it has a $40,000 loss. Over the 10-year period, the County’s NOI totals $207,958. But over the last five years, it is $368,550. This is a $2.6 million improvement over the Status Quo.
With the Hybrid model, the average annual improvement, after construction, is $494,000 over the Status Quo. This means the construction cost of $1.67 million (including the subsidy) would be paid back in 3.38 years. If financed, the cash flow improvement could support a debt of $7.1 million. The ROI is a very strong
2019 2020 2021 2022 2023 Total 19-23 Total 24-28 Total 19-28
Status QuoRounds 18,150 18,241 16,417 18,149 18,239 89,195 87,420 176,615
Revenue
Green Fees $202,188 $215,540 $190,205 $226,411 $225,937 $1,060,281 $1,198,418 $2,258,698
Total $598,674 $629,173 $574,054 $663,928 $676,458 $3,142,288 $3,594,146 $6,736,434
County Revenue $407,271 $428,877 $391,027 $451,355 $457,287 $2,135,816 $2,434,362 $4,570,177
County Expenses $714,905 $740,911 $767,902 $795,917 $824,996 $3,844,630 $4,696,420 $8,541,050
County Net ($307,635) ($312,034) ($376,875) ($344,561) ($367,709) ($1,708,814) ($2,262,058) ($3,970,873)
Scenario 1: "Elite" 9Rounds 19,500 17,200 21,000 20,875 20,458 99,033 103,252 202,284
Revenue
Green Fees $249,419 $220,302 $299,722 $309,340 $310,789 $1,389,571 $1,696,272 $3,085,843
Total $720,818 $657,425 $782,930 $877,553 $889,858 $3,928,585 $4,971,121 $8,899,705
County Revenue $491,232 $447,972 $529,014 $600,105 $608,497 $2,676,820 $3,398,686 $6,075,507
County Expenses $750,185 $776,317 $805,960 $836,470 $866,834 $4,035,767 $4,836,179 $8,871,946
County Net ($258,953) ($328,345) ($276,946) ($236,366) ($258,337) ($1,358,947) ($1,437,492) ($2,796,439)
Battle Creek Cash Flow Projections

Ramsey County Golf Study Projections
Sirius Golf Advisors, LLC 332
29.6%.
Scenario 2: Par 34 The range becomes the priority in this scenario, as both its capacity is increased as is its appeal. But this comes at the cost of the golf course, which is reduced to a Par 34.
Scaled-down priority improvements are made in 2020. However, the main improvements are slated for 2022. The improvements are expected to require the course to be closed, although it may be possible to create temporary holes and continue to operate the course. The range may be able to open later in the season.
The emphasis on the practice facility is three-fold. First, the range capacity is doubled. Second, the range’s appeal is greatly enhanced with the addition of target greens. And third, the addition of a high-quality short-game area adds a new revenue source.
Unfortunately, this comes at the cost of the golf course, which is reduced to a Par 34. While this may not seem like a big deal to the non-golfer, it is a big deal for golfers. Golf is very traditional. Once you go beyond the Par 70-72 range (Par 35 or 36 for nine holes), a course is seen as being sub-standard and performance declines dramatically. We see strong evidence of this in the MSP area, where non-regulation courses make up two-thirds of the course closings, but less than a third of the total number of courses.
The exception to this rule is Dwan Golf Course, which is a municipal golf course for the City of Bloomington. It is a high-performing 18-hole Par 68 golf course.
Still, the perception of Par 68 and less is that they are of lower quality than regulation courses, and thus less desirable for better golfers. Therefore, this would further handicap Battle Creek in that it not only has to overcome being nine holes, but also overcome having less than a Par 35.
This problem can be overcome with stronger marketing. Ironically, the improved range performance can help drive more play to the course (it is normally the other way around.)
Rounds Performance for this scenario (and Scenario 3) is the same as Scenario One in 2019. Because the improvements in 2020 are much less evasive in this scenario than in the previous one, rounds are higher (but not as high as in 2019). However, we anticipate the course being closed for all of 2022 as the conversion is being made.
Rounds will return to near 2019 levels, when it reopens… mainly due to the anticipation. But we do not believe it will prove to be as popular as remaining a Par 35. Rounds in this scenario are expected to be 94,000 total in years 2024-28, which is 10,000 rounds better than the Status Quo, but 9,000 less than the Elite 9 option.
2019 2020 2021 2022 2023 Total 19-23 Total 24-28 Total 19-28
Status QuoRounds 18,150 18,241 16,417 18,149 18,239 89,195 87,420 176,615
County Net ($307,635) ($312,034) ($376,875) ($344,561) ($367,709) ($1,708,814) ($2,262,058) ($3,970,873)
Scenario 1: "Elite" 9Rounds 19,500 17,200 21,000 20,875 20,458 99,033 103,252 202,284
County Net ($258,953) ($328,345) ($276,946) ($236,366) ($258,337) ($1,358,947) ($1,437,492) ($2,796,439)
Hybrid 2020County Revenue $491,232 $28,901 $34,130 $68,339 $64,979 $687,582 $423,076 $1,110,657
County Expenses $750,185 $69,107 $9,380 $9,661 $9,951 $848,284 $54,416 $902,700
County Net ($258,953) ($40,205) $24,750 $58,678 $55,028 ($160,702) $368,660 $207,958
Battle Creek Cash Flow Projections

Ramsey County Golf Study Projections
Sirius Golf Advisors, LLC 333
Over 10 years, the total number of rounds is projected at 171,000 rounds.
Revenue With the conversion to Par 34, we expect a lower rate structure. In 2023, the green fee yield is predicted to be $11.37 compared to $12.39 under Status Quo and $15.19 under Scenario One.
The key comparison comes in years 2024-28. Green fee revenue is projected to be $1,188,000 in this scenario, which is $10,000 less than under the Status Quo and over $500,000 less the Elite 9 option.
However, it is a different story with the practice facility. For the 24-28 period, range revenue is projected at $1.88 million. This is nearly a million dollars ($978,000 or 108%) better than the Status Quo, and $640,000 (51.5%) better than Scenario One. The ten-year total is $2,791,000 compared to $1,705,000 for Status Quo and $2,164,000 for Scenario One.
Total Revenue is $4,883,000 for the last five years, a $1.3 million improvement (93.6%) over Status Quo. For the 10-year period, the improvement is just $1,293,000 (59.8%) due to being closed for a year. In 2022, we are projecting just $81,000 in total revenue as the course is expected to be closed the entire year.
County Revenue County revenue is impacted by both improved performance and by the change in contract. For the 10-year period, county revenue is anticipated to be $5,462,000, which is $892,000 (59%) more than the Status Quo. However, it is $612,000 less than for the Elite 9 option.
For the 20-24 period, the County revenue is projected to be $3.369,000. This is $935,000 (97%) more than the Status Quo. But it still lags Scenario One by $242,000.
County Expenses County expenses in the scenario will be about the same, although slightly less, than the Elite 9 option. There is more to maintain, despite the reduction to Par 34, because of the addition of a short-game area and expanded range. However, the maintenance standards for the Par 34 course is expected to be less than the Elite 9 as the price point is lower.
During the construction year, expenses are dramatically reduced. But the course still needs to be maintained, even though it is open. Our projections are $460,000, which is a little more than half (57%) the $806,000 in 2021.
Expenses are expected to total $3.34 million for 2024-28 and $5.88 million for the 10-year period. This is $86,650 less for the five-year period and $304,000 less for 10-years than the Status Quo.
County Cash Flow Cash flow is negative for every year. For the 10-year period, cash flow projects to a total loss of ($2,748,000). This is still a $1.2 million improvement over the Status Quo, but only slightly better ($48,000) better than the Elite 9 option.
The difference is even more dramatic in the last five years, where cash flow totals ($1,224,000). This is $1.0 million (125.8%) better than the Status Quo. It is also $213,000 better than the Elite 9 option.
Renovations are expected to total $2,917,000. The average cash flow improvement post-renovation is $193,000. Thus, pay-back is achieved in 15 years. The cash flow could support a dept of $2,800,000, or the approximate cost of the construction. Annualized ROI is 6.7%.

Ramsey County Golf Study Projections
Sirius Golf Advisors, LLC 334
Discussion There is a lot of discussion in the industry today about advocating for executive courses because they are so much quicker to play, and generally, more playable. However, this is not a new discussion. There was a similar, strong movement back in the late 1990s and early 2000s. However, we quickly discovered that golfers still prefer tradition over speed. Executive courses fail at a much higher rate than regulation and generally perform worse.
This scenario obviously is a lot better than the Status Quo, but it may not be better than the lower-cost “Elite Nine” option, despite having a better cash flow in the later years. It will take several years for this improved cash flow to overcome the added cost, and the loss of revenue from closing the course. And it seems to be a higher risk, due to the inherent disadvantages of being a Par 34 versus a Par 35.
Scenario 2a: Par 34 with Hybrid In this scenario, the Hybrid contract does not kick in until after the construction is completed, or 2023. We also anticipate two subsidies. One for $60,000 in 2020 and the other for $100,000 for when the course is closed in 2022.
The Hybrid contract immediately assures the County of a profit, with a positive cash flow starting in 2023 and continuing. It reaches $87,000 in 2028 but is projected to continue to grow thereafter. Over 10 years, it is still negative at $891,213, but his is $1.9 million better than the non-hybrid option.
Over the last five years, the cash flow totals a projected $351,500. This is $2.6 million better than the Status Quo. It is also about $1.6 million better than with Scenario 2 with the equalized revenue model.
With the Hybrid, the average annual improvement after reopening is $503,000 over Status Quo. This results in an annualized ROI of 17% and can support a $7.3 million debt, more than double the anticipated $3.06 million cost (with supplements).
Scenario 3: 18 Holes If nine-hole courses are less desirable, why not eliminate this disadvantage and become an 18-hole course? Not only does this option convert the facility from a type of facility that typically struggles (challenging nine-hole) to perhaps the most popular (mid-fee 18-hole).
As noted previously, this scenario will require a new clubhouse, and with it, a new range. But the existing clubhouse and range remain, becoming a stand-alone practice facility. This does several things:
2022 2023 Total 19-23 2024 2025 2026 2027 2028 Total 24-28 Total 19-28
Status QuoRounds 18,149 18,239 89,195 18,880 17,936 17,757 15,981 16,864 87,420 176,615
County Net ($344,561) ($367,709) ($1,708,814) ($359,572) ($411,243) ($441,723) ($521,716) ($527,805) ($2,262,058) ($3,970,873)
Scenario 2: Par 34, Expanded RangeRounds - 19,000 76,700 19,768 18,779 19,372 17,435 19,029 94,383 171,083
Revenue
Green Fees $0 $216,024 $985,467 $231,921 $227,668 $241,925 $217,207 $247,659 $1,166,381 $2,151,848
Total $81,500 $843,484 $3,146,118 $953,201 $939,395 $1,003,076 $933,180 $1,054,564 $4,883,416 $8,029,534
County Revenue $0 $578,339 $2,093,027 $657,580 $648,240 $692,192 $643,858 $727,646 $3,369,516 $5,462,542
County Expenses $459,883 $823,196 $3,616,472 $854,455 $885,072 $917,929 $950,162 $986,306 $4,593,925 $8,210,397
County Net ($459,883) ($244,858) ($1,523,445) ($196,875) ($236,832) ($225,737) ($306,304) ($258,660) ($1,224,410) ($2,747,855)
Hybrid 2023County Revenue $0 $45,522 $1,560,210 $87,870 $73,069 $92,650 $52,692 $97,974 $404,256 $1,964,466
County Expenses $459,883 $9,647 $2,802,923 $9,937 $10,235 $10,542 $10,858 $11,184 $52,756 $2,855,678
County Net ($459,883) $35,874 ($1,242,713) $77,933 $62,834 $82,109 $41,834 $86,790 $351,500 ($891,213)
Battle Creek Cash Flow Projections

Ramsey County Golf Study Projections
Sirius Golf Advisors, LLC 335
• It effectively eliminates the parking issue at the existing facility
• It increases range usage by effectively doubling capacity with a second practice facility. The new range is the one used mostly by golfers playing the course, but it can be expected to get some range-only play during peak demand times.
• It adds new revenue streams with a restaurant and banquet operation.
• Its unique design elements and proximity to both downtown and 3M, make it attractive for visiting golfers.
• With two nines, it becomes a much better target for popular league play.
• With 18 holes, you double the course capacity.
This scenario also has a big advantage over Scenario 2 in that it does not require completely closing the course. Renovations on the existing nine can wait until the new nine is built.
Further, while we do not take this into consideration in our projections, it going to 18 holes can be timed with Goodrich’s modest renovation option so that when Goodrich goes to nine holes during the construction, Battle Creek will be better positioned to accommodate more of the displaced rounds.
We have construction beginning in 2021 with the new 9. The new nine opens in mid-2022, and the old nine is closed for renovation. But the new clubhouse and range are open. The entire new facility reopens in 2024.
Performance can be neatly divided into two five-year periods. For the first five years of our projections, Battle Creek remains a nine-hole course, operated like Scenario 1. In the 2nd five years, it is an 18-hole facility, with a stand-alone range in addition to the course’s range.
Rounds While the new nine is being built, the course is operated as in Scenario 1, but there is not the reduction in play seen in 2020 due to construction. Further, when the new nine opens and the existing nine closes for renovation, we expect better performance because of the “newness” factor plus the elimination of the parking problem. As a result, rounds performance for the first five years, while it remains a 9-hole course, is expected to total 100,700. This is 11,500 more than Status Quo. But it is also over 1,000 more than Scenario 1 and 24,000 more than Scenario 2.
Of course, the difference becomes dramatic when capacity is doubled as it becomes 18-holes. We conservatively estimate that performance as an 18-hole course will vary from 28,000 in really bad weather years, to 32,000 in good years. For the five-year period 2024-28, rounds total 152,600. This is 65,000 more than in the Status Quo. It is also 58,200 more than Scenario 2 and 49,000 more than Scenario 1.
Revenue Green fee yield will naturally dramatically increase with the transition to 18-holes since there is not only a price adjustment, but the percentage of play will mostly be 18 holes as opposed to 9-hole play currently. In our modeling, we are assuming a rate structure 80% that of Keller. This may go up or down, depending on the quality of the finished design as well as whether Manitou undergoes the Major Renovation option. If Manitou does not elect major renovation, then Battle Creek would likely be positioned between Keller and Manitou, and thus may have a higher yield than shown. If Manitou does undergo the Major Renovation option, Battle Creek becomes positioned between it and Goodrich, in which case it may have a lower yield than what we have illustrated, but also a higher volume.
Naturally, there is a big difference in revenue in the first five years and the second. In the first five, green fee revenue total $1,414,000, which is $354,000 more than Status Quo. But in the second five years, this

Ramsey County Golf Study Projections
Sirius Golf Advisors, LLC 336
difference jumps to over $3 million as we project green fee revenue totaling $4.2 million under this scenario. This is also $3 million more than Scenario 2 and $2.5 million more than Scenario 1.
Total Revenue difference is even more dramatic. In the first five years, Scenario Three totals a little over $4.3 million. But in the 2nd five-year period, total revenue jumps to $12,970,000. This is over $9.37 million more than Status Quo, $8 million more than both Scenarios 1 and 2.
County Revenue County Revenue for the first five years totals $2,836,000. For the 2nd five years, this jumps to $8,380,000. The latter is $5.9 million more than Status Quo, $4.9 million more than Scenario 1 and $5 million more than Scenario 2.
County Expenses Naturally, course maintenance expenses jump with the expansion to 18 holes. The course is shorter and will be maintained to slightly lower standards than Keller, but there are also two ranges and inefficiencies due to the design issues. As a result, the course maintenance expenses will be similar.
Total county expenses, which includes marketing, is projected at a little over $4.1 million in the first five years, which is $256,000 more than Status Quo. In the second five years, expenses jump to $6,670,000. This is $1.97 million more than Status Quo, $1.83 million more than Scenario 1 and $2.07 more than Scenario 2.
County Cash Flow For the first five years, the County’s cash flow is negative each year, with a total loss of ($1,265,000). This is still a $443,000 improvement over the Status Quo. But it is also $94,000 more than Scenario 1 and $258,000 more than Scenario 2. This is mainly due to the fact there is not a “down” year due to construction.
The difference, though, is much more dramatic when the facility becomes 18-holes. Over the 2nd five years, the cash flow turns positive each year, with the County expecting to realize a total gain of $1.7 million. This is $3.9 million more than Status Quo. But it is also $3.1 million more than Scenario 1 and $2.9 million more than Scenario 2. For the 10-year period, the cash flow is expected to total $406,000.
The difference in cash flow in the 2nd five years, between Scenario 3 and Status Quo, averages $794,000. Assuming a construction cost of $10,190,000, it would take 12.8 years to pay back. This cash flow could support a $11.5 million bond, covering the cost. ROI is 7.8%, which is better than Scenario 2, but not as good as Scenario 1.
Discussion This is the only scenario that maximizes the potential of both the golf course and the range, while addressing the main infrastructure issues. Our projections, which we feel are conservative, show the investment will pay off.
But it also represents a big risk as it has, by far, the most capital investment. Because of this, consideration should be given to delaying the start of construction for the new 9, while the effectiveness of the Scenario 1 changes (less the capital improvements) can be further evaluated. The danger in this strategy is that it would mean that 18-holes would not be ready, should Goodrich be reduced to nine holes for renovation.
It is also possible to delay the construction of the new clubhouse by several years, saving $2 million in construction costs. Modulars, which can be rented, could be used in the meantime. However, this would eliminate banquet sales and reduce the overall appeal of the renovated facility. If possible, we certainly recommend the clubhouse be built along with the new nine.
Ramsey County Golf Study Projections
Sirius Golf Advisors, LLC 337
Scenario 3a: 18 Holes with Hybrid Contract In this model, the Hybrid contract starts in 2020, as it did with Scenario 1a. And the facility will be operated as an Elite 9 until reopening as an 18-hole course in 2024. However, when the facility reopens, the breakpoint is adjusted to $1.1 million and the split becomes 5% under and 65% over.
We are assuming that some subsidies will be needed to support the operator during construction. We assumed $60,000 in 2020; $150,000 in 2022 and $25,000 in 2023.
For the first five years, performance is very similar to Scenario 1a, with a combined net loss of ($168,000). But in the second five years, there is a tremendous difference. For these five years, the County shows a profit of at least $600,000 each year. Combined, the total profit is $3.6 million, or $5.9 million better than the Status Quo, and nearly $2 million better than Scenario 3 without the hybrid contract. For the 10-years, the cash flow total $3,472,000.
The average improvement post-construction is $1.18 million over the Status Quo. This will pay back the estimated $10,425,000 cost in under 9 years. The annualized ROI is 11.3%, and the difference in cash flow could support a debt of $16,600,000, well over the cost of construction.
Discussion Another argument against Scenario 2 is the fact that the ratio of non-regulation holes to regulation holes is already higher than most of the other facilities (22.2% for 5-mile and 20.9% for 10-mile) and much higher than that for the County (18.5%), State (11.6%) and Country (8.1%). In short, this appears to be an already saturated market, further hampering its potential.
Based on the projections, we recommend Scenario 3 as it maximizes revenue for the range and for the golf course. The addition of a 2nd banquet center for RC Golf is also important as it not only provides another revenue stream – even in the winter months – but it will allow Battle Creek to compete successfully in the lucrative tournament and outing market. Indeed, given its location, tournaments may be the biggest money-maker for the course.
But Scenario 3 also represents a big risk as it has, by far, the most capital investment. Because of this, consideration should be given to delaying the start of construction for the new 9, while the effectiveness of the Scenario 1 changes (less the capital improvements) can be further evaluated. The danger in this strategy is that it means that 18-holes would not be ready, should Goodrich be reduced to nine holes for renovation.
Regardless of whether the goal is to go 18 holes or not, Ramsey County should immediately pursue the “Elite 9” option to help improve performance now.
2022 2023 Total 19-23 2024 2025 2026 2027 2028 Total 24-28 Total 19-28
Status QuoRounds 18,149 18,239 89,195 18,880 17,936 17,757 15,981 16,864 87,420 176,615
Revenue $663,928 $676,458 $3,142,288 $732,367 $714,871 $731,780 $676,877 $738,251 $3,594,146 $6,736,434
County Net ($344,561) ($367,709) ($1,708,814) ($359,572) ($411,243) ($441,723) ($521,716) ($527,805) ($2,262,058) ($3,970,873)
Scenario 3 18 HolesRounds 20,250 22,750 100,700 32,000 30,400 31,008 27,907 31,312 152,627 253,327
Revenue $842,259 $1,260,634 $4,325,359 $2,533,485 $2,496,273 $2,631,949 $2,465,459 $2,844,365 $12,971,532 $17,296,891
County Net ($260,824) ($186,455) ($1,264,971) $399,398 $322,850 $371,857 $196,427 $420,519 $1,711,051 $446,080
Difference $83,737 $181,254 $443,843 $758,969 $734,093 $813,580 $718,143 $948,324 $3,973,109 $4,416,952
Scenario 3a Hybrid 2020County Net ($107,424) $185,686 ($168,380) $718,378 $686,496 $748,537 $646,624 $840,651 $3,640,687 $3,472,306
Difference $237,138 $553,395 $1,540,434 $1,077,950 $1,097,739 $1,190,260 $1,168,340 $1,368,456 $5,902,745 $7,443,179
Batte Creek Cash Flow Projections

Ramsey County Golf Study Projections
Sirius Golf Advisors, LLC 338
But if the goal is truly to maximize profitability, then the County needs to seriously consider employing the Hybrid option, regardless of which scenario is used. The hybrid option virtually guarantees that the County will not lose money, while not using it means that it will (except for Scenario 3).
Combined Impact The impact of the combination of recommended improvements along with converting to hybrid contracts, is dramatic. Assuming the optimal improvement scenario for all four courses, over the next ten years we anticipate an $18 million improvement over the Status Quo. Moreover, the improvements made should minimize the need for any other major improvements for the following 10 years as well. Thus, putting RC Golf on a strong and stable financial footing for at least the next two decades.
2019 2023 Total 19-23 2024 2027 2028 Totam 19-23 Total 19-28
Combined
Status QuoRounds 109,515 103,544 523,261 107,010 90,822 97,897 497,204 1,020,465
Revenue
Green Fees $2,151,156 $2,279,956 $11,006,583 $2,450,257 $2,093,983 $2,365,258 $11,551,336 $22,557,919
Total $5,353,466 $5,830,529 $27,722,663 $6,229,808 $5,865,074 $6,429,023 $30,823,564 $58,546,227
County Revenue $2,433,516 $2,628,524 $12,564,976 $2,865,773 $2,622,276 $2,910,555 $14,011,941 $26,576,917
County Expenses $2,668,197 $3,100,092 $14,399,247 $3,219,270 $3,635,351 $3,786,606 $17,483,767 $31,883,014
County Net ($234,681) ($471,568) ($1,834,271) ($353,497) ($1,013,075) ($876,051) ($3,471,825) ($5,306,097)
Recommended (Goodrich Opt 2; Manitou Opt 2; BC Opt 3)Rounds 117,000 114,995 554,651 125,384 126,932 141,695 653,305 1,207,957
Revenue
Green Fees $2,330,448 $2,817,636 $11,857,818 $3,520,595 $3,728,125 $4,347,519 $19,076,638 $30,934,457
Total $5,921,186 $7,429,005 $30,943,950 $9,249,165 $9,876,104 $11,272,249 $49,978,807 $80,922,756
County Revenue $2,744,311 $2,279,106 $10,068,878 $2,181,830 $2,043,681 $2,693,137 $11,397,114 $21,465,992
County Expenses $2,755,348 $1,312,946 $8,086,566 $102,136 $56,674 $64,325 $384,734 $8,471,299
County Net ($11,037) $966,160 $1,982,312 $2,079,694 $1,987,008 $2,628,812 $11,012,381 $12,994,693
DifferenceRounds 7,485 11,451 31,391 18,374 36,110 43,798 156,101 187,492
Revenue
Green Fees $179,292 $537,679 $851,235 $1,070,337 $1,634,142 $1,982,262 $7,525,302 $8,376,538
Total $567,719 $1,598,476 $3,221,287 $3,019,357 $4,011,029 $4,843,226 $19,155,242 $22,376,529
County Revenue $310,795 ($349,418) ($2,496,098) ($683,943) ($578,595) ($217,418) ($2,614,827) ($5,110,925)
County Expenses $87,151 ($1,787,146) ($6,312,681) ($3,117,134) ($3,578,677) ($3,722,281) ($17,099,033) ($23,411,714)
County Net $223,644 $1,437,728 $3,816,584 $2,433,191 $3,000,082 $3,504,863 $14,484,206 $18,300,790
Combined Cash Flow Projections - Receommended Scenarios
Ramsey County Golf Study Discussion
Sirius Golf Advisors, LLC 339
The RC Golf operation has been performing well, especially when compared to other municipal golf operations. It has both great amenities and operators. There is certainly no reason to panic.
On the other hand, RC Golf is entering a critical phase. It is facing major capital needs at its two highest volume facilities – Manitou Ridge and Goodrich. It also has two facilities that are losing money (Battle Creek and Goodrich).
Further, while these facilities are doing well, they are perhaps, not doing as well as believed. This is because there are no consolidated financials for the golf program that accounts for all County expenses. The major missing element is fleet services, which provides and maintains all the equipment for the golf operations at Keller, Goodrich and Battle Creek. This is a major expense item. Nor are the administrative salaries taken into consideration. (We were given a total for Fleet services for 2017 for each course – after our presentation on October 8th -- but not a break down on the expenses, nor a history. Both items we consider essential and were requested multiple times.)
So, while it may not be time to panic, there is a need to act both prudently and expeditiously.
It can also be said that the facilities are not reaching their potential – whether one looks at them as an amenity for county citizens, or as a profit center for the County.
In short, there is a need to both “fine-tune” the current operation and to take a hard look at their future. The County is wise in doing this planning now as opposed to waiting until the courses start losing money.
Philosophical Direction As noted earlier, we began the study by asking what the Philosophical Direction the County wanted to take with regards to the golf operations. While there are many possibilities, the main axis is whether to emphasize being an amenity for the citizens of the municipality versus maximizing profitability.
We presented our preliminary findings and recommendations to the County Commissioners on October 8th, 2018. During this meeting, the commissioners voted to emphasize profitability. As a result, we have shaped our recommendations in this direction.
The County has already taken big steps down the road of prioritizing profitability by privatizing the operations to varying degrees. Three of the six facilities are leased, the other three are under management contracts.
This strategy has helped the program have a positive cash flow to the Parks department and likely overall, even when fleet services are considered (it at least is at break-even, even with Fleet services and administrative salaries are accounted for). However, it has not covered the cost of capital improvements, both past (Keller) and future. And there is a big need for capital improvements, especially at Manitou and Goodrich.
For the cost of these capital improvements to also be covered by the golf operations, it will require major changes in how RC Golf is managed and administered. Indeed, if all the recommended improvements are made, not only will RC Golf have a positive cash flow that supports the debt needed for the capital improvements, the program may spin off excess cash that can be used to better support other Parks programming.

Ramsey County Golf Study Discussion
Sirius Golf Advisors, LLC 340
Regardless of where you are on the amenity/profit center continuum, capital investment is required. With investment, not only is financial performance going to be affected, but so is the appeal as an amenity.
And many of our recommendations will help at both ends, making RC Golf more profitable and becoming an amenity that services a bigger portion of the population. For example, right now the four big courses are all basically competing for the mid-fee market. Thus, the County is not serving the needs of golfers wanting a premium experience, nor the golfers wanting more affordable options. By elevating Keller and making Goodrich a value facility, the County is doing both serving more golfers (and citizens) and improving profitability.
Our plan for increased programming, especially for individuals wanting to take up the sport (such as the golf trial program), will both service a big need in the community, but also help with down-the-road performance as new golfers are brought into the market place.
Similarly, some capital improvements clearly serve both ends. A great example of this are new forward tees at all the facilities (especially Manitou) that will make the golf courses much more appealing to women, seniors, juniors and beginners.
There is also a hidden danger in aggressively taking the amenity approach. And that is this. Politicians change over time. The vision of today’s commissioners may not be shared by future ones. Why this is important to take into consideration is that the amenity approach is highly likely to create a situation where the golf courses eventually become greatly subsidized. Further, needed capital improvements being delayed will result in deteriorating conditions that will lead to even poorer performance that will cost even more to fix down the road. At that point, the Commission may feel golf is no longer worth the continued subsidization and the now higher cost of improvements. Thus, taking this approach may ultimately cause a loss of the very amenity you are seeking to maximize.
However, to maximize profitability will require further privatization, which will mean a greater loss of control. The biggest issue will be privatizing the golf course maintenance. Our recommended model is to have a single operator at each facility that controls all operations, including course maintenance. The contract model we recommend is a hybrid contract. Under this model, the County is virtually assured of a positive cash flow as the operator assumes all operating costs.
Maximizing profitability also likely mean converting the golf program to an Enterprise fund status so that an accounting is made for future renovations as well as the ones needed today. An enterprise fund status may also give the County more flexibility in the management of the facilities.
Recommended Scenarios First, we should state the obvious. The scenarios outlined in this report are not the County’s only options. Indeed, it is highly likely that none of the scenarios will be followed as outlined. But they do represent good models from which modifications can be made.
Choosing which scenario is best for the County depends on where the county sits on the Profit Center/Amenity continuum, but also on whether it wants a short- or long-term solution.
In our minds, the Status Quo is not a good option for any of the facilities no matter whether you are profit center or amenity biased. This is because the facilities can do better on both ends of that scale.
Further, several of the facilities are facing major infrastructure needs. Ignoring them will only cause performance to decline significantly (profit center), but also create a degradation of the playing experience (amenity). Moreover, the longer the delay in addressing, the higher the cost to fix.
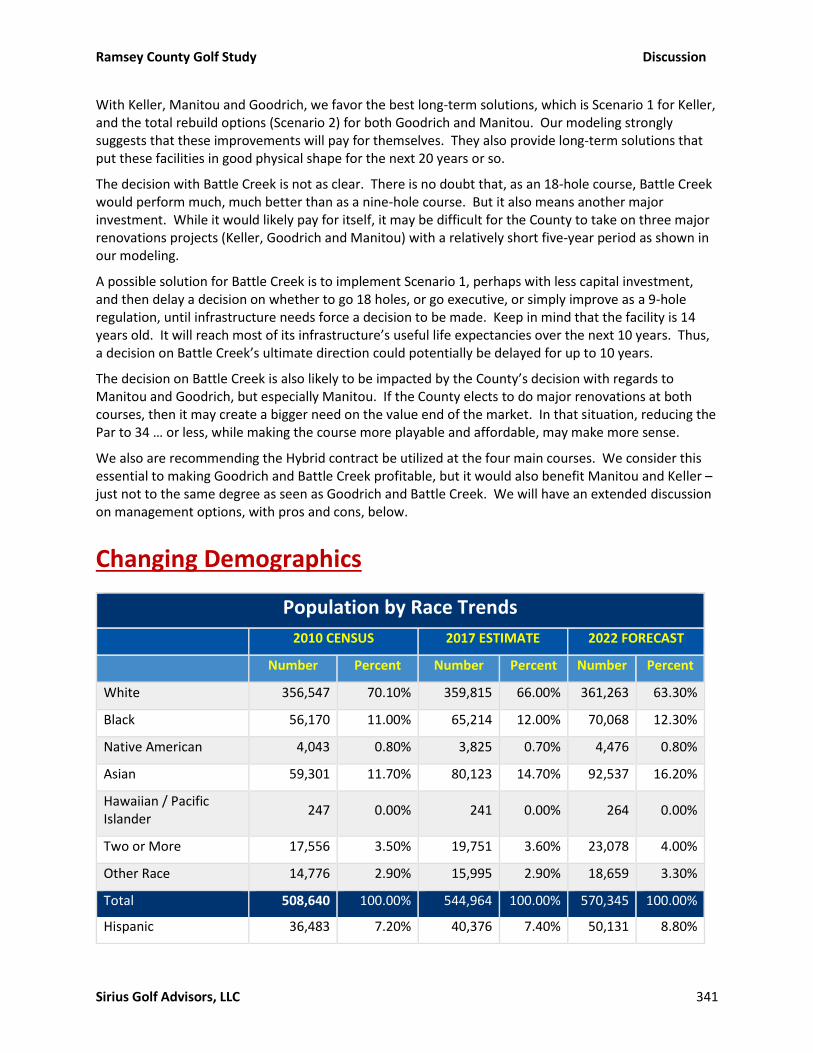
Ramsey County Golf Study Discussion
Sirius Golf Advisors, LLC 341
With Keller, Manitou and Goodrich, we favor the best long-term solutions, which is Scenario 1 for Keller, and the total rebuild options (Scenario 2) for both Goodrich and Manitou. Our modeling strongly suggests that these improvements will pay for themselves. They also provide long-term solutions that put these facilities in good physical shape for the next 20 years or so.
The decision with Battle Creek is not as clear. There is no doubt that, as an 18-hole course, Battle Creek would perform much, much better than as a nine-hole course. But it also means another major investment. While it would likely pay for itself, it may be difficult for the County to take on three major renovations projects (Keller, Goodrich and Manitou) with a relatively short five-year period as shown in our modeling.
A possible solution for Battle Creek is to implement Scenario 1, perhaps with less capital investment, and then delay a decision on whether to go 18 holes, or go executive, or simply improve as a 9-hole regulation, until infrastructure needs force a decision to be made. Keep in mind that the facility is 14 years old. It will reach most of its infrastructure’s useful life expectancies over the next 10 years. Thus, a decision on Battle Creek’s ultimate direction could potentially be delayed for up to 10 years.
The decision on Battle Creek is also likely to be impacted by the County’s decision with regards to Manitou and Goodrich, but especially Manitou. If the County elects to do major renovations at both courses, then it may create a bigger need on the value end of the market. In that situation, reducing the Par to 34 … or less, while making the course more playable and affordable, may make more sense.
We also are recommending the Hybrid contract be utilized at the four main courses. We consider this essential to making Goodrich and Battle Creek profitable, but it would also benefit Manitou and Keller – just not to the same degree as seen as Goodrich and Battle Creek. We will have an extended discussion on management options, with pros and cons, below.
Changing Demographics
Population by Race Trends
2010 CENSUS 2017 ESTIMATE 2022 FORECAST
Number Percent Number Percent Number Percent
White 356,547 70.10% 359,815 66.00% 361,263 63.30%
Black 56,170 11.00% 65,214 12.00% 70,068 12.30%
Native American 4,043 0.80% 3,825 0.70% 4,476 0.80%
Asian 59,301 11.70% 80,123 14.70% 92,537 16.20%
Hawaiian / Pacific Islander
247 0.00% 241 0.00% 264 0.00%
Two or More 17,556 3.50% 19,751 3.60% 23,078 4.00%
Other Race 14,776 2.90% 15,995 2.90% 18,659 3.30%
Total 508,640 100.00% 544,964 100.00% 570,345 100.00%
Hispanic 36,483 7.20% 40,376 7.40% 50,131 8.80%

Ramsey County Golf Study Discussion
Sirius Golf Advisors, LLC 342
Some concern has been expressed about the changing demographics in Ramsey County as it is being largely white to being more mixed. The concern is that non-whites have lower golf participation rates, so perhaps the County should be involved in an activity that may become less popular.
There are some big assumptions in that statement. So, let’s delve a little deeper into each component.
Demographic Shift As can be seen in the table above, there has been a shift in racial demographics within the County. In 2010, 70.1% of the population of Ramsey County was white. That percentage is expected to drop to 63.3% by 2022. The demographic is the biggest increase is Asian, growing from 11.7% in 2010 to an expected 16.2% by 2022. The percentage of blacks is also growing, from 11% in 2010 to 12.3% in 2022. The percentage of Hispanics is also projected to increase from 7.2% in 2010 to 8.8% in 2022.
While these trends are significant, Ramsey County is expected to remain a white-majority for the next 20 years, more than double the length of our projections. So even in a complete amenity-based view, golf remains a preferred recreation among most citizens of the County. In a profit-center viewpoint, there is much less concern about borders, as the main issue is customers, and our demographic analysis shows that the customer base will be growing over the next 10 years, not shrinking.
Minority Participation The second major assumption in the concern noted above, was that minorities do not play golf… at least do not play at rate approaching white participation. As one of the most proactive consultants in the industry with regards to minority participation, I can assure the reader that the industry does not pay near enough attention to this topic. In fact, the last comprehensive study that we know about was done by NGF and published in 2010. The study was titled simply, “Minority Golf Participation in the United States.”
Golfer Projections by Race
2017 ESTIMATE 2022 FORECAST 2010 # Golfers
Population Percent Population Percent Part Rate 2017 proj 2022 proj
White 359,815 66.00% 361,263 63.30% 11.9% 38,013 37,025 Black 65,214 12.00% 70,068 12.30% 3.9% 2,543 2,733 Native American 3,825 0.70% 4,476 0.80% 2.0% - 90 Asian 80,123 14.70% 92,537 16.20% 8.9% 7,131 8,236 Hawaiian / Pacific Islander 241 0.00% 264 0.00% 8.9% - 23 Two or More 19,751 3.60% 23,078 4.00% 9.0% 1,778 2,077 Hispanic 40,376 7.40% 50,131 8.80% 7.7% 3,109 3,860 Other Race 15,995 2.90% 18,659 3.30% 6.0% 960 1,120 Total 544,964 100.00% 570,345 100.00% 100.00% 53,534 55,163
In that study, we do find that non-whites in the US do participate in golf at a much lower rate. But that rate depends on the demographic. African-Americans had the lowest participation rate, at 3.9%, followed by Hispanics (7.7%), Asian (8.9%) and Whites (11.9%). But there were also some noticeable trends. Participation among both Whites and Blacks had declined over the previous three years, while

Ramsey County Golf Study Discussion
Sirius Golf Advisors, LLC 343
participation among Asians and Hispanics had grown – significantly. (Hispanic participation had jumped from 6.7% to 7.7% in just three years).
Let’s assume that the 2010 participation rates cited in the study were still accurate, and then apply those percentages to the current and projected populations. Here is what we get:
*In the above table, all Hispanics are assumed to be white and thus the number of whites was reduced in the calculations by the number of Hispanics.
So even with a shift in demographics, the number of golfers is expected to increase within the County. Thus, even in a full “amenity” approach, golf seems to be as important tomorrow as it is today.
But there is more to the story. In NGF’s 2018 “Golf Participation in the US,” it notes that 25% of today’s junior golfers are now non-Caucasian, versus just 6% 20 years ago. Therefore, there is reason to believe that minority participation in golf is increasing, not declining.
Regardless, though, RC Golf can do a lot more to further improve participation from diverse populations. As stated previously, here are a few things.
• Staff (1): Start with your own staff, especially with maintenance crews that tend to be more minority. Create programs to encourage your staff to take up golf, and then provide incentives for them to bring their families with them when they play. Similar programs can be extended throughout the Parks Department and not limited to golf courses.
• Staff (2): The golf operations staff that we saw at all the facilities was 100% white (and predominantly male). If you want people to participate, it is important that they see staff “that look like them” working at the course. This helps make them feel welcome.
• Lower Barriers: As we discussed previously, we need to lower the barriers to starting golf if we want to get more people to play, and this is especially true with minorities.
• Community Outreach: You need to be proactive within the minority communities. This takes several forms, including:
o Churches, Schools, Civic Groups – make presentations, hold clinics, and provide special programming to minority dominated organizations.
o Sponsorships: Show the community you care by having the golf courses sponsor minority community activities. This can take the form of being a financial sponsor, or hosting events.
In sum, we do not see the demographic shift occurring within the County as a negative with respect to golf. From an amenity side, we certainly view it as a great opportunity to use golf as a means of bringing the communities closer together. From a profit-center perspective, first, we see the golf course prospering based on a borderless look at the population. Second, the more we reach out to new populations and latent golfers and create new golfers, we are expanding the base that can support the facilities for the foreseeable future.
Management Options In our projections, we kept the operator contracts as being similar in nature to the ones that the County currently employ, just fine tuning them. We also provide projections using another model, the Hybrid. However, we encourage the county to consider other types of contracts.

Ramsey County Golf Study Discussion
Sirius Golf Advisors, LLC 344
Before beginning this discussion, we reiterate that the Golf Division is well managed. The discussion, though, is important as more and more municipalities consider alternative choices in management.
Fifty years ago, municipalities played a significant role in bringing golf to the masses. Indeed, it has only been in the last few decades that the public golfer had any options to play except at a municipal golf course.
This is no longer true. Over the past several decades, most of the golf courses being built have been privately owned public access golf facilities. As a result, today, municipalities are finding they are not only competing head-to-head with private enterprises; they are doing so in an increasingly more competitive market. Unfortunately, few municipalities find they are equipped to handle this type of competitive environment.
There are several factors that typically inhibit municipalities in their ability to compete successfully with private enterprise. These include:
• Slow response: By nature of the bureaucracy that is typically involved in making decisions, government-owned businesses are typically very slow to respond to market conditions – such as rates, promotions, etc.
• Budget Constraints: Often budgetary problems in other departments can have an adverse effect on golf operations. Even in cases where the municipality is not subsidizing the golf operations, needs in other departments can place greater pressure on the golf course to produce more revenue for the municipality, or for costs to be reduced, which can adversely affect performance.
• Personnel Policies: One of the most glaring areas separating municipal governments from private enterprise is in relation to personnel policies and costs. This is particularly true with regards to:
o Benefits: Municipalities typically offer very rich benefit packages – far superior to what is normally the case within the golf industry.
o Termination: With most private enterprises, if an employee is not productive, they are terminated – and often quickly. With governments, however, it can be extremely difficult to get unproductive employees terminated. The emphasis is on “rehabilitation” as well as avoiding litigation. Thus, it can take months or more of effort for a supervisor to remove an unproductive worker. This not only affects effectiveness from the employee in question but can adversely affect morale of the staff.
o Pigeon-Holing: Often municipalities try to make golf course jobs fit in with their established job descriptions (and resulting compensation) for other areas – such as parks and recreation. Unfortunately, these comparisons are often inadequate and can result in a serious mismatch of personnel with job needs.
• Marketing: Many municipalities lack marketing expertise that is critical to succeeding in a competitive business. In other cases, golf simply is not a priority within the marketing department.
• Special Interests: By nature, municipalities are subject to the political process. This often results in situations where special interests can dictate policies or decisions that will adversely affect the golf operation’s profitability.
• Procurement: When large items, especially capital improvements, are needed, municipalities are often constrained with lengthy procedures and mandated policies

Ramsey County Golf Study Discussion
Sirius Golf Advisors, LLC 345
that not only slow the process down when timing can be critical, but also can lead to situations where the best product or contractor is not selected.
• “Prevailing Wages”: In some areas, municipalities are constrained by prevailing wages and other labor restrictions that can drive up costs that do not apply to privately owned businesses.
• Incentive: With most municipal golf operations where the staff are employees of the municipality, there are no incentives given to the managers for superior performance. Raises and promotions are often based on seniority rather than performance. So why work harder?
Because of these considerations, many municipalities have made the decision to contract out management of their golf operations. Indeed, RC Golf has contracted out much, but not all, of its golf operations to outside contractors. However, as pointed out earlier, there are six facilities, six operators and seven different contracts. All of which are problematic to one extent or another.
So, what are the various options available?
In this section, we explore the various management options available to RC Golf. We shall attempt to provide both the pros and cons of each option.
There are three primary options: 1) Self-Management in some form, where all the managers and staff are employees of the municipality; 2) Outside Management (privatization of some degree) where at least some of the management utilizes non-municipal employees; and 3) Leasing where the entire facility is leased out to a third party in exchange for compensation.
Self-Managed Self-managed is the ultimate amenity approach to golf operations. Currently, RC Golf is only self-managed with relation to course maintenance operations at Keller, Goodrich and Battle Creek.
Issues Below are some issues commonly found with self-managed municipal operations: (Note: we have not seen evidence of most of these currently within RC Golf.) These issues often place municipal operations at a significant competitive disadvantage.
• Incentive: One of the biggest issues is the lack of incentive for both management and staff at municipal facilities. Even the fear of losing their job is diminished within most municipal operations, given the difficulty that is usually involved in getting unproductive employees terminated.
• Disincentive: Indeed, there is often a disincentive at municipal courses. Because more rounds mean more work, some employees will be motivated not to increase play. This works, because there is often little oversight and a lot of job security.
• Competitive Wages: There are two issues that are common with municipal golf courses regarding wages. One concerns the managers and the other concerns maintenance labor. Both have to do with the fact that a golf course is a very different entity than a typical government workplace.
o Labor: Too often, municipalities try to categorize course maintenance workers with the same job classifications they use for workers in the parks and recreations department. However, the job demands are entirely different. In a golf course operation,

Ramsey County Golf Study Discussion
Sirius Golf Advisors, LLC 346
maintenance workers must work odd hours, work weekends, and constantly deal with time constraints and pressure resulting from a revenue-producing business. Further, there is a far greater cost to mistakes. If a parks employee “scalps” the turf, it may make the park a bit less attractive, but there are no significant financial consequences. However, a similar mistake at a golf course can result in a significant loss of revenue, and increased repair costs to fix.
o Management: Good management in golf (general manager/head golf professionals and golf course superintendents) can often command wages that are more than their superiors in the municipal government make and even Commissioners earn. This can create obvious jealousies and tensions.
• Termination Policy: With most municipal personnel termination policies, it becomes cumbersome to terminate unproductive employees, as the emphasis is on “rehabilitation.” Most municipal systems require a lot of paperwork and intervention by supervisors, who are not always prepared or willing to follow through. As a result, unproductive employees are often retained far longer than they would under a private employer. Unfortunately, the result is a double whammy as not only is that employee costing the municipality money, but also these unproductive employees can act like a “cancer” among the workers. This is due to other staff seeing that the unproductive employees are able to get away with less work, or it can adversely affect their morale as they must work harder to compensate for the unproductive employee.
• Bureaucracy: One of the main problems found with municipal golf operations is the degree of bureaucracy that often comes from government entities. The bureaucracy will often lead to costly delays and/or inferior quality. Three areas where bureaucracy can be especially damaging are found in:
o Decision Making: With private enterprises, decisions can be made very quickly, which is extremely important in a very competitive world where the axiom “he who hesitates is lost” really comes into play. There often is so much concern in government about making the “wrong” decision that the indecision becomes a decision in and of itself. Meanwhile, the competition moves ahead.
o Purchasing: Purchasing can often become delayed in government entities. Policies to accept the lowest bid can also backfire by having to accept inferior quality or service in exchange for the lowest price. The bidding process itself can delay the acquisition of badly needed equipment or supplies.
o Personnel: The procedures required to hire new employees is often considerably more complex with municipalities than with a private employer. This can lead to costly delays and resulting poor customer service.
• Human Resources: Further, personnel policies, both in hiring and termination, can often lead to the hiring of unqualified individuals and the inability to get rid of them, once hired.
• Politics: Of course, one of the biggest issues with municipal golf operations is the degree to which politics influence what would normally be business decisions. Often, we find with municipal golf courses that a small percentage of golfers can wield a disproportionate influence on the decision-making process simply by squeaking the loudest. Indeed, the entire political process often works the exact opposite of the way a business operates. For example, in business it is often necessary to react quickly to changing situations – such as competitive pressures. Governments, however, rarely can act quickly. We do see evidence of this with RC Golf, where the County still controls fees.

Ramsey County Golf Study Discussion
Sirius Golf Advisors, LLC 347
• Multiple Managers: This is an issue we see especially at Keller, where there are four different managers involved in operating the facility. There is the outside contract in charge of golf operations, there is another in charge of food & beverage, the Course Superintendent reporting to Parks, and Fleet services, which oversees the maintenance of the equipment. The Golf Operator has no control over the other three. This raises concerns about priorities, efficiencies and coordination.
Advantages The following are the primary advantages of self-management:
• Control: It gives the municipality maximum control over their valuable amenity. This can be critically important with regards to course conditions, as operators tend to “slack off” during the final year(s) of a contract, leaving the courses in poor condition at the end of their term.
• Full-time Employment: In a situation unique to the northern parts of the country, municipalities can keep staff employed year-round by transferring them to other operations (such as the arenas, with Ramsey County).
• Programming: It allows for the most cross-programming with other Park’s operations. Further, it makes it easier to offer low- or no-cost programs, such as golf clinics.
Disadvantages • See “Issues” above
• Marketing: Municipalities are notoriously weak in marketing.
Comments This is the approach taken by an “amenity first” approach to municipal golf. It is most often the least-profitable approach to municipal golf. It usually means that the golf operation is treated like other Parks and Recreation amenities.
Leasing At the opposite end of the spectrum is leasing. Under a full lease (such as the case with the golf dome and Island Lake), the facility is leased out in its entirety to a private golf company (or individual), who is responsible for all operating expenses as well as capital upkeep. The lessee would then receive most of the revenue. The municipality either would receive a flat payment or get a percentage of revenue (revenue lease).
Manitou is operated on a non-capital lease basis. The operator is responsible for all operating expenses, including the considerable cost of equipment (especially carts and maintenance equipment). In return, the operator retains most of the revenue (87% in this case). A somewhat unusual aspect of this lease, however, is that the County still controls the fee schedule. Typically, operators will insist on control of fees as it directly affects their ability to make a profit. Manitou’s long record of performance history, and the current operator’s experience with Manitou, no doubt reduced this risk in the eyes of the operator.
Both Island Lakes and the Golf Dome, though, operate on capital leases, where the County has little financially exposure and the operator is responsible for both operating expenses and capital improvements.

Ramsey County Golf Study Discussion
Sirius Golf Advisors, LLC 348
Advantages • Guaranteed Revenue Stream: Given that the lessee is absorbing almost all the expenses, the
risk of the municipality of subsidizing the operation is mostly eliminated (unless the lessee becomes financially distressed.)
• Reduced Risk: Not only does it remove the possibility of subsidizing, but presumably it leaves the golf course in the hands of a qualified professional management team who are best equipped to compete successfully in a highly-competitive environment.
• Simplicity: The municipality is relieved of a lot of the responsibility in maintaining and operating the facility. This means a lot less administrative overhead (virtually none) is required.
• Personnel: All employees become employees of the management firm. This reduces operating costs and eliminates the issues regarding personnel found in self-management.
• Capital Improvements: In exchange for a long-term lease, many management companies are willing to invest significant amounts towards capital improvements. And most leases require the leasee to be responsible for minor capital improvements over the course of the lease.
• Capital Improvements (2): It may be possible under a lease, if the private company is responsible for making them, to avoid prevailing wage and other labor issues. This can save 10-15% of the construction costs.
• Resources: Larger companies have resources available, particularly concerning marketing and management expertise that smaller operators and self-managed facilities simply do not have.
• Marketing: In today’s competitive marketplace, most golf course management companies have a professional marketing team that knows how to market golf courses. In addition, larger companies will have a large marketing database to work with that is very beneficial to courses such as Keller. They can market the facility to customers of all their other facilities, as well as being a part of their national campaigns.
• Purchasing: Private vendors can often get equipment, parts and supplies not only faster, but often cheaper and of higher quality.
• Food and Beverage: As with marketing, most golf course management firms have developed expertise with regards to food and beverage operations.
• One Management Entity: As pointed out above, Keller has four different management entities responsible for the course. We could also add two more- Human Resources and Marketing. This can lead to conflicts of interests and priorities and decreased efficiencies. It is almost always better, from a business standpoint, to put everything under one manager who best understands the roles and interactions of the various departments and their impact on the quality of service to the customer.
Disadvantages • Deferred Maintenance: Although provisions can be put in to try and “encourage” the lessee to
continue to make additional improvements in the course, there are no guarantees that the lessee will do so, or in a manner that is in a municipality’s best interests. Inevitably, as the lease nears its end, the motivation for the lessee to put more money into the facility becomes less and less, unless they are wanting to renew. As a result, the municipality may inherit a significantly deteriorated facility at the lease’s end. This is a frequent occurrence with municipal golf operations. Moreover, by having the lessee do any of the proposed capital improvements, the
Ramsey County Golf Study Discussion
Sirius Golf Advisors, LLC 349
municipality would lose some control over the quality of the work. In addition, by requiring capital improvements be made, the lessee will want a longer term to recover their investment.
• Capital Improvements: In a capital lease, where the operator is responsible for the capital improvements, they may elect to choose cheaper materials that are of poor quality, if they do not intend to renew the lease after it expires as they would not suffer the consequences.
• Quality Control: Once the lease is signed, the municipality may have little ability to regulate the quality of the operation, if the lease terms are met. In addition, even if they are not met, the legal and practical cost to “force” conformity with the lease can be expensive.
• Long term: Leases are typically for a long term, especially if capital improvements are included in the lease terms. This makes it difficult to get out of the lease, should the municipality become displeased with the lessee’s operations of the facility.
• Oversite: With long-term leases, there is a strong tendency for the municipality to simply ignore what is going on with the asset, as they have no direct involvement or expense in its operation. So even if there are clauses within the lease that protect the municipality, they are often ignored. As a result, the facility deteriorates needlessly.
• Referendum Required: In the case of a capital lease, it may require the issue be put to the Citizens for approval; depending upon the length of the lease. This would cost the municipality the funds required to stage the vote and puts the option at risk of not being approved. Thus, the municipality risks the cost of the election, plus the costs associated with not doing any of the other options (opportunity cost) while the issue is being decided. In addition, if it fails, the municipality is back where it started, only with an additional “black eye” on its resume.
• Viability: While leasing was popular in the 1980s and 90s, it has fallen into disfavor lately. It may be difficult to find a suitable vendor who is willing to accept lease terms that are attractive to the municipality.
• Employee Continuity: If you are leasing the facility to a large multi-facility management company, employees are often moved from facility to facility within their organization. This means less continuity at any given facility.
• Management Continuity: While most management companies prefer to retain existing on-site management, there is no guarantee that they will do so, nor that the current staff would want to work for the management company. Given the quality of the staff at SCC and the golf division, this is a consideration.
• Pecking Order: Similarly, with large management companies, you may not rate very high on their “priority” list. This may mean:
o Less attention: Getting less attention from their main resource people.
o Training ground: Your facility may be used as a “training ground” for new people, meaning you will always have the least experienced staff.
Comments While leasing of municipal golf facilities has been popular in years past, its popularity has waned significantly in recent years. As these leases are expiring, municipalities are discovering they are often inheriting run-down amenities that require millions to fix back up. Additionally, as the lease typically

Ramsey County Golf Study Discussion
Sirius Golf Advisors, LLC 350
runs for many years, the municipality becomes “stuck” with an operator – for better or worse. If it’s “worse,” the municipality may have to endure years of misery before the lessee can be dislodged.
Unless Manitou’s performance returns to previous levels, and the County makes substantial investment in its infrastructure, it is hard to imagine another operator managing under a similar lease arrangement in the future.
On the other hand, if a lessor can be found that is willing to make a substantial investment in the facilities (the capital improvements recommended herein), then leasing becomes a lot more attractive.
Outside Management There are many ways in which the facility could utilize a third party to manage its golf operations. Some are turn-key, where the third party provides assumes virtually all the expenses in the operation in exchange for most of the revenues; while others are management only – where only the management is third party and the municipality retains all the employees and assumes most of the expenses.
The options that we will consider include:
• Operating: This type of contract often excludes course maintenance. The employees are employees of the operator and the operator assumes various other operating expenses in exchange for a split of the revenue. This can often take the form of a personal services contract, as the contractor is frequently an individual.
• Supervisory: This is where a third party is brought in to manage, but the municipality retains all the employees and assumes all the expenses.
• Pass Through: A modification of the management only, where the employees become employees of the management company, but the costs are still passed through to the municipality.
• Hybrid Contract: Like leasing, but for shorter-term and greater retained control. The management company assumes all the operating expenses as with a lease, while the municipality shares in the revenue stream.
In each case, the contract can exclude course maintenance should the municipality wishes to retain control of this area.
Operating This is the typical “old” model for municipal golf courses. An operator, usually an individual, is hired to run golf operations and manage the proshop. It is frequently a PGA professional. The operator assumes some, but not all the operating expenses. Typical is that the golf operation’s staff are employees of the contractor. If the contractor pays for inventory (merchandise and or food and beverage), they get all or most of that revenue. If the operator supplies the golf carts, they get all or most of that revenue stream. The municipality mainly gets its revenue from green fees, with the operator getting a much smaller share (if any). Course maintenance is usually excluded. Lesson revenue is almost always 100% the operators.
This type of contract is currently in place at Keller, Goodrich and Battle Creek.
Advantages
• Personnel: Issues with personnel, at least as far as golf operations is concerned (benefits, termination, incentive, etc.) are greatly reduced.
Ramsey County Golf Study Discussion
Sirius Golf Advisors, LLC 351
• Personnel Costs: The private operator is typically able to get staff at a lower cost to the operation than a municipality.
• Operating Costs: The private operator typically can control operating costs better than a municipality.
• Control: Preserves municipal control over course conditions.
• Term: These are typically short-term (usually three to five years), allowing for easy change should the operator prove unsatisfactory.
Disadvantages
• Conflict of Interest: If the operator’s compensation involves retaining all or most of a revenue stream (such as merchandise sales, food & beverage, etc.), then it can create a situation where what’s best for the operator is not good for the municipality and vice versa. An is where the operator wants to create more volume (which helps with their revenue streams) by discounting the green fees (which disproportionately affects the municipality.)
• Course Maintenance: Does not address personnel costs, etc. with course maintenance.
• Coordination: Unless the superintendent reports to the operator, which is difficult to do if the superintendent is a municipal employee, there can be issues in coordinating between the superintendent and the golf operations staff. For example, the operator may need special set-up for a tournament, but the superintendent may not be willing to add additional costs to his/her budget, or make the additional effort required.
• Marketing: As we clearly see with RC Golf, there can be a dispute as to who is responsible for marketing. Even if it is clearly defined, it is problematic. If it is with the municipality, they may lack the expertise and/or willingness to budget appropriately to market effectively. If it’s with the operator, unless they get reimbursement from the municipality for some or all the marketing cost, they will be reluctant to spend their money when the municipality realizes most of the gain (green fees).
• Purchasing Power: If the contractor is an individual, which it usually is, then that individual will lack the buying power of a municipality or a management company.
• Expertise: If the contractor is an individual, they may not have the expertise in all areas needed (golf operations, lessons, tournament management, merchandising, food & beverage, etc.).
Supervisory The Supervisory contract assumes that a management company (or individual) is hired to manage the facility. However, all employees remain employees of the municipality and the municipality continues to pay all expenses. The management company is paid a fee to oversee the operations.
The fee can be a flat amount each month, or a percentage of revenue, or a combination of both. (Sirius does not recommend a flat fee situation as it provides no incentive to perform).
Advantages
• Control: Preserves municipality control over the golf operation as the manager reports to a municipality official and the municipality retains all the employees.
• Management: Provides experienced management expertise to oversee operations.
• Expertise: Potentially adds expertise to several areas
Ramsey County Golf Study Discussion
Sirius Golf Advisors, LLC 352
• Costs: A management company can often reduce costs through discounts from vendors (larger buying power) and from better purchasing practices.
• Improves Revenue Opportunities: Presumably, with professional management and marketing, revenue from the facility will improve significantly and the municipality could gain more revenue than it is currently seeing.
• Resources: (see above)
• Marketing: (see above)
• Term: These are typically short-term (usually three to five years), allowing for easy change should the operator prove unsatisfactory.
Disadvantages
• Overhead: Increases overhead and/or reduces share of revenue
• Payroll: Does not address the payroll cost.
• Personnel: Does not address other personnel issues, such as the termination policy.
• Pecking Order: (see above)
Comment
The management company may or may not have a day-to-day presence at the facility, depending on whether it chooses to place a full-time General Manager at the facility or not. The management company can be effective by simply monitoring performance and visiting the site regularly during the month.
These contracts work best when they are incentive-based. We strongly recommend against a flat-fee contract. Ideally, you want an alignment of interests so that if the management company is doing well, the municipality is doing well and vice versa. We also do not recommend making the incentive based on only one or two aspects of the operation as this often leads to irregular performance whereby the management company gains, but the municipality loses.
Pass-Through This is like the management-only, with one significant difference. The employees of the golf facilities become employees of the management company. However, the cost for these employees is passed through to the municipality.
Advantages
• Same as above, plus
• Reduced Costs: Presumably the benefits costs would be lower with the management company, thereby reducing overall costs. These savings can be significant.
• Personnel: Eliminates the personnel issues discussed under self-management.
• Purchasing: As with personnel, the management company becomes responsible for purchasing, which can speed up the process, improve quality and lower costs.
• 12-month operation: Large management companies can move personnel around from facility to facility. This can be a big advantage in short-season areas such as Minneapolis. They can move some of the professional staff to and from areas with the opposite season, such as Florida and Arizona, thereby guaranteeing them 12-month employment and increasing the appeal of the opportunity, thereby increasing the probability of attracting and retaining quality staff.

Ramsey County Golf Study Discussion
Sirius Golf Advisors, LLC 353
Disadvantages
• Same as supervisory-only
• Financial Strength: If the management company lacks financial strength, it can lead to a disruption of services should payroll not be met, or supplies withheld for lack of payment. This can be minimized if:
o The municipality is quick about reimbursing.
o The operator can reimburse through the revenue stream, and/or
o The municipality provides up-front seed money to cover expenses until they could otherwise be reimbursed.
Comments
This option is preferred over the supervisory-only option above. The cost-savings from benefits, elimination of personnel issues seen with self-management, and the increased marketing expertise make this a viable option for a municipality.
Hybrid Contract A Hybrid contract blends many of the advantages of a lease with those of a management contract. Like a lease, the operations of the facility is turned over to a privately-owned company who is responsible for all the operating expenses. However, it is not a lease. It varies in several ways, including:
• Term: A management contract is for a much shorter period, typically three to five years.
• Capital Improvements: Typically, the municipality is still be responsible for all major capital improvements, although minor “upkeep” types of improvements are often the responsibility of the management company. (Some management companies may be willing to include some of the capital improvement recommendations contained in this report, in exchange for a longer-term contract and higher fee, along with a reimbursement agreement in case of premature termination of the contract).
• Flexibility: A management contract can include all or only parts of the operation.
Advantages
• Potentially reduces operating costs: A management company is likely to have a substantially less expensive benefits package that can result in significant payroll savings. Their overall expertise may lead to improved efficiencies as they are more motivated to do so. Further, they often can purchase supplies not only less expensively, but more quickly.
• Administrative: Requires less administrative costs than other management contract options as the operator pays all operating costs.
• Eliminates employee termination issues: A management company is be able to terminate staff when it sees fit, without having to go through all the steps currently involved in firing a municipality employee.
• Added Experience and Expertise: One main advantage of dealing with a management staff is the experience and expertise that such a company can bring to the table. Not only can it provide help in operations and maintenance but also in other areas such as marketing and merchandising.

Ramsey County Golf Study Discussion
Sirius Golf Advisors, LLC 354
• Marketing: Many management companies have their own marketing departments that would be a strong asset to the course. In addition, larger management companies have a large database of customers, which is ideal for marketing a resort course!
• Provides Revenue: The municipality would likely be assured a revenue stream under a hybrid contract. (The percentage, of course, depends on the nature of the contract).
• Improves Revenue Opportunities: Presumably, with professional management and marketing, revenue from the facility will improve significantly and the municipality could gain more revenue than it is currently seeing.
• Simplicity: The municipality is relieved of a lot of the responsibility in maintaining and operating the facility.
• Shorter term: Management contracts are for a shorter term than a lease and obviously not a permanent situation as is the case in privatization. Additionally, provisions can often be included for buying out the contract short of term, should the situation become unacceptable to the municipality.
• Reduces Political Influence: As the management company is tasked with making most of the decisions regarding operations, politics is minimized in its influence. This can be very important, especially if the management company is given the flexibility to set fees (which we recommend – within a range set by the municipality).
• Costs: A management company can often reduce costs through discounts from vendors (larger buying power) and from better purchasing practices.
• Food & Beverage: (see above)
• Resources: (see above)
• Marketing: (see above)
• Aligned Interests: In model hybrid contracts, all revenue streams are treated equally (after allowing for inventory costs). Thus, the interests of the contractor and the municipality are aligned. What’s good for one, is good for the other.
Disadvantages
• Control: The municipality has less ability to control the quality of operations.
• Oversight: Municipalities tend to “relax” when they have a management company. The tendency is often to “trust” the company to do what it is supposedly “expert” at doing, only to discover after it’s too late that the management company mismanaged the facility to a significant degree.
• Capital Improvements: The municipality is still responsible for the long-term capital improvements. Such improvements would likely be required in the contract negotiations.
• Final Year Syndrome. As with leases, management companies have a poor record of accomplishment in the final year of the contract, unless the company is strongly motivated to want to renew the contract. In the final year, the company is usually only interested in maximizing their revenue and minimizing their costs. Again, course maintenance becomes the primary victim. However, customer service often also falls off significantly. Thus, at the end of the contract, the municipality may be left with a poorly maintained golf course in need of capital

Ramsey County Golf Study Discussion
Sirius Golf Advisors, LLC 355
improvements to be brought back into shape; a bad reputation resulting from poor service that will take time to rebuild; and a declining customer base that will also take time to recapture. This problem, shared by all management contracts, is more prevalent with contracts four years or longer.
• Management Turnover: Management companies often will move managers around, taking their best managers and putting them into their most profitable facilities. New Braunfels will not likely merit their best (unless the facility is significantly upgraded), and if the manager they place proves particularly capable, they are likely to be “promoted” and moved elsewhere.
• Company Turnover: Currently, the golf industry is undergoing tremendous changes in management company ownerships. Management companies are being bought out and absorbed and others are going under. There are no assurances that the company or its managers who originally sign the contract will be around to see its conclusion.
• No Guaranteed Income. Unlike a lease, management contracts usually do not provide a guaranteed income for the owner (the municipality), but rather a guaranteed income for the management company.
• Employee Continuity: (see above)
• Pecking Order: (see above)
• Management Continuity: (see above)
Comments
The current contract at Manitou Ridge closely resembles a hybrid contract. It is a bit unusual in that it is with an individual as opposed to a management company.
There are good management companies and there are bad ones, and frankly, so many new ones and altered ones that their track record cannot be reliably established. To us, a hybrid contract makes the most sense as it removes payroll from the municipality while bringing in expertise and provides incentive-driven management. This should not only result in a major cost-savings to the overall operation, but eliminates other issues such as termination policies, too much time off, etc. Indeed, it is our opinion that a management company would likely be able to operate the facility for less money than the municipality is currently spending while improving service and significantly increasing revenue.
With hybrid contracts, capital equipment, such as carts and maintenance equipment, may or may not be included. However, we typically recommend that they are. This further reduces financial risk to the municipality and the operator is often better equipped to provide the equipment at a lower cost to the operation.
Many of the issues of a hybrid contract (disadvantages) can be minimized in four ways:
• Careful selection of the management entity based on criteria other than just their fee;
• Balanced Revenue Sharing: Many municipalities make the mistake of dividing the revenue by type – for example, the management company gets the cart fees, the municipality retains the green fees, etc. Unfortunately, this can create situations where the management company is going to act in its best interests and not necessarily the municipality’s. For example, discounts given for tournaments or through coupons reduce the green fee, but not the cart fee, so the municipality ends up bearing a disproportionate share of the marketing cost. Instead, we recommend that all the revenue be pooled together, and then split. Revenue from merchandise and food and beverage going into the pool is defined as gross sales less the cost-of-sales.

Ramsey County Golf Study Discussion
Sirius Golf Advisors, LLC 356
• A well-written contract that has checkpoints, quality conditions, and “outs”; and
• Competent Oversight: More municipalities are utilizing consultants to perform quarterly checks on the management company’s performance. In this way, the municipality has its own “expert” that can more objectively and critically evaluate the management company’s performance. Of course, this adds to the overall cost of the contract and needs to be figured in when evaluating this scenario. We also advocate a contract that features a “revenue sharing” concept as opposed to a flat fee model.
Discussion and Recommendation It is our experience that self-managed facilities tend to fare the poorest when it comes to municipal operations. (Ramsey County only self-manages the maintenance operations at three of the facilities). There are many reasons for this. In addition to the ones mentioned above, probably the most important reason is that municipal governments, by their very nature, are poorly equipped to compete with private enterprises in a highly competitive environment. Some examples of why include:
• Decision Making Process: In a highly competitive environment, decisions must be made quickly. Governments, by their nature, are very slow in making decisions. This often filters down to the golf course where the General Manager is often given little decision-making authority.
• Incentive: Businesses are in business to make money. Good businesses recognize that people in the business world are similarly motivated, so they structure their compensation to reward strong performance financially. This motivation is usually lacking in government operations, where performance often has little to do with compensation.
• Marketing: Because governments are not normally competing with private enterprises, there is rarely a need to develop good marketing skills. Indeed, governments often fail to appreciate the importance of marketing. As a result, municipal golf facilities often do a very poor job marketing themselves.
• Payroll: Payroll is often significantly higher for municipal operations. One of the primary culprits is usually a benefits package that far exceeds those normally found in the golf industry. This is particularly true for the golf course maintenance department.
• Quality of Staff: One of the nice things about working for a municipality is job security. Unfortunately, when competing in a highly competitive environment, this job security works strongly against the municipal operation. Time and again, we find that municipal operations have personnel policies that make it very difficult to get rid of unproductive employees. As a result, the overall quality of the staff tends to go down as not only does the facility suffer from the unproductive employee, other employees’ morale and motivation suffer as they wonder why they should work hard when the other person is getting paid the same amount and goofs off. In private enterprise, with most companies, employees know that if they do good work, they will be rewarded – with better pay or a promotion. They also know that if they do not perform well, they will be looking for a new job -- soon. This double motivation is often lacking in municipal golf operations. (This has not been a big concern at municipality).
As mentioned previously, we have great confidence in the current management teams. We like to see the agreements modified, however, to more of a hybrid format – especially with the equal treatment of revenue streams.
Ramsey County Golf Study Discussion
Sirius Golf Advisors, LLC 357
What to Include
Course Maintenance
A major issue for the County will be whether to include course maintenance. Doing so not only greatly reduces the financial risk for the county but likely save more than $100,000 or more per facility in course maintenance expense. Further, it would allow for optimal coordination between course maintenance and golf operations (although we did not get the sense that this is currently an issue at any of the facilities.)
However, such a move would likely incur the wrath of the unions. It would also present an issue as to what to do with current senior course management personnel, who may not want to transfer to a private operator (usually because of reduced benefits). The County also has the benefit of being able to offer full-time employment for many of its maintenance staff as they switch over to the ice arenas in the golf off-season. This can help attract and retain good employees.
But that also raises the question, if the course maintenance is contracted out, how will that impact the arenas, who rely on golf maintenance staffs to operate the arenas in the off-season for golf?
Another concern is that the termination of a large number of employees may trigger large benefit payouts for unpaid vacation, sick days, etc.
The concern for the employees themselves is mitigated somewhat by the fact that a management company is likely to hire most of the current staff. Further, the County can offer to transfer some of the current employees to other County departments, such as Parks. This would eliminate the need for benefit payouts, as well as address the concerns for the arenas.
However, when faced with these same concerns, other municipalities have realized that the long-term benefits are well-worth the short-term costs.
Capital Equipment
Consideration should also be given to include capital equipment in future operating agreements (golf carts and potentially maintenance equipment, if maintenance is part of the contract).
Capital Improvements
Typically, in these contracts, there is a dollar limit consideration. Capital Improvements below this amount (such as $5,000) are considered operating expenses and are the responsibility of the operator (unless it is a repetitive expense, such as due to poor irrigation).
However, we also encourage including an incentive for the operator to make larger capital improvements that would benefit the operator short-term and the municipality long-term. The clause would basically state that the municipality would reimburse the operator at the end of the contract and any extensions, the depreciated cost of the improvements. However, said improvements would have to be approved by the municipality prior to being made. An excellent example of this would be to add covered, heated stalls at the driving range. The short-term gain for the operator would make this a worth-while investment as the increased revenue stream would likely generate the cash flow for debt-financing the improvements, and the reimbursement at the end of the term should pay off the remaining debt. It also may help give the operator an advantage against potential competition in renewals. The municipality gains because it gets an improved asset at no cost and benefits from increased revenue.
Ramsey County Golf Study Discussion
Sirius Golf Advisors, LLC 358
This is another example of the profit center vs. amenity argument. If our goal is to increase profits, especially short-term, then both course maintenance and capital equipment are included in the management contracts. However, in the amenity approach, where profitability is not a consideration, then course conditions takes precedence and maintaining control becomes more important.
Preferred Contract Model Our preferred contract is the hybrid contract, similar in nature to the one we helped write for the City of Carrollton, Texas.
However, a lease may make sense if it is desired to have the operator participate in the capital improvements. This would not only reduce municipality’s burden, but it can reduce the overall costs of these improvements. A capital lease, though, would require a long-term lease agreement (as is the case with Island Lake and the golf dome). This is both good and bad. The good being that it provides a long-term solution for the golf operation and insures a positive cash flow to the County. Yet, municipalities tend to “forget” about facilities in these long-term deals so that problems are often ignored, which can result in both the county getting back a facility in distress at the end of the lease, and poor service to the community.
We recommend that a hybrid contract contain the following:
• Pooled Revenue: The contract should not be based on a flat fee but should incentivize the contractor to maximize performance in a way that is best for the municipality. We feel the best way to accomplish this is to have all revenue (less cost-of-sales and apart from lessons) be considered equally and subject to the same revenue split.
• Oversite: The contract should contain an oversite mechanism that allows the municipality to inspect the operation on a regular basis (such as twice a year) and have set standards that the contractor should adhere to. If the contractor were not performing to standards, then there are financial consequences. (We further suggest that these inspections be carried out by a qualified third party).
Large vs. Small Interacting with the type of contract is the size of the company that will be involved in management, assuming an outside vendor is used.
There certainly is no shortage of choices as there are dozens of highly qualified management companies available, as well as individuals. Indeed, one of the considerations may be which is better, choosing an individual, a small company or a large company that manages multiple municipal operations.
There are advantages and disadvantages to each: (In our discussion, we are assuming that the entities involved are all qualified to manage the facility in that they have expertise and experience in managing a municipal golf facility).
Individuals
There is probably more variability when looking at individuals than at companies. This can be good or bad. But it does increase the risk.
Pros • Highly Motivated: As an individual’s livelihood likely depends on performance of the contract,
the individual is going to be the most motivated to succeed.

Ramsey County Golf Study Discussion
Sirius Golf Advisors, LLC 359
• Control: The municipality can usually require much stiffer control measures when dealing with an individual over a company
• On Site: The municipality is directly dealing with the person who is onsite managing the facility, rather than having to work through the system.
Cons • Experience: An individual is not likely to have the experience to offer that comes with a
management company.
• Expertise: An individual is likely to have expertise in one or more aspects of operating a facility, but it is very hard to find one that is good at all aspects of operation – including proshop, merchandise sales, golf operations, course maintenance, food and beverage, personnel and marketing.
• Financial Stability: While an individual is going to be the most motivated, they are also likely to be under the greatest stress, especially in a shared-risk type of contract. This can work against the operator as they may start to panic in down times, leading to poor decision making. It can also lead to cutting back on important services, leading to poorer course conditions or customer service. Ultimately, it can lead to a situation where the municipality inherits a situation where the course is suffering from a poor reputation and needed capital improvements.
• Theft: There is also an increased risk of embezzlement or theft when an individual is controlling all aspects of the operation. This is a cash business and it is easy to manipulate the system if there is not close supervision from above from one who knows what to look for.
• Planning: An individual is much more likely to be so caught up in the day-to-day operations, that they simply do not have the time (or won’t make the time) to do needed long-range planning (such as writing a business or marketing plan).
• Resources: An individual is simply not going to have the resources available that a larger firm has.
Small Companies
Small companies will have many of the same advantages and disadvantages seen with both individual and larger companies. By small company, we are talking about a company that is already managing from one to ten other golf courses.
Pros • Highly Motivated: Your contract is going to mean a lot more to a small company than it is to a
large one, so they are going to be a lot more motivated to succeed.
• Control: The municipality can usually require much stiffer control measures when dealing with a small company over a large one.
• Expertise: A small company is more likely to expertise in all areas of golf course management than is possible with an individual.
• Purchase Power: A small company will have greater purchasing power than an individual.
• Track Record: A small company will likely have a track record of managing similar facilities. These will be easier to check than with a large company.
• Continuity: A small company is a lot less likely to be moving personnel around than with a large company.

Ramsey County Golf Study Discussion
Sirius Golf Advisors, LLC 360
• Cost: An individual has less overhead, so can afford to charge less.
Cons • Financial Stability: While a small company is going to be the most motivated, they are also
likely to be under the greatest stress than a larger one, especially in a shared-risk type of contract. This can work against the operator as they may start to panic in down times, leading to poor decision making. It can also lead to cutting back on important services, leading to poorer course conditions or customer service. Ultimately, it can lead to a situation where the municipality inherits a situation where the course is suffering from a poor reputation and needed capital improvements.
• Resources: A small company is simply not going to have the resources available that a larger firm has, although they have more than an individual.
Large Companies
We are defining a “large company” as one that is already managing over ten other golf courses.
Pros • Expertise: A large company is much more likely to have experts in every aspect of operation
who can come in when needed. For example, a larger company is more likely to have the ability to operate a very successful banquet operation in addition to managing the golf course and restaurant.
• Stability: A large company is more likely to be there over the long haul (although companies are constantly changing. But the smaller to mid-size companies are more likely to be absorbed by a larger company).
• Resources: A larger company is going to have more resources available. This can be in terms of personnel, marketing, or even equipment.
• Buying Power: The larger the company, the better the buying power. This can reduce operating costs as well as cost of sales.
• Financial Stability: Presumably the larger the company, the greater the financial stability.
• Investment: A larger company is more likely to have the ability and willingness to make an investment into the facility. This can be extremely important if you are looking for a way to reduce the municipalities capital investment. A larger company may be willing to make significant investment in exchange for a long-term lease.
• Marketing: Larger companies are more likely to not only have better marketing expertise, but even in-house marketing where they can market your facility as part of their overall portfolio. This is a stronger advantage for courses that are going after the tourist market (such as potentially Keller).
Cons • Continuity: A large company tends to move personnel, especially managers, around.
• Priority: Your course(s) may simply not rate very high on their totem pole. Thus, not only will you get less attention, but you are more likely to be used as a “training ground” for managers rather than getting their best.
• System Blind: Larger companies tend to have very detailed systems developed for how they operate and market a facility. This works very well for most courses, but it does not always
Ramsey County Golf Study Discussion
Sirius Golf Advisors, LLC 361
work for every course as markets do vary as do the courses. A large company has more difficulty in adapting to the individual needs of a given facility. And, because of their size, they may be less inclined to want to fix the situation.
• Personal Touch: A large company knows how to get the contract. They may have an entire department that is dedicated to responding to RFPs. They can put on a great “dog and pony show” during the interviews, perhaps even bringing in the Company President and top managers. The problem is, that you will likely never see these people again (until renewal time). The people that are going to be responsible for the day-to-day operations, you may not meet until they take over. Further, because of the bureaucracy involved, you may not be able to interact with the on-site managers, but must work through their system, making it more difficult to control what is going on at a specific course.
• Bureaucracy: The larger the company, the greater the bureaucracy, and the harder it becomes for it to make changes in a timely manner.
• Control: A larger company is going to insist on retaining more control and protecting itself.
• Cost: A larger company is likely to charge a lot more. They not only have a lot higher overhead and a lot of management layers, but they often have stockholders to satisfy.
• Margins: A larger company is often controlled by a board that requires each property to maintain a minimum margin. This can lead to cost-cutting measures that can adversely affect customer service or long-term course conditions.
• Razzle-Dazzle: Large companies will usually have staff whose only job is marketing to municipalities and responding to RFP’s. This means that they will usually have the most professional presentations. And as noted above, they will certainly put on a great dog-and-pony show during their interviews. However, the quality of a response and presentation does not necessarily correlate with the quality of the performance. But more problematic is that they can be a lot more difficult to perform needed due diligence. This is because they usually put into their contracts with municipalities that forbid the municipality from ever disclosing any negative information about the company to any potential employer. Thus, even when they lose contracts, it may be very difficult to ascertain why they lost them. And it is highly unlikely the management company is going to provide you with any explanation that would reflect badly on themselves.
Single Vendor Currently the County has five vendors for six facilities. Yet, there are some reasons why it makes sense to have a single operator, at least for the golf courses. These include:
1) Administrative: One vendor, one contract is a lot easier (and less costly) to administer.
2) Customer Service: Under a single vendor, there should be more consistency across facilities.
3) Marketing: It is easier to brand, and more cost-effective to market, when there is only one vendor involved.
4) Merchandising: Merchandising operations is standardized across facilities. Further, the facilities benefit from the combined buying power.

Ramsey County Golf Study Discussion
Sirius Golf Advisors, LLC 362
5) Operating Costs: Operating costs are likely to be less as there are efficiencies to be gained with a single vendor.
6) Equipment/Personnel Sharing: It is easier to share equipment and/or personnel. This can be extremely useful for large projects or in emergency situations. It can also reduce equipment costs as some of the more expensive but less used equipment can be shared across facilities.
7) Management: Course policies would be standardized. There would likely be one person that would oversee the entire operation, which can improve management responsiveness.
8) Expertise: Presumably, with multiple facilities, you would attract the interest of most of the large management companies in the country. They can provide additional expertise and resources that are not currently available.
On the other hand, the current operators are doing a great job. So, you do not necessarily want to eliminate them from consideration. Further, there is the added risk that if you hire the wrong company, it will adversely affect the performance of all the facilities, rather than just one.
Our recommendation is to work with the operators to have all the current contracts expire at the same time. Then when an RFP is issued, provide the responders with the option of bidding on a single facility, multiple facilities, or all the facilities. The County can then evaluate the responses based on its needs at that time. And if a single vendor appears to be the best solution, perform a strong due diligence on the potential vendor. Consider hiring an outside, objective company to assist in the evaluation.
How to Choose the Right Vendor Regardless of whether you want an individual, small company or large company, you will find that there are very good ones, and ones that are not. And with management companies, especially larger ones, you find that they may have spectacular successes (which they will point out), but also equally spectacular failures (which they won’t point out). In other words, what works for one course and one municipality may not be the best choice for your situation.
So how can you maximize your chances to find the best solution? Here are some pointers:
1. Choose Type of Contract First: Know what contract type you are wanting before trying to select the right vendor. If you are going after a shared risk type of contract (e.g. lease or hybrid), then financial stability is more of a consideration. If you are looking for an investment, it is going to greatly limit the field.
2. Do Your Homework: It is not enough to simply check references. Everyone is going to provide good references. What you need to check on are courses that they managed they did NOT provide.
a. Visit: Try to visit one or more of their operations in secret to see how they operate. (Or hire someone to do so).
b. Research Lost Contracts: Try to get a list of properties where they managed the facility, then lost the contract. Keep in mind that large companies have a clause in their contracts that forbid the municipalities from giving a poor reference. Thus, you may want to talk to individuals (customers, employees, other area courses) that may have knowledge of the situation. Do not trust the management company to give you the correct information.
Ramsey County Golf Study Discussion
Sirius Golf Advisors, LLC 363
3. Area Knowledge: Did the management company do their homework on you and your situation? What is right for their other customers may not apply in your situation.
4. Slick Sales: Large companies have developed very slick sales presentations that are highly effective. Keep in mind that the people delivering this presentation 1) did not develop it, and 2) are not the ones who will be managing your facilities.
5. Talk to the Actual Managers: Again, with large companies, find out who they are likely to be putting in charge of your facilities and talk to them about their philosophies, not just the company.
6. Aligned Interests: Does what they emphasize line up with what are your primary interests?
7. Risk: Are they willing to share risks? Or are they going to make out just fine, no matter how well the facility performs?
Importance of Golf In our interviews with County Commissioners, the question was raised about the importance of golf to the community. While this discussion is beyond the scope of the study, we like to point out some of the more salient benefits of golf as a recreational activity.
• Popular: According to NGF, more than one in five households in Ramsey County have at least one golfer.
• Generational: Golf is one of the few sports that spans all age groups, from near cradle to grave. More impressive, perhaps, is that it allows for competitive balance across age, gender and virtually all demographics. It is one of the few sports where a grandfather (or grandmother) can play with, and compete fairly, with their son (or daughter) and their grandchildren.
• Accessible: While golf is a physical activity, it allows for participation from people across the spectrum of physical ability, including the handicapped. (Island Lake has a wonderful program for the handicapped in cooperation with Sister Kenny Institute.)
• Builds Character: Golf is one of the few major sports that is self-refereed, even in major competitions. Honor is one of the fundamental principles in golf.
• Exercises Mind and Body: Golf is more than physical ability. It also requires strategy and risk/reward calculations. And even if you take a golf cart, you are still likely to do a lot of walking (often over 10,000 steps), in addition to the swinging of a club. (If you’re like me, you do a lot more walking and swinging).
• Preserves Valuable Green Space: Not only does golf conserve green space, but it often utilizes land that has little commercial or residential value, such as flood plains or even landfills.
• Aesthetics: Golf courses are mostly aesthetically pleasing. That is why they are so popular in residential neighborhoods where less than a third of the home owners will play golf.
• Economic Benefit: There are a lot of economic benefits to the County from golf. They include:
o RCG’s four main courses generated:
▪ Over $5.5 million in revenue last year
▪ Over $430,000 in sales tax
▪ Employment for over 227 people

Ramsey County Golf Study Discussion
Sirius Golf Advisors, LLC 364
o Property Values: Property values around a golf course tend to be higher than comparable neighborhoods. The increase can be 20% or more.
o Help attract residents and businesses. Information about local golf courses is one of the four top requested items from businesses wanting to relocate.
Role of Municipal Golf Another controversial topic is whether municipalities should even be in the golf business. After all, they are competing directly with privately-owned businesses. Again, this is beyond the scope of our study, but we want to point out a little history.
Municipal golf across the country, including Ramsey County, has its origins back when the only golf courses available were private country clubs. In those days, golf truly was an exclusive sport, reserved for the wealthy. Municipalities built golf courses to bring the sport to the general population. In those days, golf was treated by municipalities strictly as an amenity, as was tennis, swimming, hockey and other sports activities. Many of today’s golfers owe their start in golf to municipal facilities. (Municipal facilities are still the leader in bringing in new players to the sport.)
This began to change in the 1980’s and especially the 1990s. Fueled by real estate developers who realized golf was an attractive amenity for residential developments, privately owned public-accessible golf courses (“Daily Fee” and “semi-private” courses) began to flourish.
At the same time, municipalities started realizing that golf could be a “cash cow,” generating enough revenue to not only be self-supporting, but also help support other community programs. They also discovered that golf courses could have “iconic” value and be used to attract new businesses and residents to the community. At this point, municipalities started treating golf as less an amenity and more as a profit center.
In the decade from 1995-2005, we saw nearly 5,000 new golf courses being built, representing a third of the total number of golf courses. This led to an over-supply of golf courses across the country, which, coupled with the recession, created a situation where golf courses struggled to survive.
Adding to the problem is the fact that as golf’s popularity started to wane, construction and maintenance costs soared at a rate many times that of inflation. Meanwhile, competitive pressures caused fees to not keep up with costs. This shrinking margin has caused a lot of private operators, especially those operating lower-end facilities where the margin is very low, out of business.
In short, the cycle is returning to the point where municipalities are the only entities that can afford to support golf, especially for lower-priced facilities that are more accessible to the masses. Without municipally-owned facilities, golf is likely to return to the period where only the rich can afford to play.
Economic Impact Golf Courses do have an economic impact on the community in which they are located. This impact is seen in several ways, including:
• Employment: Golf courses typically employ 25-50 people or more. With RC Golf, there are around 225-230 people employed either full or part-time.
• Sales Tax: Golf courses, as retail operations, generate sales tax. RC Golf Courses generated about $430,000 in sales tax last year.
• Property Tax: Privately owned golf courses pay property taxes.

Ramsey County Golf Study Discussion
Sirius Golf Advisors, LLC 365
• Revenue: Golf courses generate a lot of revenue, much of which is reinvested locally. Last year, RC Golf Courses generated over $5.5 million in revenue.
• Property Values: Golf courses have a positive impact on property values around the golf course. While the residences that front the golf course see the greatest impact, the property values of any neighborhood around a golf course will see a positive benefit. This, in turn, increases the property taxes generated for the municipality.
• Amenity: As a valued amenity, a golf course helps attract new residences and new businesses to a municipality. In fact, area golf courses are known to be a consideration of companies seeking to relocated.
Other Considerations
Goodrich as a Loss-Leader Given that Goodrich is currently losing money, there may be some concern as to whether the County should consider closing it. We feel there are several compelling reasons why Goodrich should be kept open.
1. Improving: Performance at Goodrich is steadily improving, despite the deferred maintenance concerns.
2. Hybrid: Goodrich can easily be made profitable by converting the contract to a Hybrid and including course maintenance. It would make no sense to argue that Goodrich should be closed because it is losing money and then ague against privatizing it because it would potentially cost some County employee’s their jobs. Because, if it closes, they are out of a job anyway. And by privatizing, they would likely not be out of a job, just changing employers.
3. Community Need: But perhaps the most compelling argument is that Goodrich fills a valuable need in the marketplace – a quality low-cost golf course. And this would only be enhanced by repositioning the course as a Value facility. This will make it easier for those wanting to take up golf, making it more affordable.
Value facilities are disappearing at an alarming rate. If the trend continues, it will return golf to the days when only the rich could afford to play. And that would deprive a lot of people of a wonderful outdoor activity that can be enjoyed by people of all ages and physical ability.
4. System: As a value course, Goodrich will fill a key role in the overall RC Golf System. It will act like a “feeder” course to the rest of the system… helping develop new golfers and attract golfers from other areas. In this sense, Goodrich can be thought of as a “loss-leader.”
5. Displaced Golfers: Should the County adopt our recommendation for capital improvements at Manitou and Battle Creek, Goodrich will be needed to accommodate the displaced golfers resulting from the construction.
6. Keller: If Keller is made into a Premium facility as recommended, then some of the value-oriented current customers are likely to play more at Goodrich and Manitou.
Ramsey County Golf Study Discussion
Sirius Golf Advisors, LLC 366
7. Can Be Profitable: Most importantly, though is the fact that we feel Goodrich can be made into a profitable operation!
That being said, we do not believe RC Golf needs to have two loss-leaders. But both Goodrich and Battle Creek have options available that would make them profitable.
Facility-Specific Projections Our projections are facility-specific. In other words, they fail to show the impact of the other facilities’ situation on the target facility. For example, if Manitou is reduced to nine holes for renovations, one would expect that rounds at both Goodrich and Keller would go up during this period. But this is not shown. Nor is it shown the impact of a facility’s degradation (under Status Quo) would likely have on the other courses.
The main reason for this is that when you consider four facilities, each with at least two different scenarios, and different timing options for each, you end up with a seemingly endless number of possible combinations. This is both cumbersome and confusing to the reader.
We also feel that the facility-specific approach is more conservative with regards to that facility’s performance. Thus, it better allows for measuring the impact of the renovations on that facility.
Island Lake We do not talk much about Island Lake in this report as it is currently under a capital lease. Yet we do need to acknowledge there has been some discussion of developing the property once the current lease expires. Clearly such a decision would be based on optimizing financial return as it is permanently removing an amenity from the system.
We hope that the County will consider the following in its decision making-process:
• Profitable: According to the operator, the facility is profitable, even after taking the $75,000 annual lease payment into consideration.
• Amenity Value: Island Lake is a very valuable asset within RC Golf, even though its role is not being fully realized by the County. It is a great teaching facility, and the best facility in the system for juniors. It is also the most affordable golf facility in the system.
• Outreach: Island Lake has done an outstanding job in community outreach, with programming for many area schools, the local YMCA, and other community groups. It also has outstanding programming for juniors and seniors. And it is the only facility in the system with significant programming for the handicapped.
When a Loss is a Gain In competitive markets, often we see operators playing not to lose, rather than playing to win. As with sports, this strategy often backfires. What do we mean by this? It occurs when operators become overly concerned about losing the customers rather than seeking other customers who may be both more numerous and more profitable (higher yield rounds).
Of course, it is important to retain your customers. Yet, not all customers are created equal. Indeed, we have found that some customers (and customer-types) can inhibit profitability. This is because they demand (and get) such low rates in order to remain that they produce such yields that fails to cover costs.

Ramsey County Golf Study Discussion
Sirius Golf Advisors, LLC 367
Thus, sometimes it becomes necessary to “fire your customer” when they are a significant impediment to your long-term success. An example may be where you are giving your members such good rates, that they are average 40% or lower yield, per round, than non-members. Further, they are given priority on the highest-demand times that could otherwise be filled with the highest yield rounds, furthering the yield differential. In our studies, we will find cases where members are averaging such a low yield on weekend mornings alone, that the difference between their yield and what could be realized is significantly more than the total annual revenue received from the members.
We like to say, “when your marketing strategy is the dollar, then you are going to attract customers that are loyal to the dollar, rather than to you.” If you are providing a quality product with quality service, you should be able to attract customers willing to pay market competitive rates.
We see this happening with groups. Operators will give a particular group (such as seniors, club members, a particular league, etc.) a drastic discount and/or preferred teetimes in order to attract and/or retain their business. Granted, there are situations where this might be merited. But too often it’s because the operator finds this to be easier than to spend the money on marketing to attract less price-sensitive customers. As a result, they end up getting a yield far below what they should be realizing. Further, other groups may learn of the special rates or privileges and demand that they too, should get the same treatment. Pretty soon you are operating at a margin where even though you may have good volume, you are not realizing a profit. Moreover, you are constantly at risk of losing these groups because they are loyal not to you, but to the dollar – the rate you are giving them. All it takes is another desperate operator to give them a rate that is a dollar less, and they are gone.
Debt Financing It is highly likely that the County will use bonds to finance any major improvements to the golf courses. In our projections, we have assumed an interest rate of 3.3%, which we feel is conservative.
However, consideration may need to be given to using taxable bonds, instead of non-taxable. The reason is that with non-taxable bonds can limit the management options for the facilities. With non-taxable bonds, the IRS places limits on a management company’s ability to share in the profitability of the facility. This removes an important incentive and limits the types of contracts available.
Pavilions At both Goodrich and Manitou, we recommend considering adding Pavilions that could hold 150 guests or more. This will allow the facilities to host larger groups, such as tournaments and outings, and possibly weddings. These pavilions are likely to cost between $100,000 and $250,000. (The cost can be greater, if restrooms or other amenities are included).
Rounds Reports It should be noted that the round counts in this report have been adjusted from what has previously been disclosed by the Parks Department as some rounds were accidentally double counted – especially at Manitou. There were also errors in how rounds were categorized in the POS system at some of the courses.
Ramsey County Golf Study Discussion
Sirius Golf Advisors, LLC 368
Covered Stalls Island Lake is the only facility that offers covered stalls on the range, and it only has two. Given the uncertain weather in the spring, we strongly encourage more covered and heated stalls be added – both at Island Lake and at the other facilities – especially Battle Creek. Battle Creek would benefit from the addition of 10-20 covered and heated stalls. These are not expensive to build, and would greatly expand the utilization of the range, especially in poor weather. At least a couple of these should be fully enclosed so that they can have video cameras set up as a teaching aide.
We did do a preliminary look at the feasibility of adding a double deck to Battle Creek, but found it cost prohibitive. It is easier to expand the range as proposed in Scenario 2 or add an additional range as in Scenario 3.
Golf Surf Boards Golf surf boards are one-person golf carts that resemble a surf board. The golfer, usually standing (although some companies have a seat), steers the cart by shifting their weight, much like a surf board. The boards are powered by an electric motor.
Golf surf boards, which run about $6,000 or more each, have proven to be very popular. They are also profitable as most operators charge a surcharge (on top of regular cart fees) for their use.
There are some liability concerns, so manufacturers usually require the customer to sign a waiver (as does the facility), and at least one manufacturer requires the customer to watch a video and undergo a quick training course before being allowed to rent one.
They are popular with both millennials, and perhaps surprisingly, seniors. But because of their novelty, they do help reach new markets.
We encourage RC Golf (and/or its operators) to investigate the golf boards and to install them at one or more of the facilities. If they work well, then the program could be expanded to all the facilities.
Foot Golf Several area facilities also offer foot golf at their course. Foot golf is a combination of golf and soccer. “Goals” are placed around the golf course. Players use a soccer ball (one per player) and count how many kicks it takes to get from the tee into the goal. The course is usually about half the length of a regulation golf course, meaning a nine-hole regulation course can support 18 holes of foot golf. So, most facilities offering foot golf, do so on only nine holes.
As with regular golf, Foot Golf is usually played by foursomes (or smaller). And operators find they can integrate foot golf players in with regular golfers on the same course as it takes them about as long to complete the entire course, so they do not hold up play.
Foot golf fees are usually a lot less than regular golf, although the operator does usually charge for renting a soccer ball if they player does not bring their own.
Because the fee structure is lower, Foot Golf is usually reserved for slower times on the golf course, as it generates a lot less revenue per teetime. Foot Golf is almost exclusively an activity for youths.
Foot Golf does not add much to the bottom line. It does provide for a wider market for the use of the golf course. However, its audience is still limited.
Ramsey County Golf Study Discussion
Sirius Golf Advisors, LLC 369
Because there are several courses in the area that offer it, and because the RC courses are relatively busy, and the fact that Foot Golf does not add a lot to the bottom line, we do not have a strong recommendation for implementing it. However, it might be nice for one of the courses (Island Lake and Goodrich being the obvious candidates), just so it can be a part of the Parks and Recreation portfolio and allow the County to be offering a nice amenity for youths in the area.
Golf Simulators, Winter Activity There has been some discussion about offering winter activities at the golf courses, such as cross-country skiing. Another potential winter activity that could be done in conjunction with the skiing, is to add golf simulators to the clubhouse and open the clubhouse for food and beverage. The F&B would serve both the skiers as well as the simulator customers.
The simulators can be set up in the grill areas, as the amount of seating can be dramatically reduced in the winter. The simulators can be temporary – put up when the course closes and taken down when it reopens. The cost of these simulators has come down dramatically, and the quality has steadily improved. Not only have they proven popular, but they can also be used as a teaching tool.
The simulators could also be used with school and youth programming.
Hours would coincide with peak skiing demand times, plus Friday and Saturday evenings.
When to Close a Course With Goodrich and Battle Creek both currently losing money, the question becomes “When should we consider closing a course?” Obviously, this is not a simple question, nor is the answer.
We cannot answer this question as it will depend on values of the municipality, the market and the golf course in question. But we can provide some insight. Below are some of the considerations we encourage a municipality to employ.
• Permanent: A wise person pointed out, “be cautious about a permanent solution to a temporary problem”. Closing or selling a golf course is a permanent solution. It forever removes what is likely to have been a very valuable asset to the community. Closing or selling a golf course should be taken at least as seriously as removing a park. If you are closing the course, you are removing an asset that is being enjoyed by thousands of citizens. Even if you are selling the course in the hopes that it remains a golf course, once it is sold, there is no guarantee that it will remain a golf course – and if it is, that it will continue to service the same market it currently serves. (Even if it is sold under the condition it remains a golf course – history has shown that operators have gotten around this by closing the course and making it an eyesore so that the municipality – under different political leadership – relents and allows it be developed).
• Philosophical Direction: A major consideration goes back to our original question: what is the Philosophical Direction for the golf operation? To the degree that mission includes serving as an amenity to the citizens of the municipality, then a greater degree of tolerance to loss is expected. On the other hand, if profitability is the goal and the operation is losing money, then closing becomes a bigger consideration.
• Why is it losing money? The next question then becomes, “why is it losing money?” If the reason involves issues that can be easily fixed (as it is with Goodrich and Battle Creek), then it would make sense to try to fix the problem first. (Avoid a permanent solution to a temporary problem.)
Ramsey County Golf Study Discussion
Sirius Golf Advisors, LLC 370
• Impact: Closing a course impacts more than the golfers who play the course. It can have a dramatic impact on property values around the course. It can make the community and especially the neighborhood around the course, less attractive to both residents and businesses. If the course is developed, it permanently removes valuable greenspace and may add stress to other community resources such as traffic and schools. As pointed out above, golf courses have an economic impact that goes far beyond the operation profit or loss.
• Long-Term Cost: On the other hand, golf courses do require an ongoing investment in capital improvements. A municipality needs to weigh the return on investment of these improvements. (In the case of RC Golf, we have shown a positive ROI on the recommended improvement scenarios).
• Alternative Uses: If the course is to be closed or considered for sale, what are the alternative uses for the property? In today’s market, most of the alternative uses involve development. This certainly can generate revenue for the municipality both short-term and long-term (property taxes). But it also adds to traffic congestion, impact on schools and other resources, etc. Some properties are also not suitable for development. Golf courses often lie in flood plains that make them difficult to develop. Others (such as Battle Creek) do not have particularly desirable locations, at least for residential development.
• On Going Costs: What is often not considered enough by municipalities, is the cost to close – if the golf course land is not sold or developed. Most alternative uses for golf courses that do not include development, are money-losing as well. Parks need to be maintained. And this costs money. Further, there is going to be a significant cost involved in converting the course to its alternative use. Often, this cost can be as much or more than the capital improvements needed to make the golf course profitable, but without the possibility of ever making the land revenue positive.
• Market Value: Unless the golf course is being considered for development, or is making a lot of money, golf courses in today’s market, do not have a lot of value. There is an abundance of golf courses in the market today, suppressing golf course values. Further, it is hard to get financing to purchase golf courses, making the market for buyers more limited. A golf course’s market value in today’s market is determined by one of the following: 1) underlying real estate value (for development); 2) 10 times the NOI; or 3) .8 to 1.2 times the gross revenue. By these measures, neither Goodrich nor Battle Creek would generate a market value over $1 million – unless sold for development.
In our opinion, we recommend against closing any of the RC Golf Courses. We feel all the courses can be made profitable and sustainable, with County investment. Further, selling any of the courses (except Keller) as a golf course would not generate enough revenue to make a long-term difference. An argument can be made for selling a golf course with the idea that the return could be used to fund capital improvements at the other courses, but only if the County is willing to let that property be developed and thus, maximizing its market value. But then the County will have to deal with political cost of permanently removing an asset, loss of a community amenity, and denying the current customers their favorite course.

Ramsey County Golf Study Appendices
Sirius Golf Advisors, LLC 371
Appendix A: Trends
Appendix B: Summary Demographics
Appendix C: Golf Demand Analysis
Appendix D: Competition
Appendix E: Performance
Appendix F: Customer Survey
Appendix G: Infrastructure Life Expectancies
Appendix H: Construction Cost Estimates
Appendix I: Course Routings
Appendix J: Cash Flow Projections
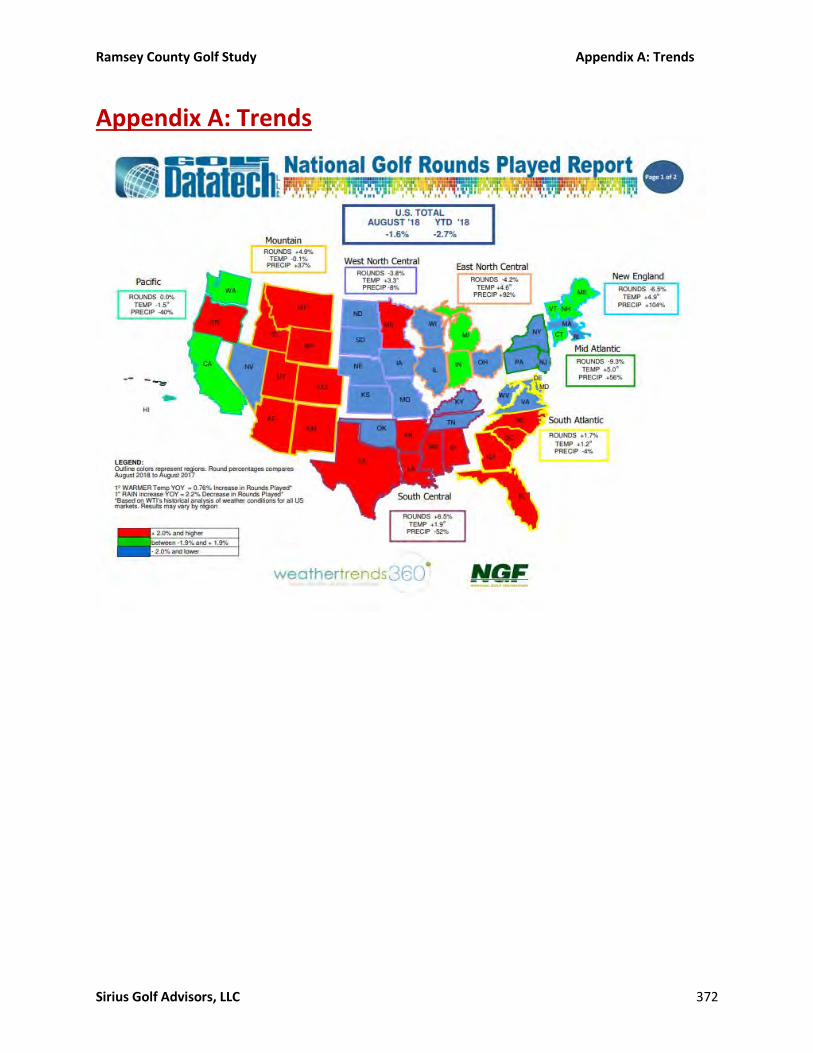
Ramsey County Golf Study Appendix A: Trends
Sirius Golf Advisors, LLC 372
Appendix A: Trends

Ramsey County Golf Study Appendix A: Trends
Sirius Golf Advisors, LLC 373

Ramsey County Golf Study Appendix B: Summary Demographics
Sirius Golf Advisors, LLC 374
Appendix B: Summary Demographics
Summary of Demographics Battle Creek Goodrich Island Lake
5 Mi 10 Mi 5 Mi 10 Mi 5 Mi 10 Mi
Summary Demographics
Population growth 1990-2000 2.45% 1.46% 1.17% 1.11% 0.35% 0.69%
Population Growth 2000-2010 0.74% 0.42% 0.15% 0.32% -0.09% 0.14%
Population Growth 2017-22 0.96% 0.89% 1.00% 0.88% 0.78% 0.97%
Population Growth 2010-2022 0.84% 0.90% 1.01% 0.90% 0.85% 1.00%
Population 2017 209,407 652,778 259,997 729,047 177,791 1,037,642
Median HH Income $66,908 $67,496 $55,204 $67,010 $73,476 $59,641
Median Age 34.8 35.8 33.7 36.1 41.4 34.5
# Households 74,995 251,527 96,814 282,678 73,534 408,146
Ethnicity
% White 64.9% 68.9% 70.1% 71.9% 57.8% 70.1%
% African American 11.2% 11.0% 10.4% 11.7% 13.4% 10.4%
% Asian 14.5% 12.6% 12.5% 8.9% 20.2% 12.5%
% Other 9.5% 7.5% 7.1% 7.6% 8.6% 7.1%
% Hispanic 11.3% 8.3% 7.5% 7.3% 9.1% 7.5%
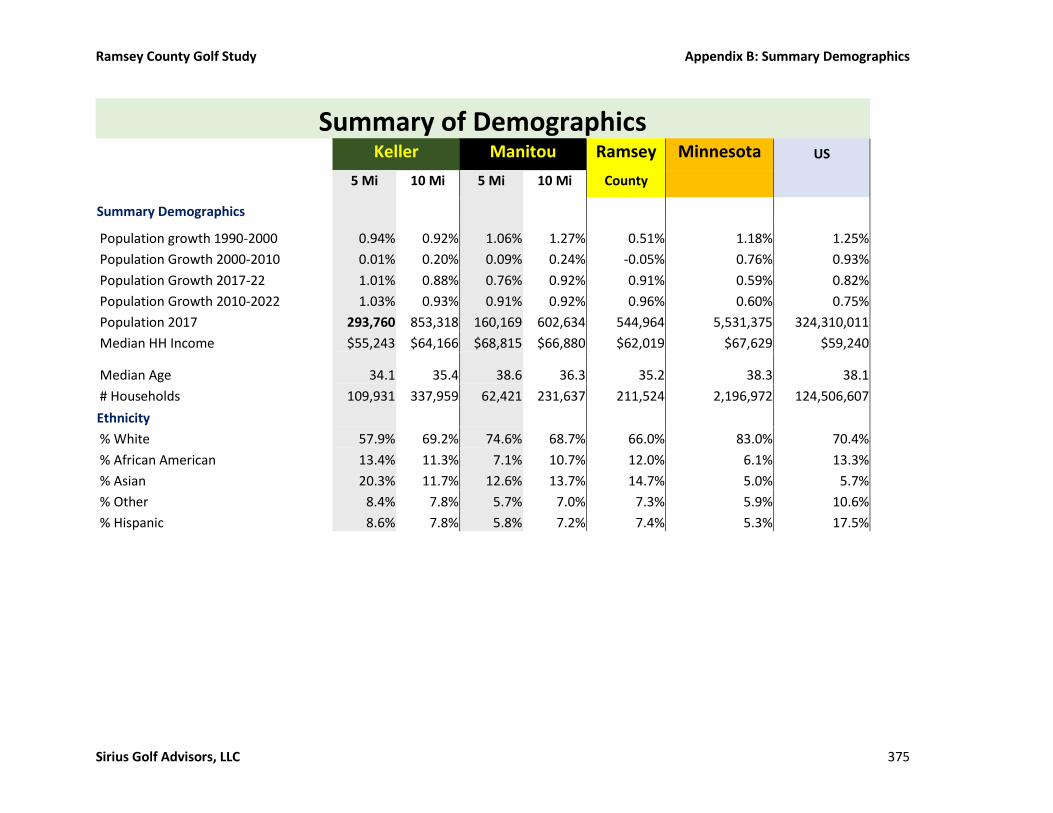
Ramsey County Golf Study Appendix B: Summary Demographics
Sirius Golf Advisors, LLC 375
Summary of Demographics
Keller Manitou Ramsey Minnesota US
5 Mi 10 Mi 5 Mi 10 Mi County
Summary Demographics
Population growth 1990-2000 0.94% 0.92% 1.06% 1.27% 0.51% 1.18% 1.25%
Population Growth 2000-2010 0.01% 0.20% 0.09% 0.24% -0.05% 0.76% 0.93%
Population Growth 2017-22 1.01% 0.88% 0.76% 0.92% 0.91% 0.59% 0.82%
Population Growth 2010-2022 1.03% 0.93% 0.91% 0.92% 0.96% 0.60% 0.75%
Population 2017 293,760 853,318 160,169 602,634 544,964 5,531,375 324,310,011
Median HH Income $55,243 $64,166 $68,815 $66,880 $62,019 $67,629 $59,240
Median Age 34.1 35.4 38.6 36.3 35.2 38.3 38.1
# Households 109,931 337,959 62,421 231,637 211,524 2,196,972 124,506,607
Ethnicity
% White 57.9% 69.2% 74.6% 68.7% 66.0% 83.0% 70.4%
% African American 13.4% 11.3% 7.1% 10.7% 12.0% 6.1% 13.3%
% Asian 20.3% 11.7% 12.6% 13.7% 14.7% 5.0% 5.7%
% Other 8.4% 7.8% 5.7% 7.0% 7.3% 5.9% 10.6%
% Hispanic 8.6% 7.8% 5.8% 7.2% 7.4% 5.3% 17.5%

Ramsey County Golf Study Appendix C: Golf Demand Analysis
Sirius Golf Advisors, LLC 376
Appendix C: Golf Demand Analysis
Summary of Demographics and Golf Demand
Battle Creek Goodrich Island Lake
5 Mi 10 Mi 5 Mi 10 Mi 5 Mi 10 Mi
Summary Demographics
Population 2017 209,407 652,778 259,997 729,047 177,791 1,037,642
Median HH Income $66,908 $67,496 $55,204 $67,010 $73,476 $59,641
Median Age 34.8 35.8 33.7 36.1 41.4 34.5
# Households 74,995 251,527 96,814 282,678 73,534 408,146
Ethnicity
% White 64.9% 68.9% 70.1% 71.9% 57.8% 70.1%
% African American 11.2% 11.0% 10.4% 11.7% 13.4% 10.4%
% Asian 14.5% 12.6% 12.5% 8.9% 20.2% 12.5%
% Other 9.5% 7.5% 7.1% 7.6% 8.6% 7.1%
% Hispanic 11.3% 8.3% 7.5% 7.3% 9.1% 7.5%
Golf Demand
Golfing Households 15,558 52,987 18,603 61,335 18,183 78,835
% Participation 20.7% 21.1% 19.2% 21.7% 24.7% 19.3%
Projected Golfing Households 2022 16,598 55,881 19,589 64,458 18,967 83,443
% Growth 6.7% 5.5% 5.3% 5.1% 4.3% 5.8%
Number of Golfers 19,972 66,526 23,078 75,728 21,730 97,602
% Population 9.5% 10.2% 8.9% 10.4% 12.2% 9.4%
Rounds Potential 342,624 1,191,742 410,879 1,407,118 178,991 688,548
Rounds in market 172,902 749,226 220,474 845,883 178,991 688,548
Number of Latent Golfers 30,534 103,261 40,864 116,521 28,707 170,679
% Population 14.6% 15.8% 15.7% 16.0% 16.1% 16.4%
Demand Indices
Household Participation Rate 150 153 139 157 179 140
Latent Demand 121 126 126 128 127 132
Rounds/Household 121 126 116 136 168 117
Golf Supply
Total Facilities 6 24 6 30 7 23
Public 6 20 6 22 5 17
Private 0 4 0 8 2 6
Public by Price point
Premium (>70) 2 3 1 2 0 1
Standard ($40-$69) 1 9 4 11 2 11
Value (<$40) 3 8 1 9 3 5
Golf Holes
Total 81 387 108 477 99 378

Ramsey County Golf Study Appendix C: Golf Demand Analysis
Sirius Golf Advisors, LLC 377
Summary of Demographics and Golf Demand
Battle Creek Goodrich Island Lake
5 Mi 10 Mi 5 Mi 10 Mi 5 Mi 10 Mi
Public 81 315 108 333 63 270
% Public 100.0% 81.4% 100.0% 69.8% 63.6% 71.4%
Private 0 72 0 144 36 108
Non-Regulation (Par 3, Exec) 18 81 18 81 27 54
% Non-Regulation 22.2% 20.9% 16.7% 17.0% 27.3% 14.3%
Net Change
Percentage Total Holes last 5 yrs. -18.2% -10.4% 0.0% -5.4% 0.0% -2.3%
Percentage Total Holes Last 10 yrs. -18.2% -14.0% -14.3% -8.6% 0.0% -6.7%
Supply Demand Ratios
Golfing Households per 18 Holes
Total 3,457 2,465 3,101 2,315 3,306 3,754
Public 3,457 3,028 3,101 3,315 5,195 5,256
Premium 7,779 17,662 18,603 30,668 xx 78,835
Standard 15,558 5,578 4,651 5,576 9,092 7,167
Value 10,372 10,597 18,603 11,152 12,122 26,278
Private xx 13,247 xx 7,667 9,092 13,139
Golfing Household Indices
Total 280 199 251 187 267 304
Public 203 178 182 195 305 308
Premium 76 174 183 302 xx 775
Standard 394 141 118 141 230 182
Value 244 249 438 262 285 618
Private xx 294 xx 170 202 292
Estimated Rounds/ In market Courses 38,423 34,848 68,480 53,099 32,544 32,788
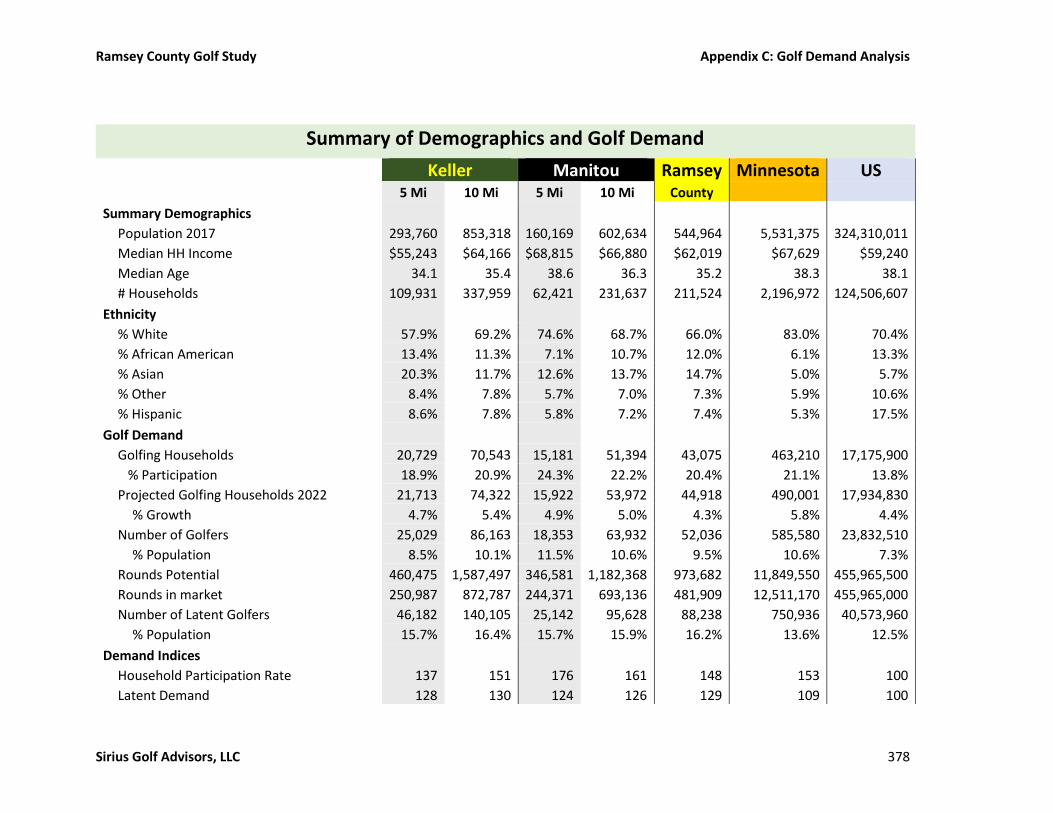
Ramsey County Golf Study Appendix C: Golf Demand Analysis
Sirius Golf Advisors, LLC 378
Summary of Demographics and Golf Demand
Keller Manitou Ramsey Minnesota US
5 Mi 10 Mi 5 Mi 10 Mi County
Summary Demographics
Population 2017 293,760 853,318 160,169 602,634 544,964 5,531,375 324,310,011
Median HH Income $55,243 $64,166 $68,815 $66,880 $62,019 $67,629 $59,240
Median Age 34.1 35.4 38.6 36.3 35.2 38.3 38.1
# Households 109,931 337,959 62,421 231,637 211,524 2,196,972 124,506,607
Ethnicity
% White 57.9% 69.2% 74.6% 68.7% 66.0% 83.0% 70.4%
% African American 13.4% 11.3% 7.1% 10.7% 12.0% 6.1% 13.3%
% Asian 20.3% 11.7% 12.6% 13.7% 14.7% 5.0% 5.7%
% Other 8.4% 7.8% 5.7% 7.0% 7.3% 5.9% 10.6%
% Hispanic 8.6% 7.8% 5.8% 7.2% 7.4% 5.3% 17.5%
Golf Demand
Golfing Households 20,729 70,543 15,181 51,394 43,075 463,210 17,175,900
% Participation 18.9% 20.9% 24.3% 22.2% 20.4% 21.1% 13.8%
Projected Golfing Households 2022 21,713 74,322 15,922 53,972 44,918 490,001 17,934,830
% Growth 4.7% 5.4% 4.9% 5.0% 4.3% 5.8% 4.4%
Number of Golfers 25,029 86,163 18,353 63,932 52,036 585,580 23,832,510
% Population 8.5% 10.1% 11.5% 10.6% 9.5% 10.6% 7.3%
Rounds Potential 460,475 1,587,497 346,581 1,182,368 973,682 11,849,550 455,965,500
Rounds in market 250,987 872,787 244,371 693,136 481,909 12,511,170 455,965,000
Number of Latent Golfers 46,182 140,105 25,142 95,628 88,238 750,936 40,573,960
% Population 15.7% 16.4% 15.7% 15.9% 16.2% 13.6% 12.5%
Demand Indices
Household Participation Rate 137 151 176 161 148 153 100
Latent Demand 128 130 124 126 129 109 100

Ramsey County Golf Study Appendix C: Golf Demand Analysis
Sirius Golf Advisors, LLC 379
Summary of Demographics and Golf Demand
Keller Manitou Ramsey Minnesota US
5 Mi 10 Mi 5 Mi 10 Mi County
Rounds/Household 114 128 152 139 129 109 100
Golf Supply
Total Facilities 7 31 8 24 16 438 14,754
Public 7 23 5 18 13 392 11,006
Private 0 8 3 6 3 46 3,748
Public by Price point
Premium (>70) 0 1 0 1 0 26 1,393
Standard ($40-$69) 5 12 4 11 7 170 4,087
Value (<$40) 2 10 1 6 6 196 5,526
Golf Holes
Total 117 486 144 405 243 6,894 250,146
Public 117 342 90 297 189 6,093 181,458
% Public 100.0% 70.4% 62.5% 73.3% 77.8% 88.4% 72.5%
Private 0 144 54 108 54 801 68,688
Non-Regulation (Par 3, Exec) 27 90 18 72 45 801 20,277
% Non-Regulation 23.1% 18.5% 12.5% 17.8% 18.5% 11.6% 8.1%
Net Change
Percentage Total Holes last 5 yrs. 0.0% -5.3% 0.0% -6.3% 0.0% -5.4% -5.3%
Percentage Total Holes Last 10 yrs. -13.3% -8.5% -11.1% -10.0% -6.9% -7.9% -7.1%
Supply Demand Ratios
Golfing Households per 18 Holes
Total 3,189 2,613 1,898 2,284 3,191 1,209 1,236
Public 3,189 3,713 3,036 3,115 4,102 1,368 1,704
Premium xx 70,543 xx 51,394 xx 13,827 10,169
Standard 4,146 5,879 3,795 4,469 6,154 2,517 3,946
Value 13,819 11,757 15,181 12,849 12,307 3,828 4,253

Ramsey County Golf Study Appendix C: Golf Demand Analysis
Sirius Golf Advisors, LLC 380
Summary of Demographics and Golf Demand
Keller Manitou Ramsey Minnesota US
5 Mi 10 Mi 5 Mi 10 Mi County
Private 0 8,818 5,060 8,566 14,358 10,409 4,501
Golfing Household Indices
Total 258 211 154 185 258 98 100
Public 187 218 178 183 241 80 100
Premium xx 694 xx 505 xx 136 100
Standard 105 149 96 113 156 64 100
Value 325 277 357 302 289 90 100
Private xx 196 112 190 319 231 100
Estimated Rounds/ In market Courses 38,613 32,325 30,546 30,806 35,697 32,666 32,809
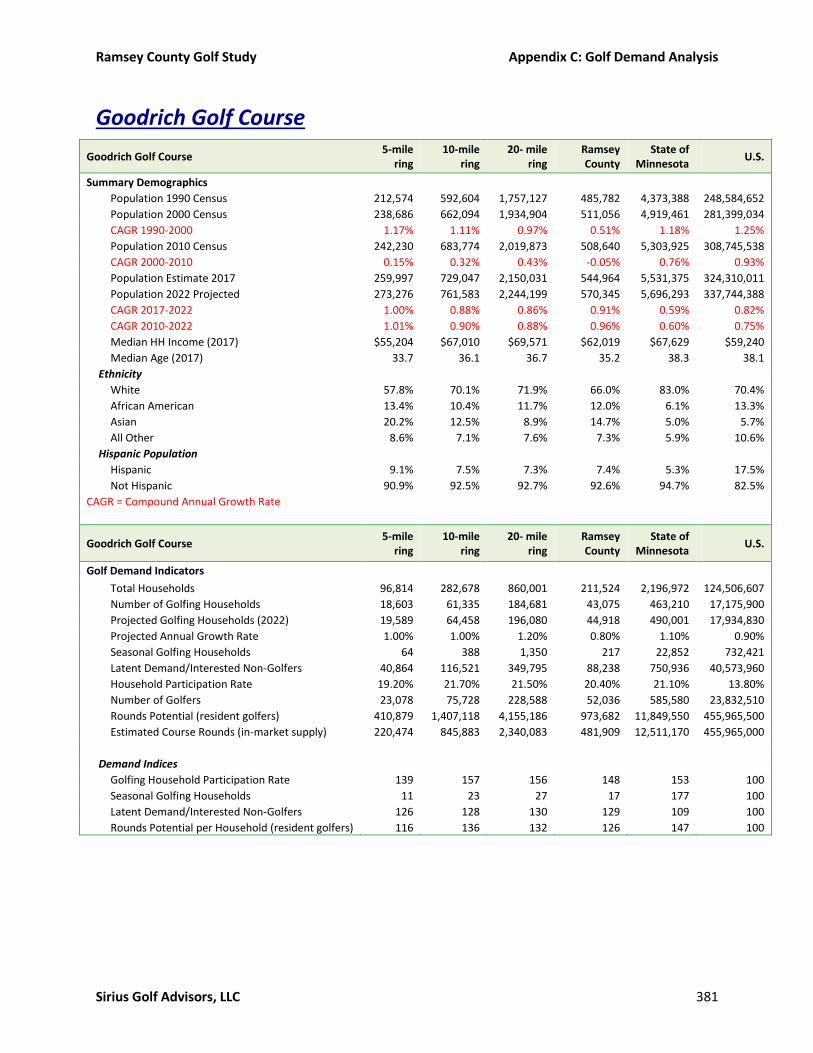
Ramsey County Golf Study Appendix C: Golf Demand Analysis
Sirius Golf Advisors, LLC 381
Goodrich Golf Course
Goodrich Golf Course 5-mile
ring 10-mile
ring 20- mile
ring Ramsey County
State of Minnesota
U.S.
Summary Demographics
Population 1990 Census 212,574 592,604 1,757,127 485,782 4,373,388 248,584,652
Population 2000 Census 238,686 662,094 1,934,904 511,056 4,919,461 281,399,034
CAGR 1990-2000 1.17% 1.11% 0.97% 0.51% 1.18% 1.25%
Population 2010 Census 242,230 683,774 2,019,873 508,640 5,303,925 308,745,538
CAGR 2000-2010 0.15% 0.32% 0.43% -0.05% 0.76% 0.93%
Population Estimate 2017 259,997 729,047 2,150,031 544,964 5,531,375 324,310,011
Population 2022 Projected 273,276 761,583 2,244,199 570,345 5,696,293 337,744,388
CAGR 2017-2022 1.00% 0.88% 0.86% 0.91% 0.59% 0.82%
CAGR 2010-2022 1.01% 0.90% 0.88% 0.96% 0.60% 0.75%
Median HH Income (2017) $55,204 $67,010 $69,571 $62,019 $67,629 $59,240
Median Age (2017) 33.7 36.1 36.7 35.2 38.3 38.1
Ethnicity
White 57.8% 70.1% 71.9% 66.0% 83.0% 70.4%
African American 13.4% 10.4% 11.7% 12.0% 6.1% 13.3%
Asian 20.2% 12.5% 8.9% 14.7% 5.0% 5.7%
All Other 8.6% 7.1% 7.6% 7.3% 5.9% 10.6%
Hispanic Population
Hispanic 9.1% 7.5% 7.3% 7.4% 5.3% 17.5%
Not Hispanic 90.9% 92.5% 92.7% 92.6% 94.7% 82.5%
CAGR = Compound Annual Growth Rate
Goodrich Golf Course 5-mile
ring 10-mile
ring 20- mile
ring Ramsey County
State of Minnesota
U.S.
Golf Demand Indicators
Total Households 96,814 282,678 860,001 211,524 2,196,972 124,506,607
Number of Golfing Households 18,603 61,335 184,681 43,075 463,210 17,175,900
Projected Golfing Households (2022) 19,589 64,458 196,080 44,918 490,001 17,934,830
Projected Annual Growth Rate 1.00% 1.00% 1.20% 0.80% 1.10% 0.90%
Seasonal Golfing Households 64 388 1,350 217 22,852 732,421
Latent Demand/Interested Non-Golfers 40,864 116,521 349,795 88,238 750,936 40,573,960
Household Participation Rate 19.20% 21.70% 21.50% 20.40% 21.10% 13.80%
Number of Golfers 23,078 75,728 228,588 52,036 585,580 23,832,510
Rounds Potential (resident golfers) 410,879 1,407,118 4,155,186 973,682 11,849,550 455,965,500
Estimated Course Rounds (in-market supply) 220,474 845,883 2,340,083 481,909 12,511,170 455,965,000
Demand Indices
Golfing Household Participation Rate 139 157 156 148 153 100
Seasonal Golfing Households 11 23 27 17 177 100
Latent Demand/Interested Non-Golfers 126 128 130 129 109 100
Rounds Potential per Household (resident golfers) 116 136 132 126 147 100
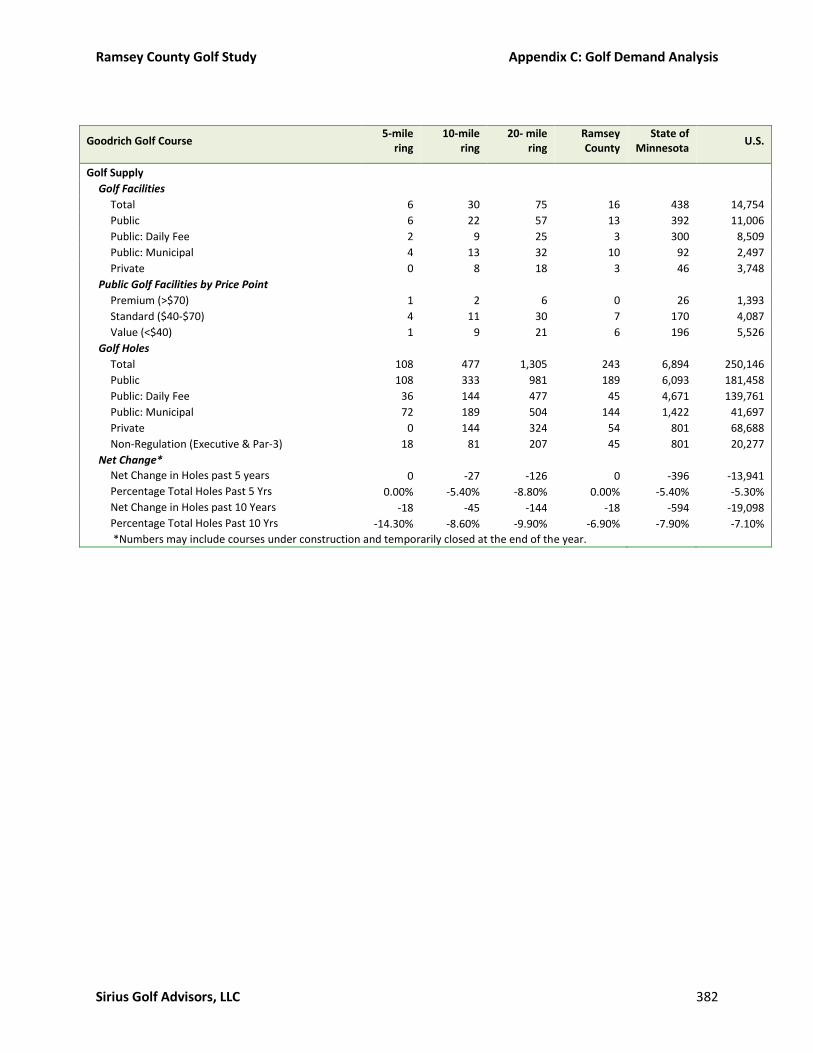
Ramsey County Golf Study Appendix C: Golf Demand Analysis
Sirius Golf Advisors, LLC 382
Goodrich Golf Course 5-mile
ring 10-mile
ring 20- mile
ring Ramsey County
State of Minnesota
U.S.
Golf Supply
Golf Facilities
Total 6 30 75 16 438 14,754
Public 6 22 57 13 392 11,006
Public: Daily Fee 2 9 25 3 300 8,509
Public: Municipal 4 13 32 10 92 2,497
Private 0 8 18 3 46 3,748
Public Golf Facilities by Price Point
Premium (>$70) 1 2 6 0 26 1,393
Standard ($40-$70) 4 11 30 7 170 4,087
Value (<$40) 1 9 21 6 196 5,526
Golf Holes
Total 108 477 1,305 243 6,894 250,146
Public 108 333 981 189 6,093 181,458
Public: Daily Fee 36 144 477 45 4,671 139,761
Public: Municipal 72 189 504 144 1,422 41,697
Private 0 144 324 54 801 68,688
Non-Regulation (Executive & Par-3) 18 81 207 45 801 20,277
Net Change*
Net Change in Holes past 5 years 0 -27 -126 0 -396 -13,941
Percentage Total Holes Past 5 Yrs 0.00% -5.40% -8.80% 0.00% -5.40% -5.30%
Net Change in Holes past 10 Years -18 -45 -144 -18 -594 -19,098
Percentage Total Holes Past 10 Yrs -14.30% -8.60% -9.90% -6.90% -7.90% -7.10%
*Numbers may include courses under construction and temporarily closed at the end of the year.

Ramsey County Golf Study Appendix C: Golf Demand Analysis
Sirius Golf Advisors, LLC 383
Goodrich Golf Course 5-mile
ring 10-mile
ring 20- mile
ring Ramsey County
State of Minnesota
U.S.
Supply-Demand Ratios
Households per 18 Holes
Total 16,136 10,667 11,862 15,668 5,736 8,959
Public 16,136 15,280 15,780 20,145 6,490 12,351
Public: Daily Fee 48,407 35,335 32,453 84,610 8,466 16,035
Public: Municipal 24,204 26,922 30,714 26,441 27,810 53,748
Private 0 35,335 47,778 70,508 49,370 32,628
Premium (>$70) 96,814 141,339 143,334 0 65,581 73,716
Standard ($40-$70) 24,204 25,698 24,225 30,218 11,940 28,602
Value (<$40) 96,814 51,396 66,154 60,435 18,157 30,826
Golfing Households per 18 Holes
Total 3,101 2,315 2,547 3,191 1,209 1,236
Public 3,101 3,315 3,389 4,102 1,368 1,704
Public: Daily Fee 9,302 7,667 6,969 17,230 1,785 2,212
Public: Municipal 4,651 5,841 6,596 5,384 5,863 7,415
Private 0 7,667 10,260 14,358 10,409 4,501
Premium (>$70) 18,603 30,668 30,780 0 13,827 10,169
Standard ($40-$70) 4,651 5,576 5,202 6,154 2,517 3,946
Value (<$40) 18,603 11,152 14,206 12,307 3,828 4,253
Household Indices
Total 180 119 132 175 64 100
Public 131 124 128 163 53 100
Private 0 108 146 216 151 100
Premium (>$70) 131 192 194 0 89 100
Standard ($40-$70) 85 90 85 106 42 100
Value (<$40) 314 167 215 196 59 100
Golfing Household Indices
Total 251 187 206 258 98 100
Public 182 195 199 241 80 100
Private 0 170 228 319 231 100
Premium (>$70) 183 302 303 0 136 100
Standard ($40-$70) 118 141 132 156 64 100
Value (<$40) 438 262 334 289 90 100
Rounds per 18 Holes
Rounds Potential (resident golfers) 68,480 53,099 57,313 72,125 30,939 32,810
Estimated Course Rounds (in-market supply) 36,746 31,920 32,277 35,697 32,666 32,809
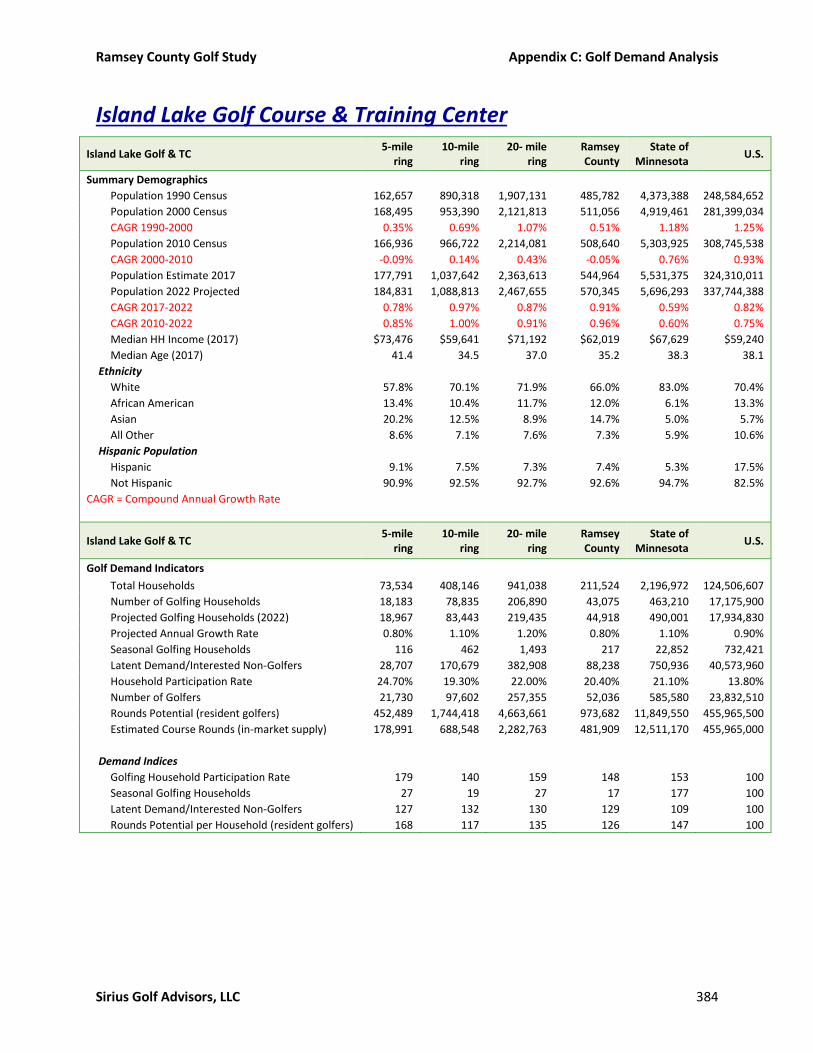
Ramsey County Golf Study Appendix C: Golf Demand Analysis
Sirius Golf Advisors, LLC 384
Island Lake Golf Course & Training Center
Island Lake Golf & TC 5-mile
ring 10-mile
ring 20- mile
ring Ramsey County
State of Minnesota
U.S.
Summary Demographics
Population 1990 Census 162,657 890,318 1,907,131 485,782 4,373,388 248,584,652
Population 2000 Census 168,495 953,390 2,121,813 511,056 4,919,461 281,399,034
CAGR 1990-2000 0.35% 0.69% 1.07% 0.51% 1.18% 1.25%
Population 2010 Census 166,936 966,722 2,214,081 508,640 5,303,925 308,745,538
CAGR 2000-2010 -0.09% 0.14% 0.43% -0.05% 0.76% 0.93%
Population Estimate 2017 177,791 1,037,642 2,363,613 544,964 5,531,375 324,310,011
Population 2022 Projected 184,831 1,088,813 2,467,655 570,345 5,696,293 337,744,388
CAGR 2017-2022 0.78% 0.97% 0.87% 0.91% 0.59% 0.82%
CAGR 2010-2022 0.85% 1.00% 0.91% 0.96% 0.60% 0.75%
Median HH Income (2017) $73,476 $59,641 $71,192 $62,019 $67,629 $59,240
Median Age (2017) 41.4 34.5 37.0 35.2 38.3 38.1
Ethnicity
White 57.8% 70.1% 71.9% 66.0% 83.0% 70.4%
African American 13.4% 10.4% 11.7% 12.0% 6.1% 13.3%
Asian 20.2% 12.5% 8.9% 14.7% 5.0% 5.7%
All Other 8.6% 7.1% 7.6% 7.3% 5.9% 10.6%
Hispanic Population
Hispanic 9.1% 7.5% 7.3% 7.4% 5.3% 17.5%
Not Hispanic 90.9% 92.5% 92.7% 92.6% 94.7% 82.5%
CAGR = Compound Annual Growth Rate
Island Lake Golf & TC 5-mile
ring 10-mile
ring 20- mile
ring Ramsey County
State of Minnesota
U.S.
Golf Demand Indicators
Total Households 73,534 408,146 941,038 211,524 2,196,972 124,506,607
Number of Golfing Households 18,183 78,835 206,890 43,075 463,210 17,175,900
Projected Golfing Households (2022) 18,967 83,443 219,435 44,918 490,001 17,934,830
Projected Annual Growth Rate 0.80% 1.10% 1.20% 0.80% 1.10% 0.90%
Seasonal Golfing Households 116 462 1,493 217 22,852 732,421
Latent Demand/Interested Non-Golfers 28,707 170,679 382,908 88,238 750,936 40,573,960
Household Participation Rate 24.70% 19.30% 22.00% 20.40% 21.10% 13.80%
Number of Golfers 21,730 97,602 257,355 52,036 585,580 23,832,510
Rounds Potential (resident golfers) 452,489 1,744,418 4,663,661 973,682 11,849,550 455,965,500
Estimated Course Rounds (in-market supply) 178,991 688,548 2,282,763 481,909 12,511,170 455,965,000
Demand Indices
Golfing Household Participation Rate 179 140 159 148 153 100
Seasonal Golfing Households 27 19 27 17 177 100
Latent Demand/Interested Non-Golfers 127 132 130 129 109 100
Rounds Potential per Household (resident golfers) 168 117 135 126 147 100
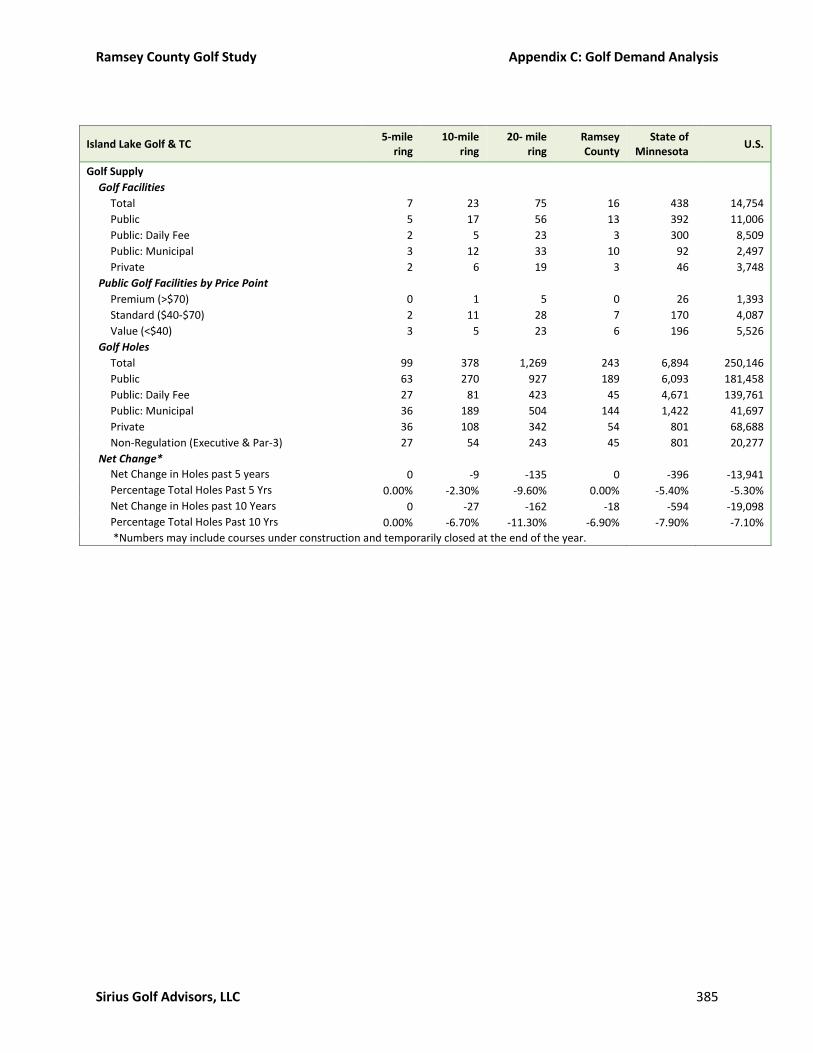
Ramsey County Golf Study Appendix C: Golf Demand Analysis
Sirius Golf Advisors, LLC 385
Island Lake Golf & TC 5-mile
ring 10-mile
ring 20- mile
ring Ramsey County
State of Minnesota
U.S.
Golf Supply
Golf Facilities
Total 7 23 75 16 438 14,754
Public 5 17 56 13 392 11,006
Public: Daily Fee 2 5 23 3 300 8,509
Public: Municipal 3 12 33 10 92 2,497
Private 2 6 19 3 46 3,748
Public Golf Facilities by Price Point
Premium (>$70) 0 1 5 0 26 1,393
Standard ($40-$70) 2 11 28 7 170 4,087
Value (<$40) 3 5 23 6 196 5,526
Golf Holes
Total 99 378 1,269 243 6,894 250,146
Public 63 270 927 189 6,093 181,458
Public: Daily Fee 27 81 423 45 4,671 139,761
Public: Municipal 36 189 504 144 1,422 41,697
Private 36 108 342 54 801 68,688
Non-Regulation (Executive & Par-3) 27 54 243 45 801 20,277
Net Change*
Net Change in Holes past 5 years 0 -9 -135 0 -396 -13,941
Percentage Total Holes Past 5 Yrs 0.00% -2.30% -9.60% 0.00% -5.40% -5.30%
Net Change in Holes past 10 Years 0 -27 -162 -18 -594 -19,098
Percentage Total Holes Past 10 Yrs 0.00% -6.70% -11.30% -6.90% -7.90% -7.10%
*Numbers may include courses under construction and temporarily closed at the end of the year.
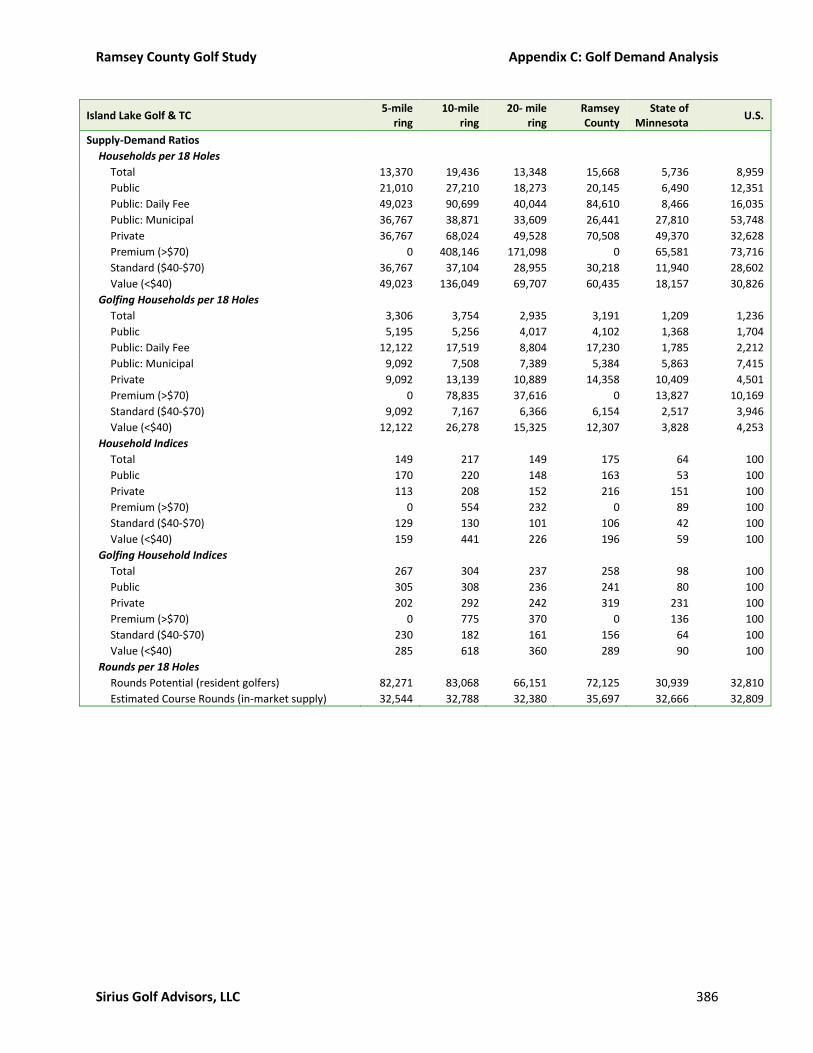
Ramsey County Golf Study Appendix C: Golf Demand Analysis
Sirius Golf Advisors, LLC 386
Island Lake Golf & TC 5-mile
ring 10-mile
ring 20- mile
ring Ramsey County
State of Minnesota
U.S.
Supply-Demand Ratios
Households per 18 Holes
Total 13,370 19,436 13,348 15,668 5,736 8,959
Public 21,010 27,210 18,273 20,145 6,490 12,351
Public: Daily Fee 49,023 90,699 40,044 84,610 8,466 16,035
Public: Municipal 36,767 38,871 33,609 26,441 27,810 53,748
Private 36,767 68,024 49,528 70,508 49,370 32,628
Premium (>$70) 0 408,146 171,098 0 65,581 73,716
Standard ($40-$70) 36,767 37,104 28,955 30,218 11,940 28,602
Value (<$40) 49,023 136,049 69,707 60,435 18,157 30,826
Golfing Households per 18 Holes
Total 3,306 3,754 2,935 3,191 1,209 1,236
Public 5,195 5,256 4,017 4,102 1,368 1,704
Public: Daily Fee 12,122 17,519 8,804 17,230 1,785 2,212
Public: Municipal 9,092 7,508 7,389 5,384 5,863 7,415
Private 9,092 13,139 10,889 14,358 10,409 4,501
Premium (>$70) 0 78,835 37,616 0 13,827 10,169
Standard ($40-$70) 9,092 7,167 6,366 6,154 2,517 3,946
Value (<$40) 12,122 26,278 15,325 12,307 3,828 4,253
Household Indices
Total 149 217 149 175 64 100
Public 170 220 148 163 53 100
Private 113 208 152 216 151 100
Premium (>$70) 0 554 232 0 89 100
Standard ($40-$70) 129 130 101 106 42 100
Value (<$40) 159 441 226 196 59 100
Golfing Household Indices
Total 267 304 237 258 98 100
Public 305 308 236 241 80 100
Private 202 292 242 319 231 100
Premium (>$70) 0 775 370 0 136 100
Standard ($40-$70) 230 182 161 156 64 100
Value (<$40) 285 618 360 289 90 100
Rounds per 18 Holes
Rounds Potential (resident golfers) 82,271 83,068 66,151 72,125 30,939 32,810
Estimated Course Rounds (in-market supply) 32,544 32,788 32,380 35,697 32,666 32,809

Ramsey County Golf Study Appendix C: Golf Demand Analysis
Sirius Golf Advisors, LLC 387
Keller Golf Course
Keller Golf Course 5-mile
ring 10-mile
ring 20- mile
ring Ramsey County
State of Minnesota
U.S.
Summary Demographics
Population 1990 Census 248,646 713,656 1,839,526 485,782 4,373,388 248,584,652
Population 2000 Census 273,044 782,268 2,034,086 511,056 4,919,461 281,399,034
CAGR 1990-2000 0.94% 0.92% 1.01% 0.51% 1.18% 1.25%
Population 2010 Census 273,320 797,718 2,117,515 508,640 5,303,925 308,745,538
CAGR 2000-2010 0.01% 0.20% 0.40% -0.05% 0.76% 0.93%
Population Estimate 2017 293,760 853,318 2,255,344 544,964 5,531,375 324,310,011
Population 2022 Projected 308,934 891,520 2,353,964 570,345 5,696,293 337,744,388
CAGR 2017-2022 1.01% 0.88% 0.86% 0.91% 0.59% 0.82%
CAGR 2010-2022 1.03% 0.93% 0.89% 0.96% 0.60% 0.75%
Median HH Income (2017) $55,243 $64,166 $70,286 $62,019 $67,629 $59,240
Median Age (2017) 34.1 35.4 36.9 35.2 38.3 38.1
Ethnicity
White 57.9% 69.2% 72.4% 66.0% 83.0% 70.4%
African American 13.4% 11.3% 11.4% 12.0% 6.1% 13.3%
Asian 20.3% 11.7% 8.7% 14.7% 5.0% 5.7%
All Other 8.4% 7.8% 7.4% 7.3% 5.9% 10.6%
Hispanic Population
Hispanic 8.6% 7.8% 7.2% 7.4% 5.3% 17.5%
Not Hispanic 91.4% 92.2% 92.8% 92.6% 94.7% 82.5%
CAGR = Compound Annual Growth Rate
Keller Golf Course 5-mile
ring 10-mile
ring 20- mile
ring Ramsey County
State of Minnesota
U.S.
Golf Demand Indicators
Total Households 109,931 337,959 904,727 211,524 2,196,972 124,506,607
Number of Golfing Households 20,729 70,543 195,947 43,075 463,210 17,175,900
Projected Golfing Households (2022) 21,713 74,322 208,122 44,918 490,001 17,934,830
Projected Annual Growth Rate 0.90% 1.00% 1.20% 0.80% 1.10% 0.90%
Seasonal Golfing Households 75 433 1,443 217 22,852 732,421
Latent Demand/Interested Non-Golfers 46,182 140,105 367,678 88,238 750,936 40,573,960
Household Participation Rate 18.90% 20.90% 21.70% 20.40% 21.10% 13.80%
Number of Golfers 25,029 86,163 242,641 52,036 585,580 23,832,510
Rounds Potential (resident golfers) 460,475 1,587,497 4,418,376 973,682 11,849,550 455,965,500
Estimated Course Rounds (in-market supply) 250,987 872,787 2,375,192 481,909 12,511,170 455,965,000
Demand Indices
Golfing Household Participation Rate 137 151 157 148 153 100
Seasonal Golfing Households 12 22 27 17 177 100
Latent Demand/Interested Non-Golfers 128 130 130 129 109 100
Rounds Potential per Household (resident golfers) 114 128 133 126 147 100

Ramsey County Golf Study Appendix C: Golf Demand Analysis
Sirius Golf Advisors, LLC 388
Keller Golf Course 5-mile
ring 10-mile
ring 20- mile
ring Ramsey County
State of Minnesota
U.S.
Golf Supply
Golf Facilities
Total 7 31 76 16 438 14,754
Public 7 23 58 13 392 11,006
Public: Daily Fee 2 9 23 3 300 8,509
Public: Municipal 5 14 35 10 92 2,497
Private 0 8 18 3 46 3,748
Public Golf Facilities by Price Point
Premium (>$70) 0 1 6 0 26 1,393
Standard ($40-$70) 5 12 30 7 170 4,087
Value (<$40) 2 10 22 6 196 5,526
Golf Holes
Total 117 486 1,305 243 6,894 250,146
Public 117 342 981 189 6,093 181,458
Public: Daily Fee 27 144 441 45 4,671 139,761
Public: Municipal 90 198 540 144 1,422 41,697
Private 0 144 324 54 801 68,688
Non-Regulation (Executive & Par-3) 27 90 225 45 801 20,277
Net Change*
Net Change in Holes past 5 years 0 -27 -126 0 -396 -13,941
Percentage Total Holes Past 5 Yrs 0.00% -5.30% -8.80% 0.00% -5.40% -5.30%
Net Change in Holes past 10 Years -18 -45 -153 -18 -594 -19,098
Percentage Total Holes Past 10 Yrs -13.30% -8.50% -10.50% -6.90% -7.90% -7.10%
*Numbers may include courses under construction and temporarily closed at the end of the year.
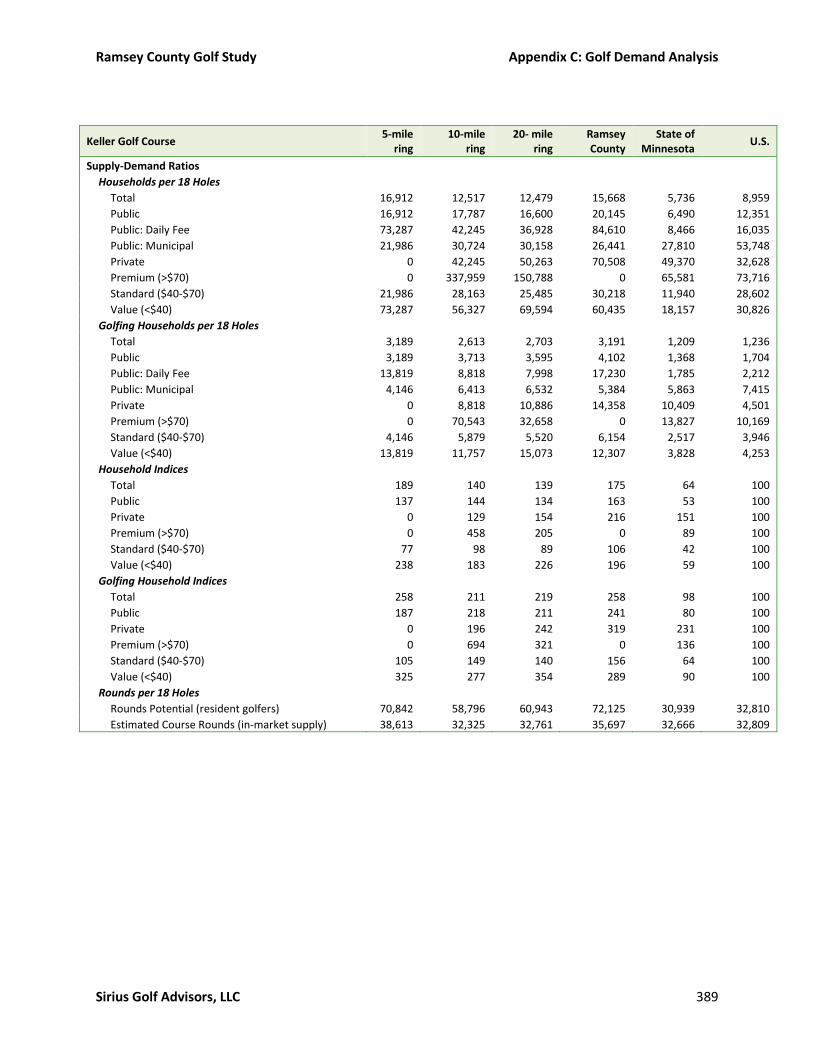
Ramsey County Golf Study Appendix C: Golf Demand Analysis
Sirius Golf Advisors, LLC 389
Keller Golf Course 5-mile
ring 10-mile
ring 20- mile
ring Ramsey County
State of Minnesota
U.S.
Supply-Demand Ratios
Households per 18 Holes
Total 16,912 12,517 12,479 15,668 5,736 8,959
Public 16,912 17,787 16,600 20,145 6,490 12,351
Public: Daily Fee 73,287 42,245 36,928 84,610 8,466 16,035
Public: Municipal 21,986 30,724 30,158 26,441 27,810 53,748
Private 0 42,245 50,263 70,508 49,370 32,628
Premium (>$70) 0 337,959 150,788 0 65,581 73,716
Standard ($40-$70) 21,986 28,163 25,485 30,218 11,940 28,602
Value (<$40) 73,287 56,327 69,594 60,435 18,157 30,826
Golfing Households per 18 Holes
Total 3,189 2,613 2,703 3,191 1,209 1,236
Public 3,189 3,713 3,595 4,102 1,368 1,704
Public: Daily Fee 13,819 8,818 7,998 17,230 1,785 2,212
Public: Municipal 4,146 6,413 6,532 5,384 5,863 7,415
Private 0 8,818 10,886 14,358 10,409 4,501
Premium (>$70) 0 70,543 32,658 0 13,827 10,169
Standard ($40-$70) 4,146 5,879 5,520 6,154 2,517 3,946
Value (<$40) 13,819 11,757 15,073 12,307 3,828 4,253
Household Indices
Total 189 140 139 175 64 100
Public 137 144 134 163 53 100
Private 0 129 154 216 151 100
Premium (>$70) 0 458 205 0 89 100
Standard ($40-$70) 77 98 89 106 42 100
Value (<$40) 238 183 226 196 59 100
Golfing Household Indices
Total 258 211 219 258 98 100
Public 187 218 211 241 80 100
Private 0 196 242 319 231 100
Premium (>$70) 0 694 321 0 136 100
Standard ($40-$70) 105 149 140 156 64 100
Value (<$40) 325 277 354 289 90 100
Rounds per 18 Holes
Rounds Potential (resident golfers) 70,842 58,796 60,943 72,125 30,939 32,810
Estimated Course Rounds (in-market supply) 38,613 32,325 32,761 35,697 32,666 32,809
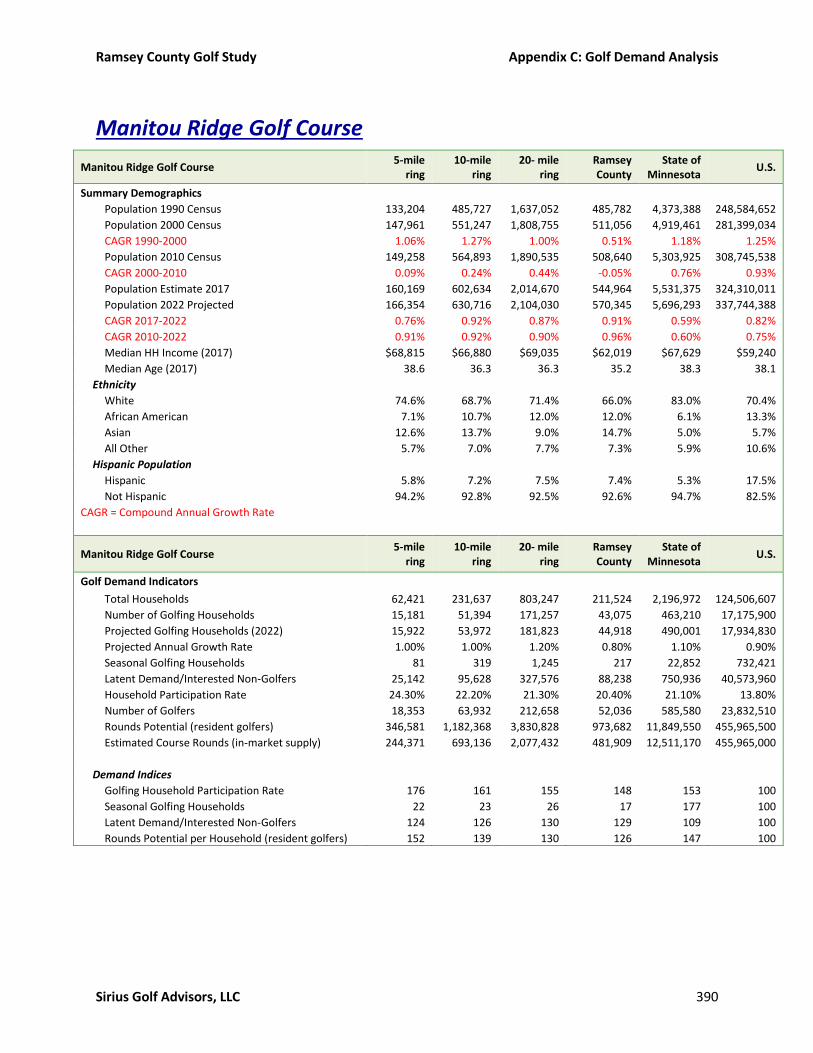
Ramsey County Golf Study Appendix C: Golf Demand Analysis
Sirius Golf Advisors, LLC 390
Manitou Ridge Golf Course
Manitou Ridge Golf Course 5-mile
ring 10-mile
ring 20- mile
ring Ramsey County
State of Minnesota
U.S.
Summary Demographics
Population 1990 Census 133,204 485,727 1,637,052 485,782 4,373,388 248,584,652
Population 2000 Census 147,961 551,247 1,808,755 511,056 4,919,461 281,399,034
CAGR 1990-2000 1.06% 1.27% 1.00% 0.51% 1.18% 1.25%
Population 2010 Census 149,258 564,893 1,890,535 508,640 5,303,925 308,745,538
CAGR 2000-2010 0.09% 0.24% 0.44% -0.05% 0.76% 0.93%
Population Estimate 2017 160,169 602,634 2,014,670 544,964 5,531,375 324,310,011
Population 2022 Projected 166,354 630,716 2,104,030 570,345 5,696,293 337,744,388
CAGR 2017-2022 0.76% 0.92% 0.87% 0.91% 0.59% 0.82%
CAGR 2010-2022 0.91% 0.92% 0.90% 0.96% 0.60% 0.75%
Median HH Income (2017) $68,815 $66,880 $69,035 $62,019 $67,629 $59,240
Median Age (2017) 38.6 36.3 36.3 35.2 38.3 38.1
Ethnicity
White 74.6% 68.7% 71.4% 66.0% 83.0% 70.4%
African American 7.1% 10.7% 12.0% 12.0% 6.1% 13.3%
Asian 12.6% 13.7% 9.0% 14.7% 5.0% 5.7%
All Other 5.7% 7.0% 7.7% 7.3% 5.9% 10.6%
Hispanic Population
Hispanic 5.8% 7.2% 7.5% 7.4% 5.3% 17.5%
Not Hispanic 94.2% 92.8% 92.5% 92.6% 94.7% 82.5%
CAGR = Compound Annual Growth Rate
Manitou Ridge Golf Course 5-mile
ring 10-mile
ring 20- mile
ring Ramsey County
State of Minnesota
U.S.
Golf Demand Indicators
Total Households 62,421 231,637 803,247 211,524 2,196,972 124,506,607
Number of Golfing Households 15,181 51,394 171,257 43,075 463,210 17,175,900
Projected Golfing Households (2022) 15,922 53,972 181,823 44,918 490,001 17,934,830
Projected Annual Growth Rate 1.00% 1.00% 1.20% 0.80% 1.10% 0.90%
Seasonal Golfing Households 81 319 1,245 217 22,852 732,421
Latent Demand/Interested Non-Golfers 25,142 95,628 327,576 88,238 750,936 40,573,960
Household Participation Rate 24.30% 22.20% 21.30% 20.40% 21.10% 13.80%
Number of Golfers 18,353 63,932 212,658 52,036 585,580 23,832,510
Rounds Potential (resident golfers) 346,581 1,182,368 3,830,828 973,682 11,849,550 455,965,500
Estimated Course Rounds (in-market supply) 244,371 693,136 2,077,432 481,909 12,511,170 455,965,000
Demand Indices
Golfing Household Participation Rate 176 161 155 148 153 100
Seasonal Golfing Households 22 23 26 17 177 100
Latent Demand/Interested Non-Golfers 124 126 130 129 109 100
Rounds Potential per Household (resident golfers) 152 139 130 126 147 100

Ramsey County Golf Study Appendix C: Golf Demand Analysis
Sirius Golf Advisors, LLC 391
Manitou Ridge Golf Course 5-mile
ring 10-mile
ring 20- mile
ring Ramsey County
State of Minnesota
U.S.
Golf Supply
Golf Facilities
Total 8 24 67 16 438 14,754
Public 5 18 51 13 392 11,006
Public: Daily Fee 1 10 22 3 300 8,509
Public: Municipal 4 8 29 10 92 2,497
Private 3 6 16 3 46 3,748
Public Golf Facilities by Price Point
Premium (>$70) 0 1 6 0 26 1,393
Standard ($40-$70) 4 11 27 7 170 4,087
Value (<$40) 1 6 18 6 196 5,526
Golf Holes
Total 144 405 1,152 243 6,894 250,146
Public 90 297 864 189 6,093 181,458
Public: Daily Fee 18 171 396 45 4,671 139,761
Public: Municipal 72 126 468 144 1,422 41,697
Private 54 108 288 54 801 68,688
Non-Regulation (Executive & Par-3) 18 72 180 45 801 20,277
Net Change*
Net Change in Holes past 5 years 0 -27 -99 0 -396 -13,941
Percentage Total Holes Past 5 Yrs 0.00% -6.30% -7.90% 0.00% -5.40% -5.30%
Net Change in Holes past 10 Years -18 -45 -117 -18 -594 -19,098
Percentage Total Holes Past 10 Yrs -11.10% -10.00% -9.20% -6.90% -7.90% -7.10%
*Numbers may include courses under construction and temporarily closed at the end of the year.
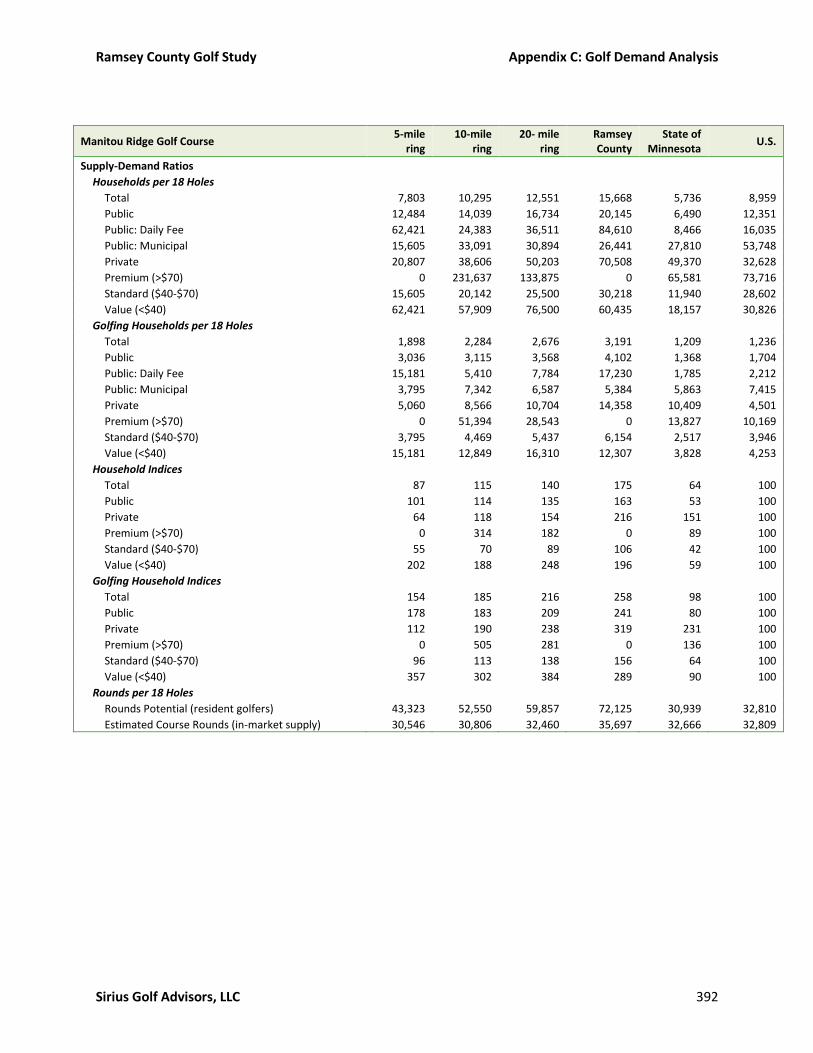
Ramsey County Golf Study Appendix C: Golf Demand Analysis
Sirius Golf Advisors, LLC 392
Manitou Ridge Golf Course 5-mile
ring 10-mile
ring 20- mile
ring Ramsey County
State of Minnesota
U.S.
Supply-Demand Ratios
Households per 18 Holes
Total 7,803 10,295 12,551 15,668 5,736 8,959
Public 12,484 14,039 16,734 20,145 6,490 12,351
Public: Daily Fee 62,421 24,383 36,511 84,610 8,466 16,035
Public: Municipal 15,605 33,091 30,894 26,441 27,810 53,748
Private 20,807 38,606 50,203 70,508 49,370 32,628
Premium (>$70) 0 231,637 133,875 0 65,581 73,716
Standard ($40-$70) 15,605 20,142 25,500 30,218 11,940 28,602
Value (<$40) 62,421 57,909 76,500 60,435 18,157 30,826
Golfing Households per 18 Holes
Total 1,898 2,284 2,676 3,191 1,209 1,236
Public 3,036 3,115 3,568 4,102 1,368 1,704
Public: Daily Fee 15,181 5,410 7,784 17,230 1,785 2,212
Public: Municipal 3,795 7,342 6,587 5,384 5,863 7,415
Private 5,060 8,566 10,704 14,358 10,409 4,501
Premium (>$70) 0 51,394 28,543 0 13,827 10,169
Standard ($40-$70) 3,795 4,469 5,437 6,154 2,517 3,946
Value (<$40) 15,181 12,849 16,310 12,307 3,828 4,253
Household Indices
Total 87 115 140 175 64 100
Public 101 114 135 163 53 100
Private 64 118 154 216 151 100
Premium (>$70) 0 314 182 0 89 100
Standard ($40-$70) 55 70 89 106 42 100
Value (<$40) 202 188 248 196 59 100
Golfing Household Indices
Total 154 185 216 258 98 100
Public 178 183 209 241 80 100
Private 112 190 238 319 231 100
Premium (>$70) 0 505 281 0 136 100
Standard ($40-$70) 96 113 138 156 64 100
Value (<$40) 357 302 384 289 90 100
Rounds per 18 Holes
Rounds Potential (resident golfers) 43,323 52,550 59,857 72,125 30,939 32,810
Estimated Course Rounds (in-market supply) 30,546 30,806 32,460 35,697 32,666 32,809

Ramsey County Golf Study Appendix C: Golf Demand Analysis
Sirius Golf Advisors, LLC 393
The Pond at Battle Creek Golf Course
The Pond @ Battle Creek GC 5-mile
ring 10-mile
ring 20- mile
ring Ramsey County
State of Minnesota
U.S.
Summary Demographics
Population 1990 Census 144,810 507,937 1,614,396 485,782 4,373,388 248,584,652
Population 2000 Census 184,449 587,205 1,790,835 511,056 4,919,461 281,399,034
CAGR 1990-2000 2.45% 1.46% 1.04% 0.51% 1.18% 1.25%
Population 2010 Census 198,592 612,620 1,864,360 508,640 5,303,925 308,745,538
CAGR 2000-2010 0.74% 0.42% 0.40% -0.05% 0.76% 0.93%
Population Estimate 2017 209,407 652,778 1,984,440 544,964 5,531,375 324,310,011
Population 2022 Projected 219,661 682,199 2,069,779 570,345 5,696,293 337,744,388
CAGR 2017-2022 0.96% 0.89% 0.85% 0.91% 0.59% 0.82%
CAGR 2010-2022 0.84% 0.90% 0.87% 0.96% 0.60% 0.75%
Median HH Income (2017) $66,908 $67,496 $69,979 $62,019 $67,629 $59,240
Median Age (2017) 34.8 35.8 36.5 35.2 38.3 38.1
Ethnicity
White 64.9% 68.9% 72.5% 66.0% 83.0% 70.4%
African American 11.2% 11.0% 11.3% 12.0% 6.1% 13.3%
Asian 14.5% 12.6% 8.6% 14.7% 5.0% 5.7%
All Other 9.5% 7.5% 7.7% 7.3% 5.9% 10.6%
Hispanic Population
Hispanic 11.3% 8.3% 7.5% 7.4% 5.3% 17.5%
Not Hispanic 88.7% 91.7% 92.5% 92.6% 94.7% 82.5%
CAGR = Compound Annual Growth Rate
The Pond @ Battle Creek GC 5-mile
ring 10-mile
ring 20- mile
ring Ramsey County
State of Minnesota
U.S.
Golf Demand Indicators
Total Households 74,995 251,527 800,407 211,524 2,196,972 124,506,607
Number of Golfing Households 15,558 52,987 171,091 43,075 463,210 17,175,900
Projected Golfing Households (2022) 16,598 55,881 181,665 44,918 490,001 17,934,830
Projected Annual Growth Rate 1.30% 1.10% 1.20% 0.80% 1.10% 0.90%
Seasonal Golfing Households 61 299 1,229 217 22,852 732,421
Latent Demand/Interested Non-Golfers 30,534 103,261 325,288 88,238 750,936 40,573,960
Household Participation Rate 20.70% 21.10% 21.40% 20.40% 21.10% 13.80%
Number of Golfers 19,972 66,526 210,978 52,036 585,580 23,832,510
Rounds Potential (resident golfers) 342,624 1,191,742 3,838,216 973,682 11,849,550 455,965,500
Estimated Course Rounds (in-market supply) 172,902 749,226 2,272,126 481,909 12,511,170 455,965,000
Demand Indices
Golfing Household Participation Rate 150 153 155 148 153 100
Seasonal Golfing Households 14 20 26 17 177 100
Latent Demand/Interested Non-Golfers 121 126 130 129 109 100
Rounds Potential per Household (resident golfers) 125 129 131 126 147 100

Ramsey County Golf Study Appendix C: Golf Demand Analysis
Sirius Golf Advisors, LLC 394
The Pond @ Battle Creek GC 5-mile
ring 10-mile
ring 20- mile
ring Ramsey County
State of Minnesota
U.S.
Golf Supply
Golf Facilities
Total 6 24 74 16 438 14,754
Public 6 20 60 13 392 11,006
Public: Daily Fee 3 7 31 3 300 8,509
Public: Municipal 3 13 29 10 92 2,497
Private 0 4 14 3 46 3,748
Public Golf Facilities by Price Point
Premium (>$70) 2 3 5 0 26 1,393
Standard ($40-$70) 1 9 34 7 170 4,087
Value (<$40) 3 8 21 6 196 5,526
Golf Holes
Total 81 387 1,260 243 6,894 250,146
Public 81 315 1,008 189 6,093 181,458
Public: Daily Fee 45 108 558 45 4,671 139,761
Public: Municipal 36 207 450 144 1,422 41,697
Private 0 72 252 54 801 68,688
Non-Regulation (Executive & Par-3) 18 81 198 45 801 20,277
Net Change*
Net Change in Holes past 5 years -18 -45 -135 0 -396 -13,941
Percentage Total Holes Past 5 Yrs -18.20% -10.40% -9.70% 0.00% -5.40% -5.30%
Net Change in Holes past 10 Years -18 -63 -162 -18 -594 -19,098
Percentage Total Holes Past 10 Yrs -18.20% -14.00% -11.40% -6.90% -7.90% -7.10%
*Numbers may include courses under construction and temporarily closed at the end of the year.

Ramsey County Golf Study Appendix C: Golf Demand Analysis
Sirius Golf Advisors, LLC 395
The Pond @ Battle Creek GC 5-mile
ring 10-mile
ring 20- mile
ring Ramsey County
State of Minnesota
U.S.
Supply-Demand Ratios
Households per 18 Holes
Total 16,666 11,699 11,434 15,668 5,736 8,959
Public 16,666 14,373 14,293 20,145 6,490 12,351
Public: Daily Fee 29,998 41,921 25,820 84,610 8,466 16,035
Public: Municipal 37,498 21,872 32,016 26,441 27,810 53,748
Private 0 62,882 57,172 70,508 49,370 32,628
Premium (>$70) 37,498 83,842 160,081 0 65,581 73,716
Standard ($40-$70) 74,995 26,477 21,344 30,218 11,940 28,602
Value (<$40) 49,997 50,305 59,289 60,435 18,157 30,826
Golfing Households per 18 Holes
Total 3,457 2,465 2,444 3,191 1,209 1,236
Public 3,457 3,028 3,055 4,102 1,368 1,704
Public: Daily Fee 6,223 8,831 5,519 17,230 1,785 2,212
Public: Municipal 7,779 4,608 6,844 5,384 5,863 7,415
Private 0 13,247 12,221 14,358 10,409 4,501
Premium (>$70) 7,779 17,662 34,218 0 13,827 10,169
Standard ($40-$70) 15,558 5,578 4,562 6,154 2,517 3,946
Value (<$40) 10,372 10,597 12,673 12,307 3,828 4,253
Household Indices
Total 186 131 128 175 64 100
Public 135 116 116 163 53 100
Private 0 193 175 216 151 100
Premium (>$70) 51 114 217 0 89 100
Standard ($40-$70) 262 93 75 106 42 100
Value (<$40) 162 163 192 196 59 100
Golfing Household Indices
Total 280 199 198 258 98 100
Public 203 178 179 241 80 100
Private 0 294 272 319 231 100
Premium (>$70) 76 174 336 0 136 100
Standard ($40-$70) 394 141 116 156 64 100
Value (<$40) 244 249 298 289 90 100
Rounds per 18 Holes
Rounds Potential (resident golfers) 76,139 55,430 54,832 72,125 30,939 32,810
Estimated Course Rounds (in-market supply) 38,423 34,848 32,459 35,697 32,666 32,809

Ramsey County Golf Study Appendix D: Competition
Sirius Golf Advisors, LLC 396
Appendix D: Competition
Metro 18-Hole Regulation
Company
City State County Type Cat Holes Par Year Open
Age
18 hole Regulation
Goodrich Golf Course St. Paul MN Ramsey MU R 18 70 1956 62
Manitou Ridge Golf Course White Bear Lake MN Ramsey MU R 18 71 1928 90
Keller Golf Course Maplewood MN Ramsey MU R 18 72 1929 89
Afton Alps GC
Hastings MN Washington RS R 18 71 1989 29
Apple Valley Golf Course Apple Valley MN Dakota MU R 18 71 1974 44
Badlands Golf Course Roberts WI St. Croix DF R 18 72 1994 24 Baker National Golf Course -Championship Medina MN Hennepin MU R 18 72 1991 27 Bellwood Oaks GC Hastings MN Dakota DF R 18 73 1972 46 Bristol Ridge Golf Course Somerset WI St. Croix DF R 18 72 1994 24 Brookview Golf Course Golden Valley MN Hennepin MU R 18 72 1937 81 Bunker Hills GC Reg Coon Rapids MN Anoka MU R 18 72 1968 50 Cannon Golf Club Cannon Falls MN Dakota DF R 18 72 1990 28
Chisago Lakes Golf Course Lindstrom MN Chisago DF R 18 72 1971 47
Chomonix Golf Course Lino Lakes MN Ramsey MU R 18 72 1971 47 Clifton Highlands GC - Reg Prescott WI Pierce DF R 18 72 1978 40 Clifton Hollow GC River Falls WI Pierce DF R 18 71 1972 46
Columbia Golf Club Minneapolis MN Hennepin MU R 18 71 1919 99
Como Golf Course1 St. Paul MN Ramsey MU R 18 70 1931 87 Crystal Lakes Golf Club Lakeville MN Dakota DF R 18 71 1995 23
Dakota Pines Golf Course Hastings MN Dakota DF R 18 72 1961 57
Dwan Golf Club Bloomington MN Hennepin MU Ex 18 68 1970 48
Eagle Valley Golf Course Woodbury MN Washington MU R 18 72 1998 20
Edinburgh USA Golf Course Brooklyn Park MN Hennepin MU R 18 72 1987 31
Emerald Greens GC -Silver Hastings MN Dakota DF R 18 73 2000 18
Emerald Greens GC -Gold Hastings MN Dakota DF R 18 72 2000 18

Ramsey County Golf Study Appendix D: Competition
Sirius Golf Advisors, LLC 397
Company
City State County Type Cat Holes Par Year Open
Age
Greenhaven Country Club Anoka MN Anoka MU R 18 71 1935 83 Gross National Golf Club
Minneapolis MN Hennepin MU R 18 71 1925 93
Hiawatha Golf Course
Minneapolis MN Hennepin MU R 18 73 1934 84
Hidden Greens Golf Course Hastings MN Dakota DF R 18 72 1985 33 Highland National Golf Course1 St. Paul MN Ramsey MU R 18 72 1928 90
HollyDale Golf Course Plymouth MN Hennepin DF R 18 71
1965 53
Inver Wood Golf Course - reg
Inver Grove Heights MN Dakota MU R 18 72 1992 26
Kilkarney Hills GC Radio Falls WI St. Croix DF R 18 71 1994 24 Links at Northfork Ramsey MN Anoka DF R 18 72 1992 26
Logger's Trail Golf Club Stillwater MN Washington DF R 18 72 2003 15
Majestic Oaks GC - Crossroad Ham Lake MN Anoka DF R 18 72 1991 27
Majestic Oaks GC - Signature Ham Lake MN Anoka DF R 18 72 1960 58
Meadowbrook Golf Course Hopkins MN Hennepin MU R 18 72 1926 92
New Richmond Golf Club New Richmond WI St. Croix DF R 27 71 1923 95
Northwoods Hills GC - Hardwoods
Garrison MN Mille Lacs DF R 18 71 1969 49
Oak Glen Golf Club - Champion Stillwater MN Washington DF R 18 72 1982 36
Oak Marsh Golf Club Oakdale MN Washington DF R 18 70 1996 22
Oneka Ridge Golf Course White Bear Lake MN Ramsey DF R 18 72 1995 23
Phalen Park Golf Course1 St. Paul MN Ramsey MU R 18 70 1917 101
Prestwick Golf Club @ Wedgewood Woodbury MN Washington DF R 18 72 1984 34
River Falls Golf Club River Falls WI Pierce DF R 18 72 1929 89
River Oaks Municipal GC Cottage Grove MN Washington MU R 18 71 1991 27
Royal Club (formerly Tartan Park GC) Lake Elmo MN Washington DF R 27 72
1965 53
Southern Hills Golf Club Farmington MN Dakota DF R 18 71 1990 28 St. Croix National Golf Course Somerset WI St. Croix DF R 18 72 1996 22 Stillwater Oaks Golf Course Stillwater MN Washington DF R 18 70 2014 4
StoneRidge Golf Club Stillwater MN Washington DF R 18 72 2000 18
Sundance Golf & Bowl Maple Grove MN Hennepin DF R 18 72 1970 48
Tanners Brook Golf Club Forest Lake MN Washington DF R 18 71 2000 18

Ramsey County Golf Study Appendix D: Competition
Sirius Golf Advisors, LLC 398
Company
City State County Type Cat Holes Par Year Open
Age
The Refuge Golf Club Oak Grove MN Anoka DF R 18 72 2001 17
Theodore Wirth Golf Course Golden Valley MN Hennepin MU R 18 68 1916 102
Troy Burne Golf Club Hudson WI St. Croix DF R 18 71 1999 19
U of M Les Bolsad GC St. Paul MN Ramsey MU R 18 71 1927 91 Valleywood Golf Course Apple Valley MN Dakota MU R 18 71 1975 43
Victory Links Golf Course Blaine MN Anoka DF R 18 71 2004 14
White Eagle Golf Club Hudson WI St. Croix DF R 18 72 2000 18
Albion Ridges Golf Course Annandale MN Wright DF R 27 72 1991 27 Bluff Creek Golf Club Chaska MN Carver DF R 18 72 1971 47 Boulder Pointe Golf Course Elko MN Scott DF R 18 71 2002 16
Braemar Golf Course Edina MN Hennepin MU R 18 72 1964 54
Bulrush Golf Club Rush City MN Chisago DF R 18 72 2002 16
Cedar Creek Golf Course Albertville MN Wright DF R 18 71 1999 19 Chaska Town Golf Course Chaska MN Carver MU R 18 72 1997 21 Creeksbend Golf Course New Prague MN Le Seuer DF R 18 72 1995 23
Dahlgreen Golf Club Chaska MN Carver DF R 18 72 1969 49
Daytona Golf Club Dayton MN Hennepin SP R 18 72 1964 54
Deer Run Golf Club Victoria MN Carver DF R 18 71 1989 29 Eagle Trace Golfers Club Clearwater MN Wright DF R 18 70 1994 24 Elk River Golf Club Elk River MN Sherburne DF R 18 72 1962 56 Falcon Ridge Golf Course Stacy MN Chisago DF R 18 72 1993 25
Fiddlestik Golf Course Isle MN Mille Lacs DF R 18 71 1987 31
Fountain Valley GC Farmington MN Dakota DF R 18 72 1978 40 Fox Hollow Golf Club Saint Michael MN Wright DF R 18 72 1989 29 Gopher Hills Golf Course Cannon Falls MN Dakota DF R 18 72 1995 23 Heritage Links Golf Club Lakeville MN Scott DF R 18 71 1997 21 Hidden Haven Golf Course Cedar MN Anoka DF R 18 71 1988 30
Island View Golf Club Waconia MN Carver DF R 18 72 1960 58
Izatys Resort Onamia MN Mille Lacs RS R 27 72 1999 19
Le Sueur CC Le Sueur MN Le Seuer SP R 18 72 1972 46
Legends Club Prior Lake MN Scott DF R 18 72 2001 17

Ramsey County Golf Study Appendix D: Competition
Sirius Golf Advisors, LLC 399
Company
City State County Type Cat Holes Par Year Open
Age
Montgomery National Golf Club Montgomery MN Le Seuer DF R 18 72 1970 48 Monticello Country Club Monticello MN Wright DF R 18 71 1968 50 New Prague Golf Club New Prague MN Le Seuer MU R 18 72 1929 89 Pebble Creek Golf Club Becker MN Sherburne MU R 27 72 1988 30
Pheasant Acres Golf Club Rogers MN Hennepin SP R 18 71 1981 37
Pheasant Hills Golf Course Hammond WI St. Croix DF R 18 72 2004 14 Pioneer Creek Golf Course Maple Plain MN Wright DF R 18 72 2000 18
Princeton Golf Club Princeton MN Sherburne DF R 18 71 1955 63
Purple Heart CC Cambridge MN Isanti DF R 18 72 1969 49
Ridges at Sand Creek Jordan MN Scott DF R 18 72 2000 18
Riverwood National Golf Course Otsego MN Wright DF R 18 72 2006 12 Rum River Hills Golf Club Anoka MN Anoka DF R 18 71 1986 32 Rush Creek Golf Club - reg Maple Grove MN Hennepin DF R 18 72 1996 22 Sanbrook Golf Course Isanti MN Isanti DF R 18 72 1995 23
Shamrock Golf Course Hamel MN Hennepin DF R 18 72 1974 44
Shoreland CC St. Peter MN Le Seuer SP R 18 69 1929 89
Southbrook Golf Club Annandale MN Wright DF R 18 72 1997 21
Spring Valley GC Spring Valley WI Pierce DF R 18 71 1970 48
Stonebrooke Golf Course Shakopee MN Scott DF R 18 71 1989 29
Stones Throw GC Milaca MN Mille Lacs DF R 18 70 1956 62
The Meadows at Mystic Lake Prior Lake MN Scott RS R 18 72 2005 13
The Ponds Golf Club Saint Francis MN Anoka DF R 27 72 2000 18
The Wilds Golf Course Prior Lake MN Scott DF R 18 72 1995 23
Timber Creek Golf Course Watertown MN Wright DF R 18 72 1988 30
Viking Meadows Golf Course Cedar MN Anoka DF R 18 72 1989 29
Whispering Pines Annandale MN Wright DF R 18 71 1986 32 Wild Marsh Golf Course Buffalo MN Wright MU R 18 71 1995 23
Averages 112 12 29 18.5 71.5
1,977.0
41.0
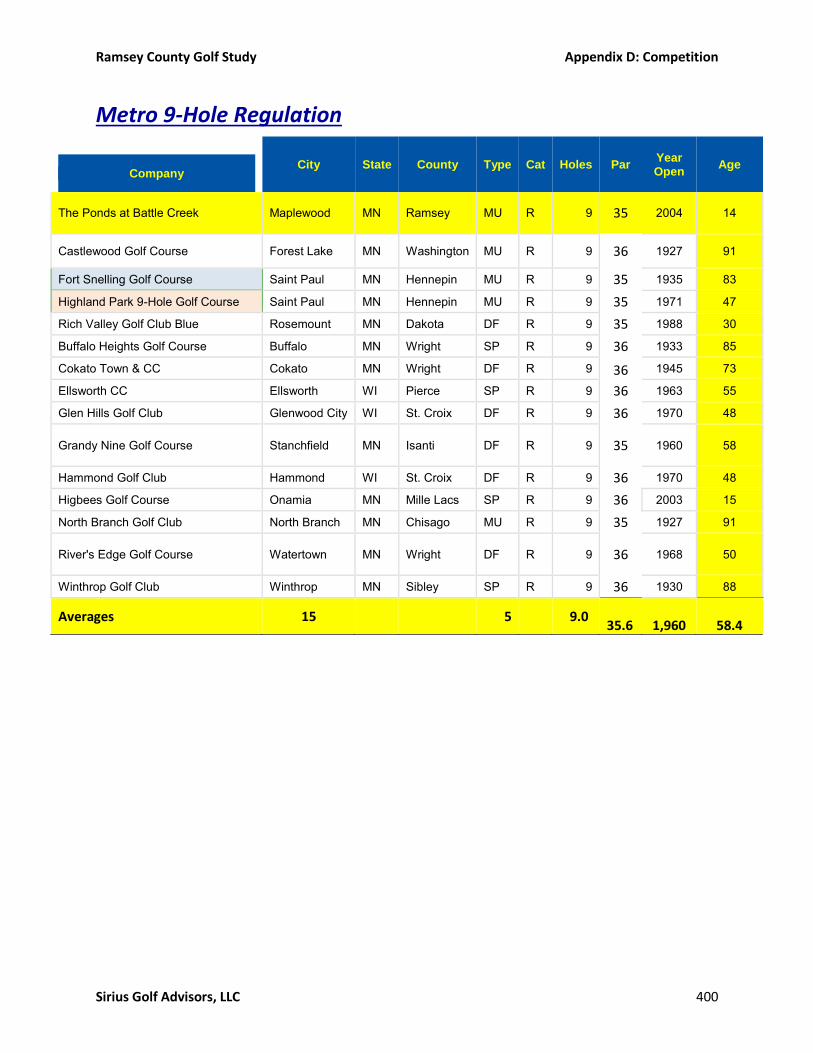
Ramsey County Golf Study Appendix D: Competition
Sirius Golf Advisors, LLC 400
Metro 9-Hole Regulation
Company
City State County Type Cat Holes Par Year Open
Age
The Ponds at Battle Creek Maplewood MN Ramsey MU R 9 35 2004 14
Castlewood Golf Course Forest Lake MN Washington MU R 9 36 1927 91
Fort Snelling Golf Course Saint Paul MN Hennepin MU R 9 35 1935 83
Highland Park 9-Hole Golf Course Saint Paul MN Hennepin MU R 9 35 1971 47
Rich Valley Golf Club Blue Rosemount MN Dakota DF R 9 35 1988 30
Buffalo Heights Golf Course Buffalo MN Wright SP R 9 36 1933 85
Cokato Town & CC Cokato MN Wright DF R 9 36 1945 73
Ellsworth CC Ellsworth WI Pierce SP R 9 36 1963 55
Glen Hills Golf Club Glenwood City WI St. Croix DF R 9 36 1970 48
Grandy Nine Golf Course Stanchfield MN Isanti DF R 9 35 1960 58
Hammond Golf Club Hammond WI St. Croix DF R 9 36 1970 48
Higbees Golf Course Onamia MN Mille Lacs SP R 9 36 2003 15
North Branch Golf Club North Branch MN Chisago MU R 9 35 1927 91
River's Edge Golf Course Watertown MN Wright DF R 9 36 1968 50
Winthrop Golf Club Winthrop MN Sibley SP R 9 36 1930 88
Averages 15 5 9.0 35.6
1,960
58.4

Ramsey County Golf Study Appendix D: Competition
Sirius Golf Advisors, LLC 401
Metro Executive Courses
Company
City State County Type Cat Holes Par Year Open
Age
18-hole
Applewood Hills Golf Course Stillwater MN Washington DF Ex 18 62 1994 24
Rich Valley Golf Club Red White Rosemount MN Dakota DF Ex 18 67 1988 30
Vintage Golf Course Otsego MN Wright DF Ex 18 58 2000 18
Averages 3 0 18.0 62.3
1,994.0
24.0
9-Hole
Island Lake Golf Center Shoreview MN Ramsey MU Ex 9 28 1995 23
Arbor Pointe Golf Club Inver Grove Heights MN Dakota DF Ex 9
31 1998 20
Baker National Golf Course -Evergreen Medina MN Hennepin MU Ex 9 30 1986 32
Brightwood Hills GC New Brighton MN Ramsey MU Ex 9 30 1969 49
Brookland Golf Park Brooklyn Park MN Hennepin MU EX 9 30 1969 49
Bunker Hills GC exec Coon Rapids MN Anoka MU R 9 32 1968 50
Cedarholm Golf Club Roseville MN Ramsey MU Ex 9 30 1958 60
Eagle Lake Golf Center Plymouth MN Hennepin MU Ex 9 31 2001 17
Gem Lake Hills Exec White Bear Lake MN Ramsey DF Ex 9 30 1955 63
Glen Lake Golf & Practice Center Minnetonka MN Hennepin MU Ex 9 31 1997 21
Inver Wood Golf Course Executive Inver Grove Heights MN Dakota MU R 9 30 1992 26
Lost Spur GC Eagan MN Dakota DF Ex 0 34 1968 50
Majestic Oaks GC - Executive Ham Lake MN Anoka DF Ex 9 29 1975 43
Oak Glen Golf Club Exec Stillwater MN Washington DF Ex 9 29 1984 34
Chaska Par 30 Chaska MN Carver MU Ex 9 30 1971 47 Gopher Hills Golf Course Lynk (exec) Cannon Falls MN Dakota DF Ex 9 30 1999 19
Halla Green Executive GC Chanhassen MN Carver DF Ex 9 29 2006 12
Orono Golf Course Wayzata MN Hennepin MU EX 9 33 1924 94
Pinewood Golf Couse Elk River MN Sherburne MU Ex 9 30 1982 36
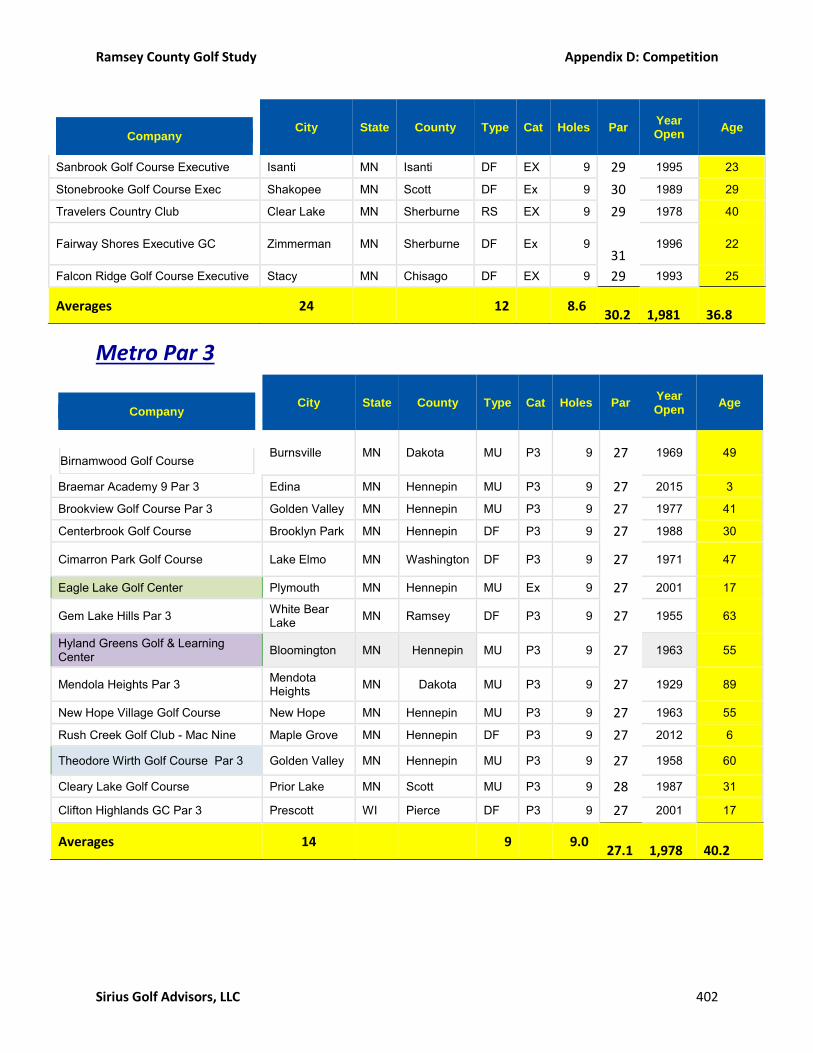
Ramsey County Golf Study Appendix D: Competition
Sirius Golf Advisors, LLC 402
Company
City State County Type Cat Holes Par Year Open
Age
Sanbrook Golf Course Executive Isanti MN Isanti DF EX 9 29 1995 23
Stonebrooke Golf Course Exec Shakopee MN Scott DF Ex 9 30 1989 29
Travelers Country Club Clear Lake MN Sherburne RS EX 9 29 1978 40
Fairway Shores Executive GC Zimmerman MN Sherburne DF Ex 9 31
1996 22
Falcon Ridge Golf Course Executive Stacy MN Chisago DF EX 9 29 1993 25
Averages 24 12 8.6 30.2
1,981
36.8
Metro Par 3
Company
City State County Type Cat Holes Par Year Open
Age
Birnamwood Golf Course
Burnsville MN Dakota MU P3 9 27 1969 49
Braemar Academy 9 Par 3 Edina MN Hennepin MU P3 9 27 2015 3
Brookview Golf Course Par 3 Golden Valley MN Hennepin MU P3 9 27 1977 41
Centerbrook Golf Course Brooklyn Park MN Hennepin DF P3 9 27 1988 30
Cimarron Park Golf Course Lake Elmo MN Washington DF P3 9 27 1971 47
Eagle Lake Golf Center Plymouth MN Hennepin MU Ex 9 27 2001 17
Gem Lake Hills Par 3 White Bear Lake MN Ramsey DF P3 9 27 1955 63
Hyland Greens Golf & Learning Center Bloomington MN Hennepin MU P3 9 27 1963 55
Mendola Heights Par 3 Mendota Heights MN Dakota MU P3 9 27 1929 89
New Hope Village Golf Course New Hope MN Hennepin MU P3 9 27 1963 55
Rush Creek Golf Club - Mac Nine Maple Grove MN Hennepin DF P3 9 27 2012 6
Theodore Wirth Golf Course Par 3 Golden Valley MN Hennepin MU P3 9 27 1958 60
Cleary Lake Golf Course Prior Lake MN Scott MU P3 9 28 1987 31
Clifton Highlands GC Par 3 Prescott WI Pierce DF P3 9 27 2001 17
Averages 14 9 9.0 27.1
1,978
40.2
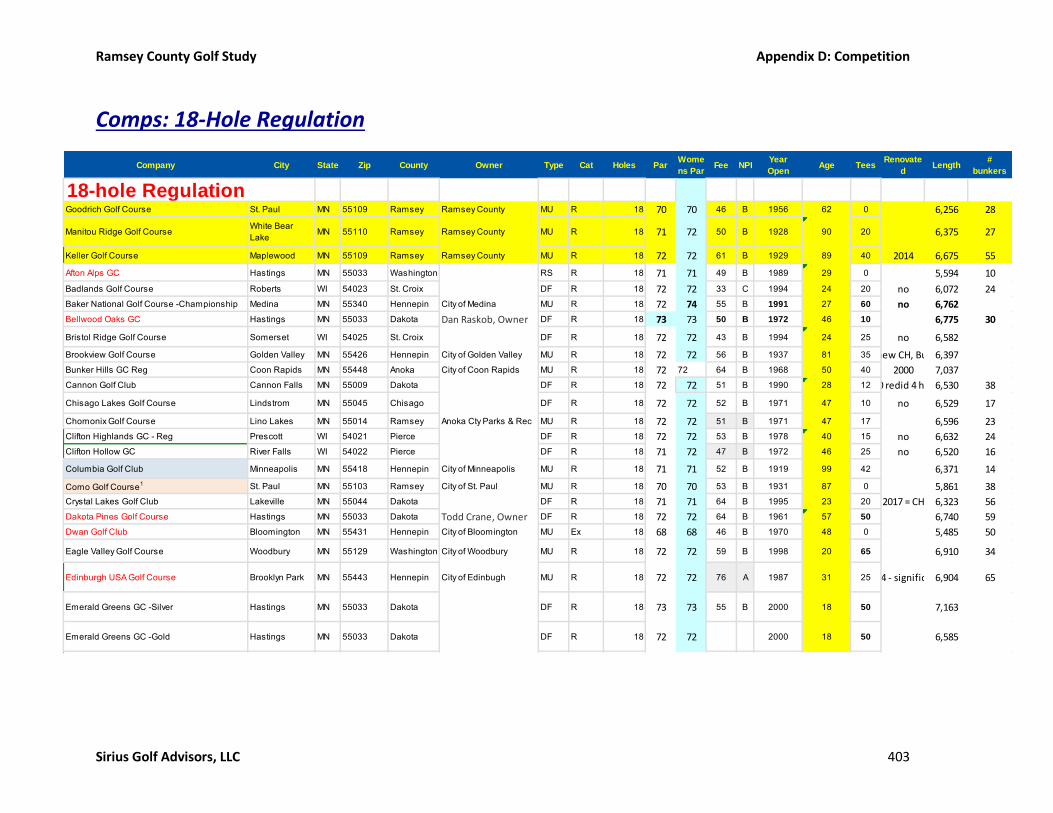
Ramsey County Golf Study Appendix D: Competition
Sirius Golf Advisors, LLC 403
Comps: 18-Hole Regulation
Company City State Zip County Owner Type Cat Holes ParWome
ns ParFee NPI
Year
OpenAge Tees
Renovate
dLength
#
bunkers
Goodrich Golf Course St. Paul MN 55109 Ramsey Ramsey County MU R 18 70 70 46 B 1956 62 0 6,256 28
Manitou Ridge Golf Course White Bear Lake MN 55110 Ramsey Ramsey County MU R 18 71 72 50 B 1928 90 20 6,375 27
Keller Golf Course Maplewood MN 55109 Ramsey Ramsey County MU R 18 72 72 61 B 1929 89 40 2014 6,675 55
Afton Alps GC Hastings MN 55033 Washington RS R 18 71 71 49 B 1989 29 0 5,594 10
Badlands Golf Course Roberts WI 54023 St. Croix DF R 18 72 72 33 C 1994 24 20 no 6,072 24
Baker National Golf Course -Championship Medina MN 55340 Hennepin City of Medina MU R 18 72 74 55 B 1991 27 60 no 6,762
Bellwood Oaks GC Hastings MN 55033 Dakota Dan Raskob, Owner DF R 18 73 73 50 B 1972 46 10 6,775 30
Bristol Ridge Golf Course Somerset WI 54025 St. Croix DF R 18 72 72 43 B 1994 24 25 no 6,582
Brookview Golf Course Golden Valley MN 55426 Hennepin City of Golden Valley MU R 18 72 72 56 B 1937 81 352016 new CH, Bunkers6,397
Bunker Hills GC Reg Coon Rapids MN 55448 Anoka City of Coon Rapids MU R 18 72 72 64 B 1968 50 40 2000 7,037
Cannon Golf Club Cannon Falls MN 55009 Dakota DF R 18 72 72 51 B 1990 28 122010 redid 4 holes6,530 38
Chisago Lakes Golf Course Lindstrom MN 55045 Chisago DF R 18 72 72 52 B 1971 47 10 no 6,529 17
Chomonix Golf Course Lino Lakes MN 55014 Ramsey Anoka Cty Parks & Rec MU R 18 72 72 51 B 1971 47 17 6,596 23
Clifton Highlands GC - Reg Prescott WI 54021 Pierce DF R 18 72 72 53 B 1978 40 15 no 6,632 24
Clifton Hollow GC River Falls WI 54022 Pierce DF R 18 71 72 47 B 1972 46 25 no 6,520 16
Columbia Golf Club Minneapolis MN 55418 Hennepin City of Minneapolis MU R 18 71 71 52 B 1919 99 42 6,371 14
Como Golf Course1 St. Paul MN 55103 Ramsey City of St. Paul MU R 18 70 70 53 B 1931 87 0 5,861 38
Crystal Lakes Golf Club Lakeville MN 55044 Dakota DF R 18 71 71 64 B 1995 23 20 2017 = CH 6,323 56
Dakota Pines Golf Course Hastings MN 55033 Dakota Todd Crane, Owner DF R 18 72 72 64 B 1961 57 50 6,740 59
Dwan Golf Club Bloomington MN 55431 Hennepin City of Bloomington MU Ex 18 68 68 46 B 1970 48 0 5,485 50
Eagle Valley Golf Course Woodbury MN 55129 Washington City of Woodbury MU R 18 72 72 59 B 1998 20 65 6,910 34
Edinburgh USA Golf Course Brooklyn Park MN 55443 Hennepin City of Edinbugh MU R 18 72 72 76 A 1987 31 252014 - significant6,904 65
Emerald Greens GC -Silver Hastings MN 55033 Dakota DF R 18 73 73 55 B 2000 18 50 7,163
Emerald Greens GC -Gold Hastings MN 55033 Dakota DF R 18 72 72 2000 18 50 6,585
18-hole Regulation

Ramsey County Golf Study Appendix D: Competition
Sirius Golf Advisors, LLC 404
Company City State Zip County Owner Type Cat Holes ParWome
ns ParFee NPI
Year
OpenAge Tees
Renovate
dLength
#
bunkers
Greenhaven Country Club Anoka MN 55303 Anoka City of Anoka MU R 18 71 73 45 B 1935 83 0 6,302 40
Gross National Golf Club Minneapolis MN 55418 Hennepin City of Minneapolis MU R 18 71 71 55 B 1925 93 20 no 6,676 34
Hiawatha Golf Course Minneapolis MN 55407 Hennepin City of Minneapolis MU R 18 73 71 45 B 1934 84 48 no 6,613 28
Hidden Greens Golf Course Hastings MN 55033 Dakota DF R 18 72 72 50 B 1985 33 302017 new event bld6,289
Highland National Golf Course1 St. Paul MN 55116 Ramsey City of St. Paul MU R 18 72 72 54 B 1928 90 55 2005 6,638 37
HollyDale Golf Course Plymouth MN 55446 HennepinRick Deziel, Jr ,
ownerDF R 18
71 7350 B 1965 53 20
6,160 4
Inver Wood Golf Course - reg Inver Grove Heights MN 55077 Dakota City of Inver Grove
Heights MU R 18 72 72 62 B 1992 26 36 6,724 44
Kilkarney Hills GC Radio Falls WI 54022 St. Croix DF R 18 71 73 32 C 1994 24 20 6,500 13
Links at Northfork Ramsey MN 55303 Anoka DF R 18 72 72 62 B 1992 26 20 6,979 104
Logger's Trail Golf Club Stillwater MN 55082 Washington DF R 18 72 73 62 B 2003 15 8 7,113
Majestic Oaks GC - Crossroad Ham Lake MN 55304 Anoka DF R 18 72 72 54 B 1991 27 30 6,396 40
Majestic Oaks GC - Signature Ham Lake MN 55304 Anoka DF R 18 72 72 60 B 1960 58 30 no 7,073 71
Meadowbrook Golf Course Hopkins MN 55343 Hennepin City of Minneapolis MU R 18 72 72 55 B 1926 92 0 2017 6,557
New Richmond Golf Club New Richmond WI 54017 St. Croix City of New Richmond DF R 27 71 72 66 B 1923 95 30 1998 6,726
Oak Glen Golf Club - Champion Stillwater MN 55082 Washington Wilson Golf Group DF R 18 72 72 53 B 1982 36 30 6,574 53
Oak Marsh Golf Club Oakdale MN 55128 Washington DF R 18 70 70 58 B 1996 22 40 no 6,179 36
Oneka Ridge Golf Course White Bear Lake MN 55110 Ramsey Scott Arcand, Owner DF R 18 72 72 51 B 1995 23 25 no 6,395 17
Phalen Park Golf Course1 St. Paul MN 55106 Ramsey City of St. Paul MU R 18 70 71 53 B 1917 101 25 6,092 38
Prestwick Golf Club @ Wedgewood Woodbury MN 55125 Washington DF R 18 72 72 85 A 1984 34 90 6,876 69
River Falls Golf Club River Falls WI 54022 Pierce DF R 18 72 72 45 B 1929 89 50 6,614 18
River Oaks Municipal GC Cottage Grove MN 55016 Washington MU R 18 71 71 54 B 1991 27 75 no 6,418 56
Royal Club (formerly Tartan Park GC) Lake Elmo MN55042
Washington DF R 2772 72 79 A
1965 53 162017 6,901

Ramsey County Golf Study Appendix D: Competition
Sirius Golf Advisors, LLC 405
Company City State Zip County Owner Type Cat Holes ParWome
ns ParFee NPI
Year
OpenAge Tees
Renovate
dLength
#
bunkers
Rum River Hills Golf Club Anoka MN 55303 Anoka DF R 18 71 71 50 B 1986 32 30 6,308 22
Rush Creek Golf Club - reg Maple Grove MN 55311 Hennepin DF R 18 72 72 137 A 1996 22 35 7,306 57
Shamrock Golf Course Hamel MN 55340 Hennepin DF R 18 72 72 49 B 1974 44 15 6,427 4
Southern Hills Golf Club Farmington MN 55024 Dakota Newman Golf Investors DF R 18 71 71 57 B 1990 28 25 6,343 42
St. Croix National Golf Course Somerset WI 54025 St. Croix DF R 18 72 72 79 A 1996 22 40 6,909 44
Stillwater Oaks Golf Course Stillwater MN 55082 Washington DF R 18 70 70 43 B 2014 4 20 no 6,228 32
StoneRidge Golf Club Stillwater MN 55082 Washington DF R 18 72 72 99 A 2000 18 60 7,013 134
Sundance Golf & Bowl Maple Grove MN 55369 Hennepin Jody Fisher, Owner DF R 18 72 73 49 B 1970 48 40 2014 6,430 34
Tanners Brook Golf Club Forest Lake MN 55025 Washington DF R 18 71 71 60 B 2000 18 20 6,854 22
The Refuge Golf Club Oak Grove MN 55011 Anoka DF R 18 72 72 64 B 2001 17 20 6,534 43
Theodore Wirth Golf Course Golden Valley MN 55422 Hennepin City of Minneapolis MU R 18 68 68 50 B 1916 102 0 ongoing 5,688 3
Troy Burne Golf Club Hudson WI 54016 St. Croix Chris Sauer, owner DF R 18 71 72 108 A 1999 19 50Some golf, 1m banq6,978 119
U of M Les Bolsad GC St. Paul MN 55113 Ramsey Univ of Minnesota MU R 18 71 69 51 B 1927 91 70ongoing couple holes6,206 13
Valleywood Golf Course Apple Valley MN 55124 Dakota City of Apple Valley MU R 18 71 72 60 B 1975 43 30 2012 new ch 6,438 15
Victory Links Golf Course Blaine MN 55449 Anoka State of MN MU R 18 71 71 63 B 2004 14 40 7,048 57
Viking Meadows Golf Course Cedar MN 55011 Anoka DF R 18 72 73 25 C 1989 29 20 6,428 14
White Eagle Golf Club Hudson WI 54016 St. Croix DF R 18 72 72 79 A 2000 18 30 7,178 30
Averages 63 10 24 18.3 71.5 71.7 57.8 1,972.2 45.8 7 2,009.3 6,552.1 38.4

Ramsey County Golf Study Appendix D: Competition
Sirius Golf Advisors, LLC 406
Other
Company # Tees Yardage Slope USGA Yardage Slope Yardage Slope Yardage Slope Yardage Slope Par 72
Equiv Wome Yardage Slope
Goodrich Golf Course 4 6,256 126 70.6 5,944 123 5,416 117 5,076 116 7,459
Manitou Ridge Golf Course 4 6,375 127 70.7 6,035 121 5,831 118 5,439 124 7,770
Keller Golf Course 4 6,675 133 72.2 6,206 131 5,397 123 4,830 114 6,900 2 combos 5,757 128
Afton Alps GC 3 5,594 121 67.6 5,376 119 4,623 116 6,697
Badlands Golf Course 4 6,280 117 6,042 5,604 4,835 6,907
Baker National Golf Course -Championship 4 6,762 138 73.9 6,294 134 6,021 130 5,313 131 7,385
Bellwood Oaks GC 4 6,775 123 73.3 6,487 128 5,916 123 5,124 120 7,220
Bristol Ridge Golf Course 3 6,582 133 6,366 130 5,132 123 7,331
Brookview Golf Course 4 6,397 128 71.2 6,123 131 5,514 125 5,328 127 7,611
Bunker Hills GC Reg 4 7,037 141 73.6 6,696 138 6,378 133 5,598 129 7,997
Cannon Golf Club 4 6,581 134 71.3 6,194 131 5,377 123 5,119 126 7,313
Chisago Lakes Golf Course 5 6,600 124 72.2 6,276 125 5,778 122 5,045 124 7,207 4,099 120
Chomonix Golf Course 3 6,550 130 72.1 6,221 127 5,300 121 7,571
Clifton Highlands GC - Reg 4 6,644 125 72.2 6,211 124 5,562 116 5,197 120 7,424
Clifton Hollow GC 4 6,520 127 6,014 122 5,424 5,074 118 7,249
Columbia Golf Club 4 6,371 120 72 6,121 117 5,685 113 5,152 116 7,464 Junior 3,155
Como Golf Course1 3 5,861 127 68.5 5,581 124 5,077 127 7,460
Crystal Lakes Golf Club 4 6,323 133 5,847 129 5,472 126 4,805 123 6,961
Dakota Pines Golf Course 4 6,740 133 73.4 6,382 130 5,905 126 5,472 130 7,817
Dwan Golf Club 3 5,485 113 66 5,275 112 4,518 121 6,834
Eagle Valley Golf Course 5 6,910 135 73.4 6,577 132 6,197 129 5,761 125 5,234 123 7,477
Edinburgh USA Golf Course 4 6,904 139 73.4 6,383 132 5,858 125 5,319 129 7,599
Emerald Greens GC -Silver 4 7,163 134 74.2 6,792 130 5,953 124 5,184 123 7,304
Emerald Greens GC -Gold 4 6,585 127 71.6 6,361 125 5,651 119 5,004 118 7,149
Greenhaven Country Club 4 6,302 121 70.3 6,059 120 5,529 116 5,267 118 7,421
Gross National Golf Club 4 6,676 126 71.4 6,348 124 5,028 112 4,939 112 7,155 Junior 3,350
Hiawatha Golf Course 4 6,613 130 71.7 6,211 126 5,685 122 5,122 121 7,420
Hidden Greens Golf Course 3 6,289 127.9 5,954 124 5,379 126 7,684
Highland National Golf Course1 4 6,638 133 72.3 6,204 129 5,843 125 5,125 121 7,321
HollyDale Golf Course4 6,160 124 70.1 5,980 123 5,334 116 5,128 123
7,225
Inver Wood Golf Course - reg 4 6,724 141 73.1 6,194 139 5,795 135 5,175 128 7,393
Kilkarney Hills GC 4 6,500 122 71.7 6,091 117 5,672 111 4,960 117 6,989
TeesBack Tee Championship Regular Senior Forward
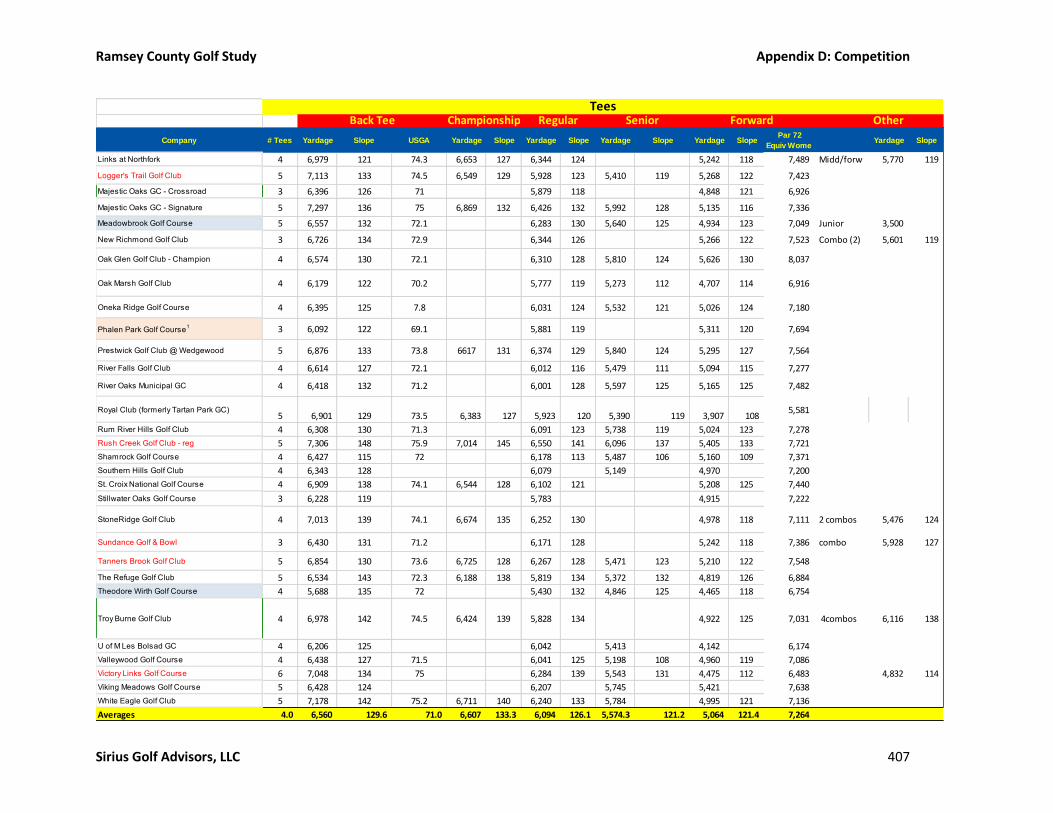
Ramsey County Golf Study Appendix D: Competition
Sirius Golf Advisors, LLC 407
Other
Company # Tees Yardage Slope USGA Yardage Slope Yardage Slope Yardage Slope Yardage Slope Par 72
Equiv Wome Yardage Slope
Links at Northfork 4 6,979 121 74.3 6,653 127 6,344 124 5,242 118 7,489 Midd/forw 5,770 119
Logger's Trail Golf Club 5 7,113 133 74.5 6,549 129 5,928 123 5,410 119 5,268 122 7,423
Majestic Oaks GC - Crossroad 3 6,396 126 71 5,879 118 4,848 121 6,926
Majestic Oaks GC - Signature 5 7,297 136 75 6,869 132 6,426 132 5,992 128 5,135 116 7,336
Meadowbrook Golf Course 5 6,557 132 72.1 6,283 130 5,640 125 4,934 123 7,049 Junior 3,500
New Richmond Golf Club 3 6,726 134 72.9 6,344 126 5,266 122 7,523 Combo (2) 5,601 119
Oak Glen Golf Club - Champion 4 6,574 130 72.1 6,310 128 5,810 124 5,626 130 8,037
Oak Marsh Golf Club 4 6,179 122 70.2 5,777 119 5,273 112 4,707 114 6,916
Oneka Ridge Golf Course 4 6,395 125 7.8 6,031 124 5,532 121 5,026 124 7,180
Phalen Park Golf Course1 3 6,092 122 69.1 5,881 119 5,311 120 7,694
Prestwick Golf Club @ Wedgewood 5 6,876 133 73.8 6617 131 6,374 129 5,840 124 5,295 127 7,564
River Falls Golf Club 4 6,614 127 72.1 6,012 116 5,479 111 5,094 115 7,277
River Oaks Municipal GC 4 6,418 132 71.2 6,001 128 5,597 125 5,165 125 7,482
Royal Club (formerly Tartan Park GC)5 6,901 129 73.5 6,383 127 5,923 120 5,390 119 3,907 108
5,581
Rum River Hills Golf Club 4 6,308 130 71.3 6,091 123 5,738 119 5,024 123 7,278
Rush Creek Golf Club - reg 5 7,306 148 75.9 7,014 145 6,550 141 6,096 137 5,405 133 7,721
Shamrock Golf Course 4 6,427 115 72 6,178 113 5,487 106 5,160 109 7,371
Southern Hills Golf Club 4 6,343 128 6,079 5,149 4,970 7,200
St. Croix National Golf Course 4 6,909 138 74.1 6,544 128 6,102 121 5,208 125 7,440
Stillwater Oaks Golf Course 3 6,228 119 5,783 4,915 7,222
StoneRidge Golf Club 4 7,013 139 74.1 6,674 135 6,252 130 4,978 118 7,111 2 combos 5,476 124
Sundance Golf & Bowl 3 6,430 131 71.2 6,171 128 5,242 118 7,386 combo 5,928 127
Tanners Brook Golf Club 5 6,854 130 73.6 6,725 128 6,267 128 5,471 123 5,210 122 7,548
The Refuge Golf Club 5 6,534 143 72.3 6,188 138 5,819 134 5,372 132 4,819 126 6,884
Theodore Wirth Golf Course 4 5,688 135 72 5,430 132 4,846 125 4,465 118 6,754
Troy Burne Golf Club 4 6,978 142 74.5 6,424 139 5,828 134 4,922 125 7,031 4combos 6,116 138
U of M Les Bolsad GC 4 6,206 125 6,042 5,413 4,142 6,174
Valleywood Golf Course 4 6,438 127 71.5 6,041 125 5,198 108 4,960 119 7,086
Victory Links Golf Course 6 7,048 134 75 6,284 139 5,543 131 4,475 112 6,483 4,832 114
Viking Meadows Golf Course 5 6,428 124 6,207 5,745 5,421 7,638
White Eagle Golf Club 5 7,178 142 75.2 6,711 140 6,240 133 5,784 4,995 121 7,136
Averages 4.0 6,560 129.6 71.0 6,607 133.3 6,094 126.1 5,574.3 121.2 5,064 121.4 7,264
TeesBack Tee Championship Regular Senior Forward
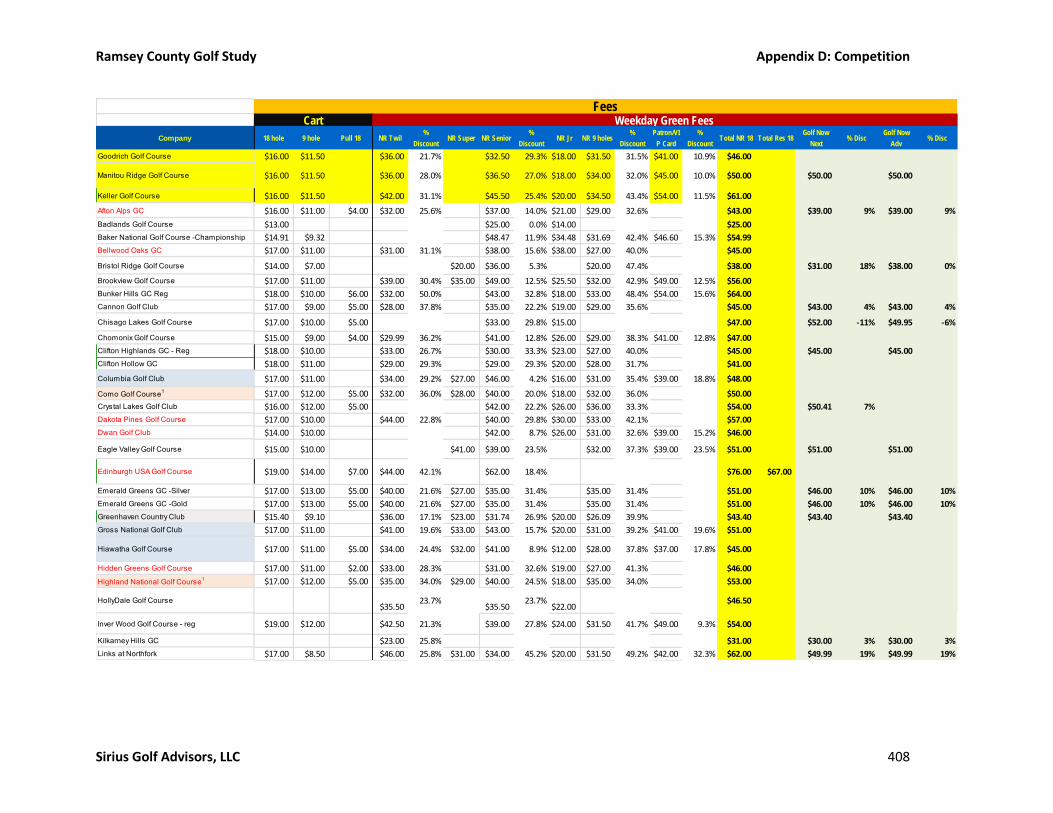
Ramsey County Golf Study Appendix D: Competition
Sirius Golf Advisors, LLC 408
Company 18 hole 9 hole Pull 18 NR Twil%
DiscountNR Super NR Senior
%
DiscountNR Jr NR 9 holes
%
Discount
Patron/VI
P Card
%
DiscountTotal NR 18 Total Res 18
Golf Now
Next% Disc
Golf Now
Adv% Disc
Goodrich Golf Course $16.00 $11.50 $36.00 21.7% $32.50 29.3% $18.00 $31.50 31.5% $41.00 10.9% $46.00
Manitou Ridge Golf Course $16.00 $11.50 $36.00 28.0% $36.50 27.0% $18.00 $34.00 32.0% $45.00 10.0% $50.00 $50.00 $50.00
Keller Golf Course $16.00 $11.50 $42.00 31.1% $45.50 25.4% $20.00 $34.50 43.4% $54.00 11.5% $61.00
Afton Alps GC $16.00 $11.00 $4.00 $32.00 25.6% $37.00 14.0% $21.00 $29.00 32.6% $43.00 $39.00 9% $39.00 9%
Badlands Golf Course $13.00 $25.00 0.0% $14.00 $25.00
Baker National Golf Course -Championship $14.91 $9.32 $48.47 11.9% $34.48 $31.69 42.4% $46.60 15.3% $54.99
Bellwood Oaks GC $17.00 $11.00 $31.00 31.1% $38.00 15.6% $38.00 $27.00 40.0% $45.00
Bristol Ridge Golf Course $14.00 $7.00 $20.00 $36.00 5.3% $20.00 47.4% $38.00 $31.00 18% $38.00 0%
Brookview Golf Course $17.00 $11.00 $39.00 30.4% $35.00 $49.00 12.5% $25.50 $32.00 42.9% $49.00 12.5% $56.00
Bunker Hills GC Reg $18.00 $10.00 $6.00 $32.00 50.0% $43.00 32.8% $18.00 $33.00 48.4% $54.00 15.6% $64.00
Cannon Golf Club $17.00 $9.00 $5.00 $28.00 37.8% $35.00 22.2% $19.00 $29.00 35.6% $45.00 $43.00 4% $43.00 4%
Chisago Lakes Golf Course $17.00 $10.00 $5.00 $33.00 29.8% $15.00 $47.00 $52.00 -11% $49.95 -6%
Chomonix Golf Course $15.00 $9.00 $4.00 $29.99 36.2% $41.00 12.8% $26.00 $29.00 38.3% $41.00 12.8% $47.00
Clifton Highlands GC - Reg $18.00 $10.00 $33.00 26.7% $30.00 33.3% $23.00 $27.00 40.0% $45.00 $45.00 $45.00
Clifton Hollow GC $18.00 $11.00 $29.00 29.3% $29.00 29.3% $20.00 $28.00 31.7% $41.00
Columbia Golf Club $17.00 $11.00 $34.00 29.2% $27.00 $46.00 4.2% $16.00 $31.00 35.4% $39.00 18.8% $48.00
Como Golf Course1 $17.00 $12.00 $5.00 $32.00 36.0% $28.00 $40.00 20.0% $18.00 $32.00 36.0% $50.00
Crystal Lakes Golf Club $16.00 $12.00 $5.00 $42.00 22.2% $26.00 $36.00 33.3% $54.00 $50.41 7%
Dakota Pines Golf Course $17.00 $10.00 $44.00 22.8% $40.00 29.8% $30.00 $33.00 42.1% $57.00
Dwan Golf Club $14.00 $10.00 $42.00 8.7% $26.00 $31.00 32.6% $39.00 15.2% $46.00
Eagle Valley Golf Course $15.00 $10.00 $41.00 $39.00 23.5% $32.00 37.3% $39.00 23.5% $51.00 $51.00 $51.00
Edinburgh USA Golf Course $19.00 $14.00 $7.00 $44.00 42.1% $62.00 18.4% $76.00 $67.00
Emerald Greens GC -Silver $17.00 $13.00 $5.00 $40.00 21.6% $27.00 $35.00 31.4% $35.00 31.4% $51.00 $46.00 10% $46.00 10%
Emerald Greens GC -Gold $17.00 $13.00 $5.00 $40.00 21.6% $27.00 $35.00 31.4% $35.00 31.4% $51.00 $46.00 10% $46.00 10%
Greenhaven Country Club $15.40 $9.10 $36.00 17.1% $23.00 $31.74 26.9% $20.00 $26.09 39.9% $43.40 $43.40 $43.40
Gross National Golf Club $17.00 $11.00 $41.00 19.6% $33.00 $43.00 15.7% $20.00 $31.00 39.2% $41.00 19.6% $51.00
Hiawatha Golf Course $17.00 $11.00 $5.00 $34.00 24.4% $32.00 $41.00 8.9% $12.00 $28.00 37.8% $37.00 17.8% $45.00
Hidden Greens Golf Course $17.00 $11.00 $2.00 $33.00 28.3% $31.00 32.6% $19.00 $27.00 41.3% $46.00
Highland National Golf Course1 $17.00 $12.00 $5.00 $35.00 34.0% $29.00 $40.00 24.5% $18.00 $35.00 34.0% $53.00
HollyDale Golf Course$35.50
23.7%$35.50
23.7%$22.00
$46.50
Inver Wood Golf Course - reg $19.00 $12.00 $42.50 21.3% $39.00 27.8% $24.00 $31.50 41.7% $49.00 9.3% $54.00
Kilkarney Hills GC $23.00 25.8% $31.00 $30.00 3% $30.00 3%
Links at Northfork $17.00 $8.50 $46.00 25.8% $31.00 $34.00 45.2% $20.00 $31.50 49.2% $42.00 32.3% $62.00 $49.99 19% $49.99 19%
Weekday Green FeesFees
Cart

Ramsey County Golf Study Appendix D: Competition
Sirius Golf Advisors, LLC 409
Company 18 hole 9 hole Pull 18 NR Twil%
DiscountNR Super NR Senior
%
DiscountNR Jr NR 9 holes
%
Discount
Patron/VI
P Card
%
DiscountTotal NR 18 Total Res 18
Golf Now
Next% Disc
Golf Now
Adv% Disc
Logger's Trail Golf Club $16.00 $8.00 $38.00 39.7% $48.00 23.8% $32.00 49.2% $63.00 $45.00 29% $55.00 13%
Majestic Oaks GC - Crossroad $17.00 $10.00 $5.00 $36.00 25.0% $42.00 12.5% $25.00 $37.00 22.9% $48.00 $48.00 $48.00
Majestic Oaks GC - Signature $17.00 $10.00 $36.00 33.3% $45.00 16.7% $28.00 $48.00 11.1% $54.00 $54.00 $54.00
Meadowbrook Golf Course $17.00 $11.00 $41.00 19.6% $33.00 $43.00 15.7% $20.00 $31.00 39.2% $41.00 19.6% $51.00
New Richmond Golf Club $18.00 $9.00 $5.00 $46.00 24.6% $46.00 $35.00 42.6% $61.00 $50.00
Oak Glen Golf Club - Champion $16.00 $8.00 $8.00 $36.00 20.0% $35.00 22.2% $35.00 22.2% $45.00
Oak Marsh Golf Club $17.50 $10.50 $4.00 $29.17 44.4% $51.81 1.3% $20.00 $30.50 41.9% $52.50 $52.50 $52.50
Oneka Ridge Golf Course $16.00 $9.00 $5.00 $32.00 $40.00 20.0% $22.00 $28.00 44.0% $50.00
Phalen Park Golf Course1 $17.00 $12.00 $5.00 $32.00 36.0% $28.00 $40.00 20.0% $18.00 $32.00 36.0% $50.00
Prestwick Golf Club @ Wedgewood $20.00 $10.00 $57.00 32.9% $47.00 $57.00 32.9% $80.00 5.9% $85.00
River Falls Golf Club $10.00 $7.00 $27.00 25.0% $32.00 11.1% $18.96 $28.00 22.2% $36.00
River Oaks Municipal GC $16.50 $12.00 $5.00 $32.00 37.9% $36.00 30.1% $19.00 $35.00 32.0% $47.00 8.7% $51.50
Royal Club (formerly Tartan Park GC)$20.00 $10.00 $5.00 $45.00
43.0% $79.00
Rum River Hills Golf Club $25.00 45.7% $19.00 $32.21 30.0% $46.00 $33.00 28% $33.00 28%
Rush Creek Golf Club - reg $99.00 28.8% $79.00 $25.00 $79.00 43.2% $139.00
Shamrock Golf Course $14.00 $8.00 $4.00 $25.00 44.4% $23.00 48.9% $45.00
Southern Hills Golf Club $17.00 $11.00 $40.00 16.7% $34.00 29.2% $23.00 $32.00 33.3% $48.00 $32.50 32%
St. Croix National Golf Course $39.00 43.5% $38.00 44.9% $25.00 $35.00 49.3% $69.00 $50.00 28% $54.00 22%
Stillwater Oaks Golf Course $13.00 $8.00 $29.00 21.6% $29.00 21.6% $27.00 27.0% $37.00
StoneRidge Golf Club $69.00 17.9% $84.00
Sundance Golf & Bowl $16.00 $9.00 $36.00 21.7% $14.00 $29.00 37.0% $46.00
Tanners Brook Golf Club $16.00 $10.00 $4.00 $36.00 35.7% $28.00 $34.00 39.3% $20.00 $28.00 50.0% $56.00 $34.00 39% $34.00 39%
The Refuge Golf Club $18.00 $13.00 $30.00 53.1% $41.00 35.9% $37.00 42.2% $64.00 $39.00 39% $39.00 39%
Theodore Wirth Golf Course $17.00 $11.00 $33.00 26.7% $27.00 $42.00 6.7% $13.00 $31.00 31.1% $38.00 15.6% $45.00
Troy Burne Golf Club $20.00 $78.00 27.8% $67.00 $78.00 27.8% $69.00 36.1% $108.00
U of M Les Bolsad GC $17.00 $11.00 $7.00 $39.00 23.5% $32.00 $39.00 23.5% $24.00 $29.67 41.8% $43.00 15.7% $51.00
Valleywood Golf Course $17.00 $10.00 $42.00 19.2% $32.00 $44.00 15.4% $27.00 $33.00 36.5% $49.00 5.8% $52.00
Victory Links Golf Course $17.75 $12.00 $55.50 11.6% $18.25 $36.00 42.6% $62.75
Viking Meadows Golf Course $26.00 21.2% $12.00 $33.00
White Eagle Golf Club $59.00 14.5% $49.00 $54.00 21.7% $30.00 $42.00 39.1% $69.00
Averages $16.58 $10.41 $5.00 $38.70 29.5% $34.42 $39.94 21.8% $21.90 $32.00 38.3% $47.82 17.1% $54.04 $58.50 $43.85 17.7% $45.04 14.7%
Weekday Green FeesFees
Cart
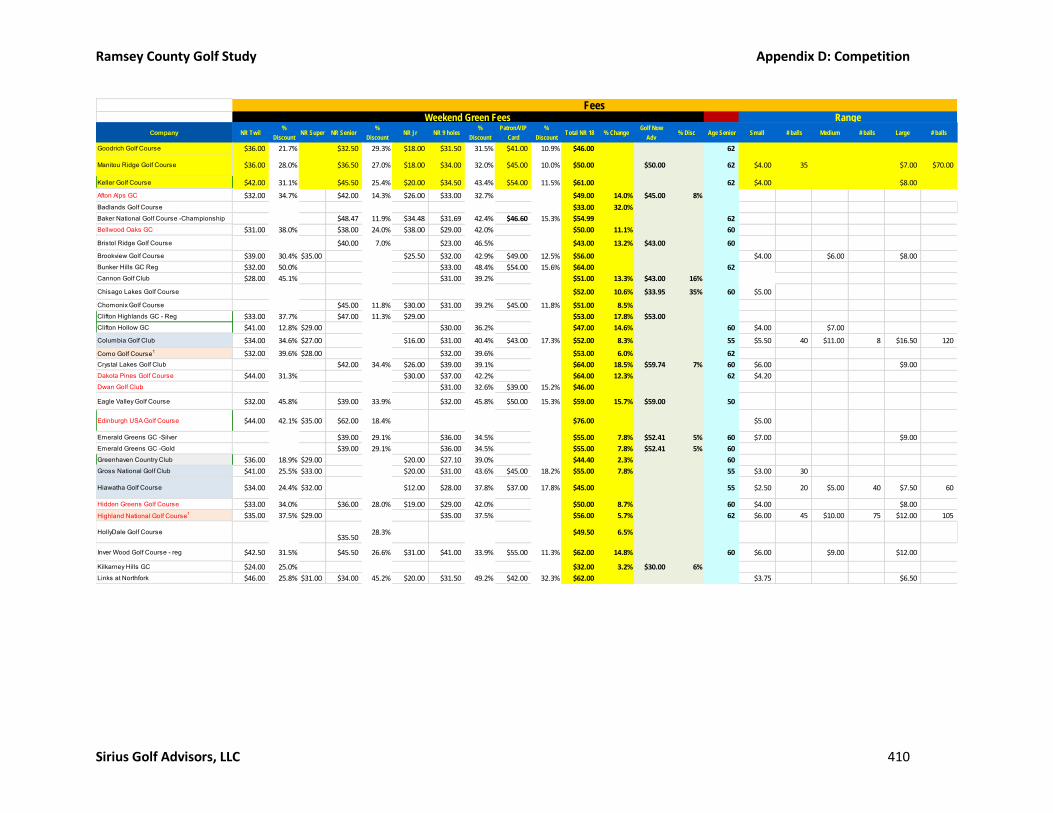
Ramsey County Golf Study Appendix D: Competition
Sirius Golf Advisors, LLC 410
Company NR Twil%
DiscountNR Super NR Senior
%
DiscountNR Jr NR 9 holes
%
Discount
Patron/VIP
Card
%
DiscountTotal NR 18 % Change
Golf Now
Adv% Disc Age Senior Small # balls Medium # balls Large # balls
Goodrich Golf Course $36.00 21.7% $32.50 29.3% $18.00 $31.50 31.5% $41.00 10.9% $46.00 62
Manitou Ridge Golf Course $36.00 28.0% $36.50 27.0% $18.00 $34.00 32.0% $45.00 10.0% $50.00 $50.00 62 $4.00 35 $7.00 $70.00
Keller Golf Course $42.00 31.1% $45.50 25.4% $20.00 $34.50 43.4% $54.00 11.5% $61.00 62 $4.00 $8.00
Afton Alps GC $32.00 34.7% $42.00 14.3% $26.00 $33.00 32.7% $49.00 14.0% $45.00 8%
Badlands Golf Course $33.00 32.0%
Baker National Golf Course -Championship $48.47 11.9% $34.48 $31.69 42.4% $46.60 15.3% $54.99 62
Bellwood Oaks GC $31.00 38.0% $38.00 24.0% $38.00 $29.00 42.0% $50.00 11.1% 60
Bristol Ridge Golf Course $40.00 7.0% $23.00 46.5% $43.00 13.2% $43.00 60
Brookview Golf Course $39.00 30.4% $35.00 $25.50 $32.00 42.9% $49.00 12.5% $56.00 $4.00 $6.00 $8.00
Bunker Hills GC Reg $32.00 50.0% $33.00 48.4% $54.00 15.6% $64.00 62
Cannon Golf Club $28.00 45.1% $31.00 39.2% $51.00 13.3% $43.00 16%
Chisago Lakes Golf Course $52.00 10.6% $33.95 35% 60 $5.00
Chomonix Golf Course $45.00 11.8% $30.00 $31.00 39.2% $45.00 11.8% $51.00 8.5%
Clifton Highlands GC - Reg $33.00 37.7% $47.00 11.3% $29.00 $53.00 17.8% $53.00
Clifton Hollow GC $41.00 12.8% $29.00 $30.00 36.2% $47.00 14.6% 60 $4.00 $7.00
Columbia Golf Club $34.00 34.6% $27.00 $16.00 $31.00 40.4% $43.00 17.3% $52.00 8.3% 55 $5.50 40 $11.00 8 $16.50 120
Como Golf Course1 $32.00 39.6% $28.00 $32.00 39.6% $53.00 6.0% 62
Crystal Lakes Golf Club $42.00 34.4% $26.00 $39.00 39.1% $64.00 18.5% $59.74 7% 60 $6.00 $9.00
Dakota Pines Golf Course $44.00 31.3% $30.00 $37.00 42.2% $64.00 12.3% 62 $4.20
Dwan Golf Club $31.00 32.6% $39.00 15.2% $46.00
Eagle Valley Golf Course $32.00 45.8% $39.00 33.9% $32.00 45.8% $50.00 15.3% $59.00 15.7% $59.00 50
Edinburgh USA Golf Course $44.00 42.1% $35.00 $62.00 18.4% $76.00 $5.00
Emerald Greens GC -Silver $39.00 29.1% $36.00 34.5% $55.00 7.8% $52.41 5% 60 $7.00 $9.00
Emerald Greens GC -Gold $39.00 29.1% $36.00 34.5% $55.00 7.8% $52.41 5% 60
Greenhaven Country Club $36.00 18.9% $29.00 $20.00 $27.10 39.0% $44.40 2.3% 60
Gross National Golf Club $41.00 25.5% $33.00 $20.00 $31.00 43.6% $45.00 18.2% $55.00 7.8% 55 $3.00 30
Hiawatha Golf Course $34.00 24.4% $32.00 $12.00 $28.00 37.8% $37.00 17.8% $45.00 55 $2.50 20 $5.00 40 $7.50 60
Hidden Greens Golf Course $33.00 34.0% $36.00 28.0% $19.00 $29.00 42.0% $50.00 8.7% 60 $4.00 $8.00
Highland National Golf Course1 $35.00 37.5% $29.00 $35.00 37.5% $56.00 5.7% 62 $6.00 45 $10.00 75 $12.00 105
HollyDale Golf Course$35.50
28.3% $49.50 6.5%
Inver Wood Golf Course - reg $42.50 31.5% $45.50 26.6% $31.00 $41.00 33.9% $55.00 11.3% $62.00 14.8% 60 $6.00 $9.00 $12.00
Kilkarney Hills GC $24.00 25.0% $32.00 3.2% $30.00 6%
Links at Northfork $46.00 25.8% $31.00 $34.00 45.2% $20.00 $31.50 49.2% $42.00 32.3% $62.00 $3.75 $6.50
Weekend Green Fees RangeFees

Ramsey County Golf Study Appendix D: Competition
Sirius Golf Advisors, LLC 411
Company NR Twil%
DiscountNR Super NR Senior
%
DiscountNR Jr NR 9 holes
%
Discount
Patron/VIP
Card
%
DiscountTotal NR 18 % Change
Golf Now
Adv% Disc Age Senior Small # balls Medium # balls Large # balls
Logger's Trail Golf Club $38.00 43.3% $28.00 $34.00 49.3% $67.00 6.3% $62.00 7% $3.00 $9.00
Majestic Oaks GC - Crossroad $36.00 33.3% $42.00 22.2% $25.00 $31.00 42.6% $54.00 12.5% $54.00 62 $7.00
Majestic Oaks GC - Signature $36.00 40.0% $45.00 25.0% $28.00 $54.00 10.0% $60.00 11.1% $60.00
Meadowbrook Golf Course $41.00 25.5% $33.00 $20.00 $31.00 43.6% $45.00 18.2% $55.00 7.8% 55
New Richmond Golf Club $46.00 30.3% $46.00 $37.00 43.9% $66.00 8.2%
Oak Glen Golf Club - Champion $36.00 32.1% $35.00 34.0% $37.00 30.2% $53.00 17.8% 62
Oak Marsh Golf Club $29.17 49.3% $20.00 $30.50 47.0% $57.50 9.5% $57.50 60 $5.50 42
Oneka Ridge Golf Course $21.00 $30.00 41.2% $51.00 2.0% 62
Phalen Park Golf Course1 $32.00 39.6% $28.00 $32.00 39.6% $53.00 6.0% 62
Prestwick Golf Club @ Wedgewood $60.00 29.4% $47.00 $57.00 32.9% $80.00 5.9% $85.00
River Falls Golf Club $29.00 35.6% $35.00 22.2% $45.00 25.0%
River Oaks Municipal GC $32.00 40.7% $36.00 33.3% $19.00 $35.00 35.2% $51.00 5.6% $54.00 4.9% 62 $4.50 $7.00 $9.00
Royal Club (formerly Tartan Park GC) $45.00 43.0% $79.00$5.00 $8.00
Rum River Hills Golf Club $25.00 49.0% $19.00 $49.00 6.5% $37.00 24% 60 $4.00 $7.50
Rush Creek Golf Club - reg $99.00 28.8% $79.00 $25.00 $79.00 43.2% $139.00 $3.00 $7.00 $10.00
Shamrock Golf Course $25.00 49.0% $28.00 42.9% $49.00 8.9% $4.00 30 $7.50 60 $10.00 $90.00
Southern Hills Golf Club $40.00 29.8% $34.00 40.4% $57.00 18.8% $43.00 25% $5.60 $8.40
St. Croix National Golf Course $59.00 25.3% $25.00 $45.00 43.0% $79.00 14.5% 55
Stillwater Oaks Golf Course $29.00 32.6% $30.00 30.2% $43.00 16.2%
StoneRidge Golf Club $69.00 30.3% $99.00 17.9%
Sundance Golf & Bowl $33.00 32.7% $49.00 6.5% $4.00 $7.00
Tanners Brook Golf Club $36.00 40.0% $28.00 $20.00 $31.00 48.3% $60.00 7.1% $52.00 13% 50 $4.00 27 $7.00 52
The Refuge Golf Club $30.00 53.1% $64.00 $54.00 16% 55
Theodore Wirth Golf Course $33.00 34.0% $27.00 $50.00 0.0% $13.00 $31.00 38.0% $42.00 16.0% $50.00 11.1% 55
Troy Burne Golf Club $79.00 26.9% $108.00 55
U of M Les Bolsad GC $39.00 23.5% $32.00 $24.00 $43.00 15.7% $51.00 55
Valleywood Golf Course $42.00 30.0% $32.00 $35.00 41.7% $57.00 5.0% $60.00 15.4% 55 $5.00 $8.00
Victory Links Golf Course $55.50 11.6% $18.25 $36.00 42.6% $42.00 33.1% $62.75 60 $5.00 $7.00 $10.00
Viking Meadows Golf Course $33.00
White Eagle Golf Club $59.00 25.3% $49.00 $54.00 31.6% $42.00 46.8% $79.00 14.5% 55
Averages $38.73 34.0% $33.23 $42.71 24.0% $23.87 $33.72 39.6% $49.94 17.5% $57.97 11.3% 13.9% $4.61 33.6 $7.66 47.0 $9.10 $89.00
Weekend Green Fees RangeFees

Ramsey County Golf Study Appendix D: Competition
Sirius Golf Advisors, LLC 412
Company 2016 2017 % Chg Total Revenue Total Expenses NOI Maint Total Payroll
Goodrich Golf Course 26,837 29,674 10.6% $989,296
Manitou Ridge Golf Course 34,147 30,350 -11.1% $1,153,882
Keller Golf Course 28,978 28,972 0.0% $2,715,286
Afton Alps GC cb
Badlands Golf Course 21,000
Baker National Golf Course -Championship 34,000
Bellwood Oaks GC
Bristol Ridge Golf Course cb
Brookview Golf Course 39,588 40,717 2.9% $2,106,472 $2,172,621 ($66,149)
Bunker Hills GC Reg 56,052 $6,689,204 $6,300,339 $388,865 $921,628 $3,063,175
Cannon Golf Club 23,000
Chisago Lakes Golf Course 23,561 21,879 -7.1%
Chomonix Golf Course 28,761
Clifton Highlands GC - Reg cb
Clifton Hollow GC 20,000
Columbia Golf Club 34,253 33,000 -3.7%
Como Golf Course1 31,743 26,604 -16.2%
Crystal Lakes Golf Club 40,169 40,738 1.4%
Dakota Pines Golf Course
Dwan Golf Club 40,000 $1,301,771 $1,275,174 $26,597 $797,662
Eagle Valley Golf Course 36,186 $1,554,204 $1,199,850 $354,354 $728,304
Edinburgh USA Golf Course 33,505 31,776 -5.2% $1,477,635 $1,922,647 ($445,012)
Emerald Greens GC -Silver
Emerald Greens GC -Gold
Greenhaven Country Club 33,958 $974,193 $955,649 $18,544 $580,717
Gross National Golf Club 42,035 38,732 -7.9%
Hiawatha Golf Course 24,752 29,166 17.8%
Hidden Greens Golf Course 22,000
Highland National Golf Course1 30,865 30,396 -1.5%
HollyDale Golf Course
Inver Wood Golf Course - reg 44,067 $1,467,194 $3,682,241 ($2,215,047) $873,024
Kilkarney Hills GC
Links at Northfork
Logger's Trail Golf Club
Rounds Financial PerformanceRevenue Operating Expenses (exl depreciation)

Ramsey County Golf Study Appendix D: Competition
Sirius Golf Advisors, LLC 413
Company 2016 2017 % Chg Total Revenue Total Expenses NOI Maint Total Payroll
Majestic Oaks GC - Crossroad 37,000
Majestic Oaks GC - Signature 33,000
Meadowbrook Golf Course
New Richmond Golf Club
Oak Glen Golf Club - Champion em
Oak Marsh Golf Club 36,000 35,500 -1.4%
Oneka Ridge Golf Course
Phalen Park Golf Course1 32,010 24,481 -23.5%
Prestwick Golf Club @ Wedgewood em
River Falls Golf Club
River Oaks Municipal GC 29,500 29,500 0.0% $1,471,676 $1,592,656 ($120,980) $952,766
Royal Club (formerly Tartan Park GC)
Rum River Hills Golf Club
Rush Creek Golf Club - reg
Shamrock Golf Course
Southern Hills Golf Club cb
St. Croix National Golf Course cb
Stillwater Oaks Golf Course 24,000
StoneRidge Golf Club
Sundance Golf & Bowl
Tanners Brook Golf Club
The Refuge Golf Club
Theodore Wirth Golf Course 25,414
Troy Burne Golf Club 22,250 20,000 -10.1%
U of M Les Bolsad GC 27,000
Valleywood Golf Course 33,000 $1,356,436 $1,538,861 ($182,425) $869,905
Victory Links Golf Course
Viking Meadows Golf Course
White Eagle Golf Club em
Averages 31,506 31,391 -3.4% $1,938,104 $2,293,338 ($355,233) $921,628 $1,123,650
Rounds Financial PerformanceRevenue Operating Expenses (exl depreciation)

Ramsey County Golf Study Appendix D: Competition
Sirius Golf Advisors, LLC 414
Google Yelp Facebook
Company Curb Neigh MaintAesthe
tics
Clubho
useTotal
Overall Rating/
Total Reviews
Overall
Rating/ Total
Reviews
Rating past
12
months/Total
Overall
Rating/ Total
Reviews
Overall Rating/
Total ReviewsRatings # rating #
Rating
last yr
# Last
yrrating #
Rating
s# Avg Rating Rank
Total
Resp
Goodrich Golf Course 6 5 7 6 6 30 4.0 stars / 34 3.5 stars / 2 - 4 stars / 1 3.9 stars / 25 4 34 3.5 2 4 1 3.9 25 3.94 42.00 62
Manitou Ridge Golf Course6.5 6.5 7 7.5 6.5 34
3.8 stars / 58 4.0 stars / 3 - - 4.2 stars / 48 3.8 58 4 3 4.2 483.98 41.00 109
Keller Golf Course 8 6 8 8.5 9.5 40 4.3 stars / 101 4.3 stars / 3 - 4.4 stars / 4 - 4.3 101 4.3 3 4.4 4 4.30 15.00 108
Afton Alps GC 6.5 6 6.5 6.5 5 30.5 5 stars / 2 3.5 stars / 61 3.5 stars / 11 3.5 stars / 40 4.4 stars / 1,092 5 2 3.5 61 3.5 11 3.5 40 3.53 52.00 103
Badlands Golf Course 4.1 stars/32 4.5 stars / 2 - 3.5 stars / 3 4.1 32 4.5 2 3.5 3 4.07 32.00 37
Baker National Golf Course -Championship #N/A
Bellwood Oaks GC 7 6.5 7.5 7 4 32 #N/A
Bristol Ridge Golf Course 4.5 stars / 28 4.5 stars / 84 4.7 stars / 12 3 stars / 5 4.6 stars/ 50 4.5 28 4.5 84 4.7 12 3 5 4.6 50 4.50 7.00 167
Brookview Golf Course 8 6 7.5 7.5 7.5 9.5 3.9 stars / 54 2.7 stars / 3 - 3 stars / 5 4.1 stars / 45 3.9 54 2.7 3 3 5 4.1 45 3.91 44.00 107
Bunker Hills GC Reg 7.5 7 7 7.5 9 38 4.5 stars / 233 4.0 stars / 1 4.0 stars / 1 - 4.6 stars / 118 4.5 233 4 1 4 1 4.6 118 4.53 5.00 352
Cannon Golf Club #N/A
Chisago Lakes Golf Course #N/A
Chomonix Golf Course 6.5 6.5 7 6.5 6 32.5 4.1 stars / 50 3.6 stars / 5 4 stars / 1 3.5 stars / 3 4.2 stars / 81 4.1 50 3.6 5 4 1 3.5 3 4.2 81 4.13 28.00 139
Clifton Highlands GC - Reg 6.5 7 7.5 7.5 7 35.5 4.5 stars / 49 4.2 stars / 1094.2 stars / 29 4.5 stars / 3 - 4.5 49 4.2 109 4.2 29 4.5 3 4.28 18.00 161
Clifton Hollow GC 4.5 6 6.5 6.5 5.5 29 4.5 stars / 14 4.0 star / 51 3.0 stars / 1 4.5 stars / 4 4.6 stars / 61 4.5 14 4 51 3 1 4.5 4 4.6 61 4.34 11.00 130
Columbia Golf Club 7.5 7 7 7.5 7.5 36.5 4.0 stars / 113 3.9 stars / 3 4.0 stars / 1 2.5 stars / 3 4.3 stars / 54 4 113 3.9 3 4 1 2.5 3 4.3 54 4.07 34.00 173
Como Golf Course1 7 6 6 7.5 7 33.5 4.3 stars / 79 4.0 stars / 3 - 2.5 stars / 6 - 4.3 79 4 3 2.5 6 4.17 26.00 88
Crystal Lakes Golf Club 7.5 8 7.5 7 7 37 #N/A
Dakota Pines Golf Course 8 7.5 8 8 8 39.5 4.4 stars / 36 4.2 stars / 2 4.0 stars / 1 4 stars / 6 - 4.4 36 4.2 2 4 1 4 6 4.33 13.00 44
Dwan Golf Club 5.5 6 6.5 6.5 4 28.5 3.6 stars / 53 - - 4 stars / 5 4.8 stars / 5 3.6 53 4 5 4.8 5 3.73 48.00 63
Eagle Valley Golf Course 7 7 8 8 8 38 4.3 stars / 96 4.5 stars / 89 4.4 stars / 17 3 stars / 6 4.5 stars / 101 4.3 96 4.5 89 4.4 17 3 6 4.5 101 4.40 9.00 292
Edinburgh USA Golf Course8 8.5 9 8.5 9.5 43.5
4.3 stars / 177 4.9 stars / 4 5.0 stars / 1 3 stars / 5 - 4.3 177 4.9 4 5 1 3 54.28 19.00 186
Emerald Greens GC -Silver 6.5 6 7.5 7.5 6 33.5 4.0 stars / 72 4.1 stars / 1844.1 stars / 28 3.5 stars / 3 3.9 stars / 46 4 7.2 4.1 184 4.1 28 3.5 3 3.9 46 4.06 36.00 240.2
Emerald Greens GC -Gold #N/A
Greenhaven Country Club 7 7 7 7 7 35 4.1 stars / 26 3.8 stars / 39 3.9 stars / 8 4 stars / 4 4.2 stars / 97 4.1 26 3.8 39 3.9 8 4 4 4.2 97 4.08 31.00 166
Gross National Golf Club 7 6.5 8 7 6 34.5 4.2 stars / 56 4.0 stars / 3 4.0 stars / 1 3.5 stars / 6 4.1 stars / 15 4.2 56 4 3 4 1 3.5 6 4.1 15 4.12 29.00 80
Hiawatha Golf Course7 5 5 6 6 29
3.9 stars / 106 1.0 stars / 1 1.0 stars / 1 2.5 stars / 18 3.9 106 1 1 1 1 2.5 183.65 50.00 125
Hidden Greens Golf Course 6 6 6 6 7 31 4.6 stars / 53 4.3 stars / 58 4.4 stars / 14 2.5 stars / 3 4.6 53 4.3 58 4.4 14 2.5 3 4.39 10.00 114
Highland National Golf Course1 7 7 7 7 5 33 4.3 stars / 79 4.0 stars / 1 - - 4 stars / 51 4.3 79 4 1 4 51 4.18 25.00 131
HollyDale Golf Course5 7 6.5 6.5 3 28
4.2 stars / 57 - - 3 stars / 5 4.2 stars / 40 4.2 57 3 5 4.2 404.14 27.00 102
Inver Wood Golf Course - reg 8 7 7.5 9 7.5 39 4.1 stars / 83 - - 2.5 stars / 10 4.4 stars / 32 4.1 83 2.5 10 4.4 32 4.05 37.00 125
Kilkarney Hills GC 6.5 6.5 6.5 7 6.5 33 4.3 stars / 71 4.4 stars / 16 5.0 stars / 1 4.5 stars / 7 4.3 71 4.4 16 5 1 4.5 7 4.34 12.00 94
Links at Northfork 8 8.5 8 8 8 40.5 #N/A
RatingsGoogle Golf Advisors Yelp FacebookPersonalRatings TotalGolfAdvisors

Ramsey County Golf Study Appendix D: Competition
Sirius Golf Advisors, LLC 415
Google Yelp Facebook
Company Curb Neigh MaintAesthe
tics
Clubho
useTotal
Overall Rating/
Total Reviews
Overall
Rating/ Total
Reviews
Rating past
12
months/Total
Overall
Rating/ Total
Reviews
Overall Rating/
Total ReviewsRatings # rating #
Rating
last yr
# Last
yrrating #
Rating
s# Avg Rating Rank
Total
Resp
Logger's Trail Golf Club 5 7.5 7 7.5 4 31 4.1 stars / 13 4.3 stars / 1624.4 stars / 48 4 stars / 2 - 4.1 13 4.3 162 4.4 48 4 2 4.31 14.00 177
Majestic Oaks GC - Crossroad 3.2 stars / 54 3.2 stars / 4 3.2 54 3.2 4 3.20 53.00 54
Majestic Oaks GC - Signature 8 7 7 7.5 8 37.5 4.2 stars /220 3.1 stars / 50 3.0 stars / 1 3 stars / 6 4.2 stars / 88 4.2 220 3.1 50 3 1 3 6 4.2 88 4.03 38.00 364
Meadowbrook Golf Course 5 7 5 6.5 2 25.5 3.9 stars / 34 - - 2 stars / 3 3.7 stars / 22 3.9 34 2 3 3.7 22 3.73 47.00 59
New Richmond Golf Club #N/A
Oak Glen Golf Club - Champion 7.5 7.5 7.5 7 8 37.5 3.9 stars / 33 4.0 stars / 1 - - 4.4 stars / 81 3.9 33 4 1 4.4 81 4.25 22.00 115
Oak Marsh Golf Club7 7 8 7.5 7.5 37
4.1 stars / 166 4.3 stars / 75 4.2 stars / 10 3 stars / 6 4.3 stars / 115 4.1 166 4.3 75 4.2 10 3 6 4.3 1154.19 24.00 362
Oneka Ridge Golf Course 6.5 7 7 6.5 6 33 4.3 stars / 51 3.6 stars / 2 - 4 stars / 1 - 4.3 51 3.6 2 4 1 4.27 21.00 54
Phalen Park Golf Course16 5 7 6.8 5 29.8 4.3 stars / 33 2.4 stars / 3 1.0 star / 1 4 stars / 4 3.8 stars / 46 4.3 33 2.4 3 1 1 4 4 3.8 46 3.92 43.00 86
Prestwick Golf Club @ Wedgewood 9 9 9 8.5 9 44.5 4.5 stars / 64 4.2 stars / 3 4.0 stars / 1 4 stars / 9 - 4.5 64 4.2 3 4 1 4 9 4.42 8.00 76
River Falls Golf Club 7.5 7.5 8 7.5 7 37.5 4.7 stars / 44 4.3 stars / 61 - - 4.6 stars / 55 4.7 44 4.3 61 4.6 55 4.51 6.00 160
River Oaks Municipal GC 7 7.5 8 7 7.5 37 4.4 stars / 74 4.2 stars / 2 4.0 stars / 1 3.5 stars / 3 4.2 stars / 78 4.4 74 4.2 2 4 1 3.5 3 4.2 78 4.28 20.00 157
Royal Club (formerly Tartan Park GC)6.5 9 9 8.5 9 42 #N/A
Rum River Hills Golf Club 6.5 5.5 5.5 7.5 7 32 3.9 stars / 58 2.9 stars / 39 2.8 stars / 13 - 4.1 stars / 70 3.9 58 2.9 39 2.8 13 4.1 70 3.68 49.00 167
Rush Creek Golf Club - reg 9 8.5 8.5 8.5 9 43.5 4.5 stars / 191 4.9 stars / 5 5.0 stars / 2 4 stars / 13 4.6 stars / 223 4.5 191 4.9 5 5 2 4 13 4.6 223 4.54 4.00 432
Shamrock Golf Course 5 6.5 6.5 4 4 26 4.1 stars / 84 4.0 stars / 3 4.0 stars / 2 4 stars / 1 4 stars / 42 4.1 84 4 3 4 2 4 1 4 42 4.06 35.00 130
Southern Hills Golf Club 7 7 7 7 6 34 4.1 stars / 28 4.2 stars / 33 4.7 stars / 3 3.5 stars / 6 4.3 stars / 97 4.1 28 4.2 33 4.7 3 3.5 6 4.3 97 4.23 23.00 164
St. Croix National Golf Course 8 8 7 9 6.5 38.5 3.6 stars / 35 4.5 stars / 74 4.7 stars / 7 4.5 stars / 2 4.4 stars / 71 3.6 35 4.5 74 4.7 7 4.5 2 4.4 71 4.30 16.00 182
Stillwater Oaks Golf Course 4 7 6.5 7 3 27.5 3.9 stars / 60 3.7 stars / 55 3.6 stars / 10 3.5 stars / 4 4.4 stars / 81 3.9 60 3.7 55 3.6 10 3.5 4 4.4 81 4.02 40.00 200
StoneRidge Golf Club9 8.5 9 9.5 8.5 44.5
4.3 stars / 33 4.7 stars / 12 5.0 stars / 1 3.5 stars / 7 - 4.3 33 4.7 12 5 1 3.5 74.30 17.00 52
Sundance Golf & Bowl 5 7 6 6.5 6 30.5 4.0 stars / 156 3.0 stars / 1 - - 4.1 stars / 68 4 156 3 1 4.1 68 4.03 39.00 225
Tanners Brook Golf Club 5 6 5.5 7.5 6.5 30.5 4.4 stars / 51 3.8 stars / 41 4.0 stars / 16 2.5 stars / 3 - 4.4 51 3.8 41 4 16 2.5 3 4.07 33.00 95
The Refuge Golf Club #N/A
Theodore Wirth Golf Course 8 6 6.5 7 6 33.5 3.9 stars / 103 - - 3.5 stars /15 3.8 stars / 66 3.9 103 3.5 15 3.8 66 3.83 45.00 184
Troy Burne Golf Club 9.5 9 9.5 9.5 9 46.5 4.8 stars / 57 4.8 stars / 5 5.0 stars / 1 4 stars / 9 - 4.8 57 4.8 5 5 1 4 9 4.70 2.00 71
U of M Les Bolsad GC 5 4 6 6 3 24 4.0 stars / 75 4.0 stars / 1 - - 4.2 stars / 64 4 75 4 1 4.2 64 4.09 30.00 140
Valleywood Golf Course 7.5 6 6.5 7.5 8 35.5 3.5 stars / 29 3.0 stars / 1 - 1.5 stars / 2 4.2 stars / 37 3.5 29 3 1 1.5 2 4.2 37 3.81 46.00 69
Victory Links Golf Course 7.5 7 8 8 6.5 37 4.6 stars / 60 4.6 stars / 5 4.5 stars / 2 4 stars / 3 4.7 stars / 82 4.6 60 4.6 5 4.5 2 4 3 4.7 82 4.64 3.00 150
Viking Meadows Golf Course 5 7 6.5 6.5 5 30 3.5 stars / 30 3.3 stars / 40 3.3 stars / 10 3.5 stars / 3 3.9 stars / 52 3.5 30 3.3 40 3.3 10 3.5 3 3.9 52 3.58 51.00 125
White Eagle Golf Club 8 8 8 8 8 40 4.5 stars / 62 4.9 stars / 74 5.0 stars / 1 4 stars / 11 4.8 stars / 121 4.5 62 4.9 74 5 1 4 11 4.8 121 4.73 1.00 268
Averages 6.8 6.9 7.2 7.3 6.6 34.3 4.2 69.1 3.9 31.9 4.0 7.5 3.5 6.1 4.3 67.4 4.14 147.48
RatingsGoogle Golf Advisors Yelp FacebookPersonalRatings TotalGolfAdvisors
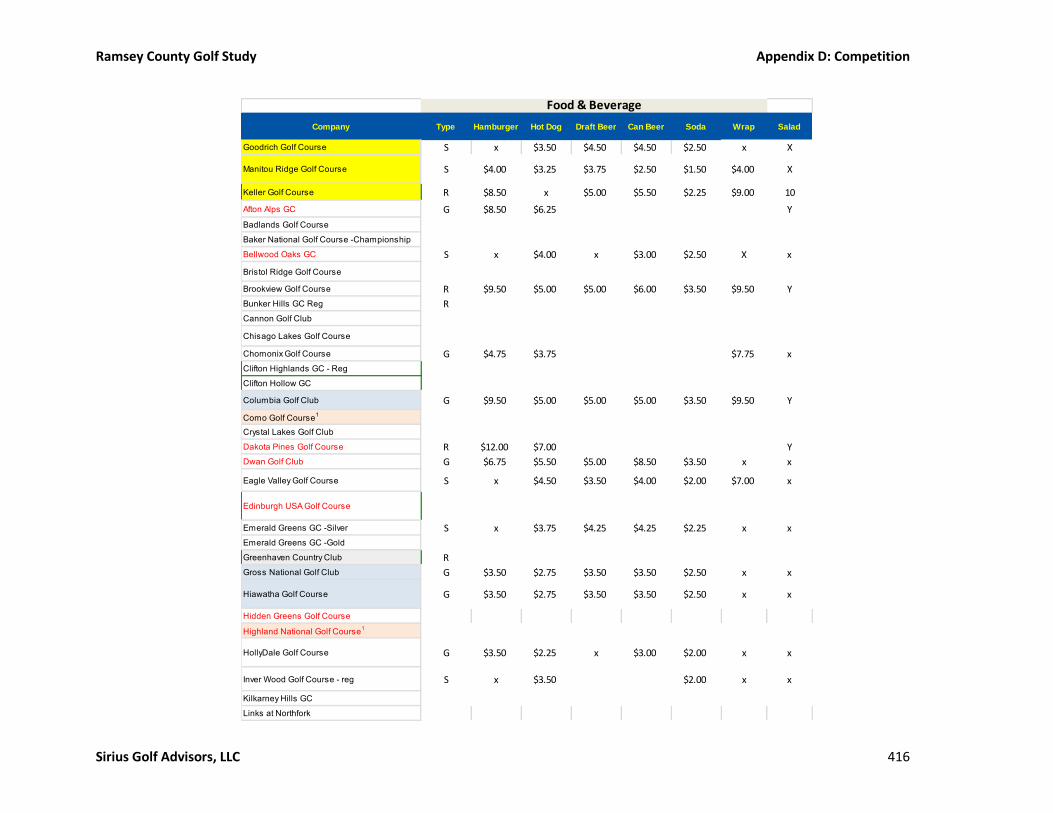
Ramsey County Golf Study Appendix D: Competition
Sirius Golf Advisors, LLC 416
Company Type Hamburger Hot Dog Draft Beer Can Beer Soda Wrap Salad
Goodrich Golf Course S x $3.50 $4.50 $4.50 $2.50 x X
Manitou Ridge Golf Course S $4.00 $3.25 $3.75 $2.50 $1.50 $4.00 X
Keller Golf Course R $8.50 x $5.00 $5.50 $2.25 $9.00 10
Afton Alps GC G $8.50 $6.25 Y
Badlands Golf Course
Baker National Golf Course -Championship
Bellwood Oaks GC S x $4.00 x $3.00 $2.50 X x
Bristol Ridge Golf Course
Brookview Golf Course R $9.50 $5.00 $5.00 $6.00 $3.50 $9.50 Y
Bunker Hills GC Reg R
Cannon Golf Club
Chisago Lakes Golf Course
Chomonix Golf Course G $4.75 $3.75 $7.75 x
Clifton Highlands GC - Reg
Clifton Hollow GC
Columbia Golf Club G $9.50 $5.00 $5.00 $5.00 $3.50 $9.50 Y
Como Golf Course1
Crystal Lakes Golf Club
Dakota Pines Golf Course R $12.00 $7.00 Y
Dwan Golf Club G $6.75 $5.50 $5.00 $8.50 $3.50 x x
Eagle Valley Golf Course S x $4.50 $3.50 $4.00 $2.00 $7.00 x
Edinburgh USA Golf Course
Emerald Greens GC -Silver S x $3.75 $4.25 $4.25 $2.25 x x
Emerald Greens GC -Gold
Greenhaven Country Club R
Gross National Golf Club G $3.50 $2.75 $3.50 $3.50 $2.50 x x
Hiawatha Golf Course G $3.50 $2.75 $3.50 $3.50 $2.50 x x
Hidden Greens Golf Course
Highland National Golf Course1
HollyDale Golf Course G $3.50 $2.25 x $3.00 $2.00 x x
Inver Wood Golf Course - reg S x $3.50 $2.00 x x
Kilkarney Hills GC
Links at Northfork
Food & Beverage
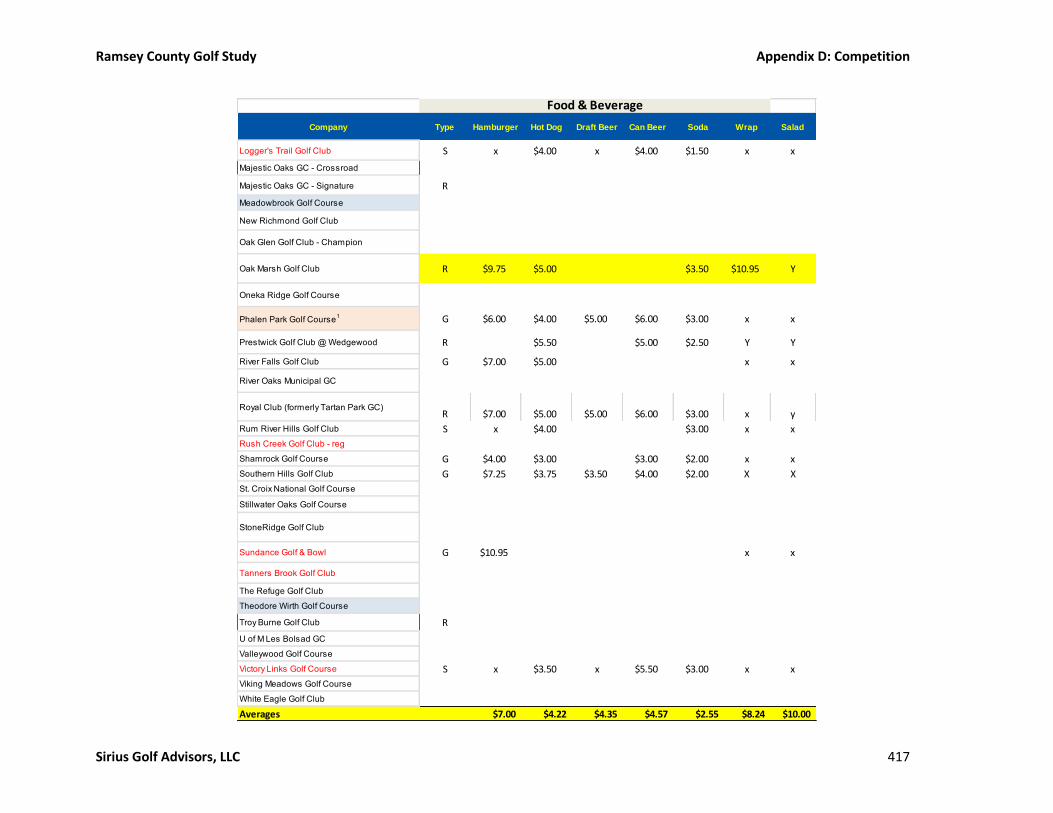
Ramsey County Golf Study Appendix D: Competition
Sirius Golf Advisors, LLC 417
Company Type Hamburger Hot Dog Draft Beer Can Beer Soda Wrap Salad
Logger's Trail Golf Club S x $4.00 x $4.00 $1.50 x x
Majestic Oaks GC - Crossroad
Majestic Oaks GC - Signature R
Meadowbrook Golf Course
New Richmond Golf Club
Oak Glen Golf Club - Champion
Oak Marsh Golf Club R $9.75 $5.00 $3.50 $10.95 Y
Oneka Ridge Golf Course
Phalen Park Golf Course1 G $6.00 $4.00 $5.00 $6.00 $3.00 x x
Prestwick Golf Club @ Wedgewood R $5.50 $5.00 $2.50 Y Y
River Falls Golf Club G $7.00 $5.00 x x
River Oaks Municipal GC
Royal Club (formerly Tartan Park GC)R $7.00 $5.00 $5.00 $6.00 $3.00 x y
Rum River Hills Golf Club S x $4.00 $3.00 x x
Rush Creek Golf Club - reg
Shamrock Golf Course G $4.00 $3.00 $3.00 $2.00 x x
Southern Hills Golf Club G $7.25 $3.75 $3.50 $4.00 $2.00 X X
St. Croix National Golf Course
Stillwater Oaks Golf Course
StoneRidge Golf Club
Sundance Golf & Bowl G $10.95 x x
Tanners Brook Golf Club
The Refuge Golf Club
Theodore Wirth Golf Course
Troy Burne Golf Club R
U of M Les Bolsad GC
Valleywood Golf Course
Victory Links Golf Course S x $3.50 x $5.50 $3.00 x x
Viking Meadows Golf Course
White Eagle Golf Club
Averages $7.00 $4.22 $4.35 $4.57 $2.55 $8.24 $10.00
Food & Beverage
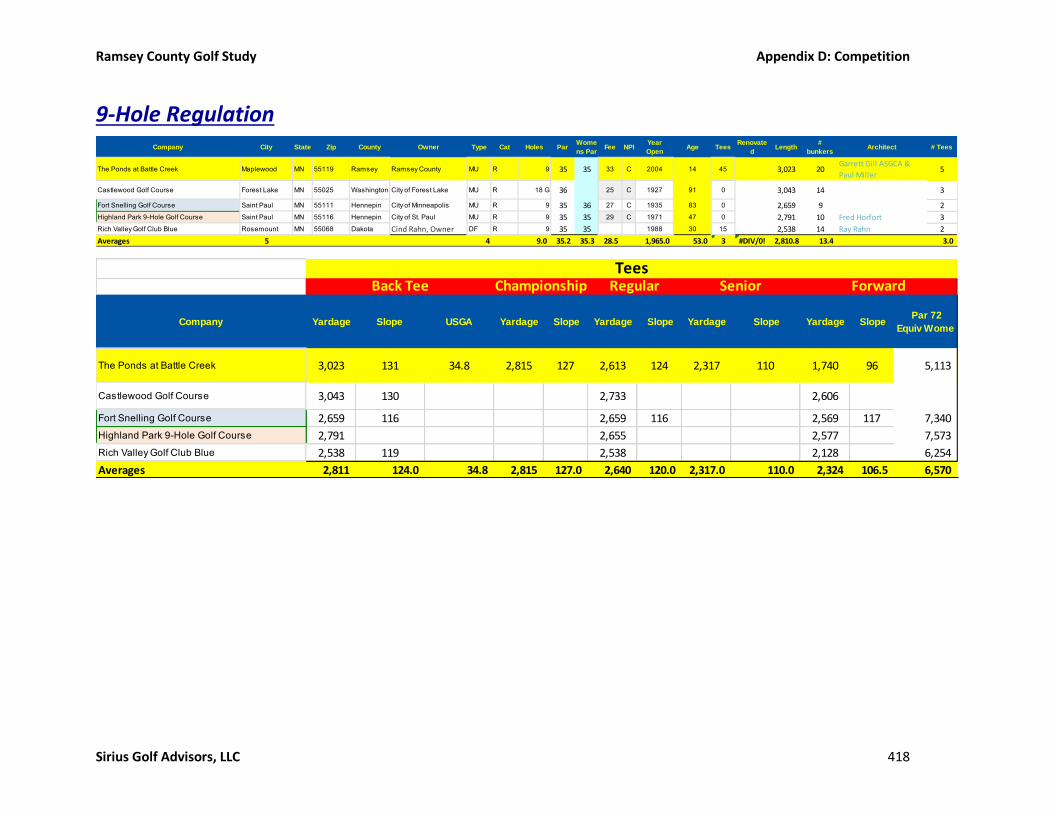
Ramsey County Golf Study Appendix D: Competition
Sirius Golf Advisors, LLC 418
9-Hole Regulation
Company City State Zip County Owner Type Cat Holes ParWome
ns ParFee NPI
Year
OpenAge Tees
Renovate
dLength
#
bunkersArchitect # Tees
The Ponds at Battle Creek Maplewood MN 55119 Ramsey Ramsey County MU R 9 35 35 33 C 2004 14 45 3,023 20Garrett Gill ASGCA &
Paul Miller5
Castlewood Golf Course Forest Lake MN 55025 Washington City of Forest Lake MU R 18 G 36 25 C 1927 91 0 3,043 14 3
Fort Snelling Golf Course Saint Paul MN 55111 Hennepin City of Minneapolis MU R 9 35 36 27 C 1935 83 0 2,659 9 2
Highland Park 9-Hole Golf Course Saint Paul MN 55116 Hennepin City of St. Paul MU R 9 35 35 29 C 1971 47 0 2,791 10 Fred Horfort 3
Rich Valley Golf Club Blue Rosemount MN 55068 Dakota Cind Rahn, Owner DF R 9 35 35 1988 30 15 2,538 14 Ray Rahn 2
Averages 5 4 9.0 35.2 35.3 28.5 1,965.0 53.0 3 #DIV/0! 2,810.8 13.4 3.0
Company Yardage Slope USGA Yardage Slope Yardage Slope Yardage Slope Yardage Slope Par 72
Equiv Wome
The Ponds at Battle Creek 3,023 131 34.8 2,815 127 2,613 124 2,317 110 1,740 96 5,113
Castlewood Golf Course 3,043 130 2,733 2,606
Fort Snelling Golf Course 2,659 116 2,659 116 2,569 117 7,340
Highland Park 9-Hole Golf Course 2,791 2,655 2,577 7,573
Rich Valley Golf Club Blue 2,538 119 2,538 2,128 6,254
Averages 2,811 124.0 34.8 2,815 127.0 2,640 120.0 2,317.0 110.0 2,324 106.5 6,570
TeesBack Tee Championship Regular Senior Forward

Ramsey County Golf Study Appendix D: Competition
Sirius Golf Advisors, LLC 419
Company 18 hole 9 hole Pull 18 NR Twil NR Super NR Senior NR Jr NR 9 holesPatron/VI
P CardTotal NR 18
Golf Now
Next% Disc
Golf Now
Adv% Disc
The Ponds at Battle Creek $28.00 $32.50 $18.00 $31.50 $41.00 $46.00
Castlewood Golf Course $29.00 $10.00 $26.00 $33.00 $27.00 18% $27.00 18%
Fort Snelling Golf Course $10.00 $24.00 $29.50 $11.00 $27.00 $42.50
Highland Park 9-Hole Golf Course $17.00 $12.00 $5.00 $27.00 $24.00 $26.00 $10.00 $30.00 $30.00
Rich Valley Golf Club Blue $18.00 $9.00 $5.00 $34.50 $21.50 $27.00 $43.50 $29.50 32% $29.50 32%
Averages $17.50 $10.33 $5.00 $26.33 $24.00 $30.30 $14.10 $28.30 $41.00 $39.00 $28.25 25.2% $28.25 25.2%
Weekday Green Fees
FeesCart
Company NR Twil NR Super NR Senior NR Jr NR 9 holesPatron/VIP
CardTotal NR 18
Golf Now
Adv% Disc Age Senior Small Large
The Ponds at Battle Creek $28.00 $32.50 $18.00 $31.50 $41.00 $46.00
Castlewood Golf Course $29.00 $10.00 $26.00 $33.00 $27.00 18%
Fort Snelling Golf Course $24.00 $29.50 $11.00 $27.00 $42.50
Highland Park 9-Hole Golf Course $27.00 $24.00 $26.00 $10.00 $30.00 $30.00
Rich Valley Golf Club Blue $34.50 $21.50 $27.00 $43.50 $39.50 9% 60 $5.50 $7.50
Averages $26.33 $24.00 $30.30 $14.10 $28.30 $41.00 $39.00 $33.25 $0.14 $5.50 $7.50
Weekend Green Fees
FeesRange
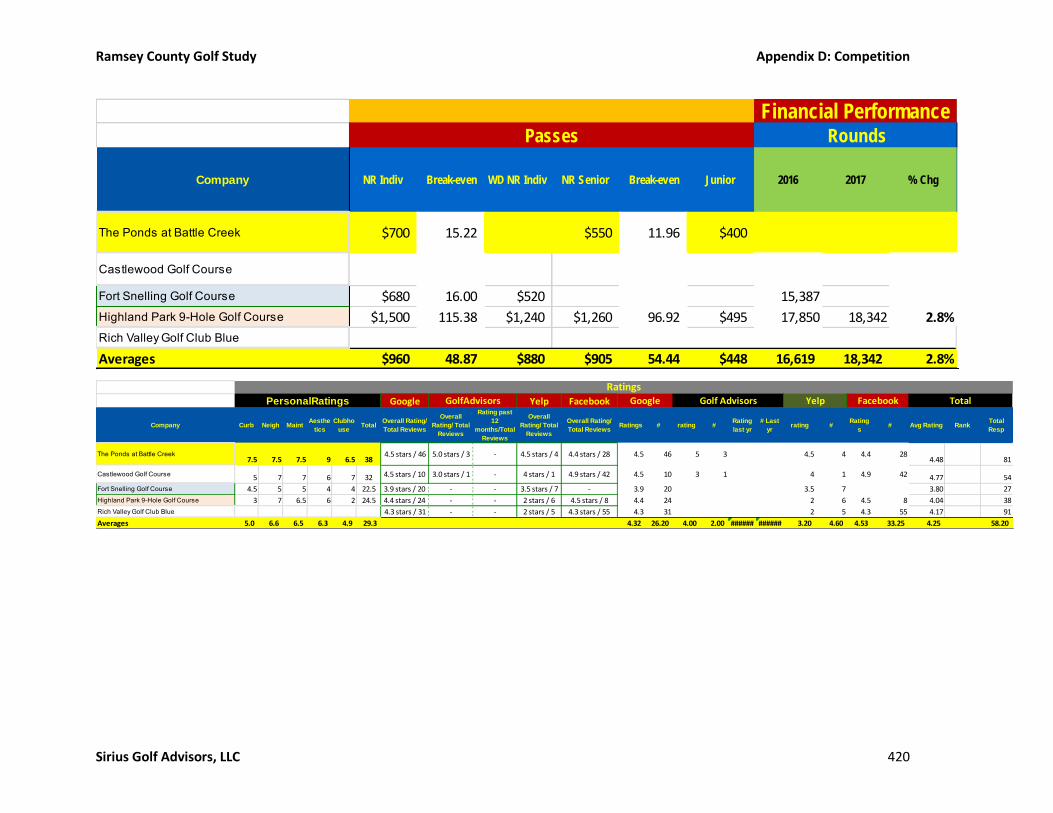
Ramsey County Golf Study Appendix D: Competition
Sirius Golf Advisors, LLC 420
Company NR Indiv Break-even WD NR Indiv NR Senior Break-even Junior 2016 2017 % Chg
The Ponds at Battle Creek $700 15.22 $550 11.96 $400
Castlewood Golf Course
Fort Snelling Golf Course $680 16.00 $520 15,387
Highland Park 9-Hole Golf Course $1,500 115.38 $1,240 $1,260 96.92 $495 17,850 18,342 2.8%
Rich Valley Golf Club Blue
Averages $960 48.87 $880 $905 54.44 $448 16,619 18,342 2.8%
Passes Rounds
Financial Performance
Google Yelp Facebook
Company Curb Neigh MaintAesthe
tics
Clubho
useTotal
Overall Rating/
Total Reviews
Overall
Rating/ Total
Reviews
Rating past
12
months/Total
Reviews
Overall
Rating/ Total
Reviews
Overall Rating/
Total ReviewsRatings # rating #
Rating
last yr
# Last
yrrating #
Rating
s# Avg Rating Rank
Total
Resp
The Ponds at Battle Creek7.5 7.5 7.5 9 6.5 38
4.5 stars / 46 5.0 stars / 3 - 4.5 stars / 4 4.4 stars / 28 4.5 46 5 3 4.5 4 4.4 284.48 81
Castlewood Golf Course 5 7 7 6 7 32 4.5 stars / 10 3.0 stars / 1 - 4 stars / 1 4.9 stars / 42 4.5 10 3 1 4 1 4.9 42 4.77 54
Fort Snelling Golf Course 4.5 5 5 4 4 22.5 3.9 stars / 20 - - 3.5 stars / 7 - 3.9 20 3.5 7 3.80 27
Highland Park 9-Hole Golf Course 3 7 6.5 6 2 24.5 4.4 stars / 24 - - 2 stars / 6 4.5 stars / 8 4.4 24 2 6 4.5 8 4.04 38
Rich Valley Golf Club Blue 4.3 stars / 31 - - 2 stars / 5 4.3 stars / 55 4.3 31 2 5 4.3 55 4.17 91
Averages 5.0 6.6 6.5 6.3 4.9 29.3 4.32 26.20 4.00 2.00 ###### ###### 3.20 4.60 4.53 33.25 4.25 58.20
RatingsGoogle Golf Advisors Yelp FacebookPersonalRatings TotalGolfAdvisors

Ramsey County Golf Study Appendix E: Performance
Sirius Golf Advisors, LLC 421
Appendix E: Performance
Rounds History 1982-2017
Goodrich Keller Manitou Ridge Battle Creek All
Year
1982 33,851 38,877 72,728
1983 34,161 38,135 72,296
1984 38,198 40,734 78,932
1985 40,776 42,869 83,645
1986 41,854 45,123 86,977
1987 47,366 42,300 89,666
1988 43,612 46,485 90,097
1989 43,912 45,633 89,545
1990 45,546 45,999 91,545
1991 44,157 41,256 85,413
1992 45,051 37,381 54,663 137,095
1993 40,710 40,911 54,525 136,146
1994 43,365 44,564 54,732 142,661
1995 39,713 40,624 52,723 133,060
1996 38,357 41,989 52,988 133,334
1997 40,842 42,782 54,424 138,048
1998 43,983 41,775 59,018 144,776
1999 39,003 41,915 57,813 138,731
2000 38,968 41,285 55,564 135,817
2001 35,655 39,869 52,720 128,244
2002 31,861 35,018 47,274 114,153
2003 33,966 37,897 49,488 121,351
2004 32,087 36,453 47,974 19,548 136,062
2005 26,712 30,622 44,010 18,830 120,174
2006 26,269 31,772 43,032 18,042 119,115
2007 25,485 31,334 42,395 18,413 117,627
2008 25,454 30,191 38,635 18,546 112,826
2009 24,138 31,147 39,003 20,212 114,500
2010 24,887 31,107 39,114 19,063 114,171
2011 23,190 26,296 35,965 15,362 100,813
2012 12,202 26,181 39,008 18,529 95,920
2013 11,120 32,719 16,385 60,224
2014 20,855 16,827 30,216 17,042 84,940
2015 24,712 31,520 40,351 17,848 114,431
2016 26,837 28,978 37,125 18,116 111,056
2017 31,833 28,972 37,084 18,944 116,833
Avg Last
10y 22,523 27,913 36,922 18,005 102,571
Ramsey County Golf Courses
Rounds played at County Courses
1982 - 2017
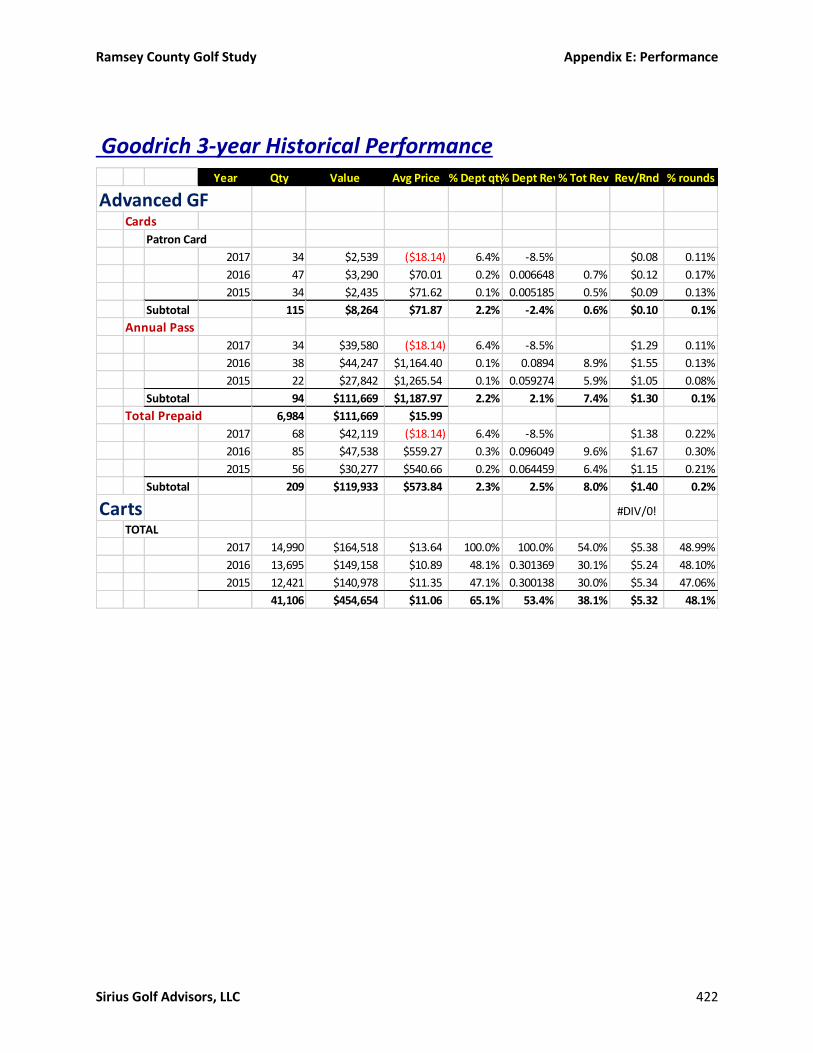
Ramsey County Golf Study Appendix E: Performance
Sirius Golf Advisors, LLC 422
Goodrich 3-year Historical Performance
Year Qty Value Avg Price % Dept qty% Dept Rev% Tot Rev Rev/Rnd % rounds
Advanced GFCards
Patron Card
2017 34 $2,539 ($18.14) 6.4% -8.5% $0.08 0.11%
2016 47 $3,290 $70.01 0.2% 0.006648 0.7% $0.12 0.17%
2015 34 $2,435 $71.62 0.1% 0.005185 0.5% $0.09 0.13%
Subtotal 115 $8,264 $71.87 2.2% -2.4% 0.6% $0.10 0.1%
Annual Pass
2017 34 $39,580 ($18.14) 6.4% -8.5% $1.29 0.11%
2016 38 $44,247 $1,164.40 0.1% 0.0894 8.9% $1.55 0.13%
2015 22 $27,842 $1,265.54 0.1% 0.059274 5.9% $1.05 0.08%
Subtotal 94 $111,669 $1,187.97 2.2% 2.1% 7.4% $1.30 0.1%
Total Prepaid 6,984 $111,669 $15.99
2017 68 $42,119 ($18.14) 6.4% -8.5% $1.38 0.22%
2016 85 $47,538 $559.27 0.3% 0.096049 9.6% $1.67 0.30%
2015 56 $30,277 $540.66 0.2% 0.064459 6.4% $1.15 0.21%
Subtotal 209 $119,933 $573.84 2.3% 2.5% 8.0% $1.40 0.2%
Carts #DIV/0!
TOTAL
2017 14,990 $164,518 $13.64 100.0% 100.0% 54.0% $5.38 48.99%
2016 13,695 $149,158 $10.89 48.1% 0.301369 30.1% $5.24 48.10%
2015 12,421 $140,978 $11.35 47.1% 0.300138 30.0% $5.34 47.06%
41,106 $454,654 $11.06 65.1% 53.4% 38.1% $5.32 48.1%

Ramsey County Golf Study Appendix E: Performance
Sirius Golf Advisors, LLC 423
Year Qty Value Avg Price % Dept qty% Dept Rev% Tot Rev Rev/Rnd % rounds
Green FeesDiscount
2017 -2,204 ($39,978) ($18.14) 6.4% -8.5% ($1.31)
2016 -1,634 ($45,780) $28.02 -5.7% -0.0925 ($1.61)
2015 -1,392 ($44,174) $31.73 -5.3% -0.09405 ($1.67)
Subtotal -5,230 ($129,932) $24.84 -1.5% -9.0% #DIV/0! ($1.53) #DIV/0!
Coupon/ Promotional
2017 321 $5,401 $16.83 0.9% 1.1% 0.6% $0.18 1.05%
2016 1 $28 $28.00 0.0% 5.66E-05 0.0% $0.00 0.00%
2015 1,667 $13,247 $7.95 6.3% 0.028202 2.8% $0.50 6.32%
Subtotal 1,989 $18,676 $9.39 2.4% 1.3% 1.1% $0.23 2.5%
Comp
Guest Comp
2017 204 $0.00 0.6% 0.0% $0.00 0.6%
2016 182 $0.00 0.6% 0 $0.00 0.64%
2015 240 $0.00 0.9% 0 $0.00 0.91%
Subtotal 626 $0 $0.00 0.7% 0.0% #DIV/0! $0.00 0.7%
Total PCC
2017 6,890 $0.00 22.52%
2016 #DIV/0! 0.0% 0 $0.00
2015 #DIV/0! 0.0% 0 $0.00
Subtotal 6,890 $0 $0.00 0.0% 0.0% #DIV/0! $0.00 22.5%
EZ Links
2017 813 $0.00 2.4% 0.0% $0.00 2.66%
2016 924 $0.00 3.2% 0 $0.00 3.25%
2015 764 $0.00 2.9% 0 $0.00 2.89%
Subtotal 2,501 $0 $0.00 2.8% 0.0% #DIV/0! $0.00 2.9%
Staff
2017 637 $0.00 1.8% 0.0% $0.00 2.08%
2016 704 $0.00 2.5% 0 $0.00 2.47%
2015 456 $0.00 1.7% 0 $0.00 1.73%
Subtotal 1,797 $0 $0.00 2.0% 0.0% #DIV/0! $0.00 2.1%
Total Comp
2017 1,700 $0 $0.00 #REF! 0.0% $0.00 5.56%
2016 1,856 $0.00 6.5% 0 $0.00 6.52%
2015 1,460 $0.00 5.5% 0 $0.00 5.53%
Subtotal 5,016 $0 $0.00 #REF! 0.0% #DIV/0! $0.00 5.9%

Ramsey County Golf Study Appendix E: Performance
Sirius Golf Advisors, LLC 424
Year Qty Value Avg Price % Dept qty% Dept Rev% Tot Rev Rev/Rnd % rounds
Green FeesPatron
2017 3,223 $82,410 $25.57 9.3% 17.5% 9.4% $2.69 10.53%
2016 1,658 $43,131 $26.01 5.8% 0.087145 8.7% $1.52 5.82%
2015 2,271 $54,270 $23.90 8.6% 0.11554 11.6% $2.06 8.60%
Subtotal 7,152 $179,811 $25.14 7.9% 12.6% 9.9% $2.09 8.3%
Seasonal
2017 2,058 $43,285 $21.03 6.0% 9.2% 5.0% $1.41 6.73%
2016 2,084 $37,890 $22.03 6.0% 9.2% 5.0% $1.33 7.32%
2015 1,461 $26,998 $18.48 5.5% 0.057478 5.7% $1.02 5.54%
Subtotal 5,603 $108,173 $19.31 5.8% 8.0% 5.2% $1.26 6.5%
Regular
2017 11,147 $262,612 $23.56 32.3% 55.7% 30.1% $8.58 36.43%
2016 12,760 $294,953 $18.18 7.3% 0.076555 7.7% $10.36 44.82%
2015 11,760 $272,088 $23.14 44.6% 0.579267 57.9% $10.31 44.56%
Subtotal 35,667 $829,654 $23.26 28.0% 40.4% 31.9% $9.75 41.9%
Pass
2017 2,415 $0 $0.00 7.0% 0.0% $0.00 7.89%
2016 2,934 $0.00 10.3% 0 $0.00 10.31%
2015 2,156 $0.00 8.2% 0 $0.00 8.17%
Subtotal 7,505 $0 $0.00 8.5% 0.0% #DIV/0! $0.00 8.8%
League
2017 1,594 $755 $0.47 0.1% 0.2% 0.1% $0.02 5.21%
2016 1,534 $0.00 5.4% 0 $0.00 5.39%
2015 1,410 $0.00 5.3% 0 $0.00 5.34%
Subtotal 4,538 $755 $0.17 3.6% 0.1% 0.1% $0.01 5.3%
Senior
2017 5,874 $129,234 $22.00 17.6% 19.1% 26.1% $4.22 19.20%
2016 6,959 $142,250 $20.44 24.4% 0.287412 28.7% $5.00 24.44%
2015 6,024 $121,978 $20.25 22.8% 0.259687 26.0% $4.62 22.82%
Subtotal 18,857 $393,461 $20.87 21.6% 24.6% 26.9% $4.61 22.2%
Total 18 hole
2017 24,221 $386,146 $15.94 53.6% 83.3% 43.6% $12.62 79.16%
2016 18,533 $423,037 $22.83 65.1% 0.854736 85.5% $14.86 65.10%
2015 17,869 $415,172 $23.23 67.7% 0.883888 88.4% $15.73 67.70%
Subtotal 60,623 $1,224,356 $20.20 62.1% 85.7% 72.5% $14.40 70.7%
Total 9 hole
2017 3,661 $50,121 $13.69 12.0% 11.4% 6.0% $1.64 11.97%
2016 4,405 $69,940 $15.88 15.5% 0.141312 14.1% $2.46 15.47%
2015 3,082 $24,851 $8.06 11.7% 0.052908 5.3% $0.94 11.68%
Subtotal 11,148 $144,913 $13.00 13.0% 10.3% 8.5% $1.68 13.0%
Total Twilight
2017 4,856 $89,554 $18.44 15.9% 20.3% 10.6% $2.93 15.87%
2016 4,883 $90,958 $18.63 13.6% 11.3% 7.0% $3.19 17.15%
2015 5,138 $95,662 $18.62 19.5% 0.203661 20.4% $3.62 19.47%
Subtotal 14,877 $276,175 $18.56 16.3% 17.3% 12.7% $3.25 17.5%
Total Weekday
2017 15,986 $344,277 $21.54 49.7% 76.2% 39.9% $11.25 52.25%
2016 9,679 $218,524 $22.58 0.0% 0.0% 0.0% $7.68 34.00%
2015 14,551 $308,306 $21.19 55.1% 0.656375 65.6% $11.68 55.13%
Subtotal 40,216 $871,108 $21.66 35.0% 47.3% 35.2% $10.20 47.1%
Total Weekend
2017 4,341 $129,324 $29.79 14.2% 29.0% 15.2% $4.23 14.19%
2016 4,812 $139,478 $28.99 0.0% 0.0% 0.0% $4.90 16.90%
2015 4,545 $129,125 $28.41 17.2% 0.274902 27.5% $4.89 17.22%
Subtotal 13,698 $397,926 $29.05 10.5% 18.8% 14.2% $4.67 16.1%
Total
2017 30,596 $471,558 $13.64 100.0% 100.0% 54.0% $15.41 100.0%
2016 28,469 $494,934 $17.38 100.0% 1 100.0% $17.38 100.00%
2015 26,394 $469,711 $17.80 100.0% 1 100.0% $17.80 100.00%
Subtotal 85,459 $1,436,203 $16.81 100.0% 100.0% 84.7% $16.86 100.0%

Ramsey County Golf Study Appendix E: Performance
Sirius Golf Advisors, LLC 425
Keller 3-year Historical Performance
Year Qty Value Avg Price % Dept qty% Dept Rev% Tot Rev Rev/Rnd % rounds
Advanced GFCards
Patron Card 2018 159 3,702
2017 128 $9,558 $74.67 0.4% 1.2% 1.2% $0.33 0.44%
2016 101 $7,071 $70.01 0.3% 0.9% 0.9% $0.24 0.35%
2015 98 $7,035 $71.78 0.3% 0.8% 0.8% $0.22 0.31%
Subtotal 327 $23,664 $72.37 0.4% 1.0% 1.0% $0.27 0.4%
Annual Pass
2018 50 $55,809 $1,116.17
2017 51 $58,366 $1,144.44 0.2% 7.5% 7.5% $2.01 0.18%
2016 56 $64,877 $1,158.52 0.2% 8.3% 8.3% $2.24 0.19%
2015 54 $62,777 $1,162.53 0.2% 7.1% 7.1% $1.99 0.17%
Subtotal 161 $186,020 $1,155.40 0.2% 7.7% 7.7% $2.08 0.2%
Total Prepaid
2017 179 $67,924 $379.46 0.6% 8.7% 8.7% $2.34 0.62%
2016 157 $71,948 $458.27 0.5% 9.2% 9.2% $2.48 0.54%
2015 152 $69,812 $459.29 0.5% 8.0% 8.0% $2.22 0.48%
Subtotal 488 $209,684 $429.68 0.5% 8.6% 8.6% $2.35 0.5%
Driving RangeBuckets
2017 6,018 $31,791 $5.28 20.8% 4.1% 4.1% $1.10 20.77%
2016 0.0% 0.0% $0.00
2015 0.0% 0.0% $0.00
Subtotal 6,018 $31,791.06 $5.28 6.9% 1.4% 4.1% $0.37 20.8%
Passes2017 705 $32,433 $46.00 2.4% 4.2% 4.2% $1.12 2.43%
2016 0.0% 0.0% $0.00
2015 0.0% 0.0% $0.00
Subtotal 705 $32,432.75 $46.00 0.8% 1.4% 4.2% $0.37 2.4%
Total2017 6,723 $64,224 $9.55 23.2% 8.2% 8.2% $2.22 23.21%
2016 0 $0 0.0% 0.0% $0.00
2015 0 $0 0.0% 0.0% $0.00
Subtotal 6,723 $64,223.81 $9.55 7.7% 2.7% 8.2% $0.74 23.2%
CartsTOTAL
2017 17,080 $216,952 $12.70 58.9% 27.8% 27.8% $7.49 58.96%
2016 16,842 $205,174 $12.18 58.1% 26.3% 26.3% $7.08 58.12%
2015 18,226 $221,124 $12.13 57.9% 25.2% 25.2% $7.02 57.88%
52,148 $643,249 $12.34 58.3% 26.4% 26.4% $7.20 58.3%

Ramsey County Golf Study Appendix E: Performance
Sirius Golf Advisors, LLC 426
Year Qty Value Avg Price % Dept qty% Dept Rev% Tot Rev Rev/Rnd % rounds
Green FeesCoupon/ Promotional
2017 0.0% 0.0% $0.00
2016 0.0% 0.0% $0.00
2015 448 $7,732 $17.26 1.4% 0.9% 0.9% $0.25 1.42%
Subtotal 448 $7,732 $17.26 0.5% 0.3% 0.9% $0.08 1.4%
Comp
Guest Comp
2017 529 $0.00 1.8% 0.0% $0.00 1.83%
2016 0.0% 0.0% $0.00
2015 0.0% 0.0% $0.00
Subtotal 529 $0 $0.00 0.6% 0.0% $0.00 1.8%
Total Comp
2017 529 $0.00 1.8% 0.0% $0.00 1.83%
2016 294 $0.00 1.0% 0.0% $0.00 1.01%
2015 492 $0.00 1.6% 0.0% $0.00 1.56%
Subtotal 1,315 $0 $0.00 1.5% 0.0% $0.00 1.5%
Patron
2017 1,797 $61,873 $34.43 6.2% 7.6% 4.7% $2.14 6.20%
2016 1,371 $47,927 $34.96 4.7% 6.1% 6.1% $1.65 4.73%
2015 1,449 $49,444 $34.12 4.6% 5.6% 5.6% $1.57 4.60%
Subtotal 11,248 $369,575 $32.86 12.8% 15.6% 15.6% $4.21 12.8%
Regular
2017 16,935 $537,063 $31.71 58.4% 68.9% 68.9% $18.54 58.46%
2016 16,643 $502,848 $31.71 $17.35 57.43%
2015 17,808 $549,966 $30.88 56.6% 62.6% 62.6% $17.47 56.56%
Subtotal 51,386 $1,589,877 $30.94 38.3% 43.8% 65.8% $17.79 57.5%
Pass
2017 3,078 $0 $0.00 10.6% 0.0% $0.00 10.62%
2016 3,207 $0.00 11.1% 0.0% $0.00 11.07%
2015 3,103 $0.00 9.9% 0.0% $0.00 9.85%
Subtotal 9,388 $0 $0.00 10.5% 0.0% $0.00 10.5%
Senior
2017 9,209 $210,332 $22.84 31.8% 27.0% 27.0% $7.26 31.79%
2016 10,114 $228,798 $22.62 34.9% 29.3% 29.3% $7.90 34.90%
2015 9,762 $228,298 $23.39 31.0% 26.0% 26.0% $7.25 31.00%
Subtotal 29,085 $667,428 $22.95 32.6% 27.4% 27.4% $7.47 32.6%
Total 18 hole
2017 19,514 $625,118 $32.03 67.3% 80.2% 80.2% $21.58 67.36%
2016 22,749 $652,983 $28.70 78.5% 83.8% 83.8% $22.53 78.50%
2015 26,219 $748,229 $28.54 83.3% 85.2% 85.2% $23.76 83.27%
Subtotal 68,482 $2,026,330 $29.59 76.4% 83.1% 83.1% $22.62 76.4%
Total 9 hole
2017 4,497 $92,508 $20.57 15.5% 11.9% 11.9% $3.19 15.52%
2016 5,452 $114,609 $21.02 18.8% 14.7% 14.7% $3.96 18.81%
2015 4,464 $93,497 $20.94 14.2% 10.6% 10.6% $2.97 14.18%
Subtotal 14,413 $300,614 $20.86 16.2% 12.4% 12.4% $3.37 16.2%
Total Twilight
2017 3,930 $91,642 $23.32 13.6% 11.8% 11.8% $3.16 13.57%
2016 #DIV/0! 13.6% 11.3% 7.0% $0.00
2015 5,048 $113,928 $22.57 16.0% 13.0% 13.0% $3.62 16.03%
Subtotal 8,978 $205,570 $22.90 14.4% 12.0% 10.6% $2.26 14.8%
Total
2017 28,970 $809,268 $27.93 100.0% 103.8% 103.8% $27.93 100.0%
2016 28,978 $779,573 $26.90 100.0% 100.0% 100.0% $26.90 100.00%
2015 31,487 $878,032 $27.89 100.0% 100.0% 100.0% $27.89 100.00%
Subtotal 89,435 $2,466,873 $27.58 100.0% 101.3% 101.3% $27.57 100.0%

Ramsey County Golf Study Appendix E: Performance
Sirius Golf Advisors, LLC 427
Manitou 3-year Historical Performance
Year Qty Value Avg Price Rev/Rnd % rounds
Advanced GFCards
Patron Card
2017 36 $2,688 $74.67 $0.09 0.12%
2016 44 $3,080 $70.01 $0.09 0.13%
2015 23 $1,610 $70.01 $0.04 0.06%
Subtotal 103 $7,379 $71.64 $0.07 0.10%
Annual Pass
2017 44 $50,735 $1,153.07 $1.67 0.14%
2016 50 $57,549 $1,150.99 $1.69 0.15%
2015 3,651 $52,882 $14.48 $1.32 9.09%
Subtotal 3,745 $161,166 $43.04 $1.54 3.58%
Total Prepaid
2017 80 $53,423 $667.79 $1.76 0.26%
2016 94 $60,630 $645.00 $1.78 0.28%
2015 3,674 $54,492 $14.83 $1.36 9.14%
Subtotal 3,848 $168,545 $43.80 $1.61 3.68%
Driving RangeBuckets
2017 4,300 $23,140 $5.38 $0.76 14.17%
2016 4,529 $22,599 $4.99 $0.66 13.26%
2015 4,757 $24,142 $5.08 $0.60 11.84%
Subtotal 13,586 $69,881.26 $5.14 $0.67 12.98%
Passes2017 599 $16,214 $27.07 $0.53 1.97%
2016 626 $14,605 $23.33 $0.43 1.83%
2015 538 $12,552 $23.33 $0.31 1.34%
Subtotal 1,763 $43,370.28 $24.60 $0.41 1.68%
Total2017 4,899 $39,354 $8.03 $1.30 16.14%
2016 5,155 $37,203 $7.22 $1.09 15.10%
2015 5,295 $36,694 $6.93 $0.91 13.18%
Subtotal 15,349 $113,251.54 $7.38 $1.08 14.66%
CartsTOTAL
2017 20,642 $225,419 $10.92 $7.43 68.01%
2016 20,275 $208,624 $10.29 $6.11 59.38%
2015 18,905 $198,383 $10.49 $4.94 47.05%
59,822 $632,426 $10.57 $6.04 57.15%

Ramsey County Golf Study Appendix E: Performance
Sirius Golf Advisors, LLC 428
Year Qty Value Avg Price Rev/Rnd % rounds
Green FeesCoupon/ Promotional
2017 7,343 $62,087 $8.46 $2.05 24.19%
2016 6,023 $48,777 $8.10 $1.43 17.64%
2015 5,569 $82,331 $14.78 $2.05 13.86%
Subtotal 22,679 $185,301 $8.17 $1.77 21.67%
Comp
Guest Comp
2017 32 $0.00 $0.00 0.11%
2016 65 $0.00 $0.00 0.19%
2015 53 $0.00 $0.00 0.13%
Subtotal 150 $0 $0.00 $0.00 0.14%
EZ Links
2017 515 $0.00 $0.00 1.70%
2016 771 $0.00 $0.00 2.26%
2015 319 $0.00 $0.00 0.79%
Subtotal 1,605 $0 $0.00 $0.00 1.53%
Staff #DIV/0! #DIV/0!
2017 437 $0.00 $0.00 1.44%
2016 320 $0.00 $0.00 0.94%
2015 359 $0.00 $0.00 0.89%
Subtotal 1,116 $0 $0.00 $0.00 1.07%
Total Comp
2017 547 $0 $0.00 $0.00 1.80%
2016 65 $0.00 $0.00 0.19%
2015 731 $0.00 $0.00 1.82%
Subtotal 1,343 $0 $0.00 $0.00 1.28%
Patron
2017 1,104 $26,597 $24.09 $0.88 3.64%
2016 1,457 $37,017 $25.41 $1.08 4.27%
2015 1,239 $26,770 $21.61 $0.67 3.08%
Subtotal 3,800 $90,383 $23.79 $0.86 3.63%
Seasonal
2017 3,346 $0.00 $0.00 11.02%
2016 #DIV/0! $0.00 0.00%
2015 #DIV/0! $0.00 0.00%
Subtotal 3,346 $0 $0.00 $0.00 3.20%
Regular
2017 13,004 $270,149 $20.77 $8.90 42.85%
2016 15,857 $333,123 $21.01 $9.76 46.44%
2015 15,852 $333,518 $21.04 $8.30 39.45%
Subtotal 44,713 $936,790 $20.95 $8.95 42.71%

Ramsey County Golf Study Appendix E: Performance
Sirius Golf Advisors, LLC 429
Green FeesPass
2017 3,533 $0 $0.00 $0.00 11.64%
2016 3,888 $0.00 $0.00 11.39%
2015 3,601 $0.00 $0.00 8.96%
Subtotal 11,022 $0 $0.00 $0.00 10.53%
Senior
2017 14,771 $233,112 $15.78 $7.68 48.67%
2016 12,296 $244,377 $19.87 $7.16 36.01%
2015 8,668 $189,676 $21.88 $4.72 21.57%
Subtotal 35,735 $667,164 $18.67 $6.37 34.14%
Total 18 hole
2017 16,286 $404,938 $24.86 $13.34 53.66%
2016 18,263 $421,676 $23.09 $12.35 53.48%
2015 18,762 $400,187 $21.33 $9.96 46.69%
Subtotal 53,311 $1,226,801 $23.01 $11.72 50.93%
Total 9 hole
2017 11,208 $205,745 $18.36 $6.78 36.93%
2016 10,784 $192,269 $17.83 $5.63 31.58%
2015 11,981 $216,242 $18.05 $5.38 29.82%
Subtotal 33,973 $614,256 $18.08 $5.87 32.45%
Total Twilight
2017 3,510 $65,468 $18.65 $2.16 11.57%
2016 5,223 $97,461 $18.66 $2.85 15.30%
2015 3,021 $44,085 $14.59 $1.10 7.52%
Subtotal 11,754 $207,014 $17.61 $1.98 11.23%
Total Weekday
2017 21,220 $476,834 $22.47 $15.71 69.92%
2016 23,759 $478,412 $20.14 $14.01 69.58%
2015 23,224 $453,136 $19.51 $11.28 57.80%
Subtotal 68,203 $1,408,382 $20.65 $13.45 65.15%
Total Weekend
2017 2,047 $59,684 $29.16 $1.97 6.74%
2016 4,339 $125,797 $28.99 $3.68 12.71%
2015 4,317 $122,430 $28.36 $3.05 10.74%
Subtotal 10,703 $307,911 $28.77 $2.94 10.22%
Total Green Fee, Cart Fee, Range and Pass
2017 30,350 $865,544 $28.52 $28.52 100.00%
2016 34,147 $923,897 $27.06 $27.06 100.00%
2015 40,183 $914,134 $22.75 $22.75 100.00%
Subtotal 104,680 $2,703,575 $25.83 $25.83 100.00%

Ramsey County Golf Study Appendix E: Performance
Sirius Golf Advisors, LLC 430
Battle Creek 3-year Historical Performance
Year Qty Value Avg Price % Tot Rev Rev/Rnd % rounds
Advanced GFCards
Patron Card
2017 60 $2,800 $46.67 0.4% $0.16 0.33%
2016 27 $1,073 $39.75 0.2% $0.06 0.15%
2015 67 $3,290 $49.10 1.4% $0.18 0.36%
Subtotal 154 $7,163.32 $46.52 0.5% $0.13 0.3%
Annual Pass
2017 37 $25,111 $678.67 3.7% $1.39 0.21%
2016 28 $18,996 $678.44 4.2% $1.07 0.16%
2015 26 $18,725 $720.19 7.7% $1.01 0.14%
Subtotal 91 $62,831.99 $690.46 4.0% $1.16 0.2%
Total Prepaid
2017 97 $27,911 $287.74 4.1% $1.55 0.54%
2016 0 $0 #DIV/0! 0.0% $0.00 0.00%
2015 93 $22,015 $236.72 9.1% $1.19 0.50%
Subtotal 190 $49,925.71 $262.77 3.2% $0.92 0.4%
Driving RangeBuckets
2017 9,991 $80,574 $8.06 11.9% $4.47 55.46%
2016 10,714 $84,132 $7.85 18.8% $4.73 60.19%
2015 11,986 $139,006 $11.60 30.2% $7.53 64.94%
Subtotal 32,691 $303,711.84 $9.29 19.2% $5.60 60.2%
Passes2017 1,524 $70,565 $46.30 10.4% $3.92 8.46%
2016 926 $52,722 $56.94 11.8% $2.96 5.20%
2015 $0.00
Subtotal 2,450 $123,286.90 $50.32 7.8% $2.27 4.5%
Total2017 11,515 $151,138 $13.13 22.3% $8.39 63.92%
2016 11,640 $136,855 $11.76 30.6% $7.69 65.39%
2015 11,986 $139,006 $11.60 30.2% $7.53 64.94%
Subtotal 35,141 $426,998.74 $12.15 26.9% $7.87 64.7%
CartsTOTAL
2017 8,305 $80,215 $9.66 11.8% $4.45 46.10%
2016 7,516 $71,266 $9.48 15.9% $4.00 42.22%
2015 7,684 $74,186 $9.65 30.6% $4.02 41.63%
23,505 $225,667.10 $9.60 14.2% $4.16 43.3%

Ramsey County Golf Study Appendix E: Performance
Sirius Golf Advisors, LLC 431
Year Qty Value Avg Price % Tot Rev Rev/Rnd % rounds
Green FeesDiscount
2017 -1,097 ($14,371) $13.10 -2.1% ($0.80)
2016 -98 ($2,043) $20.84 -0.5% ($0.11) -0.55%
2015 -542 ($13,325) $24.58 ($0.72)
Subtotal -1,737 ($29,738.92) $17.12 -1.9% ($0.55) -3.2%
Coupon/ Promotional
2017 575 $5,899 $10.26 0.9% $0.33 3.19%
2016 16 $253 $15.81 0.1% $0.01 0.09%
2015 894 $1,360 $1.52 0.6% $0.07 4.84%
Subtotal 1,485 $7,512.38 $5.06 0.5% $0.14 2.7%
Total PCC #DIV/0! 0.0% $0.00 0.00%
2017 2,562 $19,224 $7.50 2.8% #REF!
2016 #DIV/0!
2015 $0.00
Subtotal 2,562 $19,224.00 $7.50 1.2% $0.35 4.7%
Comp
Guest Comp #DIV/0!
2017 67 $0.00 $0.00 0.37%
2016 141 $0.00 0.0% $0.00 0.79%
2015 151 $0.00 $0.00 0.82%
Subtotal 359 $0.00 $0.00 0.0% $0.00 0.7%
EZ Links
2017 319 $0.00 $0.00 1.77%
2016 588 $0.00 0.0% $0.00 3.30%
2015 489 $0.00 $0.00 2.65%
Subtotal 1,396 $0.00 $0.00 0.0% $0.00 2.6%
Staff
2017 349 $0.00 $0.00 1.94%
2016 430 $0.00 0.0% $0.00 2.42%
2015 439 $0.00 $0.00 2.38%
Subtotal 1,218 $0.00 $0.00 0.0% $0.00 2.2%
Total Comp
2017 735 $0.00 $0.00 4.08%
2016 1,159 $0.00 0.0% $0.00 6.51%
2015 1,094 $0.00 $0.00 5.93%
Subtotal 2,988 $0.00 $0.00 0.0% $0.00 5.5%
Patron
2017 639 $10,314 $16.14 1.5% $0.57 3.55%
2016 958 $17,242 $18.00 3.9% $0.97 5.38%
2015 992 $16,416 $16.55 6.8% $0.89 5.37%
Subtotal 2,589 $43,971.70 $16.98 2.8% $0.81 4.8%
Seasonal
2017 723 $8,634 $11.94 1.3% $0.48 4.01%
2016 1,479 $18,344 $12.40 4.1% $1.03 8.31%
2015 1,070 $14,132 $13.21 5.8% $0.77 5.80%
Subtotal 3,272 $41,109.86 $12.56 2.6% $0.76 6.0%

Ramsey County Golf Study Appendix E: Performance
Sirius Golf Advisors, LLC 432
Year Qty Value Avg Price % Tot Rev Rev/Rnd % rounds
Green FeesRegular
2017 7,051 $131,408 $18.64 19.4% $7.29 39.14%
2016 7,511 $142,002 $18.91 31.8% $7.98 42.20%
2015 17,271 $223,548 $12.94 92.2% $12.11 93.57%
Subtotal 31,833 $496,958.75 $15.61 31.4% $9.16 58.7%
Pass
2017 2,319 $0.00 $0.00 12.87%
2016 2,714 $0.00 0.0% $0.00 15.25%
2015 850 $0.00 $0.00 4.61%
Subtotal 5,883 $0.00 $0.00 0.0% $0.00 10.8%
League
2017 89 $0.00 $0.00 0.49%
2016 0.0% $0.00 0.00%
2015
Subtotal 89 $0.00 $0.00 0.0% $0.00 0.2%
Senior
2017 4,868 $62,815 $12.90 9.3% $3.49 27.02%
2016 5,513 $54,309 $9.85 12.1% $3.05 30.97%
2015 4,459 $49,034 $11.00 20.2% $2.66 24.16%
Subtotal 14,840 $166,159.09 $11.20 10.5% $3.06 27.3%
Total 18 hole
2017 2,212 $11,419 $5.16 1.7% $0.63 12.28%
2016 986 $18,748 $19.01 4.2% $1.05 5.54%
2015 1,678 $24,833 $14.80 10.2% $1.35 9.09%
Subtotal 4,876 $54,999.62 $11.28 3.5% $1.01 9.0%
Total 9 hole
2017 14,683 $208,826 $14.22 30.8% $11.59 81.50%
2016 15,408 $215,304 $13.97 48.1% $12.10 86.56%
2015 14,201 $217,594 $15.32 89.8% $11.79 76.94%
Subtotal 44,292 $641,723.38 $14.49 40.5% $11.82 81.6%
Total Twilight
2017 575 $5,899 $10.26 0.9% $0.33 3.19%
2016 702 $7,390 $10.53 1.7% $0.42 3.94%
2015 830 $8,518 $10.26 3.5% $0.46 4.50%
Subtotal 2,107 $21,806.65 $10.35 1.4% $0.40 3.9%
Total Weekday
2017 6,160 $104,766 $17.01 15.5% $5.82 34.19%
2016 5,853 $102,106 $17.45 22.8% $5.74 32.88%
2015 8,679 $133,732 $15.41 55.2% $7.25 47.02%
Subtotal 20,692 $340,603.36 $16.46 21.5% $6.28 38.1%
Total Weekend
2017 4,150 $81,563 $19.65 12.0% $4.53 23.04%
2016 4,453 $89,178 $20.03 19.9% $5.01 25.02%
2015 4,462 $84,733 $18.99 35.0% $4.59 24.18%
Subtotal 13,065 $255,473.76 $19.55 16.1% $4.71 24.1%
Total
2017 18,015 $205,874 $11.43 30.4% $11.43 100.0%
2016 17,800 $231,155 $12.99 51.7% $12.99 100.00%
2015 18,457 $242,427 $13.13 100.0% $13.13 100.00%
Subtotal 54,272 $679,455.33 $12.52 42.9% $12.52 100.0%

Ramsey County Golf Study Appendix F: Customer Survey
Sirius Golf Advisors, LLC 433
Appendix F: Customer Survey
Survey Questions Below is the survey for Goodrich. The same survey, except for a few changes to the custom questions at the end, was administered for Battle Creek, Keller, Manitou and Island Lake.
About how many rounds have you played at Goodrich Golf Course in the past 12 months? r
ounds
Do you play most of your golf at Goodrich Golf Course? Yes
No
What other courses in the area, if any, have you played on a somewhat regular basis in the past 12
months? If you haven't played at any other courses, click "Next" to continue.
(1)
r
ounds
(2)
r
ounds
(3)
r
ounds
(4)
r
ounds
(5)
r
ounds
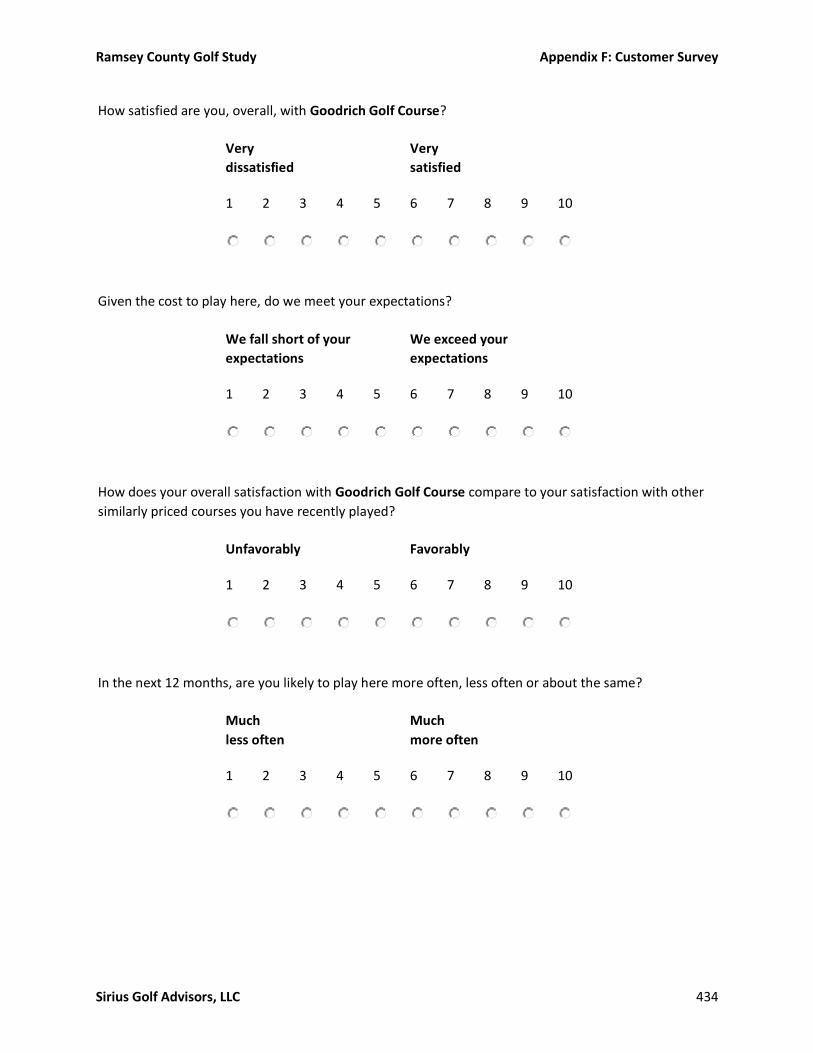
Ramsey County Golf Study Appendix F: Customer Survey
Sirius Golf Advisors, LLC 434
How satisfied are you, overall, with Goodrich Golf Course?
Very
dissatisfied
Very
satisfied
1 2 3 4 5 6 7 8 9 10
Given the cost to play here, do we meet your expectations?
We fall short of your
expectations
We exceed your
expectations
1 2 3 4 5 6 7 8 9 10
How does your overall satisfaction with Goodrich Golf Course compare to your satisfaction with other
similarly priced courses you have recently played?
Unfavorably Favorably
1 2 3 4 5 6 7 8 9 10
In the next 12 months, are you likely to play here more often, less often or about the same?
Much
less often
Much
more often
1 2 3 4 5 6 7 8 9 10
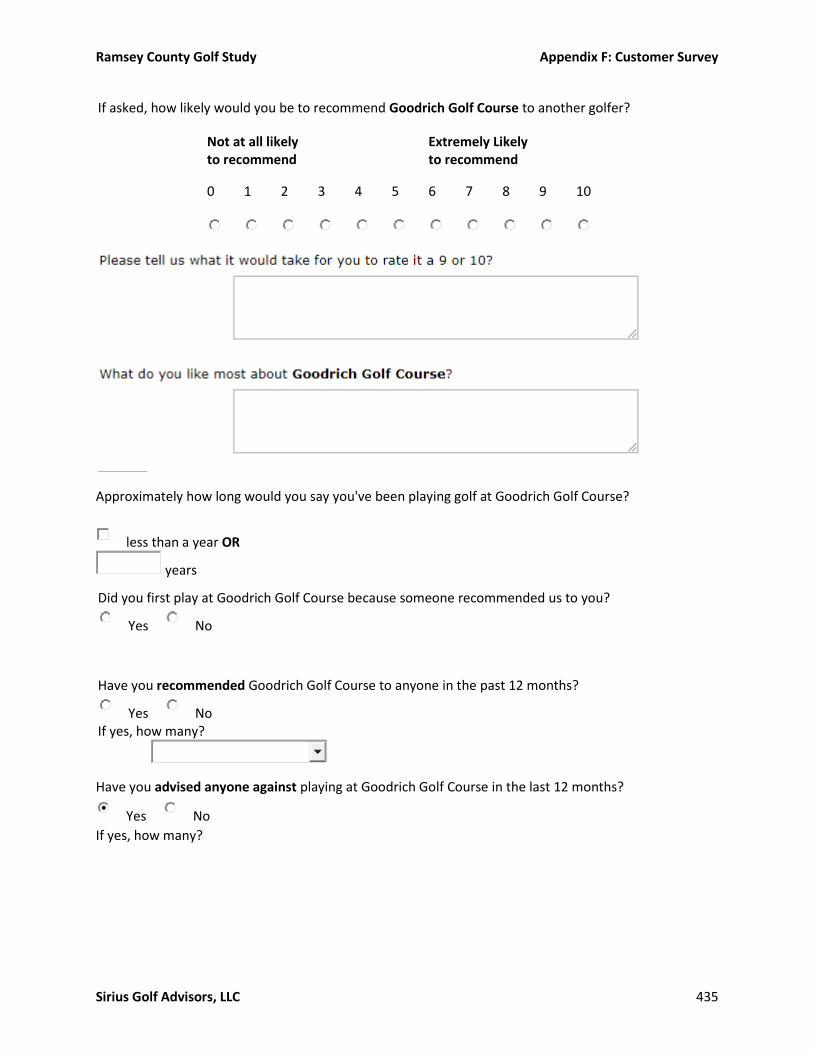
Ramsey County Golf Study Appendix F: Customer Survey
Sirius Golf Advisors, LLC 435
Approximately how long would you say you've been playing golf at Goodrich Golf Course?
less than a year OR
years
Did you first play at Goodrich Golf Course because someone recommended us to you?
Yes No
Have you recommended Goodrich Golf Course to anyone in the past 12 months?
Yes No If yes, how many?
Have you advised anyone against playing at Goodrich Golf Course in the last 12 months?
Yes No
If yes, how many?
If asked, how likely would you be to recommend Goodrich Golf Course to another golfer?
Not at all likely to recommend
Extremely Likely to recommend
0 1 2 3 4 5 6 7 8 9 10

Ramsey County Golf Study Appendix F: Customer Survey
Sirius Golf Advisors, LLC 436

Ramsey County Golf Study Appendix F: Customer Survey
Sirius Golf Advisors, LLC 437
What would you estimate is your average cost per round (including green fee, golf car if used, range balls - but excluding merchandise and food & beverage) at Goodrich Golf Course?
$
About how much would you say you have spent in total on merchandise (e.g., apparel, golf balls and clubs and other items) over the past 12 months at Goodrich Golf Course?
$
About how much would you estimate you spend, on average, on food & beverage each time you visit the course?
$
Please enter the zip / postal code of your primary residence:
Please select your gender:
Male Female
Please enter your age:
Please enter your average 18-hole score:
Which of the following best describes you?
Local player/Area resident
Non-resident player
Discount card holder
Member of our club
Member of other area club
League player
Business/corporate outing golfer
Vacationer
Custom Questions
Do you follow us online? If so, what sites (website, Facebook, Twitter, etc.)
Would you like to see more online content? If so, what?
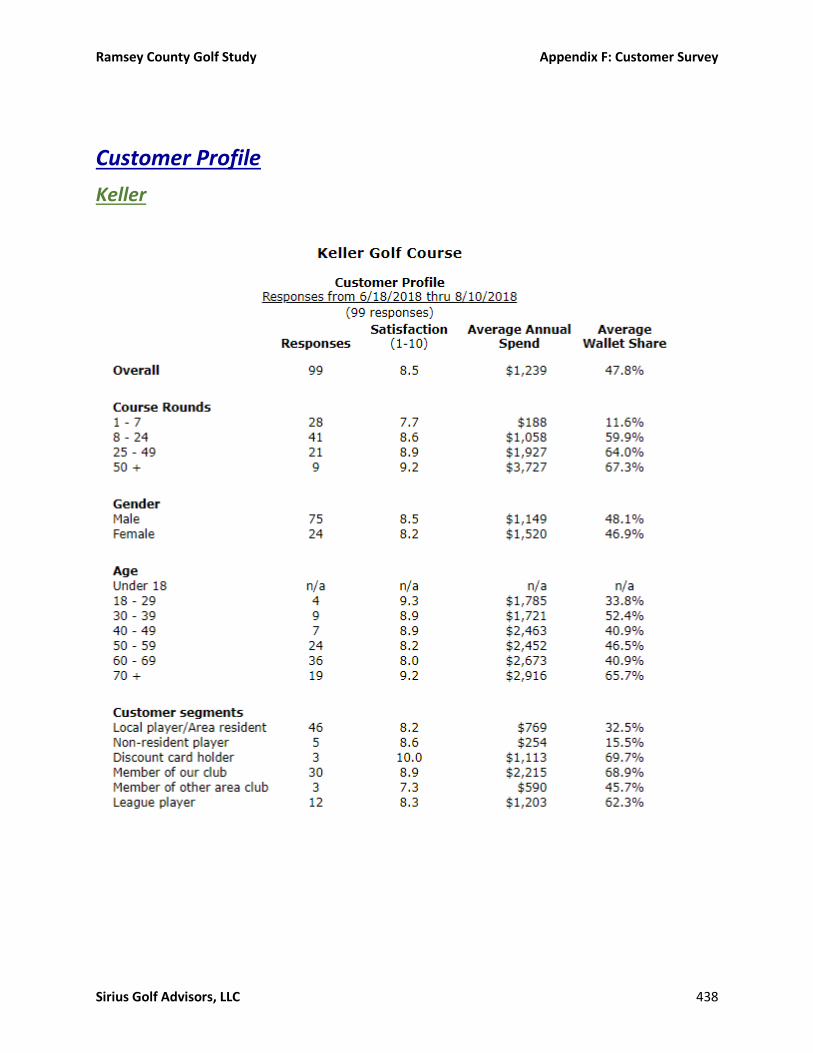
Ramsey County Golf Study Appendix F: Customer Survey
Sirius Golf Advisors, LLC 438
Customer Profile
Keller
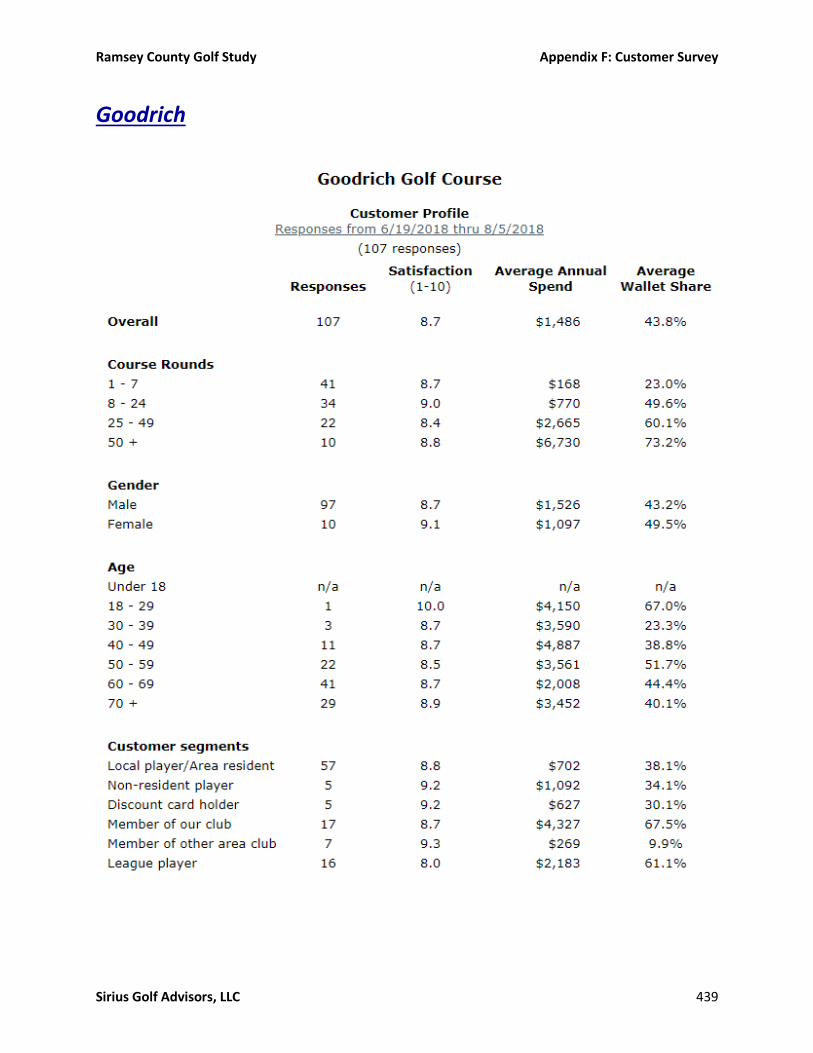
Ramsey County Golf Study Appendix F: Customer Survey
Sirius Golf Advisors, LLC 439
Goodrich

Ramsey County Golf Study Appendix F: Customer Survey
Sirius Golf Advisors, LLC 440
Battle Creek
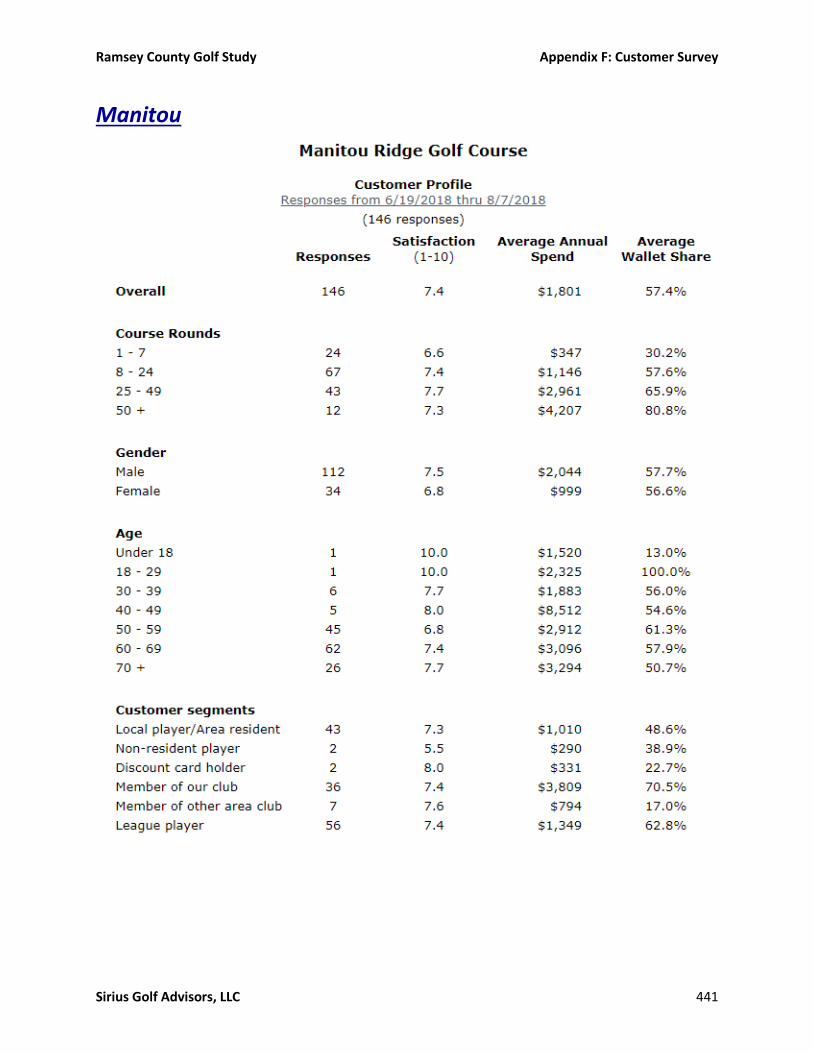
Ramsey County Golf Study Appendix F: Customer Survey
Sirius Golf Advisors, LLC 441
Manitou

Ramsey County Golf Study Appendix G: Infrastructure Life Expectancies
Sirius Golf Advisors, LLC 442
Appendix G: Infrastructure Life Expectancies These are the expected life expectancies for various components of a golf course. These have been adjusted for the MSP climate area.
Goodrich
GOLF COURSE INFRASTRUCTURE LIFE EXPECTANCIES
Goodrich Golf Course
Project Qty Min Max Built Age Min Left
Max Left
Greens- rebuild
USGA/California/sand-based (No. 12, 17) 3 20 35 2008 11 9 24
USGA/California/sand-based (No. 15) 1 20 36 2010 9 11 26
USGA/California/sand-based (No. 6,10) 1 20 35 1997 22 -2 13
Push-up -1960 15 20 50 1960 59 -39 -9
Green Collars
USGA/California/sand-based 5 12 25 2008 11 1 14
Push-up 14 12 25 1960 59 -7 -2
Tees & Surround
-Vintage 2010 (8, 9) 2 15 20 2008 11 4 9
Hole #10 16 15 20 1997 22 -7 -2
Turf
Tees 12 15 1960 59 -47 -44
Fairways 12 15 1960 59 -47 -44
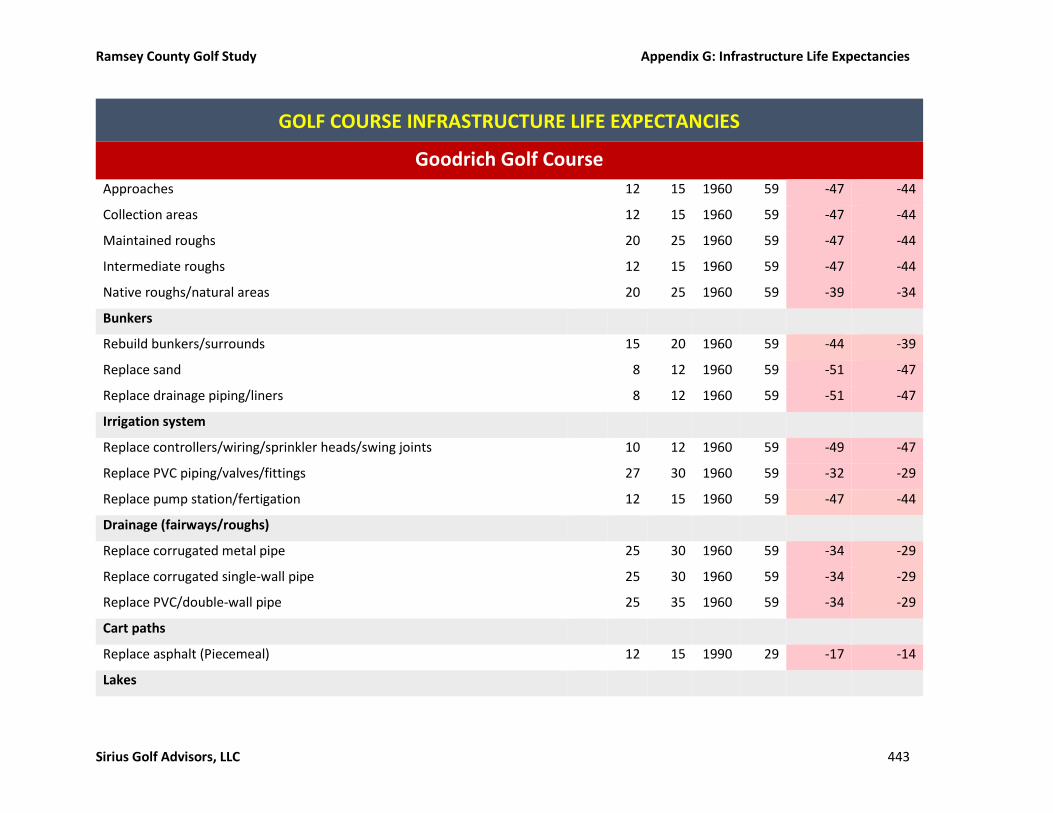
Ramsey County Golf Study Appendix G: Infrastructure Life Expectancies
Sirius Golf Advisors, LLC 443
GOLF COURSE INFRASTRUCTURE LIFE EXPECTANCIES
Goodrich Golf Course
Approaches 12 15 1960 59 -47 -44
Collection areas 12 15 1960 59 -47 -44
Maintained roughs 20 25 1960 59 -47 -44
Intermediate roughs 12 15 1960 59 -47 -44
Native roughs/natural areas 20 25 1960 59 -39 -34
Bunkers
Rebuild bunkers/surrounds 15 20 1960 59 -44 -39
Replace sand 8 12 1960 59 -51 -47
Replace drainage piping/liners 8 12 1960 59 -51 -47
Irrigation system
Replace controllers/wiring/sprinkler heads/swing joints 10 12 1960 59 -49 -47
Replace PVC piping/valves/fittings 27 30 1960 59 -32 -29
Replace pump station/fertigation 12 15 1960 59 -47 -44
Drainage (fairways/roughs)
Replace corrugated metal pipe 25 30 1960 59 -34 -29
Replace corrugated single-wall pipe 25 30 1960 59 -34 -29
Replace PVC/double-wall pipe 25 35 1960 59 -34 -29
Cart paths
Replace asphalt (Piecemeal) 12 15 1990 29 -17 -14
Lakes
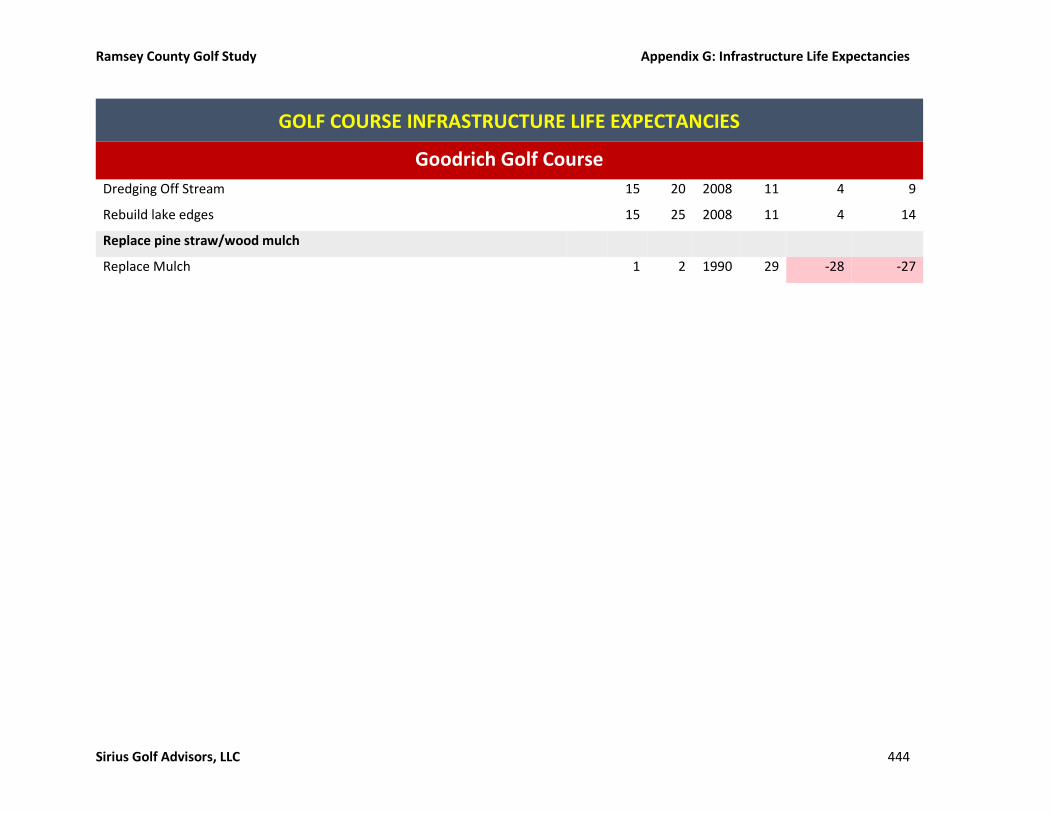
Ramsey County Golf Study Appendix G: Infrastructure Life Expectancies
Sirius Golf Advisors, LLC 444
GOLF COURSE INFRASTRUCTURE LIFE EXPECTANCIES
Goodrich Golf Course
Dredging Off Stream 15 20 2008 11 4 9
Rebuild lake edges 15 25 2008 11 4 14
Replace pine straw/wood mulch
Replace Mulch 1 2 1990 29 -28 -27

Ramsey County Golf Study Appendix G: Infrastructure Life Expectancies
Sirius Golf Advisors, LLC 445
Manitou Ridge
GOLF COURSE INFRASTRUCTURE LIFE EXPECTANCIES
Manitou Ridge Golf Course
Component Qty Min Max Built Age Min Left
Max Left
Greens - Rebuild
USGA/California/sand-based
-Vintage 1978 4 20 35 1978 41 -21 -6
-Vintage 1980-s 5 20 35 1985 34 -14 1
-Vintage 1990's 7 20 35 1995 24 -4 11
Push-up -1927 5 20 50 1927 92 -72 -42
Greens & Collars - regrass
USGA/California/sand-based 12 25 1990 29 -17 -4
Push-up 12 25 1990 29 -17 -4
Tees - rebuild
-Vintage 1978 4 15 20 1978 41 -26 -21
-Vintage 1980-s 5 15 20 1985 34 -19 -14
-Vintage 1990's 7 15 20 1995 24 -9 -4
Push-up -1927 5 15 20 1927 92 -77 -72
Turf
Tees 12 15 1990 29 -17 -14
Fairways 12 15 1978 41 -29 -26

Ramsey County Golf Study Appendix G: Infrastructure Life Expectancies
Sirius Golf Advisors, LLC 446
GOLF COURSE INFRASTRUCTURE LIFE EXPECTANCIES
Manitou Ridge Golf Course
Component Qty Min Max Built Age Min Left
Max Left
Approaches 12 15 1990 29 -17 -14
Collection areas 12 15 1990 29 -17 -14
Maintained roughs 20 25 1978 41 -21 -16
Intermediate roughs 12 15 1978 41 -29 -26
Native roughs/natural areas 20 25 1978 41 -21 -16
Bunkers
Rebuild bunkers/surrounds 15 20 2005 14 1 6
Replace sand 8 12 2005 14 -6 -2
Replace drainage piping/liners 8 12 2005 14 -6 -2
Irrigation system
Replace controllers/wiring/sprinkler heads/swing joints 10 12 1990 29 -19 -17
Replace PVC piping/valves/fittings 27 30 1990 29 -2 1
Replace pump station/fertigation 12 15 1990 29 -17 -14
Drainage (fairways/roughs)
Replace corrugated metal pipe 25 30 1990 29 -4 1
Replace corrugated single-wall pipe 25 30 1990 29 -4 1
Replace PVC/double-wall pipe 25 35 1990 29 -4 6
Cart paths
Replace asphalt 12 15 1990 29 -17 -14

Ramsey County Golf Study Appendix G: Infrastructure Life Expectancies
Sirius Golf Advisors, LLC 447
GOLF COURSE INFRASTRUCTURE LIFE EXPECTANCIES
Manitou Ridge Golf Course
Component Qty Min Max Built Age Min Left
Max Left
Lakes
Rebuild lake edges 15 25 1990 29 -14 -4
Replace pine straw/wood mulch 1 2 1990 29 -28 -27
Driving range
Re-level/regrass practice tee 8 12 1978 41 -33 -29
Rebuild practice tee 12 15 1978 41 -29 -26
Regrass practice fairway/rough 12 15 1978 41 -29 -26
Short game practice area
Regrass greens 12 15 1990 29 -17 -14
Rebuild greens 20 35 1990 29 -9 6
Regrass tees/fairways/roughs 12 15 1990 29 -17 -14
Replace bunker sand 8 12 1990 29 -21 -17
Rebuild bunkers/surrounds 15 20 1990 29 -14 -9
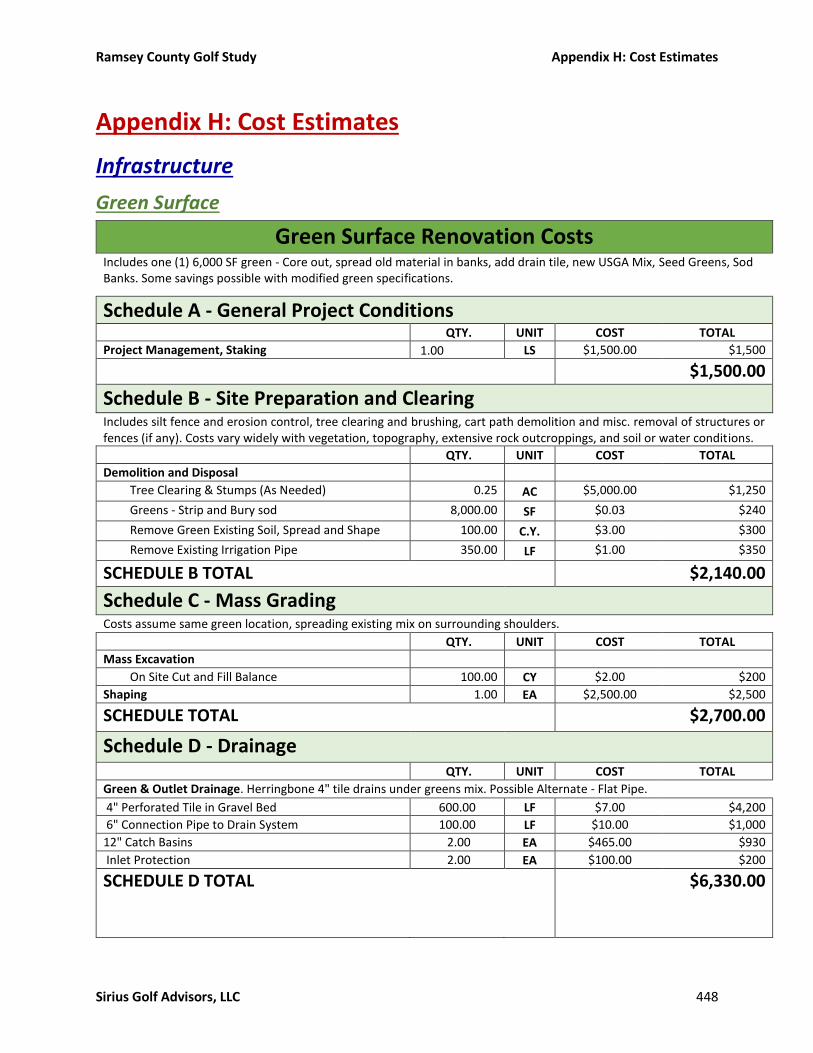
Ramsey County Golf Study Appendix H: Cost Estimates
Sirius Golf Advisors, LLC 448
Appendix H: Cost Estimates
Infrastructure
Green Surface
Green Surface Renovation Costs Includes one (1) 6,000 SF green - Core out, spread old material in banks, add drain tile, new USGA Mix, Seed Greens, Sod Banks. Some savings possible with modified green specifications.
Schedule A - General Project Conditions QTY. UNIT COST TOTAL
Project Management, Staking 1.00 LS $1,500.00 $1,500
$1,500.00
Schedule B - Site Preparation and Clearing Includes silt fence and erosion control, tree clearing and brushing, cart path demolition and misc. removal of structures or fences (if any). Costs vary widely with vegetation, topography, extensive rock outcroppings, and soil or water conditions.
QTY. UNIT COST TOTAL
Demolition and Disposal
Tree Clearing & Stumps (As Needed) 0.25 AC $5,000.00 $1,250
Greens - Strip and Bury sod 8,000.00 SF $0.03 $240
Remove Green Existing Soil, Spread and Shape 100.00 C.Y. $3.00 $300
Remove Existing Irrigation Pipe 350.00 LF $1.00 $350
SCHEDULE B TOTAL $2,140.00
Schedule C - Mass Grading Costs assume same green location, spreading existing mix on surrounding shoulders.
QTY. UNIT COST TOTAL
Mass Excavation
On Site Cut and Fill Balance 100.00 CY $2.00 $200
Shaping 1.00 EA $2,500.00 $2,500
SCHEDULE TOTAL $2,700.00
Schedule D - Drainage QTY. UNIT COST TOTAL
Green & Outlet Drainage. Herringbone 4" tile drains under greens mix. Possible Alternate - Flat Pipe.
4" Perforated Tile in Gravel Bed 600.00 LF $7.00 $4,200
6" Connection Pipe to Drain System 100.00 LF $10.00 $1,000
12" Catch Basins 2.00 EA $465.00 $930
Inlet Protection 2.00 EA $100.00 $200
SCHEDULE D TOTAL
$6,330.00

Ramsey County Golf Study Appendix H: Cost Estimates
Sirius Golf Advisors, LLC 449
Schedule E - Erosion Control, Environmental Protection Erosion Control QTY. UNIT COST TOTAL
Protection of Existing Turf, Paths 1.00 LS $1,000.00 $1,000
Silt Fence 100.00 LF $3.00 $300
Bio Rolls (Top Edge of Green) 150.00 LF $4.00 $600
SCHEDULE E TOTAL $1,900.00
Schedule F - Feature Construction
4" Gravel Layer - Not Required if Deduct to California Green Method for Potential Savings
Materials - Assume $31.50 Per Ton (Plaistead) 120.00 TON $47.00 $5,640
Installation 6,000.00 SF $0.30 $1,800
2" Coarse Sand Layer - Not Required with Plaistead Mix
12-14" Greens Mix (Approx 85% Sand/15% Peat) - Plaistead Pre Blended USGA Mix
Materials
Sand/Peat Mix Assume $47 Per Ton (Plaistead) 365.00 TON $47.00 $17,155
Installation 6,000.00 SF $0.50 $3,000
Separator and Wire Trace 325.00 LF $1.30 $423
Clean Up 1.00 EA $500.00 $500
SCHEDULE F TOTAL $28,517.50
Schedule G - Grassing Seed Greens, Sod Surrounding Banks. Some projects use more sod to minimize down time.
QTY. UNIT COST TOTAL
Fine Grading and Fertilization 0.30 AC $2,750.00 $825
Grassing
Greens (Bent) 6,000.00 SF $0.20 $1,200
Sod Allowance (Banks - Blue/Fescue) 3,000.00 SF $0.59 $1,770
SCHEDULE F TOTAL $3,795.00
Schedule H - Hardscape & Landscape - NONE QTY. UNIT COST TOTAL
Schedule I - Irrigation - Approx. 10 sprinklers per green Irrigation Pipe
2.5" PVC 400 LF $6.00 $2,400
3" PVC 40 LF $10.00 $400
Irrigation Heads - Approx 10 10 EA $300.00 $3,000
Irrigation Gate Valves 1 EA $800.00 $800
Wiring - 12 and 14 Gauge 500 LF $0.25 $125
Controller & Wiring 0.25 EA $4,500.00 $1,125
SCHEDULE TOTAL $7,850
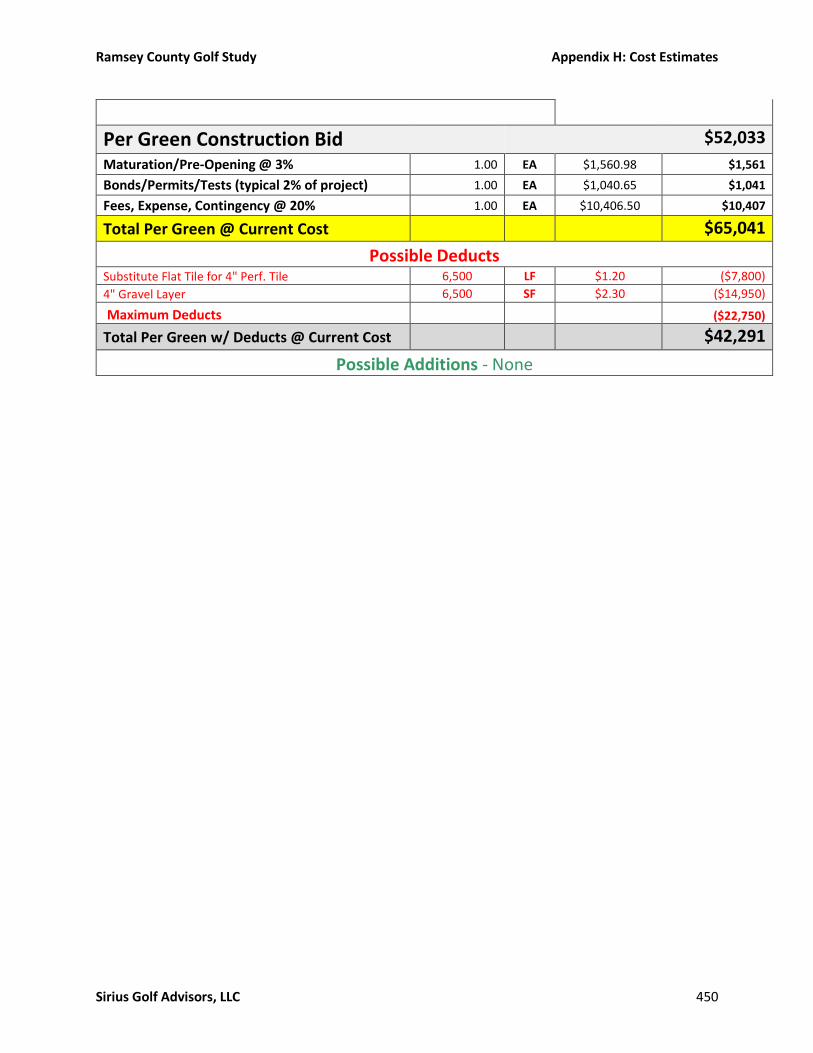
Ramsey County Golf Study Appendix H: Cost Estimates
Sirius Golf Advisors, LLC 450
Per Green Construction Bid $52,033
Maturation/Pre-Opening @ 3% 1.00 EA $1,560.98 $1,561
Bonds/Permits/Tests (typical 2% of project) 1.00 EA $1,040.65 $1,041
Fees, Expense, Contingency @ 20% 1.00 EA $10,406.50 $10,407
Total Per Green @ Current Cost $65,041
Possible Deducts Substitute Flat Tile for 4" Perf. Tile 6,500 LF $1.20 ($7,800)
4" Gravel Layer 6,500 SF $2.30 ($14,950)
Maximum Deducts ($22,750)
Total Per Green w/ Deducts @ Current Cost $42,291
Possible Additions - None
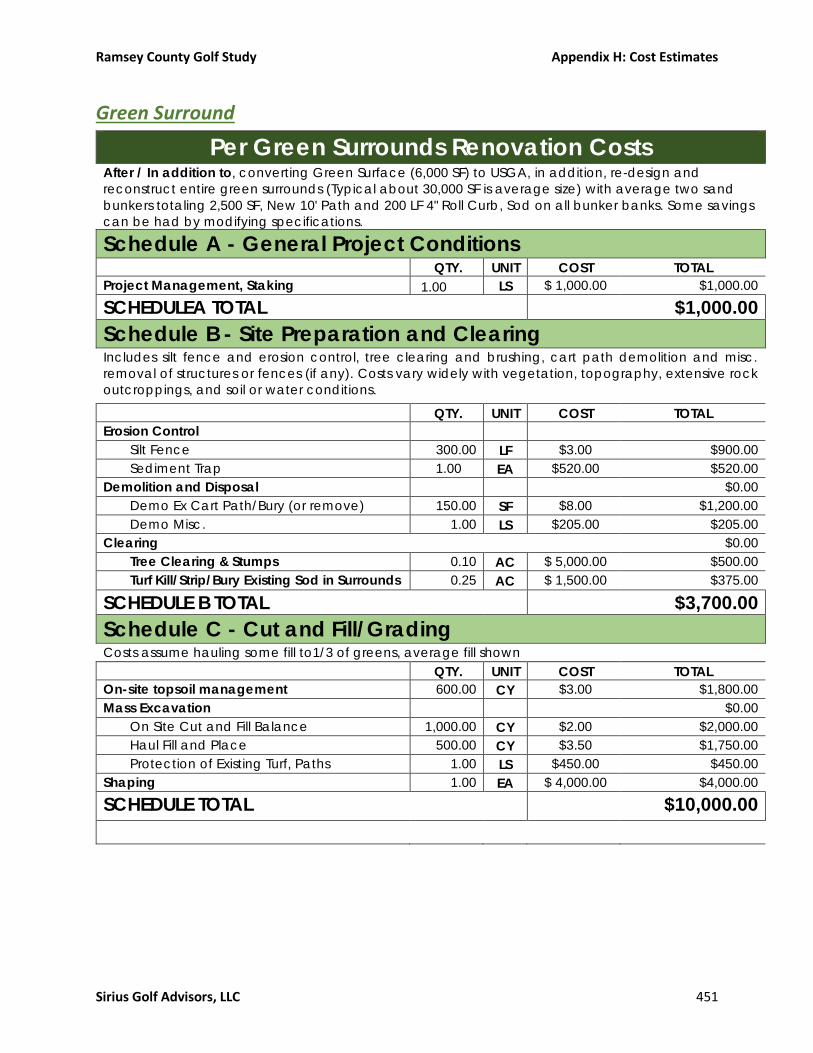
Ramsey County Golf Study Appendix H: Cost Estimates
Sirius Golf Advisors, LLC 451
Green Surround
Per Green Surrounds Renovation Costs After / In addition to, converting Green Surface (6,000 SF) to USGA, in addition, re-design and
reconstruct entire green surrounds (Typical about 30,000 SF is average size) with average two sand
bunkers totaling 2,500 SF, New 10' Path and 200 LF 4" Roll Curb, Sod on all bunker banks. Some savings
can be had by modifying specifications.
Schedule A - General Project Conditions QTY. UNIT COST TOTAL
Project Management, Staking 1.00 LS $ 1,000.00 $1,000.00
SCHEDULEA TOTAL $1,000.00
Schedule B - Site Preparation and Clearing Includes silt fence and erosion control, tree clearing and brushing, cart path demolition and misc.
removal of structures or fences (if any). Costs vary widely with vegetation, topography, extensive rock
outcroppings, and soil or water conditions.
QTY. UNIT COST TOTAL
Erosion Control
Silt Fence 300.00 LF $3.00 $900.00
Sediment Trap 1.00 EA $520.00 $520.00
Demolition and Disposal $0.00
Demo Ex Cart Path/Bury (or remove) 150.00 SF $8.00 $1,200.00
Demo Misc. 1.00 LS $205.00 $205.00
Clearing $0.00
Tree Clearing & Stumps 0.10 AC $ 5,000.00 $500.00
Turf Kill/Strip/Bury Existing Sod in Surrounds 0.25 AC $ 1,500.00 $375.00
SCHEDULE B TOTAL $3,700.00
Schedule C - Cut and Fill/Grading Costs assume hauling some fill to1/3 of greens, average fill shown
QTY. UNIT COST TOTAL
On-site topsoil management 600.00 CY $3.00 $1,800.00
Mass Excavation $0.00
On Site Cut and Fill Balance 1,000.00 CY $2.00 $2,000.00
Haul Fill and Place 500.00 CY $3.50 $1,750.00
Protection of Existing Turf, Paths 1.00 LS $450.00 $450.00
Shaping 1.00 EA $ 4,000.00 $4,000.00
SCHEDULE TOTAL $10,000.00
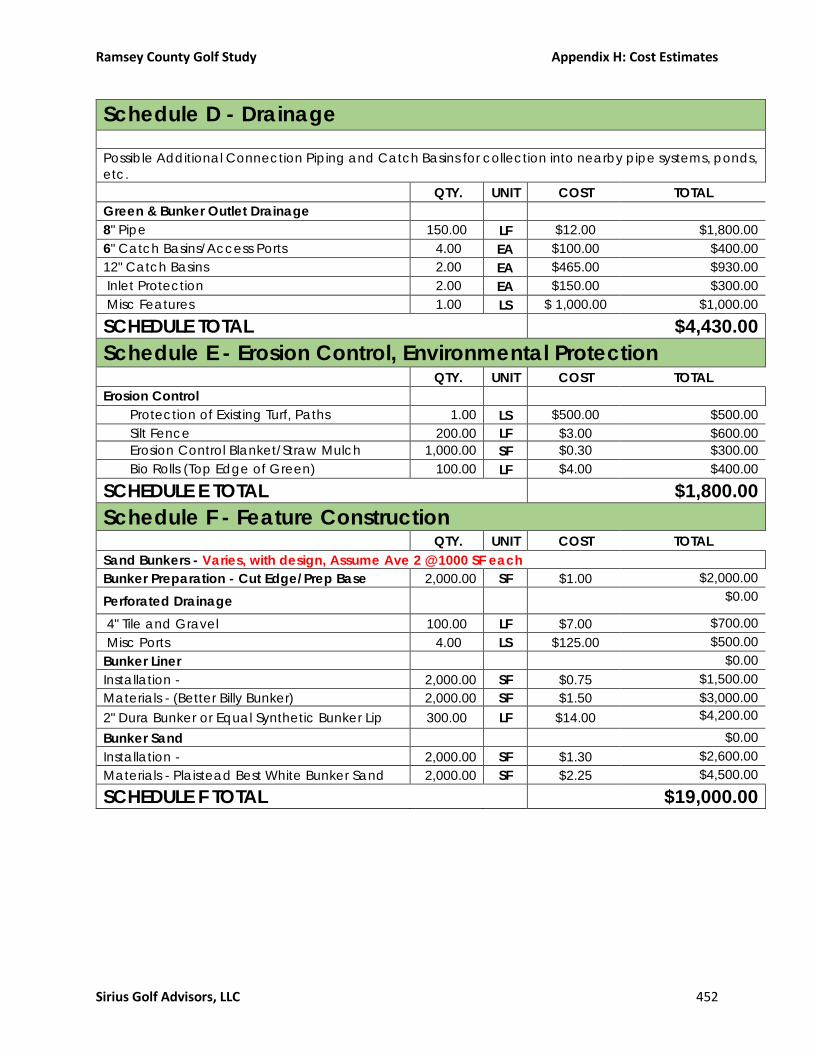
Ramsey County Golf Study Appendix H: Cost Estimates
Sirius Golf Advisors, LLC 452
Schedule D - Drainage
Possible Additional Connection Piping and Catch Basins for collection into nearby pipe systems, ponds,
etc.
QTY. UNIT COST TOTAL
Green & Bunker Outlet Drainage
8" Pipe 150.00 LF $12.00 $1,800.00
6" Catch Basins/Access Ports 4.00 EA $100.00 $400.00
12" Catch Basins 2.00 EA $465.00 $930.00
Inlet Protection 2.00 EA $150.00 $300.00
Misc Features 1.00 LS $ 1,000.00 $1,000.00
SCHEDULE TOTAL $4,430.00
Schedule E - Erosion Control, Environmental Protection QTY. UNIT COST TOTAL
Erosion Control
Protection of Existing Turf, Paths 1.00 LS $500.00 $500.00
Silt Fence 200.00 LF $3.00 $600.00
Erosion Control Blanket/Straw Mulch 1,000.00 SF $0.30 $300.00
Bio Rolls (Top Edge of Green) 100.00 LF $4.00 $400.00
SCHEDULE E TOTAL $1,800.00
Schedule F - Feature Construction QTY. UNIT COST TOTAL
Sand Bunkers - Varies, with design, Assume Ave 2 @ 1000 SF each
Bunker Preparation - Cut Edge/Prep Base 2,000.00 SF $1.00 $2,000.00
Perforated Drainage $0.00
4" Tile and Gravel 100.00 LF $7.00 $700.00
Misc Ports 4.00 LS $125.00 $500.00
Bunker Liner $0.00
Installation - 2,000.00 SF $0.75 $1,500.00
Materials - (Better Billy Bunker) 2,000.00 SF $1.50 $3,000.00
2" Dura Bunker or Equal Synthetic Bunker Lip 300.00 LF $14.00 $4,200.00
Bunker Sand $0.00
Installation - 2,000.00 SF $1.30 $2,600.00
Materials - Plaistead Best White Bunker Sand 2,000.00 SF $2.25 $4,500.00
SCHEDULE F TOTAL $19,000.00

Ramsey County Golf Study Appendix H: Cost Estimates
Sirius Golf Advisors, LLC 453
Schedule G - Grassing Seed Greens, FW approach, Sod Roughs, Bunker Banks.
QTY. UNIT COST TOTAL
Fine Grading and Fertilization 0.75 AC $ 2,700.00 $2,025.00
Grassing $0.00
Fairways (Low Mow Blue or Bent as required) 0.20 AC $800.00 $160.00
Sod Allowance (Bunker Bank - Blue/Fescue)
30,000.00 SF $0.40
$12,000.00
SCHEDULE G TOTAL $14,185.00
Schedule H - Hardscape & Landscape Asphalt Paths
8 foot wide paths, 10 – 12 feet at greens/tees with curbs. Possible width reductions to 7 and 9 feet.
QTY. UNIT COST TOTAL
10 foot width 300.00 LF $33.00 $9,900.00
8 foot width path 200.00 LF $28.00 $5,600.00
4" Concrete Roll Curbs 200.00 LF $7.50 $1,500.00
SCHEDULE H TOTAL $7,100.00
Schedule I - Irrigation - Previously Included in Green Resurfacing
SCHEDULE I TOTAL $0.00
Per Green Construction Bid $ 61,215.00 Maturation/Pre-Opening @ 3% 1.00 EA $ 1,836.45 $1,836.45
Bonds/Permits/Tests (typical 2% of project) 1.00 EA $ 1,224.30 $1,224.30
(Fees, Expense and Contingency @ 20%) 1.00 EA $12,243.00 $12,243.00
Total Green Surround @ Current Cost $ 76,518.75 Possible Deducts
Eliminate Dura Bunker Edge 300.00 LF $12.00 ($3,600.00)
Use Fabric Bunker Liner over Better Billy 2,000.00 SF $(0.30) $600.00
Materials - Plaistead Buff Bunker Sand 2,000.00 SF $(0.60) ($1,200.00)
Other Design Reductions 2.5% 1.00 LS $(1,530.38) $ (1,530.38)
Eliminate All Curb 1.00 LS $(1,200.00) $ (1,200.00)
Maximum Deducts ($6,930.38)
Total Green Surround w/ Deducts $ 69,588.38 Possible Additions - None
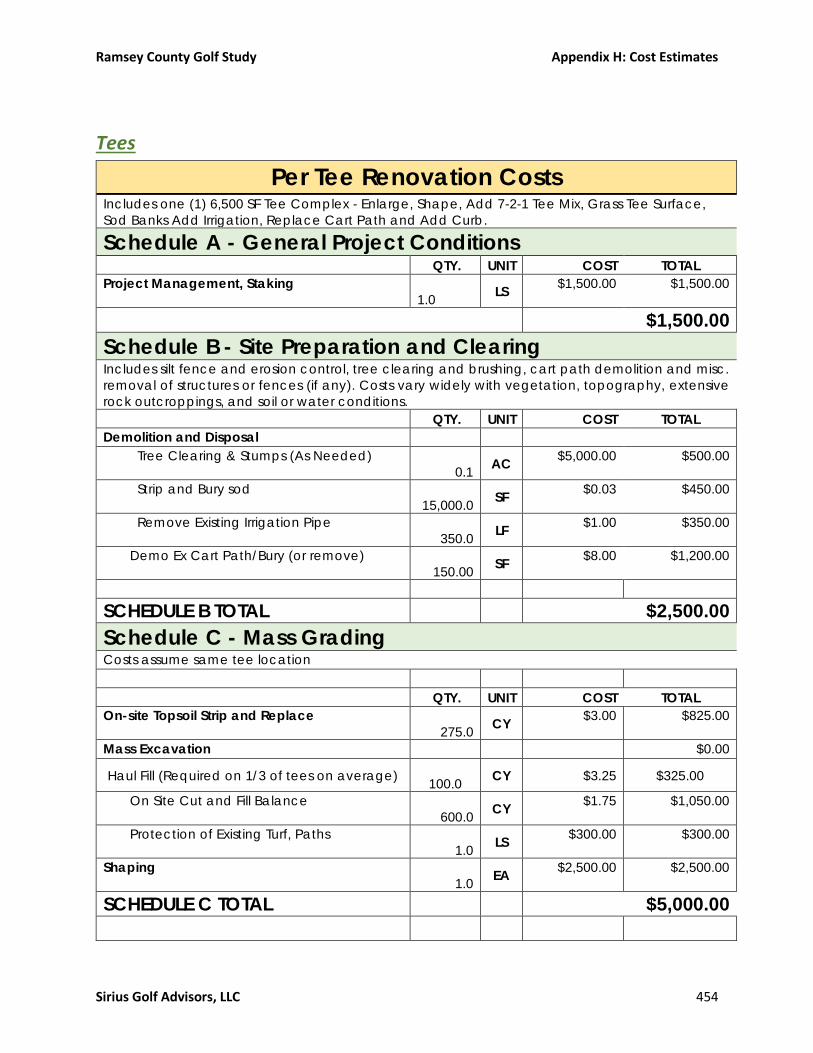
Ramsey County Golf Study Appendix H: Cost Estimates
Sirius Golf Advisors, LLC 454
Tees
Per Tee Renovation Costs Includes one (1) 6,500 SF Tee Complex - Enlarge, Shape, Add 7-2-1 Tee Mix, Grass Tee Surface,
Sod Banks Add Irrigation, Replace Cart Path and Add Curb.
Schedule A - General Project Conditions QTY. UNIT COST TOTAL
Project Management, Staking
1.0 LS
$1,500.00 $1,500.00
$1,500.00
Schedule B - Site Preparation and Clearing Includes silt fence and erosion control, tree clearing and brushing, cart path demolition and misc.
removal of structures or fences (if any). Costs vary widely with vegetation, topography, extensive
rock outcroppings, and soil or water conditions.
QTY. UNIT COST TOTAL
Demolition and Disposal
Tree Clearing & Stumps (As Needed)
0.1 AC
$5,000.00 $500.00
Strip and Bury sod
15,000.0 SF
$0.03 $450.00
Remove Existing Irrigation Pipe
350.0 LF
$1.00 $350.00
Demo Ex Cart Path/Bury (or remove)
150.00 SF
$8.00 $1,200.00
SCHEDULE B TOTAL $2,500.00
Schedule C - Mass Grading Costs assume same tee location
QTY. UNIT COST TOTAL
On-site Topsoil Strip and Replace
275.0 CY
$3.00 $825.00
Mass Excavation $0.00
Haul Fill (Required on 1/3 of tees on average)
100.0 CY $3.25 $325.00
On Site Cut and Fill Balance
600.0 CY
$1.75 $1,050.00
Protection of Existing Turf, Paths
1.0 LS
$300.00 $300.00
Shaping
1.0 EA
$2,500.00 $2,500.00
SCHEDULE C TOTAL $5,000.00

Ramsey County Golf Study Appendix H: Cost Estimates
Sirius Golf Advisors, LLC 455

Ramsey County Golf Study Appendix H: Cost Estimates
Sirius Golf Advisors, LLC 456
Schedule D - Drainage QTY. UNIT COST TOTAL
Some Tees Require 4" tile drains at back of tee.
Miscellaneous Drainage as Needed
1.0 EA
$500.00 $500.00
SCHEDULE D TOTAL $500.00
Schedule E - Erosion Control, Environmental Protection Erosion Control
Protection of Existing Turf, Paths
1.0 LS
$550.00 $550.00
Silt Fence
150.0 LF
$3.00 $450.00
SCHEDULE E TOTAL $1,000.00
Schedule F - Feature Construction
4" 7-2-1 Tee Mix - Plaistead Pre Blended Tee Mix
Materials
Tee Mix - Assume $47 Per Ton (Plaistead)
100.0 TON $47.00
$4,700.00
Installation
6,500.0 SF $0.25
$1,625.00
Clean Up
1.0 EA
$250.00 $250.00
SCHEDULE F TOTAL $6,575.00
Schedule G - Grassing Seed Greens, Sod Surrounding Banks. Some projects use more sod to minimize down time.
QTY. UNIT COST TOTAL
Fine Grading and Fertilization
0.4 AC $5,000.00 $1,750.00
Grassing
Tees (Bent)
6,500.0 SF $0.16 $1,040.00
Sod Allowance (Banks - Blue/Fescue)
8,500.0 SF $0.36 $3,060.00
SCHEDULE G TOTAL $5,850.00

Ramsey County Golf Study Appendix H: Cost Estimates
Sirius Golf Advisors, LLC 457
Schedule H - Hardscape & Landscape QTY. UNIT COST TOTAL
Asphalt Construction
8 foot width - Extend to new forward tee
200.0 LF
$28.00
$5,600.00
10 foot width
250.0 LF
$33.00
$8,250.00
4" Concrete Roll Curb
200.0 LF
$7.50
$1,500.00
SCHEDULE H TOTAL
$15,350.00
Schedule I - Irrigation - Approx. 10 sprinklers per Tee QTY. UNIT COST TOTAL
Irrigation Pipe
2.5" PVC
600.0 LF
$6.00 $3,600.00
3" PVC
40.0 LF
$10.00 $400.00
Irrigation Heads - Approx 10
10.0 EA
$300.00 $3,000.00
Irrigation Gate Valves
1.0 EA
$800.00 $800.00
Wiring - 12 and 14 Gauge
600.0 LF
$0.25 $150.00
Controller & Wiring
0.4 EA
$4,500.00 $1,575.00
SCHEDULE I TOTAL
$9,525.00
Per Tee Construction Bid $47,800.00
Maturation/Pre-Opening @ 3%
1.0 EA $1,434.00
$1,434.00
Bonds/Permits/Tests (typical 2% of project)
1.0 EA $956.00
$956.00
Fees, Expense, Contingency @ 20%
1.0 EA $9,560.00
$9,560.00
Total Per Tee - @ Current Cost $59,750.00
Possible Deducts
Reduce Path Width (10% Net)
1.00 LS
-$4,480.00 ($4,480.00)
Eliminate All Curb
1.00 LS
-$1,200.00 ($1,200.00)
Other Design Reductions 2.5%
1.00 LS
-$1,195.00 ($1,195.00)
Maximum Deducts ($6,875.00)
Total Tee w/ Deducts $52,875.00
Approximate Cost Split - Forward Tee - $11,000, Back Tee, $12,000, Middle Tees, $35,000.

Ramsey County Golf Study Appendix H: Cost Estimates
Sirius Golf Advisors, LLC 458
Fairways – Reroute
Per New/Re-Routed Fairway Renovation Costs Assumes 2 Ac Fairway and 2 Acre Rough Disturbed in Renovation
Schedule A - General Project Conditions QTY. UNIT COST TOTAL
Project Management, Staking 1.0 LS $2,500.00 $2,500
SCHEDULE A TOTAL $2,500.00
Schedule B - Site Preparation and Clearing Includes tree clearing and brushing, cart path and other misc. demolition, (if any).
QTY. UNIT COST TOTAL
Demolition and Disposal
Tree Clearing & Stumps (As Needed) 0.5 AC $5,000.00 $2,500
Strip and Bury sod
175,000.0 SF $0.03 $5,250
Remove Existing Irrigation Pipe
1,600.0 LF $1.00 $1,600
Demo Misc. 1.0 EA $650.00 $650
SCHEDULE B TOTAL $10,000.00
Schedule C - Mass Grading Assume 50% of fairway area requires grading for drainage.
QTY. UNIT COST TOTAL
On-site Topsoil Strip and Replace
1,600.0 CY $3.00 $4,800
Mass Excavation $0
Haul Fill (On 1/3 of fairways on average)
300.0 CY $3.50 $1,050
On Site Cut and Fill Balance
1,000.0 CY $2.00 $2,000
Shaping 1.0 EA $2,150.00 $2,150
SCHEDULE C TOTAL $10,000.00
Schedule D - Drainage QTY. UNIT COST TOTAL
Some Tees Require 4" tile drains at back of tee.
8" HDPE Solid 80.0 LF $11.00 $880
10" HDPE Solid 40.0 LF $15.00 $600
12" HDPE Solid 20.0 LF $18.00 $360
15" Connection Pipe to Drain System 10.0 LF $25.00 $250
12" Catch Basins 3.0 EA $465.00 $1,395
18" Catch Basins 3.0 EA $800.00 $2,400
24" Catch Basins 1.0 EA $1,000.00 $1,000
Inlet Protection 1.0 EA $500.00 $500
SCHEDULE D TOTAL $7,385.00

Ramsey County Golf Study Appendix H: Cost Estimates
Sirius Golf Advisors, LLC 459
Schedule E - Erosion Control, Environmental Protection QTY. UNIT COST TOTAL
Erosion Control
Silt Fence
400.00 LF
$3.00 $1,200
Erosion Control Blanket (For Slopes)
20,000.00 SF
$0.12 $2,400
Straw Mulch
60,000.00 SF
$0.02 $1,200
Sediment Trap 0.50 EA $520.00 $260
Protection of Existing Turf, Paths 1.0 LS $440.00 $440
SCHEDULE E TOTAL $5,500.00
Schedule F - Feature Construction QTY. UNIT COST TOTAL
Sand Bunkers - Varies, with design, Assume Ave 300 SF per hole
Bunker Preparation - Cut Edge/Prep Base 300 SF $1.00 $300
Perforated Drainage
4" Tile and Gravel 60 LF $7.00 $420
Misc Ports 2 LS $125.00 $250
Bunker Liner $0
Installation - 300 SF $0.75 $225
Materials - (Better Billy Bunker) 300 SF $1.50 $450
2" Dura Bunker or Equal Synthetic Bunker Lip 100 LF $14.00 $1,400
Bunker Sand $0
Installation - 300 SF $1.30 $390
Materials - Plaistead Best White Bunker Sand 300 SF $2.25 $675
Clean Up 1.0 EA $250.00 $250
SCHEDULE F TOTAL $4,360.00
Schedule G - Grassing Seed Greens, Sod Surrounding Banks. Some projects use more sod to minimize down time.
QTY. UNIT COST TOTAL
Fine Grading and Fertilization 4.0 AC $2,750.00 $11,000
Grassing $0
Fairways (Bent)
87,000.0 SF $0.16 $13,920
Roughs (Blue/Fescue)
80,000.0 SF $0.14 $11,200
Sod Allowance (Banks - Blue/Fescue)
9,000.0 SF $0.40 $3,600
SCHEDULE F TOTAL $39,720.00
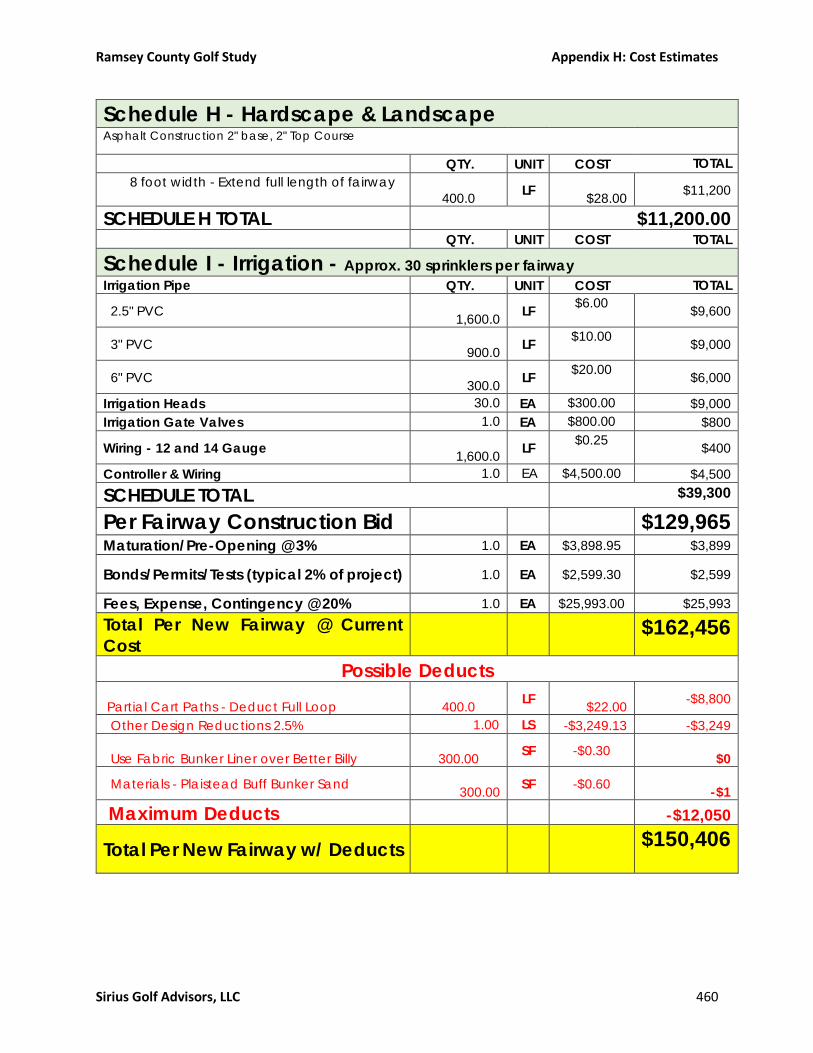
Ramsey County Golf Study Appendix H: Cost Estimates
Sirius Golf Advisors, LLC 460
Schedule H - Hardscape & Landscape Asphalt Construction 2" base, 2" Top Course QTY. UNIT COST TOTAL
8 foot width - Extend full length of fairway
400.0 LF
$28.00 $11,200
SCHEDULE H TOTAL $11,200.00 QTY. UNIT COST TOTAL
Schedule I - Irrigation - Approx. 30 sprinklers per fairway Irrigation Pipe QTY. UNIT COST TOTAL
2.5" PVC
1,600.0 LF
$6.00 $9,600
3" PVC
900.0 LF
$10.00 $9,000
6" PVC
300.0 LF
$20.00 $6,000
Irrigation Heads 30.0 EA $300.00 $9,000
Irrigation Gate Valves 1.0 EA $800.00 $800
Wiring - 12 and 14 Gauge
1,600.0 LF
$0.25 $400
Controller & Wiring 1.0 EA $4,500.00 $4,500
SCHEDULE TOTAL
$39,300
Per Fairway Construction Bid $129,965 Maturation/Pre-Opening @ 3% 1.0 EA $3,898.95 $3,899
Bonds/Permits/Tests (typical 2% of project) 1.0 EA $2,599.30 $2,599
Fees, Expense, Contingency @ 20% 1.0 EA $25,993.00 $25,993
Total Per New Fairway @ Current
Cost
$162,456
Possible Deducts
Partial Cart Paths - Deduct Full Loop
400.0 LF
$22.00 -$8,800
Other Design Reductions 2.5% 1.00 LS -$3,249.13 -$3,249
Use Fabric Bunker Liner over Better Billy
300.00 SF -$0.30
$0
Materials - Plaistead Buff Bunker Sand
300.00 SF -$0.60
-$1
Maximum Deducts -$12,050
Total Per New Fairway w/ Deducts
$150,406
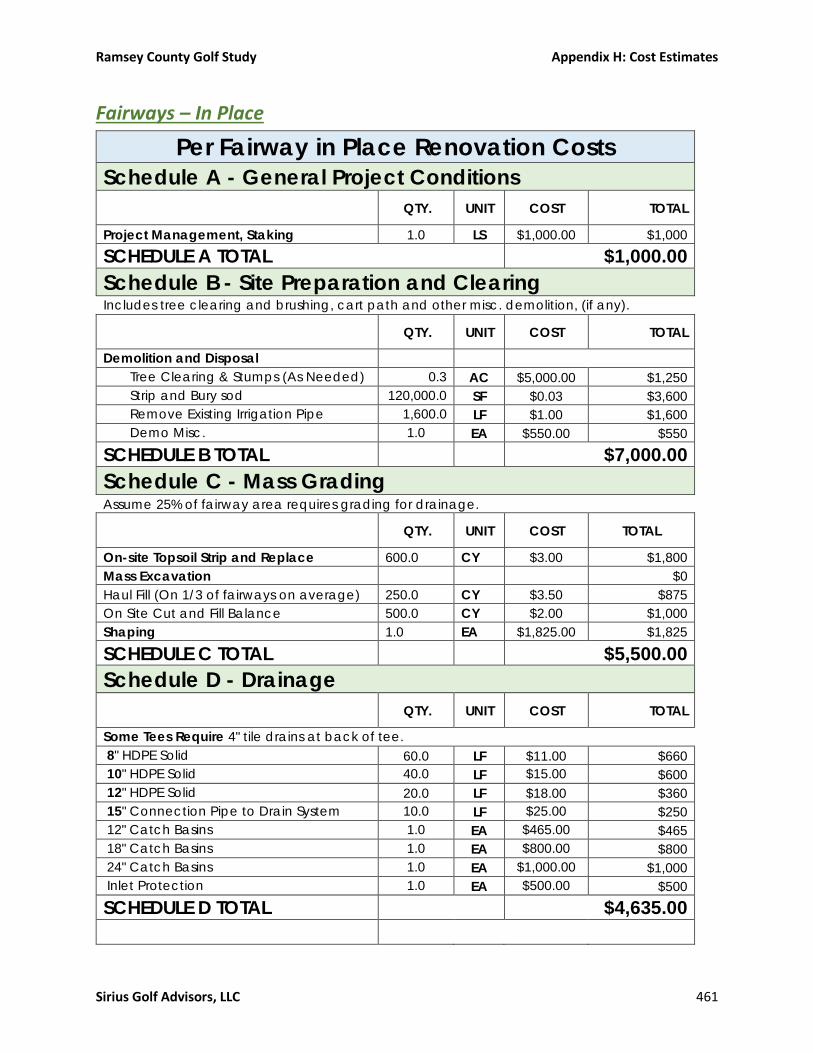
Ramsey County Golf Study Appendix H: Cost Estimates
Sirius Golf Advisors, LLC 461
Fairways – In Place
Per Fairway in Place Renovation Costs
Schedule A - General Project Conditions
QTY. UNIT COST TOTAL
Project Management, Staking 1.0 LS $1,000.00 $1,000
SCHEDULE A TOTAL $1,000.00
Schedule B - Site Preparation and Clearing Includes tree clearing and brushing, cart path and other misc. demolition, (if any).
QTY. UNIT COST TOTAL
Demolition and Disposal
Tree Clearing & Stumps (As Needed) 0.3 AC $5,000.00 $1,250
Strip and Bury sod 120,000.0 SF $0.03 $3,600
Remove Existing Irrigation Pipe 1,600.0 LF $1.00 $1,600
Demo Misc. 1.0 EA $550.00 $550
SCHEDULE B TOTAL $7,000.00
Schedule C - Mass Grading Assume 25% of fairway area requires grading for drainage.
QTY. UNIT COST TOTAL
On-site Topsoil Strip and Replace 600.0 CY $3.00 $1,800
Mass Excavation $0
Haul Fill (On 1/3 of fairways on average) 250.0 CY $3.50 $875
On Site Cut and Fill Balance 500.0 CY $2.00 $1,000
Shaping 1.0 EA $1,825.00 $1,825
SCHEDULE C TOTAL $5,500.00
Schedule D - Drainage
QTY. UNIT COST TOTAL
Some Tees Require 4" tile drains at back of tee.
8" HDPE Solid 60.0 LF $11.00 $660
10" HDPE Solid 40.0 LF $15.00 $600
12" HDPE Solid 20.0 LF $18.00 $360
15" Connection Pipe to Drain System 10.0 LF $25.00 $250
12" Catch Basins 1.0 EA $465.00 $465
18" Catch Basins 1.0 EA $800.00 $800
24" Catch Basins 1.0 EA $1,000.00 $1,000
Inlet Protection 1.0 EA $500.00 $500
SCHEDULE D TOTAL $4,635.00

Ramsey County Golf Study Appendix H: Cost Estimates
Sirius Golf Advisors, LLC 462
Schedule E - Erosion Control, Environmental Protection
QTY. UNIT COST TOTAL
Erosion Control
Silt Fence 400.00 LF $3.00 $1,200
Erosion Control Blanket (For Slopes) 20,000.00 SF $0.12 $2,400
Straw Mulch 90,000.00 SF $0.02 $1,800
Sediment Trap 0.50 EA $520.00 $260
Protection of Existing Turf, Paths 1.0 LS $340.00 $340
SCHEDULE E TOTAL $6,000.00
Schedule F - Feature Construction
QTY. UNIT COST TOTAL
Sand Bunkers - Varies, with design, Assume Ave 200 SF per hole
Bunker Preparation - Cut Edge/Prep Base 200 SF $1.00 $200
Perforated Drainage
4" Tile and Gravel 60 LF $7.00 $420
Misc Ports 2 LS $125.00 $250
Bunker Liner $0
Installation - 200 SF $0.75 $150
Materials - (Better Billy Bunker) 200 SF $1.50 $300
2" Dura Bunker or Equal Synthetic Bunker
Lip 90 LF $14.00 $1,260
Bunker Sand $0
Installation - 200 SF $1.30 $260
Materials - Plaistead White Bunker Sand 200 SF $2.25 $450
Clean Up 1.0 EA $245.00 $245
SCHEDULE F TOTAL $3,535.00
Schedule G - Grassing Seed Greens, Sod Surrounding Banks. Some projects use more sod to minimize down time.
QTY. UNIT COST TOTAL
Fine Grading and Fertilization 4.0 AC $2,750.00 $11,000
Grassing
Fairways (Bent) 88,000.0 SF $0.16 $14,080
Roughs (Blue/Fescue) 11,000.0 SF $0.14 $1,540
Sod Allowance (Banks - Blue/Fescue) 9,000.0 SF $0.40 $3,600
SCHEDULE F TOTAL $30,220.00

Ramsey County Golf Study Appendix H: Cost Estimates
Sirius Golf Advisors, LLC 463
Schedule H - Hardscape & Landscape Asphalt Construction 2" base, 2" Top Course
QTY. UNIT COST TOTAL
8 foot width - Extend full loop 400.0 LF $28.00 $11,200
SCHEDULE H TOTAL $11,200.00
QTY. UNIT COST TOTAL
Schedule I - Irrigation - Approx. 30 sprinklers per fairway Irrigation Pipe
QTY. UNIT COST TOTAL
2.5" PVC 1,600.0 LF $6.00 $9,600
3" PVC 900.0 LF $10.00 $9,000
6" PVC 300.0 LF $20.00 $6,000
Irrigation Heads 30.0 EA $300.00 $9,000
Irrigation Gate Valves 1.0 EA $800.00 $800
Wiring - 12 and 14 Gauge 1,600.0 LF $0.25 $400
Controller & Wiring 1.0 EA $4,500.00 $4,500
SCHEDULE TOTAL
$39,300
Per Fairway @ Current Cost $108,390 Maturation/Pre-Opening @ 3% 1.0 EA $3,251.70 $3,252
Bonds/Permits/Tests (typical 2%) 1.0 EA $2,167.80 $2,168
Fees, Expense, Contingency @ 20% 1.0 EA $21,678.00 $21,678
Total Per New Fairway @ Current
Cost $135,488
Possible Deducts Partial Cart Paths - Deduct Full Loop 400.0 LF $22.00 -$8,800
Keep All Existing Grass Possible 400.0 LF $22.00 -$8,800
Reduce Fairway Seeding
(66,000.0) SF $0.13 -$8,580
Reduce Rough Seeding
(10,000.0) SF $0.12 -$1,200
Other Design Reductions 2.5% 1.0 LS -$2,709.75 -$2,710
Maximum Deducts -$30,090
Total Per New Fairway w/ Deducts $105,398

Ramsey County Golf Study Appendix I: Routings
Sirius Golf Advisors, LLC 464
Appendix I: Course Routing Proposals
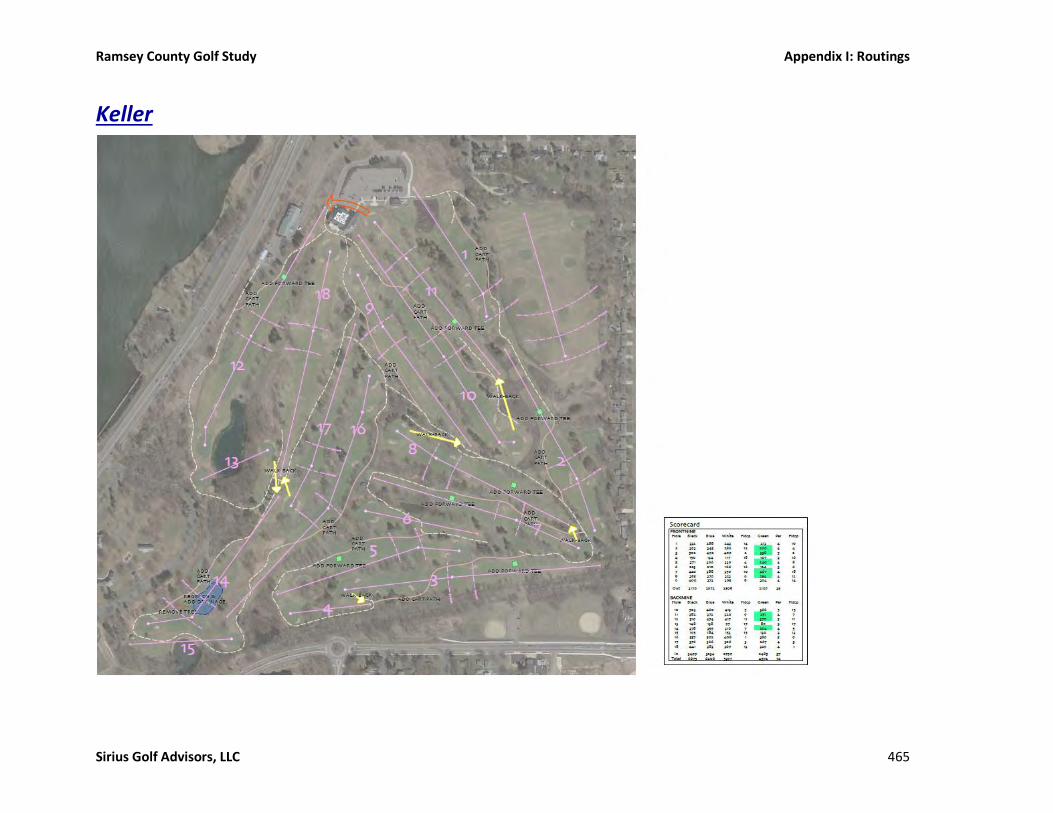
Ramsey County Golf Study Appendix I: Routings
Sirius Golf Advisors, LLC 465
Keller
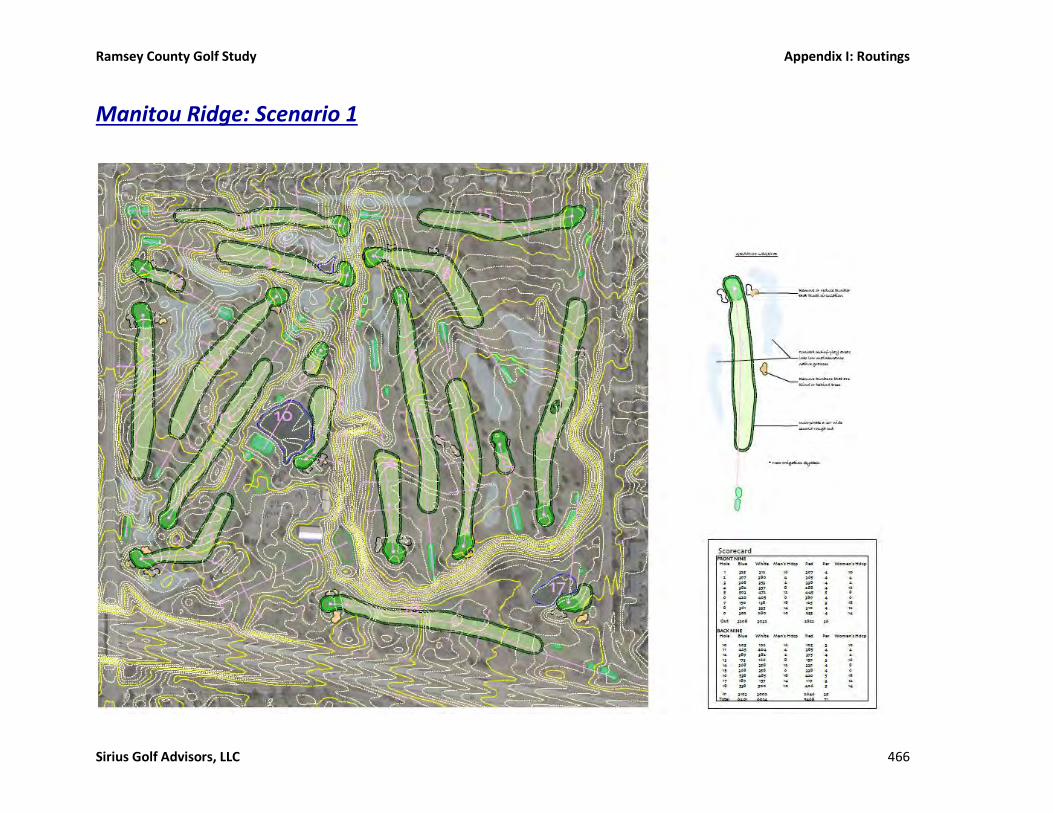
Ramsey County Golf Study Appendix I: Routings
Sirius Golf Advisors, LLC 466
Manitou Ridge: Scenario 1
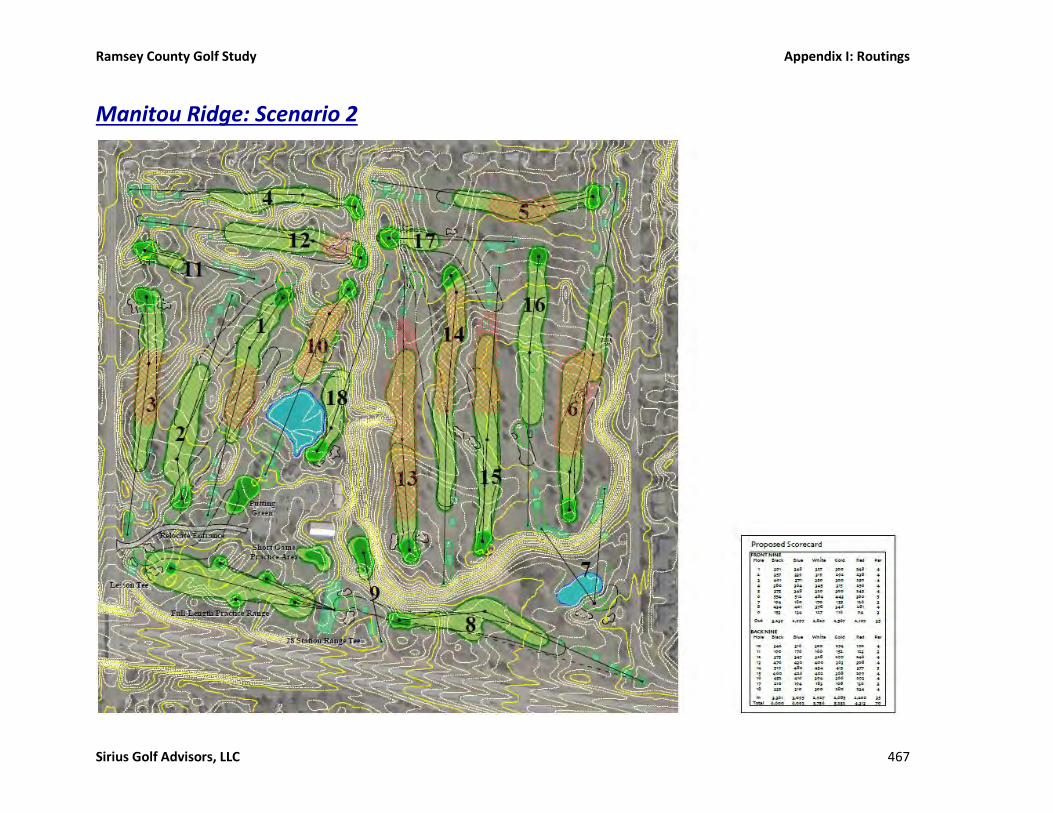
Ramsey County Golf Study Appendix I: Routings
Sirius Golf Advisors, LLC 467
Manitou Ridge: Scenario 2

Ramsey County Golf Study Appendix I: Routings
Sirius Golf Advisors, LLC 468
Goodrich Scenario 1
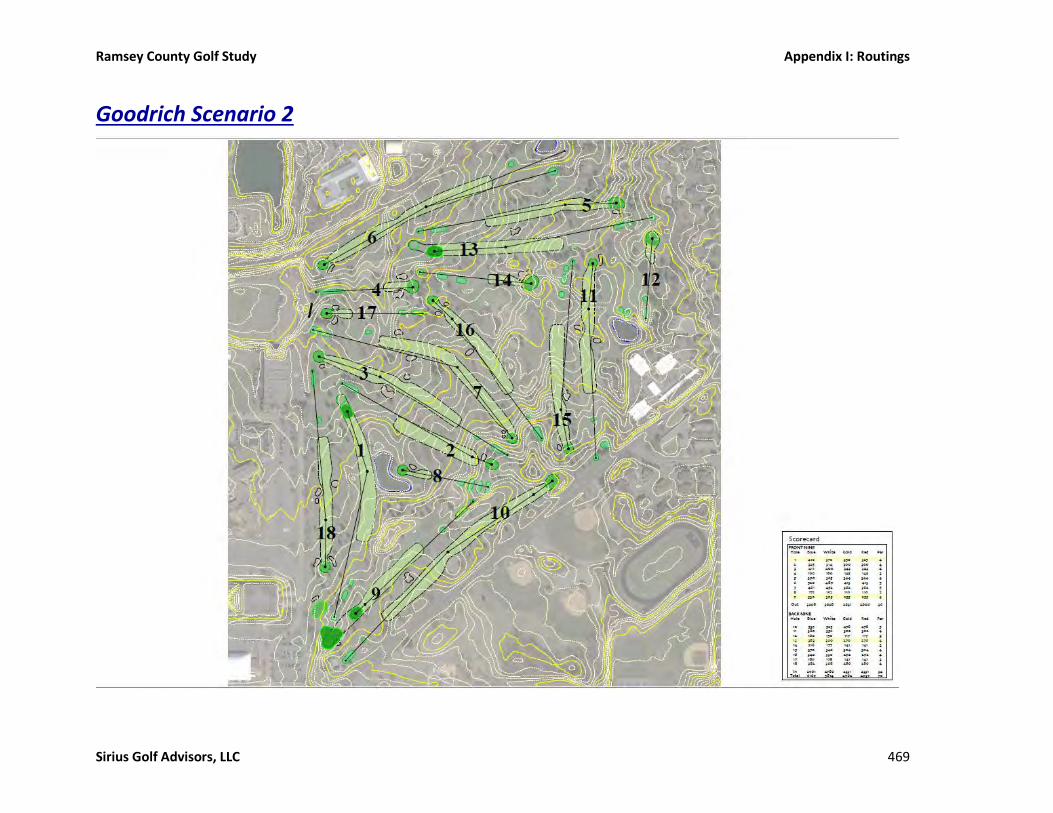
Ramsey County Golf Study Appendix I: Routings
Sirius Golf Advisors, LLC 469
Goodrich Scenario 2

Ramsey County Golf Study Appendix I: Routings
Sirius Golf Advisors, LLC 470
Battle Creek Scenario 1

Ramsey County Golf Study Appendix I: Routings
Sirius Golf Advisors, LLC 471
Battle Creek Scenario 2

Ramsey County Golf Study Appendix I: Routings
Sirius Golf Advisors, LLC 472
Battle Creek Scenario 3

Ramsey County Golf Study Appendix J: Cash Flow Projections
Sirius Golf Advisors, LLC 473
Appendix J: Cash Flow Projections

Ramsey County Golf Study Appendix J: Cash Flow Projections
Sirius Golf Advisors, LLC 474
Keller
Status Quo
2019 2020 2021 2022 2023 Total 19-23
29,515 29,663 26,696 29,513 29,660 $145,047
Regular $12,573 $13,327 $13,327 $14,127 $15,696 $69,050
Quantity 9 9 9 9 10
Unit $1,397 $1,481 $1,481 $1,570 $1,570
Senior $45,820 $48,570 $49,754 $52,739 $55,251 $252,135
Quantity 41 41 42 42 44
Unit $1,118 $1,185 $1,185 $1,256 $1,256
Junior $373 $395 $395 $419 $419 $1,999
Quantity 1 1 1 1 1
Unit $373 $395 $395 $419 $419
Total Passes $58,766 $62,292 $63,476 $67,285 $71,366 $323,184
ResidentRegular $4,074 $4,442 $4,467 $4,813 $4,813 $22,608
Quantity 175 180 181 184 184
Unit $23 $25 $25 $26 $26
Total Patron Cards $4,074 $4,442 $4,467 $4,813 $4,813 $22,608
Pass Rounds 3,078 3,078 3,138 3,138 3,319 $15,751
rnds/pass 60.35 60.35 60.35 60.35 60.35
Patron Rounds 2,457 2,527 2,541 2,583 2,583 $12,692
rnds/patron 14.04 14.04 14.04 14.04 14.04
Regular Rounds 16,854 16,909 14,772 16,721 16,698 $81,954
% Rounds 70.3% 70.3% 70.3% 70.3% 70.3%
Senior Rounds 6,599 6,621 5,784 6,547 6,538 $32,090
% Rounds 27.5% 27.5% 27.5% 27.5% 27.5%
Other Rounds 526 528 461 522 522 $2,560
% Rounds 2.2% 2.2% 2.2% 2.2% 2.2%
Avg Patron Rate $30.66 $32.50 $32.50 $34.45 $34.45
Avg Regular Rate $34.27 $36.33 $36.33 $38.51 $38.51
Avg Senior Rate $28.34 $30.04 $30.04 $31.84 $31.84
Avg Other Rate $0.00 $0.00 $0.00 $0.00 $0.00
Total Patron $75,332 $82,133 $82,589 $88,996 $88,996 $418,045
Total Regular $577,596 $614,227 $536,595 $643,874 $642,968 $3,015,260
Total Senior $187,027 $198,888 $173,750 $208,488 $208,194 $976,347
Total Green Fees $839,955 $895,248 $792,935 $941,357 $940,157 $4,409,652
avg rate $7.83 $8.30 $8.30 $8.80 $8.80
Total Cart Fees $231,102 $246,193 $221,574 $259,647 $260,945 $1,219,463
avg rate $2.22 $2.35 $2.49 $2.64 $2.80
Total Range $65,523 $69,802 $66,591 $78,033 $83,129 $363,079
avg rate $4.61 $4.75 $4.90 $5.04 $5.19
Total Merchandise $136,194 $140,981 $130,690 $148,812 $154,042 $710,719
Golf $414,207 $428,766 $397,466 $452,581 $468,489 $2,161,510
avg rate $14.03 $14.45 $14.89 $15.34 $15.80
Banquet $940,922 $969,149 $998,224 $1,028,170 $1,059,015 $4,995,480
Total F&B $1,355,129 $1,397,916 $1,395,690 $1,480,751 $1,527,505 $7,156,990
$2,690,742 $2,816,874 $2,675,422 $2,980,699 $3,041,958 $14,205,695
Cart Fees
Range
Merchandise
Food & Beverage
Total Revenue
Keller Status Quo
Rounds
Revenue
Green Fee
Patron Card
Passes

Ramsey County Golf Study Appendix J: Cash Flow Projections
Sirius Golf Advisors, LLC 475
2024 2025 2026 2027 2028 Total 24-28 Total 19-28
31,299 29,734 29,883 26,895 29,732 $147,542 292,589
Regular $16,638 $17,636 $17,636 $18,695 $18,695 $89,300 $158,350
Quantity 10 10 10 10 10
Unit $1,664 $1,764 $1,764 $1,869 $1,869 $8,930 $8,930
Senior $58,566 $62,080 $63,491 $67,300 $67,300 $318,737 $570,872
Quantity 44 44 45 45 45
Unit $1,331 $1,411 $1,411 $1,496 $1,496 $7,144 $7,144
Junior $444 $470 $470 $499 $499 $2,381 $4,381
Quantity 1 1 1 1 1
Unit $444 $470 $470 $499 $499 $2,381 $2,381
Total Passes $75,648 $80,187 $81,598 $86,493 $86,493 $410,419 $733,602
Resident
Regular $5,157 $5,467 $5,584 $5,982 $5,982 $28,171 $50,779
Quantity 186 186 190 192 192
Unit $28 $29 $29 $31 $31
Total Patron Cards $5,157 $5,467 $5,584 $5,982 $5,982 $28,171 $50,779
Pass Rounds 3,319 3,319 3,380 3,380 3,380 $16,777 32,529
rnds/pass 60.35 60.35 60.35 60.35 60.35
Patron Rounds 2,611 2,611 2,668 2,696 2,696 $13,282 25,974
rnds/patron 14.04 14.04 14.04 14.04 14.04
Regular Rounds 17,830 16,730 16,753 14,633 16,627 $82,572 164,526
% Rounds 70.3% 70.3% 70.3% 70.3% 70.3%
Senior Rounds 6,981 6,551 6,560 5,730 6,510 $32,332 64,421
% Rounds 27.5% 27.5% 27.5% 27.5% 27.5%
Other Rounds 557 523 523 457 519 $2,579 5,139
% Rounds 2.2% 2.2% 2.2% 2.2% 2.2%
Avg Patron Rate $36.52 $36.52 $38.71 $38.71 $41.03
Avg Regular Rate $40.82 $40.82 $43.27 $43.27 $45.86
Avg Senior Rate $33.75 $33.75 $35.78 $35.78 $37.93
Avg Other Rate $0.00 $0.00 $0.00 $0.00 $0.00
Total Patron $95,361 $95,361 $103,256 $104,343 $110,604 $508,925 $926,970
Total Regular $727,751 $682,857 $724,806 $633,083 $762,525 $3,531,022 $6,546,282
Total Senior $235,647 $221,110 $234,694 $204,994 $246,907 $1,143,352 $2,119,699
Total Green Fees $1,058,759 $999,328 $1,062,756 $942,420 $1,120,036 $5,183,298 $9,592,951
avg rate $9.33 $9.89 $9.89 $10.48 $10.48
Total Cart Fees $291,884 $293,928 $295,397 $281,809 $311,540 $1,474,558 $2,694,021
avg rate $2.97 $3.15 $3.34 $3.54 $3.75
Total Range $92,985 $93,636 $99,751 $95,162 $111,514 $493,048 $856,126
avg rate $5.35 $5.51 $5.68 $5.85 $6.02
Total Merchandise $167,430 $163,830 $169,589 $157,209 $179,008 $837,066 $1,547,785
Golf $509,205 $498,257 $515,770 $478,119 $544,418 $2,545,768 $4,707,278
avg rate $16.27 $16.76 $17.26 $17.78 $18.31
Banquet $1,090,786 $1,123,510 $1,157,215 $1,191,931 $1,227,689 $5,791,131 $10,786,611
Total F&B $1,599,991 $1,621,766 $1,672,985 $1,670,050 $1,772,107 $8,336,899 $15,493,889
$3,291,854 $3,258,141 $3,387,659 $3,239,125 $3,586,679 $16,763,458 $30,969,153
Cart Fees
Range
Merchandise
Food & Beverage
Total Revenue
Keller Status Quo
Rounds
Revenue
Green Fee
Patron Card
Passes
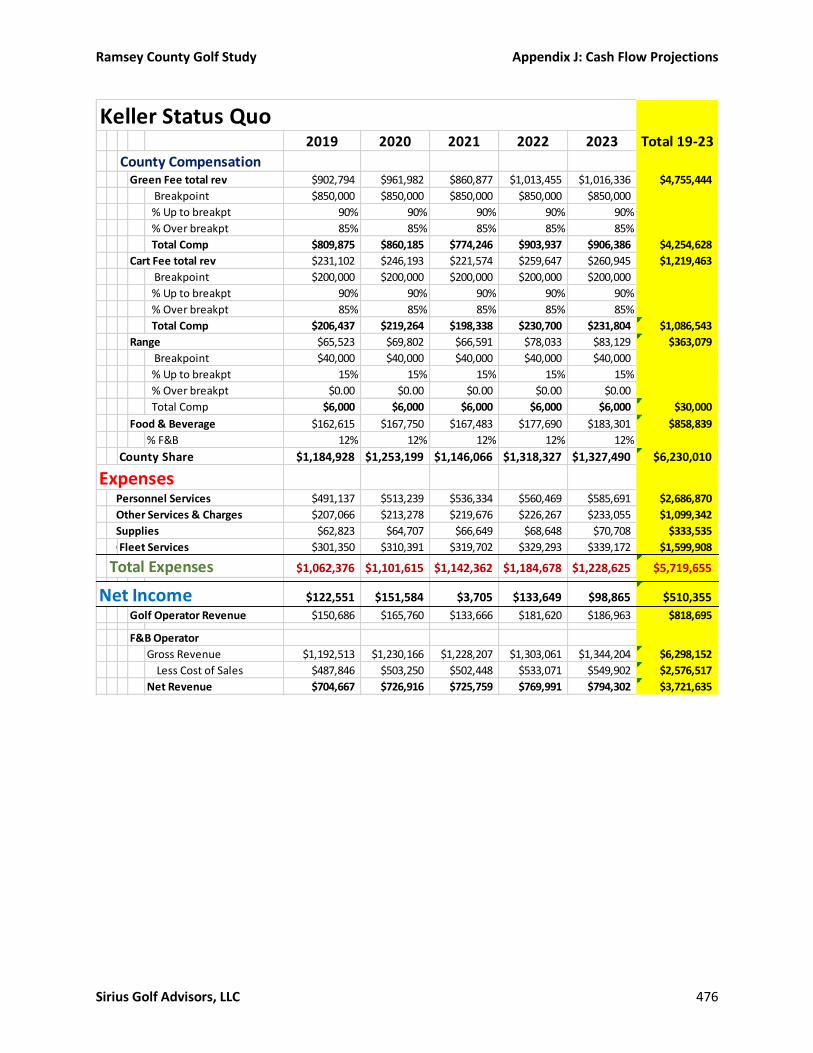
Ramsey County Golf Study Appendix J: Cash Flow Projections
Sirius Golf Advisors, LLC 476
2019 2020 2021 2022 2023 Total 19-23
Green Fee total rev $902,794 $961,982 $860,877 $1,013,455 $1,016,336 $4,755,444
Breakpoint $850,000 $850,000 $850,000 $850,000 $850,000
% Up to breakpt 90% 90% 90% 90% 90%
% Over breakpt 85% 85% 85% 85% 85%
Total Comp $809,875 $860,185 $774,246 $903,937 $906,386 $4,254,628
Cart Fee total rev $231,102 $246,193 $221,574 $259,647 $260,945 $1,219,463
Breakpoint $200,000 $200,000 $200,000 $200,000 $200,000
% Up to breakpt 90% 90% 90% 90% 90%
% Over breakpt 85% 85% 85% 85% 85%
Total Comp $206,437 $219,264 $198,338 $230,700 $231,804 $1,086,543
Range $65,523 $69,802 $66,591 $78,033 $83,129 $363,079
Breakpoint $40,000 $40,000 $40,000 $40,000 $40,000
% Up to breakpt 15% 15% 15% 15% 15%
% Over breakpt $0.00 $0.00 $0.00 $0.00 $0.00
Total Comp $6,000 $6,000 $6,000 $6,000 $6,000 $30,000
Food & Beverage $162,615 $167,750 $167,483 $177,690 $183,301 $858,839
% F&B 12% 12% 12% 12% 12%
County Share $1,184,928 $1,253,199 $1,146,066 $1,318,327 $1,327,490 $6,230,010
Personnel Services $491,137 $513,239 $536,334 $560,469 $585,691 $2,686,870
Other Services & Charges $207,066 $213,278 $219,676 $226,267 $233,055 $1,099,342
Supplies $62,823 $64,707 $66,649 $68,648 $70,708 $333,535
Capital OutlayFleet Services $301,350 $310,391 $319,702 $329,293 $339,172 $1,599,908
$1,062,376 $1,101,615 $1,142,362 $1,184,678 $1,228,625 $5,719,655
$122,551 $151,584 $3,705 $133,649 $98,865 $510,355
Golf Operator Revenue $150,686 $165,760 $133,666 $181,620 $186,963 $818,695
F&B Operator
Gross Revenue $1,192,513 $1,230,166 $1,228,207 $1,303,061 $1,344,204 $6,298,152
Less Cost of Sales $487,846 $503,250 $502,448 $533,071 $549,902 $2,576,517
Net Revenue $704,667 $726,916 $725,759 $769,991 $794,302 $3,721,635
Expenses
Total Expenses
Net Income
County Compensation
Keller Status Quo

Ramsey County Golf Study Appendix J: Cash Flow Projections
Sirius Golf Advisors, LLC 477
2024 2025 2026 2027 2028 Total 24-28 Total 19-28
Green Fee total rev $1,139,564 $1,084,981 $1,149,938 $1,034,894 $1,212,511 $5,621,888 $10,377,332
Breakpoint $850,000 $850,000 $850,000 $850,000 $850,000
% Up to breakpt 90% 90% 90% 90% 90%
% Over breakpt 85% 85% 85% 85% 85%
Total Comp $1,011,129 $964,734 $1,019,947 $922,160 $1,073,134 $4,991,105 $9,245,733
Cart Fee total rev $291,884 $293,928 $295,397 $281,809 $311,540 $1,474,558 $2,694,021
Breakpoint $200,000 $200,000 $200,000 $200,000 $200,000
% Up to breakpt 90% 90% 90% 90% 90%
% Over breakpt 85% 85% 85% 85% 85%
Total Comp $258,102 $259,838 $261,088 $249,538 $274,809 $1,303,374 $2,389,917
Range $92,985 $93,636 $99,751 $95,162 $111,514 $493,048 $856,126
Breakpoint $40,000 $40,000 $40,000 $40,000 $40,000
% Up to breakpt 15% 15% 15% 15% 15%
% Over breakpt $0.00 $0.00 $0.00 $0.00 $0.00
Total Comp $6,000 $6,000 $6,000 $6,000 $6,000 $30,000 $60,000
Food & Beverage $191,999 $194,612 $200,758 $200,406 $212,653 $1,000,428 $1,859,267
% F&B 12% 12% 12% 12% 12%
County Share $1,467,230 $1,425,184 $1,487,793 $1,378,104 $1,566,596 $7,324,907 $13,554,917
Personnel Services $612,047 $639,589 $668,370 $698,447 $729,877 $3,348,329 $6,035,200
Other Services & Charges $240,046 $247,248 $254,665 $262,305 $270,174 $1,274,438 $2,373,780
Supplies $72,829 $75,014 $77,264 $79,582 $81,969 $386,658 $720,193
Capital OutlayFleet Services $349,347 $359,828 $370,622 $381,741 $393,193 $1,854,732 $3,454,640
$1,274,269 $1,321,678 $1,370,922 $1,422,075 $1,475,214 $6,864,158 $12,583,813
$192,961 $103,507 $116,871 ($43,971) $91,382 $460,749 $971,104
Golf Operator Revenue $224,633 $211,191 $226,881 $190,970 $247,977 $1,101,652 $1,920,347
F&B Operator
Gross Revenue $1,407,992 $1,427,154 $1,472,227 $1,469,644 $1,559,454 $7,336,471 $13,634,623
Less Cost of Sales $575,997 $583,836 $602,275 $601,218 $637,958 $3,001,284 $5,577,800
Net Revenue $831,995 $843,318 $869,952 $868,426 $921,495 $4,335,187 $8,056,822
Expenses
Total Expenses
Net Income
County Compensation
Keller Status Quo

Ramsey County Golf Study Appendix J: Cash Flow Projections
Sirius Golf Advisors, LLC 478
Scenario 1: Priority Fixes
Keller Recommended2019 2020 2021 2022 2023 Total 19-23
Rounds 31,500 33,000 28,050 33,752 34,820 161,122
Priority Fixes
RevenuePasses
Regular $7,592 $9,823 $12,200 $14,731 $17,425 $61,771
Quantity 4.0 5 6 7 8
Unit $1,898 $1,965 $2,033 $2,104 $2,178
Senior $18,506 $20,628 $22,874 $25,253 $27,771 $115,033
Quantity 13 14 15 16 17
Unit $1,424 $1,473 $1,525 $1,578 $1,634
Junior $475 $491 $508 $1,052 $1,089 $3,615
Quantity 1 1 1 2 2
Unit $475 $491 $508 $526 $545
Weekday Regular $7,118 $7,367 $9,150 $9,470 $9,801 $42,906
Quantity 5 5 6 6 6
Unit $1,423.57 $1,473 $1,525 $1,578 $1,634
Weekday Senior $18,151 $19,891 $21,731 $22,491 $24,504 $106,767
Quantity 17 18 19 19 20
Unit $1,067.68 $1,105 $1,144 $1,184 $1,225
Total Passes 40 43 47 50 53
Total Passes $51,842 $58,199 $66,463 $72,998 $80,590 $330,092
Patron CardResident
Regular $1,329 $1,375 $1,423 $1,473 $1,525 $7,125
Quantity 35 35 35 35 35
Unit $38 $39 $41 $42 $44
Senior $1,138.86 $1,208.18 $1,280.97 $1,357.37 $1,437.55 $6,422.93
Quantity 40 41 42 43 44
Unit $28.47 $29 $30 $32 $33
Premium $1,024.97 $1,060.84 $1,097.97 $1,136.40 $1,176.18 $5,496.37
Quantity 12 12 12 12 12
Unit $85.41 $88 $91 $95 $98
Premium Senior $996.50 $1,100.13 $1,209.80 $1,325.80 $1,448.44 $6,080.68
Quantity 15 16 17 18 19
Unit $66.43 $69 $71 $74 $76
Non-Resident
Regular $1,565.93 $1,669.85 $1,779.12 $1,894.01 $2,014.75 $8,923.65
Quantity 33 34 35 36 37
Unit $47.45 $49 $51 $53 $54
Senior $1,594.40 $1,689.49 $1,789.29 $1,894.01 $2,003.86 $8,971.04
Quantity 42 43 44 45 46
Unit $37.96 $39 $41 $42 $44
Premium $759.24 $884.04 $1,219.97 $1,367.89 $1,633.58 $5,864.72
Quantity 8 9 12 13 15
Unit $94.90 $98 $102 $105 $109
Premium Senior $1,290.70 $1,414.46 $1,626.63 $1,767.74 $1,916.73 $8,016.26
Quantity 17 18 20 21 22
Unit $75.92 $79 $81 $84 $87
Total quantity 202 208 217 223 230
Total Patron Cards $9,699 $10,402 $11,427 $12,216 $13,156 $56,901

Ramsey County Golf Study Appendix J: Cash Flow Projections
Sirius Golf Advisors, LLC 479
Keller Recommended2024 2025 2026 2027 2028 Total 19-23 Total 19-28
Rounds 36,227 34,415 35,104 31,593 35,448 172,787 333,909
RevenuePasses
Regular $20,289 $23,332 $26,564 $29,993 $36,217 $136,395 $198,166
Quantity 9 10 11 12 14
Unit $2,254 $2,333 $2,415 $2,499 $2,587
Senior $30,434 $33,249 $36,224 $39,366 $42,684 $181,956 $296,988
Quantity 18 19 20 21 22
Unit $1,691 $1,750 $1,811 $1,875 $1,940
Junior $1,127 $1,750 $1,811 $1,875 $1,940 $8,503 $12,118
Quantity 2 3 3 3 3
Unit $564 $583 $604 $625 $647
Weekday Regular $10,145 $12,250 $12,678 $13,122 $13,581 $61,776 $104,682
Quantity 6 7 7 7 7
Unit $1,691 $1,750 $1,811 $1,875 $1,940
Weekday Senior $26,629 $27,561 $29,884 $32,336 $34,923 $151,335 $258,102
Quantity 21 21 22 23 24
Unit $1,268 $1,312 $1,358 $1,406 $1,455
Total Passes 56 60 63 66 70
Total Passes $88,624 $98,142 $107,161 $116,692 $129,345 $539,964 $870,056
Patron CardResident
Regular $1,578 $1,633 $1,690 $1,750 $1,811 $8,462 $15,587
Quantity 35 35 35 35 35
Unit $45 $47 $48 $50 $52
Senior $1,521.68 $1,609.94 $1,702.51 $1,799.59 $1,901.38 $8,535.09 $14,958
Quantity 45 46 47 48 49
Unit $34 $35 $36 $37 $39
Premium $1,217.34 $1,259.95 $1,304.05 $1,349.69 $1,396.93 $6,527.96 $12,024
Quantity 12 12 12 12 12
Unit $101 $105 $109 $112 $116
Premium Senior $1,578.04 $1,714.93 $1,859.48 $2,012.04 $2,173.00 $9,337.49 $15,418
Quantity 20 21 22 23 24
Unit $79 $82 $85 $87 $91
Non-Resident
Regular $2,141.62 $2,274.91 $2,414.90 $2,561.91 $2,716.25 $12,109.60 $21,033
Quantity 38 39 40 41 42
Unit $56 $58 $60 $62 $65
Senior $2,119.08 $2,239.91 $2,366.61 $2,499.43 $2,638.64 $11,863.67
Quantity 47 48 49 50 51
Unit $45 $47 $48 $50 $52
Premium $1,803.47 $1,983.26 $2,173.41 $2,374.46 $2,586.91 $10,921.50
Quantity 16 17 18 19 20
Unit $113 $117 $121 $125 $129
Premium Senior $2,073.99 $2,239.91 $2,414.90 $2,599.40 $2,793.86 $12,122.07
Quantity 23 24 25 26 27
Unit $90 $93 $97 $100 $103 $0
Total quantity 236 242 248 254 260
Total Patron Cards $14,033 $14,956 $15,926 $16,946 $18,018 $79,880 136,780

Ramsey County Golf Study Appendix J: Cash Flow Projections
Sirius Golf Advisors, LLC 480
Keller Recommended2019 2020 2021 2022 2023 Total 19-23
Green FeePass Rounds 2,414 2,595 2,836 3,018 3,199
rnds/pass 60.35 60.35 60.35 60.35 60.35 301.75
% Rounds
Patron Rounds 2,836 2,920 3,047 3,131 3,229
rnds/patron 14.04 14.04 14.04 14.04 14.04 70.20
% Rounds
Regular Rounds 18,450 19,317 15,580 19,401 19,955 92,703
% Rounds 70.3% 70.3% 70.3% 70.3% 70.3%
Senior Rounds 7,224 7,564 6,100 7,597 7,814 36,298
% Rounds 27.5% 27.5% 27.5% 27.5% 27.5%
Other Rounds 576 603 487 606 623
% Rounds 2.2% 2.2% 2.2% 2.2% 2.2%
Avg Patron Rate $32.00 $33.12 $34.28 $35.48 $36.72
Avg Regular Rate $35.50 $36.74 $38.03 $39.36 $40.74
Avg Senior Rate $33.00 $34.16 $35.35 $36.59 $37.87 $176.96
Avg Other Rate $0.00 $0.00 $0.00 $0.00 $0.00 $0.00
Total Patron $90,755 $96,721 $104,438 $111,082 $118,579 $521,574
Total Regular $654,960 $709,769 $592,477 $763,613 $812,920 $3,533,738
Total Senior $238,393 $258,343 $215,651 $277,941 $295,888 $1,286,216
Total Other $0 $0 $0 $0 $0
Total Green Fees $984,108 $1,064,832 $912,566 $1,152,635 $1,227,387 $5,341,528
Cart Feesavg rate $8.60 $8.90 $9.21 $9.53 $9.87
Total Cart Fees $270,900 $293,733 $258,412 $321,824 $343,628 $1,488,497
Rangeavg rate $2.50 $2.59 $2.68 $2.77 $2.87
Total Range $78,750 $85,388 $75,120 $93,554 $99,892 $432,703
Merchandiseavg rate $6.00 $6.21 $6.43 $6.65 $6.89
Total Merchandise $189,000 $204,930 $180,287 $224,529 $239,741 $1,038,486
Food & BeverageGolf $488,250 $529,403 $465,742 $580,032 $619,330 $2,682,756
avg rate $15.50 $16.04 $16.60 $17.19 $17.79
Banquet $945,489 $978,581 $1,012,832 $1,048,281 $1,084,971 $5,070,153
Total F&B $1,433,739 $1,507,984 $1,478,573 $1,628,313 $1,704,300 $7,752,910
Total Revenue $3,018,038 $3,225,468 $2,982,848 $3,506,070 $3,708,693 $16,441,116
County CompensationGreen Fee total rev $1,045,649 $1,133,434 $990,456 $1,237,850 $1,321,132 $5,728,520
Breakpoint $850,000 $850,000 $850,000 $850,000 $850,000
% Up to breakpt 85% 85% 85% 85% 85% 425%
% Over breakpt 85% 85% 85% 85% 85% 425%
Total Comp $888,801 $963,419 $841,888 $1,052,172 $1,122,962 $4,869,242
Cart Fee total rev $270,900 $293,733 $258,412 $321,824 $343,628 $1,488,497
Breakpoint $200,000 $200,000 $200,000 $200,000 $200,000
% Up to breakpt 85% 85% 85% 85% 85% 425%
% Over breakpt 85% 85% 85% 85% 85% 425%
Total Comp $230,265 $249,673 $219,650 $273,551 $292,084 $1,265,223
Range $78,750 $85,388 $75,120 $93,554 $99,892 $432,703
Breakpoint $40,000 $40,000 $40,000 $40,000 $40,000
% Up to breakpt 85% 85% 85% 85% 85% 425%
% Over breakpt 85% 85% 85% 85% 85% 425%
Total Comp $66,938 $72,579 $63,852 $79,521 $84,908
Food & Beverage $172,049 $180,958 $177,429 $195,398 $204,516
% F&B 12% 12% 12% 12% 12% 60%
Merchandise $189,000 $204,930 $180,287 $224,529 $239,741 $1,038,486
Net Merchandise $56,700 $61,479 $54,086 $67,359 $71,922 $311,546
% split 85% 85% 85% 85% 85% 425%
Merch Comp $48,195 $52,257 $45,973 $57,255 $61,134 $264,814
County Share $1,406,247 $1,518,886 $1,348,791 $1,657,896 $1,765,604 $7,697,425
Expenses Personnel Services $491,137 $513,239 $536,334 $543,655 $568,120 $2,652,486
Other Services & Charges $207,066 $213,278 $219,676 $226,266 $233,054 $1,099,340
Supplies $62,823 $64,707 $66,649 $68,648 $70,708 $333,535
Marketing $35,156 $37,972 $33,720 $41,447 $44,140 $192,436
Capital OutlayFleet Services $301,350 $310,391 $319,702 $329,293 $339,172 $1,599,908
Total Expenses $1,097,532 $1,139,587 $1,176,081 $1,209,310 $1,255,193 $5,877,704
Net Income $308,715 $379,300 $172,710 $448,586 $510,411 $1,819,721
Difference to Status Quo $186,164 $227,715 $169,005 $314,937 $411,546 $1,309,367
Golf Operator Revenue $178,051 $198,598 $155,483 $219,860 $238,788 $990,781
F&B Operator
Gross Revenue $78,750 $85,388 $75,120 $93,554 $99,892 $432,703
Less Cost of Sales $28,350 $30,740 $27,043 $33,679 $35,961 $155,773
Net Revenue $50,400 $54,648 $48,077 $59,874 $63,931 $276,930

Ramsey County Golf Study Appendix J: Cash Flow Projections
Sirius Golf Advisors, LLC 481
Keller Recommended2024 2025 2026 2027 2028 Total 19-23 Total 19-28
Green FeePass Rounds 3,380 3,621 3,802 3,983 4,225
rnds/pass 60.35 60.35 60.35 60.35 60.35 301.75 604
% Rounds
Patron Rounds 3,313 3,398 3,482 3,566 3,650
rnds/patron 14.04 14.04 14.04 14.04 14.04 70.20 140
% Rounds
Regular Rounds 20,758 19,256 19,553 16,899 19,379 95,845 188,548
% Rounds 70.3% 70.3% 70.3% 70.3% 70.3%
Senior Rounds 8,128 7,540 7,656 6,617 7,588 37,529 73,827
% Rounds 27.5% 27.5% 27.5% 27.5% 27.5%
Other Rounds 648 601 611 528 605
% Rounds 2.2% 2.2% 2.2% 2.2% 2.2%
Avg Patron Rate $38.01 $39.34 $40.71 $42.14 $43.61
Avg Regular Rate $42.16 $43.64 $45.17 $46.75 $48.38
Avg Senior Rate $39.19 $40.57 $41.99 $43.45 $44.98 $210.17 $387
Avg Other Rate $0.00 $0.00 $0.00 $0.00 $0.00 $0.00 $0
Total Patron $125,930 $133,652 $141,759 $150,270 $159,204 $710,816 $1,232,389
Total Regular $875,197 $840,286 $883,125 $789,982 $937,629 $4,326,219 $7,859,958
Total Senior $318,556 $305,849 $321,441 $287,539 $341,280 $1,574,664 $2,860,880
Total Other $0 $0 $0 $0 $0
Total Green Fees $1,319,684 $1,279,786 $1,346,325 $1,227,792 $1,438,112 $6,611,699 $11,953,227
Cart Feesavg rate $10.21 $10.57 $10.94 $11.32 $11.72
Total Cart Fees $370,024 $363,826 $384,091 $357,780 $415,480 $1,891,200 $3,379,697
Rangeavg rate $2.97 $3.07 $3.18 $3.29 $3.41
Total Range $107,565 $105,763 $111,654 $104,006 $120,779 $549,767 $982,470
Merchandiseavg rate $7.13 $7.38 $7.63 $7.90 $8.18
Total Merchandise $258,156 $253,832 $267,970 $249,614 $289,870 $1,319,442 $2,357,928
Food & BeverageGolf $666,903 $655,732 $692,256 $644,837 $748,830 $3,408,558 $6,091,315
avg rate $18.41 $19.05 $19.72 $20.41 $21.12
Banquet $1,122,944 $1,162,248 $1,202,926 $1,245,029 $1,288,605 $6,021,752 $11,091,905
Total F&B $1,789,847 $1,817,980 $1,895,183 $1,889,866 $2,037,434 $9,430,310 $17,183,219
Total Revenue $3,947,932 $3,934,285 $4,128,310 $3,962,696 $4,449,038 $20,422,262 $36,863,378
County CompensationGreen Fee total rev $1,422,341 $1,392,884 $1,469,413 $1,361,430 $1,585,475 $7,231,543 $12,960,063
Breakpoint $850,000 $850,000 $850,000 $850,000 $850,000
% Up to breakpt 85% 85% 85% 85% 85% 425% $9
% Over breakpt 85% 85% 85% 85% 85% 425% $8.50
Total Comp $1,208,990 $1,183,952 $1,249,001 $1,157,215 $1,347,654 $6,146,811 $11,016,054
Cart Fee total rev $370,024 $363,826 $384,091 $357,780 $415,480 $1,891,200 $3,379,697
Breakpoint $200,000 $200,000 $200,000 $200,000 $200,000
% Up to breakpt 85% 85% 85% 85% 85% 425%
% Over breakpt 85% 85% 85% 85% 85% 425%
Total Comp $314,520 $309,252 $326,477 $304,113 $353,158 $1,607,520 $2,872,743
Range $107,565 $105,763 $111,654 $104,006 $120,779 $549,767 $982,470
Breakpoint $40,000 $40,000 $40,000 $40,000 $40,000
% Up to breakpt 85% 85% 85% 85% 85% 425%
% Over breakpt 85% 85% 85% 85% 85% 425%
Total Comp $91,430 $89,899 $94,906 $88,405 $102,662
Food & Beverage $214,782 $218,158 $227,422 $226,784 $244,492
% F&B 12% 12% 12% 12% 12% 60%
Merchandise $258,156 $253,832 $267,970 $249,614 $289,870 $1,319,442 $2,357,928
Net Merchandise $77,447 $76,150 $80,391 $74,884 $86,961 $395,833 $707,378
% split 85% 85% 85% 85% 85% 425% $9
Merch Comp $65,830 $64,727 $68,332 $63,652 $73,917 $336,458 $601,272
County Share $1,895,551 $1,865,987 $1,966,138 $1,840,169 $2,121,883 $9,689,729 $17,387,154
Expenses Personnel Services $593,685 $620,401 $648,319 $677,493 $707,981 $3,247,880 $5,900,365
Other Services & Charges $240,045 $247,247 $254,664 $262,304 $270,173 $1,274,433 $2,373,773
Supplies $72,829 $75,014 $77,264 $79,582 $81,969 $386,658 $720,193
Marketing $47,389 $46,650 $49,153 $46,004 $53,047 $242,243 $434,679
Capital OutlayFleet Services $349,347 $359,828 $370,622 $381,741 $393,193 $1,854,732 $3,454,640
Total Expenses $1,303,295 $1,349,139 $1,400,023 $1,447,125 $1,506,364 $7,005,946 $12,883,650
Net Income $592,256 $516,848 $566,115 $393,045 $615,519 $2,683,783 $4,503,504
Difference to Status Quo $399,295 $413,342 $449,244 $437,016 $524,137 $2,223,034 $3,532,400
Golf Operator Revenue $262,534 $250,318 $266,990 $232,661 $289,721 $1,302,224 $2,293,005
F&B Operator
Gross Revenue $107,565 $105,763 $111,654 $104,006 $120,779 $549,767 $982,470
Less Cost of Sales $38,723 $38,075 $40,196 $37,442 $43,480 $197,916 $353,689
Net Revenue $68,842 $67,688 $71,459 $66,564 $77,299 $351,851 $628,781

Ramsey County Golf Study Appendix J: Cash Flow Projections
Sirius Golf Advisors, LLC 482
Scenario 1b: Hybrid Contract
Hybrid Model2019 2020 2021 2022 2023 Total 19-23
County RevenueNet Revenue $2,337,137 $2,504,885 $2,291,183 $2,725,650 $2,888,446 $12,747,300
Breakpoint $1,600,000 $1,648,000 $1,696,000 $1,744,000 $1,792,000
% Below breakpoint 5% 5% 5% 5% 5%
% Above breakpoint 50% 50% 50% 50% 50%
County Share $448,568 $510,842 $382,392 $578,025 $637,823 $2,557,650
Expenses Other Services & Charges $6,866 $7,072 $7,284 $7,503 $7,728 $36,452
Supplies $373 $384 $396 $407 $420 $1,980
Supplement $0 $60,000 $150,000 $25,000 $235,000
Marketing $1,055 $1,139 $1,012 $1,243 $1,324 $5,773
Total Expenses $8,294 $68,595 $8,691 $159,153 $34,472 $279,205
Net Income - Hybrid $440,275 $442,247 $373,700 $418,871 $603,351 $2,278,445
Difference Hybrid $317,724 $290,663 $369,996 $285,222 $504,486 $1,768,090
Operator Hybrid
Revenue Split $2,569,469 $2,714,626 $2,600,456 $2,928,045 $3,070,870 $13,883,466
Cost of sales $680,901 $720,583 $691,665 $780,420 $820,247 $3,693,816
Supplement $0 $60,000 $0 $150,000 $25,000 $235,000
Net Revenue $1,888,568 $2,054,042 $1,908,792 $2,297,625 $2,275,623 $10,424,650
Hybrid Model2024 2025 2026 2027 2028 Totam 19-23Total 19-28
County RevenueNet Revenue $3,081,918 $3,060,694 $3,215,202 $3,064,825 $3,466,107 $15,888,746 $28,636,046
Breakpoint $1,840,000 $1,888,000 $1,936,000 $1,984,000 $2,032,000
% Below breakpoint 5% 5% 5% 5% 5%
% Above breakpoint 50% 50% 50% 50% 50%
County Share $712,959 $680,747 $736,401 $639,613 $818,653 $3,588,373 $6,146,023
Expenses Other Services & Charges $7,960 $8,198 $8,444 $8,698 $8,959 $42,258 $78,711 Supplies $432 $445 $459 $472 $486 $2,295 $4,274
Supplement $0 $0 $0 $235,000
Marketing $1,422 $1,399 $1,475 $1,380 $1,591 $7,267 $13,040
Total Expenses $9,813 $10,043 $10,377 $10,550 $11,036 $51,820 $331,026
Net Income - Hybrid $703,146 $670,704 $726,024 $629,062 $807,617 $3,536,553 $5,814,998
Difference Hybrid $510,185 $567,197 $609,153 $673,034 $716,235 $3,075,804 $4,843,894
Operator Hybrid $552,216
Revenue Split $3,234,973 $3,253,538 $3,391,909 $3,323,084 $3,630,385 $16,833,889 $30,717,355
Cost of sales $866,014 $873,591 $913,108 $897,871 $982,931 $4,533,516 $8,227,332
Supplement $0 $0 $0 $0 $0 $0 $235,000
Net Revenue $2,368,959 $2,379,947 $2,478,801 $2,425,213 $2,647,453 $12,300,373 $22,725,023

Ramsey County Golf Study Appendix J: Cash Flow Projections
Sirius Golf Advisors, LLC 483
Manitou Ridge

Ramsey County Golf Study Appendix J: Cash Flow Projections
Sirius Golf Advisors, LLC 484
Status Quo
Manitou Status Quo2019 2020 2021 2022 2023 Total 19-23
Rounds 29,850 28,805 25,925 28,100 27,117 139,796
RevenuePasses
Regular $1,397 $1,481 $1,481 $1,570 $4,709 $10,637
Quantity 1 1 1 1 3
Unit $1,397 $1,481 $1,481 $1,570 $1,570
Senior $31,292 $33,169 $31,985 $33,904 $32,648 $162,998
Quantity 28 28 27 27 26
Unit $1,118 $1,185 $1,185 $1,256 $1,256
Junior $373 $395 $395 $419 $419 $1,999
Quantity 1 1 1 1 1
Unit $373 $395 $395 $419 $419
Total Passes $33,061 $35,045 $33,861 $35,892 $37,776 $175,635
Patron CardResident
Regular $1,397 $2,961 $2,912 $3,008 $2,956 $13,234
Quantity 60 120 118 115 113
Unit $23 $25 $25 $26 $26
Total Patron Cards $1,397 $2,961 $2,912 $3,008 $2,956 $13,234
Green FeePass Rounds 2,340 2,340 2,262 2,262 2,340 11,544
rnds/pass 78.00 78.00 78.00 78.00 78.00
% Rounds
Patron Rounds 1,140 2,280 2,242 2,185 2,147 9,994
rnds/patron 19.00 19.00 19.00 19.00 19.00
% Rounds
Regular Rounds 13,336 12,231 10,833 11,962 11,445 59,808
% Rounds 50.6% 50.6% 50.6% 50.6% 50.6%
Senior Rounds 8,693 7,972 7,061 7,797 7,460 38,983
% Rounds 33.0% 33.0% 33.0% 33.0% 33.0%
Other Rounds 4,341 3,981 3,526 3,894 3,725 19,468
% Rounds 16.5% 16.5% 16.5% 16.5% 16.5%
Avg Patron Rate $23.37 $24.77 $24.77 $26.26 $26.26
Avg Regular Rate $21.30 $22.58 $22.58 $23.93 $23.93
Avg Senior Rate $20.50 $21.73 $21.73 $23.03 $23.03
Avg Other Rate $14.67 $15.55 $15.55 $16.48 $16.48
Total Patron $26,642 $56,481 $55,539 $57,375 $56,377 $252,414
Total Regular $284,063 $276,160 $244,593 $286,287 $273,899 $1,365,001
Total Senior $178,198 $173,240 $153,438 $179,593 $171,822 $856,291
Total Other $63,673 $61,902 $54,826 $64,172 $61,395 $305,967
Total Green Fees $552,575 $567,782 $508,396 $587,427 $563,493 $2,779,672
Cart Feesavg rate $7.40 $7.84 $7.84 $8.31 $8.31
Total Cart Fees $220,890 $225,948 $203,354 $233,641 $225,464 $1,109,297
Rangeavg rate $1.30 $1.34 $1.38 $1.42 $1.46
Total Range $38,706 $38,472 $35,663 $39,815 $39,574 $192,231

Ramsey County Golf Study Appendix J: Cash Flow Projections
Sirius Golf Advisors, LLC 485
Manitou Status Quo2024 2025 2026 2027 2028 Total 24-28 Total 19-28
Rounds 27,476 25,003 25,944 23,350 24,786 126,558 266,354
RevenuePasses
Regular $3,328 $3,527 $3,527 $3,739 $3,739 $17,860 $28,497
Quantity 2 2 2 2 2
Unit $1,664 $1,764 $1,764 $1,869 $1,869 $8,930 $8,930
Senior $34,607 $36,684 $35,273 $35,893 $35,893 $178,350 $341,349
Quantity 26 26 25 24 24
Unit $1,331 $1,411 $1,411 $1,496 $1,496 $7,144 $7,144
Junior $444 $470 $470 $499 $499 $2,381 $4,381
Quantity 1 1 1 1 1
Unit $444 $470 $470 $499 $499 $2,381 $2,381
Total Passes $38,378 $40,681 $39,270 $40,131 $40,131 $198,592 $374,227
Patron CardResident
Regular $3,105 $3,233 $3,204 $3,365 $3,533 $16,440 $29,674
Quantity 112 110 109 108 107
Unit $28 $29 $29 $31 $33
Total Patron Cards $3,105 $3,233 $3,204 $3,365 $3,533 $16,440 $29,674
Green FeePass Rounds 2,262 2,262 2,184 2,106 2,106 10,920 22,464
rnds/pass 78.00 78.00 78.00 78.00 78.00
% Rounds
Patron Rounds 2,128 2,090 2,071 2,052 2,033 10,374 20,368
rnds/patron 19.00 19.00 19.00 19.00 19.00
% Rounds
Regular Rounds 11,675 10,444 10,969 9,706 10,442 53,236 113,043
% Rounds 50.6% 50.6% 50.6% 50.6% 50.6%
Senior Rounds 7,610 6,807 7,150 6,326 6,806 34,699 73,682
% Rounds 33.0% 33.0% 33.0% 33.0% 33.0%
Other Rounds 3,800 3,400 3,571 3,159 3,399 17,329 36,797
% Rounds 16.5% 16.5% 16.5% 16.5% 16.5%
Avg Patron Rate $24.95 $24.95 $23.70 $23.70 $23.70
Avg Regular Rate $22.74 $22.74 $21.60 $21.60 $21.60
Avg Senior Rate $21.88 $21.88 $20.79 $20.79 $20.79
Avg Other Rate $15.66 $14.87 $14.13 $13.42 $12.75
Total Patron $53,084 $52,136 $49,079 $48,629 $48,179 $251,107 $503,521
Total Regular $265,451 $237,454 $236,920 $209,639 $225,533 $1,174,997 $2,539,998
Total Senior $166,522 $148,959 $148,624 $131,511 $141,481 $737,098 $1,593,388
Total Other $59,501 $50,564 $50,451 $42,409 $43,343 $246,269 $552,235
Total Green Fees $544,558 $489,114 $485,074 $432,188 $458,536 $2,409,471 $5,189,143
Cart Feesavg rate $8.81 $9.34 $9.34 $9.90 $9.90
Total Cart Fees $242,158 $233,586 $242,377 $231,228 $245,448 $1,194,797 $2,304,094
Rangeavg rate $1.50 $1.55 $1.59 $1.64 $1.69
Total Range $41,302 $38,712 $41,374 $38,354 $41,934 $201,676 $393,907

Ramsey County Golf Study Appendix J: Cash Flow Projections
Sirius Golf Advisors, LLC 486
Manitou Status Quo2019 2020 2021 2022 2023 Total 19-23
Merchandiseavg rate $3.08 $3.18 $3.27 $3.37 $3.47
Total Merchandise $92,039 $91,482 $84,804 $94,677 $94,105 $457,108
Food & BeverageGolf $189,392 $188,246 $174,504 $194,821 $193,642 $940,607
avg rate $6.34 $6.54 $6.73 $6.93 $7.14
Total F&B $189,392 $188,246 $174,504 $194,821 $193,642 $940,607
Total Revenue $1,128,061 $1,149,937 $1,043,493 $1,189,282 $1,157,010 $5,667,783
County CompensationGreen Fee total rev $587,033 $605,788 $545,168 $626,327 $604,224 $2,968,541
Breakpoint $850,000 $850,000 $850,000 $850,000 $850,000
% Up to breakpt 13% 13% 13% 13% 13%
% Over breakpt 13% 13% 13% 13% 13%
Total Comp $76,314 $78,752 $70,872 $81,423 $78,549 $385,910
Cart Fee total rev $220,890 $225,948 $203,354 $233,641 $225,464 $1,109,297
Breakpoint $200,000 $200,000 $200,000 $200,000 $200,000
% Up to breakpt 13% 13% 13% 13% 13%
% Over breakpt 13% 13% 13% 13% 13%
Total Comp $28,716 $29,373 $26,436 $30,373 $29,310 $144,209
Range $38,706 $38,472 $35,663 $39,815 $39,574 $192,231
Breakpoint $40,000 $40,000 $40,000 $40,000 $40,000
% Up to breakpt 13% 13% 13% 13% 13%
% Over breakpt 13% 13% 13% 13% 13%
Total Comp $5,032 $5,001 $4,636 $5,176 $5,145 $24,990
Food & Beverage $189,392 $188,246 $174,504 $194,821 $193,642 $940,607
% F&B 13% 13% 13% 13% 13%
Total Comp $24,621 $24,472 $22,686 $25,327 $25,174 $122,279
Merchandise $92,039 $91,482 $84,804 $94,677 $94,105 $457,108
Breakpoint $50,000 $50,000 $50,000 $50,000 $50,000 $250,000
% Up to breakpt 13% 13% 13% 13% 13%
% Over breakpt 13% 13% 13% 13% 13%
Total Comp $11,965 $11,893 $11,025 $12,308 $12,234 $59,424
County Share $146,648 $149,492 $135,654 $154,607 $150,411 $736,812
Expenses Personnel Services $0 $0 $0 $0 $0 $0
Other Services & Charges $6,866 $7,072 $7,284 $7,503 $7,728 $36,452
Supplies $373 $384 $396 $407 $420 $1,980
Capital Outlay $0 $0 $0 $0 $0 $0
Total Expenses $7,239 $7,456 $7,680 $7,910 $8,147 $38,432
Net Income $139,409 $142,036 $127,974 $146,697 $142,264 $698,380
Operator Revenue $981,413 $1,000,445 $907,839 $1,034,676 $1,006,599 $4,930,972
less Cost of Sales $142,025 $141,166 $130,861 $146,096 $145,212 $705,360
Net Operator $839,388 $859,280 $776,979 $888,579 $861,386 $4,225,611
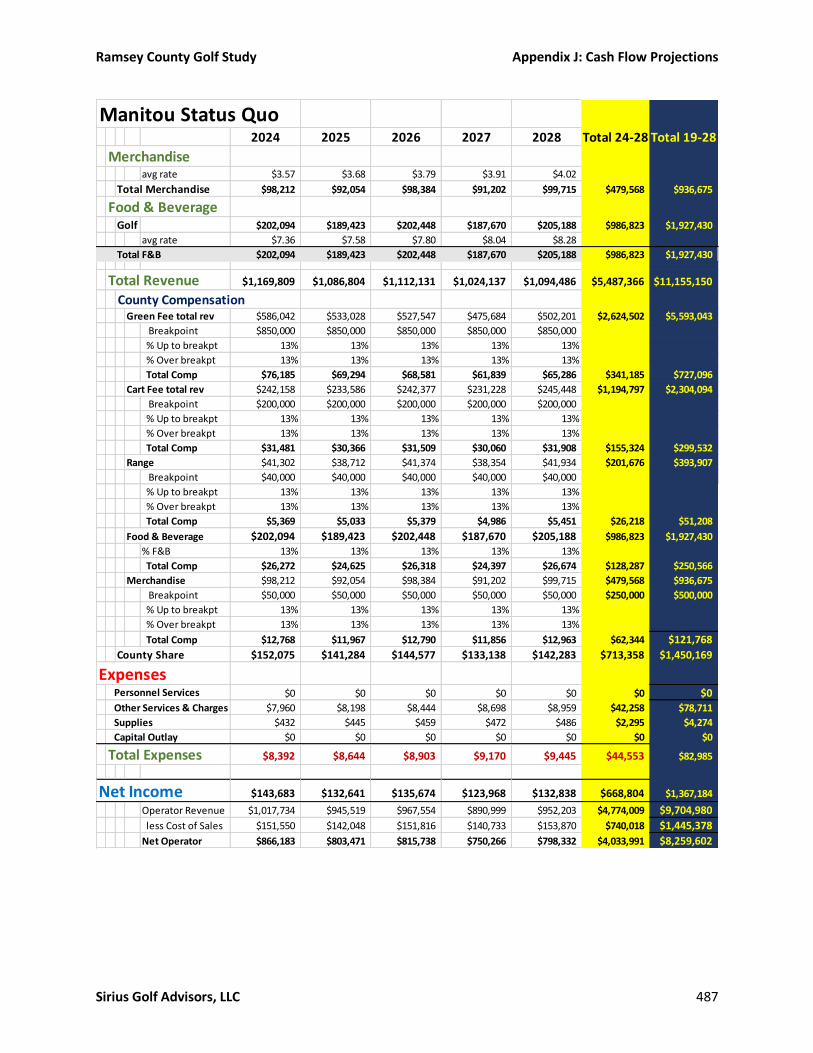
Ramsey County Golf Study Appendix J: Cash Flow Projections
Sirius Golf Advisors, LLC 487
Manitou Status Quo2024 2025 2026 2027 2028 Total 24-28 Total 19-28
Merchandiseavg rate $3.57 $3.68 $3.79 $3.91 $4.02
Total Merchandise $98,212 $92,054 $98,384 $91,202 $99,715 $479,568 $936,675
Food & BeverageGolf $202,094 $189,423 $202,448 $187,670 $205,188 $986,823 $1,927,430
avg rate $7.36 $7.58 $7.80 $8.04 $8.28
Total F&B $202,094 $189,423 $202,448 $187,670 $205,188 $986,823 $1,927,430
Total Revenue $1,169,809 $1,086,804 $1,112,131 $1,024,137 $1,094,486 $5,487,366 $11,155,150
County CompensationGreen Fee total rev $586,042 $533,028 $527,547 $475,684 $502,201 $2,624,502 $5,593,043
Breakpoint $850,000 $850,000 $850,000 $850,000 $850,000
% Up to breakpt 13% 13% 13% 13% 13%
% Over breakpt 13% 13% 13% 13% 13%
Total Comp $76,185 $69,294 $68,581 $61,839 $65,286 $341,185 $727,096
Cart Fee total rev $242,158 $233,586 $242,377 $231,228 $245,448 $1,194,797 $2,304,094
Breakpoint $200,000 $200,000 $200,000 $200,000 $200,000
% Up to breakpt 13% 13% 13% 13% 13%
% Over breakpt 13% 13% 13% 13% 13%
Total Comp $31,481 $30,366 $31,509 $30,060 $31,908 $155,324 $299,532
Range $41,302 $38,712 $41,374 $38,354 $41,934 $201,676 $393,907
Breakpoint $40,000 $40,000 $40,000 $40,000 $40,000
% Up to breakpt 13% 13% 13% 13% 13%
% Over breakpt 13% 13% 13% 13% 13%
Total Comp $5,369 $5,033 $5,379 $4,986 $5,451 $26,218 $51,208
Food & Beverage $202,094 $189,423 $202,448 $187,670 $205,188 $986,823 $1,927,430
% F&B 13% 13% 13% 13% 13%
Total Comp $26,272 $24,625 $26,318 $24,397 $26,674 $128,287 $250,566
Merchandise $98,212 $92,054 $98,384 $91,202 $99,715 $479,568 $936,675
Breakpoint $50,000 $50,000 $50,000 $50,000 $50,000 $250,000 $500,000
% Up to breakpt 13% 13% 13% 13% 13%
% Over breakpt 13% 13% 13% 13% 13%
Total Comp $12,768 $11,967 $12,790 $11,856 $12,963 $62,344 $121,768
County Share $152,075 $141,284 $144,577 $133,138 $142,283 $713,358 $1,450,169
Expenses Personnel Services $0 $0 $0 $0 $0 $0 $0 Other Services & Charges $7,960 $8,198 $8,444 $8,698 $8,959 $42,258 $78,711
Supplies $432 $445 $459 $472 $486 $2,295 $4,274
Capital Outlay $0 $0 $0 $0 $0 $0 $0
Total Expenses $8,392 $8,644 $8,903 $9,170 $9,445 $44,553 $82,985
Net Income $143,683 $132,641 $135,674 $123,968 $132,838 $668,804 $1,367,184
Operator Revenue $1,017,734 $945,519 $967,554 $890,999 $952,203 $4,774,009 $9,704,980
less Cost of Sales $151,550 $142,048 $151,816 $140,733 $153,870 $740,018 $1,445,378
Net Operator $866,183 $803,471 $815,738 $750,266 $798,332 $4,033,991 $8,259,602

Ramsey County Golf Study Appendix J: Cash Flow Projections
Sirius Golf Advisors, LLC 488
Scenario 1: Priority Fixes
Manitou Irrigation and Bunkers2019 2020 2021 2022 2023 Total 19-23
Rounds 31,500 32,130 19,000 33,500 34,003 150,133 Bui ld Temp
Hole
Irrigation,
Bunkers
RevenuePasses
Regular $5,884 $7,613 $9,135 $11,031 $13,048 $46,710
Quantity 4.0 5 6 7 8
Unit $1,471 $1,523 $1,523 $1,576 $1,631
Senior $14,615 $16,207 $17,288 $19,011 $20,834 $87,956
Quantity 14 15 16 17 18
Unit $1,044 $1,080 $1,080 $1,118 $1,157
Junior $759 $786 $786 $813 $842 $3,986
Quantity 2 2 2 2 2
Unit $380 $393 $393 $407 $421
Weekday Regular $5,457 $5,648 $6,778 $7,015 $7,260 $32,158
Quantity 5 5 6 6 6
Unit $1,091.40 $1,130 $1,130 $1,169 $1,210
Weekday Senior $25,055 $26,742 $27,552 $15,936 $17,362 $112,647
Quantity 32 33 34 19 20
Unit $782.96 $810 $810 $839 $868
Total Passes 57 60 64 51 54
Total Passes $51,770 $56,996 $61,539 $53,806 $59,345 $283,456
Patron CardResident
Regular $380 $393 $407 $421 $436 $2,036
Quantity 10 10 10 10 10
Unit $37.96 $39.29 $40.67 $42.09 $43.56
Senior $341.66 $353.61 $365.99 $378.80 $392.06 $1,832.12
Quantity 12 12 12 12 12
Unit $28.47 $29.47 $30.50 $31.57 $32.67
Premium $427.07 $442.02 $457.49 $473.50 $490.07 $2,290.15
Quantity 5 5 5 5 5
Unit $85.41 $88.40 $91.50 $94.70 $98.01
Premium Senior $531.47 $550.07 $569.32 $589.25 $609.87 $2,849.97
Quantity 8 8 8 8 8
Unit $66.43 $68.76 $71.16 $73.66 $76.23
Non-Resident
Regular $237.26 $245.57 $254.16 $263.06 $272.26 $1,272.31
Quantity 5 5 5 5 5
Unit $47.45 $49.11 $50.83 $52.61 $54.45
Senior $455.54 $471.49 $487.99 $505.07 $522.75 $2,442.83
Quantity 12 12 12 12 12
Unit $37.96 $39.29 $40.67 $42.09 $43.56
Premium $284.71 $884.04 $1,219.97 $1,367.89 $1,633.58 $5,390.19
Quantity 3 9 12 13 15
Unit $94.90 $98.23 $101.66 $105.22 $108.91
Premium Senior $303.69 $1,414.46 $1,626.63 $1,767.74 $1,916.73 $7,029.25
Quantity 4 18 20 21 22
Unit $75.92 $78.58 $81.33 $84.18 $87.12
Total quantity 59 79 84 86 89
Total Patron Cards $2,961 $4,754 $5,388 $5,766 $6,273 $25,143
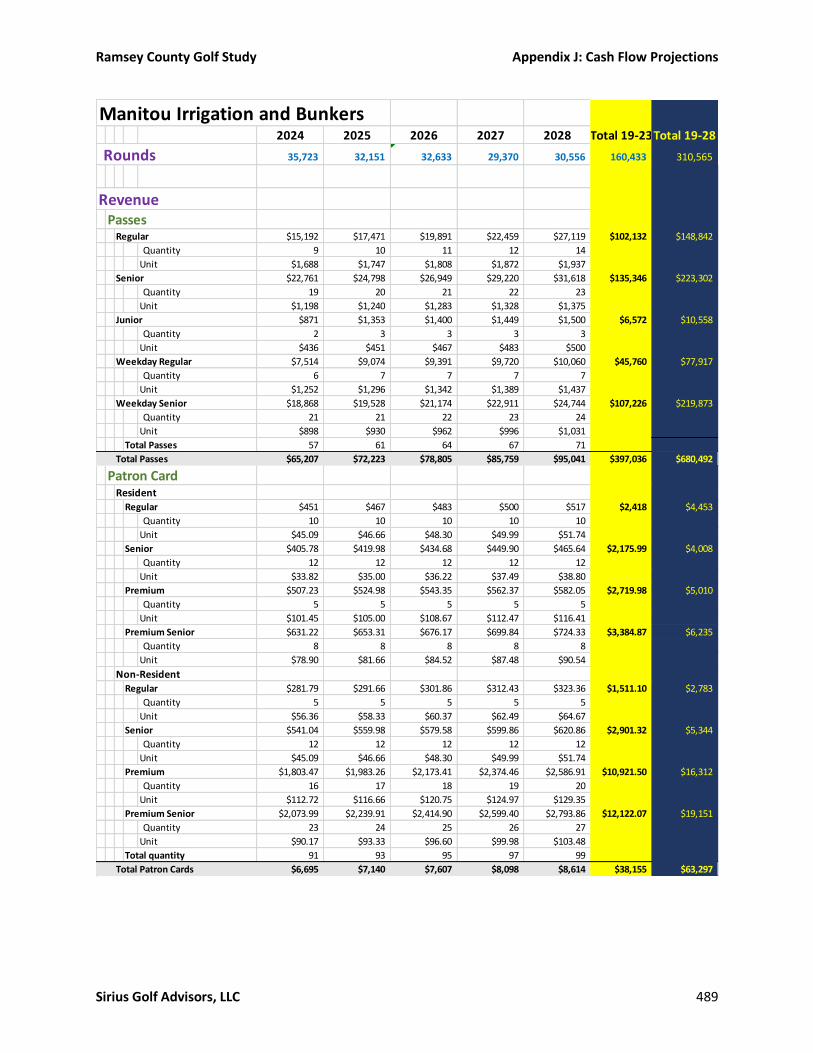
Ramsey County Golf Study Appendix J: Cash Flow Projections
Sirius Golf Advisors, LLC 489
Manitou Irrigation and Bunkers2024 2025 2026 2027 2028 Total 19-23Total 19-28
Rounds 35,723 32,151 32,633 29,370 30,556 160,433 310,565
RevenuePasses
Regular $15,192 $17,471 $19,891 $22,459 $27,119 $102,132 $148,842
Quantity 9 10 11 12 14
Unit $1,688 $1,747 $1,808 $1,872 $1,937
Senior $22,761 $24,798 $26,949 $29,220 $31,618 $135,346 $223,302
Quantity 19 20 21 22 23
Unit $1,198 $1,240 $1,283 $1,328 $1,375
Junior $871 $1,353 $1,400 $1,449 $1,500 $6,572 $10,558
Quantity 2 3 3 3 3
Unit $436 $451 $467 $483 $500
Weekday Regular $7,514 $9,074 $9,391 $9,720 $10,060 $45,760 $77,917
Quantity 6 7 7 7 7
Unit $1,252 $1,296 $1,342 $1,389 $1,437
Weekday Senior $18,868 $19,528 $21,174 $22,911 $24,744 $107,226 $219,873
Quantity 21 21 22 23 24
Unit $898 $930 $962 $996 $1,031
Total Passes 57 61 64 67 71
Total Passes $65,207 $72,223 $78,805 $85,759 $95,041 $397,036 $680,492
Patron CardResident
Regular $451 $467 $483 $500 $517 $2,418 $4,453
Quantity 10 10 10 10 10
Unit $45.09 $46.66 $48.30 $49.99 $51.74
Senior $405.78 $419.98 $434.68 $449.90 $465.64 $2,175.99 $4,008
Quantity 12 12 12 12 12
Unit $33.82 $35.00 $36.22 $37.49 $38.80
Premium $507.23 $524.98 $543.35 $562.37 $582.05 $2,719.98 $5,010
Quantity 5 5 5 5 5
Unit $101.45 $105.00 $108.67 $112.47 $116.41
Premium Senior $631.22 $653.31 $676.17 $699.84 $724.33 $3,384.87 $6,235
Quantity 8 8 8 8 8
Unit $78.90 $81.66 $84.52 $87.48 $90.54
Non-Resident
Regular $281.79 $291.66 $301.86 $312.43 $323.36 $1,511.10 $2,783
Quantity 5 5 5 5 5
Unit $56.36 $58.33 $60.37 $62.49 $64.67
Senior $541.04 $559.98 $579.58 $599.86 $620.86 $2,901.32 $5,344
Quantity 12 12 12 12 12
Unit $45.09 $46.66 $48.30 $49.99 $51.74
Premium $1,803.47 $1,983.26 $2,173.41 $2,374.46 $2,586.91 $10,921.50 $16,312
Quantity 16 17 18 19 20
Unit $112.72 $116.66 $120.75 $124.97 $129.35
Premium Senior $2,073.99 $2,239.91 $2,414.90 $2,599.40 $2,793.86 $12,122.07 $19,151
Quantity 23 24 25 26 27
Unit $90.17 $93.33 $96.60 $99.98 $103.48
Total quantity 91 93 95 97 99
Total Patron Cards $6,695 $7,140 $7,607 $8,098 $8,614 $38,155 $63,297

Ramsey County Golf Study Appendix J: Cash Flow Projections
Sirius Golf Advisors, LLC 490
Manitou Scenario 1: Priority Fixes2019 2020 2021 2022 2023 Total 19-23
Green FeePass Rounds 3,534 3,720 3,968 3,162 3,348 17,732
rnds/pass 62.00 62.00 62.00 62.00 62.00
Patron Rounds 1,180 1,580 1,680 1,720 1,780 7,940
rnds/patron 20.00 20.00 20.00 20.00 20.00
Regular Rounds 13,661 13,683 6,810 14,595 14,726 63,475
% Rounds 51.0% 51.0% 51.0% 51.0% 51.0%
Senior Rounds 8,839 8,854 4,406 9,444 9,529 41,072
% Rounds 33.0% 33.0% 33.0% 33.0% 33.0%
Other Rounds 4,286 4,293 2,136 4,579 4,620 19,914
% Rounds 16.0% 16.0% 16.0% 16.0% 16.0%
Avg Patron Rate $23.50 $24.32 $25.17 $26.05 $26.97
Avg Regular Rate $21.50 $22.25 $23.03 $23.84 $24.67
Avg Senior Rate $20.60 $21.32 $22.07 $22.84 $23.64
Avg Other Rate $16.00 $16.56 $17.14 $17.74 $18.36
Total Patron $27,730 $38,430 $42,292 $44,814 $48,001 $201,267
Total Regular $293,708 $304,488 $156,832 $347,912 $363,316 $1,466,256
Total Senior $182,091 $188,774 $97,232 $215,696 $225,246 $909,039
Total Other $68,572 $71,089 $36,616 $81,227 $84,823 $342,327
Total Green Fees $572,102 $602,780 $332,972 $689,649 $721,386 $2,918,889
Cart Feesavg rate $7.50 $7.76 $7.76 $8.03 $8.32
Total Cart Fees $236,250 $249,409 $147,488 $269,145 $282,744 $1,185,036
Rangeavg rate $1.35 $1.40 $0.50 $2.75 $2.85
Total Range $42,525 $44,894 $9,500 $92,125 $96,780 $285,823
Merchandiseavg rate $3.50 $3.62 $3.75 $3.88 $4.02
Total Merchandise $110,250 $116,391 $71,236 $129,997 $136,565 $564,440
Food & BeverageGolf $211,050 $222,805 $136,367 $248,852 $261,425 $1,080,499
avg rate $6.70 $6.93 $7.18 $7.43 $7.69
Total F&B $211,050 $222,805 $136,367 $248,852 $261,425 $1,080,499
Total Revenue $1,226,908 $1,298,029 $764,490 $1,489,340 $1,564,518 $6,343,285
Cost of SalesFood and Beverage $84,420 $89,122 $54,547 $99,541 $104,570 $432,200
Merchandise $79,380 $83,801 $51,290 $93,598 $98,327 $406,397
Total Cost of Sales $163,800 $172,924 $105,837 $193,139 $202,897 $838,596
Gross Revenue $1,063,108 $1,125,105 $658,653 $1,296,201 $1,361,621 $5,504,689
County CompensationBreakpoint $1,000,000 $1,030,000
% below breakpoint 13% 13% 5% 10% 10%
% above breakpoint 13% 13% 5% 75% 75%
County Share $159,498 $168,744 $38,224 $322,151 $351,716 $1,040,333
Expenses Personnel Services $0 $0 $0 $0 $0 $0
Other Services & Charges $6,866 $7,072 $7,284 $7,503 $7,728 $36,452
Supplement $100,000
Supplies $373 $384 $396 $407 $420 $1,980
Marketing $3,987 $4,219 $956 $8,054 $8,793 $26,008
Total Expenses $11,226 $11,675 $108,635 $15,964 $16,940 $164,440
Net Income $148,272 $157,069 ($70,411) $306,187 $334,776 $875,893
Difference to Status Quo $8,863 $15,033 ($198,385) $159,490 $192,512 $177,513
Operator Revenue $903,610 $956,362 $720,428 $974,050 $1,009,905 $4,464,356
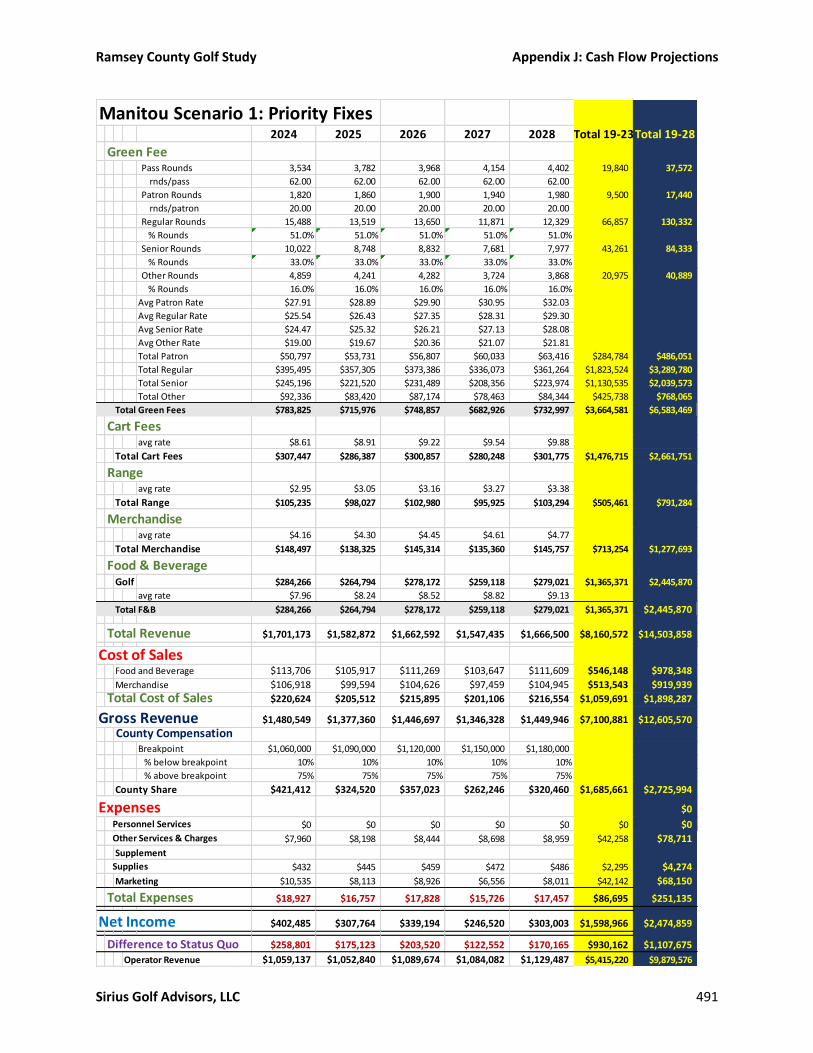
Ramsey County Golf Study Appendix J: Cash Flow Projections
Sirius Golf Advisors, LLC 491
Manitou Scenario 1: Priority Fixes2024 2025 2026 2027 2028 Total 19-23Total 19-28
Green FeePass Rounds 3,534 3,782 3,968 4,154 4,402 19,840 37,572
rnds/pass 62.00 62.00 62.00 62.00 62.00
Patron Rounds 1,820 1,860 1,900 1,940 1,980 9,500 17,440
rnds/patron 20.00 20.00 20.00 20.00 20.00
Regular Rounds 15,488 13,519 13,650 11,871 12,329 66,857 130,332
% Rounds 51.0% 51.0% 51.0% 51.0% 51.0%
Senior Rounds 10,022 8,748 8,832 7,681 7,977 43,261 84,333
% Rounds 33.0% 33.0% 33.0% 33.0% 33.0%
Other Rounds 4,859 4,241 4,282 3,724 3,868 20,975 40,889
% Rounds 16.0% 16.0% 16.0% 16.0% 16.0%
Avg Patron Rate $27.91 $28.89 $29.90 $30.95 $32.03
Avg Regular Rate $25.54 $26.43 $27.35 $28.31 $29.30
Avg Senior Rate $24.47 $25.32 $26.21 $27.13 $28.08
Avg Other Rate $19.00 $19.67 $20.36 $21.07 $21.81
Total Patron $50,797 $53,731 $56,807 $60,033 $63,416 $284,784 $486,051
Total Regular $395,495 $357,305 $373,386 $336,073 $361,264 $1,823,524 $3,289,780
Total Senior $245,196 $221,520 $231,489 $208,356 $223,974 $1,130,535 $2,039,573
Total Other $92,336 $83,420 $87,174 $78,463 $84,344 $425,738 $768,065
Total Green Fees $783,825 $715,976 $748,857 $682,926 $732,997 $3,664,581 $6,583,469
Cart Feesavg rate $8.61 $8.91 $9.22 $9.54 $9.88
Total Cart Fees $307,447 $286,387 $300,857 $280,248 $301,775 $1,476,715 $2,661,751
Rangeavg rate $2.95 $3.05 $3.16 $3.27 $3.38
Total Range $105,235 $98,027 $102,980 $95,925 $103,294 $505,461 $791,284
Merchandiseavg rate $4.16 $4.30 $4.45 $4.61 $4.77
Total Merchandise $148,497 $138,325 $145,314 $135,360 $145,757 $713,254 $1,277,693
Food & BeverageGolf $284,266 $264,794 $278,172 $259,118 $279,021 $1,365,371 $2,445,870
avg rate $7.96 $8.24 $8.52 $8.82 $9.13
Total F&B $284,266 $264,794 $278,172 $259,118 $279,021 $1,365,371 $2,445,870
Total Revenue $1,701,173 $1,582,872 $1,662,592 $1,547,435 $1,666,500 $8,160,572 $14,503,858
Cost of SalesFood and Beverage $113,706 $105,917 $111,269 $103,647 $111,609 $546,148 $978,348
Merchandise $106,918 $99,594 $104,626 $97,459 $104,945 $513,543 $919,939
Total Cost of Sales $220,624 $205,512 $215,895 $201,106 $216,554 $1,059,691 $1,898,287
Gross Revenue $1,480,549 $1,377,360 $1,446,697 $1,346,328 $1,449,946 $7,100,881 $12,605,570
County CompensationBreakpoint $1,060,000 $1,090,000 $1,120,000 $1,150,000 $1,180,000
% below breakpoint 10% 10% 10% 10% 10%
% above breakpoint 75% 75% 75% 75% 75%
County Share $421,412 $324,520 $357,023 $262,246 $320,460 $1,685,661 $2,725,994
Expenses $0
Personnel Services $0 $0 $0 $0 $0 $0 $0 Other Services & Charges $7,960 $8,198 $8,444 $8,698 $8,959 $42,258 $78,711
Supplement
Supplies $432 $445 $459 $472 $486 $2,295 $4,274
Marketing $10,535 $8,113 $8,926 $6,556 $8,011 $42,142 $68,150
Total Expenses $18,927 $16,757 $17,828 $15,726 $17,457 $86,695 $251,135
Net Income $402,485 $307,764 $339,194 $246,520 $303,003 $1,598,966 $2,474,859
Difference to Status Quo $258,801 $175,123 $203,520 $122,552 $170,165 $930,162 $1,107,675
Operator Revenue $1,059,137 $1,052,840 $1,089,674 $1,084,082 $1,129,487 $5,415,220 $9,879,576

Ramsey County Golf Study Appendix J: Cash Flow Projections
Sirius Golf Advisors, LLC 492
Scenario 2: Major Renovation
Manitou Major Renovation2019 2020 2021 2022 2023 Total 19-23
Rounds 31,500 32,130 17,350 19,467 24,500 124,947 First 9 2nd 9 Reopening
RevenuePasses
Regular $5,884 $5,709 $7,091 $8,562 $14,811 $42,058
Quantity 4.0 5 6 7 8
Unit $1,471 $1,142 $1,182 $1,223 $1,851
Senior $14,615 $12,156 $13,420 $14,757 $24,994 $79,942
Quantity 14 15 16 17 18
Unit $1,044 $810 $839 $868 $1,389
Junior $759 $589 $610 $631 $926 $3,516
Quantity 2 2 2 2 2
Unit $380 $295 $305 $316 $463
Weekday Regular $5,457 $4,236 $5,261 $5,445 $8,331 $28,731
Quantity 5 5 6 6 6
Unit $1,091.40 $847 $877 $908 $1,389
Weekday Senior $25,055 $20,057 $21,388 $12,370 $20,828 $99,697
Quantity 32 33 34 19 20
Unit $782.96 $608 $629 $651 $1,041
Total Passes 57 60 64 51 54
Total Passes $51,770 $42,747 $47,769 $41,767 $69,890 $253,944
Patron CardResident
Regular $380 $393 $407 $421 $436 $2,036
Quantity 10 10 10 10 10
Unit $37.96 $39.29 $40.67 $42.09 $43.56
Senior $341.66 $353.61 $365.99 $378.80 $392.06 $1,832.12
Quantity 12 12 12 12 12
Unit $28.47 $29.47 $30.50 $31.57 $32.67
Premium $427.07 $442.02 $457.49 $473.50 $490.07 $2,290.15
Quantity 5 5 5 5 5
Unit $85.41 $88.40 $91.50 $94.70 $98.01
Premium Senior $531.47 $550.07 $569.32 $589.25 $609.87 $2,849.97
Quantity 8 8 8 8 8
Unit $66.43 $68.76 $71.16 $73.66 $76.23
Non-ResidentRegular $237.26 $245.57 $254.16 $263.06 $272.26 $1,272.31
Quantity 5 5 5 5 5
Unit $47.45 $49.11 $50.83 $52.61 $54.45
Senior $455.54 $471.49 $487.99 $505.07 $522.75 $2,442.83
Quantity 12 12 12 12 12
Unit $37.96 $39.29 $40.67 $42.09 $43.56
Premium $284.71 $884.04 $1,219.97 $1,367.89 $1,633.58 $5,390.19
Quantity 3 9 12 13 15
Unit $94.90 $98.23 $101.66 $105.22 $108.91
Premium Senior $303.69 $1,414.46 $1,626.63 $1,767.74 $1,916.73 $7,029.25
Quantity 4 18 20 21 22
Unit $75.92 $78.58 $81.33 $84.18 $87.12
Total quantity 59 79 84 86 89
Total Patron Cards $2,961 $4,754 $5,388 $5,766 $6,273 $25,143
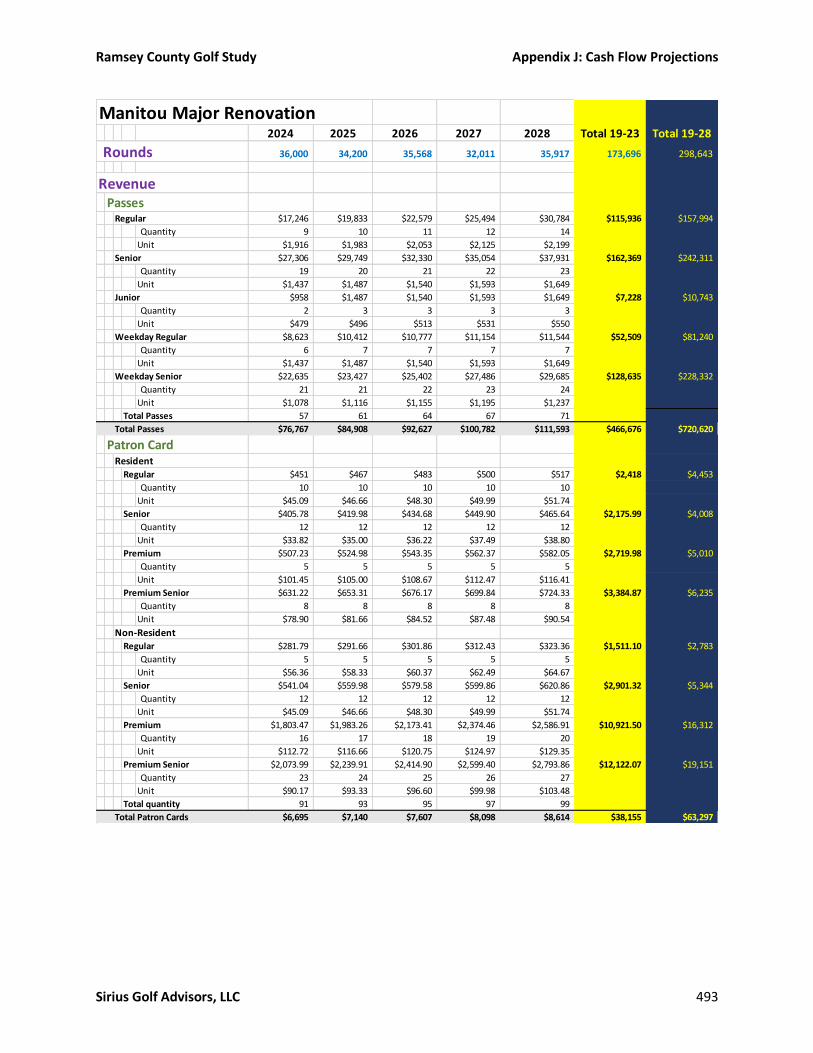
Ramsey County Golf Study Appendix J: Cash Flow Projections
Sirius Golf Advisors, LLC 493
Manitou Major Renovation2024 2025 2026 2027 2028 Total 19-23 Total 19-28
Rounds 36,000 34,200 35,568 32,011 35,917 173,696 298,643
RevenuePasses
Regular $17,246 $19,833 $22,579 $25,494 $30,784 $115,936 $157,994
Quantity 9 10 11 12 14
Unit $1,916 $1,983 $2,053 $2,125 $2,199
Senior $27,306 $29,749 $32,330 $35,054 $37,931 $162,369 $242,311
Quantity 19 20 21 22 23
Unit $1,437 $1,487 $1,540 $1,593 $1,649
Junior $958 $1,487 $1,540 $1,593 $1,649 $7,228 $10,743
Quantity 2 3 3 3 3
Unit $479 $496 $513 $531 $550
Weekday Regular $8,623 $10,412 $10,777 $11,154 $11,544 $52,509 $81,240
Quantity 6 7 7 7 7
Unit $1,437 $1,487 $1,540 $1,593 $1,649
Weekday Senior $22,635 $23,427 $25,402 $27,486 $29,685 $128,635 $228,332
Quantity 21 21 22 23 24
Unit $1,078 $1,116 $1,155 $1,195 $1,237
Total Passes 57 61 64 67 71
Total Passes $76,767 $84,908 $92,627 $100,782 $111,593 $466,676 $720,620
Patron CardResident
Regular $451 $467 $483 $500 $517 $2,418 $4,453
Quantity 10 10 10 10 10
Unit $45.09 $46.66 $48.30 $49.99 $51.74
Senior $405.78 $419.98 $434.68 $449.90 $465.64 $2,175.99 $4,008
Quantity 12 12 12 12 12
Unit $33.82 $35.00 $36.22 $37.49 $38.80
Premium $507.23 $524.98 $543.35 $562.37 $582.05 $2,719.98 $5,010
Quantity 5 5 5 5 5
Unit $101.45 $105.00 $108.67 $112.47 $116.41
Premium Senior $631.22 $653.31 $676.17 $699.84 $724.33 $3,384.87 $6,235
Quantity 8 8 8 8 8
Unit $78.90 $81.66 $84.52 $87.48 $90.54
Non-ResidentRegular $281.79 $291.66 $301.86 $312.43 $323.36 $1,511.10 $2,783
Quantity 5 5 5 5 5
Unit $56.36 $58.33 $60.37 $62.49 $64.67
Senior $541.04 $559.98 $579.58 $599.86 $620.86 $2,901.32 $5,344
Quantity 12 12 12 12 12
Unit $45.09 $46.66 $48.30 $49.99 $51.74
Premium $1,803.47 $1,983.26 $2,173.41 $2,374.46 $2,586.91 $10,921.50 $16,312
Quantity 16 17 18 19 20
Unit $112.72 $116.66 $120.75 $124.97 $129.35
Premium Senior $2,073.99 $2,239.91 $2,414.90 $2,599.40 $2,793.86 $12,122.07 $19,151
Quantity 23 24 25 26 27
Unit $90.17 $93.33 $96.60 $99.98 $103.48
Total quantity 91 93 95 97 99
Total Patron Cards $6,695 $7,140 $7,607 $8,098 $8,614 $38,155 $63,297
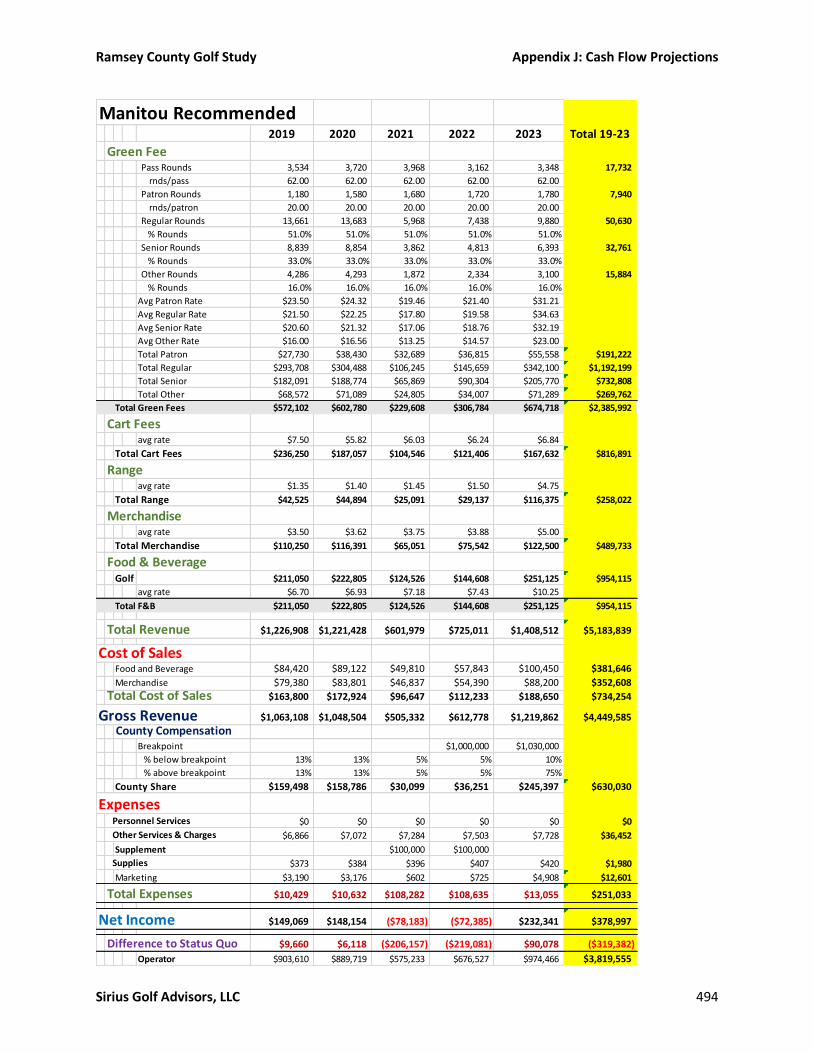
Ramsey County Golf Study Appendix J: Cash Flow Projections
Sirius Golf Advisors, LLC 494
Manitou Recommended2019 2020 2021 2022 2023 Total 19-23
Green FeePass Rounds 3,534 3,720 3,968 3,162 3,348 17,732
rnds/pass 62.00 62.00 62.00 62.00 62.00
Patron Rounds 1,180 1,580 1,680 1,720 1,780 7,940
rnds/patron 20.00 20.00 20.00 20.00 20.00
Regular Rounds 13,661 13,683 5,968 7,438 9,880 50,630
% Rounds 51.0% 51.0% 51.0% 51.0% 51.0%
Senior Rounds 8,839 8,854 3,862 4,813 6,393 32,761
% Rounds 33.0% 33.0% 33.0% 33.0% 33.0%
Other Rounds 4,286 4,293 1,872 2,334 3,100 15,884
% Rounds 16.0% 16.0% 16.0% 16.0% 16.0%
Avg Patron Rate $23.50 $24.32 $19.46 $21.40 $31.21
Avg Regular Rate $21.50 $22.25 $17.80 $19.58 $34.63
Avg Senior Rate $20.60 $21.32 $17.06 $18.76 $32.19
Avg Other Rate $16.00 $16.56 $13.25 $14.57 $23.00
Total Patron $27,730 $38,430 $32,689 $36,815 $55,558 $191,222
Total Regular $293,708 $304,488 $106,245 $145,659 $342,100 $1,192,199
Total Senior $182,091 $188,774 $65,869 $90,304 $205,770 $732,808
Total Other $68,572 $71,089 $24,805 $34,007 $71,289 $269,762
Total Green Fees $572,102 $602,780 $229,608 $306,784 $674,718 $2,385,992
Cart Feesavg rate $7.50 $5.82 $6.03 $6.24 $6.84
Total Cart Fees $236,250 $187,057 $104,546 $121,406 $167,632 $816,891
Rangeavg rate $1.35 $1.40 $1.45 $1.50 $4.75
Total Range $42,525 $44,894 $25,091 $29,137 $116,375 $258,022
Merchandiseavg rate $3.50 $3.62 $3.75 $3.88 $5.00
Total Merchandise $110,250 $116,391 $65,051 $75,542 $122,500 $489,733
Food & BeverageGolf $211,050 $222,805 $124,526 $144,608 $251,125 $954,115
avg rate $6.70 $6.93 $7.18 $7.43 $10.25
Total F&B $211,050 $222,805 $124,526 $144,608 $251,125 $954,115
Total Revenue $1,226,908 $1,221,428 $601,979 $725,011 $1,408,512 $5,183,839
Cost of SalesFood and Beverage $84,420 $89,122 $49,810 $57,843 $100,450 $381,646
Merchandise $79,380 $83,801 $46,837 $54,390 $88,200 $352,608
Total Cost of Sales $163,800 $172,924 $96,647 $112,233 $188,650 $734,254
Gross Revenue $1,063,108 $1,048,504 $505,332 $612,778 $1,219,862 $4,449,585
County CompensationBreakpoint $1,000,000 $1,030,000
% below breakpoint 13% 13% 5% 5% 10%
% above breakpoint 13% 13% 5% 5% 75%
County Share $159,498 $158,786 $30,099 $36,251 $245,397 $630,030
Expenses Personnel Services $0 $0 $0 $0 $0 $0
Other Services & Charges $6,866 $7,072 $7,284 $7,503 $7,728 $36,452
Supplement $100,000 $100,000
Supplies $373 $384 $396 $407 $420 $1,980
Marketing $3,190 $3,176 $602 $725 $4,908 $12,601
Total Expenses $10,429 $10,632 $108,282 $108,635 $13,055 $251,033
Net Income $149,069 $148,154 ($78,183) ($72,385) $232,341 $378,997
Difference to Status Quo $9,660 $6,118 ($206,157) ($219,081) $90,078 ($319,382)
Operator $903,610 $889,719 $575,233 $676,527 $974,466 $3,819,555
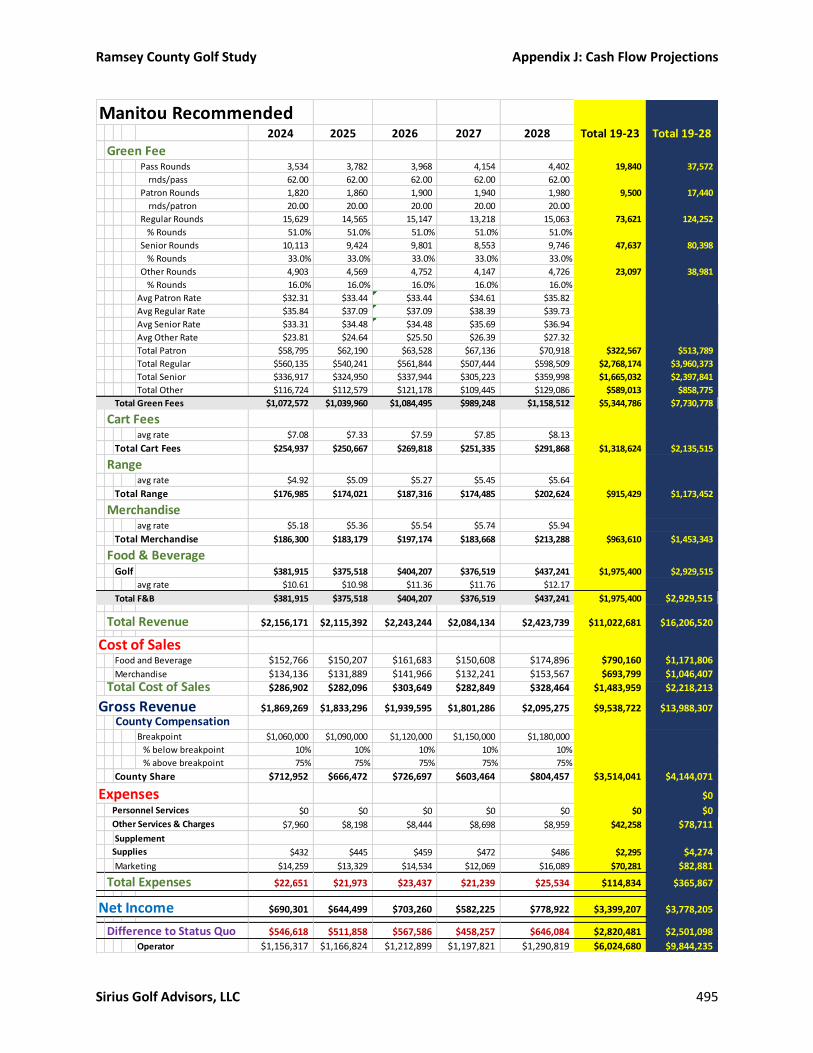
Ramsey County Golf Study Appendix J: Cash Flow Projections
Sirius Golf Advisors, LLC 495
Manitou Recommended2024 2025 2026 2027 2028 Total 19-23 Total 19-28
Green FeePass Rounds 3,534 3,782 3,968 4,154 4,402 19,840 37,572
rnds/pass 62.00 62.00 62.00 62.00 62.00
Patron Rounds 1,820 1,860 1,900 1,940 1,980 9,500 17,440
rnds/patron 20.00 20.00 20.00 20.00 20.00
Regular Rounds 15,629 14,565 15,147 13,218 15,063 73,621 124,252
% Rounds 51.0% 51.0% 51.0% 51.0% 51.0%
Senior Rounds 10,113 9,424 9,801 8,553 9,746 47,637 80,398
% Rounds 33.0% 33.0% 33.0% 33.0% 33.0%
Other Rounds 4,903 4,569 4,752 4,147 4,726 23,097 38,981
% Rounds 16.0% 16.0% 16.0% 16.0% 16.0%
Avg Patron Rate $32.31 $33.44 $33.44 $34.61 $35.82
Avg Regular Rate $35.84 $37.09 $37.09 $38.39 $39.73
Avg Senior Rate $33.31 $34.48 $34.48 $35.69 $36.94
Avg Other Rate $23.81 $24.64 $25.50 $26.39 $27.32
Total Patron $58,795 $62,190 $63,528 $67,136 $70,918 $322,567 $513,789
Total Regular $560,135 $540,241 $561,844 $507,444 $598,509 $2,768,174 $3,960,373
Total Senior $336,917 $324,950 $337,944 $305,223 $359,998 $1,665,032 $2,397,841
Total Other $116,724 $112,579 $121,178 $109,445 $129,086 $589,013 $858,775
Total Green Fees $1,072,572 $1,039,960 $1,084,495 $989,248 $1,158,512 $5,344,786 $7,730,778
Cart Feesavg rate $7.08 $7.33 $7.59 $7.85 $8.13
Total Cart Fees $254,937 $250,667 $269,818 $251,335 $291,868 $1,318,624 $2,135,515
Rangeavg rate $4.92 $5.09 $5.27 $5.45 $5.64
Total Range $176,985 $174,021 $187,316 $174,485 $202,624 $915,429 $1,173,452
Merchandiseavg rate $5.18 $5.36 $5.54 $5.74 $5.94
Total Merchandise $186,300 $183,179 $197,174 $183,668 $213,288 $963,610 $1,453,343
Food & BeverageGolf $381,915 $375,518 $404,207 $376,519 $437,241 $1,975,400 $2,929,515
avg rate $10.61 $10.98 $11.36 $11.76 $12.17
Total F&B $381,915 $375,518 $404,207 $376,519 $437,241 $1,975,400 $2,929,515
Total Revenue $2,156,171 $2,115,392 $2,243,244 $2,084,134 $2,423,739 $11,022,681 $16,206,520
Cost of SalesFood and Beverage $152,766 $150,207 $161,683 $150,608 $174,896 $790,160 $1,171,806
Merchandise $134,136 $131,889 $141,966 $132,241 $153,567 $693,799 $1,046,407
Total Cost of Sales $286,902 $282,096 $303,649 $282,849 $328,464 $1,483,959 $2,218,213
Gross Revenue $1,869,269 $1,833,296 $1,939,595 $1,801,286 $2,095,275 $9,538,722 $13,988,307
County CompensationBreakpoint $1,060,000 $1,090,000 $1,120,000 $1,150,000 $1,180,000
% below breakpoint 10% 10% 10% 10% 10%
% above breakpoint 75% 75% 75% 75% 75%
County Share $712,952 $666,472 $726,697 $603,464 $804,457 $3,514,041 $4,144,071
Expenses $0
Personnel Services $0 $0 $0 $0 $0 $0 $0 Other Services & Charges $7,960 $8,198 $8,444 $8,698 $8,959 $42,258 $78,711
Supplement
Supplies $432 $445 $459 $472 $486 $2,295 $4,274
Marketing $14,259 $13,329 $14,534 $12,069 $16,089 $70,281 $82,881
Total Expenses $22,651 $21,973 $23,437 $21,239 $25,534 $114,834 $365,867
Net Income $690,301 $644,499 $703,260 $582,225 $778,922 $3,399,207 $3,778,205
Difference to Status Quo $546,618 $511,858 $567,586 $458,257 $646,084 $2,820,481 $2,501,098
Operator $1,156,317 $1,166,824 $1,212,899 $1,197,821 $1,290,819 $6,024,680 $9,844,235
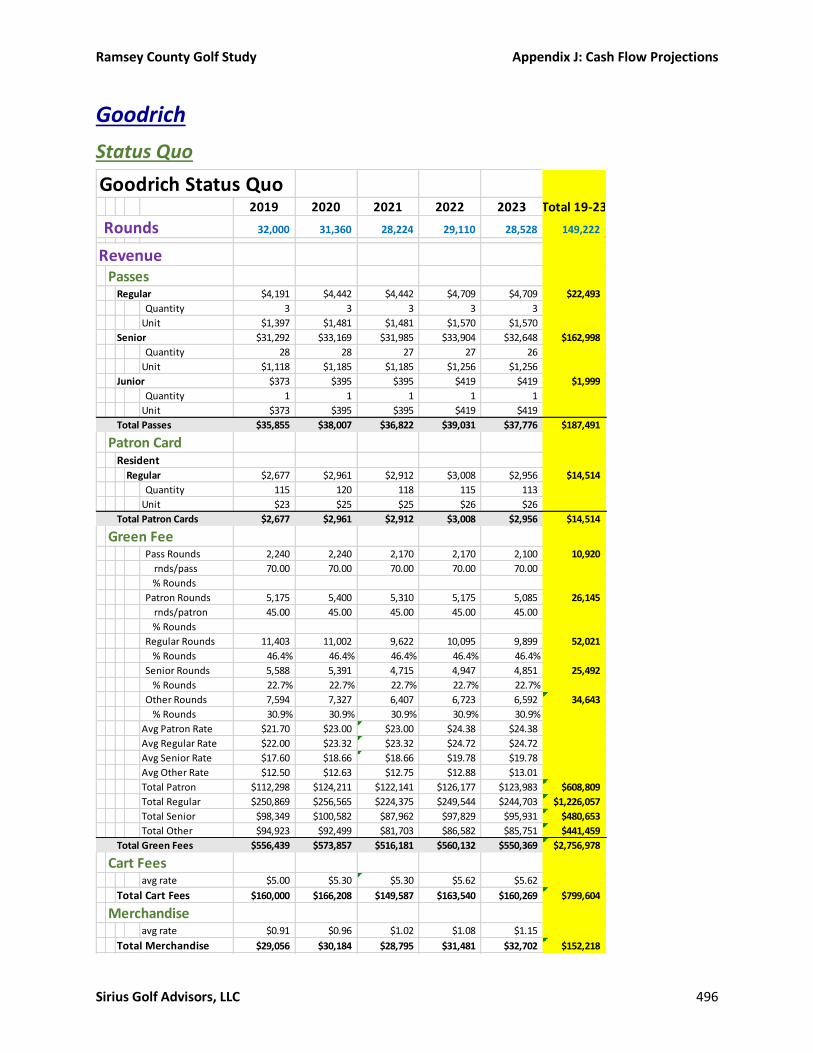
Ramsey County Golf Study Appendix J: Cash Flow Projections
Sirius Golf Advisors, LLC 496
Goodrich
Status Quo
Goodrich Status Quo2019 2020 2021 2022 2023 Total 19-23
Rounds 32,000 31,360 28,224 29,110 28,528 149,222
RevenuePasses
Regular $4,191 $4,442 $4,442 $4,709 $4,709 $22,493
Quantity 3 3 3 3 3
Unit $1,397 $1,481 $1,481 $1,570 $1,570
Senior $31,292 $33,169 $31,985 $33,904 $32,648 $162,998
Quantity 28 28 27 27 26
Unit $1,118 $1,185 $1,185 $1,256 $1,256
Junior $373 $395 $395 $419 $419 $1,999
Quantity 1 1 1 1 1
Unit $373 $395 $395 $419 $419
Total Passes $35,855 $38,007 $36,822 $39,031 $37,776 $187,491
Patron CardResident
Regular $2,677 $2,961 $2,912 $3,008 $2,956 $14,514
Quantity 115 120 118 115 113
Unit $23 $25 $25 $26 $26
Total Patron Cards $2,677 $2,961 $2,912 $3,008 $2,956 $14,514
Green FeePass Rounds 2,240 2,240 2,170 2,170 2,100 10,920
rnds/pass 70.00 70.00 70.00 70.00 70.00
% Rounds
Patron Rounds 5,175 5,400 5,310 5,175 5,085 26,145
rnds/patron 45.00 45.00 45.00 45.00 45.00
% Rounds
Regular Rounds 11,403 11,002 9,622 10,095 9,899 52,021
% Rounds 46.4% 46.4% 46.4% 46.4% 46.4%
Senior Rounds 5,588 5,391 4,715 4,947 4,851 25,492
% Rounds 22.7% 22.7% 22.7% 22.7% 22.7%
Other Rounds 7,594 7,327 6,407 6,723 6,592 34,643
% Rounds 30.9% 30.9% 30.9% 30.9% 30.9%
Avg Patron Rate $21.70 $23.00 $23.00 $24.38 $24.38
Avg Regular Rate $22.00 $23.32 $23.32 $24.72 $24.72
Avg Senior Rate $17.60 $18.66 $18.66 $19.78 $19.78
Avg Other Rate $12.50 $12.63 $12.75 $12.88 $13.01
Total Patron $112,298 $124,211 $122,141 $126,177 $123,983 $608,809
Total Regular $250,869 $256,565 $224,375 $249,544 $244,703 $1,226,057
Total Senior $98,349 $100,582 $87,962 $97,829 $95,931 $480,653
Total Other $94,923 $92,499 $81,703 $86,582 $85,751 $441,459
Total Green Fees $556,439 $573,857 $516,181 $560,132 $550,369 $2,756,978
Cart Feesavg rate $5.00 $5.30 $5.30 $5.62 $5.62
Total Cart Fees $160,000 $166,208 $149,587 $163,540 $160,269 $799,604
Merchandiseavg rate $0.91 $0.96 $1.02 $1.08 $1.15
Total Merchandise $29,056 $30,184 $28,795 $31,481 $32,702 $152,218

Ramsey County Golf Study Appendix J: Cash Flow Projections
Sirius Golf Advisors, LLC 497
Goodrich Status Quo2024 2025 2026 2027 2028 Totam 24-28Total 19-28
Rounds 29,355 27,887 27,330 24,597 26,515 135,684 284,906
RevenuePasses
Regular $3,328 $3,328 $3,328 $3,328 $3,328 $16,638 $39,132
Quantity 2 2 2 2 2
Unit $1,664 $1,664 $1,664 $1,664 $1,664 $8,319 $8,319
Senior $34,607 $34,607 $33,276 $31,945 $31,945 $166,380 $329,379
Quantity 26 26 25 24 24
Unit $1,331 $1,331 $1,331 $1,331 $1,331 $6,655 $6,655
Junior $0 $0 $0 $0 $0 $0 $1,999
Quantity 1 1 1 1 1
Unit $444 $444 $444 $444 $444 $2,218 $2,218
Total Passes $37,935 $37,935 $36,604 $35,273 $35,273 $183,019 $370,510
Patron CardResident
Regular $3,105 $3,233 $3,204 $3,365 $3,533 $16,440 $30,954
Quantity 112 110 109 108 107
Unit $28 $29 $29 $31 $33
Total Patron Cards $3,105 $3,233 $3,204 $3,365 $3,533 $16,440 $30,954
Green FeePass Rounds 2,030 2,030 1,960 1,890 1,890 9,800 20,720
rnds/pass 70.00 70.00 70.00 70.00 70.00
% Rounds
Patron Rounds 5,040 4,950 4,905 4,860 4,815 24,570 50,715
rnds/patron 45.00 45.00 45.00 45.00 45.00
% Rounds
Regular Rounds 10,336 9,697 9,492 8,278 9,188 46,992 99,013
% Rounds 46.4% 46.4% 46.4% 46.4% 46.4%
Senior Rounds 5,065 4,752 4,651 4,056 4,503 23,028 48,520
% Rounds 22.7% 22.7% 22.7% 22.7% 22.7%
Other Rounds 6,883 6,458 6,321 5,513 6,119 31,294 65,937
% Rounds 30.9% 30.9% 30.9% 30.9% 30.9%
Avg Patron Rate $25.85 $25.85 $25.85 $25.85 $25.85
Avg Regular Rate $26.20 $26.20 $26.20 $26.20 $26.20
Avg Senior Rate $20.96 $20.96 $20.96 $20.96 $20.96
Avg Other Rate $13.14 $13.14 $13.14 $13.14 $13.14
Total Patron $130,259 $127,933 $126,770 $125,607 $124,444 $635,013 $1,243,822
Total Regular $270,838 $254,093 $248,713 $216,896 $240,759 $1,231,299 $2,457,355
Total Senior $106,177 $99,613 $97,503 $85,030 $94,385 $482,708 $963,361
Total Other $90,433 $84,842 $83,045 $72,421 $80,389 $411,130 $852,589
Total Green Fees $597,706 $566,481 $556,031 $499,954 $539,978 $2,760,149 $5,517,127
Cart Feesavg rate $5.96 $6.31 $6.31 $6.69 $6.69
Total Cart Fees $174,812 $176,036 $172,515 $164,579 $177,416 $865,358 $1,664,963
Merchandiseavg rate $1.22 $1.29 $1.37 $1.45 $1.53
Total Merchandise $35,670 $35,920 $37,313 $35,597 $40,676 $185,175 $337,393

Ramsey County Golf Study Appendix J: Cash Flow Projections
Sirius Golf Advisors, LLC 498
Goodrich Status Quo2019 2020 2021 2022 2023 Total 19-23
Food & BeverageGolf $151,962 $157,858 $150,596 $164,643 $171,031 $796,090
avg rate $4.75 $5.03 $5.34 $5.66 $6.00
Total F&B $151,962 $157,858 $150,596 $164,643 $171,031 $796,090
Total Revenue $935,989 $969,074 $884,894 $961,836 $955,103 $4,706,896
County CompensationGreen Fee total rev $594,971 $614,825 $555,915 $602,172 $591,101 $2,958,984
Breakpoint $850,000 $850,000 $850,000 $850,000 $850,000
% Up to breakpt 90% 90% 90% 90% 90%
% Over breakpt 90% 90% 90% 90% 90%
Total Comp $535,474 $553,342 $500,324 $541,955 $531,991 $2,663,085
Cart Fee total rev $160,000 $166,208 $149,587 $163,540 $160,269 $799,604
Breakpoint $200,000 $200,000 $200,000 $200,000 $200,000
% Up to breakpt 90% 90% 90% 90% 90%
% Over breakpt 90% 90% 90% 90% 90%
Total Comp $144,000 $149,587 $134,628 $147,186 $144,242 $719,644
Food & Beverage $151,962 $157,858 $150,596 $164,643 $171,031 $796,090
% F&B 10% 10% 10% 10% 10%
Total Comp $15,196 $15,786 $15,060 $16,464 $17,103 $79,609
Merchandise $29,056 $30,184 $28,795 $31,481 $32,702 $152,218
Breakpoint $50,000 $50,000 $50,000 $50,000 $50,000 $250,000
% Up to breakpt 0% 0% 0% 0% 0% 0%
% Over breakpt 5% 5% 5% 5% 5% 25%
Total Comp $0 $0 $0 $0 $0 $0
County Share $694,670 $718,715 $650,012 $705,605 $693,336 $3,462,338
Expenses Personnel Services $385,979 $407,208 $429,604 $453,233 $478,160 $2,154,185
Other Services & Charges $151,375 $155,916 $160,594 $165,412 $170,374 $803,670
Fleet Services $283,500 $292,005 $300,765 $309,788 $319,082 $1,505,140
Supplies $62,823 $64,707 $66,649 $68,648 $70,708 $333,535
Total Expenses $883,677 $919,837 $957,612 $997,080 $1,038,324 $4,796,530
Net Income ($189,007) ($201,121) ($307,600) ($291,475) ($344,988) ($1,334,192)
Operator Revenue $241,319 $250,359 $234,882 $256,231 $261,768 $1,244,558
less COS $81,705 $84,875 $80,971 $88,524 $91,958 $428,033
Net Operator $159,614 $165,484 $153,911 $167,707 $169,809 $816,525

Ramsey County Golf Study Appendix J: Cash Flow Projections
Sirius Golf Advisors, LLC 499
Goodrich Status Quo2024 2025 2026 2027 2028 Totam 24-28Total 19-28
Food & BeverageGolf $186,551 $187,857 $195,145 $186,169 $212,731 $968,453 $1,764,543
avg rate $6.35 $6.74 $7.14 $7.57 $8.02
Total F&B $186,551 $187,857 $195,145 $186,169 $212,731 $968,453 $1,764,543
Total Revenue $1,035,779 $1,007,460 $1,000,812 $924,936 $1,009,607 $4,978,594 $9,685,490
County CompensationGreen Fee total rev $638,746 $607,648 $595,838 $538,591 $578,784 $2,959,608 $5,918,591
Breakpoint $850,000 $850,000 $850,000 $850,000 $850,000
% Up to breakpt 90% 90% 90% 90% 90%
% Over breakpt 90% 90% 90% 90% 90%
Total Comp $574,872 $546,884 $536,254 $484,732 $520,905 $2,663,647 $5,326,732
Cart Fee total rev $174,812 $176,036 $172,515 $164,579 $177,416 $865,358 $1,664,963
Breakpoint $200,000 $200,000 $200,000 $200,000 $200,000
% Up to breakpt 90% 90% 90% 90% 90%
% Over breakpt 90% 90% 90% 90% 90%
Total Comp $157,331 $158,432 $155,263 $148,121 $159,675 $778,823 $1,498,467
Food & Beverage $186,551 $187,857 $195,145 $186,169 $212,731 $968,453 $1,764,543
% F&B 10% 10% 10% 10% 10%
Total Comp $18,655 $18,786 $19,515 $18,617 $21,273 $96,845
Merchandise $35,670 $35,920 $37,313 $35,597 $40,676 $185,175 $337,393
Breakpoint $50,000 $50,000 $50,000 $50,000 $50,000 $250,000 $500,000
% Up to breakpt 0% 0% 0% 0% 0% 0% $0
% Over breakpt 5% 5% 5% 5% 5% 25% $1
Total Comp $0 $0 $0 $0 $0 $0 $0
County Share $750,858 $724,101 $711,032 $651,470 $701,853 $3,539,315 $7,001,653
Expenses Personnel Services $504,459 $532,205 $561,476 $592,357 $624,937 $2,815,433 $4,969,618 Other Services & Charges $175,485 $180,750 $186,172 $191,757 $197,510 $931,674 $1,735,345
Fleet Services $328,654 $338,514 $348,669 $359,129 $369,903 $1,744,870 $3,250,010 Supplies $72,829 $75,014 $77,264 $79,582 $81,969 $386,658 $720,193
Total Expenses $1,081,427 $1,126,482 $1,173,581 $1,222,826 $1,274,319 $5,878,635 $10,675,165
Net Income ($330,570) ($402,380) ($462,549) ($571,355) ($572,466) ($2,339,320) ($3,673,512)
Operator Revenue $284,921 $283,359 $289,779 $273,466 $307,754 $1,439,279 $2,683,837
less COS $100,303 $101,005 $104,924 $100,097 $114,379 $520,707 $948,740
Net Operator $184,619 $182,354 $184,856 $173,368 $193,375 $918,572 $1,735,097

Ramsey County Golf Study Appendix J: Cash Flow Projections
Sirius Golf Advisors, LLC 500
Scenario 1: Priority Fixes
Goodrich Scenario 1: Priority Fixes2019 2020 2021 2022 2023 Total 19-23
Rounds 34,500 35,190 31,671 33,597 26,000 160,958
build temp Priority fix
RevenuePasses
Regular $9,111 $10,608 $12,200 $13,889 $15,682 $61,491
Quantity 8.0 9 10 11 12
Unit $1,139 $1,179 $1,220 $1,263 $1,307
Senior $14,615 $16,207 $17,893 $19,677 $21,563 $89,955
Quantity 14 15 16 17 18
Unit $1,044 $1,080 $1,118 $1,157 $1,198
Junior $949 $982 $1,017 $526 $545 $4,019
Quantity 4 4 4 2 2
Unit $237 $246 $254 $263 $272
Weekday Regular $6,833 $7,956 $5,490 $5,682 $5,881 $31,842
Quantity 8 9 6 6 6
Unit $854.14 $884 $915 $947 $980
Weekday Senior $13,476 $14,646 $15,880 $14,195 $15,465 $73,661
Quantity 20 21 22 19 20
Unit $673.82 $697 $722 $747 $773
Total Passes 54 58 58 55 58
Total Passes $44,985 $50,400 $52,479 $53,969 $59,136 $260,968
Patron CardResident
Regular $569 $589 $610 $631 $653 $3,054
Quantity 15 15 15 15 15
Unit $38 $39 $41 $42 $44
Senior $626.37 $648.29 $670.98 $694.47 $718.77 $3,358.89
Quantity 22 22 22 22 22
Unit $28 $29 $30 $32 $33
Premium $683.31 $707.23 $731.98 $757.60 $784.12 $3,664.25
Quantity 8 8 8 8 8
Unit $85 $88 $91 $95 $98
Premium Senior $664.33 $687.58 $711.65 $736.56 $762.34 $3,562.46
Quantity 10 10 10 10 10
Unit $66 $69 $71 $74 $76
Non-Resident
Regular $427.07 $442.02 $457.49 $473.50 $490.07 $2,290.15
Quantity 9 9 9 9 9
Unit $47 $49 $51 $53 $54
Senior $683.31 $707.23 $731.98 $757.60 $784.12 $3,664.25
Quantity 18 18 18 18 18
Unit $38 $39 $41 $42 $44
Premium $474.52 $884.04 $1,219.97 $1,367.89 $1,633.58 $5,580.00
Quantity 5 9 12 13 15
Unit $95 $98 $102 $105 $109
Premium Senior $531.47 $1,414.46 $1,626.63 $1,767.74 $1,916.73 $7,257.02
Quantity 7 18 20 21 22
Unit $76 $79 $81 $84 $87
Total quantity 94 109 114 116 119
Total Patron Cards $4,660 $6,080 $6,761 $7,187 $7,743 $32,431

Ramsey County Golf Study Appendix J: Cash Flow Projections
Sirius Golf Advisors, LLC 501
Goodrich Scenario 1: Priority Fixes2024 2025 2026 2027 2028 Total 19-23Total 19-28
Rounds 34,250 32,195 35,750 32,890 36,000 171,085 332,043
RevenuePasses
Regular $18,936 $21,642 $24,347 $27,052 $31,110 $123,087 $184,578
Quantity 14 16 18 20 23
Unit $1,353 $1,353 $1,353 $1,353 $1,353
Senior $23,558 $24,798 $26,038 $27,278 $28,517 $130,188 $220,144
Quantity 19 20 21 22 23
Unit $1,240 $1,240 $1,240 $1,240 $1,240
Junior $564 $845 $845 $845 $845 $3,945 $7,964
Quantity 2 3 3 3 3
Unit $282 $282 $282 $282 $282
Weekday Regular $6,087 $7,101 $7,101 $7,101 $7,101 $34,491 $66,334
Quantity 6 7 7 7 7
Unit $1,014 $1,014 $1,014 $1,014 $1,014
Weekday Senior $16,806 $16,806 $17,606 $18,407 $19,207 $88,832 $162,493
Quantity 21 21 22 23 24
Unit $800 $800 $800 $800 $800
Total Passes 62 67 71 75 80
Total Passes $65,951 $71,192 $75,937 $80,683 $86,781 $380,544 $641,512
Patron CardResident
Regular $676 $700 $724 $750 $776 $3,627 $6,680
Quantity 15 15 15 15 15
Unit $45 $47 $48 $50 $52
Senior $743.93 $769.97 $796.92 $824.81 $853.68 $3,989.31 $7,348
Quantity 22 22 22 22 22
Unit $34 $35 $36 $37 $39
Premium $811.56 $839.97 $869.37 $899.79 $931.29 $4,351.97 $8,016
Quantity 8 8 8 8 8
Unit $101 $105 $109 $112 $116
Premium Senior $789.02 $816.63 $845.22 $874.80 $905.42 $4,231.09 $7,794
Quantity 10 10 10 10 10
Unit $79 $82 $85 $87 $91
Non-Resident
Regular $507.23 $524.98 $543.35 $562.37 $582.05 $2,719.98 $5,010
Quantity 9 9 9 9 9
Unit $56 $58 $60 $62 $65
Senior $811.56 $839.97 $869.37 $899.79 $931.29 $4,351.97 $8,016
Quantity 18 18 18 18 18
Unit $45 $47 $48 $50 $52
Premium $1,803.47 $1,983.26 $2,173.41 $2,374.46 $2,586.91 $10,921.50 $16,502
Quantity 16 17 18 19 20
Unit $113 $117 $121 $125 $129
Premium Senior $2,073.99 $2,239.91 $2,414.90 $2,599.40 $2,793.86 $12,122.07 $19,379
Quantity 23 24 25 26 27
Unit $90 $93 $97 $100 $103
Total quantity 121 123 125 127 129
Total Patron Cards $8,217 $8,715 $9,237 $9,785 $10,361 $46,315 $78,745

Ramsey County Golf Study Appendix J: Cash Flow Projections
Sirius Golf Advisors, LLC 502
Goodrich Scenario One: Priority Fixes2019 2020 2021 2022 2023 Total 19-23
Green FeePass Rounds 3,259 3,500 3,500 3,319 3,500 17,079
rnds/pass 60.35 60.35 60.35 60.35 60.35
% Rounds
Patron Rounds 1,974 2,289 2,394 2,436 2,499 11,592
rnds/patron 21.00 21.00 21.00 21.00 21.00
% Rounds
Regular Rounds 16,682 16,758 14,693 15,870 11,400 75,403
% Rounds 57.0% 57.0% 57.0% 57.0% 57.0%
Senior Rounds 7,317 7,350 6,444 6,960 5,000 33,072
% Rounds 25.0% 25.0% 25.0% 25.0% 25.0%
Other Rounds 5,268 5,292 4,640 5,011 3,600 23,812
% Rounds 18.0% 18.0% 18.0% 18.0% 18.0%
Avg Patron Rate $17.60 $18.22 $18.85 $19.51 $20.20
Avg Regular Rate $18.50 $19.15 $19.82 $20.51 $21.23
Avg Senior Rate $15.80 $16.35 $16.93 $17.52 $18.13
Avg Other Rate $12.50 $12.94 $13.39 $13.86 $14.34
Total Patron $34,742 $41,696 $45,135 $47,535 $50,471 $219,580
Total Regular $308,622 $320,881 $291,175 $325,505 $242,021 $1,488,205
Total Senior $115,605 $120,197 $109,070 $121,929 $90,657 $557,459
Total Other $65,851 $68,467 $62,128 $69,453 $51,640 $317,540
Total Green Fees $524,820 $551,242 $507,509 $564,423 $434,790 $2,582,784
Cart Feesavg rate $5.10 $5.28 $5.46 $5.65 $5.85
Total Cart Fees $175,950 $185,750 $173,027 $189,971 $152,162 $876,859
Merchandiseavg rate $1.30 $1.35 $1.39 $1.44 $1.49
Total Merchandise $44,850 $47,348 $44,105 $48,424 $38,786 $223,513
Food & BeverageGolf $162,150 $171,182 $159,456 $175,071 $140,227 $808,086
avg rate $4.70 $4.86 $5.03 $5.21 $5.39
Total F&B $162,150 $171,182 $159,456 $175,071 $140,227 $808,086
Total Revenue $957,415 $1,012,003 $943,336 $1,039,044 $832,844 $4,784,640
County CompensationGreen Fee total rev $574,465 $607,722 $566,749 $625,578 $501,668 $2,876,182
Breakpoint $850,000 $850,000 $850,000 $850,000 $850,000
% Up to breakpt 80% 80% 80% 80% 80%
% Over breakpt 80% 80% 80% 80% 80%
Total Comp $459,572 $486,178 $453,399 $500,462 $401,335 $2,300,946
Cart Fee total rev $175,950 $185,750 $173,027 $189,971 $152,162 $876,859
Breakpoint $200,000 $200,000 $200,000 $200,000 $200,000
% Up to breakpt 80% 80% 80% 80% 80%
% Over breakpt 80% 80% 80% 80% 80%
Total Comp $140,760 $148,600 $138,421 $151,977 $121,729 $701,487
F&B Total $162,150 $171,182 $159,456 $175,071 $140,227 $808,086
Food & Beverage Net $97,290 $102,709 $95,673 $105,043 $84,136 $484,852
% F&B 80% 80% 80% 80% 80%
F&B Comp $77,832 $82,167 $76,539 $84,034 $67,309 $387,881
Merchandise $44,850 $47,348 $44,105 $48,424 $38,786 $223,513
Net Merchandise $13,455 $14,204 $13,231 $14,527 $11,636 $67,054
% split 80% 80% 80% 80% 80%
Merch Comp $10,764 $11,364 $10,585 $11,622 $9,309 $53,643
County Share $688,928 $728,309 $678,944 $748,095 $599,682 $3,443,958
Expenses Personnel Services $384,150 $403,357 $423,525 $444,701 $466,937 $2,122,670
Other Services & Charges $151,375 $155,916 $160,594 $165,412 $170,374 $803,670
Supplies $62,823 $64,707 $66,649 $68,648 $70,708 $333,535
Marketing $13,779 $14,566 $13,579 $14,962 $11,994 $68,879
Fleet Services $283,500 $292,005 $300,765 $309,788 $319,082 $1,505,140
Total Expenses $895,626 $930,552 $965,112 $1,003,511 $1,039,093 $4,833,895
Net Income ($206,698) ($202,243) ($286,167) ($255,416) ($439,412) ($1,389,937)
Difference to Status Quo ($17,692) ($1,122) $21,433 $36,059 ($94,424) ($55,746)

Ramsey County Golf Study Appendix J: Cash Flow Projections
Sirius Golf Advisors, LLC 503
Goodrich Scenario One: Priority Fixes2024 2025 2026 2027 2028 Total 19-23Total 19-28
Green FeePass Rounds 3,742 4,043 4,285 4,526 4,828 21,424 38,503
rnds/pass 60.35 60.35 60.35 60.35 60.35
% Rounds
Patron Rounds 2,541 2,583 2,625 2,667 2,709 13,125 24,717
rnds/patron 21.00 21.00 21.00 21.00 21.00
% Rounds
Regular Rounds 15,941 14,574 16,439 14,647 16,224 77,825 153,229
% Rounds 57.0% 57.0% 57.0% 57.0% 57.0%
Senior Rounds 6,992 6,392 7,210 6,424 7,116 34,134 67,206
% Rounds 25.0% 25.0% 25.0% 25.0% 25.0%
Other Rounds 5,034 4,602 5,191 4,625 5,123 24,576 48,388
% Rounds 18.0% 18.0% 18.0% 18.0% 18.0%
Avg Patron Rate $20.90 $20.90 $20.90 $20.90 $20.90
Avg Regular Rate $21.97 $21.97 $21.97 $21.97 $21.97
Avg Senior Rate $18.77 $18.77 $18.77 $18.77 $18.77
Avg Other Rate $14.85 $14.85 $14.85 $14.85 $14.85
Total Patron $53,115 $53,993 $54,871 $55,749 $56,627 $274,356 $493,935
Total Regular $350,267 $320,224 $361,198 $321,830 $356,475 $1,709,994 $3,198,199
Total Senior $131,205 $119,951 $135,300 $120,553 $133,530 $640,538 $1,197,998
Total Other $74,737 $68,327 $77,069 $68,669 $76,062 $364,864 $682,404
Total Green Fees $609,324 $562,496 $628,438 $566,801 $622,694 $2,989,752 $5,572,536
Cart Feesavg rate $6.06 $6.27 $6.49 $6.72 $6.95
Total Cart Fees $207,459 $201,837 $231,968 $220,880 $250,228 $1,112,373 $1,989,232
Merchandiseavg rate $1.54 $1.60 $1.65 $1.71 $1.77
Total Merchandise $52,882 $51,449 $59,129 $56,303 $63,784 $283,546 $507,059
Food & BeverageGolf $191,188 $186,007 $213,775 $203,556 $230,602 $1,025,128 $1,833,214
avg rate $5.58 $5.78 $5.98 $6.19 $6.41
Total F&B $191,188 $186,007 $213,775 $203,556 $230,602 $1,025,128 $1,833,214
Total Revenue $1,135,020 $1,081,694 $1,218,485 $1,138,008 $1,264,449 $5,837,657 $10,622,297
County CompensationGreen Fee total rev $683,491 $642,402 $713,613 $657,269 $719,835 $3,416,611 $6,292,793
Breakpoint $850,000 $850,000 $850,000 $850,000 $850,000
% Up to breakpt 80% 80% 80% 80% 80%
% Over breakpt 80% 80% 80% 80% 80%
Total Comp $546,793 $513,922 $570,890 $525,815 $575,868 $2,733,288 $5,034,234
Cart Fee total rev $207,459 $201,837 $231,968 $220,880 $250,228 $1,112,373 $1,989,232
Breakpoint $200,000 $200,000 $200,000 $200,000 $200,000
% Up to breakpt 80% 80% 80% 80% 80%
% Over breakpt 80% 80% 80% 80% 80%
Total Comp $165,967 $161,470 $185,575 $176,704 $200,182 $889,898 $1,591,385
F&B Total $191,188 $186,007 $213,775 $203,556 $230,602 $1,025,128 $1,833,214
Food & Beverage Net $114,713 $111,604 $128,265 $122,134 $138,361 $615,077 $1,099,928
% F&B 80% 80% 80% 80% 80%
F&B Comp $91,770 $89,283 $102,612 $97,707 $110,689 $492,061 $879,942
Merchandise $52,882 $51,449 $59,129 $56,303 $63,784 $283,546 $507,059
Net Merchandise $15,865 $15,435 $17,739 $16,891 $19,135 $85,064 $152,118
% split 80.0% 80.0% 80.0% 80.0% 80.0%
Merch Comp $12,692 $12,348 $14,191 $13,513 $15,308 $68,051 $121,694
County Share $817,222 $777,022 $873,268 $813,739 $902,047 $4,183,299 $7,627,256
Expenses $0
Personnel Services $490,283 $514,798 $540,537 $567,564 $595,943 $2,709,125 $4,831,796
Other Services & Charges $175,485 $180,750 $186,172 $191,757 $197,510 $931,674 $1,735,345
Supplies $72,829 $75,014 $77,264 $79,582 $81,969 $386,658 $720,193
Marketing $16,344 $15,540 $17,465 $16,275 $18,041 $83,666 $152,545
Fleet Services $328,654 $338,514 $348,669 $359,129 $369,903 $1,744,870 $3,250,010
Total Expenses $1,083,596 $1,124,615 $1,170,108 $1,214,308 $1,263,366 $5,855,993 $10,689,888
Net Income ($266,374) ($347,593) ($296,840) ($400,569) ($361,319) ($1,672,694) ($3,062,632)
Difference to Status Quo $64,196 $54,787 $165,709 $170,787 $211,147 $666,626 $610,880
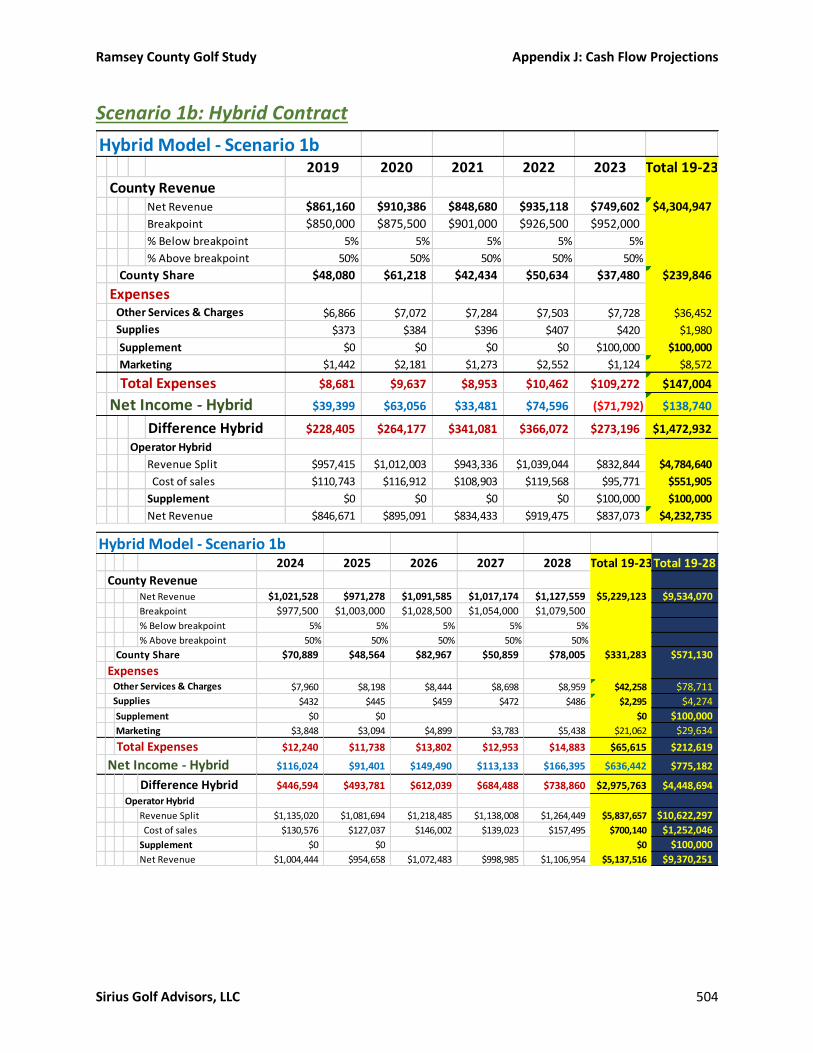
Ramsey County Golf Study Appendix J: Cash Flow Projections
Sirius Golf Advisors, LLC 504
Scenario 1b: Hybrid Contract
Hybrid Model - Scenario 1b2019 2020 2021 2022 2023 Total 19-23
County RevenueNet Revenue $861,160 $910,386 $848,680 $935,118 $749,602 $4,304,947
Breakpoint $850,000 $875,500 $901,000 $926,500 $952,000
% Below breakpoint 5% 5% 5% 5% 5%
% Above breakpoint 50% 50% 50% 50% 50%
County Share $48,080 $61,218 $42,434 $50,634 $37,480 $239,846
Expenses Other Services & Charges $6,866 $7,072 $7,284 $7,503 $7,728 $36,452
Supplies $373 $384 $396 $407 $420 $1,980
Supplement $0 $0 $0 $0 $100,000 $100,000
Marketing $1,442 $2,181 $1,273 $2,552 $1,124 $8,572
Total Expenses $8,681 $9,637 $8,953 $10,462 $109,272 $147,004
Net Income - Hybrid $39,399 $63,056 $33,481 $74,596 ($71,792) $138,740
Difference Hybrid $228,405 $264,177 $341,081 $366,072 $273,196 $1,472,932
Operator Hybrid
Revenue Split $957,415 $1,012,003 $943,336 $1,039,044 $832,844 $4,784,640
Cost of sales $110,743 $116,912 $108,903 $119,568 $95,771 $551,905
Supplement $0 $0 $0 $0 $100,000 $100,000
Net Revenue $846,671 $895,091 $834,433 $919,475 $837,073 $4,232,735
Hybrid Model - Scenario 1b2024 2025 2026 2027 2028 Total 19-23Total 19-28
County RevenueNet Revenue $1,021,528 $971,278 $1,091,585 $1,017,174 $1,127,559 $5,229,123 $9,534,070
Breakpoint $977,500 $1,003,000 $1,028,500 $1,054,000 $1,079,500
% Below breakpoint 5% 5% 5% 5% 5%
% Above breakpoint 50% 50% 50% 50% 50%
County Share $70,889 $48,564 $82,967 $50,859 $78,005 $331,283 $571,130
Expenses Other Services & Charges $7,960 $8,198 $8,444 $8,698 $8,959 $42,258 $78,711 Supplies $432 $445 $459 $472 $486 $2,295 $4,274
Supplement $0 $0 $0 $100,000
Marketing $3,848 $3,094 $4,899 $3,783 $5,438 $21,062 $29,634
Total Expenses $12,240 $11,738 $13,802 $12,953 $14,883 $65,615 $212,619
Net Income - Hybrid $116,024 $91,401 $149,490 $113,133 $166,395 $636,442 $775,182
Difference Hybrid $446,594 $493,781 $612,039 $684,488 $738,860 $2,975,763 $4,448,694
Operator Hybrid
Revenue Split $1,135,020 $1,081,694 $1,218,485 $1,138,008 $1,264,449 $5,837,657 $10,622,297
Cost of sales $130,576 $127,037 $146,002 $139,023 $157,495 $700,140 $1,252,046
Supplement $0 $0 $0 $100,000
Net Revenue $1,004,444 $954,658 $1,072,483 $998,985 $1,106,954 $5,137,516 $9,370,251
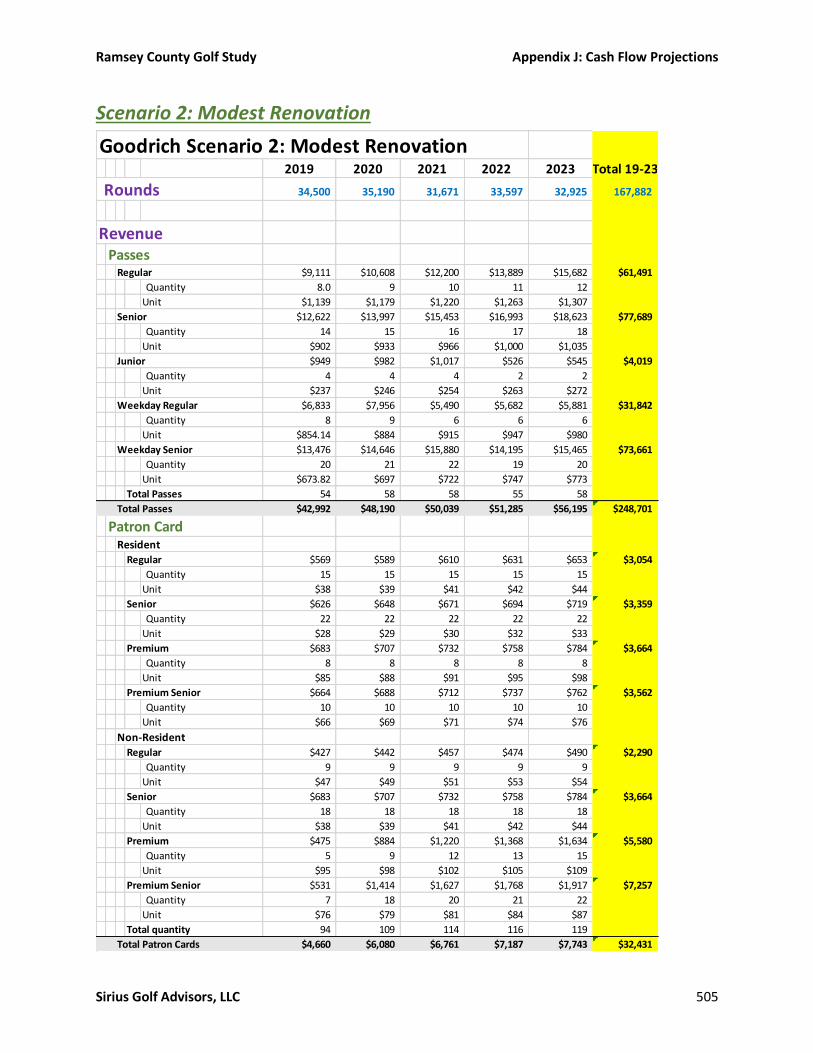
Ramsey County Golf Study Appendix J: Cash Flow Projections
Sirius Golf Advisors, LLC 505
Scenario 2: Modest Renovation
Goodrich Scenario 2: Modest Renovation2019 2020 2021 2022 2023 Total 19-23
Rounds 34,500 35,190 31,671 33,597 32,925 167,882
RevenuePasses
Regular $9,111 $10,608 $12,200 $13,889 $15,682 $61,491
Quantity 8.0 9 10 11 12
Unit $1,139 $1,179 $1,220 $1,263 $1,307
Senior $12,622 $13,997 $15,453 $16,993 $18,623 $77,689
Quantity 14 15 16 17 18
Unit $902 $933 $966 $1,000 $1,035
Junior $949 $982 $1,017 $526 $545 $4,019
Quantity 4 4 4 2 2
Unit $237 $246 $254 $263 $272
Weekday Regular $6,833 $7,956 $5,490 $5,682 $5,881 $31,842
Quantity 8 9 6 6 6
Unit $854.14 $884 $915 $947 $980
Weekday Senior $13,476 $14,646 $15,880 $14,195 $15,465 $73,661
Quantity 20 21 22 19 20
Unit $673.82 $697 $722 $747 $773
Total Passes 54 58 58 55 58
Total Passes $42,992 $48,190 $50,039 $51,285 $56,195 $248,701
Patron CardResident
Regular $569 $589 $610 $631 $653 $3,054
Quantity 15 15 15 15 15
Unit $38 $39 $41 $42 $44
Senior $626 $648 $671 $694 $719 $3,359
Quantity 22 22 22 22 22
Unit $28 $29 $30 $32 $33
Premium $683 $707 $732 $758 $784 $3,664
Quantity 8 8 8 8 8
Unit $85 $88 $91 $95 $98
Premium Senior $664 $688 $712 $737 $762 $3,562
Quantity 10 10 10 10 10
Unit $66 $69 $71 $74 $76
Non-Resident
Regular $427 $442 $457 $474 $490 $2,290
Quantity 9 9 9 9 9
Unit $47 $49 $51 $53 $54
Senior $683 $707 $732 $758 $784 $3,664
Quantity 18 18 18 18 18
Unit $38 $39 $41 $42 $44
Premium $475 $884 $1,220 $1,368 $1,634 $5,580
Quantity 5 9 12 13 15
Unit $95 $98 $102 $105 $109
Premium Senior $531 $1,414 $1,627 $1,768 $1,917 $7,257
Quantity 7 18 20 21 22
Unit $76 $79 $81 $84 $87
Total quantity 94 109 114 116 119
Total Patron Cards $4,660 $6,080 $6,761 $7,187 $7,743 $32,431
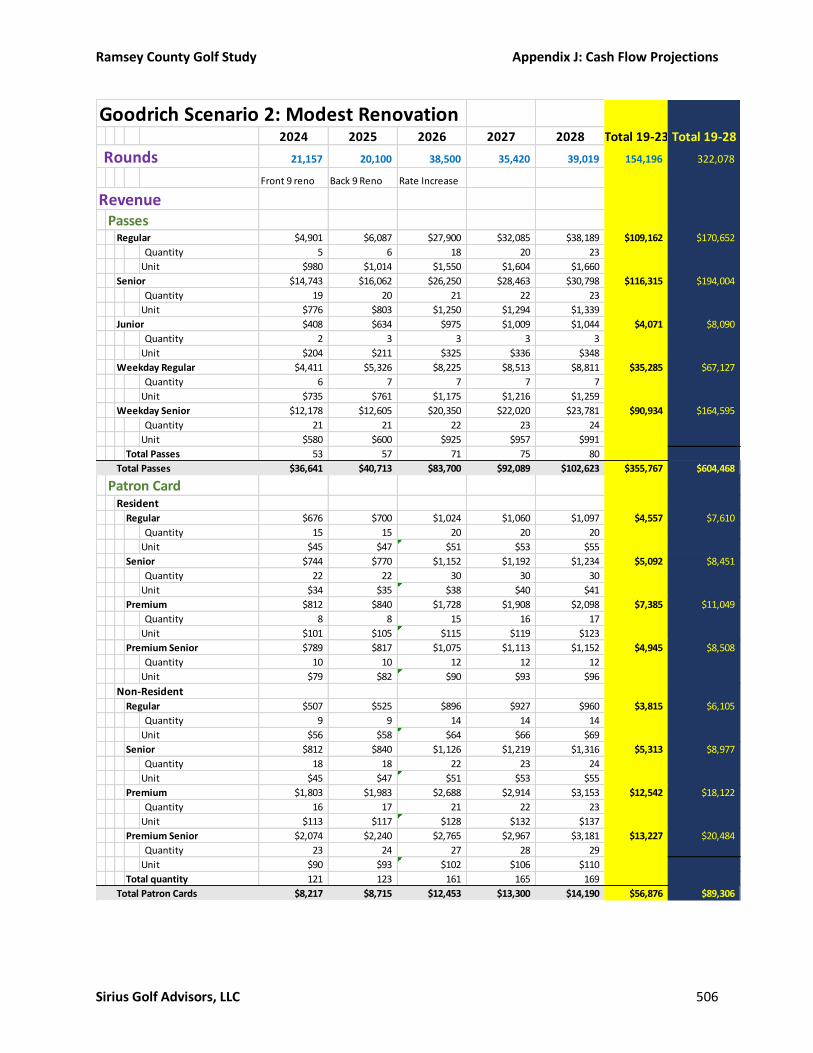
Ramsey County Golf Study Appendix J: Cash Flow Projections
Sirius Golf Advisors, LLC 506
Goodrich Scenario 2: Modest Renovation2024 2025 2026 2027 2028 Total 19-23 Total 19-28
Rounds 21,157 20,100 38,500 35,420 39,019 154,196 322,078
Front 9 reno Back 9 Reno Rate Increase
RevenuePasses
Regular $4,901 $6,087 $27,900 $32,085 $38,189 $109,162 $170,652
Quantity 5 6 18 20 23
Unit $980 $1,014 $1,550 $1,604 $1,660
Senior $14,743 $16,062 $26,250 $28,463 $30,798 $116,315 $194,004
Quantity 19 20 21 22 23
Unit $776 $803 $1,250 $1,294 $1,339
Junior $408 $634 $975 $1,009 $1,044 $4,071 $8,090
Quantity 2 3 3 3 3
Unit $204 $211 $325 $336 $348
Weekday Regular $4,411 $5,326 $8,225 $8,513 $8,811 $35,285 $67,127
Quantity 6 7 7 7 7
Unit $735 $761 $1,175 $1,216 $1,259
Weekday Senior $12,178 $12,605 $20,350 $22,020 $23,781 $90,934 $164,595
Quantity 21 21 22 23 24
Unit $580 $600 $925 $957 $991
Total Passes 53 57 71 75 80
Total Passes $36,641 $40,713 $83,700 $92,089 $102,623 $355,767 $604,468
Patron CardResident
Regular $676 $700 $1,024 $1,060 $1,097 $4,557 $7,610
Quantity 15 15 20 20 20
Unit $45 $47 $51 $53 $55
Senior $744 $770 $1,152 $1,192 $1,234 $5,092 $8,451
Quantity 22 22 30 30 30
Unit $34 $35 $38 $40 $41
Premium $812 $840 $1,728 $1,908 $2,098 $7,385 $11,049
Quantity 8 8 15 16 17
Unit $101 $105 $115 $119 $123
Premium Senior $789 $817 $1,075 $1,113 $1,152 $4,945 $8,508
Quantity 10 10 12 12 12
Unit $79 $82 $90 $93 $96
Non-Resident
Regular $507 $525 $896 $927 $960 $3,815 $6,105
Quantity 9 9 14 14 14
Unit $56 $58 $64 $66 $69
Senior $812 $840 $1,126 $1,219 $1,316 $5,313 $8,977
Quantity 18 18 22 23 24
Unit $45 $47 $51 $53 $55
Premium $1,803 $1,983 $2,688 $2,914 $3,153 $12,542 $18,122
Quantity 16 17 21 22 23
Unit $113 $117 $128 $132 $137
Premium Senior $2,074 $2,240 $2,765 $2,967 $3,181 $13,227 $20,484
Quantity 23 24 27 28 29
Unit $90 $93 $102 $106 $110
Total quantity 121 123 161 165 169
Total Patron Cards $8,217 $8,715 $12,453 $13,300 $14,190 $56,876 $89,306
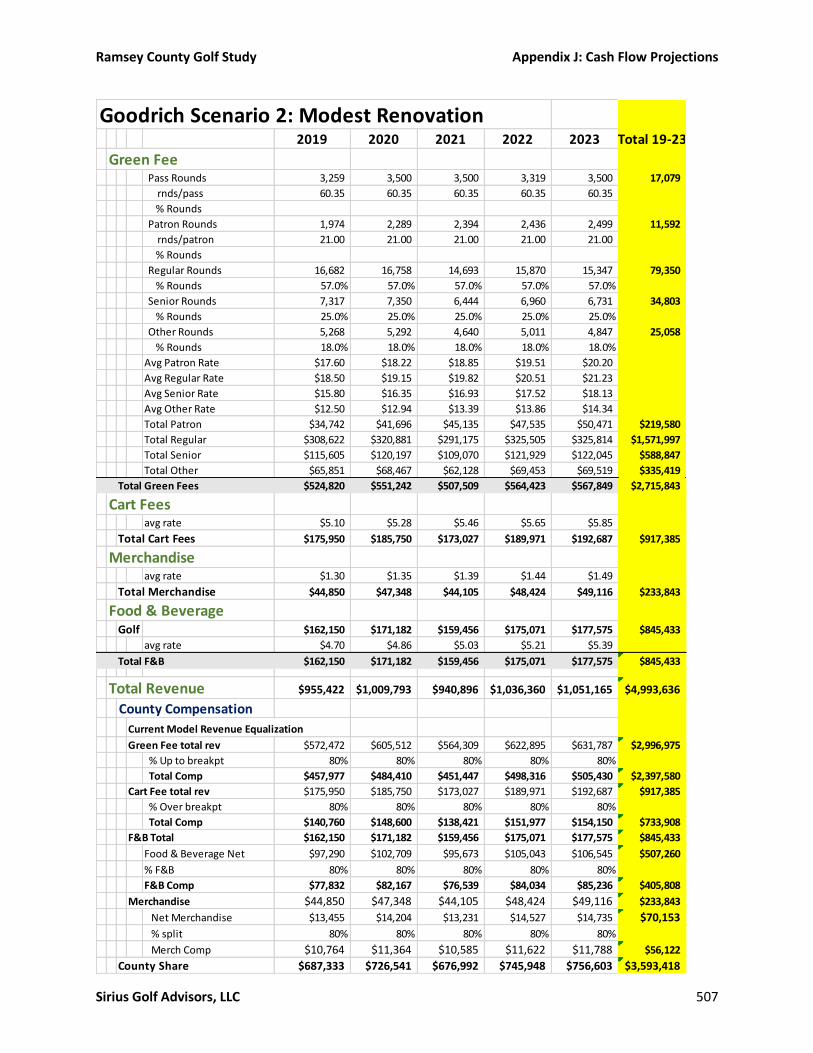
Ramsey County Golf Study Appendix J: Cash Flow Projections
Sirius Golf Advisors, LLC 507
Goodrich Scenario 2: Modest Renovation2019 2020 2021 2022 2023 Total 19-23
Green FeePass Rounds 3,259 3,500 3,500 3,319 3,500 17,079
rnds/pass 60.35 60.35 60.35 60.35 60.35
% Rounds
Patron Rounds 1,974 2,289 2,394 2,436 2,499 11,592
rnds/patron 21.00 21.00 21.00 21.00 21.00
% Rounds
Regular Rounds 16,682 16,758 14,693 15,870 15,347 79,350
% Rounds 57.0% 57.0% 57.0% 57.0% 57.0%
Senior Rounds 7,317 7,350 6,444 6,960 6,731 34,803
% Rounds 25.0% 25.0% 25.0% 25.0% 25.0%
Other Rounds 5,268 5,292 4,640 5,011 4,847 25,058
% Rounds 18.0% 18.0% 18.0% 18.0% 18.0%
Avg Patron Rate $17.60 $18.22 $18.85 $19.51 $20.20
Avg Regular Rate $18.50 $19.15 $19.82 $20.51 $21.23
Avg Senior Rate $15.80 $16.35 $16.93 $17.52 $18.13
Avg Other Rate $12.50 $12.94 $13.39 $13.86 $14.34
Total Patron $34,742 $41,696 $45,135 $47,535 $50,471 $219,580
Total Regular $308,622 $320,881 $291,175 $325,505 $325,814 $1,571,997
Total Senior $115,605 $120,197 $109,070 $121,929 $122,045 $588,847
Total Other $65,851 $68,467 $62,128 $69,453 $69,519 $335,419
Total Green Fees $524,820 $551,242 $507,509 $564,423 $567,849 $2,715,843
Cart Feesavg rate $5.10 $5.28 $5.46 $5.65 $5.85
Total Cart Fees $175,950 $185,750 $173,027 $189,971 $192,687 $917,385
Merchandiseavg rate $1.30 $1.35 $1.39 $1.44 $1.49
Total Merchandise $44,850 $47,348 $44,105 $48,424 $49,116 $233,843
Food & BeverageGolf $162,150 $171,182 $159,456 $175,071 $177,575 $845,433
avg rate $4.70 $4.86 $5.03 $5.21 $5.39
Total F&B $162,150 $171,182 $159,456 $175,071 $177,575 $845,433
Total Revenue $955,422 $1,009,793 $940,896 $1,036,360 $1,051,165 $4,993,636
County Compensation
Current Model Revenue Equalization
Green Fee total rev $572,472 $605,512 $564,309 $622,895 $631,787 $2,996,975
% Up to breakpt 80% 80% 80% 80% 80%
Total Comp $457,977 $484,410 $451,447 $498,316 $505,430 $2,397,580
Cart Fee total rev $175,950 $185,750 $173,027 $189,971 $192,687 $917,385
% Over breakpt 80% 80% 80% 80% 80%
Total Comp $140,760 $148,600 $138,421 $151,977 $154,150 $733,908
F&B Total $162,150 $171,182 $159,456 $175,071 $177,575 $845,433
Food & Beverage Net $97,290 $102,709 $95,673 $105,043 $106,545 $507,260
% F&B 80% 80% 80% 80% 80%
F&B Comp $77,832 $82,167 $76,539 $84,034 $85,236 $405,808
Merchandise $44,850 $47,348 $44,105 $48,424 $49,116 $233,843
Net Merchandise $13,455 $14,204 $13,231 $14,527 $14,735 $70,153
% split 80% 80% 80% 80% 80%
Merch Comp $10,764 $11,364 $10,585 $11,622 $11,788 $56,122
County Share $687,333 $726,541 $676,992 $745,948 $756,603 $3,593,418

Ramsey County Golf Study Appendix J: Cash Flow Projections
Sirius Golf Advisors, LLC 508
Goodrich Scenario 2: Modest Renovation2024 2025 2026 2027 2028 Total 19-23 Total 19-28
Green FeePass Rounds 3,199 3,440 4,285 4,526 4,828 20,278 37,357
rnds/pass 60.35 60.35 60.35 60.35 60.35
% Rounds
Patron Rounds 2,541 2,583 3,381 3,465 3,549 15,519 27,111
rnds/patron 21.00 21.00 21.00 21.00 21.00
% Rounds
Regular Rounds 8,788 8,024 17,575 15,634 17,466 67,487 146,838
% Rounds 57.0% 57.0% 57.0% 57.0% 57.0%
Senior Rounds 3,854 3,519 7,709 6,857 7,660 29,600 64,403
% Rounds 25.0% 25.0% 25.0% 25.0% 25.0%
Other Rounds 2,775 2,534 5,550 4,937 5,516 21,312 46,370
% Rounds 18.0% 18.0% 18.0% 18.0% 18.0%
Avg Patron Rate $16.72 $17.31 $23.75 $24.58 $25.44
Avg Regular Rate $17.58 $18.19 $24.95 $25.82 $26.73
Avg Senior Rate $15.01 $15.54 $21.30 $22.05 $22.82
Avg Other Rate $11.88 $12.29 $16.90 $17.49 $18.10
Total Patron $42,492 $44,706 $80,299 $85,174 $90,292 $342,964 $562,543
Total Regular $154,476 $145,974 $438,508 $403,731 $466,808 $1,609,497 $3,181,495
Total Senior $57,865 $54,680 $164,192 $151,170 $174,788 $602,695 $1,191,541
Total Other $32,961 $31,147 $93,797 $86,359 $99,851 $344,115 $679,534
Total Green Fees $287,794 $276,507 $776,796 $726,433 $831,740 $2,899,270 $5,615,113
Cart Feesavg rate $6.06 $6.27 $6.88 $7.12 $7.37
Total Cart Fees $128,155 $126,008 $264,801 $252,143 $287,483 $1,058,589 $1,975,974
Merchandiseavg rate $1.54 $1.60 $1.65 $1.71 $1.77
Total Merchandise $32,667 $32,120 $63,678 $60,634 $69,132 $258,230 $492,073
Food & BeverageGolf $118,103 $116,125 $230,219 $219,214 $249,939 $933,600 $1,779,033
avg rate $5.58 $5.78 $5.98 $6.19 $6.41
Total F&B $118,103 $116,125 $230,219 $219,214 $249,939 $933,600 $1,779,033
Total Revenue $611,577 $600,187 $1,431,647 $1,363,814 $1,555,107 $5,562,332 $10,555,968
County Compensation
Current Model Revenue Equalization
Green Fee total rev $332,652 $325,935 $872,949 $831,823 $948,554 $3,311,912 $6,308,887
% Up to breakpt 80% 80% 83% 83% 83%
Total Comp $266,122 $260,748 $724,548 $690,413 $787,300 $2,729,130 $5,126,710
Cart Fee total rev $128,155 $126,008 $264,801 $252,143 $287,483 $1,058,589 $1,975,974
% Over breakpt 80% 80% 83% 83% 83%
Total Comp $102,524 $100,806 $219,785 $209,279 $238,611 $871,004 $1,604,912
F&B Total $118,103 $116,125 $230,219 $219,214 $249,939 $933,600 $1,779,033
Food & Beverage Net $70,862 $69,675 $138,131 $131,529 $149,963 $560,160 $1,067,420
% F&B 80% 80% 83% 83% 83%
F&B Comp $56,690 $55,740 $114,649 $109,169 $124,469 $460,717 $866,525
Merchandise $32,667 $32,120 $63,678 $60,634 $69,132 $258,230 $492,073
Net Merchandise $9,800 $9,636 $19,103 $18,190 $20,740 $77,469 $147,622
% split 80% 80% 83% 83% 83%
Merch Comp $7,840 $7,709 $15,856 $15,098 $17,214 $63,716 $119,839
County Share $433,176 $425,004 $1,074,838 $1,023,959 $1,167,594 $4,124,570 $7,717,988

Ramsey County Golf Study Appendix J: Cash Flow Projections
Sirius Golf Advisors, LLC 509
Goodrich Scenario 2: Modest Renovation2019 2020 2021 2022 2023 Total 19-23
Expenses
Current Model Personnel Services $382,321 $399,525 $417,504 $436,291 $455,924 $2,091,565
Other Services & Charges $151,375 $155,916 $160,594 $165,412 $170,374 $803,670
Supplies $62,823 $64,707 $66,649 $68,648 $70,708 $333,535
Fleet Services $283,500 $292,005 $300,765 $309,788 $319,082 $1,505,140
Marketing $17,183 $18,164 $16,925 $18,649 $18,915 $89,835
Total Expenses $897,202 $930,317 $962,436 $998,788 $1,035,003 $4,823,745
Net Income ($209,868) ($203,776) ($285,444) ($252,840) ($278,399) ($1,230,327)
Difference to Status Quo ($20,862) ($2,655) $22,156 $38,636 $66,588 $103,864
Operator Revenue $268,088 $283,252 $263,904 $290,412 $294,562 $1,400,218
Less Cost of Sales $96,255 $101,616 $94,656 $103,925 $105,411 $501,863
Net Operator $171,833 $181,635 $169,248 $186,487 $189,151 $898,355
Hybrid ModelCounty Revenue
Net Revenue $859,167 $908,176 $846,240 $932,435 $945,754 $4,491,773
Breakpoint $850,000 $875,500 $901,000 $926,500 $952,000
Supplement
% Below breakpoint 5% 5% 5% 5% 5%
% Above breakpoint 50% 50% 50% 50% 50%
County Share $47,083 $60,113 $42,312 $49,293 $47,288 $246,089
Expenses Other Services & Charges $6,866 $7,072 $7,284 $7,503 $7,728 $36,452
Supplies $373 $384 $396 $407 $420 $1,980
Supplement $0 $0 $0 $0 $0 $0
Marketing $1,412 $1,803 $1,269 $1,479 $1,419 $7,383
Total Expenses $8,651 $9,259 $8,949 $9,389 $9,566 $45,815
Net Income - Hybrid $38,432 $50,854 $33,363 $39,904 $37,722 $200,274
Difference to Status Quo ($20,862) $251,975 $340,963 $331,379 $382,709 $1,286,165
Operator Hybrid
Revenue Split $908,338 $949,679 $898,584 $987,068 $1,003,878 $4,747,547
Cost of sales $96,255 $101,616 $94,656 $103,925 $105,411 $501,863
Supplement $0 $0 $0 $0 $0 $0
Net Revenue $812,083 $848,063 $803,928 $883,143 $898,466 $4,245,684

Ramsey County Golf Study Appendix J: Cash Flow Projections
Sirius Golf Advisors, LLC 510
Goodrich Scenario 2: Modest Renovation2024 2025 2026 2027 2028 Total 19-23 Total 19-28
Expenses
Current Model Personnel Services $309,687 $323,623 $500,000 $522,500 $546,013 $2,201,822 $4,293,387 Other Services & Charges $114,065 $117,487 $175,000 $180,250 $185,658 $772,460 $1,576,130 Supplies $47,339 $48,759 $76,000 $78,280 $80,628 $331,006 $664,541
Fleet Services $215,000 $221,450 $349,000 $359,470 $370,254 $1,515,174 $3,020,314
Marketing $10,829 $10,625 $26,871 $25,599 $29,190 $103,114 $192,950
Total Expenses $696,920 $721,944 $1,126,871 $1,166,099 $1,211,742 $4,923,576 $9,747,321
Net Income ($263,745) ($296,940) ($52,033) ($142,140) ($44,148) ($799,006) ($2,029,333)
Difference to Status Quo $66,825 $105,440 $410,516 $429,215 $528,318 $1,540,315 $1,644,179
Operator Revenue $178,401 $175,184 $356,809 $339,855 $387,513 $1,437,761 $2,837,979
Less Cost of Sales $70,108 $68,934 $136,662 $130,129 $148,368 $554,201 $1,056,064
Net Operator $108,293 $106,250 $220,147 $209,726 $239,145 $883,560 $1,781,915
Hybrid ModelCounty Revenue
Net Revenue $541,469 $531,254 $1,294,985 $1,233,685 $1,406,739 $5,008,131 $9,499,903
Breakpoint $977,500 $1,003,000 $1,028,500 $1,054,000 $1,079,500
Supplement $50,000 $50,000
% Below breakpoint 5% 5% 5% 5% 5%
% Above breakpoint 50% 50% 50% 50% 50%
County Share $27,073 $26,563 $184,667 $142,542 $217,595 $598,440 $844,529
Expenses Other Services & Charges $7,960 $8,198 $8,444 $8,698 $8,959 $42,258 $78,711 Supplies $432 $445 $459 $472 $486 $2,295 $4,274
Supplement $50,000 $50,000 $100,000 $100,000
Marketing $812 $797 $5,540 $4,276 $6,528 $17,953 $25,336
Total Expenses $59,204 $59,440 $14,443 $13,446 $15,973 $162,506 $208,321
Net Income - Hybrid ($32,131) ($32,878) $170,224 $129,096 $201,622 $435,934 $636,208
Difference to Status Quo $298,439 $369,503 $632,774 $700,451 $774,088 $2,775,254 $4,061,420
Operator Hybrid Debt support ($455,975.54)
Revenue Split $584,503 $573,625 $1,246,979 $1,221,272 $1,337,512 $4,963,891 $9,711,439
Cost of sales $70,108 $68,934 $136,662 $130,129 $148,368 $554,201 $1,056,064
Supplement $50,000 $50,000 $100,000 $100,000
Net Revenue $564,395 $554,691 $1,110,317 $1,091,142 $1,189,145 $4,409,690 $8,655,374

Ramsey County Golf Study Appendix J: Cash Flow Projections
Sirius Golf Advisors, LLC 511
Scenario 2b: Hybrid Contract
Hybrid Model2019 2020 2021 2022 2023 Total 19-23
County RevenueNet Revenue $859,167 $908,176 $846,240 $932,435 $945,754
Breakpoint $850,000 $875,500 $901,000 $926,500 $952,000
County Share $47,083 $60,113 $42,312 $49,293 $47,288
Expenses Other Services & Charges $6,866 $7,072 $7,284 $7,503 $7,728 $36,452
Supplies $373 $384 $396 $407 $420 $1,980
Supplement $0 $0 $0 $0 $0 $0
Marketing $1,412 $1,803 $1,269 $1,479 $1,419 $7,383
Total Expenses $8,651 $9,259 $8,949 $9,389 $9,566 $45,815
Net Income - Hybrid $38,432 $50,854 $33,363 $39,904 $37,722 $200,274
Difference Hybrid ($20,862) $251,975 $340,963 $331,379 $382,709 $1,286,165
Operator Hybrid
Revenue Split $908,338 $949,679 $898,584 $987,068 $1,003,878 $4,993,636
Cost of sales $96,255 $101,616 $94,656 $103,925 $105,411 $501,863
Supplement $0 $0 $0 $0 $0 $0
Net Revenue $812,083 $848,063 $803,928 $883,143 $898,466 $4,491,773
Hybrid Model2024 2025 2026 2027 2028 Total 19-23 Total 19-28
County RevenueNet Revenue $541,469 $531,254 $1,294,985 $1,233,685 $1,406,739
Breakpoint $977,500 $1,003,000 $1,028,500 $1,054,000 $1,079,500
County Share $27,073 $26,563 $184,667 $142,542 $217,595
Expenses Other Services & Charges $7,960 $8,198 $8,444 $8,698 $8,959 $42,258 $78,711 Supplies $432 $445 $459 $472 $486 $2,295 $4,274
Supplement $50,000 $50,000 $100,000 $100,000
Marketing $812 $797 $5,540 $4,276 $6,528 $17,953 $25,336
Total Expenses $59,204 $59,440 $14,443 $13,446 $15,973 $162,506 $208,321
Net Income - Hybrid ($32,131) ($32,878) $170,224 $129,096 $201,622 $435,934 $636,208
Difference Hybrid $298,439 $369,503 $632,774 $700,451 $774,088 $2,775,254 $4,061,420
Operator Hybrid Debt support ($455,975.54)
Revenue Split $584,503 $573,625 $1,246,979 $1,221,272 $1,337,512 $5,562,332 $10,555,968
Cost of sales $70,108 $68,934 $136,662 $130,129 $148,368 $554,201 $1,056,064
Supplement $50,000 $50,000 $100,000 $100,000
Net Revenue $564,395 $554,691 $1,110,317 $1,091,142 $1,189,145 $5,008,131 $9,499,903

Ramsey County Golf Study Appendix J: Cash Flow Projections
Sirius Golf Advisors, LLC 512
Battle Creek
Status Quo
Battlecreek Status Quo2019 2020 2021 2022 2023 Total 19-23
Rounds 18,150 18,241 16,417 18,149 18,239 89,195
RevenuePasses
Regular $9,101 $9,648 $9,648 $10,226 $11,013 $49,636
Quantity 13 13 13 13 14
Unit $700 $742 $742 $787 $787
Senior $15,378 $16,301 $17,042 $18,064 $18,850 $85,634
Quantity 22 22 23 23 24
Unit $699 $741 $741 $785 $785
Junior $1,330 $1,410 $1,410 $1,495 $1,495 $7,139
Quantity 3 3 3 3 3
Unit $443 $470 $470 $498 $498
Total Passes $25,810 $27,358 $28,099 $29,785 $31,357 $142,409
Patron CardResident
Regular $978 $1,036 $1,061 $1,177 $1,177 $5,429
Quantity 42 42 43 45 45
Unit $23 $25 $25 $26 $26
Total Patron Cards $978 $1,036 $1,061 $1,177 $1,177 $5,429
Green FeePass Rounds 2,356 2,356 2,418 2,418 2,542 12,090
rnds/pass 62.00 62.00 62.00 62.00 62.00
Patron Rounds 447 447 458 479 479 2,311
rnds/patron 10.65 10.65 10.65 10.65 10.65
Regular Rounds 7,187 7,229 6,341 7,142 7,126 35,025
% Rounds 46.8% 46.8% 46.8% 46.8% 46.8%
Senior Rounds 3,135 3,154 2,766 3,116 3,109 15,280
% Rounds 20.4% 20.4% 20.4% 20.4% 20.4%
Other Rounds 5,025 5,055 4,434 4,994 4,983 24,489
% Rounds 32.7% 32.7% 32.7% 32.7% 32.7%
Avg Patron Rate $16.50 $17.49 $17.49 $18.54 $18.54
Avg Regular Rate $18.25 $19.35 $19.35 $20.51 $20.51
Avg Senior Rate $14.00 $14.84 $14.84 $15.73 $15.73
Avg Other Rate $3.93 $4.17 $4.17 $4.42 $4.42
Total Patron $7,380 $7,823 $8,010 $8,885 $8,885 $40,983
Total Regular $131,157 $139,848 $122,666 $146,452 $146,133 $686,256
Total Senior $43,893 $46,801 $41,051 $49,011 $48,905 $229,661
Total Other $19,758 $21,067 $18,479 $22,062 $22,014 $103,381
Total Green Fees $202,188 $215,540 $190,205 $226,411 $225,937 $1,060,281
Cart Feesavg rate $4.65 $4.93 $4.93 $5.22 $5.22
Total Cart Fees $84,398 $89,909 $80,918 $94,822 $95,296 $445,342
Rangeavg rate $8.44 $8.69 $8.95 $9.22 $9.50
Total Range $153,186 $158,570 $146,995 $167,378 $173,261 $799,390
Merchandiseavg rate $2.03 $2.09 $2.15 $2.22 $2.28
Total Merchandise $36,828 $38,123 $35,340 $40,240 $41,655 $192,185
Food & BeverageGolf $95,288 $98,637 $91,436 $104,115 $107,775 $497,251
avg rate $5.25 $5.41 $5.57 $5.74 $5.91
Total F&B $95,288 $98,637 $91,436 $104,115 $107,775 $497,251
Total Revenue $598,674 $629,173 $574,054 $663,928 $676,458 $3,142,288

Ramsey County Golf Study Appendix J: Cash Flow Projections
Sirius Golf Advisors, LLC 513
Battlecreek Status Quo2024 2025 2026 2027 2028 Total 24-28 Total 19-28
Rounds 18,880 17,936 17,757 15,981 16,864 87,420 176,615
RevenuePasses
Regular $11,674 $12,374 $12,374 $13,117 $14,054 $63,592 $113,228
Quantity 14 14 14 14 15
Unit $834 $884 $884 $937 $937 $4,475 $4,475
Senior $19,981 $21,179 $22,062 $23,386 $23,386 $109,993 $195,627
Quantity 24 24 25 25 25
Unit $833 $882 $882 $935 $935 $4,468 $4,468
Junior $1,584 $1,679 $1,679 $1,780 $1,780 $8,503 $15,643
Quantity 3 3 3 3 3
Unit $528 $560 $560 $593 $593 $2,834 $2,834
Total Passes $33,239 $35,233 $36,115 $38,282 $39,219 $182,089 $324,498
Patron CardResident
Regular $1,275 $1,352 $1,411 $1,495 $1,495 $7,029 $12,458
Quantity 46 46 48 48 48
Unit $28 $29 $29 $31 $31
Total Patron Cards $1,275 $1,352 $1,411 $1,495 $1,495 $7,029 $12,458
Green FeePass Rounds 2,542 2,542 2,604 2,604 2,666 12,958 25,048
rnds/pass 62.00 62.00 62.00 62.00 62.00
Patron Rounds 490 490 511 511 511 2,513 4,824
rnds/patron 10.65 10.65 10.65 10.65 10.65
Regular Rounds 7,422 6,980 6,857 6,025 6,410 33,693 68,718
% Rounds 46.8% 46.8% 46.8% 46.8% 46.8%
Senior Rounds 3,238 3,045 2,991 2,628 2,796 14,698 29,978
% Rounds 20.4% 20.4% 20.4% 20.4% 20.4%
Other Rounds 5,189 4,880 4,794 4,213 4,481 23,558 48,047
% Rounds 32.7% 32.7% 32.7% 32.7% 32.7%
Avg Patron Rate $19.65 $19.65 $20.83 $20.83 $22.08
Avg Regular Rate $21.74 $21.74 $23.04 $23.04 $24.42
Avg Senior Rate $16.67 $16.67 $17.67 $17.67 $18.74
Avg Other Rate $4.68 $4.96 $5.26 $5.58 $5.91
Total Patron $9,627 $9,627 $10,649 $10,649 $11,288 $51,840 $92,823
Total Regular $161,318 $151,709 $157,978 $138,819 $156,537 $766,362 $1,452,617
Total Senior $53,986 $50,771 $52,868 $46,457 $52,386 $256,469 $486,129
Total Other $24,302 $24,226 $25,227 $23,497 $26,496 $123,747 $227,128
Total Green Fees $249,234 $236,333 $246,722 $219,422 $246,708 $1,198,418 $2,258,698
Cart Feesavg rate $5.54 $5.87 $5.87 $6.22 $6.22
Total Cart Fees $104,564 $105,296 $104,243 $99,448 $104,943 $518,495 $963,837
Rangeavg rate $9.78 $10.08 $10.38 $10.69 $11.01
Total Range $184,732 $180,760 $184,321 $170,866 $185,715 $906,394 $1,705,784
Merchandiseavg rate $2.35 $2.42 $2.50 $2.57 $2.65
Total Merchandise $44,412 $43,457 $44,314 $41,079 $44,649 $217,910 $410,096
Food & BeverageGolf $114,910 $112,440 $114,655 $106,285 $115,522 $563,811 $1,061,063
avg rate $6.09 $6.27 $6.46 $6.65 $6.85
Total F&B $114,910 $112,440 $114,655 $106,285 $115,522 $563,811 $1,061,063
Total Revenue $732,367 $714,871 $731,780 $676,877 $738,251 $3,594,146 $6,736,434

Ramsey County Golf Study Appendix J: Cash Flow Projections
Sirius Golf Advisors, LLC 514
Battlecreek Status Quo2019 2020 2021 2022 2023 Total 19-23
County CompensationGreen Fee total rev $228,975 $243,935 $219,365 $257,373 $258,471 $1,208,120
Breakpoint $225,000 $225,000 $225,000 $225,000 $225,000
% Up to breakpt 90% 90% 90% 90% 90%
% Over breakpt 85% 85% 85% 85% 85%
Total Comp $205,879 $218,595 $197,429 $230,017 $230,950 $1,082,870
Cart Fee total rev $84,398 $89,909 $80,918 $94,822 $95,296 $445,342
Breakpoint $65,000 $65,000 $65,000 $65,000 $65,000
% Up to breakpt 90% 90% 90% 90% 90%
% Over breakpt 85% 85% 85% 85% 85%
Total Comp $74,988 $79,672 $72,030 $83,849 $84,252 $394,791
Range $153,186 $158,570 $146,995 $167,378 $173,261 $799,390
Breakpoint $135,000 $135,000 $135,000 $135,000 $135,000
% Up to breakpt 80% 80% 80% 80% 80%
% Over breakpt 75% 75% 75% 75% 75%
Total Comp $121,640 $125,678 $116,996 $132,283 $136,696 $633,293
Food & Beverage $95,288 $98,637 $91,436 $104,115 $107,775 $497,251 Breakpoint $40,000 $40,000 $40,000 $40,000 $40,000
% Up to breakpt 5% 5% 5% 5% 5%
% Over breakpt 5% 5% 5% 5% 5%
Total Comp $4,764 $4,932 $4,572 $5,206 $5,389 $24,863
County Share $407,271 $428,877 $391,027 $451,355 $457,287 $2,135,816
Expenses Personnel Services $303,890 $317,565 $331,856 $346,789 $362,395 $1,662,495
Other Services & Charges $154,342 $158,973 $163,742 $168,654 $173,714 $819,425
Supplies $50,873 $52,399 $53,971 $55,590 $57,258 $270,090
Capital OutlayFleet Services $205,800 $211,974 $218,333 $224,883 $231,630 $1,092,620
Total Expenses $714,905 $740,911 $767,902 $795,917 $824,996 $3,844,630
Net Income ($307,635) ($312,034) ($376,875) ($344,561) ($367,709) ($1,708,814)
Operator $191,404 $200,297 $183,027 $212,573 $219,171 $1,006,472
less COS $64,631 $66,903 $62,019 $70,619 $73,101 $337,274
Net Operator $126,772 $133,394 $121,008 $141,954 $146,070 $669,199
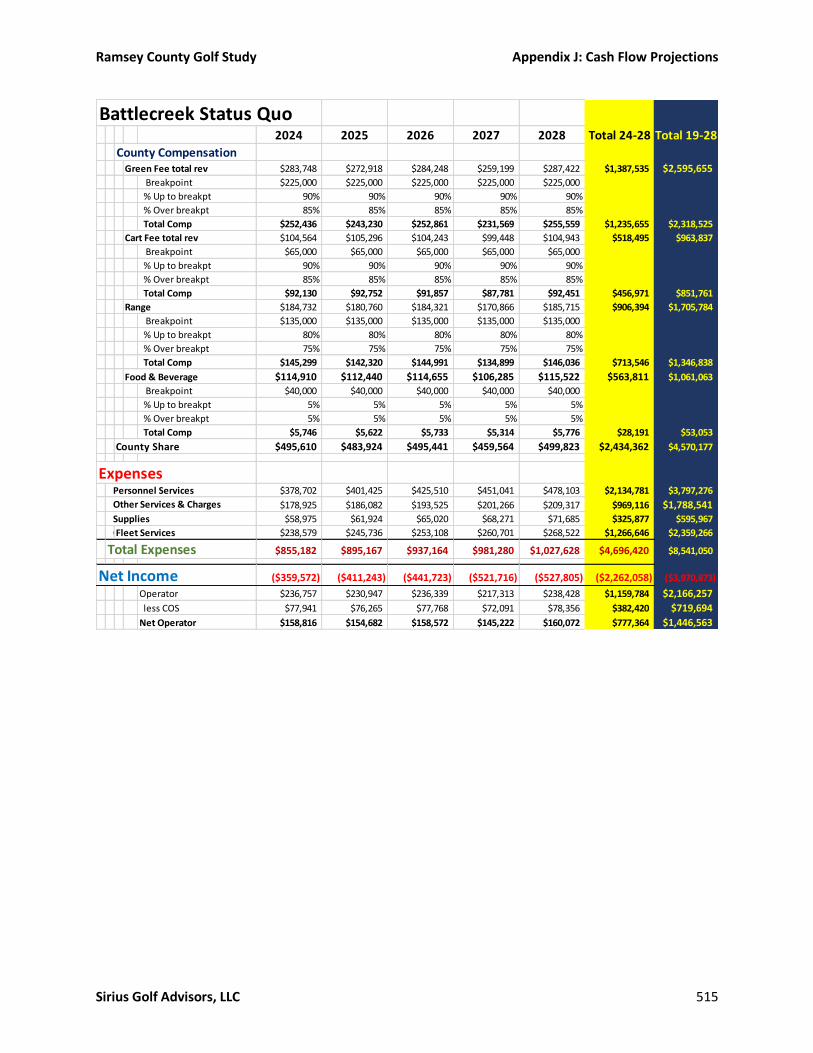
Ramsey County Golf Study Appendix J: Cash Flow Projections
Sirius Golf Advisors, LLC 515
Battlecreek Status Quo2024 2025 2026 2027 2028 Total 24-28 Total 19-28
County CompensationGreen Fee total rev $283,748 $272,918 $284,248 $259,199 $287,422 $1,387,535 $2,595,655
Breakpoint $225,000 $225,000 $225,000 $225,000 $225,000
% Up to breakpt 90% 90% 90% 90% 90%
% Over breakpt 85% 85% 85% 85% 85%
Total Comp $252,436 $243,230 $252,861 $231,569 $255,559 $1,235,655 $2,318,525
Cart Fee total rev $104,564 $105,296 $104,243 $99,448 $104,943 $518,495 $963,837
Breakpoint $65,000 $65,000 $65,000 $65,000 $65,000
% Up to breakpt 90% 90% 90% 90% 90%
% Over breakpt 85% 85% 85% 85% 85%
Total Comp $92,130 $92,752 $91,857 $87,781 $92,451 $456,971 $851,761
Range $184,732 $180,760 $184,321 $170,866 $185,715 $906,394 $1,705,784
Breakpoint $135,000 $135,000 $135,000 $135,000 $135,000
% Up to breakpt 80% 80% 80% 80% 80%
% Over breakpt 75% 75% 75% 75% 75%
Total Comp $145,299 $142,320 $144,991 $134,899 $146,036 $713,546 $1,346,838
Food & Beverage $114,910 $112,440 $114,655 $106,285 $115,522 $563,811 $1,061,063
Breakpoint $40,000 $40,000 $40,000 $40,000 $40,000
% Up to breakpt 5% 5% 5% 5% 5%
% Over breakpt 5% 5% 5% 5% 5%
Total Comp $5,746 $5,622 $5,733 $5,314 $5,776 $28,191 $53,053
County Share $495,610 $483,924 $495,441 $459,564 $499,823 $2,434,362 $4,570,177
Expenses Personnel Services $378,702 $401,425 $425,510 $451,041 $478,103 $2,134,781 $3,797,276
Other Services & Charges $178,925 $186,082 $193,525 $201,266 $209,317 $969,116 $1,788,541 Supplies $58,975 $61,924 $65,020 $68,271 $71,685 $325,877 $595,967
Capital OutlayFleet Services $238,579 $245,736 $253,108 $260,701 $268,522 $1,266,646 $2,359,266
Total Expenses $855,182 $895,167 $937,164 $981,280 $1,027,628 $4,696,420 $8,541,050
Net Income ($359,572) ($411,243) ($441,723) ($521,716) ($527,805) ($2,262,058) ($3,970,873)
Operator $236,757 $230,947 $236,339 $217,313 $238,428 $1,159,784 $2,166,257
less COS $77,941 $76,265 $77,768 $72,091 $78,356 $382,420 $719,694
Net Operator $158,816 $154,682 $158,572 $145,222 $160,072 $777,364 $1,446,563

Ramsey County Golf Study Appendix J: Cash Flow Projections
Sirius Golf Advisors, LLC 516
Scenario 1: Elite Nine
Battlecreek Elite 92019 2020 2021 2022 2023 Total 19-23
Rounds 19,500 17,200 21,000 20,875 20,458 99,033
Priority Fixes
RevenuePasses
Regular $4,508 $5,599 $6,761 $7,997 $9,311 $34,176
Quantity 5.0 6 7 8 9
Unit $902 $933 $966 $1,000 $1,035
Senior $7,118 $7,367 $7,625 $7,892 $8,168 $38,169
Quantity 10 10 10 10 10
Unit $712 $737 $762 $789 $817
Junior $1,139 $1,179 $1,220 $631 $653 $4,822
Quantity 4 4 4 2 2
Unit $285 $295 $305 $316 $327
Weekday Regular $6,064 $6,974 $4,331 $4,482 $4,639 $26,491
Quantity 9 10 6 6 6
Unit $674 $697 $722 $747 $773
Weekday Senior $7,972 $8,251 $8,540 $11,196 $12,197 $48,156
Quantity 15 15 15 19 20
Unit $531.5 $550 $569 $589 $610
Total Passes 43 45 42 45 47
Total Passes $26,801 $29,370 $28,476 $32,198 $34,969 $151,814
Patron CardResident
Regular $418 $432 $447 $463 $479 $2,239
Quantity 11 11 11 11 11
Unit $37.96 $39.29 $40.67 $42.09 $43.56
Senior $427.07 $442.02 $457.49 $473.50 $490.07 $2,290.15
Quantity 15 15 15 15 15
Unit $28.47 $29.47 $30.50 $31.57 $32.67
Premium $427.07 $442.02 $457.49 $473.50 $490.07 $2,290.15
Quantity 5 5 5 5 5
Unit $85.41 $88.40 $91.50 $94.70 $98.01
Premium Senior $398.60 $412.55 $426.99 $441.93 $457.40 $2,137.48
Quantity 6 6 6 6 6
Unit $66.43 $68.76 $71.16 $73.66 $76.23
Non-Resident
Regular $189.81 $196.45 $203.33 $210.45 $217.81 $1,017.85
Quantity 4 4 4 4 4
Unit $47.45 $49.11 $50.83 $52.61 $54.45
Senior $303.69 $314.32 $325.33 $336.71 $348.50 $1,628.55
Quantity 8 8 8 8 8
Unit $37.96 $39.29 $40.67 $42.09 $43.56
Premium $379.62 $884.04 $1,219.97 $1,367.89 $1,633.58 $5,485.10
Quantity 4 9 12 13 15
Unit $94.90 $98.23 $101.66 $105.22 $108.91
Premium Senior $379.62 $1,414.46 $1,626.63 $1,767.74 $1,916.73 $7,105.18
Quantity 5 18 20 21 22
Unit $75.92 $78.58 $81.33 $84.18 $87.12
Total quantity 58 76 81 83 86
Total Patron Cards $2,923 $4,538 $5,165 $5,535 $6,033 $24,194
Green FeePass Rounds 2,666 2,790 2,604 2,790 2,914 13,764
rnds/pass 62.00 62.00 62.00 62.00 62.00
% Rounds
Patron Rounds 696 912 972 996 1,032 4,608
rnds/patron 12.00 12.00 12.00 12.00 12.00
% Rounds
Regular Rounds 7,585 6,344 8,712 8,545 8,256 39,441
% Rounds 47.0% 47.0% 50.0% 50.0% 50.0%
Senior Rounds 3,389 2,835 4,008 3,930 3,798 17,959
% Rounds 21.0% 21.0% 23.0% 23.0% 23.0%
Other Rounds 5,164 4,319 4,704 4,614 4,458 23,260
% Rounds 32.0% 32.0% 27.0% 27.0% 27.0%
Avg Patron Rate $18.50 $18.96 $19.42 $20.00 $20.70
Avg Regular Rate $19.50 $19.98 $20.47 $22.00 $22.77
Avg Senior Rate $16.25 $16.65 $17.06 $17.00 $17.60
Avg Other Rate $6.50 $6.73 $7.25 $7.50 $7.77
Total Patron $12,876 $17,288 $18,879 $19,920 $21,362 $90,326
Total Regular $147,905 $126,759 $178,363 $187,979 $187,983 $828,988
Total Senior $55,071 $47,197 $68,372 $66,818 $66,820 $304,278
Total Other $33,567 $29,058 $34,107 $34,623 $34,623 $165,979
Total Green Fees $249,419 $220,302 $299,722 $309,340 $310,789 $1,389,571

Ramsey County Golf Study Appendix J: Cash Flow Projections
Sirius Golf Advisors, LLC 517
Battlecreek Elite 92024 2025 2026 2027 2028 Total 19-23Total 19-28
Rounds 21,910 20,814 21,000 18,900 20,627 103,252 202,284
RevenuePasses
Regular $10,708 $12,191 $13,765 $16,621 $19,660 $72,946 $107,122
Quantity 10 11 12 14 16
Unit $1,071 $1,108 $1,147 $1,187 $1,229
Senior $8,454 $8,750 $9,056 $9,373 $9,701 $45,333 $83,502
Quantity 10 10 10 10 10
Unit $845 $875 $906 $937 $970
Junior $676 $1,050 $1,087 $1,125 $1,164 $5,102 $9,924
Quantity 2 3 3 3 3
Unit $338 $350 $362 $375 $388
Weekday Regular $4,802 $5,798 $6,001 $6,211 $6,428 $29,240 $55,732
Quantity 6 7 7 7 7
Unit $800 $828 $857 $887 $918
Weekday Senior $13,256 $13,719 $14,876 $16,096 $17,384 $75,331 $123,487
Quantity 21 21 22 23 24
Unit $631 $653 $676 $700 $724
Total Passes 49 52 54 57 60
Total Passes $37,895 $41,508 $44,784 $49,426 $54,338 $227,952 $379,767
Patron CardResident
Regular $496 $513 $531 $550 $569 $2,660 $4,899
Quantity 11 11 11 11 11
Unit $45.09 $46.66 $48.30 $49.99 $51.74
Senior $507.23 $524.98 $543.35 $562.37 $582.05 $2,719.98 $5,010
Quantity 15 15 15 15 15
Unit $33.82 $35.00 $36.22 $37.49 $38.80
Premium $507.23 $524.98 $543.35 $562.37 $582.05 $2,719.98 $5,010
Quantity 5 5 5 5 5
Unit $101.45 $105.00 $108.67 $112.47 $116.41
Premium Senior $473.41 $489.98 $507.13 $524.88 $543.25 $2,538.65 $4,676
Quantity 6 6 6 6 6
Unit $78.90 $81.66 $84.52 $87.48 $90.54
Non-ResidentRegular $225.43 $233.32 $241.49 $249.94 $258.69 $1,208.88 $2,227
Quantity 4 4 4 4 4
Unit $56.36 $58.33 $60.37 $62.49 $64.67
Senior $360.69 $373.32 $386.38 $399.91 $413.91 $1,934.21 $3,563
Quantity 8 8 8 8 8
Unit $45.09 $46.66 $48.30 $49.99 $51.74
Premium $1,803.47 $1,983.26 $2,173.41 $2,374.46 $2,586.91 $10,921.50 $16,407
Quantity 16 17 18 19 20
Unit $112.72 $116.66 $120.75 $124.97 $129.35
Premium Senior $2,073.99 $2,239.91 $2,414.90 $2,599.40 $2,793.86 $12,122.07 $19,227
Quantity 23 24 25 26 27
Unit $90.17 $93.33 $96.60 $99.98 $103.48
Total quantity 88 90 92 94 96
Total Patron Cards $6,447 $6,883 $7,341 $7,823 $8,330 $36,825 $61,019
Green FeePass Rounds 3,038 3,224 3,348 3,534 3,720 16,864 30,628
rnds/pass 62.00 62.00 62.00 62.00 62.00
% Rounds
Patron Rounds 1,056 1,080 1,104 1,128 1,152 5,520 10,128
rnds/patron 12.00 12.00 12.00 12.00 12.00
% Rounds
Regular Rounds 8,908 8,255 8,274 7,119 7,878 40,434 79,875
% Rounds 50.0% 50.0% 50.0% 50.0% 50.0%
Senior Rounds 4,098 3,797 3,806 3,275 3,624 18,600 36,559
% Rounds 23.0% 23.0% 23.0% 23.0% 23.0%
Other Rounds 4,810 4,458 4,468 3,844 4,254 21,834 45,094
% Rounds 27.0% 27.0% 27.0% 27.0% 27.0%
Avg Patron Rate $21.42 $22.17 $22.95 $23.75 $24.59
Avg Regular Rate $23.57 $24.39 $25.25 $26.13 $27.04
Avg Senior Rate $18.21 $18.85 $19.51 $20.19 $20.90
Avg Other Rate $8.04 $8.32 $8.61 $8.91 $9.22
Total Patron $22,624 $23,948 $25,337 $26,794 $28,322 $127,026 $217,352
Total Regular $209,934 $201,360 $208,881 $186,013 $213,042 $1,019,231 $1,848,219
Total Senior $74,622 $71,574 $74,248 $66,119 $75,727 $362,290 $666,568
Total Other $38,666 $37,087 $38,472 $34,260 $39,239 $187,725 $353,704
Total Green Fees $345,847 $333,970 $346,939 $313,187 $356,330 $1,696,272 $3,085,843
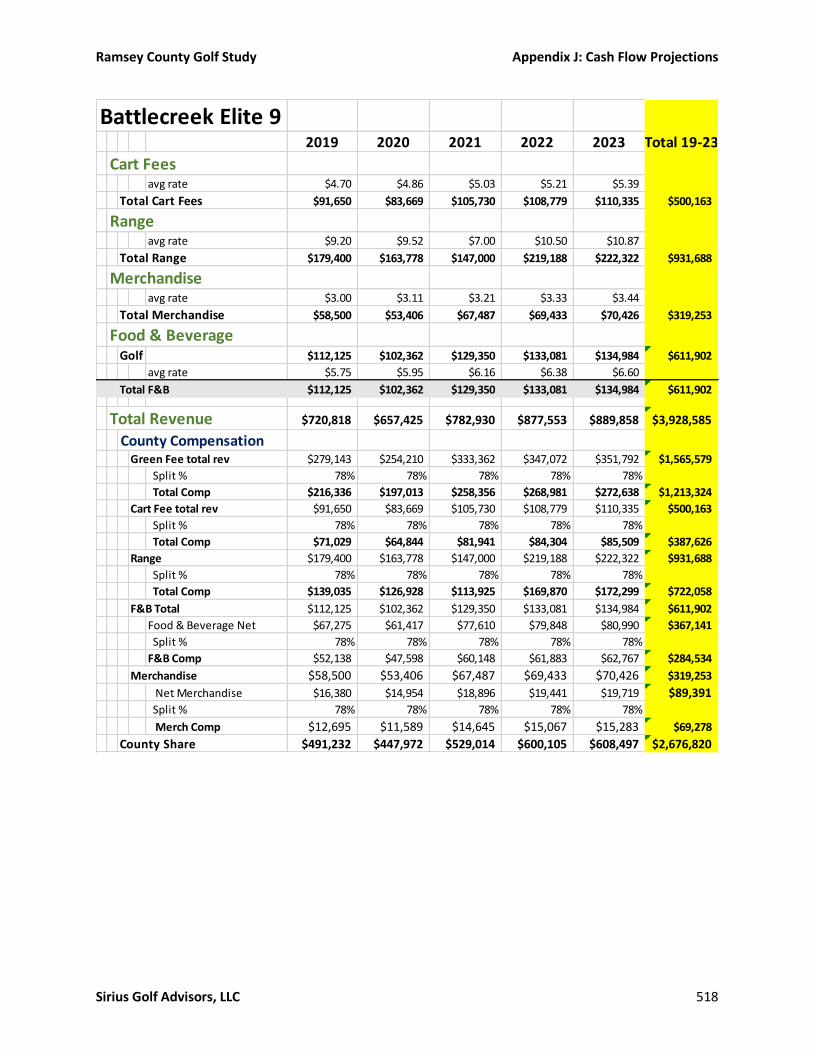
Ramsey County Golf Study Appendix J: Cash Flow Projections
Sirius Golf Advisors, LLC 518
Battlecreek Elite 92019 2020 2021 2022 2023 Total 19-23
Cart Feesavg rate $4.70 $4.86 $5.03 $5.21 $5.39
Total Cart Fees $91,650 $83,669 $105,730 $108,779 $110,335 $500,163
Rangeavg rate $9.20 $9.52 $7.00 $10.50 $10.87
Total Range $179,400 $163,778 $147,000 $219,188 $222,322 $931,688
Merchandiseavg rate $3.00 $3.11 $3.21 $3.33 $3.44
Total Merchandise $58,500 $53,406 $67,487 $69,433 $70,426 $319,253
Food & BeverageGolf $112,125 $102,362 $129,350 $133,081 $134,984 $611,902
avg rate $5.75 $5.95 $6.16 $6.38 $6.60
Total F&B $112,125 $102,362 $129,350 $133,081 $134,984 $611,902
Total Revenue $720,818 $657,425 $782,930 $877,553 $889,858 $3,928,585
County CompensationGreen Fee total rev $279,143 $254,210 $333,362 $347,072 $351,792 $1,565,579
Split % 78% 78% 78% 78% 78%
Total Comp $216,336 $197,013 $258,356 $268,981 $272,638 $1,213,324
Cart Fee total rev $91,650 $83,669 $105,730 $108,779 $110,335 $500,163
Split % 78% 78% 78% 78% 78%
Total Comp $71,029 $64,844 $81,941 $84,304 $85,509 $387,626
Range $179,400 $163,778 $147,000 $219,188 $222,322 $931,688
Split % 78% 78% 78% 78% 78%
Total Comp $139,035 $126,928 $113,925 $169,870 $172,299 $722,058
F&B Total $112,125 $102,362 $129,350 $133,081 $134,984 $611,902
Food & Beverage Net $67,275 $61,417 $77,610 $79,848 $80,990 $367,141
Split % 78% 78% 78% 78% 78%
F&B Comp $52,138 $47,598 $60,148 $61,883 $62,767 $284,534
Merchandise $58,500 $53,406 $67,487 $69,433 $70,426 $319,253
Net Merchandise $16,380 $14,954 $18,896 $19,441 $19,719 $89,391 Split % 78% 78% 78% 78% 78%
Merch Comp $12,695 $11,589 $14,645 $15,067 $15,283 $69,278
County Share $491,232 $447,972 $529,014 $600,105 $608,497 $2,676,820
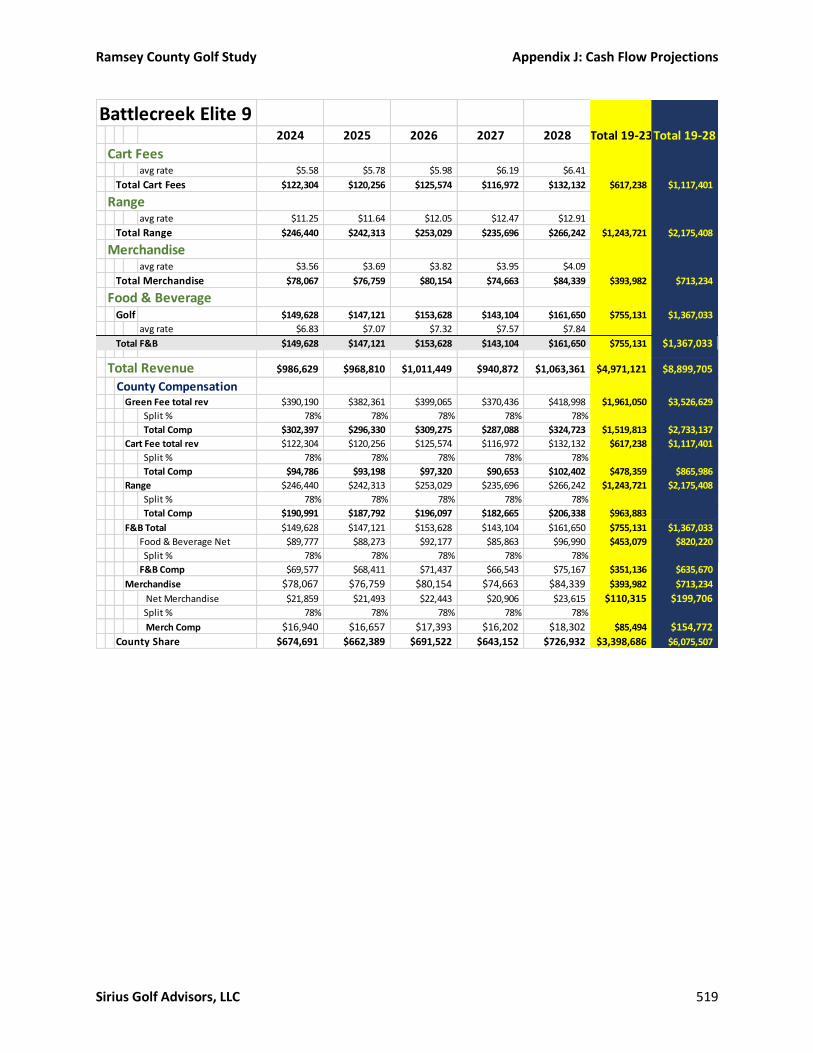
Ramsey County Golf Study Appendix J: Cash Flow Projections
Sirius Golf Advisors, LLC 519
Battlecreek Elite 92024 2025 2026 2027 2028 Total 19-23Total 19-28
Cart Feesavg rate $5.58 $5.78 $5.98 $6.19 $6.41
Total Cart Fees $122,304 $120,256 $125,574 $116,972 $132,132 $617,238 $1,117,401
Rangeavg rate $11.25 $11.64 $12.05 $12.47 $12.91
Total Range $246,440 $242,313 $253,029 $235,696 $266,242 $1,243,721 $2,175,408
Merchandiseavg rate $3.56 $3.69 $3.82 $3.95 $4.09
Total Merchandise $78,067 $76,759 $80,154 $74,663 $84,339 $393,982 $713,234
Food & BeverageGolf $149,628 $147,121 $153,628 $143,104 $161,650 $755,131 $1,367,033
avg rate $6.83 $7.07 $7.32 $7.57 $7.84
Total F&B $149,628 $147,121 $153,628 $143,104 $161,650 $755,131 $1,367,033
Total Revenue $986,629 $968,810 $1,011,449 $940,872 $1,063,361 $4,971,121 $8,899,705
County CompensationGreen Fee total rev $390,190 $382,361 $399,065 $370,436 $418,998 $1,961,050 $3,526,629
Split % 78% 78% 78% 78% 78%
Total Comp $302,397 $296,330 $309,275 $287,088 $324,723 $1,519,813 $2,733,137
Cart Fee total rev $122,304 $120,256 $125,574 $116,972 $132,132 $617,238 $1,117,401
Split % 78% 78% 78% 78% 78%
Total Comp $94,786 $93,198 $97,320 $90,653 $102,402 $478,359 $865,986
Range $246,440 $242,313 $253,029 $235,696 $266,242 $1,243,721 $2,175,408
Split % 78% 78% 78% 78% 78%
Total Comp $190,991 $187,792 $196,097 $182,665 $206,338 $963,883
F&B Total $149,628 $147,121 $153,628 $143,104 $161,650 $755,131 $1,367,033
Food & Beverage Net $89,777 $88,273 $92,177 $85,863 $96,990 $453,079 $820,220
Split % 78% 78% 78% 78% 78%
F&B Comp $69,577 $68,411 $71,437 $66,543 $75,167 $351,136 $635,670
Merchandise $78,067 $76,759 $80,154 $74,663 $84,339 $393,982 $713,234
Net Merchandise $21,859 $21,493 $22,443 $20,906 $23,615 $110,315 $199,706 Split % 78% 78% 78% 78% 78%
Merch Comp $16,940 $16,657 $17,393 $16,202 $18,302 $85,494 $154,772
County Share $674,691 $662,389 $691,522 $643,152 $726,932 $3,398,686 $6,075,507

Ramsey County Golf Study Appendix J: Cash Flow Projections
Sirius Golf Advisors, LLC 520
Battlecreek Elite 92019 2020 2021 2022 2023 Total 19-23
Expenses Personnel Services $319,085 $333,444 $348,448 $364,129 $380,514 $1,745,620
Other Services & Charges $162,060 $166,921 $171,929 $177,087 $182,399 $860,396
Supplies $53,416 $55,019 $56,669 $58,370 $60,121 $283,595
Marketing $9,825 $8,959 $10,580 $12,002 $12,170 $53,536
Capital OutlayFleet Services $205,800 $211,974 $218,333 $224,883 $231,630 $1,092,620
Total Expenses $750,185 $776,317 $805,960 $836,470 $866,834 $4,035,767
Net Income ($258,953) ($328,345) ($276,946) ($236,366) ($258,337) ($1,358,947)
Difference to Status Quo $48,682 ($16,311) $99,929 $108,196 $109,372 $349,868
# Compensation percentages changed effective 2018
Operator $229,586 $209,453 $253,916 $277,448 $281,361 $3,859,307
Less Cost of Sales $86,970 $79,397 $100,331 $103,224 $104,701 $474,623
Net Operator $142,616 $130,056 $153,585 $174,224 $176,660 $3,384,684
Hybrid Model 2020County Revenue
Net Revenue $633,848 $578,028 $682,599 $774,329 $785,158 $3,453,962
Breakpoint $650,000 $669,500 $689,000 $708,500 $728,000
% Below breakpoint 5% 5% 5% 5% 5%
% Above breakpoint 50% 50% 50% 50% 50%
County Share $491,232 $28,901 $34,130 $68,339 $64,979 $687,582
Expenses Other Services & Charges $6,866 $7,072 $7,284 $7,503 $7,728 $36,452
Supplies $373 $384 $396 $407 $420 $1,980
Supplement $0 $60,000 $0 $60,000
Marketing $1,602 $1,651 $1,700 $1,751 $1,804 $8,508
Total Expenses $750,185 $69,107 $9,380 $9,661 $9,951 $848,284
Net Income - Hybrid ($258,953) ($40,205) $24,750 $58,678 $55,028 ($160,702)
Difference to Status Quo $48,682 $271,829 $401,625 $403,240 $422,737 $1,548,112
Operator Hybrid
Revenue Split $229,586 $628,524 $748,800 $809,214 $824,879 $3,241,003
Cost of sales $86,970 $79,397 $100,331 $103,224 $104,701 $474,623
Supplement $0 $60,000 $0 $0 $0 $60,000
Net Revenue $142,616 $609,127 $648,469 $705,989 $720,179 $2,826,380

Ramsey County Golf Study Appendix J: Cash Flow Projections
Sirius Golf Advisors, LLC 521
Battlecreek Elite 92024 2025 2026 2027 2028 Total 19-23Total 19-28
Expenses Personnel Services $397,638 $415,531 $434,230 $453,771 $474,190 $2,175,360 $3,920,979 Other Services & Charges $187,871 $193,508 $199,313 $205,292 $211,451 $997,435 $1,857,831 Supplies $61,924 $63,782 $65,695 $67,666 $69,696 $328,764 $612,359
Marketing $13,494 $13,248 $13,830 $12,863 $14,539 $67,974 $121,510 Capital OutlayFleet Services $238,579 $245,736 $253,108 $260,701 $268,522 $1,266,646 $2,359,266
Total Expenses $899,506 $931,804 $966,177 $1,000,293 $1,038,398 $4,836,179 $8,871,946
Net Income ($224,814) ($269,416) ($274,654) ($357,142) ($311,466) ($1,437,492) ($2,796,439)
Difference to Status Quo $134,758 $141,827 $167,069 $164,574 $216,339 $824,566 $1,174,434
# Compensation percentages changed effective 2018
Operator $311,937 $306,421 $319,926 $297,721 $336,429 $4,885,627 $8,744,933
Less Cost of Sales $116,059 $114,115 $119,162 $110,999 $125,384 $585,719 $1,060,342
Net Operator $195,878 $192,306 $200,765 $186,721 $211,045 $4,299,907 $7,684,591
Hybrid Model 2020County Revenue
Net Revenue $870,570 $854,695 $892,287 $829,873 $937,977 $4,385,401 $7,839,363
Breakpoint $747,500 $767,000 $786,500 $806,000 $825,500
% Below breakpoint 5% 5% 5% 5% 5%
% Above breakpoint 50% 50% 50% 50% 50%
County Share $98,910 $82,197 $92,218 $52,236 $97,514 $423,076 $1,110,657
Expenses Other Services & Charges $7,960 $8,198 $8,444 $8,698 $8,959 $42,258 $78,711 Supplies $432 $445 $459 $472 $486 $2,295 $4,274
Supplement $0 $0 $0 $60,000
Marketing $1,858 $1,913 $1,971 $2,030 $2,091 $9,863 $18,371
Total Expenses $10,250 $10,557 $10,874 $11,200 $11,536 $54,416 $902,700
Net Income - Hybrid $88,660 $71,640 $81,345 $41,037 $85,978 $368,660 $207,958
Difference to Status Quo $448,232 $482,883 $523,068 $562,752 $613,782 $2,630,718 $4,178,830
Operator Hybrid
Revenue Split $887,719 $886,612 $919,230 $888,636 $965,848 $4,548,045 $7,789,048
Cost of sales $116,059 $114,115 $119,162 $110,999 $125,384 $585,719 $1,060,342
Supplement $0 $0 $0 $0 $0 $0 $60,000
Net Revenue $771,660 $772,497 $800,068 $777,636 $840,464 $3,962,326 $6,788,706
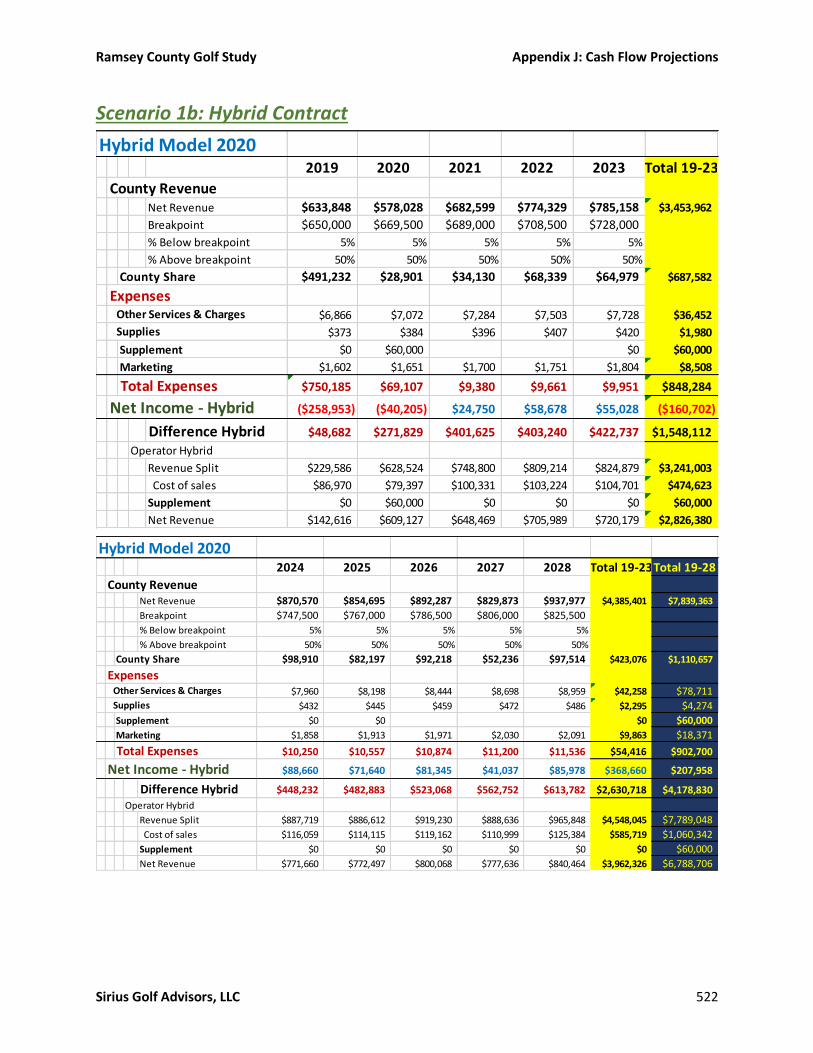
Ramsey County Golf Study Appendix J: Cash Flow Projections
Sirius Golf Advisors, LLC 522
Scenario 1b: Hybrid Contract
Hybrid Model 20202019 2020 2021 2022 2023 Total 19-23
County RevenueNet Revenue $633,848 $578,028 $682,599 $774,329 $785,158 $3,453,962
Breakpoint $650,000 $669,500 $689,000 $708,500 $728,000
% Below breakpoint 5% 5% 5% 5% 5%
% Above breakpoint 50% 50% 50% 50% 50%
County Share $491,232 $28,901 $34,130 $68,339 $64,979 $687,582
Expenses Other Services & Charges $6,866 $7,072 $7,284 $7,503 $7,728 $36,452
Supplies $373 $384 $396 $407 $420 $1,980
Supplement $0 $60,000 $0 $60,000
Marketing $1,602 $1,651 $1,700 $1,751 $1,804 $8,508
Total Expenses $750,185 $69,107 $9,380 $9,661 $9,951 $848,284
Net Income - Hybrid ($258,953) ($40,205) $24,750 $58,678 $55,028 ($160,702)
Difference Hybrid $48,682 $271,829 $401,625 $403,240 $422,737 $1,548,112
Operator Hybrid
Revenue Split $229,586 $628,524 $748,800 $809,214 $824,879 $3,241,003
Cost of sales $86,970 $79,397 $100,331 $103,224 $104,701 $474,623
Supplement $0 $60,000 $0 $0 $0 $60,000
Net Revenue $142,616 $609,127 $648,469 $705,989 $720,179 $2,826,380
Hybrid Model 20202024 2025 2026 2027 2028 Total 19-23Total 19-28
County RevenueNet Revenue $870,570 $854,695 $892,287 $829,873 $937,977 $4,385,401 $7,839,363
Breakpoint $747,500 $767,000 $786,500 $806,000 $825,500
% Below breakpoint 5% 5% 5% 5% 5%
% Above breakpoint 50% 50% 50% 50% 50%
County Share $98,910 $82,197 $92,218 $52,236 $97,514 $423,076 $1,110,657
Expenses Other Services & Charges $7,960 $8,198 $8,444 $8,698 $8,959 $42,258 $78,711 Supplies $432 $445 $459 $472 $486 $2,295 $4,274
Supplement $0 $0 $0 $60,000
Marketing $1,858 $1,913 $1,971 $2,030 $2,091 $9,863 $18,371
Total Expenses $10,250 $10,557 $10,874 $11,200 $11,536 $54,416 $902,700
Net Income - Hybrid $88,660 $71,640 $81,345 $41,037 $85,978 $368,660 $207,958
Difference Hybrid $448,232 $482,883 $523,068 $562,752 $613,782 $2,630,718 $4,178,830
Operator Hybrid
Revenue Split $887,719 $886,612 $919,230 $888,636 $965,848 $4,548,045 $7,789,048
Cost of sales $116,059 $114,115 $119,162 $110,999 $125,384 $585,719 $1,060,342
Supplement $0 $0 $0 $0 $0 $0 $60,000
Net Revenue $771,660 $772,497 $800,068 $777,636 $840,464 $3,962,326 $6,788,706
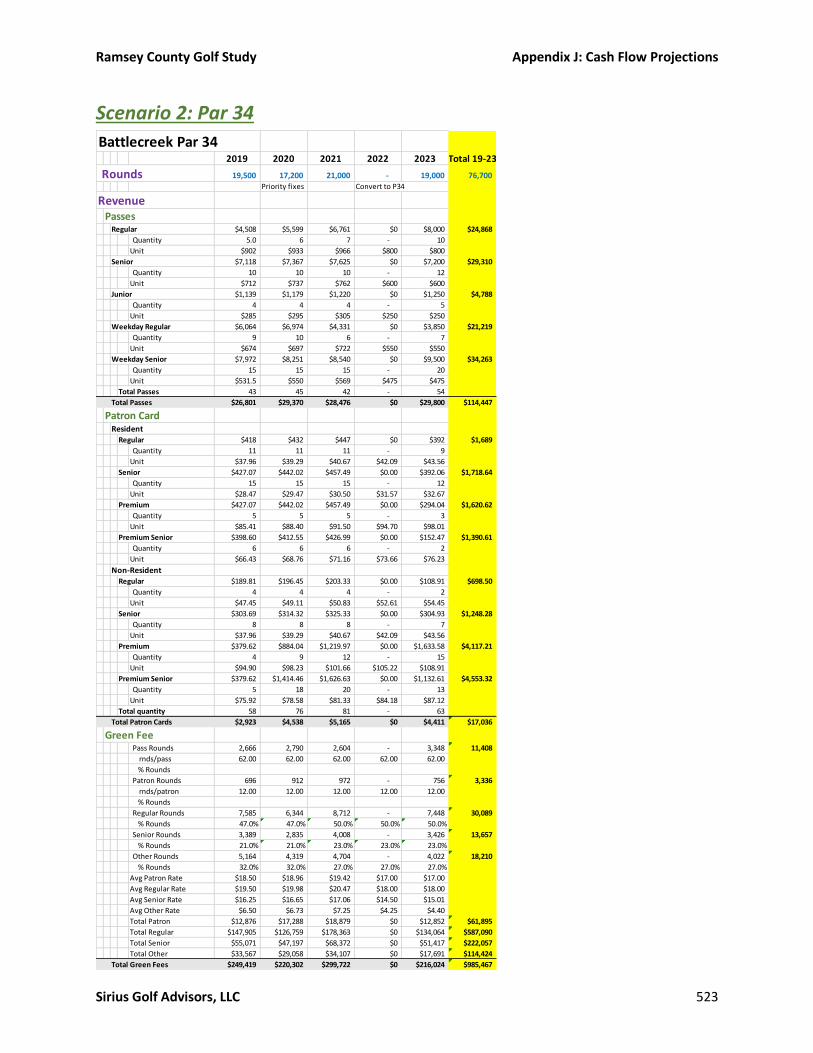
Ramsey County Golf Study Appendix J: Cash Flow Projections
Sirius Golf Advisors, LLC 523
Scenario 2: Par 34
2019 2020 2021 2022 2023 Total 19-23
Rounds 19,500 17,200 21,000 - 19,000 76,700
Priority fixes Convert to P34
RevenuePasses
Regular $4,508 $5,599 $6,761 $0 $8,000 $24,868
Quantity 5.0 6 7 - 10
Unit $902 $933 $966 $800 $800
Senior $7,118 $7,367 $7,625 $0 $7,200 $29,310
Quantity 10 10 10 - 12
Unit $712 $737 $762 $600 $600
Junior $1,139 $1,179 $1,220 $0 $1,250 $4,788
Quantity 4 4 4 - 5
Unit $285 $295 $305 $250 $250
Weekday Regular $6,064 $6,974 $4,331 $0 $3,850 $21,219
Quantity 9 10 6 - 7
Unit $674 $697 $722 $550 $550
Weekday Senior $7,972 $8,251 $8,540 $0 $9,500 $34,263
Quantity 15 15 15 - 20
Unit $531.5 $550 $569 $475 $475
Total Passes 43 45 42 - 54
Total Passes $26,801 $29,370 $28,476 $0 $29,800 $114,447
Patron CardResident
Regular $418 $432 $447 $0 $392 $1,689
Quantity 11 11 11 - 9
Unit $37.96 $39.29 $40.67 $42.09 $43.56
Senior $427.07 $442.02 $457.49 $0.00 $392.06 $1,718.64
Quantity 15 15 15 - 12
Unit $28.47 $29.47 $30.50 $31.57 $32.67
Premium $427.07 $442.02 $457.49 $0.00 $294.04 $1,620.62
Quantity 5 5 5 - 3
Unit $85.41 $88.40 $91.50 $94.70 $98.01
Premium Senior $398.60 $412.55 $426.99 $0.00 $152.47 $1,390.61
Quantity 6 6 6 - 2
Unit $66.43 $68.76 $71.16 $73.66 $76.23
Non-Resident
Regular $189.81 $196.45 $203.33 $0.00 $108.91 $698.50
Quantity 4 4 4 - 2
Unit $47.45 $49.11 $50.83 $52.61 $54.45
Senior $303.69 $314.32 $325.33 $0.00 $304.93 $1,248.28
Quantity 8 8 8 - 7
Unit $37.96 $39.29 $40.67 $42.09 $43.56
Premium $379.62 $884.04 $1,219.97 $0.00 $1,633.58 $4,117.21
Quantity 4 9 12 - 15
Unit $94.90 $98.23 $101.66 $105.22 $108.91
Premium Senior $379.62 $1,414.46 $1,626.63 $0.00 $1,132.61 $4,553.32
Quantity 5 18 20 - 13
Unit $75.92 $78.58 $81.33 $84.18 $87.12
Total quantity 58 76 81 - 63
Total Patron Cards $2,923 $4,538 $5,165 $0 $4,411 $17,036
Green FeePass Rounds 2,666 2,790 2,604 - 3,348 11,408
rnds/pass 62.00 62.00 62.00 62.00 62.00
% Rounds
Patron Rounds 696 912 972 - 756 3,336
rnds/patron 12.00 12.00 12.00 12.00 12.00
% Rounds
Regular Rounds 7,585 6,344 8,712 - 7,448 30,089
% Rounds 47.0% 47.0% 50.0% 50.0% 50.0%
Senior Rounds 3,389 2,835 4,008 - 3,426 13,657
% Rounds 21.0% 21.0% 23.0% 23.0% 23.0%
Other Rounds 5,164 4,319 4,704 - 4,022 18,210
% Rounds 32.0% 32.0% 27.0% 27.0% 27.0%
Avg Patron Rate $18.50 $18.96 $19.42 $17.00 $17.00
Avg Regular Rate $19.50 $19.98 $20.47 $18.00 $18.00
Avg Senior Rate $16.25 $16.65 $17.06 $14.50 $15.01
Avg Other Rate $6.50 $6.73 $7.25 $4.25 $4.40
Total Patron $12,876 $17,288 $18,879 $0 $12,852 $61,895
Total Regular $147,905 $126,759 $178,363 $0 $134,064 $587,090
Total Senior $55,071 $47,197 $68,372 $0 $51,417 $222,057
Total Other $33,567 $29,058 $34,107 $0 $17,691 $114,424
Total Green Fees $249,419 $220,302 $299,722 $0 $216,024 $985,467
Battlecreek Par 34

Ramsey County Golf Study Appendix J: Cash Flow Projections
Sirius Golf Advisors, LLC 524
2024 2025 2026 2027 2028 Total 19-23 Total 19-28
Rounds 19,768 18,779 19,372 17,435 19,029 94,383 171,083
RevenuePasses
Regular $9,108 $10,284 $12,418 $14,688 $17,103 $63,600 $88,468
Quantity 11 12 14 16 18
Unit $828 $857 $887 $918 $950
Senior $7,452 $7,713 $7,983 $8,262 $8,551 $39,961 $69,271
Quantity 12 12 12 12 12
Unit $621 $643 $665 $689 $713
Junior $1,553 $803 $832 $861 $891 $4,939 $9,726
Quantity 6 3 3 3 3
Unit $259 $268 $277 $287 $297
Weekday Regular $3,985 $4,124 $4,269 $4,418 $4,573 $21,368 $42,587
Quantity 7 7 7 7 7
Unit $569 $589 $610 $631 $653
Weekday Senior $10,324 $10,685 $11,586 $12,537 $13,540 $58,672 $92,935
Quantity 21 21 22 23 24
Unit $492 $509 $527 $545 $564
Total Passes 57 55 58 61 64
Total Passes $32,421 $33,610 $37,087 $40,766 $44,657 $188,540 $302,987
Patron CardResident
Regular $406 $420 $435 $450 $466 $2,176 $3,865
Quantity 9 9 9 9 9
Unit $45.09 $46.66 $48.30 $49.99 $51.74
Senior $439.60 $454.98 $470.91 $487.39 $504.45 $2,357.32 $4,076
Quantity 13 13 13 13 13
Unit $33.82 $35.00 $36.22 $37.49 $38.80
Premium $405.78 $419.98 $434.68 $449.90 $465.64 $2,175.99 $3,797
Quantity 4 4 4 4 4
Unit $101.45 $105.00 $108.67 $112.47 $116.41
Premium Senior $157.80 $408.32 $422.61 $437.40 $452.71 $1,878.84 $3,269
Quantity 2 5 5 5 5
Unit $78.90 $81.66 $84.52 $87.48 $90.54
Non-Resident
Regular $112.72 $116.66 $181.12 $187.46 $194.02 $791.97 $1,490
Quantity 2 2 3 3 3
Unit $56.36 $58.33 $60.37 $62.49 $64.67
Senior $315.61 $326.65 $386.38 $399.91 $413.91 $1,842.46 $3,091
Quantity 7 7 8 8 8
Unit $45.09 $46.66 $48.30 $49.99 $51.74
Premium $1,803.47 $1,983.26 $2,173.41 $2,374.46 $2,586.91 $10,921.50 $15,039
Quantity 16 17 18 19 20
Unit $112.72 $116.66 $120.75 $124.97 $129.35
Premium Senior $1,172.26 $1,399.94 $1,448.94 $1,499.66 $1,552.14 $7,072.94 $11,626
Quantity 13 15 15 15 15
Unit $90.17 $93.33 $96.60 $99.98 $103.48
Total quantity 66 72 75 76 77
Total Patron Cards $4,813 $5,530 $5,953 $6,286 $6,635 $29,217 $46,253
Green FeePass Rounds 3,534 3,410 3,596 3,782 3,968 18,290 29,698
rnds/pass 62.00 62.00 62.00 62.00 62.00
% Rounds
Patron Rounds 792 864 900 912 924 4,392 7,728
rnds/patron 12.00 12.00 12.00 12.00 12.00
% Rounds
Regular Rounds 7,721 7,253 7,438 6,371 7,068 35,850 65,939
% Rounds 50.0% 50.0% 50.0% 50.0% 50.0%
Senior Rounds 3,552 3,336 3,422 2,930 3,251 16,491 30,148
% Rounds 23.0% 23.0% 23.0% 23.0% 23.0%
Other Rounds 4,169 3,916 4,017 3,440 3,817 19,359 37,569
% Rounds 27.0% 27.0% 27.0% 27.0% 27.0%
Avg Patron Rate $17.60 $18.21 $18.85 $19.51 $20.19
Avg Regular Rate $18.63 $19.28 $19.96 $20.66 $21.38
Avg Senior Rate $15.53 $16.08 $16.64 $17.22 $17.82
Avg Other Rate $4.55 $4.71 $4.88 $5.05 $5.22
Total Patron $13,935 $15,734 $16,963 $17,791 $18,656 $83,080 $144,975
Total Regular $143,839 $139,845 $148,442 $131,586 $151,108 $714,820 $1,301,910
Total Senior $55,166 $53,634 $56,931 $50,466 $57,954 $274,151 $496,209
Total Other $18,981 $18,454 $19,589 $17,364 $19,941 $94,329 $208,754
Total Green Fees $231,921 $227,668 $241,925 $217,207 $247,659 $1,166,381 $2,151,848
Battlecreek Par 34
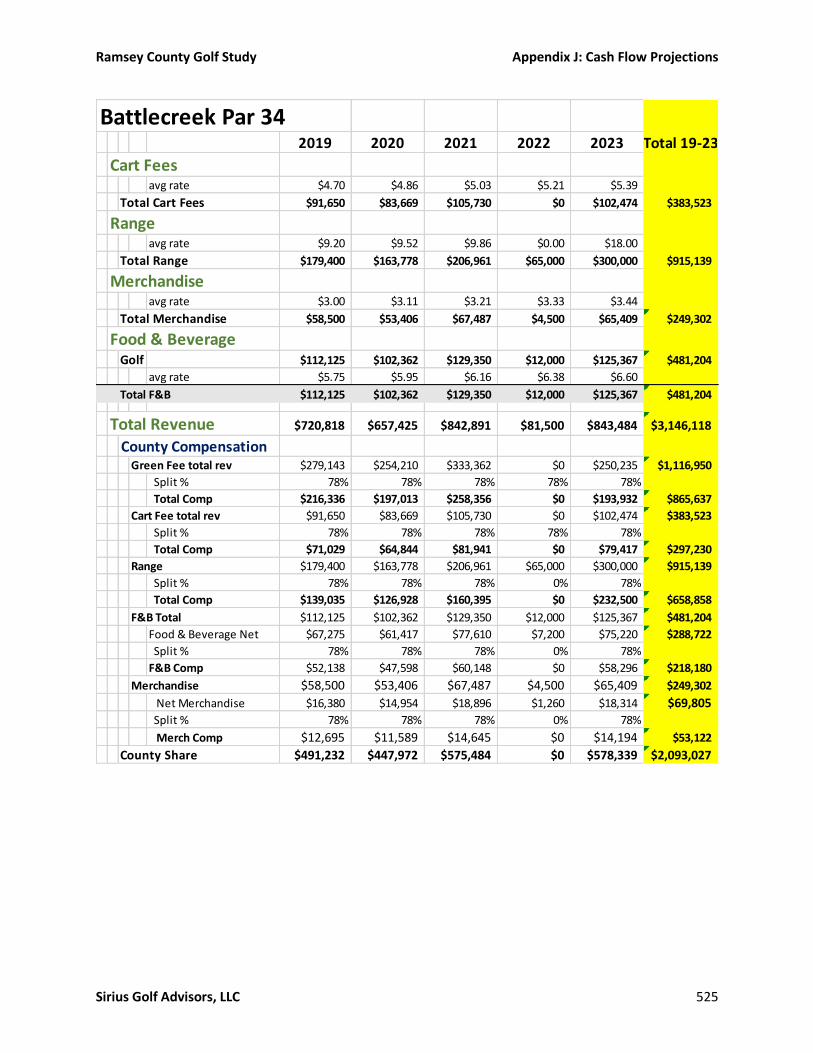
Ramsey County Golf Study Appendix J: Cash Flow Projections
Sirius Golf Advisors, LLC 525
2019 2020 2021 2022 2023 Total 19-23
Cart Feesavg rate $4.70 $4.86 $5.03 $5.21 $5.39
Total Cart Fees $91,650 $83,669 $105,730 $0 $102,474 $383,523
Rangeavg rate $9.20 $9.52 $9.86 $0.00 $18.00
Total Range $179,400 $163,778 $206,961 $65,000 $300,000 $915,139
Merchandiseavg rate $3.00 $3.11 $3.21 $3.33 $3.44
Total Merchandise $58,500 $53,406 $67,487 $4,500 $65,409 $249,302
Food & BeverageGolf $112,125 $102,362 $129,350 $12,000 $125,367 $481,204
avg rate $5.75 $5.95 $6.16 $6.38 $6.60
Total F&B $112,125 $102,362 $129,350 $12,000 $125,367 $481,204
Total Revenue $720,818 $657,425 $842,891 $81,500 $843,484 $3,146,118
County CompensationGreen Fee total rev $279,143 $254,210 $333,362 $0 $250,235 $1,116,950
Split % 78% 78% 78% 78% 78%
Total Comp $216,336 $197,013 $258,356 $0 $193,932 $865,637
Cart Fee total rev $91,650 $83,669 $105,730 $0 $102,474 $383,523
Split % 78% 78% 78% 78% 78%
Total Comp $71,029 $64,844 $81,941 $0 $79,417 $297,230
Range $179,400 $163,778 $206,961 $65,000 $300,000 $915,139
Split % 78% 78% 78% 0% 78%
Total Comp $139,035 $126,928 $160,395 $0 $232,500 $658,858
F&B Total $112,125 $102,362 $129,350 $12,000 $125,367 $481,204
Food & Beverage Net $67,275 $61,417 $77,610 $7,200 $75,220 $288,722
Split % 78% 78% 78% 0% 78%
F&B Comp $52,138 $47,598 $60,148 $0 $58,296 $218,180
Merchandise $58,500 $53,406 $67,487 $4,500 $65,409 $249,302
Net Merchandise $16,380 $14,954 $18,896 $1,260 $18,314 $69,805 Split % 78% 78% 78% 0% 78%
Merch Comp $12,695 $11,589 $14,645 $0 $14,194 $53,122
County Share $491,232 $447,972 $575,484 $0 $578,339 $2,093,027
Battlecreek Par 34

Ramsey County Golf Study Appendix J: Cash Flow Projections
Sirius Golf Advisors, LLC 526
2024 2025 2026 2027 2028 Total 19-23 Total 19-28
Cart Feesavg rate $5.58 $5.78 $5.98 $6.19 $6.41
Total Cart Fees $110,345 $108,497 $115,840 $107,905 $121,890 $564,478 $948,001
Rangeavg rate $18.63 $19.28 $19.96 $20.66 $21.38
Total Range $368,270 $362,102 $386,610 $360,128 $406,800 $1,883,910 $2,799,049
Merchandiseavg rate $3.56 $3.69 $3.82 $3.95 $4.09
Total Merchandise $70,433 $69,253 $73,941 $68,876 $77,802 $360,305 $609,607
Food & BeverageGolf $134,997 $132,736 $141,720 $132,012 $149,121 $690,585 $1,171,788
avg rate $6.83 $7.07 $7.32 $7.57 $7.84
Total F&B $134,997 $132,736 $141,720 $132,012 $149,121 $690,585 $1,171,788
Total Revenue $953,201 $939,395 $1,003,076 $933,180 $1,054,564 $4,883,416 $8,029,534
County CompensationGreen Fee total rev $269,155 $266,807 $284,965 $264,259 $298,952 $1,384,138 $2,501,088
Split % 78% 78% 78% 78% 78%
Total Comp $208,595 $206,776 $220,848 $204,801 $231,687 $1,072,707 $1,938,343
Cart Fee total rev $110,345 $108,497 $115,840 $107,905 $121,890 $564,478 $948,001
Split % 78% 78% 78% 78% 78%
Total Comp $85,518 $84,085 $89,776 $83,627 $94,465 $437,470 $734,701
Range $368,270 $362,102 $386,610 $360,128 $406,800 $1,883,910 $2,799,049
Split % 78% 78% 78% 78% 78%
Total Comp $285,410 $280,629 $299,623 $279,099 $315,270 $1,460,030
F&B Total $134,997 $132,736 $141,720 $132,012 $149,121 $690,585 $1,171,788
Food & Beverage Net $80,998 $79,641 $85,032 $79,207 $89,472 $414,351 $703,073
Split % 78% 78% 78% 78% 78%
F&B Comp $62,774 $61,722 $65,900 $61,386 $69,341 $321,122 $539,302
Merchandise $70,433 $69,253 $73,941 $68,876 $77,802 $360,305 $609,607
Net Merchandise $19,721 $19,391 $20,703 $19,285 $21,785 $100,885 $170,690 Split % 78% 78% 78% 78% 78%
Merch Comp $15,284 $15,028 $16,045 $14,946 $16,883 $78,186 $131,308
County Share $657,580 $648,240 $692,192 $643,858 $727,646 $3,369,516 $5,462,542
Battlecreek Par 34

Ramsey County Golf Study Appendix J: Cash Flow Projections
Sirius Golf Advisors, LLC 527
2019 2020 2021 2022 2023 Total 19-23
Expenses Personnel Services $319,085 $333,444 $348,448 $150,000 $355,000 $1,505,977
Other Services & Charges $162,060 $166,921 $171,929 $65,000 $175,000 $740,910
Supplies $53,416 $55,019 $56,669 $20,000 $50,000 $235,105
Marketing $9,825 $8,959 $11,510 $0 $11,567 $41,861
Capital OutlayFleet Services $205,800 $211,974 $218,333 $224,883 $231,630 $1,092,620
Total Expenses $750,185 $776,317 $806,890 $459,883 $823,196 $3,616,472
Net Income ($258,953) ($328,345) ($231,406) ($459,883) ($244,858) ($1,523,445)
Difference to Status Quo $48,682 ($16,311) $145,469 ($115,322) $122,851 $185,369
# Compensation percentages changed effective 2018
Operator $229,586 $209,453 $267,407 $81,500 $265,146 $3,092,996
Less Cost of Sales $86,970 $79,397 $100,331 $8,040 $97,241 $371,979
Net Operator $142,616 $130,056 $167,076 $73,460 $167,905 $2,721,017
Hybrid ModelCounty Revenue
Net Revenue $633,848 $578,028 $742,560 $73,460 $746,243 $2,774,139
Breakpoint $650,000 $669,500 $689,000 $708,500 $728,000
% Below breakpoint 5% 5% 5% 5% 5%
% Above breakpoint 50% 50% 50% 50% 50%
County Share $31,692 $28,901 $61,230 $3,673 $45,522 $171,018
Expenses Other Services & Charges $6,866 $7,072 $7,284 $7,503 $7,728 $36,452
Supplies $373 $384 $396 $407 $420 $1,980
Supplement $0 $60,000 $100,000 $0 $160,000
Marketing $1,602 $1,651 $1,700 $600 $1,500 $7,053
Total Expenses $8,841 $69,107 $9,380 $108,510 $9,647 $205,485
Net Income - Hybrid $22,851 ($40,205) $51,850 ($104,837) $35,874 ($34,467)
Difference to Status Quo $330,486 $271,829 $428,725 $239,724 $403,584 $1,674,348
Operator Hybrid
Revenue Split $689,125 $628,524 $781,661 $77,827 $797,963 $2,975,100
Cost of sales $86,970 $79,397 $100,331 $8,040 $97,241 $371,979
Supplement $0 $60,000 $0 $100,000 $0 $160,000
Net Revenue $602,155 $609,127 $681,330 $169,787 $700,722 $2,763,121
Battlecreek Par 34
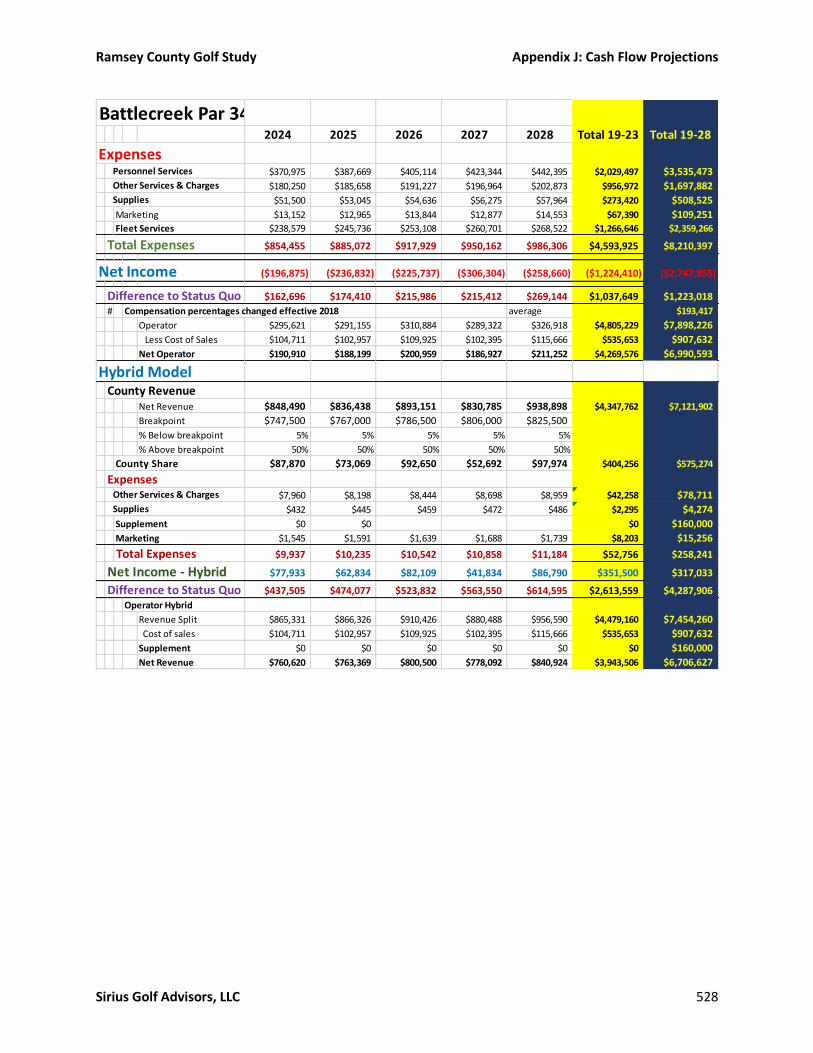
Ramsey County Golf Study Appendix J: Cash Flow Projections
Sirius Golf Advisors, LLC 528
2024 2025 2026 2027 2028 Total 19-23 Total 19-28
Expenses Personnel Services $370,975 $387,669 $405,114 $423,344 $442,395 $2,029,497 $3,535,473 Other Services & Charges $180,250 $185,658 $191,227 $196,964 $202,873 $956,972 $1,697,882 Supplies $51,500 $53,045 $54,636 $56,275 $57,964 $273,420 $508,525
Marketing $13,152 $12,965 $13,844 $12,877 $14,553 $67,390 $109,251 Capital OutlayFleet Services $238,579 $245,736 $253,108 $260,701 $268,522 $1,266,646 $2,359,266
Total Expenses $854,455 $885,072 $917,929 $950,162 $986,306 $4,593,925 $8,210,397
Net Income ($196,875) ($236,832) ($225,737) ($306,304) ($258,660) ($1,224,410) ($2,747,855)
Difference to Status Quo $162,696 $174,410 $215,986 $215,412 $269,144 $1,037,649 $1,223,018
# Compensation percentages changed effective 2018 average $193,417
Operator $295,621 $291,155 $310,884 $289,322 $326,918 $4,805,229 $7,898,226
Less Cost of Sales $104,711 $102,957 $109,925 $102,395 $115,666 $535,653 $907,632
Net Operator $190,910 $188,199 $200,959 $186,927 $211,252 $4,269,576 $6,990,593
Hybrid ModelCounty Revenue
Net Revenue $848,490 $836,438 $893,151 $830,785 $938,898 $4,347,762 $7,121,902
Breakpoint $747,500 $767,000 $786,500 $806,000 $825,500
% Below breakpoint 5% 5% 5% 5% 5%
% Above breakpoint 50% 50% 50% 50% 50%
County Share $87,870 $73,069 $92,650 $52,692 $97,974 $404,256 $575,274
Expenses Other Services & Charges $7,960 $8,198 $8,444 $8,698 $8,959 $42,258 $78,711 Supplies $432 $445 $459 $472 $486 $2,295 $4,274
Supplement $0 $0 $0 $160,000
Marketing $1,545 $1,591 $1,639 $1,688 $1,739 $8,203 $15,256
Total Expenses $9,937 $10,235 $10,542 $10,858 $11,184 $52,756 $258,241
Net Income - Hybrid $77,933 $62,834 $82,109 $41,834 $86,790 $351,500 $317,033
Difference to Status Quo $437,505 $474,077 $523,832 $563,550 $614,595 $2,613,559 $4,287,906
Operator Hybrid
Revenue Split $865,331 $866,326 $910,426 $880,488 $956,590 $4,479,160 $7,454,260
Cost of sales $104,711 $102,957 $109,925 $102,395 $115,666 $535,653 $907,632
Supplement $0 $0 $0 $0 $0 $0 $160,000
Net Revenue $760,620 $763,369 $800,500 $778,092 $840,924 $3,943,506 $6,706,627
Battlecreek Par 34

Ramsey County Golf Study Appendix J: Cash Flow Projections
Sirius Golf Advisors, LLC 529
Scenario 2b: Hybrid Contract
Hybrid Model2019 2020 2021 2022 2023 Total 19-23
County RevenueNet Revenue $633,848 $578,028 $742,560 $73,460 $746,243 $2,774,139
Breakpoint $650,000 $669,500 $689,000 $708,500 $728,000
% Below breakpoint 5% 5% 5% 5% 5%
% Above breakpoint 50% 50% 50% 50% 50%
County Share $31,692 $28,901 $61,230 $3,673 $45,522 $171,018
Expenses Other Services & Charges $6,866 $7,072 $7,284 $7,503 $7,728 $36,452
Supplies $373 $384 $396 $407 $420 $1,980
Supplement $0 $60,000 $100,000 $0 $160,000
Marketing $1,602 $1,651 $1,700 $600 $1,500 $7,053
Total Expenses $8,841 $69,107 $9,380 $108,510 $9,647 $205,485
Net Income - Hybrid $22,851 ($40,205) $51,850 ($104,837) $35,874 ($34,467)
Difference Hybrid $330,486 $271,829 $428,725 $239,724 $403,584 $1,674,348
Operator Hybrid
Revenue Split $689,125 $628,524 $781,661 $77,827 $797,963 $2,975,100
Cost of sales $86,970 $79,397 $100,331 $8,040 $97,241 $371,979
Supplement $0 $60,000 $0 $100,000 $0 $160,000
Net Revenue $602,155 $609,127 $681,330 $169,787 $700,722 $2,763,121
Hybrid Model2024 2025 2026 2027 2028 Total 19-23 Total 19-28
County RevenueNet Revenue $848,490 $836,438 $893,151 $830,785 $938,898 $4,347,762 $7,121,902
Breakpoint $747,500 $767,000 $786,500 $806,000 $825,500
% Below breakpoint 5% 5% 5% 5% 5%
% Above breakpoint 50% 50% 50% 50% 50%
County Share $87,870 $73,069 $92,650 $52,692 $97,974 $404,256 $575,274
Expenses Other Services & Charges $7,960 $8,198 $8,444 $8,698 $8,959 $42,258 $78,711 Supplies $432 $445 $459 $472 $486 $2,295 $4,274
Supplement $0 $0 $0 $160,000
Marketing $1,545 $1,591 $1,639 $1,688 $1,739 $8,203 $15,256
Total Expenses $9,937 $10,235 $10,542 $10,858 $11,184 $52,756 $258,241
Net Income - Hybrid $77,933 $62,834 $82,109 $41,834 $86,790 $351,500 $317,033
Difference Hybrid $437,505 $474,077 $523,832 $563,550 $614,595 $2,613,559 $4,287,906
Operator Hybrid
Revenue Split $865,331 $866,326 $910,426 $880,488 $956,590 $4,479,160 $7,454,260
Cost of sales $104,711 $102,957 $109,925 $102,395 $115,666 $535,653 $907,632
Supplement $0 $0 $0 $0 $0 $0 $160,000
Net Revenue $760,620 $763,369 $800,500 $778,092 $840,924 $3,943,506 $6,706,627

Ramsey County Golf Study Appendix J: Cash Flow Projections
Sirius Golf Advisors, LLC 530
Scenario 3: 18 Holes
Battlecreek 18 Hole2019 2020 2021 2022 2023 Total 19-23
Rounds 19,500 17,200 21,000 20,250 22,750 100,700
Priority Fixes Start new 9 Start Ren Frt 9
RevenuePasses
Regular $4,508 $5,599 $6,761 $7,997 $9,311 $34,176
Quantity 5.0 6 7 8 9
Unit $902 $933 $966 $1,000 $1,035
Senior $7,118 $7,367 $7,625 $7,892 $8,168 $38,169
Quantity 10 10 10 10 10
Unit $712 $737 $762 $789 $817
Junior $1,139 $1,179 $1,220 $631 $653 $4,822
Quantity 4 4 4 2 2
Unit $285 $295 $305 $316 $327
Weekday Regular $6,064 $6,974 $4,331 $4,482 $4,639 $26,491
Quantity 9 10 6 6 6
Unit $674 $697 $722 $747 $773
Weekday Senior $7,972 $8,251 $8,540 $11,196 $12,197 $48,156
Quantity 15 15 15 19 20
Unit $531 $550 $569 $589 $610
Total Passes 43 45 42 45 47
Total Passes $26,801 $29,370 $28,476 $32,198 $34,969 $151,814
Patron CardResident
Regular $418 $432 $447 $463 $479 $2,239
Quantity 11 11 11 11 11
Unit $37.96 $39.29 $40.67 $42.09 $43.56
Senior $427.07 $442.02 $457.49 $473.50 $490.07 $2,290.15
Quantity 15 15 15 15 15
Unit $28.47 $29.47 $30.50 $31.57 $32.67
Premium $427.07 $442.02 $457.49 $473.50 $490.07 $2,290.15
Quantity 5 5 5 5 5
Unit $85.41 $88.40 $91.50 $94.70 $98.01
Premium Senior $398.60 $412.55 $426.99 $441.93 $457.40 $2,137.48
Quantity 6 6 6 6 6
Unit $66.43 $68.76 $71.16 $73.66 $76.23
Non-Resident
Regular $189.81 $196.45 $203.33 $210.45 $217.81 $1,017.85
Quantity 4 4 4 4 4
Unit $47.45 $49.11 $50.83 $52.61 $54.45
Senior $303.69 $314.32 $325.33 $336.71 $348.50 $1,628.55
Quantity 8 8 8 8 8
Unit $37.96 $39.29 $40.67 $42.09 $43.56
Premium $379.62 $884.04 $1,219.97 $1,367.89 $1,633.58 $5,485.10
Quantity 4 9 12 13 15
Unit $94.90 $98.23 $101.66 $105.22 $108.91
Premium Senior $379.62 $1,414.46 $1,626.63 $1,767.74 $1,916.73 $7,105.18
Quantity 5 18 20 21 22
Unit $75.92 $78.58 $81.33 $84.18 $87.12
Total quantity 58 76 81 83 86
Total Patron Cards $2,923 $4,538 $5,165 $5,535 $6,033 $24,194
Green FeePass Rounds 2,666 2,790 2,604 2,790 2,914 13,764
rnds/pass 62.00 62.00 62.00 62.00 62.00
% Rounds
Patron Rounds 696 912 972 996 1,032 4,608
rnds/patron 12.00 12.00 12.00 12.00 12.00
% Rounds
Regular Rounds 7,585 6,344 8,712 8,232 9,402 40,275
% Rounds 47.0% 47.0% 50.0% 50.0% 50.0%
Senior Rounds 3,389 2,835 4,008 3,787 4,325 18,343
% Rounds 21.0% 21.0% 23.0% 23.0% 23.0%
Other Rounds 5,164 4,319 4,704 4,445 5,077 23,710
% Rounds 32.0% 32.0% 27.0% 27.0% 27.0%
Avg Patron Rate $18.50 $18.96 $19.62 $20.31 $21.02
Avg Regular Rate $19.50 $19.98 $20.68 $21.40 $22.15
Avg Senior Rate $16.25 $16.65 $17.23 $17.84 $18.46
Avg Other Rate $6.50 $6.73 $6.96 $7.21 $7.46
Total Patron $12,876 $17,288 $19,070 $20,225 $21,689 $91,148
Total Regular $147,905 $126,759 $180,164 $176,196 $208,282 $839,305
Total Senior $55,071 $47,197 $69,063 $67,542 $79,841 $318,714
Total Other $33,567 $29,058 $32,757 $32,036 $37,869 $165,288
Total Green Fees $249,419 $220,302 $301,054 $295,998 $347,682 $1,414,456
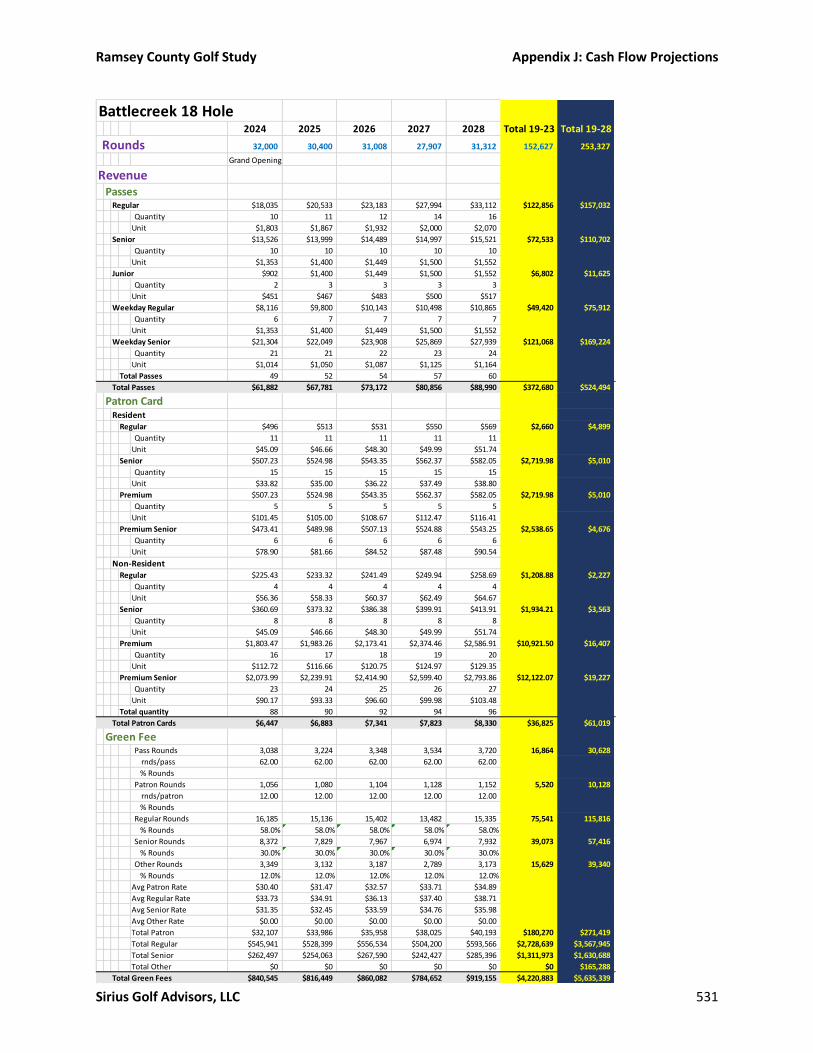
Ramsey County Golf Study Appendix J: Cash Flow Projections
Sirius Golf Advisors, LLC 531
Battlecreek 18 Hole2024 2025 2026 2027 2028 Total 19-23 Total 19-28
Rounds 32,000 30,400 31,008 27,907 31,312 152,627 253,327
Grand Opening
RevenuePasses
Regular $18,035 $20,533 $23,183 $27,994 $33,112 $122,856 $157,032
Quantity 10 11 12 14 16
Unit $1,803 $1,867 $1,932 $2,000 $2,070
Senior $13,526 $13,999 $14,489 $14,997 $15,521 $72,533 $110,702
Quantity 10 10 10 10 10
Unit $1,353 $1,400 $1,449 $1,500 $1,552
Junior $902 $1,400 $1,449 $1,500 $1,552 $6,802 $11,625
Quantity 2 3 3 3 3
Unit $451 $467 $483 $500 $517
Weekday Regular $8,116 $9,800 $10,143 $10,498 $10,865 $49,420 $75,912
Quantity 6 7 7 7 7
Unit $1,353 $1,400 $1,449 $1,500 $1,552
Weekday Senior $21,304 $22,049 $23,908 $25,869 $27,939 $121,068 $169,224
Quantity 21 21 22 23 24
Unit $1,014 $1,050 $1,087 $1,125 $1,164
Total Passes 49 52 54 57 60
Total Passes $61,882 $67,781 $73,172 $80,856 $88,990 $372,680 $524,494
Patron CardResident
Regular $496 $513 $531 $550 $569 $2,660 $4,899
Quantity 11 11 11 11 11
Unit $45.09 $46.66 $48.30 $49.99 $51.74
Senior $507.23 $524.98 $543.35 $562.37 $582.05 $2,719.98 $5,010
Quantity 15 15 15 15 15
Unit $33.82 $35.00 $36.22 $37.49 $38.80
Premium $507.23 $524.98 $543.35 $562.37 $582.05 $2,719.98 $5,010
Quantity 5 5 5 5 5
Unit $101.45 $105.00 $108.67 $112.47 $116.41
Premium Senior $473.41 $489.98 $507.13 $524.88 $543.25 $2,538.65 $4,676
Quantity 6 6 6 6 6
Unit $78.90 $81.66 $84.52 $87.48 $90.54
Non-Resident
Regular $225.43 $233.32 $241.49 $249.94 $258.69 $1,208.88 $2,227
Quantity 4 4 4 4 4
Unit $56.36 $58.33 $60.37 $62.49 $64.67
Senior $360.69 $373.32 $386.38 $399.91 $413.91 $1,934.21 $3,563
Quantity 8 8 8 8 8
Unit $45.09 $46.66 $48.30 $49.99 $51.74
Premium $1,803.47 $1,983.26 $2,173.41 $2,374.46 $2,586.91 $10,921.50 $16,407
Quantity 16 17 18 19 20
Unit $112.72 $116.66 $120.75 $124.97 $129.35
Premium Senior $2,073.99 $2,239.91 $2,414.90 $2,599.40 $2,793.86 $12,122.07 $19,227
Quantity 23 24 25 26 27
Unit $90.17 $93.33 $96.60 $99.98 $103.48
Total quantity 88 90 92 94 96
Total Patron Cards $6,447 $6,883 $7,341 $7,823 $8,330 $36,825 $61,019
Green FeePass Rounds 3,038 3,224 3,348 3,534 3,720 16,864 30,628
rnds/pass 62.00 62.00 62.00 62.00 62.00
% Rounds
Patron Rounds 1,056 1,080 1,104 1,128 1,152 5,520 10,128
rnds/patron 12.00 12.00 12.00 12.00 12.00
% Rounds
Regular Rounds 16,185 15,136 15,402 13,482 15,335 75,541 115,816
% Rounds 58.0% 58.0% 58.0% 58.0% 58.0%
Senior Rounds 8,372 7,829 7,967 6,974 7,932 39,073 57,416
% Rounds 30.0% 30.0% 30.0% 30.0% 30.0%
Other Rounds 3,349 3,132 3,187 2,789 3,173 15,629 39,340
% Rounds 12.0% 12.0% 12.0% 12.0% 12.0%
Avg Patron Rate $30.40 $31.47 $32.57 $33.71 $34.89
Avg Regular Rate $33.73 $34.91 $36.13 $37.40 $38.71
Avg Senior Rate $31.35 $32.45 $33.59 $34.76 $35.98
Avg Other Rate $0.00 $0.00 $0.00 $0.00 $0.00
Total Patron $32,107 $33,986 $35,958 $38,025 $40,193 $180,270 $271,419
Total Regular $545,941 $528,399 $556,534 $504,200 $593,566 $2,728,639 $3,567,945
Total Senior $262,497 $254,063 $267,590 $242,427 $285,396 $1,311,973 $1,630,688
Total Other $0 $0 $0 $0 $0 $0 $165,288
Total Green Fees $840,545 $816,449 $860,082 $784,652 $919,155 $4,220,883 $5,635,339
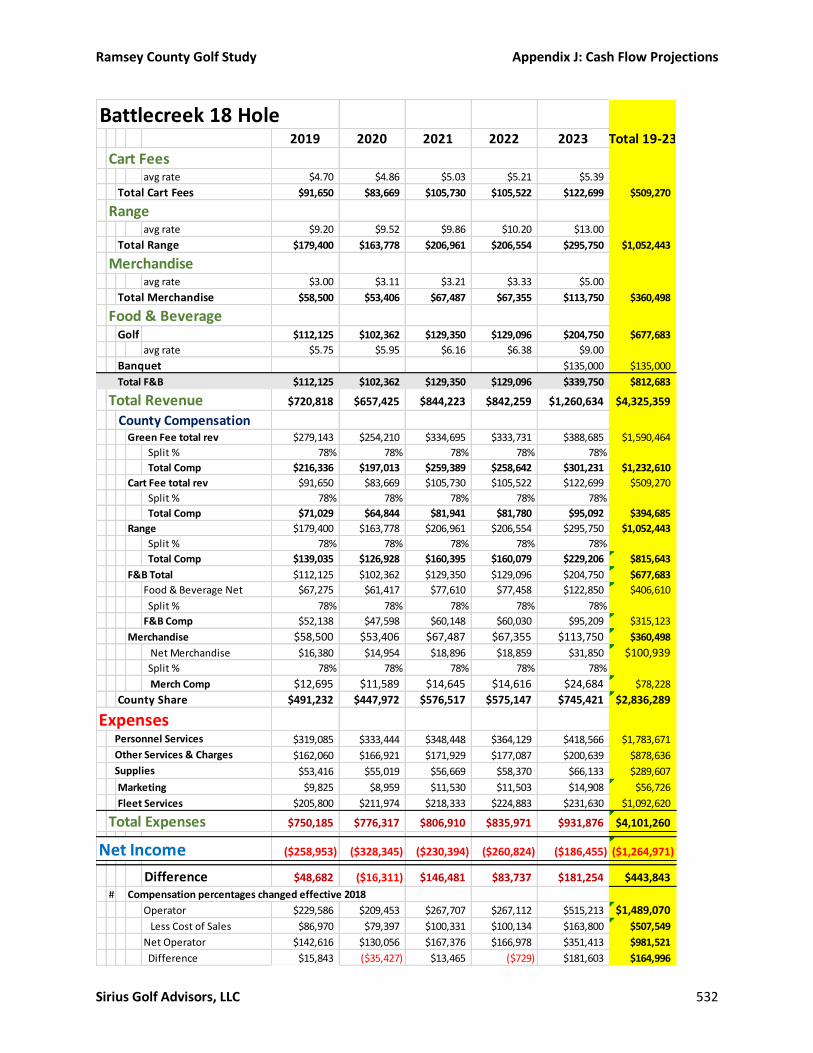
Ramsey County Golf Study Appendix J: Cash Flow Projections
Sirius Golf Advisors, LLC 532
Battlecreek 18 Hole2019 2020 2021 2022 2023 Total 19-23
Cart Feesavg rate $4.70 $4.86 $5.03 $5.21 $5.39
Total Cart Fees $91,650 $83,669 $105,730 $105,522 $122,699 $509,270
Rangeavg rate $9.20 $9.52 $9.86 $10.20 $13.00
Total Range $179,400 $163,778 $206,961 $206,554 $295,750 $1,052,443
Merchandiseavg rate $3.00 $3.11 $3.21 $3.33 $5.00
Total Merchandise $58,500 $53,406 $67,487 $67,355 $113,750 $360,498
Food & BeverageGolf $112,125 $102,362 $129,350 $129,096 $204,750 $677,683
avg rate $5.75 $5.95 $6.16 $6.38 $9.00
Banquet $135,000 $135,000
Total F&B $112,125 $102,362 $129,350 $129,096 $339,750 $812,683
Total Revenue $720,818 $657,425 $844,223 $842,259 $1,260,634 $4,325,359
County CompensationGreen Fee total rev $279,143 $254,210 $334,695 $333,731 $388,685 $1,590,464
Split % 78% 78% 78% 78% 78%
Total Comp $216,336 $197,013 $259,389 $258,642 $301,231 $1,232,610
Cart Fee total rev $91,650 $83,669 $105,730 $105,522 $122,699 $509,270
Split % 78% 78% 78% 78% 78%
Total Comp $71,029 $64,844 $81,941 $81,780 $95,092 $394,685
Range $179,400 $163,778 $206,961 $206,554 $295,750 $1,052,443
Split % 78% 78% 78% 78% 78%
Total Comp $139,035 $126,928 $160,395 $160,079 $229,206 $815,643
F&B Total $112,125 $102,362 $129,350 $129,096 $204,750 $677,683
Food & Beverage Net $67,275 $61,417 $77,610 $77,458 $122,850 $406,610
Split % 78% 78% 78% 78% 78%
F&B Comp $52,138 $47,598 $60,148 $60,030 $95,209 $315,123
Merchandise $58,500 $53,406 $67,487 $67,355 $113,750 $360,498
Net Merchandise $16,380 $14,954 $18,896 $18,859 $31,850 $100,939
Split % 78% 78% 78% 78% 78%
Merch Comp $12,695 $11,589 $14,645 $14,616 $24,684 $78,228
County Share $491,232 $447,972 $576,517 $575,147 $745,421 $2,836,289
Expenses Personnel Services $319,085 $333,444 $348,448 $364,129 $418,566 $1,783,671
Other Services & Charges $162,060 $166,921 $171,929 $177,087 $200,639 $878,636
Supplies $53,416 $55,019 $56,669 $58,370 $66,133 $289,607
Marketing $9,825 $8,959 $11,530 $11,503 $14,908 $56,726
Capital OutlayFleet Services $205,800 $211,974 $218,333 $224,883 $231,630 $1,092,620
Total Expenses $750,185 $776,317 $806,910 $835,971 $931,876 $4,101,260
Net Income ($258,953) ($328,345) ($230,394) ($260,824) ($186,455) ($1,264,971)
Difference $48,682 ($16,311) $146,481 $83,737 $181,254 $443,843
# Compensation percentages changed effective 2018
Operator $229,586 $209,453 $267,707 $267,112 $515,213 $1,489,070
Less Cost of Sales $86,970 $79,397 $100,331 $100,134 $163,800 $507,549
Net Operator $142,616 $130,056 $167,376 $166,978 $351,413 $981,521
Difference $15,843 ($35,427) $13,465 ($729) $181,603 $164,996

Ramsey County Golf Study Appendix J: Cash Flow Projections
Sirius Golf Advisors, LLC 533
Battlecreek 18 Hole2024 2025 2026 2027 2028 Total 19-23 Total 19-28
Cart Feesavg rate $5.58 $5.78 $5.98 $6.19 $6.41
Total Cart Fees $178,628 $175,636 $185,419 $172,718 $200,572 $912,973 $1,422,243
Rangeavg rate $16.00 $16.56 $17.14 $17.74 $18.36
Total Range $512,000 $503,424 $531,465 $495,059 $574,898 $2,616,846 $3,669,289
Merchandiseavg rate $10.00 $10.35 $10.71 $11.09 $11.48
Total Merchandise $320,000 $314,640 $332,165 $309,412 $359,311 $1,635,529 $1,996,026
Food & BeverageGolf $416,000 $409,032 $431,815 $402,236 $467,104 $2,126,187 $2,803,870
avg rate $13.00 $13.46 $13.93 $14.41 $14.92
Banquet $150,000 $155,250 $160,684 $166,308 $172,128 $804,370 $939,370
Total F&B $566,000 $564,282 $592,499 $568,543 $639,233 $2,930,557 $3,743,240
Total Revenue $2,485,503 $2,449,095 $2,582,142 $2,419,064 $2,790,488 $12,726,292 $17,051,651
County CompensationGreen Fee total rev $908,875 $891,113 $940,595 $873,332 $1,016,475 $4,630,388 $6,220,852
Split % 90% 90% 90% 90% 90%
Total Comp $711,737 $695,751 $740,285 $679,748 $808,577 $3,636,099 $4,868,709
Cart Fee total rev $178,628 $175,636 $185,419 $172,718 $200,572 $912,973 $1,422,243
Split % 90% 90% 90% 90% 90%
Total Comp $138,437 $136,118 $143,700 $133,856 $155,515 $707,625 $1,102,310
Range $512,000 $503,424 $531,465 $495,059 $574,898 $2,616,846 $3,669,289
Split % 90% 90% 90% 90% 90%
Total Comp $443,925 $436,207 $461,443 $428,678 $500,533 $2,270,786
F&B Total $416,000 $409,032 $431,815 $402,236 $467,104 $2,126,187 $2,803,870
Food & Beverage Net $249,600 $245,419 $259,089 $241,341 $280,263 $1,275,712 $1,682,322
Split % 90% 90% 90% 90% 90%
F&B Comp $224,640 $220,877 $233,180 $217,207 $252,236 $1,148,141 $1,463,264
Merchandise $320,000 $314,640 $332,165 $309,412 $359,311 $1,635,529 $1,996,026
Net Merchandise $89,600 $88,099 $93,006 $86,635 $100,607 $457,948 $558,887
Split % 90% 90% 90% 90% 90%
Merch Comp $80,640 $79,289 $83,706 $77,972 $90,546 $412,153 $490,381
County Share $1,599,379 $1,568,242 $1,662,314 $1,537,462 $1,807,408 $8,174,805 $11,011,093
Expenses $0
Personnel Services $581,812 $607,993 $635,353 $663,944 $693,821 $3,182,922 $4,966,593
Other Services & Charges $228,043 $234,884 $241,931 $249,189 $256,664 $1,210,711 $2,089,347
Supplies $69,187 $71,263 $73,401 $75,603 $77,871 $367,325 $656,932
Marketing $31,988 $31,365 $33,246 $30,749 $36,148 $163,496 $220,222
Capital OutlayFleet Services $328,654 $338,514 $348,669 $359,129 $369,903 $1,744,870 $2,837,490
Total Expenses $1,239,684 $1,284,019 $1,332,600 $1,378,614 $1,434,408 $6,669,324 $10,770,584
Net Income $359,695 $284,223 $329,714 $158,848 $373,000 $1,505,480 $240,509
Difference $719,267 $695,466 $771,437 $680,564 $900,804 $3,767,539 $4,211,382
# Compensation percentages changed effective 2018
Operator $886,124 $880,852 $919,829 $881,602 $983,080 $4,551,487 $6,040,557
Less Cost of Sales $396,800 $390,154 $411,885 $383,671 $445,546 $1,733,660 $2,241,210
Net Operator $489,324 $490,699 $507,943 $497,931 $537,535 $2,817,827 $3,799,348
Difference $304,705 $308,344 $323,088 $324,562 $344,160 $1,899,255 $2,064,251
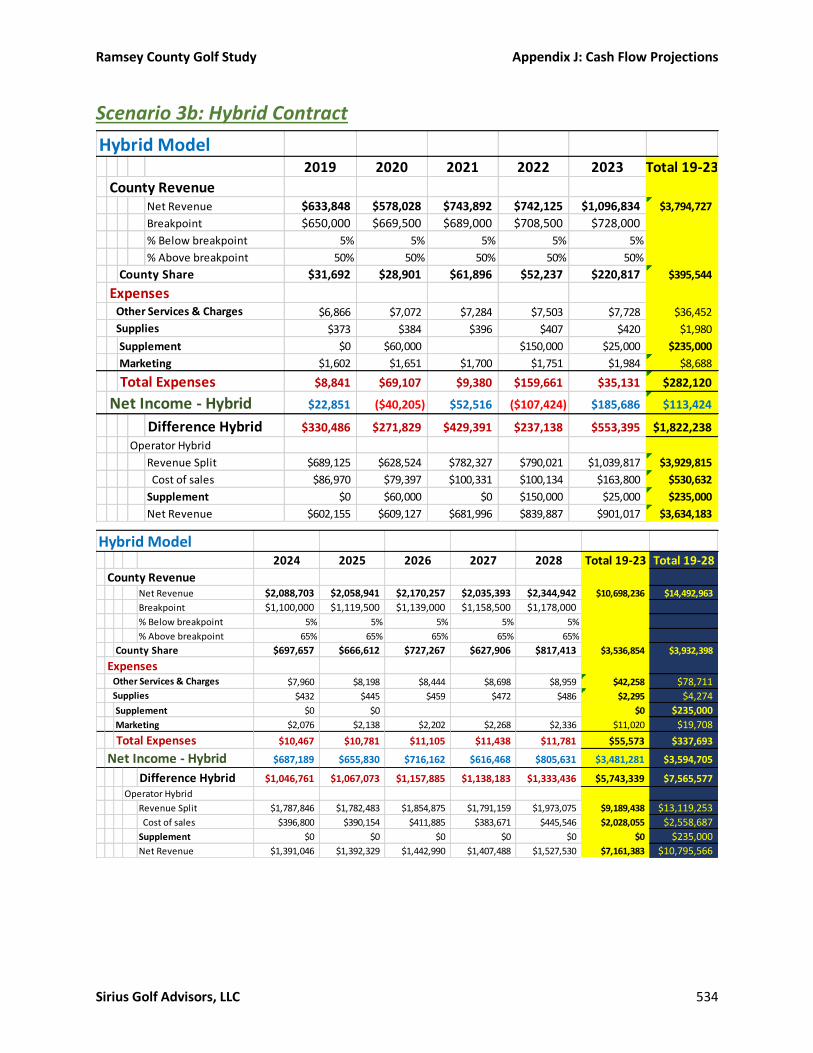
Ramsey County Golf Study Appendix J: Cash Flow Projections
Sirius Golf Advisors, LLC 534
Scenario 3b: Hybrid Contract
Hybrid Model2019 2020 2021 2022 2023 Total 19-23
County RevenueNet Revenue $633,848 $578,028 $743,892 $742,125 $1,096,834 $3,794,727
Breakpoint $650,000 $669,500 $689,000 $708,500 $728,000
% Below breakpoint 5% 5% 5% 5% 5%
% Above breakpoint 50% 50% 50% 50% 50%
County Share $31,692 $28,901 $61,896 $52,237 $220,817 $395,544
Expenses Other Services & Charges $6,866 $7,072 $7,284 $7,503 $7,728 $36,452
Supplies $373 $384 $396 $407 $420 $1,980
Supplement $0 $60,000 $150,000 $25,000 $235,000
Marketing $1,602 $1,651 $1,700 $1,751 $1,984 $8,688
Total Expenses $8,841 $69,107 $9,380 $159,661 $35,131 $282,120
Net Income - Hybrid $22,851 ($40,205) $52,516 ($107,424) $185,686 $113,424
Difference Hybrid $330,486 $271,829 $429,391 $237,138 $553,395 $1,822,238
Operator Hybrid
Revenue Split $689,125 $628,524 $782,327 $790,021 $1,039,817 $3,929,815
Cost of sales $86,970 $79,397 $100,331 $100,134 $163,800 $530,632
Supplement $0 $60,000 $0 $150,000 $25,000 $235,000
Net Revenue $602,155 $609,127 $681,996 $839,887 $901,017 $3,634,183
Hybrid Model2024 2025 2026 2027 2028 Total 19-23 Total 19-28
County RevenueNet Revenue $2,088,703 $2,058,941 $2,170,257 $2,035,393 $2,344,942 $10,698,236 $14,492,963
Breakpoint $1,100,000 $1,119,500 $1,139,000 $1,158,500 $1,178,000
% Below breakpoint 5% 5% 5% 5% 5%
% Above breakpoint 65% 65% 65% 65% 65%
County Share $697,657 $666,612 $727,267 $627,906 $817,413 $3,536,854 $3,932,398
Expenses Other Services & Charges $7,960 $8,198 $8,444 $8,698 $8,959 $42,258 $78,711 Supplies $432 $445 $459 $472 $486 $2,295 $4,274
Supplement $0 $0 $0 $235,000
Marketing $2,076 $2,138 $2,202 $2,268 $2,336 $11,020 $19,708
Total Expenses $10,467 $10,781 $11,105 $11,438 $11,781 $55,573 $337,693
Net Income - Hybrid $687,189 $655,830 $716,162 $616,468 $805,631 $3,481,281 $3,594,705
Difference Hybrid $1,046,761 $1,067,073 $1,157,885 $1,138,183 $1,333,436 $5,743,339 $7,565,577
Operator Hybrid
Revenue Split $1,787,846 $1,782,483 $1,854,875 $1,791,159 $1,973,075 $9,189,438 $13,119,253
Cost of sales $396,800 $390,154 $411,885 $383,671 $445,546 $2,028,055 $2,558,687
Supplement $0 $0 $0 $0 $0 $0 $235,000
Net Revenue $1,391,046 $1,392,329 $1,442,990 $1,407,488 $1,527,530 $7,161,383 $10,795,566