Pheasant Run Golf Club Business Plan
26
1 Pheasant Run Golf Club Business Plan Period: 2008 - 2012 A division of Canton Leisure Services 46500 Summit Parkway Canton, MI, 48188 Phone: 734-397-6460 Fax: 734-397-6801 Web Site: leisure.canton-mi.org
-
Upload
khangminh22 -
Category
Documents
-
view
0 -
download
0
Transcript of Pheasant Run Golf Club Business Plan

1
Pheasant Run Golf Club Business P lan Period: 2008 - 2012
A division of Canton Leisure Services
46500 Summit Parkway Canton, MI, 48188 Phone: 734-397-6460 Fax: 734-397-6801 Web Site: leisure.canton-mi.org
2
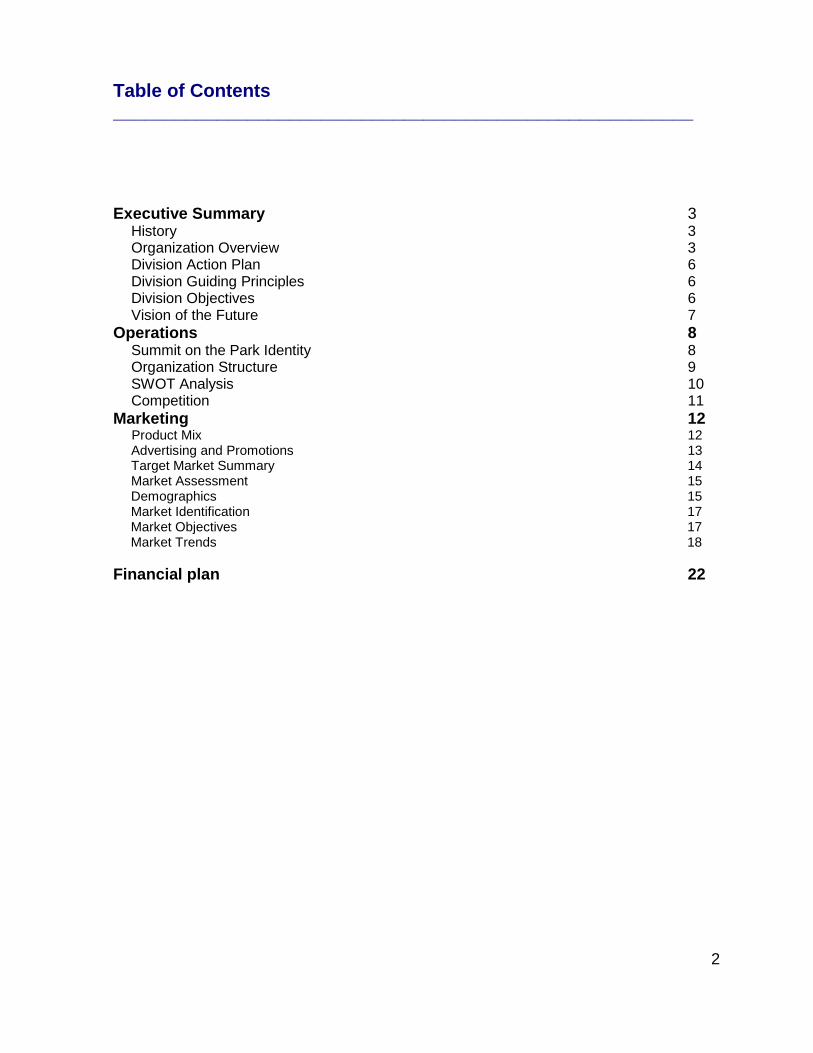
Table of Contents ________________________________________________________
Executive Summary 3 History 3 Organization Overview 3 Division Action Plan 6 Division Guiding Principles 6 Division Objectives 6 Vision of the Future 7 Operations 8 Summit on the Park Identity 8 Organization Structure 9 SWOT Analysis 10 Competition 11 Marketing 12 Product Mix 12 Advertising and Promotions 13 Target Market Summary 14 Market Assessment 15 Demographics 15 Market Identification 17 Market Objectives 17 Market Trends 18 Financial plan 22
3
Executive summary History of Pheasant Run
• Arthur Hills and Associates designed course, built in 1995 • 18 hole, 7,000 yard championship course (4 sets of tees) • In 2000 the Parks and Golf Division was separated into two unique
components with 3 full time and 40 part time and seasonal employees. • Additional 9 holes built in 2002 allowing for greater flexibility, league play,
ability to host outings up to 216 players from 144 players previously. • Continued growth in revenue and number of rounds • Contract developed with outside agency (Natural Golf) to provide lessons (golf
school) at the golf range. • In-house contracted instructors • Current Golf Pro under contract • Course affiliations: National Golf Foundation – USGA – GAM – PGA - GCSAA
Ecological and Community Benefits of the Golf Course.
• Recreation places for golf and non-golf activities such as jogging, walking, cross country skiing and bird watching during non-play periods
• A place for social interaction and community events • Community improvements that add value to land • A business that provides skilled and semi-skilled jobs • Provide “green space” in urban setting • Wetland preservation areas • Sanctuary habitats for wildlife and birds • Turf grasses that create oxygen, air cooling and filters for ground water • Housing bordering the course valued at $800,000
Organizational Overview Pheasant Run Golf Club is a 27-hole championship municipal facility owned and operated by the Charter Township of Canton. The golf course is operated under the Leisure Services department of Canton Township. The department director oversees the management team which consists of (1) Golf Professional and (1) Golf Course Superintendent. The facility vision is to provide a quality golf experience at affordable rates to the Canton community and surrounding areas. Pheasant Run provides its customers with an excellent services and amenities while remaining fiscally responsible and meeting financial goals. Staff members work as a well trained team to accomplish goals in-line with department vision.
4
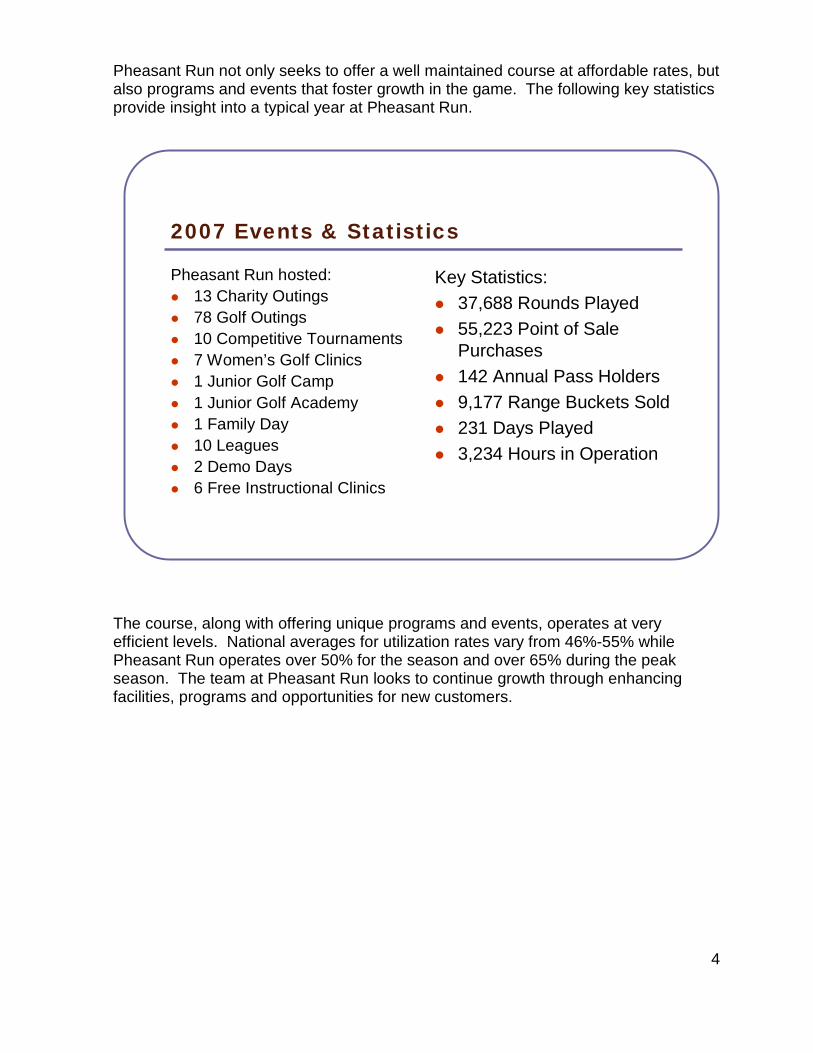
Pheasant Run not only seeks to offer a well maintained course at affordable rates, but also programs and events that foster growth in the game. The following key statistics provide insight into a typical year at Pheasant Run.
2007 Events & Statistics
Pheasant Run hosted: 13 Charity Outings 78 Golf Outings 10 Competitive Tournaments 7 Women’s Golf Clinics 1 Junior Golf Camp 1 Junior Golf Academy 1 Family Day 10 Leagues 2 Demo Days 6 Free Instructional Clinics
Key Statistics: 37,688 Rounds Played 55,223 Point of Sale
Purchases 142 Annual Pass Holders 9,177 Range Buckets Sold 231 Days Played 3,234 Hours in Operation
The course, along with offering unique programs and events, operates at very efficient levels. National averages for utilization rates vary from 46%-55% while Pheasant Run operates over 50% for the season and over 65% during the peak season. The team at Pheasant Run looks to continue growth through enhancing facilities, programs and opportunities for new customers.

5
Revenue Enhancement Maintain league program above 5500 rounds – 2008 estimate = $150,000 Maintenance and additions of Annual Memberships – 2008 estimate = $205,000 Advertisements in local and regional media (Michigan Golf Show, Michigan Golf Publications,
On-air radio promotions) Promotion of Junior tournaments, Junior Summer Golf Camp, Junior Golf Academy, Women’s
Golf Clinics, Women’s League, and Senior fees during non-peak hours Grow customer base and wallet share through promotion of In house programs such as
Player Reward Card – Loyalty program and Customer Appreciation Days Player Development - Continue At Your Leisure tapings for golf instruction Continue partnering with PLAYGOLFAMERICA supporting programs such as Free Lesson
Month, Women’s Golf Month, and Golf Michigan Month. Special Events
1. Mother’s Day – Mom’s play Free2. Father’s Day special3. LibertyFest 4. Member Tournaments5. Customer Appreciation Days & Promotions6. Monthly email specials7. Tailfeather’s mailing8. Member Appreciation Days9. Demo Days10. Player Reward Card11. Oktoberfest
Annual Rounds Played
0
10,000
20,000
30,000
40,000
50,000
60,000
70,000
80,000
Rounds 14,326 24,856 26,087 25,299 23,750 23,672 21,058 33,594 35,799 37,091 43,082 37,849 37,688
Potential Rounds 42,000 42,000 42,000 42,000 42,000 42,000 42,000 74,376 74,376 74,376 74,376 74,376 74,376
1995 1996 1997 1998 1999 2000 2001 2002 2003 2004 2005 2006 2007
6
Division Action Plan Division guiding principles and division objectives are accomplished through division actions plans developed for each division of Leisure Services. These plans outline specific initiatives that will be implemented throughout the year to work toward division and department goals. Division Guiding Principles Basic Description of Core Services: Maintain and elevate an upscale, twenty seven hole, municipal golf course with a sense of professionalism, proven golfer satisfaction, and a commitment to enhancing the environment while using Best Management Practices.
• Maintain and enhance “Total Golf Experience” • Create Country Club feel for public golfing customers • Create opportunities through growth of the game initiative • Customer service is #1 priority to every guest entering our facility • Maintain affordable rates for golfing public
Action areas identified by staff during the development of the DAP are as follows:
• Targeted programming • Environmental programming • “It’s the experience” • Multiculturalism activities with partnership and coordination • Arts and heritage in cooperation with the cultural commission • Heritage Hub with historical society and Bartlett-Travis House • Employee development • Strategic use of resources • Leisure Services Advisory Committee and other commissions • Sponsorships • Capital improvements • Asset management • Integrations of forms and plans • Opportunities inventory
Division Objectives The Balanced Scorecard concept is used as a measurement tool for the Leisure Services Department. The balanced scorecard transforms our strategic plan from a passive document into and active measurement toll for the organization. It provides a
7
framework that not only provides performance measurements, but helps planners identify what should be done and measured. Typically governments have performed financial measurement of the organization through the budgeting process. The financial measures, however, are inadequate for fully guiding and evaluating the journey through the information age that agencies must make. Therefore, the balanced scorecard is based on collecting measurable results from the following four perspectives: Customer, Financial, Operational, and Employee. Vision of the Future Pheasant Run Golf Club offers an affordable golf experience to the golfing public. The facility which is owned and operated by Canton Township prides itself on well maintained golf course conditions from tee to green. The staff members at Pheasant Run look to offer exceptional customer service before, during and after the round. The goal for the increased revenue streams comes from increasing programs outside of regular play. Annual passes, league play and outing revenues are sources that continue to be targeted. With expenses expected to rise slightly over the coming years with regards to salaries & wages, utilities, and course maintenance applications, it is imperative to target other means of revenue other than regular play. Competitive pricing coupled with the conservation of resources will help us toward our goal of covering operating and capital expenses. Debt services may require additional funds to be subsidized by Township’s general fund.

8
Operations Pheasant Run Golf Club Identity The identity of Pheasant Run is made clear by its logo, signage, advertising and facility appearance. Pheasant Run is located at 46500 Summit Parkway, Canton MI, 48188.
Location Description
Immediate area Type of area Suburban community Adjacent uses Residential Benefits Central location in the community Proximity Customer type Residents & Non-Residents of all demographics Potential customers 24,750
Competitors Northville Hills, Lakes of Taylor, Golden Fox, Stonebridge
Accessibility Close to major streets Near the intersection of Canton Center and Palmer Easy entrance / exit Three entries, three accessible Visibility From road Easy to see, high copula visible
Appeal of exterior Peaked copula with Pheasant on top, split faced brick, numerous windows
Landscaping Numerous flower beds with perennials & annuals Operating hours The Golf Course is open April – November with peak season times Monday – Sunday 6:15 am – 11:00 pm

9
The organizational structure
Personnel The Golf Pro is a contract position paid a portion of through part time pages, and a portion through bonuses based on the performance of the pheasant run budget. The 5-year projection for full time personnel is expected to show the following: 2008 2009 2010 2011 2012 Total Operations Headcount 2.5 2.5 2.5 2.5 2.5 2.5 Payroll 151,851 155,796 159,859 164,044 168,355 799,905 Bonuses Payroll burden 60,740 62,318 63,944 65,618 67,342 319,962 Total cost 212,592 218,114 223,803 229,662 235,697 1,119,867 Overall total Headcount 3 3 3 3 3 3 Payroll 151,851 155,796 159,859 164,044 168,355 799,905 Bonuses Payroll burden 60,740 62,318 63,944 65,618 67,342 319,962 Total personnel cost 212,592 218,114 223,803 229,662 235,697 1,119,867
Department Director
Park and Facility Maintenance Supervisor
Clerk II
Superintendent
Irrigation Tech
Golf Pro

10
SWOT Analysis Strengths:
• World renown architect • Practice facility • Bent grass fairways • Course maintenance and overall quality • Guaranteed tee time/pace of play • Many services for a public golf course • Exceptional customer service • New, easier fee structure • Free/ample parking • Competitive rates • Knowledgeable staff • Enhanced image • New Golf Cart fleet
Weaknesses:
• Narrow course with houses on both sides (Although most fairways with houses are wide. Hole #6 may be the exception.)
• “Municipal” golf course perception • Small, narrow clubhouse (unaccommodating) • Funding
Opportunities:
• Expansion of clubhouse • Regional course closings; therefore obtain golf member or guest list from
closing clubs • Offer unique programs through growth of the game initiative otherwise not
offered at competing facilities

11
Threats:
• Unstable financials • Unstable economy • Competition • Discounting as a means of increasing rounds • Downturn of golf industry
Competition
1. Golden Fox – upscale public, privately owned 2. Northville Hills - upscale public, privately owned 3. Stonebridge – public, daily fee, privately owned 4. Links of Novi – public, daily fee, privately owned 5. Tanglewood – public, daily fee, privately owned

12
Marketing Pheasant Run Golf Club product mix Facilities:
• 320 acre, 27 hole golf course intermingled between single-family homes, native areas and wetlands.
• Pen cross bent grass tees, greens and fairways connected by 10.5 miles of paved cart paths
• Practice facility with bent grass teeing area, target greens, and 10,000 square foot practice green
• 3,500 square foot clubhouse • Restaurant/grill with sandwiches, beverages, snacks and banquet services and
seating for 60 (bar and pro shop) Programs:
• Outings • Leagues • Corporate and Individual
1. Annual Pass Program 2. Single 3. Family 4. Corporate
Services
• Custom club fittings • Lessons • Ladies and Junior Clinics • 10 minute tee times • PGA professional staff • Rental Clubs • Community events • Starters/Rangers • Limited bag service • Beverage cart on course
Products
• Fully stocked pro shop • “Pro Line” golf apparel

13
Advertising and promotion Public Relations • Press release on increase of female golfers and what PRGC is doing to reach this market. • Monthly column in Canton Observer relating to golf, Canton employees etc. • Write press releases on large events at PRGC i.e. St. Joseph Pro Am, Chamber outing • Sports radio advertisement (trade and promotion with them) • Cross market with all CLS departments. • Continue with informational emails to golfer database with course updates • Create a promotional CD/Vide to use as a marketing tool • Member newsletters Community Relations • Utilize of an on-site comment log (CIT) Promotional • Provide custom divot tool to all guests • Provide neighboring communities with senior programs that lack a golf course
with coupons for their seniors to golf at Pheasant Run. • Provide golfers with loyalty punch card – limited life span Advertising • Advertise in golf magazines (e.g. Michigan Links, Michigan Publixer) • Golf insert in Detroit News and Ann Arbor News • Partner with Michigan Tourism – place information in the Travel Stops on local
highways. • Use NGF golfer database to implement at course, acquires spending power of individual golfers Direct Sales • Host a display booth at companies • Conduct cold calls to corporations that may have outings (e.g. Yazaki, UAW, Chamber members, etc.) and take collateral to share. • Conduct presentations to corporate sponsored sports groups, Toastmaster, Business Network etc.

14
Quality Service/ Stewardship • Send key staff to sales training • Develop a survey tool/evaluation for event planners to complete after the outing • Develop quantitative measures on guest satisfaction card that is placed on the golf cart. • Send birthday cards to Annual Pass holders
Distribute each ‘clinic’ participant a coupon • Train staff to be accepting of all demographics • Train staff to teach appropriate golf etiquette • Create Pheasant Run Ambassador Program Existing Marketing Materials and Image
Website Direct mail or e-mail to pass holders Annual Pass Holder kick off party/season ending party Michigan golf guides Golf score cards Yellow pages (one ad in W/NW) Signage Discover Guide book Collateral folder for walk-in enquiries Discover Leisure Newsletter Michigan golf show Newsletter to annual pass holders Vertical Response Monthly (Biweekly) to database Outing package Collateral folder for walk-in inquiries Community Resource Guide Players pass – discount program Yardage books on carts cost $3,000 in 2006 Michigan Publixer magazine Michigan Links magazine Course Directory GAM Discount Program (National Golf Foundation) Membership Dues (PGA,GAM,GCSSA, Chamber etc.) Customer Appreciation Days
OnLine Booking System Target Market Summary Current Market Segments (segmentation based on age, gender, experience versus benefits sought)
• Swingin’ Seniors: older females, frequent golfers, frequent private course play. • Junior Leaguers: younger females, third highest household income, not highly
competitive. • Tank Tops n’ Tennis Shoes: young males, infrequent play, extremely price
sensitive, not disposed to take lessons.
15
• Public Pundits: young males, frequent public golf course play, price sensitive. • Preoccupied Players: young males, infrequent play, second-highest household
income, not avid golfers. • Country Club Traditionalist: older males, highest average household income,
biggest spenders on golf, frequent private course play, most likely to take lessons.
• Pull Carts: oldest males, mostly retired, very frequent public course play, spend slightly above average on golf.
• Dilettante Duffers: average frequency of play, interest in best equipment, opinion leader, tries new equipment first.
Market Assessment
• Michigan ranks #1 in daily fee/municipal golf courses with 704 followed by Florida (623) and California (621)
• Wayne County has 34 daily fee/municipal courses. The border counties of Livingston (17), Washtenaw (21), and Oakland (55) combine to total 127 daily fee/municipal courses within the 4 county areas. This represents 18% of the total public/municipal golf courses in the state.
• In 2006, 2 new public courses opened in the state – down from 3 in 2005, 4 in 2004, 9 in 2003, 10 in 2002, and 17 in 2001.
• There are nearly 435,000 golfers in the Detroit Metropolitan area. 195,000 of the 435,000 are core golfers.
• The total number of adult golfers rose from 27.3 million to 28 million. Core golfers, which account for 91% of total rounds dropped from 12.8 million to 12.5 million. Core golfers are adults, 18 and over, who play at least 8 rounds per year.
• Average golf fee revenue per round is approximately $25 nationwide. Pheasant Run’s $30.
• Utilization rates nationwide average between 46% - 55% and are figured as the amount of rounds played vs. rounds available. Pheasant Run operates over 50% for the year and over 65% during the peak season of May through September.
Demographics Prior to 1960, Canton Township was primarily an agricultural community and had a population of only 5,313. With a population growth of more than 420 percent since 1970, Canton is now home to over 86,000 people. According to SEMCOG estimates, Canton’s population is projected to exceed 98,793 by the year 2035. Understanding the make up of the community is vital to success in the delivery of services. Leisure Services staff are required to regularly review demographic information to ensure that the facilities, programs and services provided are of interest to, and meet the needs of, our residents.

16
Canton Community Population
Total population 2000
(SEMCOG)
2005 American FactFinder %
Estimates
2008 SEMCOG Population
based on % Estimates
Under 5 years 6,715 9.40% 8,004 5 to 9 years 6,606 9.60% 8,173 10 to 14 years 5,670 9.10% 7,747 15 to 19 years 4,982 4.60% 3,916 20 to 24 years 4,286 4.40% 3,746 25 to 29 years 5,346 4.60% 3,916 30 to 34 years 6,938 7.80% 6,640 35 to 39 years 7,619 10.40% 8,854 40 to 44 years 6,786 9.90% 8,428 45 to 49 years 5,945 8.00% 6,811 50 to 54 years 5,484 7.00% 5,959 55 to 59 years 3,520 5.70% 4,853 60 to 64 years 1,938 2.60% 2,213 65 to 69 years 1,385 1.80% 1,532 70 to 74 years 1,193 1.50% 1,277 75 to 79 years 958 1.50% 1,277 80 to 84 years 620 1.40% 1,192 85 years and over 375 0.70% 596 Total 76,366 100.00% 85,134 Source: SEMCOG (total popluation) & American FactFinder (age % estimates)

17
Canton - Percentage of Population by Race
Race 1990
Census 2000
Census 2008 Estimated
White 52,374
(91.8%) 62,846
(82.3%) 64,106
(75.3%)
Black 1,155
(2.0%) 3,434
(4.5%) 6,470
(7.6%) Asian or Pacific Islander
2,532 (4.4%)
6,648 (8.7%)
12,259 (14.4%)
Hispanic, American Indian & Other
1, 134 (1.43%)
3,438 (4.5%)
2,299 (2.7%)
Total Population 57,040 76,366 85,134 Source: SEMCOG (total population and 1990 & 2000 %) & 2005 American FactFinder (race % estimates)
Target Market ID (Market segments based on age, gender and experience) 1. Outings 2. Corporate Transient 3. Non-Resident Males 4. Area Seniors
5. Resident Females 6. Resident Makes
Target Market Objectives (Specific initiatives to achieve membership goals)
• Provide senior rates weekdays only and before 12:00 pm • Conduct junior camps, promote early morning walking, and partner with junior
golf associations to provide competitions • Provide lessons and etiquette programs and clinics • Promote “twilight” rates and frequent player card • Promote off-peak rates to relate with all customers • Offer introductory rates or programs to draw new customers • Continue to enhance annual golf pass and amenities included • Promote golf course conditions (premier facility) that separate us from
competitors • Offer new hard good inventory and demo programs with Demo Days • Use PLAYGOLFAMERICA as a resource for program descriptions. • Maintain current league program while adding league spots to designated tee
tiems

18
Market Trends Canton Leisure Services takes a multi-faceted approach to identify trends that affect the community. Tools used include: review of community demographics, focus group input from our Leisure Services Advisory Committee and staff members, attendance at educational conferences and seminars that address the topic, review of usage patterns and popularity of program offerings and community input via surveys. Canton Leisure Services must proactively respond to trends and issues in order to remain a vital force in shaping Canton’s economic, social and environmental future. There are several clear trends that may influence future operations and must be analyzed to determine potential impact. Trend 1 – Environmental Stewardship Individuals are becoming aware of environmental issues and are placing a priority on the preservation and protection of natural areas. Environmental stewardship is defined as the maintenance and improvement of our environment for the benefit of present and future generations. Stewardship requires sound and sensitive management practices accomplished through the preservation of wetlands, environmental education, environmentally friendly products and conservation of utilities. Trend 2 - Passive Recreation Canton residents have ranked walking/hiking/nature trails as the number one park facility need for the community. This was evident in visioning workshops conducted for the development of the master plan for Patriot Park and from the 2005 Canton Leisure Services Community Survey. Over 77% of survey respondents ranked trails as their 1st or 2nd choice for new facilities in the community. A 2nd splash park, dog park and community gardens also received high rankings as respondent choices. In order to meet the meet the desired needs of the community, special focus should be placed on the development of greenways, community gardens, provision of nature education and a dog park. Trend 3 - Health/Wellness Health and wellness issues are at the fore front because of the increasing number of unfit residents in Michigan and the economic impact of rising health care costs. According to a study conducted by David Chenowith, PhD, one in four Michigan residents is considered obese and at risk for chronic diseases like cancer, diabetes and cardiovascular disease. Additionally, chronic diseases account for seven of every ten U.S. deaths and for more than 60% of medical care expenditures. Lack of physical activity and lack of leisure time are identified obstacles to improving health.

19
Leisure Services recognizes that the main focus is on prevention, and changing lifestyles before an individual becomes a statistic. Prevention, outreach and support are three critical factors believed to positively impact the overall health of the community. Strategies will include: offering health screenings and a wide variety of activity classes and health presentations to reach individuals at all fitness levels, abilities, ages and days and times; inclusion of a health/wellness curriculum or event in day camps, programs and special events; educate the community to make them aware of resources that lend support and create opportunities to change health behavior. Trend 4 - Demographic, Social, Cultural Canton has been one of the fastest growing communities in Southeast Michigan as evidenced by the increase in population from the 2000 census. The Southeast Michigan Council of Governments (SEMCOG) project that Canton’s population will exceed 98,000 by 2030. CLS recognizes that it is imperative to understand Canton’s demographics in order to provide services that are desired and meet the needs of the community. Boomers Baby boomers have reshaped what it means to grow older. Compared with their parents, boomers are healthier, better educated and living well into their 80’s and beyond. The increasing lifespan has given boomers the chance to reinvent themselves and pursue new passions at any age. As a whole, Boomers are more affluent, tend to be more active than preceding generations and think of themselves as younger than their parents at the same age. As they age, Boomers are shifting from activities such as tennis and aerobics to less strenuous ones such as walking, cycling, tai chi and yoga. Boomers are likely to live much longer and more than likely boomer retirement will be a mix involving work, leisure and family. Canton Leisure Services will need to provide a diverse range of health/wellness activities and other programs at varied times to accommodate schedules and activity levels. Millennials A millennial is anyone born between 1981 and 2000 and there are over 75 million today. Just as the baby boomers changed society, the sheer numbers of millennials can do the same. Millennials are technically literate – technology has always been a part of their lives. They expect instantaneous feedback and gratification. The 2006 Cone Millennial Cause Study cites that tragic world events such as 9/11, coupled with recent natural disasters have motivated the Millennial Generation to develop a strong social conscience. Technology has given them a loud and powerful voice. Millennials have been referred to as the most civic-minded generation since World

20
War II. The Cone Study suggests that Millennials are the most socially-conscious consumers to date. Sixty-one percent of survey respondents are currently worried about the state of the world today and feel personally responsible to make a difference. Millennials want to live in communities and work for businesses that care about how it impacts or contributes to society. As millennials become adults, they will be the next generation of Canton homeowners. Programs and services will need to be offered that are appealing. Easy access to amenities, location to parks, etc., varied communications methods and opportunities to give back to society are key.
Culture/Heritage Nationally the population is becoming more ethnically and racially diverse. This is reflective in Canton where the Asian and African American population has more than doubled since the 2000 census. Increasing ethnicity provides opportunity to expand cultural awareness, but also presents a challenge to overcome language and social barriers. The arts can be utilized to bridge cultural gaps, provide connectivity and promote cultural awareness and tolerance. Historic preservation will promote the inclusion of heritage education. Limited Discretionary Time Society as a whole is experiencing less discretionary time and in smaller segments. Programs and services should be offered in more compressed time frames, at “non-traditional” times and with drop-in options. Outreach Providing services throughout the community is important to reach the entire community. A focus should be made to partner with agencies to provide recreation opportunities in identified at-risk areas, and provide services that address identified parenting issues such as child abuse, building character, etc. Trend 5 - Technology As technology continues to evolve and become integrated into our everyday lives, Canton Leisure Services needs to stay current in order to provide more efficient and convenient service. Technology should be used for on-line purchases, virtual tours, on-line support for health/wellness, marketing, enhanced communication, facility security, and collection and management of data and assets.

21
Trend 6 - The Changing Economy According to University of Michigan economists hundreds of thousands of jobs, mostly in manufacturing, have been lost since 2000. State-shared revenue has also been reduced and a depressed housing market has adversely impacted taxable values of property. These forces are requiring local municipalities to struggle with budgets and often require them to find alternative funding sources. The Department strives to properly maintain aging facilities, absorb rising fixed costs and enhance services without increasing tax support. Canton Leisure Services needs to continue to utilize the cost recovery system. Further development of partnerships and sponsorships and expanded use of volunteers whenever possible will offset expenses. The strategic use of resources and analytical assessment of proposed services and capital expenditures will result in increased efficiency. By building an identity and a reputation through enhanced public awareness and credibility of services, the Department will ultimately be positioned as a necessity within the Community. Trend 7 - Higher Expectations of Service Many adults today grew up with programmed recreation and continue to expect services for themselves and their children. According to industry experts, hectic schedules, family obligations and travel costs have resulted in an increased demand for more flexible and convenient recreation opportunities. Dissatisfaction with the economy, their perception of government and the inability to directly reach high ranking (above local government) elected officials have created frustration. Residents recognize that Canton officials and departments are accessible. By the nature of our operation, Leisure Services staff is accessible and often deal with frustrated residents who often have unreasonable expectations for customer service and unreasonable demands on our facilities. To combat this challenge, effective customer service is critical. Staff should receive regular training on service standards and information and responses should be provided to customers in a timely manner, facility schedules should be adjusted in order to balance the need to generate revenue with rentals and community space and member/drop-in time.

22
Financial plan The goal for Pheasant Run to increase revenues annually by 3% will come from increased participation in both Annual Golf Pass sales and the finding of new league programs. Regular play may be increased by continuing customer loyalty programs and through the offering of regular play incentives. Email and mailing list databases must remain current with the offering of monthly incentives. Golf course maintenance and turf conditions must stay at a premium as competition increases. Placing a high priority on turf conditions and appearance will ensure to retain high levels of play through the season. Generated income (sales) Revenue for the Pheasant Run can be broken down into three major categories: Golf Green Fees, Range Fees, and Pro Shop Merchandise Fees. Golf Green Fees include daily usage, league play and outings, Annual Pass Fees for golf and range, Range Fees for daily usage, and Pro Shop Merchandise Fees through hard and soft goods. 2005 2006 2007 Golf Green Fees $1,189,827 $1,078,212 $1,032,953 Range Fees $ 81,134 $ 67,030 $ 70,774 Pro Shop Merchandise $ 125,330 $ 106,748 $ 107,433 Operating Expenses $2,315,267 $2,131,084 $1,947,975 The target area for growth is with Annual Pass sales, leagues and off peak playing times. Pheasant Run operates at 85-90% capacity on weekend morning with only 30-40% capacity in the afternoons. This presents opportunities through incentive play and reward programs.
Annual Rounds
0
10,000
20,000
30,000
40,000
50,000
60,000
70,000
80,000
Rounds 14,326 24,856 26,087 25,299 23,750 23,672 21,058 33,594 35,799 37,091 43,082 37,849 37,688
Potential Rounds 42,000 42,000 42,000 42,000 42,000 42,000 42,000 74,376 74,376 74,376 74,376 74,376 74,376
1995 1996 1997 1998 1999 2000 2001 2002 2003 2004 2005 2006 2007

23
Revenues Per Round
Player Profile for Rounds Played
$0.00
$5.00
$10.00
$15.00
$20.00
$25.00
$30.00
$35.00
$40.00
$45.00
Food & Beverage $5.51 $5.39 $6.07 $5.65 $5.36
Pro Shop $2.65 $2.73 $2.79 $2.72 $2.85
Additional Rev. per round $8.16 $8.12 $8.96 $8.37 $8.21
Revenue per round $30.61 $28.69 $29.60 $29.63 $27.40
Total Rev. per round $39.37 $38.70 $40.24 $39.43 $37.49
2004 2005 2006 3yr Ave 2007
Outings6% Spring/Fall
9%
Staff12%
Senior/Junior7%
League12%
Member21%
Guest16%
Resident17%

24
2008 Estimates
Month Jan Feb Mar Apr May Jun Jul Aug Sep Oct Nov Dec Total
Revenue
Total sales 2,515 4,431 25,535 205,244 175,123 194,983 251,911 180,495 131,931 106,830 34,130 69,774 1,382,902
Cost of goods sold
Gross profit 2,515 4,431 25,535 205,244 175,123 194,983 251,911 180,495 131,931 106,830 34,130 69,774 1,382,902
Operating expenses
General & Administrative Bad debts Losses & thefts Credit Card Fees 989 2,478 2,128 2,238 4,968 5,281 1,003 3,101 22,186 Operating Supplies 225 1,096 5,941 4,258 2,482 5,151 2,793 2,117 1,677 126 134 26,000 Dues and licenses 125 125 125 125 125 125 125 125 125 125 125 125 1,500 Utilities 2,667 2,667 2,667 2,667 2,667 2,667 2,667 2,667 2,667 2,667 2,667 2,667 32,000 Mag/subscriptions 46 46 46 46 46 46 46 46 46 46 46 46 550 Maintenance/repairs 5,951 7,078 29,672 25,458 57,636 32,500 46,707 36,961 20,740 22,605 11,471 5,251 302,030 Office expenses 167 167 167 167 167 167 167 167 167 167 167 167 2,000 Contracted Services 2,645 2,645 2,645 2,645 2,645 2,645 2,645 2,645 2,645 2,645 2,645 2,645 31,740 Supplies for Resale 241 28,762 42,207 3,776 12,439 3,967 917 204 58 4,429 97,000 Other 3,104 3,104 3,104 3,104 3,104 3,104 3,104 3,104 3,104 3,104 3,104 3,104 37,250 Telephone/fax/mail 167 167 167 167 167 167 167 167 167 167 167 167 2,000 Equipment Lease 2,083 2,083 2,083 2,083 2,083 2,083 2,083 2,083 2,083 2,083 2,083 2,083 25,000 Personnel Salaries and benefits 12,654 12,654 12,654 12,654 12,654 12,654 12,654 12,654 12,654 12,654 12,654 12,654 151,851 Payroll burden 5,062 5,062 5,062 5,062 5,062 5,062 5,062 5,062 5,062 5,062 5,062 5,062 60,740 PT Wages 5,916 11,426 19,504 22,830 35,380 43,167 41,910 58,201 29,260 26,185 21,335 30,118 345,232 Overtime 3,813 3,813 3,813 3,813 3,813 3,813 22,880 PT Fringes 592 1,143 1,950 2,283 3,538 4,317 4,191 5,820 2,926 2,619 2,134 3,012 34,523 Sales promotion Advertising/promotion 1,417 1,417 1,417 1,417 1,417 1,417 1,417 1,417 1,417 1,417 1,417 1,417 17,000 Printing & Publishing 1,417 1,417 1,417 1,417 1,417 1,417 1,417 1,417 1,417 1,417 1,417 1,417 17,000 Insurance Liability insurance 1,667 1,667 1,667 1,667 1,667 1,667 1,667 1,667 1,667 1,667 1,667 1,667 20,000 Other insurance Transportation Travel Transportation 442 2,852 4,160 9,411 4,097 1,131 22,093 Total operating expenses 45,678 54,321 114,646 141,082 147,909 143,586 143,056 147,824 92,280 91,644 69,288 79,264 1,270,575 EBITDA -43,163 -49,890 -89,111 64,162 27,214 51,397 108,855 32,671 39,651 15,186 -35,158 -9,490 112,327 Depreciation 7,617 7,617 7,617 7,617 7,617 7,617 7,617 7,617 7,617 7,617 7,617 7,617 91,400 Amortization Interest on short term loans Interest on long term loans Deferred loan interest Flexible loan interest Net business result -50,780 -57,507 -96,727 56,546 19,598 43,780 101,239 25,055 32,035 7,570 -42,774 -17,107 20,927

25
Sales/month per productlineyear 1
0
50,000
100,000
150,000
200,000
250,000
Jan Feb Mar Apr May Jun Jul Aug Sep Oct Nov Dec
Driving Range
Food & Beverage
Greens Fees
Other Revenue
Pro Shop
Cash in / Cash out per month
year 1
0
50,000
100,000
150,000
200,000
250,000
300,000
Jan Feb Mar Apr May Jun Jul Aug Sep Oct Nov Dec
Cash in
Cash out
Sales Estimates
2008 2009 2010 2011 2012 Total Driving Range Range Fees 85,100 87,653 90,283 92,991 95,781 451,807 Net sales 85,100 87,653 90,283 92,991 95,781 451,807 Cost of goods Cost of goods % Gross profit 85,100 87,653 90,283 92,991 95,781 451,807 Food & Beverage Commission 45,000 46,350 47,741 49,173 50,648 238,911 Net sales 45,000 46,350 47,741 49,173 50,648 238,911 Cost of goods Cost of goods % Gross profit 45,000 46,350 47,741 49,173 50,648 238,911 Greens Fees Greens Fees 1,128,402 1,162,254 1,197,122 1,233,035 1,270,026 5,990,839 Net sales 1,128,402 1,162,254 1,197,122 1,233,035 1,270,026 5,990,839 Cost of goods

26
Cost of goods % Gross profit 1,128,402 1,162,254 1,197,122 1,233,035 1,270,026 5,990,839
Other Revenue Misc Revenue 9,000 9,270 9,548 9,835 10,130 47,782 Net sales 9,000 9,270 9,548 9,835 10,130 47,782 Cost of goods Cost of goods % Gross profit 9,000 9,270 9,548 9,835 10,130 47,782 Pro Shop Product Sales 115,400 118,862 122,428 126,101 129,884 612,674 Net sales 115,400 118,862 122,428 126,101 129,884 612,674 Cost of goods Cost of goods % Gross profit 115,400 118,862 122,428 126,101 129,884 612,674 Overall total sales Total net sales 1,382,902 1,424,389 1,467,121 1,511,134 1,556,468 7,342,015 Total cost of goods Total gross profit 1,382,902 1,424,389 1,467,121 1,511,134 1,556,468 7,342,015
Sales/quarter per productline3 years
0
200,000
400,000
600,000
800,000
1,000,000
1,200,000
1st qtr. 2nd qtr. 3rd qtr. 4th qtr. 2008 1st qtr. 2nd qtr. 3rd qtr. 4th qtr. 2009 1st qtr. 2nd qtr. 3rd qtr. 4th qtr. 2010
Driving Range
Food & Beverage
Greens Fees
Other Revenue
Pro Shop
Cash in / Cash out quarterly3 years
0
200,000
400,000
600,000
800,000
1,000,000
1,200,000
1,400,000
1,600,000
1st qtr. 2nd qtr. 3rd qtr. 4th qtr. 2008 1st qtr. 2nd qtr. 3rd qtr. 4th qtr. 2009 1st qtr. 2nd qtr. 3rd qtr. 4th qtr. 2010
Cash in
Cash out