Economic Development Authority (EDA) - Ramsey, MN
332
City of Ramsey Agenda Economic Development Authority (EDA) Thursday, January 25, 2018 7:30 am COR Room, 7550 Sunwood Drive NW 1. Call to Order 2. Approve Agenda 3. EDA Business 1. NO ACTION: Supplemental Information for Next Case 2. Review Draft Economic Development Chapter of Comprehensive Plan 4. Member/Staff Input 5. Adjournment Our Mission: To work together to responsibly grow our community, and to provide quality, cost-effective, and efficient government services
-
Upload
khangminh22 -
Category
Documents
-
view
0 -
download
0
Transcript of Economic Development Authority (EDA) - Ramsey, MN

City of RamseyAgenda
Economic Development Authority (EDA)Thursday, January 25, 2018
7:30 amCOR Room, 7550 Sunwood Drive NW
1. Call to Order
2. Approve Agenda
3. EDA Business
1. NO ACTION: Supplemental Information for Next Case
2. Review Draft Economic Development Chapter of Comprehensive Plan
4. Member/Staff Input
5. Adjournment
Our Mission: To work together to responsibly grow our community, and to provide quality, cost-effective, and efficient governmentservices

Economic Development Authority (EDA) 3. 1. Meeting Date: 01/25/2018 Submitted For: Patrick Brama, Administrative Services By: Patrick Brama, Administrative Services
Title:NO ACTION: Supplemental Information for Next Case
Purpose/Background:The purpose of this case is to provide a clearing house of supplemental information that may be useful for the nextcase. This information may or may not be useful or pertinent. Staff is not requesting EDA Members read/ print allof this information. It's here for reference purposes only.
Notification:NA
Observations/Alternatives:NA
Funding Source:NA
Recommendation:NA
Action:NA
Attachments2018 EDA WorkplanCitizen Survey (2014)Citizen Survey (2016)RCP Retail Market Analysis (Streetar)RCP Retail Market Analysis (Burga)RCP Business Incubator (Streetar)RCP Business Incubator (Burga)RCP Community Center (Burga)
Form ReviewInbox Reviewed By DateKurt Ulrich Kurt Ulrich 01/19/2018 03:33 PMForm Started By: Patrick Brama Started On: 01/19/2018 12:36 PMFinal Approval Date: 01/19/2018

2018 Economic Development Workplan
Purpose Provide a functional plan that prioritizes the work of the City’s economic development department and Economic Development Authority (EDA).
Objectives 1. Encourage, and plan for, growth of industrial, commercial, retail and housing opportunities 2. Foster the retention and expansion of existing Ramsey businesses 3. Support and maintain a positive local businesses environment 4. Leverage use of outside economic resources, partnerships and funding for economic development initiatives
Outcomes 1. Growth of the City’s tax base 2. Growth in the City’s job base 3. Improved quality of life

Tactics/ Description Timeline Additional Resources & Tools Required Key Outcomes/Metrics
(1) Business Retention & Expansion The large majority of local economic growth comes from existing Ramsey businesses. The purpose of this goal is to develop and maintain positive relationships with existing Ramsey businesses (establish trust). This goal is implemented through quality customer service, businesses visits, and facilitating business events.
Ongoing
Currently Sufficient: assuming moderate customer service demand levels, sufficient resources exist to complete this tactic as proposed.
Complete 24 business visits annually. Host EDA business expo, business appreciation golf tournament, and fall networking event. Participate in Anoka County Broker Event, Anoka Ramsey Job Fair, and MN Marketing Partnership.
(2) Recruit Restaurants & Retail Users The desire for the City of Ramsey to establish new restaurant and retail users continuous to be a high priority for Ramsey residents and elected officials alike. Feedback from the development market is Ramsey needs more rooftops and higher traffic counts to achieve this goal. Although Ramsey continues to make good progress on rooftops and traffic counts, there is a desire to be more pro-active. The purpose of this tactic is:
(A) Consider establishing a policy(ies) to provide financial incentives for said users. For example, the City had a full service restaurant subsidy program/ policy several years back.
(B) Consider establishing a targeted professional information/ marketing package for said users.
(C) Consider deploying staff (and CBRE) to establish/ grow relationships with developers that work directly with said target market.
(D) Reconsider broker selection—is there a better broker for retail?
(E) Try to define what success looks like, or what progress targets Ramsey can make?
(F) Obtain annual traffic counts for The COR
2018
Currently Sufficient: assuming moderate customer service demand levels, sufficient resources exist to complete this tactic as proposed. This tactic may result in the need to create/ dedicate financial resources for incentives in the future. If dollars are needed for the developer information package, the EDA Budget (Marketing line item) can be utilized. Also, The COR TIF District (#14) is available to support this tactic.
(A) New financial incentive policy in place. (B) New information packet/ marketing packet. (C) New relationships created.

Tactics/ Description Timeline Additional Resources & Tools Required Key Outcomes/Metrics
(3) COR Development Feasibility, Pro-Forma, and Policy The City of Ramsey has taken on the role of master developer for The COR. Currently, the City manages The COR, and our various COR development related discussions on a “case-by-case-basis” and with policy based on “past practice.” Staff would like to develop more clarity/ intentional policy/ structure on how the City manages this project. Completion of this tactic will put the City in a stronger position to analyze/ respond to development proposals, strategize marketing efforts, and carry out budget/ policy discussions. (A) Pro-Forma: from a development perspective, the list of
City obligations (expenditures) for The COR is relatively long, and at this point not well-defined. Additionally, the list of revenue streams from The COR is relatively straight forward, but have been committed informally in several instances. Staff would like to develop a formal pro-forma that outlines all anticipated expenses and all anticipated revenues for the project.
(B) Feasibility Analysis: this discussion will require the City to complete a feasibility analysis for all outstanding development items to provide a clear scope of future development costs (i.e. cut/ fill, roads, storm water, community center, signs, etc.).
(C) Policy Positions: this discussion also warrants the City to take policy positions on various outstanding development items (i.e. expenses) and how they will be paid for (all city, all developer, split, etc.), and roughly when various improvements will be made (now, in the future, in phases, etc.).
2018 This work will require assistance from third party professionals. Feasibility Reports/ Concept Studies:
infrastructure-$25,000-$75,000
regional storm water --$15,000-$35,000
cut & fill analysis -- $5,000-$25,000
sign plan--$5,000-$30,000
parking ramp(s) -- $5,000-$15,000
community center-- $10,000-$25,000.
parks/ trails--$15,000-$40,000
pro-forma assistance/ review from Ehlers--$5,000-$20,000.
The numbers outlined above are very preliminary. Staff would like to get quotes for EDA review and/or review by other boards. Staff anticipates various funding sources to be utilized. Potentially, the University of Minnesota Resilient Communities Program may play a role in completing, or speeding up, some of this work.
Completed feasibility analysis on various outstanding pre-development items. Policy positions on various development items. Completed development pro-forma.

Tactics/ Description Timeline Additional Resources & Tools Required Key Outcomes/Metrics
(4) RALF Utilize the Metropolitan Council administered, MNDOT funded, RALF (right of way acquisition loan fund) for purchasing properties needed for U.S. Highway 10 improvements in Ramsey. Update: staff received word from MnDOT/ MetCouncil in August 2017 that they will no longer accept applications for RALF from the City of Ramsey. The City must first complete their updated plan for improvements to US Highway 10 and must update their Official Map.
Ongoing
Currently Sufficient: assuming moderate customer service demand levels, sufficient resources exist to complete this tactic as proposed. In some cases, this work does require use of third party professionals
Economic Development staff will continue to work with the Metropolitan Council to purchase at least property per year. Economic Development staff will continue to work with Engineer and Planning staff to complete an updated Official Map and Highway 10 plan for Ramsey.
(5) Sell Surplus City Owned Land The City owns a large inventory of surplus land available for development. In 2017, the City completed a process to obtain shovel ready information for most city-owned property. Through that process staff has identified the following outstanding items:
(A) Properties #37 and #45 have various potential environmental findings to further discuss and address.
(B) North side of the new business park (i.e. former Legacy site) should become shovel ready. This would be a new shovel ready application.
2018 Currently Sufficient: assuming moderate customer service demand levels, sufficient resources exist to complete this tactic as proposed. This work item does require use of third-party professional services (Shovel Ready Certifications and subsequent due-diligence). TIF #1 has been identified as a funding source for this work. NOTE: the large majority of shovel-ready work was completed in 2017. This goal is nearly completed. The State of Minnesota is currently officially reviewing the City’s applications for shovel ready sites. The purpose of this tactic is to keep the EDA updated on some remaining items staff is closing out.
Land sales.

Tactics/ Description Timeline Additional Resources Required Key Outcomes/Metrics
(6) Business Incubator Consider utilizing the roughly 3,500 square foot vacant space on the second floor of the Ramsey Municipal Center for a business incubator program. Staff would like to kick off the process with a scoping meeting (i.e. how should we approach this task).
2018 At this point, no additional resources are being requested. Based on the scope of this project, additional resources will be needed. The City’s Public Utilities Fund may be available for this project.
Decide if the City has a genuine interest in starting a business incubator. Have a general scope for what a business incubator means in Ramsey.
(7) ZIP Code In 2015, the City of Ramsey did open its doors to the first ever Ramsey substation USPS Post Office. Although this is a positive step for Ramsey, the need for an independent zip code still exists. The purpose of this tactic is to pursue an independent zip code for our community. Process:
1. Meet USPS minimum standards for obtaining a new zipcode (delivery points, deliver routes, scheme items, sectors). The City needs to submit a request for an audit.
2. USPS audit made—Ramsey either meets minimum thresholds or not. If they do, move on to step 3.
3. USPS conducts a survey of community to gather feedback/ support for a new zip code.
4. USPS grants Ramsey a new zip code.
Ongoing
No additional resources requested. Normal staff duties.
Apply again. Approval or denial of a new Ramsey zip code.

National Research Center, Inc. | Boulder, CO International City/County Management Association | Washington, DC
The National Citizen Survey™ Ramsey, MN
Community Livability Report
2014

The National Citizen Survey™ © 2001-2014 National Research Center, Inc.
National Research Center, Inc. International City/County Management Association 2955 Valmont Road, Suite 300 777 North Capitol Street NE, Suite 500 Boulder, CO 80301 Washington, DC 20002 www.n-r-c.com • 303-444-7863 www.icma.org • 202-289-ICMA
Contents About .............................................................................................. 1
Quality of Life in Ramsey .................................................................. 2
Community Characteristics ............................................................... 3
Governance ..................................................................................... 5
Participation .................................................................................... 7
Special Topics .................................................................................. 9
Conclusions ................................................................................... 13

1
About The National Citizen Survey™ (The NCS) report is about the “livability” of Ramsey. The phrase “livable community” is used here to evoke a place that is not simply habitable, but that is desirable. It is not only where people do live, but where they want to live.
Great communities are partnerships of the government, private sector, community-based organizations and residents, all geographically connected. The NCS captures residents’ opinions within the three pillars of a community (Community Characteristics, Governance and Participation) across eight central facets of community (Safety, Mobility, Natural Environment, Built Environment, Economy, Recreation and Wellness, Education and Enrichment and Community Engagement).
The Community Livability Report provides the opinions of a representative sample of 430 residents of the City of Ramsey. The margin of error around any reported percentage is 5% for the entire sample. The full description of methods used to garner these opinions can be found in the Technical Appendices provided under separate cover.
Communitiesare partnerships among…
Residents
Government
Community-based
organizations
Private sector

2
Quality of Life in Ramsey Most residents rated the quality of life in Ramsey as excellent or good and this was similar to the benchmark (see Appendix B of the Technical Appendices provided under separate cover).
Shown below are the eight facets of community. The color of each community facet summarizes how residents rated it across the three sections of the survey that represent the pillars of a community – Community Characteristics, Governance and Participation. When most ratings across the three pillars were higher than the benchmark, the color for that facet is the darkest shade; when most ratings were lower than the benchmark, the color is the lightest shade. A mix of ratings (higher and lower than the benchmark) results in a color between the extremes.
In addition to a summary of ratings, the image below includes one or more stars to indicate which community facets were the most important focus areas for the community. Residents identified Safety and Economy as priorities for the Ramsey community in the coming two years. It is noteworthy that Ramsey residents gave favorable ratings to these facets of community. In fact, ratings for all facets including Mobility, Natural Environment, Built Environment, Recreation and Wellness, Education and Enrichment and Community Engagement were positive and similar to other communities. This overview of the key aspects of community quality provides a quick summary of where residents see exceptionally strong performance and where performance offers the greatest opportunity for improvement. Linking quality to importance offers community members and leaders a view into the characteristics of the community that matter most and that seem to be working best.
Details that support these findings are contained in the remainder of this Livability Report, starting with the ratings for Community Characteristics, Governance and Participation and ending with results for Ramsey’s unique questions.
Education
and Enrichment
Community Engagement
Mobility
Natural Environment
Recreation
and Wellness
Built Environment
Safety
Economy
Legend
Higher than national benchmark
Similar to national benchmark
Lower than national benchmark
Most important
Excellent
14% Good
58%
Fair
28%
Poor
0%
Overall Quality of Life

3
Community Characteristics What makes a community livable, attractive and a place where people want to be?
Overall quality of community life represents the natural ambience, services and amenities that make for an attractive community. How residents rate their overall quality of life is an indicator of the overall health of a community. In the case of Ramsey, 82% rated the City as an excellent or good place to live. Respondents’ ratings of Ramsey as a place to live were similar to ratings in other communities across the nation.
In addition to rating the City as a place to live, respondents rated several aspects of community quality including Ramsey as a place to raise children and to retire, their neighborhood as a place to live, the overall image or reputation of Ramsey and its overall appearance. Most residents felt that the overall appearance of Ramsey, Ramsey as a place to raise children and their neighborhood as a place to live were excellent or good. Although a majority felt that this was true of Ramsey as a place to retire and of Ramsey’s overall image, these were less than the benchmark.
Delving deeper into Community Characteristics, survey respondents rated over 30 features of the community within the eight facets of Community Livability. Safety and Natural Environment were the facets with the highest ratings, with at least 8 in 10 residents giving positive ratings to each measure in these categories. Conversely, Economy was the facet having the lowest ratings; every item in this area received positive ratings from half or fewer of residents. Overall, most Community Characteristics rated similarly to other communities. Of the seven measures with ratings lower than the benchmark, five related to Ramsey’s Economy. Two characteristics of the community rated higher than the benchmark and were in the area of Built Environment: affordable quality housing and housing options.
84% 83% 77%
51% 51%
Overall image Neighborhood Place to raise children Place to retire Overall appearance
Higher Similar Lower
Comparison to national benchmark Percent rating positively (e.g., excellent/good)
Excellent
22%
Good
60% Fair
17%
Poor
0%
Place to Live

The National Citizen Survey™
4
Figure 1: Aspects of Community Characteristics
75%
69%
52%
69%
75%
54%
41%
60%
53%
66%
27%
49%
50%
50%
48%
56%
82%
84%
55%
64%
66%
70%
75%
68%
94%
94%
90%
55%
54%
42%
35%
23%
49%
21%
Opportunities to volunteer
Opportunities to participate in community matters
COMMUNITY ENGAGEMENT
Child care/preschool
K-12 education
Adult education
Cultural/arts/music activities
Education and enrichment opportunities
EDUCATION AND ENRICHMENT
Fitness opportunities
Recreational opportunities
Health and wellness
RECREATION AND WELLNESS
Place to work
Place to visit
Employment opportunities
Shopping opportunities
Cost of living
Business and services
Vibrant downtown/commercial area
Overall economic health
ECONOMY
Public places
Housing options
Affordable quality housing
New development in Ramsey
Overall built environment
BUILT ENVIRONMENT
Cleanliness
Overall natural environment
NATURAL ENVIRONMENT
Traffic flow
Travel by car
Travel by bicycle
Ease of walking
Paths and walking trails
Overall ease of travel
MOBILITY
Safe downtown/commercial area
Safe in neighborhood
Overall feeling of safety
SAFETY
Higher
Similar
Lower
Percent rating positively (e.g., excellent/good, very/somewhat safe)
Comparison to national benchmark

5
Governance How well does the government of Ramsey meet the needs and expectations of its residents?
The overall quality of the services provided by Ramsey as well as the manner in which these services are provided are a key component of how residents rate their quality of life. On par with other communities, three-quarters of Ramsey residents rated the overall quality of City services as excellent or good.
Survey respondents also rated various aspects of Ramsey’s leadership and governance. All measures of general government performance were similar to the benchmark, including value of services for taxes paid, the City’s overall direction, welcoming citizen involvement, acting in the best interest of the community, being honest, treating residents fairly and customer services. Each of these aspects of government performance received ratings of excellent or good from at least 4 in 10 respondents. Customer service was the most highly rated aspect in this area and received positive ratings from 8 in 10 respondents.
Respondents evaluated nearly two dozen individual services and amenities available in Ramsey. Nearly all of the ratings were similar to ratings in communities elsewhere; only recreation centers received ratings that lagged below the benchmark. Similar to Community Characteristics, the most positively rated services were related to Safety, where all but one of the services received positive ratings from 8 in 10 residents, and the least positively rated service was within Economy (43% excellent or good for economic development). Services related to Natural Environment fared well, with 7 in 10 residents rating drinking water and natural areas preservation well.
44% 48% 48% 43% 43% 47%
52%
79%
Value of
services for
taxes paid
Overall
direction
Welcoming
citizen
involvement
Confidence in
City
government
Acting in the
best interest
of Ramsey
Being honest Treating all
residents
fairly
Customer
service
Higher Similar Lower
Comparison to national benchmark Percent rating positively (e.g., excellent/good)
Excellent
14%
Good
60%
Fair
25%
Poor
2%
Overall Quality of City Services

The National Citizen Survey™
6
Figure 2: Aspects of Governance
58%
75%
43%
40%
43%
81%
73%
69%
72%
42%
61%
55%
55%
57%
45%
68%
60%
83%
80%
92%
86%
59%
Public information
COMMUNITY ENGAGEMENT
Recreation centers
City parks
RECREATION AND WELLNESS
Economic development
ECONOMY
Code enforcement
Land use, planning and zoning
Sewer services
Storm drainage
BUILT ENVIRONMENT
Natural areas preservation
Drinking water
NATURAL ENVIRONMENT
Traffic signal timing
Sidewalk maintenance
Snow removal
Street lighting
Street cleaning
Street repair
Traffic enforcement
MOBILITY
Animal control
Fire prevention
Crime prevention
Fire
Police
SAFETY
Higher
Similar
Lower
Percent rating positively
(e.g., excellent/good)
Comparison to national
benchmark

7
Participation Are the residents of Ramsey connected to the community and each other?
An engaged community harnesses its most valuable resource, its residents. The connections and trust among residents, government, businesses and other organizations help to create a sense of community; a shared sense of membership, belonging and history. Compared to other communities, fewer residents of Ramsey rated the sense of community as excellent or good (46%). Still, the vast majority of residents said that they would recommend living in Ramsey and had plans to remain living there.
The survey included almost 20 activities and behaviors for which respondents indicated how often they participated in or performed each, if at all. Overall, measures of Participation varied in relation to the benchmark. Areas where resident participation and experiences rated better than elsewhere were in Natural Environment (recycling), Safety (fewer residents had reported a crime) and Built Environment (fewer residents experienced housing cost stress). Although similar to the benchmark, the rate of purchasing goods or services, visiting City parks, being in good health and voting were high and nearly all residents reported that they had not been the victim of a crime. Most of the measures where Participation fell below the norm were under Community Engagement for campaigning, volunteering and attending public meetings. Under Economy, residents of Ramsey were less likely to work in the City where they lived than residents of other communities.
82% 85%
44%
Recommend Ramsey Remain in Ramsey Contacted Ramsey
employees
Higher Similar Lower
Percent rating positively
(e.g., very/somewhat likely,
yes)
Comparison to national
benchmark
Excellent
6% Good
40%
Fair
45%
Poor
10%
Sense of Community

The National Citizen Survey™
8
Figure 3: Aspects of Participation
78%
95%
90%
83%
26%
11%
53%
71%
83%
29%
95%
56%
38%
94%
14%
22%
11%
20%
Voted in local elections
Watched a local public meeting
Attended a local public meeting
Volunteered
Contacted Ramsey elected officials
Campaigned for an issue, cause or candidate
COMMUNITY ENGAGEMENT
Attended a City-sponsored event
EDUCATION AND ENRICHMENT
In very good to excellent health
Visited a City park
RECREATION AND WELLNESS
Work in Ramsey
Economy will have positive impact on income
Purchased goods or services in Ramsey
ECONOMY
NOT under housing cost stress
BUILT ENVIRONMENT
Recycled at home
NATURAL ENVIRONMENT
Walked or biked instead of driving
Used public transportation instead of driving
MOBILITY
Was NOT the victim of a crime
Did NOT report a crime
SAFETY
Higher
Similar
Lower
Percent rating positively
(e.g., yes, more than
once a month,
always/sometimes)
Comparison to national
benchmark

9
Special Topics The City of Ramsey included several questions of special interest on The NCS. These questions covered the topics of safety, sources of information about the City, community events, street construction and other characteristics and services in the community.
In addition to asking about safety in various parts of Ramsey during the day, the survey asked residents about feelings of safety at night. Most residents (87%) reported that they felt somewhat or very safe at night in Ramsey’s downtown/commercial areas and in their neighborhoods.
Figure 4: Safety after Dark Please rate how safe or unsafe you feel:
Residents rated the quality of trail maintenance and strategic plan development. Two-thirds of residents gave favorable ratings to the quality of trail maintenance. Less than half of residents rated the City’s strategic planning as excellent or good and one-third rated it as fair.
Figure 5: Trail Maintenance Please rate the quality of each of the following services in Ramsey: Trail maintenance
Figure 6: Strategic Planning Please rate the following categories of Ramsey government performance: Development and success of a strategic action plan
48%
41%
39%
46%
87%
87%
In your neighborhood after dark
In Ramsey’s downtown/commercial areas after dark
Very safe Somewhat safe
Excellent 15%
Good 52%
Fair 27%
Poor 6%
Excellent 8%
Good 31%
Fair 35%
Poor 26%

10
Residents reported using a variety of sources for information about the City. Most residents (84%) said that they used the City newsletter (Ramsey Resident) as a major or moderate source of information. About half relied on word-of-mouth, the City website and the local newspaper for information about the City of Ramsey. About one-quarter said that the City’s Facebook page, City employees, public meetings and QCTV were at least a moderate source of City information for them.
Figure 7: Sources of Information about the City To what extent are each of the following a source of information for you about Ramsey city government and its activities?
5%
4%
6%
10%
11%
15%
15%
55%
16%
17%
15%
13%
32%
31%
35%
28%
21%
22%
22%
23%
42%
47%
50%
84%
Cable television (QCTV)
Public meetings
City employees
City social media (Facebook)
Local newspaper
City website (www.cityoframsey.com)
Word-of-mouth
City newsletter (Ramsey Resident)
Major source Moderate source

The National Citizen Survey™
11
A majority of residents rated each of the listed community events favorably. The most positively rated events were Kids Safety Camp (93% excellent or good) and at least 8 in 10 residents rated The Draw music in the park series, Happy Days Festival, Spring/Fall recycling events and pet clinics as excellent or good and two-thirds felt as positively about the Spring Business Expo and Annual Nite to Unite event. Three-quarters of residents said that they liked the current name of the hometown festival, Happy Days; about one-third at least somewhat agreed that it should be changed.
Figure 8: Community Events Please rate the quality of each event listed below:
Figure 9: Happy Days Festival Ramsey's hometown festival, Happy Days, is organized by the volunteer Happy Days Committee. To what extent do you agree or disagree with each of the following statements about the event?
26%
20%
24%
28%
32%
36%
39%
39%
49%
56%
55%
52%
51%
54%
65%
69%
80%
83%
84%
87%
93%
Annual Nite to Unite event
Spring Business Expo
Pet Clinics
Spring/Fall recycling events
Happy Days Festival
The Draw Music in the Park Series
Kids Safety Camp
Excellent Good
18%
33%
19%
42%
37%
76%
The name “Happy Days Festival” should be changed
I like the name “Happy Days Festival”
Strongly agree Somewhat agree

The National Citizen Survey™
12
A majority of residents rated the overall condition of City streets as excellent or good and one-third rated it as fair. When asked about potential approaches to funding a long-term street reconstruction program, 40% of residents at least somewhat supported special assessments of benefitting properties, versus 33% for electric and/or gas utility fees and 29% for property tax increases.
Figure 10: Overall Condition of Streets Please rate each of the following characteristics as they relate to Ramsey as a whole: Overall condition of City maintained streets
Figure 11: Street Reconstruction The City is developing a long-term street reconstruction program for maintaining over 174 miles of public streets throughout Ramsey which will require a reliable funding source. Please indicate to what extent you would support or oppose each of the following funding options for this purpose:
Excellent 9%
Good 49%
Fair 32%
Poor 11%
3%
6%
10%
26%
27%
30%
29%
33%
40%
Property tax increases
Electric and/or gas utility fee increases,approximately $8 per utility, per month
Special assessments from benefittingproperties to re-pay the City for 20% or
more of applicable project costs,typically over 5 to 15 years
Strongly support Somewhat support

13
Conclusions Ramsey residents enjoy a high quality of life.
Most residents felt positively about the overall quality of life in Ramsey and the city as a place to live. Ramsey residents also valued the quality of life in their neighborhoods, the city as a place to raise children and its overall appearance; ratings in each of these areas were similar to other communities in the U.S. Ramsey as a place to retire was not perceived as positively as other aspects of the community. While residents of the community appreciated the city, they felt that outside opinion lagged; they rated the overall image or reputation of the city lower than the benchmark. The vast majority of residents would recommend living in the community and planned on staying.
Ramsey’s Economy is an important focus area for the community.
Residents identified Ramsey’s Economy as a priority for the community. Residents rated Ramsey favorably for its overall economic health, employment opportunities, cost of living and economic development services. The quality of its businesses and services, Ramsey as a place to work, the vibrancy of its downtown/commercial area, Ramsey as a place to visit and the availability of shopping opportunities were rated somewhat less favorably. Still, the number of residents who felt that the economy would have a positive impact on their income in the future was comparable to other communities.
Residents feel safe in Ramsey.
Residents felt that Safety was a positive feature of the community and identified it as another important area to focus on. Residents had a solid feeling of safety in Ramsey overall, in their neighborhoods and in downtown/commercial areas. Similar to residents of other communities, most had not been the victim of a crime, and a lower proportion of Ramsey residents had not reported a crime compared to elsewhere. Residents gave positive ratings to Safety services, including police, fire, crime prevention and fire prevention.

2955 Valmont Road Suite 300 777 North Capitol Street NE Suite 500 Boulder, Colorado 80301 Washington, DC 20002 n-r-c.com • 303-444-7863 icma.org • 800-745-8780
Ramsey, MN Community Livability Report FINAL 2016

The National Citizen Survey™ © 2001-2016 National Research Center, Inc.
The NCS™ is presented by NRC in collaboration with ICMA.
NRC is a charter member of the AAPOR Transparency Initiative, providing
clear disclosure of our sound and ethical survey research practices.
Contents About .............................................................................................. 1
Quality of Life in Ramsey .................................................................. 2
Community Characteristics ............................................................... 3
Governance ..................................................................................... 5
Participation .................................................................................... 7
Special Topics .................................................................................. 9
Conclusions ................................................................................... 13

1
About The National Citizen Survey™ (The NCS) report is about the “livability” of Ramsey. The phrase “livable community” is used here to evoke a place that is not simply habitable, but that is desirable. It is not only where people do live, but where they want to live.
Great communities are partnerships of the government, private sector, community-based organizations and residents, all geographically connected. The NCS captures residents’ opinions within the three pillars of a community (Community Characteristics, Governance and Participation) across eight central facets of community (Safety, Mobility, Natural Environment, Built Environment, Economy, Recreation and Wellness, Education and Enrichment and Community Engagement).
The Community Livability Report provides the opinions of a representative sample of 462 residents of the City of Ramsey. The margin of error around any reported percentage is 5% for the entire sample. The full description of methods used to garner these opinions can be found in the Technical Appendices provided under separate cover.
Communities are
partnerships among...
Residents
Community-based
organizations
Government
Private sector

2
Quality of Life in Ramsey Most residents rated the quality of life in Ramsey as excellent or good. These ratings were similar to the national benchmark (see Appendix B of the Technical Appendices provided under separate cover).
Shown below are the eight facets of community. The color of each community facet summarizes how residents rated it across the three sections of the survey that represent the pillars of a community – Community Characteristics, Governance and Participation. When most ratings across the three pillars were higher than the benchmark, the color for that facet is the darkest shade; when most ratings were lower than the benchmark, the color is the lightest shade. A mix of ratings (higher and lower than the benchmark) results in a color between the extremes.
In addition to a summary of ratings, the image below includes one or more stars to indicate which community facets were the most important focus areas for the community. Residents identified Safety and Economy as priorities for the Ramsey community in the coming two years. Ramsey residents gave favorable ratings to both of these facets of community. Ratings for Mobility, Natural Environment, Built Environment, Recreation and Wellness, Education and Enrichment and Community Engagement were positive and similar to other communities. This overview of the key aspects of community quality provides a quick summary of where residents see exceptionally strong performance and where performance offers the greatest opportunity for improvement. Linking quality to importance offers community members and leaders a view into the characteristics of the community that matter most and that seem to be working best.
Details that support these findings are contained in the remainder of this Livability Report, starting with the ratings for Community Characteristics, Governance and Participation and ending with results for Ramsey’s unique questions.
Education
and Enrichment
Community Engagement
Mobility
Natural Environment
Recreation
and Wellness
Built Environment
Safety
Economy
Legend
Higher than national benchmark
Similar to national benchmark
Lower than national benchmark
Most important
Excellent
14%
Good
66%
Fair
19%
Poor
1%
Overall Quality of Life

The National Citizen Survey™
3
Community Characteristics What makes a community livable, attractive and a place where people want to be?
Overall quality of community life represents the natural ambience, services and amenities that make for an attractive community. How residents rate their overall quality of life is an indicator of the overall health of a community. In the case of Ramsey, 87% of residents rated the City as an excellent or good place to live. Respondents’ ratings of Ramsey as a place to live were similar to ratings in other communities across the nation.
In addition to rating the City as a place to live, respondents rated several aspects of community quality including Ramsey as a place to raise children and to retire, their neighborhood as a place to live, the overall image or reputation of Ramsey and its overall appearance. Roughly 8 in 10 residents gave excellent or good ratings to their neighborhoods and Ramsey as a place to raise children which were similar to the national benchmark. Around three-quarters of residents gave favorable ratings to Ramsey’s overall appearance which also was similar to the national benchmark, while about half or less of residents positively rated Ramsey as a place to retire and the overall image which was lower than what was seen in comparison communities. Delving deeper into Community Characteristics, survey respondents rated over 30 features of the community within the eight facets of Community Livability. Overall, results were similar to other communities and most aspects had positive ratings from a majority of respondents. Around 9 in 10 residents reported feeling safe in their neighborhoods and in the downtown/commercial areas of Ramsey, ratings that were similar to the benchmark. Between half and two-thirds of residents positively rated aspects of Mobility and all of these ratings were similar to jurisdictions across the nation. Within Natural Environment, around 8 in 10 residents rated the overall natural environment and cleanliness of the City positively, which was similar to comparison communities. Within the facet of Built Environment around two-thirds of residents positively rated the availability of affordable quality housing and this rating was higher than the national benchmark. Aspects of Economy, such as the overall
economic health, Ramsey as a place to work and the cost of living received positive ratings from about half of residents. However, Ramsey’s vibrant downtown/commercial area, businesses and services, shopping opportunities and Ramsey as a place to visit received less favorable ratings that fell below the benchmark. Of the remaining facets, all aspects received positive ratings that were similar to communities elsewhere with the exception of opportunities to attend cultural, arts and musical activities and to volunteer, which were rated positively by around 4 in 10 residents and were lower than ratings seen in national comparisons.
87% 87%
73%
56% 48%
Overall image Neighborhood Place to raise children Place to retire Overall appearance
Higher Similar Lower
Comparison to national benchmark Percent rating positively (e.g., excellent/good)
Excellent
25%
Good
61%
Fair
13%
Poor
1%
Place to Live

The National Citizen Survey™
4
Figure 1: Aspects of Community Characteristics
67%
47%
56%
72%
46%
52%
55%
50%
63%
49%
24%
49%
51%
56%
73%
47%
56%
80%
81%
56%
67%
60%
66%
68%
69%
96%
98%
90%
46%
37%
35%
20%
43%
20%
Opportunities to volunteer
Opportunities to participate in community matters
COMMUNITY ENGAGEMENT
Child care/preschool
K-12 education
Adult education
Cultural/arts/music activities
Education and enrichment opportunities
EDUCATION AND ENRICHMENT
Fitness opportunities
Recreational opportunities
Health and wellness
RECREATION AND WELLNESS
Place to work
Place to visit
Employment opportunities
Shopping opportunities
Cost of living
Business and services
Vibrant downtown/commercial area
Overall economic health
ECONOMY
Public places
Housing options
Affordable quality housing
New development in Ramsey
Overall built environment
BUILT ENVIRONMENT
Cleanliness
Overall natural environment
NATURAL ENVIRONMENT
Traffic flow
Travel by car
Travel by bicycle
Ease of walking
Paths and walking trails
Overall ease of travel
MOBILITY
Safe downtown/commercial area
Safe in neighborhood
Overall feeling of safety
SAFETY
Higher
Similar
Lower
Percent rating positively (e.g., excellent/good, very/somewhat safe)
Comparison to national benchmark

5
Governance How well does the government of Ramsey meet the needs and expectations of its residents?
The overall quality of the services provided by Ramsey as well as the manner in which these services are provided are a key component of how residents rate their quality of life. The overall quality of services provided by the City of Ramsey received excellent or good ratings by about three-quarters of residents, while the Federal Government received positive ratings by about one-third of respondents. Both of these ratings were similar to the national benchmark.
Survey respondents also rated various aspects of Ramsey’s leadership and governance. Around 8 in 10 residents gave favorable ratings to the overall customer service provided by Ramsey employees. About half of residents favorably rated the remaining aspects of government performance including: the value of services for taxes paid, the overall direction of the City, welcoming citizen involvement, confidence in City government, acting in the best interest of Ramsey, being honest, and treating all residents fairly. These ratings were all on par with other communities across the nation.
Respondents evaluated over 20 individual services and amenities available in Ramsey. Among the highest rated services were police and fire with about 9 in 10 residents giving high marks to each of these aspects. Around 8 in 10 residents gave a positive rating to crime prevention, fire prevention, sewer services and City parks. All of the aforementioned services were similar to the national benchmark. The remaining services also received ratings similar to the national benchmark, with the exception of recreation centers which were rated positively by about
half of residents and lower than in comparison communities.
45% 46% 48% 45% 48% 50% 56%
81%
37%
Value of
services for
taxes paid
Overall
direction
Welcoming
citizen
involvement
Confidence
in City
government
Acting in the
best interest
of Ramsey
Being honest Treating all
residents
fairly
Customer
service
Services
provided by
the Federal
Government
Higher Similar Lower
Comparison to national benchmark Percent rating positively (e.g., excellent/good)
Excellent
16%
Good
57%
Fair
25%
Poor
2%
Overall Quality of City Services

The National Citizen Survey™
6
Figure 2: Aspects of Governance
57%
77%
41%
44%
37%
78%
71%
57%
72%
46%
65%
62%
57%
60%
40%
76%
62%
81%
79%
93%
90%
53%
Public information
COMMUNITY ENGAGEMENT
Recreation centers
City parks
RECREATION AND WELLNESS
Economic development
ECONOMY
Code enforcement
Land use, planning and zoning
Sewer services
Storm drainage
BUILT ENVIRONMENT
Natural areas preservation
Drinking water
NATURAL ENVIRONMENT
Traffic signal timing
Sidewalk maintenance
Snow removal
Street lighting
Street cleaning
Street repair
Traffic enforcement
MOBILITY
Animal control
Fire prevention
Crime prevention
Fire
Police
SAFETY
Higher
Similar
Lower
Percent rating positively
(e.g., excellent/good)
Comparison to national
benchmark

7
Participation Are the residents of Ramsey connected to the community and each other?
An engaged community harnesses its most valuable resource, its residents. The connections and trust among residents, government, businesses and other organizations help to create a sense of community; a shared sense of membership, belonging and history. Around half of residents gave a positive rating to the overall sense of community in Ramsey and this level was similar to what was seen in benchmark communities.
More than four in five residents reported that they would recommend Ramsey to others and that they would remain in Ramsey for the next five years. About 4 in 10 residents reported that they had contacted a City employee in the last 12 months. All of these ratings were similar to the national benchmark.
The survey included over 15 activities and behaviors for which respondents indicated how often they participated in or performed each, if at all. Levels of Participation tended to be mixed across the different facets, but overall reported levels were similar to those in benchmark communities. Within the facet of Safety more than 8 in 10 residents reported that they had not been the victim of crime or reported a crime in the 12 months prior to the survey. Most residents reported that they recycled at home and indicated that they were not under housing cost stress, both of which were higher than levels reported in comparison communities. Meanwhile, around 2 in 10 respondents indicated that they worked in Ramsey, a rate of participation lower than those observed elsewhere. Within the facet of Recreation and Wellness, about three-quarters or more reported that they had visited a City park or stated that they were in excellent or good health. Around 4 in 10 residents stated they had attended a City-
sponsored event, a lower rate of participation than those in benchmark communities. Within the facet of Community Engagement, residents reported that they had contacted Ramsey elected officials, watched a local public meeting and voted in local elections at levels that were similar to the national benchmark. However, fewer respondents indicated that they had campaigned for an issue, cause or candidate, volunteered or attended a local public meeting than residents in comparison communities.
86% 86%
40%
Recommend Ramsey Remain in Ramsey Contacted Ramsey
employees
Higher Similar Lower
Percent rating positively
(e.g., very/somewhat likely,
yes)
Comparison to national
benchmark
Excellent
7% Good
44%
Fair
39%
Poor
11%
Sense of Community
The National Citizen Survey™
8
Figure 3: Aspects of Participation
80%
96%
79%
21%
10%
74%
88%
29%
90%
65%
35%
92%
85%
11%
17%
6%
42%
24%
Voted in local elections
Watched a local public meeting
Attended a local public meeting
Volunteered
Contacted Ramsey elected officials
Campaigned for an issue, cause or candidate
COMMUNITY ENGAGEMENT
Attended a City-sponsored event
EDUCATION AND ENRICHMENT
In very good to excellent health
Visited a City park
RECREATION AND WELLNESS
Work in Ramsey
Economy will have positive impact on income
Purchased goods or services in Ramsey
ECONOMY
NOT under housing cost stress
BUILT ENVIRONMENT
Recycled at home
NATURAL ENVIRONMENT
Walked or biked instead of driving
Used public transportation instead of driving
MOBILITY
Was NOT the victim of a crime
Did NOT report a crime
SAFETY
Higher
Similar
Lower
Percent rating positively
(e.g., yes, more than
once a month,
always/sometimes)
Comparison to national
benchmark

9
Special Topics The City of Ramsey included eight questions of special interest on The NCS. The first question asked residents for their opinions about their feelings of safety at night. Most residents (84%) reported that they felt somewhat or very safe at night in Ramsey’s downtown/commercial areas and in their neighborhoods. Around 9 in 10 residents reported that they felt somewhat or very safe in their neighborhoods after dark.
Figure 4: Safety after Dark
Please rate how safe or unsafe you feel:
Residents rated the quality of the overall condition of City maintained streets and the quality of trail maintenance. A majority of residents gave favorable ratings to the overall condition of streets and nearly three-quarters rated the quality of trail maintenance as excellent or good.
Figure 5: Overall Condition of Streets
Please rate each of the following characteristics as they relate to Ramsey as a whole: Overall condition of City maintained streets
Figure 5: Trail Maintenance
Please rate the quality of each of the following services in Ramsey: Trail maintenance
43%
49%
41%
42%
84%
91%
In Ramsey’s downtown/commercial
areas after dark
In your neighborhoodafter dark
Very safe Somewhat safe
Excellent 11%
Good 46%
Fair 32%
Poor 11%
Excellent 18%
Good 54%
Fair 21%
Poor 7%

The National Citizen Survey™
10
Excellent
7%
Good 35%
Fair 39%
Poor 20%
The next special interest question asked residents to rate the development and success of a strategic action plan in Ramsey. Less than half of residents rated the City’s strategic planning as excellent or good and more than one-third rated it as fair.
Figure 7: Strategic Plan Development
Please rate the following categories of Ramsey government performance: Development and success of a strategic action plan
Residents reported using a variety of sources for information about the City. A vast majority (89%) said that they had used the City newsletter (Ramsey Resident) as a major or moderate source of information. Almost half used the City website and around 4 in 10 relied on word-of-mouth or the local newspaper. The least cited sources of information included cable television, public meetings and information received from City employees.
Figure 8: Source of Information about the City
To what extent are each of the following a source of information for you about Ramsey city government and its activities?
4%
4%
4%
10%
13%
12%
16%
62%
9%
13%
14%
21%
27%
31%
30%
27%
13%
17%
18%
31%
40%
43%
46%
89%
Cable television (QCTV)
Public meetings
City employees
City social media (Facebook)
Local newspaper
Word-of-mouth
City website (www.cityoframsey.com)
City newsletter (Ramsey Resident)
Major source Moderate source

The National Citizen Survey™
11
The next special interest question asked residents about the quality of various community events. A majority of residents rated each of the listed community events favorably. The most positively rated events were the Kids Safety Camp (89% excellent or good) and at least 8 in 10 residents rated The Draw Music in the Park Series, Happy Days Festival, Pet Clinics and Spring/Fall recycling events as excellent or good.
Figure 9: Community Events
Please rate the quality of each event listed below:
The following special interest question asked respondents to indicate the quality of the City’s response time for various services. Around 7 in 10 residents rated the response time for both building permits and to nuisance violations as excellent or good.
Figure 10: City’s Response Time
Please rate the quality of the following:
17%
21%
25%
18%
29%
33%
32%
50%
46%
57%
64%
55%
52%
57%
67%
67%
82%
83%
84%
85%
89%
Spring Business Expo
Annual Nite to Unite event
Spring/Fall recycling events
Pet Clinics
Happy Days Festival
The Draw Music in the Park Series
Kids Safety Camp
Excellent Good
19%
19%
49%
53%
68%
71%
The City’s response time for building permits
The City’s response time to nuisance violations
Excellent Good

The National Citizen Survey™
12
The final special interest question asked survey participants to indicate their level of support for various funding sources to maintain City streets in Ramsey. The current method received the most support from residents, with approximately three-quarters of residents saying they at least somewhat supported the measure. The least supported funding source by about a quarter of residents was the electric and/or gas utility fee increase.
Figure 11: Street Reconstruction The City employs a long-term maintenance program to cost-effectively maintain all 175-plus miles of City streets. Currently, street reconstruction projects are funded 25% by special assessments levied against benefitting properties, and 75% by street reconstruction bonds, which are paid back using general property taxes. The City periodically evaluates funding sources for this on-going program. Please indicate the extent to which you would support or oppose the following funding sources:
6%
12%
26%
19%
26%
48%
25%
38%
74%
Electric and/or gas utility fee increases,approximately $8 per utility, per month
Zero special assessments levied againstbenefitting properties, funding 100% by
general property tax increases
Current method, which requires 25% offunding by special assessments levied
against benefitting properties over 5-15years
Strongly support Somewhat support

The National Citizen Survey™
13
Conclusions Ramsey residents continue to enjoy a high quality of life.
Most of residents gave positive ratings for the overall quality of life and Ramsey as a place to live. About 8 in 10 respondents positively rated their neighborhoods and Ramsey as a place to raise children. Additionally, most residents reported that they plan on remaining in the City for the next five years and said they would recommend Ramsey to someone who asks. These ratings are similar to or higher than ratings from the City’s 2014 iteration of the survey, which suggests that residents continue enjoy living in Ramsey.
Economy is important to residents and may be an area for improvement.
Residents indicated that Economy is an important facet for Ramsey to focus on in the coming years. The ratings for overall economic health were similar to the national comparison with about half of residents giving it a positive rating. However, ratings for a vibrant downtown/commercial area, business and services, shopping opportunities, Ramsey as a place to visit and residents reporting that they worked in Ramsey were lower than other communities in the nation. Compared to 2014, nearly all Economy ratings remained stable; however, the ratings for Ramsey as a place to work increased from 2014 to 2016.
Safety is valued by residents and is a positive feature of the community.
Survey respondents indicated that Safety is an important facet and a priority for the City. At least 9 in 10 residents reported having an overall high sense of safety, feeling safe in their neighborhoods as well as in the downtown/commercial areas of Ramsey. Residents positively rated safety services, particularly police and fire services, and a vast majority felt that crime and fire prevention services were excellent or good. About 8 in 10 residents or more were NOT the victim of a crime or did NOT report a crime.

Prepared byOlivia Boerschinger, Kate Svitavsky, and Amy Yoder
Students in PA 5511 Community Economic Development Instructor: Bob Streetar
Hubert H. Humphrey School of Public Affairs
Prepared in Collaboration with Patrick Brama
Assistant City Administrator and Economic Development ManagerCity of Ramsey
Encouraging Small Business Growth and Expansion:Ramsey COR Retail Market Analysis

TheprojectonwhichthisreportisbasedwascompletedincollaborationwiththeCityofRamseyaspartofthe2017–2018ResilientCommunitiesProject(RCP)partnership.RCPisaprogramattheUniversityofMinnesota’sCenterforUrbanandRegionalAffairs(CURA)thatconnectsUniversityfacultyandstudentswithMinnesotacommunitiestoaddressstrategicprojectsthatadvancelocalresilienceandsustainability.
Thecontentsofthisreportrepresenttheviewsoftheauthors,anddonotnecessarilyreflectthoseofRCP,CURA,theRegentsoftheUniversityofMinnesota,ortheCityofRamsey.
ThisworkislicensedunderaCreativeCommonsAttribution-NonCommercial3.0UnportedLicense.Toviewacopyofthislicense,visitwww.creativecommons.org/licenses/by-nc/3.0/orsendalettertoCreativeCommons,444CastroStreet,
Suite900,MountainView,California,94041,USA.Anyreproduction,distribution,orderivativeuseofthisworkunderthislicensemustbeaccompaniedbythefollowingattribution:“ProducedbytheResilientCommunitiesProject(www.rcp.umn.edu)attheUniversityofMinnesota.ReproducedunderaCreativeCommonsAttribution-NonCommercial3.0UnportedLicense.”
Thispublicationmaybeavailableinalternateformatsuponrequest.
ResilientCommunitiesProjectUniversityofMinnesota330HHHSPA301—19thAvenueSouthMinneapolis,Minnesota55455Phone:(612)625-7501E-mail:[email protected]:http://www.rcp.umn.edu
TheUniversityofMinnesotaiscommittedtothepolicythatallpersonsshallhaveequalaccesstoitsprograms,facilities,andemploymentwithoutregardtorace,color,creed,religion,nationalorigin,sex,age,maritalstatus,
disability,publicassistancestatus,veteranstatus,orsexualorientation.

P a g e | 1
Encouraging Small Business Growth and Expansion
Ramsey COR Retail Market Analysis
Prepared By: Olivia Boerschinger, Kate Svitavsky, Amy Yoder
PA 5511 Community Economic Development
Fall 2017
Acknowledgements:
Bob Streetar, Adjunct Professor
Patrick Brama, Economic Development Manager, City of Ramsey

P a g e | 2
Executive Summary Sitting on the edge of the Twin Cities metropolitan region, the city of Ramsey is a fast growing
suburban community with a rural flair. However, even though Ramsey has seen significant
growth in the last fifteen years (from a population of 18,510 in 2000 to 24,846 in 2015),
commercial and retail development has lagged behind the expectations of the community. The
people of Ramsey in particular have expressed a need for more places to shop, eat, and enjoy
– this report explores the market forces that have impacted retail development in Ramsey,
identifies key niches that can serve as the foundation for targeted development, and offers
suggestions for focusing development efforts in the future.
Ramsey has three main commercial and retail “nodes” that should be the heart of development:
the COR (Center of Ramsey), the intersection of Bunker Lake Road and Highway 47, and the
intersection of Highway 47 and 167th Ave NW. Each of these nodes provides an opportunity to
encourage necessary business growth, thus making it less likely that residents will go outside
Ramsey for their shopping needs.
Based on a Claritas Retail Market Power and Consumer Buying Power analysis, there are a
number of sales “gaps” in the Ramsey market, where residents are spending significant
amounts of money outside of Ramsey. These gaps indicate opportunity markets, where new or
expanded businesses could capture money being lost to the community. Ramsey should begin
by capitalizing on existing businesses that already perform well within the city through
encouraging the growth of complementary industries. Two potential areas for growth would be
in furniture and car sales. As business grows in these areas, the city would be able to leverage
a concrete display of buying power to encourage other new businesses – perhaps even
restaurants near an automotive row for hungry shoppers.
More broadly, competing with areas like Coon Rapids and Anoka will require that Ramsey
develop a unique appeal beyond box stores and chains. The city has already lowered barriers to
development through a highly flexible and targeted zoning code. Other barriers to development
include the predominance of undeveloped land – the city could pursue creative options like
business incubators or the creation of a community market space to lower barriers to entry for
local businesses and entrepreneurs. Focusing on local businesses and on existing assets will
allow the city to build momentum, thus providing leverage to obtain some of the larger box
stores and chains residents might currently travel to reach.
Ultimately, cultivating the growth of significant destination retail requires that a city build upon
existing assets while focusing on a clear and unique vision. Ramsey has already made
incredible progress with pushing the COR development through the Great Recession – by
focusing on building necessary housing density and on developing a unique character, the city
will be able to demonstrate a strong market for new business.

P a g e | 3
Encouraging Small Business Growth and Expansion
Ramsey COR Retail Market Analysis
Project Background
Ramsey’s COR and Retail Attraction
Unlike many other smaller suburban towns, the city of Ramsey did not have a historic downtown
to restore to its former glory as the city continued to grow. Instead, private developers and the
city itself worked together to create a new downtown from scratch: the Center of Ramsey or
COR. Located on nearly 400 acres of former soybean fields and vacant lots, the COR combines
dense residential and commercial development, municipal offices, and a stop of the NorthStar
commuter line to create a walkable heart for Ramsey. Although the recession in 2008 slowed
work on the COR project, new residential and commercial developments have continued since
2011 when the City took over as master developer. The COR is well on its way to becoming a
thriving community center, with popular draws like the Happy Days Festival and a local farmers
market.
Fashioning a downtown from a blank slate allowed for creativity and innovation, especially with
the promise of construction of the NorthStar commuter rail station right at the center. The city of
Ramsey had a vision of creating an economically successful, walkable, transit-oriented town
center – over the past decade the community has worked tirelessly to make the vision a reality.
However, residents still find that they must travel outside Ramsey for much of their shopping
and entertainment activities. Many chain stores and restaurants have been reluctant to locate
within the COR, especially when there are established retail developments in nearby Coon
Rapids and Anoka. Each day, over 12,000 Ramsey residents travel outside of the city for work;
many of those workers likely find it more convenient to stop at existing retail nodes on their way
home.1 For traditional large-format retail and chain restaurants, both residential statistics
(needing “more roofs”) and travel patterns are key. Since Ramsey has been unable to compete
as yet with existing retail cores based on the number of roofs or the number of cars passing
each day, the city will need yet again to find creative solutions for drawing in needed businesses
until the roofs are ready.
1 US Census Bureau, OnTheMap

P a g e | 4
This report assesses the market and regulatory feasibility and barriers affecting Ramsey’s ability
to attract retail developments for the COR and other retail nodes. Ramsey’s regulatory practices
are flexible and inclusionary, proving to be non-restrictive to potential retail clients. We identify
key assets that Ramsey can leverage to encourage the growth of targeted industries and small
businesses, while considering related challenges that the city will need to address. The report
includes an analysis of past market feasibility studies and provides a new analysis of market
feasibility based on Claritas data, which shows both consumer and retail trends within a
designated area. From this data, we identify current and future demand for specific retail uses in
the COR and other retail nodes within Ramsey. Finally, the report contains a section of general
considerations and recommendations centered around how Ramsey can attract commercial and
retail to the COR and the city as a whole by developing a unique character.
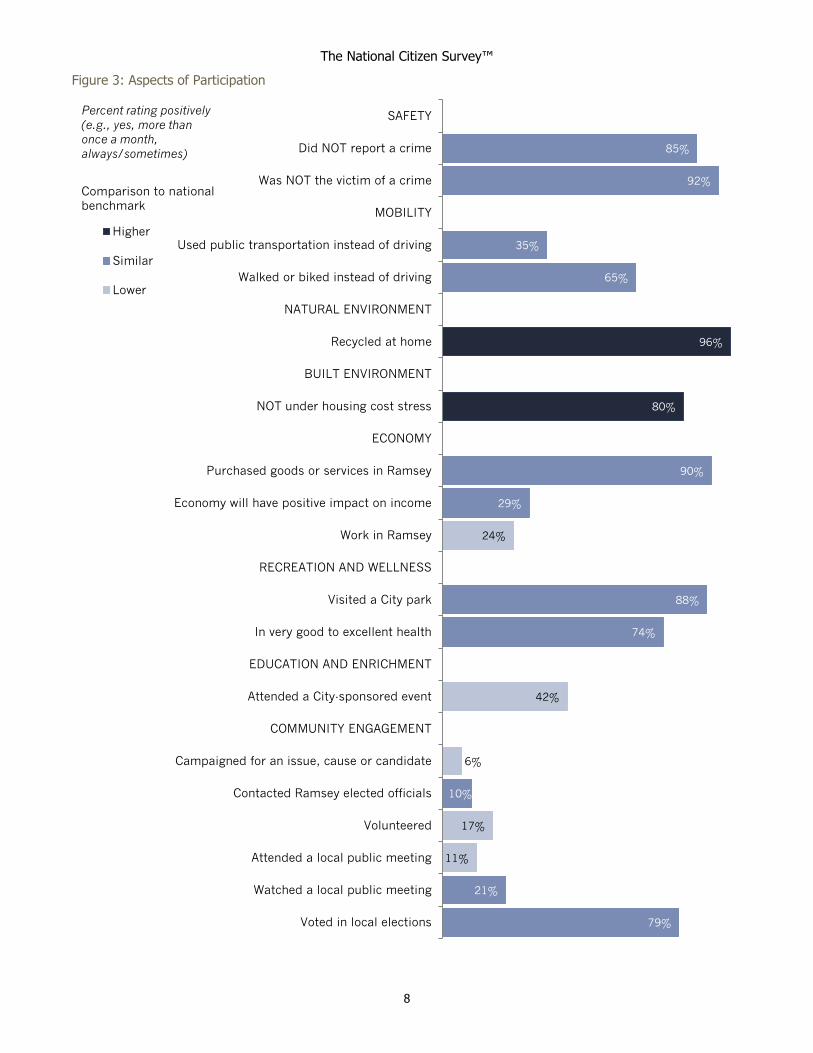
Demographic Profile
The key demographic trend of note for Ramsey is the continuing population growth expected
over the next several decades. By 2040, the population in Ramsey is expected to reach 34,700
people, with 13,000 households. Looking at Census data for 2015 through MN Compass, the
population of Ramsey shows a fairly typical breakdown according to age, with the largest age
group falling between ages 45 and 54 (17.4%). Over 92% of Ramsey residents lived in the
same residence last year, which shows a highly stable residential base. Ramsey is primarily
White, and relatively well-off with 41.7% of Ramsey residents earning $100,000 or more in
2015. The median household income (in 2015 dollars, averaged) was $86,794. Only 4.5% of
Ramsey residents are Foreign Born. More interesting for a retail analysis, 54.4% of Ramsey
residents travel 30 minutes or more to get to work, which likely contributes to the outflow of
money to other commercial markets. For a brief summary of these demographic trends, see
Appendix 1: Key Demographics Summary Page.
Retail Market Competition2
In order to gain a robust understanding of the barriers affecting the market feasibility of
Ramsey’s future retail development, it is important to assess the retail competition that
surrounds the community and impacts the ability to capture retailers attraction.
Ramsey sits between many retail nodes including big box stores and clusters of shops and
popular restaurants. The maps below represent regional competition near the City of Ramsey.
All retail nodes highlighted are within 12 miles of the city. Each map describes these nodes and
how they might impact retail in Ramsey.
2 Information gathered and maps created by HHH MURP Candidate Joshua Pansch, October 2017

P a g e | 5
Josh Pansch, In-person data gathering and GIS, October 2017
Methods
Ideally, any retail or consumer market analysis is being conducted to help Ramsey make more
informed decisions regarding commercial developments and investments and can focus energy
and resources on areas of higher retail development potential, as well as certain categories of
retail with the most potential for longevity and success. For the purpose of this project, we
analyzed different ways in which retail or consumer market analyses are conducted, how trade
areas are determined, and effective strategies to assist in the recruitment and success of retail
investment. To begin, we took a look at a retail market assessments the City of Ramsey had
completed in the past decade, analyzing their approach and results, and then move on to a form
of effective measurement and methodology today, leading into 2017 retail market data.

P a g e | 6
2011 Buxton CommunityID3
The City of Ramsey had consulted with Buxton in 2011 to develop and analyze Ramsey’s
Consumer Market. Ramsey had pre-selected two existing retail nodes, the COR and Highway
47/167th Ave, as areas hopeful for retail development and revitalization. Buxton develops their
retail consumer market for analysis by determining a twelve minute drive time radius around the
specified site (see Figure 1 and Figure 2). The demographics, as well as spending excess and
leakages are then determined from this drivetime-based market. Retail development and
consumer spending does not abide by city limits or political jurisdictions, rather spending ability
and proximity to consumers.
The purpose of Buxton’s site assessments was to provide Ramsey with a “Customer Profile”
highlighting the types of consumers residing within Ramsey’s determined market area.
Ultimately the assessment was able to indicate which store types or categories were existing
and successful in the market area, and which were missing, and losing sales to locations
outside the trade area. This assessment of existing assets compared to leakages is common,
Figure 1: Hwy 47 & 167th Ave NW Retail Trade Area Figure 2: The COR Retail Trade Area
3 Buxton CommunityID Retail Site Assessment, City of Ramsey, completed July 21st, 2011 http://156.142.212.178:8080/docs/2016/CCReg/20160913_6217/6635_Buxton2011.pdf

P a g e | 7
and can indicate areas needing attention and can help focus the discussion regarding which
retailers to recruit that would best fit the needs and fill the gaps of the community.
Buxton goes further the attempt to use demographic data of residents within the determined
market area consumer’s lifestyle and spending habits. It is assumed that this consumer analysis
can indicate to what extent demand for particular goods and services are being met within the
market area. It is unclear how Buxton determines the categories based on demographics alone,
or how accurately consumer spending aligns with demand for certain retail categories.
Results
Buxton concluded similar market feasibility findings to that of the 2017 Claritas Data Report later
in this report. Findings include market and sales leakages among the majority of retail
categories in the trade area. Some notable categories leaking from both sites selected are full
service eating places, clothing and accessory, beauty supplies, electronic and appliances and
auto parts. Categories doing well in either or both sites retail trade areas include: florists, office
supply, furniture and home furnishings, liquor sales, and auto dealers.
Their consumer profiles can be found informative, but unreliable and quickly outdated as they
are simply assumptions based on demographics for the area. It is unclear if the profiles take into
account changes in the economy, regional competition, or consumer spending reports.
Presently, they do not account for the new residents, and continually growing population of
Ramsey since the residential development within the COR continues to occur.
Ramsey Station TOD Market Analysis4
This second study was completed in May of 2013 prepared for the City of Ramsey and the
NorthStar Corridor Development Authority by the McComb Group, Ldt. This market analysis
was much more comprehensive than the Buxton report and includes regional economic and
demographic trends as well as residential market information around the station site in Ramsey
on the Northstar Commuter Rail. In regards to retail and commercial development, this study
provides information about the feasibility of commercial and retail development based on
existing and forecasted demographics. Important factors for the market analysis are number of
households in the area, number of employees working in the community, and vehicle trips per
day.
Much has changed since the study was released including Coburn’s being secured as an
anchor store within the COR, the completion of the overpass of Armstrong Boulevard over
HIghway 10, as well as over half of the housing development goals for the COR being reached.
Even if outdated, assessing the conclusions of this study can help shape the decision making
process as the City of Ramsey still works to build out the COR.
4 Ramsey Station TOD Market Analysis, McComb Group Ldt., May 2013 http://156.142.212.178:8080/docs/2016/CCReg/20160913_6217/6635_Ramsey_Station_TOD_Market_Analysis.pdf

P a g e | 8
Results
It was concluded that NorthStar Commuter Rail riders will constitute a large portion of
consumers for the COR, making it a suitable destination for a variety of commercial activity.
Retail, food services, and personal or businesses services can be supported by residents or
offices in the area, as well as the larger retail trade area.
This study included information on the other competitive retail areas also located along the
NorthStar Commuter Rail, as well as clearly defined Ramsey’s three current retail nodes.
Ramseys lease rates are below average for the Twin Cities Metro, but reflective of their location
and distance from the high population cities themselves. It has been clear that Ramsey has
focused their retail development energy on the COR, with the NorthStar Marketplace consisting
of over 50% of all retail space in the city.
The Ramsey Station TOD Analysis pulls their demographic data, which impacts and influences
the retail analysis from a differently distinguished trade area than the Buxton Review. In this
case the trade, or draw, area for development around the NorthStar station was delineated
based on rider surveys conducted by Metro Transit in 2012.The map of the draw area can be
seen below in Figure 4 and includes nearly 75 square miles - significantly larger than previous
retail trade areas. This expansive draw area is used to determine sales potential for the COR,
which could be misleading since the area considered is so far-reaching.
Figure 4 - Ramsey Station Draw Area
This assessment goes into great detail regarding infrastructure plans and needs, demographic
and workforce impact for the COR as a whole, not just retail and commercial development. The
study’s analysis is comprehensive and detailed, but it is important to note that their difference in
trade/draw area and focus of the study will have an affect on the kind of deliverables provided.
Overall a extensive community and regional land use assessment of existing assets and

P a g e | 9
opportunities was provided, but the analysis lacked in providing solutions or strategies for how
Ramsey could best fill the vacant retail opportunities in the COR.
Town Centers and the 50/50/50 Rule5
Robert J. Gibbs is a leader and pioneer in the realms of New Urbanism, town planning, and
retail development. He is known for developing inventive yet practical methods for encouraging
commercial development. With his economic background, he pushed for areas to begin
focusing on town centers over shopping malls, notably in the early 2000’s. Town centers would
be the new innovative development to attract retailers over the conventional mall. Gibbs
envisions town centers as places home to striking public spaces as well as mixed-use
development, home to residential, retail, and public service structures.
Even though individual retailers, brands and companies may have specific variables and
requirements they seek for a new location, there are some basic principles that must be in place
for a successful retail sector. Visibility, location, and parking availability are all general
guidelines that a town must consider when attempting to capture new retail development in a
town center.
Alongside these principals Gibbs developed the 50/50/50 rule for town centers seeking retailers.
This rule provides that retailers pursue locations with 50,000 people in the retail trade area, a
median income of $50,000, and at least 50,000 cars per day going by the town center.
Ramsey successfully meets the population and income portions of Gibbs rule, but like other
third-ring suburban town centers is lacking in traffic count, a factor the city has acknowledged
and is working to address. Given the city’s location along Highway 10, and the COR’s proximity
to the major trafficway, Ramsey’s COR should be well on its way to being a viable location for
retail tenants. With this knowledge, and the results from Claritas data Ramsey can focus on
simplifying the process to obtain and develop property within the COR, and work on providing
assistance as needed to local, regional or national developers. Through our recommendations
of targeting related retailers, small businesses, and continuing plan the develop the COR’s
housing, Ramsey lends itself to a good position for attracting successful retailers.
2017 Claritas Data Report
To inform recommendations in this report, our analysis utilized data from the Consumer
Expenditure Survey and the Census of Retail Trade, conducted by the Bureau of Labor
Statistics and US Census Bureau, respectively. The Claritas Retail Market Power dataset finds
sales gaps in markets by looking at where money goes within a specified area—what is spent
within the district - while the Consumer Buying Power dataset estimates where residents’ own
money is going outside of the district.
5Steuteville, Robert, The future belongs to town centers, January 2002. Public Square, CNU Journal https://www.cnu.org/publicsquare/future-belongs-town-centers

P a g e | 10
More specifically, this data examines the quantitative aspect of the community's retail
opportunities. This type of analysis is sometimes called "a gap analysis" or "a supply and
demand analysis" and can indicate how well the retail needs of local residents are being met,
uncover unmet demand and possible opportunities, describe the strengths and weaknesses of
the local retail sector, and measure the difference between actual and potential retail sales.
Within the Ramsey Summary document included as Appendix ****, industries are also listed by
North American Industry Classification System (NAICS) drawn from the US Bureau of Labor
Statistics; NAICS codes can indicate connections between industries and businesses, thus
allowing for targeted recruitment of related businesses.
The trade area is shown below, as defined by the City of Ramsey:
Figure 1, retail market for the City of Ramsey

P a g e | 11
Retail market power in the City of Ramsey
A more complete listing is included in an attachment to this report. The retail market analysis
shows considerable opportunity for businesses in the following areas:
● Clothing and clothing accessories stores, $25.9 million
● General merchandise stores, $51.5 million
● Foodservice and drinking places, $53.2 million
○ Full service, $21.7 million
○ Limited service, $23 million
● Motor vehicle and parts dealers, $29.7 million
● Motor vehicle dealerships, $32.3 million
● Building material and garden supply, $53 million
● Food and beverage stores, $49.5 million
● Health and personal care stores, $22.5 million
In each of these industries, a significant amount of money is flowing out of Ramsey to other
commercial and retail destinations. This also shows, however, a significant opportunity for each
industry within Ramsey, given that the Claritas data show concrete demand from Ramsey
residents.
The region is doing well in the following areas:
● Furniture and home furnishing stores
● Auto sales
● Gas stations and convenience stores
With these categories, Ramsey is actually pulling in money from outside of the designated
market areas. If people are currently coming to Ramsey for furniture, auto sales, or gas stations,
Ramsey has the opportunity to draw those consumers to related businesses.
Niches The city of Ramsey should consider adopting a niche-focused development model. A
commercial niche is an interrelated cluster of businesses and industries that are
complementary, but do not compete. Niches can be identified by looking at groups of NAICS
codes or through common-sense connections already existing in a community. Niche
development promotes economic strength through specialization, revitalizing downtowns and
retail markets by attracting businesses that complement what currently exists in a city. Assets
would include an existing business or a specific market segment. Because niches are context-
dependent and built with knowledge of a community’s assets and challenges, it is useful to
inventory both before suggesting potential niches.

P a g e | 12
Assets and challenges for the City of Ramsey
Assets
● Substantial, growing population: Between 2000 and 2015, the City of Ramsey’s
population grew from 18,510 to 24,846 people. The number of households grew from
5,906 to 8,358.
● Large disposable income: The median household income in Ramsey is $86,794, in
comparison to a statewide average of $58,475 and a metro average of $71,008
● Desire for retail and restaurants: City staff have indicated a high degree of resident
interest in and desire for retail development, including restaurants, stores, and
entertainment. The COR’s vacancies and non-development, to a large degree explained
by the 2008 Recession, is a source of complaint for Ramsey residents
● Geography—Highway 10: The retail market map is limited by Highway 10, encouraging
residents to stay north of the highway
● Retail space of 400+ acres: The City has a lot of opportunities to develop retail spaces
● Northstar stop: The stop help attracts housing to the City, which is beneficial for also
attracting retail
● Three retail nodes: The COR and two retail nodes already exist, and some retail space
is available in each node (see Figure 3):
○ Node 1 - Bunker Lake Road and Highway 47: Liquor store, JJ, gas station,
dollar tree, Ginger Café, coffee shops—Dunn Bros and Caribou, Wendy’s, car
wash, Papa Murphy’s, Riversbend, Family dental, massage, salon
○ Node 2 - Highway 47 and 167th Ave NW: Liquor store, shooting range and gun
shop, accounting firm, Domino’s pizza, interior supply
○ In/around the COR: Fountains of Ramsey Event Center, The Residence, dental
clinic, County offices, city offices, Gas stations; Several car/RV/trailer places; The
Northstar Stop; Coburn’s Grocery store, GiGi’s Salon, nails, State Farm office,
Chinese restaurant, Mexican restaurant, Caribou Coffee, Fitness, vaping store,
Subway, Totally Tan, gas station, Lunchbox Deli
● Evidence that residents are spending money outside of Ramsey: the Clairitas data
suggests significant desire for several retail sectors, as noted above

P a g e | 13
Figure 3 : Map of Current Businesses67
Challenges
● Geography: The 400 acres of land and proximity to Highway 10 are both an asset and a
challenge for the City of Ramsey. While having ample room for growth can provide
opportunities for development, the city needs to be strategic about growth. Huge swaths
of empty land separate housing and neighborhoods from retail nodes
● Competition with Anoka, Coon Rapids: Other cities have rapidly grown, and other retail
nodes with big box stores are popular with Ramsey residents. Other cities have perhaps
“beaten Ramsey to the punch”
● Lack of existing buildings or spaces for restaurants: While some spaces exist, creating
sites for restaurants and retail, especially for small and locally-owned businesses, is
important. The capital necessary to construct new spaces is difficult for small businesses
to come by, so connecting small businesses with existing or new spaces would help
build Ramsey’s retail market
● COR vacancies have existed for some time: Public perception of the COR and its
development might discourage businesses from locating there. A large marketing
strategy and intentional recruitment of businesses and smart use of incentives might be
methods to grow the COR and build its reputation
6 Current Business List, http://www.ci.ramsey.mn.us/brc 7https://www.google.com/maps/d/u/1/viewer?mid=13Oxf8gWI9-lIQUWWoKHjoBt-PGFYFtiE&ll=42.72811672550691%2C-102.03850964999998&z=4

P a g e | 14
Considering the above context and the retail market data, the City of Ramsey should pursue a
niche-based retail recruitment strategy. Typically, niches are specific markets made up of
several similar or complementary businesses that serve a specific clientele. Niches are based
on consumer interest, often defined by demographics (for example, an elderly/retiree niche),
type of good (furniture, entertainment), or an environment (mall or shopping district).
Two existing niches include furniture and car sales. According to the Claritas data, the City of
Ramsey is high performing in both of these markets. Potential niches in Ramsey include a
retiree niche, a wedding niche, and a restaurant niche. The Claritas data shows significant
money in these industries moving outside of the district, suggesting the potential for businesses
that serve these interests to be successful; in addition, a few businesses in these niches already
exist in Ramsey. For new niches, coordination and recruitment of businesses is key; for existing
niches, or when potential niches are further along, developing a cohesive identity for consumers
and enhancing the market is a more successful strategy. A summary of existing and potential
niches is found below:
Table 1, Existing and Potential Niches in Ramsey, Minnesota
Niche Existing Businesses Potential Businesses
Auto Niche, RV niche Star Auto Sales
EZ Auto Sales
Northern Auto Sales
Dale’s Auto Sales
AMG Auto Sales
J&C Auto Sales
Jack’s Auto Repair
Pleasureland
D/Best Auto Repair
Gus’s Auto Works
Heartland Tire
Ken’s Repair and Sales
T3 Auto and Rec
Top Ten Auto
Top Shelf Tires
The Rocket Shop
Three D’s Auto Shop
Wilkins Used Cars
NAICS 441
Automotive repair and
Maintenance (NAICS 8111)
Automotive parts,
Accessories, and Tire stores
(NAICS 4413)
Furniture and Home
Improvement Niche
Slumberland
Accent precision wood products
B&B Carpet One
Cabinetry Concepts
H&H Floor Covering
NAICS 442
Floor covering stores
Window treatment stores
Home decor stores
Resale stores

P a g e | 15
Joseph's Custom Upholstery
Roadside Furniture
TLM Cabinets
Antique stores
Retiree Niche (potential) The Residence Housing, focusing on
walkability, safety
Health care businesses
Pharmacies
In-home care businesses
Specialized renovation and
contracting
Salons
Bookstores
Restaurants and retail
Wedding Niche (potential) The Fountains of Ramsey
reception venue
Wells Catering
Lisa’s Catering
Salon Ciry
Wedding dress store
Resale store
High-end salon
Restaurant Niche
(potential)
Acapulco Mexican Restaurant
Golden Chinese Restaurant
Domino’s
Culver’s
Bamboo Village
Taco Bell
Subway (2)
Burger King
Caribou Coffee (2)
Ginger Cafe
Riostone
Lunchbox Deli
Wendy’s
Jimmy John’s
$5 Pizza
Dunn Brothers Coffee
Fast-casual
Locally owned sit-down
restaurants
Northstar Line Niche
(potential)
Northstar stop
The Residence
Coffee shop
Childcare
High-end grocery store

P a g e | 16
Impact of Zoning on Development
Overall, the Ramsey Zoning Code is quite flexible, most particularly in the COR. However, there
are some zoning limitations within the three Nodes identified in this report. Node 1 (Bunker Lake
Road and Highway 47) and Node 2 (Highway 47 and 167th Ave NW) both are primarily zoned
Business-1. B-1 districts in Ramsey cannot contain larger commercial enterprises like
automotive sales lots or hotels. Still, this intentional limitation does encourage development at a
proper scale to the nearby residential areas for each node. B-1 districts allow as a permitted use
or a conditional use most of the types of businesses that would be suitable for these more
interior nodes.
The automotive niche identified in this report as a potential opportunity for growth for Ramsey
would simply need to remain along Highway 10 within the Business-2 (B-2) zoning district. This
location takes advantage of complementary industries already existing along this corridor, and
of vital access to the Highway.
Zoning Districts by Node
Node 1: Bunker Lake Road and Highway 47
Business-1 (B-1), PUD (established subdivision), Residential-3 (R-3) High-Density Residential, and some Residential-2 (R-2) Medium Density Residential
Node 2: Highway 47 and 167th Ave NW
Business-1 (B-1) and PUD (golf course)
Node 3: The COR
specialized zoning district designed to encourage more urban, higher density mixed use development – COR-1 mixed-use core subdistrict, COR-2 Commercial subdistrict, COR-3 workplace subdistrict, COR-4 neighborhood subdistrict, COR-5 park and open space subdistrict
By focusing efforts on attracting linked businesses and industries in order to establish attractive
commercial nodes, Rasmey will be able to match businesses to appropriate zoning districts. It is
possible that the B-1 districts in Node 1 and Node 2 will need to expand at some point in the
future as each node grows, but both areas still include nearby vacant land and underdeveloped
sites. See Appendix 1 for the Official City of Ramsey Zoning Map.

P a g e | 17
Other Recommendations
Support Local8
Small local businesses not only help build community wealth but also play a formative role in
shaping the city’s identity and preserving character. The City of Ramsey has an opportunity to
redefine retail for the community. Through policy, financial incentives, and development
requirements, the City of Ramsey can create lower-risk, and lower-cost opportunities for
entrepreneurs to utilize physical assets and human capital unique to Ramsey while promoting
retail growth in the community. Particularly for the COR, the City can require future housing or
large-scale commercial development to reserve a potion of their space for small storefronts or
locally owned businesses as a condition of permitting construction. Due to financial incentives
for large chains, and fiscal barriers for start-ups, this conditional change can promoting the
importance of small businesses can help encourage local vendors without turning away private
investments.
Economic development incentives and access to capital typically favor national chains and large
retailers. These types of development are absolutely important and necessary to Ramsey and
its success. However expansion of incentives for local entrepreneurs not only provides a
needed businesses to the community, it means an investment in the residents of Ramsey for
years to come. Encouraging locals to engage with the Anoka County Chamber of Commerce, or
one of Minnesota’s nine Small Business Development Centers can help citizens turn dreams of
owning a small business into a reality and provide a retail opportunity all can enjoy.
Zoning in Ramsey is already quite flexible and inclusive, and should remain so. It is important
that the City and it’s zoning code continues to encourage and support multi-story, pedestrian-
oriented districts that include a mix of small and large commercial spaces, and that preserve
historic buildings, over the production of strip malls and sparsely developed areas. Nodes that
include a variety of vendors in a centralized location, promoting a family-friendly and walkable
opportunity for residents to shop for many needs at once, creating a retail destination provide
ample opportunities for resident satisfaction and economic success.
Ask for Input9
To successfully develop the retail economy, Ramsey must engage residents, business owners,
and other stakeholders to collectively develop a vision for future. Stakeholder engagement helps
ensure that plans reflect the community’s desires, needs, and goals and generates public
support that can maintain momentum for sustainability implementing changes and remain
resilient for the future. Community designed goals with supported plans encourages local action
8 Institute for Self Reliance, 8 Policy Strategies Cities Can Use to Support Local Businesses; https://ilsr.org/8-policy-strategies-cities-can-use-to-support-local-businesses/ 9 U.S.EPA Office of Sustainable Communities, How Small Towns and Cities can use Local Assets to Rebuild their Economies: Lessons from Successful Places; https://www.epa.gov/sites/production/files/2015-05/documents/competitive_advantage_051215_508_final.pdf

P a g e | 18
and helps build in accountability in the process of accomplishing projects that align with long-
term plans.
Just as citizens are engaged with the Comprehensive Plan process, they should be involved in
a collective visioning of the COR development, at all stages of the process. This can be done
through a variety of platforms and for both long and short range projects. Encouraging inclusive
participation in the decision process helps build trust between the City, developers, and citizens.
Provided that the COR and retail development is such an integral part of shaping Ramsey’s
character and identity, it is an even greater priority to ensure that public voices are heard. This
ensures that retailers meet the needs and desires of the community.
Leverage Assets & Growth
The Twin Cities Metro as a whole continues to expand, finding Ramsey as one of the fastest
growing communities in the metro. Ramsey’s citizens have an AMI well above the average for
the Metro, and a population that has seen significant growth over the last decade that shows no
signs of slowing. Provided with this advantageous situation, Ramsey has the opportunity to
leverage this growth and its community’s unique assets to assist in attracting and retaining
retail.
Ramsey has three key assets distinguishing it from other communities in the Twin Cities
metropolitan area: its proximity to U.S. Highway 10 - a highway serving as the gateway between
the Twin CIties and more rural Central and Northern Minnesota; its location along the
Mississippi and Rum Rivers with access to the resources the rivers offer; and an abundance of
greenways, parks and undeveloped land.
With these assets in mind, the creation and cultivation of an identity of Ramsey centered around
the preservation of rural culture, natural resources and outdoor activities can be leveraged.
Ramsey should utilize land currently zoned commercial for the formation of their new identity.
The city's abundance of land will be key to creating an identity for Ramsey.
Create a Destination10
The traditional retail format is changing and the way people experience stores and restaurants
is tied to experiences more than items. Ramsey has a community landscape with many parks
and open space. A retail market can be shaped around these resources through the creation of
expos, recreational activities, weekend events, festivals, theater, and more.
Shoppers need a reason to spend hard earned money. Ramsey has the unique assets
necessary to develop an identity lacking in nearby cities. The creation of a retail identity for
Ramsey will give character to existing retail in the city, and create a more specific framework for
10 U.S.EPA Office of Sustainable Communities, How Small Towns and Cities can use Local Assets to Rebuild their Economies: Lessons from Successful Places; https://www.epa.gov/sites/production/files/2015-05/documents/competitive_advantage_051215_508_final.pdf

P a g e | 19
future development. Branding can transform a city into a place where people want to live, work
and visit. A strong retail identity is especially vital when vying with other markets for attention in
terms of attracting new businesses. The brand should be based on what assets a city already
possesses, rather than who the city wants to become. Thus, Ramsey should work with its
unique assets to brand itself in a distinctive manner.
The branding of a community involves coordinated activity on the part of community members
and the local government to attract potential customers. Refocusing retail in Ramsey towards
locally owned businesses and experience-based shopping will not only empower residents of
the city who strongly identify with Ramsey's more rural character, but also attract passerby on
U.S. Highway 10 who share those interests.
Encourage Housing1112
The City of Ramsey continues to seek to attract and develop retail opportunities for the
community. Continuing to develop housing, increase households and diversify the housing
options will help make Ramsey not only more attractive for prospective residents, but also for
the future of commercial economic development within the city, something all residents will
benefit from.
“Successful retail depends on successful residential neighborhoods”. In the past, when
development was less risky and more abundant, retail and economic development would be
completed prior to housing developments. Since the Great Recession, there has been a shift in
that new businesses or retailers want proof of residences already in place before beginning
development on a proposed commercial site. It is now argued that where residential growth and
development is occurring, economic development is primed to follow. In today’s economic
climate, even the most stable retailers will be hesitant to move into a location if the surrounding
community is not a strong residential market with high spending potential. High-quality and
desirable consumers are found in all income brackets, but developers need to be assured that
communities are accessible and already spending money in the community, as well as full of
long-lasting residents and continuing to grow.
Retailers typically weigh a variety of factors when they consider development potential in a
proposed area, however some of the most important characteristics across the board are
population (density, growth, within a market area), traffic counts, and average income. Ramsey
already has a substantial median income of $86,800, so many retailers may be more heavily
weighing population growth and market need when considering Ramsey as a location. A
community emphasis on housing development would greatly impact the potential of retail,
commercial, and business development in Ramsey.
11 Beyard, Michael D., Michael Pawlukiewicz, and Alex Bond. Ten Principles for Rebuilding Neighborhood Retail.
Washington, D.C.: ULI - the Urban Land Institute, 2003. http://uli.org/wp-content/uploaads/2012/07/TP_NeighborhoodRetail.ashx_1.pdf 12 Gitt, Tammie. (June 1, 2014). Blight or Boom?: Rooftops essential to retail development. The Sentinel.
http://cumberlink.com/news/local/warehouses/blight-or-boom-rooftops-essential-to-retail-development/article-4949ee94-e851-11e3-8da2-001a4bcf887a.html

P a g e | 20
It is understood that cities and their streets evolve over time with businesses influenced by
quality, amount, and density of housing developments. It cannot be expected that retail will
immediately follow housing developments, but growing a community through housing will make
it easier for businesses to move in, become successful, and attract more specialized or higher-
end retailers.
Housing development can prime communities for neighborhood commercial development in a
few key ways, which involve a diversified housing stock and options for incoming community
members. Increased homeownership, including condominium ownership, displays a stable
neighborhood with invested community stakeholders and consumers. Housing development
creates a customer base for community retail, so growth in customer base, provides incentive
for a retailer to consider one location over another. Mixed-income housing also provides more
than just a growing consumer base for potential incoming businesses. Small locally owned
businesses and large chain retailers both require an accessible workforce living in close
proximity to work. Increased housing developments, particularly mixed-income, provide
residences for new anticipated workforce needs, enhancing the attractiveness of a city to
potential economic developers.

P a g e | 21
Appendix
Appendix 1 – Key Demographics Summary Page
Appendix 2 – Claritas Ramsey Summary Report
Appendix 3 – Buxton Retail Assessment 2011
Appendix 4 – Ramsey Station TOD Market Analysis 2013

P a g e | 22
Key Demographics Summary Page Data drawn from the US Census Bureau through MnCompass.
Projected Population Growth
2015 Projected 2030 Projected 2040
Total Population 25,362 30,700 34,700
Households 8,690 11,300 13,000
Percentage of Population by Age Group (2015)
Under 18 26.9%
18-24 8.7%
25-34 12.8%
35-44 14.4%
45-54 17.4%
55-64 11.4%
65-74 6.2%
75-84 1.4%
Percentage of Population by Race and Ethnicity
White alone 90.5%
Black or African American
1.2%
Asian or Pacific Islander 3.1%
Two or more races 2.4%
Hispanic or Latino 2.7%

Retail Market Power | Retail Stores OpportunityTrade Area: Ramsey, MN
2017 Demand (ConsumerExpenditures) 2017 Supply (Retail Sales) 2017 Opportunity Gap/Surplus
Retail Store Types Aggregate Dollars ($) Aggregate Dollars ($) Aggregate Dollars ($)Demand by Store TypeTotal Retail Sales (incl. Food/Drink) 606,713,669 289,476,231 317,237,438Total Retail Sales 539,406,651 275,462,433 263,944,218Motor Vehicle & Parts Dealers Motor Vehicle & Parts Dealers - 441 130,507,842 100,821,908 29,685,934 Automotive Dealers - 4411 111,678,311 79,336,898 32,341,413 Other Motor Vehicle Dealers - 4412 9,761,977 16,045,137 -6,283,160 Automotive Parts, Accessories, & Tire Stores - 4413 9,067,554 5,439,873 3,627,681Furniture & Home Furnishings Stores Furniture & Home Furnishings Stores - 442 12,267,762 19,895,379 -7,627,617 Furniture Stores - 4421 6,588,912 15,891,792 -9,302,880 Home Furnishing Stores - 4422 5,678,849 4,003,587 1,675,262Electronics & Appliance Stores Electronics & Appliance Stores - 443 10,112,056 5,889,568 4,222,488 Household Appliances Stores - 443141 1,522,119 2,797,610 -1,275,491 Electronics Stores - 443142 8,589,937 3,091,958 5,497,979Building Material & Garden Equipment & Supply Dealers Building Material & Garden Equipment & Supply Dealers - 444 65,403,195 12,211,256 53,191,939 Building Material & Supply Dealers - 4441 60,215,399 9,023,785 51,191,614 Lawn and Garden Equipment and Supplies Stores - 4442 5,187,796 3,187,472 2,000,324Building Material & Supply Dealers Home Centers - 44411 24,351,730 0 24,351,730 Paint and Wallpaper Stores - 44412 1,301,579 0 1,301,579 Hardware Stores - 44413 6,055,704 584,684 5,471,020 Other Building Materials Dealers - 44419 28,506,386 8,439,100 20,067,286 Building Material Dealers, Lumberyards - 444191 10,094,893 3,148,648 6,946,245 Outdoor Power Equipment Stores - 44421 1,082,108 2,539,212 -1,457,104 Nursery and Garden Centers - 44422 4,105,688 648,259 3,457,429Food & Beverage Stores Food & Beverage Stores - 445 75,228,316 25,715,624 49,512,692 Grocery Stores - 4451 68,218,528 20,503,490 47,715,038 Supermarkets and Other Grocery (except Convenience) Stores - 44511 63,720,568 20,022,459 43,698,109 Convenience Stores - 44512 4,497,959 481,030 4,016,929 Specialty Food Stores - 4452 2,518,998 404,520 2,114,478 Beer, Wine, & Liquor Stores - 4453 4,490,790 4,807,614 -316,824Health & Personal Care Stores Health & Personal Care Stores - 446 34,975,497 12,478,945 22,496,552 Pharmacies and Drug Stores - 44611 28,516,683 11,810,092 16,706,591 Cosmetics, Beauty Supplies and Perfume Stores - 44612 2,882,470 94,499 2,787,971 Optical Goods Stores - 44613 1,448,360 30,377 1,417,983 Other Health and Personal Care Stores - 44619 2,127,984 543,977 1,584,007Gasoline Stations Gasoline Stations - 447 35,731,023 45,986,861 -10,255,838 Gasoline Stations with Convenience Stores - 44711 17,928,242 45,414,390 -27,486,148 Other Gasoline Stations - 44719 17,802,781 572,471 17,230,310
Benchmark: USA Copyright © 2017 by Environics Analytics (EA). Source: Claritas - Pop-Facts Premier 2017, Claritas - Retail MarketPower 2017, , Claritas - Consumer Buying Power 2017.

Retail Market Power | Retail Stores OpportunityTrade Area: Ramsey, MN
2017 Demand (ConsumerExpenditures) 2017 Supply (Retail Sales) 2017 Opportunity
Gap/SurplusRetail Store Types Aggregate Dollars $ Aggregate Dollars $ Aggregate Dollars $Clothing & Clothing Accessories Stores Clothing & Clothing Accessories Stores - 448 27,572,065 1,699,856 25,872,209 Clothing Stores - 4481 20,435,131 1,349,324 19,085,807 Men's Clothing Stores - 44811 875,478 0 875,478 Women's Clothing Stores - 44812 4,548,779 0 4,548,779 Children's and Infants' Clothing Stores - 44813 1,156,550 0 1,156,550 Family Clothing Stores - 44814 11,108,928 1,116,486 9,992,442 Clothing Accessories Stores - 44815 1,055,901 179,921 875,980 Other Clothing Stores - 44819 1,689,494 52,917 1,636,577 Shoe Stores - 4482 3,727,854 112,626 3,615,228 Jewelry, Luggage, & Leather Goods Stores - 4483 3,409,080 237,905 3,171,175 Jewelry Stores - 44831 3,131,376 237,905 2,893,471 Luggage, & Leather Goods Stores - 44832 277,704 0 277,704Sporting Goods, Hobby, Book, & Music Stores Sporting Goods, Hobby, Book, & Music Stores - 451 11,664,114 2,449,474 9,214,640 Sporting Goods, Hobby, & Musical Instrument Stores - 4511 10,050,229 2,449,474 7,600,755 Sporting Goods Stores - 45111 6,957,098 1,913,577 5,043,521 Hobby, Toys and Games Stores - 45112 2,144,815 496,596 1,648,219 Sew/Needlework/Piece Goods Stores - 45113 412,810 0 412,810 Musical Instrument and Supplies Stores - 45114 535,505 39,301 496,204 Book, Periodical, & Music Stores - 4512 1,613,886 0 1,613,886 Book Stores and News Dealers - 45121 1,613,886 0 1,613,886 Book Stores - 451211 1,395,973 0 1,395,973 News Dealers and Newsstands - 451212 217,913 0 217,913General Merchandise Stores General Merchandise Stores - 452 66,566,366 15,065,788 51,500,578 Department Stores excluding leased depts. - 4521 35,311,735 1,211,269 34,100,466 Other General Merchandise Stores - 4529 31,254,630 13,854,518 17,400,112Miscellaneous Store Retailers Miscellaneous Store Retailers - 453 16,172,319 28,543,708 -12,371,389 Florists - 4531 799,879 4,120 795,759 Off ice Supplies, Stationery, & Gif t Stores - 4532 5,356,813 6,668,228 -1,311,415 Off ice Supplies and Stationery Stores - 45321 3,001,155 6,657,722 -3,656,567 Gif t, Novelty, and Souvenir Stores - 45322 2,355,658 10,506 2,345,152 Used Merchandise Stores - 4533 2,110,993 0 2,110,993 Other Miscellaneous Store Retailers - 4539 7,904,634 21,871,359 -13,966,725Non-store Retailers Non-store Retailers - 454 53,206,096 4,704,068 48,502,028Foodservice & Drinking Places Foodservice & Drinking Places - 722 67,307,018 14,013,797 53,293,221 Special Foodservices - 7223 5,030,291 2,200,874 2,829,417 Drinking Places -Alcoholic Beverages - 7224 2,153,379 67,644 2,085,735 Full-Service Restaurants - 722511 33,258,894 11,551,635 21,707,259 Limited-Service Eating Places - 722513 23,054,598 0 23,054,598 Cafeterias, Grill Buffets, and Buffets - 722514 607,398 0 607,398 Snack and Non-alcoholic Beverage Bars - 722515 3,202,458 193,645 3,008,813GAFO GAFO (General merchandise, Apparel, Furniture & Other) - (452, 448, 442, 443, 451, 4532) 133,539,176 51,668,293 81,870,883
Benchmark: USA Copyright © 2017 by Environics Analytics (EA). Source: Claritas - Pop-Facts Premier 2017, Claritas - Retail MarketPower 2017, , Claritas - Consumer Buying Power 2017.

Retail Market Power | MapTrade Area: Ramsey, MN
Benchmark: USA Copyright © 2017 by Environics Analytics (EA). Source: Claritas - Pop-Facts Premier 2017, Claritas - Retail Market Power2017, , Claritas - Consumer Buying Power 2017.
Leaflet (http://leafletjs.com) | Powered by Esri (https://www.esri.com) | USGS, NOAA

Retail Market Power | Merchandise Lines OpportunityTrade Area: Ramsey, MN
2017 Demand (ConsumerExpenditures) 2017 Supply (Retail Sales) 2017 Opportunity Gap/Surplus
Merchandise Lines Aggregate Dollars ($) Aggregate Dollars ($) Aggregate Dollars ($)Groceries and Other Foods 99,857,921 30,797,687 69,060,234Meals and Snacks 58,073,506 12,173,101 45,900,405Alcoholic Drinks 4,312,411 1,111,578 3,200,833Packaged Liquor/Wine/Beer 6,461,785 4,938,700 1,523,085Cigars, Cigarettes, and Tobacco & Smokers' Accessories 8,665,073 11,027,724 -2,362,651Drugs, Health Aids, and Beauty Aids 79,179,512 18,193,926 60,985,586Soaps, Detergents, and Household Cleaners 3,638,990 364,467 3,274,523Paper and Related Products 7,340,023 2,064,875 5,275,148Men's Wear 8,645,445 1,016,438 7,629,007Women's, Juniors', and Misses' Wear 14,853,620 1,083,121 13,770,499Children's Wear 7,269,942 424,433 6,845,509Footwear 9,679,953 1,059,448 8,620,505Sewing, Knitting, and Needlework Goods 796,422 123,584 672,838Curtains, Draperies, Blinds, Slipcovers etc. 3,129,505 1,055,707 2,073,798Major Household Appliances 6,165,951 2,532,362 3,633,589Small Electric Appliances 904,703 209,967 694,736Televisions, Video Recorders, Video Cameras 3,443,205 1,502,536 1,940,669Audio Equipment, Musical Instruments, and Supplies 1,877,093 531,043 1,346,050Furniture and Sleep Equipment 10,876,406 16,828,980 -5,952,574Flooring & Floor Coverings 2,803,340 802,010 2,001,330Computer Hardware, Software and Supplies 4,882,699 2,529,709 2,352,990Kitchenware and Home furnishings 6,280,822 2,179,921 4,100,901Jewelry 3,467,935 284,475 3,183,460Books 3,519,020 553,211 2,965,809Photographic Equipment & Supplies 576,694 146,810 429,884Toys, Hobby Goods, and Games 4,830,642 1,169,853 3,660,789Optical Goods 2,284,779 214,682 2,070,097Sporting Goods 4,509,109 3,222,894 1,286,215RVs, Campers, Camping & Travel Trailers 7,289,390 9,594,456 -2,305,066Hardware Tools, and Plumbing and Electrical Supplies 10,497,897 2,184,365 8,313,532Lawn, Garden, and Farm Equipment & Supplies 6,520,080 2,038,481 4,481,599Lumber and Building Materials 5,349,181 1,347,676 4,001,505Paint and Sundries 3,399,662 246,485 3,153,177Cars, Trucks, and Other Powered Transportation 106,234,215 76,855,954 29,378,261Automotive Fuels 64,940,849 52,000,530 12,940,319Automotive Lubricants 371,469 186,595 184,874Pets, Pet Foods, and Pet Supplies 9,114,136 9,681,515 -567,379All Other Merchandise 24,670,284 17,196,931 7,473,353
Benchmark: USA Copyright © 2017 by Environics Analytics (EA). Source: Claritas - Pop-Facts Premier 2017, Claritas - Retail MarketPower 2017, , Claritas - Consumer Buying Power 2017.

Retail Market Power | MapTrade Area: Ramsey, MN
Benchmark: USA Copyright © 2017 by Environics Analytics (EA). Source: Claritas - Pop-Facts Premier 2017, Claritas - Retail Market Power2017, , Claritas - Consumer Buying Power 2017.
Leaflet (http://leafletjs.com) | Powered by Esri (https://www.esri.com) | USGS, NOAA

Consumer Buying Power | Consumer Spending PatternsTrade Area: Ramsey, MN Population: 31,650 | Households: 11,254
TOTAL EXPENDITURESDescription 2017 Aggregate Expenditure % Comp 2022 Aggregate Expenditure % Comp 2017 Avg $/HH 2022 Avg $/HH Avg Annual % Growth 2017 Market IndexTotal Specif ied Consumer Expenditures (AREA) 517,436,409 100.00 601,631,520 100.00 45,978.00 50,463.98 3.06 115
Description 2017 Aggregate Expenditure % Comp 2022 Aggregate Expenditure % Comp 2017 Avg $/HH 2022 Avg $/HH Avg Annual % Growth 2017 Market IndexTotal Specif ied Consumer Expenditures (BASE MARKET) 4,920,067,209,960 100.00 5,461,924,949,383 100.00 39,884.90 42,589.16 2.11 100
CONSUMER SPENDING PATTERNSDescription 2017 Aggregate Expenditure % Comp 2022 Aggregate Expenditure % Comp 2017 Avg $/HH 2022 Avg $/HH Avg Annual % Growth 2017 Market IndexFood At Home Food At Home 53,881,868 100.00 60,491,977 100.00 4,788 5,074 2.34 111 Bakery Products 5,039,234 9.35 5,524,792 9.13 448 463 1.86 114 Cereals & Cereal Products 2,406,676 4.47 2,686,175 4.44 214 225 2.22 111 Dairy Products 6,931,653 12.86 7,646,773 12.64 616 641 1.98 115 Fresh Milk & Cream 2,012,075 3.73 2,216,042 3.66 179 186 1.95 111 Other Dairy Products 4,248,809 7.89 4,634,474 7.66 378 389 1.75 122 Eggs 670,769 1.24 796,256 1.32 60 67 3.49 93 Fats & Oils 1,068,420 1.98 1,262,052 2.09 95 106 3.39 110 Fish & Seafood 1,582,843 2.94 2,115,509 3.50 141 177 5.97 99 Fruits & Vegetables 8,586,139 15.94 10,439,855 17.26 763 876 3.99 105 Juices 1,211,511 2.25 1,445,386 2.39 108 121 3.59 104 Meats (All) 9,192,009 17.06 10,173,004 16.82 817 853 2.05 106 Non-Alcoholic Beverages 5,020,509 9.32 5,594,114 9.25 446 469 2.19 109 Prepared Foods 10,679,064 19.82 11,421,063 18.88 949 958 1.35 121 Sugar & Other Sweets 2,163,811 4.02 2,183,253 3.61 192 183 0.18 126Food Away From Home & Alcohol Alcoholic Beverages 5,819,686 100.00 6,465,768 100.00 517 542 2.13 114 Alcoholic Beverages At Home 3,490,810 59.98 3,864,443 59.77 310 324 2.05 114 Alcoholic Beverages Away From Home 2,328,876 40.02 2,601,326 40.23 207 218 2.24 116 Total Food Away From Home 32,212,724 100.00 36,525,101 100.00 2,862 3,064 2.54 114 Lunch 9,523,474 29.56 10,545,427 28.87 846 885 2.06 111 Dinner 16,088,315 49.94 18,650,688 51.06 1,430 1,564 3.00 114 Breakfast & Brunch 3,244,809 10.07 3,774,116 10.33 288 317 3.07 107Day Care, Education & Contributions All Day Care 4,675,914 100.00 5,211,109 100.00 415 437 2.19 132 Contributions (All) 20,359,361 100.00 23,291,549 100.00 1,809 1,954 2.73 108 Education 12,816,069 100.00 20,305,666 100.00 1,139 1,703 9.64 92 Room, Board 1,014,580 7.92 1,571,937 7.74 90 132 9.15 98 Tuition/School Supplies 11,542,656 90.06 18,315,581 90.20 1,026 1,536 9.67 92Health Care Medical Services 26,004,089 39.90 28,852,195 40.02 2,311 2,420 2.10 110 Prescription Drugs 34,934,616 53.60 38,123,204 52.88 3,104 3,198 1.76 114 Medical Supplies 2,160,443 3.31 2,660,504 3.69 192 223 4.25 122Household Furnishings & Appliances Total Furniture 6,402,813 63.69 7,457,889 63.95 569 626 3.10 116 Bedroom Furniture 1,929,214 19.19 2,235,057 19.17 171 187 2.99 113 Living/Dining Room Furniture 2,591,121 25.77 3,021,528 25.91 230 253 3.12 116 Other Furniture 1,807,340 17.98 2,115,823 18.14 161 177 3.20 121 Household Textiles 1,968,578 19.58 2,217,442 19.01 175 186 2.41 124 Domestic Textiles 1,413,390 14.06 1,690,742 14.50 126 142 3.65 117 Window & Furniture Covers 555,187 5.52 526,699 4.52 49 44 -1.05 146 Major Household Appliances 3,515,758 100.00 4,320,376 100.00 312 362 4.21 122 Miscellaneous Household Equipment 4,820,766 100.00 5,668,976 100.00 428 476 3.29 128 Small Appliances & Housewares 1,581,997 100.00 1,877,698 100.00 141 157 3.49 110
Benchmark:USA Copyright © 2017 by Environics Analytics (EA). Source: Claritas - Pop-Facts Premier 2017, Claritas - Retail MarketPower 2017, , Claritas - Consumer Buying Power 2017.

Consumer Buying Power | Consumer Spending PatternsTrade Area: Ramsey, MN Population: 31,650 | Households: 11,254
CONSUMER SPENDING PATTERNS
2017 Aggregate Expenditure % Comp 2022 Aggregate Expenditure % Comp 2017 Avg $/HH 2022 Avg $/HHAvg Annual %Growth
2017 MarketIndex
Housing Related & Personal Total Housing Expenses 64,154,727 100.00 80,946,323 100.00 5,701 6,790 4.76 110 Fuels & Utilities 36,230,469 56.47 48,927,195 60.44 3,219 4,104 6.19 112 Telephone Services 13,183,255 20.55 14,189,179 17.53 1,171 1,190 1.48 107 Cable & Internet Services 14,741,003 22.98 17,829,949 22.03 1,310 1,496 3.88 107 Household Repairs 14,878,548 100.00 17,021,652 100.00 1,322 1,428 2.73 129 Household Services 4,451,794 100.00 6,721,711 100.00 396 564 8.59 101 Housekeeping Supplies 5,924,547 100.00 7,049,690 100.00 526 591 3.54 113 Personal Expenses & Services 5,436,066 100.00 6,263,871 100.00 483 525 2.88 111Personal Care & Smoking Products Personal Care Products & Services 12,833,895 100.00 15,023,882 100.00 1,140 1,260 3.20 117 Personal Care Services 7,888,432 61.47 9,482,074 63.11 701 795 3.75 120 Smoking Products & Supplies 4,680,190 100.00 5,514,477 100.00 416 463 3.34 119Pet Expenses Pet Expenses 7,731,138 100.00 8,763,881 100.00 687 735 2.54 123Sports & Entertainment Photographic Equipment/Supplies 431,533 100.00 582,181 100.00 38 49 6.17 139 Reading Materials 1,009,323 100.00 1,246,458 100.00 90 105 4.31 110 Sports & Recreation 12,393,479 100.00 14,610,201 100.00 1,101 1,225 3.35 127 Sports Equipment 4,259,719 34.37 4,602,516 31.50 379 386 1.56 131 Travel 20,140,438 100.00 23,127,650 100.00 1,790 1,940 2.80 121 TV, Radio & Sound Equipment 8,518,902 100.00 10,855,140 100.00 757 911 4.97 105 Computers, Software & Accessories 3,112,225 100.00 4,465,506 100.00 277 375 7.49 112Transportation & Auto Expenses Automotive Maintenance, Repair, Other 13,136,629 100.00 14,932,502 100.00 1,167 1,253 2.60 118 Gasoline 34,412,263 34.96 42,390,106 39.62 3,058 3,556 4.26 115 Diesel Fuel 654,726 0.67 786,466 0.74 58 66 3.73 134 Motor Oil 200,628 0.20 189,443 0.18 18 16 -1.14 118 Vehicle Purchases & Leases 61,337,539 62.32 61,529,419 57.51 5,450 5,161 0.06 132 New Automobiles/Trucks/Vans 28,500,391 28.96 31,122,635 29.09 2,532 2,611 1.78 123 Used Vehicles 28,893,328 29.35 27,000,430 25.24 2,567 2,265 -1.35 136 Boats & Recreational Vehicle Rentals 220,466 0.22 238,465 0.22 20 20 1.58 117 Rented Vehicles 223,020 0.23 241,219 0.23 20 20 1.58 117Total Apparel Total Apparel 25,260,435 100.00 29,605,830 100.00 2,245 2,483 3.23 114 Women's Apparel 8,019,870 31.75 9,092,216 30.71 713 763 2.54 118 Men's Apparel 4,666,861 18.47 5,277,050 17.82 415 443 2.49 116 Girls' Apparel 1,559,506 6.17 1,732,158 5.85 139 145 2.12 120 Boys' Apparel 1,240,282 4.91 1,433,163 4.84 110 120 2.93 112 Infants' Apparel 1,118,640 4.43 1,209,842 4.09 99 101 1.58 119 Footwear (Excluding Infants) 5,223,755 20.68 5,864,282 19.81 464 492 2.34 115 Other Apparel Products & Services 3,431,522 13.58 4,997,118 16.88 305 419 7.81 99
Benchmark:USA Copyright © 2017 by Environics Analytics (EA). Source: Claritas - Pop-Facts Premier 2017, Claritas - Retail MarketPower 2017, , Claritas - Consumer Buying Power 2017.

Consumer Buying Power | MapTrade Area: Ramsey, MN Population: 31,650 | Households: 11,254
Leaflet (http://leafletjs.com) | Powered by Esri (https://www.esri.com) | USGS, NOAA

Benchmark:USA Copyright © 2017 by Environics Analytics (EA). Source: Claritas - Pop-Facts Premier 2017, Claritas - Retail Market Power2017, , Claritas - Consumer Buying Power 2017.

Pop-Facts Demographics Trend | Summary TrendsTrade Area: Ramsey, MN
2000 2010 2017 2022Census Census Estimate Projection
Population 24,427 29,249 31,650 33,326Households 8,236 10,283 11,254 11,922Families 6,603 7,862 8,595 9,102Housing Units 8,318 10,683 11,672 12,352Group Quarters Population 83 127 127 127
Benchmark: USA Copyright © 2017 by Environics Analytics (EA). Source: Claritas - Pop-Facts Premier 2017, Claritas -Retail Market Power 2017, , Claritas - Consumer Buying Power 2017.

Pop-Facts Demographics Trend | Percent Change TrendsTrade Area: Ramsey, MN
2000-2010 2010-2017 2017-2022% % %
Population Count Change (%) 19.74 8.21 5.29Household Count Change (%) 24.85 9.44 5.94Family Count Change (%) 19.07 9.32 5.90Housing Unit Count Change (%) 28.43 9.26 5.83Group Quarters Population Change (%) 53.01 0.00 0.00
Benchmark: USA Copyright © 2017 by Environics Analytics (EA). Source: Claritas - Pop-Facts Premier 2017, Claritas -Retail Market Power 2017, , Claritas - Consumer Buying Power 2017.
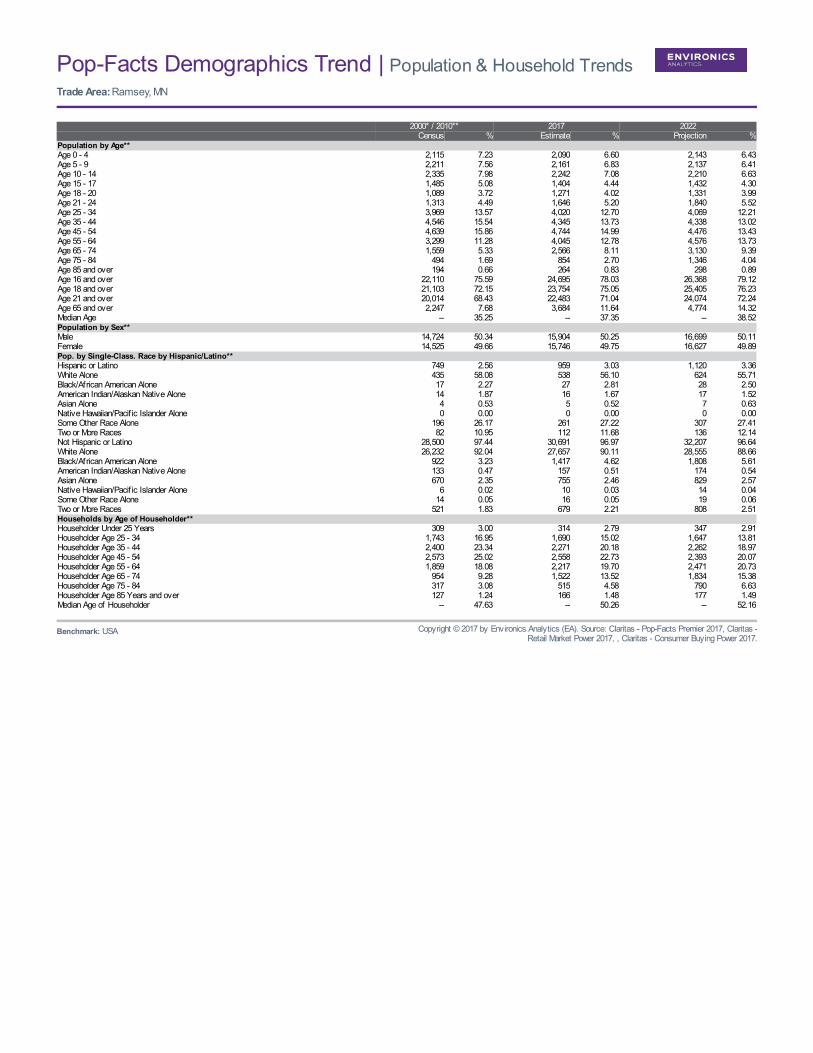
Pop-Facts Demographics Trend | Population & Household TrendsTrade Area: Ramsey, MN
2000* / 2010** 2017 2022Census % Estimate % Projection %
Population by Age**Age 0 - 4 2,115 7.23 2,090 6.60 2,143 6.43Age 5 - 9 2,211 7.56 2,161 6.83 2,137 6.41Age 10 - 14 2,335 7.98 2,242 7.08 2,210 6.63Age 15 - 17 1,485 5.08 1,404 4.44 1,432 4.30Age 18 - 20 1,089 3.72 1,271 4.02 1,331 3.99Age 21 - 24 1,313 4.49 1,646 5.20 1,840 5.52Age 25 - 34 3,969 13.57 4,020 12.70 4,069 12.21Age 35 - 44 4,546 15.54 4,345 13.73 4,338 13.02Age 45 - 54 4,639 15.86 4,744 14.99 4,476 13.43Age 55 - 64 3,299 11.28 4,045 12.78 4,576 13.73Age 65 - 74 1,559 5.33 2,566 8.11 3,130 9.39Age 75 - 84 494 1.69 854 2.70 1,346 4.04Age 85 and over 194 0.66 264 0.83 298 0.89Age 16 and over 22,110 75.59 24,695 78.03 26,368 79.12Age 18 and over 21,103 72.15 23,754 75.05 25,405 76.23Age 21 and over 20,014 68.43 22,483 71.04 24,074 72.24Age 65 and over 2,247 7.68 3,684 11.64 4,774 14.32Median Age -- 35.25 -- 37.35 -- 38.52Population by Sex**Male 14,724 50.34 15,904 50.25 16,699 50.11Female 14,525 49.66 15,746 49.75 16,627 49.89Pop. by Single-Class. Race by Hispanic/Latino**Hispanic or Latino 749 2.56 959 3.03 1,120 3.36White Alone 435 58.08 538 56.10 624 55.71Black/African American Alone 17 2.27 27 2.81 28 2.50American Indian/Alaskan Native Alone 14 1.87 16 1.67 17 1.52Asian Alone 4 0.53 5 0.52 7 0.63Native Hawaiian/Pacif ic Islander Alone 0 0.00 0 0.00 0 0.00Some Other Race Alone 196 26.17 261 27.22 307 27.41Two or More Races 82 10.95 112 11.68 136 12.14Not Hispanic or Latino 28,500 97.44 30,691 96.97 32,207 96.64White Alone 26,232 92.04 27,657 90.11 28,555 88.66Black/African American Alone 922 3.23 1,417 4.62 1,808 5.61American Indian/Alaskan Native Alone 133 0.47 157 0.51 174 0.54Asian Alone 670 2.35 755 2.46 829 2.57Native Hawaiian/Pacif ic Islander Alone 6 0.02 10 0.03 14 0.04Some Other Race Alone 14 0.05 16 0.05 19 0.06Two or More Races 521 1.83 679 2.21 808 2.51Households by Age of Householder**Householder Under 25 Years 309 3.00 314 2.79 347 2.91Householder Age 25 - 34 1,743 16.95 1,690 15.02 1,647 13.81Householder Age 35 - 44 2,400 23.34 2,271 20.18 2,262 18.97Householder Age 45 - 54 2,573 25.02 2,558 22.73 2,393 20.07Householder Age 55 - 64 1,859 18.08 2,217 19.70 2,471 20.73Householder Age 65 - 74 954 9.28 1,522 13.52 1,834 15.38Householder Age 75 - 84 317 3.08 515 4.58 790 6.63Householder Age 85 Years and over 127 1.24 166 1.48 177 1.49Median Age of Householder -- 47.63 -- 50.26 -- 52.16
Benchmark: USA Copyright © 2017 by Environics Analytics (EA). Source: Claritas - Pop-Facts Premier 2017, Claritas -Retail Market Power 2017, , Claritas - Consumer Buying Power 2017.

Pop-Facts Demographics Trend | Income TrendsTrade Area: Ramsey, MN
2000 2017 2022Census % Estimate % Projection %
Households by Household IncomeIncome Less Than $15,000 445 5.40 440 3.91 405 3.40Income $15,000 - $24,999 410 4.98 669 5.95 621 5.21Income $25,000 - $34,999 583 7.08 682 6.06 699 5.86Income $35,000 - $49,999 1,236 15.01 1,193 10.60 1,065 8.93Income $50,000 - $74,999 2,612 31.71 2,181 19.38 2,154 18.07Income $75,000 - $99,999 1,619 19.66 1,928 17.13 1,960 16.44Income $100,000 - $124,999 688 8.35 1,504 13.36 1,609 13.50Income $125,000 - $149,999 237 2.88 1,057 9.39 1,222 10.25Income $150,000 - $199,999 234 2.84 1,010 8.97 1,258 10.55Income $200,000 - $249,999 122 1.48 346 3.07 547 4.59Income $250,000 - $499,999 71 0.86 200 1.78 309 2.59Income $500,000 or more 13 0.16 45 0.40 73 0.61Average Household Income -- 76,063.00 -- 93,954.00 -- 102,801.00Median Household Income -- 63,693.63 -- 80,643.95 -- 87,532.75Median HH Inc. by Single-Classification RaceWhite Alone -- 64,151.03 -- 82,115.71 -- 89,123.45Black/African American Alone -- 14,022.20 -- 66,921.23 -- 74,499.99American Indian/Alaskan Native Alone -- 83,778.86 -- 61,030.53 -- 62,162.09Asian Alone -- 62,900.16 -- 63,765.43 -- 75,954.49Native Hawaiian/Pacif ic Islander Alone -- -- -- 75,000.00 -- 83,204.82Some Other Race Alone -- 28,164.97 -- 35,000.00 -- 40,575.24Two or More Races -- 55,481.64 -- 59,058.90 -- 65,543.62Hispanic/Latino -- 50,000.00 -- 71,386.26 -- 77,229.68Not Hispanic/Latino -- 63,833.68 -- 80,756.84 -- 87,626.94
Benchmark: USA Copyright © 2017 by Environics Analytics (EA). Source: Claritas - Pop-Facts Premier 2017, Claritas -Retail Market Power 2017, , Claritas - Consumer Buying Power 2017.

Pop-Facts Demographics Trend | MapTrade Area: Ramsey, MN
TRADE AREA MAP
Benchmark: USA Copyright © 2017 by Environics Analytics (EA). Source: Claritas - Pop-Facts Premier 2017, Claritas -Retail Market Power 2017, , Claritas - Consumer Buying Power 2017.
Leaflet (http://leafletjs.com) | Powered by Esri (https://www.esri.com) | USGS, NOAA

Retail Site Assessment
July 2011
DRAFT

Table of Contents
Selecting Ramsey’s Retail Site .................................................................... 1
Retail Site 1 Analysis .................................................................................... 2
Retail Site 2 Analysis .................................................................................... 4
Appendix A: Leakage and Demand Analysis
Appendix B: Segmentation Guide
Buxton CommunityID Staff
Jennifer Kalil, Business Development Manager, [email protected] Diana Binz, Account Executive, [email protected] Philip Davis, Manager/Senior GIS Analyst, [email protected] Scott Place, Senior GIS Analyst, [email protected] All Buxton personnel may be reached by phone at 817.332.3681 Mosaic® USA is a registered trademark of Experian; Census Data. Data Source: Applied Geographic Solutions, 2000; Census Estimates and Projections 2008 Data. Data Source: Applied Geographic Solutions

1
Selecting Ramsey’s Retail Site To begin the CommunityID process, the City of Ramsey selected two sites to be analyzed for possible retail development or revitalization. The locations of the two sites are shown on the following page. Buxton has examined the retail potential of the two sites based on the following analyses:
• A primary drive‐time trade area was delineated for each site • The customers in each trade area were segmented according to buying habits
and lifestyles • A profile of Ramsey’s customers within each of the two trade areas was
developed • The surplus and leakage for 11 major store types and 49 minor store types
were determined for the trade area The purpose of these analyses is to develop Ramsey’s Customer Profile. The Customer Profile is a snapshot of the customers that reside in Ramsey’s trade area. Even though these consumers are complex and diverse, Buxton is able to capture and catalogue the extent to which potential demand for a retailer’s goods and services are being met within the trade area. By overlaying Ramsey’s Customer Profile with over 4,500 retail matching profiles in Buxton’s proprietary database, we are able to identify major categories of retail that are candidates for location in Ramsey. This matching provides the basis for determining Ramsey’s viability to attract retailers and restaurants and forms the basis for Buxton’s recommendations and conclusions. With this analysis and Buxton’s recommendations, Ramsey can make a more informed decision about investments in infrastructure and can focus resources on areas of higher retail development potential.

lllllllllllllllllllllllllllllllllllllllllllllllllllllllllllllllll
lllllllllllllllllllllllllllllllllllllllllllllllllllllllllllllllll
$
,+
.-
#$
,+
.-
#
RamseyRamseyRamseyRamseyRamseyRamseyRamseyRamseyRamsey
State Hwy 47 & 167th AveState Hwy 47 & 167th AveState Hwy 47 & 167th AveState Hwy 47 & 167th AveState Hwy 47 & 167th AveState Hwy 47 & 167th AveState Hwy 47 & 167th AveState Hwy 47 & 167th AveState Hwy 47 & 167th AveState Hwy 47 & 167th AveState Hwy 47 & 167th AveState Hwy 47 & 167th AveState Hwy 47 & 167th AveState Hwy 47 & 167th AveState Hwy 47 & 167th AveState Hwy 47 & 167th AveState Hwy 47 & 167th AveState Hwy 47 & 167th AveState Hwy 47 & 167th AveState Hwy 47 & 167th AveState Hwy 47 & 167th AveState Hwy 47 & 167th AveState Hwy 47 & 167th AveState Hwy 47 & 167th AveState Hwy 47 & 167th AveState Hwy 47 & 167th AveState Hwy 47 & 167th AveState Hwy 47 & 167th AveState Hwy 47 & 167th AveState Hwy 47 & 167th AveState Hwy 47 & 167th AveState Hwy 47 & 167th AveState Hwy 47 & 167th AveState Hwy 47 & 167th AveState Hwy 47 & 167th AveState Hwy 47 & 167th AveState Hwy 47 & 167th AveState Hwy 47 & 167th AveState Hwy 47 & 167th AveState Hwy 47 & 167th AveState Hwy 47 & 167th AveState Hwy 47 & 167th AveState Hwy 47 & 167th AveState Hwy 47 & 167th AveState Hwy 47 & 167th AveState Hwy 47 & 167th AveState Hwy 47 & 167th AveState Hwy 47 & 167th AveState Hwy 47 & 167th Ave
The Core, 7550 Sunwood Dr NWThe Core, 7550 Sunwood Dr NWThe Core, 7550 Sunwood Dr NWThe Core, 7550 Sunwood Dr NWThe Core, 7550 Sunwood Dr NWThe Core, 7550 Sunwood Dr NWThe Core, 7550 Sunwood Dr NWThe Core, 7550 Sunwood Dr NWThe Core, 7550 Sunwood Dr NWThe Core, 7550 Sunwood Dr NWThe Core, 7550 Sunwood Dr NWThe Core, 7550 Sunwood Dr NWThe Core, 7550 Sunwood Dr NWThe Core, 7550 Sunwood Dr NWThe Core, 7550 Sunwood Dr NWThe Core, 7550 Sunwood Dr NWThe Core, 7550 Sunwood Dr NWThe Core, 7550 Sunwood Dr NWThe Core, 7550 Sunwood Dr NWThe Core, 7550 Sunwood Dr NWThe Core, 7550 Sunwood Dr NWThe Core, 7550 Sunwood Dr NWThe Core, 7550 Sunwood Dr NWThe Core, 7550 Sunwood Dr NWThe Core, 7550 Sunwood Dr NWThe Core, 7550 Sunwood Dr NWThe Core, 7550 Sunwood Dr NWThe Core, 7550 Sunwood Dr NWThe Core, 7550 Sunwood Dr NWThe Core, 7550 Sunwood Dr NWThe Core, 7550 Sunwood Dr NWThe Core, 7550 Sunwood Dr NWThe Core, 7550 Sunwood Dr NWThe Core, 7550 Sunwood Dr NWThe Core, 7550 Sunwood Dr NWThe Core, 7550 Sunwood Dr NWThe Core, 7550 Sunwood Dr NWThe Core, 7550 Sunwood Dr NWThe Core, 7550 Sunwood Dr NWThe Core, 7550 Sunwood Dr NWThe Core, 7550 Sunwood Dr NWThe Core, 7550 Sunwood Dr NWThe Core, 7550 Sunwood Dr NWThe Core, 7550 Sunwood Dr NWThe Core, 7550 Sunwood Dr NWThe Core, 7550 Sunwood Dr NWThe Core, 7550 Sunwood Dr NWThe Core, 7550 Sunwood Dr NWThe Core, 7550 Sunwood Dr NW
RamseyRamseyRamseyRamseyRamseyRamseyRamseyRamseyRamsey
AnokaAnokaAnokaAnokaAnokaAnokaAnokaAnokaAnoka
DaytonDaytonDaytonDaytonDaytonDaytonDaytonDaytonDayton
State Hwy 47 & 167th AveState Hwy 47 & 167th AveState Hwy 47 & 167th AveState Hwy 47 & 167th AveState Hwy 47 & 167th AveState Hwy 47 & 167th AveState Hwy 47 & 167th AveState Hwy 47 & 167th AveState Hwy 47 & 167th AveState Hwy 47 & 167th AveState Hwy 47 & 167th AveState Hwy 47 & 167th AveState Hwy 47 & 167th AveState Hwy 47 & 167th AveState Hwy 47 & 167th AveState Hwy 47 & 167th AveState Hwy 47 & 167th AveState Hwy 47 & 167th AveState Hwy 47 & 167th AveState Hwy 47 & 167th AveState Hwy 47 & 167th AveState Hwy 47 & 167th AveState Hwy 47 & 167th AveState Hwy 47 & 167th AveState Hwy 47 & 167th AveState Hwy 47 & 167th AveState Hwy 47 & 167th AveState Hwy 47 & 167th AveState Hwy 47 & 167th AveState Hwy 47 & 167th AveState Hwy 47 & 167th AveState Hwy 47 & 167th AveState Hwy 47 & 167th AveState Hwy 47 & 167th AveState Hwy 47 & 167th AveState Hwy 47 & 167th AveState Hwy 47 & 167th AveState Hwy 47 & 167th AveState Hwy 47 & 167th AveState Hwy 47 & 167th AveState Hwy 47 & 167th AveState Hwy 47 & 167th AveState Hwy 47 & 167th AveState Hwy 47 & 167th AveState Hwy 47 & 167th AveState Hwy 47 & 167th AveState Hwy 47 & 167th AveState Hwy 47 & 167th AveState Hwy 47 & 167th Ave
The Core, 7550 Sunwood Dr NWThe Core, 7550 Sunwood Dr NWThe Core, 7550 Sunwood Dr NWThe Core, 7550 Sunwood Dr NWThe Core, 7550 Sunwood Dr NWThe Core, 7550 Sunwood Dr NWThe Core, 7550 Sunwood Dr NWThe Core, 7550 Sunwood Dr NWThe Core, 7550 Sunwood Dr NWThe Core, 7550 Sunwood Dr NWThe Core, 7550 Sunwood Dr NWThe Core, 7550 Sunwood Dr NWThe Core, 7550 Sunwood Dr NWThe Core, 7550 Sunwood Dr NWThe Core, 7550 Sunwood Dr NWThe Core, 7550 Sunwood Dr NWThe Core, 7550 Sunwood Dr NWThe Core, 7550 Sunwood Dr NWThe Core, 7550 Sunwood Dr NWThe Core, 7550 Sunwood Dr NWThe Core, 7550 Sunwood Dr NWThe Core, 7550 Sunwood Dr NWThe Core, 7550 Sunwood Dr NWThe Core, 7550 Sunwood Dr NWThe Core, 7550 Sunwood Dr NWThe Core, 7550 Sunwood Dr NWThe Core, 7550 Sunwood Dr NWThe Core, 7550 Sunwood Dr NWThe Core, 7550 Sunwood Dr NWThe Core, 7550 Sunwood Dr NWThe Core, 7550 Sunwood Dr NWThe Core, 7550 Sunwood Dr NWThe Core, 7550 Sunwood Dr NWThe Core, 7550 Sunwood Dr NWThe Core, 7550 Sunwood Dr NWThe Core, 7550 Sunwood Dr NWThe Core, 7550 Sunwood Dr NWThe Core, 7550 Sunwood Dr NWThe Core, 7550 Sunwood Dr NWThe Core, 7550 Sunwood Dr NWThe Core, 7550 Sunwood Dr NWThe Core, 7550 Sunwood Dr NWThe Core, 7550 Sunwood Dr NWThe Core, 7550 Sunwood Dr NWThe Core, 7550 Sunwood Dr NWThe Core, 7550 Sunwood Dr NWThe Core, 7550 Sunwood Dr NWThe Core, 7550 Sunwood Dr NWThe Core, 7550 Sunwood Dr NW
1010
169169
4747
2651 S. Polaris Dr. Fort Worth, Texas 76137 tel: 817.332.3681 fax:817.332.3686 e-mail:[email protected] http://www.buxtonco.com
Shopping CentersGLA in thousands
1000+
500 to 1000
"Mosaic® USA is a registered trademark of Experian" "National Business Database Source: Experian" "Census Estimates and Projections 2008 Data. Data Source: Applied Geographic Solutions""Source:2011 usretailcenters.com/theretailplanet.com."
Ramsey, Minnesota: Overview
City Limits
Site 1lllllllllllllllllllllllllllllllllllllllllllllllll
Site 2lllllllllllllllllllllllllllllllllllllllllllllllll
N
0 10.5
Miles

lllllllllllllllllllllllllllllllllllllllllllllllllllllllllllllllll&%
$#
,+
$#
&%
$#
,+
$#
43
AnokaAnokaAnokaAnokaAnokaAnokaAnokaAnokaAnoka
DaytonDaytonDaytonDaytonDaytonDaytonDaytonDaytonDayton
AndoverAndoverAndoverAndoverAndoverAndoverAndoverAndoverAndoverRamseyRamseyRamseyRamseyRamseyRamseyRamseyRamseyRamsey
St. FrancisSt. FrancisSt. FrancisSt. FrancisSt. FrancisSt. FrancisSt. FrancisSt. FrancisSt. FrancisBethelBethelBethelBethelBethelBethelBethelBethelBethel
Oak GroveOak GroveOak GroveOak GroveOak GroveOak GroveOak GroveOak GroveOak Grove
RIVERDALE VILLAGERIVERDALE VILLAGERIVERDALE VILLAGERIVERDALE VILLAGERIVERDALE VILLAGERIVERDALE VILLAGERIVERDALE VILLAGERIVERDALE VILLAGERIVERDALE VILLAGERIVERDALE COMMONSRIVERDALE COMMONSRIVERDALE COMMONSRIVERDALE COMMONSRIVERDALE COMMONSRIVERDALE COMMONSRIVERDALE COMMONSRIVERDALE COMMONSRIVERDALE COMMONS
State Hwy 47 & 167th AveState Hwy 47 & 167th AveState Hwy 47 & 167th AveState Hwy 47 & 167th AveState Hwy 47 & 167th AveState Hwy 47 & 167th AveState Hwy 47 & 167th AveState Hwy 47 & 167th AveState Hwy 47 & 167th AveState Hwy 47 & 167th AveState Hwy 47 & 167th AveState Hwy 47 & 167th AveState Hwy 47 & 167th AveState Hwy 47 & 167th AveState Hwy 47 & 167th AveState Hwy 47 & 167th AveState Hwy 47 & 167th AveState Hwy 47 & 167th AveState Hwy 47 & 167th AveState Hwy 47 & 167th AveState Hwy 47 & 167th AveState Hwy 47 & 167th AveState Hwy 47 & 167th AveState Hwy 47 & 167th AveState Hwy 47 & 167th AveState Hwy 47 & 167th AveState Hwy 47 & 167th AveState Hwy 47 & 167th AveState Hwy 47 & 167th AveState Hwy 47 & 167th AveState Hwy 47 & 167th AveState Hwy 47 & 167th AveState Hwy 47 & 167th AveState Hwy 47 & 167th AveState Hwy 47 & 167th AveState Hwy 47 & 167th AveState Hwy 47 & 167th AveState Hwy 47 & 167th AveState Hwy 47 & 167th AveState Hwy 47 & 167th AveState Hwy 47 & 167th AveState Hwy 47 & 167th AveState Hwy 47 & 167th AveState Hwy 47 & 167th AveState Hwy 47 & 167th AveState Hwy 47 & 167th AveState Hwy 47 & 167th AveState Hwy 47 & 167th AveState Hwy 47 & 167th Ave
4747
1010
4747
101101
94
2651 S. Polaris Dr. Fort Worth, Texas 76137 tel: 817.332.3681 fax:817.332.3686 e-mail:[email protected] http://www.buxtonco.com
Shopping CentersGLA in thousands
1000+
500 to 1000
"Mosaic® USA is a registered trademark of Experian" "National Business Database Source: Experian" "Census Estimates and Projections 2008 Data. Data Source: Applied Geographic Solutions""Source:2011 usretailcenters.com/theretailplanet.com."
Ramsey, Minnesota: Trade Area
Site 1lllllllllllllllllllllllllllllllllllllllllllllllll
N
12 Minute Drive Time
0 21
Miles

2
Site 1 Analysis: State Highway 47 & 167th Avenue Drive‐Time Trade Area The map on the previous page depicts the primary trade area for Site 1. The primary trade area consists of a twelve‐minute polygon, determined by Buxton’s proprietary drive‐time technology. Psychographics The psychographic profile of the households within a twelve‐minute drive‐time of Site 1 is presented below.
Mosaic® USA is a registered trademark of Experian; Census Data. Data Source: Applied Geographic Solutions, 2000: Census Estimates and Projections 2008 Data
Dominant Segments A segment that represents at least three percent of a trade area is a dominant segment. By determining dominant segments and reviewing their segment descriptions, lifestyle habits and preferences can be identified. Please refer to Appendix C for additional segment description information.
Dominant Segments Description HouseholdsA06 Small‐town Success 5,050
A07 New Suburbia Families 3,786
B03 Urban Commuter Families 1,249
B05 Second‐generation Success 711
C02 Prime Middle America 1,208
C04 Family Convenience 741
F01 Steadfast Conservatives 999
F02 Moderate Conventionalists 581
H03 Stable Careers 639
K04 Urban Diversity 822 Mosaic® USA is a registered trademark of Experian; Census Data. Data Source: Applied Geographic Solutions, 2000: Census Estimates and Projections 2008 Data

3
Site 1 Analysis (continued) Leakage Analysis The following table represents an overview by store type of the leakage or surplus within the studied trade area. This is represented by an index with 1.0 being the baseline. A leakage is reflected by an index less than 1.0 and a surplus is reflected by an index greater than 1.0. Please see Appendix A for detailed demand and actual sales by category.
Source: Mosaic® USA is a registered trademark of Experian; Census Data. Data Source: Applied Geographic Solutions, 2000: Census Estimates and Projections 2008 Data
The following table presents the trade potential variables for Site 1:
Leakage ($197,192,421)
Total Demand $629,316,309
Total Supply $432,123,888
Number of Households in Dominant Segments 15,786
Traffic Count 9,600
Trade Potential Variables Site 1
Estimated Household Count 18,678
Mosaic® USA is a registered trademark of Experian; Census Data. Data Source: Applied Geographic Solutions, 2000: Census Estimates and Projections 2008 Data

lllllllllllllllllllllllllllllllllllllllllllllllllllllllllllllllll
&%
$
,+
.-#
&
,+
%.-
&%
$
,+
.-#
&
,+
%.-
RIVERDALE COMMONSRIVERDALE COMMONSRIVERDALE COMMONSRIVERDALE COMMONSRIVERDALE COMMONSRIVERDALE COMMONSRIVERDALE COMMONSRIVERDALE COMMONSRIVERDALE COMMONS
RIVERDALE VILLAGERIVERDALE VILLAGERIVERDALE VILLAGERIVERDALE VILLAGERIVERDALE VILLAGERIVERDALE VILLAGERIVERDALE VILLAGERIVERDALE VILLAGERIVERDALE VILLAGE
The Core, 7550 Sunwood Dr NWThe Core, 7550 Sunwood Dr NWThe Core, 7550 Sunwood Dr NWThe Core, 7550 Sunwood Dr NWThe Core, 7550 Sunwood Dr NWThe Core, 7550 Sunwood Dr NWThe Core, 7550 Sunwood Dr NWThe Core, 7550 Sunwood Dr NWThe Core, 7550 Sunwood Dr NWThe Core, 7550 Sunwood Dr NWThe Core, 7550 Sunwood Dr NWThe Core, 7550 Sunwood Dr NWThe Core, 7550 Sunwood Dr NWThe Core, 7550 Sunwood Dr NWThe Core, 7550 Sunwood Dr NWThe Core, 7550 Sunwood Dr NWThe Core, 7550 Sunwood Dr NWThe Core, 7550 Sunwood Dr NWThe Core, 7550 Sunwood Dr NWThe Core, 7550 Sunwood Dr NWThe Core, 7550 Sunwood Dr NWThe Core, 7550 Sunwood Dr NWThe Core, 7550 Sunwood Dr NWThe Core, 7550 Sunwood Dr NWThe Core, 7550 Sunwood Dr NWThe Core, 7550 Sunwood Dr NWThe Core, 7550 Sunwood Dr NWThe Core, 7550 Sunwood Dr NWThe Core, 7550 Sunwood Dr NWThe Core, 7550 Sunwood Dr NWThe Core, 7550 Sunwood Dr NWThe Core, 7550 Sunwood Dr NWThe Core, 7550 Sunwood Dr NWThe Core, 7550 Sunwood Dr NWThe Core, 7550 Sunwood Dr NWThe Core, 7550 Sunwood Dr NWThe Core, 7550 Sunwood Dr NWThe Core, 7550 Sunwood Dr NWThe Core, 7550 Sunwood Dr NWThe Core, 7550 Sunwood Dr NWThe Core, 7550 Sunwood Dr NWThe Core, 7550 Sunwood Dr NWThe Core, 7550 Sunwood Dr NWThe Core, 7550 Sunwood Dr NWThe Core, 7550 Sunwood Dr NWThe Core, 7550 Sunwood Dr NWThe Core, 7550 Sunwood Dr NWThe Core, 7550 Sunwood Dr NWThe Core, 7550 Sunwood Dr NW
ChamplinChamplinChamplinChamplinChamplinChamplinChamplinChamplinChamplin
RamseyRamseyRamseyRamseyRamseyRamseyRamseyRamseyRamsey
AnokaAnokaAnokaAnokaAnokaAnokaAnokaAnokaAnoka
DaytonDaytonDaytonDaytonDaytonDaytonDaytonDaytonDayton
RogersRogersRogersRogersRogersRogersRogersRogersRogersRIVERDALE COMMONSRIVERDALE COMMONSRIVERDALE COMMONSRIVERDALE COMMONSRIVERDALE COMMONSRIVERDALE COMMONSRIVERDALE COMMONSRIVERDALE COMMONSRIVERDALE COMMONS
RIVERDALE VILLAGERIVERDALE VILLAGERIVERDALE VILLAGERIVERDALE VILLAGERIVERDALE VILLAGERIVERDALE VILLAGERIVERDALE VILLAGERIVERDALE VILLAGERIVERDALE VILLAGE
The Core, 7550 Sunwood Dr NWThe Core, 7550 Sunwood Dr NWThe Core, 7550 Sunwood Dr NWThe Core, 7550 Sunwood Dr NWThe Core, 7550 Sunwood Dr NWThe Core, 7550 Sunwood Dr NWThe Core, 7550 Sunwood Dr NWThe Core, 7550 Sunwood Dr NWThe Core, 7550 Sunwood Dr NWThe Core, 7550 Sunwood Dr NWThe Core, 7550 Sunwood Dr NWThe Core, 7550 Sunwood Dr NWThe Core, 7550 Sunwood Dr NWThe Core, 7550 Sunwood Dr NWThe Core, 7550 Sunwood Dr NWThe Core, 7550 Sunwood Dr NWThe Core, 7550 Sunwood Dr NWThe Core, 7550 Sunwood Dr NWThe Core, 7550 Sunwood Dr NWThe Core, 7550 Sunwood Dr NWThe Core, 7550 Sunwood Dr NWThe Core, 7550 Sunwood Dr NWThe Core, 7550 Sunwood Dr NWThe Core, 7550 Sunwood Dr NWThe Core, 7550 Sunwood Dr NWThe Core, 7550 Sunwood Dr NWThe Core, 7550 Sunwood Dr NWThe Core, 7550 Sunwood Dr NWThe Core, 7550 Sunwood Dr NWThe Core, 7550 Sunwood Dr NWThe Core, 7550 Sunwood Dr NWThe Core, 7550 Sunwood Dr NWThe Core, 7550 Sunwood Dr NWThe Core, 7550 Sunwood Dr NWThe Core, 7550 Sunwood Dr NWThe Core, 7550 Sunwood Dr NWThe Core, 7550 Sunwood Dr NWThe Core, 7550 Sunwood Dr NWThe Core, 7550 Sunwood Dr NWThe Core, 7550 Sunwood Dr NWThe Core, 7550 Sunwood Dr NWThe Core, 7550 Sunwood Dr NWThe Core, 7550 Sunwood Dr NWThe Core, 7550 Sunwood Dr NWThe Core, 7550 Sunwood Dr NWThe Core, 7550 Sunwood Dr NWThe Core, 7550 Sunwood Dr NWThe Core, 7550 Sunwood Dr NWThe Core, 7550 Sunwood Dr NW
1010
169169
4747
5252
169169
278278
101101
2651 S. Polaris Dr. Fort Worth, Texas 76137 tel: 817.332.3681 fax:817.332.3686 e-mail:[email protected] http://www.buxtonco.com
Shopping CentersGLA in thousands
1000+
500 to 1000
"Mosaic® USA is a registered trademark of Experian" "National Business Database Source: Experian" "Census Estimates and Projections 2008 Data. Data Source: Applied Geographic Solutions""Source:2011 usretailcenters.com/theretailplanet.com."
Ramsey, Minnesota: Trade Area
Site 2lllllllllllllllllllllllllllllllllllllllllllllllll
N
12 Minute Drive Time
0 21
Miles

4
Site 2 Analysis: 7550 Sunwood Drive NW Drive‐Time Trade Area The map on the previous page depicts the primary trade area for Site 2. The primary trade area consists of a twelve‐minute polygon, determined by Buxton’s proprietary drive‐time technology. Psychographics The psychographic profile of the households within a twelve‐minute drive‐time of Site 2 is presented below.
Mosaic® USA is a registered trademark of Experian; Census Data. Data Source: Applied Geographic Solutions, 2000: Census Estimates and Projections 2008 Data
Dominant Segments A segment that represents at least three percent of a trade area is a dominant segment. By determining dominant segments and reviewing their segment descriptions, lifestyle habits and preferences can be identified. Please refer to Appendix C for additional segment description information.
Dominant Segments Description HouseholdsA06 Small‐town Success 2,188
A07 New Suburbia Families 2,812
B03 Urban Commuter Families 1,158
B06 Successful Suburbia 430
C02 Prime Middle America 669
F01 Steadfast Conservatives 1,074
F02 Moderate Conventionalists 613
H03 Stable Careers 742
K04 Urban Diversity 973 Mosaic® USA is a registered trademark of Experian; Census Data. Data Source: Applied Geographic Solutions, 2000: Census Estimates and Projections 2008 Data
5
Site 2 Analysis (continued) Leakage Analysis
The following table represents an overview by store type of the leakage or surplus within the studied trade area. This is represented by an index with 1.0 being the baseline. A leakage is reflected by an index less than 1.0 and a surplus is reflected by an index greater than 1.0. Please see Appendix A for detailed demand and actual sales by category.
Mosaic® USA is a registered trademark of Experian; Census Data. Data Source: Applied Geographic Solutions, 2000: Census Estimates and Projections 2008 Data
The following table presents the trade potential variables for Site 2:
Surplus $219,949,916
Total Demand $955,227,451
Total Supply $1,175,177,367
Number of Households in Dominant Segments 10,659
Traffic Count 37,500
Trade Potential Variables Site 2
Estimated Household Count 13,514
Mosaic® USA is a registered trademark of Experian; Census Data. Data Source: Applied Geographic Solutions, 2000: Census Estimates and Projections 2008 Data

6
Site Comparison Trade Area Segmentation
This side by side comparison of the two trade areas shows the compositions and characteristics of the households to be very similar. This is not unusual and can be expected in an area with potential sites in close proximity.
Mosaic® USA is a registered trademark of Experian; Census Data. Data Source: Applied Geographic Solutions, 2000: Census Estimates and Projections 2008 Data
12‐ Minute Trade Area Statistics
Leakage/Surplus ($197,192,421) $219,949,916
Total Demand $629,316,309 $955,227,451
Total Supply $432,123,888 $1,175,177,367
Number of Households in Dominant Segments 15,786 10,659
Traffic Count 9,600 37,500
Trade Potential Variables Site 1 Site 2
Estimated Household Count 18,678 13,514
Mosaic® USA is a registered trademark of Experian; Census Data. Data Source: Applied Geographic Solutions, 2000: Census Estimates and Projections 2008 Data

Appendix A:
Leakage Analysis

Retail Leakage and Surplus Analysis
The Retail Leakage and Surplus Analysis examines the quantitative aspect of the community's retail opportunities. It is a guide to understanding retail opportunities but it is not an analysis that indicates unconditional opportunities. The analysis is sometimes called "a gap analysis" or "a supply and demand analysis" and can aid in the following:
-Indicating how well the retail needs of local residents are being met-Uncovering unmet demand and possible opportunities-Understanding the strengths and weaknesses of the local retail sector-Measuring the difference between actual and potential retail sales
Understanding Retail Leakage
Retail leakage means that residents are spending more for products than local businesses capture. Retail sales leakage suggests that there is unmet demand in the trade area and that the community can support additional store space for that type of business.
However, retail leakage does not necessarily translate into opportunity. For example, there could be a strong competitor in a neighboring community that dominates the market for that type of product or store.
Understanding Retail Surplus
A retail surplus means that the community's trade area is capturing the local market plus attracting non-local shoppers. A retail surplus does not necessarily mean that the community cannot support additional business. Many communities have developed strong clusters of stores that have broad geographic appeal. Examples of these types of retailers include: sporting goods stores, home furnishing stores, restaurants, and other specialty operations that become destination retailers and draw customers from outside the trade area.
Examining the quantitative aspects (Leakage/Surplus) is only part of the evaluation of community's retail opportunities. Before any conclusions can be drawn about potential business expansion or recruitment opportunities, qualitative considerations such as trade area psychographics and buying habits must be analyzed in context of other market factors.
Interpreting Leakage Index
1.0 = equilibrium, meaning that demand and sales in the area being analyzed are in balance.
.80 = demand exceeds sales by 20%, meaning that consumers are leaving the area being analyzed.
1.2 = sales exceed demand by 20%, meaning that consumers are coming from outside the area being analyzed.

STATE HWY 47 & 167TH AVE NW, RAMSEY, MN 55303 (12 minute drive time)
Retail Leakage and Surplus Analysis
Buxton2651 South Polaris DriveFort Worth, TX 76137
07/21/2011
Tel: 817.332.3681Fax: 817.332.3686www.buxtonco.com
2 of 14
Data Sources: Applied Geographic Solutions, Inc., Copyright 2009
Leakage/Surplus Index by Major Store Type
The quantitative comparison of retail leakage and surplus in the twelve major store types shown in the chart and table below provides an initial measure of market opportunities. Combining this analysis with the knowledge of the local retail situation will take the process of identifying retail possibilities one step further.
Figure 1 provides the leakage/surplus indices and following is the sales potential and actual sales for major store types.
Figure 1. Leakage/Surplus Index and Actual and Potential Sales by Major Store Types
Store Type Potential Actual Sales LeakageMotor Vehicle Parts & Dealers 149,660,406 179,996,510 1.2Furniture & Home Furnishing Stores 20,483,996 32,254,984 1.6Electronics & Appliance Stores 18,142,728 4,881,670 0.3Building Material & Garden Equipment & Supply Dealers 95,030,755 55,623,887 0.6Food & Beverage Stores 82,693,348 33,582,484 0.4Health & Personal Care Stores 32,900,745 23,862,895 0.7Clothing & Clothing Accessories Stores 37,271,242 6,637,591 0.2Sporting Goods, Hobby, Book, & Music Stores 14,909,907 8,496,836 0.6General Merchandise Stores 90,365,546 33,130,570 0.4Miscellaneous Store Retailers 19,917,598 20,599,947 1.0Foodservice & Drinking Places 67,940,038 33,056,514 0.5
Total 629,316,309 432,123,888 0.7

STATE HWY 47 & 167TH AVE NW, RAMSEY, MN 55303 (12 minute drive time)
Retail Leakage and Surplus Analysis
Buxton2651 South Polaris DriveFort Worth, TX 76137
07/21/2011
Tel: 817.332.3681Fax: 817.332.3686www.buxtonco.com
3 of 14
Data Sources: Applied Geographic Solutions, Inc., Copyright 2009
Sub-Categories of Motor Vehicle Parts & Dealers
Store Type Potential Actual Sales LeakageExpenditures at Automotive Dealers 129,146,720 140,545,858 1.1Expenditures at Other Motor Vehicle Dealers 9,488,263 31,577,770 3.3Expenditures at Automotive Parts, Accessories, and Tire Stores 11,025,422 7,872,882 0.7
Total Motor Vehicle Parts & Dealers 149,660,406 179,996,510 1.2

STATE HWY 47 & 167TH AVE NW, RAMSEY, MN 55303 (12 minute drive time)
Retail Leakage and Surplus Analysis
Buxton2651 South Polaris DriveFort Worth, TX 76137
07/21/2011
Tel: 817.332.3681Fax: 817.332.3686www.buxtonco.com
4 of 14
Data Sources: Applied Geographic Solutions, Inc., Copyright 2009
Sub-Categories of Furniture & Home Furnishing Stores
Store Type Potential Actual Sales LeakageExpenditures at Furniture Stores 10,789,586 20,413,743 1.9Expenditures at Home Furnishing Stores 9,694,410 11,841,241 1.2
Total Furniture & Home Furnishing Stores 20,483,996 32,254,984 1.6

STATE HWY 47 & 167TH AVE NW, RAMSEY, MN 55303 (12 minute drive time)
Retail Leakage and Surplus Analysis
Buxton2651 South Polaris DriveFort Worth, TX 76137
07/21/2011
Tel: 817.332.3681Fax: 817.332.3686www.buxtonco.com
5 of 14
Data Sources: Applied Geographic Solutions, Inc., Copyright 2009
Sub-Categories of Electronics & Appliance Stores
Store Type Potential Actual Sales LeakageExpenditures at Appliance, Television, and Other Electronics Stores 13,631,944 4,017,476 0.3Expenditures at Computer and Software Stores 3,752,604 788,295 0.2Expenditures at Camera and Photographic Equipment Stores 758,179 75,899 0.1
Total Electronics & Appliance Stores 18,142,728 4,881,670 0.3

STATE HWY 47 & 167TH AVE NW, RAMSEY, MN 55303 (12 minute drive time)
Retail Leakage and Surplus Analysis
Buxton2651 South Polaris DriveFort Worth, TX 76137
07/21/2011
Tel: 817.332.3681Fax: 817.332.3686www.buxtonco.com
6 of 14
Data Sources: Applied Geographic Solutions, Inc., Copyright 2009
Sub-Categories of Building Material & Garden Equipment & Supply Dealers
Store Type Potential Actual Sales LeakageExpenditures at Home Centers 34,575,783 12,371,415 0.4Expenditures at Paint and Wallpaper Stores 1,958,246 0 0.0Expenditures at Hardware Stores 6,934,600 13,533,357 2.0Expenditures at Other Building Materials Dealers 44,049,036 26,201,508 0.6Expenditures at Outdoor Power Equipment Stores 1,100,267 1,054,116 1.0Expenditures at Nursery and Garden Centers 6,412,824 2,463,490 0.4
Total Building Material & Garden Equipment & Supply Dealers 95,030,755 55,623,887 0.6

STATE HWY 47 & 167TH AVE NW, RAMSEY, MN 55303 (12 minute drive time)
Retail Leakage and Surplus Analysis
Buxton2651 South Polaris DriveFort Worth, TX 76137
07/21/2011
Tel: 817.332.3681Fax: 817.332.3686www.buxtonco.com
7 of 14
Data Sources: Applied Geographic Solutions, Inc., Copyright 2009
Sub-Categories of Food & Beverage Stores
Store Type Potential Actual Sales LeakageExpenditures at Supermarkets and Other Grocery (except Convenience) Stores 70,980,489 26,613,050 0.4Expenditures at Convenience Stores 3,969,048 748,888 0.2Expenditures at Specialty Food Stores 2,285,507 770,966 0.3Expenditures at Beer, Wine, and Liquor Stores 5,458,304 5,449,580 1.0
Total Food & Beverage Stores 82,693,348 33,582,484 0.4

STATE HWY 47 & 167TH AVE NW, RAMSEY, MN 55303 (12 minute drive time)
Retail Leakage and Surplus Analysis
Buxton2651 South Polaris DriveFort Worth, TX 76137
07/21/2011
Tel: 817.332.3681Fax: 817.332.3686www.buxtonco.com
8 of 14
Data Sources: Applied Geographic Solutions, Inc., Copyright 2009
Sub-Categories of Health & Personal Care Stores
Store Type Potential Actual Sales LeakageExpenditures at Pharmacies and Drug Stores 28,291,074 21,317,149 0.8Expenditures at Cosmetics, Beauty Supplies and Perfume Stores 1,090,245 0 0.0Expenditures at Optical Goods Stores 1,581,756 260,747 0.2Expenditures at Other Health and Personal Care Stores 1,937,669 2,284,999 1.2
Total Health & Personal Care Stores 32,900,745 23,862,895 0.7

STATE HWY 47 & 167TH AVE NW, RAMSEY, MN 55303 (12 minute drive time)
Retail Leakage and Surplus Analysis
Buxton2651 South Polaris DriveFort Worth, TX 76137
07/21/2011
Tel: 817.332.3681Fax: 817.332.3686www.buxtonco.com
9 of 14
Data Sources: Applied Geographic Solutions, Inc., Copyright 2009
Sub-Categories of Clothing & Clothing Accessories Stores
Store Type Potential Actual Sales LeakageExpenditures at Men's Clothing Stores 1,736,422 1,067,917 0.6Expenditures at Women's Clothing Stores 6,864,316 3,415,189 0.5Expenditures at Children's and Infants' Clothing Stores 1,443,296 0 0.0Expenditures at Family Clothing Stores 14,380,184 817,601 0.1Expenditures at Clothing Accessories Stores 627,446 12,609 0.0Expenditures at Other Clothing Stores 1,733,329 244,238 0.1Expenditures at Shoe Stores 4,803,863 843,791 0.2Expenditures at Jewelry Stores 5,244,567 236,245 0.0Expenditures at Luggage, and Leather Goods Stores 437,819 0 0.0
Total Clothing & Clothing Accessories Stores 37,271,242 6,637,591 0.2

STATE HWY 47 & 167TH AVE NW, RAMSEY, MN 55303 (12 minute drive time)
Retail Leakage and Surplus Analysis
Buxton2651 South Polaris DriveFort Worth, TX 76137
07/21/2011
Tel: 817.332.3681Fax: 817.332.3686www.buxtonco.com
10 of 14
Data Sources: Applied Geographic Solutions, Inc., Copyright 2009
Sub-Categories of Sporting Goods, Hobby, Book, & Music Stores
Store Type Potential Actual Sales LeakageExpenditures at Sporting Goods Stores 5,569,216 5,491,546 1.0Expenditures at Hobby, Toys and Games Stores 3,314,160 1,304,947 0.4Expenditures at Sew/Needlework/Piece Goods Stores 749,262 889,467 1.2Expenditures at Musical Instrument and Supplies Stores 947,358 342,258 0.4Expenditures at Book Stores and News Dealers 2,922,860 356,402 0.1Expenditures at Prerecorded Tape, Compact Disc, and Record Stores 1,407,051 112,217 0.1
Total Sporting Goods, Hobby, Book, & Music Stores 14,909,907 8,496,836 0.6

STATE HWY 47 & 167TH AVE NW, RAMSEY, MN 55303 (12 minute drive time)
Retail Leakage and Surplus Analysis
Buxton2651 South Polaris DriveFort Worth, TX 76137
07/21/2011
Tel: 817.332.3681Fax: 817.332.3686www.buxtonco.com
11 of 14
Data Sources: Applied Geographic Solutions, Inc., Copyright 2009
Sub-Categories of General Merchandise Stores
Store Type Potential Actual Sales LeakageExpenditures at Department Stores excluding leased depts. 44,271,577 31,197,433 0.7Expenditures at Warehouse Clubs and Super Stores 39,204,104 436,278 0.0Expenditures at All Other General Merchandise Stores 6,889,865 1,496,860 0.2
Total General Merchandise Stores 90,365,546 33,130,570 0.4

STATE HWY 47 & 167TH AVE NW, RAMSEY, MN 55303 (12 minute drive time)
Retail Leakage and Surplus Analysis
Buxton2651 South Polaris DriveFort Worth, TX 76137
07/21/2011
Tel: 817.332.3681Fax: 817.332.3686www.buxtonco.com
12 of 14
Data Sources: Applied Geographic Solutions, Inc., Copyright 2009
Sub-Categories of Miscellaneous Store Retailers
Store Type Potential Actual Sales LeakageExpenditures at Florists 1,470,743 1,530,956 1.0Expenditures at Office Supplies and Stationery Stores 4,529,564 4,806,945 1.1Expenditures at Gift, Novelty, and Souvenir Stores 3,491,790 4,309,653 1.2Expenditures at Used Merchandise Stores 1,717,028 933,518 0.5Expenditures at Other Miscellaneous Store Retailers 8,708,474 9,018,875 1.0
Total Miscellaneous Store Retailers 19,917,598 20,599,947 1.0

STATE HWY 47 & 167TH AVE NW, RAMSEY, MN 55303 (12 minute drive time)
Retail Leakage and Surplus Analysis
Buxton2651 South Polaris DriveFort Worth, TX 76137
07/21/2011
Tel: 817.332.3681Fax: 817.332.3686www.buxtonco.com
13 of 14
Data Sources: Applied Geographic Solutions, Inc., Copyright 2009
Sub-Categories of Foodservice & Drinking Places
Store Type Potential Actual Sales LeakageExpenditures at Full-service Restaurants 31,323,828 7,123,431 0.2Expenditures at Limited-service Eating Places 27,507,668 21,169,395 0.8Expenditures at Special Foodservices 5,676,962 4,229,978 0.7Expenditures at Drinking Places -Alcoholic Beverages 3,431,581 533,710 0.2
Total Foodservice & Drinking Places 67,940,038 33,056,514 0.5

STATE HWY 47 & 167TH AVE NW, RAMSEY, MN 55303 (12 minute drive time)
Retail Leakage and Surplus Analysis
Buxton2651 South Polaris DriveFort Worth, TX 76137
07/21/2011
Tel: 817.332.3681Fax: 817.332.3686www.buxtonco.com
14 of 14
Data Sources: Applied Geographic Solutions, Inc., Copyright 2009
Sources and Methodology
The primary data sources used in the construction of the database include:
• Current year AGS (Applied Geographic Solutions) Consumer Expenditure Estimates• Census of Retail Trade, Merchandise Line Sales• Census Bureau Monthly Retail Trade
The Census of Retail Trade presents a table known as the Merchandise Line summary, which relates approximately 120 merchandise lines (e.g. hardware) to each of the store types. For each merchandise line, the distribution of sales by store type can be computed, yielding a conversion table which apportions merchandise line sales by store type.
The AGS (Applied Geographic Solutions) Consumer Expenditure database was re-computed to these merchandise lines by aggregating both whole and partial categories, yielding, at the block group level, a series of merchandise line estimates which are consistent with the AGS Consumer Expenditure database.
These two components were then combined in order to derive estimated potential by store type. The results were then compared to current retail trade statistics to ensure consistency and completeness.

Retail Leakage and Surplus Analysis
The Retail Leakage and Surplus Analysis examines the quantitative aspect of the community's retail opportunities. It is a guide to understanding retail opportunities but it is not an analysis that indicates unconditional opportunities. The analysis is sometimes called "a gap analysis" or "a supply and demand analysis" and can aid in the following:
-Indicating how well the retail needs of local residents are being met-Uncovering unmet demand and possible opportunities-Understanding the strengths and weaknesses of the local retail sector-Measuring the difference between actual and potential retail sales
Understanding Retail Leakage
Retail leakage means that residents are spending more for products than local businesses capture. Retail sales leakage suggests that there is unmet demand in the trade area and that the community can support additional store space for that type of business.
However, retail leakage does not necessarily translate into opportunity. For example, there could be a strong competitor in a neighboring community that dominates the market for that type of product or store.
Understanding Retail Surplus
A retail surplus means that the community's trade area is capturing the local market plus attracting non-local shoppers. A retail surplus does not necessarily mean that the community cannot support additional business. Many communities have developed strong clusters of stores that have broad geographic appeal. Examples of these types of retailers include: sporting goods stores, home furnishing stores, restaurants, and other specialty operations that become destination retailers and draw customers from outside the trade area.
Examining the quantitative aspects (Leakage/Surplus) is only part of the evaluation of community's retail opportunities. Before any conclusions can be drawn about potential business expansion or recruitment opportunities, qualitative considerations such as trade area psychographics and buying habits must be analyzed in context of other market factors.
Interpreting Leakage Index
1.0 = equilibrium, meaning that demand and sales in the area being analyzed are in balance.
.80 = demand exceeds sales by 20%, meaning that consumers are leaving the area being analyzed.
1.2 = sales exceed demand by 20%, meaning that consumers are coming from outside the area being analyzed.

7550 SUNWOOD DR NW, RAMSEY, MN 55303 (12 minute drive time)
Retail Leakage and Surplus Analysis
Buxton2651 South Polaris DriveFort Worth, TX 76137
07/21/2011
Tel: 817.332.3681Fax: 817.332.3686www.buxtonco.com
2 of 14
Data Sources: Applied Geographic Solutions, Inc., Copyright 2009
Leakage/Surplus Index by Major Store Type
The quantitative comparison of retail leakage and surplus in the twelve major store types shown in the chart and table below provides an initial measure of market opportunities. Combining this analysis with the knowledge of the local retail situation will take the process of identifying retail possibilities one step further.
Figure 1 provides the leakage/surplus indices and following is the sales potential and actual sales for major store types.
Figure 1. Leakage/Surplus Index and Actual and Potential Sales by Major Store Types
Store Type Potential Actual Sales LeakageMotor Vehicle Parts & Dealers 228,607,369 255,401,791 1.1Furniture & Home Furnishing Stores 29,917,339 52,836,985 1.8Electronics & Appliance Stores 27,318,974 12,428,000 0.5Building Material & Garden Equipment & Supply Dealers 137,590,373 196,251,012 1.4Food & Beverage Stores 129,231,986 181,774,978 1.4Health & Personal Care Stores 52,303,345 59,263,828 1.1Clothing & Clothing Accessories Stores 54,744,508 25,847,066 0.5Sporting Goods, Hobby, Book, & Music Stores 22,392,967 22,951,557 1.0General Merchandise Stores 137,040,628 227,713,487 1.7Miscellaneous Store Retailers 30,260,211 37,626,745 1.2Foodservice & Drinking Places 105,819,751 103,081,917 1.0
Total 955,227,451 1,175,177,367 1.2

7550 SUNWOOD DR NW, RAMSEY, MN 55303 (12 minute drive time)
Retail Leakage and Surplus Analysis
Buxton2651 South Polaris DriveFort Worth, TX 76137
07/21/2011
Tel: 817.332.3681Fax: 817.332.3686www.buxtonco.com
3 of 14
Data Sources: Applied Geographic Solutions, Inc., Copyright 2009
Sub-Categories of Motor Vehicle Parts & Dealers
Store Type Potential Actual Sales LeakageExpenditures at Automotive Dealers 197,332,251 192,708,424 1.0Expenditures at Other Motor Vehicle Dealers 14,293,971 42,931,727 3.0Expenditures at Automotive Parts, Accessories, and Tire Stores 16,981,148 19,761,640 1.2
Total Motor Vehicle Parts & Dealers 228,607,369 255,401,791 1.1

7550 SUNWOOD DR NW, RAMSEY, MN 55303 (12 minute drive time)
Retail Leakage and Surplus Analysis
Buxton2651 South Polaris DriveFort Worth, TX 76137
07/21/2011
Tel: 817.332.3681Fax: 817.332.3686www.buxtonco.com
4 of 14
Data Sources: Applied Geographic Solutions, Inc., Copyright 2009
Sub-Categories of Furniture & Home Furnishing Stores
Store Type Potential Actual Sales LeakageExpenditures at Furniture Stores 15,916,445 29,317,089 1.8Expenditures at Home Furnishing Stores 14,000,894 23,519,896 1.7
Total Furniture & Home Furnishing Stores 29,917,339 52,836,985 1.8

7550 SUNWOOD DR NW, RAMSEY, MN 55303 (12 minute drive time)
Retail Leakage and Surplus Analysis
Buxton2651 South Polaris DriveFort Worth, TX 76137
07/21/2011
Tel: 817.332.3681Fax: 817.332.3686www.buxtonco.com
5 of 14
Data Sources: Applied Geographic Solutions, Inc., Copyright 2009
Sub-Categories of Electronics & Appliance Stores
Store Type Potential Actual Sales LeakageExpenditures at Appliance, Television, and Other Electronics Stores 20,578,398 10,174,308 0.5Expenditures at Computer and Software Stores 5,609,549 1,115,201 0.2Expenditures at Camera and Photographic Equipment Stores 1,131,027 1,138,492 1.0
Total Electronics & Appliance Stores 27,318,974 12,428,000 0.5

7550 SUNWOOD DR NW, RAMSEY, MN 55303 (12 minute drive time)
Retail Leakage and Surplus Analysis
Buxton2651 South Polaris DriveFort Worth, TX 76137
07/21/2011
Tel: 817.332.3681Fax: 817.332.3686www.buxtonco.com
6 of 14
Data Sources: Applied Geographic Solutions, Inc., Copyright 2009
Sub-Categories of Building Material & Garden Equipment & Supply Dealers
Store Type Potential Actual Sales LeakageExpenditures at Home Centers 50,224,216 128,857,531 2.6Expenditures at Paint and Wallpaper Stores 2,772,665 4,761,072 1.7Expenditures at Hardware Stores 10,221,953 18,180,226 1.8Expenditures at Other Building Materials Dealers 63,288,603 40,951,888 0.6Expenditures at Outdoor Power Equipment Stores 1,622,473 1,240,137 0.8Expenditures at Nursery and Garden Centers 9,460,463 2,260,158 0.2
Total Building Material & Garden Equipment & Supply Dealers 137,590,373 196,251,012 1.4

7550 SUNWOOD DR NW, RAMSEY, MN 55303 (12 minute drive time)
Retail Leakage and Surplus Analysis
Buxton2651 South Polaris DriveFort Worth, TX 76137
07/21/2011
Tel: 817.332.3681Fax: 817.332.3686www.buxtonco.com
7 of 14
Data Sources: Applied Geographic Solutions, Inc., Copyright 2009
Sub-Categories of Food & Beverage Stores
Store Type Potential Actual Sales LeakageExpenditures at Supermarkets and Other Grocery (except Convenience) Stores 110,821,801 164,646,839 1.5Expenditures at Convenience Stores 6,278,217 1,695,858 0.3Expenditures at Specialty Food Stores 3,551,918 1,960,832 0.6Expenditures at Beer, Wine, and Liquor Stores 8,580,049 13,471,449 1.6
Total Food & Beverage Stores 129,231,986 181,774,978 1.4

7550 SUNWOOD DR NW, RAMSEY, MN 55303 (12 minute drive time)
Retail Leakage and Surplus Analysis
Buxton2651 South Polaris DriveFort Worth, TX 76137
07/21/2011
Tel: 817.332.3681Fax: 817.332.3686www.buxtonco.com
8 of 14
Data Sources: Applied Geographic Solutions, Inc., Copyright 2009
Sub-Categories of Health & Personal Care Stores
Store Type Potential Actual Sales LeakageExpenditures at Pharmacies and Drug Stores 45,052,907 53,816,966 1.2Expenditures at Cosmetics, Beauty Supplies and Perfume Stores 1,743,517 5,434 0.0Expenditures at Optical Goods Stores 2,403,744 1,421,870 0.6Expenditures at Other Health and Personal Care Stores 3,103,177 4,019,558 1.3
Total Health & Personal Care Stores 52,303,345 59,263,828 1.1

7550 SUNWOOD DR NW, RAMSEY, MN 55303 (12 minute drive time)
Retail Leakage and Surplus Analysis
Buxton2651 South Polaris DriveFort Worth, TX 76137
07/21/2011
Tel: 817.332.3681Fax: 817.332.3686www.buxtonco.com
9 of 14
Data Sources: Applied Geographic Solutions, Inc., Copyright 2009
Sub-Categories of Clothing & Clothing Accessories Stores
Store Type Potential Actual Sales LeakageExpenditures at Men's Clothing Stores 2,565,104 1,942,868 0.8Expenditures at Women's Clothing Stores 9,993,395 8,331,835 0.8Expenditures at Children's and Infants' Clothing Stores 2,208,647 0 0.0Expenditures at Family Clothing Stores 21,224,352 7,313,832 0.3Expenditures at Clothing Accessories Stores 909,054 195,190 0.2Expenditures at Other Clothing Stores 2,539,496 438,828 0.2Expenditures at Shoe Stores 7,139,416 5,557,368 0.8Expenditures at Jewelry Stores 7,531,156 2,067,145 0.3Expenditures at Luggage, and Leather Goods Stores 633,889 0 0.0
Total Clothing & Clothing Accessories Stores 54,744,508 25,847,066 0.5

7550 SUNWOOD DR NW, RAMSEY, MN 55303 (12 minute drive time)
Retail Leakage and Surplus Analysis
Buxton2651 South Polaris DriveFort Worth, TX 76137
07/21/2011
Tel: 817.332.3681Fax: 817.332.3686www.buxtonco.com
10 of 14
Data Sources: Applied Geographic Solutions, Inc., Copyright 2009
Sub-Categories of Sporting Goods, Hobby, Book, & Music Stores
Store Type Potential Actual Sales LeakageExpenditures at Sporting Goods Stores 8,214,638 9,525,227 1.2Expenditures at Hobby, Toys and Games Stores 4,979,785 6,062,766 1.2Expenditures at Sew/Needlework/Piece Goods Stores 1,121,349 1,241,456 1.1Expenditures at Musical Instrument and Supplies Stores 1,433,780 936,900 0.7Expenditures at Book Stores and News Dealers 4,457,297 4,389,770 1.0Expenditures at Prerecorded Tape, Compact Disc, and Record Stores 2,186,118 795,438 0.4
Total Sporting Goods, Hobby, Book, & Music Stores 22,392,967 22,951,557 1.0

7550 SUNWOOD DR NW, RAMSEY, MN 55303 (12 minute drive time)
Retail Leakage and Surplus Analysis
Buxton2651 South Polaris DriveFort Worth, TX 76137
07/21/2011
Tel: 817.332.3681Fax: 817.332.3686www.buxtonco.com
11 of 14
Data Sources: Applied Geographic Solutions, Inc., Copyright 2009
Sub-Categories of General Merchandise Stores
Store Type Potential Actual Sales LeakageExpenditures at Department Stores excluding leased depts. 66,378,948 215,263,870 3.2Expenditures at Warehouse Clubs and Super Stores 60,296,373 10,131,549 0.2Expenditures at All Other General Merchandise Stores 10,365,307 2,318,068 0.2
Total General Merchandise Stores 137,040,628 227,713,487 1.7

7550 SUNWOOD DR NW, RAMSEY, MN 55303 (12 minute drive time)
Retail Leakage and Surplus Analysis
Buxton2651 South Polaris DriveFort Worth, TX 76137
07/21/2011
Tel: 817.332.3681Fax: 817.332.3686www.buxtonco.com
12 of 14
Data Sources: Applied Geographic Solutions, Inc., Copyright 2009
Sub-Categories of Miscellaneous Store Retailers
Store Type Potential Actual Sales LeakageExpenditures at Florists 2,176,533 2,945,361 1.4Expenditures at Office Supplies and Stationery Stores 6,884,444 11,520,674 1.7Expenditures at Gift, Novelty, and Souvenir Stores 5,295,338 8,378,151 1.6Expenditures at Used Merchandise Stores 2,569,005 1,841,074 0.7Expenditures at Other Miscellaneous Store Retailers 13,334,891 12,941,484 1.0
Total Miscellaneous Store Retailers 30,260,211 37,626,745 1.2

7550 SUNWOOD DR NW, RAMSEY, MN 55303 (12 minute drive time)
Retail Leakage and Surplus Analysis
Buxton2651 South Polaris DriveFort Worth, TX 76137
07/21/2011
Tel: 817.332.3681Fax: 817.332.3686www.buxtonco.com
13 of 14
Data Sources: Applied Geographic Solutions, Inc., Copyright 2009
Sub-Categories of Foodservice & Drinking Places
Store Type Potential Actual Sales LeakageExpenditures at Full-service Restaurants 48,803,164 37,916,346 0.8Expenditures at Limited-service Eating Places 42,820,669 56,954,853 1.3Expenditures at Special Foodservices 8,827,746 7,926,997 0.9Expenditures at Drinking Places -Alcoholic Beverages 5,368,172 283,721 0.1
Total Foodservice & Drinking Places 105,819,751 103,081,917 1.0

7550 SUNWOOD DR NW, RAMSEY, MN 55303 (12 minute drive time)
Retail Leakage and Surplus Analysis
Buxton2651 South Polaris DriveFort Worth, TX 76137
07/21/2011
Tel: 817.332.3681Fax: 817.332.3686www.buxtonco.com
14 of 14
Data Sources: Applied Geographic Solutions, Inc., Copyright 2009
Sources and Methodology
The primary data sources used in the construction of the database include:
• Current year AGS (Applied Geographic Solutions) Consumer Expenditure Estimates• Census of Retail Trade, Merchandise Line Sales• Census Bureau Monthly Retail Trade
The Census of Retail Trade presents a table known as the Merchandise Line summary, which relates approximately 120 merchandise lines (e.g. hardware) to each of the store types. For each merchandise line, the distribution of sales by store type can be computed, yielding a conversion table which apportions merchandise line sales by store type.
The AGS (Applied Geographic Solutions) Consumer Expenditure database was re-computed to these merchandise lines by aggregating both whole and partial categories, yielding, at the block group level, a series of merchandise line estimates which are consistent with the AGS Consumer Expenditure database.
These two components were then combined in order to derive estimated potential by store type. The results were then compared to current retail trade statistics to ensure consistency and completeness.

Appendix B:
Segmentation Guide

©Experian 1
Group Structure Label Segment Name % of US Households Page #A01 Americaʹs Wealthiest 1.14% 6A02 Dream Weavers 1.74% 7
11.19% A03 White‐collar Suburbia 1.43% 8A04 Upscale Suburbanites 0.84% 9A05 Enterprising Couples 0.84% 10A06 Small‐town Success 2.38% 11A07 New Suburbia Families 2.82% 12B01 Status‐conscious Consumers 1.55% 13B02 Affluent Urban Professionals 1.44% 14
13.26% B03 Urban Commuter Families 6.33% 15B04 Solid Suburban Life 0.63% 16B05 Second‐generation Success 2.40% 17B06 Successful Suburbia 0.91% 18C01 Second City Homebodies 0.74% 19C02 Prime Middle America 3.52% 20
7.64% C03 Suburban Optimists 0.61% 21C04 Family Convenience 1.93% 22C05 Mid‐market Enterprise 0.84% 23D01 Nuevo Hispanic Families 2.73% 24D02 Working Rural Communities 1.06% 25
6.57% D03 Lower‐income Essentials 0.83% 26D04 Small‐city Endeavors 1.95% 27E01 Ethnic Urban Mix 1.89% 28E02 Urban Blues 1.74% 29
9.73% E03 Professional Urbanites 2.09% 30E04 Suburban Advantage 1.15% 31E05 American Great Outdoors 1.37% 32E06 Mature America 1.48% 33F01 Steadfast Conservatives 6.51% 34F02 Moderate Conventionalists 1.60% 35
10.63% F03 Southern Blues 0.92% 36F04 Urban Grit 0.55% 37F05 Grass‐roots Living 1.05% 38G01 Hardy Rural Families 2.70% 39G02 Rural Southern Living 2.71% 40
7.39% G03 Coal and Crops 1.81% 41G04 Native Americana 0.18% 42H01 Young Cosmopolitans 3.22% 43H02 Minority Metro Communities 2.20% 44
11.18% H03 Stable Careers 4.29% 45H04 Aspiring Hispania 1.48% 46I01 Industrious Country Living 1.30% 47I02 Americaʹs Farmlands 1.04% 48
4.77% I03 Comfy Country Living 0.73% 49I04 Small‐town Connections 0.48% 50I05 Hinterland Families 1.23% 51J01 Rugged Rural Style 1.62% 52J02 Latino Nuevo 2.91% 53
8.20% J03 Struggling City Centers 1.72% 54J04 College Town Communities 0.98% 55J05 Metro Beginnings 0.98% 56K01 Unattached Multi‐cultures 0.38% 57K02 Academic Influences 0.47% 58
8.63% K03 African‐American Neighborhoods 1.93% 59K04 Urban Diversity 2.44% 60K05 New Generation Activists 2.37% 61K06 Getting By 1.05% 62L01 Military Family Life 0.31% 63L02 Major University Towns 0.27% 64
0.80% L03 Gray Perspectives 0.22% 65
A
B
C
D
K
L
E
F
G
H
Varying Lifestyles
American Diversity
Metro Fringe
Remote America
Aspiring Contemporaries
Segment Group
Rural Villages and Farms
Struggling Societies
Urban Essence
Affluent Suburbia
Upscale America
Small‐town Contentment
Blue‐collar Backbone
I
J

©Experian 2
Mosaic USA Group Descriptions A full Mosaic media guide is available online at: www.buxtonco.com/mosaic.asp ██ Group A: Affluent Suburbia
The wealthiest households in the U.S. living in exclusive suburban neighborhoods enjoying the best of everything that life has to offer
The seven Segments in the Affluent Suburbia group comprise the wealthiest households in the nation. These segments outrank all other Mosaic Segments in terms of household income, home value and educational achievement. Concentrated in exclusive suburban neighborhoods, these households are predominantly white, college educated and filled with Baby Boom parents and their children. With their managerial and executive positions paying six‐figure‐plus incomes, they enjoy the good life in fashionable houses outfitted with the latest technology. These are the Americans who drive luxury cars, belong to country clubs, travel abroad and relax by sailing, golfing or skiing. Many are culture buffs who attend the theater, art shows, dance performances and concerts, all at high rates. Both their purchasing behavior and media choices reflect their interests in money management, travel, computers and gourmet foods.
██ Group B: Upscale America
College‐educated couples and families living in the metropolitan sprawl earning upscale incomes providing them with large homes and very comfortable and active lifestyles
The six Segments in Upscale America are populated with mainly white, college‐educated couples and families living in the metropolitan sprawl. Most of the adults work as executives and white‐collar professionals, and their upscale incomes provide them with large homes and comfortable lifestyles. They like to spend their leisure time getting exercise—jogging, biking and swimming are popular—or shopping for the latest in‐fashion and high‐tech electronics. They are active in community affairs as members of business clubs, environmental groups and arts associations. They’re selective media fans who prefer magazines and cable TV channels that cover business, fashion and the arts. Their one exception is the Internet. These Americans are omnivorous Web users who go online for everything from banking and trading stocks to downloading music and buying merchandise.
██ Group C: Small‐town Contentment
Middle‐aged, upper‐middle‐class families living in small towns and satellite cities with moderate educations employed in white‐collar, blue‐collar and service professions
The five Segments in Small‐town Contentment represent the nation’s middle‐aged, upper‐middle‐class families living in small towns and satellite cities. As a group, they share moderate educations and a mix of well‐paying jobs in white‐collar, blue‐collar and service professions. With their locations outside the nation’s major metros, these households can afford recently built homes and new SUVs and pickup trucks. They enjoy outdoor sports like hiking, fishing and camping. They are also close enough to big cities to frequent comedy clubs, nightclubs and upscale malls for designer clothes and sporting goods. They tend to have varied media tastes, enjoying music and comedy shows on television, modern rock and country music on the radio and fitness and music magazines from newsstands. They are active Internet users going online for instant messaging, exchanging email and getting the latest sports scores and news.
©Experian 3
██ Group D: Blue‐collar Backbone
Budget‐conscious, young and old blue‐collar households living in older towns working in manufacturing, construction and retail trades
The four Segments in Blue‐collar Backbone are a bastion of blue‐collar diversity. This group features above‐average proportions of both old and young residents, whites and Hispanics, families and singles, homeowners and apartment renters. Most residents live in older outlying towns and cities, and work at blue‐collar jobs in manufacturing, construction and retail trades. Their lifestyle reflects a working‐class sensibility. Their most popular leisure activities include baseball, soccer, fishing and woodworking. They’re more likely to go out to a veterans club than attend a concert or play. These budget‐conscious households shop at discount clothiers and department stores, and they have low rates for buying investments or insurance products. With relatively few entertainment options due to their remote location or lack of discretionary income, this group is a strong market for traditional media. Residents like to watch soaps and game shows on television, listen to country music on the radio and read a variety of outdoor and women’s magazines.
██ Group E: American Diversity
A diverse group of ethnically mixed singles and couples, middle‐aged and retired with middleclass incomes from blue‐collar and service industry jobs
American Diversity is a reflection of how contrasting mid‐America’s population is. It is an ethnic mix of middleaged couples, singles and retirees. With a few exceptions, these six Mosaic Segments consist of households with average educations and middle‐class incomes from blue‐collar and service industry jobs. Many of the group’s adults are older Americans—aging singles and couples who’ve already exited the workplace. They tend to have unassuming lifestyles, scoring high for reading books and newspapers, going to movies and plays, and socializing through fraternal orders and veterans clubs. They have traditional media tastes, enjoying TV news, movies and game shows as well as business and shelter magazines. Conservative in their politics and fashion, they have limited interest in new clothing styles, consumer electronics or the Internet.
██ Group F: Metro Fringe
Racially mixed, lower‐middle‐class clusters in older single‐family homes, semi‐detached houses and low‐rise apartments in satellite cities
Metro Fringe is a collection of five racially mixed, lower‐middle‐class Mosaic Segments located primarily in satellite cities such as Kissimmee, FL, Flint MI, Joiliet, IL and Fresno, CA. Many of the group’s households consist of young singles and couples who work at blue‐collar and service industry jobs. They tend to live in older singlefamily homes, semidetached houses and low‐rise apartments. Overall, this group is relatively active and pursues sports‐oriented lifestyles participating in activities such as soccer and softball, rollerblading, skateboarding, gocarting and video gaming. As shoppers, they patronize discount retailers where they buy the latest fashion and tech gear at low prices. In their homes, they’re fans of electronic media, whether it’s watching youth‐oriented cable channels like Spike TV, FX and Cartoon Network, or going online to chat forums and Web sites for job listings or music downloading.

©Experian 4
██ Group G: Remote America
A mix of farming and small industrial rural communities with outdoor oriented lifestyles living primarily in America’s heartland
The four Remote America Segments reflect heartland lifestyles, a mix of farming and small industrial communities mostly located in the nation’s midsection. The working‐class couples and families in this group tend to be employed in agriculture and blue‐collar jobs that pay modest wages. The median home value is about half the national average, and a significant number of residents live in mobile homes. No group has a lower population density, and few have higher rates for outdoors‐oriented lifestyles. Households spend their leisure time fishing, hunting, hiking and horseback riding. In their homes, they look to their TV sets for entertainment, especially game shows, soap operas and home improvement shows. Their magazine tastes may split along gender lines with the men reading hunting publications while the women peruse shelter magazines. On the radio, country and western is the preferred choice of music.
██ Group H: Aspiring Contemporaries
Young, mostly single, ethnically diverse, online active households living in new homes or apartments with discretionary income to spend on themselves
The four Segments in Aspiring Contemporaries are all filled with upward strivers. The households tend to be young (Generation Xers between 18 and 34 years old), ethnically diverse (about 40 percent are minorities) and unattached (about two‐thirds are single or divorced). Yet despite traditional barriers to affluence, the members of these metropolitan segments are already solidly middle‐class. Many live in relatively new homes or apartments valued at more than the national average—a reliable sign of upward mobility. They’re big culture buffs who like to see plays, movies, comics and live bands. They spend a lot of their discretionary income on the latest fashions and consumer electronics. They’re heavy media consumers, listening to jazz on the radio and reading the Sunday paper for science and technology news. Raised on technology, they are very Internet savvy, spending their leisure time online to chat, shop, job search, send instant messages, bid in auctions and frequent dating Web sites.
██ Group I: Rural Villages and Farms
Rural, middle‐class married families and couples of varied ages, living and working in agricultural and mining communities
Representing America’s agricultural and mining communities, Rural Villages and Farms is a collection of five low‐density Segments filled with middle‐class families and couples of varied ages. Most of the households in this group are married, white and high school educated. They maintain tranquil lifestyles in unpretentious houses and comfortable mobile homes. They share a fondness for outdoor sports, enjoying fishing, hunting, camping and motor sports. Many residents are do‐it‐yourselfers who are into woodworking and needlework. They like to shop at the big‐box home improvement chains and watch how‐to shows on TV. When it comes to media, nothing dominates like country music. They watch their favorite country and western stars on TV, listen to them on the radio and attend their concerts.

©Experian 5
██ Group J: Struggling Societies
Young minorities, students and single parents trying to raise families on low‐level jobs in manufacturing, health care and food services
The five Segments in Struggling Societies symbolize the challenges facing a significant number of economically challenged Americans. These households tend to be disadvantaged and uneducated. With incomes half the national average and nearly a third never completing high school, they are consigned to low‐level jobs in manufacturing, health care and food services. Many of these residents are young, minorities, students and single parents trying to raise families on low incomes and tight budgets. Without much discretionary income their activities are limited and leisure pursuits include playing sports like basketball, volleyball and skateboarding. They shop at discount clothiers and sporting goods stores for casual apparel and athletic shoes. In these lessfortunate communities, television is a main source of entertainment, specifically reality programs, sitcoms, talk shows and sports. This group also relates to ethnic‐oriented media, creating a strong radio market for stations that play Spanish, Mexican and urban contemporary music.
██ Group K: Urban Essence
Young, single and single‐parent minorities living in older apartments working at entry‐level jobs in service industries
As a whole, the six segments in Urban Essence make up the nation’s least affluent group, a collection of relatively young minorities living in older apartments. More than half the households consist of African Americans and Hispanics. Many of these residents are single or single parents working at entry‐level jobs in service industries. With their low education levels and household incomes, residents lead unpretentious lifestyles. Many spend their leisure time playing sports like baseball, basketball and football. With their above‐average household size, they make a strong market for children’s toys and electronic gear, especially video games, dolls and board games. They have high rates for enjoying traditional media, reading ethnic‐targeted magazines, listening to jazz and urban contemporary radio and, especially, watching television. It’s hard to find a network program or cable channel that they don’t view watching comedies, cartoons, sports, soaps and game shows.
██ Group L: Varying Lifestyles
Residents who primarily live in group quarters including students, military personnel and institution populations
The three Segments that make up Varying Lifestyles are an unconventional group. What they share is the singular experience of living in group quarters. A majority of this group lives the unique lifestyles offered by the military and university dorm life. Though their daily lives are different from many Americans—as well as each other—those who have the ability are more likely than average Americans to visit museums, zoos and state fairs. They like to stay active doing aerobic exercise, hiking, bowling and playing sports like tennis, baseball and volleyball. They’re frequent travelers who vacation abroad as well as within the United States. At home, they divide their time between the television and computer screens. They typically watch TV news, comedy programs and latenight talk shows. When online they frequent chat rooms, auction and banking sites and listen to Internet radio with a preference for rock ’n’ roll.

©Experian 6
Mosaic USA Segment Descriptions Group A: Affluent Suburbia ██ Segment A06: Small‐town Success
White‐collar, college educated, middle‐aged working couples living in newly developed subdivisions outside the nation’s beltways
Demographics Small‐town Success is typically home to the families of the most prominent citizens in their exurban communities. White‐collar, college educated and upscale, they live in recently developed subdivisions outside the nation’s beltways in the Midwest and West. Most of these households contain white, middle‐aged working couples who have positions as executives and professionals in health care, retail and education. More than eight in ten drive alone to work, pulling out of the driveways of large single‐family homes valued at 50 percent above the national median. These high‐earners drive to work in comfort and have high rates for owning luxury SUVs as well as family vehicles including minivans.
Lifestyles Small‐town Success households enjoy a prosperous way of life. For athletic activities, they enjoy biking, swimming, bowling and jogging. They tend to seek out intellectual stimulation, reading books and taking adult education classes at high rates, and they don’t mind driving to big cities to visit museums or see a show. They’re conservative by nature and describe themselves as “smart shoppers.” They like to buy quality merchandise at low prices at big‐box chains such as Sam’s Club, Circuit City and Bed, Bath & Beyond. They’re late adopters when it comes to consumer electronics and are more likely to own 35‐mm cameras than digital models, VHS players than DVD units. They own a wide range of insurance products, including life, health, disability and homeowner’s coverage. However, being conservative hasn’t dampened their enthusiasm for travel as they are likely to take a trip for either business or pleasure almost every month of the year.
Media Small‐town Success households share a fondness for a variety of media. They like to watch primetime crime dramas and comedies on television, especially “CSI,” “Law and Order” and “Two and a Half Men.” They are avid radio listeners and enjoy stations that offer news talk, golden oldies and country music. They have high rates for reading the Sunday newspaper to catch up on sports, business and entertainment news and read mainstream magazine titles as National Geographic, Good Housekeeping and Better Homes and Gardens. They have above average interest in the Internet, and they go online to get news, do their banking and buy merchandise such as books and CDs.

©Experian 7
Group A: Affluent Suburbia ██ Segment A07: New Suburbia Families
Young, affluent working couples with pre‐school children concentrated in fast‐growing, metro fringe communities
Demographics Young couples with pre‐school children have turned New Suburbia Families into a booming lifestyle. Concentrated in fast‐growing, metro fringe communities mainly in the West and Southwest, the segment’s population has more than tripled since 1990. With many households under 35 years old, these young families are making the most of their new subdivisions. More than half the housing has been built since 2000 and the median value worth nearly 50 percent above the U.S. average. Residents have both brains and bucks. More than twothirds have gone to college and many workers earn six‐figure incomes. It takes hard work to have achieved success at such a young age. More than two‐thirds of families have multiple workers in the labor force, gravitating to jobs as managers, executives and white‐collar professionals.
Lifestyles The members of New Suburbia Families have crafted active, children‐centered lifestyles. These families participate in a number of team sports such as baseball, basketball and soccer, shuttling kids and gear to activities in their SUVs and minivans. They go to kid‐friendly destinations and frequent zoos, aquariums and campgrounds. At supermarkets, they fill their grocery carts with pizza, Pop Tarts and prepared lunch kits. This is one of the top‐ranked segments for owning toys, books and video games, and residents here never met a consumer electronics device they didn’t like including cell phones, gaming systems and home theater systems. With their relatively large families, money still needs to be managed. They maintain that price and functionality trump style when they purchase electronics and clothing at retailers like Target, Best Buy and Wal‐Mart. Contributing to 529 college savings plans is a priority, but this segment can be debt heavy due to first mortgages and home equity loans.
Media These energetic households are only moderate consumers of most media. New Suburbia Families are often too busy to read a newspaper or magazine, although they will sit in front of a TV to watch network sitcoms and reality shows as well as sports and entertainment on cable channels such as ESPN, MTV and Comedy Central. Thanks to their lengthy commutes, they exhibit high rates for listening to radio stations that offer news and sports as well as classic rock and adult contemporary music. When they finally wind down, many go online to trade stocks, search for jobs and check out real estate listings.

©Experian 8
Group B: Upscale America ██ Segment B03: Urban Commuter Families
Upscale, college educated Baby Boomer families and couples living in comfortable, single detached homes in city neighborhoods on the metropolitan fringe
Demographics Not all families have fled the nation’s cities for the far‐out suburbs. In Urban Commuter Families, Baby Boomer families and couples are content to live in comfortable, single detached homes in city neighborhoods on the metro fringe. Many of these upscale, college‐educated households contain dual‐income couples who put in long hours as professionals and managers in retail, health care and education services. They tend to leverage their home equity with major home improvement projects, and build their real estate holdings with recent purchases of second homes for family getaways.
Lifestyles With its concentration of empty‐nesters, Urban Commuter Families lifestyle is relatively serene. They are not into aerobic sports, preferring to get their exercise from low‐impact activities such as gardening, golfing and birdwatching. They enjoy leisure activities like going to the theater or antique show rather than a rock concert or an auto race. They describe themselves as brand‐loyal shoppers who prefer to buy functional clothes over expensive designer labels, shopping at stores like Sears and J.C. Penney. With limited interest in the latest electronics and technology products, their homes are more likely to contain stereos and 35‐mm cameras than MP3 players and digital cameras. These conservative investors put their money to work in CDs, U.S. savings bonds and taxsheltered annuities. With their high rates of owning houses and vacation homes, they take out home improvement loans and spend their free time roaming the aisles at Home Depot and Lowe’s, Linens ‘N Things and Pottery Barn.
Media The households in Urban Commuter Families are old‐fashioned media fans. They subscribe to daily newspapers at high rates and spend their Sunday mornings poring over the travel section and the ad inserts. They pick up traditional general interest magazines at the supermarket, enjoying Reader’s Digest, Family Circle and Good Housekeeping. On their commute to work, they listen to the calming strains of classical, golden oldies and big band music on the radio. When they finally wind down in front of a TV, these conservative households watch Fox News, the History Channel and the old movies on AMC and TMC. Their Mosaic motto could be “No surprises, please.”

©Experian 9
Group B: Upscale America ██ Segment B05: Second‐generation Success
Upper‐middle‐class and large multi‐ethnic households working in white and blue‐collar jobs within metro fringe communities
Demographics These grandchildren of immigrants who live in Second‐generation Success, life is sweet. These multi‐ethnic households—of Asian, Hispanic and varied European descent—have achieved upper‐middle‐class status through hard work and devotion to family. They are primarily married couples with children. Their household size with five or more people is almost double the U.S. average. More than half of adults have attended college, landing a mix of blue‐ and white‐collar jobs in retail, manufacturing, transportation and public administration. In these metro fringe communities, located primarily in coastal states, many households strive to balance the need to assimilate with the desire to retain their cultural traditions. For now, most have found the American Dream in a single detached house built in the early 1980s in what was then the suburban frontier.
Lifestyles With their upscale incomes and children of all ages, Second‐generation Success households enjoy active, familycentered lifestyles. They participate in a number of team sports, including soccer, basketball, football and baseball. On weekends, they typically pile into their vans and SUVs for outings to a zoo, aquarium, cinema or one of the kids’ sporting games. Those vehicles also come in handy when they go on shopping excursions patronizing big‐box stores such as Home Depot, Toys R Us and Best Buy. Indeed, these relatively young families make a strong market for toys, sporting goods and high‐tech products, and they say they’re heavily influenced by their children when shopping. With these households, most of their savings is tied up in their home equity. At the supermarket they buy a lot of fresh fish, poultry and meat for home‐cooked meals.
Media Second‐generation Success is a media‐filled lifestyle where residents enjoy virtually all media channels at aboveaverage rates. They watch network television programs that feature sitcoms, sports, reality shows and even animation—the grownups watching alongside their kids. They read celebrity publications such as People and Us Weekly as well as Spanish‐language newspapers and magazines Radio preferences vary but with many of the households whose families are of Hispanic origin there is a tendency for ranchero and Tejano music. When it comes to the Internet, this ethnic mix has relatively high rates for surfing the Internet to download music, get sports scores, upload family pictures and search for jobs.

©Experian 10
Group B: Upscale America ██ Segment B06: Successful Suburbia
Middle‐age, married couples with children who enjoy an upscale life far from the downtown hustle of city living
Demographics The households in Successful Suburbia are located primarily in East Coast towns on the metro fringe. Predominantly white and college educated, these middle‐aged couples and families have settled in upscale homes built around 1985. These homeowners earn relatively high incomes from a combination of management and professional jobs in health care, retail and manufacturing. This cluster is a haven for married couples with children who enjoy life far from the downtown hustle. They rank near the top for having multiple workers and cars to commute to jobs and entertainment.
Lifestyles Successful Suburbia households lead busy family‐oriented lifestyles. They participate in varied leisure activities, from cooking and gardening to going to aquariums, bowling alleys and theaters. Many enjoy outdoor athletic activities such as golf, soccer, baseball, football and swimming. They travel frequently for business and pleasure, though mostly to domestic beaches and ski resorts. Brand loyal shoppers, they patronize stores including Kohl’s, BJ’s Wholesale, Old Navy, Linens ‘N Things and Best Buy. In the early childrearing phase of their lives, they buy lots of home‐based consumer electronics, like desktop computers, video game systems and home theater systems, bringing everything home in their SUVs. To help finance their acquisitive nature, they carry a variety of credit cards while maintaining high levels of investments in stocks, mutual funds and U.S. savings bonds.
Media Despite their upscale profile, the households in Successful Suburbia are a tough media sell. Other than their fondness for radio, they exhibit relatively low rates for consuming most media. They will tune in family‐friendly TV sitcoms, animated shows as “The Simpsons” and cable channels including ABC Family and TBS. They subscribe to a handful of home‐based magazines like Popular Mechanics, Cooking Light, American Baby and Parents. On the radio, they prefer listening to country, classic rock and golden oldies. These middle‐aged family households have begun to rely on the Internet for sports news, auctions and medical information. Marketers however should be warned. These busy consumers have little patience for advertising and declare that television commercials are annoying.

©Experian 11
Group C: Small‐town Contentment ██ Segment C02: Prime Middle America
A mix of young, upper‐middle‐class couples and families living in both small towns and midsized cities working in well paying white‐collar and blue‐collar jobs
Demographics Prime Middle America features a mix of couples and families living in both small towns and mid‐sized cities in the South and Northwest. Younger than average and upper‐middle‐class in status, these predominantly white dual‐income households have well‐paying blue‐collar and white‐collar jobs in transportation, manufacturing and public administration. Most of the households own their own homes and are nearly twice as likely to live in mobile homes than the national average.
Lifestyles Prime Middle America features a small‐town, family‐centered lifestyle. Households enjoy leisure activities like playing cards and board games as well as outdoor pursuits such as fishing, biking and swimming at a lake. Many are do‐it‐yourselfers who load up their SUVs and pickup trucks with home improvement supplies from stores such as Lowe’s, Home Depot and True Value Hardware. Their incomes afford them a wide range of mortgages, home equity loans and college savings plans. As consumers, they describe themselves as less interested in new fashions than the latest high‐tech gadgets.
Media When the folks in this cluster put down their hammers and saws, they enjoy a variety of media. Prime Middle America residents like to gather round their large‐screen TVs to watch reality shows, sports and cable channels such as MTV, FX, Discovery and Country Music Television. They’re traditionalists who enjoy reading established magazines such as Woman’s World, Field & Stream and Parents. The radio soundtrack usually playing features a mix of country music, classic rock and contemporary hits. The Internet has expanded the entertainment and convenience choices for residents of small towns, and Prime Middle America households are no exception. They like to go online to play games, do their banking and participate in auctions for antiques and collectibles.

©Experian 12
Group C: Small‐town Contentment ██ Segment C04: Family Convenience
Sprawling families living in remote towns and military bases containing dual‐income couples working at skilled blue‐collar jobs in manufacturing and construction as well as in the military
Demographics Family Convenience is a collection of sprawling families living in remote towns and military bases primarily in the Midwest and Northern Plains. Most of the households contain dual‐income couples working at skilled bluecollar jobs in manufacturing and construction as well as in the military. Service families are six times as likely to live here than the general population. Despite moderate educations, the adults in this segment earn upper‐middleclass incomes and have a high rate of home ownership. The vast majority own new single‐family homes and have SUVs and pickup trucks in the driveway. With an above‐average length of residence, many have achieved a secure lifestyle with room for the kids to grow.
Lifestyles Life today in Family Convenience looks a lot like it did a half‐century ago. Residents enjoy spending their leisure time swimming, fishing, hunting and camping. They are active in their community and belong to civic clubs and parent/teacher associations. To feed their big families, they spend their grocery money on easy‐to‐prepare foods like toaster pastries, lunch kits, frozen pizza and refrigerated biscuits. Discount department stores like Wal‐Mart, Sam’s Club and Big Lots are frequent destinations for clothing and housewares. When they take a vacation, parents are content to pile the kids into their domestic SUVs and head to a theme park or campground near a lake or beach. Financially risk‐averse, they make a stronger market for insurance rather than investment products.
Media The members of Family Convenience have traditional media tastes. They like to watch classic sitcoms on TV Land, family‐friendly fare on the Disney Channel and cartoons on Nickelodeon. Many listen to radio every day, tuning in country, classic rock and adult contemporary stations. They prefer magazines that cater to their interests in the home, hunting, motor sports and entertainment. When they go online, they seek out websites that follow their leisure interests frequenting sites such as NASCAR.com, Disney.com and eBay.com all at high rates. Although their small towns may have few movie theaters, residents are avid movie goers with their favorite genre being family movies which is not surprising for this Mosaic.

©Experian 13
Group F: Metro Fringe ██ Segment F01: Steadfast Conservatives
Home to high‐school educated mature singles and couples living in middle‐class urban bluecollar neighborhoods
Demographics A quietly aging cluster, Steadfast Conservatives is home to mature singles and couples living in midscale urban neighborhoods. Households tend to be white, high school‐educated and middle class. Many have begun to emptynest or are already filled with couples and singles aged 65 years or older. The seniority of many residents does have benefits in the workplace. They earn middle class incomes from skilled jobs in manufacturing, retail and health care. Their incomes go far, allowing residents to own older homes and multiple cars and trucks at higher than average rates.
Lifestyles The residents of Steadfast Conservatives live up to their old fashioned reputation. They think the stock market is too risky, computers and the Internet too confusing and take preventive medicine before any sign of illness. They even regard aerobic exercise as too strenuous, preferring to spend their leisure time fishing, gardening, antiquing or doing needlework or woodworking. For their social life, they attend activities sponsored by fraternal orders, veterans clubs and church groups. As consumers, they’re likely to be brand loyal when they shop at favorite stores like J.C. Penney for clothes, Dick’s Sporting Goods for outdoor gear and Jo‐Ann for needlecrafts. With their middle‐class incomes, they make a strong automotive market, especially for American‐made pickup trucks and mid‐sized sedans. To further protect their established lifestyles, they buy a variety of insurance products— covering health, life, car and home—though primarily low‐value policies.
Media Households in Steadfast Conservatives are fans of traditional media, including print, TV and radio. They like to get their news from a daily paper or the nightly newscasts on network TV. They consider television as a primary source of entertainment in their lives, and they have high rates for watching sitcoms, reality shows, daytime soaps and religious programs. They enjoy reading magazines that appeal to their do‐it‐yourself sensibilities including popular titles as Family Handyman, Better Homes & Gardens and Country Living. Their radio tastes include a mix of big band, classic rock, country and golden oldies. These households are mostly unenthusiastic about the Internet, but when online they engage in chat forums and visit NASCAR.com.

©Experian 14
Group F: Metro Fringe ██ Segment F02: Moderate Conventionalists
Highly mobile, middle‐class singles and childless couples living in modest homes, semidetached houses and apartments scattered throughout second‐tier cities
Demographics With many key demographic measures close to the national average—including age, income and education— members of Moderate Conventionalists epitomize average Americans. Scattered throughout second‐tier cities in the Midwest and West Coast, these singles and couples tend to live in modest homes, semi‐detached houses and apartments. Most have completed high school or some college and parlayed well‐paying blue‐collar and whitecollar jobs into middle‐class status. These predominantly childless households have low rates of homeownership and above‐average rates of mobility. Moving vans are a frequent sight in this cluster, as young singles move into their first apartments and empty‐nesting couples leave their homes for smaller retirement rentals.
Lifestyles Members of Moderate Conventionalists lead active social lives. With the majority of residents unattached, these areas present an active social scene. Their favorite activities include dancing, bar hopping, bowling and playing pool. They’re avid exercise buffs who like to play softball, tennis and volleyball. They travel frequently for business and pleasure, though their destinations are frequently to ocean beaches. They’re big consumers for products that help them look their best such as cosmetics, toiletries and athletic gear. With their midscale incomes, these childless households have discretionary cash to spend on clothes and the latest tech gear. However, they can’t be too extravagant since many are carrying plenty of debt with education and car loans.
Media Despite all their socializing, Moderate Conventionalists find time to enjoy a variety of media—from newspapers and TV to movies and the Internet. They like to watch reality shows, sitcoms and evening animation such as “CSI,” “King of the Hill,” “E.R.” and “Malcolm in the Middle.” They read a lot of gaming, celebrity and sports magazines, such as Entertainment Weekly, Us, Sports Illustrated and GamePro. This is only a moderate market for radio programming, with country music and contemporary hit radio stations faring the best. Many of the young residents would rather spend their free time on the Internet, downloading games, looking for better jobs, surfing to sports websites and participating in chat forums.

©Experian 15
Group H: Aspiring Contemporaries ██ Segment H03: Stable Careers
Young and ethnically diverse singles residing in low‐ and high‐rise apartment buildings and living comfortable lifestyles in big‐city metropolitan areas
Demographics Stable Careers is a collection of young and ethnically diverse singles living in big‐city metros as Los Angeles, CA, Philadelphia, PA and Miami, FL. A quarter of the households are of Hispanic and Asian and are slightly less affluent than others dominated by Generation Y residents. More than half of households have gone to college and most have landed white‐collar jobs in retail, health services and professional offices. Without the financial responsibilities of children, these singles and couples stretch their incomes into comfortable lifestyles. Most of the households live in relatively new apartments—in both low‐ and high‐rise buildings—and pay above‐average rents for the in‐town real estate.
Lifestyles The households in Stable Careers enjoy urbane lifestyles. They take advantage of their urban settings to go to bars, restaurants, concerts and comedy clubs. These young singles are body conscious and spend a fair portion of their free time jogging, lifting weights and doing aerobic exercises at nearby health clubs. Often on the go, they rarely set foot inside banks, preferring ATM machines to pick up cash for shopping trips to stores like Target, Old Navy, Gap and Best Buy. Although they’re drawn to the clearance racks when shopping for clothes, they’re willing to spend extra money for electronic devices such as MP3 players, digital cameras and laptop computers. In Stable Careers, these budget‐conscious consumers enjoy traveling as often as they can, but their trips are typically to U.S. cities and staying with friends and family.
Media The media tastes skew young in Stable Careers. The households make a strong market for a variety of network TV offerings including reality shows, sitcoms, music and late‐night programs, including TV shows such as “Saturday Night Live,” “American Idol” and “Fear Factor.” Most residents prefer compact cars, but they make a point of having high‐end radios to play alternative rock, urban contemporary and contemporary hit music. Their taste in magazines reflects their pop sensibilities, with favorite publications such as Rolling Stone, Vanity Fair and Entertainment Weekly. As early tech adopters, the members of Stable Careers are computer literate, and they go online frequently to search for jobs, chat, download music and check out the local personal ads.

©Experian 16
Group K: Urban Essence ██ Segment K04: Urban Diversity
Young and mobile multi‐ethnic singles and single‐parent families living in inter‐city neighborhoods in a mix of rowhouses and high‐rise apartment buildings
Demographics With nearly half of households containing minorities, Urban Diversity is known as a transient world of young, multi‐ethnic singles and single‐parent families. In these inter‐city neighborhoods, residents struggle against challenging economics in a mix of rowhouses and high‐rise apartment buildings. Most adults have completed high school or some college, with many working at entry‐level jobs in retail, health care and food services. With a high unemployment rate, the median income is a third below the general population, and sometimes it’s a stretch for households to make the rent for their less‐than‐lavish apartments that nevertheless cost more than the U.S. average. Young and mobile, a disproportionate number have lived in their units less than a year and mostly alone.
Lifestyles Modest incomes haven’t kept the young members of Urban Diversity from leading vibrant lifestyles. They have high rates for going to nightclubs, theme parks, comedy clubs and bowling alleys. They enjoy an impressive number of athletic activities, from soccer and basketball to weight lifting and jogging. Residents describe themselves as the first among their friends to try a new store and fashion, but they also frequent retail chains like Old Navy, Marshalls and Mervyn’s. With a third of households having children, this is a strong market for kids’ products including toys, books, dolls, board games and easy‐to‐prepare foods such as lunch kits and frozen pizza. They buy consumer electronics for themselves and their kids, including video game devices, MP3 players and digital cameras. They claim they’re not good at saving money, but prefer the safety of short‐term CDs versus stocks or other investments.
Media The households of Urban Diversity are omnivorous media fans. They describe themselves as TV addicts, radio lovers, regular movie‐goers and Internet surfers. Television is still their entertainment source of choice, and they watch sitcoms, reality shows, evening animation and late‐night talk shows all at high rates. On their radios, they gravitate to talk stations, Spanish programming and urban contemporary music. Residents alternate between reading ethnic‐targeted magazines and mainstream titles covering music, parenting and popular culture. They pick up a daily newspaper for job and TV listings. These young households typically go online each day for a variety of activities, from finding sports scores and job openings to listening to streaming radio and trying their luck at gambling sites.

BUXTON UPDATE – SITES 1 AND 2

Ramsey, MN
Operational Status of Retailers
The COR
7550 Sunwood Dr NW
Retailer Concept Website Preferred Square Footage Franchise? Percent
FranchiseOperating
in MN?Targeting MN
for expansion?A&W DRIVE‐IN Fast food www.yum.com 2,000‐3,500 YES 69% YES YESACE HARDWARE Hardware/home improvement www.acehardware.com 10,000‐20,000 NO 0% YES YESAEROPOSTALE INC Apparel ‐ menʹs, apparel ‐ womenʹs www.aeropostale.com 3,500 NO 0% YES YES
ANN TAYLOR Apparel ‐ womenʹs www.anntaylor.com 5,000‐8,400 NO 0% YES YESASHLEY FURNITURE HOMESTORE Furniture/beds www.ashleyfurniture.com 55,000 NO 0% YES YES
BANANA REPUBLIC Apparel ‐ childrenʹs, apparel ‐ menʹs, apparel ‐ womenʹs www.gapinc.com 2,750‐35,000 NO 0% YES YESBASKIN‐ROBBINS ICE CREAM Candy/ice cream/yogurt, fast food www.dunkinbrands.com 1,500‐2,200 YES 100% YES YES
BATTERIES PLUS Computers/software, electronics, specialty www.batteriesplus.com 1,200‐1,800 YES 96% YES YESBED BATH & BEYOND Bed and bath linens, cutlery/kitchenware, home decor/lamps/drapes, discount stores www.bedbathandbeyond.com 5,500‐85,000 NO 0% YES YES
BEST BUY Computers/software, electronics, major appliances www.bestbuy.com 5,000‐45,000 NO 0% YES YESBIG BOY Restaurants/bars www.bigboy.com 5,200 YES 97% NO YES
BLIMPIE SUBS & SALADS Fast food www.kahalacorp.com 250‐3,000 YES 75% YES YESBUFFALO WILD WINGS Restaurants/bars www.buffalowildwings.com 5,000‐7,000 YES 65% YES YES
BUILD A BEAR Amusement/play centers, specialty www.buildabear.com 1,500‐3,000 NO 0% YES YESBURGER KING Fast food www.bk.com 1,900‐4,000 YES 86% YES YES
CACHE Apparel ‐ womenʹs www.cache.com 1,800‐2,000 NO 0% YES YESCAMPBOWWOW Pets/animal supplies www.campbowwowusa.com 7,500‐10,000 NO 0% YES YES
CARIBOU COFFEE CO Coffee bars/juice bars www.cariboucoffee.com 1,600 YES 18% YES YESCARTRIDGE WORLD Specialty www.cartridgeworld.com 800‐1,400 YES 100% YES YES
CATHERINES STORES CORP Apparel ‐ womenʹs www.charmingshoppes.com 3,000‐7,000 NO 0% YES YESCHICOʹS Accessories, apparel ‐ womenʹs www.chicos.com 1,500‐4,000 YES 1% YES YES
CHILIʹS GRILL & BAR Fast casual restaurants, restaurants/bars www.brinker.com 5,000‐16,000 YES 27% YES YESCHRISTOPHER & BANKS INC Apparel ‐ womenʹs www.christopherandbanks.com 3,000‐3,600 NO 0% YES YESCOLD STONE CREAMERY Candy/ice cream/yogurt www.kahalacorp.com 250‐3,000 YES 75% YES YESCOSTCO WHOLESALE Furniture/beds, warehouses/wholesale clubs www.costco.com 70,000‐205,000 NO 0% YES YES
COUNTRY KITCHEN RESTAURANT Restaurants/bars www.countrykitchenrestaurants.com 4,500 YES 84% YES NOCOUSINS SUBS Fast food www.cousinssubs.com 1,400‐2,000 YES 91% YES YES
CULVERʹS Candy/ice cream/yogurt, fast casual restaurants www.culvers.com 4,000 YES 98% YES YESCURVES Health clubs/gyms www.curvesforwomen.com 1,000‐1,500 YES 100% YES YES
DAIRY QUEEN Candy/ice cream/yogurt, coffee bars/juice bars, fast food www.idq.com 500‐1,200 YES 99% YES YESDEB SHOP Apparel ‐ menʹs, apparel ‐ womenʹs www.debshops.com 7,500 NO 0% YES YES
DENNYʹS RESTAURANT Fast food, restaurants/bars www.dennys.com 3,200‐4,750 YES 77% YES NODICKʹS SPORTING GOODS Sporting goods/athletic wear www.dickssportinggoods.com 50,000‐60,000 NO 0% YES YESDISCOUNT TIRE CENTER Auto supplies/car care www.tires.com 5,000‐10,000 NO 0% YES YES
DOMINOʹS PIZZA Fast food www.dominos.com 1,000‐1,300 YES 89% YES YESDRESS BARN Apparel ‐ womenʹs www.dressbarn.com 4,000‐8,000 NO 0% YES YES
DUNKIN DONUTS Bakeries/bagels/pretzels www.dunkinbrands.com 1,500‐2,200 YES 100% YES YESFAMOUS DAVEʹS Restaurants/bars www.famousdaves.com 6,000‐10,500 YES 72% YES YES
9/20/2011
Information is drawn from our best
known resources at the time of this study.
Information specific to individual retailers is
subject to change.

Ramsey, MN
Operational Status of Retailers
The COR
7550 Sunwood Dr NW
Retailer Concept Website Preferred Square Footage Franchise? Percent
FranchiseOperating
in MN?Targeting MN
for expansion?FAMOUS FOOTWEAR Shoes www.famousfootwear.com 6,000‐8,000 NO 0% YES YES
FIGAROS ITALIAN KITCHEN Fast food www.figaros.com 1,000‐1,500 YES 100% YES YESFIVE GUYS Restaurants/bars www.fiveguys.com 2,000‐3,000 YES 100% YES NO
FOXʹS PIZZA DEN Fast food www.foxspizza.com 800‐1,800 YES 100% NO YESFUDDRUCKERS INC Fast casual restaurants www.fuddruckers.com 4,500‐7,000 YES 62% YES YES
GLIKʹS DEPARTMENT STORE Apparel ‐ menʹs, apparel ‐ womenʹs, shoes www.gliks.com 4,000‐15,000 NO 0% YES NOGODFATHERʹS PIZZA Fast food www.godfathers.com 3,600‐4,000 YES 84% YES YES
GOLF U S A Sporting goods/athletic wear www.golfusa.com 2,500‐7,000 YES 98% YES YESGREAT CLIPS Beauty salons www.greatclips.com 900‐1,200 YES 100% YES YES
GREAT STEAK & POTATO CO Fast food www.kahalacorp.com 250‐3,000 YES 75% YES YESGUESS RETAIL INC Accessories, apparel ‐ childrenʹs, apparel ‐ menʹs, apparel ‐ womenʹs www.guess.com 4,500 NO 0% YES YES
HALLMARK Cards/stationery www.hallmark.com 3,200‐4,500 YES 86% YES YESHERBERGERS DEPT STORE Department stores www.bonton.com 55,000‐150,000 NO 0% YES YES
HOBBY LOBBY Art supplies/crafts/hobbies www.hobbylobby.com 23,000‐55,000 NO 0% YES YESHOBBYTOWN USA Art supplies/crafts/hobbies, toys/games/video games www.hobbytown.com 3,000‐7,000 YES 100% YES YESHOME DEPOT INC Hardware/home improvement www.homedepot.com 2,400‐150,000 NO 0% YES YES
JERSEY MIKEʹS SUBMARINES Fast food www.jerseymikes.com 1,200‐1,400 YES 63% YES YESJIMMY JOHNʹS Fast casual restaurants www.jimmyjohns.com 900‐1,500 YES 97% YES YES
JOSEPH A BANK CLOTHIERS Apparel ‐ menʹs, off‐price/outlet stores www.josbank.com 4,000‐4,500 YES 2% YES YESJOURNEYS Accessories, apparel ‐ menʹs, apparel ‐ womenʹs, shoes, off‐price/outlet stores www.genesco.com 150‐3,000 NO 0% YES YES
KAY JEWELERS Fine jewelry/watches www.signetgroupplc.com 1,200‐5,500 NO 0% YES YESKOHLʹS DEPARTMENT STORES Department stores www.kohls.com 75,000‐133,000 NO 0% YES YES
LA Z BOY Furniture/beds www.lazboy.com 15,519‐20,479 NO 0% YES YESLANE BRYANT Apparel ‐ womenʹs www.charmingshoppes.com 3,000‐7,000 NO 0% YES YES
LENS CRAFTERS INC Optical/eyewear www.luxottica.com 150‐4,000 NO 0% YES YESLITTLE CAESARʹS PIZZA Fast food www.littlecaesars.com 1,200‐1,600 YES 87% YES YES
LONE STAR STEAKHOUSE & SALOON Restaurants/bars www.lonestarsteakhouse.com 5,800‐16,500 NO 0% NO YESLONGHORN STEAKHOUSE Restaurants/bars www.dardenrestaurants.com 5,500‐8,600 NO 0% YES YESMARBLE SLAB CREAMERY Candy/ice cream/yogurt www.nexcenbrands.com 400‐12,000 YES 60% YES YES
MARSHALLS Apparel ‐ childrenʹs, apparel ‐ menʹs, apparel ‐ womenʹs, home decor/lamps/drapes www.tjx.com 25,000‐65,000 NO 0% YES YESMICHAELʹS Art/collectibles/frames, art supplies/crafts/hobbies www.michaels.com 5,800‐18,200 NO 0% YES YES
MILIOS SANDWICHES Fast food www.milios.com 2,500 NO 0% YES YESMOES SOUTHWEST GRILL Fast food www.focusbrands.com 500‐3,000 YES 66% YES YES
NAPA AUTO PARTS Auto supplies/car care www.genpt.com 5,000‐7,000 YES 81% YES YESNEW YORK & CO Apparel ‐ womenʹs www.nyandcompany.com 6,000‐8,000 NO 0% YES YESOʹCHARLEYʹS Restaurants/bars www.ocharleys.com 7,000‐10,000 YES 5% NO YES
OLD NAVY CLOTHING CO Apparel ‐ childrenʹs, apparel ‐ menʹs, apparel ‐ womenʹs www.gapinc.com 2,750‐35,000 NO 0% YES YESOLIVE GARDEN Restaurants/bars www.dardenrestaurants.com 5,500‐8,600 NO 0% YES YES
9/20/2011
Information is drawn from our best
known resources at the time of this study.
Information specific to individual retailers is
subject to change.

Ramsey, MN
Operational Status of Retailers
The COR
7550 Sunwood Dr NW
Retailer Concept Website Preferred Square Footage Franchise? Percent
FranchiseOperating
in MN?Targeting MN
for expansion?PACIFIC SUNWEAR Apparel ‐ menʹs, apparel ‐ womenʹs www.pacsun.com 3,500‐4,500 NO 0% YES YESPANERA BREAD Bakeries/bagels/pretzels, fast casual restaurants www.panera.com 4,200‐5,000 YES 57% YES YESPAPA MURPHYʹS Fast food www.papamurphys.com 1,200‐1,800 YES 98% YES YESPEARLE VISION Optical/eyewear www.luxottica.com 150‐4,000 NO 0% YES YES
PERKINS Restaurants/bars www.perkinsrestaurants.com 4,200‐7,100 YES 58% YES YESPETSMART Pets/animal supplies www.petsmart.com 19,000‐27,000 NO 0% YES YES
PIZZA FACTORY Restaurants/bars www.pizzafactory.com 200‐5,000 YES 100% NO YESPIZZA RANCH Restaurants/bars www.pizzaranch.com 4,000‐10,000 YES 94% YES YES
PLAY IT AGAIN SPORTS Sporting goods/athletic wear, specialty www.winmarkcorporation.com 2,500‐3,500 YES 100% YES YESPLAY N TRADE Toys/games/video games www.playntrade.com 4,000‐5,000 NO 0% YES YESPOTTERY BARN Bed and bath linens, china/glassware, cutlery/kitchenware, home decor/lamps/drapes www.williams‐sonomainc.com 1,800‐20,000 NO 0% YES YES
POWERHOUSE GYM Health clubs/gyms www.powerhousegym.com 9,000‐12,000 YES 36% YES YESQUIZNO Fast casual restaurants www.quiznos.com 1,200‐1,600 YES 100% YES YES
RED ROBIN Restaurants/bars www.redrobin.com 6,350 YES 34% YES YESROLY POLY Fast food www.rolypolyusa.com 1,000‐1,700 YES 100% YES YES
RUE 21 Apparel ‐ menʹs, apparel ‐ womenʹs www.rue21.com 4,000‐5,000 NO 0% YES YESSCHLOTZSKYʹS DELI Fast casual restaurants www.schlotzskys.com 2,400‐2,800 YES 94% YES YES
SEPHORA Cosmetics/body care/fragrance www.sephora.com 5,200‐5,700 NO 0% YES YESSHERWIN‐WILLIAMS CO Wall coverings/paint www.sherwinwilliams.com 3,000‐6,000 NO 0% YES YES
SPORT CLIPS Beauty salons www.sportclips.com 1,000‐1,400 NO 0% YES YESSTARBUCKS Coffee bars/juice bars www.starbucks.com 100‐2,000 NO 0% YES YESSTRIDE RITE Shoes www.strideritecorporation.com 1,000‐3,000 NO 0% YES YEST J MAXX Apparel ‐ childrenʹs, apparel ‐ menʹs, apparel ‐ womenʹs, home decor/lamps/drapes www.tjx.com 25,000‐65,000 NO 0% YES YES
TACO DEL MAR Fast food www.tacodelmar.com 1,200‐1,500 NO 0% NO YESTARGET Discount stores, supercenters www.target.com 123,000‐174,000 NO 0% YES YES
THE CHILDRENʹS PLACE Apparel ‐ childrenʹs, toys/games/video games www.childrensplace.com 4,000‐6,500 NO 0% YES YESTIRE CENTERS INC Auto supplies/car care www.tirecenters.com 10,000‐35,000 NO 0% NO YES
TRUE VALUE HARDWARE Hardware/home improvement www.truevaluecompany.com 3,500‐15,000 NO 0% YES YESTUESDAY MORNING INC Close‐out stores www.tuesdaymorning.com 8,000‐10,000 NO 0% YES YESUNO RESTAURANTS INC Restaurants/bars www.unos.com 5,500‐6,000 YES 38% YES YES
WALGREENS Drug stores www.walgreens.com 14,560 NO 0% YES YESWENDYʹS Fast food www.wendys.com 3,000‐6,000 YES 77% YES YES
WHITE CASTLE RESTAURANT Fast food www.whitecastle.com 2,000‐3,000 NO 0% YES YESWILD BIRDS UNLIMITED Pets/animal supplies www.wildbird.com 1,500‐2,400 YES 5% YES YES
WINE STYLES Beer/wine/liquor www.winestyles.net 1,200‐2,000 YES 100% YES YESWINGS TO GO Fast food www.wingstogo.com 1,200‐2,000 YES 100% NO YES
YANKEE CANDLE CO Specialty www.yankeecandle.com 1,300‐2,000 NO 0% YES YESZUMIEZ Apparel ‐ menʹs, apparel ‐ womenʹs, shoes www.zumiez.com 3,000 NO 0% YES YES
9/20/2011
Information is drawn from our best
known resources at the time of this study.
Information specific to individual retailers is
subject to change.

Ramsey, MNRetail Match List
The COR 7550 Sunwood Dr NW
These retailers are good matches.
Retailer Distance Address City StateA&W DRIVE‐IN 13.4 16777 MARKETPLACE DR BIG LAKE MNACE HARDWARE 5.1 13735 ROUND LAKE BLVD NW ANDOVER MNANN TAYLOR 9.7 12265 ELM CREEK BLVD MAPLE GROVE MN
ASHLEY FURNITURE HOMESTORE 9.9 6497 LABEAUX AVE NE ALBERTVILLE MNBANANA REPUBLIC 9.7 12245 ELM CREEK BLVD MAPLE GROVE MN
BASKIN‐ROBBINS ICE CREAM NONE KNOWN TO BE IN AREABIG BOY NONE KNOWN TO BE IN AREA
BLIMPIE SUBS & SALADS 19.0 788 CLEVELAND AVE SW NEW BRIGHTON MNBUILD A BEAR 18.2 12567 WAYZATA BLVD MINNETONKA MN
CACHE 18.2 12321 WAYZATA BLVD MINNETONKA MNCAMPBOWWOW 16.0 2067 E CENTER CIR PLYMOUTH MN
CATHERINES STORES CORP 9.9 6415 LABEAUX AVE NE ALBERTVILLE MNCHICOʹS 9.7 7817 MAIN ST N MAPLE GROVE MN
CHILIʹS GRILL & BAR 11.9 1430 109TH AVE NE BLAINE MNCOLD STONE CREAMERY 5.6 3461 RIVER RAPIDS DR COON RAPIDS MN
COUNTRY KITCHEN RESTAURANT 14.4 7849 42ND AVE N NEW HOPE MNCURVES 5.0 646 E RIVER RD ANOKA MN
DENNYʹS RESTAURANT 5.0 13450 ROGERS DR ROGERS MNDUNKIN DONUTS NONE KNOWN TO BE IN AREA
FIGAROS ITALIAN KITCHEN NONE KNOWN TO BE IN AREAFIVE GUYS 9.7 7814 MAIN ST N MAPLE GROVE MN
FOXʹS PIZZA DEN NONE KNOWN TO BE IN AREAFUDDRUCKERS INC 26.4 3801 MINNESOTA DR BLOOMINGTON MN
GLIKʹS DEPARTMENT STORE NONE KNOWN TO BE IN AREAGODFATHERʹS PIZZA 4.8 12490 CHAMPLIN DR CHAMPLIN MN
GOLF U S A 26.4 8427 JOINER WAY EDEN PRAIRIE MNGREAT STEAK & POTATO CO 19.9 555 NICOLLET MALL MINNEAPOLIS MN
GUESS RETAIL INC 28.3 260 SOUTH AVE MINNEAPOLIS MNHERBERGERS DEPT STORE 12.3 301 NORTHTOWN DR BLAINE MN
HOBBY LOBBY NONE KNOWN TO BE IN AREAHOBBYTOWN USA 10.9 7632 BROOKLYN BLVD BROOKLYN PARK MN
JERSEY MIKEʹS SUBMARINES 19.0 2704 HWY 88 ST ANTHONY VILLAGE MNJOSEPH A BANK CLOTHIERS 9.7 12215 ELM CREEK BLVD MAPLE GROVE MN
JOURNEYS 9.7 12457 ELM CREEK BLVD MAPLE GROVE MNLA Z BOY NONE KNOWN TO BE IN AREA
LENS CRAFTERS INC 9.7 12131 ELM CREEK BLVD MAPLE GROVE MNLONE STAR STEAKHOUSE & SALOON NONE KNOWN TO BE IN AREA
LONGHORN STEAKHOUSE NONE KNOWN TO BE IN AREAMARBLE SLAB CREAMERY NONE KNOWN TO BE IN AREA
MARSHALLS 9.9 11421 FOUNTAINS DR MAPLE GROVE MNMILIOS SANDWICHES 21.7 2620 E FRANKLIN AVE MINNEAPOLIS MN
MOES SOUTHWEST GRILL NONE KNOWN TO BE IN AREANAPA AUTO PARTS 4.8 21075 S DIAMOND LAKE RD ROGERS MNNEW YORK & CO 9.9 6415 LABEAUX AVE NE ALBERTVILLE MNOʹCHARLEYʹS NONE KNOWN TO BE IN AREA
OLIVE GARDEN 9.6 12520 ELM CREEK BLVD MAPLE GROVE MNPACIFIC SUNWEAR 9.7 12465 ELM CREEK BLVD MAPLE GROVE MNPAPA MURPHYʹS 7.6 19112 FREEPORT ST NW ELK RIVER MNPIZZA FACTORY NONE KNOWN TO BE IN AREAPIZZA RANCH 17.1 1220 HWY 25 S MONTICELLO MN
Distance is the straight-line mileage
from your site to nearest existing
retailer location. 9/20/2011
Retailers with locations greater than
fifty miles from this site are shown
"None known to be in area."

Ramsey, MNRetail Match List
The COR 7550 Sunwood Dr NW
Retailer Distance Address City StatePLAY IT AGAIN SPORTS 7.8 19268 EVANS ST ELK RIVER MN
PLAY N TRADE NONE KNOWN TO BE IN AREAPOTTERY BARN 9.7 12225 ELM CREEK BLVD MAPLE GROVE MN
POWERHOUSE GYM NONE KNOWN TO BE IN AREAQUIZNO 12.9 7610 UNIVERSITY AVE NE MINNEAPOLIS MN
RED ROBIN 15.5 2669 CAMPUS DR PLYMOUTH MNROLY POLY 25.5 7733 FLYING CLOUD DR EDEN PRAIRIE MN
RUE 21 9.9 6415 LABEAUX AVE NE ALBERTVILLE MNSCHLOTZSKYʹS DELI 25.1 3425 W 66TH ST EDINA MN
SPORT CLIPS 5.7 3540 MAIN ST NW COON RAPIDS MNSTARBUCKS 5.2 21615 S DIAMOND LAKE RD ROGERS MNSTRIDE RITE 25.2 2915 SOUTHDALE CENTER EDINA MNT J MAXX 10.3 8081 BROOKLYN BLVD BROOKLYN PARK MN
TACO DEL MAR NONE KNOWN TO BE IN AREATHE CHILDRENʹS PLACE 9.7 12157 ELM CREEK BLVD MAPLE GROVE MNTRUE VALUE HARDWARE 5.0 12325 CHAMPLIN DR CHAMPLIN MNTUESDAY MORNING INC 17.3 10100 6TH AVE N PLYMOUTH MNUNO RESTAURANTS INC NONE KNOWN TO BE IN AREA
WALGREENS 4.0 1911 FERRY ST ANOKA MNWHITE CASTLE RESTAURANT 5.8 3465 124TH AVE NW COON RAPIDS MN
WILD BIRDS UNLIMITED 18.0 11210 WAYZATA BLVD MINNETONKA MNWINE STYLES 13.5 314 CLYDESDALE TRAIL MEDINA MNWINGS TO GO NONE KNOWN TO BE IN AREA
ZUMIEZ 9.9 6500 LABEAUX AVE NE ALBERTVILLE MN
Distance is the straight-line mileage
from your site to nearest existing
retailer location. 9/20/2011
Retailers with locations greater than
fifty miles from this site are shown
"None known to be in area."

Ramsey, MNRetail Match List
The COR 7550 Sunwood Dr NW
These retailers match well but their existing locations are in close proximity of your site.
Retailer Distance Address City StateAEROPOSTALE INC 5.5 12768 RIVERDALE BLVD COON RAPIDS MNBATTERIES PLUS 6.5 2740 MAIN ST NW COON RAPIDS MN
BED BATH & BEYOND 5.5 12773 RIVERDALE BLVD COON RAPIDS MNBEST BUY 5.0 20870 ROGERS DR ROGERS MN
BUFFALO WILD WINGS 5.6 3395 RIVER RAPIDS DR COON RAPIDS MNBURGER KING 0.6 7205 N HWY 10 RAMSEY MN
CARIBOU COFFEE CO 0.5 7988 SUNWOOD DR NW RAMSEY MNCARTRIDGE WORLD 5.6 12667 RIVERDALE BLVD COON RAPIDS MN
CHRISTOPHER & BANKS INC 5.5 12771 RIVERDALE BLVD NW COON RAPIDS MNCOSTCO 5.8 12547 RIVERDALE BLVD COON RAPIDS MN
COUSINS SUBS 1.7 6401 W HWY 10 RAMSEY MNCULVERʹS 3.1 800 W MAIN ST ANOKA MN
DAIRY QUEEN 3.7 424 MAIN ST ANOKA MNDEB SHOP 5.6 12646 RIVERDALE BLVD COON RAPIDS MN
DICKʹS SPORTING GOODS 5.6 12661 RIVERDALE BLVD COON RAPIDS MNDISCOUNT TIRE CENTER 5.2 12921 RIVERDALE DR NW COON RAPIDS MN
DOMINOʹS PIZZA 3.4 6014 167TH AVE NW RAMSEY MNDRESS BARN 5.5 12761 RIVERDALE BLVD NW COON RAPIDS MN
FAMOUS DAVEʹS 6.1 3211 NORTHDALE BLVD COON RAPIDS MNFAMOUS FOOTWEAR 5.5 12761 RIVERDALE BLVD NW COON RAPIDS MN
GREAT CLIPS 3.1 14050 ST FRANCIS BLVD RAMSEY MNHALLMARK 5.5 12755 RIVERDALE BLVD NW COON RAPIDS MN
HOME DEPOT INC 5.7 3550 124TH AVE NW COON RAPIDS MNJIMMY JOHNʹS 3.1 14050 ST FRANCIS BLVD RAMSEY MNKAY JEWELERS 5.6 12669 RIVERDALE BLVD COON RAPIDS MN
KOHLʹS DEPARTMENT STORES 5.3 21985 S DIAMOND LAKE RD ROGERS MNLANE BRYANT 5.5 12774 RIVERDALE BLVD NW COON RAPIDS MN
LITTLE CAESARʹS PIZZA 2.8 1100 W HWY 10 ANOKA MNMICHAELʹS 5.8 3460 124TH AVE NW COON RAPIDS MN
OLD NAVY CLOTHING CO 5.5 12767 RIVERDALE BLVD NW COON RAPIDS MNPANERA BREAD 5.9 12465 RIVERDALE BLVD NW COON RAPIDS MNPEARLE VISION 5.5 12771 RIVERDALE BLVD COON RAPIDS MN
PERKINS 3.4 601 W MAIN ST ANOKA MNPETSMART 5.5 3589 RIVER RAPIDS DR COON RAPIDS MNSEPHORA 5.8 12550 RIVERDALE BLVD COON RAPIDS MN
SHERWIN‐WILLIAMS CO 5.7 3564 MAIN ST NW COON RAPIDS MNTARGET 5.2 21615 S DIAMOND LAKE RD ROGERS MN
TIRE CENTERS INC 4.6 12999 WILFRED LANE ROGERS MNWENDYʹS 3.1 480 BUNKER LAKE BLVD NW ANOKA MN
YANKEE CANDLE CO 5.5 12782 RIVERDALE BLVD NW COON RAPIDS MN
Distance is the straight-line mileage
from your site to nearest existing
retailer location. 9/20/2011
Retailers with locations greater than
fifty miles from this site are shown
"None known to be in area."

RAMSEY STATION TOD MARKET ANALYSIS
Prepared for:
City of Ramsey Northstar Corridor Development Authority
Prepared by:
McComb Group, Ltd. Vantage Point Development Advisors Economic & Planning Systems, Inc.
May 2013

RAMSEY STATION TOD MARKET ANALYSIS
Prepared for:
City of Ramsey Northstar Corridor Development Authority
Prepared by:
McComb Group, Ltd. Vantage Point Development Advisors Economic & Planning Systems, Inc.
May 2013

[Back of inside coversheet]
“The work that provided the basis for this publication was supported by funding under an award with the U.S. Department of Housing and Urban Development. The substance and findings of the work are dedicated to the public. The author and publisher are solely responsible for the accuracy of the statements and interpretations contained in this publication. Such interpretations do not necessarily reflect the views of the Government."

i
TABLE OF CONTENTS Chapter Subject Page
EXECUTIVE SUMMARY ................................................................................ vii
Northstar Commuter Rail ...................................................................................... vii Commuter Rail ....................................................................................................... ix Commuter Rail Transit-Oriented Development ..................................................... ix Ramsey Development Potential ...............................................................................x Residential Development ................................................................................. xi Retail Development ........................................................................................ xii Office Development ........................................................................................ xii I INTRODUCTION.............................................................................................. 1-1
Background .......................................................................................................... 1-1 Transit Oriented Development ............................................................................. 1-2 Commuter Rail vs. Light Rail .............................................................................. 1-4 Commuter Rail TOD ............................................................................................ 1-5 Application to Northstar Corridor ........................................................................ 1-6 II NORTHSTAR CORRIDOR STATIONS ........................................................ 2-1
Ramsey Commuting............................................................................................. 2-4 III REGIONAL ECONOMIC AND DEMOGRAPHIC FRAMEWORK ......... 3-1
Employment Trends ............................................................................................. 3-1 Corridor Employment .................................................................................... 3-3 Major Industries and Drivers ......................................................................... 3-6 Major Employers ........................................................................................... 3-7 Ramsey Employment ..................................................................................... 3-8 Population and Households.................................................................................. 3-8 Population and Household Forecasts ........................................................... 3-10 IV NORTHSTAR CORRIDOR RESIDENTIAL MARKET CONDITIONS ... 4-1
Residential Market ............................................................................................... 4-1 For-Sale Market ............................................................................................. 4-3 Apartment Market .......................................................................................... 4-4 Ramsey Population and Households .................................................................... 4-5 Ramsey Residential Market ................................................................................. 4-9 For-Sale Market ............................................................................................. 4-9 Apartment Market ........................................................................................ 4-11 Ramsey Realtor Surveys .................................................................................... 4-13 Residential Growth Estimates ............................................................................ 4-14 Twin Cities Area Residential Growth Corridors ......................................... 4-15 Historic Residential Growth ........................................................................ 4-16 Ramsey Residential Growth ........................................................................ 4-17 Multi-Family Development Trends ............................................................. 4-18 Household Formation................................................................................... 4-19

ii
TABLE OF CONTENTS (continued) Chapter Subject Page
Stabilized Residential Demand .................................................................... 4-20 Ramsey Residential Demand ....................................................................... 4-21 V COMMERCIAL REAL ESTATE.................................................................... 5-1
Twin Cities Area Retail Market ........................................................................... 5-1 Northstar Corridor Shopping Centers .................................................................. 5-1 Ramsey Shopping Centers ................................................................................... 5-3 Ramsey Retail Development ................................................................................ 5-3 Office Market ....................................................................................................... 5-3 Ramsey Office Space ........................................................................................... 5-5 Planned Development .......................................................................................... 5-5 Industrial Market .................................................................................................. 5-5 Ramsey Industrial Development .......................................................................... 5-6 VI RAMSEY STATION DRAW AREA DEMOGRAPHICS ............................. 6-1
Ramsey Station Draw Area .................................................................................. 6-1 Population and Households ............................................................................. 6-1 Household Income ........................................................................................... 6-2 Household Density Distribution ...................................................................... 6-3 Household Income Distribution ...................................................................... 6-4 Population Age ................................................................................................ 6-5 Demographic Characteristics .......................................................................... 6-6 Station Area Sales Potential ................................................................................. 6-6 VII RAMSEY STATION AREA DEVELOPMENT POTENTIAL .................... 7-1
Ramsey Station .................................................................................................... 7-1 Commuter Service ........................................................................................... 7-2 Traffic Counts .................................................................................................. 7-3 Surrounding Land Use and Development ....................................................... 7-3 The COR at Ramsey ............................................................................................ 7-4 Civic Amenities ............................................................................................... 7-5 Commercial Projects ....................................................................................... 7-6 Medical ............................................................................................................ 7-6 Education ......................................................................................................... 7-7 Residential Projects ......................................................................................... 7-7 Development Summary ....................................................................................... 7-7 Planned Developments .................................................................................... 7-8 Land Use Plans and Policies ................................................................................ 7-8 Infrastructure Plans and Needs ............................................................................ 7-8 Development Opportunities ................................................................................. 7-9 Residential Development .............................................................................. 7-10 Retail Development ........................................................................................... 7-11 Office Development ........................................................................................... 7-11

iii
TABLE OF CONTENTS (continued) Chapter Subject Page
APPENDICES
Appendix A: Demographic Characteristics Appendix B: Retail and Services Sales Potential and Supportable Space
LIST OF TABLES Table Title Page
1-1 U.S. Commuter Rail Systems Ranked by Ridership ............................................ 1-5
2-1 Northstar Station Draw Areas Workers and Those That Work in Minneapolis ..................................................................................................... 2-3
2-2 Northstar Riders and Station Draw Areas Residents Working in Minneapolis; 2010 ........................................................................................... 2-3
2-3 Ramsey Station Draw Area Resident Commuting; 2010 Residents That Work in Other Station Cities ........................................................................... 2-4
2-4 Ramsey Workers That Live in Other Station Draw Areas; 2010 ........................ 2-5
3-1 MSA and Anoka and Sherburne Counties Total Employment; 2001 to 2011 ..... 3-1
3-2 Minneapolis-St. Paul MSA Non-Farm Employment by Industry; 2001 to 2011 ................................................................................................................. 3-2
3-3 Anoka County Non-Farm Employment by Industry; 2001 to 2011 .................... 3-4
3-4 Sherburne County Non-Farm Employment by Industry; 2001 to 2011 .............. 3-5
3-5 Corridor Communities Employment; 2000 to 2011 ............................................ 3-6
3-6 Ramsey Employment Trends; 2002 to 2010 ........................................................ 3-8
3-7 Twin Cities Area Population; 2000 to 2010 ........................................................ 3-9
3-8 Twin Cities Area Households; 2000 to 2010 ....................................................... 3-9
3-9 Corridor Communities Population and Households; 2000 to 2010 ................... 3-10
3-10 Northstar Corridor Population and Household Forecast; 2010 to 2030 ............ 3-10
4-1 Residential Building Permits: MSA and Anoka and Sherburne Counties; 2000 to 2011 .................................................................................................... 4-2
4-2 Northstar Corridor Cities Residential Building Permits; 2000 to 2011 ............... 4-3
4-3 Twin Cities Area Average Home Price; 2005 to 2011 ........................................ 4-4
4-4 Twin Cities Area Apartment Market; 2nd Quarter 2011 ...................................... 4-5
4-5 City of Ramsey Population, Households, and Tenure; 2000 and 2010 ............... 4-5
4-6 City of Ramsey and Minneapolis-St. Paul MSA Housing Tenure; 2000 and 2010 ................................................................................................................. 4-6

iv
LIST OF TABLES (continued) Table Title Page
4-7 City of Ramsey Households by Type; 2000 and 2010 ........................................ 4-6
4-8 City of Ramsey and Minneapolis-St. Paul MSA Households by Age of Householder; 2010 .......................................................................................... 4-7
4-9 City of Ramsey and Minneapolis-St. Paul MSA Household Income; 2010 ........ 4-8
4-10 Ramsey Residential Building Permits; 2000 to 2012 .......................................... 4-9
4-11 Ramsey Home Sales; 2005 to 2012 ................................................................... 4-10
4-12 Ramsey Average Home Sale Price; 2005 to 2012 ............................................. 4-10 4-13 Ramsey Foreclosed Sales; 2005 to 2012 ........................................................... 4-11
4-14 Ramsey Apartments: Year Built and Number of Units ..................................... 4-12
4-15 Ramsey Apartments: Unit Size, Rent, and Rent per Square Foot ..................... 4-12
4-16 Seven-County Metropolitan Area, North Growth Corridor, Northstar Corridor Draw Area, Ramsey Station Draw Area, and Ramsey Residential Building Permits; 1991 to 2012 .................................................. 4-16
4-17 Northstar Corridor Draw Area, Northstar Cities, Other Cities, and Ramsey Multi-Family Building Permits; 1991 to 2012 .............................................. 4-18
4-18 Seven-County Metropolitan Area Plus Sherburne County, North Growth Corridor, Northstar Corridor Draw Area, Ramsey Station Draw Area, and Ramsey Household Projections; 2013 to 2035 .............................................. 4-22
5-1 Twin Cities Area Retail Inventory; 3rd Quarter 2011 .......................................... 5-1
5-2 Northstar Corridor Major Shopping Centers ....................................................... 5-2
5-3 Ramsey Retail Rental Rates ................................................................................. 5-3
5-4 Twin Cities Area Office Market; 4th Quarter 2011 .............................................. 5-4
5-5 Ramsey Office Rental Rates ................................................................................ 5-4
5-6 Twin Cities Area Industrial Market; 3rd Quarter 2011 ......................................... 5-5
6-1 Ramsey Station and Northstar Corridor Draw Areas and Seven-County Metropolitan Area Population and Household Growth Trends 2000 Census; 2011 and 2016 Estimated .......................................................... 6-2
6-2 Ramsey Station and Northstar Corridor Draw Areas and Seven-County Metropolitan Area Average and Median Household Income 2000 Census; 2011 and 2016 Estimated .......................................................... 6-3
6-3 Ramsey Station and Northstar Corridor Draw Areas and Seven-County Metropolitan Area Household Income Distribution: 2000 Census; 2011 and 2016 Estimated ................................................................................ 6-5
6-4 Ramsey Station Draw Area Population by Age; 2011 and 2016 ......................... 6-5
6-5 Ramsey Station Draw Area Demographic and Income Snapshot ....................... 6-7
6-6 Northstar Corridor Draw Area Demographic and Income Snapshot ................... 6-8

v
LIST OF TABLES (continued) Table Title Page
6-7 Seven-County Metropolitan Area Demographic and Income Snapshot .............. 6-9
6-8 Ramsey Northstar Rider Retail Sales Potential and Supportable Space by Merchandise Category; 2016 .................................................................... 6-10
6-9 Ramsey Northstar Rider Supportable Space by Merchandise Category; 2016 and 2020 ............................................................................................... 6-11
7-1 Northstar Commuter Rail Ridership by Station; 2012 ......................................... 7-2 7-2 Ramsey Station Area Average Daily Traffic Counts; 2010 ................................. 7-3
7-3 The COR at Ramsey Development ...................................................................... 7-5
7-4 Ramsey Development by Type; 2002 to 2011 ..................................................... 7-8
7-5 The COR Developable Acres ............................................................................... 7-9
LIST OF MAPS Map Title Page
2-1 Northstar Corridor Draw Areas ........................................................................... 2-2
4-1 Ramsey Apartments ........................................................................................... 4-11
4-2 North Growth Corridor ...................................................................................... 4-15
4-3 Northstar Corridor Draw Areas ......................................................................... 4-16
6-1 Ramsey Station Draw Area .................................................................................. 6-1
6-2 Ramsey Station Draw Area Estimated 2016 Household Density ........................ 6-3
6-3 Ramsey Station Draw Area Estimated 2016 Household Income: Percent Above $75,000 ................................................................................................ 6-4
7-1 Ramsey Station Location ..................................................................................... 7-1
LIST OF FIGURES Figure Title Page
i Northstar Commuter Rail Line ............................................................................. vii
ii Northstar Corridor Cities ..................................................................................... viii
iii The COR at Ramsey Development Plan ..................................................................x
1-1 Northstar Corridor Stations .................................................................................. 1-1
1-2 Northstar Line Station Typology ......................................................................... 1-3
2-1 Northstar Park-and-Ride User Origins ................................................................. 2-1

vi
LIST OF FIGURES (continued) Figure Title Page
3-1 Employment by Industry as Percent of Total MSA and Anoka and Sherburne Counties ......................................................................................... 3-6
3-2 Northstar Corridor Major Employers................................................................... 3-7
4-1 Minneapolis and Selected Cities Home Price Index, 2000 to 2011 ..................... 4-3
4-2 City of Ramsey and Minneapolis-St. Paul MSA Percent of Households by Type; 2010 ....................................................................................................... 4-7
4-3 City of Ramsey and Minneapolis-St. Paul MSA Household Income Distribution; 2010 ............................................................................................ 4-8
4-4 Metropolitan Area Building Permits; 1990 to 2012; Stabilized Residential Demand; 2013 to 2035 .................................................................................. 4-21
5-1 Northstar Corridor Major Retail Centers ............................................................. 5-2
7-1 Northstar Schedule – Ramsey Station .................................................................. 7-2
7-2 Ramsey Station Existing Conditions ................................................................... 7-4
7-3 The COR at Ramsey Development Plan ............................................................ 7-10

vii
EXECUTIVE SUMMARY This report summarizes the analysis and conclusions regarding the market for transit oriented development (TOD) at the Ramsey Station and other station areas on the Northstar commuter rail line in the Twin Cities area. The study was completed under a contract with the Northstar Corridor Development Authority (NCDA) with funding provided by the Metropolitan Council through a HUD Sustainability Grant. Northstar Commuter Rail
The Northstar Line opened in 2009 with service between Big Lake and Target Field in downtown Minneapolis, Minnesota, a distance of 40 miles. Stations are located in Big Lake, Elk River, Ramsey, Anoka, Coon Rapids, Fridley, and Target Field in Minneapolis, as shown in Figure i. Each of the Northstar station cities has unique characteristics, as shown in Figure ii.
Figure i
NORTHSTAR COMMUTER RAIL LINE
Source: EPS.

Figu
re ii
Ch
aracteristic
Fridley
7.87
miles
Coon
Rap
ids
17.0 m
iles
Ano
ka19
.0 m
iles
Ramsey
23.2 m
iles
Elk River
28.6 m
iles
Big Lake
38.8 m
iles
Station Area
Topo
grap
hy
Reside
ntial
Emph
asis
Commuter
Reside
ntial
Emph
asis
Commuter
Reside
ntial
Emph
asis
Commuter
Town Ce
nter
Activity
Cen
ter
Commuter
Reside
ntial
Commun
ity
First ring subu
rb,
develope
d 40
s and 50
s
Second
ring
subu
rb,
develope
d 70
s and 80
s
Historic river city,
coun
ty seat
Third ring
sub
urb,
new to
wn center,
significant growth
Historic river city,
coun
ty seat,
significant growth
Historic lakeside
commun
ity,
significant growth
Opp
ortunity
Rede
velopm
ent
sites
Rede
velopm
ent
site
Rede
velopm
ent
sites
Green
field
Develop
men
t
Rede
velopm
ent
Green
field
Develop
men
t
Green
field
Develop
men
t
Wha
t’s un
ique
? Indu
strial
rede
velopm
ent
Adjacen
t to
Riverdale Mall
Adjacen
t to Ru
m
River
VA and
Allina
Clinics
City owne
d indu
strial park –
75 acres
Multi‐family
housing ne
ar
station
Wha
t’s
happ
ening?
Busine
ss park and
reside
ntial
developm
ent
Ano
ka Cou
nty
owns 15‐acre
station area
site
VOA 178
‐unit
senior hou
sing
280 un
its TOD
multi‐family
housing
Station area
de
velopm
ent
prop
osed
38 units of
housing ‐ 2
013
Adjacen
t activity
Reside
ntial
Commercial
Indu
strial
Reside
ntial
Retail
Reside
ntial
Institu
tional
indu
strial
Public
Reside
ntial
Office
Med
ical
Retail
Indu
strial
Reside
ntial
Retail
Indu
strial
Reside
ntial
Retail
Conn
ectivity
Avg. H
ouseho
ld
Income ‐ 2
010
$60,33
7 $7
2,84
8 $6
0,11
3 $8
7,09
6 $8
3,02
4 $6
7,97
0
Med
ian Age
‐ 2010
37
.1
36.9
37.6
34.9
34.9
29.5
NORT
HSTAR CO
RRIDOR CITIES
Distance from
Target F
ield Station
, Dow
ntow
n Minne
apolis
Lori
Text Box
viii

ix
The Northstar Line runs on existing Burlington Northern Santa Fe (BNSF) tracks with five weekday morning downtown inbound trips and five outbound weekday trips. There is one reverse commute trip each day. Daily ridership averages 2,400 riders per day with a target of 5,900 riders per day by 2030. There is limited weekend service as well as extra trips provided for special events such as Minnesota Twins (baseball) and Vikings (football) games. Commuter Rail
Commuter rail differs from light rail or heavy rail in terms of its characteristics and markets served; similarly TOD opportunities associated with commuter rail also have some important distinctions. Commuter rail is most often passenger transit service utilizing diesel or electric propelled trains on existing track that are also utilized by freight or other passenger trains. It generally provides frequent peak-hour service and work trip oriented service of longer distances, typically 20 miles or more, with spacing between stations ranging from two to five miles, compared to light rail with station area spacing of three to six blocks and frequent service for 22 hours per day. Commuter Rail Transit-Oriented Development
Transit-oriented development (TOD) can be defined as mixed-use residential or commercial development within walking distance of a transit station designed to maximize access to transit and incorporating features designed to encourage transit ridership. A TOD often resembles other activity centers with a greater mix of uses and higher densities than the surrounding market area. The presence of transit at a station location can have a positive effect on market and development potentials in the immediate area because transit improves the regional accessibility of the station area properties, which has a positive impact on property values. These higher land values can support higher development densities and in some cases a different mix of land uses in much the same way as property adjacent to a highway interchange is different from development farther away. However, the presence of transit alone does not translate to greater development potentials. Commuter rail TOD opportunities are also different than those associated with light rail or heavy rail systems due to its more limited scope, both in terms of frequency of service as well as the portion of the region that easily can be accessed by transit. Both factors limit the accessibility premiums that translate to increases in real estate market demand and higher land values. The nature of the commuter-freight rail corridor can also be less compatible with adjacent TOD. The sound levels associated with diesel locomotives and horns are louder, there are often larger transit parking fields, and the frequency of freight rail trains all creates land use impacts that are less compatible with residential and office-based employment development. The existing land development pattern in commuter rail corridors is also often not compatible with TOD, as it can include manufacturing and distribution uses requiring direct rail service as well as other heavy industrial uses which have located near like uses and away from residential and community serving commercial uses. Despite these limitations, there remains a great deal of interest in TOD at commuter station locations, and in particular where the land use and development pattern is less fully built out. There are a number of principles that apply to capitalizing on TOD opportunities at commuter rail station locations. A station area plan that addresses individual station location characteristics, land use, market opportunities and infrastructure needs is key as it provides direction for future development
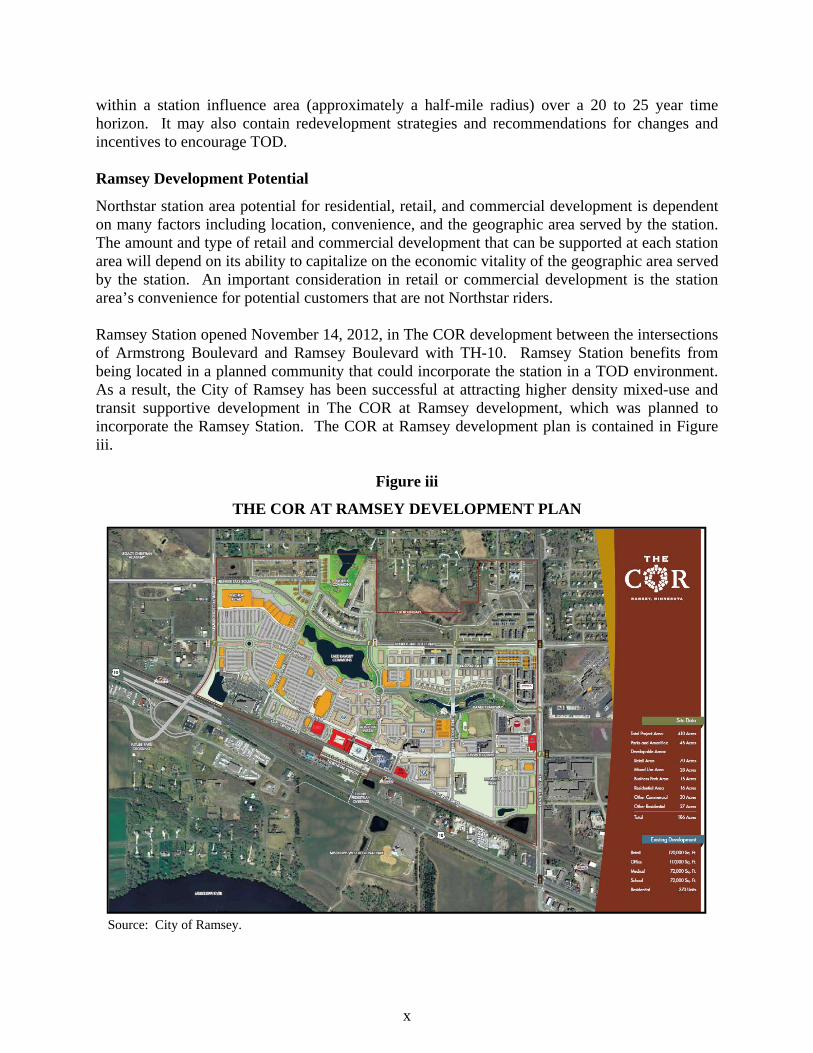
x
within a station influence area (approximately a half-mile radius) over a 20 to 25 year time horizon. It may also contain redevelopment strategies and recommendations for changes and incentives to encourage TOD. Ramsey Development Potential
Northstar station area potential for residential, retail, and commercial development is dependent on many factors including location, convenience, and the geographic area served by the station. The amount and type of retail and commercial development that can be supported at each station area will depend on its ability to capitalize on the economic vitality of the geographic area served by the station. An important consideration in retail or commercial development is the station area’s convenience for potential customers that are not Northstar riders. Ramsey Station opened November 14, 2012, in The COR development between the intersections of Armstrong Boulevard and Ramsey Boulevard with TH-10. Ramsey Station benefits from being located in a planned community that could incorporate the station in a TOD environment. As a result, the City of Ramsey has been successful at attracting higher density mixed-use and transit supportive development in The COR at Ramsey development, which was planned to incorporate the Ramsey Station. The COR at Ramsey development plan is contained in Figure iii.
Figure iii
THE COR AT RAMSEY DEVELOPMENT PLAN
Source: City of Ramsey.

xi
There are approximately 186 developable acres remaining for commercial, business park, and residential, plus 45 acres of parks and amenities, as shown in Figure iii. Retail, business park, and commercial total 115 acres; while residential totals 43 acres and mixed-use is 28 acres and could include commercial and residential. The residential component of The COR is planned at 2,200 units. The COR at Ramsey is a significant development opportunity. The Northstar station location in Ramsey is unique among the Northstar Corridor cities. It’s located on the edge of the planned downtown area served by a large parking structure, which is flanked by City Hall on the east and an apartment building to the west. To the north is Municipal Plaza, which is surrounded by office, residential, or mixed-use development. This creates the opportunity for both daytime and resident population, which can support ground level retail and commercial commensurate with market demand. Business park uses located to the east will offer employment opportunities to Ramsey residents. Planning for the area northwest of the station area is primarily retail. Building configurations in the retail area are illustrative of a power center, which requires a high volume of customer traffic to support its stores. The retail area should be accessible to pedestrians, but most of the customers, even those living in The COR, are likely to drive to the retail area for shopping to facilitate transporting their purchases home. Residential Development
The COR at Ramsey Development Plan provides for a wide variety of housing including single family homes on small lots, townhouses/rowhouses, apartments and/or condominiums, and mixed-use residential buildings. This provides Ramsey with the opportunity to develop housing that appeals to a wide range of markets ranging from singles, young marrieds, move up housing, as well as a variety of senior living options. This ability to tap the full range of housing submarkets will stimulate additional residential development. The COR Development Plan envisions 2,200 housing units in The COR. Previous construction has added 350 housing units and an additional 230 are currently under construction indicating future capacity for over 1,600 units. Market analysis indicates that Ramsey has the potential to add about 7,300 new housing units by 2035. In the near future, Ramsey residential demand is estimated at about 350 units per year. Not all of these units will be located in The COR. Development in other parts of Ramsey is likely to be predominately single family. The COR Development Plan is heavily oriented toward multi-family units, which may inhibit absorption in periods when single family housing demand is high. Stabilized housing demand in The COR is estimated at 70 to 75 percent of Ramsey demand or 245 to 260 units per year. Multi-family units (townhomes, duplexes, and apartments) are estimated to range from 85 to 90 percent annually. This indicates multi-family demand of 210 to 230 units. During the period 2002 through 2007 when housing production was the highest, multi-family units in Ramsey totaled 1,971, of which 170 or 8.6 percent were apartment buildings indicating that about 90 percent of the multi-family units were townhomes. While townhomes have been less popular in recent years, increasing single family home prices are expected to increase townhome popularity in the future. The City of Ramsey should strive to achieve apartment/condominium development at 50 percent of the multi-tenant units in The COR to encourage density near the station. The City of Ramsey has the opportunity to accommodate a wide variety of housing project types consistent with market preferences, particularly in areas in The COR within reasonable walking

xii
distance of the station. The COR offers a unique residential setting and lifestyle within the Northstar Corridor. Retail Development
The COR at Ramsey offers two different types of retail development opportunities. The development northwest of the central core is illustrative of a power center anchored by a discount or supercenter type of store. This is a distinct possibility for The COR; however, development is likely to be delayed until the Armstrong Boulevard interchange with TH-10 is constructed. In the meantime, this retail area is likely to continue to fill in with smaller retail stores, restaurants, and services consistent with a neighborhood shopping area anchored by a supermarket. The area around Municipal Plaza will be suitable for a wide range of retail, food service, and personal and business services that can be supported by residential or office development in that area and the larger retail trade area. Northstar riders will constitute a portion of the customers for these retail and service establishments. Office Development
The Northwest Twin Cities office submarket, which includes the Northstar Corridor, has about 1.5 million square feet of multi-tenant office space, according to Cassidy Turley, an amount that has remained unchanged since 2005. During this period, the vacancy rate has increased from 26.4 percent to 30.3 percent in 2011. Anoka County has about 600,000 square feet of multi-tenant office space during the same period of time. During this period, the vacancy rate was 15.7 percent in 2005, fluctuated between 13.0 and 18.7 percent, and fell to 15.4 percent in 2011. During this period, net office absorption was 35,700 square feet or about 6,000 square feet annually. The multi-tenant office market is relatively weak at the present time. The COR at Ramsey appears to have one multi-tenant office building (Ramsey Office Plaza) and one single tenant building (NAU Country Insurance). Three medical developments total over 64,000 square feet, indicating that Ramsey has absorbed about 157,500 square feet or almost 20,000 square feet over the past eight years. Ramsey’s experience indicates it should focus on single tenant build-to-suit office users. Given its available land and location, Ramsey is an excellent location for additional office users seeking a unique location in the northwest suburban area.

Chapter I
INTRODUCTION This report summarizes the analysis and conclusions of Vantage Point Development Advisors, LLC, McComb Group, Ltd., and Economic & Planning Systems, Inc. (EPS) regarding the market for transit oriented development (TOD) at the Ramsey Station on the Northstar commuter rail line in the Twin Cities area. The study was completed under a contract with the Northstar Corridor Development Authority (NCDA) with funding provided by the Metropolitan Council through a HUD Sustainability Grant. Background
The Northstar Line opened in 2009 with service between Big Lake and Target Field in downtown Minneapolis, Minnesota, a distance of 40 miles, as shown in Figure 1-1. There are seven stations in operation. The line begins at Big Lake with additional stops in Elk River, Ramsey, Anoka, Coon Rapids, Fridley, and Target Field.
Figure 1-1
NORTHSTAR CORRIDOR STATIONS
Source: Economic & Planning Systems, Inc.
1-1

The Northstar Line runs on existing Burlington Northern Santa Fe (BNSF) tracks with five weekday morning downtown inbound trips and five outbound weekday trips. There is one reverse commute trip each day. Daily ridership averages 2,400 riders per day which is below the Metro Transit goal of 3,400 riders per day by 2010 and 5,900 riders per day by 2030. There is limited weekend service as well as extra trips provided for special events such as Minnesota Twins (baseball) and Vikings (football) games. The $317 million project was built with $157 million in federal transit funds, $97.5 million in state sales tax revenues, and $34.8 million from the Anoka County Rail Authority, $8.0 million from Sherburne County, $5.9 million from the Met Council, and $2.6 million from the Minnesota Twins. A total of $107.5 million was paid to BNSF for a perpetual easement for track rights. The rail corridor continues to be one of the busiest freight corridors in the region with an average of 50 to 60 freight trains per day. The line is planned for a future extension to St. Cloud, which is an additional 42 miles. It was not included in the original full funding grant agreement with FTA due to cost effectiveness concerns as measured by the costs per new rider. A major cost factor is the need to complete double track rail for a 14-mile segment north of Big Lake. Transit Oriented Development
TOD can be defined as mixed-use residential or commercial development within walking distance of a transit station designed to maximize access to transit and incorporating features designed to encourage transit ridership. A TOD often resembles other activity centers with a greater mix of uses and higher densities than the surrounding market area. TODs typically have the following features:
♦ Mix of Uses – Land uses can be mixed either vertically or horizontally. TOD is most often primarily residential at suburban locations but can have employment and other commercial and retail uses at activity center and downtown locations.
♦ Compact Development – TODs are built at higher densities than the surrounding market area, creating a focal point around a transit station. The density and amount of development are market driven; higher land values support higher development densities and more urban locations support greater amounts of development.
♦ Pedestrian Oriented – The development pattern at TODs is designed to facilitate pedestrian access to and from the station with ample sidewalks, interconnected blocks and streets, and buildings oriented toward the street and parking located in secondary locations.
Stations can be classified according to their transit function and their approximate place in the continuum of urban and suburban development. This continuum ranges from Downtown and Regional Activity Centers areas on the larger and most intense end of the development spectrum to Neighborhood Centers on the smaller end, as shown in Figure 1-2. There are also more specialized single use centers such as hospitals or major sports complexes. The mix of uses varies by type and locational setting; however, the larger, more intense urban centers tend to be
1-2

higher density and contain more employment uses while smaller centers tend to contain lower densities and a greater proportion of housing.
Figure 1-2
NORTHSTAR LINE STATION TYPOLOGY
Station Type Residential Commercial/
Employment Scale Transit System Function Corridor Example
Mor
e C
omm
erci
al/ E
mpl
oym
ent
Downtown / Central Business District
Urban multi-family and loft
Major employment center. Full range of office, retail, entertainment, and services.
High rise: 5 stories and above
Major regional destination for employment, shopping, and entertainment. Numerous and frequent multimodal connections (bus, light rail, streetcar).
Target Field
Activity Center Multi-family and townhome
Employment emphasis, with more than 250,000 office & 50,000 sq. ft. retail
5 stories and above
Sub-regional destination. Some park-n-ride. Linked with district circulator transit and express feeder bus.
N/A
Urban Center Multi-family and townhome
Predominately commercial. More than 100,000 sq. ft. of retail. More retail than office.
Less than 4-5 stories
Sub-regional destination. Some park-n-ride. Linked with district circulator transit and express feeder bus.
Coon Rapids
Commuter - Employment Emphasis
Multi-family, townhome, small lot single family. May be more than ¼ mile from station.
More employment than residential. Mix of office, service, and retail uses.
Less than 4-5 stories
Primarily park-n-ride. Employment and commercial development is compatible with transit, but not dependent on transit service.
Anoka
Mor
e R
esid
entia
l
Commuter Town Center
Multi-family, townhome, small lot single family in closer proximity to station.
Significant retail and mixed use possible based on size of trade area and market conditions.
Less than 4 stories
Greater TOD potential. Also has large park-n-ride with local and express bus connections. Can be an end-of-line station.
Ramsey
Main Street Multi-family Main street retail infill Less than 4 stories
Bus or streetcar corridors. Walk-up stops. Limited transit parking.
N/A
Commuter – Residential Emphasis
Multi-family, townhome, small lot single family. May be more than ¼ mile from station.
Limited retail and service uses serving station and surrounding neighborhoods.
Less than 4 stories
Large park-n-ride. May have additional feeder bus and express bus connections.
Elk River Big Lake
Neighborhood
Multi-family townhome, small lot single family
Predominately residential with limited neighborhood serving commercial (less than 50,000 sq. ft.)
Less than 4 stories
Neighborhood walk-up station. Small or no park-n-ride. Local bus connections.
Fridley
Spec
ial
Use
s
Campus/ Special Events Station/ Regional Activity Center
Limited multi-family
Institutional, entertainment, limited office and retail.
Varies
Large commuter destination. Large parking reservoirs to serve activities, not necessarily for transit.
N/A
1-3

The presence of transit at a station location can have a positive effect on market and development potentials in the immediate area because transit improves the regional accessibility of the station area properties, which has a positive impact on property values. These higher land values can support higher development densities and in some cases a different mix of land uses in much the same way as property adjacent to a highway interchange is different from development farther away. However, the presence of transit alone does not translate to greater development potentials. There are other key economic requirements impacting TOD, including:
♦ A Positive Market – TOD cannot overcome other negative local or national real estate market conditions, including negative household or employment growth, declining building and land values, or the lack of conventional development financing.
♦ Supportive Public Policy – In order for a TOD activity center to be built, the local jurisdiction needs to provide a planning framework and zoning that allows for the type, mix, and density of development supportable by the market and desired by the community.
♦ Realistic Expectations – TOD can alter the location, density, and form of development within a market area. It can have a positive impact on the development capture of a city or sub-region. However, it cannot by itself create the demand for net new development within the larger region.
TOD also requires a commitment to a long-term development plan. Historically TOD does not occur until the transit investment is in place and provides a high level of accessibility that is generating high levels of ridership. In all but the most robust real estate markets, a TOD plan will take 20 or more years to become a significant activity center. Commuter Rail vs. Light Rail
Commuter rail differs from light rail or heavy rail in terms of its characteristics and markets served; similarly TOD opportunities associated with commuter rail also have some important distinctions. Commuter rail is most often passenger transit service utilizing diesel or electric propelled trains on existing track and/or right-of-ways utilized by freight or other passenger trains. It generally provides frequent peak-hour service and work trip oriented service of longer distances, typically 20 miles or more, with longer station spacings of two to five miles. Until recently, commuter rail systems were only found in the largest metropolitan areas including Boston, Chicago, Montreal, New York, Philadelphia, San Francisco, and Toronto. These systems are made up of multiple commuter rail lines and connect to light rail, heavy rail, and subway systems. The number of destinations that are accessible from these older systems is much larger than some of the newer systems. In the last 20 years, commuter rail lines have been developed in the next tier urban markets including Albuquerque/Santa Fe, Dallas, Los Angeles, Miami, Minneapolis, Portland, and Seattle, as shown in Table 1-1. These newer systems are generally single corridors rather than components of a larger system and have less than 10,000 average daily riders.
1-4

Table 1-1
U.S. COMMUTER RAIL SYSTEMS RANKED BY RIDERSHIP
AverageRank by Weekday Route YearRidership System Major Cities Served Ridership Miles Stations Opened
1 Long Island Rail Road New York 352,000 700.00 124 18362 Metra Chicago 304,700 495.00 240 19843 Metro-North Railroad New York 298,500 384.00 120 19834 New Jersey Transit Rail New York.Philadelphia 276,459 951.00 162 19835 MBTA Commuter Rail Boston 130,600 368.00 133 19736 SEPTA Regional Rail Philadelphia 127,200 289.00 150 19837 Caltrain San Francisco/San Jose 41,400 77.00 32 19878 Metrolink Los Angeles 39,600 512.00 55 19929 MARC Train Baltimore/Washington D.C. 33,700 187.00 43 1984
10 Virginia Railway Express Washington D.C. 19,200 90.00 18 199211 Tri-Rail Miami 163,300 72.00 18 198712 NICTD South Shore Line Chicago 12,100 90.00 20 190313 Sounder Commuter Rail Seattle/Tacoma 10,100 80.00 9 200014 A-Train Denton 8,600 21.00 6 201115 Trinity Railway Express Dallas/Fort Worth 8,200 34.00 10 199616 UTA FrontRunner Salt Lake City 5,800 44.00 8 200817 NCTD Coaster San Diego 5,000 41.00 8 199518 New Mexico Rail Runner Express Albuquerque 3,900 97.00 13 200619 Altamont Commuter Express San Jose 3,000 86.00 10 199820 Shore Line East New Haven 2,200 59.00 13 199021 Northstar Line Minneapolis 2,000 40.00 6 200922 Capital MetroRail Austin 2,000 32.00 9 201023 Westside Express Service Beaverton 1,600 15.00 5 201024 Music City Star Nashville 1,000 32.00 6 2006
Source: Economic & P lanning Systems, Inc. Commuter Rail TOD
Commuter rail TOD opportunities are also different than those associated with light rail or heavy rail systems due to its more limited scope, both in terms of frequency of service as well as the portion of the region that easily can be accessed by transit. Both factors limit the accessibility premiums that translate to increases in real estate market demand and higher land values. The nature of the commuter-freight rail corridor can also be less compatible with adjacent TOD. The sound levels associated with diesel locomotives and horns are louder, there are often larger transit parking fields, and the frequency of freight rail trains all creates land use impacts that are less compatible with residential and office-based employment development. The existing land development pattern in commuter rail corridors is also often not compatible with TOD, as it can include manufacturing and distribution uses requiring direct rail service as well as other heavy industrial uses which have located near like uses and away from residential and community serving commercial uses. Despite these limitations, there remains a great deal of interest in TOD at commuter station locations, and in particular on these newer lines where the land use and development pattern is less fully built out. There are a number of principles that apply to capitalizing on TOD opportunities at commuter rail station locations. A station area plan is key as it provides direction for the preferred land uses to be developed within a station influence area over a long-term time horizon of 20 to 25 years. The typical area of influence is approximately a half-mile radius modified by logical roadway and geographic features. In addition to the land use element, the plan should be grounded by a market study that identifies the potentials for TOD land uses.
1-5

1-6
It should also contain an infrastructure needs analysis, redevelopment strategies, and recommendations for changes and incentives to encourage TOD. The TOD plan allows a municipality to address the individual characteristics and market opportunities and constraints of individual station locations and settings. Application to Northstar Corridor
The Northstar Corridor stations have a wide range of land use and development conditions. At greenfield station locations, the land use development opportunities are constrained primarily by the depth of the market for higher density development uses, whether residential or employment. How close development takes place to the station will be a factor or the intensity of train activity and the tolerance of the market for living or working next to these uses. In general, urban populations have a higher tolerance for “all things urban,” mixed uses, densities, and noise. At commuter rail stations where existing industrial uses prevail, the community needs to consider a number of additional factors when implementing a TOD plan. Most industrial uses are not considered ideal TOD uses because the employment density (number of employees per acre or per square foot) is not very high, resulting in little impact on transit demand and usage. However, these industries are often important to the city’s employment base; hence it makes little sense to try to relocate them at least until there is a land constraint in the area. The cities should apply the same principles that it would in any other redevelopment setting by concentrating on parcels that have a potential to be redeveloped to higher value uses including vacant land and buildings and other outmoded space. Short of a land constraint for imminent development, the plan should prioritize redeveloping or removing the most incompatible land uses and developing vacant land. The plan should also prioritize public investments on addressing infrastructure deficiencies and urban design improvements to improve the public realm to attract TOD.

Chapter II
NORTHSTAR CORRIDOR STATIONS Northstar Corridor stations are located in seven locations from Big Lake to Target Field in Minneapolis. Each Northstar station attracts riders from a geographic area that is larger than the station city. This is demonstrated by a Metropolitan Council license plate survey of vehicles in Northstar park-n-ride lots conducted on January 27, 2010. This survey counted 851 vehicles, of which 778 could be mapped. The number of boardings at each station on January 11, 2010, was obtained from Metro Transit. Northstar station boardings at the five outlying stations totaled 944, which correlates well with 851 parked vehicles allowing for ride sharing and bus transfers. We don’t know where these riders disembarked, but the assumption is that the vast majority rode to Target Field. An additional eight riders boarded at Target Field. Origin of Ramsey’s park-n-ride users was derived from a survey conducted in 2012, obtained from Metro Transit. The geocoded registration addresses of park-n-ride users for each station are shown on Figure 2-1.
Figure 2-1
2-1

The distribution of rider origins demonstrates that while most rider residences are close to the station, many riders travel long distances before boarding the train. The distribution of rider residences is similar to the distribution of customers for a retail business, or the draw area from which a residential development will attract most of its residents. Retail stores have trade areas, residential developments have draw areas, and each Northstar station has a travelshed. For this analysis, these travelsheds will be referred to as draw areas. Draw areas were delineated for each station based on the origin of park-n-ride users. These draw areas, shown on Map 2-1, have widely differing geographic areas. Three draw areas extend south of the Mississippi River, while three do not. Big Lake Station and Elk River Station Draw Areas cover the largest geographic areas, while the Fridley Station Draw Area is the smallest. The draw areas for Elk River, Ramsey, Anoka, and Coon Rapids overlap with adjacent station draw areas based on rider behavior.
Map 2-1
NORTHSTAR CORRIDOR DRAW AREAS
The portion of draw area employed residents that work in Minneapolis decreases the further the station is located from Minneapolis. In the Fridley Station Draw Area, there are 16,232 resident workers, of which 3,384 (20.8 percent) work in Minneapolis. Ramsey Station Draw Area has 25,296 employed residents of which 2,779 (11.0 percent) are employed in Minneapolis. Draw area residents that are employed in Minneapolis, particularly downtown Minneapolis, are the strongest candidates to be Northstar commuters.
2-2

Table 2-1
NORTHSTAR STATION DRAW AREAS WORKERSAND THOSE THAT WORK IN MINNEAPOLIS
TotalStation Draw Area Employees Employees Percent
Big Lake 6,695 514 7.7 %Elk River 13,808 1,206 8.7 Ramsey 25,296 2,779 11.0 Anoka 46,508 5,990 12.9 Coon Rapids 56,554 8,828 15.6 Fridley 16,232 3,384 20.8
Source: U.S. Census Bureau, Center for Economic Studies.
Work in Minneapolis
Northstar station market penetration in each draw area is shown in Table 2-2. The number of draw area residents employed in Minneapolis is compared with number of Northstar riders identified in the user origin survey. In calculating ridership market share, each station’s draw area was limited to the area north of the Mississippi River to be consistent with the residential market analysis, which did not extend south of the river. Those riders from south of the river are included as inflow riders along with those living outside the draw area. Inflow riders are assumed to also be primarily destined to Minneapolis.
Table 2-2
NORTHSTAR RIDERS AND STATION DRAW AREAS RESIDENTS WORKING IN MINNEAPOLIS; 2010
Draw AreaBig Lake Elk River Ramsey Anoka Coon Rapids FridleyStation Station Station Station Station Station
Work in Minneapolis 514 1,206 2,779 5,990 8,828 3,384 Ride to Minneapolis 155 240 87 190 165 22 Employee Market Share 30.2 % 19.9 % 3.1 % 3.2 % 1.9 % 0.7 %Draw Area Rider Percent 73.1 % 83.3 % 67.4 % 89.2 % 83.8 % 64.7 %Inflow Riders 57 48 42 23 32 12
Percent 26.9 % 16.7 % 32.6 % 10.8 % 16.2 % 35.3 %Total Riders 212 288 129 213 197 34
Source: M cComb Group, Ltd. and M etroTransit. The Big Lake Station Draw Area includes Big Lake and Becker and had 514 residents employed in Minneapolis and an estimated 155 rode the Northstar for a market share of 30.2 percent. Inflow riders from outside the draw area and south of the Mississippi River represented 26.9 percent or 57 riders including 31 from south of the Mississippi River. Big Lake has the highest ridership market share of any station. Elk River had the largest ridership with 288 users. This draw area includes the cities of Elk River and Zimmerman, with inflow riders from Otsego, Albertville and a portion of St. Michael. Draw area riders totaled 240 or 19.9 percent of the draw area residents employed in Minneapolis. Inflow users (48 riders) accounted for 16.7 percent of the users, 33 of which were from south of the Mississippi River.
2-3

The draw area for the Ramsey Station is based on previous express bus ridership, which has been replaced by the Northstar Commuter Rail. The draw area, which includes Ramsey and portions of Nowthen and Elk River, had 2,779 Minneapolis employees. Ridership on the Northstar has averaged 129, of which 67.4 percent, or 87 riders, are estimated to be from the draw area based on bus ridership. These riders represent 3.1 percent of the Minneapolis employees. Inflow riders were estimated at 42 or 32.6 percent, all living north of the Mississippi River. The Anoka Station had a total of 213 riders, 190 or 89.2 percent lived in the draw area north of the Mississippi River. This draw area includes the cities of Anoka, Andover, Ramsey, Nowthen, Oak Grove, and St. Francis, with inflow riders from portions of Dayton and Champlin. Northstar users represented 3.2 percent of the 5,990 Minneapolis employees living in the draw area. Thirteen of the Anoka riders lived south of the Mississippi River. Coon Rapids Station Draw Area had an estimated 8,828 residents employed in Minneapolis with 165 or 1.9 percent that rode the Northstar. This draw area includes the cities of Coon Rapids, Andover, and Ham Lake. Inflow riders (32) represented 16.2 percent of the users. The Fridley Station had the lowest number of users (34) with 22 living in the draw area for a 0.7 percent market share of the 3,384 estimated Minneapolis employees. Draw area riders included riders from Fridley, Spring Lake Park, Hilltop, and Columbia Heights and represented 64.7 percent of the riders and inflow was 35.3 percent. Big Lake Station and Elk River Station have the highest rider market shares at 30.2 percent and 19.9 percent, respectively. This may be due to their further distance from Minneapolis. Market share increases with distance from Minneapolis; while the number of Minneapolis employees decreases with distance from the city. Ramsey Commuting
While most Northstar riders are traveling to Target Field, some riders are disembarking at other stations. The potential for commuting from Ramsey to other stations is demonstrated in Table 2-3. In 2010, 2,776 residents of the Ramsey Station Draw Area worked in Elk River. They represented 11.0 percent of the employed draw area residents. Ramsey Station Draw Area residents that work in the other station cities are also shown. The work location in each city is unknown, but some jobs may be within walking distance of a station or could be reached by a connecting bus.
Table 2-3
RAMSEY STATION DRAW AREA RESIDENT COMMUTING; 2010RESIDENTS THAT WORK IN OTHER STATION CITIES
Station City Number Percent
Big Lake 193 0.8 %Elk River 2,776 11.0 Anoka 1,598 6.3 Coon Rapids 1,404 5.6 Fridley 778 3.1 Minneapolis 2,779 11.0
Source: U.S. Census Bureau, Center for Economic Studies and M cComb Group, Ltd.
Workers
2-4

Commuting opportunities are represented by employees working in station area cities that reside in other station draw areas. In 2010, 2,137 workers employed in Ramsey lived in the Anoka Station Draw Area, as shown in Table 2-4. This represented 44.0 percent of Ramsey employment. Additional Ramsey employees from other station city draw areas are shown in Table 2-4. Reverse commuting to Ramsey by workers from other stations would require a bus or shuttle to meet the train and transport workers to their destination if they did not work near the station. The employee work locations are unknown. These reverse (outbound) commuters are served by only one train, which reduces the potential for reverse commuting.
Table 2-4
RAMSEY WORKERS THAT LIVE IN OTHER STATION DRAW AREAS; 2010
Work inStation Draw Area Ramsey Percent
Big Lake 127 2.6 %Elk River 219 4.5 Anoka 2,137 44.0 Coon Rapids 730 15.0 Fridley 56 1.2 Minneapolis 104 2.1
Source: U.S. Census Bureau, Center for Economic Studies and McComb Group, Ltd.
2-5

Chapter III
REGIONAL ECONOMIC AND DEMOGRAPHIC FRAMEWORK This chapter provides an overview of regional employment and demographic trends to illustrate the relationship between the station area cities and the larger Minneapolis-St. Paul region. The following sections of this Regional Economic and Demographic Framework are presented to provide the context of the station cities within the Eleven-County Minneapolis-St. Paul Metropolitan Statistical Area (MSA). In some cases, detailed analysis will be based on the Seven-County Metropolitan Area (Metropolitan Area) adjusted to include Sherburne County. EMPLOYMENT TRENDS
The MSA is the nation’s 15th largest MSA. Employment growth in the MSA1, as shown in Table 3-1, was interrupted by the great recession, which began in December 2007. Employment increased between 2001 and 2007 at a modest annual rate of 1.07 percent. MSA employment peaked in 2007 with 2,209,659, declined to 2,127,674 in 2010, and began a slow recovery to 2,168,451 in 2011.
Table 3-1
MSA AND ANOKA AND SHERBURNE COUNTIESTOTAL EMPLOYMENT; 2001 TO 2011
Anoka SherburneYear MSA County County
2001 2,072,916 148,362 28,577 2002 2,063,216 148,660 29,538 2003 2,070,706 151,693 30,915 2004 2,102,568 154,939 31,904 2005 2,146,233 159,570 32,926 2006 2,179,756 161,558 33,346 2007 2,209,659 163,248 33,918 2008 2,204,264 160,397 33,312 2009 2,134,490 154,041 32,393 2010 2,127,674 150,589 32,329 2011 2,168,451 153,523 32,931
Source: U.S. Department o f Commerce, Bureau o f Economic Analysis.1 The MSA’s four largest industries are Health Care, Government, Retail Trade, and Manufacturing, as shown in Table 3-2. Industries that experienced strong growth between 2001 and 2011 include the Health Care and Social Assistance (65,000); Real Estate, Rental and Leasing (28,313); Finance and Insurance (26,421); Education Services (22,871); and Professional, Scientific, and Tech Services (20,104). Industries that lost employment between 2001 and 2011 include Manufacturing (45,259); Construction (25,506); Retail Trade (18,158); and Information (12,316). Anoka County employment grew steadily between 2001 and 2007, as shown in Table 3-1. Between 2001 and 2007, employment in Anoka County increased from 148,362 to 163,248, an 1 Employment data from the Bureau of Economic Analysis (BEA) includes private wage and salary, sole proprietors, and government jobs. BEA compiles the data from multiple sources, resulting in a one- to two-year lag from the current year.
3-1

Tabl
e 3-
2
MIN
NEA
POLI
S-ST
. PA
UL
MSA
NO
N-F
AR
M E
MPL
OY
MEN
T B
Y IN
DU
STR
Y; 2
001
TO 2
011
Indu
stry
2001
2002
2003
2004
2005
2006
2007
2008
2009
2010
2011
Fore
stry
, Fis
hing
, and
Rel
ated
Act
iviti
es1,
249
1,10
2
48
2
540
1,
038
1,06
0
1,
408
1,52
5
1,
538
1,52
8
1,
587
Min
ing
1,17
0
1,
074
585
56
5
1,15
5
1,
307
1,60
2
1,
525
1,22
5
1,
214
1,41
1
U
tiliti
es5,
256
4,85
6
4,
675
4,59
5
4,
739
6,55
0
5,
305
5,71
0
5,
949
4,87
4
4,
912
Con
stru
ctio
n10
9,16
1
10
8,91
1
11
0,74
3
11
4,69
5
11
8,58
1
11
5,93
5
11
1,60
2
10
4,41
9
87
,520
81
,681
83
,655
M
anuf
actu
ring
223,
913
210,
802
204,
763
202,
414
204,
406
203,
188
200,
508
195,
695
178,
435
173,
718
178,
654
Who
lesa
le T
rade
100,
412
97,3
67
95,7
42
97,2
61
99,8
57
103,
183
103,
815
101,
395
94,1
29
91,0
92
92,8
42
Ret
ail T
rade
219,
055
218,
442
218,
765
218,
410
221,
426
220,
339
220,
748
213,
675
203,
187
199,
824
200,
897
Tran
spor
tatio
n an
d W
areh
ousi
ng56
,528
50
,673
50
,409
52
,488
53
,937
62
,014
58
,424
59
,288
58
,828
57
,819
58
,788
In
form
atio
n58
,428
54
,300
50
,552
49
,076
49
,648
48
,651
49
,987
49
,450
46
,762
46
,163
46
,112
Fi
nanc
e an
d In
sura
nce
130,
595
133,
246
136,
461
137,
065
139,
483
140,
512
143,
772
147,
944
152,
696
151,
542
157,
016
Rea
l Est
ate
and
Ren
tal a
nd L
easi
ng68
,495
72
,573
77
,494
83
,815
90
,772
93
,916
95
,786
94
,101
90
,584
95
,670
96
,808
Pr
ofes
sion
al, S
cien
tific
, and
Tec
h Sv
s14
5,55
2
14
2,97
1
14
2,54
2
14
8,44
4
15
0,62
2
15
5,67
8
16
4,34
0
16
5,82
4
15
9,94
9
16
0,90
6
16
5,65
6
M
gmt o
f Com
pani
es a
nd E
nter
pris
es61
,020
57
,377
55
,218
59
,098
58
,198
60
,091
61
,119
65
,482
64
,417
64
,551
66
,405
A
dmin
istra
tive
and
Was
te M
gmt S
ervi
ces
117,
853
116,
144
116,
626
120,
111
122,
809
128,
599
131,
093
126,
017
116,
806
123,
933
131,
208
Educ
atio
nal S
ervi
ces
40,1
07
43,4
63
44,5
66
46,6
70
48,2
78
51,8
90
53,1
52
55,5
26
57,6
70
59,8
10
62,9
78
Hea
lth C
are
and
Soci
al A
ssis
tanc
e18
7,99
2
19
7,23
4
20
4,70
8
21
1,27
8
21
5,04
8
22
5,43
1
23
4,66
5
24
2,34
4
24
4,24
5
24
5,21
2
25
2,99
2
A
rts, E
nter
tain
men
t, an
d R
ecre
atio
n46
,126
48
,882
49
,846
50
,378
51
,844
53
,741
55
,934
57
,889
57
,822
57
,233
58
,403
A
ccom
mod
atio
n an
d Fo
od S
ervi
ces
122,
126
123,
486
125,
294
129,
356
132,
992
134,
887
136,
693
136,
475
131,
843
131,
112
134,
547
Oth
er S
ervi
ces,
Exce
pt P
ublic
Adm
in10
7,02
8
11
0,57
4
11
0,47
6
11
0,32
3
11
0,93
1
11
2,24
4
10
3,35
5
11
3,73
0
11
0,91
9
10
9,64
8
11
1,21
2
G
over
nmen
t and
Gov
t Ent
erpr
ises
229,
149
229,
200
230,
193
230,
754
235,
567
239,
639
240,
497
240,
645
240,
008
241,
392
236,
940
Tot
al E
mpl
oym
ent
2,07
2,91
6
2,06
3,21
6
2,07
0,70
6
2,10
2,56
8
2,14
6,23
3
2,17
9,75
6
2,20
9,65
9
2,20
4,26
4
2,13
4,49
0
2,12
7,67
4
2,16
8,45
1
Perc
ent C
hang
e(0
.47)
%0.
36
%
1.54
%2.
08
%
1.56
%1.
37
%
(0.2
4)
%
(3.1
7)
%
(0.3
2)
%
1.92
%N
on-F
arm
Em
ploy
men
t2,
061,
194
2,
052,
440
2,
060,
158
2,
092,
573
2,
136,
373
2,
170,
489
2,
200,
473
2,
195,
369
2,
124,
940
2,
118,
015
2,
159,
266
Pe
rcen
t Cha
nge
(0.4
2)
%
0.38
%1.
57
%
2.09
%1.
60
%
1.38
%(0
.23)
%(3
.21)
%(0
.33)
%1.
95
%
Sour
ce:
U.S
. Dep
artm
ent o
f Com
mer
ce, B
urea
u of
Eco
nom
ic A
naly
sis.
Lori
Text Box
3-2

annual rate of 1.61 percent. Employment declined to 150,589 in 2010, a decline of 7.8 percent, and increased to 153,523 in 2011. In that year, Anoka County represented 7.1 percent of the MSA employment. Manufacturing is the largest industry in Anoka County with 21,084 jobs in 2011, as shown in Table 3-3. The largest industries in Anoka County are the same as the MSA and include Health Care; Government; Retail; and Manufacturing. Anoka County experienced the largest employment growth in the Health Care (2,933) and Finance and Insurance industries (1,897). Other employment categories recording steadily increasing employment notwithstanding the recession include: Professional, Scientific, and Tech Services (1,417); Real Estate and Rental and Leasing (1,832); Management of Companies and Enterprises (283); and Administrative Services (864). The changes in employment in Anoka County were similar to the changes experienced by the MSA as a whole. The largest decline was recorded in Manufacturing, which lost 4,142 jobs between 2001 and 2011. Sherburne County employment trends are similar to Anoka County, as shown in Table A-4. Employment increased from 28,577 in 2001 to 33,918 in 2007, an annual growth rate of 2.90 percent. Employment declined to 32,329 in 2010, a decrease of 4.7 percent. Employment increased to 32,931 in 2011, which represented 1.5 percent of MSA employment. Major employers in Sherburne County in 2011 were Health Care; Government; Retail Trade; and Manufacturing. Health Care is also the largest industry in Sherburne County and accounted for over 44 percent of the new jobs created in the county. Employment categories that recorded generally increasing employment trends between 2001 and 2010 included: Finance and Insurance (350); Real Estate and Rental and Leasing (698); Professional, Scientific, and Technical Services (395); Management of Companies and Enterprises (224); and Administrative Services (291) to name a few. The Construction and Retail Trade industries lost 429 and 523 jobs, respectively, between 2001 and 2011. Corridor Employment
Corridor cities have experienced differing employment trends over the past decade, as shown in Table 3-5. In most corridor cities (Coon Rapids, Anoka, Ramsey, Elk River, and Big Lake), employment increased between 2000 and 2007 or 2008 when the great recession caused employment to decline. In each city, except Elk River, employment declined through 2010 and then recovered in 2011. In four corridor cities (Coon Rapids, Ramsey, Elk River, and Big Lake), employment in 2011 was higher than in 2000. Elk River and Coon Rapids had the largest increases in employment of the corridor cities increasing by 2,360 and 2,086 jobs, respectively, in the past decade. Ramsey grew by 1,141 and Big Lake employment increased by 332. Fridley and Anoka recorded generally declining employment trends. In Fridley, employment was in a downward trend from 2000 to 2006. Employment increased in 2007, and then declined during the recession, and then recovered in 2011. Over this period, Fridley lost 4,356 jobs. Anoka employment fluctuated in a narrow range between 2000 and 2006, increased to 13,674 in 2008, and ended at 12,826 for a net loss of 471 jobs. Minneapolis, the terminal city for the Northstar Corridor, has experienced a steadily declining employment trend. Employment declined from 308,758 in 2000 to 285,883 in 2004, increased to 294,370 in 2006, and then declined to 280,899 in 2009. By 2011, employment had recovered to 287,640 jobs. Minneapolis has 21,118 fewer jobs in 2011 than in 2000. As the destination for most Northstar Corridor commuters, employment trends in Minneapolis are important.
3-3

Tabl
e 3-
3
AN
OK
A C
OU
NTY
NO
N-F
AR
M E
MPL
OY
MEN
T B
Y IN
DU
STR
Y; 2
001
TO 2
011
Indu
stry
2001
2002
2003
2004
2005
2006
2007
2008
2009
2010
2011
Fore
stry
, Fis
hing
, and
Rel
ated
Act
iviti
es21
7
-
-
-
-
-
267
31
6
288
28
2
281
M
inin
g66
-
-
-
-
-
90
11
6
93
81
92
Util
ities
-
-
-
-
-
-
-
-
-
-
-
Con
stru
ctio
n13
,699
13
,735
14
,343
14
,969
15
,110
14
,629
13
,778
12
,303
10
,471
9,
808
9,92
1
M
anuf
actu
ring
25,2
26
23,2
19
22,9
51
23,0
11
23,5
58
23,6
57
24,2
64
23,1
21
21,1
38
20,3
54
21,0
84
Who
lesa
le T
rade
5,71
4
6,
201
6,29
5
6,
398
6,21
0
6,
502
6,51
7
6,
278
5,80
0
5,
695
5,72
3
R
etai
l Tra
de19
,463
20
,048
20
,248
20
,545
21
,428
21
,173
21
,461
20
,386
19
,017
18
,452
18
,496
Tr
ansp
orta
tion
and
War
ehou
sing
-
-
-
-
-
-
-
-
-
-
-
Info
rmat
ion
1,59
0
1,
444
1,43
8
1,
312
1,46
5
1,
465
1,51
8
1,
536
1,37
5
1,
241
1,25
7
Fi
nanc
e an
d In
sura
nce
3,95
0
4,
205
4,38
4
4,
491
4,74
8
4,
728
5,01
0
5,
329
5,89
6
5,
650
5,84
7
R
eal E
stat
e an
d R
enta
l and
Lea
sing
5,69
2
6,
107
6,57
6
7,
283
7,80
4
8,
199
7,91
2
7,
381
7,31
4
7,
359
7,52
4
Pr
ofes
sion
al, S
cien
tific
, and
Tec
h Sv
s6,
249
6,22
3
6,
538
6,84
7
7,
025
6,99
0
7,
262
7,21
4
7,
095
7,12
2
7,
666
Mgm
t of C
ompa
nies
and
Ent
erpr
ises
558
43
5
590
60
2
670
71
2
577
38
0
718
84
4
841
A
dmin
istra
tive
and
Was
te M
gmt S
ervi
ces
7,95
2
7,
610
8,24
5
8,
825
8,91
7
9,
302
9,45
8
9,
854
8,94
3
8,
510
8,81
6
Ed
ucat
iona
l Ser
vice
s1,
800
2,06
0
1,
979
2,04
3
2,
157
2,26
4
2,
300
2,40
7
2,
419
2,35
5
2,
463
Hea
lth C
are
and
Soci
al A
ssis
tanc
e13
,767
13
,982
14
,346
14
,501
14
,872
15
,348
15
,823
16
,485
16
,841
16
,546
16
,700
A
rts, E
nter
tain
men
t, an
d R
ecre
atio
n3,
082
3,32
4
3,
464
3,51
3
3,
458
3,64
3
3,
660
4,07
1
4,
228
4,27
6
4,
422
Acc
omm
odat
ion
and
Food
Ser
vice
s8,
422
8,86
6
9,
166
9,47
1
9,
815
9,89
7
10
,109
10
,062
9,
701
9,43
4
9,
674
Oth
er S
ervi
ces,
Exce
pt P
ublic
Adm
in8,
776
9,04
3
9,
271
9,19
1
9,
296
9,65
2
-
9,
611
9,68
0
9,
714
9,74
3
G
over
nmen
t and
Gov
t Ent
erpr
ises
15,3
41
15,2
16
15,2
65
15,5
25
16,3
76
16,6
97
17,3
17
17,3
95
17,0
96
16,8
42
16,4
55
Tot
al E
mpl
oym
ent
148,
362
148,
660
151,
693
154,
939
159,
570
161,
558
163,
248
160,
397
154,
041
150,
589
153,
523
Perc
ent C
hang
e0.
20
%
2.04
%2.
14
%
2.99
%1.
25
%
1.05
%(1
.75)
%(3
.96)
%(2
.24)
%1.
95
%
Non
-Far
m E
mpl
oym
ent
147,
517
147,
875
150,
921
154,
226
158,
878
160,
928
162,
635
159,
817
153,
392
149,
929
152,
908
Perc
ent C
hang
e0.
24
%
2.06
%2.
19
%
3.02
%1.
29
%
1.06
%(1
.73)
%(4
.02)
%(2
.26)
%1.
99
%
Sour
ce:
U.S
. Dep
artm
ent o
f Com
mer
ce, B
urea
u of
Eco
nom
ic A
naly
sis.
Lori
Text Box
3-4

Tabl
e 3-
4
SHER
BU
RN
E C
OU
NTY
NO
N-F
AR
M E
MPL
OY
MEN
T B
Y IN
DU
STR
Y; 2
001
TO 2
011
Indu
stry
2001
2002
2003
2004
2005
2006
2007
2008
2009
2010
2011
Fore
stry
, Fis
hing
, and
Rel
ated
Act
iviti
es-
-
-
-
-
-
-
-
-
-
-
Min
ing
-
-
-
-
-
-
-
-
-
-
-
U
tiliti
es-
-
-
-
-
819
-
-
-
-
-
C
onst
ruct
ion
2,86
8
2,96
4
3,16
0
3,39
5
3,45
8
3,33
3
3,11
4
2,70
3
2,35
4
2,17
2
2,43
9
Man
ufac
turin
g3,
091
2,
985
3,
297
3,
394
3,
446
3,
374
3,
487
3,
486
3,
103
3,
100
3,
118
W
hole
sale
Tra
de-
-
-
-
-
971
1,06
1
-
1,
075
-
-
R
etai
l Tra
de4,
218
4,
384
4,
374
4,
029
4,
109
4,
216
4,
161
3,
935
3,
731
3,
678
3,
695
Tr
ansp
orta
tion
and
War
ehou
sing
1,05
2
1,10
5
1,18
4
1,19
2
1,24
6
1,23
0
-
1,
287
-
1,26
2
1,31
9
Info
rmat
ion
426
414
288
242
268
282
289
264
239
191
213
Fina
nce
and
Insu
ranc
e72
0
82
3
84
3
90
1
90
7
92
1
1,
012
1,
015
1,
111
1,
040
1,
070
R
eal E
stat
e an
d R
enta
l and
Lea
sing
912
1,10
7
1,14
4
1,16
7
1,39
4
1,46
5
1,49
8
1,55
5
1,51
5
1,59
4
1,61
0
Prof
essi
onal
, Sci
entif
ic, a
nd T
ech
Svs
832
839
841
1,02
7
1,14
1
1,14
9
1,21
9
1,31
3
1,27
4
1,20
8
1,22
7
Mgm
t of C
ompa
nies
and
Ent
erpr
ises
117
142
227
251
194
241
223
299
301
333
341
Adm
inis
trativ
e an
d W
aste
Mgm
t Ser
vice
s98
2
1,
057
1,
045
1,
174
1,
202
1,
162
1,
052
99
8
1,
018
1,
231
1,
273
Ed
ucat
iona
l Ser
vice
s26
3
28
7
33
0
34
3
36
7
33
6
39
9
39
7
37
7
38
8
40
6
H
ealth
Car
e an
d So
cial
Ass
ista
nce
2,85
6
2,93
9
3,32
8
3,65
8
3,88
4
4,10
2
4,39
5
4,47
8
4,64
2
4,73
4
4,76
9
Arts
, Ent
erta
inm
ent,
and
Rec
reat
ion
443
490
524
511
540
532
542
547
557
557
534
Acc
omm
odat
ion
and
Food
Ser
vice
s1,
833
1,
848
2,
024
1,
954
1,
995
2,
055
1,
991
1,
940
1,
825
1,
712
1,
762
O
ther
Ser
vice
s, Ex
cept
Pub
lic A
dmin
1,76
5
1,91
1
2,01
7
2,06
5
2,12
6
2,15
0
2,19
2
2,14
4
2,18
6
2,21
9
2,20
9
Gov
ernm
ent a
nd G
ovt E
nter
pris
es3,
625
3,
682
3,
728
3,
947
4,
031
4,
177
4,
328
4,
325
4,
325
4,
352
4,
368
Tot
al E
mpl
oym
ent
28,5
77
29
,538
30,9
15
31
,904
32,9
26
33
,346
33,9
18
33
,312
32,3
93
32
,329
32,9
31
Pe
rcen
t Cha
nge
3.36
%4.
66
%
3.20
%3.
20
%
1.28
%1.
72
%
(1.7
9)
%(2
.76)
%
(0.2
0)
%1.
86
%
Non
-Far
m E
mpl
oym
ent
27,7
39
28
,764
30,1
76
31
,218
32,2
65
32
,738
33,3
30
32
,741
31,7
84
31
,714
32,3
44
Pe
rcen
t Cha
nge
3.70
%4.
91
%
3.45
%3.
35
%
1.47
%1.
81
%
(1.7
7)
%(2
.92)
%
(0.2
2)
%1.
99
%
Sour
ce:
U.S
. Dep
artm
ent o
f Com
mer
ce, B
urea
u of
Eco
nom
ic A
naly
sis.
Lori
Text Box
3-5

Table 3-5
CORRIDOR COMMUNITIES EMPLOYMENT; 2000 TO 2011
Coon ElkYear Minneapolis Fridley Rapids Anoka Ramsey River Big Lake
2000 308,758 26,279 21,496 13,297 3,901 8,864 1,716 2001 305,880 26,042 21,695 13,114 4,019 9,798 1,800 2002 294,162 24,762 22,546 13,279 4,023 10,025 1,755 2003 286,631 23,885 23,687 13,302 4,371 10,272 1,843 2004 285,883 23,593 23,563 13,031 4,952 10,423 1,903 2005 287,552 23,860 23,895 13,199 4,985 10,302 2,095 2006 294,370 23,691 24,151 13,287 5,152 10,608 2,212 2007 292,833 24,489 24,579 13,392 4,994 10,771 2,292 2008 291,019 23,050 24,747 13,674 5,277 10,709 2,325 2009 280,899 22,122 23,464 12,806 4,977 10,682 2,173 2010 281,577 21,377 23,150 12,690 4,757 10,950 2,083 2011 287,640 21,923 23,582 12,826 5,042 11,224 2,048
Percent Change (0.64) % (1.63) % 0.85 % (0.33) % 2.36 % 2.17 % 1.62 %
Source: M innesota Department o f Employment and Economic Development (QCEW data). Major Industries and Drivers
Comparing the percentage of jobs in each industry illustrates the economic drivers in Anoka and Sherburne Counties. Both Anoka and Sherburne Counties have a larger percentage of jobs in Manufacturing than the MSA. Anoka County has 14 percent of its employment in Manufacturing and Sherburne County 10 percent compared to only eight percent in the MSA, as shown in Figure 3-1.
Figure 3-1
EMPLOYMENT BY INDUSTRY AS PERCENT OF TOTAL MSA AND ANOKA AND SHERBURNE COUNTIES
Source: Economic & Planning Systems, Inc.
0% 2% 4% 6% 8% 10% 12% 14% 16%
Construction
Manufacturing
Wholesale trade
Retail trade
Information
Finance and insurance
Real estate and rental and leasing
Professional and technical services
Management of companies and enterprises
Administrative and waste services
Educational services
Health care and social assistance
Arts, entertainment, and recreation
Accommodation and food services
Other services, except public administration
Government and government enterprises
Minneapolis MSA Anoka County Sherburne County
3-6

Anoka County has a high percentage of Retail jobs with 13 percent compared to 10 percent in the MSA. Sherburne and Anoka Counties have 7.5 to 8.0 percent Construction employment, which indicates higher housing growth in these counties. Over 15 percent of jobs in Sherburne County are in Health Care, making it the largest industry in the county. Major Employers
The largest employers in the corridor are located mainly in Anoka, Fridley, and Coon Rapids. The largest is Medtronic, Inc. in Fridley with 3,076 employees. Seven of the fifteen major employers identified on Figure 2-3 are located within one mile of a Northstar commuter rail station.
Figure 3-2
NORTHSTAR CORRIDOR MAJOR EMPLOYERS
Source: Economic & Planning Systems, Inc.
3-7

Ramsey Employment
Employment in Ramsey increased steadily from 2002 to 2008 and declined to 5,212 in 2010 due primarily to declines in Construction; Manufacturing; and Wholesale Trade, as shown in Table 3-6. Industry categories with growing employment trends from 2002 to 2010 include: Manufacturing; Transportation and Warehousing; Agriculture; Utilities; Wholesale Trade; Information; Finance and Insurance; Management of Companies and Enterprises; Educational Services; Accommodation and Food Services; Other Services; Professional, Scientific, and Technical Services; and Health Care and Social Assistance. Categories with declining trends include Construction; Retail Trade; Real Estate and Rental and Leasing; Administration and Support; Arts, Entertainment and Recreation; and Public Administration. Employment in this table differs slightly from Table 3-5 because it is derived from a different database from the U.S. Census Bureau that provides more complete reporting of employment by industry.
Table 3-6
RAMSEY EMPLOYMENT TRENDS; 2002 TO 2010
PercentJobs by NAICS Industry Sector 2002 2003 2004 2005 2006 2007 2008 2009 2010 Change
Agriculture, Forestry, Fishing and Hunting 87 89 90 79 100 110 91 111 127 4.8 %Utilities 241 223 239 246 231 229 225 240 244 0.2 Construction 509 521 651 641 551 468 382 328 270 (7.6) Manufacturing 1,092 1,006 938 1,002 1,497 1,671 1,837 1,672 1,619 5.0 Wholesale Trade 212 249 236 299 254 778 828 688 584 13.5 Retail Trade 470 486 477 555 498 440 397 445 414 (1.6) Transportation and Warehousing 60 49 45 55 54 59 81 99 78 3.3
Office Inclined IndustriesInformation - 2 2 5 4 2 4 3 5 - %Finance and Insurance 23 33 54 41 54 36 62 65 35 5.4 Real Estate and Rental and Leasing 58 46 86 78 82 40 18 30 21 (11.9) Professional, Scientific, and Tech Services 86 96 128 88 70 94 95 79 92 0.8 Management of Companies and Enterprises 24 39 30 48 57 63 74 89 108 20.7 Administration & Support 281 297 288 386 334 310 304 356 268 (0.6) Subtotal 472 513 588 646 601 545 557 622 529 1.4 %
Educational Services 3 4 7 20 220 311 319 328 364 72.3 %Health Care and Social Assistance 91 214 241 262 229 250 260 236 274 14.8 Arts, Entertainment, and Recreation 90 105 100 84 85 90 51 50 70 (3.1) Accommodation and Food Services 261 289 272 322 290 356 393 456 325 2.8 Other Services (excluding Public Admin.) 188 212 202 193 204 231 212 213 191 0.2 Public Administration 134 144 157 120 131 130 125 141 123 (1.1)
Total All Jobs 3,912 4,108 4,246 4,524 4,945 5,668 5,759 5,629 5,212 3.7 %
So urce : U.S. Cens us Bureau, OnTheMap Applica tio n and LEHD Origin-Des tina tio n Emplo yment. Office-inclined industries are important categories that are likely to occupy office space and represent potential demand. Employment in office-inclined industries was steady between 2002 and 2005 when employment peaked at 646 and then declined to 529 employees in 2010. Assuming 250 square feet per employee, demand for office space would have been about 118,000 square feet in 2002 increasing to about 161,500 square feet in 2005, before declining to 132,250 square feet in 2010, a decline of over 18.1 percent. POPULATION AND HOUSEHOLDS
The MSA added over 311,000 persons between 2000 and 2010, an annual growth rate of 1.0 percent, as shown in Table 3-7. Anoka County grew at the same annual growth rate as the MSA (1.0 percent), adding 32,760 persons or 10.5 percent of total MSA growth. Sherburne County grew by 24,082 people in the past decade, which is an annual rate of increase of 3.2 percent.
3-8

Sherburne County captured 7.7 percent of the population growth in the MSA between 2000 and 2010.
Table 3-7
TWIN CITIES AREA POPULATION; 2000 TO 2010
PercentGrowth of MSA
Place 2000 2010 Number Change Rate Growth
Minneapolis-St. Paul MSA 2,968,806 3,279,833 311,027 31,103 1.0 % 100.0 %Metropolitan Area 2,642,056 2,849,567 207,511 20,751 0.8 66.7 Corridor Counties
Anoka 298,084 330,844 32,760 3,276 1.0 10.5 Sherburne 64,417 88,499 24,082 2,408 3.2 7.7 Total 362,501 419,343 56,842 5,684 1.5 % 18.3 %
Source: U.S. Census.
Change 2000 to 2010
The MSA added over 136,000 households between 2000 and 2010, an average of over 13,000 annually, as shown in Table 3-8. Anoka and Sherburne Counties grew at an annual rate of 1.3 percent and 3.4 percent compared to 1.1 percent for the MSA. Anoka County added 14,799 households during this period compared to 8,631 additional households in Sherburne County.
Table 3-8
TWIN CITIES AREAS HOUSEHOLDS; 2000 TO 2010
PercentGrowth of MSA
Place 2000 2010 Number Change Rate Growth
Minneapolis-St. Paul MSA 1,136,615 1,272,677 136,062 13,606 1.1 % 100.0 %Metropolitan Area 1,021,454 1,117,749 96,295 9,630 0.9 70.8 Corridor Counties
Anoka 106,428 121,227 14,799 1,480 1.3 10.9 Sherburne 21,581 30,212 8,631 863 3.4 6.3 Total 128,009 151,439 23,430 2,343 1.7 % 17.2 %
Source: U.S. Census.
Change 2000 to 2010
The Northstar cities added 14,376 people over the past decade, which is about five percent of the growth in the MSA, as shown in Table 3-9. Ramsey, Elk River, and Big Lake captured the majority of population and household growth in the study corridor. Elk River increased the most in population and households of any of the corridor communities with 6,527 new residents in 2,416 households. Ramsey increased in population by 5,158 people and 2,127 households. Big Lake’s population and households increased by 3,997 and 1,260, respectively. Coon Rapids is the largest of the cities in the corridor with a population of 61,476 people in 2010, but lost population despite an increase of 954 households due to declining household size. The older, inner ring suburbs in the corridor such as Fridley, Coon Rapids, and Anoka experienced a loss in population during the decade, while the more exurban communities grew at rates much higher than the MSA.
3-9

Table 3-9
CORRIDOR COMMUNITIES POPULATION AND HOUSEHOLDS; 2000 TO 2010
GrowthCommunity 2000 2010 Number Rate 2010 Change
POPULATIONFridley 27,449 27,208 (241) (0.1) % 16.7 % (1.7) %Coon Rapids 61,607 61,476 (131) (0.0) 37.8 (0.9) Anoka 18,076 17,142 (934) (0.5) 10.5 (6.5) Ramsey 18,510 23,668 5,158 2.5 14.6 35.9 Elk River 16,447 22,974 6,527 3.4 14.1 45.4 Big Lake 6,063 10,060 3,997 5.2 6.2 27.8
Total 148,152 162,528 14,376 0.9 % 100.0 % 100.0 %
HOUSEHOLDSFridley 11,328 11,110 (218) (0.2) % 18.2 % (3.4) %Coon Rapids 22,578 23,532 954 0.4 38.5 15.1 Anoka 7,262 7,060 (202) (0.3) 11.5 (3.2) Ramsey 5,906 8,033 2,127 3.1 13.1 33.6 Elk River 5,664 8,080 2,416 3.6 13.2 38.1 Big Lake 2,117 3,377 1,260 4.8 5.5 19.9
Total 54,855 61,192 6,337 1.1 % 100.0 % 100.0 %
Source: U.S. Census.
Change Percent of Corridor
Population and Household Forecasts
Population and household forecasts developed by the State Demographer for 2010, 2020, and 2030 are shown in Table 3-10. The Metropolitan Area is projected to grow at a rate of 0.6 percent. The expected annual rate of growth for Anoka and Sherburne Counties is an indication of the expected capture of Metropolitan Area growth for the Northstar Corridor. Anoka County population is expected to grow at an annual rate of 0.8 percent. Sherburne County population is expected to grow at an annual rate of 2.4 percent, higher than both the MSA and Metropolitan Area forecast of less than 1.0 percent per year.
Table 3-10
NORTHSTAR CORRIDOR POPULATION AND HOUSEHOLD FORECAST; 2010 TO 2030
GrowthCommunity 2010 2020 2030 Number Rate Change
POPULATIONMinneapolis-St. Paul MSA 3,248,430 3,583,220 3,828,560 580,130 0.8 % 29,007 Metropolitan Area 2,906,470 3,134,270 3,286,970 380,500 0.6 19,025 Corridor Counties
Anoka 352,070 373,480 411,630 59,560 0.8 2,978 Sherburne 101,570 134,360 161,990 60,420 2.4 3,021 Total 453,640 507,840 573,620 119,980 1.2 % 5,999
HOUSEHOLDSMinneapolis-St. Paul MSA 1,263,000 1,416,680 1,539,000 276,000 1.0 % 13,800 Metropolitan Area 1,141,070 1,253,360 1,335,970 194,900 0.8 9,745 Corridor Counties
Anoka 132,570 154,350 167,040 34,470 1.2 1,724 Sherburne 35,470 48,110 59,900 24,430 2.7 1,222 Total 168,040 202,460 226,940 58,900 1.5 % 2,945
Source: M innesota State Demographic Center.
Change
3-10

3-11
Household forecasts show households growing faster than population in the MSA, Metropolitan Area, and Anoka and Sherburne Counties. Sherburne County households are expected to grow at a 2.7 percent annual growth rate; while Anoka County is expected to grow at a 1.2 percent annual growth rate.

4-1
Chapter IV
NORTHSTAR CORRIDOR RESIDENTIAL MARKET CONDITIONS This chapter summarizes the current residential market conditions in the MSA and along the Northstar Corridor. Residential market conditions are analyzed to provide a framework for identifying viable residential development options at the Ramsey Station. RESIDENTIAL MARKET
There were over 156,000 new housing units permitted in the MSA between 2000 and 2011, as shown in Table 4-1, which is an average of 13,058 units per year. Single family units comprised 45 percent of all the units permitted, while attached homes were 20 percent and multi-family units were 35 percent of the total units. Building permits peaked in 2003 at 21,283 units and declined steadily to 4,290 in 2009 before recovering to 5,725 units in 2010. There were 20,698 units permitted in Anoka County between 2000 and 2011, which was 13 percent of residential construction in the MSA. Sixty-three percent of the units permitted in Anoka County were single family homes and 26 percent were townhomes and duplexes. Only 11 percent were multi-family units including both condos and apartments. Building permits in Anoka County peaked at 3,336 units in 2004, one year later than the MSA, and declined steadily to 492 in 2009, a decline of 85 percent. Building permits recovered to 685 in 2010. Anoka County’s market share of MSA building permits has held up well. Market share was 11 percent in 2000, increased to 16 percent in 2004, declined to 11 percent in 2008 and 2009, and then recovered to 12 percent in 2010. Sherburne County permitted 9,213 units over the past decade, which was six percent of the units permitted in the MSA. Units in Sherburne County were predominately single family units at 95 percent, with townhomes comprising two percent and multi-family units three percent of the total. Sherburne County building permits peaked in 2003 at 1,596 units and declined steadily to 89 units in 2009, a decline of 94 percent. Market share of MSA building permits ranged from six to seven percent between 2000 and 2006, and then declined to two percent in 2008, 2009, 2010, and 2011. The Northstar Corridor communities permitted 8,909 housing units between 2000 and 2011, which is 5.7 percent of the MSA total, as shown in Table 4-2. Elk River and Ramsey permitted the most units between 2000 and 2011, with 2,662 and 2,413 units, respectively. Coon Rapids and Big Lake each permitted over 1,600 units. Fridley and Anoka permitted the least number of units, with 385 and 147 units, respectively. Ramsey permitted 2,413 units, which was 27.1 percent of the total units permitted in the corridor. Like the MSA as a whole, residential construction in the corridor communities dropped off sharply after 2006.

Tabl
e 4-
1
RES
IDEN
TIA
L BU
ILD
ING
PER
MIT
S: M
SA A
ND
AN
OK
A A
ND
SH
ERBU
RN
E C
OU
NTI
ES; 2
000
TO 2
011
Perc
ent
Are
a20
0020
0120
0220
0320
0420
0520
0620
0720
0820
0920
1020
11To
tal
of T
otal
Min
neap
olis
-St.
Paul
MSA
Sing
le F
amily
Det
ache
d
9,5
418,
858
8,27
6
9,
034
8,
24
46,
877
5
,251
3,65
0
2,
282
2,46
9
2,
792
3,75
6
71
,030
45
%To
wnh
ome/
Dup
lex
3
,567
3,47
3
3,
577
4,83
5
5,
126
3,
79
5
2,9
611,
861
960
56
1
614
24
31
,354
20
Con
do/ A
partm
ent
5
,0
195,
837
8,30
7
7,
414
7,
40
16,
375
4
,208
2,93
4
1,
865
1,26
0
2,
319
1,36
8
54
,307
35
MSA
Tot
al18
,127
18,1
68
20,1
60
21,2
83
20,
77
117
,
047
12,
420
8,44
5
5,
107
4,29
0
5,
725
5,14
8
15
6,69
1
10
0
%
Ano
ka C
ount
ySi
ngle
Fam
ily D
etac
hed
1
,704
1,70
6
1,
685
1,82
4
1,
768
1,
21
783
0
638
29
5
415
50
9
538
13
,129
63
%To
wnh
ome/
Dup
lex
339
47
3
542
97
9
1,02
9
8
37
610
20
8
123
41
11
8
-
5,29
9
26
C
ondo
/ Apa
rtmen
t
16
254
41
5
145
53
9
3
2440
28
2
161
36
58
-
2,
270
11
Ano
ka T
otal
2
,0
592,
433
2,64
2
2,
948
3,
33
62,
378
1
,480
1,12
8
57
9
492
68
5
538
20
,698
10
0
%Pe
rcen
t of M
SA11
%13
%13
%14
%16
%14
%12
%13
%11
%11
%12
%10
%13
%
Sher
burn
e C
ount
ySi
ngle
Fam
ily D
etac
hed
1
,108
1,02
7
1,
075
1,52
0
1,
501
1,
16
372
2
333
10
8
89
82
65
8,79
3
95
%
Tow
nhom
e/ D
uple
x
70
68
26
20
4
-
-
-
-
-
-
-
188
2
C
ondo
/ Apa
rtmen
t
10
9
34
8
56
32
5 -
-
-
-
53
17
31
4
3
Sher
burn
e To
tal
1
,2
871,
129
1,10
9
1,
596
1,
53
71,
168
722
33
3
108
89
13
5
82
9,29
5
100
%
Perc
ent o
f MSA
7%6%
6%7%
7%7%
6%4%
2%2%
2%2%
6%
Sour
ce: U
S C
ensu
s C-4
0, M
etro
polit
an C
ounc
il, E
cono
mic
& P
lann
ing
Syst
ems,
Inc.
, and
McC
omb
Gro
up, L
td.
Lori
Text Box
4-2

4-3
Table 4-2
NORTHSTAR CORRIDOR CITIES RESIDENTIAL BUILDING PERMITS; 2000 TO 2011
Minneapolis- Coon Elk Big % ofYear St. Paul MSA Fridley Rapids Anoka Ramsey River Lake Total MSA
2000 18,127 20 142 NA 91 284 306 843 4.7 %2001 18,168 42 286 10 85 256 167 846 4.7 2002 20,160 11 221 15 219 244 155 865 4.3 2003 21,283 144 319 38 454 550 236 1,741 8.2 2004 20,771 11 282 16 564 547 206 1,626 7.8 2005 17,047 27 171 10 391 344 199 1,142 6.7 2006 12,420 9 155 4 176 250 147 741 6.0 2007 8,445 3 73 2 230 116 72 496 5.9 2008 5,107 1 4 26 75 25 11 142 2.8 2009 4,290 1 9 2 45 20 25 102 2.4 2010 5,725 44 10 22 60 15 28 179 3.1 2011 5,148 72 21 2 23 11 57 186 3.6
Total 156,691 385 1,693 147 2,413 2,662 1,609 8,909 5.7 %
Source: US Census, Northstar Corridor Communities, Economic & Planning Systems, Inc., and McComb Group, Ltd. For-Sale Market
The Case Schiller home price index tracks the growth in the value of residential real estate by tracking the original purchase price and resale price of homes. The index tracks the major metro areas in the U.S. and compiles a 10 and 20 city composite index for comparison. The Minneapolis metro area home price index peaked in early 2006 and reached its bottom in January 2011, as shown in Figure 4-1. Minneapolis home price index has matched closely with Chicago’s home price index over the past 10 years. Minneapolis home prices did not rise as high as the composite 20 city index but prices dropped to a level almost as low as in 2000. The recession coupled with the financial crisis had a major impact on consumer confidence, employment and wages, and consequently on home values.
Figure 4-1
MINNEAPOLIS AND SELECTED CITIES HOME PRICE INDEX; 2000 TO 2011
50
75
100
125
150
175
200
225
250
275
Jan-00 Jan-01 Jan-02 Jan-03 Jan-04 Jan-05 Jan-06 Jan-07 Jan-08 Jan-09 Jan-10 Jan-11
Minneapolis
Chicago
Denver
Seattle
San Diego
Composite 20
Source: Case Schiller.

The average price for a new home in the Twin Cities area was $376,000 in 2011, as shown in Table 4-3. The price for new single family home is up slightly from the average price found in 2005 but down $60,000 (13.7 percent) from the 2007 peak of $436,000. The average price for a previously owned single family home in the Twin Cities area was $202,000 in 2011, which was down $93,000 (31.5 percent) from the 2006 high of $295,000. The average price for previously owned townhomes decreased 36.0 percent and condos prices were down 25.2 percent from 2005. The average price for previously owned homes has not rebounded from the drop in prices that started in 2006. Average home prices in 2010 were up from the 2009 average, but dropped again in 2011. It appears that the average home prices in the Twin Cities area have reached bottom and are beginning to recover. Average sales prices for newly constructed units have been increasing, but new homes sales accounted for only six percent of all sales in the Twin Cities area in 2011.
Table 4-3
TWIN CITIES AREA AVERAGE HOME PRICE; 2005 TO 2011
% Change2005 2006 2007 2008 2009 2010 2011 2005-2011
New ConstructionSingle Family Detached 372,138$ 415,435$ 436,211$ 422,106$ 351,589$ 356,803$ 376,418$ 1.2%
Annual % Change --- 11.6% 5.0% -3.2% -16.7% 1.5% 5.5%
Townhouse 249,135$ 237,139$ 235,094$ 229,720$ 195,671$ 200,507$ 203,143$ -18.5%Annual % Change --- -4.8% -0.9% -2.3% -14.8% 2.5% 1.3%
Condo 265,124$ 285,194$ 280,167$ 339,799$ 348,884$ 286,442$ 333,926$ 26.0%Annual % Change --- 7.6% -1.8% 21.3% 2.7% -17.9% 16.6%
Previously OwnedSingle Family Detached 289,741$ 294,999$ 289,067$ 238,439$ 203,968$ 221,595$ 202,119$ -30.2%
Annual % Change --- 1.8% -2.0% -17.5% -14.5% 8.6% -8.8%
Townhouse 206,116$ 203,337$ 206,337$ 176,992$ 149,256$ 150,735$ 131,824$ -36.0%Annual % Change --- -1.3% 1.5% -14.2% -15.7% 1.0% -12.5%
Condo 173,922$ 174,327$ 176,338$ 166,216$ 140,297$ 138,975$ 130,103$ -25.2%Annual % Change --- 0.2% 1.2% -5.7% -15.6% -0.9% -6.4%
So urce : Minneapo lis Area As s o c ia tio n o f Rea lto rs , Eco no mic & P lanning Sys tems , Inc ., and McCo mb Gro up, Ltd. Apartment Market
The Twin Cities area apartment market is recovering much faster than the for-sale market locally and nationally. The apartment vacancy rate in the Twin Cities area was 2.4 percent in mid-2011, which is considerably lower than the national average and down from over 5.0 percent in 2009. The Northwest Suburban submarket, which includes the Northstar Corridor, had a vacancy rate of 2.7 percent in the 2nd Quarter of 2011 and the average rent price was $907 per month, which is slightly lower than the area wide average. The vacancy rates in downtown Minneapolis and downtown St. Paul were 1.2 and 0.8 percent, respectively, in 2011, as shown in Table 4-4. This drop in vacancy rate has lead to a steady growth in rental rates. The Twin Cities area average rental rate was $921 per month in the 2nd Quarter of 2011, which is up from $908 at the end of 2010. Low vacancies and rent growth are spurring new construction. According to the Cassidy Turley real estate brokerage firm, in the 2nd Quarter of 2011 the Northwest Suburban submarket had 1,060 apartment units proposed. The Twin Cities area had 8,593 proposed units and 1,814 units that were under construction. The proposed units in the Northwest Suburban submarket (including the Northstar Corridor) were 12.3 percent of the Twin Cities area total. Over 70 percent of the proposed units are within the cities of Minneapolis and
4-4

St. Paul. The low vacancy rates and rising rental rates in the Twin Cities area indicates a growing demand for apartment units.
Table 4-4
TWIN CITIES AREA APARTMENT MARKET; 2ND QUARTER 2011
Vacancy Average Units Under ProposedSubmarket Rate Rent Construction Units
Northwest Suburban 2.7 % 907$ - 1,060 Downtown Minneapolis 1.2 1,213 297 2,505 Downtown St. Paul 0.8 1,133 70 327 Minneapolis 2.3 844 886 2,904 North Central Suburban 2.8 837 - 55 Northeast Suburban 2.3 802 - - South Central Suburban 2.3 890 561 1,257 Southeast Suburban 2.7 975 - - Southwest Suburban 2.4 1,015 - 150 St. Paul 2.4 832 - 335
Total Twin Cities Area 2.4 % 921$ 1,814 8,593
Source: Cassidy Turley. RAMSEY POPULATION AND HOUSEHOLDS
Ramsey’s population increased over the past decade by 5,158 people or an average of 516 per year, which is a 2.5 percent annual growth rate, as shown in Table 4-5. The number of housing units increased from 5,946 in 2000 to 8,302 in 2010, an average increase of 236 households per year or 3.4 percent annual growth rate. Vacant housing units increased from 40 in 2000 to 269 in 2010 for a vacancy rate of 3.2 percent.
Table 4-5
CITY OF RAMSEYPOPULATION, HOUSEHOLDS, AND TENURE; 2000 AND 2010
ChangeAverage Growth
Description 2000 2010 Number Annual Rate
Population 18,510 23,668 5,158 516 2.5 %
HouseholdsRenters 150 684 534 53 16.4 %Owners 5,756 7,349 1,593 159 2.5 Total 5,906 8,033 2,127 213 3.1 %Average Household Size 3.13 2.95
Housing Units 5,946 8,302 2,356 236 3.4 %Vacant Units 40 269 229 23 21.0 Vacancy Rate 0.7 % 3.2 %
Source: U.S. Census, Economic & Planning Systems, Inc., and McComb Group, Ltd.
4-5

In 2010, 8.5 percent of households in Ramsey were renters and 91.5 percent were owners, as shown in Table 4-6. The percentage of renter households in Ramsey (8.5 percent) is less than the MSA in which 28.6 percent of households are renters.
Table 4-6
CITY OF RAMSEY AND MINNEAPOLIS-ST. PAUL MSAHOUSING TENURE; 2000 AND 2010
Household Type 2000 2010
RamseyRenters 2.5 % 8.5 %Owners 97.5 91.5 Total 100.0 % 100.0 %
Minneapolis-St. Paul MSARenters 27.6 % 28.6 %Owners 72.4 71.4 Total 100.0 % 100.0 %
Source: U.S. Census and Economic & Planning Systems, Inc. The majority of households in Ramsey are families (related by blood or marriage), and nearly half of all households are families with children, as shown in Table 4-7. Eighty-one percent of households in Ramsey were family households in 2010, and 41.1 percent of households have individuals under 18.
Table 4-7
CITY OF RAMSEYHOUSEHOLDS BY TYPE; 2000 AND 2010
2000 2010 GrowthHousehold Type Number Percent Number Percent Change Rate
Total Households 5,906 8,033 2,127 3.1 %Family Households 5,101 86.4 % 6,484 80.7 % 1,383 2.4
With Individuals under 18 2,927 49.6 3,301 41.1 374 1.2 With Individuals 65 and Over 82 1.4 245 3.0 163 11.6
Non-Family Households 805 13.6 1,549 19.3 744 6.8 Householder Living Alone 522 8.8 1,104 13.7 582 7.8
Source: U.S. Census and Economic & Planning Systems, Inc. Ramsey has a higher percentage of family households and family households with individuals under 18 than the MSA and a lower percentage of non-family households, householders living alone, and households with individuals 65 and over, as shown in Figure 4-2.
4-6
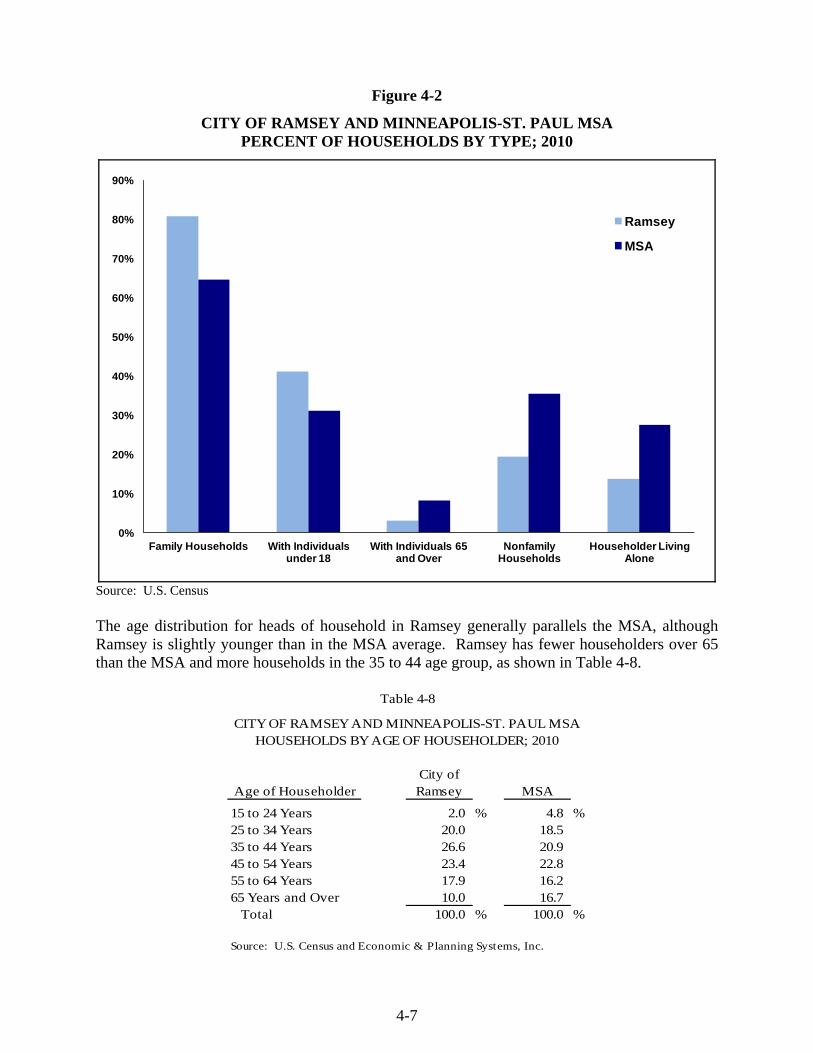
Figure 4-2
CITY OF RAMSEY AND MINNEAPOLIS-ST. PAUL MSA PERCENT OF HOUSEHOLDS BY TYPE; 2010
0%
10%
20%
30%
40%
50%
60%
70%
80%
90%
Family Households With Individuals under 18
With Individuals 65 and Over
Nonfamily Households
Householder Living Alone
Ramsey
MSA
Source: U.S. Census The age distribution for heads of household in Ramsey generally parallels the MSA, although Ramsey is slightly younger than in the MSA average. Ramsey has fewer householders over 65 than the MSA and more households in the 35 to 44 age group, as shown in Table 4-8.
Table 4-8
CITY OF RAMSEY AND MINNEAPOLIS-ST. PAUL MSAHOUSEHOLDS BY AGE OF HOUSEHOLDER; 2010
City ofAge of Householder Ramsey MSA
15 to 24 Years 2.0 % 4.8 %25 to 34 Years 20.0 18.5 35 to 44 Years 26.6 20.9 45 to 54 Years 23.4 22.8 55 to 64 Years 17.9 16.2 65 Years and Over 10.0 16.7 Total 100.0 % 100.0 %
Source: U.S. Census and Economic & Planning Systems, Inc.
4-7

Average household income for residents in Ramsey was $87,096 in 2010, which was 4.7 percent higher than the MSA average of $83,023, as shown in Table 4-9. The median household income in Ramsey was $81,598 in 2010; while the MSA median household income was $65,181.
Table 4-9
CITY OF RAMSEY AND MINNEAPOLIS-ST. PAUL MSAHOUSEHOLD INCOME; 2010
City ofCategory Ramsey MSA
Average Household Income 87,096$ 83,023$ Median Household Income 81,598 65,181 Per Capita Income 30,365 32,852
Source: 2000 U.s. Census, 2006-2010 American Community Survey 5-Year Estimates, and Economic & Planning Systems, Inc.
The largest household income brackets in Ramsey are $50,000 to $74,999, $75,000 to $99,999, and $100,000 to $149,999. Ramsey has fewer lower income households than the MSA, as shown in Figure 4-3.
Figure 4-3
CITY OF RAMSEY AND MINNEAPOLIS-ST. PAUL MSA HOUSEHOLD INCOME DISTRIBUTION; 2010
0%
5%
10%
15%
20%
25%
0-$14,999 $15,000-$24,999
$25,000-$34,999
$35,000-$49,999
$50,000-$74,999
$75,000-$99,999
$100,000-$149,999
Over $150,000
Ramsey
MSA
Source: U.S. Census.
4-8
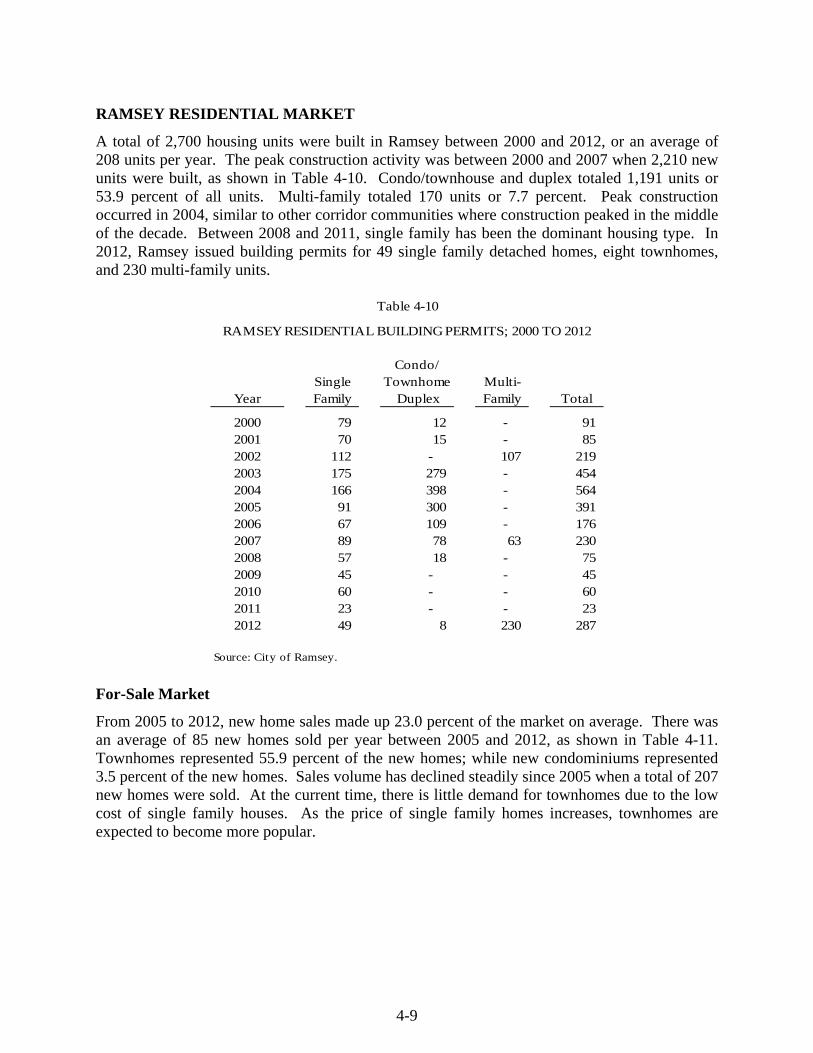
RAMSEY RESIDENTIAL MARKET
A total of 2,700 housing units were built in Ramsey between 2000 and 2012, or an average of 208 units per year. The peak construction activity was between 2000 and 2007 when 2,210 new units were built, as shown in Table 4-10. Condo/townhouse and duplex totaled 1,191 units or 53.9 percent of all units. Multi-family totaled 170 units or 7.7 percent. Peak construction occurred in 2004, similar to other corridor communities where construction peaked in the middle of the decade. Between 2008 and 2011, single family has been the dominant housing type. In 2012, Ramsey issued building permits for 49 single family detached homes, eight townhomes, and 230 multi-family units.
Condo/Single Townhome Multi-
Year Family Duplex Family Total
2000 79 12 - 91 2001 70 15 - 85 2002 112 - 107 219 2003 175 279 - 454 2004 166 398 - 564 2005 91 300 - 391 2006 67 109 - 176 2007 89 78 63 230 2008 57 18 - 75 2009 45 - - 45 2010 60 - - 60 2011 23 - - 23 2012 49 8 230 287
Source: City of Ramsey.
Table 4-10
RAMSEY RESIDENTIAL BUILDING PERMITS; 2000 TO 2012
For-Sale Market
From 2005 to 2012, new home sales made up 23.0 percent of the market on average. There was an average of 85 new homes sold per year between 2005 and 2012, as shown in Table 4-11. Townhomes represented 55.9 percent of the new homes; while new condominiums represented 3.5 percent of the new homes. Sales volume has declined steadily since 2005 when a total of 207 new homes were sold. At the current time, there is little demand for townhomes due to the low cost of single family houses. As the price of single family homes increases, townhomes are expected to become more popular.
4-9

Table 4-11
RAMSEY HOME SALES; 2005 TO 2012
2005 2006 2007 2008 2009 2010 2011 2012 Total Percent
New ConstructionSingle Family Detached 62 30 28 31 32 38 23 32 276 40.6 %Townhome 136 111 55 52 16 9 1 - 380 55.9 Condo 9 2 6 1 - - - 6 24 3.5
Subtotal 207 143 89 84 48 47 24 38 680 100.0 %
Previously OwnedSingle Family Detached 265 210 170 196 216 207 226 228 1,718 75.4 %Townhome 29 34 52 59 102 74 101 103 554 24.3 Condo - 2 - 2 - - - 2 6 0.3
Subtotal 294 246 222 257 318 281 327 333 2,278 100.0 %
Total 501 389 311 341 366 328 351 371 2,958
Source: Minneapolis Area Association of Realtors and Economic & Planning Systems, Inc. The average sales price for a new construction single family home in Ramsey has dropped 40.2 percent from $347,432 in 2005 to $207,803 in 2012, as shown in Table 4-12. The average sales price for a new construction townhome was $187,051 in 2005 and declined by 33.3 percent to $124,731 in 2012. These steep declines were influenced by foreclosed home sales. Previously owned single family prices declined from an average of $259,559 in 2005 to $179,298 in 2012, a decrease of 30.9 percent. Townhome prices declined from $186,272 in 2005 to $98,975 in 2012, a decline of 46.9 percent.
2005 2006 2007 2008 2009 2010 2011 2012 % Change
New ConstructionSingle Family Detached $347,432 $352,585 $274,491 $274,466 $246,594 $239,398 $211,821 $207,803 -40.2%
Annual % Change --- 1.48% -22.15% -0.01% -10.15% -2.92% -11.52% -1.90%
Townhome $187,051 $199,964 $188,767 $161,128 $150,585 $71,072 $79,900 $124,731 -33.3%Annual % Change --- 6.90% -5.60% -14.64% -6.54% -52.80% 12.42% 56.11%
Condo $171,096 $194,431 $167,612 $156,000 --- --- --- --- ---Annual % Change --- 13.64% -13.79% -6.93% --- --- --- ---
Previously OwnedSingle Family Detached $259,559 $275,308 $261,913 $233,713 $183,832 $191,056 $173,085 $179,298 -30.9%
Annual % Change --- 6.07% -4.87% -10.77% -21.34% 3.93% -9.41% 3.59%
Townhome $186,272 $187,879 $166,479 $130,515 $107,984 $104,947 $91,859 $98,975 -46.9%Annual % Change --- 0.86% -11.39% -21.60% -17.26% -2.81% -12.47% 7.75%
Condo --- $168,000 --- $126,200 --- --- --- $79,300 ---Annual % Change --- --- --- --- --- --- --- ---
Source: Minneapolis Area Association of Realtors and Economic & Planning Systems, Inc.
Table 4-12
RAMSEY AVERAGE HOME SALE PRICE; 2005 TO 2012
Foreclosures are the primary factor contributing to both the volume of sales and the decline in average prices. In 2009, over half of the home sales in Ramsey were foreclosure sales, compared to only 1.4 percent in 2005, as shown in Table 4-13. Since 2009, the percent of foreclosed sales has declined, resulting in 38.1 percent foreclosed home sales in 2012. The Twin Cities area is experiencing a similar trend with 29 percent of sales in the area being foreclosures. In 2013, this rate of foreclosures in Ramsey will need to be worked down before existing home prices stabilize.
4-10

2005 2006 2007 2008 2009 2010 2011 2012Ramsey
Foreclosure Sales 7 17 33 119 189 149 159 127 Total Sales 501 389 311 341 366 328 351 333
Percent Foreclosure Sales 1.4 % 4.4 % 10.6 % 34.9 % 51.6 % 45.4 % 45.3 % 38.1 %
Twin Cities AreaForeclosure Sales 804 1,496 3,288 10,764 17,805 13,185 15,634 13,929 Total Sales 56,755 46,770 39,227 38,289 44,621 38,251 41,566 48,772
Percent Foreclosure Sales 1.4 % 3.2 % 8.4 % 28.1 % 39.9 % 34.5 % 37.6 % 28.6 %
So urce : Minneapo lis Area As s o c ia tio n o f Rea lto rs and Eco no mic & P lanning Sys tems , Inc .
Table 4-13
RAMSEY FORECLOSED SALES, 2005 TO 2012
Apartment Market
Renters made up approximately nine percent of Ramsey’s households in 2010. There are three general occupancy multi-family properties (with 20 units or more) in the City and one senior living facility, as shown on Map 4-1 and in Table 4-14. General occupancy apartments include River Bend (32 units), Sunwood Townhomes (32 units), and Terrace Hill Apartments (63 units). Savannah Oaks (50 units) is Ramsey’s only existing senior building.
Map 4-1
RAMSEY APARTMENTS
The Residence at The COR, a 230-unit general occupancy apartment building, is scheduled for completion in Spring 2013. Stoney River is a 72-unit senior development located at Nowthen
4-11

Boulevard and TH-47 in southeast Ramsey. The development is proposed to include nine independent living units, 39 assisted living, and 24 specialized memory care units. This development is planned for completion in 2014.
Table 4-14
RAMSEY APARTMENTSYEAR BUILT AND NUMBER OF UNITS
Building Year Units
General OccupancyRiver Bend 1991 32Sunwood Townhomes 2002 32Terrace Hill Apartments 2008 63Residence at The COR 2013 230
SeniorSavannah Oaks 1998 50Stoney River 2014 72
Source: City of Ramsey. Unit size and rent for general occupancy and senior buildings are contained in Table 4-15. Unit size is available for two general occupancy buildings and Savannah Oaks. Monthly rent and rent per square foot are, as would be expected, highest at The Residence at The COR.
Table 4-15
RAMSEY APARTMENTS: UNIT SIZE, RENT, AND RENT PER SQUARE FOOT
Terrace Residence SavannahHill at The COR Oaks
Square FeetStudio 533-6421 Bedroom 762-878 644-1,039 7051 Bedroom + Den 908-9562 Bedroom 966-1,161 976-1,598 1,0203 Bedroom 1,323 1,598
Rental RatesStudio $899-$1,0001 Bedroom $830-$935 $1,050-$1,225 $7631 Bedroom + Den $901-$9402 Bedroom $1,025-$1,140 $1,299-$2,100 $1,1043 Bedroom $1,350 $1,899-$2,100
Rent per Square FootStudio $1.56-$1.691 Bedroom $1.06-$1.09 $1.18-$1.63 $1.081 Bedroom + Den $0.98-$0.992 Bedroom $0.98-$1.06 $1.31-$1.33 $1.083 Bedroom $1.02 $1.19-$1.31
Source: McComb Group, Ltd.
4-12

RAMSEY REALTOR SURVEYS
Four Ramsey area realtors were surveyed to solicit their opinions of the residential real estate market in Ramsey. These realtors were asked questions regarding today’s residential buyer and seller, the attractiveness of Ramsey, housing types and price ranges, homebuyers views on the Northstar commuter rail service, and also about what makes Ramsey different from surrounding communities. Responses have been summarized below. According to area real estate agents, there is a wide variety of people selling their homes in Ramsey--foreclosures, short sales, and traditional home sellers. While foreclosures and short sales have been the norm in the past couple of years, these real estate agents felt that the traditional existing home market is coming back. Other people selling their homes are looking to downsize or move up to a larger home because of the low interest rates. Additionally, new construction has seen increased sales within the past year. Ramsey realtors cited the most common reason people are selling is not having a choice, or forced to sell. These are the people that were hit the hardest by the economy. Other reasons included life cycle, it’s either time to move up or downsize; one way or the other, these sellers have had a change of lifestyle. There was no overwhelming response by real estate agents stating that people selling their homes tend to stay in the area. Realtors felt that there are too many variables to consider and it really depends on what the movers needs are. However, there are some that are moving to newer construction that has become available in the Ramsey area. All Ramsey real estate agents stated that the majority of people seeking homes in the Ramsey area are young families and first time homebuyers. Since townhomes are in abundance in Ramsey, there are a lot of apartment dwellers looking to move into their first home. There are also people looking to take advantage of the low interest rates and get more for their money by moving into a larger home or a home they always dreamed of having. Real estate agents in the Ramsey area feel that Ramsey is attractive to homebuyers because of the following:
• New medical clinics (3 mentions) • Good schools (3 mentions) • Convenience of TH-10 (3 mentions) • Nice lots with acreage (3 mentions) • Growing community (2 mentions) • Conveniences of various retail (2 mentions) • Rural setting (2 mentions) • Parks • Rail system • Affordability, single family is reasonable • Close to Anoka and Minneapolis • Ramsey Town Center • PACT Charter School
4-13

Ramsey real estate agents have experienced that people looking for houses in Ramsey are typically looking for large lot single family homes or townhomes. The most sought after home is one with three bedrooms and two bathrooms. Northfork is also a very popular development in Ramsey. This is a community of well kept, older homes (1990’s) with acreage. Homebuyers in Ramsey expect to pay between $145,000 and $225,000 for a home. Real estate agents in the area felt the majority of the buyers look around the $150,000 to $170,000 range. Townhomes usually run $90,000 to $140,000 and new construction will be in the $300,000’s. There was no question amongst real estate agents that homebuyers are able to find what they are looking for in a home in Ramsey. Homebuyers can easily find homes in their price category with the current existing for-sale home inventory. When local real estate agents were asked how Ramsey homebuyers view the Northstar commuter rail, there were various personal views. However, none of the real estate agents felt that the Northstar commuter rail was a driving force or a needed feature of people looking to buy a home in Ramsey. Personal views on the Northstar commuter rail service by the real estate agents are shown below:
• Personally, it’s inconvenient. For baseball games, it has a schedule, and regardless of how the game goes, the train leaves at a certain time. For the airport, it’s a long ride from Ramsey! And it’s a transfer to light rail, which has way too many stops and some of them are not in nice areas.
• Single friends who work in the city, have looked at it as a way to get out of the city and into ownership of something affordable, but I haven’t run into a lot of daily users.
• Don’t think a lot of people understand the service – or don’t know about it.
• We talk about it, it helps a little, seems like people are aware of it. When asked what makes Ramsey different from other surrounding communities, real estate agents had different ideas. One real estate agent felt that Ramsey was like an island, it got developed around, and now it has opportunities for new growth and it offers newness to homebuyers. Other real estate agents agree with the newness of the area differentiating Ramsey from adjacent communities. Others felt that it has the opportunity for new construction and there are few areas that are close to the cities with this many opportunities. Another thought was that Ramsey was a mix of rural and city, without being too far from the city, which made it different from neighboring communities. RESIDENTIAL GROWTH ESTIMATES
Future housing demand in the Northstar cities is dependent on future residential growth in each city’s draw area, which is the area where most of the Northstar riders live. The methodology used to estimate household growth in each of the Northstar cities for 2013 through 2035 is described in this section.
4-14

Twin Cities Area Residential Growth Corridors
Residential growth in the Twin Cities area radiates out from Minneapolis and St. Paul in eight growth corridors. Historic growth in these eight corridors has been documented by McComb Group, Ltd. from 1970 through 2011. Each growth corridor generally captures the same portion of the Twin Cities area growth each year, even though housing development will fluctuate from year to year. Northstar Corridor cities are located in the North Growth Corridor, shown in Map 4-2. This growth corridor is served by TH-10 in the west and TH-65 in the east.
Map 4-2
NORTH GROWTH CORRIDOR
The Northstar commuter service draws its riders from cities located in the west portion of the North Growth Corridor, shown on Map 4-3. Stations in each city have individual draw areas that contain the residence location of Northstar riders that use that station. Draw areas were delineated based on rider surveys conducted by the Metropolitan Council for Fridley, Coon Rapids, Anoka, Elk River, and Big Lake Stations. The Ramsey Station Draw Area is based on a survey conducted in 2012 by Metro Transit. The draw area cities are shown on Map 4-3, along with the Northstar cities.
4-15

4-16
Map 4-3
NORTHSTAR CORRIDOR DRAW AREAS
Historic Residential Growth
Building permits for the Metropolitan Area, North Growth Corridor, Northstar Corridor Draw Area, and Northstar cities were examined from 1991 through September 2012, shown in Table 4-16, to determine household growth trends. Annual Metropolitan Area building permits ranged from 12,060 to 17,679 between 1991 and 1999. As the housing boom unfolded, building permits increased from 17,679 in 1999, peaked at 20,973 in 2003, which was followed by a decline to 12,109 in 2006 when the housing boom ended. Building permits declined by 67 percent from 12,109 in 2006 to 4,028 in 2009 and began a slight recovery to 5,014 units in 2010. Based on nine months experience in 2012, it appears that building permits in 2012 will be significantly higher than recorded in the 2008 to 2011 period. Three periods contained in Table 4-16 reflect a relatively normal period (1991 to 1998); a boom period (1999 to 2006) and a recessionary period (2007 to 2012). Building permit trends in each period provide insight into future residential development trends. North Growth Corridor market share of the Metropolitan Area building permits has averaged 17.1 percent between 1991 and 2012. During the period 1991 to 1998, market share averaged 16.9 percent. Market share average increased to 18.0 percent in the 1999 to 2006 period. This increase was influenced by one year (2005) when market share was 27.1 percent. If 2005 market share is excluded, the average of the other seven years is 16.7 percent, generally consistent with the previous period. During the last four years (2008 through 2011), building permit market share ranged from 11.6 percent in 2008 to 18.6 percent in 2011. Market share has increased each

4-17
full year since 2008. Even though building permits have declined sharply, the North Growth Corridor has maintained a relatively consistent market share.
Table 4-16
SEVEN-COUNTY METROPOLITAN AREA, NORTH GROWTH CORRIDOR, NORTHSTAR CORRIDOR DRAW AREA,RAMSEY STATION DRAW AREA, AND RAMSEY
RESIDENTIAL BUILDING PERMITS; 1991 TO 2012*
Draw AreaMetropolitan Building Market Market Building Market Building Market Building
Year Area Permits Share Share Permits Share Permits Share Permits
1991 12,060 1,912 15.85 % 86.45 % 1,653 17.91 % 296 51.35 % 152 1992 15,632 2,713 17.36 84.48 2,292 20.24 464 60.13 279 1993 15,882 2,924 18.41 77.39 2,263 26.87 608 61.68 375 1994 14,205 2,140 15.07 84.67 1,812 25.00 453 54.75 248 1995 13,956 2,124 15.22 89.41 1,899 27.54 523 42.45 222 1996 14,098 2,505 17.77 86.59 2,169 25.17 546 50.55 276 1997 13,234 2,195 16.59 89.43 1,963 25.22 495 46.67 231 1998 15,817 2,944 18.61 91.98 2,708 21.38 579 53.02 307 1999 17,679 3,049 17.25 93.34 2,846 13.84 394 33.50 132 2000 17,050 2,432 14.26 93.22 2,267 17.87 405 22.47 91 2001 16,788 2,634 15.69 95.25 2,509 14.91 374 22.73 85 2002 19,782 2,751 13.91 96.58 2,657 19.53 519 42.20 219 2003 20,973 4,077 19.44 90.43 3,687 29.92 1,103 41.16 454 2004 19,832 4,119 20.77 93.59 3,855 30.17 1,163 48.50 564 2005 11,514 3,118 27.08 81.14 2,530 30.24 765 51.11 391 2006 12,109 1,904 15.72 91.23 1,737 25.96 451 39.02 176 2007 8,039 1,231 15.31 94.15 1,159 31.23 362 63.54 230 2008 4,711 543 11.53 92.08 500 20.80 104 72.12 75 2009 4,028 546 13.56 93.59 511 13.31 68 66.18 45 2010 5,014 702 14.00 96.15 675 11.70 79 75.95 60 2011 4,549 846 18.60 75.06 635 6.46 41 56.10 23 2012* 6,436 1,033 16.05 86.16 890 35.51 316 90.82 287
Total 283,388 48,442 17.09 % 89.21 % 43,217 23.39 % 10,108 48.69 % 4,922 Average 13,188 2,258 2,016 466 221
*Through September 2012.Average excludes 2012.Source: U.S. Census and McComb Group, Ltd.
North Growth Corridor RamseyDraw AreaNorthstar Corridor Ramsey Station
Building permits in the Northstar Corridor Draw Area increased from 1,653 in 1991 to 2,708 in 1998. During this eight year period, market share ranged from 77.4 percent to a peak of 92.0 percent in 1998 and averaged 86.3 percent. Market shares have increased to an average of 91.9 percent during the housing boom from 1999 to 2006. Since the housing boom ended in 2006, market share has averaged 90.2 percent over a five-year period. In the first four years of that period, the market share was 94.0 percent. While the number of building permits has been declining, the Northstar Corridor Draw Area has maintained strong market share performance. Ramsey Residential Growth
The Ramsey Station Draw Area includes Ramsey, Elk River, and Nowthen. Between 1991 and 1998, the draw area market share averaged 23.7 percent. During the period between 1999 and 2007, this area achieved the same average market share of 23.7 percent of Northstar Corridor Draw Area building permits. Building permit market share for the Ramsey Station Draw Area ranged from 13.8 to 31.2 percent between 1999 and 2008, with 2003 through 2005 being the most productive years for Ramsey’s residential development. Since 2008, Ramsey Station Draw Area cities have experienced reduced market share as a result of declining home construction. Average market share for the 2007 to 2012 was about 20 percent.

4-18
Ramsey’s market share of the Ramsey Station Draw Area building permits averaged 52.6 percent for the period 1991 through 1998. Annual market share fluctuated between 42.5 and 61.7 percent during this period. Residential development slowed during the 1999 to 2001 time period due to a shortage of residential lots. Development accelerated in 2004. Ramsey’s residential development declined between 2008 and 2011, while market share increased. From 2008 to 2012, Ramsey’s market share of Ramsey Station Draw Area building permits has averaged 72.2 percent. Market share increased to 90.8 percent in 2012 year-to-date due to a 238-unit apartment building. Multi-Family Development Trends
Development potential for most of the Ramsey Station areas is likely to be some form of multi-family housing which represents a residential submarket. Multi-family housing includes for-sale and for-rent multi-family buildings, duplexes, and townhomes. The historic market share of multi-family housing in relation to total housing in the Northstar Corridor Draw Area is contained in Table 4-17.
MULTI-FAMILY BUILDING PERMITS; 1991 TO 2012
Year Total Number Percent Number Percent Number Percent Number Percent
1991 1,653 171 10.3 % 165 96.5 % 6 3.5 % - - %1992 2,292 392 17.1 320 81.6 72 18.4 - - 1993 2,263 440 19.4 440 100.0 - - - - 1994 1,812 288 15.9 165 57.3 123 42.7 - - 1995 1,899 124 6.5 110 88.7 14 11.3 10 9.1 1996 2,169 74 3.4 45 60.8 29 39.2 - - 1997 1,963 134 6.8 82 61.2 52 38.8 9 11.0 1998 2,708 250 9.2 156 62.4 94 37.6 105 67.3 1999 2,846 308 10.8 292 94.8 16 5.2 8 2.7 2000 2,267 323 14.2 286 88.5 37 11.5 12 4.2 2001 2,509 542 21.6 420 77.5 122 22.5 15 3.6 2002 2,657 399 15.0 324 81.2 75 18.8 107 33.0 2003 3,687 977 26.5 919 94.1 58 5.9 279 30.4 2004 3,855 1,154 29.9 914 79.2 240 20.8 398 43.5 2005 2,530 927 36.6 604 65.2 323 34.8 300 49.7 2006 1,737 522 30.1 344 65.9 178 34.1 109 31.7 2007 1,155 509 44.1 240 47.2 269 52.8 141 58.8 2008 500 182 36.4 40 22.0 142 78.0 18 45.0 2009 511 62 12.1 4 6.5 58 93.5 - - 2010 675 103 15.3 59 57.3 44 42.7 - - 2011 637 123 19.3 123 100.0 - - - - 2012 * 873 NA NA NA NA NA NA 238 NA
Average 2,015 381 19.1 % 288 70.8 % 93 29.2 % 72 18.6 %
*Through September 2012.Average excludes 2012.Note: Multi-family includes townhomes and duplexes.Source: Metropolitan Council and U.S. Census.
Table 4-17
Northstar Corridor Draw Area
NORTHSTAR CORRIDOR DRAW AREA, NORTHSTAR CITIES, OTHER CITIES, AND RAMSEY
Multi-Family Northstar Cities Other Cities Ramsey

4-19
Northstar Corridor Draw Area multi-family building permits averaged 11.1 percent market share of total building permits from 1991 to 1998. Multi-family market share increased to an average of 23.1 percent from 1999 to 2006, and continued to increase to an average of 25.4 percent in the 2007 to 2011 period. This demonstrates that the Northstar Corridor Draw Area has become more attractive for multi-family development. Northstar station cities attracted more multi-family development than other communities within the Northstar Corridor Draw Area. Station cities captured over 75 percent of the Northstar Corridor Draw Area new multi-family units built between 1991 and 1998. From 1999 to 2006, Northstar station cities share of new multi-family units increased to an average of 80.8 percent as multi-family development increased in Northstar station cities. Since 2007, multi-family housing has decreased as a result of the recession. Multi-family housing increased in the other draw area cities which may reflect availability of development sites. Ramsey experienced sporadic multi-family development prior to 2002. In 1998, Ramsey added 105 multi-family units, capturing two-thirds of Northstar cities multi-family development. Between 2002 and 2007, Ramsey added over 1,300 multi-family housing units, of which 87.2 percent were in the condo/townhouse/duplex category. The average annual multi-family market share for this time period was 41.2 percent. Since 2007, multi-family development in Ramsey has decreased significantly with 18 units built in 2008 and no additional units added between 2009 and 2011. Year-to-date building permits indicate 238 multi-family units under construction in 2012. Household Formation
The dramatic decline in housing construction has many causes. It is becoming apparent that household formation has recently departed significantly from past trends. This appears to have been a major contributor to the sharp decline in residential construction following 2006 in the Metropolitan Area and nationally. The decline in household formation is a national trend and was documented in a recent analysis published by the Cleveland Federal Reserve Bank. This report found that annual household formation in the United States fell from an average of 1.5 million households in the 1997 to 2007 period to 500,000 per year in 2010, a level that is one-third of the annual households formed in the previous 10 years. The great recession reduced the formation of households by two-thirds. The shortfall in household formation was estimated at 2.6 million households. The decline in households was not uniform across all age cohorts. Nationally, households age 18 to 34 accounted for 25.6 million households or 21.6 percent of total households in 2011. This group, however, accounted for 1.9 million or 73 percent of the shortfall in household formation. The recession had a dramatic impact on the economic prospects for the 18 to 34 age cohort as unemployment increased and job openings evaporated as a result of the recession and the sluggish recovery that has created few jobs. The recession caused adult children to move home, singles to double-up, and homeowners to take in renters reducing the rate of household formation.

During the past 10 years, Metropolitan Area residential building permits declined from a peak of 20,973 units in 2003 to 4,028 in 2009, as shown in Table 4-16. The housing boom undoubtedly fueled the high number of building permits in the 1999 to 2004 period. Building permits fell below average in 2005 and began a sharp decline in 2007. While it was not apparent at that time, this decline coincided with a significant decline in household formation. Between 2006 and 2009, building permits fell from 12,109 to 4,028 in 2009, a two-thirds drop similar to the drop in household formation nationally. In past recessions, declines in household formation have been less severe and have been reflected in slight drops in building permits and decreased apartment occupancy rates. During the Great Recession, those declines have been greater and lasted longer due to the slow recovery. In the Metropolitan Area, as the economy has improved and the unemployment rate has declined, there’s been an increase in the number of building permits issued, particularly for multi-family housing. This indicates that the rate of household formation is beginning to increase creating demand for new housing. It’s uncertain how long it will take household formation to recover to previous levels, but the process seems to be underway. At some point, there may be an increase in household formation that makes up for some of the household formation that did not occur in 2008, 2009, 2010, and 2011. How much pent up demand exists is subject to speculation. Stabilized Residential Demand
The estimates of future housing demand in incorporate State Demographer estimates of future household growth for 10-year periods. These estimates represent stabilized residential demand based on long-term household growth estimates and do not reflect cyclical changes in household formations. The relationship of stabilized residential demand to past annual building permits and household formations for the Metropolitan Area are shown on Figure 4-4. The blue bars represent annual unit building permits and the horizontal black lines represent average annual household growth for 1990 to 2000 and 2000 to 2010. The red bars represent stabilized future residential demand. Stabilized annual demand is decreasing because the State Demographer is projecting slower future growth for the Metropolitan Area. Household growth in the Metropolitan Area has been declining since the 1970 to 1980 period when annual average household increase was 18,231. In the next decade (1980 to 1990), the average annual increase was 15,406. Between 1990 and 2000, the average annual household increase was 14,595 (shown by the black line in Figure 4-4) compared to annual average building permits of 15,141, a difference of 3.6 percent, which could be accounted for by vacancy and demolition of existing units. In the latest 10-year period (2000 to 2010), average annual household growth was 9,830 compared to average annual building permits of 12,279. The sharp decline in building permits beginning in 2007 is clearly evident. Building permits more than doubled in 2012 to 10,301, a positive sign. Future stabilized residential demand is represented by the red bars and is expected to grow slowly over the next five years. This graph demonstrates that over the long-term, residential demand is expected to moderate as household growth slows.
4-20

Figure 4-4
METROPOLITAN AREA BUILDING PERMITS; 1990 TO 2012 STABILIZED RESIDENTIAL DEMAND; 2013 TO 2035
Source: U.S. Census, State Demographer, and McComb Group, Ltd.
Ramsey Residential Demand
Future stabilized household growth projections for Ramsey and the Ramsey Station Draw Area take into consideration estimated future market share in the North Growth Corridor and Northstar Corridor Draw Area. Market share relationships established in the previous section are used to estimate future stabilized residential market demand. Future Metropolitan Area households for 2013 through 2035 are shown in the first column of Table 4-18. These estimates are based on households for the Metropolitan Area plus Sherburne County counted in the 2010 Census. Future household estimates are based on the State Demographer’s 2012 population estimates adjusted to reflect average household size contained in the State Demographer’s 2008 estimate of population and households. This results in a 2013 estimated 1,194,278 households in the Metropolitan Area plus Sherburne County. Future stabilized household growth is about 20 percent lower than past projections. Metropolitan Area plus Sherburne County households are estimated to increase to 1,226,189 in 2015, followed by an increase to 1,300,152 households in 2020. The rate of household growth slows after each five-year period. Over the past 20 years, the North Growth Corridor has captured an average of 15.4 percent of Metropolitan Area plus Sherburne County growth with a higher growth rate of 17.5 percent during the housing boom. In the future, it’s estimated that the North Growth Corridor will capture about 16.5 percent of the Metropolitan Area plus Sherburne County new households.
4-21

Assuming that the North Growth Corridor will capture 16.5 percent of the increased growth, similar to the past, the estimated household growth in 2013 would be about 2,581 households.
Table 4-18
SEVEN-COUNTY METROPOLITAN AREA PLUS SHERBURNE COUNTY, NORTH GROWTH CORRIDOR,
North Growth CorridorMarket Northstar CorridorShare Draw Area
Year Households Increase @ 16.5% Percent HHs Percent HHs Percent HHs
2013 1,194,278 15,643 2,581 91.0 % 2,349 23.0 % 540 65.0 % 351 2014 1,210,128 15,850 2,615 91.0 2,380 23.0 547 65.0 356 2015 1,226,189 16,061 2,650 91.0 2,412 23.0 555 65.0 361 2016 1,240,637 14,448 2,384 91.0 2,169 23.0 499 65.0 324 2017 1,255,255 14,618 2,412 91.0 2,195 23.0 505 65.0 328 2018 1,270,046 14,791 2,440 91.0 2,221 23.0 511 65.0 332 2019 1,285,011 14,965 2,469 92.0 2,272 23.0 522 65.0 340 2020 1,300,152 15,141 2,498 92.0 2,298 23.0 529 65.0 344 2021 1,313,020 12,868 2,123 92.0 1,953 24.0 469 65.0 305 2022 1,326,015 12,995 2,144 92.0 1,973 24.0 473 65.0 308 2023 1,339,138 13,124 2,165 92.0 1,992 24.0 478 65.0 311 2024 1,352,392 13,253 2,187 92.0 2,012 24.0 483 65.0 314 2025 1,365,777 13,385 2,208 92.0 2,032 24.0 488 65.0 317 2026 1,378,099 12,322 2,033 92.0 1,870 25.0 468 65.0 304 2027 1,390,532 12,433 2,051 92.0 1,887 25.0 472 65.0 307 2028 1,403,077 12,545 2,070 92.0 1,904 25.0 476 65.0 309 2029 1,415,736 12,659 2,089 92.0 1,922 25.0 480 65.0 312 2030 1,428,508 12,773 2,108 92.0 1,939 25.0 485 65.0 315 2031 1,440,141 11,632 1,919 92.0 1,766 25.0 441 65.0 287 2032 1,451,868 11,727 1,935 92.0 1,780 25.0 445 65.0 289 2033 1,463,690 11,823 1,951 92.0 1,795 25.0 449 65.0 292 2034 1,475,609 11,919 1,967 92.0 1,809 25.0 452 65.0 294 2035 1,487,625 12,016 1,983 92.0 1,824 25.0 456 65.0 296
Total 308,990 50,983 46,754 11,223 7,295
So urce : McCo mb Gro up, Ltd.
NORTHSTAR CORRIDOR DRAW AREA, RAMSEY STATION DRAW AREA, AND RAMSEY
Ramsey Station
HOUSEHOLD PROJECTIONS; 2013 TO 2035
RamseyHouseholdsplus Sherburne CountyMetropolitan Area Draw Area
The Northstar Corridor Draw Area segment of the North Growth Corridor has maintained a relatively stable share of North Growth Corridor households, averaging 90.9 percent over the past 20 years. In the next six years, 2013 to 2018, Northstar Corridor Draw Area market share is estimated at 91.0 percent, increasing to 92.0 percent in 2019 and beyond. Northstar cities market share of the Northstar Corridor Draw Area has been declining due to slowing development in the older communities of Anoka, Coon Rapids, and Fridley. Each of these cities is actively seeking to encourage new housing in their respective station areas, which will create the potential for increased market share. The Ramsey Station Draw Area market share of the Northstar Corridor Draw Area is estimated to increase from 23.0 percent of the Northstar Corridor Draw Area households in 2013 through 2020 to 24.0 percent in 2021 through 2025, and 25.0 percent for the following 10-year period. Ramsey’s stabilized market share of Ramsey Station Draw Area demand is estimated at 65 percent from 2013 to 2035. This is an estimated 351 households in 2013, increasing to 361 in 2015, and then fluctuating up and down throughout the 20 year period to 296 in 2035 as household growth slows in the Metropolitan Area. These household growth forecasts assume
4-22

4-23
historic household formation rates. Until household formation recovers, new households and new residential construction are likely to be less than forecast. Owner-occupied homes represented 91.5 percent of all Ramsey housing units in 2010, a decrease from 97.4 percent in 2000. During the housing boom 2000 to 2006, 2,031 building permits were issued: 756 (37.2 percent) for single family homes and 1,275 (62.8 percent) for multi-family units. The multi-family category included two apartment buildings with 170 units or 12.0 percent of the multi-family total. Townhomes, condos, and duplexes accounted for 88 percent of the units. At the present time, there is less interest in townhomes due to lower prices for single family homes. Fortunately, there has been a trend toward higher demand for rental housing as interest in homeownership has moderated. It is uncertain if this is a long-term trend. Ramsey has a 230-unit apartment building under construction at the present time. In the near term, stabilized demand for rental multi-family is likely to represent 20 to 25 percent of stabilized housing demand, mostly apartment buildings. Ownership housing, single family and townhome, is estimated at 75 to 80 percent of demand. The townhome component could be satisfied by a mix of traditional single family, detached townhomes, and townhomes when demand for that category recovers. These percentages can vary from year to year based on developer interest and assume that housing units are available, properly marketed, and competitively priced.
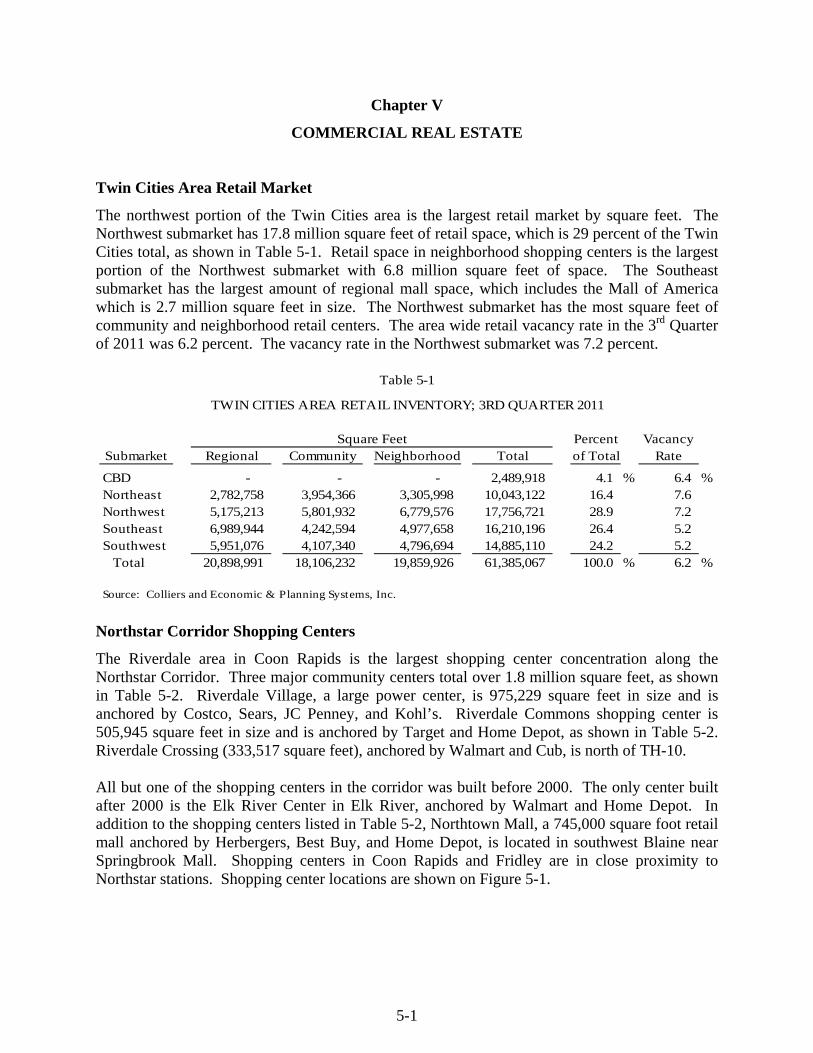
Chapter V
COMMERCIAL REAL ESTATE Twin Cities Area Retail Market
The northwest portion of the Twin Cities area is the largest retail market by square feet. The Northwest submarket has 17.8 million square feet of retail space, which is 29 percent of the Twin Cities total, as shown in Table 5-1. Retail space in neighborhood shopping centers is the largest portion of the Northwest submarket with 6.8 million square feet of space. The Southeast submarket has the largest amount of regional mall space, which includes the Mall of America which is 2.7 million square feet in size. The Northwest submarket has the most square feet of community and neighborhood retail centers. The area wide retail vacancy rate in the 3rd Quarter of 2011 was 6.2 percent. The vacancy rate in the Northwest submarket was 7.2 percent.
Table 5-1
TWIN CITIES AREA RETAIL INVENTORY; 3RD QUARTER 2011
Square Feet Percent VacancySubmarket Regional Community Neighborhood Total of Total Rate
CBD - - - 2,489,918 4.1 % 6.4 %Northeast 2,782,758 3,954,366 3,305,998 10,043,122 16.4 7.6 Northwest 5,175,213 5,801,932 6,779,576 17,756,721 28.9 7.2 Southeast 6,989,944 4,242,594 4,977,658 16,210,196 26.4 5.2 Southwest 5,951,076 4,107,340 4,796,694 14,885,110 24.2 5.2 Total 20,898,991 18,106,232 19,859,926 61,385,067 100.0 % 6.2 %
Source: Colliers and Economic & Planning Systems, Inc. Northstar Corridor Shopping Centers
The Riverdale area in Coon Rapids is the largest shopping center concentration along the Northstar Corridor. Three major community centers total over 1.8 million square feet, as shown in Table 5-2. Riverdale Village, a large power center, is 975,229 square feet in size and is anchored by Costco, Sears, JC Penney, and Kohl’s. Riverdale Commons shopping center is 505,945 square feet in size and is anchored by Target and Home Depot, as shown in Table 5-2. Riverdale Crossing (333,517 square feet), anchored by Walmart and Cub, is north of TH-10. All but one of the shopping centers in the corridor was built before 2000. The only center built after 2000 is the Elk River Center in Elk River, anchored by Walmart and Home Depot. In addition to the shopping centers listed in Table 5-2, Northtown Mall, a 745,000 square foot retail mall anchored by Herbergers, Best Buy, and Home Depot, is located in southwest Blaine near Springbrook Mall. Shopping centers in Coon Rapids and Fridley are in close proximity to Northstar stations. Shopping center locations are shown on Figure 5-1.
5-1

Table 5-2
NORTHSTAR CORRIDOR MAJOR SHOPPING CENTERS(Over 100,000 Square Feet)
Year SquareShopping Center Address Center Type Opened Stores Feet
AnokaRiverview Plaza 2830 Cutters Grove Ave Community 1990 109,499
Coon RapidsRiverdale Village 12921 Riverdale Dr Super Regional 1999 73 975,229 Riverdale Commons 3300 124th Ave NW Regional 1996 18 505,945 Springbrook Mall 77 85th Ave NW Community 1980 12 237,388 Village Ten Center 2090 NW Northdale Blvd Community 1971 15 211,472 Riverdale Crossing 129000 Riverdale Dr NW Community 1990 27 333,517 Northtown Village Shopping Center 40 NW Coon Rapids Blvd Community 1995 166,118 Coon Rapids Family Center Mall 2891 Coon Rapids Blvd NW Community 1966 16 133,792 Kmart Plaza 8943 University Ave NE Community 1971 3 118,095 Northdale Shopping Center 514 NW Northdale Blvd Community 1955 25 100,903 Coon Rapids I 3000 111th Ave NW Community 1980 100,490
Elk RiverElk River Center 18185 Zane St NW Community 2005 349,610 Elk Park Center 19112 NW Freeport St Community 1995 287,985 Elk River Mall 550 Freeport Ave Community 5 113,091
Fridley753 NE 53rd Ave 753 NE 53rd Ave Community 1969 177,428 Fridley Market 244 57th Ave NE Neighborhood 1967 168,054
Source: Claritas and Economic & P lanning Systems, Inc.
Figure 5-1
NORTHSTAR CORRIDOR MAJOR RETAIL CENTERS
Source: Economic and Planning Systems, Inc.
5-2

Ramsey Shopping Centers
There are three major shopping areas in Ramsey: The COR/Northstar Marketplace, River’s Bend/Ramsey Towne Square, and 167th Retail Node. The COR/Northstar Marketplace is a 96,175 square foot neighborhood center anchored by Coborn’s. Other tenants include Anytime Fitness, Subway, Verizon Wireless, Caribou Coffee, Fantastic Sam’s, and others. This center is located less than one-half mile from the Ramsey Station. The second Ramsey shopping area--River’s Bend/Ramsey Towne Square--is located four miles east of the Ramsey Station at Bunker Lake Boulevard and TH-47. This center has over 40 retail tenants including Wendy’s, SuperAmerica, Caribou Coffee, Subway, and Rum River Wine and Spirits. The third retail area in Ramsey is a retail node at 167th Avenue and TH-47, which is home to a liquor store, Domino’s, a day care center, and a church. Retail lease rates, as shown in Table 5-3, are reflective of Ramsey’s distance from major population centers. Retail lease rates range from $12.00 to $18.00 per square foot, below the Twin Cities area average of $18-19 per square foot.
Table 5-3
RAMSEY RETAIL RENTAL RATES(Per Square Foot)
Net SpaceRent Expenses Taxes Available
RetailNorthstar Marketplace 2.41$ 3.19$ Rum River Retail $12.00-14.00 2,550 Ramsey Commons $16.00-18.00 8,849
Source: Loopnet, Northmarq, and M cComb Group, Ltd. Ramsey Retail Development
Over the past 10 years, over 180,000 square feet of retail space was developed in Ramsey. Northstar Marketplace in The COR represented 53.4 percent of all retail space. The only other significant retail development was a 34,700 square foot Slumberland furniture store. Office Market
The office market in the Twin Cities area is showing signs of improvement. With unemployment dropping and some indication of positive employment growth, the demand for office space is increasing. Vacancy rates in the Twin Cities area are down from 17.6 percent in 2010 to 16.8 at the end of 2011. Rental rates have remained consistent since peaking in 2008 and dropping in 2009 to their current levels. The average asking full-service rent rate for Class A office space is $23.27 per square foot for central business district properties and $23.49 for suburban properties, as shown in Table 5-4. The Twin Cities area absorbed over 400,000 square feet of office space in 2011, which was up from 26,000 in 2010. Despite the positive trends, the only construction activity for office space in the past two years has been for build-to-suit office buildings; no multi-tenant office buildings have been built. Current trends indicate the possibility of some construction activity but likely only in the major established office locations.
5-3

Table 5-4
TWIN CITIES AREA OFFICE MARKET; 4TH QUARTER 2011
Total Vacant Vacancy Rent RateSubmarket Sq. Ft. Sq. Ft. Rate Class A Class B
CBDMinneapolis 28,299,243 4,074,715 16.0 % 23.33$ 18.06$ St. Paul Midway 10,059,518 1,840,810 20.7 23.02 17.84 CBD Total 38,358,761 5,915,525 17.2 % 23.27$ 17.96$
SuburbanNortheast 2,387,967 507,669 21.3 % 22.20$ 20.05$ Northwest 5,380,557 947,703 17.6 24.99 17.95 Southeast 4,406,797 782,744 17.8 19.33 18.97 Southwest 19,859,628 3,643,585 18.3 24.37 20.27 Suburban Total 32,034,949 5,881,701 18.4 % 23.49$ 19.68$
Total Twin Cities Area 70,393,710 11,797,226 16.8 % 23.39$ 18.79$
Source: Grubb & Ellis. The Northstar Corridor is in the Northwest office submarket, which makes up 16.8 percent of the suburban submarkets, and about 7.6 percent of the Twin Cities area office market. The Northwest submarket is the second largest suburban submarket in the Twin Cities area, but is a quarter the size of the Southwest submarket. The Northwest submarket has approximately 5.4 million square feet of multi-tenant office space. The vacancy rate in the Northwest submarket was 17.6 percent at the end of 2011, which is lower than the suburban average of 18.4 percent, but higher than the overall Twin Cities area average of 16.8 percent. The Twin Cities area average rental rate for Class A office space in the Northwest submarket was $24.99 per square foot, which is the highest of all the submarkets. Office rents are well below the Twin Cities area average of $19 per square foot, ranging from as low as $3.00 to $19.00 per square foot on current listings, as shown in Table 5-5. Due to the low rental rates, the market does not support speculative office development.
Table 5-5
RAMSEY OFFICE RENTAL RATES(Per Square Foot)
Net SpaceRent Expenses Taxes Available
7100 Sunwood Drive $4.25-$8.25 1.50$ 1.24$ Energy Business Park $3.90-$4.00 1.40$ 1.72$ 18,516 McKinley Building $4.00-$8.00 1.02$ 1.65$ 4,615 Ramsey Business Park $4.00 1.50$ 1.76$ 4,475 Thurston Business Center $3.00-$6.50 0.91$ 2.02$ 28,610 Ramsey Office Plaza $19.00 8,762 14391 Azurite $15.00 2,641 Riverview Office Suites $9.50 3,920
Source: Loopnet, Northmarq, and McComb Group, Ltd.
5-4

Ramsey Office Space
Ramsey’s office space increased by 179,000 square feet over the last 10 years. Two buildings--NAU Country Insurance and Ramsey Professional Center--totaled about 93,000 square feet, representing 52.0 percent of the total. In addition, three medical buildings totaling 64,000 square feet were constructed in The COR. Planned Development
Four new developments are planned for The COR. McDonalds (4,600 square feet) and SuperAmerica (4,300 square feet) have been approved for locations on Armstrong Boulevard. A proposed restaurant with liquor is also planned for an Armstrong Boulevard location. These three stores reinforce the Northstar Marketplace area as a growing retail area. Also under consideration is Northgate Church/Performing Arts Center with a 500-seat auditorium. Industrial Market
The Twin Cities area has 333.8 million square feet of industrial space. The Northstar Corridor is within the Northwest submarket, which is the largest industrial submarket in the Twin Cities area with 96.2 million square feet of space. The industrial space in the Northwest submarket is driven by the high concentration of manufacturing employment in the corridor, specifically in Anoka County. The area wide vacancy rate for industrial space was 6.6 percent in the 3rd Quarter of 2011, as shown in Table 5-6. The average rental rate for warehouse and distribution space was $5.16 per square foot, and $6.32 per square foot for research and development and flex space. The vacancy rate in the Northwest submarket was 6.9 percent, which was slightly higher than the Twin Cities area average. Rental rates in the Northwest submarket were slightly higher for warehouse and distribution space, but lower for research and development and flex space than the Twin Cities area average. The industrial space market in the Twin Cities area has remained consistent over the past few years with only small drops in absorption, consistent rental and vacancy rates, and little to no new construction. Only significant growth in manufacturing or distribution employment will drive up demand for industrial space in the near future.
Table 5-6
TWIN CITIES AREA INDUSTRIAL MARKET; 3RD QUARTER 2011
Total Vacant Vacancy Rent RateSubmarket Sq. Ft. Sq. Ft. Rate WH/Dist. R&D/Flex
Minneapolis 43,968,445 1,754,797 4.0 % 3.57$ 5.66$ Northeast 31,171,300 1,834,493 5.9 5.57 6.57 Northwest 96,166,932 6,650,020 6.9 5.48 6.02 Southeast 47,480,858 3,689,464 7.8 4.94 6.36 Southwest 73,088,539 5,993,878 8.2 5.16 6.57 St. Paul Midway 41,943,603 2,265,052 5.4 5.31 5.72 Total Twin Cities Arae 333,819,677 22,187,704 6.6 % 5.16$ 6.32$
Source: Grubb & Ellis.
5-5

5-6
Ramsey Industrial Development
Ramsey has a strong industrial market as evidence by construction of over 852,000 square feet of space almost equally divided between office/warehouse (450,000 square feet) and office/manufacturing (403,000 square feet). These buildings are located outside of The COR. In addition, these two categories are not recommended for The COR.

Chapter VI
RAMSEY STATION DRAW AREA DEMOGRAPHICS Draw areas for each of the Northstar station cities were delineated based on rider surveys conducted by the Metropolitan Council for each station community: Fridley, Coon Rapids, Anoka, Elk River, and Big Lake. The Ramsey Station Draw Area is based on a survey conducted in 2012 by Metro Transit. RAMSEY STATION DRAW AREA
The Ramsey Station Draw Area serves residents living in Ramsey, eastern Elk River, southern Nowthen, and the southwest portion of Oak Grove, as shown on Map 6-1. The Ramsey Station Draw Area extends west to the Mississippi River and TH-169 in Elk River, north to Norris Lake Road in Nowthen, east to the Rum River, and south to the Mississippi river. This draw area covers approximately 75 square miles.
Map 6-1
RAMSEY STATION DRAW AREA
Population and Households
Ramsey Station Draw Area population and household growth was higher than the population and household growth of the Northstar Corridor Draw Area and the Metropolitan Area between 2000 and 2011, as shown on Table 6-1. Ramsey Station Draw Area had a population of 28,288 in 2000 and increased to 38,973 by 2011, an annual growth rate of 2.96 percent. From 2011 through 2016, population growth in the Ramsey Station Draw Area is estimated to decrease to less 0.75 percent, which is similar to the 2016 estimates for both the Northstar Corridor Draw
6-1

Area and Metropolitan Area. Ramsey Station Draw Area 2016 population is estimated at 40,452. Ramsey Station Draw Area households increased from 9,271 in 2000 to 13,522 in 2011, an annual growth rate of 3.49. This household growth rate is estimated to drop significantly to 0.98 percent by 2016, when households are estimated to total 14,197.
Table 6-1
RAMSEY STATION AND NORTHSTAR CORRIDOR DRAW AREASAND SEVEN-COUNTY METROPOLITAN AREA
POPULATION AND HOUSEHOLD GROWTH TRENDS2000 CENSUS; 2011 AND 2016 ESTIMATED
Ramsey NorthstarStation Corridor Metropolitan
Year Draw Area Draw Area Area
Population2000 28,288 290,439 2,642,056 2011E 38,973 346,506 2,875,666 2016E 40,452 363,015 2,979,795
Annual Growth Rate2000-11 2.96 % 1.62 % 0.77 %2011-16 0.75 0.94 0.71
Households2000 9,271 102,464 1,021,454 2011E 13,522 125,352 1,128,357 2016E 14,197 131,616 1,170,688
Annual Growth Rate2000-11 3.49 % 1.85 % 0.91 %2011-16 0.98 0.98 0.74
E: Es timated.So urce : Scan/US and McCo mb Gro up, Ltd.
Northstar Corridor Draw Area annual population growth was 1.62 percent from 2000 to 2011, increasing population from 290,439 in 2000 to 346,506 in 2011. The Northstar Corridor Draw Area population is estimated to continue to increase at a rate of 0.94 percent through 2016, when population is estimated to reach 363,015. Northstar Corridor Draw Area household growth was 1.85 percent from 2000 to 2011, increasing households from 102,464 in 2000 to 125,352 in 2011. Northstar Corridor Draw Area households are estimated to increase at an annual rate of 0.98 percent through 2016, increasing households to 131,616 by 2016. Metropolitan Area population and households are increasing at slower rates than both the Ramsey Station Draw Area and the Northstar Corridor Draw Area. Population growth for the Metropolitan Area was 0.77 percent annually from 2000 to 2011 and is estimated at 0.71 percent annually through 2016. Metropolitan Area households have been increasing at an annual rate of 0.91 percent between 2000 and 2011. Estimates show this household growth rate decreasing to 0.74 percent annually through 2016. Household Income
Average household income for the Ramsey Station Draw Area, shown in Table 6-2, is estimated at $80,465 in 2011, 10.3 percent above the Northstar Corridor Draw Area average household income of $72,977 and 0.6 percent above the Metropolitan Area average household income of
6-2

6-3
$79,958. Average household income for Ramsey Station Draw Area is expected to increase to $89,787 by 2016, above that of the Northstar Corridor Draw Area ($81,330) and Metropolitan Area ($87,063).
Table 6-2
RAMSEY STATION AND NORTHSTAR CORRIDOR DRAW AREAS,AND SEVEN-COUNTY METROPOLITAN AREA
AVERAGE AND MEDIAN HOUSEHOLD INCOME: 2000 CENSUS; 2011 AND 2016 ESTIMATED
Ramsey Station Northstar Corridor MetropolitanDraw Area Draw Area Area
Average Household Income2000 77,246$ 67,047$ 68,484$ 2011E 80,465 72,977 79,958 2016E 89,787 81,330 87,063
Median Household Income2000 65,189$ 58,141$ 54,667$ 2011E 73,745 66,487 62,465 2016E 79,548 71,581 66,464
E: Estimated.Source: McComb Group, Ltd.
Household Density Distribution
Estimated future household density for 2016 for the Ramsey Station Draw Area is shown on Map 6-2. Household density is highest in the southeast corner of Ramsey and the eastern portion of Elk River.
Map 6-2
RAMSEY STATION DRAW AREA ESTIMATED 2016 HOUSEHOLD DENSITY

Household Income Distribution
The estimated distribution of households with incomes above $75,000 in 2016, shown on Map 6-3, demonstrates that more affluent households are located in Nowthen (northern portion of the draw area) and in Ramsey, near the golf course.
Map 6-3
RAMSEY STATION DRAW AREA ESTIMATED 2016 HOUSEHOLD INCOME: PERCENT ABOVE $75,000
The proportion of households in the Ramsey Station Draw Area, Northstar Corridor Draw Area, and Metropolitan Area with incomes above $75,000, $100,000, and $150,000 are shown in Table 6-3. In 2011, households with incomes above $75,000 were highest in the Ramsey Station Draw Area with 49.6 percent, followed by Northstar Corridor Draw Area with 41.6 percent, and Metropolitan Area with 40.7 percent. Households with incomes above $100,000 in 2011 were over 20.0 percent in all three areas with Ramsey Station Draw Area being the highest with 28.9 percent.
6-4

Table 6-3
RAMSEY STATION AND NORTHSTAR CORRIDOR DRAW AREASAND SEVEN-COUNTY METROPOLITAN AREA
HOUSEHOLD INCOME DISTRIBUTION: 2000 CENSUS; 2011 AND 2016 ESTIMATED
Draw Area
Number Percent Number Percent Number Percent
Households above $75,0002000 3,551 38.3 % 31,465 30.7 % 326,285 31.9 %2011E 6,702 49.6 52,170 41.6 459,718 40.7 2016E 7,877 55.5 61,727 46.9 517,863 44.2
Households above $100,0002000 1,561 16.9 % 13,580 13.3 % 178,170 17.4 %2011E 3,905 28.9 28,997 23.1 292,814 26.0 2016E 4,906 34.6 36,587 27.8 344,691 29.4
Households above $150,0002000 453 4.9 % 3,160 3.1 % 63,482 6.2 %2011E 965 7.1 7,811 6.2 118,549 10.5 2016E 1,262 8.9 10,114 7.7 142,421 12.2
E: Es timated.So urce : McCo mb Gro up, Ltd.
Ramsey Station Northstar Corridor MetropolitanDraw Area Area
Population Age
Ramsey Station Draw Area population is becoming older, as shown in Table 6-4. Population aged 25 to 34 is expected to decline from 5,190 in 2011 to 4,869 in 2016; while population age 35 to 44 is expected to decline from 6,029 in 2011 to 5,488 in 2016. Population aged 65 to 74 is expected to increase from 2,282 in 2011 to 3,013 in 2016, an increase of 731; while the age cohort 75 to 84 is expected to increase from 964 to 1,186, an increase of 222. The over 85 age cohort is also expected to increase modestly. These increases in the over 65 population indicates a future demand for senior housing and services.
Table 6-4
RAMSEY STATION DRAW AREAPOPULATION BY AGE; 2011 AND 2016
2011 Estimated 2016 EstimatedAge Cohort Number Percent Number Percent
< 19 11,761 30.2 % 11,839 29.3 %20 - 24 2,577 6.6 2,881 7.1 25 - 34 5,190 13.3 4,869 12.0 35 - 44 6,029 15.5 5,488 13.6 45 - 54 5,699 14.6 5,790 14.3 55 - 64 4,088 10.5 4,980 12.3 65 - 74 2,282 5.9 3,013 7.4 75 - 84 964 2.5 1,186 2.9 85 + 382 1.0 407 1.0
So urce : U.S . Cens us , Scan/US, Inc ., and McCo mb Gro up, Ltd.
6-5

6-6
Demographic Characteristics
Demographic characteristics for the Ramsey Station Draw Area, Northstar Corridor Draw Area, and Metropolitan Area are summarized in the demographic snapshots contained in Tables 6-5, 6-6, and 6-7 on the following pages. These snapshots contain census data for 2000, as well as estimates for 2011 and 2016. These estimates were provided by Scan/US, Inc., a source of Census comparable demographic information. Significant characteristics of Ramsey Station Draw Area include the following:
♦ Ramsey Station Draw Area estimated median age is 36 in 2016, which is lower than both the Northstar Corridor Draw Area and the Metropolitan Area with median ages in both areas at 37 in 2016.
♦ Ramsey Station Draw Area population is estimated to increase at 0.75 percent annually between 2011 and 2016, which is similar both the Northstar Corridor Draw Area and the Metropolitan Area annual population growth rates of 0.94 and 0.71 percent, respectively.
♦ In 2011, approximately 30.2 percent of the population in the Ramsey Station Draw Area was under the age of 19. By 2016, the Ramsey Station Draw Area is expected to have approximately 29.3 percent of the population under the age of 19, which is higher than both the Northstar Corridor Draw Area and Metropolitan Area percentages of 28.8 and 26.9 percent, respectively.
♦ In 2011, approximately 9.4 percent of the population in the Ramsey Station Draw Area was over the age of 65, which is expected to increase to about 11.3 percent by 2016. The Northstar Corridor Draw Area had 9.1 percent over age 65 in 2011 and an estimated 10.9 percent for 2016; while the Metropolitan Area had 10.7 percent of the population over the age of 65 in 2011, with expectations of an increase to 12.3 percent by 2016.
♦ By 2016, over 50 percent of the households within the Ramsey Station Draw Area will have incomes above $75,000.
♦ Over 90 percent of the population within the Ramsey Station Draw Area is Caucasian, which is expected to remain constant through 2016.
Additional demographic characteristics for the Ramsey Station Draw Area are contained in Appendix A. STATION AREA SALES POTENTIAL
Retail sales potential represented by Northstar riders at the Ramsey station is based on estimated purchasing power of the average 129 weekday rides. These riders represent about 1.0 percent of the 13,522 Ramsey Station Draw Area households in 2011. Draw area households are estimated to increase to 14,197 in 2016, an increase of 0.98 percent. Estimated retail and service sales potential of Northstar riders is a two-step process. Estimated sales potential of Northstar riders for each retail or service category is estimated by McComb Group proprietary sales potential model, which contains over 120 retail and service categories. Next, store size is determined based on sales productivity and typical store size for each category. This methodology is illustrated for 2016 in Table 6-8 using convenience goods stores as an example to illustrate the amount of retail and service space that can be supported by Northstar riders.

Table 6-5
DEMOGRAPHIC AND INCOME SNAPSHOT
Ramsey Station Draw Area 3/11/2013
SNAPSHOT 2000 Census 2011 Estimated 2016 ProjectedPopulation 28,288 38,973 40,452Households 9,271 13,522 14,197Families 7,689 10,626 11,053Per Capita Income $ 25,556 $ 28,021 $ 31,625Median Household Income $ 65,189 $ 73,745 $ 79,548Average Household Income $ 77,246 $ 80,465 $ 89,787Average Household Size 3.04 2.87 2.84Median Age 34 35 36
Annual Percent ChangeTRENDS 1990 - 2000 2000 - 2011 2011 - 2016Population 3.74 % 2.96 % 0.75 %Households 4.38 3.49 0.98Families 4.03 2.98 0.79Median Household Income 4.37 1.13 1.53Average Household Income 4.79 0.37 2.22
2000 Census 2011 Estimated 2016 ProjectedHOUSEHOLDS BY INCOME Number Percent Number Percent Number PercentLess than $15,000 480 5.2 % 410 3.0 % 406 2.9 %$15,000 - $24,999 381 4.1 579 4.3 570 4.0$25,000 - $34,999 597 6.4 825 6.1 746 5.3$35,000 - $49,999 1,274 13.8 1,664 12.3 1,497 10.5$50,000 - $74,999 2,980 32.2 3,337 24.7 3,097 21.8$75,000 - $99,999 1,990 21.5 2,797 20.7 2,972 20.9$100,000 - $149,999 1,109 12.0 2,940 21.7 3,644 25.7$150,000 + 453 4.9 965 7.1 1,262 8.9
POPULATION BY AGE Number Percent Number Percent Number Percent<19 9,777 34.6 % 11,761 30.2 % 11,839 29.3 %20-24 1,288 4.6 2,577 6.6 2,881 7.125-34 4,290 15.2 5,190 13.3 4,869 12.035-44 5,532 19.6 6,029 15.5 5,488 13.645-54 4,004 14.2 5,699 14.6 5,790 14.355-64 2,031 7.2 4,088 10.5 4,980 12.365-74 710 2.5 2,282 5.9 3,013 7.475-84 451 1.6 964 2.5 1,186 2.985+ 196 0.7 382 1.0 407 1.0
RACE AND ETHNICITY Number Percent Number Percent Number PercentWhite 27,453 97.0 % 36,055 92.5 % 37,397 92.4 %Black 98 0.3 910 2.3 972 2.4Native American 113 0.4 167 0.4 172 0.4Asian/Pacific Islander 236 0.8 867 2.2 896 2.2Other Races 389 1.4 973 2.5 1,016 2.5
Hispanic (Any Race) 308 1.1 983 2.5 1,366 3.4
Source: U.S. Census, Scan/US, Inc. and McComb Group, Ltd.
McCombGroup, Ltd.
6-7

Table 6-6
DEMOGRAPHIC AND INCOME SNAPSHOT
Northstar Corridor Draw Area 3/11/2013
SNAPSHOT 2000 Census 2011 Estimated 2016 ProjectedPopulation 290,439 346,506 363,015Households 102,464 125,352 131,616Families 77,618 92,167 96,124Per Capita Income $ 23,876 $ 26,538 $ 29,636Median Household Income $ 58,141 $ 66,487 $ 71,581Average Household Income $ 67,047 $ 72,977 $ 81,330Average Household Size 2.81 2.75 2.74Median Age 33 35 37
Annual Percent ChangeTRENDS 1990 - 2000 2000 - 2011 2011 - 2016Population 1.47 % 1.62 % 0.94 %Households 2.19 1.85 0.98Families 1.51 1.57 0.84Median Household Income 3.65 1.23 1.49Average Household Income 4.61 0.77 2.19
2000 Census 2011 Estimated 2016 ProjectedHOUSEHOLDS BY INCOME Number Percent Number Percent Number PercentLess than $15,000 6,162 6.0 % 7,355 5.9 % 7,439 5.7 %$15,000 - $24,999 7,150 7.0 8,091 6.5 7,930 6.0$25,000 - $34,999 9,965 9.7 9,960 7.9 9,441 7.2$35,000 - $49,999 17,537 17.1 16,738 13.4 15,569 11.8$50,000 - $74,999 30,146 29.4 31,016 24.7 29,493 22.4$75,000 - $99,999 17,885 17.5 23,173 18.5 25,140 19.1$100,000 - $149,999 10,420 10.2 21,186 16.9 26,473 20.1$150,000 + 3,160 3.1 7,811 6.2 10,114 7.7
POPULATION BY AGE Number Percent Number Percent Number Percent<19 94,967 32.7 % 102,340 29.5 % 104,620 28.8 %20-24 16,851 5.8 21,968 6.3 24,643 6.825-34 45,255 15.6 47,311 13.7 44,811 12.335-44 54,203 18.7 52,867 15.3 48,640 13.445-54 38,636 13.3 53,508 15.4 55,285 15.255-64 22,028 7.6 36,911 10.7 45,231 12.565-74 11,144 3.8 19,054 5.5 25,160 6.975-84 5,667 2.0 9,016 2.6 10,859 3.085+ 1,654 0.6 3,513 1.0 3,751 1.0
RACE AND ETHNICITY Number Percent Number Percent Number PercentWhite 275,452 94.8 % 311,714 90.0 % 326,795 90.0 %Black 3,576 1.2 11,536 3.3 12,022 3.3Native American 1,582 0.5 1,922 0.6 2,014 0.6Asian/Pacific Islander 3,898 1.3 9,301 2.7 9,610 2.6Other Races 5,931 2.0 12,033 3.5 12,574 3.5
Hispanic (Any Race) 4,327 1.5 11,743 3.4 16,340 4.5
Source: U.S. Census, Scan/US, Inc. and McComb Group, Ltd.
McCombGroup, Ltd.
6-8

Table 6-7
DEMOGRAPHIC AND INCOME SNAPSHOT
Seven-County Metropolitan Area 3/11/2013
SNAPSHOT 2000 Census 2011 Estimated 2016 ProjectedPopulation 2,642,056 2,875,666 2,979,795Households 1,021,454 1,128,357 1,170,688Families 658,159 711,347 730,364Per Capita Income $ 27,227 $ 31,731 $ 34,596Median Household Income $ 54,667 $ 62,465 $ 66,464Average Household Income $ 68,484 $ 79,958 $ 87,063Average Household Size 2.53 2.50 2.50Median Age 34 36 37
Annual Percent ChangeTRENDS 1990 - 2000 2000 - 2011 2011 - 2016Population 1.45 % 0.77 % 0.71 %Households 1.56 0.91 0.74Families 1.21 0.71 0.53Median Household Income 3.69 1.22 1.25Average Household Income 4.46 1.42 1.72
2000 Census 2011 Estimated 2016 ProjectedHOUSEHOLDS BY INCOME Number Percent Number Percent Number PercentLess than $15,000 94,987 9.3 % 100,226 8.9 % 104,550 8.9 %$15,000 - $24,999 94,307 9.2 88,724 7.9 86,306 7.4$25,000 - $34,999 112,850 11.0 100,920 8.9 94,851 8.1$35,000 - $49,999 159,411 15.6 152,005 13.5 147,462 12.6$50,000 - $74,999 233,614 22.9 226,764 20.1 219,656 18.8$75,000 - $99,999 148,115 14.5 166,904 14.8 173,172 14.8$100,000 - $149,999 114,688 11.2 174,265 15.4 202,270 17.3$150,000 + 63,482 6.2 118,549 10.5 142,421 12.2
POPULATION BY AGE Number Percent Number Percent Number Percent<19 768,028 29.1 % 783,409 27.2 % 801,940 26.9 %20-24 173,732 6.6 189,862 6.6 192,262 6.525-34 411,155 15.6 417,260 14.5 396,052 13.335-44 469,324 17.8 416,462 14.5 407,567 13.745-54 363,592 13.8 440,983 15.3 433,762 14.655-64 200,980 7.6 317,979 11.1 381,648 12.865-74 130,615 4.9 164,660 5.7 216,477 7.375-84 90,292 3.4 97,689 3.4 101,987 3.485+ 34,338 1.3 47,362 1.6 48,100 1.6
RACE AND ETHNICITY Number Percent Number Percent Number PercentWhite 2,238,117 84.7 % 2,267,068 78.8 % 2,349,676 78.9 %Black 156,620 5.9 240,876 8.4 249,475 8.4Native American 20,417 0.8 21,073 0.7 21,737 0.7Asian/Pacific Islander 122,239 4.6 186,359 6.5 193,059 6.5Other Races 104,663 4.0 160,290 5.6 165,848 5.6
Hispanic (Any Race) 95,902 3.6 179,857 6.3 228,964 7.7
Source: U.S. Census, Scan/US, Inc. and McComb Group, Ltd.
McCombGroup, Ltd.
6-9

Using supermarkets as an example, Ramsey Station rider sales potential in 2016 is estimated at $456,000, as shown in Table 6-8. Supportable gross leasable area (GLA) for a supermarket is estimated by dividing sales potential by $460 per square foot, sales productivity appropriate for a supermarket. This results in supportable GLA of 991 square feet of supermarket space, which is considerably smaller than the range of supermarket store size. Store GLA in other retail categories supportable by Northstar riders is also shown in Table 6-8. Supportable space for drug stores and liquor stores is 441 and 213 square feet of GLA, respectively. These estimates of sales potential represent rider spending potential for each category. Spending potential for an individual store will be less as consumers usually patronize several stores in each category.
Table 6-8
RAMSEY NORTHSTAR STATION RIDERRETAIL SALES POTENTIAL AND SUPPORTABLE SPACE BY MERCHANDISE CATEGORY; 2016
Sales Sales/ Supportable Store SizeCategory Potential Sq. Ft. Sq. Ft. Low Median High
Convenience GoodsSupermarkets 456,000$ 460$ 991 31,245 52,419 69,462 Convenience Food 9,000 300 30 1,349 2,085 5,323 Drug & Proprietary Stores 203,000 460 441 8,280 11,700 23,714 Hardware 31,000 185 168 5,638 13,831 27,743 Liquor 80,000 375 213 1,305 2,856 7,210 Florist 12,000 190 63 766 1,600 5,396
Source: McComb Group, Ltd. Ramsey’s retail businesses are consistent with those of a neighborhood shopping area that offers convenience goods, food services, and services that are typically purchased close to home. Consumers typically drive further distances to patronize shopping goods and destination type retailers. Retail stores consistent with a neighborhood shopping area and supportable GLA in the Ramsey Station area are contained in Table 6-9. Northstar riders do not represent sales potential sufficient to support the types of stores consistent with a neighborhood shopping area in Ramsey. The list of businesses is not all inclusive of store types, but the supportable GLA result would be similar. Northstar riders represent additional retail potential for business establishments that serve the larger Ramsey community. Ramsey Station’s location adjacent to a growing commercial area will be a benefit to business establishments located in the area. child daycare is a potential use that is consistent with the station area for commuters with children, as well as other parents living and/or working in Ramsey. This analysis points out that Northstar riders do not have sufficient spending potential to support stores or services in the station area. They do, however, have spending potential that can be important additional sales to existing and future Ramsey businesses. Many of these riders may already shop in Ramsey; however, others may not. The Northstar brings these riders to Ramsey on a regular basis and increases the convenience of shopping in Ramsey on a regular basis. Complete tables showing supportable square footage by retail and service category for each target year are contained in Appendix B.
6-10

Table 6-9
RAMSEY NORTHSTAR RIDERSUPPORTABLE SPACE BY MERCHANDISE CATEGORY; 2016 AND 2020
(Gro s s Leas able Area)
Store SizeMerchandise Category 2016 2020 Low Median High
Convenience GoodsSupermarkets 991 1,065 31,245 52,419 69,462 Convenience Food 30 33 1,349 2,085 5,323 Drug & Proprietary Stores 441 474 8,280 11,700 23,714 Hardware 168 178 5,638 13,831 27,743 Liquor 213 229 1,305 2,856 7,210 Florist 63 68 766 1,600 5,396 Food/Health Supplement Stores 20 20 1,200 1,234 1,968
Food ServiceFull-Service Restaurants 617 664 2,000 4,500 9,775 Limited Service Restaurants 423 455 1,335 3,000 3,400 Snack & Beverage Places 127 133 850 1,500 2,495
Ice Cream & Soft Serve 15 15 902 1,148 1,570 Doughnut Shops 32 32 744 1,200 2,153 Coffee Shops 40 43 881 1,500 2,000
ServicesBeauty Salons 258 284 455 788 1,422 Laundries & Dry Cleaners 73 80 1,222 2,024 3,734 Child Day Care Services 470 520 3,059 5,050 7,495
Health CareOffices of Physicians 1,188 1,303 969 1,652 4,008 Offices of Dentists 548 603 1,090 1,700 3,970 Offices of Chiropractors 78 87 1,090 1,600 3,970
So urce : McCo mb Gro up, Ltd. The last column in Table 6-9 contains low, median, and high store size for each store type from Dollars & Cents of Shopping Centers, published by the Urban Land Institute. Median store size indicates a typical size for a store in each retail category. To the extent that supportable square footage is above the low store size, sales potential exists to support that store type. Many retailers will desire stores that are closer to the median store size. Retail GLA supported by estimated sales potential for each retail store category is based on estimated sales per square foot (in 2012 dollars) by store type. Sales per square foot estimates are derived from median store sales per square foot for each tenant type contained in Dollar & Cents of Shopping Centers. Supportable GLA is calculated by dividing sales potential by sales per square foot. This analysis was used to provide an estimate of the supportable square footage in each retail category. The detailed tables resulting from these calculations are contained in Appendix B.
6-11

Chapter VII
RAMSEY STATION AREA DEVELOPMENT POTENTIAL
Northstar station area potential for residential, retail, and commercial development is dependent on many factors including location, convenience, and the geographic area served by the station. The amount and type of retail and commercial development that can be supported at each station area will depend on its ability to capitalize on the economic vitality of the geographic area served by the station. An important consideration in retail or commercial development is the station area’s convenience for potential customers that are not Northstar riders. RAMSEY STATION
Ramsey Station opened November 14, 2012, in The COR development between the intersections of Armstrong Boulevard and Ramsey Boulevard with TH-10, as shown on Map 7-1. Ramsey Station benefits from being located in a planned community that could incorporate the station in a TOD environment. As a result, the City of Ramsey has been successful at attracting higher density mixed-use and transit supportive development in The COR at Ramsey development, which was planned to incorporate the Ramsey Station. This was accomplished, in part, by establishing a development plan and consolidating property ownership in order to control the form and sequencing of development. Ramsey has set the stage for expanded TOD in The COR.
Map 7-1
RAMSEY STATION LOCATION
The station is adjacent to an 800-stall municipal parking ramp with 350 dedicated commuter parking spaces. This structure is flanked by City Hall on the east and The Residence at the COR, a 230-unit apartment. Retail stores will be developed between the parking ramp and Sunwood
7-1

Drive. Municipal Plaza is just across Sunwood Drive from the retail spaces. The Ramsey Station enjoys a central location in The COR at Ramsey. Unlike other Northstar stations, Ramsey Station is visible from a major highway. Commuter Service
The Ramsey Station attracts riders from the area served by TH-10. The station has 350 dedicated parking spaces. Prior to service by the Northstar train, the station was served by the Regional Express Bus Route 856, which offered direct service to downtown Minneapolis. The service operated only on weekdays with four southbound morning trips to Minneapolis and four northbound trips to Ramsey during the afternoon commute. Bus ridership averaged about 110 daily weekday trips. Since Northstar service began there have been approximately 129 inbound and outbound riders per day, as shown in Table 7-1. Inbound and outbound weekend service attracted about 19 inbound and 17 outbound riders per day.
Table 7-1
NORTHSTAR COMMUTER RAIL RIDERSHIP BY STATION; 2012
Weekday WeekendStation Inbound Outbound Inbound Outbound
Big Lake 360 290 200 200 Elk River 370 340 130 125 Ramsey 129 129 19 17 Anoka 250 250 90 85 Coon Rapids 250 230 120 115 Fridley 100 90 80 75
Source: NCDA and M etro Transit. Ramsey Station is served by five daily inbound trains during the morning commute period, and one inbound evening train, as shown in Figure 7-1. There is one morning outbound train to Ramsey, and five evening outbound trains for a total of 12 trains per day. Inbound scheduled travel times are 34 minutes. Outbound travel times are 30 minutes, except the train that does not stop in Fridley, which takes 28 minutes.
Figure 7-1
NORTHSTAR SCHEDULE – RAMSEY STATION
7-2
Inbound Outbound

Traffic Counts
Traffic counts on the primary streets are one of the important site criteria for retail and commercial development. TH-10 had 2010 average daily traffic counts of 40,000 east of Ramsey Boulevard, 37,500 between Ramsey and Armstrong Boulevards, and 34,000 to the west indicating that a high volume of trips enter The COR at Ramsey area. Traffic counts on Ramsey Boulevard north of TH-10 were 7,000 trips compared to 6,400 trips on Armstrong Boulevard north of TH-10. Sunwood Drive carried 2,400 trips west of Ramsey Boulevard, a relatively low traffic count for commercial developments.
Table 7-2
RAMSEY STATION AREAAVERAGE DAILY TRAFFIC COUNTS; 2010
TrafficLocation Count
TH-10East of Ramsey Blvd 40,000 Between Ramsey and Armstrong Blvds 37,500 West of Armstrong Blvd 34,000
Ramsey BoulevardNorth of TH-10 7,000
Armstrong BoulevardNorth of TH-10 6,400
Sunwood DriveWest of Ramsey Blvd 2,400
Source: Mn/DOT . Surrounding Land Use and Development
Land use around the Ramsey Station is influenced by the TH-10/rail line corridor, as shown in Figure 7-2. Land use south of the rail line is generally highway oriented commercial development including RV and boat dealerships, a gardening/nursery business, home furnishings stores, and automotive services. Mississippi West Regional Park is south of TH-10 on Traprock Street, and will be connected to the station and COR project with a pedestrian and bicycle overpass. West of Ramsey Boulevard between TH-10 and the rail line, there are several highway oriented businesses including fast food, pet care, and RV and trailer service. North of the rail line and east of Armstrong Boulevard is occupied by a business park with several light industrial, warehouse, and one to two story office buildings. Land use transitions to low density residential north of 149th Avenue NW, which is the approximate boundary of The COR development. Land west of Armstrong Boulevard is mostly vacant and available for future development.
7-3

7-4
Figure 7-2
RAMSEY STATION EXISTING CONDITIONS
THE COR AT RAMSEY
The COR at Ramsey was planned as a TOD mixed-use development prior to the funding and opening of Ramsey Station. The COR at Ramsey is a 410-acre development implemented by the City of Ramsey as master developer. The City bought 150 acres of land in the project area after the original developer went into bankruptcy. Developments to date are summarized in Table 7-3 and include 189,000 square feet of commercial, 64,000 square feet of medical, 72,000 square feet of school space, and 370 housing units.

Table 7-3
THE COR AT RAMSEY DEVELOPMENT
Use Units
Retail 96,000 square feetOffice 93,000 square feetMedical 64,000 square feetSchool 72,000 square feetCity Hall 68,000 square feetResidential 370 unitsParking Ramp 900 spaces
Source: City of Ramsey. The COR has been successful in attracting development as illustrated by the key projects completed to date, which are summarized below. Civic Amenities
• Ramsey Municipal Center – A 68,000 square foot City administration building and police headquarters.
• The Draw Park and Amphitheatre – A four-acre park and outdoor amphitheater with 350 seats for summer concert series, outdoor movie nights, and other year-round programming.
• Parking Ramp – An 800-stall public parking ramp that provides 350 spaces for the commuter
rail station. It was expanded by an additional 300 spaces for The Residence at the COR apartments.
7-5

Commercial Projects
• Northstar Marketplace – A 98,000 square foot shopping center anchored by Coborn’s supermarket. Other tenants include Caribou Coffee, Acapulco Mexican Restaurant, Subway, Verizon, and Anytime Fitness.
• Ramsey Office Plaza – A 52,000 square foot
three-story office building with ground level retail space including a full service restaurant, The Falls. Also includes a 12,000 square foot outdoor banquet facility, The Fountains of Ramsey, and a coffee shop/café. Office tenants include two law firms and a title company.
• NAU Country Insurance – A 41,548 square foot build-to-suit building for an agricultural insurance company. An expansion is planned for a second building.
Medical
• VA Outpatient Clinic – A 20,000 square foot outpatient clinic located adjacent to Ramsey Station. The clinic provides primary care, mental health, and services such as physical therapy.
• Allina Clinic – A 25,682 square foot medical clinic with diabetes, pre-natal, and physical therapy services.
7-6

• Midwest Medical Examiners – An 18,353 square foot office building with world class medical diagnostic and scanning services. Also provides coroner services for law enforcement.
Education
• PACT Charter School – A K-12 charter school with 600 students.
Residential Projects
• The Residence at the COR – A 230-unit market rate apartment project that is planned to open in spring of 2013. It is being developed by Flaherty and Collins of Indianapolis, Indiana. The City has pledged TIF revenue as well as some additional equity for gap financing. This project will be connected to the parking ramp at the station platform and be an important placemaking project, catalyst, and anchor for the station area.
• Seasons of Ramsey – A 50-unit rental townhome development is planned north of the Ramsey
Station at 147th Lane and Rhinestone Street. Completion planned for 2013.
• Other Residential – Over 350 units of townhomes and small lot single family homes have been constructed by K Hovananian Homes and DR Horton.
DEVELOPMENT SUMMARY
Commercial development (retail, office, and medical) in The COR totaled 320,000 square feet over the last 10 years, as shown in Table 7-4. This represented 75 percent of Ramsey’s total development in these categories. The COR captured 53 percent of the retail, 89 percent of the office, and 100 percent of the medical office. Office/warehouse and office/manufacturing space in other parts of Ramsey totaled 852,779 square feet. All told, Ramsey developed over 1.2 million square feet of space along with over 580 residential units.
7-7

Table 7-4
RAMSEY DEVELOPMENT BY TYPE; 2002 TO 2011(Square Feet)
Medical Office/ Office/Year Retail Office Office Warehouse Manufacturing
2002 10,086 - - 63,336 - 2003 - - - 28,000 56,314 2004 1,960 71,470 - 202,480 60,828 2005 138,768 36,528 - 130,655 89,366 2006 - 51,829 - - 30,000 2007 12,580 - - - 120,000 2008 7,600 19,000 18,353 25,600 26,200 2009 7,800 - - - - 2010 1,500 - 25,682 - 20,000 2011 - - 20,000 - - Total 180,294 178,827 64,035 450,071 402,708
In The COR 96,175 159,827 64,035 Percent 53.3 % 89.4 % 100.0 %
Source: City o f Ramsey and M cComb Group, Ltd. Planned Developments
Several planned developments include: McDonalds, SuperAmerica, and Northgate Performing Arts Center. LAND USE PLANS AND POLICIES
The area around Ramsey Station was designated as a mixed use district in the City’s 2030 Comprehensive Plan. It seeks to develop a town center or downtown for Ramsey, which The COR will provide. The mixed-use district promotes:
• Higher residential densities than are common in Ramsey, where residents can take advantage of transit opportunities;
• Civic places where people can gather and events can be held; • Commercial/retail to meet the needs of the community, with residential units above; • Professional offices and other places of employment.
The COR is specifically identified in several sections of the 2030 Comprehensive Plan as a vital component to Ramsey’s future housing needs. The town center area will provide a diverse housing stock meant to attract residents of all ages and incomes by offering amenities, access to transportation, and recreation and entertainment opportunities. The Comprehensive Plan specifically highlights the importance of senior and affordable housing to the town center district. It also notes the potential for the district to attract and retain young residents through its amenities and access to transportation. INFRASTRUCTURE PLANS AND NEEDS
The COR project has all necessary wet and dry utilities in place, and most major roadways. A key improvement is the planned Armstrong Boulevard interchange with TH-10. This is judged
7-8

to be needed in order to attract a major retail anchor that would assist in completing the retail portion of the project in the northwestern quarter of the project. Bunker Lake Boulevard reconstruction and expansion is planned. A pedestrian bridge across the Northstar tracks and TH-10 to the Mississippi West Regional Park is also planned. DEVELOPMENT OPPORTUNITIES
There are approximately 186 developable acres remaining for commercial, business park, and residential, plus 45 acres of parks and amenities, as shown in Figure 7-3. Retail, business park, and commercial total 115 acres; while residential totals 43 acres and mixed-use is 28 acres and could include commercial and residential. The residential component of The COR is planned at 2,200 units. The COR at Ramsey is a significant development opportunity. The City established a 25-year, $65 million tax increment financing (TIF) district for the project area to fund infrastructure and public amenities, and to provide targeted private development incentives.
Table 7-5
THE COR DEVELOPABLE ACRES
Use Total
Retail 70Mixed-Use 28Business Park 15Residential 16Other Commercial 30Other Residential 27 Total 186
Source: City of Ramsey. The Northstar station location in Ramsey is unique among the Northstar Corridor cities. It’s located on the edge of the planned downtown area served by a large parking structure, which is flanked by City Hall on the east and an apartment building to the west. To the north is Municipal Plaza, which is surrounded by office, residential, or mixed-use development. This creates the opportunity for both daytime and resident population, which can support ground level retail and commercial commensurate with market demand. Business park uses located to the east will offer employment opportunities to Ramsey residents. Planning for the area northwest of the station area is primarily retail. Building configurations in the retail area are illustrative of a power center, which requires a high volume of customer traffic to support its stores. The retail area should be accessible to pedestrians, but most of the customers, even those living in The COR, are likely to drive to the retail area for shopping to facilitate transporting their purchases home.
7-9

Figure 7-3
THE COR AT RAMSEY DEVELOPMENT PLAN
Source: City of Ramsey. Residential Development
The COR at Ramsey Development Plan provides for a wide variety of housing including single family homes on small lots, townhouses/rowhouses, apartments and/or condominiums, and mixed-use residential buildings. This provides Ramsey with the opportunity to develop housing that appeals to a wide range of markets ranging from singles, young marrieds, move up housing, as well as a variety of senior living options. This ability to tap the full range of housing submarkets will stimulate additional residential development. The COR Development Plan envisions 2,200 housing units in The COR. Previous construction has added 350 housing units and an additional 230 are currently under construction indicating future capacity for over 1,600 units. Analysis contained in Chapter IV indicates that Ramsey has the potential to add about 7,300 new housing units by 2035. In the near future, Ramsey residential demand is estimated at about 350 units per year. Not all of these units will be located in The COR. Development in other parts of Ramsey is likely to be predominately single family. The COR Development Plan is heavily oriented toward multi-family units, which may inhibit absorption in periods when single family housing demand is high. Stabilized housing demand in The COR is estimated at 70 to 75 percent of Ramsey demand or 245 to 260 units per year. Multi-family units (townhomes, duplexes, and apartments) are estimated to range from 85 to 90 percent annually. This indicates multi-family demand of 210 to 230 units. During the period 2002 through 2007 when housing production was the highest, multi-family units in Ramsey totaled 1,971, of which 170 or 8.6 percent were apartment buildings indicating that about 90 percent of the multi-family units were townhomes. While
7-10

7-11
townhomes have been less popular in recent years, increasing single family home prices are expected to increase townhome popularity in the future. The City of Ramsey should strive to achieve apartment/condominium development at 50 percent of the multi-tenant units in The COR to encourage density near the station. The City of Ramsey has the opportunity to accommodate a wide variety of housing project types consistent with market preferences, particularly in areas in The COR within reasonable walking distance of the station. The COR offers a unique residential setting and lifestyle within the Northstar Corridor. Retail Development
The COR at Ramsey offers two different types of retail development opportunities. As indicated earlier, the development northwest of the central core is illustrative of a power center anchored by a discount or supercenter type of store. This is a distinct possibility for The COR; however, development is likely to be delayed until the Armstrong Boulevard interchange with TH-10 is constructed. In the meantime, this retail area is likely to continue to fill in with smaller retail stores, restaurants, and services consistent with a neighborhood shopping area anchored by a supermarket. The current proposals for McDonalds and SuperAmerica are consistent with this trend. The area around Municipal Plaza will be suitable for a wide range of retail, food service, and personal and business services that can be supported by residential or office development in that area and the larger retail trade area. Northstar riders will constitute a portion of the customers for these retail and service establishments. The COR Development Plan contains a building footprint that appears to be a multi-plex movie theater or community center. Ramsey’s location could be a logical location for a movie theater given the distance from existing cinemas. Dining and entertainment is a synergistic use with a movie theater and would provide the opportunity for a destination dining and entertainment development adjacent to the downtown area with a plaza in front of the movie theater with a cluster of food service establishments. Office Development
The Northwest Twin Cities office submarket, which includes the Northstar Corridor, has about 1.5 million square feet of multi-tenant office space, according to Cassidy Turley, an amount that has remained unchanged since 2005. During this period, the vacancy rate has increased from 26.4 percent to 30.3 percent in 2011. Anoka County has about 600,000 square feet of multi-tenant office space during the same period of time. During this period, the vacancy rate was 15.7 percent in 2005, fluctuated between 13.0 and 18.7 percent, and fell to 15.4 percent in 2011. During this period, net office absorption was 35,700 square feet or about 6,000 square feet annually. The multi-tenant office market is relatively weak at the present time. The COR at Ramsey appears to have one multi-tenant office building (Ramsey Office Plaza) and one single tenant building (NAU Country Insurance). Three medical developments total over 64,000 square feet, indicating that Ramsey has absorbed about 157,500 square feet or almost 20,000 square feet over the past eight years. Ramsey’s experience indicates it should focus on single tenant build-to-suit office users. Given its available land and location, Ramsey is an excellent location for additional office users seeking a unique location in the northwest suburban area.
Appendices
RAMSEY STATION
TOD ANALYSIS

APPENDIX A
DEMOGRAPHIC CHARACTERISTICS
Table A-1 Ramsey Station and Northstar Corridor Draw Areas and Seven-County Metropolitan Area; Population and Households: 2000 Census; 2011 and 2016 Estimated
Table A-2 Ramsey Station and Northstar Corridor Draw Areas and Seven-County
Metropolitan Area; Average and Median Household Incomes: 2000 Census; 2011 and 2016 Estimated
Table A-3 Ramsey Station and Northstar Corridor Draw Areas and Seven-County
Metropolitan Area; Household Income: 2000 Census; 2011 and 2016 Estimated Table A-4 Ramsey Station and Northstar Corridor Draw Areas and Seven-County
Metropolitan Area; Households, Families and Household Size: 2000 Census; 2011 and 2016 Estimated
Table A-5 Ramsey Station and Northstar Corridor Draw Areas and Seven-County
Metropolitan Area; Educational Attainment: 2000 Census; 2011 and 2016 Estimated
Table A-6 Ramsey Station and Northstar Corridor Draw Areas and Seven-County
Metropolitan Area; Gender and Marital Status: 2000 Census; 2011 and 2016 Estimated
Table A-7 Ramsey Station and Northstar Corridor Draw Areas and Seven-County
Metropolitan Area; Age Distribution: 2000 Census; 2011 and 2016 Estimated Table A-8 Ramsey Station and Northstar Corridor Draw Areas and Seven-County
Metropolitan Area; Ethnicity: 2000 Census; 2011 and 2016 Estimated

Table A-1
RAMSEY STATION AND NORTHSTAR CORRIDOR DRAW AREAS,AND SEVEN-COUNTY METROPOLITAN AREA
POPULATION AND HOUSEHOLDS: 2000 CENSUS; 2011 AND 2016 ESTIMATED
Population HouseholdsRate of Rate of
Tr e rea ead A / Y ar Number Change Number Change
RAMSEY STATION DRAW AREA2000 28,288 NA 9,271 NA2011 E 38,973 2.96 % 13,522 3.49 %2016 E 40,452 0.75 14,197 0.98
NORTHSTAR CORRIDOR DRAW AREA2000 290,439 NA 102,464 NA2011 E 346,506 1.62 % 125,352 1.85 %2016 E 363,015 0.94 131,616 0.98
SEVEN-COUNTY METRO AREA2000 2,642,056 NA 1,021,454 NA2011 E 2,875,666 0.77 % 1,128,357 0.91 %2016 E 2,979,795 0.71 1,170,688 0.74
N/A: Not Available.E: Estimated.
Source: U.S. Census, Scan/US and McComb Group, Ltd.

Table A-2
RAMSEY STATION AND NORTHSTAR CORRIDOR DRAW AREAS,AND SEVEN-COUNTY METROPOLITAN AREA
AVERAGE AND MEDIAN HOUSEHOLD INCOMES2000 CENSUS; 2011 AND 2016 ESTIMATED
Ramsey Northstar Seven-Station Corridor County
Income ype ar T / Ye Draw Area Draw Area Metro Area
Average Household Income2000 77,246$ 67,047$ 68,484$ 2011 E 80,465 72,977 79,958 2016 E 89,787 81,330 87,063
Median Household Income2000 65,189$ 58,141$ 54,667$ 2011 E 73,745 66,487 62,465 2016 E 79,548 71,581 66,464
E: Estimated.
Source: U.S. Census, Scan/US and McComb Group, Ltd.

Table A-3
RAMSEY STATION AND NORTHSTAR CORRIDOR DRAW AREAS,AND SEVEN-COUNTY METROPOLITAN AREA
HOUSEHOLD INCOME: 2000 CENSUS; 2011 AND 2016 ESTIMATED
2000 2011 E 2016 ENumber Percent Number Percent Number Percent
RAMSEY STATION DRAW AREAHouseholds 9,271 N/A 13,522 N/A 14,197 N/AAverage Size 3.04 N/A 2.87 N/A 2.84 N/A
Household Income Median 65,189$ N/A 73,745$ N/A 79,548$ N/A
Average 77,246$ N/A 80,465$ N/A 89,787$ N/AHouseholds Above $50,000 6,531 70.5 % 10,039 74.3 % 10,974 77.3 %Households Above $75,000 3,551 38.3 6,702 49.6 7,877 55.5
Income DistributionLess than $15,000 480 5.2 % 410 3.0 % 406 2.9 %$15,000 - $24,999 381 4.1 579 4.3 570 4.0 $25,000 - $34,999 597 6.4 825 6.1 746 5.3 $35,000 - $49,999 1,274 13.8 1,664 12.3 1,497 10.5 $50,000 - $74,999 2,980 32.2 3,337 24.7 3,097 21.8 $75,000 - $99,999 1,990 21.5 2,797 20.7 2,972 20.9 $100,000 - $149,999 1,109 12.0 2,940 21.7 3,644 25.7 $150,000 + 453 4.9 965 7.1 1,262 8.9
NORTHSTAR CORRIDOR DRAW AREAHouseholds 102,464 N/A 125,352 N/A 131,616 N/AAverage Size 2.81 N/A 2.75 N/A 2.74 N/A
Household Income Median 58,141$ N/A 66,487$ N/A 71,581$ N/A
Average 67,047$ N/A 72,977$ N/A 81,330$ N/AHouseholds Above $50,000 61,611 60.2 % 83,186 66.4 % 91,220 69.3 %Households Above $75,000 31,465 30.7 52,170 41.6 61,727 46.9
Income DistributionLess than $15,000 6,162 6.0 % 7,355 5.9 % 7,439 5.7 %$15,000 - $24,999 7,150 7.0 8,091 6.5 7,930 6.0 $25,000 - $34,999 9,965 9.7 9,960 7.9 9,441 7.2 $35,000 - $49,999 17,537 17.1 16,738 13.4 15,569 11.8 $50,000 - $74,999 30,146 29.4 31,016 24.7 29,493 22.4 $75,000 - $99,999 17,885 17.5 23,173 18.5 25,140 19.1 $100,000 - $149,999 10,420 10.2 21,186 16.9 26,473 20.1 $150,000 + 3,160 3.1 7,811 6.2 10,114 7.7
SEVEN-COUNTY METRO AREAHouseholds 1,021,454 N/A 1,128,357 N/A 1,170,688 N/AAverage Size 2.53 N/A 2.50 N/A 2.50 N/A
Household Income Median 54,667$ N/A 62,465$ N/A 66,464$ N/A
Average 68,484$ N/A 79,958$ N/A 87,063$ N/AHouseholds Above $50,000 559,899 54.8 % 686,482 60.8 % 737,519 63.0 %Households Above $75,000 326,285 31.9 459,718 40.7 517,863 44.2
Income DistributionLess than $15,000 94,987 9.3 % 100,226 8.9 % 104,550 8.9 %$15,000 - $24,999 94,307 9.2 88,724 7.9 86,306 7.4 $25,000 - $34,999 112,850 11.0 100,920 8.9 94,851 8.1 $35,000 - $49,999 159,411 15.6 152,005 13.5 147,462 12.6 $50,000 - $74,999 233,614 22.9 226,764 20.1 219,656 18.8 $75,000 - $99,999 148,115 14.5 166,904 14.8 173,172 14.8 $100,000 - $149,999 114,688 11.2 174,265 15.4 202,270 17.3 $150,000 + 63,482 6.2 118,549 10.5 142,421 12.2
N/A: Not Available or Not Applicable.E: Estimated.
Source: U.S. Census, Scan/US and McComb Group, Ltd.

Table A-4
RAMSEY STATION AND NORTHSTAR CORRIDOR DRAW AREAS,AND SEVEN-COUNTY METROPOLITAN AREA
HOUSEHOLDS, FAMILIES AND HOUSEHOLD SIZE; 2000 CENSUS; 2011 AND 2016 ESTIMATED
2000 2011 E 2016 E Number Percent Number Percent Number Percent
RAMSEY STATION DRAW AREAHouseholds 9,271 13,522 14,197 Families 7,689 10,626 11,053 As Percent of Households 82.9 % 78.6 % 77.9 %
Household Size1 Person 1,144 12.3 % 2,234 16.5 % 2,495 17.6 %2 Persons 2,871 31.0 4,137 30.6 4,329 30.5 3-4 Persons 3,880 41.9 5,551 41.1 5,753 40.5 5+ Persons 1,371 14.8 1,597 11.8 1,617 11.4
Average Household Size 3.04 2.87 2.84
NORTHSTAR CORRIDOR DRAW AREAHouseholds 102,464 125,352 131,616 Families 77,618 92,167 96,124 As Percent of Households 75.8 % 73.5 % 73.0 %
Household Size1 Person 18,582 18.1 % 26,032 20.8 % 28,435 21.6 %2 Persons 32,918 32.1 39,149 31.2 40,193 30.5 3-4 Persons 38,483 37.6 45,207 36.1 47,130 35.8 5 + Persons 12,451 12.2 14,951 11.9 15,846 12.0
Average Household Size 2.81 2.75 2.74
SEVEN-COUNTY METRO AREAHouseholds 1,021,454 1,128,357 1,170,688 Families 658,159 711,347 730,364 As Percent of Households 64.4 % 63.0 % 62.4 %
Household Size1 Person 281,086 27.5 % 338,115 30.0 % 363,873 31.1 %2 Persons 332,671 32.6 347,289 30.8 346,851 29.6 3-4 Persons 308,027 30.2 332,510 29.5 342,801 29.3 5 + Persons 99,670 9.8 110,443 9.8 117,163 10.0
Average Household Size 2.53 2.50 2.50
N/A: Not Available or Not Applicable.E: Estimated.
Source: U.S. Census, Scan/US and McComb Group, Ltd.

Table A-5
RAMSEY STATION AND NORTHSTAR CORRIDOR DRAW AREAS,AND SEVEN-COUNTY METROPOLITAN AREA
EDUCATIONAL ATTAINMENT: 2000 CENSUS; 2011 AND 2016 ESTIMATED
2000 2011 E 2016 EAttainment Number Percent Number Percent Number Percent
RAMSEY STATION DRAW AREANo College 4,943 31.0 % 7,293 31.0 % 7,334 29.7 %Some College/2 yr. Degree 7,312 45.9 9,212 39.2 9,453 38.3 College Graduate 2,654 16.7 5,284 22.5 5,939 24.1 Graduate School 1,023 6.4 1,701 7.2 1,947 7.9
NORTHSTAR CORRIDOR DRAW AREANo College 57,694 35.5 % 68,639 33.1 % 69,515 31.5 %Some College/2 yr. Degree 68,149 41.9 82,778 39.9 86,251 39.1 College Graduate 27,690 17.0 41,687 20.1 47,927 21.7 Graduate School 9,038 5.6 14,421 6.9 16,764 7.6
SEVEN-COUNTY METRO AREANo College 412,047 26.7 % 431,698 24.4 % 435,747 23.7 %Some College/2 yr. Degree 538,291 34.9 565,605 31.9 574,131 31.2 College Graduate 411,245 26.7 517,528 29.2 535,262 29.1 Graduate School 181,479 11.8 256,881 14.5 292,476 15.9
N/A: Not Available or Not Applicable.E: Estimated.
Source: U.S. Census, Scan/US and McComb Group, Ltd.

Table A-6
RAMSEY STATION AND NORTHSTAR CORRIDOR DRAW AREAS,AND SEVEN-COUNTY METROPOLITAN AREA
GENDER AND MARITAL STATUS: 2000 CENSUS; 2011 AND 2016 ESTIMATED
2000 2011 E 2016 EEthnicity Number Percent Number Percent Number Percent
RAMSEY STATION DRAW AREAGender
Male 14,441 51.0 % 20,117 51.6 % 20,886 51.6 %Female 13,848 49.0 18,856 48.4 19,566 48.4
Marital StatusSingle 284 3.7 % 350 3.3 % 388 3.5 %Single With Children 687 8.9 1,190 11.2 1,263 11.4 Married 6,717 87.4 9,086 85.5 9,402 85.1
NORTHSTAR CORRIDOR DRAW AREAGender
Male 145,436 50.1 % 174,278 50.3 % 182,654 50.3 %Female 145,004 49.9 172,226 49.7 180,359 49.7
Marital StatusSingle 4,145 5.3 % 4,470 4.9 % 4,642 4.8 %Single With Children 9,834 12.7 12,148 13.2 12,986 13.5 Married 63,631 82.0 75,540 82.0 78,486 81.7
SEVEN-COUNTY METRO AREAGender
Male 1,301,693 49.3 % 1,423,025 49.5 % 1,474,574 49.5 %Female 1,340,363 50.7 1,452,641 50.5 1,505,221 50.5
Marital StatusSingle 45,380 6.9 % 51,280 7.2 % 53,428 7.3 %Single With Children 92,498 14.1 105,638 14.9 111,106 15.2 Married 520,281 79.1 554,429 77.9 565,830 77.5
N/A: Not Available or Not Applicable.E: Estimated.
Source: U.S. Census, Scan/US and McComb Group, Ltd.

Table A-7
RAMSEY STATION AND NORTHSTAR CORRIDOR DRAW AREAS,AND SEVEN-COUNTY METROPOLITAN AREA
AGE DISTRIBUTION: 2000 CENSUS; 2011 AND 2016 ESTIMATED
2000 2011 E 2016 EAge Distribution Number Percent Number Percent Number Percent
RAMSEY STATION DRAW AREAUnder 5 2,316 8.2 % 2,914 7.5 % 3,040 7.5 %5 - 9 2,637 9.3 2,944 7.6 2,941 7.3 10 - 14 2,674 9.5 2,937 7.5 2,826 7.0 15 - 19 2,150 7.6 2,967 7.6 3,032 7.5 20 - 24 1,288 4.6 2,577 6.6 2,881 7.1 25 - 34 4,290 15.2 5,190 13.3 4,869 12.0 35 - 44 5,532 19.6 6,029 15.5 5,488 13.6 45 - 54 4,004 14.2 5,699 14.6 5,790 14.3 55 - 64 2,031 7.2 4,088 10.5 4,980 12.3 65 - 74 710 2.5 2,282 5.9 3,013 7.4 75 + 647 2.3 1,346 3.5 1,592 3.9
25 - 64 15,857 56.1 % 21,006 53.9 % 21,126 52.2 %65 and Over 1,357 4.8 3,628 9.3 4,605 11.4
NORTHSTAR CORRIDOR DRAW AREAUnder 5 23,534 8.1 % 26,094 7.5 % 27,380 7.5 %5 - 9 24,897 8.6 25,591 7.4 26,223 7.2 10 - 14 24,832 8.6 25,701 7.4 25,291 7.0 15 - 19 21,704 7.5 24,954 7.2 25,726 7.1 20 - 24 16,851 5.8 21,968 6.3 24,643 6.8 25 - 34 45,255 15.6 47,311 13.7 44,811 12.3 35 - 44 54,203 18.7 52,867 15.3 48,640 13.4 45 - 54 38,636 13.3 53,508 15.4 55,285 15.2 55 - 64 22,028 7.6 36,911 10.7 45,231 12.5 65 - 74 11,144 3.8 19,054 5.5 25,160 6.9 75 + 7,321 2.5 12,529 3.6 14,610 4.0
25 - 64 160,122 55.1 % 190,597 55.0 % 193,967 53.4 %65 and Over 18,465 6.4 31,583 9.1 39,770 11.0
SEVEN-COUNTY METRO AREAUnder 5 188,236 7.1 % 207,282 7.2 % 214,447 7.2 %5 - 9 198,690 7.5 192,307 6.7 205,438 6.9 10 - 14 197,611 7.5 190,384 6.6 191,984 6.4 15 - 19 183,491 6.9 193,436 6.7 190,071 6.4 20 - 24 173,732 6.6 189,862 6.6 192,262 6.5 25 - 34 411,155 15.6 417,260 14.5 396,052 13.3 35 - 44 469,324 17.8 416,462 14.5 407,567 13.7 45 - 54 363,592 13.8 440,983 15.3 433,762 14.6 55 - 64 200,980 7.6 317,979 11.1 381,648 12.8 65 - 74 130,615 4.9 164,660 5.7 216,477 7.3 75 + 124,630 4.7 145,051 5.0 150,087 5.0
25 - 64 1,445,051 54.7 % 1,592,684 55.4 % 1,619,029 54.3 %65 and Over 255,245 9.7 309,711 10.8 366,564 12.3
E: Estimated.
Source: U.S. Census, Scan/US and McComb Group, Ltd.

Table A-8
RAMSEY STATION AND NORTHSTAR CORRIDOR DRAW AREAS,AND SEVEN-COUNTY METROPOLITAN AREA
ETHNICITY: 2000 CENSUS; 2011 AND 2016 ESTIMATED
2000 2011 E 2016 EEthnicity Number Percent Number Percent Number Percent
RAMSEY STATION DRAW AREACaucasian 27,453 97.0 % 36,055 92.5 % 37,397 92.4 %African-American 98 0.3 910 2.3 972 2.4Native American 113 0.4 167 0.4 172 0.4Asian/Pacific Islander 236 0.8 867 2.2 896 2.2Other 389 1.4 973 2.5 1,016 2.5
Hispanic (any race) 308 1.1 % 983 2.5 % 1,366 3.4 %
NORTHSTAR CORRIDOR DRAW AREACaucasian 275,452 94.8 % 311,714 90.0 % 326,795 90.0 %African-American 3,576 1.2 11,536 3.3 12,022 3.3Native American 1,582 0.5 1,922 0.6 2,014 0.6Asian/Pacific Islander 3,898 1.3 9,301 2.7 9,610 2.6Other 5,931 2.0 12,033 3.5 12,574 3.5
Hispanic (any race) 4,327 1.5 % 11,743 3.4 % 16,340 4.5 %
SEVEN-COUNTY METRO AREACaucasian 2,238,117 84.7 % 2,267,068 78.8 % 2,349,676 78.9 %African-American 156,620 5.9 240,876 8.4 249,475 8.4Native American 20,417 0.8 21,073 0.7 21,737 0.7Asian/Pacific Islander 122,239 4.6 186,359 6.5 193,059 6.5Other 104,663 4.0 160,290 5.6 165,848 5.6
Hispanic (any race) 95,902 3.6 % 179,857 6.3 % 228,964 7.7 %
E: Estimated.
Source: U.S. Census, Scan/US and McComb Group, Ltd.
Appendix B
RETAIL AND SERVICES SALES POTENTIAL AND SUPPORTABLE SPACE
Ramsey Northstar Rider Retail Supportable Space B-1 Ramsey Northstar Rider Services and Health Care Supportable Space B-2 Ramsey Northstar Rider Retail Sales Potential and Supportable Space B-3 Ramsey Northstar Rider Services and Health Care Sales Potential and Supportable Space B-4

Table B-1
RAMSEY NORTHSTAR RIDERRETAIL SUPPORTABLE SPACE; 2016 AND 2020
BY MERCHANDISE CATEGORY(Gross Leasable Area)
Store SizeMerchandise Category 2016 2020 Low Median High
CONVENIENCE GOODSFood Stores Grocery Stores 1,011 1,087 31,676 52,500 65,888 Supermarkets 991 1,065 31,245 52,419 69,462 Convenience Food 30 33 1,349 2,085 5,323 Specialty Food Stores 80 90 1,188 2,400 6,000
Meat Markets 27 31 1,130 2,215 18,080 Fish & Seafood Markets 8 8 1,188 2,398 6,000 Fruit & Vegetable Markets 15 20 1,036 1,400 2,516 Other Specialty Food Stores 22 27 1,112 2,291 9,888
Baked Goods 4 8 1,191 1,834 3,285 Confectionery and Nut Stores 3 6 702 1,240 2,047 All Other Specialty Food Stores 10 15 1,069 2,200 8,007 Other Convenience Goods Drug & Proprietary Stores 441 474 8,280 11,700 23,714 Hardware 168 178 5,638 13,831 27,743 Liquor 213 229 1,305 2,856 7,210 Florist 63 68 766 1,600 5,396 Food/Health Supplement Stores 20 20 1,200 1,234 1,968 Food Service Full-Service Restaurants 617 664 2,000 4,500 9,775 Limited Service Restaurants 423 455 1,335 3,000 3,400 Cafeterias 30 34 517 1,073 10,049 Snack & Beverage Places 127 133 850 1,500 2,495
Ice Cream & Soft Serve 15 15 902 1,148 1,570 Frozen Yogurt - 5 1,031 1,282 1,700 Doughnut Shops 32 32 744 1,200 2,153 Bagel Shops 7 7 2,000 2,388 3,400 Coffee Shops 40 43 881 1,500 2,000 Cookie Shops - 3 220 602 797 Other Snack Shops 22 22 850 1,578 2,495
Specialized Food Places 188 200 N/A Drinking Places 108 116 2,243 Gasoline Svs Stations/Conv. Gas/Convenience Food Stores 380 409 1,500 2,933 6,121
OTHER RETAIL STORESBuilding Materials & Garden Supplies Building Materials & Supplies Stores Home Centers 369 394 8,981 95,173 135,833 Paint, Glass & Wallpaper 76 84 2,348 3,533 5,028 Other Building Materials Dealers 1,302 1,400 N/A N/A N/A Lawn & Garden Equipment Outdoor Power Equipment 100 110 N/A N/A N/A Retail Nurseries, Lawn & Garden 440 480 N/A 15,000 N/AMotor Vehicles & Parts Dealers Auto Parts & Accessories Stores 200 215 2,232 6,500 13,000 Tire Dealers 155 165 3,514 6,944 12,014
Source: McComb Group, Ltd.

Table B-1 (continued)
RAMSEY NORTHSTAR RIDERRETAIL SUPPORTABLE SPACE; 2016 AND 2020
BY MERCHANDISE CATEGORY(Gross Leasable Area)
Store SizeMerchandise Category 2016 2020 Low Median High
SHOPPING GOODSGeneral Merchandise Department Stores (Incl. leased depts.) Discount Stores 104 111 57,720 94,788 141,986 Department Stores 38 40 89,641 148,796 243,167 Other General Merchandise Stores Warehouse Clubs and Supercenters 65 70 90,134 151,980 217,447 Dollar Stores 6 6 2,726 8,000 13,788 Miscellaneous General Merchandise 11 12 3,200 8,400 11,212 Apparel & Accessories Clothing Stores Mens and Boys 4 4 2,002 4,000 5,635 Womens Clothing 19 20 2,074 4,200 8,740 Children's & Infant 7 8 1,490 3,912 6,000 Family Clothing 34 36 2,374 8,000 28,228 Clothing Accessories Stores 2 2 918 1,400 2,001 Other Clothing Stores 5 6 1,060 2,300 8,234 Shoe Stores Men's - - 903 1,640 2,186 Women's 1 1 1,309 2,384 3,158 Children's & Infant - - 1,490 3,912 6,000 Family Shoe Stores 11 12 2,021 3,388 10,234 Athletic Footwear 5 5 1,535 3,284 11,314 Furniture & Home Furnishings Furniture 29 31 3,108 7,927 36,712 Floor Coverings 13 13 1,229 3,593 7,819 Window Treatment Stores 1 1 1,489 4,905 9,934 All Other Home Furnishings Stores 19 20 2,868 3,570 6,500 Electronics & Appliances Stores Household Appliance Stores 8 9 2,349 4,000 7,563 Radio, TV & Electronics Stores 32 34 1,208 3,406 10,451 Computers, Software, Music, & Other Electronics 5 5 997 3,388 25,600 Other Shopping Goods Sporting Goods 31 33 2,238 7,500 44,116 General Line Sporting Goods 13 14 3,765 5,850 28,128 Specialty Line Sporting Goods 16 18 1,097 2,449 4,356 Book Stores & Newsdealers 11 12 2,428 4,542 29,974 Stationery Stores and Office Supply 6 7 585 1,033 2,247 Musical Instrument & Supplies 4 5 2,432 7,324 26,094 Jewelry Stores 11 12 790 1,450 3,410 Hobby, Toy & Game 10 10 1,604 4,050 25,861 Camera & Photographic Supply 3 3 816 2,200 5,965 Gift, Novelty & Souvenirs 13 14 2,369 4,422 7,015 Luggage & Leather Goods 1 1 1,193 2,300 3,102 Sewing, Needlework & Piece Goods 9 10 2,678 12,202 19,299 Pet Stores 8 9 1,847 3,200 12,398 Art Dealers 1 1 675 1,434 2,401 Optical Goods Stores 5 5 885 1,561 4,068 Pre-Recorded Tapes, Compact Discs 1 1 1,308 3,426 12,753 Cosmetics, Beauty Supplies & Perfume 4 4 1,102 1,953 6,235 All Other Health & Personal Care 7 8 697 1,786 3,084

Table B-2
BIG LAKE NORTHSTAR RIDERSERVICES AND HEALTH CARE SUPPORTABLE SPACE; 2016 AND 2020
BY SERVICES CATEGORY
Store SizeCategory 2016 2020 Low Median High
Personal Care Services Barber Shops - - 455 788 1,422 Beauty Shops 258 284 900 1,400 3,480 Nail Salons 36 36 773 1,200 1,807 Diet & Weight Reducing Services 20 20 1,223 1,856 3,130 Other Personal Care Services 40 46 703 1,488 4,128
Drycleaning & Laundry Services Coin-Operated Laundries & Drycleaners 50 67 1,222 2,024 3,734 Drycleaning & Laundry Services (except coin-op.) 73 80 1,038 1,608 2,731
Other Personal ServicesChild Day Care Services 470 520 3,059 5,050 7,495 Photographic Services 364 400 990 1,866 2,550 Photographic Studios 36 36 990 1,866 2,550 Veteranarian Services 160 173 1,346 2,122 2,701 Pet Care 53 53 1,200
Rental and LeasingFormalwear and Costume Rental 5 5 763 1,046 1,773 Video Tape and Disc Rental 60 65 3,740 5,836 7,341 Home Health Equipment Rental 16 20 1,200 1,600 3,480
Household Goods Repair Home & Garden Equipment & Appliance Repair &Maint. 23 23 Reupholstery & Furniture Repair 13 13 600 Footwear and Leather Goods Repair - - 405 648 742 Watch, Clock and Jewelry Repair 6 6 900 Garment Repair and Alteration Services 8 8 680 1,185 1,488
Computer & Office Machine Repair 93 107 1,200
Automotive Repair and Maintenance General Automotive Repair 355 390 2,400 6,200 10,624
Health Care Offices of Physicians Offices of Physicians (except mental health specialists) 1,188 1,303 969 1,652 4,008 Offices of Physicians, Mental Health Specialists 11 11 969 1,800 4,008 Offices of Dentists 548 603 1,090 1,700 3,970 Offices of Other Health Practitioners Offices of Chiropractors 78 87 1,090 1,600 3,970 Offices of Optometrists 29 34 1,074 1,620 4,347 Offices of Mental Health Practitioners (except physicians) 41 43 1,090 1,800 3,970 Offices of Physical, Occup, & Speech Therapists & Audiologists Speech Therapist & Audiologists 3 6 1,090 1,600 3,970 Physical & Occupational Therapists 70 75 1,090 1,600 3,970 Offices of All Other Health Practitioners Offices of Podiatrists 6 8 1,090 1,800 3,970 Offices of All Other Misc. Health Practitioners 29 32 1,090 1,800 3,970
Source: McComb Group, Ltd.

Table B-3
RAMSEY NORTHSTAR RIDERRETAIL SALES POTENTIAL AND SUPPORTABLE SPACE; 2016
BY MERCHANDISE CATEGORY
EstimatedSales Sales Supportable Store Size
Category Potential Per Sq. Ft. Square Feet Low Median High
CONVENIENCE GOODS
Food Stores Grocery stores 465,000$ 460$ 1,011 31,676 52,500 65,888 Supermarkets 456,000 460 991 31,245 52,419 69,462 Convenience food 9,000 300 30 1,349 2,085 5,323 Specialty food stores 16,000 200 80 1,188 2,400 6,000
Meat Markets 6,000 225 27 1,130 2,215 18,080 Fish & Seafood Markets 2,000 250 8 1,188 2,398 6,000 Fruit & Vegetable Markets 3,000 200 15 1,036 1,400 2,516 Other Specialty Food Stores 5,000 225 22 1,112 2,291 9,888
Baked Goods 1,000 250 4 1,191 1,834 3,285 Confectionery and Nut Stores 1,000 320 3 702 1,240 2,047 All Other Specialty Food Stores 2,000 200 10 1,069 2,200 8,007
Other Convenience Goods Drug & proprietary stores 203,000$ 460$ 441 8,280 11,700 23,714 Hardware 31,000 185 168 5,638 13,831 27,743 Liquor 80,000 375 213 1,305 2,856 7,210 Florist 12,000 190 63 766 1,600 5,396
Food Service & Drinking Places Food Service Full-service restaurants 222,000$ 360$ 617 2,000 4,500 9,775 Limited service restaurants 169,000 400 423 1,335 3,000 3,400 Cafeterias 7,000 235 30 517 1,073 10,049 Snack & beverage places 38,000 300 127 850 1,500 2,495
Ice Cream & Soft Serve 5,000 325 15 902 1,148 1,570 Frozen Yogurt - 200 - 1,031 1,282 1,700 Doughnut Shops 7,000 220 32 744 1,200 2,153 Bagel Shops 2,000 275 7 2,000 2,388 3,400 Coffee Shops 16,000 400 40 881 1,500 2,000 Cookie Shops - 400 - 220 602 797 Other Snack Shops 8,000 360 22 850 1,578 2,495
Specialized food places 75,000 400 188 N/A
Drinking Places 27,000$ 250$ 108 2,243
Gasoline Svs Stations/Conv. Gas/Convenience food stores 532,000$ 1,400$ 380 1,500 2,933 6,121
OTHER RETAIL STORES
Building Materials & Garden Supplies Building materials & supplies stores Home centers 129,000$ 350$ 369 8,981 95,173 135,833 Paint, glass & wallpaper 17,000 225 76 2,348 3,533 5,028 Other building materials dealers 293,000 225 1,302 N/A N/A N/A Lawn & garden equipment Outdoor power equipment 10,000 100 100 N/A N/A N/A Retail nurseries, lawn & garden 44,000 100 440 N/A 15,000 N/A
Motor Vehicles & Parts Dealers Auto parts, accessories & tires Auto parts & accessories stores 40,000$ 200$ 200 2,232 6,500 13,000 Tire dealers 31,000 200 155 3,514 6,944 12,014
Source: McComb Group, Ltd.

Table B-3 (continued)
RAMSEY NORTHSTAR RIDERRETAIL SALES POTENTIAL AND SUPPORTABLE SPACE; 2016
BY MERCHANDISE CATEGORY
EstimatedSales Sales Supportable Store Size
Category Potential Per Sq. Ft. Square Feet Low Median High
SHOPPING GOODS
General Merchandise Department stores Discount stores 25,904$ 250$ 104 57,720 94,788 141,986 Department Stores 8,462 225 38 89,641 148,796 243,167 Other general merchandise stores Warehouse Clubs and Supercenters 29,100$ 450$ 65 90,134 151,980 217,447 Dollar Stores 1,222 220 6 2,726 8,000 13,788 Miscellaneous general mdse. 2,821 250 11 3,200 8,400 11,212
Apparel & Accessories Clothing Stores Mens and boys 846$ 220$ 4 2,002 4,000 5,635 Womens clothing 3,761 200 19 2,074 4,200 8,740 Children's & infant 1,739 240 7 1,490 3,912 6,000 Family clothing 8,744 260 34 2,374 8,000 28,228 Clothing accessories stores 517 290 2 918 1,400 2,001 Other clothing stores 1,410 265 5 1,060 2,300 8,234
Shoe Stores Men's 102$ 290$ - 903 1,640 2,186 Women's 181 270 1 1,309 2,384 3,158 Children's & infant 47 290 - 1,490 3,912 6,000 Family shoe stores 1,880 175 11 2,021 3,388 10,234 Athletic footwear 799 175 5 1,535 3,284 11,314
Furniture & Home Furnishings Furniture 7,428$ 260$ 29 3,108 7,927 36,712 Floor coverings 2,821 225 13 1,229 3,593 7,819 Window treatment stores 282 210 1 1,489 4,905 9,934 All other home furnishings stores 3,291 175 19 2,868 3,570 6,500
Electronics & Appliances Stores Household appliance stores 2,304$ 275$ 8 2,349 4,000 7,563 Radio, tv & electronics stores 9,496 300 32 1,208 3,406 10,451 Computers, Software, Music, & other electronics 2,821 580 5 997 3,388 25,600
Other Shopping Goods Sporting goods 6,206$ 200$ 31 2,238 7,500 44,116 General Line Sporting Gds. 2,539 200 13 3,765 5,850 28,128 Specialty Line Sporting Gds. 3,667 225 16 1,097 2,449 4,356 Book stores & newsdealers 1,739 160 11 2,428 4,542 29,974 Stationery Stores and Office Supply 2,304 375 6 585 1,033 2,247 Musical Instrument & Supplies 1,034 240 4 2,432 7,324 26,094 Jewelry stores 3,526 325 11 790 1,450 3,410 Hobby, toy & game 1,692 175 10 1,604 4,050 25,861 Camera & photographic supply 705 275 3 816 2,200 5,965 Gift, novelty & souvenirs 1,927 150 13 2,369 4,422 7,015 Luggage & leather goods 235 200 1 1,193 2,300 3,102 Sewing, needlework & piece goods 893 100 9 2,678 12,202 19,299 Pet stores 1,692 200 8 1,847 3,200 12,398 Art dealers 282 225 1 675 1,434 2,401 Optical goods stores 1,410 290 5 885 1,561 4,068 Pre-Recorded Tapes, Compact Discs 268 230 1 1,308 3,426 12,753 Cosmetics, beauty supplies & perfume 1,153 320 4 1,102 1,953 6,235 All other health & personal care 1,974 275 7 697 1,786 3,084

Table B-3 (continued)
RAMSEY NORTHSTAR RIDERRETAIL SALES POTENTIAL AND SUPPORTABLE SPACE; 2020
BY MERCHANDISE CATEGORY
EstimatedSales Sales Supportable Store Size
Category Potential Per Sq. Ft. Square Feet Low Median High
CONVENIENCE GOODS
Food Stores Grocery stores 500,000$ 460$ 1,087 31,676 52,500 65,888 Supermarkets 490,000 460 1,065 31,245 52,419 69,462 Convenience food 10,000 300 33 1,349 2,085 5,323 Specialty food stores 18,000 200 90 1,188 2,400 6,000
Meat Markets 7,000 225 31 1,130 2,215 18,080 Fish & Seafood Markets 2,000 250 8 1,188 2,398 6,000 Fruit & Vegetable Markets 4,000 200 20 1,036 1,400 2,516 Other Specialty Food Stores 6,000 225 27 1,112 2,291 9,888
Baked Goods 2,000 250 8 1,191 1,834 3,285 Confectionery and Nut Stores 2,000 320 6 702 1,240 2,047 All Other Specialty Food Stores 3,000 200 15 1,069 2,200 8,007
Other Convenience Goods Drug & proprietary stores 218,000$ 460$ 474 8,280 11,700 23,714 Hardware 33,000 185 178 5,638 13,831 27,743 Liquor 86,000 375 229 1,305 2,856 7,210 Florist 13,000 190 68 766 1,600 5,396
Food Service & Drinking Places Food Service Full-service restaurants 239,000$ 360$ 664 2,000 4,500 9,775 Limited service restaurants 182,000 400 455 1,335 3,000 3,400 Cafeterias 8,000 235 34 517 1,073 10,049 Snack & beverage places 40,000 300 133 850 1,500 2,495
Ice Cream & Soft Serve 5,000 325 15 902 1,148 1,570 Frozen Yogurt 1,000 200 5 1,031 1,282 1,700 Doughnut Shops 7,000 220 32 744 1,200 2,153 Bagel Shops 2,000 275 7 2,000 2,388 3,400 Coffee Shops 17,000 400 43 881 1,500 2,000 Cookie Shops 1,000 400 3 220 602 797 Other Snack Shops 8,000 360 22 850 1,578 2,495
Specialized food places 80,000 400 200 N/A
Drinking Places 29,000$ 250$ 116 2,243
Gasoline Svs Stations/Conv. Gas/Convenience food stores 572,000$ 1,400$ 409 1,500 2,933 6,121
OTHER RETAIL STORES
Building Materials & Garden Supplies Building materials & supplies stores Home centers 138,000$ 350$ 394 8,981 95,173 135,833 Paint, glass & wallpaper 19,000 225 84 2,348 3,533 5,028 Other building materials dealers 315,000 225 1,400 N/A N/A N/A Lawn & garden equipment Outdoor power equipment 11,000 100 110 N/A N/A N/A Retail nurseries, lawn & garden 48,000 100 480 N/A 15,000 N/A
Motor Vehicles & Parts Dealers Auto parts, accessories & tires Auto parts & accessories stores 43,000$ 200$ 215 2,232 6,500 13,000 Tire dealers 33,000 200 165 3,514 6,944 12,014
Source: McComb Group, Ltd.

Table B-3 (continued)
RAMSEY NORTHSTAR RIDERRETAIL SALES POTENTIAL AND SUPPORTABLE SPACE; 2020
BY MERCHANDISE CATEGORY
EstimatedSales Sales Supportable Store Size
Category Potential Per Sq. Ft. Square Feet Low Median High
SHOPPING GOODS
General Merchandise Department stores Discount stores 27,845$ 250$ 111 57,720 94,788 141,986 Department Stores 9,096 225 40 89,641 148,796 243,167 Other general merchandise stores Warehouse Clubs and Supercenters 31,282$ 450$ 70 90,134 151,980 217,447 Dollar Stores 1,314 220 6 2,726 8,000 13,788 Miscellaneous general mdse. 3,032 250 12 3,200 8,400 11,212
Apparel & Accessories Clothing Stores Mens and boys 910$ 220$ 4 2,002 4,000 5,635 Womens clothing 4,043 200 20 2,074 4,200 8,740 Children's & infant 1,870 240 8 1,490 3,912 6,000 Family clothing 9,400 260 36 2,374 8,000 28,228 Clothing accessories stores 556 290 2 918 1,400 2,001 Other clothing stores 1,516 265 6 1,060 2,300 8,234
Shoe Stores Men's 110$ 290$ - 903 1,640 2,186 Women's 195 270 1 1,309 2,384 3,158 Children's & infant 51 290 - 1,490 3,912 6,000 Family shoe stores 2,021 175 12 2,021 3,388 10,234 Athletic footwear 859 175 5 1,535 3,284 11,314
Furniture & Home Furnishings Furniture 7,985$ 260$ 31 3,108 7,927 36,712 Floor coverings 3,032 225 13 1,229 3,593 7,819 Window treatment stores 303 210 1 1,489 4,905 9,934 All other home furnishings stores 3,538 175 20 2,868 3,570 6,500
Electronics & Appliances Stores Household appliance stores 2,476$ 275$ 9 2,349 4,000 7,563 Radio, tv & electronics stores 10,208 300 34 1,208 3,406 10,451 Computers, Software, Music, & other electronics 3,032 580 5 997 3,388 25,600
Other Shopping Goods Sporting goods 6,671$ 200$ 33 2,238 7,500 44,116 General Line Sporting Gds. 2,729 200 14 3,765 5,850 28,128 Specialty Line Sporting Gds. 3,942 225 18 1,097 2,449 4,356 Book stores & newsdealers 1,870 160 12 2,428 4,542 29,974 Stationery Stores and Office Supply 2,476 375 7 585 1,033 2,247 Musical Instrument & Supplies 1,112 240 5 2,432 7,324 26,094 Jewelry stores 3,790 325 12 790 1,450 3,410 Hobby, toy & game 1,819 175 10 1,604 4,050 25,861 Camera & photographic supply 758 275 3 816 2,200 5,965 Gift, novelty & souvenirs 2,072 150 14 2,369 4,422 7,015 Luggage & leather goods 253 200 1 1,193 2,300 3,102 Sewing, needlework & piece goods 960 100 10 2,678 12,202 19,299 Pet stores 1,819 200 9 1,847 3,200 12,398 Art dealers 303 225 1 675 1,434 2,401 Optical goods stores 1,516 290 5 885 1,561 4,068 Pre-Recorded Tapes, Compact Discs 289 230 1 1,308 3,426 12,753 Cosmetics, beauty supplies & perfume 1,239 320 4 1,102 1,953 6,235 All other health & personal care 2,122 275 8 697 1,786 3,084

Table B-4
RAMSEY NORTHSTAR RIDERSERVICES AND HEALTH CARE SALES POTENTIAL AND SUPPORTABLE SPACE; 2016
BY SERVICES CATEGORY
EstimatedSales Sales Supportable Store Size
Category Potential Per Sq. Ft. Square Feet Low Median HighPersonal Care Services Barber Shops -$ 200$ - 455 788 1,422 Beauty Shops 49,000 190 258 900 1,400 3,480 Nail Salons 4,000 110 36 773 1,200 1,807 Diet & Weight Reducing Services 3,000 150 20 1,223 1,856 3,130 Other Personal Care Services 7,000 175 40 703 1,488 4,128
Drycleaning & Laundry Services Coin-Operated Laundries & Drycleaners 3,000$ 60$ 50 1,222 2,024 3,734 Drycleaning & Laundry Services (except coin-op.) 11,000 150 73 1,038 1,608 2,731
Other Personal ServicesChild Day Care Services 47,000$ 100$ 470 3,059 5,050 7,495 Photographic Services 100,000 275 364 990 1,866 2,550 Photographic Studios 10,000 275 36 990 1,866 2,550 Veteranarian Services 36,000 225 160 1,346 2,122 2,701 Pet Care 4,000 75 53 1,200
Rental and LeasingFormalwear and Costume Rental 2,000$ 365$ 5 763 1,046 1,773 Video Tape and Disc Rental 12,000 200 60 3,740 5,836 7,341 Home Health Equipment Rental 4,000 250 16 1,200 1,600 3,480
Household Goods Repair Home & Garden Equipment & Appliance Repair &Maint. 4,000$ 175$ 23 Reupholstery & Furniture Repair 2,000 155 13 600 Footwear and Leather Goods Repair - 155 - 405 648 742 Watch, Clock and Jewelry Repair 1,000 155 6 900 Garment Repair and Alteration Services 1,000 125 8 680 1,185 1,488
Computer & Office Machine Repair 14,000 150 93 1,200
Automotive Repair and Maintenance General Automotive Repair 71,000$ 200$ 355 2,400 6,200 10,624
Health Care Offices of Physicians Offices of Physicians (except mental health specialists) 424,000$ 357$ 1,188 969 1,652 4,008 Offices of Physicians, Mental Health Specialists 4,000 357 11 969 1,800 4,008 Offices of Dentists 189,000 345 548 1,090 1,700 3,970 Offices of Other Health Practitioners Offices of Chiropractors 27,000 345 78 1,090 1,600 3,970 Offices of Optometrists 12,000 415 29 1,074 1,620 4,347 Offices of Mental Health Practitioners (except physicians) 14,000 345 41 1,090 1,800 3,970 Offices of Physical, Occup, & Speech Therapists & Audiologists Speech Therapist & Audiologists 1,000 345 3 1,090 1,600 3,970 Physical & Occupational Therapists 24,000 345 70 1,090 1,600 3,970 Offices of All Other Health Practitioners Offices of Podiatrists 2,000 357 6 1,090 1,800 3,970 Offices of All Other Misc. Health Practitioners 10,000 345 29 1,090 1,800 3,970
Source: McComb Group, Ltd.

Table B-4 (continued)
RAMSEY NORTHSTAR RIDERSERVICES AND HEALTH CARE SALES POTENTIAL AND SUPPORTABLE SPACE; 2020
BY SERVICES CATEGORY
EstimatedSales Sales Supportable Store Size
Category Potential Per Sq. Ft. Square Feet Low Median HighPersonal Care Services Barber Shops -$ 200$ - 455 788 1,422 Beauty Shops 54,000 190 284 900 1,400 3,480 Nail Salons 4,000 110 36 773 1,200 1,807 Diet & Weight Reducing Services 3,000 150 20 1,223 1,856 3,130 Other Personal Care Services 8,000 175 46 703 1,488 4,128
Drycleaning & Laundry Services Coin-Operated Laundries & Drycleaners 4,000$ 60$ 67 1,222 2,024 3,734 Drycleaning & Laundry Services (except coin-op.) 12,000 150 80 1,038 1,608 2,731
Other Personal ServicesChild Day Care Services 52,000$ 100$ 520 3,059 5,050 7,495 Photographic Services 110,000 275 400 990 1,866 2,550 Photographic Studios 10,000 275 36 990 1,866 2,550 Veteranarian Services 39,000 225 173 1,346 2,122 2,701 Pet Care 4,000 75 53 1,200
Rental and LeasingFormalwear and Costume Rental 2,000$ 365$ 5 763 1,046 1,773 Video Tape and Disc Rental 13,000 200 65 3,740 5,836 7,341 Home Health Equipment Rental 5,000 250 20 1,200 1,600 3,480
Household Goods Repair Home & Garden Equipment & Appliance Repair &Maint. 4,000$ 175$ 23 Reupholstery & Furniture Repair 2,000 155 13 600 Footwear and Leather Goods Repair - 155 - 405 648 742 Watch, Clock and Jewelry Repair 1,000 155 6 900 Garment Repair and Alteration Services 1,000 125 8 680 1,185 1,488
Computer & Office Machine Repair 16,000 150 107 1,200
Automotive Repair and Maintenance General Automotive Repair 78,000$ 200$ 390 2,400 6,200 10,624
Health Care Offices of Physicians Offices of Physicians (except mental health specialists) 465,000$ 357$ 1,303 969 1,652 4,008 Offices of Physicians, Mental Health Specialists 4,000 357 11 969 1,800 4,008 Offices of Dentists 208,000 345 603 1,090 1,700 3,970 Offices of Other Health Practitioners Offices of Chiropractors 30,000 345 87 1,090 1,600 3,970 Offices of Optometrists 14,000 415 34 1,074 1,620 4,347 Offices of Mental Health Practitioners (except physicians) 15,000 345 43 1,090 1,800 3,970 Offices of Physical, Occup, & Speech Therapists & Audiologists Speech Therapist & Audiologists 2,000 345 6 1,090 1,600 3,970 Physical & Occupational Therapists 26,000 345 75 1,090 1,600 3,970 Offices of All Other Health Practitioners Offices of Podiatrists 3,000 357 8 1,090 1,800 3,970 Offices of All Other Misc. Health Practitioners 11,000 345 32 1,090 1,800 3,970
Source: McComb Group, Ltd.

Prepared byOlivia Boerschinger, Joshua Pansch and Mathew Lupini
Students in PA 5253 Land Use Development Instructor: Dr. Fernando Burga
Hubert H. Humphrey School of Public Affairs
Prepared in Collaboration with Tim Gladhill
Community Development Director City of Ramsey
Surviving the Retail Apocalypse: Charting the Future of Retail in Ramsey

TheprojectonwhichthisreportisbasedwascompletedincollaborationwiththeCityofRamseyaspartofthe2017–2018ResilientCommunitiesProject(RCP)partnership.RCPisaprogramattheUniversityofMinnesota’sCenterforUrbanandRegionalAffairs(CURA)thatconnectsUniversityfacultyandstudentswithMinnesotacommunitiestoaddressstrategicprojectsthatadvancelocalresilienceandsustainability.
Thecontentsofthisreportrepresenttheviewsoftheauthors,anddonotnecessarilyreflectthoseofRCP,CURA,theRegentsoftheUniversityofMinnesota,ortheCityofRamsey.
ThisworkislicensedunderaCreativeCommonsAttribution-NonCommercial3.0UnportedLicense.Toviewacopyofthislicense,visitwww.creativecommons.org/licenses/by-nc/3.0/orsendalettertoCreativeCommons,444CastroStreet,
Suite900,MountainView,California,94041,USA.Anyreproduction,distribution,orderivativeuseofthisworkunderthislicensemustbeaccompaniedbythefollowingattribution:“ProducedbytheResilientCommunitiesProject(www.rcp.umn.edu)attheUniversityofMinnesota.ReproducedunderaCreativeCommonsAttribution-NonCommercial3.0UnportedLicense.”
Thispublicationmaybeavailableinalternateformatsuponrequest.
ResilientCommunitiesProjectUniversityofMinnesota330HHHSPA301—19thAvenueSouthMinneapolis,Minnesota55455Phone:(612)625-7501E-mail:[email protected]:http://www.rcp.umn.edu
TheUniversityofMinnesotaiscommittedtothepolicythatallpersonsshallhaveequalaccesstoitsprograms,facilities,andemploymentwithoutregardtorace,color,creed,religion,nationalorigin,sex,age,maritalstatus,
disability,publicassistancestatus,veteranstatus,orsexualorientation.

Surviving the Retail ApocalypseCharting the Future of Retail in Ramsey 1
PA5211: Land Use Planning / Instructor: Fernando Burga PhD. Olivia Boerschinger, Joshua Pansch, Matthew Lupini
The upcoming posters show the challenges Ramsey faces in attracting retail today and opportunities it has to attract future business. The city is in a position to create a retail identity, attractive to new retailers and leap ahead of its neighbors.
Globally big box retailers have been downsizing and closing stores for decades. Large shopping malls are no longer being built across suburban cities, and many more people are shopping online.
Utilizing Exisiting AssetsBranding a Unique Identity Experience the Character of Ramsey
Retooling the Retail Economy: It is important for Ramsey to utilize not only the physical space but also the intellectual resources of the community. The city can foster the talents of the community through innovative strategies to spur the retail development that the commnity desires.
Creating a Reason to Shop in Ramsey: Shoppers need a reason to spend hard earned money. Ramsey has unique assets to develop an identity lacking in nearby cities. Coordinate residents and developers to create a cohesive vision of retail going forward that all development will build
Leveraging Recreation: Ramsey has an advantage over its neighbors from it's nearby rivers, established and upcoming bike trails and vacant space for new retail formats. Retail in Ramsey should create a fun and novel experience for the community to spend their time.
http://kare11.tv/2hWRnpI http://bit.ly/2zwHJBChttp://bit.ly/2qwWwLg
Ramsey is surrounded by large retail nodes hunting for eager shoppers. Cities like Maple Grove, Coon Rapids, Otsego, and Anoka all have established markets easily accessible in less than a 23 minute drive.
Vacant space is designated for commercial development. There are more than 50 shops and restaurants that are located across the city but only a few located in the center of Ramsey.
Retail is Changing Competition is High Ramsey Inventory and Assets
The retail opportunity in Ramsey is high given the city’s growing population, disposable income, and space for new shops and restaurants. Global retail is changing rapidly with new technology and ways for people to shop and enjoy their time. Ramsey can become a premier destination by taking advantage of its resources, creating a place for the talent of the community members to grow, and becoming a model for the future of retail.
The Story of Retail Today
Survival Strategies
Strategies:• Create retail identity through outdoor
expos and events• Encourage development of destinations
for outdoor enthusiasts• Turn vacant space into places for
neighbors to stay a while
Strategies:• Simplify new business start-up process• Incentivize redevelopment, encourage
reinvestment• Create low-risk opportunities for
entrepreneurers
Strategies:• Identify unique assets• Coordinate residents and developers
around retail vision• Ensure cohesive retail story built around
Ramsey identity
Introduction National Trends Regional Competition
Demographics Strategy #1 Strategy #2 Strategy #3 Ramsey Assets Conclusion
Introduction
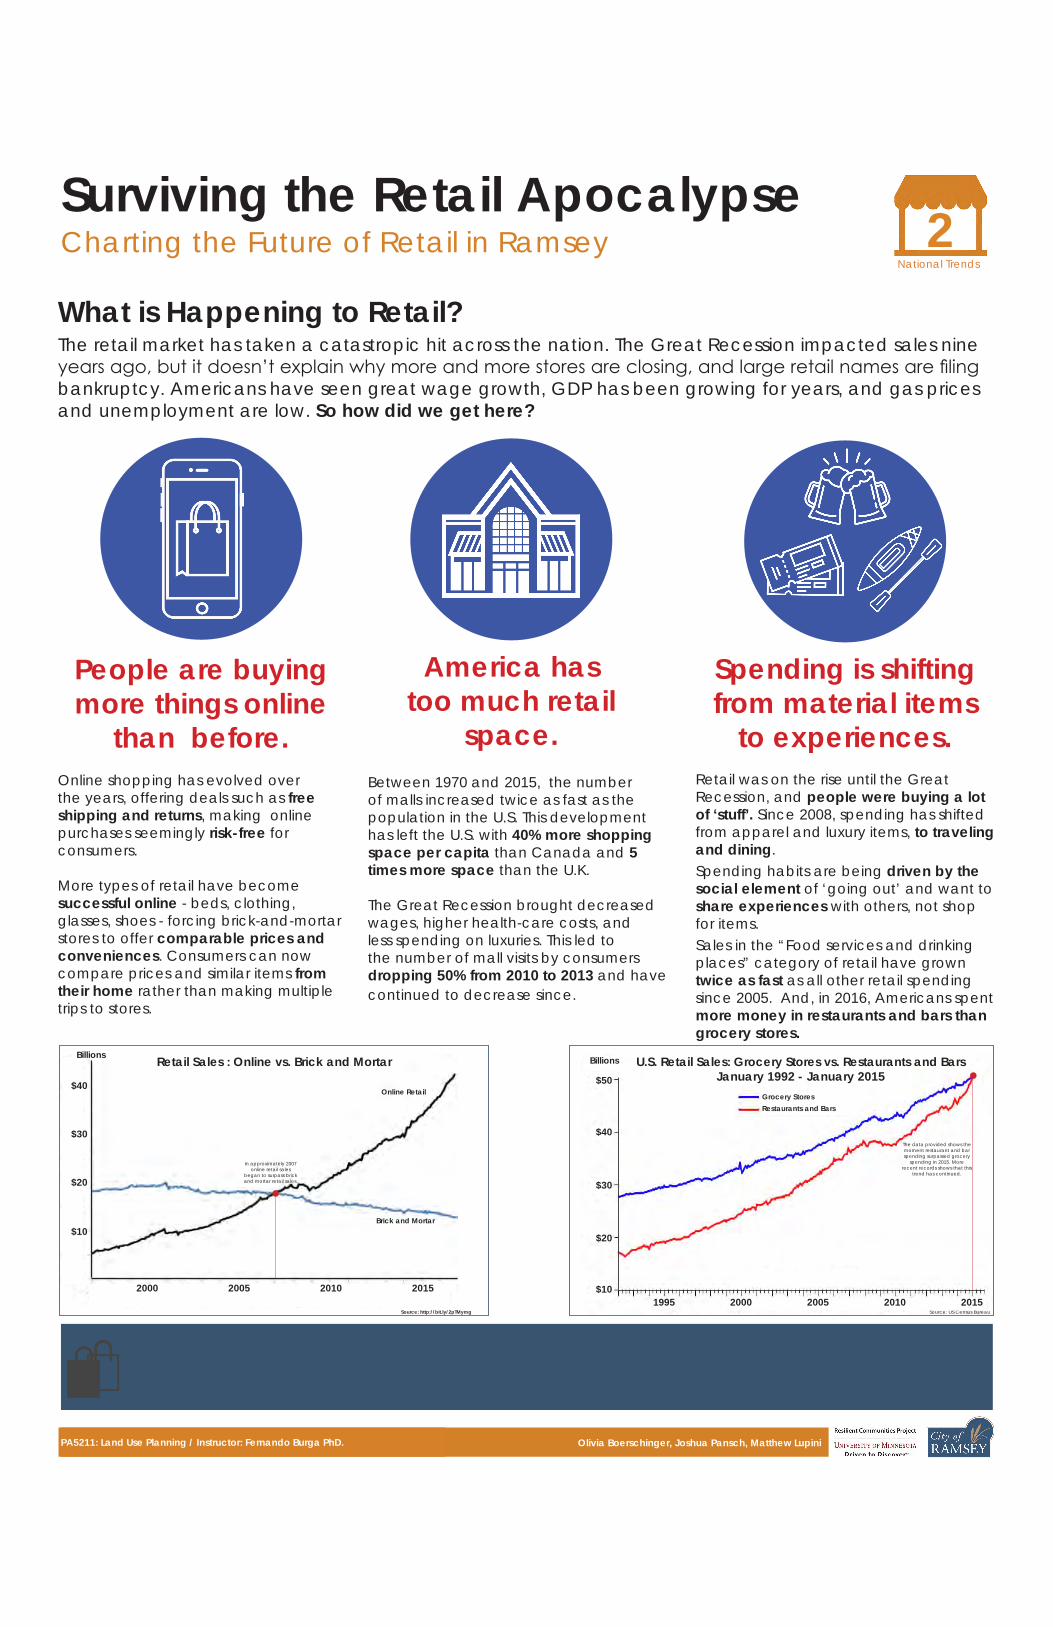
Surviving the Retail ApocalypseCharting the Future of Retail in Ramsey 2
PA5211: Land Use Planning / Instructor: Fernando Burga PhD. Olivia Boerschinger, Joshua Pansch, Matthew Lupini
The retail market has taken a catastropic hit across the nation. The Great Recession impacted sales nine years ago, but it doesn’t explain why more and more stores are closing, and large retail names are filing bankruptcy. Americans have seen great wage growth, GDP has been growing for years, and gas prices and unemployment are low. So how did we get here?
What is Happening to Retail?
Is this the end of brick-and-mortar? Probably not. New technology advances will continue to impact the retail market. Economic development can still be successful, as long as cities plan alongside the changes, shaping strategies to try to keep up with whatever comes next. Ramsey can stay on the cutting edge of market change though implementing strategies shaped by these trends, and understanding their competition, as highlighted on the next poster.
Between 1970 and 2015, the number of malls increased twice as fast as the population in the U.S. This development has left the U.S. with 40% more shopping space per capita than Canada and 5 times more space than the U.K.
The Great Recession brought decreased wages, higher health-care costs, and less spending on luxuries. This led to the number of mall visits by consumers dropping 50% from 2010 to 2013 and have continued to decrease since.
America has too much retail
space.
People are buying more things online
than before.Online shopping has evolved over the years, offering deals such as free shipping and returns, making online purchases seemingly risk-free for consumers.
More types of retail have become successful online - beds, clothing, glasses, shoes - forcing brick-and-mortar stores to offer comparable prices and conveniences. Consumers can now compare prices and similar items from their home rather than making multiple trips to stores.
Source: http://bit.ly/2pTMymg
Retail was on the rise until the Great Recession, and people were buying a lot of ‘stuff’. Since 2008, spending has shifted from apparel and luxury items, to traveling and dining.Spending habits are being driven by the social element of ‘going out’ and want to share experiences with others, not shop for items.Sales in the “Food services and drinking places” category of retail have grown twice as fast as all other retail spending since 2005. And, in 2016, Americans spent more money in restaurants and bars than grocery stores.
Spending is shifting from material items
to experiences.
Source: http://bit.ly/2ALyktN
U.S. Retail Sales: Grocery Stores vs. Restaurants and BarsJanuary 1992 - January 2015
Grocery StoresRestaurants and Bars
Source: US Census Bureau
Billions
$50
$40
$30
$20
$101995 2000 2005 2010 2015
Retail Sales : Online vs. Brick and Mortar
$40
$30
$20
$10
2000 2005 2010 2015
Online Retail
Brick and Mortar
National Trends
In approximately 2007 online retail sales
began to surpass brick and mortar retail sales.
The data provided shows the moment restaurant and bar spending surpassed grocery
spending in 2015. More recent records shows that this
trend has continued.
Billions

Surviving the Retail ApocalypseCharting the Future of Retail in Ramsey 3
PA5211: Land Use Planning / Instructor: Fernando Burga PhD. Olivia Boerschinger, Joshua Pansch, Matthew Lupini
Regional competition is fierce with attractions for residents, commuters and cabin goers surrounding Ramsey. Major highways passing through the region give shoppers access to retail nodes in several nearby cites. Ramsey has the land area and vacant space to expand its retail base within the city.
Competition & AccessibilityRamsey sits between many retail nodes including big box stores and clusters of shops and popular restaurants. The map below represents regional competition near the City of Ramsey. All retail nodes highlighted are within 12 miles of the city. Each map describes these nodes and how they might impact retail in Ramsey.
Reginal Competition
RestaurantsRetail StoresServiceGrocery
60%
4%16%
20%
16% 17%
17%50%
40%
40%
15%5%
64%
5%13%
18%49%
39%
7%5%
35%18%
42%
5%
43%
33%17%
7%
47%
21%
19%
14%
57%17%
17%
9%
Ramsey
Mississippi River
Hwy65
Interstate94
Hwy
10
Hwy
47
0 3 6 Miles
N
Location of Retail Nodes Near Ramsey
Drive Time Retail Diversity
Quantity of Retail and Restaurants
Ramsey sits between 9 competitive retail nodes These 9 nodes have 854 retail locations combined
Various types of retail are available in each nodeResidents can access each in less than 23 minutes
15 Minutes
11 Minutes
21 Minutes
9 Minutes15 Minutes
23 Minutes
16 Minutes
13 Minutes19 Minutes
Ramsey
Mississippi River
Hwy65
Interstate94
Hwy
10
Hwy
47
0 3 6 Miles
N
Ramsey
St. Francis
Elk River
Andover
Anoka
Riverdale
NorthtownArbor Lakes
Rogers
Otsego
222180
183
84
645637
14
14
Ramsey
Mississippi River
Hwy65
Interstate94
Hwy
10
Hwy
47
0 3 6 Miles
N
Ramsey
Mississippi River
Hwy65
Interstate94
Hwy
10
Hwy
47
0 3 6 Miles
N

Surviving the Retail ApocalypseCharting the Future of Retail in Ramsey 4
PA5211: Land Use Planning / Instructor: Fernando Burga PhD. Olivia Boerschinger, Joshua Pansch, Matthew Lupini
Who is Ramsey’s target retail market?To analyze Ramsey's opportunities, demographic data should be examined to as questions about residents, the surrounding area, and consumer habits. Current and projected demographic data, which shapes consumer spending information provides crucial insights about Ramsey's potential to successfully attract and retain retailers.
Ramsey's Retail DemographicsAge- The majority of Ramsey’s population is between the age of 25-65. This highlights the stability of the city’s population for potential retailers. However, the largest concentration of population is between 40-55 years old, emphasizing the aging population and anticipated shift in spending habits. Spending momentum starts to decrease dramatically after age 50. Prior to that individuals and households peak in spending when buying homes, cars, and having children.
Income - 40% of Ramsey residents have a household income over $100,000 and average household income nearly $20,000 greater than the average for the Twin Cities Metro. When evaluating a market, retailers seek a minimum number of households within a certain income range before establishing a business. Ramsey’s high median income means lower risk for incoming retailers.
Understanding resident demographics and correlating spending habits can provide direction as the City of Ramsey moves forward with strategies to attract types of retail that will be most successful in the community.
0 500 1,000 1,500 2,000 2,500 3,000 3,500 4,000 4,500
Under 5 years
5-9 years
10-14 years
15-17 years
18-24 years
25-34 years
35-44 years
45-54 years
55-64 years
65-74 years
75-84 years
Age of Ramsey Residents
Source: MetCouncil Community Profile
Age of Ramsey Residents
Housing Units & Households - Ramsey’s population and household projected growth shows a steadily growing consumer market. A notably high percentage of home-ownership indicates stability and consistency in consumer spending. As Ramsey continues to construct more housing, the number of households within the market area will increase, making Ramsey more attractive to potential retailers.
89.10%
0
68.30%
10.90%
0
31.70%
0% 10% 20% 30% 40% 50% 60% 70% 80% 90% 100%
Owned and Rental Housing
Owner-Occupied Units Renter-Occupied Units
Twin Cities Region
City of Ramsey
Retail markets are often analyzed by milage or drive time from a specific commerical node. Ramsey has had multiple market analyses completed previously, and has not found these
measurements to be effective for understanding the market in regards to retail recruitment. Recently, emphasis has been placed on average daily traffic counts, something Ramsey is striving to increase. Measuring or analyzing traffic counts was not within the scope of this project, however could impact the ability to attract retail, alongside Ramsey's increasing population, housing density and maintaining an above average median income.
Demographics
10 miles
5 miles
3miles
1
mile

Surviving the Retail ApocalypseCharting the Future of Retail in Ramsey 5
PA5211: Land Use Planning / Instructor: Fernando Burga PhD. Olivia Boerschinger, Joshua Pansch, Matthew Lupini
Branding a Unique Retail IdentityRamsey faces numerous challenges in bringing successful retail to the city. This factor can be seen through the city's lack of a retail identity. The creation of a retail identity for Ramsey will give character to existing retail in the city, and create a more specific framework for future development.
The creation of the "COR" brand in Ramsey is a step in the right direction, but we believe the city should take this brand to the next level and expand Ramsey's identity to access its green space and abundance of available land that make it a unique area in the Twin Cities. Next, we discuss a retail development strategy focused on developing Ramsey's identity through a brick-and-mortar space.
Branding a city does not come solely from the design of a logo or in the creation of a slogan, rather it involves the residents of the city. The Ramsey city government should effectively tap into the ideas and talents of its populace to serve as ambassadors for and contribute to the development of the "Ramsey Brand".
A Ramsey Brand Involves Residents
Ramsey has three key assets distinguishing it from other communities in the Twin Cities metro: its proximity to U.S. Highway 10 - a highway serving as the gateway to hunting and fishing grounds in Central and Northern Minnesota; its location along the Mississippi River and access to the resources the river offers; and an abundance of greenways, parks and undeveloped land.
A Ramsey Brand Includes Cultivating Assets
Branding can transform a city into a place where people want to live, work and play. A strong retail identity is especially vital when vying with other markets for attention in of attracting new businesses. The brand should be based on what assets a city already possesses, rather than what the city wants to become.
An example of successful city branding can be seen in Dubuque, Iowa - a city of approximately 60,000 along the Mississippi River lying on the border of Wisconsin, Illinois and Iowa. Dubuque was long a center of manufacturing and industry - a fact reflected in the character of its downtown architecture.
Due in part to the diversification of Dubuque's economy, the city had realized an expanding business climate - increasing its tax base and allowing city officials to focus on downtown redevelopment. This district was transformed from older and vacant buildings into revitalized retail, restaurant and living spaces that embraced the historic manufacturing identity of the city.
Downtown Dubuque
http://bit.ly/2AhhByE
Proposal: Mississippi Riverfront Retail NodeThis rendering illustrates one potential usefor the commercial zoning in Ramsey in accordance to the proposed outdoor recreation, retail identity for the city (see poster 8).
The natural character of Ramsey lends itself to retail themed around nature and in close proximity to it. Doing so merges shopping and nature in a way that provides an experience.4
2
53 6
1
1. Green space connected to retail node2. Restaurant with outdoor riverfront seating3. Gazebo connected to dock
4. Mississippi River5. Shoreline path6. Retail space with riverfront view
The branding of a community involves coordinated activity on the part of community members and the local government to attract potential "customers". Refocusing retail in Ramsey towards locally owned, outdoor activity-themed shopping will not only empower residents of the city who strongly identify with Ramsey's more rural character, but also attract passerby on U.S. Highway 10 who share those interests.
A Ramsey Brand Involves Outdoor Activities
Ramsey should use land currently zoned commercial to foster their new identity.The city's abundance of land will serve as a parallel to Dubque's manufacturing district: this open land will be key to creating an outdoor-oriented identity for Ramsey.
A Ramsey Brand Involves Linking Land Use to Brands
Strategy #1

Surviving the Retail ApocalypseCharting the Future of Retail in Ramsey 6
PA5211: Land Use Planning / Instructor: Fernando Burga PhD. Olivia Boerschinger, Joshua Pansch, Matthew Lupini
Using Existing Assets - Simplify the ProcessTo spur economic growth and encourage retail developmment Ramsey needs to identify and build on its existing assets, entrepreneurial potential and availability of space. By identifying the assets that offer the best opportunities for growth, it will be easier to develop and implement strategies to support them. How can Ramsey help future development?
Source: http://www.nwsbdc.org/
Use Small Business Development Centers Minnesota is home to nine Small Business Development Centers (SBDC), with Ramsey located between centers in St. Cloud and downtown Minneapolis. A SBDC can help new businesses at every step of the way, particularly those looking to turn a concept into a reality. Ramsey needs to encourage entrepreneurs to use existing centers for strategic planning, access to capital, and professional guidance and resources they can offer. The City of Ramsey could also invest in a staff position of Small Business Navigator to provide site specific resources and consultations with those looking to start a business.
Facilitate Adaptive Reuse of Vacant Land and BuildingsThe City of Ramsey has an opportunity to redefine retail for the community. By developing land or repurposing vacant space themselves, the City of Ramsey can create lower-risk, and lower-cost opportunities for entrepreneurs to utilize physical and social assets unique to Ramsey while promoting retail growth in the community. A successful model of this is the Midtown Global Market in Minneapolis. A variety of vendors are all present in a centralized location, promoting a family-friendly and walkable opportunity for residents to shop for many needs at once, creating a retail destination.
Simplify the ProcessMake it easier for interested businesses and developers to invest in the community in ways that support the community’s long-term priorities. Tactics to facilitate private-sector investment include streamlining the development process, providing technical assistance, and creating informational guides. Ramsey can create a COR/commercial development resource program that provides developers with an inventory of all the buildings in the retail nodes with information that helps encourage investment, including physical characteristics of buildings, rental rates, ownership, and design requirements.
Create a Collective VisionTo successfully develop the retail enconomy, Ramsey must engage residents, business owners, and other stakeholders to collectively develop a vision for the future. Stakeholder engagement helps ensure that plans reflect the community’s desires, needs, and goals and generates public support that can maintain momentum for sustainabily implementing changes and remain resilient for the future. Community-designed goals with supported plans encourage local action and help build in accountability in the process of accomplishing projects that align with long-term plans.
Strategy #2
Source: http://strib.mn/2ABNNvk
Source: http://bit.ly/2BTvD6G
Source: City of Ramsey COR Design Framework, City of Ramsey Economic Development Resource
Successful cities complement retail recruitment by emphasizing their existing assets and distinctive resources. This provides retail options for the community and builds a stronger sense of identity by embracing what Ramsey has to offer. In the next poster, we provide examples of ways Ramsey can redesign retail to embrace recreation and natural resources.

Surviving the Retail ApocalypseCharting the Future of Retail in Ramsey 7
PA5211: Land Use Planning / Instructor: Fernando Burga PhD. Olivia Boerschinger, Joshua Pansch, Matthew Lupini
Experience the Character of RamseyThe traditional retail format is changing. The way people experience stores and restaurants is tied to recreation and experiences that are important to shoppers. Ramsey has a landscape full of natural resources to explore. A retail market can be shaped around these resources through the creation of expos, recreational destinations and places to spend time with neighbors. Make Ramsey a place to remember.
Sunfish Canoe Rental
Mississippi River Bicycle Trail
Turn vacant space into welcoming places for neighbors to stay a while
Encourage development of destinations for outdoor enthusiasts
Create retail identity through outdoor expos and events
Vacant Retail Space
http://bit.ly/2hZidOf
Credit: Olivia Boerschinger
http://bit.ly/2hYvxCd
http://bit.ly/2jcAuL9http://bit.ly/2hnYFpk
http://bit.ly/2iJe4gX
• Canoe and boat expos• Bike or ski fest• Marathon or fundraising
activities
• Themed restaurants• Accessible and near trails• Amenities and benches around
city
• Coffee and sandwhich shops• Centrally located• Transit, available parking and
walkable
Outdoor Adventure Expo
Bike Friendly Lanesboro, MN
Inviting Coffee Shop
Proposals to attract retail must leverage the unique character of Ramsey. Centering the retail theme on the recreational activities around Ramsey can give people a reason to visit and stay for a while.
Bring Outdoor Enthusiasts to RamseyRamsey is setup to be the premier destination for outdoor recreation activities. A nearby major river, hunting land,and highway for cabin goers makes this location prime for people who love the outdoors in the Land of 10,000 lakes. This retail industry can thrive in this environment.
Independant and unique restaurants and coffee shops don’t need to be kept only in the city. Ramsey can be in a position to capture the thriving restaurant and coffee business that has many eager and young start-ups waiting for their opportunity. WIth the right resources and property, a new and hip set of restaurants can create the identiy Ramsey desires.
Enhance the JourneyUtilize the Mississippi River Bike Trail that goes right through the City of Ramsey. Lanesboro has captured tourism traffic for retail and is a destination for bicycle enthusiasists. Improvements in the MRT and bike trails through Ramsey will bring additional bicyclists and retailers will follow. Land use plans must be ready to take advantage of this opportunity.
Create Places to Relax
Strategy #3

Surviving the Retail ApocalypseCharting the Future of Retail in Ramsey 8
PA5211: Land Use Planning / Instructor: Fernando Burga PhD. Olivia Boerschinger, Joshua Pansch, Matthew Lupini
Ramsey’s main asset for future development is an abundance of land, but that benefit in its current state also represents the greatest obstacle. In the next poster, we will conclude by revisiting the retail trends we addressed, as well as connect the implications from our proposals to other features of Ramsey.
Existing Inventory & AssetsRamsey, with an abundance of land coupled with a lack of accessibility for shoppers, has had difficulty attracting “big-box” retailers. However, the City does possess a significant inventory of commercially designated land. To analyze this asset we propose the following questions:
1. Does the current inventory of retail and restaurants preclude future development?2. What is the character of the retail inventory in Ramsey?3. What can Ramsey offer to retailers that other communities in Anoka County and beyond cannot?
2. South of Highway 10
Barriers to Access: while the River characterizes this site, it presents a barrier in that the site cannot be accessed easily without the construction of a land bridge from the COR or a bridge over the River
Lacking Character: despite this site's potential, other retail along U.S. Highway 10 in Ramsey has struggled to develop consistent character in terms of its overall commercial offerings
DRAWBACKS
COR Proximity: this site lies just across U.S. Highway 10 from the COR, and thus can be developed in sync with the rest of this areaNatural Character: the site is bordered on the south by green space and the Mississippi, which provide significant landmarks around which retail may be developed
BENEFITS
The sites we have chosen for analysis below include two open parcels and one fully developed site.
Green shading on the map indicates parks and green spaces - we believe Ramsey should work to emphasize its natural character in future retail development.
The open sites (numbered 1 and 2) were chosen due to their proximity to the COR and to the Mississippi River. and the developed site (3) was chosen primarily because of its relative distance from the COR, as well as its location at a major intersection in Ramsey.
3. St. Francis - Bunker Lake Boulevard
Barriers to Access: while it is located at one of Ramsey's major intersections, vehicular traffic here is relatively low compared to most successful retail nodes - an issue the city must work to address throughout all of retail sites
Lacking Character: there is no common theme that flows throughout this node a as a whole, and there is some redundancy in the sort of retail that exists here
DRAWBACKS
COR Proximity: this node is relatively distant from the COR, but its variety of retail and level of activity shows that retail can thrive in Ramsey outside of the CORNatural Character: while this site is not as close to a river as others in Ramsey, it is proximate enough to both the Mississippi and Rum Rivers such that green space may serve as an asset for this node as well
BENEFITS
Barriers to Access: The River does not allow for easy access to this site, as there is no bridge, and the closest crossing from the south is no less than 10 minutes away by car
Lacking Character: the retail currently in the COR is significant and established, which runs the risk of redundancy in this site in terms of potential new retail
1. Armstrong BoulevardCOR Proximity: this site is located directly west of the COR and its numerous benefits,
including a large proportion of Ramsey's population and the North Star rail stop
Natural Character: the openness of this site, as well as its relative proximity to the Mississippi River, offers an opening for the development of a new retail character
BENEFITS
DRAWBACKS
Center of Ramsey (COR)
Commercial Zoned Land
Parks & Green Space
U.S. Highway 10
Legend
Ramsey Assets
1
2 3

Surviving the Retail ApocalypseCharting the Future of Retail in Ramsey 9
PA5211: Land Use Planning / Instructor: Fernando Burga PhD. Olivia Boerschinger, Joshua Pansch, Matthew Lupini
Conclusion and ConnectionsRamsey faces a unique set of challenges in their creation of a retail destination for the future. However, many of the problems in Ramsey can be similarly seen at a regional or national scale. Our proposed solutions attempt to address each general problem directly, in the context of Ramsey's current assets. In doing so, we believe, Ramsey will effectively become more competitive in attracting and retaining retailers.
Highway 10 represents a perfect opportunity to establish an identity for Ramsey that is evident immediately upon one's entrance into the city. Similar to our proposal, the "Gateway to Greater Minnesota" project calls for Ramsey to create an outdoor and natural resource themed identity; we believe this brand will effectively guide Ramsey's development in retail and beyond.
Successful small city retail development lies in the cultivation of existing assets and inventory, rather than attempting to attract larger national retailers (i.e. big-box retail). The "Talent & Tenacity" project calls for the establishment of a series of business incubators in Ramsey aimed at spurring development, a proposal we believe echoes our suggestion of entrepreneurial expansion.
Economic and land use tools may be used to incentivize retail that characterizes Ramsey in a new light. Through the centering of the theme of retail on outdoor and recreational activities, residents of Ramsey will see their interests manifested in the new character of retail, while passerby will have reason to stop and stay in the city itself.
Utilizing Existing Assets in Ramsey
Experiencing the Character of Ramsey
Branding a Unique Identity for Ramsey
http://bit.ly/2jhsQwo http://bit.ly/2nulCK5
Large open areas in Ramsey have been designated for commercial development. There are more than 50 shops and restaurants currently located across the city, but only a few are located in the COR area of Ramsey. To address this locational disparity, we propose:
Experiential Shopping
Ramsey initially reacted to market pressures by branding their downtown as the "COR". However, this represents only a small segment of available land in the city. Addressing the identified issues through our three proposed strategies will allow Ramsey to positively stand out from its competitors and attract retailers for the future.
Ramsey lies in an area that is surrounded by large retail nodes - Coon Rapids, Otsego and Anoka each have established markets that directly compete with Ramsey. To combat this uncannily large amount of local competition for Ramsey, we propose:
High Regional Competition
Globally, big-box retailers have been downsizing and closing stores for decades. Large shopping malls are no longer being built across suburban cities, and many more people are choosing to shop online. To confront this shifting direction in retail on a national scale, we propose:
Changing Global Retail
Conclusion
Talent & Tenacity: Goodwin, Wadsworth, Yoder

Prepared byGretchen Buechler, Tanner Hofer, Maureen Hoffman,
and Eric Van Oss
Students in PA 5511 Community Economic DevelopmentInstructor: Bob Streetar
Hubert H. Humphrey School of Public Affairs
Prepared in Collaboration with Patrick Brama
Assistant City Administrator and Economic Development ManagerCity of Ramsey
Business Incubators and the City of Ramsey: Preliminary Insights

TheprojectonwhichthisreportisbasedwascompletedincollaborationwiththeCityofRamseyaspartofthe2017–2018ResilientCommunitiesProject(RCP)partnership.RCPisaprogramattheUniversityofMinnesota’sCenterforUrbanandRegionalAffairs(CURA)thatconnectsUniversityfacultyandstudentswithMinnesotacommunitiestoaddressstrategicprojectsthatadvancelocalresilienceandsustainability.Thecontentsofthisreportrepresenttheviewsoftheauthors,anddonotnecessarilyreflectthoseofRCP,CURA,theRegentsoftheUniversityofMinnesota,ortheCityofRamsey.
ThisworkislicensedunderaCreativeCommonsAttribution-NonCommercial3.0UnportedLicense.Toviewacopyofthislicense,visitwww.creativecommons.org/licenses/by-nc/3.0/orsendalettertoCreativeCommons,444CastroStreet,
Suite900,MountainView,California,94041,USA.Anyreproduction,distribution,orderivativeuseofthisworkunderthislicensemustbeaccompaniedbythefollowingattribution:“ProducedbytheResilientCommunitiesProject(www.rcp.umn.edu)attheUniversityofMinnesota.ReproducedunderaCreativeCommonsAttribution-NonCommercial3.0UnportedLicense.”Thispublicationmaybeavailableinalternateformatsuponrequest.
ResilientCommunitiesProjectUniversityofMinnesota330HHHSPA301—19thAvenueSouthMinneapolis,Minnesota55455Phone:(612)625-7501E-mail:[email protected]:http://www.rcp.umn.edu
TheUniversityofMinnesotaiscommittedtothepolicythatallpersonsshallhaveequalaccesstoitsprograms,facilities,andemploymentwithoutregardtorace,color,creed,religion,nationalorigin,sex,age,maritalstatus,
disability,publicassistancestatus,veteranstatus,orsexualorientation.

Business Incubators and the City of RamseyPreliminary Insights
Prepared by Gretchen Buechler, Tanner Hofer, Maureen Hoffman, and Eric Van OssPA 5511 Community Economic DevelopmentHumphrey School of Public Affairs
Prepared for the City of Ramsey
Prepared in Partnership with the Resilient Communities Project

Business Incubators and the City of Ramsey 2
Table of Contents
Introduction............................................................................................................................................................
Background Information...................................................................................................................................... On Ramsey................................................................................................................................................ On Business Services................................................................................................................................. On Business Incubators............................................................................................................................ On Business Climate.................................................................................................................................
Case Studies............................................................................................................................................................ Government-Owned Incubators............................................................................................................ STEM-Based Incubators.......................................................................................................................... Nonprofit Managed Incubators............................................................................................................... Coworking Space......................................................................................................................................
Alternatives to Business Incubators...................................................................................................................... Workforce Pipeline................................................................................................................................... Craft District............................................................................................................................................. Artist Work Space..................................................................................................................................... Public Markets..........................................................................................................................................
Recommendations.................................................................................................................................................
Appendix................................................................................................................................................................. Appendix A............................................................................................................................................... Appendix B................................................................................................................................................
Works Cited............................................................................................................................................................
3
44455
67111417
2223232424
25
272931
33

Business Incubators and the City of Ramsey 3
Introduction
Business incubation is an innovative form of business development and growth. This approach can be interesting to city officials due to its novelty and visibility. However, business incubation programs and organizations are complex, and the pursuit of a business incubator requires a thorough study of real estate, industry and employment, existing services, business models, ROI analyses, and more. A business incubator is a potential complement to the City of Ramsey’s existing business retention and expansion programs focused on small business development and growth, but pursuing a business incubator model without robust research and planning may lead to an expensive mistake.
This report represents one of the preliminary steps for the City of Ramsey to explore the potential for business incubation services in the city. This report includes a review of existing business resources in the city, other business incubators in the state, successful business incubators across the country, and more. An audit of existing resources and services available to Ramsey businesses is provided to begin assessing the role that a business incubator could play in Ramsey. Examples of different types of successful incubators in the region and across the country are detailed to provide ideas for the potential form of a business incubator in Ramsey, including case studies on a nonprofit-managed incubator, a government-owned incubator, a STEM-focused incubator, and a coworking space. To complement this information on business incubators, examples of other innovative approaches to business attraction, development, and growth are provided as potential options for Ramsey, including workforce pipelines, craft districts, artist work spaces, and public markets. A review of business incubators in Minnesota is also provided for additional information and reference. This
information creates a foundation of understanding around business incubators for policymakers and city staff to begin a robust public policy discussion on the role that a business incubator could play in Ramsey. This report will conclude with recommendations for the next steps that the City of Ramsey should take in its pursuit of a business incubator for the city, including strategic planning actions and additional research.
This information creates a foundation of understanding around business incubators for policymakers and city staff to begin a robust public policy discussion on the role that a business incubator could play in Ramsey. This report will conclude with recommendations for the next steps that the City of Ramsey should take in its pursuit of a business incubator for the city, including strategic planning actions and additional research.
The scope of this report is limited to an assessment of business services and business incubators in the context of the City of Ramsey. This preliminary research performed for this report, which provides baseline information on services currently available in Ramsey and the types of services a business incubator could provide to Ramsey, is not sufficient to make a recommendation about a viable business incubator model in the City of Ramsey. We believe that a viable business incubator option exists for the City of Ramsey, and we hope that the information provided in this report provides the city with the information necessary to begin the search for that viable option. We recommend considering the information in this report in conjunction with Talent and Tenacity: Sparking an Incubator in Ramsey by Garth Wadsworth, Matthew Goodwin, and Amy Yoder, created for the City of Ramsey in PA 5211: Land Use Planning.

Business Incubators and the City of Ramsey 4
Background Information
On RamseyThe City of Ramsey is situated in the Twin Cities metropolitan area in a way that provides great benefits as well as challenges to its residents and businesses. The Northstar commuter rail to downtown Minneapolis stops in Ramsey, connecting the city to the metropolitan urban core. Highway 10, an important route connecting the Twin Cities to northern Minnesota, runs through Ramsey. A diverse range of housing options in the City of Ramsey is available for different types of households in the outer-ring suburbs. The manufacturing industry in Ramsey is strong, and the city’s commitment to economic development, particularly with importance of office parks, ensures a wide variety of commercial activity and a growing number of jobs available in the city. The Mississippi River and the Rum River provide natural resource and recreational amenities to the city. One of the greatest challenges for the City of Ramsey is attracting retail and restaurant services to the city.
On Business ServicesThere are a patchwork of business services available for small businesses in Ramsey. The City of Ramsey has an existing a business retention and expansion program, which includes business visits (goal of 24 visits annually); hosting the business expo, golf tournament, and networking events; and participating in the Anoka County broker event, Anoka Ramsey job fair, and MN Marketing Partnership. The city also has a robust set of marketing tools and financial incentives for attracting new development. Beyond city services and resources, there are a variety of organizations that provide assistance to Ramsey businesses, whether in making connections, providing loans, finding employees, and more. A comprehensive list of these organizations has been provided in Appendix A.
Source: City of Ramsey
Source: City of Ramsey

Business Incubators and the City of Ramsey 5
On Business ClimateRamsey has a reputation for being incredibly active with the local business community. City officials have fostered a strong business climate and outreach to stakeholders is robust. An interview with the President of the Anoka Area Chamber of Commerce Peter Turok revealed several important issues for the business climate in Ramsey. Ramsey has a need for more retail space, especially as it grows and becomes more of a regional hub for goods and services. Ramsey also has an already large manufacturing sector as an asset that can be strengthened and built upon. Additionally, the Anoka-Hennepin School District in conjunction with Anoka Technical College formed the Secondary Technical Education Program (STEP), which provides courses in advanced machining and engineering for college credit. The city could tap into this existing resource. The largest issue facing the Anoka-wide business community is a shortage of labor, both for service positions as well as technical jobs. Both retail and manufacturing industries are expected to grow in Anok, but filling many of these positions will be increasingly difficult in the future. Any city business development initiative, in addition to providing commercial space, should strongly consider including workforce development and training components. A major barrier to business expansion in the future will be a lack of access to qualified workers.
Background Information
On Business IncubatorsA business incubator can be a lot of different things. At its most basic definition, a business incubator is an organization or a program that helps develop new or small businesses. Usually, a business incubator provides services or resources to its users, although the level and intensity of this support can vary widely from incubator to incubator. Business incubators may provide one or more of the following: communal working space, equipment, expertise, mentoring, apprenticeships, funding, programming and events, and more. Business incubators can be run for-profit, by nonprofits, or by public institutions. Business incubators can inhabit physical space or can be a network of resources. Business incubators are an extremely flexible way of servicing businesses in a community, which is both a benefit and a challenge. The flexibility of business incubators means that there is almost certainly some arrangement of a business incubator that can successfully support the business community of an area. The flexibility of business incubators also means that there is no one-size-fits-all approach that can be seamlessly applied to a unique area. A business incubator must be conceptualized in the specific context of an area, its industries, its workforce, its supporting organizations, and more.

Business Incubators and the City of Ramsey 6
Case Studies
Prepared by Gretchen Buechler, Tanner Hofer , Maureen Hoffman, and Eric Van OssPA 5511 Community Economic DevelopmentHumphrey School of Public Affairs
Prepared for the City of Ramsey
Prepared in Partnership with the Resilient Communities Project
In this section, four different business incubators are described in case studies. These case studies describe the context around the initial creation of the incubator, how the incubator is run, the outcomes of the incubator, and how Ramsey might consider the role of this incubator in their community. Each of these incubators is representative of a different approach to business incubation, from government-owned, to STEM-based, to nonprofit-managed, to coworking. These case studies do not represent the world of business incubators. These types of incubators were chosen for their applicability to the specific context of Ramsey. For additional reference, a comprehensive list and brief description of business incubators in the State of Minnesota is provided in Appendix B.

Business Incubators and the City of Ramsey 7
Government-Owned Business Incubators
Incubators are typically associated with technology firms, and there are many such incubators around the country. The concept of the incubator is perhaps more applicable and important to the manufacturing industry. Unlike technology companies, which often require relatively modest infrastructure, manufacturing startups require significantly different and more expensive resources to produce products. The cost of manufacturing equipment and technology can be a significant barrier to any manufacturing startup. By providing not only the usual incubator benefits such as office space and the ability to network, manufacturing incubators can offer tools, machinery and other benefits that would otherwise be too expensive or difficult for a single startup to purchase.
Manufacturing incubators provide a range of important services to the industry, including:• Access to common tools and infrastructure: For most startups, the ability to access tools and a facility
would be impossible on their own. Making those tools available as a shared service to multiple startups, economies of scale are derived, and they become affordable and usable.
• Collaboration and sharing: The manufacturing industry is fast paced and experiences lots of technological changes. Many startups are finding ways to produce goods in ways that would have been unthinkable even a few years ago. When those new ideas and technologies come together within an incubator, collaboration among firms is facilitated.
• Networking: The establishment of business relationships and partnerships is important to the success of startups, and can lead greater innovation over time. Incubators bring like-minded startups together, and make those kinds of connections possible.
• Business infrastructure: Like any startup, manufacturing startups require common business infrastructure, like office space, meeting rooms, phones and internet access. Incubator environments provide all of that to their startups, for comparatively little cost.
Sometimes manufacturing incubators are associated with a University or Technical College, using it as a resource to connect its students and faculty with local businesses and their resources. Additionally, the manufacturing sector can provide pre-apprentice and apprenticeship workforce training for students and create a workforce pipeline. The Chippewa Valley Innovation Center is an example of a manufacturing innovation center located in Wisconsin. Information on Chippewa Valley Innovation Center was derived from research on their website: https://chippewavalleyinnovationcenter.org.

Business Incubators and the City of Ramsey 8
Chippewa Valley Innovation Center
Government-Owned Business Incubators
The Chippewa Valley Innovation Center (CVIC) is located in Eau Claire, Wisconsin. It formed a collaborative effort between the Chippewa and Eau Claire counties, and the City of Eau Claire thirty years ago in 1986. It was formed in response to a growing need within the Chippewa Valley for low cost, appropriately sized space for businesses in the early stages of development. Today, the facility continues to serve as an incubation center for manufacturing and service-related businesses who are in the transitional stages of going from a new business to an established business.
In terms of organization and management, the Chippewa Valley Innovation Center is a 501(c)3 organization. Donations to the CVIC are tax-deductible to the full extent of the law. The facility is managed by the Eau Claire Area Economic Development Corporation and additionally has a board of 8 directors.
The Chippewa Valley Innovation Center encourages new and emerging entrepreneurial businesses to utilize local community resources. Features and benefits of the CVIC include warehouse/manufacturing space, managerial support, technical assistance, and access to financial programs. Businesses apply to become a tenant to the CVIC, and applications are reviewed in the order that they come in. Decisions are based on eligibility and available space in the incubation center. Candidates should be a light manufacturing, value-added, or service related business and a business plan is required within 90 of occupancy (business plan assistance is available).
Once accepted, tenants are able to rent out the amount of manufacturing and/or office space they need for up to three years. Each year, rent is increased slightly until tenants are paying market values for their space. During a business’s time in the CVIC, they have access to programs and assistance to help your company transition from a new start-up to an established business. Tenants graduate from CVIC when they outgrow their space or after 3 years – whichever happens first. Because of the incremental increases in rent, at the end of the three years, graduates are able to relocate and pay market price for their new spaces without experiencing a significant increase in overhead costs. In addition to physical space, businesses have access to local economic development agencies including UW-Eau Claire Center Business Solutions, UW-Stout Discover Center, Chippewa Valley Technical College, and Northwest Wisconsin Manufacturing Outreach Center (NWMOC).
This facility has an emphasis on manufacturing centered companies and homegrown local businesses. On the center’s website, there are several success stories of companies that have grown from the innovation center and established themselves in the community. Currently, over 15 businesses have been jumpstarted by the center. A study of the businesses that have graduated from this incubator was performed, determining there has been $28 million being spent from that business in buying real estate, equipment, etc. Additionally, there has been an annual salary of about $18 million. Advance Laser Machining, is a highlighted success story. It went from one employee in 1996 to 120 employees with over 20 million in sales today.

Business Incubators and the City of Ramsey 9
Government-Owned Business Incubators
Space Pricing Amenities Location Technical Assistance and Business Support
• 8 bays at 1,250 square feet
• 1 bay at 1,740 square feet
• 4 offices at 250 square feet
• 2 offices at 213 square feet
• 2 offices at 150 square feet
• 1 office at 480 square feet
• 440 Amp / 3 phase power
• 1 loading dock – 9×9 overhead door
• 2 10×10 overhead doors at grade level
• Ceiling height: 17’ at eaves – 20’ at center
• 32 parking spaces available and street parking
Manufacturing:• $2.60 per square foot – Year 1• $2.85 per square foot – Year 2• $3.10 per square foot – Year 3Office:• $4.35 per square foot• $8.00 per square foot (Office space rental only)Common areas for the use of all tenants are the lunchroom, restrooms, loading docks and overhead doors
Conference room available at no charge
Heated manufacturing areas
Shared amenities: forklift, pallet jack and compressed air
Office spaces are furnished with heat, power, internet and air conditioning
Maintenance includes lawn care, snow removal, garbage collection and building repair
Electricity is a tenant expense
• Common areas for the use of all tenants are the lunchroom, restrooms, loading docks and overhead doors
• Conference room available at no charge
• Heated manufacturing areas
• Shared amenities: forklift, pallet jack and compressed air
• Office spaces are furnished with heat, power, internet and air conditioning
• Maintenance includes lawn care, snow removal, garbage collection and building repair
• Electricity is a tenant expense
• Less than one mile to Hwy 53 with quick access to I-94 and Hwy 29
• Less than one mile to the Chippewa Valley Regional Airport
• Local economic development agencies
• UW-Eau Claire Center Business Solutions
• UW-Stout Discover Center
• Chippewa Valley Technical College
• Northwest Wisconsin
Table 1: A breakdown of the Chippewa Valley Innovation Center’s space, pricing, amenities location, and support.
Source: https://chippewavalleyinnovationcenter.org

Business Incubators and the City of Ramsey 10
Government-Owned Business Incubators
Manufacturing Incubators in RamseyGiven Ramsey’s clustering and established presence of manufacturing businesses, a manufacturing innovation hub could fit. Startup businesses would have access to a strong and established manufacturing business community and could leverage those relationships. Additionally, the skill set of the existing workforce would compliment the needs of manufacturing startups, especially as they begin to grow and expand. The emphasis on homegrown “garage” type startups happens organically already in Ramsey, and a manufacturing innovation center could further speed and nurture that entrepreneurship. A potential drawback could be the absence of a community or technical college to provide expertise, businesses assistance, and potential apprenticeships. Ramsey could remediate this by drawing from other technical schools within the proximity of Anoka County.

Business Incubators and the City of Ramsey 11
STEM-Based Incubators
Incubators can take many forms, and one example is an office space dedicated to the study of a specific field like the North Dakota State University (NDSU) Research and Technology Park. Information on NDSU Research and Technology Park was derived from research on their website: https://www.ndsuresearchpark.com/
NDSU Research and Technology ParkThe NDSU Research and Technology Park is located in Fargo, North Dakota and operates in conjunction with the NDSU. The park specializes in STEM (science, technology, engineering, and math) fields. Their vision is to “serve as a catalyst for innovation in science and technology leading to discoveries that contribute to North Dakota’s economic development.” The Park’s dedication to technology is a unique asset that has helped the Park thrive in the market. By fostering technologically focused initiatives, the park has been able to better provide for both NDSU and their tenants.
The NDSU Research and Technology Park is separated into two distinct parts, the Park and the Incubator. The park hosts four main tenants. These tenants are Appareo, an electronic and software manufacturer; Candlewood Suites, a hotel chain; John Deere, a manufacturer of tractors and other farming equipment; and NDSU, which holds offices and some land in reserve. The incubator currently serves eighteen different businesses. These businesses include:
Bank of North DakotaBobcat
C2renewDiscovery Express
DoosanElinor
farmQAField of View
Intelligent MaltMCP Networks
OmniByte TechnologyOPGO Marketing
Probitas promotionsRed diamond coatings
RenuvixSatshot
Small Business Development Center of North Dakota
Summers

Business Incubators and the City of Ramsey 12
STEM-Based Incubators
These businesses within the incubator range from marketing companies to agricultural technology creation firms to agricultural harvesting and processing companies. Most of these companies specialize in fields relating to STEM, while some provide support to that sector. Within the STEM field, the Park has a specialty in agriculture-related fields. Part of this comes from the long-standing tradition of NDSU as being a school that has a large agricultural program. The park operates on roughly 24 acres of open land that can be utilized by tenants for research and development of software and hardware.
To be part of the Research Park, NDSU requires tenants to meet a set of criteria in line with the beliefs of the Park. The first item of this criteria is to “Be involved in the advancement and development of new technology.” The Park is dedicated to advancing technology, and the Park expects this of the tenants as well. The second criteria is, “Be willing to establish a working relationship with North Dakota State University.” This criteria is essential to the workings of the Park and allows the Park to stipulate that its tenants work in tandem and add to what already exists within NDSU. The Park itself gives the following examples as to how a tenant in the Park may work with NDSU:
• “Jointly funded research & development projects and technology transfer activities
• Create partnerships to enhance the business environment dedicated to applied research and technological discovery for the benefit of NDSU’s faculty, staff and students
• Facilitate the transfer and application of scientific research for North Dakota State University and to the global economy and to the global economy. ”
The third criteria has to do with the allowed industries within the park. The fields allowed within the Park include, “material sciences, biosciences and life technology, information technology, nanotechnology, and advanced manufacturing and sensors/micro-electronics.” The Park is not completely strict on these requirements. They allow a “Center of Excellence” that have a clear concentration and a measure of knowledge and expertise which meet a “criteria outlined by the North Dakota State Board of Higher Education.” The final criteria that the Park holds is that prospective tenants are reviewed by an incubator advisory committee. While not explicitly stated, the Park notes that “emphasis is given to North Dakota State University patented and licensed technology.” In tandem with this, all prospective tenants and companies are required to work within the Park’s guidelines and are subject to final approval by the NDSU President.
The Technology Incubator works to encourage entrepreneurs to foster innovation and encourage ingenuity. The Incubator side of the NDSU Research and Technology Park is more focused on general business facilitations, similar to those that would be found in a cooperative work space. The incubator offers “state-of-the-art” benefits that allow their tenants to present a professional business appearance. The Incubator is made of a 50,000
Source: https://www.ndsuresearchpark.com/available-space/open-land/

Business Incubators and the City of Ramsey 13
STEM-Based Incubators
square foot facility and is adjacent to the Park referenced earlier and the NDSU campus. The Incubator also boasts access to both an international airport and major interstate highways within five minutes of NDSU’s campus. The Incubator hosts both newly found entrepreneurs and experienced business people. The Incubator provides:
• One gigabit service • Shared printers, copiers, scanners, and fax• Wet lab/dry lab space• Manufacturing space• Customizable tenant space• Shared production areas• Executive boardroom
These office amenities are available to all tenants within the Incubator. The Incubator also provides professional services that include:
• Client networking• Coaching and mentoring• Fostering university relationships• Financing and providing venture capital• Craft student initiatives• Comprehensive business assistance• Fostering educational events and forums
The Park and Incubator hold multiple partnerships with various forms of financial aid through an assortment of governmental bodies and companies. The NDSU Research and Technology Park acknowledges that capital is one of the most limiting and hard to access assets within starting a business. For this reason, it is able and willing to help its tenants secure the capital necessary for prospective tenants. The NDSU Research and Technology Park have graduated four tenants. These tenants include: Appareo, Intelligent InSites, Myriad Mobile, and Pedigree Technologies.
Specialized Incubators in RamseyThe proposed location for the business incubator in Ramsey is located in the COR development area. The specific location is located next to multiple empty lots. The lesson that should be learned from the NDSU Research and Technology Park is the possibility of a specialized form of business incubator.
According to reports generated through Esri Business Summary, 32.2% of the businesses in Ramsey are in the services category . It is difficult to determine which sub-industry makes up the largest part of the service industry because the largest section (21.6%) is “other services”. Additionally, the construction industry and manufacturing industry compose 12.1% and 11.5%, respectively. This information can be used to direct a potential business incubator in the City of Ramsey. Similar to NDSU Research and Technology Park specialization in the STEM field, Ramsey could form a business incubator that is focused on the service industry, construction, or manufacturing. Ramsey’s incubator should also allow for accessory uses that are beneficial to the main focus of the incubator. Ramsey could provide open land for the use of testing and development by acquiring one of the nearby parcels that are vacant. This would likely be most helpful for a construction based incubator, but could have varying uses for other types of incubators.

Business Incubators and the City of Ramsey 14
Nonprofit-Managed Incubators
Business incubators can be for-profit or nonprofit. Both offer advantages and disadvantages to entrepreneurs. Nonprofit incubators typically acquire funds from cities, a chamber of commerce, and/or universities. They can also be standalone from universities or cities, garnering their own funding sources through grants. Nonprofit incubators ask for little from their startups, typically only asking for future mentoring, data tracking, and fundraising consideration. A nonprofit incubator’s goal is usually focused on creating jobs and promoting economic development in their region. IncubatorWorks is an example of a nonprofit run incubator. It has two locations, both in the Southern Tier region of the State of New York. IncubatorWorks’ mission is to “promote economic development in the Southern Tier of New York through supporting entrepreneurial growth and development of businesses and their creation of jobs.” Information on IncubatorWorks was derived from an interview with their project manager, Ashleigh Madison, an research on their website: http://www.incubatorworks.org/.
IncubatorWorksIncubatorWorks is a nonprofit standalone incubator that is thirty years old. It has locations in Alfred, New York and Corning, New York, which are approximately 60 miles apart. Corning and Alfred both have a long manufacturing history, which influenced the focus of the two incubators. Both locations focus on light manufacturing and clean technology. They serve a broad range of low technology to high technology businesses ranging from candle-making, to clothing, to fiber optics. The two incubators have a total of 70,000 square feet. The case study will focus predominantly on the incubator located in Corning, New York.
IncubatorWorks is unique because it is a stand alone incubator, meaning it is unaffiliated with any college or university. They employ three full time and four part time staff. The three full time staff have diverse backgrounds and experiences that make them well suited for the broad range of startups they serve. The executive director is a CPA who has experience with startup financials. She focuses mainly on providing financial advice and support. The co-executive director has experience with science and business. This background gives him the ability to advise on a broad range of manufacturing issues. The program manager has a background in marketing and business. She manages client and helps startups with marketing. The program manager also identified groups in the region receive the least amount of support to create systems for each including: the Veterans Entrepreneurship Group and Elmyria Entrepreneurs.

Business Incubators and the City of Ramsey 15
Nonprofit-Managed Incubators
Both are held in different facilities and have different leaders than staff at IncubatorWorks. Each group helps to further the mission of IncubatorWorks, while remaining separate entities.
Corning, New York is a small town located in the Southern Tier. The town has a rich industrial past, centering around glass. IncubatorWorks capitalized on this history by focusing on light industry and technology. To cater to these industries, they offer wet/dry labs, and machinery in their facility. Other than providing physical space they offer a number of other services for those who just have an idea, those who just started their business, and to those who have a manufacturing space but don’t know how to propel forward. They provide virtual client services to help the client create business plans to procure funding from financial institutions. For clients who are established, but need help moving forward they can help to connect them to the right people, from different manufacturers, local industrial development agencies, to the Regional Economic Development and Energy Corporation.
The Corning and Alfred IncubatorWorks are part of two different startup networks, helping expand the services it can offer to its clients. The Corning location is part of the Southern Tier Startup Alliance (STSA) is a member organization of business incubators. STSA shares a similar goal with IncubatorWorks, to increase the number of jobs in the region by supporting scalable businesses, to help diversify and strengthen the economy. It is based out of Ithaca, New York and is composed of fifty-five different startups. Member incubators provide support and assistance to one another. For example, McGovern Center at Cornell University provides IncubatorWorks’ clients with experienced entrepreneurs in residence. These entrepreneurs give advice and educational talks to IncubatorWorks’
to IncubaorWorks’ clients. The Alfred location is part of the Western Innovation Network (WIN). WIN is located at the University of Buffalo, and is a collaborative effort of business incubators to expands entrepreneurial services, helps startups, and grows wealth in the region. They encourage incubators to work together to help their ventures grow quickly, and achieve greater profitability. WIN provides IncubatorWorks’ clients with more resources and offers a unique set of tax incentives for companies in their earliest stages.
IncubatorWorks has a vast clientele ranging from low to high technology. To fit the needs of its client it has contracts ranging from a five year lease (typically high technology), only $50 - $200 for virtual consultations, and to just meeting with the client a couple of times to determine if they can help their business. When leasing out space they can tailor to the clients needs and make a month to month agreement or up to five years in residence.
Since IncubatorWorks is a nonprofit and stands alone from a university, it acquires most of its funding from grants. For additional funding they have anchor tenants, similar to a mall, in their facility. An anchor tenant has a more permanent lease and, hopefully, brings in more business. IncubatorWorks’ anchor tenant is Corning Incorporated. Corning Incorporated is a manufacturer of glass, ceramics, and related materials, primarily for industrial and scientific applications.
IncubatorWorks defines success as helping a startup to achieve their goals, which could range from helping them to access funding to open their own manufacturing space. They are currently gathering the data, but to their best estimates they have had 30 total startups graduate from each incubator location.

Business Incubators and the City of Ramsey 16
Nonprofit-Managed Incubators
This is less when compared to university affiliated and for-profit incubators. Since IncubatorWorks is a nonprofit, they can spend more time with individual startups to ensure they give them the tools to succeed upon graduation. IncubatorWorks’ mission to bring in businesses and entrepreneurs to the Southern Tier. They are currently gathering the metrics to see how many businesses became established within the region after incubating. A well known successful business that graduated from IncubatorWorks and stayed in the region is Micatu.
Micatu provides next generation measurement capabilities in the areas of smart grid, wind, power distribution and condition monitoring. When Micatu moved into the incubator it grew from two to fifteen employees. When it graduated the incubator it remained in Corning, and grew from fifteen to forty-five employees.
Nonprofit Incubators in RamseyThis type of incubator offers a number of advantages. They offer offices, labs, flexible manufacturing spaces, and supporting services with affordable, short-term leases. IncubatorWorks links the startups to a comprehensive network of support. The mentoring program helps to guide the startups through the process of establishing and operating their new business the right way. Tenants in the incubator may also qualify for StartUp NY tax benefits, meaning no corporate tax, no property tax, and no sales tax for ten years. IncubatorWorks participates in business competitions that help to draw in more talent to the area. Startups do not have to be from the area to enter. The winner of the competition wins a large sum of money to invest in their startup. Micatu was a past winner of one of the competitions and has grown substantially since its graduation from the incubator.
This incubator models also offers several disadvantages. Since, IncubatorWorks is a standalone nonprofit, it has less overall financing and cannot support more staff. For this reason, they also cannot handle as many startups. University affiliated and for-profit incubators are able to service more startups at one time.
The City of Ramsey’s main goal is to support local entrepreneurs and to maintain their business in Ramsey. A nonprofit model supports this goal more when compared to a for profit incubator. IncubatorWorks model defines a startup staying in the region as a key determinant of their success. Ramsey also shares similarities with the City of Corning and Alfred. Both cities are not, in themselves major areas, but are located in/near major metropolitans. Ramsey can take advantage of startup networks in their region to help offer their clients more support. While Ramsey’s incubator, will most likely not be affiliated with a University it can look into partnering with nearby trade schools to provide startups with more technical support. To help with initial costs, Ramsey can open its proposed location to anchor tenants, similar to IncubatorWorks. The anchor tenants should share a similar focus to the new incubator.

Business Incubators and the City of Ramsey 17
Coworking Space
When considering business incubators, coworking may not immediately come to mind. However, coworking can provide a valuable business service to a community while requiring relatively little energy and investment from the operator. On the spectrum of business incubators, coworking space is the most hands-off. Coworking space seeks only to provide working space for entrepreneurs and other professionals rather than attempting to intensively develop businesses and individuals. While coworking may evoke a particular image, coworking does not mean any one thing. Most coworking spaces are membership-based and provide communal working space, but those are often the only things that coworking spaces share in common. Coworking space can be shared working space or dedicated offices. It can be catered to particular industries such as professional, light manufacturing, or food production or to particular types of workers such as freelancers, entrepreneurs, or remote workers. Coworking spaces may provide varying levels of service to their members, from simply providing a space to work to providing programming, equipment, sustenance, and other tools.
Coworking space has many advantages for both its members and the service provider. Coworking space can be advantageous for entrepreneurs and start-up companies for whom signing a long-term lease of their own is not feasible. Coworking space can also be advantageous for individuals who work from home but seek a more productive or dedicated space, such as freelancers or remote workers. Coworking space provides the opportunity for different professionals to network and collaborate and provides a professional place to host meetings. Depending on the amount of service provided to members, coworking space can also be relatively inexpensive to operate compared to other types of business incubators. A coworking membership is often more expensive per square foot than a private lease, but coworking space usually does not require a long-term commitment like a private lease and also provides the additional benefits outlined above.
Despite all these benefits, coworking space can be perceived as trendy and may attract only a particular type of worker. Additionally, coworking does very little to support the success of its members and does not necessarily encourage its members to expand and move on. Nonetheless, coworking is a flexible concept, and coworking space can be tailored to the needs of the area and people it is trying to serve to capitalize on the advantages and reduce the disadvantages. The Commons is an example of a coworking space located in two suburbs outside the Twin Cities. Information on the Commons was derived from an inerview with Peggy Stefan, Co-Owner, an from research on their website: http://www.thecommonswp.com/

Business Incubators and the City of Ramsey 18
The CommonsThe Commons is a shared workspace company with two locations: one in Minnetonka and one in Excelsior. Their Minnetonka space is primarily private offices, while their Excelsior space is primarily coworking space. The Commons first opened in 2012, and seeks to serve individuals and businesses who require either a permanent space to work from or a space to use on occasion. The Commons does not specialize in any particular industry, although the services they provide meet the basic needs of professional work.
The Commons offers the basic provisions of every professional coworking space, including shared working space (non-dedicated areas and desks), dedicated desks and offices, and meeting/event space. Their meeting rooms are equipped with whiteboards, TVs, arrangeable furniture, and video/teleconferencing equipment. They also provide on-site staff to greet members and their guests, printing and copy services, private telephone rooms, and free coffee. The Commons periodically organizes programming such as personal finance seminars, TedX salons, “Collaborative Conversations” time, “Common Connections” time, Toastmasters, and happy hours
The Commons does not brand themselves the same way as many of the other coworking spaces in the Twin Cities. Often, coworking space seems geared toward millennial workers. They may offer additional “luxury” amenities such as bike storage, fitness centers, or full cafes in order to align themselves with start-up and downtown culture. Instead of this approach, The Commons makes itself a relatively blank slate in order to attract a diverse set of members and allow their members to define themselves. In a similar vein,
The Reserve in Edina (previously known as Cafe Inc.) described their approach to coworking space as providing “pro-working not coworking,” creating a more traditional take on the general perception of coworking. Despite their differences, the owner of The Commons suggests that the spirit of coworking remains consistent across different spaces.
The Commons does not target any particular type of worker or type of company. They invest very little advertising and rely on word of mouth to attract new members. The owner expressed a lack of tangible return on investment for advertising expenses and has attributed the growth of The Commons membership to more organic factors. Their Excelsior location receives a fair amount of foot traffic being near the post office and main street, which helps increase awareness of the space. They also allow the space be used for public events and business association meetings which helps to increase awareness. The Commons can also rely, in part, on being one of the few suburban coworking spaces available in the Twin Cities for people who are not interested in working downtown. With this approach to recruitment, The Commons has attracted about half remote workers and half small businesses or entrepreneurs. While the owner is interested in pursuing some directed prospecting for new members using LinkedIn, business listings, and other resources, they have not yet taken this approach.
The Commons claims to have relatively high retention of its members. They believe that their suburban location attracts a slightly older member who is looking for a more permanent space. While not providing direct business development assistance like a traditional incubator, coworking space does have an incentive to support the success of their members so that they continue to be members.
Coworking Space

Business Incubators and the City of Ramsey 19
Most of their departing members, they say, leave because they get a new job. Although, some of their entrepreneur members have left to inhabit their own space due to growth of their business.
The Commons originally set a goal of four times as many members as they had capacity for at any given time (the gym membership model). This number proved to be too ambitious, but they found their break-even point within two years of opening. Most members of The Commons are not in everyday, and some may only be seen once every few weeks. The Commons does not have a cap for membership. The owner claims that, should membership dramatically increase, members would self-select and cancel their membership if they felt there were too many people using the space.
The Commons pricing schedule (as of October 2017) is described in the table below. All memberships (not including non-member options) require a $100 sign-up fee and a 90-day commitment before the membership becomes month-to-month. The Commons provides a variety of membership options, ranging from memberships with 8 AM -5 PM access on working days to 24/7 access to use of meeting rooms only. This flexibility in their membership options has allowed them to attract a wider variety of members.
Coworking Space

Business Incubators and the City of Ramsey 20
Membership Price per Month Add-ons and DealsCoworking• Unlimited use of common space, 8am-5pm
Monday-Friday • 4 hours of meeting room space per month
$200 $60/month for extended hours access, 6am-10:30pm 7 days/week
Dedicated Desk• Semi-private, branded personal space• Unlimited use of common space, 6am-
10:30pm 7 days/week• 6 hours of meeting room space per month
$390 N/A
Private Office• Private, branded personal space• Unlimited use of common space, 6am-
10:30pm 7 days/week
$500-$900, de-pending on the office
Discounted price for 6-month or 12-month commitment
inNetwork• Access to programming and events
$25 N/A
inCommons• Use of a meeting room for 1 2-hour meeting/
month OR 1 2-hour meeting/week, 8am-5pm Monday-Friday
$180 or $290 $15/month for extended hours access, 6am-10:30pm 7 days/week
inVirtual• Use of the address and mailbox
$35 N/A
Coworking SpaceTable 2: A breakdown of the Commons’ membership pricing and services

Business Incubators and the City of Ramsey 21
Coworking Space
Non-Membership Options Price per Month Add-ons and DealsHot Seat• Non-member hourly use of the common
space, 8am-5pm Monday-Friday
$5/hour N/A
Day Pass• Non-member daily use of the common space,
8am-5pm Monday-Friday
$30/day N/A
Punch Card• Non-member daily use of the common space,
8am-5pm Monday-Friday
$100/5 days N/A
Coworking in RamseyCoworking is a flexible concept that can be used to fit the needs of Ramsey residents and businesses, while meeting the government’s capacity to provide services to its residents. Beyond the initial investment required to create the coworking space, the city can adjust the amount and intensity of the services it provides to its members based on the resources it has available. Providing a coworking space in Ramsey may also fill a gap in the market for Ramsey residents and businesses as well as residents and businesses from surrounding communities. Most coworking space in the Twin Cities is concentrated in Minneapolis and St. Paul, although several coworking spaces have recently become available in suburban areas. The closest coworking space to Ramsey is The Commons Minnetonka location, about 30 miles away. The City of Ramsey may be able to capitalize on this market while also providing a service to the city.
Most coworking spaces are geared toward a general professional worker, but there are many different ways to approach coworking space. For example, some coworking spaces cater to a specific industry or craft. DevJam is a software development coworking and innovation space in South Minneapolis. GIA Kitchen, The Good Acre, and other commercial kitchen space in the Twin Cities are available for use on an hourly or monthly basis. There are several member-based workshops in the Twin Cities, including MPLS MAKE and Nordeast Makers. In the case of an industry-specific coworking space, more specific services, equipment, and programming can be provided. When a coworking space does not target a specific industry, there is less opportunity to provide industry-specific business development assistance to its members. There may be a critical mass of residents and businesses in Ramsey in need of a specific type of workspace, and Ramsey could tailor a coworking space to provide that.
Even if simply providing the bare minimum coworking space for professional workers, a coworking space in Ramsey would provide an opportunity for remote workers and small businesses from the northwest outer-ring suburbs to stay in the area instead of traveling to the city or staying in their homes. This can create positive externalities for the city. For example, people working in Ramsey may be more likely to patronize other Ramsey businesses like restaurants, auto services, clinics, printing services, and more.
Table 3: A breakdown of the Commons’ non-membership pricing and services

Business Incubators and the City of Ramsey 22
Prepared by Gretchen Buechler, Tanner Hofer , Maureen Hoffman, and Eric Van OssPA 5511 Community Economic DevelopmentHumphrey School of Public Affairs
Prepared for the City of Ramsey
Prepared in Partnership with the Resilient Communities Project
This section provides an overview of several other forms of business development and growth beyond business incubators, including a workforce pipeline, a craft district, artist work space, and public markets. These alternatives are provided to ensure that the City of Ramsey considers the roles that other innovative forms of business development could play in the city. Business incubators are one approach but not the only approach.
Alternatives to Business Incubators

Business Incubators and the City of Ramsey 23
Alternatives to Business Incubators
Workforce PipelineThe space available to the City of Ramsey could be used to host a restaurant hub for the area. The 5,000 square feet of space would create a culinary gathering point for the community and act as a draw to residents from other areas. If developed as restaurant space, the City of Ramsey could take the project a step further and create a workforce pipeline in partnership with local schools. This serves the dual purpose of providing space for small businesses, while also providing those businesses with a skilled workforce in addition to employment opportunities for residents.
The Minnesota Chamber of Commerce created the Business Education Network and launched a pilot program in Brainerd aimed at providing skilled workers for the local hospitality industry. Local schools used ProStart, a program developed by the National Restaurant Association Educational Foundation focusing on practical curriculum and work experience. Starting with an overview of the industry, students will learn kitchen essentials, as well as critical management skills like communication and customer service. Students enrolled in Bridges ProStart classes have the ability to earn a certificate and receive an honor cord and special recognition at high school graduation. Each high school is matched up with chefs and managers from the area’s top hospitality businesses and Students work alongside a professional chef with the ultimate goal of permanent employment.
Cultivating existing space to an attraction with multiple restaurant startups would be a way to both promote entrepreneurship/small businesses in Ramsey and create a social gathering place for residents. Taking this concept a step further and pairing a restaurant incubator with a targeted workforce development strategy has the potential to create greater opportunities for resident, while also providing restaurant startups with a skilled workforce, better ensuring their economic success.
Craft DistrictAn alternative to an incubator Ramsey could explore is a craft district. The City of Duluth’s Lincoln Park neighborhood is a good example of a successful craft district. The Lincoln Park Craft District is an effort to rebrand the neighborhood as a collection of similar businesses whose mission is to also help revitalize the neighborhood. The City, nonprofits, and the private sector are working together towards accomplishing this goal. The neighborhood capitalized on its industrial working class history and cheap building space to lure in light manufacturing startups. The City launched a loan program that offers up to $50,000.00 in bridge financing to help startups rehabilitate the old buildings located in the Lincoln Park neighborhood. Neighborhood nonprofits work to connect entrepreneurs, and to help them secure funding. Meanwhile, the local businesses that have become established in the neighborhood work together in the Lincoln Park Business Group to promote economic and community development. The local businesses help to keep money circulating within the local economy, which can be reinvested into the area. Ramsey can capitalize on its manufacturing, or other unique history, to help draw in local businesses who also care about the state and health of Ramsey.

Business Incubators and the City of Ramsey 24
Artist Workspace
Alternatives to Business Incubators
Work space for artists has always been at a premium, as there are many more artist compared to space to work. One example in the Twin Cities metro of successful artist workspace is the Northrup King Building. The Northrup King Building is a congregation of ten separate buildings that have been around since 1917. The Northrup King Building is an ideal example of a historic building being repurposed to fit the need of a more current market. Originally designed to be a center of operations for the Northrup King & Co. seed company, it was sold to private owners in the 1980s and has been retrofitted into creative workspaces for artists. Currently, the Northrup King Building is home to “over 190 artists and arts related businesses and another 30 entrepreneurs and nonprofit organizers.” The building also operates as a market place, though this function is most popular during specific events.
Artist workspace is likely not a direction that the City of Ramsey will want to pursue. Unless there is an existing artist community that is not reflected within the current demographics, this type of facility would likely not be supported. Artists, on average, have lower incomes than many other professions. This creates a reliance on public transit, and while there are public transit options in Ramsey, they are limited compared to what is located in the urban center. Overall, we do not recommend artists workspace as a viable option in Ramsey.
Public MarketsPermanent public markets were once important anchors in communities all over the United States and have recently come back into fashion. These public markets can be a way for a city to promote and develop its small businesses as well as create a place for the community to gather year round. Public markets usually have a relatively low barrier to entry for small businesses than any other type of commercial space. A lot of very small spaces (as little as 10 square feet) can be rented out to small businesses at a reasonable cost, and no build out of the space is required. The market can serve as a place for entrepreneurs to showcase and sell their crafts, goods, or services as a form of getting a foothold in the market. This could present the opportunity for these entrepreneurs to grow their business to the point where they desire their own space in the community.
Midtown Global Market is a good example of the role that a permanent public market can play in developing small businesses. The development of the market space included a goal to provide affordable commercial space to small businesses who could not afford to lease a space of their own. Businesses like Manny’s Tortas and Salty Tart Bakery started at the Midtown Global Market and have since been able to open other locations or move into bigger spaces. While a permanent public market in Ramsey would exist in a different economic context than the Midtown Global Market, Ramsey could try to tap into the through traffic going up north in the summer and could position itself as a holiday destination in the winter.

Business Incubators and the City of Ramsey 25
Recommendations
Prepared by Gretchen Buechler, Tanner Hofer , Maureen Hoffman, and Eric Van OssPA 5511 Community Economic DevelopmentHumphrey School of Public Affairs
Prepared for the City of Ramsey
Prepared in Partnership with the Resilient Communities Project
Equipped with the information provided in this report on business services and business incubators, there are several things that the City of Ramsey can do to further pursue a business incubator in the city. Most importantly, the city must engage in some strategic planning and do some additional research to become better informed on the needs of Ramsey and the potential role of a business incubator.

Business Incubators and the City of Ramsey 26
Recommendations
First, any further research on business incubators in Ramsey requires a better understanding of what Ramsey’s goals are. The formation of a committee or task force is an important step for furthering this research. The committee could be made up of elected officials, city staff, business leaders, and/or residents. This committee should be responsible for succinctly identifying the problem that they are trying to solve. After identifying the problem, all the possible options for solving this problem should be outlined. It may be that a business incubator is not the only or best approach to solving this problem, and other potential options should be carefully considered before moving forward. This committee should also be responsible for determining the high level goals of a business incubator in the city. Is the primary goal to grow small businesses so that the expand and can be included in the city’s tax base? Or is the primary goal to provide in-demand goods and services to Ramsey residents? Or is the primary goal something else? This committee should also consider the role that Ramsey should play in a business incubator. Does the city just want to provide space for the incubator, provide funding, or own and run the incubator itself as an extension of the city? Residents and businesses of Ramsey should be included in this strategic planning process as much as possible to ensure that their needs and interests are accounted for.
The goals defined in the strategic planning process should then be used to determine the direction of additional research necessary to make a decision on what form a business incubator in the City of Ramsey should take. The city should research the potential barriers to achieving these goals and identify ways to prevent or mitigate these barriers. Potential partners can be identified that can help meet these goals, and the roles they could play can be explored. The needs and gaps for existing businesses and residents should be researched to ensure that the city’s business incubator strategy can best meet those needs. A market analysis of commercial real estate in Ramsey and the surrounding area should be performed to determine if there is a supply or demand problem and what that means for a business incubator. A workforce analysis should also be performed to find out what types of workers live in or near Ramsey, what their needs are, who should be targeted, and what a business incubator could do for them. The city should draft sample budgets of different incubator forms to understand the feasibility of different models. The city should also consider how a business incubator can be holistically integrated into the existing business community of Ramsey, through the space, the workforce, possible events and programming, and more. These recommendations are just a sample of research that should be done to determine the how a business incubator can be best applied and utilized in Ramsey.
Business Incubators and the City of Ramsey 27
Appendix
Prepared by Gretchen Buechler, Tanner Hofer , Maureen Hoffman, and Eric Van OssPA 5511 Community Economic DevelopmentHumphrey School of Public Affairs
Prepared for the City of Ramsey
Prepared in Partnership with the Resilient Communities Project
This appendix contains a list of business services and resources available to businesses in Ramsey as well as a list of business incubators in Minnesota.

Business Incubators and the City of Ramsey 28
Appendix
Appendix A: Business Services and Resources for Ramsey Small Businesses
Local ResourcesAnoka County https://www.anokacounty.us/2799/Support-for-New-Businesses
Greater MSPhttps://www.greatermsp.org
Minnesota Chamber of Commerce https://www.mnchamber.com
Anoka Area Chamberhttps://www.anokaareachamber.com
Business Financing Minnesota Investment Fundhttps://mn.gov/deed/business/financing-business/deed-programs/mif/
Minnesota Job Creation Fundhttps://mn.gov/deed/business/financing-business/deed-programs/mn-jcf/
Research and Development Tax Credithttps://mn.gov/deed/business/financing-business/tax-credits/research-dev-credit/
Greater MN Job Expansion Programhttps://mn.gov/deed/business/financing-business/tax-credits/greater-mn-job-expansion/
MTHAhttp://www.mhta.org/mnsbir/
Innovation Voucher Programhttps://mn.gov/deed/business/financing-business/deed-programs/voucher/
SBAhttps://www.sba.gov/funding-programs/loans
Neighborhood Development Centerhttp://www.ndc-mn.org/what-we-do/business-lending/

Business Incubators and the City of Ramsey 29
MEDAhttp://meda.net/services/business-financing/loan-program/
MCCDhttp://www.mccdmn.org/programs/open-to-business-lending/
Starting and Managing a Business Score MNhttp://www.score-mn.org/
Small Business Assistance Office https://mn.gov/deed/business/help/sbao/
Filing a Businesshttps://mblsportal.sos.state.mn.us/
Business First Stophttps://mn.gov/deed/business/help/first-stop/
CEO Nexus (Anoka focus)http://ceonexus.com/economic-gardening-2/minnesota/
Research and Data ToolsUniversity of Minnesota Business Development Resourceshttps://diversity.umn.edu/bced/node/56
University of Minnesota Business Development Services https://diversity.umn.edu/bced/bds
University of Minnesota Community Economicshttp://www.extension.umn.edu/community/community-economics/
Workforce DevelopmentWorkforce Centershttps://mn.gov/deed/job-seekers/workforce-centers/workforce-center-locations/
Minnesota Apprenticeshipshttp://www.dli.mn.gov/aai.asp
Appendix

Business Incubators and the City of Ramsey 30
Appendix
Export/ImportBusiness One Stophttps://2016.export.gov/minnesota/index.asp
Export Financing https://mn.gov/deed/business/exporting/export-financing/
Entrepreneurship Angel Financing https://mn.gov/deed/business/financing-business/tax-credits/angel-tax-credit/
MN Cuphttps://carlsonschool.umn.edu/mn-cup
Gopher Angels http://www.gopherangels.com/entrepreneurs/ Plan It Business Training http://www.ndc-mn.org/what-we-do/business-training/
Clean Tech Startupshttps://midwest.cleantechopen.org/en/
Business Development http://wcif.org/what-we-do/programs/business/
Investors Networkhttp://www.inventorsnetwork.org/

Business Incubators and the City of Ramsey 31
Appendix B: Business Incubators in Minnesota
Appendix
Name City Purpose Addressignite! Innovation Eden Prairie Business assistanceNeighborhood Development Center St Paul Business management consultant 663 University Ave W #200, St Paul, MN 55104CleanTech Open Midwest Minneapolis Clean energy start up support University of St. Thomas, 1000 LaSalle AvenueMayo Clinic Business Accelerator Rochester Collaborative Space 221 1st Ave SW #202, Rochester, MN 55902gener8tor Minnesota Minneapolis Concierge startup accelerator 1621 Hennepin Avenue #100, Minneapolis MN 55403The Business Works Bloomington Coworking Space 7800 Metro Pkwy Ste 300, Bloomington, MN 55425The Reserve Edina Coworking Space 4940 West 77th Street, Edina, Mn 55435The Commons Excelsior Coworking Space 540 Lake Street, Excelsior, MN 55331Office Outpost Grand Marais Coworking Space 15 North Broadway, Grand Marais, MN 55604Envision lab Mankato Coworking Space 227 East Main Street, Suite 200, Mankato, MN 55601CoCo Minneapolis Minneapolis Coworking Space 400 South 4th Street, Suite 401, Minneapolis, MN 55412Assemble Minneapolis Coworking space 15th S 5th Street #500, Minneapolis, MN 55402CoCo Minneapolis Minneapolis Coworking Space 1400 Van Buren Street Northeast, Suite 200, Minneapolis, MN 55413CoCo Minneapolis Minneapolis Coworking Space 213 East 4th Street 4th Floor, St. Paul, MN 55101CoCo Minneapolis Minneapolis Coworking Space 1010 West Lake Street, Suite 100, Minneapolis, MN 55408Everyday Office Minneapolis Coworking Space 2303 Kennedy Street, Suite 201, Minneapolis, Mn 55412Growth Lab Minneapolis Coworking Space 1550 Jackson Street NE, Minneapolis, MN 55413Impact Hub Minneapolis Coworking Space 250 3rd Avenue North Ste 550, Minneapolis, MN 55401Industrious Minneapolis Coworking Space 60 South 6th Street, Suite 2800, Minneapolis, MN 55402Industrious Minneapolis Coworking Space 323 Washington Avenue North, Minneapolis, MN 55401The Pitch Minneapolis Coworking Space 807 Broadway Street NE Suite 310, Minneapolis, MN 55413Work Around Minneapolis Coworking Space 2828 University Ave SE, Suite 150, Minneapolis, MN 55414Flock Minneapolis Coworking Space 2611 1st Avenue South, Minneapolis, MN 55408Restore Collaborative Minneapolis Coworking Space 211 N 1st St, Minneapolis, MN 55401The Hive 905 Minneapolis Coworking Space 905 Washington Avenue North, Minneapolis, MNTC Maker Minneapolis Coworking Space 3119 East 26th Street, Minneapolis, MN 55406The Commons Minnetonka Coworking Space 14451 Highway 7, Minnetonka, MN 55345Spur Northfield Coworking Space 510 Washington Street, Northfield, MN 55057Red Wing Ignite Red Wing Coworking Space 419 Bush St, Red Wing, MN 55066Cube MN Rochester Coworking Space 328 South Broadway, Rochester, Mn 55904Collider Coworking Rochester Coworking Space 14 4th Street SW, Rochester, MN 55902Primordial Soup St. Paul Coworking Space 287 East Sixth Street Ste. 160, St. Paul, MN 55101The Tunnel St. Paul Coworking Space 165 Western Avenue, St. Paul, MN 55102Work Up Willmar Coworking Space 1601 Technology Drive NE, Willmar, MN 56201New Rules Minneapolis Creative coworking space 2015 N Lowry Ave, Minneapolis, MN 55412Northside Economic Opportunity Network Minneapolis Economic development agency 1007 W Broadway Ave, MTreehouse Health Minneapolis Health care innovation center 1635 Hennepin Avenue, Suite 200Technology Incubation Center Vadnais Heights Modern space for tech tech startups 1185 Willow Lake Blvd., Vadnais Heights, MN 55110Midtown Global Market Minneapolis Restaurant work space and store fronts 920 Lake Street, Minneapolis, MN 55407OffiCenters & VirtualOffiCenters Bloomington Shared Office Space 7900 International Dr Ste 300, Bloomington, MN 55425Regus - Normandale Lake Bloomington Shared office space 8400 Normandale Lake Blvd, Suite 920, Bloomington, MN 55437Regus - Grand Oak I Eagan Shared office space 860 Blue Gentian Road, Suite 200, Eagan, Minnesota 55121Regus - Crosstown Corporate Eden Prairie Shared office space 6385 Old Shady Oak Rd., Suite 250, Eden Prairie, MN 55344Executive Suites of Minnesota Edina Shared office Space 5200 Willson Rd Ste 150, Edina, MN 55424Regus - Grandview Square Edina Shared office space 5201 Eden Avenue, Suite 300, Edina, MN 55436Studio Co Work Golden Valley Shared office space 919 Lilac Drive North, Golden Valley, MN 55422Regus - Lake Elmo Lake Elmo Shared office space 8530 Eagle Point Blvd, Suite 100, Lake Elmo, MN 55042Lindstrom Office Center Lindstrom Shared office space 12732 Lake Boulevard, Lindstrom, MN 55045Regus - Maple Grove Maple Grove Shared office space 11670 Fountain Dr Ste 200, Maple Grove, MN 55369Joule Minneapolis Shared Office Space 1220 Washington Ave S, Minneapolis, MN 55415 Regus - Fifth Street Towers Minneapolis Shared office space 100 South Fifth Street, Suite 1900, Minneapolis, MN 55402Regus - AT&T Tower Minneapolis Shared office space 901 Marquette Avenue, Suite 1500, Minneapolis, MN 55402Regus - Minnesota Center Minneapolis Shared office space 7760 France Avenue South, Suite 1100, Minneapolis, MN 55435Regus - Carlson Center Minnetonka Shared office space 601 Carlson Parkway, Suite 1050, Minnetonka, MN 55305Regus - Roseville - Bonestroo Roseville Shared office space 2355 Highway 36 West, Suite 400, Roseville, MN 55113Regus - St. Paul - Town Square Tower St Paul Shared office space 445 Minnesota Street, Suite 1500, St Paul, MN 55101

Business Incubators and the City of Ramsey 32
Appendix
Name City Purpose Addressignite! Innovation Eden Prairie Business assistanceNeighborhood Development Center St Paul Business management consultant 663 University Ave W #200, St Paul, MN 55104CleanTech Open Midwest Minneapolis Clean energy start up support University of St. Thomas, 1000 LaSalle AvenueMayo Clinic Business Accelerator Rochester Collaborative Space 221 1st Ave SW #202, Rochester, MN 55902gener8tor Minnesota Minneapolis Concierge startup accelerator 1621 Hennepin Avenue #100, Minneapolis MN 55403The Business Works Bloomington Coworking Space 7800 Metro Pkwy Ste 300, Bloomington, MN 55425The Reserve Edina Coworking Space 4940 West 77th Street, Edina, Mn 55435The Commons Excelsior Coworking Space 540 Lake Street, Excelsior, MN 55331Office Outpost Grand Marais Coworking Space 15 North Broadway, Grand Marais, MN 55604Envision lab Mankato Coworking Space 227 East Main Street, Suite 200, Mankato, MN 55601CoCo Minneapolis Minneapolis Coworking Space 400 South 4th Street, Suite 401, Minneapolis, MN 55412Assemble Minneapolis Coworking space 15th S 5th Street #500, Minneapolis, MN 55402CoCo Minneapolis Minneapolis Coworking Space 1400 Van Buren Street Northeast, Suite 200, Minneapolis, MN 55413CoCo Minneapolis Minneapolis Coworking Space 213 East 4th Street 4th Floor, St. Paul, MN 55101CoCo Minneapolis Minneapolis Coworking Space 1010 West Lake Street, Suite 100, Minneapolis, MN 55408Everyday Office Minneapolis Coworking Space 2303 Kennedy Street, Suite 201, Minneapolis, Mn 55412Growth Lab Minneapolis Coworking Space 1550 Jackson Street NE, Minneapolis, MN 55413Impact Hub Minneapolis Coworking Space 250 3rd Avenue North Ste 550, Minneapolis, MN 55401Industrious Minneapolis Coworking Space 60 South 6th Street, Suite 2800, Minneapolis, MN 55402Industrious Minneapolis Coworking Space 323 Washington Avenue North, Minneapolis, MN 55401The Pitch Minneapolis Coworking Space 807 Broadway Street NE Suite 310, Minneapolis, MN 55413Work Around Minneapolis Coworking Space 2828 University Ave SE, Suite 150, Minneapolis, MN 55414Flock Minneapolis Coworking Space 2611 1st Avenue South, Minneapolis, MN 55408Restore Collaborative Minneapolis Coworking Space 211 N 1st St, Minneapolis, MN 55401The Hive 905 Minneapolis Coworking Space 905 Washington Avenue North, Minneapolis, MNTC Maker Minneapolis Coworking Space 3119 East 26th Street, Minneapolis, MN 55406The Commons Minnetonka Coworking Space 14451 Highway 7, Minnetonka, MN 55345Spur Northfield Coworking Space 510 Washington Street, Northfield, MN 55057Red Wing Ignite Red Wing Coworking Space 419 Bush St, Red Wing, MN 55066Cube MN Rochester Coworking Space 328 South Broadway, Rochester, Mn 55904Collider Coworking Rochester Coworking Space 14 4th Street SW, Rochester, MN 55902Primordial Soup St. Paul Coworking Space 287 East Sixth Street Ste. 160, St. Paul, MN 55101The Tunnel St. Paul Coworking Space 165 Western Avenue, St. Paul, MN 55102Work Up Willmar Coworking Space 1601 Technology Drive NE, Willmar, MN 56201New Rules Minneapolis Creative coworking space 2015 N Lowry Ave, Minneapolis, MN 55412Northside Economic Opportunity Network Minneapolis Economic development agency 1007 W Broadway Ave, MTreehouse Health Minneapolis Health care innovation center 1635 Hennepin Avenue, Suite 200Technology Incubation Center Vadnais Heights Modern space for tech tech startups 1185 Willow Lake Blvd., Vadnais Heights, MN 55110Midtown Global Market Minneapolis Restaurant work space and store fronts 920 Lake Street, Minneapolis, MN 55407OffiCenters & VirtualOffiCenters Bloomington Shared Office Space 7900 International Dr Ste 300, Bloomington, MN 55425Regus - Normandale Lake Bloomington Shared office space 8400 Normandale Lake Blvd, Suite 920, Bloomington, MN 55437Regus - Grand Oak I Eagan Shared office space 860 Blue Gentian Road, Suite 200, Eagan, Minnesota 55121Regus - Crosstown Corporate Eden Prairie Shared office space 6385 Old Shady Oak Rd., Suite 250, Eden Prairie, MN 55344Executive Suites of Minnesota Edina Shared office Space 5200 Willson Rd Ste 150, Edina, MN 55424Regus - Grandview Square Edina Shared office space 5201 Eden Avenue, Suite 300, Edina, MN 55436Studio Co Work Golden Valley Shared office space 919 Lilac Drive North, Golden Valley, MN 55422Regus - Lake Elmo Lake Elmo Shared office space 8530 Eagle Point Blvd, Suite 100, Lake Elmo, MN 55042Lindstrom Office Center Lindstrom Shared office space 12732 Lake Boulevard, Lindstrom, MN 55045Regus - Maple Grove Maple Grove Shared office space 11670 Fountain Dr Ste 200, Maple Grove, MN 55369Joule Minneapolis Shared Office Space 1220 Washington Ave S, Minneapolis, MN 55415 Regus - Fifth Street Towers Minneapolis Shared office space 100 South Fifth Street, Suite 1900, Minneapolis, MN 55402Regus - AT&T Tower Minneapolis Shared office space 901 Marquette Avenue, Suite 1500, Minneapolis, MN 55402Regus - Minnesota Center Minneapolis Shared office space 7760 France Avenue South, Suite 1100, Minneapolis, MN 55435Regus - Carlson Center Minnetonka Shared office space 601 Carlson Parkway, Suite 1050, Minnetonka, MN 55305Regus - Roseville - Bonestroo Roseville Shared office space 2355 Highway 36 West, Suite 400, Roseville, MN 55113Regus - St. Paul - Town Square Tower St Paul Shared office space 445 Minnesota Street, Suite 1500, St Paul, MN 55101Regus - West End St. Louis Park Shared office space 1650 West End Blvd, Suite 100, St Louis Park, Minnesota 55416WeWork Minneapolis Shared office space 2900 Fremont Avenue, Minneapolis, MN 55408WeWork Minneapolis Shared office spaces 225 South 6th St, Minneapolis, MN 55402Intermedia Arts Minneapolis Small organization assistance focusing on minority owner assistance 2822 Lyndale Avenue S, Minneapolis, MN 55408Brainerd Industrial Center Brainerd Small to large manufacturing space 1801 Mill Ave, Brainerd, MN 56041University Enterprise Laboratories St. Paul Specialized work space 1000 Westgate Dr, St Paul, MN 55114GoKart Labs Minneapolis Start up, business assistance 110 N 5th St #520, Minneapolis, MN 55403Owatonna Area Business Development Center Owatonna Start up, business assistance 1065 SW 24th Ave, Owatonna, MN 55060Bir Ventures USA Ltd. Minneapolis 1635 Hennepin Avenue, Suite 200, Minneapolis, MN 55403

Business Incubators and the City of Ramsey 33
Chippewa Valley Innovation Center. “Chippewa Valley Innovation Center.” chippewavalleyinnovation-center.org/.
Golden Peiser & Peiser, LLP. (2015). “The importance of manufacturing incubators, CPA Dallas | GPP.” GPP Manufacturing. manufacturing.gppcpa.com/enewsletters/article/how-manufacturing-incuba-tors-are-moving-manufacturing-into-the-21st-century/
Incubator Works. (2017). Retrieved December 09, 2017, from http://www.incubatorworks.org/
Jossi, F. (2014, March 19). The comforts of co-working. Retrieved December 06, 2017, from http://finance-com-merce.com/2014/03/the-comforts-of-co-working/
Kraker, D. (2017, April 18). Craftsmen, backpacks, beer build hope in a needy Duluth neighborhood. MPRnews. org. Retrieved December 9, 2017, from https://www.mprnews.org/story/2017/04/18/duluth-lincoln-park-business-es-spark-revival
North Dakota State University. (2017). NDSU Research and Technology Park. Retrieved Oct. & nov., 2017, from https://www.ndsuresearchpark.com/
Northrup King Building. (2017). Retrieved Oct. & nov., 2017, from http://www.northrupkingbuilding.com/about
Romero, D. (2009, April 10). A New Take on Incubators. Entrepreneur. doi:https://www.entrepreneur.com/arti-cle/201228
Southern Tier Startup Alliance. (2017). Retrieved December 09, 2017, from http://www.ststartup.com/
Works Cited

Prepared byAmy Yoder, Garth Wadsworth and Mathew Goodwin
Students in PA 5211 Land Use Planning Instructor: Dr. Fernando Burga
Hubert H. Humphrey School of Public Affairs
Prepared in Collaboration with Patrick Brama
Assistant City Administrator and Economic Development ManagerCity of Ramsey
Talent & Tenacity: Sparking an Incubator in Ramsey

TheprojectonwhichthisreportisbasedwascompletedincollaborationwiththeCityofRamseyaspartofthe2017–2018ResilientCommunitiesProject(RCP)partnership.RCPisaprogramattheUniversityofMinnesota’sCenterforUrbanandRegionalAffairs(CURA)thatconnectsUniversityfacultyandstudentswithMinnesotacommunitiestoaddressstrategicprojectsthatadvancelocalresilienceandsustainability.
Thecontentsofthisreportrepresenttheviewsoftheauthors,anddonotnecessarilyreflectthoseofRCP,CURA,theRegentsoftheUniversityofMinnesota,ortheCityofRamsey.
ThisworkislicensedunderaCreativeCommonsAttribution-NonCommercial3.0UnportedLicense.Toviewacopyofthislicense,visitwww.creativecommons.org/licenses/by-nc/3.0/orsendalettertoCreativeCommons,444CastroStreet,
Suite900,MountainView,California,94041,USA.Anyreproduction,distribution,orderivativeuseofthisworkunderthislicensemustbeaccompaniedbythefollowingattribution:“ProducedbytheResilientCommunitiesProject(www.rcp.umn.edu)attheUniversityofMinnesota.ReproducedunderaCreativeCommonsAttribution-NonCommercial3.0UnportedLicense.”
Thispublicationmaybeavailableinalternateformatsuponrequest.
ResilientCommunitiesProjectUniversityofMinnesota330HHHSPA301—19thAvenueSouthMinneapolis,Minnesota55455Phone:(612)625-7501E-mail:[email protected]:http://www.rcp.umn.edu
TheUniversityofMinnesotaiscommittedtothepolicythatallpersonsshallhaveequalaccesstoitsprograms,facilities,andemploymentwithoutregardtorace,color,creed,religion,nationalorigin,sex,age,maritalstatus,
disability,publicassistancestatus,veteranstatus,orsexualorientation.

Talent & TenacitySparking an Incubator in Ramsey 1
Amy Yoder, Garth Wadsworth, Matthew GoodwinPA5211: Land Use Planning / Instructor: Fernando Burga PhD.Resilient Communities Project
UNIVERSITY OF MINNESOTADriven to Discover
Introduction The Ramsey Advantage
Opportunities to Grow
Incubator Options
Business Owner Interviews
Resilient Financing
Manufacturing Incubator
Coworking Incubator
Food Service Incubator
1 2 3 4 65 7 8 9
Ramsey on the Edge• For decades the city of Ramsey has been outside of the contiguous urban growth
boundary. Within 30 minutes of the Twin Cities, Ramsey is a short distance from numerousamenities the region has to offer.
• Paired with inexpensive, undeveloped land, the city has become a rural haven for businesses looking to expand.
• As developments along Highway 10 and the Northstar commuter rail continue to pushthe boundary northward, Ramsey sits on the cusp of being enveloped by regionalgrowth and the opportunities that come with development.
Realizing Opportunity• Having an opportunity is one thing, making the most of it is another. The city of Ramsey is focused on converting the opportunity of growth into
positive change in its latest comprehensive plan. With the introduction of the COR (Center of Ramsey) development district, the city aims tochannel the anticipated influx and development into concrete results that can greatly add to what the city has to offer.
• While the COR outlines how future development will occur in the city, it does not indicate what will anchor it in Ramsey. For this a separateapproach is needed, one that grasps on to local talent and tenacity to start building upon this foundation.
• A business incubator is a model that can help local entrepreneurs get their start up off the ground by providing various spaces and support. Thismodel can provide the necessary catalyst for Ramsey to innovate as it looks towards the future.
Sparking Success: Creating a Business IncubatorBusiness Incubators can take on many forms in practice to provide the elements that startups need to grow. This project aims to analyze the city of Ramsey in terms of offerings and opportunities. Based on research findings and interviews with local business owners, we distill key values the city of Ramsey should take into account when envisioning an incubator. Using these findings as a guide, we develop models for various types of incubators than can be successful in fostering businesses and attracting development to the region.
For a city on the edge of urbanization, business incubators can act as catalysts for business growth. In the next poster we look at current gaps in Ramsey’s local economy to understand the potential services an incubator can provide to help local entrepreneurs fill these gaps. The following posters will explore the advantages and opportunities available to the City of Ramsey.
City of Ramsey 2030 Comprehensive PlanChapter 3: Community Background
City of Ramsey 2030 Comprehensive Plan 3-8
Figure 3-5 - Expansion of the Contiguous Edge of Development in the Twin CitiesMetropolitan Area 1950-2000
Source: The Metropolitan Council
Sources:Startup Space: http://www.killingarchitects.com/�nancial-models-for-temp-use-casestudy-practice-space/Room: https://www.�ickr.com/photos/yorkcollegepa/5909869136/Accelerator: http://www.today.mccombs.utexas.edu/2014/12/tvl-accelerator-space-jon-rebecca-brCcelerator 2: https://www.�ickr.com/photos/cfccreates/14189072583/in/photo-list-nBQGWt-e3dZKy-e38nJe-e3e4QL-nzLHDi-e38ncK-8tiDtM-dUUiwi-dekQ7g-niz6gd-e3e2rh-dz1riw-e38kU4-e38ox2-e38jgn-heXN8m-ny1ZBj-heY9Xf-heXDLF-gQFtsJ-e38ohv-dyUYaF-e3e54f-heXXuB-dUZRwA-heYak9-8CBAsW-heZa9e-nBQFTr-e38nxR-dUZRtN-heY7eS-e38mG6-nzLHPD-nBQGU4-heXXkZ-q7Hns1-e38kii-heXURk-e5ccF5-niz6nW-heXXHH-heY4iw-ny21Hs-dz1r9d-ny211A-dyUXTk-e3e2iY-niyZgP-e3e2oqFarmers Market:https://www.�ickr.com/photos/usdagov/7699839136/Food Venture
? ? ?? ? ?
Sources: https://z.umn.edu/346j, https://z.umn.edu/346k, https://z.umn.edu/346l, https://z.umn.edu/346m, https://z.umn.edu/346q, https://z.umn.edu/346r
Crafts Markets
Startup Showcase Maker Space Food Truck
Commercial Kitchen Coworking Hub
Highway 10
MSPAirport
10+ of higher education institutions including the University of Minnesota
17 Fortune 500 Companies
Anoka-Ramsey Community College
and Anoka Technical College
5 major companies including Medtronic, Aveda and Pentair
Ramsey Manufacturing
Hub
Sources: Forbes, TripSavvy, Welcome!TwinCities, City of Ramsey
Nearby Amenities: Time from the City of Ramsey
On the outer reaches of the Twin Cities metro, the City of Ramsey has long been a place coveted by businesses looking to expand. Now, as Ramsey finds itself more integrated into the metro area, it aims to establish a business incubator to cultivate local talent and bring opportunities from the region. This project considers the city’s current amenities to propose an incubator that capitalizes on Ramsey’s future potential.
City of Ramsey 2030 Comprehensive PlanChapter 3: Community Background
City of Ramsey 2030 Comprehensive Plan 3-8
Figure 3-5 - Expansion of the Contiguous Edge of Development in the Twin CitiesMetropolitan Area 1950-2000
Expansion of the Contiguous Edge of Development in the Twin Cities Metropolitan Area 1950-2000
1
UrbanCatalyst
Introduction

Talent & TenacitySparking an Incubator in Ramsey 2
Amy Yoder, Garth Wadsworth, Matthew GoodwinPA5211: Land Use Planning / Instructor: Fernando Burga PhD.Resilient Communities Project
UNIVERSITY OF MINNESOTADriven to Discover
Introduction The Ramsey Advantage
Opportunities to Grow
Incubator Options
Business Owner Interviews
Resilient Financing
Manufacturing Incubator
Coworking Incubator
Food Service Incubator
1 2 3 4 65 7 8 9
The combination of connections, resources and opportunities in Ramsey are prime for growth. By providing the necessary space and support services for start-ups, the city can facilitate the growth of a more resilient local economy. The following posters layout a number of proposed incubation programs that include both physical development and business support programs.
Industry Employment per 1000 Residents Annual Household Income Distribution
As shown above, the City of Ramsey has successfully facilitated the growth of a highly specialized manufacturing sector. Ramsey has an additional 30 manufacturing jobs per 1000 residents relative to the greater Twin Cities metro area. The city of Ramsey has a manufacturing location quotient of 1.35, providing a substantial tax base and external source of revenue (U.S. Census Bureau).Ramsey also has a favorable local income distribution (top right). Over three quarters of households have an annual income of over $60,000 while 40% of all households have an annual income of over $100,000 (U.S. Census Bureau) .The combination of favorable income distribution and specialized manufacturing sector provide a foundation capable of supporting non-basic industries, such as local restaurants and entertainment venues.
In addition to the specialized manufacturing sector, Ramsey has lower levels of employment in the Entertainment & Food services sector relative to both Anoka County and the greater metro area (top left & bottom left). This under-employment in the food services provides an opportunity for business incubation. If food & service industry employment remains constant, relative to population growth, Ramsey can expect an additional 200 food & services industry jobs by 2030. However, a successful incubator could result in double the job growth (400 total additional jobs) by achieving employment similar to that of Anoka County. As shown below, Ramsey has a local labor force capable of supporting additional creative and support industries. This is evidenced by the net outward flow of service sector jobs experienced by the city. Leveraging this local talent will be crucial for the success of creative industry incubation.
U.S. Census Bureau
OnTheMapU.S. Census Bureau
0%
5%
10%
15%
20%
25%
30%
35%
40%
< $20,000 $20,000 - $39,999 $40,000 - $59,999 $60,000 - $99,999 $100,000 -$149,999
$150,000 -$199,999
>$200,000
Ramsey Anoka County Twin Cities Metro Area U.S. Census Bureau
0
20
40
60
80
100
120
Entertainment & Food Services Manufacturing Retail trade
Indus
try E
mploy
men
t Per
1000
Res
ident
s
,
Ramsey Anoka County
Opportunity
Advantage
4,98712,108
952
The City of Ramsey has successfully leveraged its proximity to the Twin Cities and created a highly specialized manufacturing sector. The city is now in a position to capatilize on this growth and bolster the growth of slower developing sectors.
FutureGrowth
2
Opportunities for Growth
0
200
400
600
800
1000
1200
1400
CurrentEm lo ment
City Ratio
(2030)
County Ratio
(2040)
Total
Emplo
ymen
t
County Ratio
City Ratio
Current Employment 2030 2040
1400
1200
1000
800
600
400
200
0
Emp
loym
ent
City RatioCity Ratio
County Ratio
County Ratio
U.S. Census Bureau
+200
+200
Net Daily Labor FlowsProjected Employment DemandArt, Entertainment & Food Services
Perc
enta
ge o
f Hou
seho
lds
Entering Within Leaving

Talent & TenacitySparking an Incubator in Ramsey 3
Amy Yoder, Garth Wadsworth, Matthew GoodwinPA5211: Land Use Planning / Instructor: Fernando Burga PhD.Resilient Communities Project
UNIVERSITY OF MINNESOTADriven to Discover
Introduction The Ramsey Advantage
Opportunities to Grow
Incubator Options
Business Owner Interviews
Resilient Financing
Manufacturing Incubator
Coworking Incubator
Food Service Incubator
1 2 3 4 65 7 8 9
Specific resources in Ramsey prime the city for business development. By recognizing and capitalizing on these advantages a Ramsey-focused incubator can provide the opportunity for burgeoning businesses to take the next step. In the next poster we interview current Ramsey business owners to see how their experiences and insights can shape the services an incubator provides.
The city of Ramsey has the opportunity to address business gaps in the region with local services and products spurred on by a business incubator. Examining the unique characteristics of Ramsey provides information about how an incubator can harness the city’s strengths to propel startups forward on the local and regional stages.
The Ramsey Advantage
In the business world connections are everything. They define how you can reach customers, who will invest in your company, where you’re able to ship your product and more. In today’s economy these connections are physical and digital as the Internet has become backbone of the business world. Ramsey is equipped with high-speed Fiber Optic Internet. It is also located only 30 min from the Twin Cities, putting new businesses on the doorstep of a thriving regional and global marketplace.
Ramsey is no stranger to hosting successful business. On the edge of the metropolitan area, Ramsey has become a hub for companies looking for room to expand and still maintain their close ties with the Twin Cities. This history has fostered a strong partnership between companies and the city, seeing each other as partners in growth. Each year the city celebrates these relationships in its Business Expo where it hosts 50+ businesses, a number of networking events and crowns Ramsey’s “Business of the Year”.
Spac
e O
ppor
tuni
ties
Virtu
al C
onne
ctio
ns
Busin
ess H
ub
Hum
an C
onne
ctio
ns
For business of all types, space is a factor in determining their path forward. For many its a balance between being able to add additional inventory or employees while keeping the overhead costs manageable. Within the limits of Ramsey, the city owns a number of undeveloped parcels. In terms of a business incubator these spaces can provide unique opportunities to showcase their products or provide subsidized development opportunities for those companies after they leave the incubator.
2,6482,086 239
7,3024451,738
Goods Producing
Transportation & Utilities All Other Services
The City of Ramsey is home to a productive labor force working in a variety of industries. The significant gap between inward and outward flows of workers into the city within the sector is an opportunity for new businesses to capitalize on existing talent and provide local alternatives to currently outsourced services.
Live outside, work in Ramsey
Live in, work outside of Ramsey
Live & work within Ramsey
Available parcels owned by the City of Ramsey
City of Ramsey
Sources:https://www.�ickr.com/photos/diversey/2202489728/in/pho-tolist-6ruw6u-dDiPt-dkA7kS-4mCksQ-bQsdTz-amwYaa-dHh1x-4YmtVG-duoc32-nXBdVF-UwNQ6B-6BAzeU-k4Mqat-6VTHVo-4tw5w3-6PJF6o-7GcdVd-6Ta2qW-3tt3kG-amwQ2n-7WE52m-3BSjAk-6N35wm-bw5j8Z-5YtSoC-diJKXS-4PxsWP-oC3pe-bAYTin-dLN559-bf12yK-WGspY2-qC9Jow-djE7or-p8m1x7-fNi2n-dpD13h-2x25zi-fKsRf-JVnznS-bCw6A4-nCLAGA-2viLt9-AnmeF-eeUqj9-4PLjbt-nruNUq-4YfZAp-bzBbDt-64ydhf
https://www.�ickr.com/photos/valentinstanci-u/28882740100/in/photolist-L1gAnA-Ve7fdg-WJRuqg-BPM1Va-MQpBaM-L9D3V7-YmXgoQ-Mav5nN-Mav4bQ-YkeqME-Ywrdi1-YzespJ-XxDTDW-MmGBZm-Mav45h-qeEqhA-EtFBsK-puoNJt-Loa3Va-UkpgnG-Jo4cSN-prYcxN-Mav4nw-M1zr6E-JEPMKQ-y3cjmj-EAH1bk-wZHv8m-K6GEgv-P2QPxi-STdXHJ-Kbcmbi-zCMtno-RAyk9G-xgtQp3-xcAqYV-U4AD3u-qL7npC-V89Y2H-TjfNZv-JYqq1Q-LnXXyb-zjCTjw-puoNQF-RdcqUN-Xy3HZu-NJ52qY-As7eXF-CoiwYi-Dz1RS7https://www.�ickr.com/photos/howzey/2176696450/in/pho-tolist-4jm929-5MkQcR-dMXtJo-DQLDd-4yD984-7Ukonk-mGMZZk-aCo38B-g7RPWk-qCUgBD-fzjXvj-pW5m3M-4rmAX1-e3A75W-QuS3Dq-HU7f2N-93TpPg-aTnJWp-TRiYjs-y4wX2G-oUGt1h-pmKuTh-D2jSyr-fp6SKk-qCs1G8-5dfGfC-9dah43-aTnJ8P-adkSS4-375yTB-gP6HCS-puhyGd-9HULgC-381dsQ-nyAMrG-8EBbqU-cB8Bzh-tm5pxb-rmbfFS-dKLKRj-aepRzQ-4yDk1M-8WaGqL-61MESZ-dp2g-ptZkU8-ehsUE5-pXVfJ8-qyMftm-X4nPfz
London
Minneapolis
ShanghaiSources: Ramsey Water Tower (c) Steve Schneider, 2017 https://z.umn.edu/3595| Minneapolis (CC BY 2.0) Tony Webster, 2008 https://z.umn.edu/358w | Shanghai (CC BY-NC-SA 2.0) Xavier Lubeigt, 2017 https://z.umn.edu/3591| London (CC BY-NC 2.0) Mark Zastrow, 2008 https://z.umn.edu/3592
2,1581,163
268
Workers Who:
The Capstone Homes team, accepting Ramsey’s Business of the Year Award for 2017
Source: City of Ramsey
Source: City of Ramsey
3
U.S. Census Bureau
Ramsey Advantages

Talent & TenacitySparking an Incubator in Ramsey 4
Amy Yoder, Garth Wadsworth, Matthew GoodwinPA5211: Land Use Planning / Instructor: Fernando Burga PhD.Resilient Communities Project
UNIVERSITY OF MINNESOTADriven to Discover
Introduction The Ramsey Advantage
Opportunities to Grow
Incubator Options
Business Owner Interviews
Resilient Financing
Manufacturing Incubator
Coworking Incubator
Food Service Incubator
1 2 3 4 65 7 8 9
The city of Ramsey holds a unique position in the region by providing a place where businesses can grow in size and reach. The stories of Ramsey business owners reveal what it takes to get a business off the ground and how an incubator can give new owners a running start. Below we share three interviews conducted in November 2017 that address the obstacles, accelerators and relationships that built Ramsey businesses.
Business Owner Interviews
AcceleratorsKey moments in a business where it reaches a new level or expands. Examples include: securing a loan, moving into a larger space, opening a new location
BarriersObstacles that stop businesses from growing. Examples include: Need for financing, uncertainty in future growth opportunities
Community RelationshipEpisodes when collaborating with the city and/or the greater community has a positive effect on the business. Examples include: receiving tax credits, working with other local businesses
Source: Kelly Dahl (c) 2017 https://z.umn.edu/359k Source: Google MapsPhoto AB&F Fastener Supply is established in St. Anthony, MN in 1988 as an industrial and construction supply distributor with a passion for customer service.
Looking to start a machine shop to add to its offerings, B&F Supply had to find a location in the metro that could support its machining operations at a good price.
B&F finds their expansion opportunity in the city of Ramsey. Renting out a space in a client’s building, B&F starts up its machine shop which quickly outgrows its new home.
Since moving to Ramsey, B&F Fastener Supply has expanded its corporate-wide footprint from 20,000 to 275,000 square feet. The company has continued to grow organically through this time and established new distribution centers throughout the Midwest.
Loren O’BrienPresident/CEO of B&F Fastener SupplyB&F Fastener is a premium industrial and construction supply distributor serving customers in Minnesota, South Dakota, North Dakota, Wisconsin, Iowa and Nebraska. The company now has 14 distribution centers as well as machining and manufacturing divisions.
Tom DeQuattroOwner of Willy McCoysWilly McCoys is a 1920's Prohibition-themed tavern started in Ramsey. A family atmosphere, good food, and an accessible location off of Highway 10 has made the restaurant a favorite among locals and allowed Willy McCoys to expand to five other locations across the metro area.
Starting any new restaurant is a costly endeavor. In additon to building and property costs, the owners of Willy McCoy’s also had to secure financing for the costly food-service equipment (griddle, walk-in freezer, etc) needed to get their business started.
Once established, Willy McCoy’s quickly becomes a favorite stop for locals, workers in the nearby business park and travelers Highway 10.
Since opening, Willy McCoy’s has been able to expand at a rate of one new restaurant per a year along with reinvestments made to improve the capacity of the Ramsey location.
Impressed with the city of Ramsey B&F decides to continue to expand its presence in the city as well as move it’s headquarters up to the city from St. Anthony.
Working closely with Ramsey’s Economic Development, B&F was able secure the land they needed to expand on as well as Tax Increment Financing (TIF) to help with their new building.
Source: Frankie Leon (CC BY 2.0), 2011 https://z.umn.edu/34kq
After driving through Ramsey, Tom found a market primed for the first Willy McCoy’s. With affordable land, low competition and family households Tom was able to secure the a loan from the bank to get the restaurant off the ground.
The city of Ramsey provides credit for sewer connection fees associated with new developments. For a growing restaurant, like Willy McCoy’s, this credit goes toward alleviating sewage fees down the line with the permitting costs they already paid upfront.
Source: B&F Fastener Supply
Source: Yelp.com Source: Yelp.com
Source: Acapulco Mexican Restaurants Source: Kelly Dahl (c) 2017 https://z.umn.edu/359n Sam LeonOwner of Acapulco Mexican RestaurantAcapulco Mexican Restaurant brings fresh, authentic Mexican food to Minnesota. A family-run restaurant started by his parents, Acapulco now has eight locations across Minnesota.
Acapulco’s first restaurant in Minnesota opened up in 1996 after the Leon family moved to the state.
Working with the city, the owners were able to collect the demographic data they needed to convince them that a Ramsey-based restaurant could be viable. An additional Tenant Improvement Allowance also convinced them to break ground.
After the Ramsey location opened, Acapulco expanded to Ham Lake and started a pub in Stillwater, MN.
Approached by the City of Ramsey and a developer, the Leon Family was asked if they wanted to expand into the city. Given the investment required in opening up a new restaurant, the family was unsure if the city could support their restaurant.
Acapulco has come to be a big part of the Ramsey community. They frequently work with other local business through cross-promotions and are very engaged with “Happy Days”, Ramsey’s annual hometown festival.
Source: Steve Schneider (c) 2017 https://z.umn.edu/359m
Source: Steve Schneider (c) 2017
4
For each of the companies interviewed, a strong relationship with Ramsey has been a crucial foothold for expansion into the greater metro area and beyond. Key to this success is the relationship between companies and the city of Ramsey that has allowed these businesses to develop. The next poster examines how the incubator model reproduces this relationship and success for local startups.
Source: Kelly Dahl (c) 2017 https://z.umn.edu/359k Source: Google MapsPhoto AB&F Fastener Supply is established in St. Anthony, MN in 1988 as an industrial and construction supply distributor with a passion for customer service.
Looking to start a machine shop to add to its offerings, B&F Supply had to find a location in the metro that could support its machining operations at a good price.
B&F finds their expansion opportunity in the city of Ramsey. Renting out a space in a client’s building, B&F starts up its machine shop which quickly outgrows its new home.
Since moving to Ramsey, B&F Fastener Supply has expanded its corporate-wide footprint from 20,000 to 275,000 square feet. The company has continued to grow organically through this time and established new distribution centers throughout the Midwest.
Loren O’BrienPresident/CEO of B&F Fastener SupplyB&F Fastener is a premium industrial and construction supply distributor serving customers in Minnesota, South Dakota, North Dakota, Wisconsin, Iowa and Nebraska. The company now has 14 distribution centers as well as machining and manufacturing divisions.
Tom DeQuattroOwner of Willy McCoysWilly McCoys is a 1920's Prohibition-themed tavern started in Ramsey. A family atmosphere, good food, and an accessible location off of Highway 10 has made the restaurant a favorite among locals and allowed Willy McCoys to expand to five other locations across the metro area.
Starting any new restaurant is a costly endeavor. In additon to building and property costs, the owners of Willy McCoy’s also had to secure financing for the costly food-service equipment (griddle, walk-in freezer, etc) needed to get their business started.
Once established, Willy McCoy’s quickly becomes a favorite stop for locals, workers in the nearby business park and travelers Highway 10.
Since opening, Willy McCoy’s has been able to expand at a rate of one new restaurant per a year along with reinvestments made to improve the capacity of the Ramsey location.
Impressed with the city of Ramsey B&F decides to continue to expand its presence in the city as well as move it’s headquarters up to the city from St. Anthony.
Working closely with Ramsey’s Economic Development, B&F was able secure the land they needed to expand on as well as Tax Increment Financing (TIF) to help with their new building.
Source: Frankie Leon (CC BY 2.0), 2011 https://z.umn.edu/34kq
After driving through Ramsey, Tom found a market primed for the first Willy McCoy’s. With affordable land, low competition and family households Tom was able to secure the a loan from the bank to get the restaurant off the ground.
The city of Ramsey provides credit for sewer connection fees associated with new developments. For a growing restaurant, like Willy McCoy’s, this credit goes toward alleviating sewage fees down the line with the permitting costs they already paid upfront.
Source: B&F Fastener Supply
Source: Yelp.com Source: Yelp.com
Source: Acapulco Mexican Restaurants Source: Kelly Dahl (c) 2017 https://z.umn.edu/359n Sam LeonOwner of Acapulco Mexican RestaurantAcapulco Mexican Restaurant brings fresh, authentic Mexican food to Minnesota. A family-run restaurant started by his parents, Acapulco now has eight locations across Minnesota.
Acapulco’s first restaurant in Minnesota opened up in 1996 after the Leon family moved to the state.
Working with the city, the owners were able to collect the demographic data they needed to convince them that a Ramsey-based restaurant could be viable. An additional Tenant Improvement Allowance also convinced them to break ground.
After the Ramsey location opened, Acapulco expanded to Ham Lake and started a pub in Stillwater, MN.
Approached by the City of Ramsey and a developer, the Leon Family was asked if they wanted to expand into the city. Given the investment required in opening up a new restaurant, the family was unsure if the city could support their restaurant.
Acapulco has come to be a big part of the Ramsey community. They frequently work with other local business through cross-promotions and are very engaged with “Happy Days”, Ramsey’s annual hometown festival.
Source: Steve Schneider (c) 2017 https://z.umn.edu/359m
Source: Steve Schneider (c) 2017
Foundations for Growth

Talent & TenacitySparking an Incubator in Ramsey 5
Amy Yoder, Garth Wadsworth, Matthew GoodwinPA5211: Land Use Planning / Instructor: Fernando Burga PhD.Resilient Communities Project
UNIVERSITY OF MINNESOTADriven to Discover
Introduction The Ramsey Advantage
Opportunities to Grow
Incubator Options
Business Owner Interviews
Resilient Financing
Manufacturing Incubator
Coworking Incubator
Food Service Incubator
1 2 3 4 65 7 8 9
As Ramsey moves forward with the development of a Business Incubator, the city will need to decide on the particular form the program takes based on market needs and available resources. Business Incubators are a highly flexible tool - they need to be shaped deliberately to fit a community.
Choose your own Incubator Adventure
The type of Incubator program must be defined by Ramsey’s needs and resources. To be successful, Incubator programs balance three types of support - soft, hard, and capital - along with a series of formal and informal networks. Once these decisions have been made, Ramsey will have narrowed down its options. The next posters contain possible models for addressing gaps identified in “Opportunities to Grow” (p.2)
To decide on the most effective format for a Ramsey Business Incubator, the city will need ot consider:• Level of financial support - how much money are they willing to commit?• Target market - what type of businesses or services will use the Incubator?• Organizational structure - will the Incubator remain under city control, or take some other form like a non-profit?• Existing Soft Support services - what opportunities already exist in Ramsey and surrounding communities?
The Incubator CycleFinancial Commitment
Options
• Single large capital cost• Continued funding from city• Rely on outside funding• Funding only for capital/hard costs• Funding for operations/soft costs
Target MarketOptions
Focus on Gaps identified during
feasibility study [See poster 2]
• Food Services• Entertainment• Support industries for established
Manufacturing Sector
Organizational StructureOptions
• Traditional business model - strict
focus on profit• Non-profit 501c3• Social enterprise
Ramsey will also need to decide on a staffing structure:
• Executive director/ president• Support staff• Mentors - formal or informal• Distributor network
Existing New Business Support Services
Many support services already exist for new businesses within Ramsey, between Anoka County, Ramsey, and the Metro Region.
A Ramsey Business Incubator will need to determine what unique support it can offer.
[See poster 3]
Hard Support
• Providing land or buildings at reduced cost
• Larger physical investments like machinery
• Internet and office technology
Soft Support
• Direct mentoring of Owners• Training on equipment• Training for business skills like taxes,
accounting, marketing, etc.• Network of successful Businesses• Distributor network
The decisions made for each of these categories will shape how a Business Incubator moves forward.
A Business Incubator focused on one large capital investment to meet food services and dining needs might lead to a Pilot Restaurant - where the city builds a restaurant space and leases it at reduced rates.
Focusing on providing support services and tech jobs currently outsourced by existing businesses could mean a Co-Working Space would be a better fit.
The Community of Ramsey
Existing Networks
Incubator Program
Successful Businesses
Soft Support
Hard Support
Capital
Business Leaders
Twin Cities
Skilled Labor
Goods & Services
Market Needs
Choosing a Model
5
This Incubator Scorecard will appear to indicate which option will carry the most weight in each potential Incubator model. Key aspects of each model will be shown in Ramsey Blue.
Incubator Scorecard

Talent & TenacitySparking an Incubator in Ramsey 6
Amy Yoder, Garth Wadsworth, Matthew GoodwinPA5211: Land Use Planning / Instructor: Fernando Burga PhD.Resilient Communities Project
UNIVERSITY OF MINNESOTADriven to Discover
Introduction The Ramsey Advantage
Opportunities to Grow
Incubator Options
Business Owner Interviews
Resilient Financing
Manufacturing Incubator
Coworking Incubator
Food Service Incubator
1 2 3 4 65 7 8 9
Gap FinancingThe city’s Revolving Loan Fund is used to fill the financial ‘gap’ of a particular project. The city provides loans with below market interest rates for up to 40% of the total project cost.Tax Abatement Tax Increment FinancingBoth programs work by leveraging future property tax revenues for land acquisition or development.Industrial Revenue BondsThis program uses the tax exempt status of local government to provide below market rate interest to firms constructing new manufacturing facilities.
Small Business Development CentersThe Minnesota SBDC works to provide consulting and development services. SBDC consultants work to connect eligible businesses with appropriate funding sources.Minnesota Investment Fund (MIF)The program provides financial incentives for capital investments that retain or create new high-paying jobs.Minnesota Job Creation Fund (JCF)The State will provide a 5% rebate on capital investments for eligible projects. Participating companies must invest in new or expanded facilities that create or retain jobs.
U.S. Small Business Admisitration Loan GuranteesThe SBA works with lenders to provide loans to small businesses. The agency doesn’t lend money directly to small business owners. Instead, it sets guidelines for loans made by its partnering lenders, community development organizations, and micro-lending institutions. The SBA guarantees these loans will be repaid, which eliminates some risk for the lending partners.
Resilient Financing Solutions
Local Financing Tools State Level Assistance Programs Federal Loan Gurantees
Open for BusinessOpen to Business advisers assist entrepreneurs with identify borrowing needs and accessing financing options. Advisers work with clients to help them find the financing that best meets their own unique needs. MCCD also provides direct financing and loans in partnership with banks and nonprofits.
Expert Consulting for Small BusinessesThe Twin Cities Small Business Development Center provides free consulting services to help new businesses develop financing, marketing and management strategies.
Housing & Community DevelopmentThe Metropolitan Consortium of Community Developers is an association of nonprofit organizations focused on housing and economic development initiatives. The MCCD works through loan fund development and strategic planning programs to improve community and workforce development.
Anoka County & Greater MSP Twin Cities Small Business Development Center
Metropolitan Consortium of Community Developers
We recommend advertising available options. Creating a comprehensive list of programs, agencies and lenders to provide a single point of contact for new businesses will improve access to a variety of financing mechanisms. Leveraging a diverse portfolio will improve the chance of success of all incubator models and startups.
Ramsey has the advantages and opportunities necessary for a successful incubator program, however still requires financing mechanisms. Below are a number of financing strategies and programs from a variety of institutions that can help leverage Ramsey’s assets. A combination of innovative financing programs and local talent will encourage economic diversification.
tinyurl.com/y6w9ah2r https://tinyurl.com/yaxtpgf8 mccdmn.org
6
ResilientStrategies

Talent & TenacitySparking an Incubator in Ramsey 7
Amy Yoder, Garth Wadsworth, Matthew GoodwinPA5211: Land Use Planning / Instructor: Fernando Burga PhD.Resilient Communities Project
UNIVERSITY OF MINNESOTADriven to Discover
Introduction The Ramsey Advantage
Opportunities to Grow
Incubator Options
Business Owner Interviews
Resilient Financing
Manufacturing Incubator
Coworking Incubator
Food Service Incubator
1 2 3 4 65 7 8 9
The answers from Ramsey’s “Choose Your Own Adventure” (poster 5) shape the form a food and dining services Incubator would take. For example, focusing more on a large capital investment upfront results in a different incubator than focusing on mentoring services with a lower initial cost.
As identified in Opportunities for Growth (p. 2), the city of Ramsey has an opportunity to develop more food services and fine dining options. Many residents have expressed a wish for more interesting dining options - each of these models would utilize available strengths and opportunities.
Food Services and Fine Dining Incubator Models
A Destination Market Incubation model involves the construction of a market space with vendor stalls provided at a low rate to new food and artisinal vendors. By gathering a number of food vendors and artisans under one roof, a Destination Market helps create an enlarged customer pool for the businesses. The market thus allows for both lower capital investments on the part of the Incubator client businesses and a retail destination to draw people into a commercial district.
Like the Sea Salt Eatery and the Tin Fish, run by the Minneapolis Park and Recreation Board, a pilot restaurant space would provide the physical space necessary to open a restaurant. This would draw an up-and-coming restauranteer to the COR who wouldn’t otherwise be able to risk the location. This format would require the least involvement from the city - a pilot restaurant functions relatively independently until the client “graduates” and a new tenant must be selected.
Dest
inat
ion
Mar
ket
Pilo
t Res
taur
ant
Com
mer
cial
Kitc
hen
A large capital investment can be used to construct a commercial kitchen for local artisans and chefs to produce food items on a larger scale. Commercial kitchens must be up to all relevant health and safety codes, which creates a significant burden for home-based businesses like caterers and specialty jam makers. Small food-based start-ups also need access to the high capacity kitchen equipment necessary to ramp up production to sustainable levels.
Commercial Kitchen
Incu
bato
r Sco
reca
rd
Pilot Restaurant
Destination Market
Feed Ramsey
7

Talent & TenacitySparking an Incubator in Ramsey 8
Amy Yoder, Garth Wadsworth, Matthew GoodwinPA5211: Land Use Planning / Instructor: Fernando Burga PhD.Resilient Communities Project
UNIVERSITY OF MINNESOTADriven to Discover
Introduction The Ramsey Advantage
Opportunities to Grow
Incubator Options
Business Owner Interviews
Resilient Financing
Manufacturing Incubator
Coworking Incubator
Food Service Incubator
1 2 3 4 65 7 8 9
RamseyWorks: CoWorking Model
A coworking modeled incubator space creates a flexible space for companies to leave their garages and find firmer footing. RamseyWorks binds this design with the services and opportunities provided by a business incubator to create a collaborative workspace that promotes the exchange of ideas and growth.
Unused space in Ramsey’s Municipal Center provides an opportunity to create a coworking space for businesses looking to access traditional office amenities alongside the soft services an incubator provides. This shared work space, RamseyWorks, offers a flexible space solution for businesses looking to step out of the “garage” phase at a low cost.
RamseyWorks provides a physical space that embodies the principles of the Ramsey incubator. By centering the space within the municipal center, the space symbolizes the city’s dedication to small businesses. With amenities such as reservable conference rooms, soundproof telephone booths and high speed internet, RamseyWorks is aimed at startups looking for an economic and flexible office space.
Better TogetherRamseyWorks looks to join the flexibility and affordability of a coworking space with the purpose and services of a business incubator. The shared office within the city owned building means that participating companies can keep overhead costs down and keep their profits flowing into developing their business. Aside from the desks and conference rooms, RamseyWorks also provides a space to network with fellow entrepreneurs both in and outside of Ramsey. A dedicated Incubator Advisor can help connect businesses to interested parties in similar industries or coworking spaces throughout the region and country. This coworking model leverages the current assets available to the city of Ramsey, making use of existing physical infrastructure and business networks.
Potential PartnersAs coworking continues to grow in popularity a number of companies have begun to specialize in creating and running these spaces. The companies below have had success creating these spaces in the Twin Cities and around the nation. By partnering with these companies, Ramsey can let these groups handle the “hard” aspects of the space, while Ramsey can focus on providing the other connections and advising to make those in the incubator successful.
FLOCK
Collaborative Growth
8
Motivation
Incubator Scorecard
Internal View of RamseyWorks Proposed Floorplan of RamseyWorks
RamseyWorks

Talent & TenacitySparking an Incubator in Ramsey 9
Amy Yoder, Garth Wadsworth, Matthew GoodwinPA5211: Land Use Planning / Instructor: Fernando Burga PhD.Resilient Communities Project
UNIVERSITY OF MINNESOTADriven to Discover
Introduction The Ramsey Advantage
Opportunities to Grow
Incubator Options
Business Owner Interviews
Resilient Financing
Manufacturing Incubator
Coworking Incubator
Food Service Incubator
1 2 3 4 65 7 8 99
RamseyWorks: Manufacturing ModelRamseyWorks: Manufacturing is the embodiment the hard working spirit of the community of Ramsey. By constructing or procuring manufacturing space, Ramsey can establish a hub for entrepreneurs in the city. Similar to previous models, the shared manufacturing space seeks to remove the financial barriers currently impeding innovation and growth. By providing access to large, cost-prohibitive machinery or floorspace, the incubator can encourage innovation and the growth of new industry.
Large Capital InvestmentsSmall startups and individuals with new ideas often lack the means necessary to prototype and refine potentially cutting-edge products. Access to previously cost-prohibitive machinery, such as CNC machining facilities or 3D printers can give the opportunities for innovative ideas to be actualized. The investment may also allow established firms the opportunity to venture into new ideas that may have previously been considered risky. The distributed cost and communal access to capital intensive equipment provides the potential for innovation without the financial risk of large investments.
Resource InvestmentsIn addition to large capital investments, the incubator could make a series of slightly smaller investments in communal resources. Access to a tool library, temporary workspaces or computer-aided design software can help spur the productivity of innovators and artists. Following the lead of various “Maker Spaces” throughout the nation, Ramsey Works can also hold open houses where residents of the community can come and work on their own projects and see what products are being developed by RamseyWorks’ innovators. This type of programming ties the incubator investment back to the community and increases its visibility as a resource for aspiring entrepreneurs.
Connecting ResourcesRamsey has successfully connected the productivity of its rural workforce to the resources of the metro area. By connecting industry knowledge, fresh ideas and the necessary tools, Ramsey can continue to innovate. Connections between the physical manufacturing equipment, shared work spaces in city hall and industry leaders will be foundational to the success of the incubator program. Connecting the various incubators in both physical and social space will ensure the greatest chance of success as well as generating the most value for each dollar invested.
Lasting Connections
ConnectionsAcross Industry
A successful incubator will connect a variety of physical spaces, social networks and financial services. A single incubator will be helpful in removing specific barriers to growth, however, a combination will provide the greatest chance for success. While the program should seek to include as many potential participants as possible, investments in the program should be guided by posters 2, 3 and 5. Utilizing existing assets will be foundational to a cost effective program. This includes local business networks and expertise, city owned property and a variety of funding mechanisms. There are often multiple solutions to a small set of problems. Leveraging available options will make the best use of program resources while providing the greatest chance of success. Connecting resources, clients and services to relevant partners will be foundational to the success of the program and participants.
Participants in the first incubator program will become a valuable asset for future development. The experiences and successes of new startups will provide input to further improve the incubator model. Additionally, successful participating startup businesses will act as connections to established business networks and resource pools, helping to continue Ramsey’s tradition of innovation.
airwolf3d.com https://tinyurl.com/ycye9x5uhttps://tinyurl.com/y792ejlv
Incubator Scorecard
Incubator Scorecard
Incubator Scorecard

Comm[UNITY] Centered People, Places & Play in Ramsey
PA5211: Land Use Planning / Instructor: Fernando Burga PhD Kathleen Russell, Erik Thompson, Leoma Van Dort
TOWARDS A COMMUNITY CENTER: GEOGRAPHIC MODELS & GOVERNANCE STRATEGIES Ramsey is currently considering several geographic models and governance strategies to determine a suitable approach for providing a traditional community center or components of community center services dispersed across the City. Below is a summary of these models and strategies.
The desire for a community center in Ramsey is reflected in the City’s 2016 Community Livability Report and several planning documents: the City’s Strategic Action Plan, Capital Improvement Plan (CIP), and the COR Master Plan.
The City of Ramsey has up to 12 acres of land available, potentially for free, in its downtown area (the COR) that could be used for a stand-alone community center or the hub of satellite centers.
While there is a strong resident interest in a community center and the idea has been generally discussed by the Ramsey City Council, there has been no in-depth planning, budgeting, or community engagement for developing a community center vision.
Geographic Models
The centralized model is based on a traditional stand-alone community center where multiple uses and services are provided under one roof. As depicted in the map, the 12-acre land allocated in the mixed-use downtown area (The COR) could be a potential site for a centralized community center.
The satellite model allows community center services to be dispersed across the City with one location operating as the hub. As indicated on the map, places where infrastructure and amenities already exist can operate as satellite centers across Ramsey.
Governance Strategies
Municipal Model This is a community center owned and run by a city. These community centers typically offer programs and amenities free of charge or at a low cost to local residents.
Nonprofit Model This is a community center owned and/or run by a nonprofit organization. Cities can partner with nonprofits to offer community center services that typically require membership.
THE CHALLENGE
Our goal is to provide the City of Ramsey with a set of recommendations that will assist the City in developing a long-term vision and strategy for a community center model & associated programming.
OUR GOAL
OUR APPROACHOur recommendations for Ramsey include an analysis of existing community resources, demographic information, and facilities and programs offered in other cities.
A DESIRE FOR A COMMUNITY CENTER
A SITE FOR A COMMUNITY CENTER
FUNDS FOR A COMMUNITY CENTERAccording to The COR: Market Panel Discussion, Ramsey has identified a $4,000,000 contribution to a community center with their 10-year Capital Improvement Plan.
Thinking about a Community Center for Ramsey: Ultimately, the community center or centers that offer services should be quality public spaces that include opportunities for physical activity, leisure, recreation, and learning; and improve the overall quality of life and wellbeing of residents in Ramsey. In the subsequent posters, we will discuss Ramsey’s demographics, geographic models and governance strategies used by other cities, and existing community resources to provide recommendations for developing a community center model that would serve the needs and interests of all residents in Ramsey.
What type of community center will best serve Ramsey’s residents?
Phot
os: C
ity o
f Ram
sey
Geographic models provide the City of Ramsey the opportunity to consider more than one option for where they could locate their community center and how they could offer community center services to ensure that these services reach a large population.
Governance strategies provide the City of Ramsey the opportunity to consider more than one option for how they want to operate their community center. These strategies can offer cost-effective ways to provide amenities and programs that are affordable to all residents.
Introduction
Demographics
Framework
Central MunicipalModel
Central NonprofitModel
Satellite MunicipalModel Existing Resources
Recommendations
Centralized Model Satellite Model
1. Introduction
Satellite NonprofitModel
Project Outline

Comm[UNITY] Centered People, Places & Play in Ramsey
PA5211: Land Use Planning / Instructor: Fernando Burga PhD Kathleen Russell, Erik Thompson, Leoma Van Dort
To make recommendations for community center models and governance strategies, we must first understand the demographic makeup of the City of Ramsey found in census data. Below we illustrate Ramsey’s walkability index, population growth, and demographic composition. Understanding these unique conditions will help us frame our recommendations for a community center in Ramsey.
The population in Ramsey was estimated at just over 26,000 people in 2016 nand has been growing steadily. Population percent change from 2010 to 2016 has increased by 10.7%. This is high compared to the state’s average growth which is 4.1% according to census data. This means that Ramsey is going to need more community increase their community center ammenities as the population continues to increase.
POPULATION
RAMSEY’S DEMOGRAPHIC MAKEUP
Demographic Considerations for Implementation: Considering that almost all trips in Ramsey are taken by car, parking will be an important factor in the building of a community center. Offering family memberships will also be pertinent because about 80% of the household composition in Ramsey are families. Income may come into play when determining membership prices for the community center. In the next poster, we will discuss the social, economic, and environmental benefits of community centers and how each geographic model could present both advantages and challenges.
2.Demographics
A little over 50% of Ramsey’s population is 20-59 years old. This impacts the types of programs to be offered in the community center. Beyond services for this age group city staff should also anticipate the aging population to address senior services.
AGE BREAKDOWN
While the two greatest proportions of household income reflect the upper half of household incomes surveyed, 21% of households in Ramsey earn less than $49,999 a year. Therefore community centers should be affordable to accomodate all residents.
INCOME AND BENEFITS PER HOUSEHOLD
RACIAL COMPOSITION
WALKABILITYA Walk Score® measures the walkability of a place using a points-based system. A five-minute walk (.25 miles) to amenities are given maximum points on a scale of 0-100 while no points are given for an over 30-minute walk. Ramsey has an average Walk Score® of 6 which means that almost all trips require a car. This has implications for where a community center should be located in Ramsey.
HOUSEHOLD TYPE In Ramsey, over 80% of households include families. Therefore, a community center in Ramsey should consider including a range of programming and amenities that will attract and benefit families, including children, youth, and adults.
In 2015, 92% of the population in Ramsey was White, while 2.8% was African American and 2.4% was Asian.Out of Ramsey’s total population 2.4% was either Latino or Hispanic. Given the racial composition of the residents in Ramsey, the City’s community center should be a place that promotes inclusiveness and is welcoming to people from all races, ethnicities, and cultures.

Comm[UNITY] Centered People, Places & Play in Ramsey
PA5211: Land Use Planning / Instructor: Fernando Burga PhD Kathleen Russell, Erik Thompson, Leoma Van Dort
3. Framework
A COMMUNITY CENTER FRAMEWORK Community centers provide safe, affordable, and quality places for residents to enjoy opportunities for physical activity, recreation, education, arts and culture, and leisure. Such places serve as year-round gathering places that facilitate multigenerational and intercultural interaction and offer attractions for community members with different interests. Creating Resiliency through Community CentersAn integration of social, economic, and environmental benefits is key to creating a resilient community center model that is also viable and equitable. Below are some of the social, economic, and environmental benefits of having community centers.
Social Benefits Create community awareness through social interaction. Increase opportunities for physical activity and healthy living. Provide opportunities for learning and education. Enable integration of residents of all ages, cultures, and incomes.
Economic Benefits Create a stimulus for local businesses to offer services. Offer affordable access to community amenities and programs. Provide opportunities for employment. Potentially increase value of neighboring properties.
Environmental Benefits Increase access to outdoor spaces. Support cleaner, greener, and safer public places. Create opportunities for programs that increase environmental awareness. Can support environmental and habitat protection e.g. rain gardens.
Centralized Model Satellite Model
Considering Costs and Benefits: The City of Ramsey should consider the social, economic, and environmental benefits and costs of both the centralized and satellite community center model when determining which geographic model to use. The municipal and nonprofit governance strategies discussed in the subsequent posters will provide examples of how other cities are using these strategies to mitigate the disadvantages and increase the advantages associated with each of the geographic models.
Serves as a one-stop shop for accessing multiple community amenities and programs.Finding an easily accessible central location for the stand-alone community center may be difficult.
Maintenance and operational costs are limited to one building.Limited employment opportunities and limited options for local businesses to become involved.
Able to offer environmental awareness programs and hands-on learning opportunities.There may be limited opportunity for expanding access to green spaces such as parks.
Assessing Geographic Models
Increased access to community center amenities dispersed across multiple locations.Residents might not find all the amenities they need under one roof.
More opportunities for employment and affordable access to a variety of amenities and programs.Maintenance and operational costs may increase due to multiple locations.
Using existing buildings may reduce the amount of total resources needed.May require more land contributing to sprawl and inefficient land uses.
When considering a location for a centralized community center or satellite centers, it is important to consider residents’ accessibility to each location. Ideally, community centers should be located in pedestrian and bicycle friendly neighborhoods instead of locations that require residents to drive. Given that Ramsey is a car-dependent city and that there is no public transportation within the City, City staff must be strategic about where they locate their community center. The COR could offer a unique opportunity for locating a centralized community center or the hub of satellite centers. The following illustrations and discussion of potential advantages and disadvantages of each of these models provide a framework for assessing which model would work best for Ramsey.
Walking proximity
Bicycling proximity
Driving proximity
Walking proximity
Bicycling proximity
Driving proximity

PA5211: Land Use Planning / Instructor: Fernando Burga PhD Kathleen Russell, Erik Thompson, Leoma Van Dort
Comm[UNITY] Centered People, Places & Play in Ramsey
Unique Community Center Attributes
• Amenities: free walking track, fitnesscenter,pool,senior center, climbing wall, rental facility,communitygarden
• Construction Cost:$12million
• Operating Cost:$2.4million
• Programming:moviesinthe park,localfarmers’market, BertramBlastTriathalon,adult sportsleagues
4.CentralizedMunicipal
Unique Funding Opportunities and Incremental Growth: MonticelloandShoreviewofferexamplesoflargecommunitycentersthathavebeenconstructedandoperatedbytheirrespectivemunicipalities.IfRamseyweretopursuethismodeltheyshouldinvestigatefundingoptionssuchasgrantsandpartnersasthefinancialburdenmayrestsolelywiththecity. Ramsey has identified a large phsyical space for a community center and if Ramsey chooses to build a small community center, there would be ample room for growth as needs are identified.Inournextposterweinvestigatethecentralizednonprofitmodel.
Note:TheinformationprovidedonthisposterisbasedoninterviewswithCitystaffandinformationmadeavailableontheCitywebsite.
CENTRALIZED MUNICIPAL MODELCentralizedmunicipalcommunitycentersareapopularmodelinMinnesotaandacrosstheUnitedStates.Municipalities benefit from complete control over amenities as well as the programming offered.Asingle,centraliazedlocationoffersawidevarietyofprogramminginacentralspace.However,thedisadvantagesofthismodelincludehighcostandlimitedaccessibility.Municipalitiesoftenfinditchallengingtofundtheoperationandtheconstructionofastandalonecommunitycenterentirelythroughthecitybudget.
http://bit.ly/2BFnOR4
Ramsey
Monticello
http://bit.ly/2BFnOR4
http://bit.ly/2BFnOR4
TheconstructionofthecommunitycenterbuildingcostMonticello$12.5millionintotalbuttheNational Guard contributed $2.5 million and the city received an additional $500,000 in Cleanup Grants funds.
Monticello’scommunityneedsassessmentledthemtobuildinguniquefeaturesintheircommunitycenter.Aclimbingwallandaseniorcenterareevidencethatthe different populations in their community were being heard when deciding which amenities to construct.
The Cleanup Grants fundsthatMonticelloreceivedfortheirconstructionpracticesaswellastheircommunitygardenfollowtheidealsofanenvironmentally-friendlyfacility.
Formoreinformationsee:http://bit.ly/2BEy2Bi
SYNERGYNote:TheinformationprovidedonthisposterisbasedoninterviewswithCitystaffandinformationmadeavailableontheCitywebsite.
Monticello, MN
http://bit.ly/2BEy2Bi
RamseyMonticello
Shoreview, MN
http://bit.ly/2BfDVbW
Shoreview built its community center using an incremental approach.TheCitybuilta90,000square-footcomunitycenterin1990for$9million.Asthecommunityneedsbecamemoreapparenttheyaddedtwolargeexpansions.In2003,therewasa$5.5millionexpansionthatincreasedthesizeofthebuildingto110,000squarefeet.Currently,Shoreviewisworkingona$15millionexpansionthatwillincreasethetotalsizeofthecommunitycentertobebetween130and140thousandsquarefeet.
Shoreview advocates healthy lifestylesbeyondpromotingsportsclubsandfitnessclasses.Byhostingfarmers’markets,theActiveLifeFairandactiveseniorsgroupsShoreviewismakinghealthaboutmorethanjustfitness.
Formoreinformationsee:http://bit.ly/2jOoyj8
http://bit.ly/2BFnOR4
http://bit.ly/2jOoyj8 http://bit.ly/2jOoyj8
Ramsey
Shoreview
http://bit.ly/2BfDVbW
Unique Community Center Attributes
• Construction Cost:$27.5million investedincrementally($9mil., $5.5mil,$13mil.)
• Amenities:indoorwaterpark, fitnesscenter,indoorplayarea, outdoorpavillion,gymnasium
• Operating Costs:$2.5million Revenue:$2.5million Owner/Operator:Shoreview

PA5211: Land Use Planning / Instructor: Fernando Burga PhD Kathleen Russell, Erik Thompson, Leoma Van Dort
Comm[UNITY] Centered People, Places & Play in Ramsey
CENTRALIZED NONPROFIT MODELNonprofit partnerships are a commonly used strategy for managing the various costs related to operating a community center. Cities typically form unique relationships with nonprofits, including YMCAs through use agreements and other formal cost-sharing agreements. The operational cost of community centers is a large burden for a city to be wholly responsible for, therefore, nonprofits geared towards providing youth and other specialized programming offer attractive partnership/sponsorship opportunities for cities.
Andover, MN
Elk River, MN
5. Centralized Nonprofit
Operational Costs and Use Agreements: Andover and Elk River demsonstrate unique opportunities for use agreements within a centralized nonprofit model. This model may place the burden of construction costs entirely on the City of Ramsey, however, partnering with nonprofits such as the YMCA makes a centralized community center model a viable option because it can help mitigate operational costs. Also, the YMCA brings a wealth of experience in community center creation and would be a logical nonprofit partner. Ramsey can negotiate unique use agreements with the YMCA or any other nonprofit organization it partners with to either lease the entire building or parts of the building to offer programming. In the next poster, we will investigate the satellite municipal model.
http://bit.ly/2BFnOR4
http://bit.ly/2BFnOR4
http://bit.ly/2BFnOR4
Elk River funded the construction of their community center, which cost roughly $19 million. The City worked with BWBR Architects, Inc. to obtain Legacy Landfill grant rebates, saving the City more than $1 million through recycling rebates.
In exchange for leasing their building for free, the YMCA pays for operating costs while allowing Elk River 20 hours of gym time per week to offer their own programming. The combined programming from the YMCA and the City affords residents access to a wide variety of programming in a single central location.
The unique grants and rebates that Elk River secured are substantial and contribute towards constructing a community center that is built around environmental awareness.
For more information see: http://bit.ly/2BFnOR4Note: The information provided on this poster is based on interviews with City staff and YMCA staff, and information made available on their respective websites including the BWBR Architects, Inc. website.
Andover has a unique partnership with YMCA Twin Cities. The City operates facilities such as the ice arena and field house while the YMCA operates the pool and the kids’ gym.
A visitor need not be a YMCA member or a resident of Andover to use the field house or the ice arena. Therefore the community center has the potential to attract business from outside of the community.
Although the City of Andover was unable to secure a substatial amount of contributions through their citywide fundraiser, alternative forms of funding such as in-kind and monetary donations, and grants provide valuable opportunities for cities to fund their community centers.
For more information see: http://bit.ly/2AeooZPNote: The information provided on this poster is based on interviews with City staff and YMCA staff, and information made available on their respective websites.
http://bit.ly/2BNT694 http://bit.ly/2BNT694
http://bit.ly/2AmOD0g
http://bit.ly/2AYsi8O
RamseyAndover
RamseyElk River
http://bit.ly/2AjjrPj
http://bit.ly/2AjjrPj
Unique Community Center Attributes
• Construction Cost: $18.2 million
• Operating Budget: $1 million
• Amenities: ice arena, meeting rooms, field house, YMCA offers: lap pool, kids gym, family locker rooms, sauna
• Programming: senior and Pre-K programming, volleyball, youth sports, YMCA offers: health classes, and free child care for members
Unique Community Center Attributes
• Amenities: waterslide, whirlpool, basketball court, lap pool, sauna, kitchen, weight room
• Construction Cost: $19 million
• Yearly Operating Cost: $4 million yearly revenues: > $4 million
• Use Agreement: The city is allotted 20 hours a week during off peak gym hours to offer their own programming.

PA5211: Land Use Planning / Instructor: Fernando Burga PhD Kathleen Russell, Erik Thompson, Leoma Van Dort
Comm[UNITY] Centered People, Places & Play in RamseySATELLITE MUNICIPAL MODELA satellite municipal model allows community center services to be dispersed across several different locations with a community center hub located in a central location. Each node or satellite location can be designed to offer specialized community center programming based on already available resources and/or resident needs. Offering community center services in more than one location can increase accessibility to facilities and programming. In this poster, we will discuss how the municipal model allows the City to capitalize on exisitng resources and tailor the model to the specific needs of the City.
Williamson County, TN
San Jose, CA
6. Satellite Municipal
Cost Efficiency through Partnerships: If Ramsey chooses to adopt a municipal satellite model, the City can re-use several of its city-owned facilities by allowing local businesses and community based organizations to offer programs that are currently in need. These existing facilities and community spaces can easily serve as satellite centers that offer components of a community center. Another alternative would be to connect with neighboring cities to expand programming. The City can also develop a sponsorship policy that will allow for more formal partnerships with service providers. The next poster presents examples of how cities that have used nonprofit partnerships to better meet community needs.
http://bit.ly/2BFnOR4
http://bit.ly/2BFnOR4
http://bit.ly/2zAWlzh
San Jose’s community center model is unique in regard to their facility re-use program. This program gives government agencies, nonprofits, and community based organizations access to selected satellite community centers to operate programs and offer services that primarily benefit City residents. This allows the City to strategically manage operational costs, provide a wide variety of programming, re-use or re-service city facilities, and expand relationships with service providers.
See here for more information: http://bit.ly/2ioGj4r
Cities and counties in the suburbs of Nashville have been able to collaborate across several community and recreation centers to create several satellite centers, allowing the smaller cities to benefit from shared resources and offer a wider variety of amenities and programming.
Williamson County Parks and Recreation has partnerships with several local businesses and nonprofits that support their programs through monetary donations and by providing needed goods and services. The County offers their sponsors recognition in various media sources and public engagement.
For more information see: http://bit.ly/1yrYkUz
Unique Community Center Attributes
• Programming: Arts & crafts for children, teens, and adults; dance and music classes, summer camps, theater programs, movie nights, game nights, sports camps, senior fitness programs, aquatics, therapeutics
• Sponsorships: SilverSneakers, Silver&Fit, Barre Fitness, Nancy Stevens, Wellness Coaching, STAR Physical Therapy Satellite Centers: Hillsboro/ Leipers Fork Community Center, College Grove Community Center, Bethesda Recreation Center
http://bit.ly/2BzAAkD http://bit.ly/2nj01E3
http://bit.ly/2zDnXE8
http://bit.ly/2zDnXE8
Unique Community Center Attributes
• Amenities and programming: classroom rentals, banquet hall, Youth Center, parks, trails, youth basketball and soccer, half gymnasium, summer camp
• Partnership: The Department of Parks, Recreation and Neighborhood Services has a facility re-use program that allows city-owned buildings to be re-used by nonprofit and community based organizations to offer services that benefit residents. Opportunities: Although San Jose is a vastly different city compared to Ramsey, there are still important takeaways from their satellite municipal model.

PA5211: Land Use Planning / Instructor: Fernando Burga PhD Kathleen Russell, Erik Thompson, Leoma Van Dort
Comm[UNITY] Centered People, Places & Play in Ramsey
SATELLITE NONPROFIT MODELIn a nonprofit satellite model, some or all of the satellite centers, including its hub, can be owned and/or operated by a nonprofit organization. Cities can also partner with nonprofits to provide facilities and programming that the City may not be able to offer otherwise. The following examples highlight how cities have partnered with nonprofits to offer services that meet the needs and desires of their communities while also finding effective strategies to manage costs.
Queens, NY
Maplewood, MN
7. Satellite Nonprofit
Managing Costs and Addressing Needs: The satellite geographic model and nonprofit governance strategies presented in this poster highlight the advantages of partnerships in managing operational costs and ways in which community centers can serve the unique needs of the community. It is important that Ramsey conduct meaningful community engagement at the grassroots level to identify resident needs and develop programming that can benefit all populations. The next poster highlights existing community resources in Ramsey that can present valuable opportunities for partnerships and serve as satellite centers that offer specialized community services.
http://bit.ly/2zJbTER
http://bit.ly/2BFnOR4
http://bit.ly/2ztLn1m
The City of Maplewood has a variety of partnerships with local nonprofits and community organizations which allow the City to provide specific programming without having to commit additional staffing and be responsible for all costs.
The Memorandum of Understanding (MOU) enables the City to provide its building while all operational costs are covered by the YMCA. This strategic partnership has helped the City to broaden their services and effectively respond to the net loss they were experiencing.
By offering programming through satellite centers, the City has also been able to bring activities and programs closer to its residents.
For more information see: http://bit.ly/2BEdhFw
The community center in Queens offers core social services including food and shelter; financial assistance; and youth and adult education to facilitate community empowerment. This model exemplifies how community centers can incorporate impactful programming that go beyond traditional programming by taking into consideration the local context and unique needs of residents.
Such programming can make community centers a welcoming place for all residents, especially for socially disadvantaged and marginalized populations.
For more information see: http://bit.ly/2jhYr0R
Unique Community Center Attributes
• Operation: Run exclusively by Catholic Charities.
• Amenities: classrooms, meeting spaces, and worship spaces
• Programming: food pantry; educational programs for Latino children, youth, and families; programs for low-income parents; employment support programs; health education; and financial literacy Opportunities: While the geographic area is different from Ramsey, mainly in relation to population size, the model that is adopted across Queens still offers unique features that are applicable to Ramsey.
http://bit.ly/2ByjeVx http://bit.ly/2iseWtXhttp://bit.ly/2zDnXE8
Unique Community Center Attributes
• Memorandum of Understanding: agreement between the Parks and Recreation Board and the YMCA in 2016.
• Amenities: 3 gyms, fitness center, 9 ice skating rinks, aquatic center, picnic shelters, and nature center
• Satellite Centers: Cater Community Gym, Edgerton Community Gym, Maplewood Community Nature Center, and neighboring parks Partnerships: YMCA, local elementary school, Jr. Polar Football, Maplewood Area Historical Society, NEU Soccer Club, North Polars Fastpitch
Maplewood
Note: The information provided on this poster is based on interviews with City staff and information made available on the City website.
Ramsey

People, Places & Play in RamseyComm[UNITY] Centered
8. Existing Resources
PA5211: Land Use Planning / Instructor: Fernando Burga PhD Kathleen Russell, Erik Thompson, Leoma Van Dort
EXISTING COMMUNITY RESOURCES
Incorporating Existing Resources into the Community Center Model: If the City of Ramsey pursues a satellite community center model, the City can capitalize on existing community gathering spaces and facilities to incorporate and expand components of a centralized community center. Having community center services dispersed throughout the City can also increase access to resources for communities across Ramsey. The City can repurpose already existing infrastructure and/or expand existing infrastructure to integrate community center resources that are currently lacking in Ramsey to meet the needs and desires of residents.
Central Park7925 161st Ave NWhttp://bit.ly/2zDNixG• Outdoor pavilion and building• Common area • Playground• Ice rinks with hockey nets• Six softball fields
The Draw7401 E Ramsey Parkwayhttp://bit.ly/2i7Q9HW• Amphitheater• Picnic tables• Open green space• Passive recreation programming• Regional trails access
Municipal Center7550 Sunwood Dr NW A http://bit.ly/2AiBroF• Five rentable meeting rooms• Overhead projectors• WiFi availability• Multiple kitchens• Flat screen TVs
Ramsey Elementary15000 County Hwy 5http://bit.ly/2zV4brI • Two gymnasiums• Outdoor fields• Auditoriums• Cafeterias and kitchens• Classrooms
Youth First6701 Hwy 10 NWhttp://bit.ly/2ik1bdm• Free afterschool programs• Volunteer programs• Teen movie nights• Soccer field & volleyball court• Outdoor recreation events
Adrenaline SportsSW Bunker & Armstrong Blvd.http://bit.ly/2j7JXAB• Three basketball courts• Three volleyball courts• Three 80′ x 170′ turf fields• 52,000 sq ft of rentable space• Opens in January 2018
An expanded inventory of community resourcesThe list of community resources highlighted on the left of this poster is by no means comprehensive. Ramsey currently offers a myriad of community resources that are already accessible to residents. The locations of these resources and the types of facilities and programming offered provide valuable considerations when envisioning a community center model for Ramsey. Below are some additional outdoor spaces, facilities, and programming that could potentially be incorporated into the City’s community center model. Parks and open spaces: Ramsey has approximately 565 acres of parks and trail corridors. Aside from Central Park and The Draw, several other City parks including, Elmcrest, Alpine, Lake Itasca, Emerald Pond, Sunfish Lake, and Woodland Green; and regional parks including Rum River Central Park and Mississippi West Regional Park offer facilities and space for both active and passive recreation. They also serve as gathering spaces for residents and provide a variety of amenities, including ones that are listed in the graphs above. Other facilities and programming: Residents in Ramsey can access facilities and programming offered by several privately-run institutions and businesses including the PACT Charter School, Anytime Fitness, Fountains of Ramsey, Links at Northfork Golf Course, Lord of Life Church, Northgate Church, Rum River Scout Camp, and Northern Starz Children’s Theater to utilize a variety of facilities and programming including gymnasiums, multi-purpose event rentals, outdoor activities, and performing arts programming that can benefit children, youth, and adults.
The City of Ramsey currently offers multiple community spaces with a range of facilities, amenities, and programming for outdoor recreation, physical activity, community gatherings, and leisure. The map and information presented below highlight six such community resources that include parks, playgrounds, sports fields, gymnasiums, meeting spaces, and event venues. These resources indicate the investments the City of Ramsey has already made in providing components of a traditional community center.
ParksOther Resources
1
3
3
4
8
8
16
0 2 4 6 8 10 12 14 16 18
Skateparks
Football Fields
Basketball Courts
Hockey Rinks
Soccer Fields
Tennis Courts
Baseball FieldsSports Infrastructure
2
2
6
8
9
0 5 10 15
Amphitheaters
Warming Houses
BBQ/Grills
Pavilions
PlaygroundsPark Amenities

Comm[UNITY] Centered People, Places & Play in Ramsey
PA5211: Land Use Planning / Instructor: Fernando Burga PhD Kathleen Russell, Erik Thompson, Leoma Van Dort
SecureFunding &
PartnershipsIdentify creative
and nontraditional ways to manage costs and
secure funding for facility, operational, and
programmaticneeds.
Create aCommunity
Center TaskforceInclude members
representing Ramsey’sdiverse community, Citystaff, schools, businesses,
and communityorganizations.
FacilitateCommunity
Engagement Engage residents from
diverse backgrounds for input on what facilities & programming are desired (surveys, open houses, meetings).
Increase Visibility of Resources Use effective messaging to communicate information about already available facilities, amenities & programming.
Assess Fiscal& SpatialNeeds
Create cost metrics forfacility and programming
needs, assess spatialneeds, and identify gapsand challenges based
on past data.
9. Recommendations
RECOMMENDATIONS This poster presents important considerations for the City of Ramsey as they move forward with in-depth planning for a community center model as well as associated programming and activities. Here we highlight gaps in facilities and programming offered in Ramsey, possible opportunities for partnerships and funding, a framework for site selection, and recommended next steps that will help the City develop a community center model that will serve the needs and interests of all residents in Ramsey.
Opportunties for PartnershipsPartnerships can offer valuable and cost-effective strategies for expanding and supplementing programming and facilities offered by the City. However, they should fit within the community’s needs and align well with the City’s overall goals. Partnerships should also provide the City with a high-level of control over programs, services, and rates to ensure affordability and accessibility to all residents.
• Government entities e.g. Parks and Recreation Department, neighboring cities• Nonprofit organizations e.g. YMCA Twin Cities, Youth First Community of Promise• Schools e.g. Ramsey Elementary, PACT Charter School• Private fitness & athletic clubs e.g. Adrenaline Sports Center, Anytime Fitness• Local businesses e.g. Fountains of Ramsey, Links at Northfolk Golf Course
Opportunties for Funding and Managing CostsRamsey should explore diverse funding streams in addition to City funds to support community center services. Having multiple sources of funding can effectively address cost issues related to construction, operation, maintenance, programming, and facility updates. Below are several opportunities that can potentially be used to finance community center services and ensure the continuity of programs. • Facility use agreements e.g. Ramsey elementary, PACT Charter School• Grants from government/public entities e.g. Land & Water Conservation Fund, Ramsey Foundation• Grants from private/nonprofit entities e.g. Anoka Area Chamber of Commerce, Ramsey Lions• Facility re-use programs/policy e.g. community-based organizations and service providers• Donations & fundraisers e.g. in-kind and monetary donations, walk-a-thon fundraisers
Recommended Next Steps for Ramsey
Assets: What does the site bring as an asset? e.g. large site, easy access, parking space Gaps: What gaps does the site have? e.g. no room for expansion, not centrally located
Benefits: What are the advantages of choosing this site? e.g. adjacent to playground, can incorporate park
Consequences: What are the negative impacts of using this site? e.g. increased traffic, loss of trees
Action Needed: What has to be done to ensure that all needs are met? e.g. determine wetland mitigation, street and sidewalk modifications
Partnerships: What are some options for partnerships? e.g. formal agreements with YMCA, school district, senior center, and local businesses
Funding Options: What funding options are available? e.g. donations, sponsorships, cost-sharing agreements, fundraisers
Note: This framework is adapted from the City of Bloomington’s Community Center Taskforce Report to the Bloomington City Council (Oct. 10, 2016). For more information see: http://bit.ly/2zDNixG
A Framework for Selecting a Site for a Centralized Community Center or Hub
Facilties and activities for children and youth• Splash pad• Sports programs • Music and theater
Facilities and programs for families• Day camps• Pool & swimming lessons• Winter activities
While the City has not conducted a formal needs assessment, the City’s Parks and Recreation website includes a survey that allows residents to provide feedback on what recreation programs the City should offer. This feedback can help inform the type of programs and amenities to include in a community center. The following section categorizes gaps in current facilities and programs offered in Ramsey based on the survey responses, a comparison of facilities and activities offered in other cities dicussed in the project, and information obtained from key informants.
Gaps in Facilities and Programming Offered in Ramsey
Programs for adults• Fitness classes• Nutrition education• Swimming lessons
Other facilities and programs• Community/rec center• Gardening programs• Childcare
We also gathered that residents in Ramsey currently utilize community centers, YMCAs, and other facilities in neighboring cities including Andover, Elk River, Rogers, Champlin, and Otsego for family/child-oriented programming. Residents have also shared their preference for sports and fitness programs provided by the City over the long-term fee-based services offered by athletic associations and private fitness clubs.
http
://bi
t.ly/
2jM
rfO
Eht
tp://
bit.l
y/2B
FV2A
F
http
://bi
t.ly/
2jM
Wt8
0ht
tp://
bit.l
y/2A
q37u
Q
• More playgrounds• Arts and crafts
• Movie nights• Nature hikes & outdoor programs
• Yoga• Evening/weekend recreation programs
• Indoor walking tracks• Improved biking & walking trails
Recommended Next Steps

Economic Development Authority (EDA) 3. 2. Meeting Date: 01/25/2018 By: Tim Gladhill, Community Development
Title:Review Draft Economic Development Chapter of Comprehensive Plan
Purpose/Background:UPDATE: At the 01/11 EDA meeting, it was requested the EDA bring this case back for a second review.Specifically, the EDA wanted to provide feedback and direction regarding long-term goals. As the ComprehensivePlan reads today, most EDA goals are short-term/ mid-term. Community Development Director Tim Gladhill willbe leading a long-term goal setting session at this EDA meeting.
The purpose of this case is to review a draft of the Economic Development Chapter of the Comprehensive Plan andmake a recommendation to the Planning Commission. This Chapter will be an iterative review process assubsequent chapters are completed. This will not be the last time the Committee will review this chapter.
Observations/Alternatives:Please see the attached document for specifics.
Recommendation:Staff recommends that the Committee provide input on this draft and make recommendations to the PlanningCommission.
Action:Provide input and recommendations on the draft chapter.
AttachmentsEconomic Development Plan
Form ReviewInbox Reviewed By DateTim Gladhill Katie Schmidt 01/22/2018 09:08 AMTim Gladhill Katie Schmidt 01/22/2018 09:09 AMForm Started By: Patrick Brama Started On: 01/05/2018 08:21 AMFinal Approval Date: 01/22/2018

City of Ramsey 2040 Comprehensive Plan Update Land Use Plan Page 1 of 18
City of Ramsey 2040 Comprehensive Plan Update Economic Development Plan
Background on this Document This document is a draft of the narrative to be used in the 2040 Comprehensive Plan Update. This is not a
final version or actual layout. This document will be reviewed and revised multiple times. The City will try to
add additional maps and figures to better tell the story of this vision.
Our Mission It is our mission to work together to responsible grow our community, and to provide quality, cost-effective,
and efficient government services.
Our Vision Ramsey will evolve through citizen-driven, collaborative processes that respect the balance and connectivity
between its unique urban, rural, and natural environment for current and future generations.
Core Values 1) Encourage new pedestrian friendly neighborhoods and balanced transportation.
2) Maintain landowner rights.
3) Employ careful foresight that involves all citizens in decisions that affect their lives, property,
and neighborhoods through collaborative public engagement.
4) Nurture neighborhood and community interactions with flexibility to meet future needs without
compromising the needs and interests of current residents.
5) Develop and maintain a well-connected park and public space system for all ages.
6) Attract and retain businesses that support the whole community.

City of Ramsey 2040 Comprehensive Plan Update Land Use Plan Page 2 of 18
2030 Plan Accomplishments The last plan was adopted in 2010. While a number of factors changed since the last plan was adopted, the
City can celebrate a number of successes as it relates to our land use vision. Subsequent chapters of the 2040
Comprehensive Plan will celebrate their own successes.
Add accomplishments here. This section will be completed at a later date.

City of Ramsey 2040 Comprehensive Plan Update Land Use Plan Page 3 of 18
Goals and Strategies The following represents goals and strategies for future land uses. Subsequent chapters will include their own goals and strategies that integrate with the
above. Resources above and beyond current budget approvals are indicated in the ‘Additional Resources’ column.
Strategic Imperatives (4 key themes from Phase I of update)
1. Rural Character and Urban Growth Balance
2. An Active Community (Parks, Recreation, and Open Space)
3. A Connected Community (Transportation)
4. A positive learning environment
Goal/Initiative Tactic Timeframe Key Outcomes Additional Resources
1) Business Retention & Expansion The large majority local economic growth comes from existing Ramsey businesses. The purpose of this goal is to develop and maintain positive relationships with existing Ramsey businesses (establish trust). This goal is implemented through quality customer service, businesses visits, and facilitating business events. In 2017, staff would like to review the option of utilizing the University of Minnesota’s BRE program (link). If the EDA was interested in the program, Connexus Energy has indicated a willingness to sponsor the program (2018).
Ongoing Complete 24 business visits annually. Execute EDA business expo, business appreciation golf tournament, and fall networking event. Participate in Anoka County Broker Event and MN Marketing Partnership. This tactic fits within EDA objectives 2 and 3.
Currently Sufficient: assuming moderate customer service demand levels, sufficient resources exist to complete this tactic as proposed.
(2) Future Business Park Continue to move along the City’s future business park initiative. Below are major work items to be addressed:
1. Finalize Economic Development Analysis
2. Develop and solidify the City’s position/ involvement/ policy.
3. Attain shovel ready status.
Complete/Ongoing “Ready-to-go” business park and clear position of City involvement. This tactic fits within EDA objectives 2 and 3 and the City’s strategic plan.
Currently Sufficient: assuming moderate customer service demand levels, sufficient resources exist to complete this tactic as proposed. This work item does require use of third-party professional services (Shovel Ready Certifications, Economic Development Analysis, and subsequent due-diligence). TIF #1 and the EDA Fund have been identified as funding sources for this work in the past by the EDA and City Council.

City of Ramsey 2040 Comprehensive Plan Update Land Use Plan Page 4 of 18
(3) Old Municipal Center Redevelopment Facilitate redevelopment of old municipal center site. Below are major work items to be completed:
1. Remove former Fire Station #2 and clean site
2. Close on sale of property, phase #2
3. Close out land-swap agreement with Meadow Creek Builders
Complete/Ongoinog Old municipal center site cleaned and ready for sale by Winter 2016. This tactic fits within EDA objectives 1 and the Council’s strategic plan.
Currently Sufficient: assuming moderate customer service demand levels, sufficient resources exist to complete this tactic as proposed. The Anoka County HRA account has been identified as a funding source for the demolition and site clean-up work in the past.
(4) Recruit new industry and major retail businesses to Ramsey
Ongoing Secure two new 30,000 square foot retail, and two new 30,000 square foot industrial facilities. This tactic fits within EDA objective 1. This tactic fits within the City’s strategic plan and Council policy discussions.
Currently Sufficient: this tactic requires assistance from the City’s real estate broker CBRE; and demand from the development market. In order to provide latitude on which method is selected to tackle this goal (several exist), staff is requesting an increase of the EDA marketing budget line item from $3,000 to $30,000 in 2017.
(5) Sell Surplus City Owned Land The City owns a large inventory of surplus land available for development. Attain shovel ready status for all listed City owned property (including cut/fill estimations and identifying major costs for development—such as required extension of public infrastructure).
Ongoing Land sales are closed. Staff shall provide an annual overview. This tactic fits within EDA objective 1. This tactic fits within the City’s strategic plan and Council policy discussions.
Currently Sufficient: assuming moderate customer service demand levels, sufficient resources exist to complete this tactic as proposed. This work item does require use of third-party professional services (Shovel Ready Certifications and subsequent due-diligence). TIF #1 has been identified as a funding source for this work.
(7) COR Development Pro-Forma and Policy The City of Ramsey has taken the role of master developer for The COR. From a development perspective, the list of City obligations (expenditures) for The COR is relatively long, and at this point not well-defined. Additionally, the list of revenue streams from The COR is relatively straight forward, but have been committed informally in several instances. Staff would like to develop a pro-forma for The COR outlining all anticipated expenses and all anticipated revenues for the project.
2018 Completed development pro-forma. This work will require assistance from third party professionals:
(A) infrastructure analysis for The COR--$20,000-$30,000. (B) regional stormwater plan for The COR--$15,000-$30,000. (C) updated sign plan and cost estimates for The COR--$5,000-$15,000.
At this point, the numbers outlined above a very preliminary. Staff would like to get quotes for EDA review.

City of Ramsey 2040 Comprehensive Plan Update Land Use Plan Page 5 of 18
NOTE: this work has been partially completed in the past in many different forms (i.e. Landform, Ehlers, City C.I.P., etc.). This discussion also warrants the City to take policy positions on various items (i.e. expenses) and how they will be paid for (all city, all developer, split, etc.), and roughly when various improvements will be made. Completion of this pro-forma will put the City in a much better position to effectively analyze development proposals, strategize marketing efforts (i.e. pricing of land), budget discussions, and various policy items.
Staff anticipates various funding sources will be utilized to implement this work.
(8) RALF The Metropolitan Council reinstated the RALF (revolving acquisition loan fund) program in 2015 with eligibility modifications which significantly affect cities’ ability to use this program. In fact, since the 2015 rule change, no RALF awards have been made by the Metropolitan Council, to any city Staff would like the EDA/ City Council to consider pursing amendments/ exceptions to the RALF program criteria. Staff is receiving requests/ inquiries from Highway 10 property owners RE this subject; which are intensifying with time. Staff would like to submit a RALF application to the Metropolitan Council to test/ challenge their new policies and positions. Additionally, said application will serve as a base point for future policy discussions for the City of Ramsey.
2018 A RALF program that can actually be utilized by the City of Ramsey.
No additional resources requested. Normal staff duties.
(9) Business Incubator Consider utilizing vacant space on the second floor of the Ramsey Municipal Center for a business incubator
2018 Decide if the City has a genuine interest in starting a business incubator.
At this point, no additional resources are being requested. Based on the scope of this project, additional resources will be needed.

City of Ramsey 2040 Comprehensive Plan Update Land Use Plan Page 6 of 18
program—(or a cowork space, COCO). Staff would like to kick the process with a scoping meeting (i.e. how should we approach this task).
Have a general scope for what a business incubator means in Ramsey.
(10) ZIP Code In 2015, the City of Ramsey did open its doors to the first ever Ramsey substation USPS Post Office. Although this is a positive step for Ramsey, the need for an independent zip code still exists. The purpose of this tactic is to pursue an independent zip code for our community. Process:
1. Meet USPS minimum standards for obtaining a new zipcode (delivery points, deliver routes, scheme items, sectors). The City needs to submit a request for an audit.
2. USPS audit made—Ramsey either meets minimum thresholds or not. If they do, move on to step 3.
3. USPS conducts a survey of community to gather feedback/ support for a new zip code.
4. USPS grants Ramsey a new zip code.
2018 Approval or denial of a new Ramsey zip code.
No additional resources requested. Normal staff duties.

City of Ramsey 2040 Comprehensive Plan Update Land Use Plan Page 7 of 18
Existing Industrial Opportunities Put something here.
Ramsey/Anoka Industrial Park. Put a description here. It is 1,000 acres.
About 1,000 acres
About 15,000 jobs
Hundreds of businesses, with a high concentration of manufacturing
Future Industrial Opportunities Put something here.
New 115-acre business park NW of new interchange
15-acre Connexus site, within existing business park.
9.3-acre city owned site, within existing business park.
Bunker Lake Industrial Park Put a description here.
Figure 1: Map of Bunker Lake Industrial Park

City of Ramsey 2040 Comprehensive Plan Update Land Use Plan Page 8 of 18
Figure 2: PSD, LLC Master Plan
Figure 3: Hageman Holdings

City of Ramsey 2040 Comprehensive Plan Update Land Use Plan Page 9 of 18
Retail Development Goals Describe our retail goals here. 115 acres guided for future retail development.
Figure 4: Retail Guided Areas
Create a map of the areas guided for retail.
Retail Goals in The COR Table 1: Planned Growth in The COR
Rum River Hills This is the 167th Node.
Background The retail node located at 167th Avenue and Trunk Highway 47 has been a topic of discussion with City Councils and EDA boards for several years (“167/47 Node”). The 167/47 Node has struggled to become economically viable for some time, is experiencing high vacancy rates, an increase of blighted building conditions and escalating crime. The City has received a significant number of inquiries from property and business owners located in the 167/47 Node from 2012 to 2013 requesting assistance to address concerns. Additionally, the City of Ramsey owns an inventory of real property located adjacent to the 167/47 Node totaling 16.52 acres. Said property was identified as surplus City owned land in 2012 and is available for sale. The EDA, Planning Commission and City Council have expressed interest in addressing the 167/47 Node.
Purpose Guide City participation in the redevelopment of the 167/47 Node; and, specifically identify a common goal, vision, working parameters and garner public input.
0
20
40
60
80
100
Residential Office Retail Public Realm
70%
35%15%
35%
30%
65%85%
65%
COR Development Progress – by acreage (rough estimates only)
Complete Additional Planned

City of Ramsey 2040 Comprehensive Plan Update Land Use Plan Page 10 of 18
The desired outcome of this document is to develop a clear, consistent, transparent and fair process the City, prospective developers, property owners and Staff can rely on as proposals are received. The Ramsey Economic Development Authority (EDA) shall act as first point of contact for City in relation to the 167/47 Node by utilizing this Statement of Goals. Note: The City Council makes all final policy decisions; which may deviate from this document. This document is not a legally binding agreement.
Goal To improve and/or remove blight from properties-of-concern and encourage sustainable market-driven redevelopment of the 167/47 Node that will benefit the entire City of Ramsey. Figure 5: Area of Concen

City of Ramsey 2040 Comprehensive Plan Update Land Use Plan Page 11 of 18
Vision A mixture of residential and retail uses. Residential users may include single family residential, townhomes, or senior living units as directed by the market. Retail will include a market driven neighborhood commercial node. Redevelopment of the 167/47 Node should include a connection to Elmcrest Park and/or nearby trails where feasible.
Parameters Listed below are a number of parameters intended to develop a clear, consistent, transparent and fair process the City, prospective developers, property owners and Staff can rely on as proposals and inquiries are received.
A. CITY LAND ACQUISITION: The City does not support purchasing property to redevelop the 167/47 retail node.
B. MARKETING: The Ramsey EDA does support facilitating a professional marketing package for the 167/47 retail node to entice redevelopment/investment; which would include:
I. Information matrix: asking prices, County valuations, tax information, utility information, ownership buy-in, maps, current zoning information, future land use information, etc.
II. An inventory of what City and State financial assistance options exist for a potential redevelopment project.
III. List of desirable uses (i.e. retail and wide range of residential); and, other allowable uses (i.e. compatible to surrounding residential)
IV. Professional material developed in partnership with the City and proactively marketed by a third party broker. Broker will be chosen by ownership group.
V. Marketing material shall be paid for by the ownership group. The Ramsey EDA is willing to considering financially contributing to this effort.
C. ZONING:
I. The City would support a Comprehensive Plan and Zoning Amendment to allow retail or residential (of the appropriate density that balances compatibility of the surrounding area and market viability) land uses at 167/47 Node.
II. The Planning Commission will review requests for additional Permitted or Conditional Uses.
D. CITY FINANCIAL ASSISTANCE:
I. AVAILABLE TOOLS: The City has a number of financial assistance programs potentially available for qualified projects; including
1. Redevelopment Tax Increment Financing District (TIF)

City of Ramsey 2040 Comprehensive Plan Update Land Use Plan Page 12 of 18
2. Tax Abatement 3. EDA Revolving Loan Fund (RLF) 4. Anoka County HRA Account 5. State Redevelopment Grant and Loan Program 6. Land Write Down (City Owned Parcels)
The City will consider all financial assistance programs listed above only for projects that directly address existing blighted properties; see Appendix A: Primary Area of Concern. Utilization of financial assistance requires completion and approval of a Business Subsidy Application by the Ramsey EDA and City Council. Consideration will be based on the merits of an individual project and community benefit.
II. EDA REVOLVING LOAN FUND (RLF) Upon adoption of this Statement of Goals, the Ramsey EDA will review alternatives to utilize the City’s existing Revolving Loan Fund (RLF) to stimulate cleanup and revitalization of the 167/47 Node. This may include, but is not limited to the following:
i. Storefront Matching grants to help encourage/spark the ‘clean-up’ or improved ‘curb-appeal’ of properties. For example, a matching grant with a $10,000 maximum City contribution.
ii. Revitalization Loan Program: low interest loans that are tied to revitalizing properties to a marketable condition. NOTE: the City has about $275,000 available for these types of programs. This effort would require the creation and adoption of new program polices.
III. PEDESTRIAN UNDERPASS
It has been requested, for the City to consider funding a pedestrian underpass to connect the east and west side of MN trunk Highway 47. A pedestrian underpass would increase public safety, enhance connectivity to and from Elmcrest Park and increase foot traffic to retail businesses.
At this point, the City will not pre-commit a specific funding source, or specific dollar amount, to a pedestrian underpass. The City would react to this specific request at the time of future development; and, would base their response on the merits of a project—and the value it will bring to the community. Examples of potential funding solutions below:
i. Cost Share Agreement with developer (most desired) ii. Redevelopment TIF District proceeds iii. Grant Programs (various) iv. Park/Trail Dedication Fees (from 167/47 area, new development) v. Land Write Down Contribution (city owned parcels) vi. Anoka County HRA Account
NOTE: When future development occurs, the City will consider methods beyond a pedestrian underpass for increasing safety at the 167/47 intersection.

City of Ramsey 2040 Comprehensive Plan Update Land Use Plan Page 13 of 18
IV. SEWER TRUNK FUND
The 167/47 Node is not currently connected to City sanitary sewer service. Extending sanitary sewer service to this node will make properties more attractive for future development and will provide existing property owners with an alternative to the use of septic tanks. Presently, the City of Ramsey is not willing to fully fund a special sanitary sewer service line to the 167/47 Node. However, if a property owner (or developer) was willing to share the cost of extending sewer service, the City would be willing to discuss an agreement.
NOTES: The cost of extending a special 8” force main sanitary sewer line to the 167/47 Node is estimated to be $1.5M. It is estimated, at full build out, the special 167/47 Node sewer trunk line would recapture $500,000-$750,000 in sewer trunk fees (based on 2012 adopted sewer trunk fees). Therefore, a shortfall of $750,000-$1M in funding would occur. Additionally, extending an undersized, special, sanitary sewer line to the 167/47 node may result in extra costs (in the long run) if the City ever decided to serve the north east portion of the Ramsey with sanitary sewer service. Today, the City does have sufficient trunk fund dollars to pay for the 167/47 Node special sanitary sewer line. However, the City is planning for sanitary sewer service in three other future growth locations in Ramsey. Unlike the 167/47 Node, said areas do have sufficient forecasted development capacity to fully recapture the cost of proposed future sanitary sewer trunk lines.
Public Input Two levels of public input were critical to this Statement of Goals: (A) Primary Property Owners; and (B) Surrounding Property Owners.
A. Primary Property Owners: Primary property owners are outlined in Appendix B. The City does support facilitating an ownership meeting group to brainstorm options, share information and to investigate opportunities for redevelopment and additional uses that are compatible with the surrounding residential area. This effort will be led by the Economic Development Authority (EDA).
The City desires a consistent, collaborative approach with a single voice amongst all property owners. Several separate messages per individual property owner is not a desired nor effective approach. The City has received direction from surrounding property owners to market the entire 167/47 Node as an opportunity to developers—rather than only marketing properties individually. Through the EDA, the City will explore options to support a joint marketing effort for the 167/47 Node.

City of Ramsey 2040 Comprehensive Plan Update Land Use Plan Page 14 of 18
B. Surrounding Property Owners:
On September 26, 2013, the City of Ramsey hosted a collaborative public process with residents to discuss opportunities and barriers for redevelopment of the 167/47 Node. The intent of this process was to garner general public input before specific development proposals were crafted and reviewed by the City; and, before this Statement of Goals was adopted. The planning and facilitation of this public input process was led by the Planning Commission. 232 nearby property owners were invited via direct mailing, 26 participants registered and staff estimates over 30 people attended. The following summarized public input was received:
I. PUBLIC UN-DESIRED USES
Manufacturing
Warehousing (in most cases)
High density housing
II. PUBLIC DESIRED USES/IMPROVEMENTS
Grocery store, coffee shop, convenience store, gun range,
bar/lounge, hardware store, restaurant
Anchor businesses
Single family homes, retirement homes
Townhomes are acceptable (in most cases)
City support, light at intersection, address septic/sewer
More rooftops and population needed
Continued on next page.

City of Ramsey 2040 Comprehensive Plan Update Land Use Plan Page 15 of 18
Rum River Hills Redevelopment Plan The Rum River Hills has proposed a redevelopment plan to the City.
Figure 6: Rum River Hills Development Plan
Economic Development Tools
The City of Ramsey has a number of financial tools available for economic development projects. Below is an overview of common economic development tools. GAP FINANCING:
1. Ramsey Revolving Loan Fund (RLF) 2. Minnesota Investment Fund (MIF)
The City’s RLF and the DEED MIF programs are used to fill the financial “gap” of a particular project. A financial gap occurs when private financing and/or owner equity cannot fund an entire project. Commonly, these programs are used to purchase equipment; however, other eligible uses exist. Interest rates and terms are negotiable.
DEED JOB CREATION FUND:
3. Capital Investment Rebate 4. Job Creation Rebate
DEED assistance to projects that have capital investment and provide well-paying jobs. Program would allow for a company to receive a 5% rebate on capital expenditures (construction costs, materials etc.) up

City of Ramsey 2040 Comprehensive Plan Update Land Use Plan Page 16 of 18
to $500,000. In addition, this program allows for up to $500,000 in job creation rebates based upon jobs created and their salary levels.
PROPERTY TAX PROGRAMS:
5. Tax Abatement 6. Tax Increment Financing (TIF)
Tax abatement and TIF are local tax programs typically used for development or land acquisition costs. In general, both programs work by capturing property taxes generated by a particular parcel then dedicating said tax revenue for a specific project cost.
PRIMARY FINANCING:
7. Private Primary Lender and/or Owner Equity [no involvement from City] 8. Industrial Revenue Bonds (IRB)
Typically, projects are funded in large part by a private primary lender and with some level of owner equity. Certain manufacturing projects are eligible for complete funding via Industrial Revenue Bonds (IRB). IRBs are have a tax exempt status—which results in a lower interest rate for the borrower.
HOW DO I KNOW WHAT TOOLS I AM ELIGIBLE FOR? Identifying finical tools your business may be eligible for is a clearer and cleaner process if project specs can be provided to the City (i.e. project budget, job details, building specs, etc.). DISCLAIMER: Eligibility for financing tools based on the merit of an individual project, compliance with specific program requirements and in many cases approval from the Ramsey EDA and City Council. The City of Ramsey targets quality projects with high quality job growth. Typically, projects require owner equity and/or private financing. Most programs require specific job creation goals and annual reporting. The following pages provide detailed information on each program.
Tax Increment Financing Description goes here.
Figure 7: Development District No. 1
A map of Development District No. 1.
Figure 8: Tax Increment Financing Districts
A map of TIF Districts.
Economic Development Implementation The Metropolitan Council’s Regional Development Framework, ThriveMSP 2040, outlines roles for the
Metropolitan Council and Ramsey for land use policy. Specific to land use policy, the Metropolitan Council
has set a goal for the region to achieve Economic Competitiveness.
Ramsey Role
Consider how local efforts to focus economic development strategies along existing commercial centers (historic downtowns or commercial corridors) can contribute to the region’s overall economic
Metropolitan Council Role
Invest in regional amenities and services,
including transit, regional parks and trails, and bikeways to support the Emerging Suburban Edge area as an attractive place to locate and do business.

City of Ramsey 2040 Comprehensive Plan Update Land Use Plan Page 17 of 18
competitiveness through enhanced integration of local and regional planning efforts.
Protect sites for highway-, river- and rail-dependent manufacturing and freight transportation needs from incompatible uses and identify local land supply and transportation needs for effective use of those sites.
Identify important multimodal intersections, alternative freight routes, key intersections, and other existing opportunities that may contribute to local and regional economic competitiveness.
Promote local planning around key intersections, regional infrastructure, and business needs.
Support the development of workforce housing to provide nearby housing options for employees of local employers.
Convene interested partners to further strategies towards increasing regional competitiveness and include discussion of how Emerging Suburban Edge communities can contribute to the region’s overall economic growth.
Action Priority Timeframe

City of Ramsey 2040 Comprehensive Plan Update Land Use Plan Page 18 of 18
List of Tables
Table 1: Planned Growth in The COR ........................................................................................................................... 9
List of Figures
Figure 1: Map of Bunker Lake Industrial Park............................................................................................................... 7 Figure 2: PSD, LLC Master Plan ...................................................................................................................................... 8 Figure 3: Hageman Holdings ............................................................................................................................................ 8 Figure 4: Retail Guided Areas ........................................................................................................................................... 9 Figure 5: Area of Concen ................................................................................................................................................ 10 Figure 6: Rum River Hills Development Plan ............................................................................................................. 15 Figure 7: Development District No. 1 .......................................................................................................................... 16 Figure 8: Tax Increment Financing Districts ............................................................................................................... 16