GMR18133 - Resolve a DOI Name
18
©FUNPEC-RP www.funpecrp.com.br Genetics and Molecular Research 18 (1): gmr18133 Evaluation of the capacity of the DNA barcode ITS2 for identifying and discriminating dryland plants W.S. Al-Juhani Biology Department, Faculty of Applied Science, Umm Al-Qura University, Makkah, KSA Corresponding author: W.S. Al-Juhani E-mail: [email protected] Genet. Mol. Res. 18 (1): gmr18133 Received September 02, 2018 Accepted February 21, 2019 Published March 28, 2019 DOI http://dx.doi.org/10.4238/gmr18133 ABSTRACT. Many of the plants that grow in arid and semi-arid regions under harsh conditions (drought, salinity and misuse) are of medical importance. Desert plants also provide other benefits; so conservation efforts should be strengthened in these areas. In this study, three DNA barcodes – chloroplast maturase-K (matK), ribulose-1,5-bisphosphate carboxylase/oxygenase (rbcL) and secondary internal transcribed spacer (ITS2) – were tested in order to determine the ability of these markers to distinguish between various species. A total of 93 fresh and dry samples belonging to 30 plant families were examined. These are native to the arid lands around Makkah in the Kingdom of Saudi Arabia. Various tools and tests were used to evaluate the efficiency of the barcode markers; these included the basic local alignment search tool (BLAST), as well as the use of inter- and intraspecific distances, barcode gap, prediction of the secondary structure of the ITS2 and phylogenetic methods. The results confirmed the efficiency and superiority of the ITS2 loci over two chloroplast genes: matK and rbcL. ITS2 had a 97% success rate with amplification and a 95% success rate with sequencing, showing 100% identification at the family level, 77% identification at the genus level and 70% species resolution. A clear barcode gap was observed between inter- and intraspecific distances. Identification was achieved even in cases of degraded samples or old herbarium
-
Upload
khangminh22 -
Category
Documents
-
view
1 -
download
0
Transcript of GMR18133 - Resolve a DOI Name

©FUNPEC-RP www.funpecrp.com.br Genetics and Molecular Research 18 (1): gmr18133
Evaluation of the capacity of the DNA barcode
ITS2 for identifying and discriminating dryland
plants
W.S. Al-Juhani
Biology Department, Faculty of Applied Science, Umm Al-Qura University,
Makkah, KSA
Corresponding author: W.S. Al-Juhani
E-mail: [email protected]
Genet. Mol. Res. 18 (1): gmr18133
Received September 02, 2018
Accepted February 21, 2019
Published March 28, 2019
DOI http://dx.doi.org/10.4238/gmr18133
ABSTRACT. Many of the plants that grow in arid and semi-arid
regions under harsh conditions (drought, salinity and misuse) are of
medical importance. Desert plants also provide other benefits; so
conservation efforts should be strengthened in these areas. In this
study, three DNA barcodes – chloroplast maturase-K (matK),
ribulose-1,5-bisphosphate carboxylase/oxygenase (rbcL) and
secondary internal transcribed spacer (ITS2) – were tested in order to
determine the ability of these markers to distinguish between various
species. A total of 93 fresh and dry samples belonging to 30 plant
families were examined. These are native to the arid lands around
Makkah in the Kingdom of Saudi Arabia. Various tools and tests
were used to evaluate the efficiency of the barcode markers; these
included the basic local alignment search tool (BLAST), as well as
the use of inter- and intraspecific distances, barcode gap, prediction
of the secondary structure of the ITS2 and phylogenetic methods. The
results confirmed the efficiency and superiority of the ITS2 loci over
two chloroplast genes: matK and rbcL. ITS2 had a 97% success rate
with amplification and a 95% success rate with sequencing, showing
100% identification at the family level, 77% identification at the
genus level and 70% species resolution. A clear barcode gap was
observed between inter- and intraspecific distances. Identification
was achieved even in cases of degraded samples or old herbarium

©FUNPEC-RP www.funpecrp.com.br Genetics and Molecular Research 18 (1): gmr18133
W.S. Al-Juhani 2
specimens. This study contributes to DNA barcode data by adding
224 DNA sequences of desert plants to the National Center for
Biotechnology Information NCBI database. The results of this study
are important and useful for application in each of the following
fields: validation of medicinal plant identity, conservation, and
taxonomic and evolutionary studies.
Key words: DNA; Barcodes; ITS2; rbcL; matK; Desert plant
INTRODUCTION
Identification of organisms has important applications. However, determining a
species based on phenotypic traits is a difficult and time-consuming task that requires expert
input, which is not always available. DNA barcoding is emerging as a reliable method for
species identification. It uses a short sequence of a universal standard part of a genome
instead of using the whole genome in order to verify the identity of specimens.
The Mitochondrial CO1 region has been recommended as the standard barcode for
animals (Hebert et al., 2003). However, the mitochondrial genome is not suitable for DNA
barcodes in land plants because it slowly evolves with a low rate of substitution (Fazekas et
al., 2008). This affects the use of this genome to distinguish between plant species. The
chloroplast genome is used as the standard in plants because it has a stable genetic structure
in haploid form and is parentally inherited (Xiwen et al., 2015).
The Consortium for the Barcode of Life ([CBOL]; CBOL Plant Working Group,
2009) recommended the use of chloroplast maturase-K (matK) and ribulose-1,5-
bisphosphate carboxylase/oxygenase (rbcL) genes as a universal barcode for vascular
plants. There has been a clear increase in DNA barcode applications in recent years, for
example, for resolving identification and taxonomy issues. Different types of DNA
barcodes have been applied to plant species, but the most frequently used are matK and
rbcL markers. These were used for identification and taxonomic studies of five species of
the genus Andrographis, belonging to the family Acanthaceae (Arolla et al., 2015). Lin et
al. (2015) used 27 prescreened chloroplast DNA (cpDNA) regions to screen Phalaenopsis
species. Similarly, Nithaniyal and Parani (2016) used rbcL, matK, internal transcribed
spacer 2 (ITS2) and trnH-psbA markers for identification of Terminalia spp. Martin et al.
(2016) reported that DNA barcoding of ITS in the nuclear ribosomal DNA (nrDNA) region
supported the separation of Chroogomphus mediterraneus from C. rutilus. In Mezzasalma
et al.’s (2017) study, four barcode loci – rbcL, matK, trnH-psbA and ITS – were used to
identify the traditional medicine species Cyperus articulatus within the natural flora of the
Amazon.
This method is also used to check herbal medicines. As well as using DNA
barcodes for phylogenetic analysis and genetic diversity, Patil et al. (2016) used eight
plastid (matK, rbcL, trnH-psbA, rpoC1, ycf5, rpoB, atp and psbK-psbI) and six nuclear ITS
markers to examine the phylogenetic relationships among 19 species of the genus
Chlorophytum. Silva et al. (2015) studied the phylogenetic relationships among 18 species
of Spondias of the family Anacardiaceae using cpDNA barcodes for the trnH-psbA spacer
gene. In addition to using the chloroplast genome for detecting aquatic invasive plant
species, Scriver et al. (2015) examined three regions – matK, rbcL and trnH-psbA in 10

Genetics and Molecular Research 18 (1): gmr18133 ©FUNPEC-RP www.funpecrp.com.br
DNA barcode ITS2 for dryland plants 3
species of invasive plants. Yang et al. (2017) examined intraspecific differences among 13
species in the subgenus Potamogeton in China using seven cpDNA barcodes (trnL-trnL-
trnF, rpl20-rps12, trnG intron, trnH-psbA, matK and rbcL) and two nuclear markers (ITS
and PHYB), They recommended used PHYB as the most efficient candidate to detect
divergence among Potamogeton species.
Although the chloroplast genes matK and rbcL have become the most commonly
used loci in land plants, several studies have identified problems with these two markers.
The rbcL gene has usually been successfully amplified and has given good sequencing
results, but low variation in sequence data affects its discriminatory power (Michel et al.,
2016; Mohamed, 2016). With regard to matK, amplification and application has been
difficult in many families, and it cannot be considered a universal barcode region. Standard
DNA barcoding must be present in most taxa levels; with easy amplification and
sequencing, and they should have wide variation across species and little variation within a
species (Sarvananda, 2018).
Several researchers (Pan et al., 2009; Chen et al., 2010; Braukmann et al., 2017)
have shown the ability of ITS2 to discriminate between specimens of different genera. The
suitability of the ITS2 region for use as a DNA barcode was tested by Chen et al. (2010) on
6,600 specimens, representing 4,800 species and 753 genera of the most important
medicinal plants in China. They compared its power of discrimination to that of six other
loci (trnH-psbA, matK, rbcL, rpoC1, ycf5 and ITS). The results confirmed that ITS2 had
superiority over the rest of the markers, with a 92.7% rate of successful identification. Most
recently, a study by Braukmann et al. (2017) involved a large number of plants and families
and covered a wide range of geographical diversity. They used three DNA barcode regions
(rbcL, matK and ITS2) to identify 4,923 species, 1,153 genera and 171 families of vascular
plants that grow in Canada. The results showed that rbcL had the highest percentage of
amplification and sequencing (90–100%), followed by ITS2 (~90%), whereas matK had the
lowest percentage (56–90%). ITS2 had the highest level of discriminating power and
species resolution (79–93%), followed by matK (45–80%) and rbcL (17%–92%). Yu et al.
(2017) found that even with a short sequence length (ranging from 220 to 241 bp), ITS2
was 100% successful in identifying 127 samples of Trachelospermum jasminoides used in
traditional Chinese medicine.
The Kingdom of Saudi Arabia (KSA) is located in Southwest Asia. The Rub Al-
Khali desert covers the southern areas of the kingdom’s topography; it is the largest
continuous sand desert in the world (Vincent, 2008). The climate of the KSA is dry and hot
in summer, with an average temperature of around 35°C, but temperatures can reach 50°C
and above between June and August. Many of the plants in arid environments have medical
importance and are still used in traditional medicine (Sher and Aldosari, 2012; AL-Eisawi
and Al-Ruzayza, 2015). Reliable methods for identifying these plants are critical not only
because of the medical value of these plants but also because of the need to preserve the
natural diversity of flora in this desert environment. Several previous studies have applied DNA barcoding techniques to plants native to
the KSA. Bafeel et al. (2012c) used matK and rbcL to identify Chenopodium murale
(Chenopodiaceae), and Bafeel et al. (2012b) used the rbcL gene to identify Coptosperma
graveolens subsp. arabicum (Rubiaceae). Khan et al. (2012a) used nuclear DNA ITS and
chloroplast rpoB and rpoC1 markers to identify Ochradenus arabicus (Resedaceae). Bafeel
et al. (2012a) used rbcL for identification and conservation of the endemic tree Mimusops

©FUNPEC-RP www.funpecrp.com.br Genetics and Molecular Research 18 (1): gmr18133
W.S. Al-Juhani 4
laurifolia (Sapotaceae). Al-Qurainy et al. (2013) used the nrDNA region ITS1-5.8S-IT5 to
assess the relationships among five rare species in the KSA: Scadoxus multiflorus
(Acanthaceae), Pancratium tortuosum (Amaryllidaceae), Senecio hadiensis (Asteraceae),
Commiphora myrrha (Burseraceae) and Heliotropium strigosum (Boraginaceae). Alaklabi
et al. (2014) used the rbcL gene to identify the endangered tree Diospyros mespiliformis
(Ebenaceae). Furthermore, Al-Qurainy et al. (2014) used the nuclear gene ITS for
identification of Nepeta deflersiana (Lamiaceae). Ali et al. (2015) used ITS1 and ITS4
primers in DNA barcodes to study the system of the genus Echinops (Asteraceae). Khan et
al. (2017) used six DNA barcodes – matK, rbcL, rpoB, rpoC1, atpF-atpH and psbK – to
identify the dryland medicinal plant Rhazya stricta (Apocynaceae).
Comparisons among these results are difficult because of variations in the types of
DNA barcode markers used. Most of these studies focused on a particular family or genus,
except that of Bafeel et al. (2011), which compared dryland plant samples and evaluated the
universal primers matK and rbcL located in 26 plant species from 14 plant families native to
Saudi Arabia. This study recorded a higher success rate in amplification with rbcL (88%)
than with matK (69%), though both failed to amplify the DNA of three species of the family
Asteraceae. The PCR products of matK were less than the expected size for two species:
Malva parviflora (Malvaceae) and Salsola imbricate (Chenopodiaceae). Bafeel et al. (2011)
recommended the use of a further set of primers that can be applied to a wide range of plant
species.
Our work had the following aims: 1) to examine and compare the possible use of
the molecular DNA barcodes ITS2, matK and rbcL for identifying desert plants; 2) to
determine the best of these three DNA barcode markers for resolving identification
questions and for discriminating among native KSA flora; and 3) to apply the recommended
universal barcodes to plants from different geographic regions and conditions.
MATERIAL AND METHODS
Study Area
The samples were collected from the Makkah district in Western KSA. The plants
in this region are adapted to growth in harsh conditions, including high temperatures,
drought and salinity, all of which impact the population. The number and types of plants
recorded in this area vary due to variable amounts of rain. Meelad (1987) recorded nearly
70 species native to the geographical area of Makkah, while Abdel et al. (2013) reported
104 species growing in the Makkah region.
Plant Material
The study samples included fresh leaves collected from 40 specimens from the
Makkah region in 2016 – 2017, which were dried in silica gel. An additional 53 herbarium
specimens were obtained from the Biology Department of Umm Al-Qura University
(Makkah), which had been collected from 1991 to 2015 from various locations in Makkah.
The total number of samples was 93, with 30 families, 71 genera and 80 species. The
samples comprised Makkah’s most important native flora, representing more than 70% of
the genera recorded in the region by Meelad (1987) and Abdel et al. (2013). (All

Genetics and Molecular Research 18 (1): gmr18133 ©FUNPEC-RP www.funpecrp.com.br
DNA barcode ITS2 for dryland plants 5
information relating to the study samples is available in Table S1.) The plants were
identified based on their morphology by referring to various sources (Migahid, 1996;
Chaudhary, 2000, 2001; e-floras.org: http://www.efloras.org) and were assigned to their
respective families.
DNA Extraction
Samples of dry leaves were collected from each plant. Total genomic DNA was
isolated from the leaves using a magnetic bead-based DNA extraction method (Azimi et al.,
2011). The quantity of extracted DNA was estimated using a Qubit 3.0 Fluorometer
(Thermo-scientific, Wilmington, USA). The quality of the DNA was checked using 1%
agarose gel electrophoresis and visualized under ultraviolet light, and the isolated DNA was
stored at -20°C.
Primer Sequences
The DNA regions rbcL and matK were amplified with universal DNA barcoding
primers (Plant Working Group, 2009). For the ITS2 locus, the primer sequences published
by Chen et al. (2010) were used. Table 1 shows the primers’ forward and reverse sequences
for each locus.
Table 1. Primers used for amplification of ITS2, matk and rbcl barcodes.
DNA Amplification and Sequencing
PCRs of rbcL and matK markers for the chloroplast genome were amplified
following the method described by Maloukh et al. (2017), using a total volume of 50 µL,
including 25 µL of Taq PCR Master Mix, 22 µL of distilled water, 1 µL of forward primer,
1 µL of reverse primer and 1 µL of the DNA template (50 – 80 ng/µL). Amplification was
performed in a Veriti 96-Well Fast Thermal Cycler (Applied Biosystems, CA, USA), with
an initial denaturation at 94°C for 3 min. This was followed by 35 cycles at 94°C for 1 min
and an annealing temperature at 55°C for 1 min, followed by 72°C for 1 min and a final
elongation at 72°C for 7 min.
The ITS2 region was amplified following the method described by Chen et al.
(2010), using 25-µL reaction volumes containing 12.5 µL of Master Mix, 8.5 µL of
molecular grade water, 1 µL of each primer and 2 µL of the DNA template. Thermal
cycling was conducted with an initial denaturation at 94°C for 5 min, followed by 40 cycles
at 94°C for 45 s, 56°C for 45 s, 72°C for 1.5 min and a final extension final step at 72°C for
10 min. The successful amplifications of the ITS2, matK, and rbcL PCR products were
Region Primers Sequences F/R
ITS2 ITS2-2F: 5′-ATGCGATACTTGGTGTGAAT-3′
ITS2-3R: 5′-GACGCTTCTCCAGACTACAAT-3′
matK matK-KIM3F: 5'-CGTACAGTACTTTTGTGTTTACGAG3'
matK-KIM1R: 5' ACCCAGTCCATCTGGAAATCTTGGTTC-3'
rbcL rbcLa-F: 5'-ATGTCACCACAAACAGAGACTAAAGC-3'
rbcLa-R: 5'-GTAAAATCAAGTCCACCRCG-3'

©FUNPEC-RP www.funpecrp.com.br Genetics and Molecular Research 18 (1): gmr18133
W.S. Al-Juhani 6
checked by electrophoresis on a 1.5% agarose gel and by imaging using a UVP system;
sequencing was performed at Laragen Inc. (Culver City, CA, USA).
Bioinformatics Data Analysis
Forward and reverse sequences were assembled into contig sequences per sample
and per gene, performed in DNA Baser v. 4.16.0 (2013). The ITS2 region in each specimen
was detected using a hidden Markov model to remove the 5.8 S and 28 S sections, which
may overlap with the ITS2 region (Keller et al., 2009). A multiple sequence alignment was
run for each gene using the Muscle algorithm in MEGA5.2 (Tamura et al., 2011). The
sequences were manually adjusted, and ambiguous regions were removed.
The species resolution of the three DNA barcodes – ITS2, matK and rbcL – was
assessed using the basic local alignment search tool (BLAST) and the following methods:
pairwise genetic distance, inter- and intraspecific distance, barcode gap, prediction of the
secondary structure of the ITS2 and phylogenetic methods.
The BLAST was run against known specimens in GenBank. The identification
process took place on three levels: family, genus and species. The query sequences were
detected by selecting the highest maximum score and lowest E-value (Gao et al., 2011).
Outcomes were classified into three levels: A – correct identification, meaning
determination of the right species, genus or family; B – ambiguous identification, meaning
determination of several species, genera or families that included the right one; and C –
incorrect identification, meaning determination of species, genera or families that were not
correct (Meier et al., 2006).
Pairwise genetic distances for the ITS2, matK and rbcL regions in the three levels
were calculated using the Kimura two-parameter (K2P) model in MEGA 7.0.27 software
(Tamura et al., 2011; Kumar et al., 2016). Inter- and intraspecific distances were calculated
for the three barcode genes using the SpeciesIdentifier window in TaxonDNA v.1.7.8
(Meier et al., 2006). Barcode gaps in matK, rbcL and ITS2 were analysed using the
Automatic Barcode Gap Discovery (ABGD) (Puillandre et al., 2012) based on K2P
distance.
The secondary structure of the ITS2 sequences was predicted using the ITS2
ribosomal RNA database (http://its2.bioapps.biozentrum.uni-wuerzburg.de/; Schultz et al.,
2005). The trees of phylogenetic relationships were obtained by applying the neighbour-
joining (NJ) method, using the K2P model and 1000 bootstrap replications in MEGA 7.0.27
software (Kumar et al., 2016). The tree of each gene was evaluated based on the ability of
the species under each family to cluster in one clade or to form a monophyletic group, in
addition to a bootstrap supporting value.
RESULTS
PCR and Sequencing
Genomic DNA isolation was successful for all the samples. PCR amplifications of
93 plant specimens yielded 90 results for rbcL (97%), 82 for matK (88%) and 90 for ITS2
(97%), as shown in Table 2. Ninety (97%), 82 (88%) and 88 (95%) of the specimens were

Genetics and Molecular Research 18 (1): gmr18133 ©FUNPEC-RP www.funpecrp.com.br
DNA barcode ITS2 for dryland plants 7
successfully sequenced in the rbcL, matK and ITS2 loci, respectively. The sequence length
ranged from 201 to 348 bp for ITS2, 792 to 964 bp for matK and 584 to 628 bp for rbcL.
Sequencing success varied according to the family. The lowest success rates were
found for matK in members of Ephedraceae (50%) and Poaceae (12.5%) families. There
was a mixed sequence in ITS2 for the Apocynaceae family (20%). However, RbcL, matK
and ITS2 gave 100% amplification and sequencing success in some families, such as
Amaranthaceae, Asteraceae and Fabaceae.
In terms of sequence length for ITS2, the longest sequence was from Forsskaolea
tenacissima (Urticaceae; 348 bp), and the shortest was from Farsetia aegyptia
(Brassicaceae; 201 bp). The longest matK sequence was from Malva parviflora
(Malvaceae) with 964 bp, while the shortest was 792 bp, which was produced by Panicum
turgidum (Poaceae). Of the rbcL sequences, Boerhavia diffusa (Nyctaginaceae) was the
longest (628 bp), while the shortest at 584 bp was Cotula abyssinica (Asteraceae; see Table
2).
The guanine-cytosine content (GC) ranged from 40.6 to 66.5 with an average of
57.1 in ITS2, whereas in matK, the range was 27.8–37.8 with an average of 33.2. In rbcL,
the GC percentage ranged from 40.6 to 58.4 (43.3 average). These results are shown in
Table 2.
Table 2. Evaluation of three DNA barcoding regions used in the study of dryland plants.
Species Resolution and Barcode Analysis
Based on the BLAST data, the sequence homology had a mean of 98, 95 and 99%
for ITS2, matK and rbcL, respectively. The mean of the inquired sequences was 86, 95 and
98% for ITS2, matK and rbcL, respectively. E-values were ≤ (0) for the three genes.
ITS2 sequences were correctly identified by 100, 77.2 and 70.4% at family, genus
and species levels, respectively. In terms of ambiguous sequences, identification was 4.6
and 6.8% for genus and species levels, while ITS2 identification was incorrect at 18.1 and
22.7% for the genus and species levels, respectively (see Figure 1). For the matK sequences,
the specimens were correctly assigned by 100, 66.6 and 53.9% at family, genus and species
levels, whereas ambiguous detection was 11.1 and 17.7% for genus and species levels,
respectively. MatK identification was incorrect by 22.2 and 28.3% for genus and species
levels, respectively. The rbcL successfully assigned sequences at the levels of family
(100%), genus (63.4%) and species (45.5%), whereas identification was ambiguous by 1.2
and 22.2% for genus and species levels, respectively. Incorrect rbcL identification was
observed for genus (35.3%) and species (32.2%) levels, as shown in Figure 1.
Variable DNA region
ITS2 matK rbcL
Number of samples 93 93 93
Mean and range of GC content (%) 57.1 (40.6–66.5) 33.2 (27.8–37.8) 43.3 (40.6–58.4)
Efficiency of PCR amplification (%) 90 (97%) 82 (88%) 90 (97%)
Success rate of sequencing (%) 88 (95%) 82 (88%) 90 (97%)
Amplified product length (bp) ~200 ~800 ~600
Mean and range of sequenced length (bp) 227 (201–348) 870.33 (792–964) 601 (584–628)

©FUNPEC-RP www.funpecrp.com.br Genetics and Molecular Research 18 (1): gmr18133
W.S. Al-Juhani 8
Figure 1. Identification success of dryland plant specimens at three levels (family, genus and species) using
BLAST and matching sequences to the NBCI database. Total sequences for rbcL = 90, ITS2 = 88 and matK = 82.
The values in the columns were estimated in percentages (%).
Interestingly, the ITS2 sequences for Phyllanthus rotundifolius, Dipterygium
glaucum, Steinheilia radicans, Tetraena coccinea, Tetraena simplex and Tripteris vaillantii
were not available in either the NCBI or Barcode of Life databases. The following matK
groups were also unavailable in the GenBank database: Phyllanthus rotundifolius,
Leptadenia pyrotechnica, Forsskaolea tenacissima, Tephrosia uniflora, Heliotropium
europaeum L., Heliotropium strigosum and Cotula abyssinica.
The interspecific distances for the three barcode loci using TaxonDNA software are
shown in Table 3. The ITS2 locus gave a higher interspecific mean than the two other
markers (0.76%); rbcL gave the lowest value (0.38%), while the matK value was 0.63%.
The intraspecific distances were the lowest in ITS2 (0.03) and were 0.08 and 0.10 for rbcL
and matK, respectively, which reflects the utility of the ITS2 marker.
Table 3. Inter- and intraspecific distance for the three barcode loci and dryland plant samples using the taxon
DNA software.
The comparison between specimens in terms of the pairwise genetic distance
presented in Table 4, show that the mean genetic distance of the ITS2 locus was much
higher than the mean distance of both marK and rbcL loci at three taxa levels for the three
genes.
Locus Intraspecific distance Interspecific distance
Min. Max. Mean. Min. Max. Mean.
ITS2 0.00 0.49 0.03 0.00 0.82 0.76
matK 0.00 0.73 0.10 0.00 0.76 0.63
rbcL 0.00 0.75 0.08 0.00 0.79 0.38

Genetics and Molecular Research 18 (1): gmr18133 ©FUNPEC-RP www.funpecrp.com.br
DNA barcode ITS2 for dryland plants 9
Table 4. Genetic divergence of dryland species based on pairwise genetic distances and three barcode loci using
MEGA 7.0.27 software.
Gene Level No. of Taxa Min. Dist. (%) Mean Dist. (%) Max. Dist. (%) Se Dist. (%)
ITS2
Within Species 75 0.032 0.170 0.289 0.010
Within Genus 66 0.032 0.172 0.289 0.010
Within Family 29 0.133 0.664 0.783 0.025
matK
Within Species 76 0.001 0.007 0.016 0.001
Within Genus 67 0.083 0.093 0.097 0.024
Within Family 29 0.078 0.623 0.741 0.016
rbcL
Within Species 77 0.000 0.005 0.030 0.001
Within Genus 68 0.000 0.010 0.070 0.003
Within Family 30 0.030 0.280 0.780 0.014
Min. dist.: minimum pair wise genetic; Max. dist.: maximum pair wise genetic; Mean dist.: mean pair wise
genetic. Se Dist.: Standard error distance.
The outcomes of applying the ABGD algorithm distance values are shown in
Figure 2, showing the barcode gap in the three DNA- barcode markers. The ITS2 gene
gave a clear gap between the intraspecific (right) and interspecific (left) distances.
Analysis was based on K2P genetic distances; the average nucleotide divergence was
0.71–1.05 for the two partitions of distance values obtained from 88 desert plant
samples. The pairwise intra-/interspecific genetic distances showed that the matK
marker grouped samples into two groups at various genetic distances (60–70): the first
was very close to the intraspecific distance, and the second was close to the
interspecific distance (0.70–1.0; Figure 2). In the rbcL marker, the distances were
narrow (0.70–0.80) compared to the matK and ITS2 markers.
Figure 2. Barcode gaps for three DNA barcodes (ITS2, matK and rbcL) based on the ABGD method and k2p
distance between samples of dryland plants. Total barcoded sequences for ITS2 = 88, for matK = 82 and for rbcL
= 90 individuals.
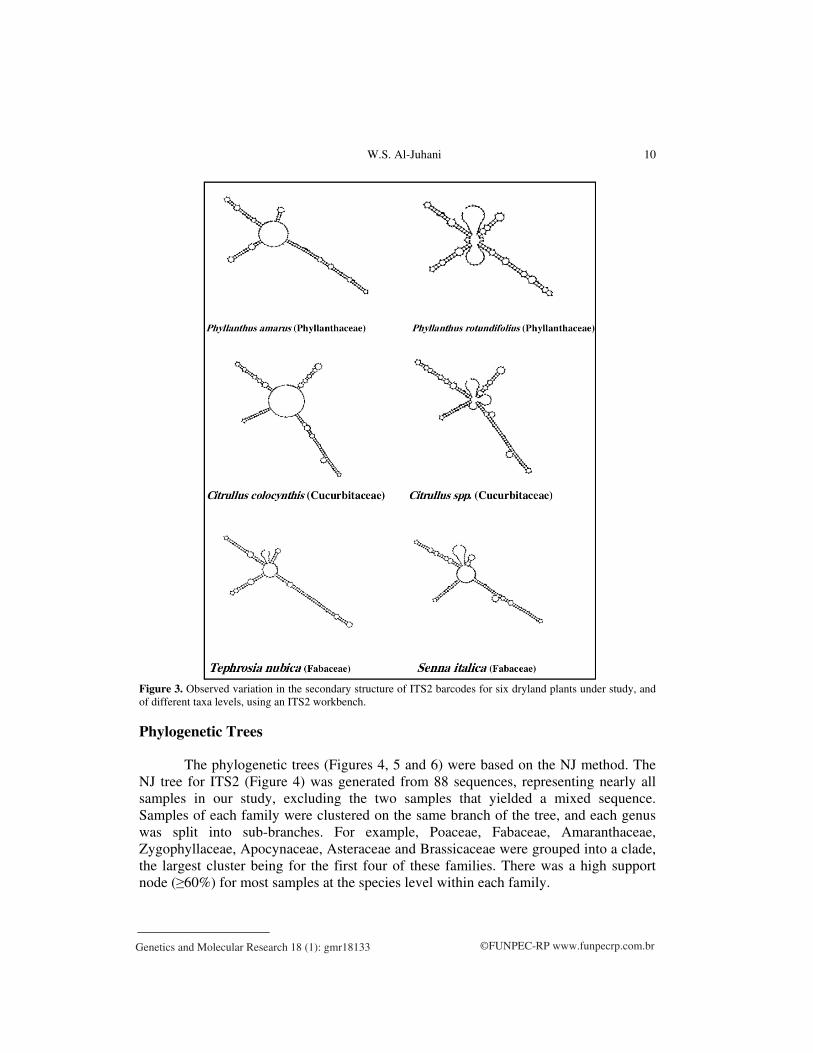
There were significant variations in the shape of the secondary structure of ITS2
in terms of stem loop number, size and position, which gave unique features to
distinguish between the specimens based on the molecular morphological
characteristics of these sequences. Figure 3 provides examples of the secondary
structure of the ITS2 for some study samples at different taxa levels.
©FUNPEC-RP www.funpecrp.com.br Genetics and Molecular Research 18 (1): gmr18133
W.S. Al-Juhani 10
Figure 3. Observed variation in the secondary structure of ITS2 barcodes for six dryland plants under study, and
of different taxa levels, using an ITS2 workbench.
Phylogenetic Trees
The phylogenetic trees (Figures 4, 5 and 6) were based on the NJ method. The
NJ tree for ITS2 (Figure 4) was generated from 88 sequences, representing nearly all
samples in our study, excluding the two samples that yielded a mixed sequence.
Samples of each family were clustered on the same branch of the tree, and each genus
was split into sub-branches. For example, Poaceae, Fabaceae, Amaranthaceae,
Zygophyllaceae, Apocynaceae, Asteraceae and Brassicaceae were grouped into a clade,
the largest cluster being for the first four of these families. There was a high support
node (≥60%) for most samples at the species level within each family.

Genetics and Molecular Research 18 (1): gmr18133 ©FUNPEC-RP www.funpecrp.com.br
DNA barcode ITS2 for dryland plants 11
Figure 4. Neighbor joining tree for ITS2 barcodes of 88 dryland plants. Bootstrap replications = 1000; most
branches showed strong support (≥ 60%) in addition to the sequence accession numbers for each sample.
The NJ tree for the matK gene had 82 sequences (Figure 5). Most species of the
same family belonged to one cluster, with strong support for the branches; however, some
species of the Asclepiadaceae and Boraginaceae families were not represented in
monophyletic groups. In addition, species belonging to the families Euphorbiaceae and
Plantaginaceae were clustered in different branches in the rbcL tree, which was constructed
of 90 sequences (Figure 6). The ITS2 tree appeared to be adequate in terms of the number
of species clustered in the monophyletic group of the right family and the values of the
support node.

©FUNPEC-RP www.funpecrp.com.br Genetics and Molecular Research 18 (1): gmr18133
W.S. Al-Juhani 12
Figure 5. Neighbor joining tree for matK barcodes of 82 dryland plants. Bootstrap replications = 1000; most
branches showed strong support (≥60%) in addition to the sequence accession numbers for each sample.

Genetics and Molecular Research 18 (1): gmr18133 ©FUNPEC-RP www.funpecrp.com.br
DNA barcode ITS2 for dryland plants 13
Figure 6. Neighbor joining tree for rbcL barcodes of 90 desert plants. Bootstrap replications = 1000; most
branches showed strong support (≥60%) in addition to the sequence accession numbers for each sample.
DISCUSSION
We used three barcode DNA regions (ITS2, matK and rbcL) for identifying and
differentiating among 93 specimens of desert plants. Based on the results, the matK region
gave difficulties in PCR amplification in several samples and in sequencing, with 88%
efficiency. Meanwhile, the rbcL region gave higher PCR amplification (97%) and
sequencing efficiency (97%); however the identification efficiencies were low at both the
genus (63.4%) and species (45.52%) levels. This finding was contrary to previous studies
that suggested using the rbcL barcode for the identification of rare desert plants. For
example, Maloukh et al. (2017) used rbcL and matK loci for a group of 51 native plants
(belonging to 22 families) from the United Arab Emirates. Our results are consistent with
those of Guo et al. (2016), as these authors mentioned the failure of the chloroplast genes
rbcL and matK in plant specimens identification. This issue is related to the process of
inheritance in the plastid region of the plant. Some researchers reported that they were
unable to discriminate between many species successfully when they combined the use of

©FUNPEC-RP www.funpecrp.com.br Genetics and Molecular Research 18 (1): gmr18133
W.S. Al-Juhani 14
rbcL and matK (Chen et al., 2010; Michel et al., 2016; Elansary et al., 2017). Chen et al.
(2010) mentioned that by using a combination of rbcL and matK, they were able to identify
only 550 out of 907 samples (72%).
In our investigation, the use of the nuclear DNA region ITS2 was the most effective
compared with the counterpart chloroplast genes matK and rbcL. ITS2 showed the greatest
ability to identify samples at the levels of genus and species (77.2 and 70.4%, respectively).
Zhang et al. (2015) argue that the most effective DNA barcode region for
identification in plants must have a high interspecific genetic divergence and a low
intraspecific distance. We found that interspecific divergence was highest in ITS2 (0.76%),
followed by matK (0.63%) and rbcL (0.38%). Another important finding was that the
intraspecific distance was lower in ITS2 (0.03) than both rbcL (0.08) and matK (0.10)
among the samples studied. This shows the superiority of the ITS2 marker and its relevance
for species identification.
The barcode gap is one of the most important tools for evaluating barcode quality
(Candek and Kuntner, 2015). In our study, the results of the ABGD algorithm showed a
significant barcode gap in ITS2, with clear partitions of distance values (0.71–1.05). The
discrimination power of a barcoding region is considered effective if the minimum
interspecies distance is greater than its maximum intraspecies distance (Tahir et al., 2018).
The mean genetic distance of the ITS2 locus was significantly greater than the mean
distance of both matK and rbcL loci. This demonstrates the higher resolution power of
ITS2. Similar results were reported by Li et al. (2016), who evaluated five DNA barcoding
regions (rbcL, matK, trnH-psbA, ITS and ITS2) of 127 individuals representing 40 species
and one variety of Oberonia from China. All three plastid candidates tested (rbcL, matK
and trnH-psbA) had a lower discriminatory power than the nuclear regions (ITS and ITS2),
and the ITS2 region had the highest resolution rate (82.14%). This study supports what has
been mentioned previously by (Hollingsworth, 2011), who referred to possibility to used
ITS2 region as alternatives to amplify ITS region in plant and it has a high discrimination
power, where it is amplified part of ITS region, this will be useful if it difficult to amplify
the whole nrDNA ITS region. This again supports the use of the nuclear gene ITS2 for the
identification of local flora and for phylogeny studies.
Our findings confirm the effectiveness of the ITS2 region and support the proposal
that the ITS2 region is universal in plants as a DNA barcode, corresponding to the CO1
region in animals (Chen et al., 2010). If this is the case, ITS2 has great potential for
identifying plants at both higher and lower levels. The China Plant BOL Group has
mentioned that The advantages of using nuclear DNA barcode ITS was outweigh its
disadvantages, and it will contribute to solving problems related to identification at the
species level (Hollingsworth, 2011). Braukmann et al. (2017) pointed out an important
property that supports the use of the ITS2 gene for standard DNA barcoding in plants: its
short length. This property makes amplification possible with fewer primers. The
superiority of nuclear genes could be explained by the abundant quantity of genetic
information and gene flow available in nuclear regions ( Petit and Excoffier, 2009; Naciri et
al., 2012).
In our study, we tested ITS2 on 93 samples grown in a harsh climate with difficult
environmental conditions. Many were preserved as old herbarium specimens, some of
which were in poor conservation conditions and showed evidence of degradation. Our
results show that ITS2 had a 97% amplification capacity with 77.2 and 70.4% successful

Genetics and Molecular Research 18 (1): gmr18133 ©FUNPEC-RP www.funpecrp.com.br
DNA barcode ITS2 for dryland plants 15
identification at the genus and species levels, respectively. Our results agree with those of
Yu et al. (2017), who found that the ITS2 region was able to detect the identity of degraded
specimens because ITS2 is a multi-copy region.
Recent studies have recommended the use of ITS2 to verify the content of
traditional medicine material. Han et al. (2016) examined 1,436 specimens of 295 medicinal
species in China. The results confirmed that ITS2 barcodes could be amplified and
sequenced for most of the samples (87.7%). The ITS2 barcode was successfully used to
identify 58 herbal medicinal plants, including samples of M. tenacissima and its adulterants
(Yu et al., 2018). As well as a way to reveal commercial fraud in the herbal industry,
especially if products are falsely sold as powdered plant material in traditional shops
(Michel et al., 2016), it can also be used as a reliable means to verify the identity of herbs
used in the pharmaceutical industry, in addition to traditional morphological and chemical
methods, DNA barcoding with ITS2 has recently been used as a standard quality control
procedure in several studies (Khan et al., 2017; Yu et al., 2017)
In some cases, ITS2 failed in species identification in our study. A possible
explanation for this might be that the sequences stored in GeneBank were misidentified.
This was also reported by Griffiths et al. (2006), Michel et al. (2016) and Elansary et al.
(2017).
Our study shows sequences of a group of species that have not previously been
available in the NCBI and Barcode of Life databases. Therefore, the sequences presented in
this study, and those expected to result from future studies, will help to resolve the lack of
ITS2 sequences.
CONCLUSIONS
In recent years, the ITS2 region has been commonly used in plant identification,
taxonomy and molecular phylogeny for the verification of medicinal plants. In our study,
the DNA barcode ITS2 was capable of pinpointing the taxonomic identity of most species
tested. This is because ITS2 had a higher barcoding success rate and species resolution
when compared to matK and rbcL markers. We recommend the use of ITS2 as a standard
barcode for identifying desert plants, increasing its testing in future studies with a larger
number of dryland samples.
According to our results, ITS2 is successful not only in amplifying and sequencing
but also in identification, and it could, therefore, be applied in cases of old herbal
specimens, even with damaged or old samples. This will further enhance conservation
efforts at the local and global levels.
At the local level, there is a need to apply barcode markers to a wide range of local
flora for the purposes of identification, taxonomy and phylogeny. More broadly, further
efforts are needed to ensure the conservation of desert plants, especially those of medical
importance; using barcode technology will enhance these efforts.
FUNDING
This research did not receive any specific grant from funding agencies in public,
commercial or not-for-profit sectors.
©FUNPEC-RP www.funpecrp.com.br Genetics and Molecular Research 18 (1): gmr18133
W.S. Al-Juhani 16
ACKNOWLEDGMENTS
I would like to extend my thanks to Umm Al-Qura University for allowing me to
access its herbarium and for allowing me to make use of its facilities.
REFERENCES
Abdel KK, El-Shikh M and El-Aidarous A (2013). Floristic diversity and vegetation of Wadi al-Noman, Mecca, Saudi
Arabia. Turkish J. Bot. 37: 894-907.
Alaklabi A, Arif IA, Bafeel SO, Alfarhan AH, et al. (2014). Nucleotide based validation of the endangered plant
Diospyros mespiliformis (Ebenaceae) by evaluating short sequence region of plastid rbcL gene. Plant Omics 7:
102-107.
AL-Eisawi DMA and Al-Ruzayza S (2015). The flora holy Mecca district, SaudiArabia. IJBC 7: 173-189.
Ali MA, Al-Hemaid FM, Lee J, Hatamleh AA, et al. (2015). Unraveling systematic inventory of Echinops (Asteraceae)
with special reference to nrDNA ITS sequence-based molecular typing of Echinops abuzinadianus. Genet. Mol.
Res. 14: 11752-11762.
Al-Qurainy F, Khan S, Nadeem M, Tarroum M, et al. (2013). Assessment of phylogenetic relationship of rare plant
species collected from Saudi Arabia using internal transcribed spacer sequences of nuclear ribosomal DNA. Genet.
Mol. Res. 12: 723-730.
Al-Qurainy F, Khan S, Nadeem M, Tarroum M, et al. (2014). Selection of DNA barcoding loci for Nepeta deflersiana
Schweinf. ex Hedge from chloroplast and nuclear DNA genomes. Genet. Mol. Res. 13: 1144-1151.
Arolla RG, Cherukupalli N, Khareedu VR and Vudem DR (2015). DNA barcoding and haplotyping in different species
of Andrographis. Biochem. Syst. Ecol. 62: 91-97.
Azimi S, Nixon G, Ahern J and Balachandran W (2011). A magnetic bead-based DNA extraction and purification
microfluidic device. Microfluid Nanofluidics 11: 157-165
Bafeel SO, Alaklabi A, Arif IA, Khan H, et al. (2012a). Molecular characterization of regionally endangered tree species
Mimusops laurifolia (Forssk.) Friis (Sapotaceae). Int. J. Biol. 4: 29-37.
Bafeel SO, Alaklabi A, Arif IA, Khan H, et al. (2012b). Ribulose-1, 5-biphosphate carboxylase (rbcL) gene sequence
and random amplification of polymorphic DNA (RAPD) profile of regionally endangered tree species Coptosperma
graveolens subsp. arabicum (S. Moore). Plant Omics 5: 285-290.
Bafeel SO, Arif IA, Al-Homaidan AA, Khan H, et al. (2012c). Assessment of DNA barcoding for the identification of
Chenopodium murale L. (Chenopodiaceae). Int. J. Biol. 4: 66-74.
Bafeel SO, Arif IA, Bakir MA, Khan H, et al. (2011). Comparative evaluation of PCR success with universal primers of
maturase K (matK) and ribulose-1, 5-bisphosphate carboxylase oxygenase large subunit (rbcL) for barcoding of
some arid plants. Plant Omics 4: 195-198.
Braukmann TW, Kuzmina ML, Sills J, Zakharov E, et al. (2017). Testing the efficacy of DNA barcodes for identifying
the vascular plants of Canada. PLoS ONE 12: e0169515.
Candek K and Kuntner M (2015). DNA barcoding gap: Reliable species identification over morphological and
geographical scales. Mol. Ecol. Resour. 15: 268-277.
CBOL Plant Working Group (2009). A DNA barcode for land plants. Proc. Natl. Acad. Sci. U.S.A. 106: 12794–12797.
Chaudhary SA (2000). Flora of the Kingdom of Saudi Arabia Illustrated. Ministry of Agriculture and Water: National
Agriculture Research Center, Riyadh, Saudi Arabia.
Chaudhary SA (2001). Flora of the Kingdom of Saudi Arabia Illustrated. Ministry of Agriculture and Water: National
Agriculture Research Center, Riyadh, Saudi Arabia.
Chen S, Yao H, Han J, Liu C, et al. (2010). Validation of the ITS2 region as a novel DNA barcode for identifying
medicinal plant species. PLoS ONE 5: e8613.
Elansary OH, Ashfaq M, Ali HM and Yessoufou K (2017). The first initiative of DNA barcoding of ornamental plants
from Egypt and potential applications in horticulture industry. PLoS ONE 12: e0172170.
Fazekas A, Burgess K, Kesanakurti P, Graham S, et al. (2008). Multiple multilocus DNA barcodes from the plastid
genome discriminate plant species equally well. PLoS ONE 3: e2802. Available at
[https://doi.org/10.1371/journal.pone.0002802(22/6/2018)].
Gao T, Yao H, Song J, Liu C, et al. (2011). Identification of medicinal plants in the family Fabaceae using a potential
DNA barcode ITS2. J. Ethnopharmacol. 130: 116-121.
Griffiths A, Miller J, Suzuki D, Lewontin R, et al. (2006). An introduction to genetic analysis. W. H. Freeman and
Company, New York.
Guo Y-Y, Huang L-Q, Liu Z-J and Wang X-Q (2016). Promise and challenge of DNA barcoding in Venus Slipper
(Paphiopedilum). PLoS ONE 11: e0146880.

Genetics and Molecular Research 18 (1): gmr18133 ©FUNPEC-RP www.funpecrp.com.br
DNA barcode ITS2 for dryland plants 17
Han J, Pang X, Liao B, Hui Y, et al. (2016). An authenticity survey of herbal medicines from markets in China using
DNA barcoding. Sci. Rep. 6: 1-9.
Hebert PD, Cywinska A, Ball SL and deWaard JR (2003). Biological identifications through DNA barcodes. Proceeding
Biological Science 270: 313-321.
Hollingsworth PM (2011). Refining the DNA barcode for land plants. PNAS. 108(49): 19451–19452.
Keller A, Schleicher T, Schultz J, Muller T, et al. (2009). 5.8S-28S rRNA interaction and HMM-based ITS2 annotation.
Gene 430: 50-57.
Khan S, Al-Qurainy F, Nadeem M and Tarroum M (2012a). Development of genetic markers for Ochradenus arabicus
(Resedaceae), an endemic medicinal plant of Saudi Arabia. Genet. Mol. Res. 11: 1300-1308.
Khan SA, Baeshen MN, Ramadan HA and Baeshen NA (2017). Emergence of plastidial intergenic spacers as suitable
DNA barcodes for arid medicinal plant Rhazya stricta. Am J Plant Sci 8: 1774-1789.
Kumar S, Stecher G and Tamura K (2016). MEGA7: Molecular Evolutionary Genetics Analysis Version 7.0 for Bigger
Datasets. Mol. Biol. Evol. 33: 7. 1870–1874. https://doi.org/10.1093/molbev/msw054.
Li Y, Tong Y and Xing F (2016). DNA Barcoding Evaluation and ITS Taxonomic Implications in the Recently Evolved
Genus Oberonia Lindl. (Orchidaceae) in China. Front Plant Sci. 7: 1791.
Lin J-Y, Lin B-Y, Chang C-D, Liao S-C, et al. (2015). Evaluation of chloroplast DNA markers for distinguishing
Phalaenopsis species. Sci. Hortic. 192: 302-310.
Maloukh L, Kumarappan A, Jarrar M, Salehi J, et al. (2017). Discriminatory power of rbcL barcode locus for
authentication of some of United Arab Emirates (UAE) native plants. 3 Biotech 7: 144.
Martin MP, Finschow G, Salom JC, Siquier JLl, et al. (2016). Barcoding sequences clearly separate Chroogomphus
mediterraneus (Gomphidiaceae, Boletales) from C. rutilus, and allied species. Mycoscience 57: 384-392.
Meelad MMHS (1987). Some floristic and chemotaxonomic studies of the flowering plants of Makkah. Doctoral
dissertation. The University of Salford, Salford, Manchester, UK.
Meier R, Kwong S, Vaidya G and Ng PKL (2006). DNA barcoding and taxonomy in Diptera: A tale of high intraspecific
variability and low identification success. Syst. Biol. 55: 715-728.
Mezzasalma V, Bruni I, Fontana D, Galimberti A, et al. (2017). A DNA barcoding approach for identifying species in
Amazonian traditional medicine: The case of Piri-Piri. Plant Gene 9: 1-5.
Michel C-I, Meyer RS, Taveras Y and Molina J (2016). The nuclear internal transcribed spacer (ITS2) as a practical
plant DNA barcode for herbal medicines. J Appl Res Med Aromat Plants 3: 94-100.
Migahid AM (1996). Flora of Saudi Arabia. Riyadh University, Riyadh, Saudi Arabia.
Mohamed A (2016). DNA Barcoding of Five Medicinal Plants from Siwa Oasis, Egypt. KMITL Sci. Tech. 16: 49-56.
Naciri Y, Caetano S and Salamin N (2012). Plant DNA barcodes and the influence of gene flow. Mol. Ecol. Resour. 12:
575-580.
Nithaniyal S and Parani M (2016). Evaluation of chloroplast and nuclear DNA barcodes for species identification in
Terminalia L. Biochem. Syst. Ecol. 68: 223-229.
Pan Y-Z, Fang L-Q, Hao G and Gong X (2009). Systematic positions of Lamiophlomis and Paraphlomis (Lamiaceae)
based on nuclear and chloroplast sequences. Plant Syst. Evol. 47: 535-542.
Patil SM, Rane NR, Adsul AA, Gholave AR, et al. (2016). Study of molecular genetic diversity and evolutionary history
of medicinally important endangered genus Chlorophytum using DNA barcodes. Biochem. Syst. Ecol. 65: 245-252.
Petit RJ and Excoffier L. (2009). Gene flow and species delimitation. Trends Ecol. Evol. (Amst.) 24: 386-393.
Puillandre N, Lambert N, Brouillet S and Achaz G (2012). ABGD, automatic barcode gap discovery for primary species
delimitation. Mol. Ecol. 21: 1864-1877.
Sarvananda L (2018). Short introduction of DNA barcoding. IJR. 5: 673-686.
Scriver M, Marinich A, Wilson C and Freeland J. (2015). Development of species-specific environmental DNA (eDNA)
markers for invasive aquatic plants. Aquat. Bot. 122: 27-31.
Schultz J, Maisel S, Gerlach D and Muller T (2005). A common core of secondary structure of the internal transcribed
spacer 2 (ITS2) throughout the Eukaryota. RNA 11: 361-364. Available at [http://its2.bioapps.biozentrum.uni-
wuerzburg.de/].
Sher H. and Aldosari AA (2012). Overview on the ecological and geographical appraisal of important medicinal and
aromatic plants: An endangered component in the flora of Saudi Arabia. Sci. Res. Essays 7: 1639-1646.
Silva JN, Bezerra da Costa A, Silva JV and Almeida C (2015). DNA barcoding and phylogeny in neotropical species of
the genus Spondias. Biochem. Syst. Ecol. 61: 240-243.
Tahir A, Hussain F, Ahmed N, Ghorbani A, et al. (2018). Assessing universality of DNA barcoding in geographically
isolated selected desert medicinal species of Fabaceae and Poaceae. Peer J. 4499: 1-16.
Tamura K, Peterson D, Peterson N, Stecher G, et al. (2011). MEGA5: Molecular evolutionary genetics analysis using
maximum likelihood, evolutionary distance, and maximum parsimony methods. Mol. Biol. Evol. 28: 2731-2739.
Vincent P (2008). Saudi Arabia: An Environmental Overview. London: Taylor & Francis.
Xiwen L, Yang Y, Robert JH, Maurizio R, et al. (2015). Plant DNA barcoding: From gene to genome. Biol. Rev. 90:
157-166.
Yang T, Zhang T, Guo Y-h and Liu X (2017). Testing eight barcoding markers for Potamogeton species at intraspecific
levels. Aquat. Bot. 137: 56-64.
©FUNPEC-RP www.funpecrp.com.br Genetics and Molecular Research 18 (1): gmr18133
W.S. Al-Juhani 18
Yu N, Wei Y, Zhang X, Zhu N, et al. (2017). Barcode ITS2: A useful tool for identifying Trachelospermum jasminoides
and a good monitor for medicine market. Scientific Reports 7: 5037.
Yu N, Wei Y, Zhu Y, Zhu N, et al. (2018). Integrated approach for identifying and evaluating the quality of Marsdenia
tenacissima in the medicine market. PLoS ONE 13: e0195240.
Zhang Z-L, Song M-F, Guan Y-H, Li H-T, et al. (2015). DNA barcoding in medicinal plants: Testing the potential of a
proposed barcoding marker for identification of Uncaria species from China. Biochem. Syst. Ecol. 60: 6-14n. Bot.
59: 18 - 28.