GŁÓWNY URZĄD STATYSTYCZNY CENTRAL STATISTICAL OFFICE Statistical Information and Elaborations...
165
GŁÓWNY URZĄD STATYSTYCZNY CENTRAL STATISTICAL OFFICE OBRÓT NIERUCHOMOŚCIAMI W 2012 R. REAL ESTATE TURNOVER IN 2012 Statistical Information and Elaborations Informacje i opracowania statystyczne Warszawa 2013
-
Upload
independent -
Category
Documents
-
view
4 -
download
0
Transcript of GŁÓWNY URZĄD STATYSTYCZNY CENTRAL STATISTICAL OFFICE Statistical Information and Elaborations...

GŁÓWNY URZĄD STATYSTYCZNY
CENTRAL STATISTICAL OFFICE
OBRÓT NIERUCHOMOŚCIAMI
W 2012 R.
REAL ESTATE TURNOVER
IN 2012
Statistical
Information
and Elaborations
Informacje
i opracowania
statystyczne
Warszawa 2013

2
Opracowanie publikacji
Preparation of the publication
GUS, Departament Handlu i Usług
CSO, Trade and Services Department
kierujący
supervisor
Ewa Adach-Stankiewicz
Dyrektor Departamentu
Director of Department
zespół
team
Wydział Cen Producentów
Producer Prices Section
Renata Rechnio
Elżbieta Kafara
Karolina Świderska
Przy publikowaniu danych Głównego Urzędu Statystycznego – prosimy o podanie źródła
When publishing the Central Statistical Office data – please indicate the source

3
PREFACE
The Trade and Services Department of the Central Statistical Office presents another
edition of the “Real Estate Turnover” publication. The study includes the results of the survey
conducted annually since 2003 for real estate purchase/sale transactions.
This publication contains information characterising real estate turnover in 2012, i.e.
data concerning the quantity and value of transactions made, the areas of properties sold as
well as the average measures reflecting the specificity of real estate transactions. For the
purposes of this study, properties have been divided into the following categories: premises,
buildings, land properties and built-up properties. Data are presented in the territorial profiles,
in the breakdown by turnover form and by types of properties comprising objects of
transactions.
Information presented in the publication has been prepared on the basis of statistical
data from the Registers of Prices and Values of Real Estate, which are kept by powiat starost
offices and cities with powiat status. The data reflect the status at the moment of their
transmission to the Central Statistical Office.
The entire publication has been divided by categories of properties. Each category is
provided with an analytical part including commentary and descriptive and graphic
presentation of data as well as a tabular part. General notes and methodological notes
including the description of sources of information and basic definitions are aimed at assisting
the interpretation of the results presented in the publication.
We would like to express our gratitude to all persons and institutions for their
suggestions, which might contribute to the development and enrichment of the following
editions of this publication.
Director
Trade and Services Department
Ewa Adach-Stankiewicz

4
CONTENTS
Page
PREFACE ............................................................................................................................................................... 3
GENERAL NOTES ................................................................................................................................................ 7
METHODOLOGICAL NOTES ............................................................................................................................. 8
I. INTRODUCTION ......................................................................................................................................... 11
II. PURCHASE/SALE TRANSACTIONS OF PREMISES .............................................................................. 22
III. PURCHASE/SALE TRANSACTIONS OF BUILDINGS ............................................................................ 59
IV. PURCHASE/SALE TRANSACTIONS OF BUILT-UP PROPERTIES ....................................................... 79
V. PURCHASE/SALE TRANSACTIONS OF LAND PROPERTIES ............................................................... 113
TABLES No Page
Purchase/sale transactions of properties in 2012 ................................................................................................ 1 17
Purchase/sale transactions of properties by voivodships in 2012 ....................................................................... 2 17
Purchase/sale transactions of properties by turnover form in 2012 .................................................................... 3 18
Purchase/sale transactions of properties by location in 2012 .............................................................................. 4 19
Number of purchase/sale transactions of properties in 2006-2012 ..................................................................... 5 20
Value of purchase/sale transactions of properties in 2006-2012 ......................................................................... 6 21
Purchase/sale transactions of premises in 2012 .................................................................................................. 7 38
Purchase/sale transactions of residential premises in 2012 ................................................................................. 8 38
Purchase/sale transactions of non-residential premises in 2012 ......................................................................... 9 39
Purchase/sale transactions of premises by turnover form in 2012 ...................................................................... 10 40
Sale structure of premises by turnover form in 2012 .......................................................................................... 11 41
Purchase/sale transactions of premises by location in 2012 ................................................................................ 12 42
Sale structure of premises by location in 2012 ................................................................................................... 13 43
Number of purchase/sale transactions of premises in 2006-2012 ....................................................................... 14 44
Value of purchase/sale transactions of premises in 2006-2012 .......................................................................... 15 45
Purchase/sale transactions of residential premises by voivodships in 2012 ........................................................ 16 46
Purchase/sale transactions of non-residential premises by voivodships in 2012 ................................................ 17 46
Purchase/sale transactions of residential premises by voivodships and turnover form in 2012 .......................... 18 47
Purchase/sale transactions of non-residential premises by voivodships and turnover form in 2012 .................. 19 48
Purchase/sale transactions of residential premises by voivodships and location in 2012 ................................... 20 49
Purchase/sale transactions of non-residential premises by voivodships and location in 2012 ............................ 21 50
Purchase/sale transactions of residential premises in voivodship cities in 2012 ................................................. 22 51
Purchase/sale transactions of non-residential premises in voivodship cities in 2012 ......................................... 23 51
Purchase/sale transactions of residential premises in powiats with the largest number of transactions in
2012 .................................................................................................................................................................... 24 52
Purchase/sale transactions of non-residential premises in powiats with the largest number of transactions
in 2012 ................................................................................................................................................................ 25 53
Average usable area sold in single purchase/sale transaction of premises by location in 2012 .......................... 26 54
Average value of single purchase/sale transaction of premises by location in 2012 ........................................... 27 55
Average transaction prices of premises by location in 2012 ............................................................................... 28 56
Average measures of purchase/sale transactions of residential premises by voivodships in 2012 ..................... 29 57
Descriptive characteristics of average transaction prices of premises at powiats level in 2012 ......................... 30 58
Purchase/sale transactions of buildings in 2012 .................................................................................................. 31 66
Purchase/sale transactions of buildings by turnover form in 2012 ..................................................................... 32 66
Purchase/sale transactions of buildings by location in 2012 ............................................................................... 33 67
Number of purchase/sale transactions of buildings in 2006-2012 ...................................................................... 34 68
Value of purchase/sale transactions of buildings in 2006-2012 .......................................................................... 35 69
Purchase/sale transactions of residential buildings by voivodships in 2012 ....................................................... 36 70

5
Purchase/sale transactions of non-residential buildings by voivodships in 2012 ................................................ 37 70
Purchase/sale transactions of residential buildings by voivodships and turnover form in 2012 ......................... 38 71
Purchase/sale transactions of non-residential buildings by voivodships and turnover form in 2012 .................. 39 72
Purchase/sale transactions of residential buildings by voivodships and location in 2012 .................................. 40 73
Purchase/sale transactions of non-residential buildings by voivodships and location in 2012 ........................... 41 74
Purchase/sale transactions of residential buildings in powiats with the largest number of transactions in
2012 .................................................................................................................................................................... 42 75
Purchase/sale transactions of non-residential buildings in powiats with the largest number of transactions
in 2012 ................................................................................................................................................................ 43 76
Average measures of purchase/sale transactions of residential buildings by voivodships in 2012 ..................... 44 77
Descriptive characteristics of average transaction prices of buildings at powiats level in 2012 ......................... 45 78
Purchase/sale transactions of built-up properties in 2012 ................................................................................... 46 90
Purchase/sale transactions of built-up properties by turnover form in 2012 ....................................................... 47 91
Purchase/sale transactions of built-up properties by location in 2012 ................................................................ 48 92
Purchase/sale transactions of built-up properties by kind of right to land parcel in 2012 ................................... 49 93
Number of purchase/sale transactions of built-up properties in 2006-2012 ........................................................ 50 94
Value of purchase/sale transactions of built-up properties in 2006-2012 ........................................................... 51 95
Purchase/sale transactions of built-up properties by voivodships in 2012 .......................................................... 52 96
Purchase/sale transactions of properties built up with residential buildings by voivodships in 2012 ................. 53 96
Purchase/sale transactions of built-up agricultural land by voivodships in 2012 ................................................ 54 97
Purchase/sale transactions of other built-up properties by voivodships in 2012 ................................................. 55 97
Purchase/sale transactions of properties built up with residential buildings by voivodships and turnover
form in 2012 ........................................................................................................................................................ 56
98
Purchase/sale transactions of built-up agricultural land by voivodships and turnover form in 2012 .................. 57 99
Purchase/sale transactions of other built-up properties by voivodships and turnover form in 2012 .................... 58 100
Purchase/sale transactions of properties built up with residential buildings by voivodships and location in
2012 .................................................................................................................................................................... 59 101
Purchase/sale transactions of built-up agricultural land by voivodships and location in 2012 ........................... 60 102
Purchase/sale transactions of other built-up properties by voivodships and location in 2012 ............................ 61 103
Purchase/sale transactions of properties built up with residential buildings in voivodship cities in 2012 .......... 62 104
Purchase/sale transactions of other built-up properties in voivodship cities in 2012 .......................................... 63 104
Purchase/sale transactions of properties built up with residential buildings in powiats with the largest
number of transactions in 2012 ........................................................................................................................... 64 105
Purchase/sale transactions of built-up agricultural land in powiats with the largest number of transactions
in 2012 ................................................................................................................................................................ 65 106
Purchase/sale transactions of other built-up properties in powiats with the largest number of transactions
in 2012 ................................................................................................................................................................ 66 107
Average measures for purchase/sale transactions of built-up properties by location in 2012 ............................. 67 108
Average measures for purchase/sale transactions of properties built up with residential buildings by
voivodships in 2012 ............................................................................................................................................ 68 109
Average measures for purchase/sale transactions of built-up agriculture land by voivodships in 2012 ............. 69 110
Average measures for purchase/sale transactions of other built-up properties by voivodships in 2012 ............. 70 111
Price descriptive characteristics of average transaction prices of built-up land at powiats level in 2012 ........... 71 112
Purchase/sale transactions of land properties in 2012 ......................................................................................... 72 132
Purchase/sale transactions of land properties by turnover form in 2012 ............................................................. 73 133
Sale structure of land properties by turnover form in 2012 ................................................................................ 74 134
Purchase/sale transactions of land properties by location in 2012 ...................................................................... 75 135
Sale structure of land properties by location in 2012 .......................................................................................... 76 136
Purchase/sale transactions of land properties by kind of right to land parcel in 2012 ........................................ 77 137
Sale structure of land properties by kind of right to land parcel in 2012 ............................................................ 78 138
Number of purchase/sale transactions of land properties in 2006-2012 ............................................................. 79 139
Value of purchase/sale transactions of land properties in 2006-2012 ................................................................. 80 140
Purchase/sale transactions of building land by voivodships in 2012 .................................................................. 81 141
Purchase/sale transactions of residential land by voivodships in 2012 ............................................................... 82 141
6
Purchase/sale transactions of industrial land by voivodships in 2012 ................................................................ 83 142
Purchase/sale transactions of other building land by voivodships in 2012 ......................................................... 84 142
Purchase/sale transactions of agricultural land by voivodships in 2012 ............................................................. 85 143
Purchase/sale transactions of forest land as well as woody and bushy land by voivodships in 2012 ................. 86 143
Purchase/sale transactions of residential land by voivodships and turnover form in 2012 ................................. 87 144
Purchase/sale transactions of industrial land by voivodships and turnover form in 2012 ................................... 88 145
Purchase/sale transactions of other building land by voivodships and turnover form in 2012 ........................... 89 146
Purchase/sale transactions of agricultural land by voivodships and turnover form in 2012 ............................... 90 147
Purchase/sale transactions of forest land as well as woody and bushy land by voivodships and turnover
form in 2012 ........................................................................................................................................................ 91 148
Purchase/sale transactions of residential land by voivodships and location in 2012 .......................................... 92 149
Purchase/sale transactions of industrial land by voivodships and location in 2012 ............................................ 93 150
Purchase/sale transactions of other building land by voivodships and location in 2012 ..................................... 94 151
Purchase/sale transactions of agricultural land by voivodships and location in 2012 ......................................... 95 152
Purchase/sale transactions of forest land as well as woody and bushy land by voivodships and location in
2012 .................................................................................................................................................................... 96 153
Purchase/sale transactions of residential land in powiats with the largest number of transactions in 2012 ........ 97 154
Purchase/sale transactions of industrial land in powiats with the largest number of transactions in 2012 ......... 98 155
Purchase/sale transactions of other building land in powiats with the largest number of transactions in
2012 .................................................................................................................................................................... 99 156
Purchase/sale transactions of agricultural land in powiats with the largest number of transactions in 2012 ...... 100 157
Purchase/sale transactions of forest land as well as woody and bushy land in powiats with the largest
number of transactions in 2012 ........................................................................................................................... 101 158
Average measures for purchase/sale transactions of land properties by location in 2012 .................................. 102 159
Average measures for purchase/sale transactions of residential land by voivodships in 2012 ........................... 103 160
Average measures for purchase/sale transactions of industrial land by voivodships in 2012 ............................. 104 161
Average measures for purchase/sale transactions of agricultural land by voivodships in 2012 .......................... 105 162
Average measures for purchase/sale transactions of forest land as well as woody and bushy land by
voivodships in 2012 ............................................................................................................................................ 106 163
Price characteristics of average transaction prices of land properties at powiats level in 2012 .......................... 107 164

7
GENERAL NOTES
1. Data included in the publication refer to the territorial division of 1 January 1999, taking into
consideration the Nomenclature of Territorial Units for Statistics (NTS), introduced by the Regulation of the
Council of Ministers of 14 November 2007 (Journal of Laws No. 214, Item 1573, with subsequent
amendments).
2. Relative numbers (indicators, interest) were calculated mostly on the basis of absolute data expressed with
higher precision than indicated in the tables.
3. Due to data rounding, the sums of components might in same cases be slightly different from given values
"in total".
4. While converting the number of transactions per 10,000 inhabitants, the population as of 30 June 2012 was
assumed.
5. Average transaction prices, as presented in the publication, were obtained as a quotient of the values and
areas of real estate sold.
6. Descriptive price characteristics, e.g. variation range, arithmetic mean, median or variation coefficient,
supplement the information on average transaction prices. The median is the numerical value of a given
feature, above and below which there is an equal number of observations. Standard deviation constitutes
the measure of variability of the feature analysed and informs us about how specific cases differ on average
from the arithmetic average. The coefficient of variation is a relative measure of variability and forms the
ratio of the standard deviation from the arithmetic mean of the feature analysed. It tells us what percentage
of the arithmetic mean value constitutes standard deviation.
Abbreviations
tys. = tysiąc
thous. = thousand
mln = milion
milion
mld = miliard
bn = billion
zł = złoty
PLN = zloty
r. = rok
year
ok. = około
about
m2 = metr kwadratowy
square metre
ha = hektar
hectare
m.in. = między innymi
among others
tabl. = tablica
table
rys. = rysunek (wykres)
chart
Symbols
„w tym” = nie wymienia się wszystkich składników
„of which” = not all elements of sum are given
Kreska (–) = zjawisko nie wystąpiło
magnitude zero
Zero: (0.0) = zjawisko istniało w wielkości mniejszej od 0.05
magnitude not zero, but less than 0.05 of a unit
Kropka (.) = zupełny brak informacji albo brak informacji wiarygodnych
data not available or not reliable
Znak (x) = wypełnienie pozycji jest niemożliwe lub niecelowe

8
METHODOLOGICAL NOTES
I. Data scope and sources
1. This publication provides data characterising the real estate turnover in 2012. In particular, it includes
information on the number and transaction values of the real estate purchase/sale, on the area of real estate
sold, and on the average transaction prices, divided by:
premises
buildings
built-up properties
land properties
2. Data included in the publication was compiled on the basis of information obtained from Registers of
Prices and Values of Real Estate, kept by powiat starosta offices and mayors of cities with powiat status,
and using the data derived from notarial deeds. Presented data was compiled on the basis of information
from 379 powiats and cities with powiat status.
3. The survey covers transactions concluded on the free market, resulting from the sales preceded by a tender,
or from non-tender sales, where the State Treasury, a gmina, a powiat, a voivodship, or a natural or legal
person, holding the ownership or joint ownership title, mortgaged real estate or joint mortgaged real estate
title, can act as the seller.
4. Only those purchase/sale transactions of properties are observed, which were concluded during the period
under survey and were registered in the Register of Prices and Values of Real Estate before the date of data
transfer to the Central Statistical Office.
5. The real estate value comprises all and any elements of the real estate purchased/sold under the notarial
deeds produced.
II. Definitions of basic terms
1. A notarial deed is understood as a document confirming the conclusion of a legal transaction, drafted
entirely by a notary, then read out to the parties and signed by all persons concerned (Act of 14 February
1991 – Notarial Law).
2. A real estate purchase/sale transaction is understood as selling or purchasing real estate by concluding a
legal transaction, under which the ownership title to the said real estate is being transferred.
3. Real estate covers all parts of land constituting separate ownership (land), and buildings, or parts of
buildings, permanently connected with the ground, provided that they constitute separate ownership from
the land under any specific provisions. Three types of real estate are distinguished:
retail real estate
building real estate
land property

9
4. Retail real estate refers to residential or business premises, including a garage forming part of a building,
provided that it constitutes separate ownership. Retail real estate is established under the Act of 24 June
1994 on the Ownership of Premises.
5. Building real estate is a building and other facilities permanently connected with the ground, provided that
they constitute separate ownership from such land under any specific provisions.
6. Land property is land with any component parts, excluding buildings and premises, provided that they
constitute separate ownership. If a land and mortgage register is kept for the land property, then the land
constitutes separate real estate from any other real estate held by the same owner.
7. Premises (an independent residential apartment or premises designated for other purposes) refers to a room
or set of rooms separated with durable walls within the building dedicated to the permanent stay of persons,
which together with the auxiliary rooms serve the purpose of fulfilling their housing needs or which are
used according to their dedication for the purposes other than residential ones.
8. An independent residential apartment is a residential apartment, in relation to which the starost has
determined, in the form of a statement, the compliance with the requirements mentioned in Article 2,
Section 2 of the Act of 24 June 1994 on the Ownership of Premises; the definition is applied accordingly
also to the independent premises used according to their dedication for the purposes other than residential
ones.
9. A room is a premise in a dwelling, separated from other premises with fixed walls from the floor to the
ceiling, with an area not smaller than 4 m2, and with direct daylight, i.e. with a window or a French window
in an external wall of the building; kitchens are also considered rooms as long as they fulfil the above
criteria. Corridors, halls, bathrooms, toilets, larders, verandas, porches, storerooms, etc. are not considered
rooms, irrespective of their area and lighting.
10. A building is a covered constructed structure, together with built in systems and technical facilities, used
for permanent purposes, adjusted to house persons, animals, or to protect items; a shed is considered a
specific kind of a building, which is a structure built on the ground, not surrounded by walls from all sides,
or even not having any walls at all.
11. Residential buildings are constructed structures in which at least one half of the overall space is used for
residential purposes; these include single-family buildings, buildings with two dwellings, multi-dwelling
buildings and collective accommodation buildings, e.g. social assistance houses (without medical care),
employee boarding houses, boarding schools, school dormitories, student dormitories, care and education
centres, homeless shelters, etc.)
12. Non-residential buildings are constructed structures in which more than half of the surface area is used for
non-residential purposes.
13. Industrial buildings are buildings dedicated for production purposes for all types of industrial activity, e.g.
plants, workshops, production halls, slaughter houses, breweries, assembly plants, film companies, etc.
14. Commercial buildings include commercial centres, department stores, independent shops and boutiques,
fair, auction and exhibition halls, covered markets, petrol stations, service stations, pharmacies, etc.

10
15. Office buildings are buildings used as the workplace for office activity, or other administrative activity, e.g.
banks, post office, city, gmina, self-government, ministry offices, administrative premises of various
economic entities, as well as conference and congress centre buildings, court and parliament houses.
16. Land built-up with residential buildings refers to land not used for agricultural and forest production,
dedicated for residential buildings and functional equipment connected with residential buildings
(farmyards, access roads, passages, adjacent playgrounds, etc), as well as adjacent gardens.
17. Built-up agricultural land refers to land dedicated for residential buildings, and other buildings and
facilities serving the purpose of agricultural production (not excluding fish production), as well as
agricultural and food processing (boiler plants, storerooms, garages, cotes, barns, sheds, granaries, inventory
buildings, storage and manoeuvre area within the built-up land, etc.), and land occupied by adjacent gardens
within agricultural farms.
18. Agricultural land covers arable land, adjacent gardens, permanent crops, including orchards, meadows and
pastures, as well as other arable land.
19. Forest area refers to land of a compact area of at least 0.10 ha, covered by forest vegetation (wooded area)
– trees, bushes and undergrowth – or temporarily devoid of forest vegetation, and:
a) designated for silviculture production,
b) constituting nature reserves or forming part of a national park; or
c) registered as a nature monument,
as well as land connected with silviculture, designated for the purpose of forest management: buildings and
structures, devices for water drainage, spatial division lines in forests, forest roads, areas under electricity
power lines, forest nurseries, wood stockpiling areas, and forest car parks and tourist facilities.
20. Woody and bushy land refers to land covered by forest vegetation with an area smaller than 0.1 ha,
including also field clusters of trees and bushes not classified as forests, peat bogs, areas covered by natural
wicker and bushy forms of willow; land adjacent to surface waters and covered by trees or bushes,
constituting a biological protection zone for watercourses and water containers; ravines and gorges covered
by trees and bushes not classified as forests; stone and rubble deposit sites covered by trees and bushes;
park-type clusters of trees and bushes, not equipped with facilities and structures serving recreational and
leisure purposes.
21. Perpetual usufruct is a property right which may be established on the real estate owned by the State
Treasury and self-government bodies on the principles set out in Articles 232-240 of the Civil Code, and in
Articles 27-35 of the Act of 21 August 1997 on Real Estate Management.

11
I. INTRODUCTION
According to notarial reporting conducted by the Ministry of Justice on the Ms-Not24 form, over 1.5
million notarial deeds were concluded in 2012, of which approx. 383 thous. of deeds concerned real estate sale
transactions. Notarial deeds regarding real estate sale transactions included: sale of agricultural properties, sale
of other properties, transfer of properties by the State Treasury or local self-government bodies for perpetual
usufruct (with the sale of premises or buildings), sale of properties for the State Treasury or local self-
government bodies as well as sale of perpetual usufruct right.
According to data received from the Registers of Prices and Values of Real Estate, in 2012 approx. 324
thous. real estate purchase/sale transactions were registered, and their turnover value amounted to approx. PLN
71 bn. Transactions registered in the Registers of Prices and Values of Real Estate which form the grounds for
this study, constitute approx. 85% of the number of notarial deeds recorded by the Ministry of Justice.
The majority of transactions concerned land properties (approx. 43.8%), 39.1% premises, 16.8% built-up
properties and 0.3% buildings. The highest value of transactions was recorded in the premises segment. The sale
value of premises accounted for 39.1% of the total value of real estate turnover. The share of sale value of built-
up properties amounted to 34.4%, that of land properties amounted to 25.9%, and of buildings to 0.6%.

12
In 2012 sales on the free market constituted the prevailing form of turnover, both in terms of quantity
and value, accounting respectively for 84.7% and 88.0% of all transactions.
The number of real estate purchase/sale transactions registered in 2012 was by almost 14% higher in
relation to 2011, whereas the value of transactions made increased by nearly 46%. The increase in the value of
turnover was recorded in each real estate category, but the highest growth was observed in buildings transactions
(of nearly 64% in comparison to 2011). This was caused by a considerable increase, in comparison to the
previous year, in the average usable floor space of buildings and the average cadastral area of built-up and non-
built-up land sold in a single transaction, which caused, among other things, an increase in the average value of a
single transaction.
Since 2008 no significant changes in the quantity structure of real estate purchase/sale transactions by
their particular types were observed. As late as in 2012 a considerable rise was recorded in the share of premises
transactions and a decrease in the proportion of land properties and built-up properties. In the years 2008-2010 a
significant increase of share of premises was observed in the total value of transactions made (of approx. 27
percentage points in 2010 in relation to 2007), with a simultaneous decrease in the share of purchase/sale
transactions value for built-up properties (of approx. 12 percentage points in 2010 in relation to 2007). In 2011
the opposite trend was observed. The share of purchase/sale transactions value for premises decreased by almost
6 percentage points in relation to the previous year, whereas the share of purchase/sale transactions value for
built-up properties increased by approx. 5 percentage points. The share of purchase/sale transactions value for

13
buildings and land properties was at a similar level as in 2010. In 2012 no substantial changes were observed in
the structure of purchase/sale transactions value by type.
Analysing the real estate market in terms of territorial division, it should be stated that in 2012 the number
of transactions was slightly higher in urban areas in comparison to rural areas. The proportion of transactions
recorded in urban areas was 53.1%. In terms of value, as many as 71.8% of transactions within real estate
turnover were concluded in urban areas. In urban areas the largest proportion of transactions involved premises
(67.3% in terms of quantity and 50.8% in terms of value). In turn, outside city borders the most frequent were
purchase/sale transactions of land properties (75.4% in terms of quantity and 55.1% in terms of value).

14
The highest number of purchase/sale transactions of properties was made in Mazowieckie, Dolnośląskie,
Śląskie and Wielkopolskie Voivodships. The value of transactions made in Mazowieckie Voivodship accounted
nearly 25% of the total value of transactions in Poland. The lowest real estate turnover, both in terms of quantity
and value, was recorded in Opolskie and Podlaskie Voivodships.

15
The number of purchase/sale transactions of properties per 10,000 inhabitants was highly diversified. The
range of this indicator by voivodships in 2012 was from approx. 65 transactions in Śląskie Voivodship to
approx. 114 transactions in Lubuskie Voivodship. Apart from this voivodship, the highest indicators
characterised Warmińsko-Mazurskie, Dolnośląskie and Pomorskie Voivodships.
16
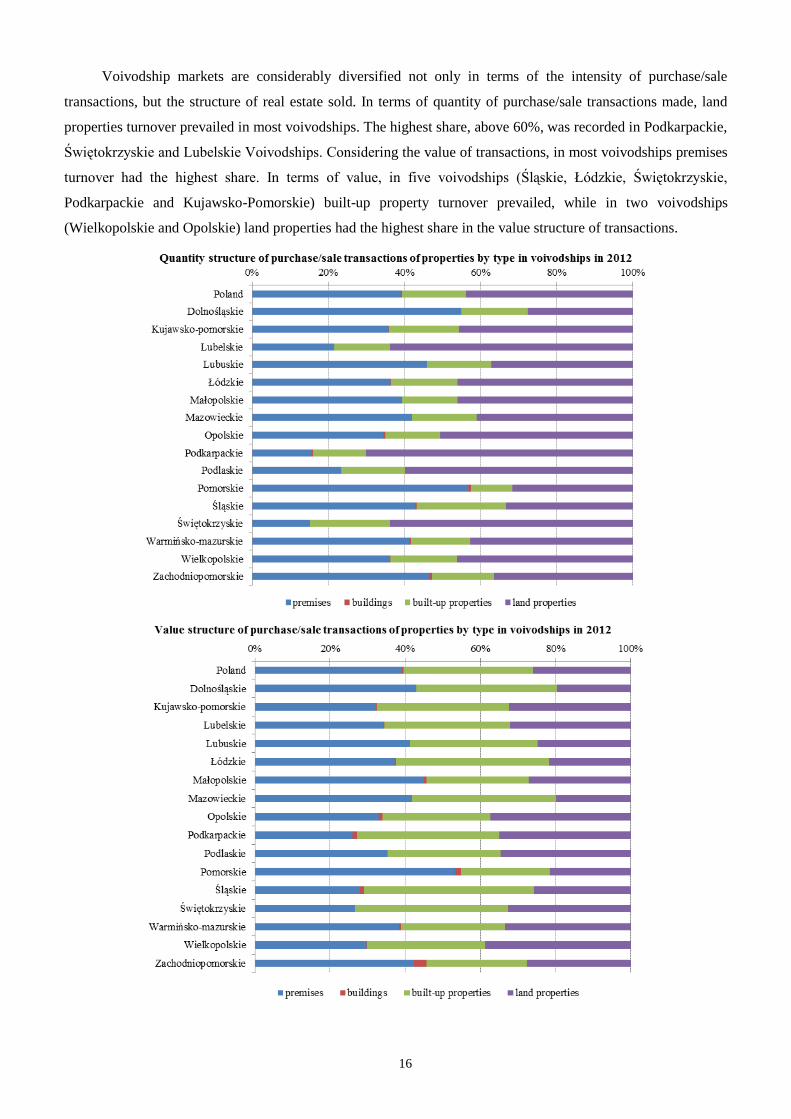
Voivodship markets are considerably diversified not only in terms of the intensity of purchase/sale
transactions, but the structure of real estate sold. In terms of quantity of purchase/sale transactions made, land
properties turnover prevailed in most voivodships. The highest share, above 60%, was recorded in Podkarpackie,
Świętokrzyskie and Lubelskie Voivodships. Considering the value of transactions, in most voivodships premises
turnover had the highest share. In terms of value, in five voivodships (Śląskie, Łódzkie, Świętokrzyskie,
Podkarpackie and Kujawsko-Pomorskie) built-up property turnover prevailed, while in two voivodships
(Wielkopolskie and Opolskie) land properties had the highest share in the value structure of transactions.

17
TABL. 1. TRANSAKCJE KUPNA/SPRZEDAŻY NIERUCHOMOŚCI W 2012 R.
PURCHASE/SALE TRANSACTIONS OF PROPERTIES IN 2012
Wyszczególnienie
Specification
a - ogółem
total
b - w granicach miast
urban areas
c - poza granicami miast
rural areas
Liczba transakcji
Number of transactions
Wartość
Value
w liczbach
bezwzględnych
in absolute numbers
w %
in %
w tys. zł
in thous. zl
w %
in %
Ogółem1 .............................................. a 324133 100.0 71051412 100.0
Total b 172101 53.1 51020936 71.8
c 151495 46.7 19902846 28.0
Lokale ................................................. a 126649 39.1 27750566 39.1
Premises b 115813 35.7 25907292 36.5
c 10299 3.2 1715644 2.4
Budynki ............................................... a 904 0.3 403308 0.6
Buildings b 558 0.2 200060 0.3
c 346 0.1 203248 0.3
Nieruchomości zabudowane ............... a 54519 16.8 24442158 34.4
Built-up properties b 27854 8.6 17420493 24.5
c 26665 8.2 7021665 9.9
Nieruchomości gruntowe .................... a 142061 43.8 18455379 25.9
Land properties b 27876 8.6 7493091 10.5
c 114185 35.2 10962288 15.4
TABL. 2. TRANSAKCJE KUPNA/SPRZEDAŻY NIERUCHOMOŚCI WEDŁUG WOJEWÓDZTW W 2012 R.
PURCHASE/SALE TRANSACTIONS OF PROPERTIES BY VOIVODSHIPS IN 2012
Wyszczególnienie
Specification
Liczba transakcji
Number of transactions
Wartość
Value
w liczbach bezwzględnych
in absolute numbers
w %
in %
w tys. zł
in thous. zl
w %
in %
Polska ................................... 324133 100.0 71051412 100.0
Poland
Dolnośląskie .......................... 31601 9.8 8420761 11.9
Kujawsko-Pomorskie ............ 14643 4.5 2504685 3.5
Lubelskie ............................... 18930 5.8 2192844 3.1
Lubuskie ............................... 11639 3.6 1594234 2.2
Łódzkie ................................. 18781 5.8 2817723 4.0
Małopolskie .......................... 22389 6.9 5311553 7.5
Mazowieckie ......................... 41635 12.9 17510548 24.6
Opolskie ................................ 8902 2.7 1317877 1.9
Podkarpackie ......................... 15623 4.8 1508825 2.1
Podlaskie ............................... 10778 3.3 1315014 1.8
Pomorskie ............................. 23661 7.3 6335813 8.9
Śląskie ................................... 30188 9.4 5511096 7.8
Świętokrzyskie ...................... 12475 3.8 1356286 1.9
Warmińsko-Mazurskie .......... 16339 5.0 2496339 3.5
Wielkopolskie ....................... 29805 9.2 7440102 10.5
Zachodniopomorskie ............. 16744 5.2 3417712 4.8
1 The difference between the item total and the sum of urban areas and rural areas results from the fact that some transactions included
in the Registers of Prices and Values of Real Estate were registered without information on the location of the sold property.

18
TABL. 3. TRANSAKCJE KUPNA/SPRZEDAŻY NIERUCHOMOŚCI WEDŁUG FORMY OBROTU W 2012 R.
PURCHASE/SALE TRANSACTIONS OF PROPERTIES BY TURNOVER FORM IN 2012
Wyszczególnienie
Specification
a – liczba transakcji
number of transactions
b – wartość w tys. zł
value in thous. zl
c – powierzchnia w m2
area in m2
Ogółem
Total
Forma obrotu
Turnover form
wolny rynek
free market
sprzedaż
bezprzetargowa
sale without
tender procedure
sprzedaż
przetargowa
sale under tender
procedure
w liczbach bezwzględnych
in absolute numbers
Ogółem ............................................ a 324133 274290 30267 19576
Total b 71051412 62515729 4715326 3820357
Lokale .............................................. a 126649 104201 19568 2880
Premises b 27750566 24646082 2662781 441703
c 7292638 6046897 1088701 157040
Budynki ............................................ a 904 788 74 42
Buildings b 403308 355753 14550 33005
c 248313 223090 13378 11845
Nieruchomości zabudowane .......... a 54519 48558 3545 2416
Built-up properties b 24442158 22154534 1050408 1237216
c 524370822 412295985 91820971 20253866
Nieruchomości gruntowe ............... a 142061 120743 7080 14238
Land properties b 18455379 15359359 987587 2108433
c 3041022840 2334193025 334611497 372218318
w odsetkach
in percent
Ogółem ............................................ a 100.0 84.7 9.3 6.0
Total b 100.0 88.0 6.6 5.4
Lokale .............................................. a 100.0 82.3 15.5 2.2
Premises b 100.0 88.8 9.6 1.6
c 100.0 82.9 14.9 2.2
Budynki ............................................ a 100.0 87.2 8.2 4.6
Buildings b 100.0 88.2 3.6 8.2
c 100.0 89.8 5.4 4.8
Nieruchomości zabudowane .......... a 100.0 89.1 6.5 4.4
Built-up properties b 100.0 90.6 4.3 5.1
c 100.0 78.6 17.5 3.9
Nieruchomości gruntowe ............... a 100.0 85.0 5.0 10.0
Land properties b 100.0 83.2 5.4 11.4
c 100.0 76.8 11.0 12.2

19
TABL. 4. TRANSAKCJE KUPNA/SPRZEDAŻY NIERUCHOMOŚCI WEDŁUG LOKALIZACJI W 2012 R.
PURCHASE/SALE TRANSACTIONS OF PROPERTIES BY LOCATION IN 2012
Wyszczególnienie
Specification
a – liczba transakcji
number of transactions
b – wartość w tys. zł
value in thous. zl
c – powierzchnia w m2
area in m2
Ogółem
Total
Lokalizacja
Location
w granicach miast
urban areas
poza
granicami
miast
rural areas ogółem
total
w tym miasta na prawach powiatu
of which cities with powiat status
ogółem
total
powyżej
200 tys.
ludności
more than
200 thous.
inhabitants
poniżej 200
tys.
ludności
less than
200 thous.
inhabitants
w liczbach bezwzględnych
in absolute numbers
Ogółem ................................. a 324133 172101 103475 67006 36469 151495
Total b 71051412 51020936 38628154 30874141 7754013 19902846
Lokale ................................... a 126649 115813 78420 53770 24650 10299
Premises b 27750566 25907292 20614063 16855929 3758134 1715644
c 7292638 6621454 4510239 3164453 1345786 638327
Budynki ................................. a 904 558 204 81 123 346
Buildings b 403308 200060 89410 47046 42364 203248
c 248313 143445 63450 33122 30328 104868
Nieruchomości
zabudowane .................. a 54519 27854 14920 8415 6505 26665
Built-up properties b 24442158 17420493 13011135 10297819 2713316 7021665
c 524370822 78558055 34715874 21681629 13034245 445812767
Nieruchomości gruntowe ... a 142061 27876 9931 4740 5191 114185
Land properties b 18455379 7493091 4913546 3673346 1240200 10962288
c 3041022840 112663100 34255576 16832316 17423260 2928359740
w odsetkach
in percent
Ogółem ................................. a 100.0 53.1 31.9 20.7 11.2 46.7
Total b 100.0 71.8 54.4 43.5 10.9 28.0
Lokale ................................... a 100.0 91.4 61.9 42.5 19.4 8.1
Premises b 100.0 93.4 74.3 60.8 13.5 6.2
c 100.0 90.8 61.8 43.4 18.4 8.8
Budynki ................................. a 100.0 61.7 22.6 9.0 13.6 38.3
Buildings b 100.0 49.6 22.2 11.7 10.5 50.4
c 100.0 57.8 25.6 13.4 12.2 42.2
Nieruchomości
zabudowane .................. a 100.0 51.1 27.4 15.5 11.9 48.9
Built-up properties b 100.0 71.3 53.2 42.1 11.1 28.7
c 100.0 15.0 6.6 4.1 2.5 85.0
Nieruchomości gruntowe ... a 100.0 19.6 7.0 3.3 3.7 80.4
Land properties b 100.0 40.6 26.6 19.9 6.7 59.4
c 100.0 3.7 1.1 0.5 0.6 96.3

20
TABL. 5. LICZBA TRANSAKCJI KUPNA/SPRZEDAŻY NIERUCHOMOŚCI W LATACH 2006-2012
NUMBER OF PURCHASE/SALE TRANSACTIONS OF PROPERTIES IN 2006-2012
Wyszczególnienie
Specification
a – ogółem
total
b – w granicach miast
urban areas
c – poza granicami miast
rural areas
2006 2007 2008 2009 2010 2011 2012
w liczbach bezwzględnych
in absolute numbers
Ogółem ....................................... a 278176 306085 277013 208190 256614 284576 324133
Total b 147748 149747 138888 100814 124865 144890 172101
c 130428 156338 138125 107376 131749 139686 151495
Lokale ......................................... a 74843 72277 85334 66595 82110 93815 126649
Premises b 67347 65584 78581 60560 75612 87215 115813
c 7496 6693 6753 6035 6498 6600 10299
Budynki ....................................... a 3741 2801 2572 1100 674 856 904
Buildings b 2722 1787 1844 779 394 514 558
c 1019 1014 728 321 280 342 346
Nieruchomości zabudowane ....... a 58386 61949 50325 39069 46491 54087 54519
Built-up properties b 36281 35941 26687 19160 23374 29224 27854
c 22105 26008 23638 19909 23117 24863 26665
Nieruchomości gruntowe ............ a 141206 169058 138782 101426 127339 135818 142061
Land properties b 41398 46435 31776 20315 25485 27937 27876
c 99808 122623 107006 81111 101854 107881 114185
poprzedni rok = 100
previous year = 100
Ogółem ....................................... a 104.9 110.0 90.5 75.2 123.3 110.9 113.9
Total b 102.4 101.4 92.7 72.6 123.9 116.0 118.8
c 107.9 119.9 88.4 77.7 122.7 106.0 108.5
Lokale ......................................... a 98.3 96.6 118.1 78.0 123.3 114.3 135.0
Premises b 98.2 97.4 119.8 77.1 124.9 115.3 132.8
c 99.2 89.3 100.9 89.4 107.7 101.6 156.0
Budynki ....................................... a 102.4 74.9 91.8 42.8 61.3 127.0 105.6
Buildings b 105.9 65.7 103.2 42.2 50.6 130.5 108.6
c 94.3 99.5 71.8 44.1 87.2 122.1 101.2
Nieruchomości zabudowane ....... a 115.3 106.1 81.2 77.6 119.0 116.3 100.8
Built-up properties b 119.7 99.1 74.3 71.8 122.0 125.0 95.3
c 108.6 117.7 90.9 84.2 116.1 107.6 107.2
Nieruchomości gruntowe ............ a 104.9 119.7 82.1 73.1 125.5 106.7 104.6
Land properties b 96.7 112.2 68.4 63.9 125.4 109.6 99.8
c 108.7 122.9 87.3 75.8 125.6 105.9 105.8

21
TABL. 6. WARTOŚĆ TRANSAKCJI KUPNA/SPRZEDAŻY NIERUCHOMOŚCI W LATACH 2006-2012
VALUE OF PURCHASE/SALE TRANSACTIONS OF PROPERTIES IN 2006-2012
Wyszczególnienie
Specification
a – ogółem
total
b – w granicach miast
urban areas
c – poza granicami miast
rural areas
2006 2007 2008 2009 2010 2011 2012
w tys. zł
in thous. zl
Ogółem ......................... a 29493780 44035844 46933493 31901619 33566948 48803189 71051412
Total b 21795512 31106129 33924099 22094750 22337960 34343262 51020936
c 7698268 12929716 13009394 9806869 11228988 14459927 19902846
Lokale ........................... a 5781741 8021891 13491283 12374049 15025812 19053800 27750566
Premises b 5469512 7665076 12936348 11604503 14122201 18167099 25907292
c 312229 356816 554935 769546 903611 886701 1715644
Budynki ......................... a 1099452 851876 1745884 654510 164094 246583 403308
Buildings b 982301 679197 1560182 579710 94825 164969 200060
c 117151 172679 185702 74800 69269 81614 203248
Nieruchomości
zabudowane .......... a 11385575 17273183 16017740 10503337 9221363 15912588 24442158
Built-up properties b 8662408 13214277 11609346 6733814 5210026 10572063 17420493
c 2723167 4058906 4408394 3769523 4011337 5340524 7021665
Nieruchomości
gruntowe ............... a 11227012 17888894 15678586 8369723 9155679 13590218 18455379
Land properties b 6681291 9547579 7818223 3176723 2910908 5439130 7493091
c 4545721 8341315 7860363 5193000 6244771 8151088 10962288
poprzedni rok = 100
previous year = 100
Ogółem ......................... a 126.4 149.3 106.6 68.0 105.2 145.4 145.6
Total b 124.3 142.7 109.1 65.1 101.1 153.7 148.6
c 132.9 168.0 100.6 75.4 114.5 128.8 137.6
Lokale ........................... a 102.8 138.7 168.2 91.7 121.4 126.8 145.6
Premises b 101.5 140.1 168.8 89.7 121.7 128.6 142.6
c 133.9 114.3 155.5 138.7 117.4 98.1 193.5
Budynki ......................... a 142.0 77.5 204.9 37.5 25.1 150.3 163.6
Buildings b 159.4 69.1 229.7 37.2 16.4 174.0 121.3
c 74.0 147.4 107.5 40.3 92.6 117.8 249.0
Nieruchomości
zabudowane .......... a 124.8 151.7 92.7 65.6 87.8 172.6 153.6
Built-up properties b 121.5 152.5 87.9 58.0 77.4 202.9 164.8
c 136.6 149.1 108.6 85.5 106.4 133.1 131.5
Nieruchomości
gruntowe ............... a 143.8 159.3 87.6 53.4 109.4 148.4 135.8
Land properties b 151.8 142.9 81.9 40.6 91.6 186.9 137.8
c 133.4 183.5 94.2 66.1 120.3 130.5 134.5

22
II. PURCHASE/SALE TRANSACTIONS OF PREMISES
The number of purchase/sale transactions of premises registered in 2012 amounted to about 126.6 thous.
accounting for 39.1% of all real estate transactions. The value of the premises turnover reached the level of PLN
27.8 bn, which corresponded to 39.1% of the total real estate turnover. The usable floor space of the premises
constituting the object of the purchase/sale transactions amounted to approx. 7.3 mln m2.
Two basic segments might be distinguished on the premises market i.e. the residential premises segment
and the non-residential premises segment. In 2012 residential premises turnover accounted for 92.0% of the
premises turnover in terms of quantity, 89.2% in terms of value, and 86.2% in terms of the usable area sold.
In the years 2003-2012 a significant growth in the number of the purchase/sale transactions of premises
was observed five times. The growth occurred for the first time in 2004, when the premises turnover in terms of
quantity grew by 6% in relation to 2003. Another period of considerable growth in the number of real estate
transactions of premises was 2008, when the growth of over 18% was recorded in relation to 2007. In last years
of the period in question, the growth of over 23% in the premises turnover in terms of quantity was observed in
2010 in relation to 2009, of over 14% in 2011 in relation to 2010, and of 35% in 2012 in comparison to 2011.
Analysing the value of the premises turnover, we can notice that the turnover level in the years
2003-2006 was quite stable. In the next two years, however, a considerable growth in the value of turnover was
observed of approx. 39% in 2007 and over 68% in 2008 respectively. Then, in 2009
a considerable drop in the sale of premises was recorded, both in terms of quantity and value.
In the following three years both the number and value of premises transactions was gradually increasing on
a year-on-year basis. The value of the purchase/sale transactions of premises in 2010 increased by approx. 21%
in relation to 2009. In 2011, further growth of turnover value of nearly 27% was recorded, and in 2012
- of 45.6%.
The situation in the residential premises segment developed in a similar way as on the premises market in
total. Slightly different tendencies were observed in the non-residential premises segment.
In 2004 and 2005 a drop in the number of the purchase/sale transactions of non-residential premises was
recorded, followed by alternating increases and decreases, observed until 2009. In terms of value, a considerable
growth in the non-residential premises turnover was observed in the period from 2006 to 2008, resulting in the
transaction value in 2008 being more than two times higher than the corresponding value in 2005. 2010 was the
second year in a row recording a drop in non-residential premises turnover, both as regards quantity and value of
transactions made. Not until 2011 was the growth in non-residential premises turnover recorded. In relation to
2010, the number of the purchase/sale transactions increased by almost 28%, whereas the turnover value
increased by over 75%. In 2012 the number of non-residential premises purchase/sale transactions increased by
nearly 46%, and in terms of the value of turnover, the increase amounted to as much as 202.6%.

23

24
Residential premises
In the residential premises segment transactions usually involved three-room or four-room
and larger premises, which in terms of quantity in total constituted 69.7% of the residential premises turnover,
and in terms of value they reached 74.2%. In 2012, the share of turnover of two-room premises was similar as in
the preceding year and constituted 22.5% of total number of purchase/sale transactions of residential premises,
and 18.8% of their total value. The sales of one-room premises in 2012 constituted 4.1% in terms of quantity,
and 3.4% in terms of value.
In 2012, as in the preceding years, sales on the free market constituted the predominating form
of turnover, both in terms of quantity and value, accounting respectively for 81.7% and 88.3% of all transactions.
In terms of quantity, tender sales accounted for 2.1% of the total residential premises turnover,
and for 1.4% in terms of value.
Residential premises were mainly sold in urban areas. Residential premises turnover within the city
borders accounted for over 91% of the total residential premises turnover in terms of quantity,
and for approx. 93% in terms of value. An especially important role was played by markets in cities with powiat
status, where nearly 62% of all purchase/sale transactions of residential premises was made, thereby accounting

25
for approx. 73% of the total value of residential premises turnover. Three-room, four-room and larger premises
were the most frequently sold, both in urban and rural areas.
The largest number of transactions of residential premises was recorded in Dolnośląskie
and Mazowieckie Voivodships. Both these voivodships accounted for approx. 14% of all purchase/sale
transactions of residential premises in Poland. In terms of value, the largest share in the turnover
of residential premises belonged to Mazowieckie Voivodship (nearly 24%), followed by Dolnośląskie,
Pomorskie, Małopolskie and Wielkopolskie Voivodships. The lowest number of transactions was recorded in
Świętokrzyskie, Podkarpackie, Podlaskie and Opolskie Voivodships, which also indicated very low values
of turnover.

26
The number of purchase/sale transactions of residential premises per 10,000 inhabitants ranged from
approx. 11 transactions in Podkarpackie Voivodship to approx. 55 transactions in Dolnośląskie and Pomorskie

27
Voivodships. This indicator was also high in Lubuskie, Warmińsko-Mazurskie and Zachodniopomorskie
Voivodships.
As on the national scale, the sales of three-room, four-room and larger premises played the most
significant role on the voivodship markets. The turnover of smaller premises was noticeable especially in
Małopolskie, Warmińsko-Mazurskie and Zachodniopomorskie Voivodships.

28
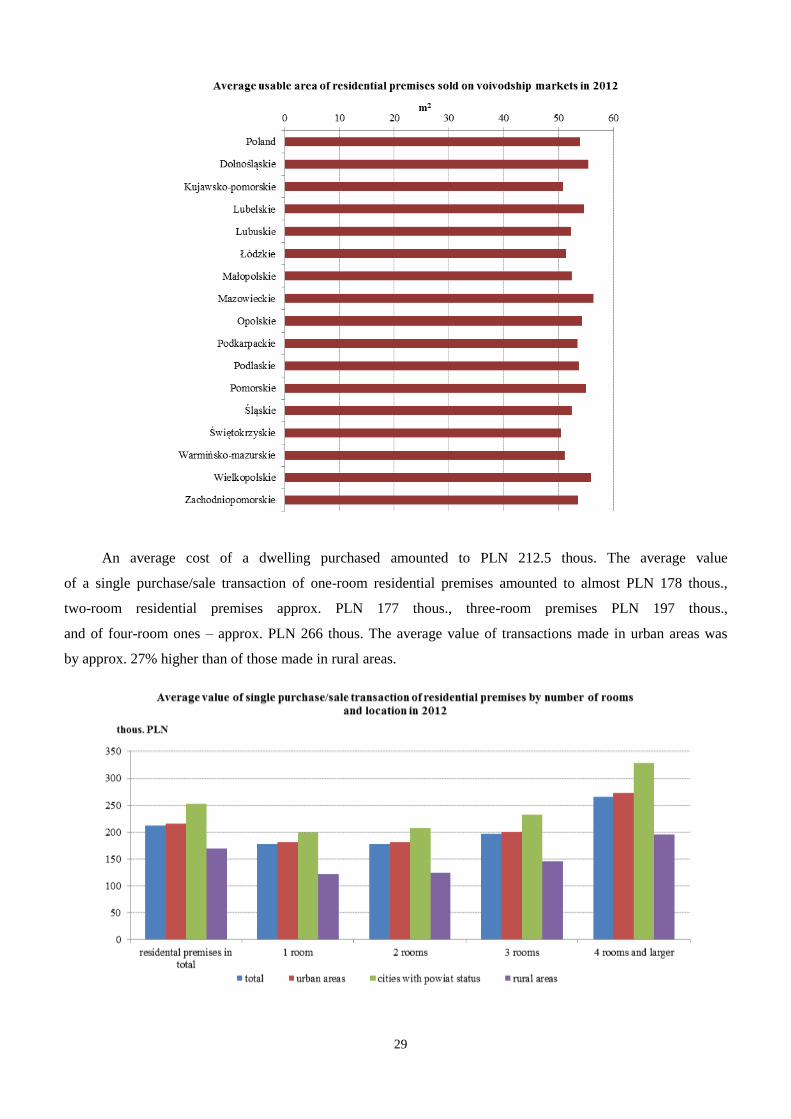
An average usable floor space of the residential premises constituting the object of turnover in 2012
amounted to 53.9 m2. An average usable floor space of one-room premises sold in 2012 amounted to approx.
35.0 m2. For two-room premises this parameter was almost 40.0 m
2, for three-room ones it was approx. 51 m
2,
whereas for four-room and larger premises it amounted to approx. 72 m2. Dwellings sold in rural areas were
usually slightly bigger than those sold in cities.
An average usable floor space of residential premises sold in 2012 ranged from 50.4 m2
in Świętokrzyskie Voivodship to 56.4 m2 in Mazowieckie Voivodship. Also in Wielkopolskie and Dolnośląskie
Voivodships the objects of turnover were residential premises with the largest average usable floor space.
The group of voivodships with by the lowest average area of residential premises being objects of turnover
included Świętokrzyskie, Kujawsko-Pomorskie and Warmińsko-Mazurskie Voivodships.
29
An average cost of a dwelling purchased amounted to PLN 212.5 thous. The average value
of a single purchase/sale transaction of one-room residential premises amounted to almost PLN 178 thous.,
two-room residential premises approx. PLN 177 thous., three-room premises PLN 197 thous.,
and of four-room ones – approx. PLN 266 thous. The average value of transactions made in urban areas was
by approx. 27% higher than of those made in rural areas.
30
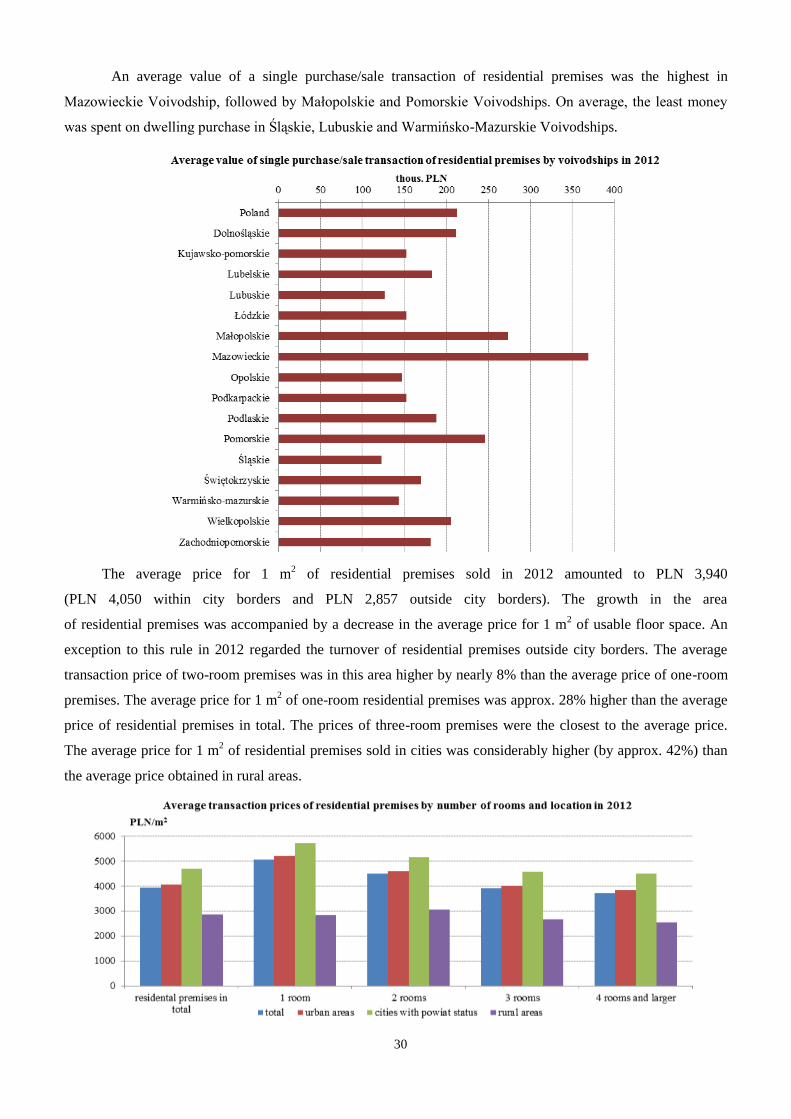
An average value of a single purchase/sale transaction of residential premises was the highest in
Mazowieckie Voivodship, followed by Małopolskie and Pomorskie Voivodships. On average, the least money
was spent on dwelling purchase in Śląskie, Lubuskie and Warmińsko-Mazurskie Voivodships.
The average price for 1 m2 of residential premises sold in 2012 amounted to PLN 3,940
(PLN 4,050 within city borders and PLN 2,857 outside city borders). The growth in the area
of residential premises was accompanied by a decrease in the average price for 1 m2 of usable floor space. An
exception to this rule in 2012 regarded the turnover of residential premises outside city borders. The average
transaction price of two-room premises was in this area higher by nearly 8% than the average price of one-room
premises. The average price for 1 m2 of one-room residential premises was approx. 28% higher than the average
price of residential premises in total. The prices of three-room premises were the closest to the average price.
The average price for 1 m2 of residential premises sold in cities was considerably higher (by approx. 42%) than
the average price obtained in rural areas.

31
The average prices of residential premises ranged from PLN 2,348 per 1 m2 in Śląskie Voivodship
to PLN 6,541 per 1 m2 in Mazowieckie Voivodship. Relatively high prices were also recorded in Małopolskie
Voivodship – PLN 5,216 per 1 m2 and in Pomorskie Voivodship – PLN 4,473 per 1 m
2.
Non-residential premises
As in the preceding years, a relatively insignificant non-residential premises turnover was recorded also in
2012, although with a clear upward trend. 10.1 thous. of non-residential premises purchase/sale transactions
were registered, with the turnover value of approx. PLN 3.0 bn. The area covered by such transactions amounted
to approx. 1 million m2.
Among the non-residential premises, premises classified as "other" were sold the most frequently;
their share in the total number of transactions involving non-residential premises amounted to 64.6%. It is a very
broad category including business premises of various kinds other than commercial premises, office premises,
production premises and garages. Among other things, storage premises, gastronomical premises, consulting
rooms and studios of various types and premises designed for socio-cultural activities are classified to this
category. A slightly lower share in the non-residential premises turnover, in terms of quantity, was recorded in
the category of garages – 26.7% and commercial premises – 7.8%. In terms of value, other non-residential
premises were the most significant, accounting for 82.6% of turnover. Commercial premises were rated second,
with a share of 12.2% in the non-residential premises turnover value, followed by garages, which reached 3.6%
of turnover value. Production premises, in turn, indicated the lowest share in the size of turnover of non-
residential premises, both in terms of quantity and value. In 2012, only 5 transactions in this category of real
estate were recorded in the whole Poland.

32
In 2012 sales on the free market constituted the predominating form of non-residential premises
turnover, accounting for over 89% in terms of quantity and almost 94% in terms of the value of transactions.
Non-residential premises, similarly as residential premises, were mainly sold in urban areas.
The non-residential premises turnover within the city borders accounted for almost 94% of the non-residential
premises turnover in terms of quantity, and approx. 97% in terms of value. An especially important role was
played by markets in cities with powiat status, where over 64% of the total number of purchase/sale transactions
of non-residential premises were made, thereby accounting for approx. 82% of the turnover value of this real
estate category.

33
The largest number of transactions involving non-residential premises was made in Mazowieckie
Voivodship, followed by Dolnośląskie and Śląskie Voivodships. The total number of transactions made in these
three voivodships constituted almost 39% of all transactions involving non-residential premises. In terms of
value, the dominating role was attributed to Mazowieckie Voivodship, which accounted for almost 47% of all
transactions in Poland in terms of value. The lowest number of transactions involving non-residential premises
was recorded in Świętokrzyskie and Podkarpackie Voivodships. In terms of value, the lowest non-residential
premises turnover was observed in Opolskie and Podlaskie Voivodships.

34
Zachodniopomorskie, Lubuskie, Dolnośląskie and Warmińsko-Mazurskie belonged to voivodships with
the largest number of purchase/sale transactions of non-residential premises per 10,000 inhabitants. On the other
hand, the lowest number of purchase/sale transactions of non-residential premises per 10,000 inhabitants was
recorded in Podkarpackie, Świętokrzyskie, Kujawsko-Pomorskie and Łódzkie Voivodships.

35
In terms of quantity, the sales in the category of other premises prevailed in most voivodships. Only in
Lubuskie, Łódzkie and Kujawsko-Pomorskie Voivodships the sales of garages prevailed. The purchase/sale
transactions of production premises constitute a small percentage in non-residential premises turnover,
and transactions of this kind were only recorded in Łódzkie, Lubelskie and Dolnośląskie Voivodships.
It is worth noticing that in Świętokrzyskie Voivodship the structure of sales of non-residential premises was
different than in other voivodships. As many as 27% of transactions within this real-estate category involved
commercial premises, 8% - office premises and approx. 12% - garages. In terms of value, the category of other
premises prevailed in nearly all voivodships, with the exception of Podlaskie, Kujawsko-Pomorskie
and Świętokrzyskie Voivodships, where the most significant role was played by the sales of commercial
premises.
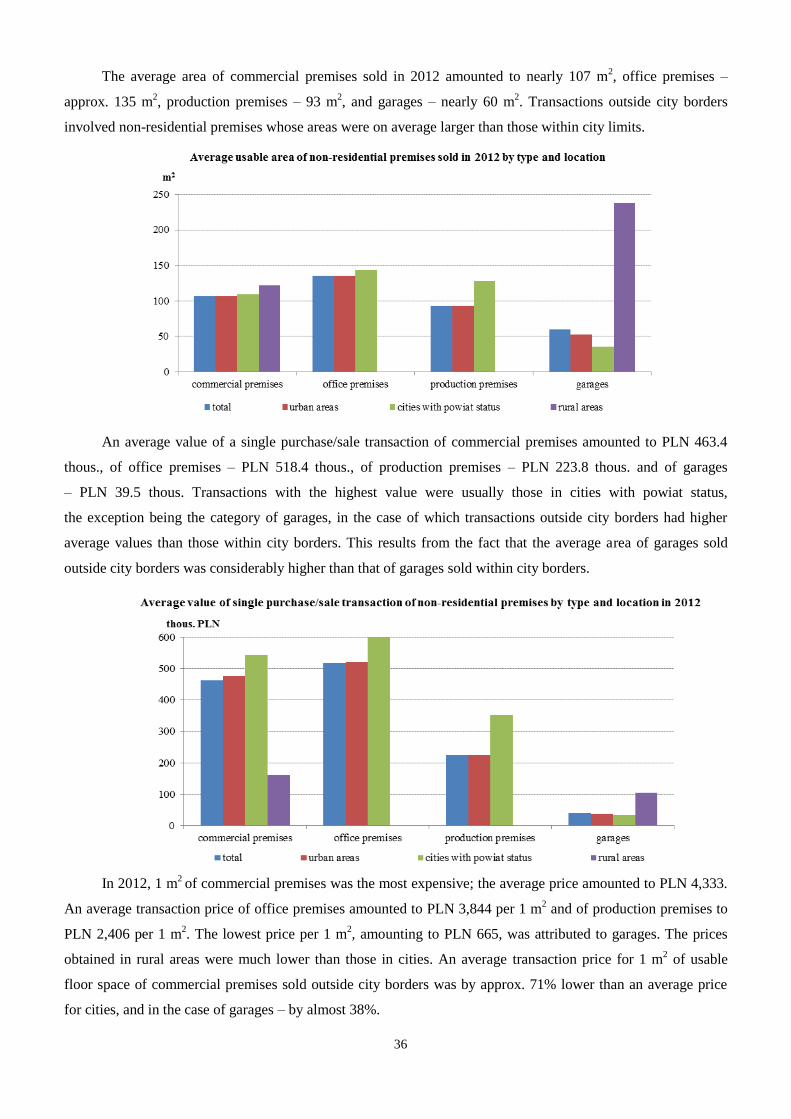
36
The average area of commercial premises sold in 2012 amounted to nearly 107 m2, office premises –
approx. 135 m2, production premises – 93 m
2, and garages – nearly 60 m
2. Transactions outside city borders
involved non-residential premises whose areas were on average larger than those within city limits.
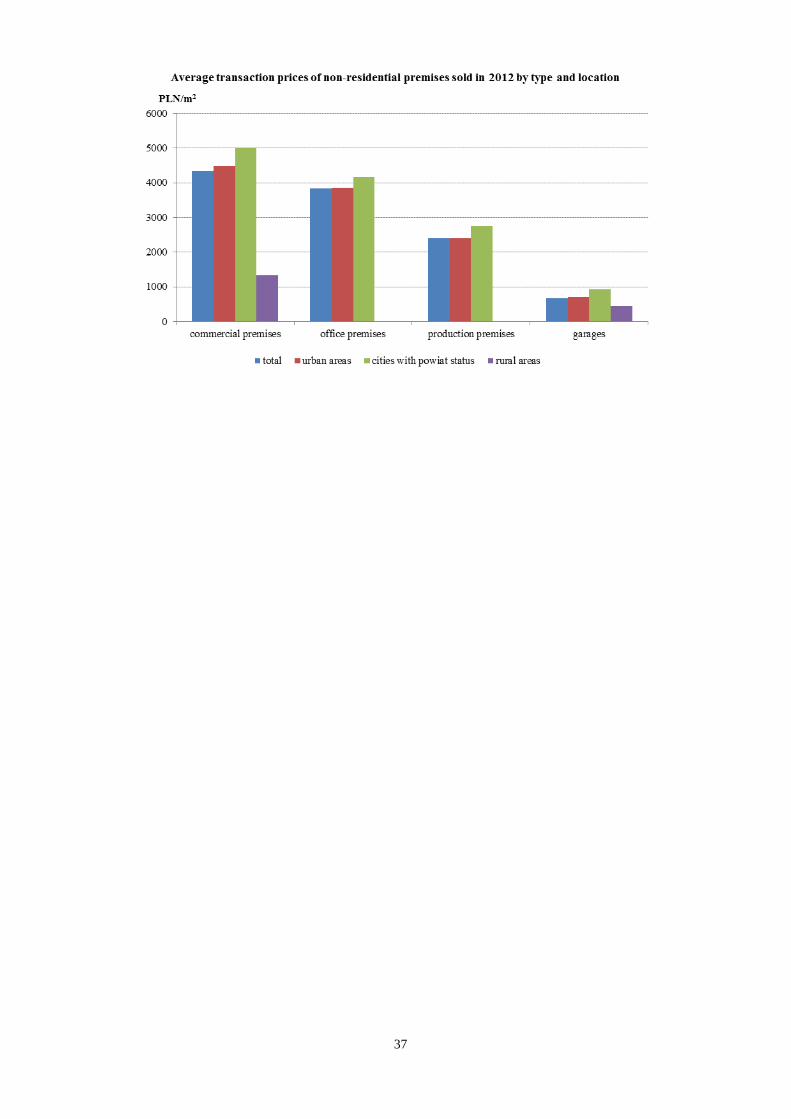
An average value of a single purchase/sale transaction of commercial premises amounted to PLN 463.4
thous., of office premises – PLN 518.4 thous., of production premises – PLN 223.8 thous. and of garages
– PLN 39.5 thous. Transactions with the highest value were usually those in cities with powiat status,
the exception being the category of garages, in the case of which transactions outside city borders had higher
average values than those within city borders. This results from the fact that the average area of garages sold
outside city borders was considerably higher than that of garages sold within city borders.
In 2012, 1 m2 of commercial premises was the most expensive; the average price amounted to PLN 4,333.
An average transaction price of office premises amounted to PLN 3,844 per 1 m2 and of production premises to
PLN 2,406 per 1 m2. The lowest price per 1 m
2, amounting to PLN 665, was attributed to garages. The prices
obtained in rural areas were much lower than those in cities. An average transaction price for 1 m2 of usable
floor space of commercial premises sold outside city borders was by approx. 71% lower than an average price
for cities, and in the case of garages – by almost 38%.
37

38
TABL. 7. TRANSAKCJE KUPNA/SPRZEDAŻY LOKALI W 2012 R.
PURCHASE/SALE TRANSACTIONS OF PREMISES IN 2012
Wyszczególnienie
Specification
a - ogółem
total
b - w granicach miast
urban areas
c - poza granicami miast
rural areas
Liczba transakcji
Number of transactions
Wartość
Value
Powierzchnia
Area
w liczbach
bezwzględnych
in absolute
numbers
w %
in %
w tys. zł
in thous. zl
w %
in %
w m2
in m2
w %
in %
Lokale ogółem2 ................................ a 126649 100.0 27750566 100.0 7292638 100.0
Premises in total b 115813 91.4 25907292 93.4 6621454 90.8
c 10299 8.1 1715644 6.2 638327 8.8
Lokale mieszkalne ............................ a 116555 92.0 24764572 89.2 6285531 86.2
Residential premises b 106367 84.0 22999047 82.9 5678317 77.9
c 9663 7.6 1642673 5.9 574935 7.9
Lokale niemieszkalne ........................ a 10094 8.0 2985995 10.8 1007107 13.8
Non-residential premises b 9446 7.4 2908245 10.5 943137 12.9
c 636 0.5 72971 0.3 63392 0.9
TABL. 8. TRANSAKCJE KUPNA/SPRZEDAŻY LOKALI MIESZKALNYCH W 2012 R.
PURCHASE/SALE TRANSACTIONS OF RESIDENTIAL PREMISES IN 2012
Wyszczególnienie
Specification
a - ogółem
total
b - w granicach miast
urban areas
c - poza granicami miast
rural areas
Liczba transakcji
Number of transactions
Wartość
Value
Powierzchnia
Area
w liczbach
bezwzględnych
in absolute
numbers
w %
in %
w tys. zł
in thous. zl
w %
in %
w m2
in m2
w %
in %
Lokale mieszkalne ogółem ................ a 116555 100.0 24764572 100.0 6285531 100.0
Residential premises in total b 106367 91.3 22999047 92.9 5678317 90.3
c 9663 8.3 1642673 6.6 574935 9.1
1-izbowe ............................................. a 4733 4.1 842205 3.4 166862 2.6
one-room b 4493 3.9 812724 3.2 156383 2.5
c 230 0.2 28177 0.1 9917 0.1
2-izbowe ............................................. a 26244 22.5 4655858 18.8 1038167 16.5
two-room b 24345 20.9 4411714 17.8 960671 15.3
c 1794 1.5 223993 0.9 73249 1.2
3-izbowe ............................................. a 46711 40.1 9203131 37.2 2361538 37.6
three-room b 43209 37.1 8680281 35.1 2169876 34.5
c 3318 2.9 483962 2.0 182506 2.9
4-izbowe i większe .............................. a 34453 29.6 9169310 37.0 2467498 39.3
four-room and larger b 31505 27.0 8581055 34.7 2238586 35.6
c 2768 2.4 541836 2.2 213865 3.4
o nieznanej liczbie izb ......................... a 4414 3.7 894068 3.6 251466 4.0
unknown number of rooms b 2815 2.4 513274 2.1 152801 2.4
c 1553 1.3 364705 1.4 95398 1.5
2 The difference between the item total and the sum of urban areas and rural areas results from the fact that some transactions included
in the Registers of Prices and Values of Real Estate were registered without information on the location of the sold property.

39
TABL. 9. TRANSAKCJE KUPNA/SPRZEDAŻY LOKALI NIEMIESZKALNYCH W 2012 R.
PURCHASE/SALE TRANSACTIONS OF NON-RESIDENTIAL PREMISES IN 2012
Wyszczególnienie
Specification
a - ogółem
total
b - w granicach miast
urban areas
c - poza granicami miast
rural areas
Liczba transakcji
Number of transactions
Wartość
Value
Powierzchnia
Area
w liczbach
bezwzględnych
in absolute
numbers
w %
in %
w tys. zł
in thous. zl
w %
in %
w m2
in m2
w %
in %
Lokale niemieszkalne ogółem ........... a 10094 100.0 2985995 100.0 1007107 100.0
Non-residential premises in total b 9446 93.6 2908245 97.4 943137 93.6
c 636 6.3 72971 2.4 63392 6.3
Handlowo-usługowe ........................... a 783 7.8 362866 12.2 83737 8.3
Commercial b 749 7.4 357344 12.0 79595 7.9
c 33 0.3 5342 0.1 4035 0.4
Biurowe ............................................... a 92 0.9 47694 1.6 12409 1.2
Office b 91 0.9 47594 1.6 12331 1.2
c x x x x x x
Produkcyjne ........................................ a 5 0.0 1119 0.0 465 0.0
Production b 5 0.0 1119 0.0 465 0.0
c – – – – – –
Garaże ................................................. a 2689 26.7 106341 3.6 159894 15.9
Garages b 2582 25.6 95242 3.2 134702 13.4
c 106 1.1 11080 0.4 25176 2.5
Inne ..................................................... a 6525 64.6 2467975 82.6 750602 74.6
Other b 6019 59.7 2406946 80.6 716044 71.1
c 496 4.9 56450 1.9 34103 3.4

40
TABL. 10. TRANSAKCJE KUPNA/SPRZEDAŻY LOKALI WEDŁUG FORMY OBROTU W 2012 R.
PURCHASE/SALE TRANSACTIONS OF PREMISES BY TURNOVER FORM IN 2012
Wyszczególnienie
Specification
a – liczba transakcji
number of transactions
b – wartość w tys. zł
value in thous. zl
c – powierzchnia w m2
area in m2
Ogółem
Total
Forma obrotu
Turnover form
wolny rynek
free market
sprzedaż
bezprzetargowa
sale without
tender procedure
sprzedaż
przetargowa
sale under tender
procedure
Lokale ogółem .............................. a 126649 104201 19568 2880
Premises in total b 27750566 24646082 2662781 441703
c 7292638 6046897 1088701 157040
Lokale mieszkalne ......................... a 116555 95196 18915 2444
Residential premises b 24764572 21846191 2561584 356797
c 6285531 5170472 987993 127066
1-izbowe ..................................... a 4733 4342 299 92
one-room b 842205 807341 29121 5743
c 166862 153013 11192 2657
2-izbowe ..................................... a 26244 22408 3282 554
two-room b 4655858 4254274 348070 53513
c 1038167 899126 118586 20455
3-izbowe ..................................... a 46711 37237 8619 855
three-room b 9203131 8010744 1076635 115753
c 2361538 1910202 409692 41644
4-izbowe i większe ..................... a 34453 27849 6069 535
four-room and larger b 9169310 8066459 1005906 96944
c 2467498 2014521 413391 39586
o nieznanej liczbie izb ................ a 4414 3360 646 408
unknown number of rooms b 894068 707373 101851 84844
c 251466 193610 35132 22724
Lokale niemieszkalne ..................... a 10094 9005 653 436
Non-residential premises b 2985995 2799892 101197 84906
c 1007107 876425 100708 29974
Handlowo-usługowe ................... a 783 662 76 45
Commercial b 362866 335779 19318 7769
c 83737 74127 6358 3252
Biurowe ...................................... a 92 77 11 4
Office b 47694 40120 1570 6003
c 12409 9253 1068 2088
Produkcyjne ................................ a 5 3 x –
Production b 1119 1005 x –
c 465 344 x –
Garaże ......................................... a 2689 2536 123 30
Garages b 106341 103450 2278 613
c 159894 156999 2279 616
Inne ............................................. a 6525 5727 441 357
Other b 2467975 2319537 77918 70521
c 750602 635702 90882 24018

41
TABL. 11. STRUKTURA SPRZEDAŻY LOKALI WEDŁUG FORMY OBROTU W 2012 R.
SALE STRUCTURE OF PREMISES BY TURNOVER FORM IN 2012
Wyszczególnienie
Specification
a – liczba transakcji
number of transactions
b – wartość
value
c – powierzchnia
area
Ogółem
Total
Forma obrotu
Turnover form
wolny rynek
free market
sprzedaż
bezprzetargowa
sale without
tender
procedure
sprzedaż
przetargowa
sale under
tender
procedure
Lokale ogółem .............................. a 100.0 82.3 15.5 2.2
Premises in total b 100.0 88.8 9.6 1.6
c 100.0 82.9 14.9 2.2
Lokale mieszkalne ......................... a 100.0 81.7 16.2 2.1
Residential premises b 100.0 88.3 10.3 1.4
c 100.0 82.3 15.7 2.0
1-izbowe ..................................... a 100.0 91.8 6.3 1.9
one-room b 100.0 95.9 3.5 0.6
c 100.0 91.7 6.7 1.6
2-izbowe ..................................... a 100.0 85.4 12.5 2.1
two-room b 100.0 91.4 7.5 1.1
c 100.0 86.6 11.4 2.0
3-izbowe ..................................... a 100.0 79.7 18.5 1.8
three-room b 100.0 87.0 11.7 1.3
c 100.0 80.9 17.3 1.8
4-izbowe i większe ..................... a 100.0 80.8 17.6 1.6
four-room and larger b 100.0 88.0 11.0 1.0
c 100.0 81.6 16.8 1.6
o nieznanej liczbie izb ................ a 100.0 76.2 14.6 9.2
unknown number of rooms b 100.0 79.1 11.4 9.5
c 100.0 77.0 14.0 9.0
Lokale niemieszkalne ..................... a 100.0 89.2 6.5 4.3
Non-residential premises b 100.0 93.8 3.4 2.8
c 100.0 87.0 10.0 3.0
Handlowo-usługowe ................... a 100.0 84.6 9.7 5.7
Commercial b 100.0 92.6 5.3 2.1
c 100.0 88.5 7.6 3.9
Biurowe ...................................... a 100.0 83.7 12.0 4.3
Office b 100.0 84.1 3.3 12.6
c 100.0 74.6 8.6 16.8
Produkcyjne ................................ a 100.0 60.0 x –
Production b 100.0 89.9 x –
c 100.0 74.0 x –
Garaże ......................................... a 100.0 94.3 4.6 1.1
Garages b 100.0 97.3 2.1 0.6
c 100.0 98.2 1.4 0.4
Inne ............................................. a 100.0 87.8 6.8 5.4
Other b 100.0 94.0 3.2 2.8
c 100.0 84.7 12.1 3.2

42
TABL. 12. TRANSAKCJE KUPNA/SPRZEDAŻY LOKALI WEDŁUG LOKALIZACJI W 2012 R.
PURCHASE/SALE TRANSACTIONS OF PREMISES BY LOCATION IN 2012
Wyszczególnienie
Specification
a – liczba transakcji
number of transactions
b – wartość w tys. zł
value in thous. zl
c – powierzchnia w m2
area in m2
Ogółem
Total
Lokalizacja
Location
w granicach miast
urban areas
poza
granicami
miast
rural areas ogółem
total
w tym miasta na prawach powiatu
of which cities with powiat status
ogółem
total
powyżej
200 tys.
ludności
more than
200 thous.
inhabitants
poniżej
200 tys.
ludności
less than
200 thous.
inhabitants
Lokale ogółem ..................... a 126649 115813 78420 53770 24650 10299
Premises in total b 27750566 25907292 20614063 16855929 3758134 1715644
c 7292638 6621454 4510239 3164453 1345786 638327
Lokale mieszkalne ................ a 116555 106367 71930 49452 22478 9663
Residential premises b 24764572 22999047 18156175 14697329 3458846 1642673
c 6285531 5678317 3876071 2684333 1191738 574935
1-izbowe ............................ a 4733 4493 3553 2843 710 230
one-room b 842205 812724 707588 630010 77578 28177
c 166862 156383 123844 99410 24434 9917
2-izbowe ............................ a 26244 24345 17438 12460 4978 1794
two-room b 4655858 4411714 3612645 2991309 621337 223993
c 1038167 960671 700483 509350 191133 73249
3-izbowe ............................ a 46711 43209 29513 20128 9385 3318
three-room b 9203131 8680281 6872988 5523646 1349341 483962
c 2361538 2169876 1502041 1037049 464992 182506
4-izbowe ............................ a 34453 31505 20611 13547 7064 2768
four-room b 9169310 8581055 6771638 5409828 1361810 541836
c 2467498 2238586 1504888 1011164 493724 213865
o nieznanej liczbie izb ....... a 4414 2815 815 474 341 1553
unknown number of rooms b 894068 513274 191316 142536 48779 364705
c 251466 152801 44815 27360 17455 95398
Lokale niemieszkalne ............ a 10094 9446 6490 4318 2172 636
Non-residential premises b 2985995 2908245 2457888 2158601 299288 72971
c 1007107 943137 634168 480120 154048 63392
Handlowo-usługowe .......... a 783 749 522 323 199 33
Commercial b 362866 357344 284423 224552 59872 5342
c 83737 79595 56977 40855 16122 4035
Biurowe ............................. a 92 91 76 48 28 x
Office b 47694 47594 45521 36367 9155 x
c 12409 12331 10902 8328 2574 x
Produkcyjne ....................... a 5 5 3 x x –
Production b 1119 1119 1058 x x –
c 465 465 384 x x –
Garaże ................................ a 2689 2582 2009 1179 830 106
Garages b 106341 95242 65675 44421 21254 11080
c 159894 134702 71050 30111 40939 25176
Inne .................................... a 6525 6019 3880 2766 1114 496
Other b 2467975 2406946 2061211 1852234 208977 56450
c 750602 716044 494855 400457 94398 34103
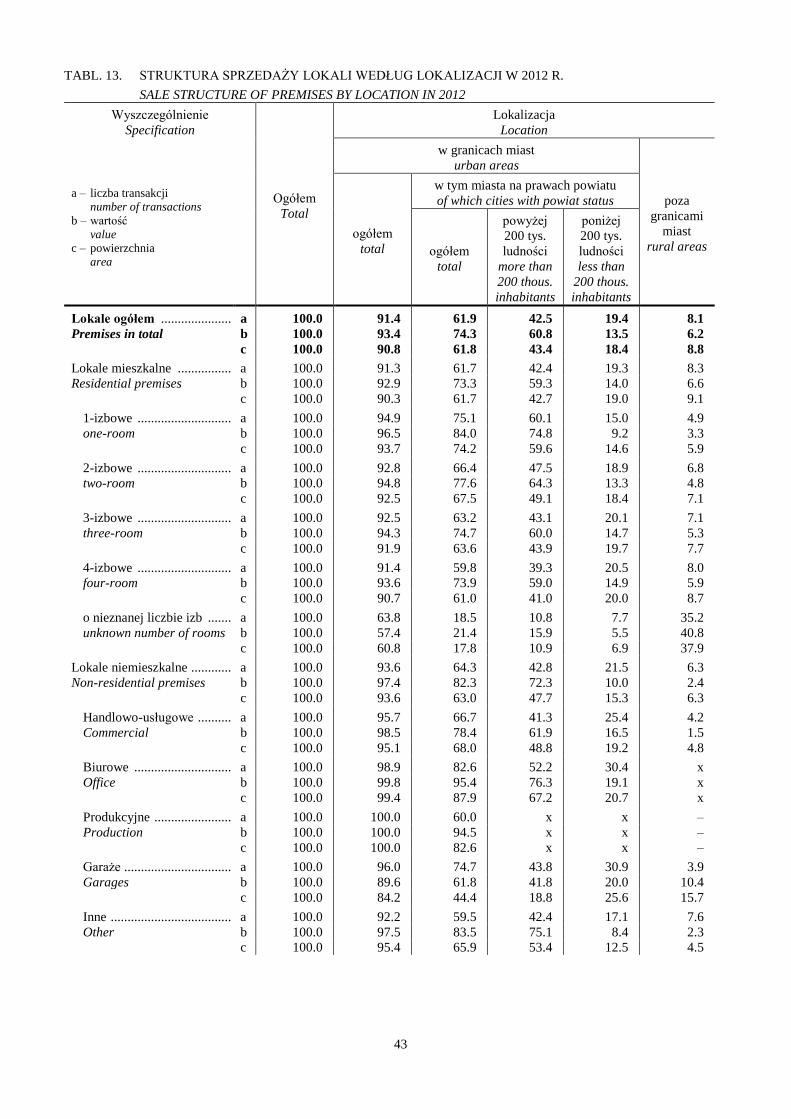
43
TABL. 13. STRUKTURA SPRZEDAŻY LOKALI WEDŁUG LOKALIZACJI W 2012 R.
SALE STRUCTURE OF PREMISES BY LOCATION IN 2012
Wyszczególnienie
Specification
a – liczba transakcji
number of transactions
b – wartość
value
c – powierzchnia
area
Ogółem
Total
Lokalizacja
Location
w granicach miast
urban areas
poza
granicami
miast
rural areas ogółem
total
w tym miasta na prawach powiatu
of which cities with powiat status
ogółem
total
powyżej
200 tys.
ludności
more than
200 thous.
inhabitants
poniżej
200 tys.
ludności
less than
200 thous.
inhabitants
Lokale ogółem ..................... a 100.0 91.4 61.9 42.5 19.4 8.1
Premises in total b 100.0 93.4 74.3 60.8 13.5 6.2
c 100.0 90.8 61.8 43.4 18.4 8.8
Lokale mieszkalne ................ a 100.0 91.3 61.7 42.4 19.3 8.3
Residential premises b 100.0 92.9 73.3 59.3 14.0 6.6
c 100.0 90.3 61.7 42.7 19.0 9.1
1-izbowe ............................ a 100.0 94.9 75.1 60.1 15.0 4.9
one-room b 100.0 96.5 84.0 74.8 9.2 3.3
c 100.0 93.7 74.2 59.6 14.6 5.9
2-izbowe ............................ a 100.0 92.8 66.4 47.5 18.9 6.8
two-room b 100.0 94.8 77.6 64.3 13.3 4.8
c 100.0 92.5 67.5 49.1 18.4 7.1
3-izbowe ............................ a 100.0 92.5 63.2 43.1 20.1 7.1
three-room b 100.0 94.3 74.7 60.0 14.7 5.3
c 100.0 91.9 63.6 43.9 19.7 7.7
4-izbowe ............................ a 100.0 91.4 59.8 39.3 20.5 8.0
four-room b 100.0 93.6 73.9 59.0 14.9 5.9
c 100.0 90.7 61.0 41.0 20.0 8.7
o nieznanej liczbie izb ....... a 100.0 63.8 18.5 10.8 7.7 35.2
unknown number of rooms b 100.0 57.4 21.4 15.9 5.5 40.8
c 100.0 60.8 17.8 10.9 6.9 37.9
Lokale niemieszkalne ............ a 100.0 93.6 64.3 42.8 21.5 6.3
Non-residential premises b 100.0 97.4 82.3 72.3 10.0 2.4
c 100.0 93.6 63.0 47.7 15.3 6.3
Handlowo-usługowe .......... a 100.0 95.7 66.7 41.3 25.4 4.2
Commercial b 100.0 98.5 78.4 61.9 16.5 1.5
c 100.0 95.1 68.0 48.8 19.2 4.8
Biurowe ............................. a 100.0 98.9 82.6 52.2 30.4 x
Office b 100.0 99.8 95.4 76.3 19.1 x
c 100.0 99.4 87.9 67.2 20.7 x
Produkcyjne ....................... a 100.0 100.0 60.0 x x –
Production b 100.0 100.0 94.5 x x –
c 100.0 100.0 82.6 x x –
Garaże ................................ a 100.0 96.0 74.7 43.8 30.9 3.9
Garages b 100.0 89.6 61.8 41.8 20.0 10.4
c 100.0 84.2 44.4 18.8 25.6 15.7
Inne .................................... a 100.0 92.2 59.5 42.4 17.1 7.6
Other b 100.0 97.5 83.5 75.1 8.4 2.3
c 100.0 95.4 65.9 53.4 12.5 4.5

44
TABL. 14. LICZBA TRANSAKCJI KUPNA/SPRZEDAŻY LOKALI W LATACH 2006-2012
NUMBER OF PURCHASE/SALE TRANSACTIONS OF PREMISES IN 2006-2012
Wyszczególnienie
Specification
a – ogółem
total
b – w granicach miast
urban areas
c – poza granicami miast
rural areas
2006 2007 2008 2009 2010 2011 2012
w liczbach bezwzględnych
in absolute numbers
Lokale ......................................... a 74843 72277 85334 66595 82110 93815 126649
Premises b 67347 65584 78581 60560 75612 87215 115813
c 7496 6693 6753 6035 6498 6600 10299
Lokale mieszkalne ...................... a 67936 65792 77526 60894 76698 86897 116555
Residential premises b 61029 59527 71229 55151 70463 80608 106367
c 6907 6265 6297 5743 6235 6289 9663
Lokale niemieszkalne .................. a 6907 6485 7808 5701 5412 6918 10094
Non-residential premises b 6318 6057 7352 5409 5149 6607 9446
c 589 428 456 292 263 311 636
poprzedni rok = 100
previous year = 100
Lokale ......................................... a 98.3 96.6 118.1 78.0 123.3 114.3 135.0
Premises b 98.2 97.4 119.8 77.1 124.9 115.3 132.8
c 99.2 89.3 100.9 89.4 107.7 101.6 156.0
Lokale mieszkalne ...................... a 96.0 96.8 117.8 78.5 126.0 113.3 134.1
Residential premises b 95.8 97.5 119.7 77.4 127.8 114.4 132.0
c 98.0 90.7 100.5 91.2 108.6 100.9 153.6
Lokale niemieszkalne .................. a 128.8 93.9 120.4 73.0 94.9 127.8 145.9
Non-residential premises b 130.1 95.9 121.4 73.6 95.2 128.3 143.0
c 116.6 72.7 106.5 64.0 90.1 118.3 204.5
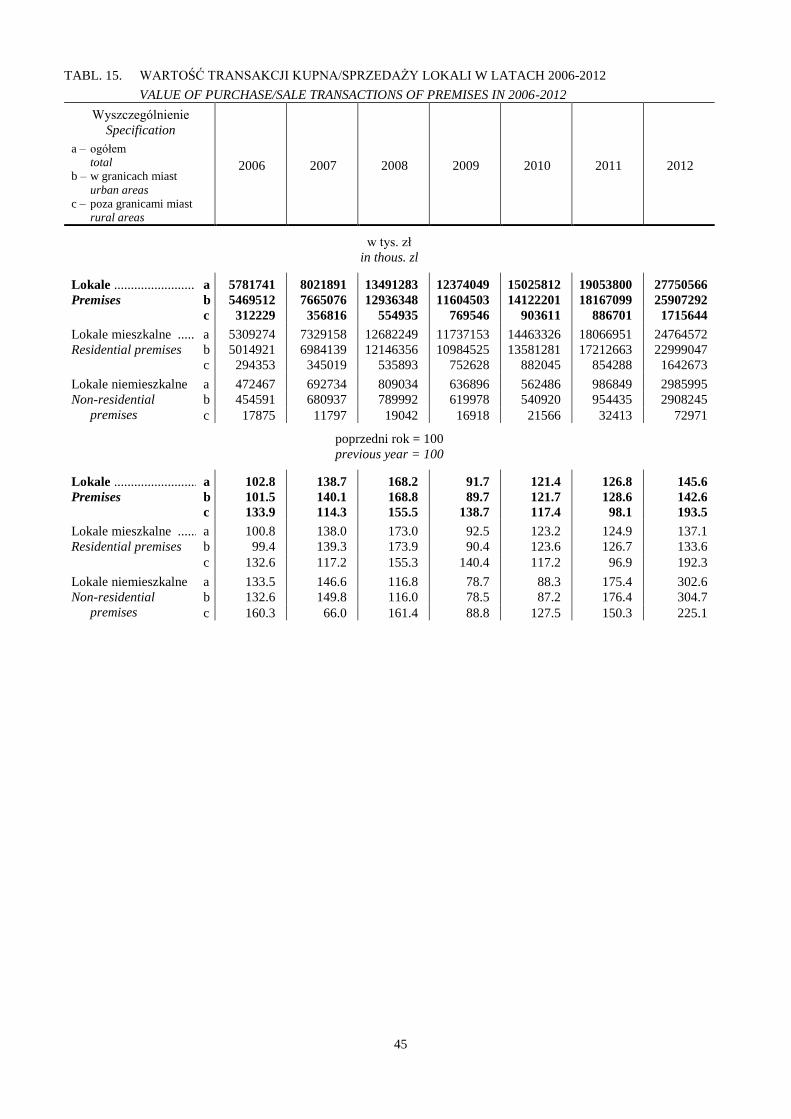
45
TABL. 15. WARTOŚĆ TRANSAKCJI KUPNA/SPRZEDAŻY LOKALI W LATACH 2006-2012
VALUE OF PURCHASE/SALE TRANSACTIONS OF PREMISES IN 2006-2012
Wyszczególnienie
Specification
a – ogółem
total
b – w granicach miast
urban areas
c – poza granicami miast
rural areas
2006 2007 2008 2009 2010 2011 2012
w tys. zł
in thous. zl
Lokale ........................ a 5781741 8021891 13491283 12374049 15025812 19053800 27750566
Premises b 5469512 7665076 12936348 11604503 14122201 18167099 25907292
c 312229 356816 554935 769546 903611 886701 1715644
Lokale mieszkalne ..... a 5309274 7329158 12682249 11737153 14463326 18066951 24764572
Residential premises b 5014921 6984139 12146356 10984525 13581281 17212663 22999047
c 294353 345019 535893 752628 882045 854288 1642673
Lokale niemieszkalne a 472467 692734 809034 636896 562486 986849 2985995
Non-residential
premises
b 454591 680937 789992 619978 540920 954435 2908245
c 17875 11797 19042 16918 21566 32413 72971
poprzedni rok = 100
previous year = 100
Lokale ................................ a 102.8 138.7 168.2 91.7 121.4 126.8 145.6
Premises b 101.5 140.1 168.8 89.7 121.7 128.6 142.6
c 133.9 114.3 155.5 138.7 117.4 98.1 193.5
Lokale mieszkalne ............. a 100.8 138.0 173.0 92.5 123.2 124.9 137.1
Residential premises b 99.4 139.3 173.9 90.4 123.6 126.7 133.6
c 132.6 117.2 155.3 140.4 117.2 96.9 192.3
Lokale niemieszkalne a 133.5 146.6 116.8 78.7 88.3 175.4 302.6
Non-residential
premises
b 132.6 149.8 116.0 78.5 87.2 176.4 304.7
c 160.3 66.0 161.4 88.8 127.5 150.3 225.1

46
TABL. 16. TRANSAKCJE KUPNA/SPRZEDAŻY LOKALI MIESZKALNYCH WEDŁUG WOJEWÓDZTW W
2012 R.
PURCHASE/SALE TRANSACTIONS OF RESIDENTIAL PREMISES BY VOIVODSHIPS IN 2012
Wyszczególnienie
Specification
Liczba transakcji
Number of transactions
Wartość
Value
Powierzchnia
Area
w liczbach
bezwzględnych
in absolute
numbers
w %
in %
w tys. zł
in thous. zl
w %
in %
w m2
in m2
w %
in %
Polska ........................................... 116555 100.0 24764572 100.0 6285531 100.0
Poland
Dolnośląskie .................................. 16099 13.8 3415177 13.8 891477 14.2
Kujawsko-Pomorskie .................... 4979 4.3 760611 3.1 252944 4.0
Lubelskie ....................................... 3640 3.1 666656 2.7 198887 3.2
Lubuskie ....................................... 4834 4.1 611215 2.5 252913 4.0
Łódzkie ......................................... 6496 5.6 988940 4.0 333036 5.3
Małopolskie .................................. 8007 6.9 2187011 8.8 419317 6.7
Mazowieckie ................................. 16035 13.8 5914672 23.9 904234 14.4
Opolskie ........................................ 2757 2.4 405537 1.6 149802 2.4
Podkarpackie ................................. 2238 1.9 340821 1.4 119523 1.9
Podlaskie ....................................... 2268 1.9 426762 1.7 121747 1.9
Pomorskie ..................................... 12628 10.8 3104850 12.5 694185 11.0
Śląskie ........................................... 11721 10.1 1442539 5.8 614483 9.8
Świętokrzyskie .............................. 1740 1.5 296163 1.1 87690 1.3
Warmińsko-Mazurskie .................. 6133 5.3 880256 3.6 313419 5.0
Wielkopolskie ............................... 10073 8.6 2071427 8.4 562668 9.0
Zachodniopomorskie ..................... 6907 5.9 1251936 5.1 369206 5.9
TABL. 17. TRANSAKCJE KUPNA/SPRZEDAŻY LOKALI NIEMIESZKALNYCH WEDŁUG WOJEWÓDZTW W
2012 R.
PURCHASE/SALE TRANSACTIONS OF NON-RESIDENTIAL PREMISES BY VOIVODSHIPS IN 2012
Wyszczególnienie
Specification
Liczba transakcji
Number of transactions
Wartość
Value
Powierzchnia
Area
w liczbach
bezwzględnych
in absolute
numbers
w %
in %
w tys. zł
in thous. zl
w %
in %
w m2
in m2
w %
in %
Polska .......................................... 10094 100.0 2985995 100.0 1007107 100.0
Poland
Dolnośląskie ................................. 1271 12.6 201660 6.8 124811 12.4
Kujawsko-Pomorskie ................... 269 2.7 46768 1.5 25536 2.5
Lubelskie ...................................... 448 4.4 79840 2.7 24625 2.4
Lubuskie ...................................... 500 5.0 46433 1.5 42477 4.2
Łódzkie ........................................ 329 3.3 59720 2.0 20713 2.1
Małopolskie ................................. 757 7.5 205511 6.9 108111 10.7
Mazowieckie ................................ 1452 14.4 1391504 46.6 229558 22.9
Opolskie ....................................... 314 3.1 28430 0.9 12199 1.2
Podkarpackie ................................ 179 1.8 49804 1.7 18936 1.9
Podlaskie ...................................... 254 2.5 37758 1.2 12455 1.2
Pomorskie .................................... 800 7.9 271301 9.1 103406 10.3
Śląskie .......................................... 1180 11.7 99030 3.3 69911 6.9
Świętokrzyskie ............................. 154 1.4 64999 2.2 32633 3.2
Warmińsko-Mazurskie ................. 602 6.0 76204 2.6 26796 2.7
Wielkopolskie .............................. 734 7.3 137151 4.6 57655 5.7
Zachodniopomorskie .................... 851 8.4 189882 6.4 97285 9.7

47
TABL. 18. TRANSAKCJE KUPNA/SPRZEDAŻY LOKALI MIESZKALNYCH WEDŁUG WOJEWÓDZTW I
FORMY OBROTU W 2012 R.
PURCHASE/SALE TRANSACTIONS OF RESIDENTIAL PREMISES BY VOIVODSHIPS AND TURNOVER
FORM IN 2012
Wyszczególnienie
Specification
a – liczba transakcji
number of transactions
b – wartość w tys. zł
value in thous. zl
c – powierzchnia w m2
area in m2
Ogółem
Total
Forma obrotu
Turnover form
wolny rynek
free market
sprzedaż
bezprzetargowa
sale without
tender procedure
sprzedaż
przetargowa
sale under tender
procedure
Polska ........................................ a 116555 95196 18915 2444
Poland b 24764572 21846191 2561584 356797
c 6285531 5170472 987993 127066
Dolnośląskie ............................... a 16099 11191 4530 378
b 3415177 2519400 850254 45522
c 891477 618496 253135 19846
Kujawsko-Pomorskie ................. a 4979 4245 694 40
b 760611 682698 73803 4110
c 252944 217500 33553 1891
Lubelskie .................................... a 3640 3198 425 17
b 666656 644743 20260 1654
c 198887 176652 21286 949
Lubuskie .................................... a 4834 3902 873 59
b 611215 509123 97795 4296
c 252913 206156 44217 2540
Łódzkie ...................................... a 6496 5489 921 86
b 988940 907557 74976 6408
c 333036 282587 46392 4057
Małopolskie ............................... a 8007 6726 1246 35
b 2187011 1892059 289299 5653
c 419317 358528 59129 1660
Mazowieckie .............................. a 16035 15189 724 122
b 5914672 5788698 102295 23679
c 904234 862389 36005 5840
Opolskie ..................................... a 2757 2020 692 45
b 405537 313266 88609 3662
c 149802 109116 38256 2430
Podkarpackie .............................. a 2238 1922 278 38
b 340821 317524 19335 3961
c 119523 103366 14443 1714
Podlaskie .................................... a 2268 1940 315 13
b 426762 373191 52324 1246
c 121747 104418 16691 638
Pomorskie .................................. a 12628 10023 2487 118
b 3104850 2724337 369096 11416
c 694185 560867 127966 5352
Śląskie ........................................ a 11721 8748 2561 412
b 1442539 1209557 200648 32334
c 614483 463150 132326 19007
Świętokrzyskie ........................... a 1740 1685 46 9
b 296163 290634 4530 999
c 87690 85260 2020 410
Warmińsko-Mazurskie ............... a 6133 4829 1244 60
b 880256 716401 158046 5808
c 313419 247422 63090 2907
Wielkopolskie ............................ a 10073 8119 995 959
b 2071427 1822769 46932 201725
c 562668 453748 53844 55076
Zachodniopomorskie .................. a 6907 5970 884 53
b 1251936 1134232 113380 4324
c 369206 320817 45640 2749

48
TABL. 19. TRANSAKCJE KUPNA/SPRZEDAŻY LOKALI NIEMIESZKALNYCH WEDŁUG WOJEWÓDZTW
I FORMY OBROTU W 2012 R.
PURCHASE/SALE TRANSACTIONS OF NON-RESIDENTIAL PREMISES BY VOIVODSHIPS AND
TURNOVER FORM IN 2012
Wyszczególnienie
Specification
a – liczba transakcji
number of transactions
b – wartość w tys. zł
value in thous. zl
c – powierzchnia w m2
area in m2
Ogółem
Total
Forma obrotu
Turnover form
wolny rynek
free market
sprzedaż
bezprzetargowa
sale without
tender procedure
sprzedaż
przetargowa
sale under tender
procedure
Polska ...................................... a 10094 9005 653 436
Poland b 2985995 2799892 101197 84906
c 1007107 876425 100708 29974
Dolnośląskie ............................. a 1271 1037 120 114
b 201660 165556 17377 18728
c 124811 109668 7693 7450
Kujawsko-Pomorskie ............... a 269 247 17 5
b 46768 45018 1174 576
c 25536 24088 1226 222
Lubelskie .................................. a 448 434 3 11
b 79840 77927 130 1783
c 24625 24078 175 372
Lubuskie .................................. a 500 447 23 30
b 46433 41573 2654 2206
c 42477 39898 1125 1454
Łódzkie .................................... a 329 302 17 10
b 59720 56796 1729 1195
c 20713 19175 945 593
Małopolskie ............................. a 757 708 30 19
b 205511 182755 14372 8384
c 108111 102227 2447 3437
Mazowieckie ............................ a 1452 1354 82 16
b 1391504 1349900 14862 26743
c 229558 163853 63415 2290
Opolskie ................................... a 314 257 51 6
b 28430 25521 2650 259
c 12199 10059 1423 717
Podkarpackie ............................ a 179 162 11 6
b 49804 44736 1596 3472
c 18936 16001 992 1943
Podlaskie .................................. a 254 225 27 x
b 37758 34423 3301 x
c 12455 11032 1341 x
Pomorskie ................................ a 800 733 50 17
b 271301 263374 4446 3481
c 103406 100598 1586 1222
Śląskie ...................................... a 1180 1047 76 57
b 99030 86094 7069 5867
c 69911 61296 5020 3595
Świętokrzyskie ......................... a 154 150 x x
b 64999 64226 x x
c 32633 32380 x x
Warmińsko-Mazurskie ............. a 602 523 53 26
b 76204 71605 2716 1883
c 26796 23662 1760 1374
Wielkopolskie .......................... a 734 608 38 88
b 137151 128316 2970 5865
c 57655 51762 2155 3738
Zachodniopomorskie ................ a 851 771 53 27
b 189882 162070 23749 4063
c 97285 86648 9310 1327

49
TABL. 20. TRANSAKCJE KUPNA/SPRZEDAŻY LOKALI MIESZKALNYCH WEDŁUG WOJEWÓDZTW
I LOKALIZACJI W 2012 R.
PURCHASE/SALE TRANSACTIONS OF RESIDENTIAL PREMISES BY VOIVODSHIPS AND LOCATION
IN 2012
Wyszczególnienie
Specification
a – liczba transakcji
number of transactions
b – wartość w tys. zł
value in thous. zl
c – powierzchnia w m2
area in m2
Ogółem
Total
Lokalizacja Location
w granicach miast urban areas
poza
granicami
miast
rural areas
ogółem
total
w tym miasta na prawach powiatu
of which cities with powiat status
ogółem
total
powyżej
200 tys.
ludności
more than
200 thous.
inhabitants
poniżej 200
tys.
ludności
less than
200 thous.
inhabitants
Polska ...................................... a 116555 106367 71930 49452 22478 9663
Poland b 24764572 22999047 18156175 14697329 3458846 1642673
c 6285531 5678317 3876071 2684333 1191738 574935
Dolnośląskie ............................. a 16099 14880 9062 6727 2335 1177
b 3415177 3252209 2520833 2173504 347329 158085
c 891477 816517 497357 359612 137745 70444
Kujawsko-Pomorskie ............... a 4979 4590 3177 2339 838 389
b 760611 720592 553846 456488 97358 40019
c 252944 232051 159953 119501 40452 20893
Lubelskie .................................. a 3640 3499 2211 1741 470 141
b 666656 647425 496402 433466 62936 19231
c 198887 190814 126400 103022 23378 8073
Lubuskie .................................. a 4834 4330 2186 – 2186 504
b 611215 567334 336293 – 336293 43881
c 252913 225485 114504 – 114504 27428
Łódzkie .................................... a 6496 6373 3949 3486 463 123
b 988940 979111 714324 644301 70023 9829
c 333036 326076 199932 176669 23263 6960
Małopolskie ............................. a 8007 7772 6728 6170 558 180
b 2187011 2146380 1970991 1883738 87253 34497
c 419317 405520 353641 323839 29802 11169
Mazowieckie ............................ a 16035 15116 11753 10573 1180 571
b 5914672 5624527 4944728 4727595 217133 185107
c 904234 839156 663899 602268 61631 43766
Opolskie ................................... a 2757 2490 904 – 904 267
b 405537 378991 183714 – 183714 26546
c 149802 134005 48521 – 48521 15797
Podkarpackie ............................ a 2238 2067 1153 – 1153 162
b 340821 318969 194220 – 194220 20965
c 119523 109828 63464 – 63464 9265
Podlaskie .................................. a 2268 2211 1864 1376 488 57
b 426762 421287 379167 301440 77727 5475
c 121747 118836 101610 71809 29801 2911
Pomorskie ................................ a 12628 11499 8369 7343 1026 1129
b 3104850 2899799 2367355 2060505 306849 205051
c 694185 629759 469250 411816 57434 64426
Śląskie ...................................... a 11721 11337 9369 2013 7356 314
b 1442539 1403001 1147912 280827 867085 33810
c 614483 593314 490228 103904 386324 17830
Świętokrzyskie ......................... a 1740 1701 1110 1110 – 39
b 296163 294225 220393 220393 – 1938
c 87690 85817 56552 56552 – 1873
Warmińsko-Mazurskie ............. a 6133 5369 2197 – 2197 764
b 880256 815302 400704 – 400704 64954
c 313419 272780 109818 – 109818 40639
Wielkopolskie .......................... a 10073 7341 4870 4186 684 2732
b 2071427 1446684 1077275 978741 98534 624743
c 562668 391997 258857 223852 35005 170671
Zachodniopomorskie ................ a 6907 5792 3028 2388 640 1114
b 1251936 1083213 648018 536330 111688 168543
c 369206 306362 162085 131489 30596 62790

50
TABL. 21. TRANSAKCJE KUPNA/SPRZEDAŻY LOKALI NIEMIESZKALNYCH WEDŁUG WOJEWÓDZTW
I LOKALIZACJI W 2012 R.
PURCHASE/SALE TRANSACTIONS OF NON-RESIDENTIAL PREMISES BY VOIVODSHIPS AND
LOCATION IN 2012
Wyszczególnienie
Specification
a – liczba transakcji
number of transactions
b – wartość w tys. zł
value in thous. zl
c – powierzchnia w m2
area in m2
Ogółem
Total
Lokalizacja Location
w granicach miast urban areas
poza
granicami
miast
rural areas
ogółem
total
w tym miasta na prawach powiatu
of which cities with powiat status
ogółem
total
powyżej
200 tys.
ludności
more than
200 thous.
inhabitants
poniżej 200
tys.
ludności
less than
200 thous.
inhabitants
Polska ...................................... a 10094 9446 6490 4318 2172 636
Poland b 2985995 2908245 2457888 2158601 299288 72971
c 1007107 943137 634168 480120 154048 63392
Dolnośląskie ............................. a 1271 1172 718 610 108 99
b 201660 190189 139140 116314 22826 11472
c 124811 98152 57865 50237 7628 26659
Kujawsko-Pomorskie ............... a 269 256 183 137 46 13
b 46768 44253 36950 32048 4902 2515
c 25536 24471 19835 17568 2267 1065
Lubelskie .................................. a 448 425 296 264 32 23
b 79840 79107 56116 50629 5487 733
c 24625 23263 16655 15137 1518 1362
Lubuskie .................................. a 500 492 350 – 350 8
b 46433 46118 33890 – 33890 315
c 42477 40611 33221 – 33221 1866
Łódzkie .................................... a 329 321 256 218 38 8
b 59720 59577 52272 44353 7918 143
c 20713 20499 14899 11417 3482 214
Małopolskie ............................. a 757 734 685 660 25 23
b 205511 202867 192156 182163 9993 2644
c 108111 105579 97108 89323 7785 2532
Mazowieckie ............................ a 1452 1399 1145 1036 109 43
b 1391504 1384861 1330455 1315957 14498 2063
c 229558 227624 152725 149040 3685 1479
Opolskie ................................... a 314 306 146 – 146 8
b 28430 27924 18311 – 18311 505
c 12199 11757 5032 – 5032 442
Podkarpackie ............................ a 179 165 70 – 70 14
b 49804 49144 35225 – 35225 661
c 18936 18101 7785 – 7785 835
Podlaskie .................................. a 254 252 223 180 43 x
b 37758 37746 34907 27466 7441 x
c 12455 12422 11236 8493 2743 x
Pomorskie ................................ a 800 736 371 318 53 64
b 271301 260468 189531 174456 15075 10833
c 103406 99300 34915 31554 3361 4106
Śląskie ...................................... a 1180 1169 1036 218 818 9
b 99030 97990 90956 22584 68372 840
c 69911 69195 64689 16658 48031 593
Świętokrzyskie ......................... a 154 153 133 133 – x
b 64999 64992 62219 62219 – x
c 32633 32600 30122 30122 – x
Warmińsko-Mazurskie ............. a 602 573 167 – 167 29
b 76204 75273 25957 – 25957 931
c 26796 25374 6565 – 6565 1422
Wielkopolskie .......................... a 734 598 386 313 73 136
b 137151 127759 106509 93848 12661 9392
c 57655 50435 39086 35754 3332 7220
Zachodniopomorskie ................ a 851 695 325 231 94 156
b 189882 159977 53297 36564 16732 29906
c 97285 83754 42430 24817 17613 13531

51
TABL. 22. TRANSAKCJE KUPNA/SPRZEDAŻY LOKALI MIESZKALNYCH W MIASTACH WOJEWÓDZKICH
W 2012 R.
PURCHASE/SALE TRANSACTIONS OF RESIDENTIAL PREMISES IN VOIVODSHIP CITIES IN 2012
Wyszczególnienie
Specification
Liczba transakcji
Number of transactions
Wartość w tys. zł
Value in thous. zl
Powierzchnia w m2
Area in m2
Miasta wojewódzkie ogółem ...... 50870 14860405 2758295
Voivodship cities in total
M.st. Warszawa ............................ 10070 4651209 576607
Białystok ...................................... 1376 301440 71809
Bydgoszcz .................................... 1728 333995 88635
Gdańsk ......................................... 5333 1519095 301535
Gorzów Wlkp. .............................. 1133 168015 58726
Katowice ...................................... 639 114977 35140
Kielce ........................................... 1110 220393 56552
Kraków ........................................ 6170 1883738 323839
Lublin ........................................... 1741 433466 103022
Łódź ............................................. 3486 644301 176669
Olsztyn ......................................... 1384 275879 68719
Opole ............................................ 904 183714 48521
Poznań .......................................... 4186 978741 223852
Rzeszów ....................................... 831 150836 46924
Szczecin ....................................... 2388 536330 131489
Toruń ............................................ 611 122493 30866
Wrocław ....................................... 6727 2173504 359612
Zielona Góra ................................ 1053 168278 55778
TABL. 23. TRANSAKCJE KUPNA/SPRZEDAŻY LOKALI NIEMIESZKALNYCH W MIASTACH
WOJEWÓDZKICH W 2012 R.
PURCHASE/SALE TRANSACTIONS OF NON-RESIDENTIAL PREMISES IN VOIVODSHIP CITIES IN 2012
Wyszczególnienie
Specification
Liczba transakcji
Number of transactions
Wartość w tys. zł
Value in thous. zl
Powierzchnia w m2
Area in m2
Miasta wojewódzkie ogółem ...... 4679 2189185 509518
Voivodship cities in total
M.st. Warszawa ............................ 984 1309507 146643
Białystok ...................................... 180 27466 8493
Bydgoszcz .................................... 90 22041 15451
Gdańsk ......................................... 199 121049 20433
Gorzów Wlkp. .............................. 160 20373 24740
Katowice ...................................... 101 15817 12238
Kielce ........................................... 133 62219 30122
Kraków ........................................ 660 182163 89323
Lublin ........................................... 264 50629 15137
Łódź ............................................. 218 44353 11417
Olsztyn ......................................... 132 16993 4580
Opole ............................................ 146 18311 5032
Poznań .......................................... 313 93848 35754
Rzeszów ....................................... 21 28013 4503
Szczecin ....................................... 231 36564 24817
Toruń ............................................ 47 10007 2117
Wrocław ....................................... 610 116314 50237
Zielona Góra ................................ 190 13517 8481

52
TABL. 24. TRANSAKCJE KUPNA/SPRZEDAŻY LOKALI MIESZKALNYCH W POWIATACH O NAJWIĘKSZEJ
LICZBIE TRANSAKCJI W 2012 R.
PURCHASE/SALE TRANSACTIONS OF RESIDENTIAL PREMISES IN POWIATS WITH THE LARGEST
NUMBER OF TRANSACTIONS IN 2012
Wyszczególnienie
Specification
Liczba transakcji
Number of transactions
Wartość w tys. zł
Value in thous. zl
Powierzchnia w m2
Area in m2
Polska .......................................... 116555 24764572 6285531
Poland
w tym:
of which:
Powiat m. st. Warszawa ................ 10070 4651209 576607
Powiat m. Wrocław ....................... 6727 2173504 359612
Powiat m. Kraków ........................ 6170 1883738 323839
Powiat m. Gdańsk ......................... 5333 1519095 301535
Powiat m. Poznań ......................... 4186 978741 223852
Powiat m. Łódź ............................. 3486 644301 176669
Powiat poznański .......................... 2507 648857 156313
Powiat m. Szczecin ....................... 2388 536330 131489
Powiat m. Gdynia ......................... 2010 541411 110281
Powiat m. Lublin ........................... 1741 433466 103022
Powiat m. Bydgoszcz .................... 1728 333995 88635
Powiat m. Bytom .......................... 1485 80474 80625
Powiat m. Olsztyn ......................... 1384 275879 68719
Powiat m. Białystok ...................... 1376 301440 71809
Powiat m. Legnica ........................ 1276 195749 76912
Powiat m. Gorzów Wlkp. .............. 1133 168015 58726
Powiat m. Kielce ........................... 1110 220393 56552
Powiat m. Jelenia Góra ................. 1059 151580 60833
Powiat m. Zielona Góra ................ 1053 168278 55778
Powiat wejherowski ...................... 1029 204185 51432
Powiat m. Gliwice ......................... 977 157207 53101
Powiat m. Opole ........................... 904 183714 48521
Powiat wałbrzyski ......................... 877 76814 43262
Powiat świdnicki3.......................... 864 95752 62804
Powiat m. Rzeszów ....................... 831 150836 46924
Powiat m. Sosnowiec .................... 830 100578 41157
Powiat kłodzki .............................. 820 81900 42921
Powiat m. Elbląg ........................... 813 124825 41099
Powiat m. Ruda Śląska ................. 765 85591 38384
Powiat kutnowski .......................... 736 44367 40628
3 in Dolnośląskie Voivodship

53
TABL. 25. TRANSAKCJE KUPNA/SPRZEDAŻY LOKALI NIEMIESZKALNYCH W POWIATACH
O NAJWIĘKSZEJ LICZBIE TRANSAKCJI W 2012 R.
PURCHASE/SALE TRANSACTIONS OF NON-RESIDENTIAL PREMISES IN POWIATS WITH THE
LARGEST NUMBER OF TRANSACTIONS IN 2012
Wyszczególnienie
Specification
Liczba transakcji
Number of transactions
Wartość w tys. zł
Value in thous. zl
Powierzchnia w m2
Area in m2
Polska .......................................... 10094 2985995 1007107
Poland
w tym:
of which:
Powiat m. st. Warszawa ................ 984 1309507 146643
Powiat m. Kraków ........................ 660 182163 89323
Powiat m. Wrocław ....................... 610 116314 50237
Powiat m. Poznań ......................... 313 93848 35754
Powiat m. Lublin ........................... 264 50629 15137
Powiat m. Szczecin ....................... 231 36564 24817
Powiat kołobrzeski ........................ 229 62009 23667
Powiat m. Łódź ............................. 218 44353 11417
Powiat m. Gdańsk ......................... 199 121049 20433
Powiat m. Zielona Góra ................ 190 13517 8481
Powiat m. Białystok ...................... 180 27466 8493
Powiat m. Gliwice ......................... 173 21784 6999
Powiat m. Gorzów Wlkp. .............. 160 20373 24740
Powiat m. Opole ........................... 146 18311 5032
Powiat m. Kielce ........................... 133 62219 30122
Powiat m. Olsztyn ......................... 132 16993 4580
Powiat m. Tychy ........................... 130 7836 4186
Powiat m. Gdynia ......................... 119 53407 11121
Powiat poznański .......................... 115 7380 5055
Powiat m. Katowice ...................... 101 15817 12238
Powiat m. Sosnowiec .................... 93 3302 2698
Powiat wejherowski ...................... 92 12909 4522
Powiat m. Bydgoszcz .................... 90 22041 15451
Powiat kłodzki .............................. 84 10278 6508
Powiat wrocławski ........................ 83 10679 24773
Powiat gdański .............................. 82 10707 4086
Powiat pucki ................................. 74 26345 41388
Powiat m. Siemianowice Śląskie .. 72 1042 1190
Powiat m. Koszalin ....................... 72 10842 16725
Powiat m. Chorzów ....................... 71 2513 1953

54
TABL. 26. ŚREDNIA POWIERZCHNIA UŻYTKOWA SPRZEDANA W POJEDYNCZEJ TRANSAKCJI
KUPNA/SPRZEDAŻY LOKALI WEDŁUG LOKALIZACJI W 2012 R.
AVERAGE USABLE AREA SOLD IN SINGLE PURCHASE/SALE TRANSACTION OF PREMISES BY
LOCATION IN 2012
Wyszczególnienie
Specification
Średnia powierzchnia użytkowa sprzedana w pojedynczej transakcji
Average area sold in single transaction
Ogółem
Total
w granicach miast
urban areas poza granicami
miast
rural areas ogółem
total
w tym miasta na
prawach powiatu
of which cities with
powiat status
w m2 in m
2
Lokale mieszkalne .................... 53.9 53.4 53.9 59.5
Residential premises
w tym:
of which:
1-izbowe ................................ 35.3 34.8 34.9 43.1
one-room
2-izbowe ................................ 39.6 39.5 40.2 40.8
two-room
3-izbowe ................................ 50.6 50.2 50.9 55.0
three-room
4-izbowe ................................. 71.6 71.1 73.0 77.3
four-room
Lokale handlowo-usługowe ...... 106.9 106.3 109.2 122.3
Commercial premises
Lokale biurowe ......................... 134.9 135.5 143.4 x
Office premises
Lokale produkcyjne .................. 93.0 93.0 128.0 –
Production premises
Garaże ....................................... 59.5 52.2 35.4 237.5
Garages
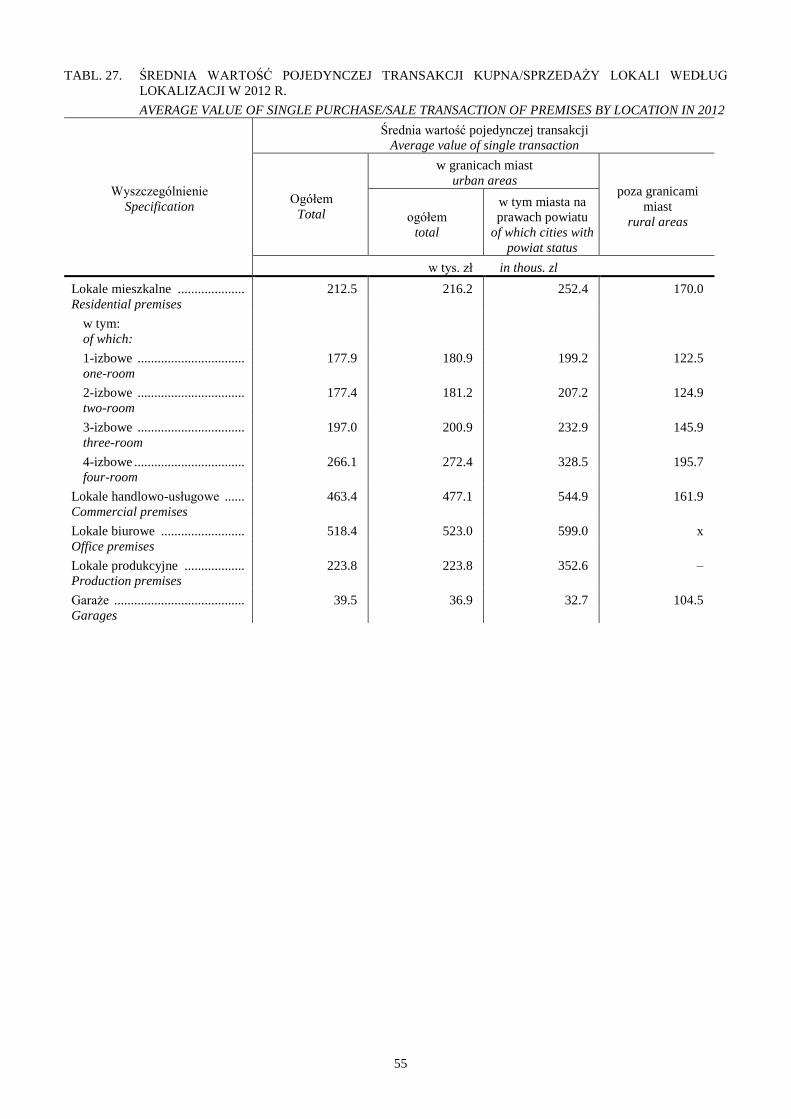
55
TABL. 27. ŚREDNIA WARTOŚĆ POJEDYNCZEJ TRANSAKCJI KUPNA/SPRZEDAŻY LOKALI WEDŁUG
LOKALIZACJI W 2012 R.
AVERAGE VALUE OF SINGLE PURCHASE/SALE TRANSACTION OF PREMISES BY LOCATION IN 2012
Wyszczególnienie
Specification
Średnia wartość pojedynczej transakcji
Average value of single transaction
Ogółem
Total
w granicach miast
urban areas poza granicami
miast
rural areas ogółem
total
w tym miasta na
prawach powiatu
of which cities with
powiat status
w tys. zł in thous. zl
Lokale mieszkalne .................... 212.5 216.2 252.4 170.0
Residential premises
w tym:
of which:
1-izbowe ................................ 177.9 180.9 199.2 122.5
one-room
2-izbowe ................................ 177.4 181.2 207.2 124.9
two-room
3-izbowe ................................ 197.0 200.9 232.9 145.9
three-room
4-izbowe ................................. 266.1 272.4 328.5 195.7
four-room
Lokale handlowo-usługowe ...... 463.4 477.1 544.9 161.9
Commercial premises
Lokale biurowe ......................... 518.4 523.0 599.0 x
Office premises
Lokale produkcyjne .................. 223.8 223.8 352.6 –
Production premises
Garaże ....................................... 39.5 36.9 32.7 104.5
Garages

56
TABL. 28. ŚREDNIE CENY TRANSAKCYJNE LOKALI WEDŁUG LOKALIZACJI W 2012 R.
AVERAGE TRANSACTION PRICES OF PREMISES BY LOCATION IN 2012
Wyszczególnienie
Specification
Średnia cena transakcyjna
Average transaction price
Ogółem
Total
w granicach miast
urban areas poza granicami
miast
rural areas ogółem
total
w tym miasta na
prawach powiatu
of which cities with
powiat status
w zł/m2 in zl/m
2
Lokale mieszkalne .................... 3940 4050 4684 2857
Residential premises
w tym:
of which:
1-izbowe ................................ 5047 5197 5714 2841
one-room
2-izbowe ................................ 4485 4592 5157 3058
two-room
3-izbowe ................................ 3897 4000 4576 2652
three-room
4-izbowe ................................. 3716 3833 4500 2534
four-room
Lokale handlowo-usługowe ...... 4333 4490 4992 1324
Commercial premises
Lokale biurowe ......................... 3844 3860 4176 x
Office premises
Lokale produkcyjne .................. 2406 2406 2755 –
Production premises
Garaże ....................................... 665 707 924 440
Garages

57
TABL. 29. MIARY ŚREDNIE DLA TRANSAKCJI KUPNA/SPRZEDAŻY LOKALI MIESZKALNYCH WEDŁUG
WOJEWÓDZTW W 2012 R.
AVERAGE MEASURES OF PURCHASE/SALE TRANSACTIONS OF RESIDENTIAL PREMISES BY
VOIVODSHIPS IN 2012
Wyszczególnienie
Specification
a – ogółem
total
b – w granicach miast
urban areas
c – poza granicami miast
rural areas
Średnia powierzchnia
sprzedana w pojedynczej
transakcji w m2
Average area sold in
single transaction in m2
Średnia wartość
pojedynczej transakcji
w tys. zł
Average value of single
transaction in thous. zl
Średnia cena
transakcyjna w zł/m2
Average transaction
price in zl/m2
Polska ........................................ a 53.9 212.5 3940
Poland b 53.4 216.2 4050
c 59.5 170.0 2857
Dolnośląskie ............................... a 55.4 212.1 3831
b 54.9 218.6 3983
c 59.9 134.3 2244
Kujawsko-Pomorskie ................. a 50.8 152.8 3007
b 50.6 157.0 3105
c 53.7 102.9 1915
Lubelskie .................................... a 54.6 183.1 3352
b 54.5 185.0 3393
c 57.3 136.4 2382
Lubuskie .................................... a 52.3 126.4 2417
b 52.1 131.0 2516
c 54.4 87.1 1600
Łódzkie ...................................... a 51.3 152.2 2969
b 51.2 153.6 3003
c 56.6 79.9 1412
Małopolskie ............................... a 52.4 273.1 5216
b 52.2 276.2 5293
c 62.1 191.6 3089
Mazowieckie .............................. a 56.4 368.9 6541
b 55.5 372.1 6703
c 76.6 324.2 4229
Opolskie ..................................... a 54.3 147.1 2707
b 53.8 152.2 2828
c 59.2 99.4 1680
Podkarpackie .............................. a 53.4 152.3 2852
b 53.1 154.3 2904
c 57.2 129.4 2263
Podlaskie .................................... a 53.7 188.2 3505
b 53.7 190.5 3545
c 51.1 96.0 1881
Pomorskie .................................. a 55.0 245.9 4473
b 54.8 252.2 4605
c 57.1 181.6 3183
Śląskie ........................................ a 52.4 123.1 2348
b 52.3 123.8 2365
c 56.8 107.7 1896
Świętokrzyskie ........................... a 50.4 170.2 3377
b 50.5 173.0 3429
c 48.0 49.7 1035
Warmińsko-Mazurskie ............... a 51.1 143.5 2809
b 50.8 151.9 2989
c 53.2 85.0 1598
Wielkopolskie ............................ a 55.9 205.6 3681
b 53.4 197.1 3691
c 62.5 228.7 3661
Zachodniopomorskie .................. a 53.5 181.3 3391
b 52.9 187.0 3536
c 56.4 151.3 2684

58
TABL. 30. CHARAKTERYSTYKI OPISOWE ŚREDNICH CEN TRANSAKCJI LOKALAMI NA SZCZEBLU
POWIATÓW W 2012 R.
DESCRIPTIVE CHARACTERISTICS OF AVERAGE TRANSACTION PRICES OF PREMISES AT POWIATS
LEVEL IN 2012
Wyszczególnienie
Specification
a – w granicach miast
urban areas
b – poza granicami miast
rural areas
Średnia cena w zł/m2
Average price in zl/m2
Współczynnik
zmienności w %
Variability
coefficient in % najniższa
lowest
najwyższa
highest
mediana
median
średnia
arytmetyczna
arithmetic
mean
wolny rynek
free market
Lokale mieszkalne ................ a 429 9100 2628 2788 33.4
Residential premises b 189 4903 1606 1829 47.0
Lokale handlowo-usługowe a 577 9093 3602 3687 48.4
Commercial premises b 128 5820 783 2071 102.0
Lokale biurowe ..................... a 354 14107 3224 3946 76.1
Office premises b x x x x x
Garaże ................................... a 91 2808 1027 1042 44.3
Garages b 63 3356 699 959 96.1
sprzedaż bezprzetargowa
sale without tender procedure
Lokale mieszkalne ................ a 84 7986 2020 2083 55.4
Residential premises b 41 4349 931 1093 65.8
Lokale handlowo-usługowe a 671 6643 2223 2983 63.6
Commercial premises b 378 1580 1148 1073 41.7
Lokale biurowe ..................... a 773 3617 1419 1871 55.7
Office premises b – – – – –
Garaże ................................... a 55 4360 736 1008 72.7
Garages b – – – – –
sprzedaż przetargowa
sale under tender procedure
Lokale mieszkalne ................ a 358 6537 2036 2154 44.6
Residential premises b 167 5273 942 1270 76.1
Lokale handlowo-usługowe a 534 10861 2619 3242 76.5
Commercial premises b 659 2071 837 1061 51.7
Lokale biurowe ..................... a 1418 3478 2985 2627 41.0
Office premises b – – – – –
Garaże ................................... a 404 1955 1028 1046 40.1
Garages b x x x x x

59
III. PURCHASE/SALE TRANSACTIONS OF BUILDINGS
Turnover in buildings, as ownership objects separate from the land, is the least numerous category of the
real estate turnover in total. The number of purchase/sale transactions of buildings registered in 2012 amounted
to 904, accounting for 0.3% of all real estate transactions. The turnover value for this real estate category reached
PLN 403 million, which corresponded to 0.6% of the total real estate turnover. The total usable floor space of the
buildings constituting the object of the purchase/sales transactions amounted to 248 thous. m2.
In the survey on the buildings turnover, a distinction was made between residential buildings, industrial
buildings, commercial buildings, office buildings and other non-residential buildings. In 2012 the Polish real
estate market of buildings recorded no transactions involving industrial or commercial buildings. There were
very few transactions with office buildings. The most frequently sold category of non-residential
buildings was other non-residential buildings. This category is very broad and diversified, and it covers,
among other things, hospitals and health care buildings, education, science and culture buildings, farm
buildings, transport and telecommunication buildings, tanks, silos and storage buildings. A comparison
of the structure of turnover on the building market shows that transactions which prevailed in terms of
quantity were those involving residential buildings (59.4% transactions), and in terms of value – non-
residential buildings (53.1% of transaction value).
In 2012 sales on the free market constituted the predominating form of building real estate turnover, both
in terms of quantity and value, accounting respectively for 87.2% and 88.2% of all transactions. In terms of
quantity, tender sales had an insignificant share in the building real estate turnover (4.6% transactions),
while in terms of value the lowest share was that of non-tender sales (3.6% of the value of
transactions).

60
In the years 2003-2010 a decline in the number of purchase/sale transactions of buildings was
observed with a slight revival in 2006, when a growth of 2.4% in the number of transactions,
in relation to the preceding year, was recorded. This resulted from a growth in the sales of residential
buildings in urban areas. In 2008, despite a nearly 9% increase in the sales of non-residential buildings
located within city borders, the overall number of transactions involving buildings dropped by 8%.
It was not until 2011 when the sales of buildings increased by 27% in total as compared to 2010;
yet it was preceded with considerable declines in the number of transactions made in the years 2009
and 2010. In 2012, compared to 2011, the number of transactions increased by less than 6%.
The amount of turnover in 2012 constituted slightly more than 35% of turnover registered in 2008.
Annual sale value of buildings was growing up to 2006, when a growth of 42% in relation to the year
2005 was recorded. The year 2007 brought a decline in the purchase/sale transactions of buildings,
amounting to 22.5%. Then, in 2008, more than a two-fold increase occurred in the value of transactions
made, accompanied by a simultaneous drop in the number of transactions. In the years 2009 and 2010,
a considerable decline in the buildings turnover was observed, both in terms of quantity and value. The
value of buildings sold in 2009 was by 62.5% lower compared to the turnover value in 2008. The value
of turnover in 2010 was again by 74.9% lower than in 2009. The growth of purchase/sale transactions
of buildings recorded in 2011 and 2012 in terms of quantity and value took place both in urban areas
and outside city borders. The value of buildings sold was by over 50% higher than the value of
buildings sold in 2010, and in 2012 by nearly 64% higher than in the preceding year. A very large
increase in the value of turnover was recorded in particular in transactions which involved non-
residential buildings located outside city borders.

61
In 2012, the vast majority of the building real estate turnover in terms of quantity took place within city
borders (61.7% transactions). In terms of value, the prevailing transactions were those involving real estate
located outside city borders (50.4% of turnover value). A particularly high increase in value occurred in
transactions which involved non-residential buildings located in rural areas.

62
The largest building real estate turnover, both in terms of quantity and value, was recorded in
Śląskie, Pomorskie and Zachodniopomorskie Voivodships. These three voivodships accounted for
more than 50% of the total number of transactions and nearly 68% of the value of all transactions in
this real estate category in Poland. The lowest building real estate turnover was recorded in Podlaskie,
Świętokrzyskie and Lubuskie Voivodships.
0 25 50 75 100 125 150 175
Dolnośląskie
Kujawsko-pomorskie
Lubelskie
Lubuskie
Łódzkie
Małopolskie
Mazowieckie
Opolskie
Podkarpackie
Podlaskie
Pomorskie
Śląskie
Świętokrzyskie
Warmińsko-mazurskie
Wielkopolskie
Zachodniopomorskie
Number of purchase/sale transactions of buildings in voivodships in 2012

63
Zachodniopomorskie, Pomorskie and Warmińsko-Mazurskie Voivodships belonged to voivodships with
the largest number of purchase/sale transactions of buildings per 10,000 inhabitants. The lowest
number of transactions per 10,000 inhabitants was observed in Podlaskie, Lubelskie, Dolnośląskie
and Świętokrzyskie Voivodships.

64
On the majority of voivodship markets the sales of residential buildings prevailed.
Zachodniopomorskie, Świętokrzyskie, Podkarpackie and Warmińsko-Mazurskie were the only
voivodships to record more transactions in non-residential than residential buildings. In the value
structure of turnover of buildings, the turnover of non-residential buildings category played
a particularly significant role in Zachodniopomorskie Voivodship (approx. 84%), followed by
Świętokrzyskie (approx. 74%), Lubelskie (approx. 72%) and Podkarpackie Voivodships
(approx. 64%).

65
An average usable area of residential buildings sold in 2012 amounted to approx. 195 m2. Residential
buildings sold in urban areas, particularly in cities with powiat status, were usually larger than those
sold outside the city borders.
An average value of a single purchase/sale transaction made in 2012 for residential buildings amounted to
approx. PLN 352 thous. In the case of residential buildings the average value of a single transaction made in
urban areas, especially in cities with powiat status, was higher than the average value of transactions
made outside the city borders.
An average price for 1 m2 of usable area of residential buildings was at the level of PLN 1,805. In
the case of residential buildings, average prices for 1 m2 of usable area were rather stable, regardless of
location. In cities, the average price was slightly higher than the average price in rural areas (by less
than 5%).

66
TABL. 31. TRANSAKCJE KUPNA/SPRZEDAŻY BUDYNKÓW W 2012 R.
PURCHASE/SALE TRANSACTIONS OF BUILDINGS IN 2012
Wyszczególnienie
Specification
a - ogółem
total
b - w granicach miast
urban areas
c - poza granicami miast
rural areas
Liczba transakcji
Number of transactions
Wartość
Value
Powierzchnia
Area
w liczbach
bezwzględnych
in absolute
numbers
w %
in %
w tys. zł
in thous. zl
w %
in %
w m2
in m2
w %
in %
Budynki ogółem ............................... a 904 100.0 403308 100.0 248313 100.0
Buildings in total b 558 61.7 200060 49.6 143445 57.8
c 346 38.3 203248 50.4 104868 42.2
Budynki mieszkalne .......................... a 537 59.4 189260 46.9 104881 42.2
Residential buildings b 293 32.4 111266 27.6 60501 24.4
c 244 27.0 77994 19.3 44380 17.8
Budynki niemieszkalne ..................... a 367 40.6 214048 53.1 143432 57.8
Non-residential buildings b 265 29.3 88794 22.0 82944 33.4
c 102 11.3 125254 31.1 60488 24.4
TABL. 32. TRANSAKCJE KUPNA/SPRZEDAŻY BUDYNKÓW WEDŁUG FORMY OBROTU W 2012 R.
PURCHASE/SALE TRANSACTIONS OF BUILDINGS BY TURNOVER FORM IN 2012
Wyszczególnienie
Specification
a – liczba transakcji
number of transactions
b – wartość w tys. zł
value in thous. zl
c – powierzchnia w m2
area in m2
Ogółem
Total
Forma obrotu
Turnover form
wolny rynek
free market
sprzedaż
bezprzetargowa
sale without
tender procedure
sprzedaż
przetargowa
sale under tender
procedure
w liczbach bezwzględnych
in absolute numbers
Budynki ogółem ............................ a 904 788 74 42
Buildings in total b 403308 355753 14550 33005
c 248313 223090 13378 11845
Budynki mieszkalne ....................... a 537 492 31 14
Residential buildings b 189260 175736 9999 3525
c 104881 98298 3942 2641
Budynki niemieszkalne .................. a 367 296 43 28
Non-residential buildings b 214048 180017 4551 29480
c 143432 124792 9436 9204
w odsetkach
in percent
Budynki ogółem ............................ a 100.0 87.2 8.2 4.6
Buildings in total b 100.0 88.2 3.6 8.2
c 100.0 89.8 5.4 4.8
Budynki mieszkalne ....................... a 100.0 91.6 5.8 2.6
Residential buildings b 100.0 92.9 5.3 1.8
c 100.0 93.7 3.8 2.5
Budynki niemieszkalne .................. a 100.0 80.7 11.7 7.6
Non-residential buildings b 100.0 84.1 2.1 13.8
c 100.0 87.0 6.6 6.4

67
TABL. 33. TRANSAKCJE KUPNA/SPRZEDAŻY BUDYNKÓW WEDŁUG LOKALIZACJI W 2012 R.
PURCHASE/SALE TRANSACTIONS OF BUILDINGS BY LOCATION IN 2012
Wyszczególnienie
Specification
a – liczba transakcji
number of transactions
b – wartość w tys. zł
value in thous. zl
c – powierzchnia w m2
area in m2
Ogółem
Total
Lokalizacja Location
w granicach miast urban areas
poza
granicami
miast
rural areas
ogółem
total
w tym miasta na prawach powiatu
of which cities with powiat status
ogółem
total
powyżej
200 tys.
ludności
more than
200 thous.
inhabitants
poniżej 200
tys.
ludności
less than
200 thous.
inhabitants
w liczbach bezwzględnych
in absolute numbers
Budynki ogółem ................... a 904 558 204 81 123 346
Buildings in total b 403308 200060 89410 47046 42364 203248
c 248313 143445 63450 33122 30328 104868
Budynki mieszkalne .............. a 537 293 122 61 61 244
Residential buildings b 189260 111266 60284 37979 22305 77994
c 104881 60501 33873 12548 21325 44380
Budynki niemieszkalne ......... a 367 265 82 20 62 102
Non-residential buildings b 214048 88794 29126 9068 20059 125254
c 143432 82944 29577 20574 9003 60488
w odsetkach
in percent
Budynki ogółem ................... a 100.0 61.7 22.6 9.0 13.6 38.3
Buildings in total b 100.0 49.6 22.2 11.7 10.5 50.4
c 100.0 57.8 25.6 13.4 12.2 42.2
Budynki mieszkalne .............. a 100.0 54.6 22.8 11.4 11.4 45.4
Residential buildings b 100.0 58.8 31.9 20.1 11.8 41.2
c 100.0 57.7 32.3 12.0 20.3 42.3
Budynki niemieszkalne ......... a 100.0 72.2 22.3 5.4 16.9 27.8
Non-residential buildings b 100.0 41.5 13.6 4.2 9.4 58.5
c 100.0 57.8 20.6 14.3 6.3 42.2

68
TABL. 34. LICZBA TRANSAKCJI KUPNA/SPRZEDAŻY BUDYNKÓW W LATACH 2006-2012
NUMBER OF PURCHASE/SALE TRANSACTIONS OF BUILDINGS IN 2006-2012
Wyszczególnienie
Specification
a – ogółem
total
b – w granicach miast
urban areas
c – poza granicami miast
rural areas
2006 2007 2008 2009 2010 2011 2012
w liczbach bezwzględnych
in absolute numbers
Budynki ...................................... a 3741 2801 2572 1100 674 856 904
Buildings b 2722 1787 1844 779 394 514 558
c 1019 1014 728 321 280 342 346
Budynki mieszkalne .................... a 2459 1668 1467 567 469 539 537
Residential buildings b 1705 970 955 337 246 287 293
c 754 698 512 230 223 252 244
Budynki niemieszkalne ............... a 1282 1133 1105 533 205 317 367
Non-residential buildings b 1017 817 889 442 148 227 265
c 265 316 216 91 57 90 102
poprzedni rok = 100
previous year = 100
Budynki ...................................... a 102.4 74.9 91.8 42.8 61.3 127.0 105.6
Buildings b 105.9 65.7 103.2 42.2 50.6 130.5 108.6
c 94.3 99.5 71.8 44.1 87.2 122.1 101.2
Budynki mieszkalne .................... a 111.3 67.8 87.9 38.7 82.7 114.9 99.6
Residential buildings b 119.5 56.9 98.5 35.3 73.0 116.7 102.1
c 96.4 92.6 73.4 44.9 97.0 113.0 96.8
Budynki niemieszkalne ............... a 88.8 88.4 97.5 48.2 38.5 154.6 115.8
Non-residential buildings b 88.9 80.3 108.8 49.7 33.5 153.4 116.7
c 88.6 119.2 68.4 42.1 62.6 157.9 113.3

69
TABL. 35. WARTOŚĆ TRANSAKCJI KUPNA/SPRZEDAŻY BUDYNKÓW W LATACH 2006-2012
VALUE OF PURCHASE/SALE TRANSACTIONS OF BUILDINGS IN 2006-2012
Wyszczególnienie
Specification
a – ogółem
total
b – w granicach miast
urban areas
c – poza granicami miast
rural areas
2006 2007 2008 2009 2010 2011 2012
w tys. zł
in thous. zl
Budynki ........................... a 1099452 851876 1745884 654510 164094 246583 403308
Buildings b 982301 679197 1560182 579710 94825 164969 200060
c 117151 172679 185702 74800 69269 81614 203248
Budynki mieszkalne ......... a 465363 387162 548693 187538 123817 171396 189260
Residential buildings b 387525 275016 450179 130502 64154 108187 111266
c 77837 112146 98514 57036 59663 63209 77994
Budynki niemieszkalne .... a 634089 464714 1197191 466972 40277 75187 214048
Non-residential buildings b 594776 404181 1110003 449208 30671 56782 88794
c 39314 60533 87188 17764 9606 18405 125254
poprzedni rok = 100
previous year = 100
Budynki ........................... a 142.0 77.5 204.9 37.5 25.1 150.3 163.6
Buildings b 159.4 69.1 229.7 37.2 16.4 174.0 121.3
c 74.0 147.4 107.5 40.3 92.6 117.8 249.0
Budynki mieszkalne ......... a 124.1 83.2 141.7 34.2 66.0 138.4 110.4
Residential buildings b 156.4 71.0 163.7 29.0 49.2 168.6 102.8
c 61.2 144.1 87.8 57.9 104.6 105.9 123.4
Budynki niemieszkalne .... a 158.7 73.3 257.6 39.0 8.6 186.7 284.7
Non-residential buildings b 161.5 68.0 274.6 40.5 6.8 185.1 156.4
c 125.7 154.0 144.0 20.4 54.1 191.6 680.5

70
TABL. 36. TRANSAKCJE KUPNA/SPRZEDAŻY BUDYNKÓW MIESZKALNYCH WEDŁUG WOJEWÓDZTW
W 2012 R.
PURCHASE/SALE TRANSACTIONS OF RESIDENTIAL BUILDINGS BY VOIVODSHIPS IN 2012
Wyszczególnienie
Specification
Liczba transakcji
Number of transactions
Wartość
Value
Powierzchnia
Area
w liczbach
bezwzględnych
in absolute
numbers
w %
in %
w tys. zł
in thous. zl
w %
in %
w m2
in m2
w %
in %
Polska ............................................... 537 100.0 189260 100.0 104881 100.0
Poland
Dolnośląskie ...................................... 15 2.8 3669 1.9 2294 2.2
Kujawsko-Pomorskie ........................ 16 3.0 2619 1.4 1981 1.9
Lubelskie ........................................... 6 1.1 2125 1.1 712 0.7
Lubuskie ........................................... 5 0.9 413 0.2 903 0.9
Łódzkie ............................................. 13 2.4 5780 3.1 1875 1.8
Małopolskie ...................................... 30 5.6 15096 8.0 7549 7.2
Mazowieckie ..................................... 36 6.7 12619 6.7 6896 6.6
Opolskie ............................................ 36 6.7 6798 3.6 4079 3.9
Podkarpackie ..................................... 30 5.6 6924 3.7 4184 4.0
Podlaskie ........................................... x x x x x x
Pomorskie ......................................... 108 20.1 57200 30.2 15933 15.2
Śląskie ............................................... 120 22.3 36080 19.1 33969 32.4
Świętokrzyskie .................................. 3 0.6 300 0.1 154 0.1
Warmińsko-Mazurskie ...................... 36 6.7 11804 6.2 5606 5.3
Wielkopolskie ................................... 32 6.0 8645 4.6 4363 4.2
Zachodniopomorskie ......................... 50 9.3 18859 10.0 14255 13.6
TABL. 37. TRANSAKCJE KUPNA/SPRZEDAŻY BUDYNKÓW NIEMIESZKALNYCH WEDŁUG WOJEWÓDZTW
W 2012 R.
PURCHASE/SALE TRANSACTIONS OF NON-RESIDENTIAL BUILDINGS BY VOIVODSHIPS IN 2012
Wyszczególnienie
Specification
Liczba transakcji
Number of transactions
Wartość
Value
Powierzchnia
Area
w liczbach
bezwzględnych
in absolute
numbers
w %
in %
w tys. zł
in thous. zl
w %
in %
w m2
in m2
w %
in %
Polska ............................................... 367 100.0 214048 100.0 143432 100.0
Poland
Dolnośląskie ...................................... 3 0.8 252 0.1 254 0.1
Kujawsko-Pomorskie ........................ 9 2.5 731 0.3 737 0.5
Lubelskie ........................................... 3 0.8 5404 2.5 1704 1.2
Lubuskie ........................................... x x x x x x
Łódzkie ............................................. 6 1.6 279 0.1 981 0.7
Małopolskie ...................................... 19 5.2 15698 7.3 24811 17.3
Mazowieckie ..................................... 17 4.6 5731 2.7 7380 5.1
Opolskie ............................................ 10 2.7 6246 2.9 4273 3.0
Podkarpackie ..................................... 48 13.1 12060 5.6 7325 5.1
Podlaskie ........................................... x x x x x x
Pomorskie ......................................... 47 12.8 36825 17.2 18027 12.6
Śląskie ............................................... 40 10.9 21085 9.9 10775 7.5
Świętokrzyskie .................................. 5 1.4 865 0.4 813 0.6
Warmińsko-Mazurskie ...................... 52 14.2 2771 1.3 3118 2.2
Wielkopolskie ................................... 15 4.1 2895 1.4 2662 1.9
Zachodniopomorskie ......................... 90 24.5 102722 48.1 60269 42.0

71
TABL. 38. TRANSAKCJE KUPNA/SPRZEDAŻY BUDYNKÓW MIESZKALNYCH WEDŁUG WOJEWÓDZTW
I FORMY OBROTU W 2012 R.
PURCHASE/SALE TRANSACTIONS OF RESIDENTIAL BUILDINGS BY VOIVODSHIPS AND TURNOVER
FORM IN 2012
Wyszczególnienie
Specification
a – liczba transakcji
number of transactions
b – wartość w tys. zł
value in thous. zl
c – powierzchnia w m2
area in m2
Ogółem
Total
Forma obrotu
Turnover form
wolny rynek
free market
sprzedaż
bezprzetargowa
sale without
tender procedure
sprzedaż
przetargowa
sale under tender
procedure
Polska ...................................... a 537 492 31 14
Poland b 189260 175736 9999 3525
c 104881 98298 3942 2641
Dolnośląskie ............................. a 15 15 – –
b 3669 3669 – –
c 2294 2294 – –
Kujawsko-Pomorskie ............... a 16 15 – x
b 2619 2544 – x
c 1981 1753 – x
Lubelskie .................................. a 6 6 – –
b 2125 2125 – –
c 712 712 – –
Lubuskie .................................. a 5 4 – x
b 413 372 – x
c 903 730 – x
Łódzkie .................................... a 13 12 x –
b 5780 5551 x –
c 1875 1742 x –
Małopolskie ............................. a 30 27 x x
b 15096 13740 x x
c 7549 6606 x x
Mazowieckie ............................ a 36 35 – x
b 12619 12389 – x
c 6896 6856 – x
Opolskie ................................... a 36 34 x x
b 6798 6687 x x
c 4079 3924 x x
Podkarpackie ............................ a 30 29 – x
b 6924 6889 – x
c 4184 4110 – x
Podlaskie .................................. a x x – –
b x x – –
c x x – –
Pomorskie ................................ a 108 88 18 x
b 57200 47823 8701 x
c 15933 13635 2110 x
Śląskie ...................................... a 120 119 – x
b 36080 35960 – x
c 33969 33876 – x
Świętokrzyskie ......................... a 3 3 – –
b 300 300 – –
c 154 154 – –
Warmińsko-Mazurskie ............. a 36 31 3 x
b 11804 10747 208 x
c 5606 4345 312 x
Wielkopolskie .......................... a 32 29 x x
b 8645 8521 x x
c 4363 4234 x x
Zachodniopomorskie ................ a 50 44 5 x
b 18859 18088 634 x
c 14255 13199 889 x

72
TABL. 39. TRANSAKCJE KUPNA/SPRZEDAŻY BUDYNKÓW NIEMIESZKALNYCH WEDŁUG WOJEWÓDZTW
I FORMY OBROTU W 2012 R.
PURCHASE/SALE TRANSACTIONS OF NON-RESIDENTIAL BUILDINGS BY VOIVODSHIPS AND
TURNOVER FORM IN 2012
Wyszczególnienie
Specification
a – liczba transakcji
number of transactions
b – wartość w tys. zł
value in thous. zl
c – powierzchnia w m2
area in m2
Ogółem
Total
Forma obrotu
Turnover form
wolny rynek
free market
sprzedaż
bezprzetargowa
sale without
tender procedure
sprzedaż
przetargowa
sale under tender
procedure
Polska ...................................... a 367 296 43 28
Poland b 214048 180017 4551 29480
c 143432 124792 9436 9204
Dolnośląskie ............................. a 3 3 – –
b 252 252 – –
c 254 254 – –
Kujawsko-Pomorskie ............... a 9 7 x x
b 731 685 x x
c 737 707 x x
Lubelskie .................................. a 3 x x –
b 5404 x x –
c 1704 x x –
Lubuskie .................................. a x x x –
b x x x –
c x x x –
Łódzkie .................................... a 6 5 x –
b 279 277 x –
c 981 916 x –
Małopolskie ............................. a 19 17 x x
b 15698 14388 x x
c 24811 22545 x x
Mazowieckie ............................ a 17 16 – x
b 5731 4526 – x
c 7380 6967 – x
Opolskie ................................... a 10 7 x x
b 6246 5652 x x
c 4273 2610 x x
Podkarpackie ............................ a 48 47 – x
b 12060 12004 – x
c 7325 7044 – x
Podlaskie .................................. a x x – –
b x x – –
c x x – –
Pomorskie ................................ a 47 34 11 x
b 36825 35384 668 x
c 18027 16967 706 x
Śląskie ...................................... a 40 37 x x
b 21085 20366 x x
c 10775 9919 x x
Świętokrzyskie ......................... a 5 5 – –
b 865 865 – –
c 813 813 – –
Warmińsko-Mazurskie ............. a 52 41 7 4
b 2771 1415 176 1180
c 3118 2008 188 922
Wielkopolskie .......................... a 15 14 – x
b 2895 2764 – x
c 2662 2047 – x
Zachodniopomorskie ................ a 90 59 18 13
b 102722 75933 2859 23930
c 60269 50223 6243 3803
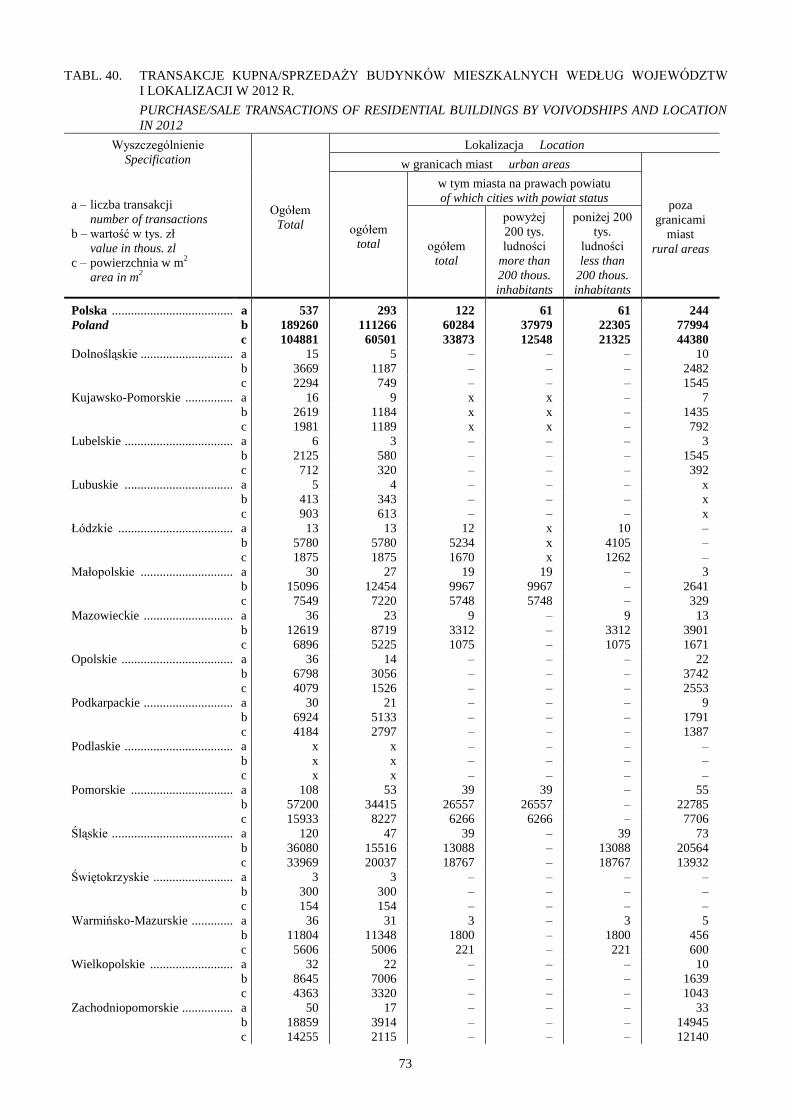
73
TABL. 40. TRANSAKCJE KUPNA/SPRZEDAŻY BUDYNKÓW MIESZKALNYCH WEDŁUG WOJEWÓDZTW
I LOKALIZACJI W 2012 R.
PURCHASE/SALE TRANSACTIONS OF RESIDENTIAL BUILDINGS BY VOIVODSHIPS AND LOCATION
IN 2012
Wyszczególnienie
Specification
a – liczba transakcji
number of transactions
b – wartość w tys. zł
value in thous. zl
c – powierzchnia w m2
area in m2
Ogółem
Total
Lokalizacja Location
w granicach miast urban areas
poza
granicami
miast
rural areas
ogółem
total
w tym miasta na prawach powiatu
of which cities with powiat status
ogółem
total
powyżej
200 tys.
ludności
more than
200 thous.
inhabitants
poniżej 200
tys.
ludności
less than
200 thous.
inhabitants
Polska ...................................... a 537 293 122 61 61 244
Poland b 189260 111266 60284 37979 22305 77994
c 104881 60501 33873 12548 21325 44380
Dolnośląskie ............................. a 15 5 – – – 10
b 3669 1187 – – – 2482
c 2294 749 – – – 1545
Kujawsko-Pomorskie ............... a 16 9 x x – 7
b 2619 1184 x x – 1435
c 1981 1189 x x – 792
Lubelskie .................................. a 6 3 – – – 3
b 2125 580 – – – 1545
c 712 320 – – – 392
Lubuskie .................................. a 5 4 – – – x
b 413 343 – – – x
c 903 613 – – – x
Łódzkie .................................... a 13 13 12 x 10 –
b 5780 5780 5234 x 4105 –
c 1875 1875 1670 x 1262 –
Małopolskie ............................. a 30 27 19 19 – 3
b 15096 12454 9967 9967 – 2641
c 7549 7220 5748 5748 – 329
Mazowieckie ............................ a 36 23 9 – 9 13
b 12619 8719 3312 – 3312 3901
c 6896 5225 1075 – 1075 1671
Opolskie ................................... a 36 14 – – – 22
b 6798 3056 – – – 3742
c 4079 1526 – – – 2553
Podkarpackie ............................ a 30 21 – – – 9
b 6924 5133 – – – 1791
c 4184 2797 – – – 1387
Podlaskie .................................. a x x – – – –
b x x – – – –
c x x – – – –
Pomorskie ................................ a 108 53 39 39 – 55
b 57200 34415 26557 26557 – 22785
c 15933 8227 6266 6266 – 7706
Śląskie ...................................... a 120 47 39 – 39 73
b 36080 15516 13088 – 13088 20564
c 33969 20037 18767 – 18767 13932
Świętokrzyskie ......................... a 3 3 – – – –
b 300 300 – – – –
c 154 154 – – – –
Warmińsko-Mazurskie ............. a 36 31 3 – 3 5
b 11804 11348 1800 – 1800 456
c 5606 5006 221 – 221 600
Wielkopolskie .......................... a 32 22 – – – 10
b 8645 7006 – – – 1639
c 4363 3320 – – – 1043
Zachodniopomorskie ................ a 50 17 – – – 33
b 18859 3914 – – – 14945
c 14255 2115 – – – 12140

74
TABL. 41. TRANSAKCJE KUPNA/SPRZEDAŻY BUDYNKÓW NIEMIESZKALNYCH WEDŁUG WOJEWÓDZTW
I LOKALIZACJI W 2012 R.
PURCHASE/SALE TRANSACTIONS OF NON-RESIDENTIAL BUILDINGS BY VOIVODSHIPS AND
LOCATION IN 2012
Wyszczególnienie
Specification
a – liczba transakcji
number of transactions
b – wartość w tys. zł
value in thous. zl
c – powierzchnia w m2
area in m2
Ogółem
Total
Lokalizacja Location
w granicach miast urban areas
poza
granicami
miast
rural areas
ogółem
total
w tym miasta na prawach powiatu
of which cities with powiat status
ogółem
total
powyżej 200
tys. ludności
more than
200 thous.
inhabitants
poniżej 200
tys. ludności
less than 200
thous.
inhabitants
Polska ................................... a 367 265 82 20 62 102
Poland b 214048 88794 29126 9068 20059 125254
c 143432 82944 29577 20574 9003 60488
Dolnośląskie .......................... a 3 3 – – – –
b 252 252 – – – –
c 254 254 – – – –
Kujawsko-Pomorskie ............ a 9 7 x – x x
b 731 651 x – x x
c 737 283 x – x x
Lubelskie ............................... a 3 x – – – x
b 5404 x – – – x
c 1704 x – – – x
Lubuskie ............................... a x x – – – x
b x x – – – x
c x x – – – x
Łódzkie ................................. a 6 5 x x x x
b 279 199 x x x x
c 981 913 x x x x
Małopolskie .......................... a 19 18 6 6 – x
b 15698 15118 8076 8076 – x
c 24811 24404 18341 18341 – x
Mazowieckie ......................... a 17 11 x – x 6
b 5731 1487 x – x 4244
c 7380 4223 x – x 3157
Opolskie ................................ a 10 4 – – – 6
b 6246 437 – – – 5809
c 4273 1280 – – – 2993
Podkarpackie ......................... a 48 43 23 – 23 5
b 12060 11960 299 – 299 99
c 7325 7165 442 – 442 160
Podlaskie ............................... a x – – – – x
b x – – – – x
c x – – – – x
Pomorskie ............................. a 47 29 11 11 – 18
b 36825 4460 934 934 – 32365
c 18027 6684 1919 1919 – 11343
Śląskie ................................... a 40 25 17 – 17 15
b 21085 19537 18898 – 18898 1548
c 10775 8526 7726 – 7726 2249
Świętokrzyskie ...................... a 5 5 x x – –
b 865 865 x x – –
c 813 813 x x – –
Warmińsko-Mazurskie .......... a 52 52 17 – 17 –
b 2771 2771 230 – 230 –
c 3118 3118 589 – 589 –
Wielkopolskie ....................... a 15 13 x – x x
b 2895 1493 x – x x
c 2662 798 x – x x
Zachodniopomorskie ............. a 90 47 x x – 43
b 102722 24072 x x – 78650
c 60269 22757 x x – 37512

75
TABL. 42. TRANSAKCJE KUPNA/SPRZEDAŻY BUDYNKÓW MIESZKALNYCH W POWIATACH
O NAJWIĘKSZEJ LICZBIE TRANSAKCJI W 2012 R.
PURCHASE/SALE TRANSACTIONS OF RESIDENTIAL BUILDINGS IN POWIATS WITH THE LARGEST
NUMBER OF TRANSACTIONS IN 2012
Wyszczególnienie
Specification
Liczba transakcji
Number of transactions
Wartość w tys. zł
Value in thous. zl
Powierzchnia w m2
Area in m2
Polska .......................................... 537 189260 104881
Poland
w tym:
of which:
Powiat pszczyński ......................... 69 18165 12419
Powiat m. Gdańsk ......................... 39 26557 6266
Powiat m. Ruda Śląska ................. 38 12528 18569
Powiat pucki ................................. 35 17458 5601
Powiat słupski ............................... 33 13175 4031
Powiat gryfiński ............................ 31 7113 10410
Powiat m. Kraków ........................ 19 9967 5748
Powiat braniewski ......................... 19 6645 3419
Powiat golubsko-dobrzyński ......... 10 1123 1120
Powiat m. Skierniewice ................ 10 4105 1262
Powiat m. Ostrołęka ...................... 9 3312 1075
Powiat stalowowolski ................... 9 1798 995
Powiat wołowski ........................... 8 1220 1574
Powiat miński ............................... 8 3196 1222
Powiat bieruńsko-lędziński ........... 8 3842 2191
Powiat kołobrzeski ........................ 8 8232 1810
Powiat warszawski zachodni ........ 7 3402 699
Powiat czarnkowsko-trzcianecki ... 7 1154 692
Powiat grodziski4 .......................... 7 1395 693
Powiat średzki5 ............................. 6 1990 618
Powiat głubczycki ......................... 6 481 549
Powiat kędzierzyńsko-kozielski .... 6 1045 520
Powiat krapkowicki ...................... 6 1065 655
Powiat nyski .................................. 6 291 613
Powiat jarosławski ........................ 6 1850 1033
Powiat tarnobrzeski ....................... 6 1750 679
Powiat kętrzyński .......................... 5 421 322
Powiat rawicki .............................. 5 1959 888
Powiat koszaliński ........................ 5 1850 524
Powiat olkuski............................... 4 627 631
Powiat oświęcimski ...................... 4 1860 841
Powiat białobrzeski ....................... 4 925 2737
Powiat namysłowski ..................... 4 1095 423
Powiat opolski6 ............................. 4 2071 887
Powiat przeworski ......................... 4 960 400
4 in Wielkopolskie Voivodship 5 in Dolnośląskie Voivodship 6 in Opolskie Voivodship

76
TABL. 43. TRANSAKCJE KUPNA/SPRZEDAŻY BUDYNKÓW NIEMIESZKALNYCH W POWIATACH
O NAJWIĘKSZEJ LICZBIE TRANSAKCJI W 2012 R.
PURCHASE/SALE TRANSACTIONS OF NON-RESIDENTIAL BUILDINGS IN POWIATS WITH THE
LARGEST NUMBER OF TRANSACTIONS IN 2012
Wyszczególnienie
Specification
Liczba transakcji
Number of transactions
Wartość w tys. zł
Value in thous. zl
Powierzchnia w m2
Area in m2
Polska ......................................... 367 214048 143432
Poland
w tym:
of which:
Powiat gryfiński ............................ 64 45220 40801
Powiat m. Tarnobrzeg ................... 23 299 442
Powiat słupski ............................... 21 2129 1866
Powiat m. Olsztyn ......................... 17 230 589
Powiat braniewski ......................... 16 1384 1117
Powiat m. Ruda Śląska ................. 15 6647 5574
Powiat kołobrzeski ........................ 15 55282 18406
Powiat pszczyński ......................... 14 1506 2196
Powiat pucki ................................. 13 33433 14090
Powiat m. Gdańsk ......................... 11 934 1919
Powiat jasielski ............................. 9 10751 5018
Powiat tarnobrzeski ....................... 9 136 287
Powiat rawicki .............................. 8 1305 674
Powiat olkuski............................... 7 6143 5153
Powiat węgorzewski ..................... 7 448 455
Powiat m. Kraków ........................ 6 8076 18341
Powiat kozienicki .......................... 6 99 114
Powiat bieruńsko-lędziński ........... 5 510 353
Powiat koszaliński ........................ 5 1264 479
Powiat miński ............................... 4 2368 2703
Powiat kędzierzyńsko-kozielski .... 4 631 1816
Powiat opolski7 ............................. 4 5606 2416
Powiat starachowicki .................... 4 847 794
Powiat czarnkowsko-trzcianecki ... 4 277 705
Powiat opoczyński ........................ 3 159 620
Powiat oświęcimski ...................... 3 337 664
Powiat przeworski ......................... 3 270 1056
Powiat elbląski .............................. 3 60 56
Powiat kętrzyński .......................... 3 88 762
Powiat gołdapski ........................... 3 147 83
7 in Opolskie Voivodship
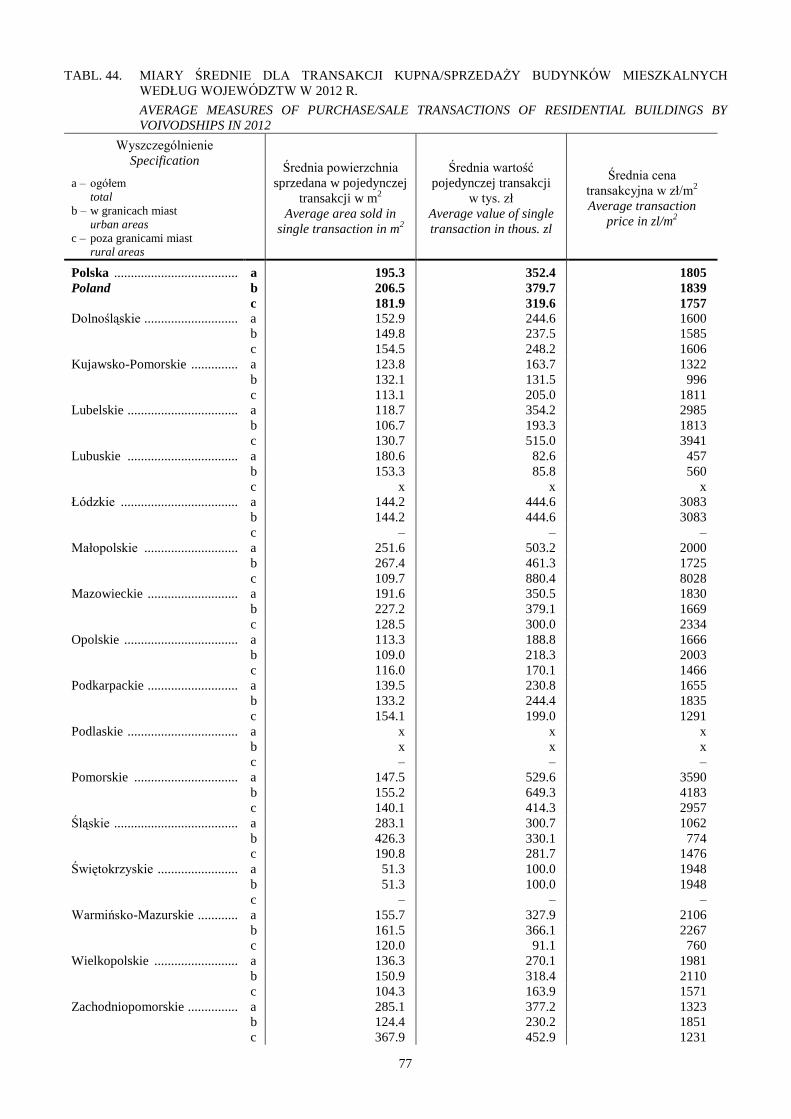
77
TABL. 44. MIARY ŚREDNIE DLA TRANSAKCJI KUPNA/SPRZEDAŻY BUDYNKÓW MIESZKALNYCH
WEDŁUG WOJEWÓDZTW W 2012 R.
AVERAGE MEASURES OF PURCHASE/SALE TRANSACTIONS OF RESIDENTIAL BUILDINGS BY
VOIVODSHIPS IN 2012
Wyszczególnienie
Specification
a – ogółem
total
b – w granicach miast
urban areas
c – poza granicami miast
rural areas
Średnia powierzchnia
sprzedana w pojedynczej
transakcji w m2
Average area sold in
single transaction in m2
Średnia wartość
pojedynczej transakcji
w tys. zł
Average value of single
transaction in thous. zl
Średnia cena
transakcyjna w zł/m2
Average transaction
price in zl/m2
Polska ..................................... a 195.3 352.4 1805
Poland b 206.5 379.7 1839
c 181.9 319.6 1757
Dolnośląskie ............................ a 152.9 244.6 1600
b 149.8 237.5 1585
c 154.5 248.2 1606
Kujawsko-Pomorskie .............. a 123.8 163.7 1322
b 132.1 131.5 996
c 113.1 205.0 1811
Lubelskie ................................. a 118.7 354.2 2985
b 106.7 193.3 1813
c 130.7 515.0 3941
Lubuskie ................................. a 180.6 82.6 457
b 153.3 85.8 560
c x x x
Łódzkie ................................... a 144.2 444.6 3083
b 144.2 444.6 3083
c – – –
Małopolskie ............................ a 251.6 503.2 2000
b 267.4 461.3 1725
c 109.7 880.4 8028
Mazowieckie ........................... a 191.6 350.5 1830
b 227.2 379.1 1669
c 128.5 300.0 2334
Opolskie .................................. a 113.3 188.8 1666
b 109.0 218.3 2003
c 116.0 170.1 1466
Podkarpackie ........................... a 139.5 230.8 1655
b 133.2 244.4 1835
c 154.1 199.0 1291
Podlaskie ................................. a x x x
b x x x
c – – –
Pomorskie ............................... a 147.5 529.6 3590
b 155.2 649.3 4183
c 140.1 414.3 2957
Śląskie ..................................... a 283.1 300.7 1062
b 426.3 330.1 774
c 190.8 281.7 1476
Świętokrzyskie ........................ a 51.3 100.0 1948
b 51.3 100.0 1948
c – – –
Warmińsko-Mazurskie ............ a 155.7 327.9 2106
b 161.5 366.1 2267
c 120.0 91.1 760
Wielkopolskie ......................... a 136.3 270.1 1981
b 150.9 318.4 2110
c 104.3 163.9 1571
Zachodniopomorskie ............... a 285.1 377.2 1323
b 124.4 230.2 1851
c 367.9 452.9 1231

78
TABL. 45. CHARAKTERYSTYKI OPISOWE ŚREDNICH CEN TRANSAKCJI BUDYNKAMI MIESZKALNYMI
NA SZCZEBLU POWIATÓW W 2012 R.
DESCRIPTIVE CHARACTERISTICS OF AVERAGE TRANSACTION PRICES OF RESIDENTIAL
BUILDINGS AT POWIATS LEVEL IN 2012
Wyszczególnienie
Specification
a – w granicach miast
urban areas
b – poza granicami miast
rural areas
Średnia cena w zł/m2
Average price in zl/m2
Współczynnik
zmienności w %
Variability
coefficient in % najniższa
lowest
najwyższa
highest
mediana
median
średnia
arytmetyczna
arithmetic
mean
wolny rynek
free market
Budynki mieszkalne .............. a 226 8145 2326 2300 61.3
Residential buildings b 228 12778 1695 2208 98.1
sprzedaż bezprzetargowa
sale without tender procedure
Budynki mieszkalne .............. a 85 6723 816 1895 127.1
Residential buildings b 184 3639 928 1405 88.2
sprzedaż przetargowa
sale under tender procedure
Budynki mieszkalne .............. a 237 4958 1170 1732 95.6
Residential buildings b 233 5750 567 1779 149.5

79
IV. PURCHASE/SALE TRANSACTIONS OF BUILT-UP PROPERTIES
The number of purchase/sale transactions of built-up properties registered in 2012 amounted to
approx. 54.5 thous., which accounted for 16.8% of all real estate transactions. The value of built-up properties
turnover reached the level of PLN 24.4 bn, which corresponded to 34.4% of the total real estate turnover.
The cadastral area of built-up properties constituting the object of purchase/sale transactions amounted to more
than 524.4 mln m2.
In the survey on built-up properties turnover, a distinction was made between the properties built up with
residential buildings, built-up agricultural land, and other built-up properties, i.e. properties built up with
buildings having other purposes than farmstead and residential ones. In 2012 the predominating role in the built-
up properties turnover was attributed to the properties built up with residential buildings, accounting for more
than a half of the built-up properties turnover, both in terms of quantity and value (54.7% and 53.6%,
respectively). Other built-up properties constituted the second category in terms of significance, which in terms
of the number of transactions made accounted for 23.7% of the market, and in terms of value for 37.0%. Built-up
agricultural land transactions constituted the smallest part of built-up properties turnover, both in terms of
quantity and value (respectively 21.6% and 9.4% of built-up properties turnover).
Within the built-up properties turnover, the ownership title was the most frequently occurring type of land
ownership right. Within the structure of quantity, it accounted for 93.9% of all purchase/sale transactions of
built-up properties, and within the structure of value for 91.6%.
In 2012 sales on the free market constituted the predominating form of the built-up properties turnover,
accounting for 89.1% of the total number of transactions, and for 90.6% of the total turnover value of this type of
properties. In terms of quantity, tender sales constituted merely 4.4% of built-up properties turnover, and in
terms of value 5.1%.

80
In the years 2003-2007 a constant growth was observed in both the number and value of the purchase/sale
transactions of built-up properties. After that, in two subsequent years a considerable decline of the turnover in
this real estate category was recorded. In 2010 a growth in the number of transactions involving built-up
properties was observed, together with a simultaneous continuing drop in the value of transactions made. In 2011
not only a growth in the number of transactions involving built-up properties was observed, but also a
considerable increase in the value of these transactions. In 2012 the number of the purchase/sale transactions of
built-up properties grew slightly, by approx. 1%, whereas their value increased by nearly 54% in relation to the
previous year. A slight increase in the number of the purchase/sale transactions of built-up properties resulted
from a growth in the number of transactions involving properties located outside city borders, and a
simultaneous drop in the number of real estate transactions involving properties locates within city borders. Only
in the case of built-up agricultural land an increase in the number of transactions involving properties located
within city borders was recorded, amounting to 3%. The growth in the turnover value, observed in 2012,
concerned each of the built-up properties market segments, and it resulted, among others, from an increase in the
average area and average value of the properties sold in a single transaction. The highest growth in terms of
value of the transactions made was observed in the segment of other built-up properties located within city
borders – of approx. 92%, while the lowest increase concerned the value of the purchase/sale transactions of
properties built up with residential buildings, located outside city borders – of less than 17%, in relation to the
preceding year.

81
In 2012 the number of purchase/sale transactions of built-up properties was relatively evenly allocated
between urban areas (51.1%) and rural areas (48.9%). However, over 71% of the total value of transactions
referred to transactions made in cities. Both in terms of quantity and value, the most significant role was played
by the purchase/sale transactions of properties built up with residential buildings.

82
The highest built-up properties turnover, in terms of the number of transactions made, was recorded in
Śląskie and Mazowieckie Voivodships. The number of transactions reached a similar level in these two
voivodships, in each case accounting for approx. 13% of all purchase/sale transactions of built-up properties.
In terms of value, the largest number of transactions concerned Mazowieckie Voivodship – nearly 28% of all
purchase/sale transactions of built-up properties. The lowest turnover, both in terms of number and value, was
recorded in Opolskie and Podlaskie Voivodships.

83
The number of purchase/sale transactions of built-up properties per 10 000 inhabitants
at voivodship level in 2012 ranged from approx. 10 transactions in Małopolskie Voivodship to over 20
transactions in Świętokrzyskie Voivodship. The highest indicators also characterised the following voivodships:
Lubuskie, Dolnośląskie and Warmińsko-Mazurskie.

84
Similar as on the national scale, the largest number of transactions recorded on most voivodship markets
concerned the sales of properties built up with residential buildings. A different situation was observed only in
Świętokrzyskie Voivodship, where both in terms of quantity and value the highest share in the turnover was
attributed to built-up agricultural land. Furthermore, in Lubelskie and Podlaskie Voivodships most transactions
of built-up properties concerned agricultural land, but in terms of value these transactions did not have the
highest share within the structure of total sales of built-up properties. In terms of value, other built-up property
turnover prevailed in most voivodships. Mazowieckie Voivodship stands out in terms of the value structure,
where the share of properties built up with residential buildings is considerably prevalent, accounting for over
84% of the total value of transactions made in that voivodship.

85
An average cadastral area of the properties built up with residential buildings sold in 2012 amounted to
2752.0 m2, of built-up agricultural land to 30863.2 m
2, and of other built-up properties to 6078.8 m
2.
An average cadastral area of the properties built up with residential buildings sold in a single transaction
in 2012 ranged from 1270.3 m2 in Wielkopolskie Voivodship to 5112.3 m
2 in Śląskie Voivodship.

86
In 2012, similarly to the previous year, considerable disproportions were observed in an average size of
built-up agricultural land sold in particular voivodships. This specifically applied to the following voivodships:
Warmińsko-Mazurskie (86183.3 m2), Pomorskie (70148.4 m
2), Opolskie (68675.4 m
2), and Kujawsko-
Pomorskie (55238.2 m2), which considerably exceeded the average for Poland in total. The lowest cadastral area
of built-up agricultural land sold in a single transaction was recorded in Podkarpackie Voivodship – 8952.0 m2.

87
An average value of a single purchase/sale transaction of a property built up with residential buildings
made in 2012 amounted to PLN 439.2 thous., of built-up agricultural land to PLN 193.8 thous., and of other
built-up properties to PLN 702.3 thous. In the case of each of the built-up properties category under analysis, the
transactions made in cities, and particularly in cities with powiat status, were characterised by higher values than
those made in rural areas.
An average value of a single purchase/sale transaction of a property built up with residential buildings
ranged from PLN 197.7 thous. in Podkarpackie Voivodship to PLN 1241.6 thous. in Mazowieckie Voivodship.
An average value of a single purchase/sale transaction of built-up agricultural land ranged from PLN
97.5 thous. in Lubelskie Voivodship to PLN 381.0 thous. in Pomorskie Voivodship.

88
An average price for 1 m2 of cadastral area of properties built up with residential buildings amounted to
PLN 159.6, of built-up agricultural land to PLN 6.3, and of other built-up properties to PLN 115.5.
The highest average transaction price for properties built up with residential buildings was recorded in
Mazowieckie Voivodship. It amounted to PLN 649.1 per 1 m2 and was by over four timeshigher than the
average price for Poland in total. The lowest average transaction price for properties built-up with residential
buildings was recorded in Śląskie Voivodship – approx. PLN 49.6 per 1 m2.

89
The highest average transaction price for built-up agricultural land was recorded in Śląskie Voivodship –
approx. PLN 16.9 per 1 m2. The lowest average transaction price for built-up agricultural land was recorded in
Warmińsko-Mazurskie Voivodship – PLN 3.2 per 1 m2. The highest average cadastral area in Poland was
recorded in Warmińsko-Mazurskie, whereas one of the lowest average cadastral areas in a single transaction in
Poland concerned Śląskie Voivodship.

90
TABL. 46. TRANSAKCJE KUPNA/SPRZEDAŻY NIERUCHOMOŚCI ZABUDOWANYCH W 2012 R.
PURCHASE/SALE TRANSACTIONS OF BUILT-UP PROPERTIES IN 2012
Wyszczególnienie
Specification
a - ogółem
total
b - w granicach miast
urban areas
c - poza granicami miast
rural areas
Liczba transakcji
Number of transactions
Wartość
Value
Powierzchnia
Area
w liczbach
bezwzględnych
in absolute
numbers
w %
in %
w tys. zł
in thous. zl
w %
in %
w m2
in m2
w %
in %
Nieruchomości zabudowane
ogółem ......................................... a 54519 100.0 24442158 100.0 524370822 100.0
Built-up properties in total b 27854 51.1 17420493 71.3 78558055 15.0
c 26665 48.9 7021665 28.7 445812767 85.0
Nieruchomości zabudowane
budynkami mieszkalnymi ............ a 29840 54.7 13105006 53.6 82120225 15.7
Properties built up with residential
buildings
b 18303 33.6 9832176 40.2 46679804 8.9
c 11537 21.1 3272830 13.4 35440421 6.8
Grunty rolne zabudowane ................. a 11791 21.6 2285514 9.4 363907485 69.4
Built-up agricultural land b 948 1.7 226620 1.0 6244769 1.2
c 10843 19.9 2058893 8.4 357662716 68.2
Nieruchomości zabudowane
pozostałe ...................................... a 12888 23.7 9051638 37.0 78343112 14.9
Other built-up properties b 8603 15.8 7361696 30.1 25633482 4.9
c 4285 7.9 1689942 6.9 52709630 10.0
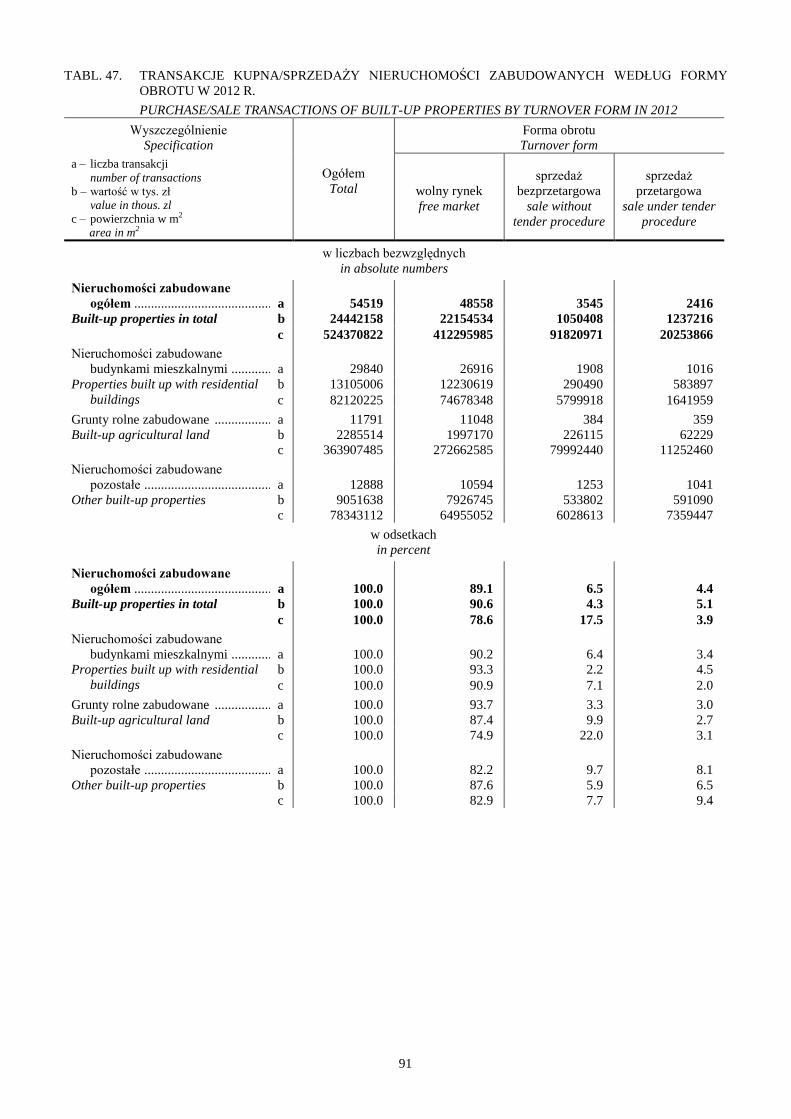
91
TABL. 47. TRANSAKCJE KUPNA/SPRZEDAŻY NIERUCHOMOŚCI ZABUDOWANYCH WEDŁUG FORMY
OBROTU W 2012 R.
PURCHASE/SALE TRANSACTIONS OF BUILT-UP PROPERTIES BY TURNOVER FORM IN 2012
Wyszczególnienie
Specification
a – liczba transakcji
number of transactions
b – wartość w tys. zł
value in thous. zl
c – powierzchnia w m2
area in m2
Ogółem
Total
Forma obrotu
Turnover form
wolny rynek
free market
sprzedaż
bezprzetargowa
sale without
tender procedure
sprzedaż
przetargowa
sale under tender
procedure
w liczbach bezwzględnych
in absolute numbers
Nieruchomości zabudowane
ogółem ......................................... a 54519 48558 3545 2416
Built-up properties in total b 24442158 22154534 1050408 1237216
c 524370822 412295985 91820971 20253866
Nieruchomości zabudowane
budynkami mieszkalnymi ............ a 29840 26916 1908 1016
Properties built up with residential
buildings
b 13105006 12230619 290490 583897
c 82120225 74678348 5799918 1641959
Grunty rolne zabudowane ................. a 11791 11048 384 359
Built-up agricultural land b 2285514 1997170 226115 62229
c 363907485 272662585 79992440 11252460
Nieruchomości zabudowane
pozostałe ...................................... a 12888 10594 1253 1041
Other built-up properties b 9051638 7926745 533802 591090
c 78343112 64955052 6028613 7359447
w odsetkach
in percent
Nieruchomości zabudowane
ogółem ......................................... a 100.0 89.1 6.5 4.4
Built-up properties in total b 100.0 90.6 4.3 5.1
c 100.0 78.6 17.5 3.9
Nieruchomości zabudowane
budynkami mieszkalnymi ............ a 100.0 90.2 6.4 3.4
Properties built up with residential
buildings
b 100.0 93.3 2.2 4.5
c 100.0 90.9 7.1 2.0
Grunty rolne zabudowane ................. a 100.0 93.7 3.3 3.0
Built-up agricultural land b 100.0 87.4 9.9 2.7
c 100.0 74.9 22.0 3.1
Nieruchomości zabudowane
pozostałe ...................................... a 100.0 82.2 9.7 8.1
Other built-up properties b 100.0 87.6 5.9 6.5
c 100.0 82.9 7.7 9.4

92
TABL. 48. TRANSAKCJE KUPNA/SPRZEDAŻY NIERUCHOMOSCI ZABUDOWANYCH WEDŁUG
LOKALIZACJI W 2012 R.
PURCHASE/SALE TRANSACTIONS OF BUILT-UP PROPERTIES BY LOCATION IN 2012
Wyszczególnienie
Specification
a – liczba transakcji
number of transactions
b – wartość w tys. zł
value in thous. zl
c – powierzchnia w m2
area in m2
Ogółem
Total
Lokalizacja
Location
w granicach miast
urban areas
poza
granicami
miast
rural areas ogółem
total
w tym miasta na prawach powiatu
of which cities with powiat status
ogółem
total
powyżej
200 tys.
ludności
more than
200 thous.
inhabitants
poniżej
200 tys.
ludności
less than
200 thous.
inhabitants
w liczbach bezwzględnych
in absolute numbers
Nieruchomości
zabudowane ogółem ... a 54519 27854 14920 8415 6505 26665
Built-up properties in
total
b 24442158 17420493 13011135 10297819 2713316 7021665
c 524370822 78558055 34715874 21681629 13034245 445812767
Nieruchomości
zabudowane
budynkami
mieszkalnymi ............... a 29840 18303 11052 6912 4140 11537
Properties built up with
residential buildings
b 13105006 9832176 7749745 6647822 1101923 3272830
c 82120225 46679804 22495516 16167242 6328274 35440421
Grunty rolne zabudowane .. a 11791 948 84 50 34 10843
Built-up agricultural land b 2285514 226620 26972 20378 6594 2058893
c 363907485 6244769 321664 175562 146102 357662716
Nieruchomości
zabudowane pozostałe .. a 12888 8603 3784 1453 2331 4285
Other built-up properties b 9051638 7361696 5234418 3629619 1604798 1689942
c 78343112 25633482 11898694 5338825 6559869 52709630
w odsetkach
in percent
Nieruchomości
zabudowane ogółem ... a 100.0 51.1 27.4 15.5 11.9 48.9
Built-up properties in
total
b 100.0 71.3 53.2 42.1 11.1 28.7
c 100.0 15.0 6.6 4.1 2.5 85.0
Nieruchomości
zabudowane
budynkami
mieszkalnymi ............... a 100.0 61.3 37.0 23.2 13.8 38.7
Properties built up with
residential buildings
b 100.0 75.0 59.1 50.7 8.4 25.0
c 100.0 56.8 27.4 19.7 7.7 43.2
Grunty rolne zabudowane .. a 100.0 8.0 0.7 0.4 0.3 92.0
Built-up agricultural land b 100.0 9.9 1.2 0.9 0.3 90.1
c 100.0 1.7 0.1 0.1 0.0 98.3
Nieruchomości
zabudowane pozostałe .. a 100.0 66.8 29.4 11.3 18.1 33.2
Other built-up properties b 100.0 81.3 57.8 40.1 17.7 18.7
c 100.0 32.7 15.2 6.8 8.4 67.3

93
TABL. 49. TRANSAKCJE KUPNA/SPRZEDAŻY NIERUCHOMOŚCI ZABUDOWANYCH WEDŁUG RODZAJU
PRAWA DO DZIAŁKI W 2012 R.
PURCHASE/SALE TRANSACTIONS OF BUILT-UP PROPERTIES BY KIND OF RIGHT TO LAND
PARCEL IN 2012
Wyszczególnienie
Specification
a – liczba transakcji
number of transactions
b – wartość w tys. zł
value in thous. zl
c – powierzchnia w m2
area in m2
Ogółem
Total
Rodzaj prawa do działki
Type of land ownership right
użytkowanie
wieczyste
perpetual usufruct
własność
ownership title
w liczbach bezwzględnych
in absolute numbers
Nieruchomości zabudowane ogółem ...... a 54519 3319 51200
Built-up properties in total b 24442158 2060753 22381405
c 524370822 13047094 511323728
Nieruchomości zabudowane budynkami
mieszkalnymi ...................................... a 29840 1653 28187
Properties built up with residential
buildings
b 13105006 1227299 11877707
c 82120225 5710000 76410225
Grunty rolne zabudowane ......................... a 11791 52 11739
Built-up agricultural land b 2285514 10263 2275250
c 363907485 262472 363645013
Nieruchomości zabudowane pozostałe ..... a 12888 1614 11274
Other built-up properties b 9051638 823190 8228448
c 78343112 7074622 71268490
w odsetkach
in percent
Nieruchomości zabudowane ogółem ...... a 100.0 6.1 93.9
Built-up properties in total b 100.0 8.4 91.6
c 100.0 2.5 97.5
Nieruchomości zabudowane budynkami
mieszkalnymi ...................................... a 100.0 5.5 94.5
Properties built up with residential
buildings
b 100.0 9.4 90.6
c 100.0 7.0 93.0
Grunty rolne zabudowane ......................... a 100.0 0.4 99.6
Built-up agricultural land b 100.0 0.4 99.6
c 100.0 0.1 99.9
Nieruchomości zabudowane pozostałe ..... a 100.0 12.5 87.5
Other built-up properties b 100.0 9.1 90.9
c 100.0 9.0 91.0

94
TABL. 50. LICZBA TRANSAKCJI KUPNA/SPRZEDAŻY NIERUCHOMOŚCI ZABUDOWANYCH W LATACH
2006-2012
NUMBER OF PURCHASE/SALE TRANSACTIONS OF BUILT-UP PROPERTIES IN 2006-2012
Wyszczególnienie
Specification
a – ogółem
total
b – w granicach miast
urban areas
c – poza granicami miast
rural areas
2006 2007 2008 2009 2010 2011 2012
w liczbach bezwzględnych
in absolute numbers
Nieruchomości zabudowane
ogółem ................................... a 58386 61949 50325 39069 46491 54087 54519
Built-up properties in total b 36281 35941 26687 19160 23374 29224 27854
c 22105 26008 23638 19909 23117 24863 26665
Nieruchomości zabudowane
budynkami mieszkalnymi ...... a 38432 38383 28311 19763 25454 30410 29840
Properties built up with
residential buildings
b 27272 26257 17826 11545 15239 19273 18303
c 11160 12126 10485 8218 10215 11137 11537
Grunty rolne zabudowane ........... a 8969 11107 10050 8453 9953 10552 11791
Built-up agricultural land b 1223 1267 1188 761 804 920 948
c 7746 9840 8862 7692 9149 9632 10843
Nieruchomości zabudowane
pozostałe ................................ a 10985 12459 11964 10853 11084 13125 12888
Other built-up properties b 7786 8417 7673 6854 7331 9031 8603
c 3199 4042 4291 3999 3753 4094 4285
poprzedni rok = 100
previous year = 100
Nieruchomości zabudowane
ogółem ................................... a 115.3 106.1 81.2 77.6 119.0 116.3 100.8
Built-up properties in total b 119.7 99.1 74.3 71.8 122.0 125.0 95.3
c 108.6 117.7 90.9 84.2 116.1 107.6 107.2
Nieruchomości zabudowane
budynkami mieszkalnymi ...... a 126.6 99.9 73.8 69.8 128.8 119.5 98.1
Properties built up with
residential buildings
b 126.8 96.3 67.9 64.8 132.0 126.5 95.0
c 126.1 108.7 86.5 78.4 124.3 109.0 103.6
Grunty rolne zabudowane ........... a 97.8 123.8 90.5 84.1 117.7 106.0 111.7
Built-up agricultural land b 129.6 103.6 93.8 64.1 105.7 114.4 103.0
c 94.2 127.0 90.1 86.8 118.9 105.3 112.6
Nieruchomości zabudowane
pozostałe ................................ a 98.7 113.4 96.0 90.7 102.1 118.4 98.2
Other built-up properties b 99.2 108.1 91.2 89.3 107.0 123.2 95.3
c 97.6 126.4 106.2 93.2 93.8 109.1 104.7

95
TABL. 51. WARTOŚĆ TRANSAKCJI KUPNA/SPRZEDAŻY NIERUCHOMOŚCI ZABUDOWANYCH W LATACH
2006-2012
VALUE OF PURCHASE/SALE TRANSACTIONS OF BUILT-UP PROPERTIES IN 2006-2012
Wyszczególnienie
Specification
a – ogółem
total
b – w granicach miast
urban areas
c – poza granicami miast
rural areas
2006 2007 2008 2009 2010 2011 2012
w tys. zł
in thous. zl
Nieruchomości
zabudowane
ogółem .................. a 11385575 17273183 16017740 10503337 9221363 15912588 24442158
Built-up properties
in total
b 8662408 13214277 11609346 6733814 5210026 10572063 17420493
c 2723167 4058906 4408394 3769523 4011337 5340524 7021665
Nieruchomości
zabudowane
budynkami
mieszkalnymi ....... a 5504767 8221908 8578390 5431880 6198308 9360583 13105006
Properties built up
with residential
buildings
b 4200755 6150533 6260637 3408501 3792591 6559312 9832176
c 1304012 2071374 2317753 2023379 2405717 2801270 3272830
Grunty rolne
zabudowane .......... a 933042 1257877 1466095 1007865 1180083 1729063 2285514
Built-up agricultural
land
b 196264 208313 314384 150978 139506 175579 226620
c 736778 1049564 1151711 856887 1040577 1553483 2058893
Nieruchomości
zabudowane
pozostałe ............... a 4947766 7793398 5973255 4063592 1842972 4822942 9051638
Other built-up
properties
b 4265389 6855431 5034325 3174335 1277929 3837172 7361696
c 682377 937968 938929 889257 565043 985771 1689942
poprzedni rok = 100
previous year = 100
Nieruchomości
zabudowane
ogółem .................. a 124.8 151.7 92.7 65.6 87.8 172.6 153.6
Built-up properties
in total
b 121.5 152.5 87.9 58.0 77.4 202.9 164.8
c 136.6 149.1 108.6 85.5 106.4 133.1 131.5
Nieruchomości
zabudowane
budynkami
mieszkalnymi ....... a 124.8 149.4 104.3 63.3 114.1 151.0 140.0
Properties built up
with residential
buildings
b 118.2 146.4 101.8 54.4 111.3 173.0 149.9
c 152.0 158.8 111.9 87.3 118.9 116.4 116.8
Grunty rolne
zabudowane .......... a 123.3 134.8 116.6 68.7 117.1 146.5 132.2
Built-up agricultural
land
b 145.3 106.1 150.9 48.0 92.4 125.9 129.1
c 118.5 142.5 109.7 74.4 121.4 149.3 132.5
Nieruchomości
zabudowane
pozostałe ............... a 125.1 157.5 76.6 68.0 45.4 261.7 187.7
Other built-up
properties
b 123.9 160.7 73.4 63.1 40.3 300.3 191.9
c 133.0 137.5 100.1 94.7 63.5 174.5 171.4

96
TABL. 52. TRANSAKCJE KUPNA/SPRZEDAŻY NIERUCHOMOŚCI ZABUDOWANYCH WEDŁUG
WOJEWÓDZTW W 2012 R.
PURCHASE/SALE TRANSACTIONS OF BUILT-UP PROPERTIES BY VOIVODSHIPS IN 2012
Wyszczególnienie
Specification
Liczba transakcji
Number of transactions
Wartość
Value
Powierzchnia
Area
w liczbach
bezwzględnych
in absolute
numbers
w %
in %
w tys. zł
in thous. zl
w %
in %
w m2
in m2
w %
in %
Polska ............................................ 54519 100.0 24442158 100.0 524370822 100.0
Poland
Dolnośląskie ................................... 5487 10.1 3135576 12.8 32268538 6.2
Kujawsko-Pomorskie ..................... 2684 4.9 880432 3.6 35210172 6.7
Lubelskie ........................................ 2744 5.0 735706 3.0 25967481 5.0
Lubuskie ........................................ 1982 3.6 540398 2.2 22187526 4.2
Łódzkie .......................................... 3292 6.0 1151934 4.7 32147657 6.1
Małopolskie ................................... 3280 6.0 1446498 5.9 12525859 2.4
Mazowieckie .................................. 7042 12.9 6712269 27.5 61158401 11.7
Opolskie ......................................... 1281 2.3 378878 1.6 21606232 4.1
Podkarpackie .................................. 2175 4.0 571548 2.3 12618440 2.4
Podlaskie ........................................ 1805 3.3 395036 1.6 24903047 4.7
Pomorskie ...................................... 2600 4.8 1503280 6.2 24660612 4.7
Śląskie ............................................ 7084 13.1 2493920 10.2 35958274 6.9
Świętokrzyskie ............................... 2604 4.8 552648 2.3 43034682 8.2
Warmińsko-Mazurskie ................... 2549 4.7 691544 2.8 70111328 13.4
Wielkopolskie ................................ 5168 9.5 2345028 9.6 41147540 7.8
Zachodniopomorskie ...................... 2742 5.0 907464 3.7 28865033 5.5
TABL. 53. TRANSAKCJE KUPNA/SPRZEDAŻY NIERUCHOMOŚCI ZABUDOWANYCH BUDYNKAMI
MIESZKALNYMI WEDŁUG WOJEWÓDZTW W 2012 R.
PURCHASE/SALE TRANSACTIONS OF PROPERTIES BUILT UP WITH RESIDENTIAL BUILDINGS BY
VOIVODSHIPS IN 2012
Wyszczególnienie
Specification
Liczba transakcji
Number of transactions
Wartość
Value
Powierzchnia
Area
w liczbach
bezwzględnych
in absolute
numbers
w %
in %
w tys. zł
in thous. zl
w %
in %
w m2
in m2
w %
in %
Polska ............................................ 29840 100.0 13105006 100.0 82120225 100.0
Poland
Dolnośląskie ................................... 3411 11.4 1223346 9.3 10664860 13.0
Kujawsko-Pomorskie ..................... 1447 4.8 364784 2.8 3722458 4.5
Lubelskie ........................................ 917 3.1 214055 1.6 1994958 2.4
Lubuskie ........................................ 803 2.7 199555 1.5 1709361 2.1
Łódzkie .......................................... 1561 5.2 400705 3.1 3205961 3.9
Małopolskie ................................... 2043 6.8 899483 6.9 4682178 5.7
Mazowieckie .................................. 4546 15.2 5644170 43.1 8695742 10.6
Opolskie ......................................... 664 2.2 147431 1.1 1618826 2.0
Podkarpackie .................................. 1011 3.4 199860 1.5 2429107 3.0
Podlaskie ........................................ 669 2.2 153669 1.2 1681478 2.0
Pomorskie ...................................... 1468 4.9 484567 3.7 3249018 4.0
Śląskie ............................................ 4852 16.4 1230410 9.4 24804984 30.2
Świętokrzyskie ............................... 557 1.9 119276 0.8 1421080 1.7
Warmińsko-Mazurskie ................... 1039 3.5 243573 1.9 3643103 4.4
Wielkopolskie ................................ 3486 11.7 1160990 8.9 4428415 5.4
Zachodniopomorskie ...................... 1366 4.6 419131 3.2 4168696 5.1

97
TABL. 54. TRANSAKCJE KUPNA/SPRZEDAŻY GRUNTÓW ROLNYCH ZABUDOWANYCH WEDŁUG
WOJEWÓDZTW W 2012 R.
PURCHASE/SALE TRANSACTIONS OF BUILT-UP AGRICULTURAL LAND BY VOIVODSHIPS IN 2012
Wyszczególnienie
Specification
Liczba transakcji
Number of transactions
Wartość
Value
Powierzchnia
Area
w liczbach
bezwzględnych
in absolute
numbers
w %
in %
w tys. zł
in thous. zl
w %
in %
w m2
in m2
w %
in %
Polska ............................................ 11791 100.0 2285514 100.0 363907485 100.0
Poland
Dolnośląskie ................................... 716 6.1 149073 6.5 16111345 4.4
Kujawsko-Pomorskie ..................... 521 4.4 198069 8.7 28779118 7.9
Lubelskie ........................................ 1288 10.9 125627 5.5 16020941 4.4
Lubuskie ........................................ 363 3.1 66854 2.9 12974234 3.6
Łódzkie .......................................... 898 7.6 165457 7.2 24757602 6.8
Małopolskie ................................... 628 5.3 90833 4.0 6042273 1.7
Mazowieckie .................................. 1443 12.2 313815 13.8 42441375 11.7
Opolskie ......................................... 260 2.1 62113 2.7 17855592 4.9
Podkarpackie .................................. 633 5.4 67701 3.0 5666641 1.5
Podlaskie ........................................ 840 7.1 121536 5.3 21813790 6.0
Pomorskie ...................................... 273 2.3 104013 4.6 19150503 5.3
Śląskie ............................................ 431 3.7 83394 3.6 4920067 1.3
Świętokrzyskie ............................... 1787 15.2 227836 10.0 39542862 10.9
Warmińsko-Mazurskie ................... 631 5.4 171658 7.5 54381688 14.9
Wielkopolskie ................................ 644 5.5 224761 9.8 33583597 9.2
Zachodniopomorskie ...................... 435 3.7 112772 4.9 19865857 5.5
TABL. 55. TRANSAKCJE KUPNA/SPRZEDAŻY NIERUCHOMOŚCI ZABUDOWANYCH POZOSTAŁYCH
WEDŁUG WOJEWÓDZTW W 2012 R.
PURCHASE/SALE TRANSACTIONS OF OTHER BUILT-UP PROPERTIES BY VOIVODSHIPS IN 2012
Wyszczególnienie
Specification
Liczba transakcji
Number of transactions
Wartość
Value
Powierzchnia
Area
w liczbach
bezwzględnych
in absolute
numbers
w %
in %
w tys. zł
in thous. zl
w %
in %
w m2
in m2
w %
in %
Polska ............................................ 12888 100.0 9051638 100.0 78343112 100.0
Poland
Dolnośląskie ................................... 1360 10.6 1763157 19.5 5492333 7.0
Kujawsko-Pomorskie ..................... 716 5.6 317580 3.5 2708596 3.5
Lubelskie ........................................ 539 4.2 396023 4.4 7951582 10.1
Lubuskie ........................................ 816 6.3 273989 3.0 7503931 9.6
Łódzkie .......................................... 833 6.5 585772 6.5 4184094 5.3
Małopolskie ................................... 609 4.7 456182 5.0 1801408 2.3
Mazowieckie .................................. 1053 8.2 754283 8.3 10021284 12.8
Opolskie ......................................... 357 2.8 169334 1.9 2131814 2.7
Podkarpackie .................................. 531 4.1 303987 3.4 4522692 5.8
Podlaskie ........................................ 296 2.2 119831 1.3 1407779 1.8
Pomorskie ...................................... 859 6.7 914700 10.1 2261091 2.9
Śląskie ............................................ 1801 14.0 1180115 13.0 6233223 8.0
Świętokrzyskie ............................... 260 1.9 205536 2.3 2070740 2.6
Warmińsko-Mazurskie ................... 879 6.8 276312 3.1 12086537 15.4
Wielkopolskie ................................ 1038 8.1 959277 10.6 3135528 4.0
Zachodniopomorskie ...................... 941 7.3 375560 4.1 4830480 6.2

98
TABL. 56. TRANSAKCJE KUPNA/SPRZEDAŻY NIERUCHOMOŚCI ZABUDOWANYCH BUDYNKAMI
MIESZKALNYMI WEDŁUG WOJEWÓDZTW I FORMY OBROTU W 2012 R.
PURCHASE/SALE TRANSACTIONS OF PROPERTIES BUILT UP WITH RESIDENTIAL BUILDINGS BY
VOIVODSHIPS AND TURNOVER FORM IN 2012
Wyszczególnienie
Specification
a – liczba transakcji
number of transactions
b – wartość w tys. zł
value in thous. zl
c – powierzchnia w m2
area in m2
Ogółem
Total
Forma obrotu
Turnover form
wolny rynek
free market
sprzedaż
bezprzetargowa
sale without
tender procedure
sprzedaż
przetargowa
sale under tender
procedure
Polska ...................................... a 29840 26916 1908 1016
Poland b 13105006 12230619 290490 583897
c 82120225 74678348 5799918 1641959
Dolnośląskie ............................. a 3411 3168 179 64
b 1223346 1165690 26103 31552
c 10664860 9367924 1202701 94235
Kujawsko-Pomorskie ............... a 1447 1302 131 14
b 364784 338297 23542 2944
c 3722458 3564218 144963 13277
Lubelskie .................................. a 917 879 24 14
b 214055 211773 1163 1119
c 1994958 1927298 47255 20405
Lubuskie .................................. a 803 744 43 16
b 199555 188987 8133 2434
c 1709361 1601768 72659 34934
Łódzkie .................................... a 1561 1512 29 20
b 400705 391563 4233 4910
c 3205961 3154335 29396 22230
Małopolskie ............................. a 2043 2006 30 7
b 899483 854283 42569 2632
c 4682178 4555090 114528 12560
Mazowieckie ............................ a 4546 4275 64 207
b 5644170 5295219 4821 344130
c 8695742 8151894 178067 365781
Opolskie ................................... a 664 573 82 9
b 147431 128932 17789 710
c 1618826 1094345 515114 9367
Podkarpackie ............................ a 1011 970 26 15
b 199860 194216 1583 4061
c 2429107 2323900 40838 64369
Podlaskie .................................. a 669 649 16 4
b 153669 152285 1234 149
c 1681478 1661437 16858 3183
Pomorskie ................................ a 1468 1399 58 11
b 484567 462371 18495 3700
c 3249018 3160798 65273 22947
Śląskie ...................................... a 4852 3731 933 188
b 1230410 1099793 99478 31139
c 24804984 21238272 3019886 546826
Świętokrzyskie ......................... a 557 547 6 4
b 119276 118559 496 221
c 1421080 1408630 9617 2833
Warmińsko-Mazurskie ............. a 1039 915 110 14
b 243573 228413 12369 2791
c 3643103 3476231 146374 20498
Wielkopolskie .......................... a 3486 2978 95 413
b 1160990 993943 17910 149137
c 4428415 3956523 87011 384881
Zachodniopomorskie ................ a 1366 1268 82 16
b 419131 406293 10571 2268
c 4168696 4035685 109378 23633

99
TABL. 57. TRANSAKCJE KUPNA/SPRZEDAŻY GRUNTÓW ROLNYCH ZABUDOWANYCH WEDŁUG
WOJEWÓDZTW I FORMY OBROTU W 2012 R.
PURCHASE/SALE TRANSACTIONS OF BUILT-UP AGRICULTURAL LAND BY VOIVODSHIPS AND
TURNOVER FORM IN 2012
Wyszczególnienie
Specification
a – liczba transakcji
number of transactions
b – wartość w tys. zł
value in thous. zl
c – powierzchnia w m2
area in m2
Ogółem
Total
Forma obrotu
Turnover form
wolny rynek
free market
sprzedaż
bezprzetargowa
sale without
tender procedure
sprzedaż
przetargowa
sale under tender
procedure
Polska ...................................... a 11791 11048 384 359
Poland b 2285514 1997170 226115 62229
c 363907485 272662585 79992440 11252460
Dolnośląskie ............................. a 716 652 42 22
b 149073 138134 8510 2429
c 16111345 13143413 2703703 264229
Kujawsko-Pomorskie ............... a 521 472 32 17
b 198069 179628 14990 3451
c 28779118 24376406 3256805 1145907
Lubelskie .................................. a 1288 1244 19 25
b 125627 121643 2597 1387
c 16020941 14873721 1034572 112648
Lubuskie .................................. a 363 337 17 9
b 66854 59316 6924 614
c 12974234 8605083 4300701 68450
Łódzkie .................................... a 898 873 11 14
b 165457 151637 12736 1084
c 24757602 19935048 4707387 115167
Małopolskie ............................. a 628 601 19 8
b 90833 87128 2762 944
c 6042273 5866059 145441 30773
Mazowieckie ............................ a 1443 1338 31 74
b 313815 273896 20937 18982
c 42441375 34480867 7251337 709171
Opolskie ................................... a 260 229 18 13
b 62113 31779 25218 5116
c 17855592 5588535 10699823 1567234
Podkarpackie ............................ a 633 599 20 14
b 67701 61629 5454 619
c 5666641 3967236 1670517 28888
Podlaskie .................................. a 840 797 22 21
b 121536 114673 2393 4470
c 21813790 20603291 901044 309455
Pomorskie ................................ a 273 245 16 12
b 104013 86644 15030 2339
c 19150503 13431672 5280529 438302
Śląskie ...................................... a 431 387 36 8
b 83394 77590 5364 441
c 4920067 4569760 242272 108035
Świętokrzyskie ......................... a 1787 1771 7 9
b 227836 219074 8105 657
c 39542862 36807429 2671633 63800
Warmińsko-Mazurskie ............. a 631 545 38 48
b 171658 136306 32270 3082
c 54381688 36362191 17125443 894054
Wielkopolskie .......................... a 644 596 30 18
b 224761 175704 42410 6647
c 33583597 22356678 9317666 1909253
Zachodniopomorskie ................ a 435 362 26 47
b 112772 82391 20414 9968
c 19865857 7695196 8683567 3487094

100
TABL. 58. TRANSAKCJE KUPNA/SPRZEDAŻY NIERUCHOMOŚCI ZABUDOWANYCH POZOSTAŁYCH
WEDŁUG WOJEWÓDZTW I FORMY OBROTU W 2012 R.
PURCHASE/SALE TRANSACTIONS OF OTHER BUILT-UP PROPERTIES BY VOIVODSHIPS AND
TURNOVER FORM IN 2012
Wyszczególnienie
Specification
a – liczba transakcji
number of transactions
b – wartość w tys. zł
value in thous. zl
c – powierzchnia w m2
area in m2
Ogółem
Total
Forma obrotu
Turnover form
wolny rynek
free market
sprzedaż
bezprzetargowa
sale without
tender procedure
sprzedaż
przetargowa
sale under tender
procedure
Polska ...................................... a 12888 10594 1253 1041
Poland b 9051638 7926745 533802 591090
c 78343112 64955052 6028613 7359447
Dolnośląskie ............................. a 1360 981 204 175
b 1763157 1514213 93127 155817
c 5492333 4292176 457368 742789
Kujawsko-Pomorskie ............... a 716 604 83 29
b 317580 293542 16132 7906
c 2708596 2238261 195960 274375
Lubelskie .................................. a 539 483 26 30
b 396023 363872 2917 29234
c 7951582 7629969 153843 167770
Lubuskie .................................. a 816 582 115 119
b 273989 227848 24271 21870
c 7503931 4436267 1479893 1587771
Łódzkie .................................... a 833 746 33 54
b 585772 561516 11655 12600
c 4184094 3872700 82518 228876
Małopolskie ............................. a 609 511 50 48
b 456182 354172 52746 49264
c 1801408 1455269 115926 230213
Mazowieckie ............................ a 1053 906 64 83
b 754283 650390 16302 87591
c 10021284 9364744 213331 443209
Opolskie ................................... a 357 261 68 28
b 169334 147872 13481 7980
c 2131814 1226372 631966 273476
Podkarpackie ............................ a 531 387 104 40
b 303987 208347 85606 10034
c 4522692 1958131 915228 1649333
Podlaskie .................................. a 296 256 18 22
b 119831 112143 2097 5591
c 1407779 1236094 47198 124487
Pomorskie ................................ a 859 743 76 40
b 914700 844119 16344 54238
c 2261091 1734825 158565 367701
Śląskie ...................................... a 1801 1570 124 107
b 1180115 1081937 57484 40695
c 6233223 5067636 827760 337827
Świętokrzyskie ......................... a 260 253 x 5
b 205536 196927 x 8530
c 2070740 2014081 x 52531
Warmińsko-Mazurskie ............. a 879 732 71 76
b 276312 241832 16956 17524
c 12086537 11472232 187179 427126
Wielkopolskie .......................... a 1038 815 122 101
b 959277 811492 99654 48131
c 3135528 2547594 349075 238859
Zachodniopomorskie ................ a 941 764 93 84
b 375560 316523 24952 34084
c 4830480 4408701 208675 213104

101
TABL. 59. TRANSAKCJE KUPNA/SPRZEDAŻY NIERUCHOMOŚCI ZABUDOWANYCH BUDYNKAMI
MIESZKALNYMI WEDŁUG WOJEWÓDZTW I LOKALIZACJI W 2012 R.
PURCHASE/SALE TRANSACTIONS OF PROPERTIES BUILT UP WITH RESIDENTIAL BUILDINGS BY
VOIVODSHIPS AND LOCATION IN 2012
Wyszczególnienie
Specification
a – liczba transakcji
number of transactions
b – wartość w tys. zł
value in thous. zl
c – powierzchnia w m2
area in m2
Ogółem
Total
Lokalizacja Location
w granicach miast urban areas
poza
granicami
miast
rural areas
ogółem
total
w tym miasta na prawach powiatu
of which cities with powiat status
ogółem
total
powyżej 200
tys. ludności
more than
200 thous.
inhabitants
poniżej 200
tys. ludności
less than 200
thous.
inhabitants
Polska ..................................... a 29840 18303 11052 6912 4140 11537
Poland b 13105006 9832176 7749745 6647822 1101923 3272830
c 82120225 46679804 22495516 16167242 6328274 35440421
Dolnośląskie ............................ a 3411 2312 1753 1719 34 1099
b 1223346 855523 676331 665619 10712 367823
c 10664860 7972132 6517318 6486432 30886 2692728
Kujawsko-Pomorskie .............. a 1447 756 493 303 190 691
b 364784 221655 161813 119007 42806 143129
c 3722458 737990 450290 234525 215765 2984468
Lubelskie ................................. a 917 565 293 172 121 352
b 214055 161617 94546 70838 23708 52438
c 1994958 546700 257494 168865 88629 1448258
Lubuskie ................................. a 803 428 203 – 203 375
b 199555 126306 72660 – 72660 73249
c 1709361 548232 254661 – 254661 1161129
Łódzkie ................................... a 1561 977 409 336 73 584
b 400705 284491 141063 122337 18726 116214
c 3205961 1182369 450050 355058 94992 2023592
Małopolskie ............................ a 2043 1125 759 625 134 918
b 899483 608099 508439 464999 43440 291384
c 4682178 1417427 1015055 697129 317926 3264751
Mazowieckie ........................... a 4546 2868 1535 1400 135 1678
b 5644170 4918485 4336938 4295495 41443 725685
c 8695742 4184364 2653363 2541505 111858 4511378
Opolskie .................................. a 664 243 118 – 118 421
b 147431 78803 50304 – 50304 68628
c 1618826 300231 95448 – 95448 1318595
Podkarpackie ........................... a 1011 502 239 – 239 509
b 199860 118423 62694 – 62694 81437
c 2429107 643599 323590 – 323590 1785508
Podlaskie ................................. a 669 367 111 43 68 302
b 153669 85745 35258 14425 20833 67924
c 1681478 312582 85306 38234 47072 1368896
Pomorskie ............................... a 1468 875 539 317 222 593
b 484567 294522 190164 167103 23061 190045
c 3249018 1108111 790798 350256 440542 2140907
Śląskie ..................................... a 4852 3974 3074 1231 1843 878
b 1230410 1019032 773729 310541 463188 211378
c 24804984 23138940 6935234 4403158 2532076 1666044
Świętokrzyskie ........................ a 557 362 113 113 – 195
b 119276 88517 41099 41099 – 30759
c 1421080 434938 123101 123101 – 986142
Warmińsko-Mazurskie ............ a 1039 456 111 – 111 583
b 243573 110412 41893 – 41893 133162
c 3643103 456464 98916 – 98916 3186639
Wielkopolskie ......................... a 3486 1600 629 467 162 1886
b 1160990 584716 342902 283837 59065 576274
c 4428415 1729701 690059 523573 166486 2698714
Zachodniopomorskie ............... a 1366 893 673 186 487 473
b 419131 275830 219911 92520 127390 143301
c 4168696 1966024 1754833 245406 1509427 2202672

102
TABL. 60. TRANSAKCJE KUPNA/SPRZEDAŻY GRUNTÓW ROLNYCH ZABUDOWANYCH WEDŁUG
WOJEWÓDZTW I LOKALIZACJI W 2012 R.
PURCHASE/SALE TRANSACTIONS OF BUILT-UP AGRICULTURAL LAND BY VOIVODSHIPS AND
LOCATION IN 2012
Wyszczególnienie
Specification
a – liczba transakcji
number of transactions
b – wartość w tys. zł
value in thous. zl
c – powierzchnia w m2
area in m2
Ogółem
Total
Lokalizacja Location
w granicach miast urban areas
poza
granicami
miast
rural areas
ogółem
total
w tym miasta na prawach powiatu
of which cities with powiat status
ogółem
total
powyżej 200
tys. ludności
more than
200 thous.
inhabitants
poniżej 200
tys. ludności
less than 200
thous.
inhabitants
Polska ................................... a 11791 948 84 50 34 10843
Poland b 2285514 226620 26972 20378 6594 2058893
c 363907485 6244769 321664 175562 146102 357662716
Dolnośląskie .......................... a 716 62 – – – 654
b 149073 9598 – – – 139475
c 16111345 321090 – – – 15790255
Kujawsko-Pomorskie ............ a 521 23 x x – 498
b 198069 27269 x x – 170799
c 28779118 1880151 x x – 26898967
Lubelskie ............................... a 1288 52 x – x 1236
b 125627 7937 x – x 117690
c 16020941 147614 x – x 15873327
Lubuskie ................................ a 363 20 x – x 343
b 66854 3004 x – x 63849
c 12974234 188472 x – x 12785762
Łódzkie ................................. a 898 66 28 28 – 832
b 165457 20803 15286 15286 – 144654
c 24757602 251013 131186 131186 – 24506589
Małopolskie .......................... a 628 88 6 4 x 540
b 90833 15453 2651 968 x 75380
c 6042273 365868 10540 3054 x 5676405
Mazowieckie ......................... a 1443 48 x – x 1395
b 313815 10096 x – x 303719
c 42441375 708159 x – x 41733216
Opolskie ................................ a 260 10 x – x 250
b 62113 1113 x – x 61000
c 17855592 60157 x – x 17795435
Podkarpackie ......................... a 633 69 13 – 13 564
b 67701 8582 2085 – 2085 59119
c 5666641 179612 28439 – 28439 5487029
Podlaskie ............................... a 840 32 6 6 – 808
b 121536 6056 805 805 – 115480
c 21813790 259187 15135 15135 – 21554603
Pomorskie ............................. a 273 32 x x – 241
b 104013 11795 x x – 92218
c 19150503 24734 x x – 19125769
Śląskie ................................... a 431 93 12 x 10 338
b 83394 18905 1383 x 1341 64490
c 4920067 447342 64721 x 59114 4472725
Świętokrzyskie ...................... a 1787 260 4 4 – 1527
b 227836 67590 429 429 – 160246
c 39542862 528085 6101 6101 – 39014777
Warmińsko-Mazurskie .......... a 631 15 – – – 616
b 171658 4864 – – – 166795
c 54381688 250890 – – – 54130798
Wielkopolskie ....................... a 644 55 3 x x 589
b 224761 6933 1040 x x 217828
c 33583597 326390 37939 x x 33257207
Zachodniopomorskie ............. a 435 23 3 x x 412
b 112772 6621 515 x x 106151
c 19865857 306005 4327 x x 19559852

103
TABL. 61. TRANSAKCJE KUPNA/SPRZEDAŻY NIERUCHOMOŚCI ZABUDOWANYCH POZOSTAŁYCH
WEDŁUG WOJEWÓDZTW I LOKALIZACJI W 2012 R.
PURCHASE/SALE TRANSACTIONS OF OTHER BUILT-UP PROPERTIES BY VOIVODSHIPS AND
LOCATION IN 2012
Wyszczególnienie
Specification
a – liczba transakcji
number of transactions
b – wartość w tys. zł
value in thous. zl
c – powierzchnia w m2
area in m2
Ogółem
Total
Lokalizacja Location
w granicach miast urban areas
poza
granicami
miast
rural areas
ogółem
total
w tym miasta na prawach powiatu
of which cities with powiat status
ogółem
total
powyżej 200
tys. ludności
more than
200 thous.
inhabitants
poniżej 200
tys. ludności
less than
200 thous.
inhabitants
Polska ..................................... a 12888 8603 3784 1453 2331 4285
Poland b 9051638 7361696 5234418 3629619 1604798 1689942
c 78343112 25633482 11898694 5338825 6559869 52709630
Dolnośląskie ............................ a 1360 1040 228 117 111 320
b 1763157 1632107 1426402 1396712 29689 131050
c 5492333 2748772 1034015 728951 305064 2743561
Kujawsko-Pomorskie .............. a 716 452 210 133 77 264
b 317580 272558 203820 172373 31447 45021
c 2708596 1262541 659520 523835 135685 1446055
Lubelskie ................................. a 539 325 145 51 94 214
b 396023 251818 164351 117667 46684 144205
c 7951582 1685528 514433 297639 216794 6266054
Lubuskie ................................. a 816 537 210 – 210 279
b 273989 231183 123478 – 123478 42806
c 7503931 1535237 1023111 – 1023111 5968694
Łódzkie ................................... a 833 562 137 95 42 271
b 585772 508506 304217 215357 88860 77267
c 4184094 2421570 725554 495965 229589 1762524
Małopolskie ............................ a 609 434 240 191 49 175
b 456182 411494 304233 276467 27766 44688
c 1801408 1043223 502016 400136 101880 758185
Mazowieckie ........................... a 1053 434 141 46 95 619
b 754283 363607 141986 26741 115246 390676
c 10021284 1293761 385562 96658 288904 8727523
Opolskie .................................. a 357 210 92 – 92 147
b 169334 129206 50522 – 50522 40127
c 2131814 791400 255034 – 255034 1340414
Podkarpackie ........................... a 531 317 124 – 124 214
b 303987 151820 71494 – 71494 152167
c 4522692 784273 296870 – 296870 3738419
Podlaskie ................................. a 296 171 45 4 41 125
b 119831 67614 19855 464 19391 52217
c 1407779 662409 72633 6707 65926 745370
Pomorskie ............................... a 859 569 269 163 106 290
b 914700 849774 698192 656461 41731 64926
c 2261091 1193491 600463 529715 70748 1067600
Śląskie ..................................... a 1801 1591 1154 302 852 210
b 1180115 1082381 794003 276725 517278 97734
c 6233223 5006662 3686609 1202157 2484452 1226561
Świętokrzyskie ........................ a 260 179 55 55 – 81
b 205536 189983 62212 62212 – 15553
c 2070740 1085182 130588 130588 – 985558
Warmińsko-Mazurskie ............ a 879 492 156 – 156 387
b 276312 197786 68457 – 68457 78527
c 12086537 1077406 354578 – 354578 11009131
Wielkopolskie ......................... a 1038 651 325 182 143 387
b 959277 754496 619764 313804 305960 204782
c 3135528 1736860 1010235 502980 507255 1398668
Zachodniopomorskie ............... a 941 639 253 114 139 302
b 375560 267364 181431 114636 66795 108196
c 4830480 1305167 647473 423494 223979 3525313
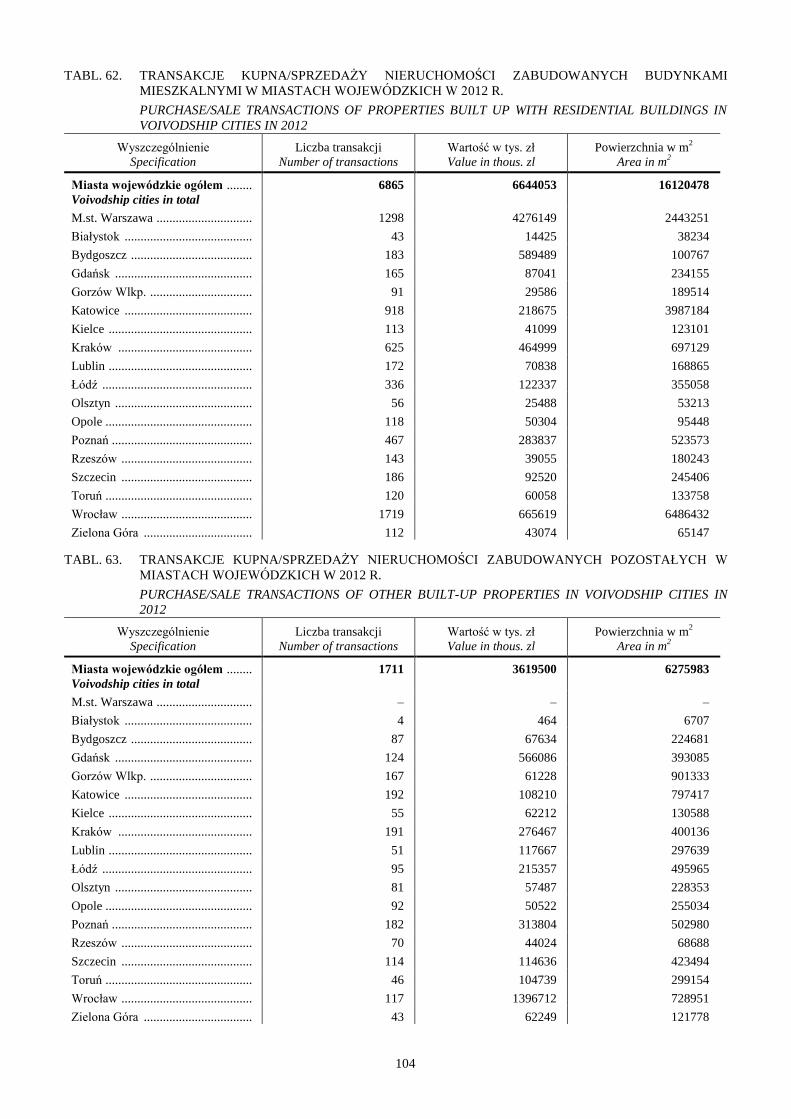
104
TABL. 62. TRANSAKCJE KUPNA/SPRZEDAŻY NIERUCHOMOŚCI ZABUDOWANYCH BUDYNKAMI
MIESZKALNYMI W MIASTACH WOJEWÓDZKICH W 2012 R.
PURCHASE/SALE TRANSACTIONS OF PROPERTIES BUILT UP WITH RESIDENTIAL BUILDINGS IN
VOIVODSHIP CITIES IN 2012
Wyszczególnienie
Specification
Liczba transakcji
Number of transactions
Wartość w tys. zł
Value in thous. zl
Powierzchnia w m2
Area in m2
Miasta wojewódzkie ogółem ........ 6865 6644053 16120478
Voivodship cities in total
M.st. Warszawa .............................. 1298 4276149 2443251
Białystok ........................................ 43 14425 38234
Bydgoszcz ...................................... 183 589489 100767
Gdańsk ........................................... 165 87041 234155
Gorzów Wlkp. ................................ 91 29586 189514
Katowice ........................................ 918 218675 3987184
Kielce ............................................. 113 41099 123101
Kraków .......................................... 625 464999 697129
Lublin ............................................. 172 70838 168865
Łódź ............................................... 336 122337 355058
Olsztyn ........................................... 56 25488 53213
Opole .............................................. 118 50304 95448
Poznań ............................................ 467 283837 523573
Rzeszów ......................................... 143 39055 180243
Szczecin ......................................... 186 92520 245406
Toruń .............................................. 120 60058 133758
Wrocław ......................................... 1719 665619 6486432
Zielona Góra .................................. 112 43074 65147
TABL. 63. TRANSAKCJE KUPNA/SPRZEDAŻY NIERUCHOMOŚCI ZABUDOWANYCH POZOSTAŁYCH W
MIASTACH WOJEWÓDZKICH W 2012 R.
PURCHASE/SALE TRANSACTIONS OF OTHER BUILT-UP PROPERTIES IN VOIVODSHIP CITIES IN
2012
Wyszczególnienie
Specification
Liczba transakcji
Number of transactions
Wartość w tys. zł
Value in thous. zl
Powierzchnia w m2
Area in m2
Miasta wojewódzkie ogółem ........ 1711 3619500 6275983
Voivodship cities in total
M.st. Warszawa .............................. – – –
Białystok ........................................ 4 464 6707
Bydgoszcz ...................................... 87 67634 224681
Gdańsk ........................................... 124 566086 393085
Gorzów Wlkp. ................................ 167 61228 901333
Katowice ........................................ 192 108210 797417
Kielce ............................................. 55 62212 130588
Kraków .......................................... 191 276467 400136
Lublin ............................................. 51 117667 297639
Łódź ............................................... 95 215357 495965
Olsztyn ........................................... 81 57487 228353
Opole .............................................. 92 50522 255034
Poznań ............................................ 182 313804 502980
Rzeszów ......................................... 70 44024 68688
Szczecin ......................................... 114 114636 423494
Toruń .............................................. 46 104739 299154
Wrocław ......................................... 117 1396712 728951
Zielona Góra .................................. 43 62249 121778

105
TABL. 64. TRANSAKCJE KUPNA/SPRZEDAŻY NIERUCHOMOŚCI ZABUDOWANYCH BUDYNKAMI
MIESZKALNYMI W POWIATACH O NAJWIĘKSZEJ LICZBIE TRANSAKCJI W 2012 R.
PURCHASE/SALE TRANSACTIONS OF PROPERTIES BUILT UP WITH RESIDENTIAL BUILDINGS IN
POWIATS WITH THE LARGEST NUMBER OF TRANSACTIONS IN 2012
Wyszczególnienie
Specification
Liczba transakcji
Number of transactions
Wartość w tys. zł
Value in thous. zl
Powierzchnia w m2
Area in m2
Polska .......................................... 29840 13105006 82120225
Poland
Powiat m. Wrocław ....................... 1719 665619 6486432
Powiat poznański .......................... 1537 571131 1194473
Powiat m. Warszawa ..................... 1298 4276149 2443251
Powiat m. Katowice ...................... 918 218675 3987184
Powiat m. Zabrze .......................... 712 99770 901351
Powiat m. Kraków ........................ 625 464999 697129
Powiat warszawski zachodni ........ 542 289173 655680
Powiat wrocławski ........................ 489 240202 876563
Powiat m. Koszalin ....................... 478 120505 1498133
Powiat m. Poznań ......................... 467 283837 523573
Powiat krakowski .......................... 436 180691 794537
Powiat m. Łódź ............................. 336 122337 355058
Powiat wołomiński ....................... 296 149772 532622
Powiat piaseczyński ...................... 293 272208 625376
Powiat białostocki ......................... 253 68610 630049
Powiat bielski8 .............................. 245 71674 338551
Powiat m. Chorzów ....................... 236 48335 688909
Powiat olsztyński .......................... 235 54566 952133
Powiat tarnogórski ........................ 232 60694 253604
Powiat pruszkowski ...................... 217 114838 465372
Powiat legionowski ....................... 215 103467 678066
Powiat m. Częstochowa ................ 213 60226 310797
Powiat cieszyński .......................... 207 59594 336920
Powiat opolski9 ............................. 206 42144 340033
Powiat zgierski .............................. 203 49684 333361
Powiat m. Sopot ............................ 202 17040 427530
Powiat mikołowski ....................... 198 59891 282314
Powiat wielicki ............................. 193 66736 248259
Powiat kłodzki .............................. 191 29190 420265
Powiat m. Szczecin ....................... 186 92520 245406
8 in Śląskie Voivodship
9 in Opolskie Voivodship

106
TABL. 65. TRANSAKCJE KUPNA/SPRZEDAŻY GRUNTÓW ROLNYCH ZABUDOWANYCH W POWIATACH
O NAJWIĘKSZEJ LICZBIE TRANSAKCJI W 2012 R.
PURCHASE/SALE TRANSACTIONS OF BUILT-UP AGRICULTURAL LAND IN POWIATS WITH THE
LARGEST NUMBER OF TRANSACTIONS IN 2012
Wyszczególnienie
Specification
Liczba transakcji
Number of transactions
Wartość w tys. zł
Value in thous. zl
Powierzchnia w m2
Area in m2
Polska .......................................... 11791 2285514 363907485
Poland
Powiat jędrzejowski ...................... 1109 144941 28697352
Powiat warszawski zachodni ........ 210 92387 2115240
Powiat poddębicki ......................... 177 42789 7494209
Powiat kazimierski ........................ 156 16496 2272037
Powiat krotoszyński ...................... 148 35269 5092314
Powiat chełmski ............................ 140 9902 1486333
Powiat lubelski .............................. 134 24558 1234425
Powiat zamojski ............................ 126 10801 1701190
Powiat hajnowski .......................... 121 19489 1227494
Powiat nowosądecki...................... 117 19005 1658634
Powiat hrubieszowski ................... 113 9935 3031969
Powiat siedlecki ............................ 103 15596 2019947
Powiat wrocławski ........................ 96 21394 416535
Powiat tarnowski ........................... 95 10823 733904
Powiat opatowski .......................... 95 10394 2351448
Powiat krasnostawski .................... 94 5436 1248778
Powiat sokólski ............................. 94 10655 1560250
Powiat płoński............................... 93 12561 1998524
Powiat częstochowski ................... 92 13512 987387
Powiat sejneński ........................... 91 17374 6699000
Powiat gorzowski .......................... 89 16284 1284613
Powiat wysokomazowiecki ........... 89 7762 714652
Powiat bialski ................................ 82 4673 378380
Powiat olsztyński .......................... 80 17547 2210386
Powiat sieradzki ............................ 79 11504 1640574
Powiat bielski10
............................. 78 9130 2677479
Powiat kielecki .............................. 77 9175 1319166
Powiat opolski11
............................ 75 7214 699436
Powiat łomżyński .......................... 75 8446 1496804
Powiat legnicki ............................. 73 11566 430294
Powiat buski .................................. 73 5902 574223
10
in Podlaskie Voivodship 11
in Lubelskie Voivodship

107
TABL. 66. TRANSAKCJE KUPNA/SPRZEDAŻY NIERUCHOMOŚCI ZABUDOWANYCH POZOSTAŁYCH
W POWIATACH O NAJWIĘKSZEJ LICZBIE TRANSAKCJI W 2012 R.
PURCHASE/SALE TRANSACTIONS OF OTHER BUILT-UP PROPERTIES IN POWIATS WITH THE
LARGEST NUMBER OF TRANSACTIONS IN 2012
Wyszczególnienie
Specification
Liczba transakcji
Number of transactions
Wartość w tys. zł
Value in thous. zl
Powierzchnia w m2
Area in m2
Polska .......................................... 12888 9051638 78343112
Poland
Powiat m. Bytom .......................... 215 36240 279481
Powiat m. Katowice ...................... 192 108210 797417
Powiat m. Kraków. ....................... 191 276467 400136
Powiat m. Poznań ......................... 182 313804 502980
Powiat kłodzki .............................. 178 47258 518146
Powiat m. Gorzów Wlkp. .............. 167 61228 901333
Powiat ostrołęcki ........................... 152 18459 5608360
Powiat m. Zabrze .......................... 146 55867 432994
Powiat poznański .......................... 138 189807 360085
Powiat świdnicki12
........................ 126 33715 245648
Powiat cieszyński .......................... 126 61378 312246
Powiat m. Gdańsk ......................... 124 566086 393085
Powiat kutnowski .......................... 121 26018 174011
Powiat m. Wrocław ....................... 117 1396712 728951
Powiat nowosolski ........................ 115 9254 107583
Powiat m. Szczecin ....................... 114 114636 423494
Powiat olsztyński .......................... 106 13522 355228
Powiat m. Koszalin ....................... 106 47362 177216
Powiat ostródzki ........................... 103 20190 397124
Powiat zielonogórski ..................... 102 22098 271173
Powiat dzierżoniowski .................. 99 15823 253231
Powiat m. Łódź ............................. 95 215357 495965
Powiat m. Opole ........................... 92 50522 255034
Powiat międzychodzki .................. 89 12483 233185
Powiat m. Bydgoszcz .................... 87 67634 224681
Powiat m. Olsztyn ......................... 81 57487 228353
Powiat wrocławski ........................ 80 50597 381255
Powiat tarnogórski ........................ 77 19791 189744
Powiat jarosławski ........................ 76 8948 1108034
Powiat m. Chorzów ....................... 75 58833 423259
Powiat m. Elbląg ........................... 75 10970 126225
12
in Dolnośląskie Voivodship

108
TABL. 67. MIARY ŚREDNIE DLA TRANSAKCJI KUPNA/SPRZEDAŻY NIERUCHOMOŚCI ZABUDOWANYCH
WEDŁUG LOKALIZACJI W 2012 R.
AVERAGE MEASURES FOR PURCHASE/SALE TRANSACTIONS OF BUILT-UP PROPERTIES BY
LOCATION IN 2012
Wyszczególnienie
Specification
Ogółem
Total
Lokalizacja
Location
w granicach miast
urban areas poza granicami
miast
rural areas ogółem
total
w tym miasta na
prawach powiatu
of which cities
with powiat status
Średnia powierzchnia ewidencyjna sprzedana w pojedynczej transakcji w m2
Average area sold in single transaction in m2
Nieruchomości zabudowane
budynkami mieszkalnymi .... 2752.0 2550.4 2035.4 3071.9
Properties built up with
residential buildings
Grunty rolne zabudowane ......... 30863.2 6587.3 3829.3 32985.6
Built-up agricultural land
Nieruchomości zabudowane
pozostałe .............................. 6078.8 2979.6 3144.5 12301.0
Other built-up properties
Średnia wartość pojedynczej transakcji w tys. zł
Average value of single transaction in thous. zl
Nieruchomości zabudowane
budynkami mieszkalnymi .... 439.2 537.2 701.2 283.7
Properties built up with
residential buildings
Grunty rolne zabudowane ......... 193.8 239.1 321.1 189.9
Built-up agricultural land
Nieruchomości zabudowane
pozostałe .............................. 702.3 855.7 1383.3 394.4
Other built-up properties
Średnia cen transakcyjna w zł/m2
Average transaction price in zl/m2
Nieruchomości zabudowane
budynkami mieszkalnymi .... 159.6 210.6 344.5 92.3
Properties built up with
residential buildings
Grunty rolne zabudowane ......... 6.3 36.3 83.9 5.8
Built-up agricultural land
Nieruchomości zabudowane
pozostałe .............................. 115.5 287.2 439.9 32.1
Other built-up properties

109
TABL. 68. MIARY ŚREDNIE DLA TRANSAKCJI KUPNA/SPRZEDAŻY NIERUCHOMOŚCI ZABUDOWANYCH
BUDYNKAMI MIESZKALNYMI WEDŁUG WOJEWÓDZTW W 2012 R.
AVERAGE MEASURES FOR PURCHASE/SALE TRANSACTIONS OF PROPERTIES BUILT UP WITH
RESIDENTIAL BUILDINGS BY VOIVODSHIPS IN 2012
Wyszczególnienie
Specification
a – ogółem
total
b – w granicach miast
urban areas
c – poza granicami miast
rural areas
Średnia powierzchnia
ewidencyjna sprzedana
w pojedynczej transakcji
w m2
Average area sold in
single transaction in m2
Średnia wartość
pojedynczej transakcji
w tys. zł
Average value of single
transaction in thous. zl
Średnia cena
transakcyjna w zł/m2
Average transaction
price in zl/m2
Polska ........................................ a 2752.0 439.2 159.6
Poland b 2550.4 537.2 210.6
c 3071.9 283.7 92.3
Dolnośląskie ............................... a 3126.6 358.6 114.7
b 3448.2 370.0 107.3
c 2450.2 334.7 136.6
Kujawsko-Pomorskie ................. a 2572.5 252.1 98.0
b 976.2 293.2 300.3
c 4319.1 207.1 48.0
Lubelskie .................................... a 2175.5 233.4 107.3
b 967.6 286.0 295.6
c 4114.4 149.0 36.2
Lubuskie .................................... a 2128.7 248.5 116.7
b 1280.9 295.1 230.4
c 3096.3 195.3 63.1
Łódzkie ...................................... a 2053.8 256.7 125.0
b 1210.2 291.2 240.6
c 3465.1 199.0 57.4
Małopolskie ............................... a 2291.8 440.3 192.1
b 1259.9 540.5 429.0
c 3556.4 317.4 89.3
Mazowieckie .............................. a 1912.8 1241.6 649.1
b 1459.0 1715.0 1175.4
c 2688.5 432.5 160.9
Opolskie ..................................... a 2438.0 222.0 91.1
b 1235.5 324.3 262.5
c 3132.1 163.0 52.0
Podkarpackie .............................. a 2402.7 197.7 82.3
b 1282.1 235.9 184.0
c 3507.9 160.0 45.6
Podlaskie .................................... a 2513.4 229.7 91.4
b 851.7 233.6 274.3
c 4532.8 224.9 49.6
Pomorskie .................................. a 2213.2 330.1 149.1
b 1266.4 336.6 265.8
c 3610.3 320.5 88.8
Śląskie ........................................ a 5112.3 253.6 49.6
b 5822.6 256.4 44.0
c 1897.5 240.7 126.9
Świętokrzyskie ........................... a 2551.3 214.1 83.9
b 1201.5 244.5 203.5
c 5057.1 157.7 31.2
Warmińsko-Mazurskie ............... a 3506.4 234.4 66.9
b 1001.0 242.1 241.9
c 5465.9 228.4 41.8
Wielkopolskie ............................ a 1270.3 333.0 262.2
b 1081.1 365.4 338.0
c 1430.9 305.6 213.5
Zachodniopomorskie .................. a 3051.8 306.8 100.5
b 2201.6 308.9 140.3
c 4656.8 303.0 65.1

110
TABL. 69. MIARY ŚREDNIE DLA TRANSAKCJI KUPNA/SPRZEDAŻY GRUNTÓW ROLNYCH
ZABUDOWANYCH WEDŁUG WOJEWÓDZTW W 2012 R.
AVERAGE MEASURES FOR PURCHASE/SALE TRANSACTIONS OF BUILT-UP AGRICULTURE LAND
BY VOIVODSHIPS IN 2012
Wyszczególnienie
Specification
a – ogółem
total
b – w granicach miast
urban areas
c – poza granicami miast
rural areas
Średnia powierzchnia
ewidencyjna sprzedana
w pojedynczej transakcji
w m2
Average area sold in
single transaction in m2
Średnia wartość
pojedynczej transakcji
w tys. zł
Average value of single
transaction in thous. zl
Średnia cena
transakcyjna w zł/m2
Average transaction
price in zl/m2
Polska ........................................ a 30863.2 193.8 6.3
Poland b 6587.3 239.1 36.3
c 32985.6 189.9 5.8
Dolnośląskie ............................... a 22501.9 208.2 9.3
b 5178.9 154.8 29.9
c 24144.1 213.3 8.8
Kujawsko-Pomorskie ................. a 55238.2 380.2 6.9
b 81745.7 1185.6 14.5
c 54014.0 343.0 6.3
Lubelskie .................................... a 12438.6 97.5 7.8
b 2838.7 152.6 53.8
c 12842.5 95.2 7.4
Lubuskie .................................... a 35741.7 184.2 5.2
b 9423.6 150.2 15.9
c 37276.3 186.1 5.0
Łódzkie ...................................... a 27569.7 184.3 6.7
b 3803.2 315.2 82.9
c 29455.0 173.9 5.9
Małopolskie ............................... a 9621.5 144.6 15.0
b 4157.6 175.6 42.2
c 10511.9 139.6 13.3
Mazowieckie .............................. a 29411.9 217.5 7.4
b 14753.3 210.3 14.3
c 29916.3 217.7 7.3
Opolskie ..................................... a 68675.4 238.9 3.5
b 6015.7 111.3 18.5
c 71181.7 244.0 3.4
Podkarpackie .............................. a 8952.0 107.0 11.9
b 2603.1 124.4 47.8
c 9728.8 104.8 10.8
Podlaskie .................................... a 25968.8 144.7 5.6
b 8099.6 189.3 23.4
c 26676.5 142.9 5.4
Pomorskie .................................. a 70148.4 381.0 5.4
b 772.9 368.6 476.9
c 79360.0 382.6 4.8
Śląskie ........................................ a 11415.5 193.5 16.9
b 4810.1 203.3 42.3
c 13232.9 190.8 14.4
Świętokrzyskie ........................... a 22128.1 127.5 5.8
b 2031.1 260.0 128.0
c 25550.0 104.9 4.1
Warmińsko-Mazurskie ............... a 86183.3 272.0 3.2
b 16726.0 324.3 19.4
c 87874.7 270.8 3.1
Wielkopolskie ............................ a 52148.4 349.0 6.7
b 5934.4 126.1 21.2
c 56463.8 369.8 6.5
Zachodniopomorskie .................. a 45668.6 259.2 5.7
b 13304.6 287.9 21.6
c 47475.4 257.6 5.4

111
TABL. 70. MIARY ŚREDNIE DLA TRANSAKCJI KUPNA/SPRZEDAŻY NIERUCHOMOŚCI ZABUDOWANYCH
POZOSTAŁYCH WEDŁUG WOJEWÓDZTW W 2012 R.
AVERAGE MEASURES FOR PURCHASE/SALE TRANSACTIONS OF OTHER BUILT-UP PROPERTIES BY
VOIVODSHIPS IN 2012
Wyszczególnienie
Specification
a – ogółem
total
b – w granicach miast
urban areas
c – poza granicami miast
rural areas
Średnia powierzchnia
ewidencyjna sprzedana
w pojedynczej transakcji
w m2
Average area sold in
single transaction in m2
Średnia wartość
pojedynczej transakcji
w tys. zł
Average value of single
transaction in thous. zl
Średnia cena
transakcyjna w zł/m2
Average transaction
price in zl/m2
Polska ........................................ a 6078.8 702.3 115.5
Poland b 2979.6 855.7 287.2
c 12301 394.4 32.1
Dolnośląskie ............................... a 4038.5 1296.4 321.0
b 2643.1 1569.3 593.8
c 8573.6 409.5 47.8
Kujawsko-Pomorskie ................. a 3783.0 443.5 117.2
b 2793.2 603.0 215.9
c 5477.5 170.5 31.1
Lubelskie .................................... a 14752.5 734.7 49.8
b 5186.2 774.8 149.4
c 29280.6 673.9 23.0
Lubuskie .................................... a 9196.0 335.8 36.5
b 2858.9 430.5 150.6
c 21393.2 153.4 7.2
Łódzkie ...................................... a 5022.9 703.2 140.0
b 4308.8 904.8 210.0
c 6503.8 285.1 43.8
Małopolskie ............................... a 2958.0 749.1 253.2
b 2403.7 948.1 394.4
c 4332.5 255.4 58.9
Mazowieckie .............................. a 9516.9 716.3 75.3
b 2981.0 837.8 281.0
c 14099.4 631.1 44.8
Opolskie ..................................... a 5971.5 474.3 79.4
b 3768.6 615.3 163.3
c 9118.5 273.0 29.9
Podkarpackie .............................. a 8517.3 572.5 67.2
b 2474.0 478.9 193.6
c 17469.2 711.1 40.7
Podlaskie .................................... a 4756.0 404.8 85.1
b 3873.7 395.4 102.1
c 5963.0 417.7 70.1
Pomorskie .................................. a 2632.2 1064.8 404.5
b 2097.5 1493.5 712.0
c 3681.4 223.9 60.8
Śląskie ........................................ a 3461.0 655.3 189.3
b 3146.9 680.3 216.2
c 5840.8 465.4 79.7
Świętokrzyskie ........................... a 7964.4 790.5 99.3
b 6062.5 1061.4 175.1
c 12167.4 192.0 15.8
Warmińsko-Mazurskie ............... a 13750.3 314.3 22.9
b 2189.8 402.0 183.6
c 28447.4 202.9 7.1
Wielkopolskie ............................ a 3020.7 924.2 305.9
b 2668.0 1159.0 434.4
c 3614.1 529.2 146.4
Zachodniopomorskie .................. a 5133.3 399.1 77.7
b 2042.5 418.4 204.9
c 11673.2 358.3 30.7

112
TABL. 71. CHARAKTERYSTYKI OPISOWE ŚREDICH CEN TRANSAKCJI NIERUCHOMOŚCIAMI
ZABUDOWANYMI NA SZCZEBLU POWIATÓW W 2012 R.
PRICE DESCRIPTIVE CHARACTERISTICS OF AVERAGE TRANSACTION PRICES OF BUILT-UP
PROPERTIES AT POWIATS LEVEL IN 2012
Wyszczególnienie
Specification
a – w granicach miast
urban areas
b – poza granicami miast
rural areas
Średnia cena w zł/m2
Average price in zl/m2
Współczynnik
zmienności w %
Variability
coefficient in % najniższa
lowest
najwyższa
highest
mediana
median
średnia
arytmetyczna
arithmetic
mean
wolny rynek
free market
Nieruchomości zabudowane
budynkami mieszkalnymi ...... a 0.58 1684 255 289 64.4
Properties built up with
residential buildings
b 2.20 636 67 89 95.5
Grunty rolne zabudowane ........... a 0.62 1403 42 95 183.2
Built-up agricultural land b 0.22 232 9 16 150.0
Nieruchomości zabudowane
pozostałe ................................ a 1.33 2835 187 259 110.4
Other built-up properties b 0.44 613 45 81 123.5
sprzedaż bezprzetargowa
sale without tender procedure
Nieruchomości zabudowane
budynkami mieszkalnymi ...... a 0.13 3619 112 279 177.8
Properties built up with
residential buildings
b 1.45 1232 54 106 155.7
Grunty rolne zabudowane ........... a 4.83 1031 91 138 150.7
Built-up agricultural land b 0.05 396 10 24 183.3
Nieruchomości zabudowane
pozostałe ................................ a 0.22 5061 131 292 191.4
Other built-up properties b 0.94 787 33 77 171.4
sprzedaż przetargowa
sale under tender procedure
Nieruchomości zabudowane
budynkami mieszkalnymi ...... a 7.31 4656 255 400 151.5
Properties built up with
residential buildings
b 2.63 497 42 70 135.7
Grunty rolne zabudowane ........... a 2.04 503 60 93 133.3
Built-up agricultural land b 0.85 309 12 23 173.9
Nieruchomości zabudowane
pozostałe ................................ a 4.09 4679 143 349 188.3
Other built-up properties b 0.14 1279 33 73 198.6
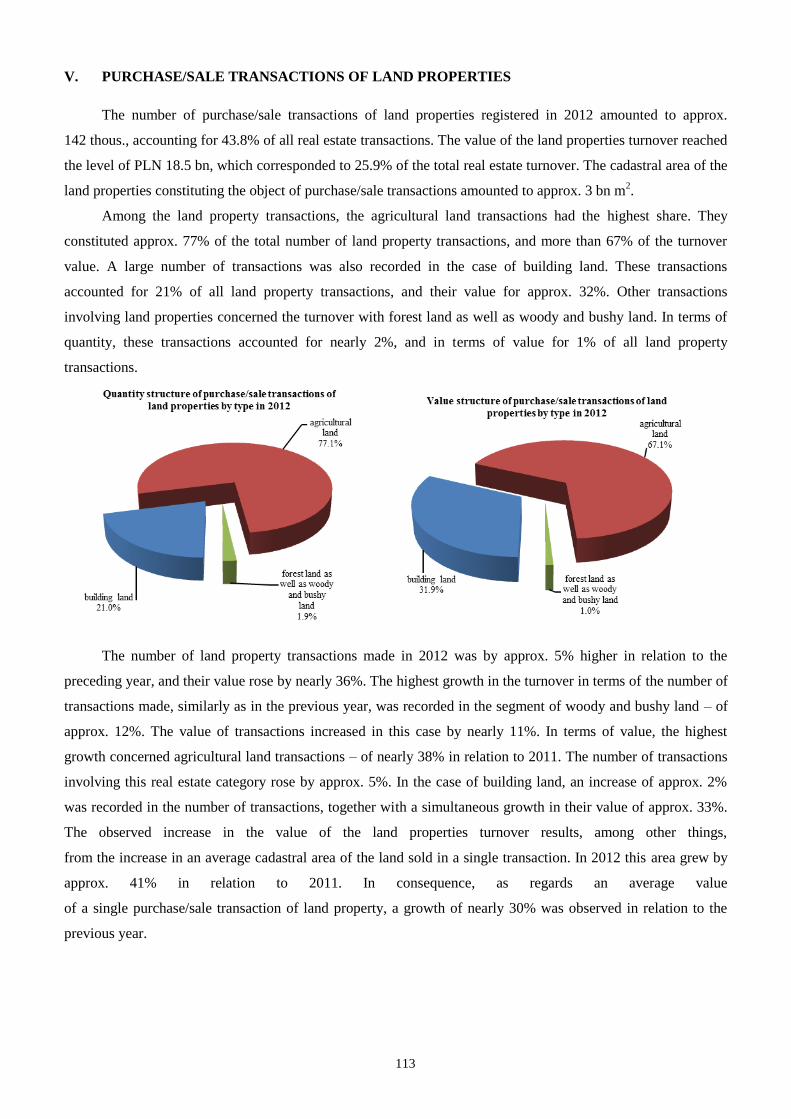
113
V. PURCHASE/SALE TRANSACTIONS OF LAND PROPERTIES
The number of purchase/sale transactions of land properties registered in 2012 amounted to approx.
142 thous., accounting for 43.8% of all real estate transactions. The value of the land properties turnover reached
the level of PLN 18.5 bn, which corresponded to 25.9% of the total real estate turnover. The cadastral area of the
land properties constituting the object of purchase/sale transactions amounted to approx. 3 bn m2.
Among the land property transactions, the agricultural land transactions had the highest share. They
constituted approx. 77% of the total number of land property transactions, and more than 67% of the turnover
value. A large number of transactions was also recorded in the case of building land. These transactions
accounted for 21% of all land property transactions, and their value for approx. 32%. Other transactions
involving land properties concerned the turnover with forest land as well as woody and bushy land. In terms of
quantity, these transactions accounted for nearly 2%, and in terms of value for 1% of all land property
transactions.
The number of land property transactions made in 2012 was by approx. 5% higher in relation to the
preceding year, and their value rose by nearly 36%. The highest growth in the turnover in terms of the number of
transactions made, similarly as in the previous year, was recorded in the segment of woody and bushy land – of
approx. 12%. The value of transactions increased in this case by nearly 11%. In terms of value, the highest
growth concerned agricultural land transactions – of nearly 38% in relation to 2011. The number of transactions
involving this real estate category rose by approx. 5%. In the case of building land, an increase of approx. 2%
was recorded in the number of transactions, together with a simultaneous growth in their value of approx. 33%.
The observed increase in the value of the land properties turnover results, among other things,
from the increase in an average cadastral area of the land sold in a single transaction. In 2012 this area grew by
approx. 41% in relation to 2011. In consequence, as regards an average value
of a single purchase/sale transaction of land property, a growth of nearly 30% was observed in relation to the
previous year.

114

115
Building land
Building land constitutes the second considerable group of land property transactions, preceded by
agricultural land. Three types of land constituting the object of transactions can be distinguished in this group,
namely residential land, industrial land and other building land.
In 2012, in the scope of building land, the object of the turnover involved mainly other building land. This
category is very broad and diversified, covering land designated for buildings and other facilities related to
administration, health care, trade, craft, services, education, culture and art, leisure, communications, religion,
etc. In terms of quantity, transactions involving other building land constituted 81% of the building land
turnover, and in terms of value – over 86%. A considerable number of transactions was also recorded in the
scope of residential land. These transactions accounted for 18% of all transactions involving building land, and
their value for over 10%.
Sales on the free market constituted the predominating form of the building land turnover, both in terms of
quantity and value, accounting respectively for 82.2% and 85.3% of all transactions in 2012.
Within the turnover of building land, the ownership title was the most frequently occurring type of land
ownership right. Within the structure of quantity it accounted for 95.6%, and within the structure of value for
88.6% of all purchase/sale transactions of building land. A relatively large share of transactions concerning the

116
right of perpetual usufruct was recorded in the segment of industrial land (nearly 26% in terms of quantity, and
62% in terms of the transaction value).
Almost 55% of all transactions involving building land took place in rural areas. In terms of value of the
transactions made, the turnover within city borders prevailed, accounting for approx. 66% of all transactions
involving building land.
As regards residential land and other building land, most of transactions took place outside city borders.
The sales of industrial land, however, mainly occurred in urban areas. In the case of industrial land and other
building land, the value of transactions made in cities considerably exceeded the value of transactions made in
rural areas.
The highest turnover of building land, both in terms of quantity and value, was recorded in Mazowieckie,
Śląskie, Małopolskie, Wielkopolskie and Dolnośląskie Voivodships. The transactions of building land made in
these five voivodships altogether accounted in terms of quantity for over 53% of all transactions, and for nearly
61% of the total value of transactions involving this category of real estate in Poland. The lowest number of
transactions involving building land was recorded in Świętokrzyskie, Podlaskie and Lubuskie Voivodships.
These were also the voivodships with the lowest values of transactions of building land.
0
1000
2000
3000
4000
5000
6000
7000
total urban areas cities with powiat status rural areas
mln PLN
Value of purchase/sale transactions of building land by type and location in 2012
residential land industrial land other building land

117

118
Other building land had the highest share in the sales of building land. Such a situation was observed
both in the national scale and in particular voivodships. The highest share of the residential land turnover was
observed in Mazowieckie Voivodship where, in terms of quantity, this real estate category was involved in over
43% of all transactions, and in terms of value in nearly 29% of all building land transactions. In terms of the
value of the transactions, industrial land played a significant role in Opolskie Voivodship (over 35% of the value
of transactions).
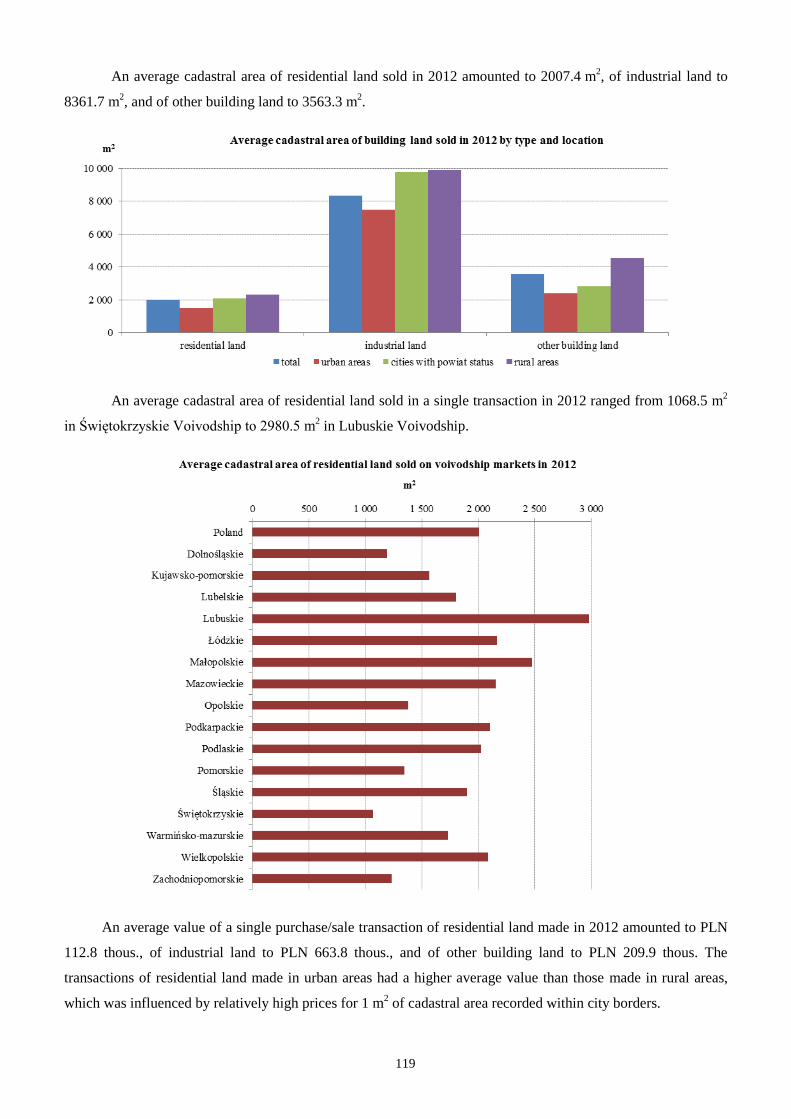
119
An average cadastral area of residential land sold in 2012 amounted to 2007.4 m2, of industrial land to
8361.7 m2, and of other building land to 3563.3 m
2.
An average cadastral area of residential land sold in a single transaction in 2012 ranged from 1068.5 m2
in Świętokrzyskie Voivodship to 2980.5 m2 in Lubuskie Voivodship.
An average value of a single purchase/sale transaction of residential land made in 2012 amounted to PLN
112.8 thous., of industrial land to PLN 663.8 thous., and of other building land to PLN 209.9 thous. The
transactions of residential land made in urban areas had a higher average value than those made in rural areas,
which was influenced by relatively high prices for 1 m2 of cadastral area recorded within city borders.

120
The highest average value of a single purchase/sale transaction of residential land was recorded in
Wielkopolskie Voivodship – PLN 149.8 thous., whereas the lowest average value of a single purchase/sale
transaction of residential land was observed in Warmińsko-Mazurskie Voivodship – PLN 50.5 thous.
An average price for 1 m2 of cadastral area of residential land amounted to approx. PLN 56, of industrial
land to approx. PLN 79, and other building land to nearly PLN 59. The location of building land had
a considerable influence on its prices. The prices of building land located in urban areas were higher than those
located outside city borders. In urban areas, especially high prices of other building land were observed in cities
with powiat status.

121
The highest average transaction value for residential land was recorded in Dolnośląskie Voivodship. It
amounted to approx. PLN 123 per 1 m2 and was by over two times higher than the average price for Poland in
total. The lowest average transaction price of residential land was recorded in Warmińsko-Mazurskie
Voivodship – approx. PLN 29 per 1 m2.

122
Agricultural land
Agricultural land constituted the most significant transaction group as regards land property transactions.
In 2012, similarly to the previous year, sales on the free market constituted the predominant form of
turnover, both within the structure of quantity and quality, accounting respectively for 85.8% and 82.3% of all
transactions. Non-tender sales were the least frequent form of turnover. In terms of the number of transactions,
these sales accounted for 4.2% of the agricultural land turnover, and in terms of value for 6.1%.
Within the agricultural land turnover, the ownership title was the most frequently occurring type of land
ownership right. Both in terms of quantity and value, the majority of the agricultural land turnover took place
outside city borders (87.2% and 71.2%, respectively).
The largest number of agricultural land transactions was recorded in Mazowieckie, Wielkopolskie,
Lubelskie and Podkarpackie Voivodships, and the smallest in Lubuskie and Opolskie Voivodships. In terms of
value, the highest turnover was observed in Mazowieckie Voivodship (over 20% of the turnover value of
agricultural land in Poland) and in Wielkopolskie Voivodship (nearly 19% of the turnover value of agricultural
land in the entire Poland). The lowest value of purchase/sale transactions of agricultural land was recorded in
Lubuskie and Opolskie Voivodships.

123
An average cadastral area of agricultural land sold in a single transaction in 2012 amounted to 2.66 ha
for the whole of Poland. Agricultural land sold in rural areas was, in average terms, much larger than agricultural
land sold within city borders. In particular voivodships, an average cadastral area of agricultural land ranged
from 0.53 ha in Małopolskie Voivodship to 17.78 ha in Warmińsko-Mazurskie Voivodship.

124
An average price of agricultural land purchased in a single transaction amounted to PLN 113.2 thous.
The agricultural land transactions made in urban areas were approx. 176% more expensive than those made in
rural areas, which was influenced by relatively high prices for 1 m2 of cadastral area recorded within city
borders.

125
An average value of a single purchase/sale transaction of agricultural land ranged from PLN 36.8 thous.
in Podkarpackie Voivodship to PLN 210.6 thous. in Wielkopolskie Voivodship. Both voivodships belonged to
the group of voivodships which in 2012 recorded the largest number of transactions. Wielkopolskie Voivodship
indicated a high average value of agricultural land transactions, along with a rather small average area sold in a
single transaction.
An average price for 1 ha of cadastral area of agricultural land sold in 2012 in Poland amounted to nearly
PLN 43 thous. per 1 ha. The prices of agricultural land located in urban areas were much higher than the prices
of land located outside city borders. Especially high prices were recorded in cities with powiat status. An average

126
price for 1 ha of cadastral area of agricultural land sold in cities with powiat status was nearly 32 times higher
than an average price of this real estate category for Poland in total.
The highest average transaction price for agricultural land was recorded in Mazowieckie and Małopolskie
Voivodship (accounting respectively for PLN 136 thous. per 1 ha) as well as Śląskie and Wielkopolskie
respectively for PLN 132.3 and 120.5 thous. per 1 ha. The lowest average transaction price for agricultural land
concerned Warmińsko-Mazurskie Voivodship - PLN 7 thous. per 1 ha.
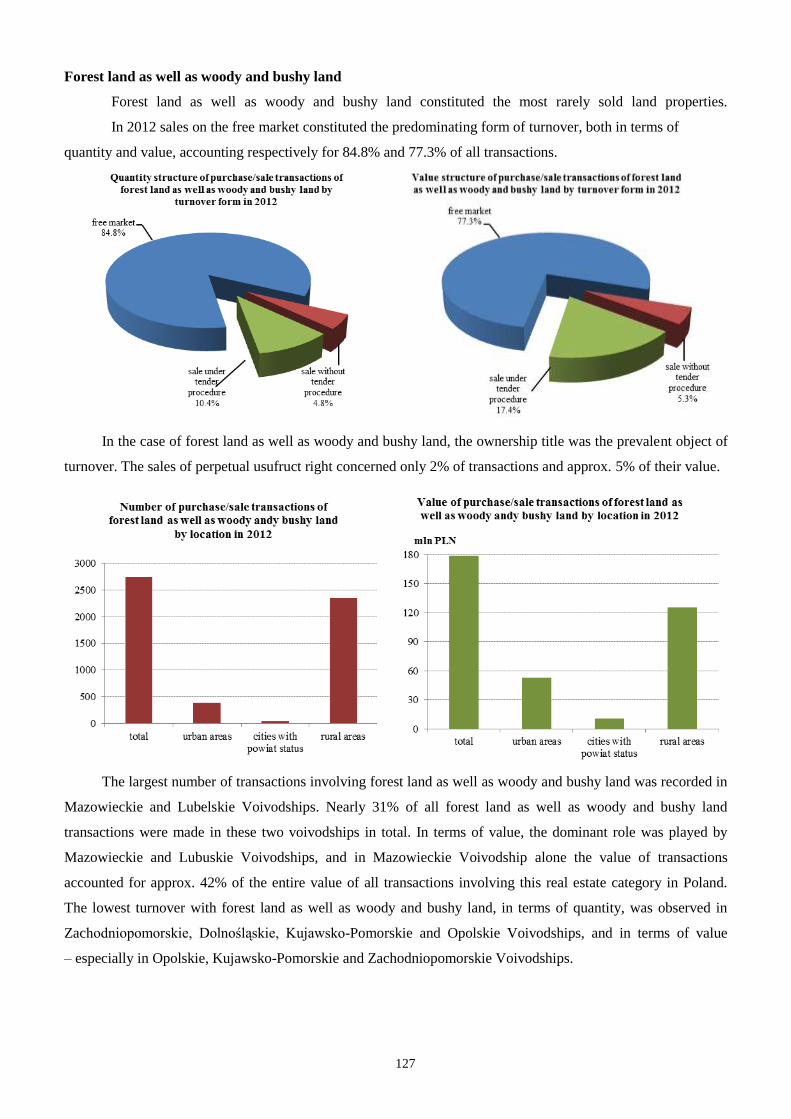
127
Forest land as well as woody and bushy land
Forest land as well as woody and bushy land constituted the most rarely sold land properties.
In 2012 sales on the free market constituted the predominating form of turnover, both in terms of
quantity and value, accounting respectively for 84.8% and 77.3% of all transactions.
In the case of forest land as well as woody and bushy land, the ownership title was the prevalent object of
turnover. The sales of perpetual usufruct right concerned only 2% of transactions and approx. 5% of their value.
The largest number of transactions involving forest land as well as woody and bushy land was recorded in
Mazowieckie and Lubelskie Voivodships. Nearly 31% of all forest land as well as woody and bushy land
transactions were made in these two voivodships in total. In terms of value, the dominant role was played by
Mazowieckie and Lubuskie Voivodships, and in Mazowieckie Voivodship alone the value of transactions
accounted for approx. 42% of the entire value of all transactions involving this real estate category in Poland.
The lowest turnover with forest land as well as woody and bushy land, in terms of quantity, was observed in
Zachodniopomorskie, Dolnośląskie, Kujawsko-Pomorskie and Opolskie Voivodships, and in terms of value
– especially in Opolskie, Kujawsko-Pomorskie and Zachodniopomorskie Voivodships.

128
An average cadastral area of forest land as well as woody and bushy land, constituting the object of
turnover in 2012, amounted to 0.90 ha for the whole of Poland. For particular voivodships, this figure ranged

129
from 0.25 ha in Lubuskie Voivodship to 2.22 ha in Dolnośląskie Voivodship. However, it should be pointed out
that Dolnośląskie Voivodship belonged to the group of voivodships with a small number of transactions made.
An average cost of forest land as well as woody and bushy land purchased in a single transaction
amounted to PLN 65.2 thous. An average transaction value in particular voivodships ranged from PLN
13.3 thous. in Podkarpackie Voivodship to PLN 175.5 thous. in Dolnośląskie Voivodship. The high transaction
value in Dolnośląskie Voivodship resulted mainly from a high average cadastral area of land sold in a single
transaction.

130
An average price for 1 ha of cadastral area of forest land as well as woody and bushy land sold in 2012 in
Poland amounted to approx. PLN 72.4 thous. The prices of forest land as well as woody and bushy land located
in urban areas were much higher than those located outside city borders. An average price for 1 ha of cadastral
area of forest land as well as woody and bushy land sold in cities was nearly five times higher than an average
price of this real estate category for Poland in total.

131
Average transaction prices for forest land as well as woody and bushy land ranged from PLN 14 thous. per
1 ha in Lubelskie Voivodship to approx. PLN 464 thous. per 1 ha in Lubuskie Voivodship. A high average
transaction price recorded in Lubuskie Voivodship results, among other things, from the fact that nearly 84% of
the forest land as well as woody and bushy land transactions made in this voivodship concerned land located
within city borders. In consequence, transactions made in this voivodship were characterised by a low average
area and a high value.

132
TABL. 72. TRANSAKCJE KUPNA/SPRZEDAŻY NIERUCHOMOŚCI GRUNTOWYCH W 2012 R.
PURCHASE/SALE TRANSACTIONS OF LAND PROPERTIES IN 2012
Wyszczególnienie
Specification
a - ogółem
total
b - w granicach miast
urban areas
c - poza granicami miast
rural areas
Liczba transakcji
Number of transactions
Wartość
Value
Powierzchnia
Area
w liczbach
bezwzględnych
in absolute
numbers
w %
in %
w tys. zł
in thous. zl
w %
in %
w m2
in m2
w %
in %
Nieruchomości gruntowe ogółem ... a 142061 100.0 18455379 100.0 3041022840 100.0
Land properties in total b 27876 19.6 7493091 40.6 112663100 3.7
c 114185 80.4 10962288 59.4 2928359740 96.3
Grunty przeznaczone pod
zabudowę ..................................... a 29865 21.0 5887277 31.9 99530656 3.2
Building land b 13486 9.5 3871602 21.0 31745560 1.0
c 16379 11.5 2015675 10.9 67785096 2.2
Grunty przeznaczone pod
zabudowę mieszkaniową ....... a 5376 3.8 606383 3.3 10791971 0.4
Residential land b 2072 1.5 303220 1.7 3146119 0.1
c 3304 2.3 303162 1.6 7645852 0.3
Grunty przeznaczone pod
zabudowę przemysłową ......... a 308 0.2 204442 1.1 2575401 0.0
Industrial land b 197 0.1 168904 0.9 1479053 0.0
c 111 0.1 35538 0.2 1096348 0.0
Grunty przeznaczone pod
zabudowę inną ....................... a 24181 17.0 5076452 27.5 86163284 2.8
Other building land b 11217 7.9 3399477 18.4 27120388 0.9
c 12964 9.1 1676975 9.1 59042896 1.9
Użytki rolne ........................................ a 109455 77.1 12389404 67.1 2916803199 95.9
Agricultural land. b 14000 9.9 3568387 19.3 79377879 2.6
c 95455 67.2 8821017 47.8 2837425320 93.3
Grunty leśne oraz zadrzewione i
zakrzewione ................................. a 2741 1.9 178698 1.0 24688985 0.9
Forest land as well as woody and
bushy land
b 390 0.2 53102 0.3 1539661 0.1
c 2351 1.7 125596 0.7 23149324 0.8

133
TABL. 73. TRANSAKCJE KUPNA/SPRZEDAŻY NIERUCHOMOŚCI GRUNTOWYCH WEDŁUG FORMY
OBROTU W 2012 R.
PURCHASE/SALE TRANSACTIONS OF LAND PROPERTIES BY TURNOVER FORM IN 2012
Wyszczególnienie
Specification
a – liczba transakcji
number of transactions
b – wartość w tys. zł
value in thous. zl
c – powierzchnia w m2
area in m2
Ogółem
Total
Forma obrotu
Turnover form
wolny rynek
free market
sprzedaż
bezprzetargowa
sale without
tender procedure
sprzedaż
przetargowa
sale under tender
procedure
Nieruchomości gruntowe ogółem ... a 142061 120743 7080 14238
Land properties in total b 18455379 15359359 987587 2108433
c 3041022840 2334193025 334611497 372218318
Grunty przeznaczone pod
zabudowę ..................................... a 29865 24532 2275 3058
Building land b 5887277 5024537 217020 645720
c 99530656 82312355 6905203 10313098
Grunty przeznaczone pod
zabudowę mieszkaniową ....... a 5376 4733 209 434
Residential land b 606383 542192 10618 53572
c 10791971 9765488 117781 908702
Grunty przeznaczone pod
zabudowę przemysłową ......... a 308 230 29 49
Industrial land b 204442 183801 6502 14139
c 2575401 1994448 216818 364135
Grunty przeznaczone pod
zabudowę inną ....................... a 24181 19569 2037 2575
Other building land b 5076452 4298544 199900 578008
c 86163284 70552419 6570604 9040261
Użytki rolne ...................................... a 109455 93887 4672 10896
Agricultural land. b 12389404 10196762 760961 1431681
c 2916803199 2229697023 327181599 359924577
Grunty leśne oraz zadrzewione i
zakrzewione ................................. a 2741 2324 133 284
Forest land as well as woody and
bushy land b 178698 138059 9607 31032
c 24688985 22183647 524695 1980643

134
TABL. 74. STRUKTURA SPRZEDAŻY NIERUCHOMOŚCI GRUNTOWYCH WEDŁUG FORMY OBROTU
W 2012 R.
SALE STRUCTURE OF LAND PROPERTIES BY TURNOVER FORM IN 2012
Wyszczególnienie
Specification
a – liczba transakcji
number of transactions
b – wartość
value
c – powierzchnia
area
Ogółem
Total
Forma obrotu
Turnover form
wolny rynek
free market
sprzedaż
bezprzetargowa
sale without
tender procedure
sprzedaż
przetargowa
sale under tender
procedure
Nieruchomości gruntowe ogółem ... a 100.0 85.0 5.0 10.0
Land properties in total b 100.0 83.2 5.4 11.4
c 100.0 76.8 11.0 12.2
Grunty przeznaczone pod
zabudowę ..................................... a 100.0 82.2 7.6 10.2
Building land b 100.0 85.3 3.7 11.0
c 100.0 82.7 6.9 10.4
Grunty przeznaczone pod
zabudowę mieszkaniową ....... a 100.0 88.0 3.9 8.1
Residential land b 100.0 89.4 1.8 8.8
c 100.0 90.5 1.1 8.4
Grunty przeznaczone pod
zabudowę przemysłową ......... a 100.0 74.7 9.4 15.9
Industrial land b 100.0 89.9 3.2 6.9
c 100.0 77.5 8.4 14.1
Grunty przeznaczone pod
zabudowę inną ....................... a 100.0 81.0 8.4 10.6
Other building land b 100.0 84.7 3.9 11.4
c 100.0 81.9 7.6 10.5
Użytki rolne ...................................... a 100.0 85.8 4.2 10.0
Agricultural land. b 100.0 82.3 6.1 11.6
c 100.0 76.5 11.2 12.3
Grunty leśne oraz zadrzewione i
zakrzewione ................................. a 100.0 84.8 4.8 10.4
Forest land as well as woody and
bushy land b 100.0 77.3 5.3 17.4
c 100.0 89.9 2.1 8.0

135
TABL. 75. TRANSAKCJE KUPNA/SPRZEDAŻY NIERUCHOMOŚCI GRUNTOWYCH WEDŁUG LOKALIZACJI
W 2012 R.
PURCHASE/SALE TRANSACTIONS OF LAND PROPERTIES BY LOCATION IN 2012
Wyszczególnienie
Specification
a – liczba transakcji
number of transactions
b – wartość w tys. zł
value in thous. zl
c – powierzchnia w m2
area in m2
Ogółem
Total
Lokalizacja Location
w granicach miast urban areas
poza
granicami
miast
rural areas
ogółem
total
w tym miasta na prawach powiatu
of which cities with powiat status
ogółem
total
powyżej
200 tys.
ludności
more than
200 thous.
inhabitants
poniżej 200
tys.
ludności
less than
200 thous.
inhabitants
Nieruchomości gruntowe
ogółem ................................ a 142061 27876 9931 4740 5191 114185
Land properties in total b 18455379 7493091 4913546 3673346 1240200 10962288
c 3041022840 112663100 34255576 16832316 17423260 2928359740
Grunty przeznaczone pod
zabudowę ............................ a 29865 13486 5719 2541 3178 16379
Building land b 5887277 3871602 2482864 1628179 854685 2015675
c 99530656 31745560 16169466 8159568 8009898 67785096
Grunty przeznaczone pod
zabudowę
mieszkaniową ............... a 5376 2072 453 75 378 3304
Residential land b 606383 303220 69891 13161 56730 303162
c 10791971 3146119 957695 78818 878877 7645852
Grunty przeznaczone pod
zabudowę
przemysłową ................. a 308 197 43 8 35 111
Industrial land b 204442 168904 36042 5506 30536 35538
c 2575401 1479053 420013 23484 396529 1096348
Grunty przeznaczone pod
zabudowę inną .............. a 24181 11217 5223 2458 2765 12964
Other building land b 5076452 3399477 2376931 1609512 767419 1676975
c 86163284 27120388 14791758 8057266 6734492 59042896
Użytki rolne ............................. a 109455 14000 4172 2187 1985 95455
Agricultural land b 12389404 3568387 2420325 2043018 377307 8821017
c 2916803199 79377879 17888358 8643859 9244499 2837425320
Grunty leśne oraz
zadrzewione i zakrzewione a 2741 390 40 12 28 2351
Forest land as well as woody
and bushy land
b 178698 53102 10357 2149 8208 125596
c 24688985 1539661 197752 28889 168863 23149324
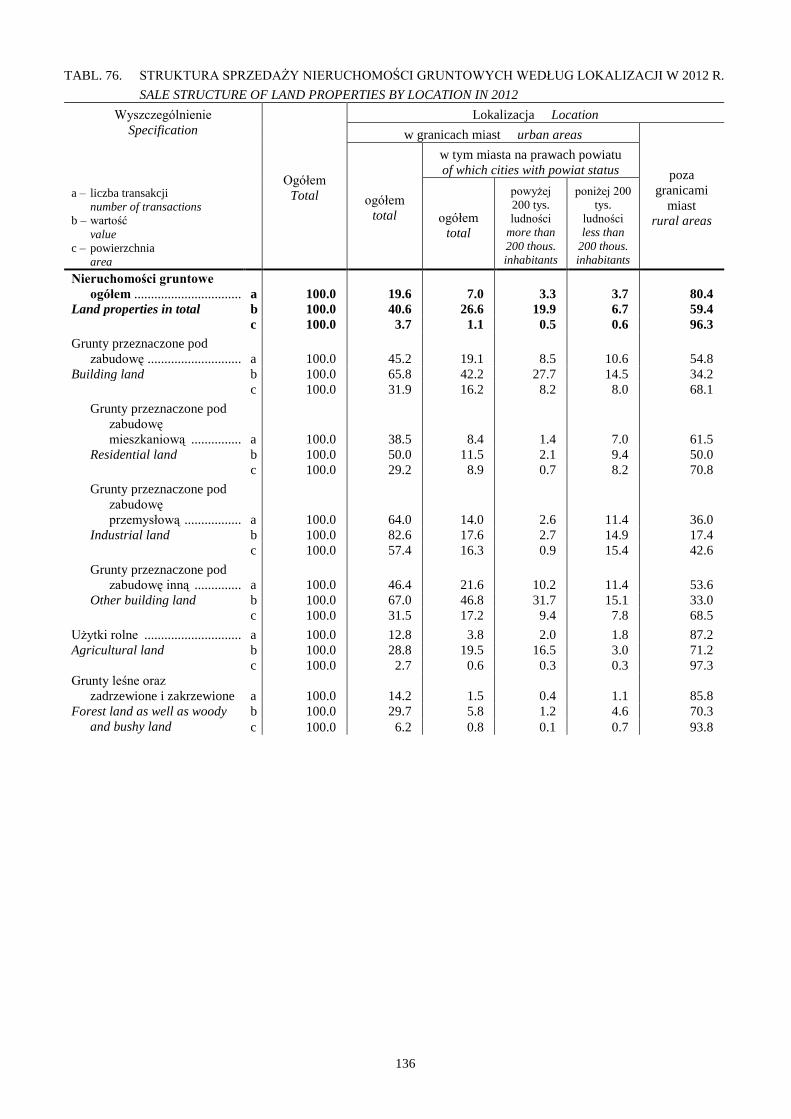
136
TABL. 76. STRUKTURA SPRZEDAŻY NIERUCHOMOŚCI GRUNTOWYCH WEDŁUG LOKALIZACJI W 2012 R.
SALE STRUCTURE OF LAND PROPERTIES BY LOCATION IN 2012
Wyszczególnienie
Specification
a – liczba transakcji
number of transactions
b – wartość
value
c – powierzchnia
area
Ogółem
Total
Lokalizacja Location
w granicach miast urban areas
poza
granicami
miast
rural areas
ogółem
total
w tym miasta na prawach powiatu
of which cities with powiat status
ogółem
total
powyżej
200 tys.
ludności
more than
200 thous.
inhabitants
poniżej 200
tys.
ludności
less than
200 thous.
inhabitants
Nieruchomości gruntowe
ogółem ................................ a 100.0 19.6 7.0 3.3 3.7 80.4
Land properties in total b 100.0 40.6 26.6 19.9 6.7 59.4
c 100.0 3.7 1.1 0.5 0.6 96.3
Grunty przeznaczone pod
zabudowę ............................ a 100.0 45.2 19.1 8.5 10.6 54.8
Building land b 100.0 65.8 42.2 27.7 14.5 34.2
c 100.0 31.9 16.2 8.2 8.0 68.1
Grunty przeznaczone pod
zabudowę
mieszkaniową ............... a 100.0 38.5 8.4 1.4 7.0 61.5
Residential land b 100.0 50.0 11.5 2.1 9.4 50.0
c 100.0 29.2 8.9 0.7 8.2 70.8
Grunty przeznaczone pod
zabudowę
przemysłową ................. a 100.0 64.0 14.0 2.6 11.4 36.0
Industrial land b 100.0 82.6 17.6 2.7 14.9 17.4
c 100.0 57.4 16.3 0.9 15.4 42.6
Grunty przeznaczone pod
zabudowę inną .............. a 100.0 46.4 21.6 10.2 11.4 53.6
Other building land b 100.0 67.0 46.8 31.7 15.1 33.0
c 100.0 31.5 17.2 9.4 7.8 68.5
Użytki rolne ............................. a 100.0 12.8 3.8 2.0 1.8 87.2
Agricultural land b 100.0 28.8 19.5 16.5 3.0 71.2
c 100.0 2.7 0.6 0.3 0.3 97.3
Grunty leśne oraz
zadrzewione i zakrzewione a 100.0 14.2 1.5 0.4 1.1 85.8
Forest land as well as woody
and bushy land
b 100.0 29.7 5.8 1.2 4.6 70.3
c 100.0 6.2 0.8 0.1 0.7 93.8

137
TABL. 77. TRANSAKCJE KUPNA/SPRZEDAŻY NIERUCHOMOŚCI GRUNTOWYCH WEDŁUG RODZAJU
PRAWA DO DZIAŁKI W 2012 R.
PURCHASE/SALE TRANSACTIONS OF LAND PROPERTIES BY KIND OF RIGHT TO LAND PARCEL IN
2012
Wyszczególnienie
Specification
a – liczba transakcji
number of transactions
b – wartość w tys. zł
value in thous. zl
c – powierzchnia w m2
area in m2
Ogółem
Total
Rodzaj prawa do działki
Type of land ownership right
użytkowanie
wieczyste
perpetual usufruct
własność
ownership title
Nieruchomości gruntowe ogółem ........... a 142061 1792 140269
Land properties in total b 18455379 918649 17536730
c 3041022840 8067944 3032954896
Grunty przeznaczone pod zabudowę ........ a 29865 1308 28557
Building land b 5887277 673794 5213483
c 99530656 5277139 94253517
Grunty przeznaczone pod zabudowę
mieszkaniową ................................ a 5376 113 5263
Residential land b 606383 14519 591863
c 10791971 210167 10581804
Grunty przeznaczone pod zabudowę
przemysłową .................................. a 308 79 229
Industrial land b 204442 126663 77779
c 2575401 919632 1655769
Grunty przeznaczone pod zabudowę
inną ................................................ a 24181 1116 23065
Other building land b 5076452 532611 4543841
c 86163284 4147340 82015944
Użytki rolne .............................................. a 109455 430 109025
Agricultural land b 12389404 235131 12154273
c 2916803199 2660199 2914143000
Grunty leśne oraz zadrzewione i
zakrzewione ......................................... a 2741 54 2687
Forest land as well as woody and bushy
land
b 178698 9723 168975
c 24688985 130606 24558379

138
TABL. 78. STRUKTURA SPRZEDAŻY NIERUCHOMOŚCI GRUNTOWYCH WEDŁUG RODZAJU PRAWA DO
DZIAŁKI W 2012 R.
PURCHASE/SALE TRANSACTIONS OF LAND PROPERTIES BY KIND OF RIGHT TO LAND PARCEL IN
2012
Wyszczególnienie
Specification
a – liczba transakcji
number of transactions
b – wartość
value
c – powierzchnia
area
Ogółem
Total
Rodzaj prawa do działki
Type of land ownership right
użytkowanie
wieczyste
perpetual usufruct
własność
ownership title
Nieruchomości gruntowe ogółem ........... a 100.0 1.3 98.7
Land properties in total b 100.0 5.0 95.0
c 100.0 0.3 99.7
Grunty przeznaczone pod zabudowę ........ a 100.0 4.4 95.6
Building land b 100.0 11.4 88.6
c 100.0 5.3 94.7
Grunty przeznaczone pod zabudowę
mieszkaniową ................................ a 100.0 2.1 97.9
Residential land b 100.0 2.4 97.6
c 100.0 1.9 98.1
Grunty przeznaczone pod zabudowę
przemysłową .................................. a 100.0 25.6 74.4
Industrial land b 100.0 62.0 38.0
c 100.0 35.7 64.3
Grunty przeznaczone pod zabudowę
inną ................................................ a 100.0 4.6 95.4
Other building land b 100.0 10.5 89.5
c 100.0 4.8 95.2
Użytki rolne .............................................. a 100.0 0.4 99.6
Agricultural land b 100.0 1.9 98.1
c 100.0 0.1 99.9
Grunty leśne oraz zadrzewione i
zakrzewione ......................................... a 100.0 2.0 98.0
Forest land as well as woody and bushy
land
b 100.0 5.4 94.6
c 100.0 0.5 99.5

139
TABL. 79. LICZBA TRANSAKCJI KUPNA/SPRZEDAŻY NIERUCHOMOŚCI GRUNTOWYCH W LATACH 2006-
2012
NUMBER OF PURCHASE/SALE TRANSACTIONS OF LAND PROPERTIES IN 2006-2012
Wyszczególnienie
Specification
a – ogółem
total
b – w granicach miast
urban areas
c – poza granicami miast
rural areas
2006 2007 2008 2009 2010 2011 2012
w liczbach bezwzględnych
in absolute numbers
Nieruchomości gruntowe
ogółem ................................... a 141206 169058 138782 101426 127339 135818 142061
Land properties in total b 41398 46435 31776 20315 25485 27937 27876
c 99808 122623 107006 81111 101854 107881 114185
w tym:
of which:
Grunty przeznaczone pod
zabudowę ............................... a 35988 43795 35776 24315 28358 29173 29865
Building land b 16341 18400 15506 10335 12104 13508 13486
c 19647 25395 20270 13980 16254 15665 16379
Użytki rolne ................................ a 84906 104289 84763 75160 97085 104191 109455
Agricultural land b 12880 15750 11548 9752 13202 14169 14000
c 72026 88539 73215 65408 83883 90022 95455
Grunty leśne oraz zadrzewione i
zakrzewione ........................... a 2063 2232 2683 1951 1896 2454 2741
Forest land as well as woody
and bushy land
b 207 184 459 228 179 260 390
c 1856 2048 2224 1723 1717 2194 2351
poprzedni rok = 100
previous year = 100
Nieruchomości gruntowe
ogółem ................................... a 104.9 119.7 82.1 73.1 125.5 106.7 104.6
Land properties in total b 96.7 112.2 68.4 63.9 125.4 109.6 99.8
c 108.7 122.9 87.3 75.8 125.6 105.9 105.8
w tym:
of which:
Grunty przeznaczone pod
zabudowę ............................... a 147.4 121.7 81.7 68.0 116.6 102.9 102.4
Building land b 128.1 112.6 84.3 66.7 117.1 111.6 99.8
c 168.7 129.3 79.8 69.0 116.3 96.4 104.6
Użytki rolne ................................ a 105.0 122.8 81.3 88.7 129.2 107.3 105.1
Agricultural land b 128.5 122.3 73.3 84.4 135.4 107.3 98.8
c 101.7 122.9 82.7 89.3 128.2 107.3 106.0
Grunty leśne oraz zadrzewione i
zakrzewione ........................... a 125.9 108.2 120.2 72.7 97.2 129.4 111.7
Forest land as well as woody and
bushy land
b 134.4 88.9 249.5 49.7 78.5 145.3 150.0
c 125.0 110.3 108.6 77.5 99.7 127.8 107.2

140
TABL. 80. WARTOŚĆ TRANSAKCJI KUPNA/SPRZEDAŻY NIERUCHOMOŚCI GRUNTOWYCH W LATACH
2006-2012
VALUE OF PURCHASE/SALE TRANSACTIONS OF LAND PROPERTIES IN 2006-2012
Wyszczególnienie
Specification
a – ogółem
total
b – w granicach miast
urban areas
c – poza granicami miast
rural areas
2006 2007 2008 2009 2010 2011 2012
w tys. zł
in thous. zl
Nieruchomości
gruntowe ogółem ... a 11227012 17888894 15678586 8369723 9155679 13590218 18455379
Land properties in
total
b 6681291 9547579 7818223 3176723 2910908 5439130 7493091
c 4545721 8341315 7860363 5193000 6244771 8151088 10962288
w tym:
of which:
Grunty przeznaczone
pod zabudowę .......... a 4345144 6647252 6995188 3426333 2886719 4418474 5887277
Building land b 3344033 4488132 4820227 2082345 1568217 2780912 3871602
c 1001112 2159119 2174961 1343988 1318502 1637563 2015675
Użytki rolne .................. a 3915150 7234139 6859822 4796048 6185689 9010070 12389404
Agricultural land
b 1030620 2001040 2086197 1054495 1328496 2608529 3568387
c 2884530 5233099 4773626 3741553 4857193 6401541 8821017
Grunty leśne oraz
zadrzewione i
zakrzewione ............. a 43901 69096 172929 147342 83271 161674 178698
Forest land as well as
woody and bushy
land
b 8279 11441 92261 39883 14195 49690 53102
c 35622 57655 80669 107459 69076 111984 125596
poprzedni rok = 100
previous year = 100
Nieruchomości
gruntowe ogółem ... a 143.8 159.3 87.6 53.4 109.4 148.4 135.8
Land properties in
total
b 151.8 142.9 81.9 40.6 91.6 186.9 137.8
c 133.4 183.5 94.2 66.1 120.3 130.5 134.5
w tym:
of which:
Grunty przeznaczone
pod zabudowę .......... a 193.7 153.0 105.2 49.0 84.3 153.1 133.2
Building land b 186.7 134.2 107.4 43.2 75.3 177.3 139.2
c 221.5 215.7 100.7 61.8 98.1 124.2 123.1
Użytki rolne .................. a 133.3 184.8 94.8 69.9 129.0 145.7 137.5
Agricultural land
b 194.1 194.2 104.3 50.5 126.0 196.4 136.8
c 119.9 181.4 91.2 78.4 129.8 131.8 137.8
Grunty leśne oraz
zadrzewione i
zakrzewione ............. a 76.9 157.4 250.3 85.2 56.5 194.2 110.5
Forest land as well as
woody and bushy
land
b 30.1 138.2 806.4 43.2 35.6 350.1 106.9
c 120.5 161.9 139.9 133.2 64.3 162.1 112.2

141
TABL. 81. TRANSAKCJE KUPNA/SPRZEDAŻY GRUNTÓW PRZEZNACZONYCH POD ZABUDOWĘ WEDŁUG
WOJEWÓDZTW W 2012 R.
PURCHASE/SALE TRANSACTIONS OF BUILDING LAND BY VOIVODSHIPS IN 2012
Wyszczególnienie
Specification
Liczba transakcji
Number of transactions
Wartość
Value
Powierzchnia
Area
w liczbach
bezwzględnych
in absolute
numbers
w %
in %
w tys. zł
in thous. zl
w %
in %
w m2
in m2
w %
in %
Polska ............................................. 29865 100.0 5887277 100.0 99530656 100.0
Poland
Dolnośląskie .................................... 2550 8.5 586982 10.0 9267722 9.3
Kujawsko-Pomorskie ...................... 1375 4.6 242254 4.1 5285245 5.3
Lubelskie ......................................... 1268 4.2 229425 3.9 3819881 3.8
Lubuskie ......................................... 958 3.2 139207 2.4 3896018 3.9
Łódzkie ........................................... 1981 6.6 252571 4.3 8507968 8.5
Małopolskie .................................... 2792 9.3 913705 15.5 6669209 6.7
Mazowieckie ................................... 4015 13.5 870563 14.8 12069660 12.1
Opolskie .......................................... 1230 4.1 226286 3.8 2947557 3.0
Podkarpackie ................................... 1231 4.1 176431 3.0 4050855 4.1
Podlaskie ......................................... 597 2.0 73099 1.2 2260692 2.3
Pomorskie ....................................... 2142 7.2 428758 7.3 8853699 8.9
Śląskie ............................................. 3915 13.2 682559 11.6 9926407 10.0
Świętokrzyskie ................................ 529 1.8 121716 2.1 2298772 2.3
Warmińsko-Mazurskie .................... 1468 4.9 149340 2.5 9109854 9.2
Wielkopolskie ................................. 2588 8.7 536861 9.1 6174683 6.2
Zachodniopomorskie ....................... 1226 4.1 257521 4.4 4392434 4.4
TABL. 82. TRANSAKCJE KUPNA/SPRZEDAŻY GRUNTÓW PRZEZNACZONYCH POD ZABUDOWĘ
MIESZKANIOWĄ WEDŁUG WOJEWÓDZTW W 2012 R.
PURCHASE/SALE TRANSACTIONS OF RESIDENTIAL LAND BY VOIVODSHIPS IN 2012
Wyszczególnienie
Specification
Liczba transakcji
Number of transactions
Wartość
Value
Powierzchnia
Area
w liczbach
bezwzględnych
in absolute
numbers
w %
in %
w tys. zł
in thous. zl
w %
in %
w m2
in m2
w %
in %
Polska ............................................. 5376 100.0 606383 100.0 10791971 100.0
Poland
Dolnośląskie .................................... 123 2.3 18144 3.0 146981 1.4
Kujawsko-Pomorskie ...................... 71 1.3 3813 0.6 111467 1.0
Lubelskie ......................................... 431 8.0 33499 5.5 777397 7.2
Lubuskie ......................................... 118 2.2 12765 2.1 351694 3.3
Łódzkie ........................................... 528 9.8 50356 8.3 1144852 10.6
Małopolskie .................................... 285 5.3 23531 3.9 706740 6.5
Mazowieckie ................................... 1730 32.3 251611 41.5 3727927 34.6
Opolskie .......................................... 139 2.6 19242 3.2 191763 1.8
Podkarpackie ................................... 225 4.2 22592 3.7 473613 4.4
Podlaskie ......................................... 93 1.7 8196 1.4 188266 1.7
Pomorskie ....................................... 128 2.4 11880 2.0 172298 1.6
Śląskie ............................................. 699 13.0 68552 11.3 1327537 12.3
Świętokrzyskie ................................ 86 1.6 6645 1.1 91892 0.9
Warmińsko-Mazurskie .................... 308 5.7 15554 2.6 533748 4.9
Wielkopolskie ................................. 394 7.3 59002 9.7 823553 7.6
Zachodniopomorskie ....................... 18 0.3 1000 0.1 22243 0.2

142
TABL. 83. TRANSAKCJE KUPNA/SPRZEDAŻY GRUNTÓW PRZEZNACZONYCH POD ZABUDOWĘ
PRZEMYSŁOWĄ WEDŁUG WOJEWÓDZTW W 2012 R.
PURCHASE/SALE TRANSACTIONS OF INDUSTRIAL LAND BY VOIVODSHIPS IN 2012
Wyszczególnienie
Specification
Liczba transakcji
Number of transactions
Wartość
Value
Powierzchnia
Area
w liczbach
bezwzględnych
in absolute
numbers
w %
in %
w tys. zł
in thous. zl
w %
in %
w m2
in m2
w %
in %
Polska .......................................... 308 100.0 204442 100.0 2575401 100.0
Poland
Dolnośląskie ................................. 13 4.2 8493 4.2 242086 9.4
Kujawsko-Pomorskie ................... 6 1.9 2031 1.0 13984 0.5
Lubelskie ...................................... 22 7.1 10192 5.0 190806 7.4
Lubuskie ...................................... 5 1.6 9965 4.9 160482 6.2
Łódzkie ........................................ 21 6.8 13257 6.5 206476 8.0
Małopolskie ................................. 18 5.8 8955 4.4 115177 4.5
Mazowieckie ................................ 74 24.1 34767 17.0 599826 23.4
Opolskie ....................................... 35 11.5 80147 39.2 386136 15.0
Podkarpackie ................................ 19 6.2 5039 2.5 57713 2.2
Podlaskie ...................................... – – – – – –
Pomorskie .................................... x x x x x x
Śląskie .......................................... 17 5.5 6285 3.1 78140 3.0
Świętokrzyskie ............................. 9 2.9 1194 0.5 26301 1.0
Warmińsko-Mazurskie ................. 18 5.8 1127 0.5 62922 2.4
Wielkopolskie .............................. 49 16.0 22056 10.8 428486 16.7
Zachodniopomorskie .................... – – – – – –
TABL. 84. TRANSAKCJE KUPNA/SPRZEDAŻY GRUNTÓW PRZEZNACZONYCH POD ZABUDOWĘ INNĄ
WEDŁUG WOJEWÓDZTW W 2012 R.
PURCHASE/SALE TRANSACTIONS OF OTHER BUILDING LAND BY VOIVODSHIPS IN 2012
Wyszczególnienie
Specification
Liczba transakcji
Number of transactions
Wartość
Value
Powierzchnia
Area
w liczbach
bezwzględnych
in absolute
numbers
w %
in %
w tys. zł
in thous. zl
w %
in %
w m2
in m2
w %
in %
Polska .......................................... 24181 100.0 5076452 100.0 86163284 100.0
Poland
Dolnośląskie ................................. 2414 10.0 560345 11.0 8878655 10.3
Kujawsko-Pomorskie ................... 1298 5.4 236411 4.7 5159794 6.0
Lubelskie ...................................... 815 3.4 185734 3.7 2851678 3.3
Lubuskie ...................................... 835 3.5 116477 2.3 3383842 3.9
Łódzkie ........................................ 1432 5.9 188958 3.7 7156640 8.3
Małopolskie ................................. 2489 10.3 881218 17.4 5847292 6.8
Mazowieckie ................................ 2211 9.1 584185 11.5 7741907 9.0
Opolskie ....................................... 1056 4.4 126897 2.5 2369658 2.8
Podkarpackie ................................ 987 4.1 148800 2.9 3519529 4.1
Podlaskie ...................................... 504 2.1 64903 1.2 2072426 2.3
Pomorskie .................................... 2012 8.3 415945 8.2 8674535 10.1
Śląskie .......................................... 3199 13.2 607722 12.0 8520730 9.9
Świętokrzyskie ............................. 434 1.7 113876 2.2 2180579 2.5
Warmińsko-Mazurskie ................. 1142 4.7 132659 2.6 8513184 9.9
Wielkopolskie .............................. 2145 8.9 455803 9.0 4922644 5.7
Zachodniopomorskie .................... 1208 5.0 256521 5.1 4370191 5.1
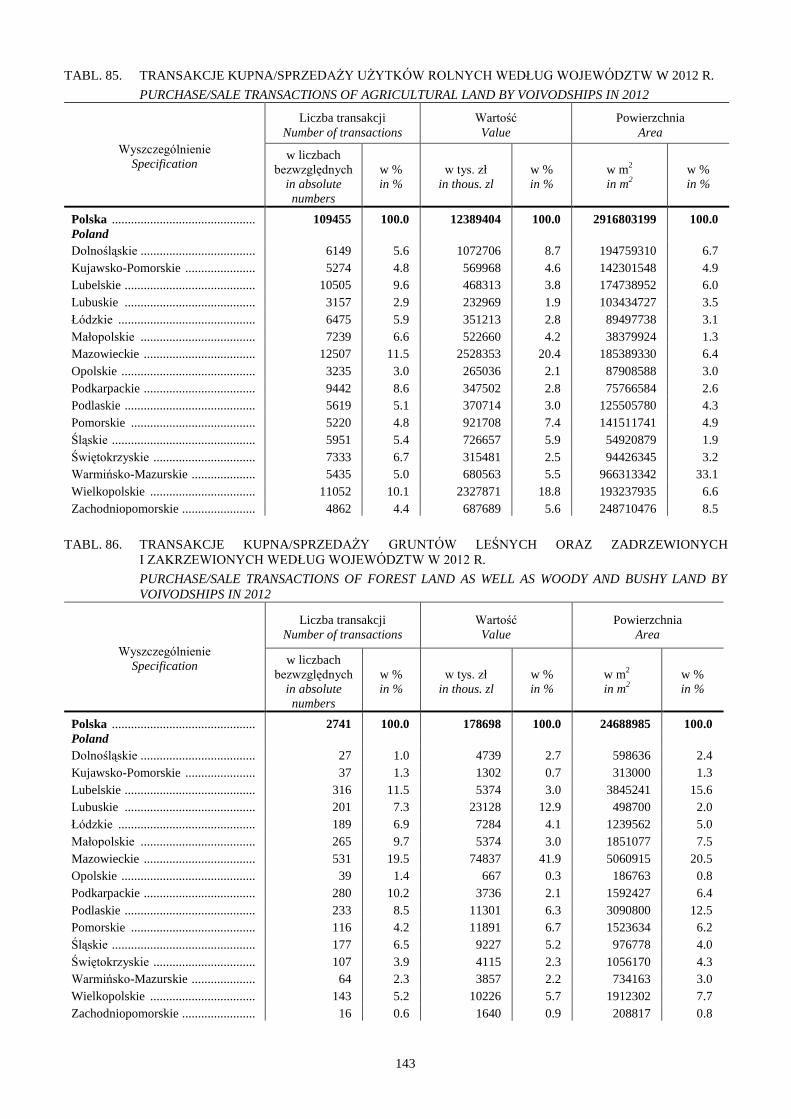
143
TABL. 85. TRANSAKCJE KUPNA/SPRZEDAŻY UŻYTKÓW ROLNYCH WEDŁUG WOJEWÓDZTW W 2012 R.
PURCHASE/SALE TRANSACTIONS OF AGRICULTURAL LAND BY VOIVODSHIPS IN 2012
Wyszczególnienie
Specification
Liczba transakcji
Number of transactions
Wartość
Value
Powierzchnia
Area
w liczbach
bezwzględnych
in absolute
numbers
w %
in %
w tys. zł
in thous. zl
w %
in %
w m2
in m2
w %
in %
Polska ............................................. 109455 100.0 12389404 100.0 2916803199 100.0
Poland
Dolnośląskie .................................... 6149 5.6 1072706 8.7 194759310 6.7
Kujawsko-Pomorskie ...................... 5274 4.8 569968 4.6 142301548 4.9
Lubelskie ......................................... 10505 9.6 468313 3.8 174738952 6.0
Lubuskie ......................................... 3157 2.9 232969 1.9 103434727 3.5
Łódzkie ........................................... 6475 5.9 351213 2.8 89497738 3.1
Małopolskie .................................... 7239 6.6 522660 4.2 38379924 1.3
Mazowieckie ................................... 12507 11.5 2528353 20.4 185389330 6.4
Opolskie .......................................... 3235 3.0 265036 2.1 87908588 3.0
Podkarpackie ................................... 9442 8.6 347502 2.8 75766584 2.6
Podlaskie ......................................... 5619 5.1 370714 3.0 125505780 4.3
Pomorskie ....................................... 5220 4.8 921708 7.4 141511741 4.9
Śląskie ............................................. 5951 5.4 726657 5.9 54920879 1.9
Świętokrzyskie ................................ 7333 6.7 315481 2.5 94426345 3.2
Warmińsko-Mazurskie .................... 5435 5.0 680563 5.5 966313342 33.1
Wielkopolskie ................................. 11052 10.1 2327871 18.8 193237935 6.6
Zachodniopomorskie ....................... 4862 4.4 687689 5.6 248710476 8.5
TABL. 86. TRANSAKCJE KUPNA/SPRZEDAŻY GRUNTÓW LEŚNYCH ORAZ ZADRZEWIONYCH
I ZAKRZEWIONYCH WEDŁUG WOJEWÓDZTW W 2012 R.
PURCHASE/SALE TRANSACTIONS OF FOREST LAND AS WELL AS WOODY AND BUSHY LAND BY
VOIVODSHIPS IN 2012
Wyszczególnienie
Specification
Liczba transakcji
Number of transactions
Wartość
Value
Powierzchnia
Area
w liczbach
bezwzględnych
in absolute
numbers
w %
in %
w tys. zł
in thous. zl
w %
in %
w m2
in m2
w %
in %
Polska ............................................. 2741 100.0 178698 100.0 24688985 100.0
Poland
Dolnośląskie .................................... 27 1.0 4739 2.7 598636 2.4
Kujawsko-Pomorskie ...................... 37 1.3 1302 0.7 313000 1.3
Lubelskie ......................................... 316 11.5 5374 3.0 3845241 15.6
Lubuskie ......................................... 201 7.3 23128 12.9 498700 2.0
Łódzkie ........................................... 189 6.9 7284 4.1 1239562 5.0
Małopolskie .................................... 265 9.7 5374 3.0 1851077 7.5
Mazowieckie ................................... 531 19.5 74837 41.9 5060915 20.5
Opolskie .......................................... 39 1.4 667 0.3 186763 0.8
Podkarpackie ................................... 280 10.2 3736 2.1 1592427 6.4
Podlaskie ......................................... 233 8.5 11301 6.3 3090800 12.5
Pomorskie ....................................... 116 4.2 11891 6.7 1523634 6.2
Śląskie ............................................. 177 6.5 9227 5.2 976778 4.0
Świętokrzyskie ................................ 107 3.9 4115 2.3 1056170 4.3
Warmińsko-Mazurskie .................... 64 2.3 3857 2.2 734163 3.0
Wielkopolskie ................................. 143 5.2 10226 5.7 1912302 7.7
Zachodniopomorskie ....................... 16 0.6 1640 0.9 208817 0.8

144
TABL. 87. TRANSAKCJE KUPNA/SPRZEDAŻY GRUNTÓW PRZEZNACZONYCH POD ZABUDOWĘ
MIESZKANIOWĄ WEDŁUG WOJEWÓDZTW I FORMY OBROTU W 2012 R.
PURCHASE/SALE TRANSACTIONS OF RESIDENTIAL LAND BY VOIVODSHIPS AND TURNOVER
FORM IN 2012
Wyszczególnienie
Specification
a – liczba transakcji
number of transactions
b – wartość w tys. zł
value in thous. zl
c – powierzchnia w m2
area in m2
Ogółem
Total
Forma obrotu
Turnover form
wolny rynek
free market
sprzedaż
bezprzetargowa
sale without
tender procedure
sprzedaż
przetargowa
sale under tender
procedure
Polska ...................................... a 5376 4733 209 434
Poland b 606383 542192 10618 53572
c 10791971 9765488 117781 908702
Dolnośląskie ............................. a 123 99 15 9
b 18144 15451 1852 842
c 146981 132244 6683 8054
Kujawsko-Pomorskie ............... a 71 60 x 10
b 3813 3342 x 461
c 111467 102240 x 8574
Lubelskie .................................. a 431 396 19 16
b 33499 28017 561 4921
c 777397 725941 4116 47340
Lubuskie .................................. a 118 54 18 46
b 12765 7848 1055 3862
c 351694 260186 16779 74729
Łódzkie .................................... a 528 478 20 30
b 50356 43905 253 6198
c 1144852 1099186 3276 42390
Małopolskie ............................. a 285 275 7 3
b 23531 22423 824 284
c 706740 682386 8655 15699
Mazowieckie ............................ a 1730 1647 40 43
b 251611 245490 1247 4874
c 3727927 3565489 23889 138549
Opolskie ................................... a 139 130 5 4
b 19242 18208 438 596
c 191763 180196 4257 7310
Podkarpackie ............................ a 225 166 13 46
b 22592 13809 401 8383
c 473613 234153 3385 236075
Podlaskie .................................. a 93 89 x 3
b 8196 8064 x 103
c 188266 185968 x 2118
Pomorskie ................................ a 128 102 8 18
b 11880 10489 209 1181
c 172298 136806 5737 29755
Śląskie ...................................... a 699 683 7 9
b 68552 67446 255 851
c 1327537 1308854 8170 10513
Świętokrzyskie ......................... a 86 73 – 13
b 6645 5805 – 840
c 91892 79302 – 12590
Warmińsko-Mazurskie ............. a 308 183 37 88
b 15554 9478 948 5129
c 533748 353375 12621 167752
Wielkopolskie .......................... a 394 292 18 84
b 59002 42115 2536 14351
c 823553 710276 19380 93897
Zachodniopomorskie ................ a 18 6 – 12
b 1000 303 – 697
c 22243 8886 – 13357

145
TABL. 88. TRANSAKCJE KUPNA/SPRZEDAŻY GRUNTÓW PRZEZNACZONYCH POD ZABUDOWĘ
PRZEMYSŁOWĄ WEDŁUG WOJEWÓDZTW I FORMY OBROTU W 2012 R.
PURCHASE/SALE TRANSACTIONS OF INDUSTRIAL LAND BY VOIVODSHIPS AND TURNOVER FORM
IN 2012
Wyszczególnienie
Specification
a – liczba transakcji
number of transactions
b – wartość w tys. zł
value in thous. zl
c – powierzchnia w m2
area in m2
Ogółem
Total
Forma obrotu
Turnover form
wolny rynek
free market
sprzedaż
bezprzetargowa
sale without
tender procedure
sprzedaż
przetargowa
sale under tender
procedure
Polska ...................................... a 308 230 29 49
Poland b 204442 183801 6502 14139
c 2575401 1994448 216818 364135
Dolnośląskie ............................. a 13 10 3 –
b 8493 6637 1856 –
c 242086 133616 108470 –
Kujawsko-Pomorskie ............... a 6 x x x
b 2031 x x x
c 13984 x x x
Lubelskie .................................. a 22 20 x x
b 10192 9693 x x
c 190806 181009 x x
Lubuskie .................................. a 5 5 – –
b 9965 9965 – –
c 160482 160482 – –
Łódzkie .................................... a 21 17 x x
b 13257 12617 x x
c 206476 189123 x x
Małopolskie ............................. a 18 15 x x
b 8955 4872 x x
c 115177 63522 x x
Mazowieckie ............................ a 74 58 8 8
b 34767 31289 967 2511
c 599826 404244 59732 135850
Opolskie ................................... a 35 22 3 10
b 80147 78388 41 1718
c 386136 303245 3760 79131
Podkarpackie ............................ a 19 17 x x
b 5039 4899 x x
c 57713 52919 x x
Podlaskie .................................. a – – – –
b – – – –
c – – – –
Pomorskie ................................ a x – x x
b x – x x
c x – x x
Śląskie ...................................... a 17 16 – x
b 6285 6256 – x
c 78140 77640 – x
Świętokrzyskie ......................... a 9 9 – –
b 1194 1194 – –
c 26301 26301 – –
Warmińsko-Mazurskie ............. a 18 9 x 7
b 1127 566 x 410
c 62922 38795 x 16371
Wielkopolskie .......................... a 49 30 5 14
b 22056 15474 2619 3963
c 428486 355791 16163 56532
Zachodniopomorskie ................ a – – – –
b – – – –
c – – – –

146
TABL. 89. TRANSAKCJE KUPNA/SPRZEDAŻY GRUNTÓW PRZEZNACZONYCH POD ZABUDOWĘ INNĄ
WEDŁUG WOJEWÓDZTW I FORMY OBROTU W 2012 R.
PURCHASE/SALE TRANSACTIONS OF OTHER BUILDING LAND BY VOIVODSHIPS AND TURNOVER
FORM IN 2012
Wyszczególnienie
Specification
a – liczba transakcji
number of transactions
b – wartość w tys. zł
value in thous. zl
c – powierzchnia w m2
area in m2
Ogółem
Total
Forma obrotu
Turnover form
wolny rynek
free market
sprzedaż
bezprzetargowa
sale without
tender procedure
sprzedaż
przetargowa
sale under tender
procedure
Polska ...................................... a 24181 19569 2037 2575
Poland b 5076452 4298544 199900 578008
c 86163284 70552419 6570604 9040261
Dolnośląskie ............................. a 2414 1683 294 437
b 560345 443455 12592 104298
c 8878655 7059322 547218 1272115
Kujawsko-Pomorskie ............... a 1298 1078 126 94
b 236411 208344 11318 16749
c 5159794 4486399 340404 332991
Lubelskie .................................. a 815 742 30 43
b 185734 163930 1019 20785
c 2851678 2714100 18432 119146
Lubuskie .................................. a 835 571 122 142
b 116477 87337 13199 15940
c 3383842 2252384 804411 327047
Łódzkie .................................... a 1432 1297 41 94
b 188958 175653 3157 10147
c 7156640 6915288 49288 192064
Małopolskie ............................. a 2489 2160 207 122
b 881218 824075 29057 28086
c 5847292 5281982 198655 366655
Mazowieckie ............................ a 2211 2009 74 128
b 584185 531510 6568 46107
c 7741907 7225360 198850 317697
Opolskie ................................... a 1056 709 137 210
b 126897 93027 11216 22654
c 2369658 1563478 168581 637599
Podkarpackie ............................ a 987 722 146 119
b 148800 128245 5659 14895
c 3519529 2553372 178013 788144
Podlaskie .................................. a 504 438 30 36
b 64903 52891 1069 10943
c 2072426 1931030 16070 125326
Pomorskie ................................ a 2012 1632 193 187
b 415945 360382 17351 38212
c 8674535 7660050 309174 705311
Śląskie ...................................... a 3199 2809 185 205
b 607722 513660 29001 65061
c 8520730 7222238 547663 750829
Świętokrzyskie ......................... a 434 398 15 21
b 113876 101792 1287 10797
c 2180579 2112643 24822 43114
Warmińsko-Mazurskie ............. a 1142 797 151 194
b 132659 98428 7861 26370
c 8513184 4495122 2677592 1340470
Wielkopolskie .......................... a 2145 1724 133 288
b 455803 315510 35563 104730
c 4922644 4146381 203259 573004
Zachodniopomorskie ................ a 1208 800 153 255
b 256521 200305 13983 42233
c 4370191 2933270 288172 1148749

147
TABL. 90. TRANSAKCJE KUPNA/SPRZEDAŻY UŻYTKÓW ROLNYCH WEDŁUG WOJEWÓDZTW I FORMY
OBROTU W 2012 R.
PURCHASE/SALE TRANSACTIONS OF AGRICULTURAL LAND BY VOIVODSHIPS AND TURNOVER
FORM IN 2012
Wyszczególnienie
Specification
a – liczba transakcji
number of transactions
b – wartość w tys. zł
value in thous. zl
c – powierzchnia w m2
area in m2
Ogółem
Total
Forma obrotu
Turnover form
wolny rynek
free market
sprzedaż
bezprzetargowa
sale without
tender procedure
sprzedaż
przetargowa
sale under tender
procedure
Polska ...................................... a 109455 93887 4672 10896
Poland b 12389404 10196762 760961 1431681
c 2916803199 2229697023 327181599 359924577
Dolnośląskie ............................. a 6149 4830 410 909
b 1072706 765105 55432 252168
c 194759310 117922486 24280688 52556136
Kujawsko-Pomorskie ............... a 5274 4544 412 318
b 569968 459396 71198 39374
c 142301548 112649038 18122062 11530448
Lubelskie .................................. a 10505 9773 177 555
b 468313 431842 16536 19936
c 174738952 150984319 11257196 12497437
Lubuskie .................................. a 3157 2243 325 589
b 232969 161986 32235 38748
c 103434727 58499211 23498319 21437197
Łódzkie .................................... a 6475 5995 129 351
b 351213 331221 2331 17661
c 89497738 84053267 1040298 4404173
Małopolskie ............................. a 7239 6809 277 153
b 522660 494359 17771 10531
c 38379924 36434392 1264840 680692
Mazowieckie ............................ a 12507 11616 201 690
b 2528353 2384827 18507 125019
c 185389330 171352968 6062671 7973691
Opolskie ................................... a 3235 2599 214 422
b 265036 186498 47215 31322
c 87908588 55598027 20288388 12022173
Podkarpackie ............................ a 9442 7640 310 1492
b 347502 291670 18146 37686
c 75766584 54047736 6546059 15172789
Podlaskie .................................. a 5619 5176 169 274
b 370714 340795 13706 16214
c 125505780 113331710 7025168 5148902
Pomorskie ................................ a 5220 4202 392 626
b 921708 720286 115444 85979
c 141511741 75048123 40518564 25945054
Śląskie ...................................... a 5951 5330 302 319
b 726657 653169 29380 44108
c 54920879 43364577 7298219 4258083
Świętokrzyskie ......................... a 7333 6987 33 313
b 315481 308834 1560 5088
c 94426345 90417098 881833 3127414
Warmińsko-Mazurskie ............. a 5435 3979 408 1048
b 680563 438629 103956 137978
c 966313342 839405960 76032949 50874433
Wielkopolskie .......................... a 11052 8853 503 1696
b 2327871 1842627 120065 365179
c 193237935 128515514 31052163 33670258
Zachodniopomorskie ................ a 4862 3311 410 1141
b 687689 385518 97481 204691
c 248710476 98072597 52012182 98625697

148
TABL. 91. TRANSAKCJE KUPNA/SPRZEDAŻY GRUNTÓW LEŚNYCH ORAZ ZADRZEWIONYCH
I ZAKRZEWIONYCH WEDŁUG WOJEWÓDZTW I FORMY OBROTU W 2012 R.
PURCHASE/SALE TRANSACTIONS OF FOREST LAND AS WELL AS WOODY AND BUSHY LAND BY
VOIVODSHIPS AND TURNOVER FORM IN 2012
Wyszczególnienie
Specification
a – liczba transakcji
number of transactions
b – wartość w tys. zł
value in thous. zl
c – powierzchnia w m2
area in m2
Ogółem
Total
Forma obrotu
Turnover form
wolny rynek
free market
sprzedaż
bezprzetargowa
sale without
tender procedure
sprzedaż
przetargowa
sale under tender
procedure
Polska ...................................... a 2741 2324 133 284
Poland b 178698 138059 9607 31032
c 24688985 22183647 524695 1980643
Dolnośląskie ............................. a 27 17 5 5
b 4739 1406 698 2635
c 598636 327717 4259 266660
Kujawsko-Pomorskie ............... a 37 29 6 x
b 1302 1114 142 x
c 313000 276600 32868 x
Lubelskie .................................. a 316 307 x 7
b 5374 5280 x 80
c 3845241 3800479 x 29662
Lubuskie .................................. a 201 129 59 13
b 23128 15591 5626 1911
c 498700 276849 96242 125609
Łódzkie .................................... a 189 180 x 7
b 7284 7127 x 146
c 1239562 1204547 x 18471
Małopolskie ............................. a 265 257 7 x
b 5374 5141 117 x
c 1851077 1818178 30525 x
Mazowieckie ............................ a 531 489 14 28
b 74837 55641 623 18573
c 5060915 4778621 71304 210990
Opolskie ................................... a 39 14 3 22
b 667 392 56 220
c 186763 101507 22347 62909
Podkarpackie ............................ a 280 157 7 116
b 3736 2858 101 776
c 1592427 1079308 33119 480000
Podlaskie .................................. a 233 221 3 9
b 11301 11146 12 144
c 3090800 2972580 3546 114674
Pomorskie ................................ a 116 93 7 16
b 11891 8295 476 3119
c 1523634 1308123 148557 66954
Śląskie ...................................... a 177 165 10 x
b 9227 8884 187 x
c 976778 956464 18236 x
Świętokrzyskie ......................... a 107 100 x 6
b 4115 4094 x 19
c 1056170 1035091 x 19200
Warmińsko-Mazurskie ............. a 64 48 x 15
b 3857 3263 x 587
c 734163 611652 x 122336
Wielkopolskie .......................... a 143 110 6 27
b 10226 6423 1535 2268
c 1912302 1510345 29994 371963
Zachodniopomorskie ................ a 16 8 – 8
b 1640 1403 – 236
c 208817 125586 – 83231

149
TABL. 92. TRANSAKCJE KUPNA/SPRZEDAŻY GRUNTÓW PRZEZNACZONYCH POD ZABUDOWĘ
MIESZKANIOWĄ WEDŁUG WOJEWÓDZTW I LOKALIZACJI W 2012 R.
PURCHASE/SALE TRANSACTIONS OF RESIDENTIAL LAND BY VOIVODSHIPS AND LOCATION IN 2012
Wyszczególnienie
Specification
a – liczba transakcji
number of transactions
b – wartość w tys. zł
value in thous. zl
c – powierzchnia w m2
area in m2
Ogółem
Total
Lokalizacja Location
w granicach miast urban areas
poza
granicami
miast
rural areas
ogółem
total
w tym miasta na prawach powiatu
of which cities with powiat status
ogółem
total
powyżej
200 tys.
ludności
more than
200 thous.
inhabitants
poniżej 200
tys.
ludności
less than
200 thous.
inhabitants
Polska ...................................... a 5376 2072 453 75 378 3304
Poland b 606383 303220 69891 13161 56730 303162
c 10791971 3146119 957695 78818 878877 7645852
Dolnośląskie ............................. a 123 79 49 49 – 44
b 18144 15210 11505 11505 – 2933
c 146981 88568 60150 60150 – 58413
Kujawsko-Pomorskie ............... a 71 43 8 – 8 28
b 3813 2924 1099 – 1099 888
c 111467 72523 6816 – 6816 38944
Lubelskie .................................. a 431 278 101 – 101 153
b 33499 23891 11851 – 11851 9608
c 777397 366420 141069 – 141069 410977
Lubuskie .................................. a 118 80 27 – 27 38
b 12765 11199 6921 – 6921 1566
c 351694 284739 225032 – 225032 66955
Łódzkie .................................... a 528 157 9 – 9 371
b 50356 19174 2052 – 2052 31181
c 1144852 195026 9766 – 9766 949826
Małopolskie ............................. a 285 73 45 – 45 212
b 23531 11811 8872 – 8872 11720
c 706740 272019 237398 – 237398 434721
Mazowieckie ............................ a 1730 523 101 26 75 1207
b 251611 120283 11779 1656 10123 131328
c 3727927 670893 112501 18668 93833 3057034
Opolskie ................................... a 139 54 – – – 85
b 19242 9437 – – – 9806
c 191763 44593 – – – 147170
Podkarpackie ............................ a 225 97 55 – 55 128
b 22592 14433 4789 – 4789 8159
c 473613 280604 75242 – 75242 193009
Podlaskie .................................. a 93 35 – – – 58
b 8196 2557 – – – 5639
c 188266 55867 – – – 132399
Pomorskie ................................ a 128 46 – – – 82
b 11880 4717 – – – 7162
c 172298 42666 – – – 129632
Śląskie ...................................... a 699 201 58 – 58 498
b 68552 26364 11022 – 11022 42188
c 1327537 322352 89721 – 89721 1005185
Świętokrzyskie ......................... a 86 73 – – – 13
b 6645 6215 – – – 430
c 91892 73246 – – – 18646
Warmińsko-Mazurskie ............. a 308 145 – – – 163
b 15554 8247 – – – 7307
c 533748 213545 – – – 320203
Wielkopolskie .......................... a 394 171 – – – 223
b 59002 25783 – – – 33219
c 823553 141781 – – – 681772
Zachodniopomorskie ................ a 18 17 – – – x
b 1000 973 – – – x
c 22243 21277 – – – x

150
TABL. 93. TRANSAKCJE KUPNA/SPRZEDAŻY GRUNTÓW PRZEZNACZONYCH POD ZABUDOWĘ
PRZEMYSŁOWĄ WEDŁUG WOJEWÓDZTW I LOKALIZACJI W 2012 R.
PURCHASE/SALE TRANSACTIONS OF INDUSTRIAL LAND BY VOIVODSHIPS AND LOCATION IN 2012
Wyszczególnienie
Specification
a – liczba transakcji
number of transactions
b – wartość w tys. zł
value in thous. zl
c – powierzchnia w m2
area in m2
Ogółem
Total
Lokalizacja Location
w granicach miast urban areas
poza
granicami
miast
rural areas
ogółem
total
w tym miasta na prawach powiatu
of which cities with powiat status
ogółem
total
powyżej
200 tys.
ludności
more than
200 thous.
inhabitants
poniżej 200
tys.
ludności
less than
200 thous.
inhabitants
Polska ...................................... a 308 197 43 8 35 111
Poland b 204442 168904 36042 5506 30536 35538
c 2575401 1479053 420013 23484 396529 1096348
Dolnośląskie ............................. a 13 8 6 6 – 5
b 8493 5932 5412 5412 – 2561
c 242086 43818 22144 22144 – 198268
Kujawsko-Pomorskie ............... a 6 6 x – x –
b 2031 2031 x – x –
c 13984 13984 x – x –
Lubelskie .................................. a 22 18 5 – 5 4
b 10192 9799 610 – 610 393
c 190806 170850 11882 – 11882 19956
Lubuskie .................................. a 5 5 4 – 4 –
b 9965 9965 9923 – 9923 –
c 160482 160482 159309 – 159309 –
Łódzkie .................................... a 21 12 – – – 9
b 13257 8916 – – – 4341
c 206476 122444 – – – 84032
Małopolskie ............................. a 18 13 9 – 9 5
b 8955 8833 5742 – 5742 122
c 115177 97342 60006 – 60006 17835
Mazowieckie ............................ a 74 46 11 x 9 28
b 34767 18746 10627 x 10533 16021
c 599826 240697 113232 x 111892 359129
Opolskie ................................... a 35 24 – – – 11
b 80147 78184 – – – 1963
c 386136 312033 – – – 74103
Podkarpackie ............................ a 19 14 3 – 3 5
b 5039 3963 315 – 315 1076
c 57713 42052 8867 – 8867 15661
Podlaskie .................................. a – – – – – –
b – – – – – –
c – – – – – –
Pomorskie ................................ a x x – – – –
b x x – – – –
c x x – – – –
Śląskie ...................................... a 17 12 3 – 3 5
b 6285 4247 1445 – 1445 2038
c 78140 61594 37027 – 37027 16546
Świętokrzyskie ......................... a 9 8 – – – x
b 1194 994 – – – x
c 26301 19201 – – – x
Warmińsko-Mazurskie ............. a 18 4 – – – 14
b 1127 436 – – – 691
c 62922 11366 – – – 51556
Wielkopolskie .......................... a 49 25 – – – 24
b 22056 15926 – – – 6130
c 428486 176324 – – – 252162
Zachodniopomorskie ................ a – – – – – –
b – – – – – –
c – – – – – –

151
TABL. 94. TRANSAKCJE KUPNA/SPRZEDAŻY GRUNTÓW PRZEZNACZONYCH POD ZABUDOWĘ INNĄ
WEDŁUG WOJEWÓDZTW I LOKALIZACJI W 2012 R.
PURCHASE/SALE TRANSACTIONS OF OTHER BUILDING LAND BY VOIVODSHIPS AND LOCATION IN 2012
Wyszczególnienie
Specification
a – liczba transakcji
number of transactions
b – wartość w tys. zł
value in thous. zl
c – powierzchnia w m2
area in m2
Ogółem
Total
Lokalizacja Location
w granicach miast urban areas
poza
granicami
miast
rural areas
ogółem
total
w tym miasta na prawach powiatu
of which cities with powiat status
ogółem
total
powyżej
200 tys.
ludności
more than
200 thous.
inhabitants
poniżej 200
tys.
ludności
less than
200 thous.
inhabitants
Polska ...................................... a 24181 11217 5223 2458 2765 12964
Poland b 5076452 3399477 2376931 1609512 767419 1676975
c 86163284 27120388 14791758 8057266 6734492 59042896
Dolnośląskie ............................. a 2414 1039 265 124 141 1375
b 560345 307454 177783 144651 33132 252892
c 8878655 2453280 666209 194523 471686 6425375
Kujawsko-Pomorskie ............... a 1298 509 259 168 91 789
b 236411 174880 110034 99444 10590 61531
c 5159794 1281501 695305 456656 238649 3878293
Lubelskie .................................. a 815 431 233 159 74 384
b 185734 168002 145904 124913 20990 17732
c 2851678 1139874 881042 735069 145973 1711804
Lubuskie .................................. a 835 483 207 – 207 352
b 116477 95913 50337 – 50337 20564
c 3383842 1116010 564482 – 564482 2267832
Łódzkie .................................... a 1432 600 180 72 108 832
b 188958 119293 55228 20638 34590 69664
c 7156640 1349764 487156 185812 301344 5806876
Małopolskie ............................. a 2489 1122 727 674 53 1367
b 881218 696696 625132 612674 12459 184522
c 5847292 2465443 1468194 1238858 229336 3381849
Mazowieckie ............................ a 2211 583 158 18 140 1628
b 584185 165927 45996 2246 43750 418258
c 7741907 1218126 459130 12551 446579 6523781
Opolskie ................................... a 1056 471 122 – 122 585
b 126897 69458 38918 – 38918 57439
c 2369658 890630 288006 – 288006 1479028
Podkarpackie ............................ a 987 464 164 – 164 523
b 148800 102161 49511 – 49511 46638
c 3519529 1121570 362335 – 362335 2397959
Podlaskie .................................. a 504 268 105 22 83 236
b 64903 47068 27870 13844 14026 17835
c 2072426 488863 154250 25883 128367 1583563
Pomorskie ................................ a 2012 870 477 423 54 1142
b 415945 307759 245259 216587 28671 108186
c 8674535 3816452 3273645 3207360 66285 4858083
Śląskie ...................................... a 3199 2085 1396 200 1196 1114
b 607722 521384 407894 54029 353865 86337
c 8520730 5307306 3594829 730503 2864326 3213424
Świętokrzyskie ......................... a 434 208 111 111 – 226
b 113876 88049 47633 47633 – 25828
c 2180579 474291 199943 199943 – 1706288
Warmińsko-Mazurskie ............. a 1142 481 133 – 133 661
b 132659 75674 36986 – 36986 56985
c 8513184 884241 229015 – 229015 7628943
Wielkopolskie .......................... a 2145 962 428 296 132 1183
b 455803 324673 232820 206634 26185 131130
c 4922644 1625906 767394 497843 269551 3296738
Zachodniopomorskie ................ a 1208 641 258 191 67 567
b 256521 135087 79627 66219 13409 121434
c 4370191 1487131 700823 572265 128558 2883060

152
TABL. 95. TRANSAKCJE KUPNA/SPRZEDAŻY UŻYTKÓW ROLNYCH WEDŁUG WOJEWÓDZTW
I LOKALIZACJI W 2012 R.
PURCHASE/SALE TRANSACTIONS OF AGRICULTURAL LAND BY VOIVODSHIPS AND LOCATION IN 2012
Wyszczególnienie
Specification
a – liczba transakcji
number of transactions
b – wartość w tys. zł
value in thous. zl
c – powierzchnia w m2
area in m2
Ogółem
Total
Lokalizacja Location
w granicach miast urban areas
poza
granicami
miast
rural areas
ogółem
total
w tym miasta na prawach powiatu
of which cities with powiat status
ogółem
total
powyżej
200 tys.
ludności
more than
200 thous.
inhabitants
poniżej 200
tys. ludności
less than
200 thous.
inhabitants
Polska ................................... a 109455 14000 4172 2187 1985 95455
Poland b 12389404 3568387 2420325 2043018 377307 8821017
c 2916803199 79377879 17888358 8643859 9244499 2837425320
Dolnośląskie .......................... a 6149 952 252 235 17 5197
b 1072706 305682 205363 204260 1103 767024
c 194759310 10868403 1305997 1025424 280573 183890907
Kujawsko-Pomorskie ............ a 5274 444 106 92 14 4830
b 569968 51246 32456 31672 784 518723
c 142301548 1256802 276440 259447 16993 141044746
Lubelskie ............................... a 10505 597 35 25 10 9908
b 468313 41532 8244 7650 594 426781
c 174738952 4330603 203563 138783 64780 170408349
Lubuskie ............................... a 3157 271 24 – 24 2886
b 232969 24956 2927 – 2927 208013
c 103434727 1497898 199500 – 199500 101936829
Łódzkie ................................. a 6475 681 204 143 61 5794
b 351213 94109 46415 39884 6531 257105
c 89497738 3490204 905239 685984 219255 86007534
Małopolskie .......................... a 7239 1292 389 234 155 5947
b 522660 210602 128097 107417 20680 312058
c 38379924 4760984 1008319 677143 331176 33618940
Mazowieckie ......................... a 12507 1635 844 830 14 10872
b 2528353 1564500 1298496 1297784 712 963853
c 185389330 6469549 2548444 2354719 193725 178919781
Opolskie ................................ a 3235 339 21 – 21 2896
b 265036 21283 1887 – 1887 243753
c 87908588 2777224 107566 – 107566 85131364
Podkarpackie ......................... a 9442 1547 496 – 496 7895
b 347502 138298 71911 – 71911 209203
c 75766584 4904286 1221005 – 1221005 70862298
Podlaskie ............................... a 5619 508 149 120 29 5111
b 370714 71622 38049 34158 3891 299092
c 125505780 5030833 404318 206510 197808 120474947
Pomorskie ............................. a 5220 609 191 166 25 4611
b 921708 289910 219123 194626 24497 631798
c 141511741 3710538 2308996 1462377 846619 137801203
Śląskie ................................... a 5951 2413 1123 210 913 3538
b 726657 415335 251186 53074 198111 311321
c 54920879 16690569 5038192 738321 4299871 38230310
Świętokrzyskie ...................... a 7333 703 64 64 – 6630
b 315481 51979 15465 15465 – 263502
c 94426345 3894411 223540 223540 – 90531934
Warmińsko-Mazurskie .......... a 5435 192 16 – 16 5243
b 680563 24347 3270 – 3270 656217
c 966313342 1046485 40848 – 40848 965266857
Wielkopolskie ....................... a 11052 1238 178 54 124 9814
b 2327871 204767 72496 52362 20133 2123104
c 193237935 4903325 880390 533109 347281 188334610
Zachodniopomorskie ............. a 4862 579 80 14 66 4283
b 687689 58219 24941 4666 20275 629470
c 248710476 3745765 1216001 338502 877499 244964711

153
TABL. 96. TRANSAKCJE KUPNA/SPRZEDAŻY GRUNTÓW LEŚNYCH ORAZ ZADRZEWIONYCH
I ZAKRZEWIONYCH WEDŁUG WOJEWÓDZTW I LOKALIZACJI W 2012 R.
PURCHASE/SALE TRANSACTIONS OF FOREST LAND AS WELL AS WOODY AS BUSHY LAND BY
VOIVODSHIPS AND LOCATION IN 2012
Wyszczególnienie
Specification
a – liczba transakcji
number of transactions
b – wartość w tys. zł
value in thous. zl
c – powierzchnia w m2
area in m2
Ogółem
Total
Lokalizacja Location
w granicach miast urban areas
poza
granicami
miast
rural areas
ogółem
total
w tym miasta na prawach powiatu
of which cities with powiat status
ogółem
total
powyżej 200
tys. ludności
more than
200 thous.
inhabitants
poniżej 200
tys. ludności
less than 200
thous.
inhabitants
Polska ................................... a 2741 390 40 12 28 2351
Poland b 178698 53102 10357 2149 8208 125596
c 24688985 1539661 197752 28889 168863 23149324
Dolnośląskie .......................... a 27 7 – – – 20
b 4739 869 – – – 3870
c 598636 10668 – – – 587968
Kujawsko-Pomorskie ............ a 37 x x x – 35
b 1302 x x x – 996
c 313000 x x x – 310881
Lubelskie ............................... a 316 16 7 x 6 300
b 5374 326 176 x 112 5048
c 3845241 186987 78657 x 77038 3658254
Lubuskie ............................... a 201 168 5 – 5 33
b 23128 21416 6005 – 6005 1712
c 498700 290786 42909 – 42909 207914
Łódzkie ................................. a 189 15 x x – 174
b 7284 825 x x – 6459
c 1239562 29536 x x – 1210026
Małopolskie .......................... a 265 24 x x – 241
b 5374 972 x x – 4401
c 1851077 216810 x x – 1634267
Mazowieckie ......................... a 531 48 4 3 x 483
b 74837 12807 975 255 x 62030
c 5060915 227174 30446 5184 x 4833741
Opolskie ................................ a 39 – – – – 39
b 667 – – – – 667
c 186763 – – – – 186763
Podkarpackie ......................... a 280 13 x – x 267
b 3736 949 x – x 2787
c 1592427 31992 x – x 1560435
Podlaskie ............................... a 233 16 x x – 217
b 11301 1735 x x – 9567
c 3090800 149669 x x – 2941131
Pomorskie ............................. a 116 14 3 x x 102
b 11891 7537 79 x x 4353
c 1523634 26825 3306 x x 1496809
Śląskie ................................... a 177 39 10 x 8 138
b 9227 3097 1565 x 300 6130
c 976778 192612 22547 x 14703 784166
Świętokrzyskie ...................... a 107 10 x x – 97
b 4115 188 x x – 3927
c 1056170 98996 x x – 957174
Warmińsko-Mazurskie .......... a 64 5 4 – 4 59
b 3857 1182 1010 – 1010 2675
c 734163 9781 5442 – 5442 724382
Wielkopolskie ....................... a 143 12 x – x 131
b 10226 852 x – x 9374
c 1912302 62131 x – x 1850171
Zachodniopomorskie ............. a 16 x – – – 15
b 1640 x – – – 1600
c 208817 x – – – 205242

154
TABL. 97. TRANSAKCJE KUPNA/SPRZEDAŻY GRUNTÓW PRZEZNACZONYCH POD ZABUDOWĘ
MIESZKANIOWĄ W POWIATACH O NAJWIĘKSZEJ LICZBIE TRANSAKCJI W 2012 R.
PURCHASE/SALE TRANSACTIONS OF RESIDENTIAL LAND IN POWIATS WITH THE LARGEST
NUMBER OF TRANSACTIONS IN 2012
Wyszczególnienie
Specification
Liczba transakcji
Number of transactions
Wartość w tys. zł
Value in thous. zl
Powierzchnia w m2
Area in m2
Polska .......................................... 5376 606383 10791971
Poland
w tym:
of which:
Powiat cieszyński .......................... 291 22833 560223
Powiat bielski13
............................. 244 21592 504927
Powiat wadowicki ......................... 214 12438 433214
Powiat ostrołęcki ........................... 199 6057 422825
Powiat płocki ................................ 168 12898 249944
Powiat otwocki ............................. 163 49399 245342
Powiat pabianicki .......................... 160 21269 432642
Powiat rzeszowski ......................... 135 15587 355427
Powiat ciechanowski ..................... 132 7556 157104
Powiat łódzki wschodni ................ 131 14414 224506
Powiat pruszkowski ...................... 125 75374 456381
Powiat wyszkowski ....................... 116 9015 169579
Powiat żyrardowski ....................... 109 12800 192177
Powiat mikołowski ....................... 97 12032 161283
Powiat makowski .......................... 91 2829 587648
Powiat kędzierzyńsko-kozielski .... 91 11488 137656
Powiat legionowski ....................... 87 21903 282546
Powiat piotrkowski ....................... 80 4120 167833
Powiat mławski ............................. 75 2393 135209
Powiat człuchowski ...................... 72 3579 117666
Powiat grodziski14
......................... 67 16397 150862
Powiat koniński ............................. 66 5098 209993
Powiat m. Płock ............................ 64 8787 81082
Powiat tomaszowski15
................... 63 3323 154031
Powiat nowosolski ........................ 61 3716 66645
Powiat białostocki ......................... 58 6136 130297
Powiat czarnkowsko-trzcianecki ... 58 8873 98119
Powiat wejherowski ...................... 56 8301 54632
Powiat piski................................... 56 3483 105451
Powiat wągrowiecki ...................... 56 3764 73349
13 in Śląskie Voivodship 14 in Mazowieckie Voivodship 15 in Lubelskie Voivodship

155
TABL. 98. TRANSAKCJE KUPNA/SPRZEDAŻY GRUNTÓW PRZEZNACZONYCH POD ZABUDOWĘ
PRZEMYSŁOWĄ W POWIATACH O NAJWIĘKSZEJ LICZBIE TRANSAKCJI W 2012 R.
PURCHASE/SALE TRANSACTIONS OF INDUSTRIAL LAND IN POWIATS WITH THE LARGEST
NUMBER OF TRANSACTIONS IN 2012
Wyszczególnienie
Specification
Liczba transakcji
Number of transactions
Wartość w tys. zł
Value in thous. zl
Powierzchnia w m2
Area in m2
Polska .......................................... 308 204442 2575401
Poland
w tym:
of which:
Powiat wyszkowski ....................... 18 4904 81782
Powiat kędzierzyńsko-kozielski .... 16 33129 78665
Powiat opolski16
............................ 12 619 84460
Powiat wadowicki ......................... 9 3214 55171
Powiat m. Tarnów ......................... 9 5742 60006
Powiat m. Płock ............................ 9 10533 111892
Powiat lubartowski ....................... 8 8957 145972
Powiat szamotulski ....................... 8 1880 26394
Powiat łódzki wschodni ................ 7 2282 55436
Powiat pabianicki .......................... 7 8895 82635
Powiat przasnyski ......................... 7 1441 109298
Powiat krapkowicki ...................... 7 46399 223011
Powiat mielecki ............................. 7 2588 16449
Powiat kępiński ............................. 7 3752 38302
Powiat m. Wrocław ....................... 6 5412 22144
Powiat cieszyński .......................... 6 900 16115
Powiat wrzesiński ......................... 6 3029 22460
Powiat legnicki ............................. 5 2561 198268
Powiat miński ............................... 5 1236 20341
Powiat pruszkowski ...................... 5 10676 46400
Powiat rzeszowski ......................... 5 1076 15661
Powiat bielski17
............................. 5 2021 17929
Powiat ełcki................................... 5 227 12563
Powiat czarnkowsko-trzcianecki ... 5 7152 84733
Powiat m. Gorzów Wlkp. .............. 4 9923 159309
Powiat rawski ................................ 4 1357 39963
Powiat ciechanowski ..................... 4 370 32308
Powiat mławski ............................. 4 649 101307
Powiat stalowowolski ................... 4 1060 16736
Powiat skarżyski ........................... 4 881 9904
Powiat giżycki............................... 4 295 6132
Powiat poznański .......................... 4 169 665
Powiat śremski .............................. 4 789 97243
16 in Opolskie Voivodship 17 in Śląskie Voivodship

156
TABL. 99. TRANSAKCJE KUPNA/SPRZEDAŻY GRUNTÓW PRZEZNACZONYCH POD ZABUDOWĘ INNĄ
W POWIATACH O NAJWIĘKSZEJ LICZBIE TRANSAKCJI W 2012 R.
PURCHASE/SALE TRANSACTIONS OF OTHER BUILDING LAND IN POWIATS WITH THE LARGEST
NUMBER OF TRANSACTIONS IN 2012
Wyszczególnienie
Specification
Liczba transakcji
Number of transactions
Wartość w tys. zł
Value in thous. zl
Powierzchnia w m2
Area in m2
Polska .......................................... 24181 5076452 86163284
Poland
w tym:
of which:
Powiat wrocławski ........................ 696 182624 2602466
Powiat m. Kraków ........................ 674 612674 1238858
Powiat krakowski .......................... 415 118381 1128524
Powiat kartuski ............................. 400 45629 828138
Powiat warszawski zachodni ........ 377 161089 657165
Powiat żywiecki ............................ 368 38788 593359
Powiat m. Gdynia ......................... 354 131617 2831425
Powiat opolski18
............................ 353 39083 813651
Powiat m. Poznań ......................... 296 206634 497843
Powiat bielski19
............................. 290 26173 863343
Powiat poznański .......................... 267 78204 310009
Powiat ostródzki ........................... 259 24781 1114585
Powiat m. Bielsko-Biała ............... 252 77375 714563
Powiat dębicki............................... 250 16121 1029693
Powiat toruński ............................. 238 16820 588577
Powiat legionowski ....................... 238 44014 921572
Powiat pułtuski ............................. 222 12793 849214
Powiat będziński ........................... 216 24991 664219
Powiat legnicki ............................. 204 23672 626960
Powiat starogardzki ....................... 202 12174 677937
Powiat limanowski ........................ 201 8268 356432
Powiat stargardzki ......................... 194 26171 998123
Powiat m. Szczecin ....................... 191 66219 572265
Powiat zielonogórski ..................... 190 11356 472140
Powiat rzeszowski ......................... 190 31124 390415
Powiat słupski ............................... 186 15702 912884
Powiat chrzanowski ...................... 183 9136 380160
Powiat wolsztyński ....................... 181 8369 335809
Powiat m. Żory ............................. 180 35628 386025
Powiat ostrowski20
........................ 173 22446 363561
18 in Opolskie Voivodship 19 in Śląskie Voivodship 20 in Wielkopolskie Voivodship

157
TABL. 100. TRANSAKCJE KUPNA/SPRZEDAŻY UŻYTKÓW ROLNYCH W POWIATACH O NAJWIĘKSZEJ
LICZBIE TRANSAKCJI W 2012 R.
PURCHASE/SALE TRANSACTIONS OF AGRICULTURAL LAND IN POWIATS WITH THE LARGEST
NUMBER OF TRANSACTIONS IN 2012
Wyszczególnienie
Specification
Liczba transakcji
Number of transactions
Wartość w tys. zł
Value in thous. zl
Powierzchnia w m2
Area in m2
Polska .......................................... 109455 12389404 2916803199
Poland
w tym:
of which:
Powiat poznański .......................... 2942 1529018 27962941
Powiat jędrzejowski ...................... 2222 74228 29887911
Powiat lubelski .............................. 1240 109789 11136047
Powiat białostocki ......................... 1165 95160 18860720
Powiat rzeszowski ......................... 1037 38438 5119481
Powiat olsztyński .......................... 969 117617 29166482
Powiat chełmski ............................ 962 44487 28492117
Powiat krakowski .......................... 959 100450 3943026
Powiat zamojski ............................ 945 63920 18055246
Powiat jarosławski ........................ 940 27481 9346685
Powiat miński ............................... 872 71325 7832040
Powiat opatowski .......................... 832 33017 14104735
Powiat m. st. Warszawa ................ 758 1290690 2191739
Powiat kielecki .............................. 753 51054 6076877
Powiat krasnostawski .................... 717 13637 9694441
Powiat przemyski .......................... 714 20745 10234502
Powiat płoński............................... 700 54713 11464718
Powiat płocki ................................ 694 65780 26226374
Powiat nowosądecki...................... 688 39199 3746616
Powiat częstochowski ................... 685 55750 7357397
Powiat przeworski ......................... 679 11784 5418853
Powiat hajnowski .......................... 670 38208 17475827
Powiat koniński ............................. 664 36349 8707558
Powiat hrubieszowski ................... 660 48233 21706953
Powiat łukowski ............................ 658 16409 7945108
Powiat kazimierski ........................ 657 63959 12060735
Powiat ostrołęcki ........................... 624 24198 8900919
Powiat włocławski ........................ 622 37302 10736088
Powiat sieradzki ............................ 620 25928 9459253
Powiat krośnieński21
..................... 603 13147 4963140
21 in Podkarpackie Voivodship

158
TABL. 101. TRANSAKCJE KUPNA/SPRZEDAŻY GRUNTÓW LEŚNYCH ORAZ ZADRZEWIONYCH
I ZAKRZEWIONYCH W POWIATACH O NAJWIĘKSZEJ LICZBIE TRANSAKCJI W 2012 R.
PURCHASE/SALE TRANSACTIONS OF FOREST LAND AS WELL AS WOODY AND BUSHY LAND IN
POWIATS WITH THE LARGEST NUMBER OF TRANSACTIONS IN 2012
Wyszczególnienie
Specification
Liczba transakcji
Number of transactions
Wartość w tys. zł
Value in thous. zl
Powierzchnia w m2
Area in m2
Polska .......................................... 2741 178698 24688985
Poland
w tym:
of which:
Powiat żagański ............................ 167 15937 264742
Powiat białostocki ......................... 64 6194 1050353
Powiat strzyżowski ....................... 55 574 269465
Powiat biłgorajski ......................... 54 551 719941
Powiat ostrołęcki ........................... 54 24146 958127
Powiat garwoliński ....................... 46 2963 238060
Powiat miński ............................... 45 3834 310238
Powiat częstochowski ................... 44 3612 146691
Powiat limanowski ........................ 41 763 291036
Powiat poznański .......................... 38 4238 343464
Powiat sokołowski ........................ 37 325 292443
Powiat nowotarski ......................... 36 457 264247
Powiat płoński............................... 35 1863 301557
Powiat kartuski ............................. 35 1030 166160
Powiat rzeszowski ......................... 34 250 117347
Powiat żywiecki ............................ 34 343 207937
Powiat tarnowski ........................... 33 595 181502
Powiat lubaczowski ...................... 33 312 271424
Powiat pajęczański ........................ 32 570 136597
Powiat janowski ............................ 31 211 367807
Powiat zamojski ............................ 31 338 328313
Powiat makowski .......................... 29 557 440797
Powiat leżajski .............................. 29 159 151656
Powiat lubelski .............................. 28 811 410090
Powiat zgierski .............................. 27 2290 72165
Powiat nowosądecki...................... 27 865 150732
Powiat parczewski ........................ 26 1164 527372
Powiat łukowski ............................ 25 191 255435
Powiat wysokomazowiecki ........... 25 210 185137
Powiat warszawski zachodni ........ 24 23655 135632

159
TABL. 102. MIARY ŚREDNIE DLA TRANSAKCJI KUPNA/SPRZEDAŻY NIERUCHOMOŚCI GRUNTOWYCH
WEDŁUG LOKALIZACJI W 2012 R.
AVERAGE MEASURES FOR PURCHASE/SALE TRANSACTIONS OF LAND PROPERTIES BY LOCATION IN 2012
Wyszczególnienie
Specification
Ogółem
Total
Lokalizacja
Location
w granicach miast
urban areas
poza granicami miast
rural areas ogółem
total
w tym miasta na
prawach powiatu
of which cities with
powiat status
Średnia powierzchnia ewidencyjna sprzedana w pojedynczej transakcji w m2
Average area sold in single transaction in m2
Grunty przeznaczone pod zabudowę
mieszkaniową ...................... 2007.4 1518.4 2114.1 2314.1
Residential land
Grunty przeznaczone pod zabudowę
przemysłową ........................ 8361.7 7507.9 9767.7 9877.0
Industrial land
Grunty przeznaczone pod zabudowę inną 3563.3 2417.8 2832.0 4554.4
Other building land
Użytki rolne .............................. 26648.4 5669.8 4287.7 29725.3
Agricultural land
Grunty leśne oraz zadrzewione i
zakrzewione ......................... 9007.3 3947.8 4943.8 9846.6
Forest land as well as woody and bushy
land
Średnia wartość pojedynczej transakcji w tys. zł
Average value of single transaction in thous. zl
Grunty przeznaczone pod zabudowę
mieszkaniową ...................... 112.8 146.3 154.3 91.8
Residential land
Grunty przeznaczone pod zabudowę
przemysłową ........................ 663.8 857.4 838.2 320.2
Industrial land
Grunty przeznaczone pod zabudowę inną 209.9 303.1 455.1 129.4
Other building land
Użytki rolne .............................. 113.2 254.9 580.1 92.4
Agricultural land
Grunty leśne oraz zadrzewione i
zakrzewione ......................... 65.2 136.2 258.9 53.4
Forest land as well as woody and bushy
land
Średnia cena transakcyjna w zł/m2
Average transaction price in zl/m2
Grunty przeznaczone pod zabudowę
mieszkaniową ...................... 56.19 96.38 72.98 39.65
Residential land
Grunty przeznaczone pod zabudowę
przemysłową ........................ 79.38 114.20 85.81 32.41
Industrial land
Grunty przeznaczone pod zabudowę inną 58.92 125.35 160.69 28.40
Other building land
Użytki rolne .............................. 4.25 44.95 135.30 3.11
Agricultural land
Grunty leśne oraz zadrzewione i
zakrzewione ......................... 7.24 34.49 52.37 5.43
Forest land as well as woody and bushy
land
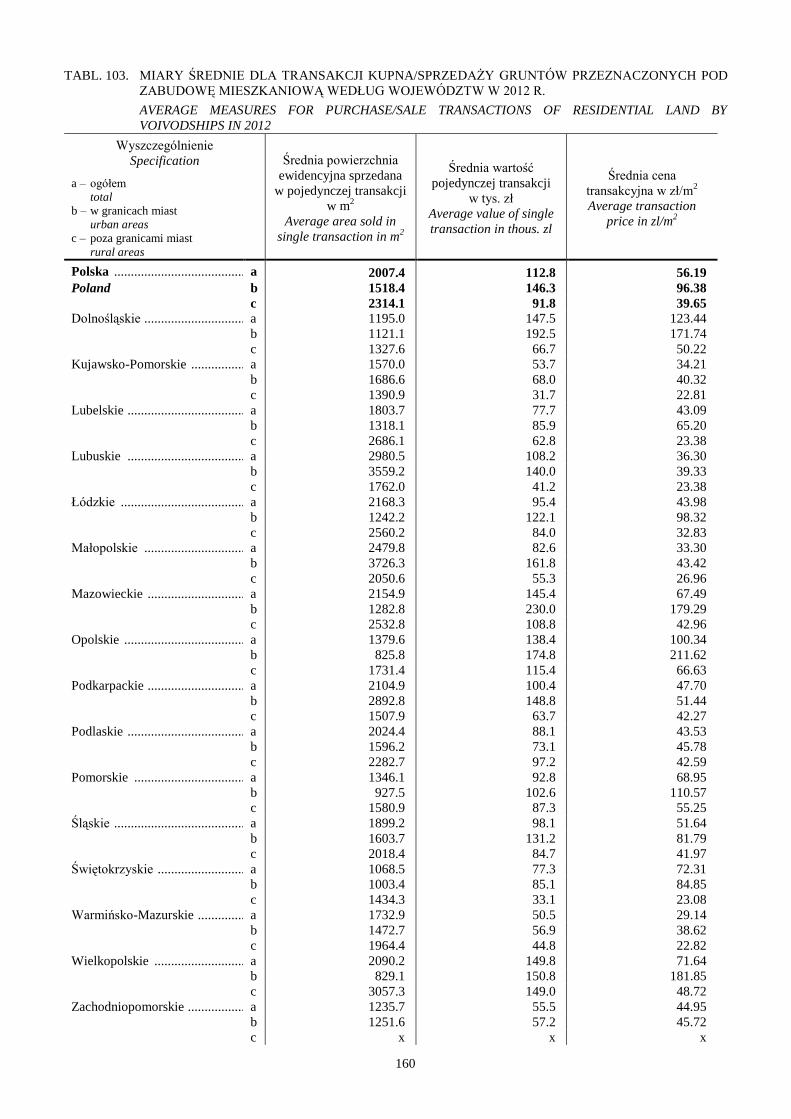
160
TABL. 103. MIARY ŚREDNIE DLA TRANSAKCJI KUPNA/SPRZEDAŻY GRUNTÓW PRZEZNACZONYCH POD
ZABUDOWĘ MIESZKANIOWĄ WEDŁUG WOJEWÓDZTW W 2012 R.
AVERAGE MEASURES FOR PURCHASE/SALE TRANSACTIONS OF RESIDENTIAL LAND BY
VOIVODSHIPS IN 2012
Wyszczególnienie
Specification
a – ogółem
total
b – w granicach miast
urban areas
c – poza granicami miast
rural areas
Średnia powierzchnia
ewidencyjna sprzedana
w pojedynczej transakcji
w m2
Average area sold in
single transaction in m2
Średnia wartość
pojedynczej transakcji
w tys. zł
Average value of single
transaction in thous. zl
Średnia cena
transakcyjna w zł/m2
Average transaction
price in zl/m2
Polska ........................................ a 2007.4 112.8 56.19
Poland b 1518.4 146.3 96.38
c 2314.1 91.8 39.65
Dolnośląskie ............................... a 1195.0 147.5 123.44
b 1121.1 192.5 171.74
c 1327.6 66.7 50.22
Kujawsko-Pomorskie ................. a 1570.0 53.7 34.21
b 1686.6 68.0 40.32
c 1390.9 31.7 22.81
Lubelskie .................................... a 1803.7 77.7 43.09
b 1318.1 85.9 65.20
c 2686.1 62.8 23.38
Lubuskie .................................... a 2980.5 108.2 36.30
b 3559.2 140.0 39.33
c 1762.0 41.2 23.38
Łódzkie ...................................... a 2168.3 95.4 43.98
b 1242.2 122.1 98.32
c 2560.2 84.0 32.83
Małopolskie ............................... a 2479.8 82.6 33.30
b 3726.3 161.8 43.42
c 2050.6 55.3 26.96
Mazowieckie .............................. a 2154.9 145.4 67.49
b 1282.8 230.0 179.29
c 2532.8 108.8 42.96
Opolskie ..................................... a 1379.6 138.4 100.34
b 825.8 174.8 211.62
c 1731.4 115.4 66.63
Podkarpackie .............................. a 2104.9 100.4 47.70
b 2892.8 148.8 51.44
c 1507.9 63.7 42.27
Podlaskie .................................... a 2024.4 88.1 43.53
b 1596.2 73.1 45.78
c 2282.7 97.2 42.59
Pomorskie .................................. a 1346.1 92.8 68.95
b 927.5 102.6 110.57
c 1580.9 87.3 55.25
Śląskie ........................................ a 1899.2 98.1 51.64
b 1603.7 131.2 81.79
c 2018.4 84.7 41.97
Świętokrzyskie ........................... a 1068.5 77.3 72.31
b 1003.4 85.1 84.85
c 1434.3 33.1 23.08
Warmińsko-Mazurskie ............... a 1732.9 50.5 29.14
b 1472.7 56.9 38.62
c 1964.4 44.8 22.82
Wielkopolskie ............................ a 2090.2 149.8 71.64
b 829.1 150.8 181.85
c 3057.3 149.0 48.72
Zachodniopomorskie .................. a 1235.7 55.5 44.95
b 1251.6 57.2 45.72
c x x x

161
TABL. 104. MIARY ŚREDNIE DLA TRANSAKCJI KUPNA/SPRZEDAŻY GRUNTÓW PRZEZNACZONYCH POD
ZABUDOWĘ PRZEMYSŁOWĄ WEDŁUG WOJEWÓDZTW W 2012 R.
AVERAGE MEASURES FOR PURCHASE/SALE TRANSACTIONS OF INDUSTRIAL LAND BY
VOIVODSHIPS IN 2012
Wyszczególnienie
Specification
a – ogółem
total
b – w granicach miast
urban areas
c – poza granicami miast
rural areas
Średnia powierzchnia
ewidencyjna sprzedana
w pojedynczej transakcji
w m2
Average area sold in
single transaction in m2
Średnia wartość
pojedynczej transakcji
w tys. zł
Average value of single
transaction in thous. zl
Średnia cena
transakcyjna w zł/m2
Average transaction
price in zl/m2
Polska ........................................ a 8361.7 663.8 79.38
Poland b 7507.9 857.4 114.20
c 9877.0 320.2 32.41
Dolnośląskie ............................... a 18622.0 653.3 35.08
b 5477.3 741.5 135.37
c 39653.6 512.2 12.92
Kujawsko-Pomorskie ................. a 2330.7 338.4 145.20
b 2330.7 338.4 145.20
c – – –
Lubelskie .................................... a 8673.0 463.3 53.42
b 9491.7 544.4 57.35
c 4989.0 98.3 19.71
Lubuskie .................................... a 32096.4 1993.0 62.09
b 32096.4 1993.0 62.09
c – – –
Łódzkie ...................................... a 9832.2 631.3 64.21
b 10203.7 743.0 72.82
c 9336.9 482.3 51.66
Małopolskie ............................... a 6398.7 497.5 77.75
b 7487.8 679.5 90.75
c 3567.0 24.4 6.84
Mazowieckie .............................. a 8105.8 469.8 57.96
b 5232.5 407.5 77.88
c 12826.0 572.2 44.61
Opolskie ..................................... a 11032.5 2289.9 207.56
b 13001.4 3257.6 250.56
c 6736.6 178.5 26.50
Podkarpackie .............................. a 3037.5 265.2 87.31
b 3003.7 283.0 94.23
c 3132.2 215.3 68.72
Podlaskie .................................... a – – –
b – – –
c – – –
Pomorskie .................................. a x x x
b x x x
c – – –
Śląskie ........................................ a 4596.5 369.7 80.43
b 5132.8 353.9 68.95
c 3309.2 407.6 123.18
Świętokrzyskie ........................... a 2922.3 132.7 45.41
b 2400.1 124.3 51.79
c x x x
Warmińsko-Mazurskie ............... a 3495.7 62.6 17.91
b 2841.5 109.0 38.36
c 3682.6 49.3 13.40
Wielkopolskie ............................ a 8744.6 450.1 51.47
b 7053.0 637.0 90.32
c 10506.8 255.4 24.31
Zachodniopomorskie .................. a – – –
b – – –
c – – –

162
TABL. 105. MIARY ŚREDNIE DLA TRANSAKCJI KUPNA/SPRZEDAŻY UŻYTKÓW ROLNYCH WEDŁUG
WOJEWÓDZTW W 2012 R.
AVERAGE MEASURES FOR PURCHASE/SALE TRANSACTIONS OF AGRICULTURAL LAND BY
VOIVODSHIPS IN 2012
Wyszczególnienie
Specification
a – ogółem
total
b – w granicach miast
urban areas
c – poza granicami miast
rural areas
Średnia powierzchnia
sprzedana w pojedynczej
transakcji w m2
Average area sold in
single transaction in m2
Średnia wartość
pojedynczej transakcji
w tys. zł
Average value of single
transaction in thous. zl
Średnia cena
transakcyjna w zł/m2
Average transaction
price in zl/m2
Polska ........................................ a 26648.4 113.2 4.25
Poland b 5669.8 254.9 44.95
c 29725.3 92.4 3.11
Dolnośląskie ............................... a 31673.3 174.5 5.51
b 11416.4 321.1 28.13
c 35384.0 147.6 4.17
Kujawsko-Pomorskie ................. a 26981.7 108.1 4.01
b 2830.6 115.4 40.77
c 29201.8 107.4 3.68
Lubelskie .................................... a 16633.9 44.6 2.68
b 7253.9 69.6 9.59
c 17199.1 43.1 2.50
Lubuskie .................................... a 32763.6 73.8 2.25
b 5527.3 92.1 16.66
c 35321.1 72.1 2.04
Łódzkie ...................................... a 13822.0 54.2 3.92
b 5125.1 138.2 26.96
c 14844.2 44.4 2.99
Małopolskie ............................... a 5301.8 72.2 13.62
b 3685.0 163.0 44.23
c 5653.1 52.5 9.28
Mazowieckie .............................. a 14822.8 202.2 13.64
b 3956.9 956.9 241.83
c 16456.9 88.7 5.39
Opolskie ..................................... a 27174.2 81.9 3.01
b 8192.4 62.8 7.66
c 29396.2 84.2 2.86
Podkarpackie .............................. a 8024.4 36.8 4.59
b 3170.2 89.4 28.20
c 8975.6 26.5 2.95
Podlaskie .................................... a 22336.0 66.0 2.95
b 9903.2 141.0 14.24
c 23571.7 58.5 2.48
Pomorskie .................................. a 27109.5 176.6 6.51
b 6092.8 476.0 78.13
c 29885.3 137.0 4.58
Śląskie ........................................ a 9228.8 122.1 13.23
b 6916.9 172.1 24.88
c 10805.6 88.0 8.14
Świętokrzyskie ........................... a 12876.9 43.0 3.34
b 5539.7 73.9 13.35
c 13654.9 39.7 2.91
Warmińsko-Mazurskie ............... a 177794.5 125.2 0.70
b 5450.4 126.8 23.27
c 184105.8 125.2 0.68
Wielkopolskie ............................ a 17484.4 210.6 12.05
b 3960.7 165.4 41.76
c 19190.4 216.3 11.27
Zachodniopomorskie .................. a 51153.9 141.4 2.77
b 6469.4 100.6 15.54
c 57194.7 147.0 2.57

163
TABL. 106. MIARY ŚREDNIE DLA TRANSAKCJI KUPNA/SPRZEDAŻY GRUNTÓW LEŚNYCH ORAZ
ZADRZEWIONYCH I ZAKRZEWIONYCH WEDŁUG WOJEWÓDZTW W 2012 R.
AVERAGE MEASURES FOR PURCHASE/SALE TRANSACTIONS OF FOREST LAND AS WELL AS
WOODY AND BUSHY LAND BY VOIVODSHIPS IN 2012
Wyszczególnienie
Specification
a – ogółem
total
b – w granicach miast
urban areas
c – poza granicami miast
rural areas
Średnia powierzchnia
sprzedana w pojedynczej
transakcji w m2
Average area sold in
single transaction in m2
Średnia wartość
pojedynczej transakcji
w tys. zł
Average value of single
transaction in thous. zl
Średnia cena
transakcyjna w zł/m2
Average transaction
price in zl/m2
Polska ........................................ a 9007.3 65.2 7.24
Poland b 3947.8 136.2 34.49
c 9846.6 53.4 5.43
Dolnośląskie ............................... a 22171.7 175.5 7.92
b 1524.0 124.2 81.50
c 29398.4 193.5 6.58
Kujawsko-Pomorskie ................. a 8459.5 35.2 4.16
b x x x
c 8882.3 28.5 3.20
Lubelskie .................................... a 12168.5 17.0 1.40
b 11686.7 20.4 1.74
c 12194.2 16.8 1.38
Lubuskie .................................... a 2481.1 115.1 46.38
b 1730.9 127.5 73.65
c 6300.4 51.9 8.23
Łódzkie ...................................... a 6558.5 38.5 5.88
b 1969.1 55.0 27.94
c 6954.2 37.1 5.34
Małopolskie ............................... a 6985.2 20.3 2.90
b 9033.8 40.5 4.48
c 6781.2 18.3 2.69
Mazowieckie .............................. a 9530.9 140.9 14.79
b 4732.8 266.8 56.38
c 10007.7 128.4 12.83
Opolskie ..................................... a 4788.8 17.1 3.57
b – – –
c 4788.8 17.1 3.57
Podkarpackie .............................. a 5687.2 13.3 2.35
b 2460.9 73.0 29.67
c 5844.3 10.4 1.79
Podlaskie .................................... a 13265.2 48.5 3.66
b 9354.3 108.4 11.59
c 13553.6 44.1 3.25
Pomorskie .................................. a 13134.8 102.5 7.80
b 1916.1 538.4 280.98
c 14674.6 42.7 2.91
Śląskie ........................................ a 5518.5 52.1 9.45
b 4938.8 79.4 16.08
c 5682.4 44.4 7.82
Świętokrzyskie ........................... a 9870.7 38.5 3.90
b 9899.6 18.8 1.90
c 9867.8 40.5 4.10
Warmińsko-Mazurskie ............... a 11471.3 60.3 5.25
b 1956.2 236.4 120.87
c 12277.7 45.3 3.69
Wielkopolskie ............................ a 13372.7 71.5 5.35
b 5177.6 71.0 13.71
c 14123.4 71.6 5.07
Zachodniopomorskie .................. a 13051.1 102.5 7.85
b x x x
c 13682.8 106.7 7.80

164
TABL. 107. CHARAKTERYSTYKI OPISOWE ŚREDICH CEN TRANSAKCJI NIERUCHOMOŚCIAMI
GRUNTOWYMI NA SZCZEBLU POWIATÓW W 2012 R.
PRICE DESCRIPTIVE CHARACTERISTICS OF AVERAGE TRANSACTION PRICES OF LAND
PROPERTIES AT POWIATS LEVEL IN 2012
Wyszczególnienie
Specification
a – w granicach miast
urban areas
b – poza granicami miast
rural areas
Średnia cena w zł/m2
Average price in zl/m2
Współczynnik
zmienności w %
Variability coefficient
in % najniższa
lowest
najwyższa
highest
mediana
median
średnia
arytmetyczna
arithmetic mean
wolny rynek
free market
Grunty przeznaczone pod zabudowę
mieszkaniową .......................... a 8.19 1358 67 111 127.9
Residential land b 0.67 330 26 43 111.6
Grunty przeznaczone pod zabudowę
przemysłową ............................ a 1.14 689 64 99 120.2
Industrial land b 0.29 769 33 62 208.1
Grunty przeznaczone pod zabudowę inną
.................................................. a 0.28 1056 80 112 112.5
Other building land b 0.72 1184 20 33 230.3
Użytki rolne ................................... a 0.77 592 19 35 142.9
Agricultural land b 0.05 101 3 6 150.0
Grunty leśne oraz zadrzewione i
zakrzewione ............................. a 0.52 466 12 54 177.8
Forest land as well as woody and bushy
land
b 0.22 330 3 13 269.2
sprzedaż bezprzetargowa
sale without tender procedure
Grunty przeznaczone pod zabudowę
mieszkaniową .......................... a 14.59 402 99 125 74.4
Residential land b 1.02 544 30 65 175.4
Grunty przeznaczone pod zabudowę
przemysłową ............................ a 1.34 243 55 60 96.7
Industrial land b 4.62 231 17 54 146.3
Grunty przeznaczone pod zabudowę inną
.................................................. a 2.48 3474 82 144 193.1
Other building land b 0.08 1059 23 49 230.6
Użytki rolne ................................... a 0.46 8009 40 105 577.1
Agricultural land b 0.53 302 2 6 350.0
Grunty leśne oraz zadrzewione i
zakrzewione ............................. a 5.55 306 45 90 124.4
Forest land as well as woody and bushy
land
b 0.30 56 3 11 136.4
sprzedaż przetargowa
sale under tender procedure
Grunty przeznaczone pod zabudowę
mieszkaniową .......................... a 2.99 537 83 133 94.7
Residential land b 1.89 448 28 43 151.2
Grunty przeznaczone pod zabudowę
przemysłową ............................ a 5.40 311 62 79 92.4
Industrial land b 1.08 64 14 21 95.2
Grunty przeznaczone pod zabudowę inną
.................................................. a 2.40 1339 87 142 126.1
Other building land b 0.47 6291 22 79 634.2
Użytki rolne ................................... a 0.64 2857 34 70 292.9
Agricultural land b 0.62 61 3 5 180.0
Grunty leśne oraz zadrzewione i
zakrzewione ............................. a 1.48 1302 53 192 175.5
Forest land as well as woody and bushy
land
b 0.70 338 2 14 307.1

165